UNITED STATES
SECURITIES AND EXCHANGE COMMISSION
Washington, D.C. 20549
FORMN-CSR
CERTIFIED SHAREHOLDER REPORT OF REGISTERED MANAGEMENT INVESTMENT
COMPANIES
| | |
| Investment Company Act file number: | | 811-09439 |
| |
| Exact name of registrant as specified in charter: | | Prudential Investment Portfolios 5 |
| |
| Address of principal executive offices: | | 655 Broad Street, 17th Floor |
| | Newark, New Jersey 07102 |
| |
| Name and address of agent for service: | | Andrew R. French |
| | 655 Broad Street, 17th Floor |
| | Newark, New Jersey 07102 |
| |
| Registrant’s telephone number, including area code: | | 800-225-1852 |
| |
| Date of fiscal year end: | | 7/31/2019 |
| |
| Date of reporting period: | | 7/31/2019 |
Item 1 – Reports to Stockholders

PGIM JENNISON DIVERSIFIED GROWTH FUND
ANNUAL REPORT
JULY 31, 2019
COMING SOON: PAPERLESS SHAREHOLDER REPORTS
Beginning on January 1, 2021, as permitted by regulations adopted by the Securities and Exchange Commission, paper copies of the Fund’s annual and semiannual shareholder reports will no longer be sent by mail, unless you specifically request paper copies of the reports. Instead, the reports will be made available on the Fund’s website (pgiminvestments.com), and you will be notified by mail each time a report is posted and provided with a website link to access the report.
If you already elected to receive shareholder reports electronically, you will not be affected by this change and you need not take any action. You may elect to receive shareholder reports and other communications from the Fund electronically anytime by contacting your financial intermediary (such as a broker-dealer or bank) or, if you are a direct investor, by calling 1-800-225-1852 or by sending an email request to PGIM Investments at shareholderreports@pgim.com.
You may elect to receive all future reports in paper free of charge. If you invest through a financial intermediary, you can contact your financial intermediary or follow instructions included with this notice to elect to continue to receive paper copies of your shareholder reports. If you invest directly with the Fund, you can call 1-800-225-1852 or send an email request to shareholderreports@pgim.com to let the Fund know you wish to continue receiving paper copies of your shareholder reports. Your election to receive reports in paper will apply to all funds held in your account if you invest through your financial intermediary or all funds held with the fund complex if you invest directly with the Fund.

To enroll in e-delivery, go to pgiminvestments.com/edelivery
|
| Objective:Long-term capital appreciation |
Highlights
| • | | Several information technology holdings contributed strongly to the Fund’s performance, including Microsoft, Adobe, and Mastercard. |
| • | | Also adding to returns were shares of Chipotle and Lululemon in consumer discretionary, Costco and Estee Lauder in consumer staples, and Disney and Facebook in communications services. |
| • | | Shares of Nvidia detracted from the Fund’s performance. Other holdings that dragged on performance included Tesla and Alibaba in consumer discretionary, Biogen in health care, and Netflix in communications services. |
This report is not authorized for distribution to prospective investors unless preceded or accompanied by a current prospectus.
The views expressed in this report and information about the Fund’s portfolio holdings are for the period covered by this report and are subject to change thereafter.
Mutual funds are distributed by Prudential Investment Management Services LLC, member SIPC. Jennison Associates LLC is a registered investment adviser. Both are Prudential Financial companies.© 2019 Prudential Financial, Inc. and its related entities. Jennison Associates, Jennison, PGIM, and the PGIM logo are service marks of Prudential Financial, Inc. and its related entities, registered in many jurisdictions worldwide.
| | |
| 2 | | Visit our website at pgiminvestments.com |
Table of Contents
| | | | |
| PGIM Jennison Diversified Growth Fund | | | 3 | |
This Page Intentionally Left Blank
Letter from the President

Dear Shareholder:
We hope you find the annual report for the PGIM Jennison Diversified Growth Fund informative and useful. The report covers performance for the12-month period that ended July 31, 2019.
While the US economy remained healthy, with rising corporate profits and strong job growth, the Federal Reserve cut interest rates on the last day of the period for the first time since the Great Recession more than a decade ago. After nine rate increases in recent years, the cut was a proactive attempt by the Fed to extend the longest domestic economic expansion on record as growth in many other regions weakened. China in particular showed signs of slowing amid trade tensions with the US, and turmoil in the United Kingdom continued as it negotiated an exit from the European Union.
Despite the growing US economy, volatility returned to the equity markets during the period. After corporate tax cuts and regulatory reforms helped boost US stocks early in the period, equities declined significantly at the end of 2018 on concerns about China’s economy, a potential global trade war, higher interest rates, and worries that profit growth might slow. Stocks reversed course early in 2019, rising sharply after the Fed moderated its position on additional rate hikes for the remainder of the year. For the period overall,large-cap US equities rose whilesmall-cap US stocks fell. Stocks also declined in developed foreign and emerging markets.
The overall US bond market posted strong returns during the period on a significant rally in interest rates that saw the10-year US Treasury yield decline from around 3% to 2%. Investment grade corporate bonds led the way with a double-digit gain, while corporate high yield and municipal bonds each had a high single-digit return. Globally, bonds in developed markets delivered solid returns, while emerging markets debt also posted positive results. A continuing trend during the period was the inversion of a portion of the US Treasury yield curve, as the yield on certain shorter maturities exceeded the yield on the10-year bond.
Regarding your investments with PGIM, we believe it is important to maintain a diversified portfolio of funds consistent with your tolerance for risk, time horizon, and financial goals. Your financial advisor can help you create a diversified investment plan that may include funds covering all the basic asset classes and that reflects your personal investor profile and risk tolerance. However, diversification and asset allocation strategies do not assure a profit or protect against loss in declining markets.
At PGIM Investments, we consider it a great privilege and responsibility to help investors participate in opportunities across global markets while meeting their toughest investment challenges. PGIM is atop-10 global investment manager with more than $1 trillion in assets under management. This scale and investment expertise allow us to deliver actively managed funds and strategies to meet the needs of investors around the globe.
Thank you for choosing our family of funds.
Sincerely,

Stuart S. Parker, President
PGIM Jennison Diversified Growth Fund
September 16, 2019
| | | | |
| PGIM Jennison Diversified Growth Fund | | | 5 | |
Your Fund’s Performance(unaudited)
Performance data quoted represent past performance. Past performance does not guarantee future results. The investment return and principal value of an investment will fluctuate, so that an investor’s shares, when redeemed, may be worth more or less than their original cost. Current performance may be lower or higher than the past performance data quoted. An investor may obtain performance data as of the most recent month-end by visiting our website atpgiminvestments.com or by calling (800) 225-1852.
| | | | | | | | | | | | | | |
| |
| | | Average Annual Total Returns as of 7/31/19
(with sales charges) | |
| | | One Year (%) | | Five Years (%) | | | Ten Years (%) | | | Since Inception (%) | |
| Class A | | 1.05 | | | 9.97 | | | | 12.37 | | | | — | |
| Class B | | 1.08 | | | 10.13 | | | | 12.09 | | | | — | |
| Class C | | 5.00 | | | 10.37 | | | | 12.15 | | | | — | |
| Class Z | | 7.20 | | | N/A | | | | N/A | | | | 14.49 (9/27/17) | |
| Class R6 | | 7.20 | | | N/A | | | | N/A | | | | 14.49 (9/27/17) | |
| Russell 1000 Growth Index | |
| | 10.82 | | | 14.25 | | | | 15.74 | | | | — | |
| Lipper Large-Cap Growth Funds Average | |
| | | 9.81 | | | 12.97 | | | | 14.41 | | | | — | |
| | | | | | | | | | | | | | |
| |
| | | Average Annual Total Returns as of 7/31/19
(without sales charges) | |
| | | One Year (%) | | Five Years (%) | | | Ten Years (%) | | | Since Inception (%) | |
| Class A | | 6.93 | | | 11.23 | | | | 13.00 | | | | — | |
| Class B | | 5.79 | | | 10.27 | | | | 12.09 | | | | — | |
| Class C | | 5.95 | | | 10.37 | | | | 12.15 | | | | — | |
| Class Z | | 7.20 | | | N/A | | | | N/A | | | | 14.49 (9/27/17) | |
| Class R6 | | 7.20 | | | N/A | | | | N/A | | | | 14.49 (9/27/17) | |
| Russell 1000 Growth Index | | | | | | | | | | | | | | |
| | 10.82 | | | 14.25 | | | | 15.74 | | | | — | |
| Lipper Large-Cap Growth Funds Average | |
| | | 9.81 | | | 12.97 | | | | 14.41 | | | | — | |
Source: PGIM Investments LLC and Lipper Inc.
Since Inception returns are provided for any share class with less than 10 fiscal years of returns. Since Inception returns for the Index and the Lipper Average are measured from the closest month-end to the class’ inception date.
| | |
| 6 | | Visit our website at pgiminvestments.com |
Growth of a $10,000 Investment
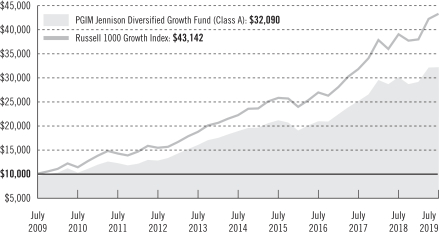
The graph compares a $10,000 investment in the Fund’s Class A shares with a similar investment in the Russell 1000 Growth Index by portraying the initial account values at the beginning of the 10-year period for Class A shares (July 31, 2009) and the account values at the end of the current fiscal year (July 31, 2019) as measured on a quarterly basis. For purposes of the graph, and unless otherwise indicated, it has been assumed that (a) all recurring fees (including management fees) were deducted; and (b) all dividends and distributions were reinvested. The line graph provides information for Class A shares only. As indicated in the tables provided earlier, performance for Class B, Class C shares, Class Z and Class R6 shares will vary due to the differing charges and expenses applicable to each share class (as indicated in the following paragraphs). Without waiver of fees and/or expense reimbursement, if any, the returns would have been lower.
Past performance does not predict future performance. Total returns and the ending account values in the graph include changes in share price and reinvestment of dividends and capital gains distributions in a hypothetical investment for the periods shown. The Fund’s total returns do not reflect the deduction of income taxes on an individual’s investment. Taxes may reduce your actual investment returns on income or gains paid by the Fund or any gains you may realize if you sell your shares.
| | | | |
| PGIM Jennison Diversified Growth Fund | | | 7 | |
Your Fund’s Performance(continued)
The returns in the tables do not reflect the deduction of taxes that a shareholder would pay on Fund distributions or following the redemption of Fund shares. The average annual total returns take into account applicable sales charges, which are described for each share class in the table below.
| | | | | | | | | | |
| | | | | | |
| | | Class A | | Class B* | | Class C | | Class Z | | Class R6 |
| Maximum initial sales charge | | 5.50% of the public offering price | | None | | None | | None | | None |
| Contingent deferred sales charge (CDSC) (as a percentage of the lower of original purchase price or net asset value at redemption) | | 1.00% on sales of $1 million or more made within 12 months of purchase | | 5.00% (Yr.1) 4.00% (Yr.2) 3.00% (Yr.3) 2.00% (Yr.4) 1.00% (Yr.5/6) 0.00% (Yr.7) | | 1.00% on sales made within 12 months of purchase | | None | | None |
| Annual distribution or distribution and service(12b-1) fees (shown as a percentage of average daily net assets) | | 0.30% (0.25% currently) | | 1.00% | | 1.00% | | None | | None |
*Class B shares are closed to all purchase activity and no additional Class B shares may be purchased or acquired except by exchange from Class B shares of another Fund or through dividend or capital gains reinvestment.
Benchmark Definitions
Russell 1000 Growth Index—The Russell 1000 Growth Index is an unmanaged index which contains those securities in the Russell 1000® Index with an above-average growth orientation. Companies in this index tend to exhibit higher price-to-book and price-to-earnings ratios, lower dividend yields, and higher forecasted growth rates. The average annual total return for the Index measured from the month-end closest to the inception date of the Fund’s Class Z and Class R6 shares is 16.34%.
Lipper Large-Cap Growth Funds Average—The Lipper Large-Cap Growth Funds Average (Lipper Average) is based on the average return of all funds in the Lipper Large-Cap Growth Funds universe for the periods noted. Funds in the Lipper Average invest at least 75% of their equity assets in companies with market capitalizations (on a three-year weighted basis) greater than 300% of the dollar-weighted median market capitalization of the middle 1,000 securities of the S&P SuperComposite 1500 Index. The average annual total return for the Index measured from the month-end closest to the inception date of the Fund’s Class Z and Class R6 shares is 15.57%.
Investors cannot invest directly in an index or average. The returns for the Index would be lower if they included the effects of sales charges, operating expenses of a mutual fund, or taxes. Returns for the Lipper Average reflect the deduction of operating expenses, but not sales charges or taxes.
| | |
| 8 | | Visit our website at pgiminvestments.com |
Presentation of Fund Holdings
| | | | |
| Ten Largest Holdings | | Line of Business | | % of Net Assets |
| Microsoft Corp. | | Software | | 6.8% |
| Amazon.com, Inc. | | Internet & Direct Marketing Retail | | 4.4% |
| Mastercard, Inc. (Class A Stock) | | IT Services | | 4.1% |
| Alphabet, Inc. (Class A Stock) | | Interactive Media & Services | | 3.9% |
| Visa, Inc. (Class A Stock) | | IT Services | | 3.7% |
| Apple, Inc. | | Technology Hardware, Storage & Peripherals | | 3.2% |
| Adobe, Inc. | | Software | | 2.9% |
| salesforce.com, Inc. | | Software | | 2.7% |
| Alibaba Group Holding Ltd. (China), ADR | | Internet & Direct Marketing Retail | | 2.7% |
| Facebook, Inc. (Class A Stock) | | Interactive Media & Services | | 2.6% |
For a complete list of holdings, please refer to the Schedule of Investments section of this report. Holdings reflect only long-term Investments. Holdings/Issues/Industries/Sectors are subject to change.
| | | | |
| PGIM Jennison Diversified Growth Fund | | | 9 | |
Strategy and Performance Overview
How did the Fund perform?
ThePGIM Jennison Diversified Growth Fund’s Class A shares returned 6.93% in the12-month reporting period that ended July 31, 2019, underperforming the 10.82% return of the Russell 1000 Growth Index (the Index) and the 9.81% return of the LipperLarge-Cap Growth Funds Average.
What was the market environment?
| • | | Equity markets were volatile in the period. At the outset (in August 2018), global gross domestic product (GDP) growth was accelerating, the US labor market was strengthening, and lower US corporate tax rates were helping boost wages and capital spending. Given the constructive macroeconomic landscape, investors overlooked uncertainty created by White House trade and other policy initiatives. |
| • | | An abrupt equity marketsell-off in the fourth quarter of 2018 reflected mounting investor concerns about the rising risk of a major trade war with China, the state of US trade alliances with other major trading partners, the pace of US economic growth, decelerating expansion innon-US economies, US interest rate increases, and discord and uncertainty about domestic policy. |
| • | | US equity markets subsequently rebounded early in 2019 as the Federal Reserve (the Fed) signaled a pause in its federal funds rate hikes, corporate earnings reports generally indicated continued strength, and sentiment grew that trade friction would be resolved. |
| • | | Markets declined again late in the period after the US administration placed Chinese technology company Huawei Technologies on a list of firms deemed a risk to national security, escalating the trade discord between the world’s two largest economies. |
What worked?
| • | | Several information technology holdings were strong contributors to the Fund’s return. |
| | • | | Digital transformation has become a strategic imperative across many industries and companies. HoldingsMicrosoft Corp.,Adobe Inc.,Red Hat Inc.,salesforce.com Inc., andWorkday Inc. offer mission-critical applications and services that are fundamentally changing the way businesses operate. |
| | • | | Payments companies continued to benefit from the long-term shift from cash to electronic transactions.Mastercard Inc. andVisa Inc. have strong market positions with high barriers to entry, pricing power, and solid operating leverage potential. |
| • | | In consumer discretionary: |
| | • | | Fast casual restaurant companyChipotle Mexican Grill Inc.’s new management team has been turning the company around by improving sales through new products, better marketing, mobile/digital efforts, and delivery. |
| | |
| 10 | | Visit our website at pgiminvestments.com |
| | • | | Lululemon Athletica Inc.’s new products, integrated marketing, and online sales momentum—combined with ahigh-end customer base and athleisure fashion trends—drove strong customer traffic, sales conversion, and comparable store sales. The company also benefited from strong brand positioning, international prospects, margin-expansion opportunities, and attractive return on invested capital. |
| | • | | Costco Wholesale Corp.’s consistent stream of membership fee income allowed for low prices and broad product selection, which, in turn, led to high inventory turnover. |
| | • | | The Estée Lauder Cos. Inc. enhanced its strong brand portfolio in the fast-growing luxury beauty care market with complementary acquisitions and subsequent brand development. Emerging markets, especially China, were key drivers of the company’s growth. |
| • | | In communication services: |
| | • | | The Walt Disney Co. announced plans to launch Disney+, a subscriptionvideo-on-demand service. With ongoing disruption in the broader media landscape, execution of Disney+ and Disney’s otherdirect-to-consumer initiatives is uncertain. However, Jennison believes the company is well positioned to succeed given the strength of its content, global brand, and marketing. |
| | • | | Facebook Inc. faced ongoing investor concerns about data privacy. However, the company continued to show resilience, with solid engagement metrics and strong revenue growth, as advertisers continued to seek the reach and targeting Facebook provides. |
What didn’t work?
| • | | After strong performance through much of 2017 and 2018, shares of information technology holdingNvidia Corp. fell in the fourth quarter of 2018, reflecting gaming graphics microchip inventory issues that were exacerbated by a slowdown in the cryptocurrency mining boom. The company’s stock began to recover in early 2019 on signs that inventory issues were being resolved, only to dip again in May on worries that renewed escalation of US/China trade discord could disrupt technology product markets and depress chip demand. |
| • | | In consumer discretionary: |
| | • | | Tesla Inc.’s share price decline was tied to ongoing controversy surrounding CEO Elon Musk and concerns about vehicle production volume. The Fund’s position in Tesla Inc. was eliminated in April 2019. |
| | | | |
| PGIM Jennison Diversified Growth Fund | | | 11 | |
Strategy and Performance Overview(continued)
| | • | | Slowing Chinese economic growth and Chinese government efforts to tighten control of internet andnon-traditional financial businesses weighed one-commerce giantAlibaba Group Holding Ltd. |
| • | | In health care, shares ofBiogen Inc. fell after the company discontinued its Phase 3 clinical trial of Alzheimer’s disease drug aducanumab. |
| • | | In communication services,Netflix Inc. continued to raise its long-term competitive barriers with investments in exclusive and original content, resulting in strong subscriber growth and pricing leverage. The company’s domestic subscriber base decreased, marginally, in the second quarter of 2019 for the first time since 2011, and international net subscriber additions reverted to 2016 levels. Given itsstill-low global penetration and the accelerating shift from linear TV, Netflix still has significant room for growth, in Jennison’s view. |
Current outlook
| • | | After months of trade friction, both consumer and business sentiment show signs of fraying. The prolonged uncertainty and the magnitude of potential tariffs are forcing revisions to corporate profit growth forecasts, alterations to business plans and supply chains, and scaled-back estimates of global GDP growth. |
| • | | At the same time, labor market strength persists and inflation remains benign, while the Fed cut already low interest rates at the end of the reporting period. |
| • | | While not immune from the impact of tariffs, few Fund holdings, many of which have global operating footprints, face material risk of being competitively disadvantaged by the evolving trade landscape, in Jennison’s opinion. They are, by and large, market leaders in their industries, operating in secularly growing markets and generating the cash flow necessary to reinvest for attractive rates of organic revenue and above-market-average profit growth. |
| • | | Although macroeconomic and policy factors sometimes distract investor focus away from superior fundamentals, companies with well-above-average long-term growth rates and unique, market-leading products and services have historically outperformed in the long term. |
The percentages shown in the tables below identify each security’s positive or negative contribution to the Fund’s return, which is the sum of all contributions by individual holdings.
| | | | | | |
| |
| Top contributors (%) | | Top detractors (%) |
| Microsoft | | 1.71 | | Nvidia | | –0.77 |
| Mastercard | | 1.35 | | Tesla | | –0.57 |
| Visa | | 0.96 | | Biogen | | –0.39 |
| Chipotle Mexican Grill | | 0.75 | | Alibaba | | –0.28 |
| Adobe | | 0.67 | | Netflix | | –0.28 |
| | |
| 12 | | Visit our website at pgiminvestments.com |
Fees and Expenses(unaudited)
As a shareholder of the Fund, you incur two types of costs: (1) transaction costs, including sales charges (loads) on purchase payments and redemptions, as applicable, and (2) ongoing costs, including management fees, distribution and/or service (12b-1) fees, and other Fund expenses, as applicable. This example is intended to help you understand your ongoing costs (in dollars) of investing in the Fund and to compare these costs with the ongoing costs of investing in other mutual funds.
The example is based on an investment of $1,000 held through the six-month period ended July 31, 2019. The example is for illustrative purposes only; you should consult the Prospectus for information on initial and subsequent minimum investment requirements.
Actual Expenses
The first line for each share class in the table on the following page provides information about actual account values and actual expenses. You may use the information on this line, together with the amount you invested, to estimate the expenses that you paid over the period. Simply divide your account value by $1,000 (for example, an $8,600 account value ÷ $1,000 = 8.6), then multiply the result by the number on the first line under the heading “Expenses Paid During the Six-Month Period” to estimate the expenses you paid on your account during this period.
Hypothetical Example for Comparison Purposes
The second line for each share class in the table on the following page provides information about hypothetical account values and hypothetical expenses based on the Fund’s actual expense ratio and an assumed rate of return of 5% per year before expenses, which is not the Fund’s actual return. The hypothetical account values and expenses may not be used to estimate the actual ending account balance or expenses you paid for the period. You may use this information to compare the ongoing costs of investing in the Fund and other funds. To do so, compare this 5% hypothetical example with the 5% hypothetical examples that appear in the shareholder reports of the other funds.
The Fund’s transfer agent may charge additional fees to holders of certain accounts that are not included in the expenses shown in the table on the following page. These fees apply to individual retirement accounts (IRAs) and Section 403(b) accounts. As of the close of the six-month period covered by the table, IRA fees included an annual maintenance fee of $15 per account (subject to a maximum annual maintenance fee of $25 for all accounts held by the same shareholder). Section 403(b) accounts are charged an annual $25 fiduciary maintenance fee. Some of the fees may vary in amount, or may be waived, based on your total account balance or the number of Prudential funds, including the Fund, that you own. You should consider the additional fees that were charged to your Fund account over the six-month period when you estimate the total ongoing expenses paid over the
| | | | |
| PGIM Jennison Diversified Growth Fund | | | 13 | |
Fees and Expenses(continued)
period and the impact of these fees on your ending account value, as these additional expenses are not reflected in the information provided in the expense table. Additional fees have the effect of reducing investment returns.
Please note that the expenses shown in the table are meant to highlight your ongoing costs only and do not reflect any transactional costs such as sales charges (loads). Therefore, the second line for each share class in the table is useful in comparing ongoing costs only and will not help you determine the relative total costs of owning different funds. In addition, if these transactional costs were included, your costs would have been higher.
| | | | | | | | | | | | | | | | | | |
| | | | |
PGIM Jennison
Diversified
Growth Fund | | Beginning Account
Value
February 1, 2019 | | | Ending Account
Value
July 31, 2019 | | | Annualized
Expense Ratio
Based on the
Six-Month Period | | | Expenses Paid
During the
Six-Month Period* | |
| Class A | | Actual | | $ | 1,000.00 | | | $ | 1,103.90 | | | | 1.25 | % | | $ | 6.52 | |
| | Hypothetical | | $ | 1,000.00 | | | $ | 1,018.60 | | | | 1.25 | % | | $ | 6.26 | |
| Class B | | Actual | | $ | 1,000.00 | | | $ | 1,098.80 | | | | 2.26 | % | | $ | 11.76 | |
| | Hypothetical | | $ | 1,000.00 | | | $ | 1,013.59 | | | | 2.26 | % | | $ | 11.28 | |
| Class C | | Actual | | $ | 1,000.00 | | | $ | 1,098.20 | | | | 2.14 | % | | $ | 11.13 | |
| | Hypothetical | | $ | 1,000.00 | | | $ | 1,014.18 | | | | 2.14 | % | | $ | 10.69 | |
| Class Z | | Actual | | $ | 1,000.00 | | | $ | 1,105.50 | | | | 1.00 | % | | $ | 5.22 | |
| | Hypothetical | | $ | 1,000.00 | | | $ | 1,019.84 | | | | 1.00 | % | | $ | 5.01 | |
| Class R6 | | Actual | | $ | 1,000.00 | | | $ | 1,105.50 | | | | 1.00 | % | | $ | 5.22 | |
| | | Hypothetical | | $ | 1,000.00 | | | $ | 1,019.84 | | | | 1.00 | % | | $ | 5.01 | |
*Fund expenses (net of fee waivers or subsidies, if any) for each share class are equal to the annualized expense ratio for each share class (provided in the table), multiplied by the average account value over the period, multiplied by the 181 days in the six-month period ended July 31, 2019, and divided by the 365 days in the Fund's fiscal year ended July 31, 2019 (to reflect the six-month period). Expenses presented in the table include the expenses of any underlying portfolios in which the Fund may invest.
| | |
| 14 | | Visit our website at pgiminvestments.com |
Schedule of Investments
as of July 31, 2019
| | | | | | | | |
| Description | | Shares | | | Value | |
LONG-TERM INVESTMENTS 98.8% | | | | | | | | |
| | |
COMMON STOCKS | | | | | | | | |
| | |
Aerospace & Defense 3.3% | | | | | | | | |
Airbus SE (France), ADR | | | 40,894 | | | $ | 1,446,012 | |
Boeing Co. (The) | | | 12,042 | | | | 4,108,489 | |
Safran SA (France), ADR | | | 54,100 | | | | 1,935,698 | |
Spirit AeroSystems Holdings, Inc. (Class A Stock) | | | 8,039 | | | | 617,717 | |
| | | | | | | | |
| | | | | | | 8,107,916 | |
| | |
Airlines 2.0% | | | | | | | | |
American Airlines Group, Inc. | | | 38,162 | | | | 1,164,322 | |
Delta Air Lines, Inc. | | | 31,248 | | | | 1,907,378 | |
United Airlines Holdings, Inc.* | | | 18,634 | | | | 1,712,651 | |
| | | | | | | | |
| | | | | | | 4,784,351 | |
| | |
Banks 1.1% | | | | | | | | |
JPMorgan Chase & Co. | | | 22,490 | | | | 2,608,840 | |
| | |
Beverages 0.2% | | | | | | | | |
Constellation Brands, Inc. (Class A Stock) | | | 3,038 | | | | 597,939 | |
| | |
Biotechnology 4.1% | | | | | | | | |
Alexion Pharmaceuticals, Inc.* | | | 24,417 | | | | 2,766,202 | |
Amgen, Inc. | | | 18,671 | | | | 3,483,635 | |
Biogen, Inc.* | | | 2,959 | | | | 703,709 | |
Celgene Corp.* | | | 12,001 | | | | 1,102,412 | |
Exact Sciences Corp.* | | | 16,740 | | | | 1,926,942 | |
| | | | | | | | |
| | | | | | | 9,982,900 | |
| | |
Consumer Finance 1.8% | | | | | | | | |
American Express Co. | | | 5,327 | | | | 662,519 | |
Discover Financial Services | | | 22,055 | | | | 1,979,216 | |
Synchrony Financial | | | 51,062 | | | | 1,832,104 | |
| | | | | | | | |
| | | | | | | 4,473,839 | |
| | |
Diversified Consumer Services 0.8% | | | | | | | | |
H&R Block, Inc. | | | 66,285 | | | | 1,835,432 | |
See Notes to Financial Statements.
| | | | |
| PGIM Jennison Diversified Growth Fund | | | 15 | |
Schedule of Investments(continued)
as of July 31, 2019
| | | | | | | | |
| Description | | Shares | | | Value | |
COMMON STOCKS (Continued) | | | | | | | | |
| | |
Entertainment 3.7% | | | | | | | | |
Netflix, Inc.* | | | 16,815 | | | $ | 5,431,077 | |
Walt Disney Co. (The) | | | 25,281 | | | | 3,615,436 | |
| | | | | | | | |
| | | | | | | 9,046,513 | |
| | |
Equity Real Estate Investment Trusts (REITs) 0.5% | | | | | | | | |
American Tower Corp. | | | 2,927 | | | | 619,412 | |
SBA Communications Corp.* | | | 2,459 | | | | 603,463 | |
| | | | | | | | |
| | | | | | | 1,222,875 | |
| | |
Food & Staples Retailing 2.3% | | | | | | | | |
Costco Wholesale Corp. | | | 20,613 | | | | 5,681,561 | |
| | |
Food Products 0.3% | | | | | | | | |
McCormick & Co., Inc. | | | 3,785 | | | | 600,074 | |
| | |
Health Care Equipment & Supplies 1.8% | | | | | | | | |
Danaher Corp. | | | 25,554 | | | | 3,590,337 | |
Edwards Lifesciences Corp.* | | | 3,753 | | | | 798,826 | |
| | | | | | | | |
| | | | | | | 4,389,163 | |
| | |
Health Care Providers & Services 1.1% | | | | | | | | |
HCA Healthcare, Inc. | | | 16,244 | | | | 2,168,736 | |
UnitedHealth Group, Inc. | | | 2,396 | | | | 596,628 | |
| | | | | | | | |
| | | | | | | 2,765,364 | |
| | |
Health Care Technology 0.3% | | | | | | | | |
Veeva Systems, Inc. (Class A Stock)* | | | 4,623 | | | | 766,956 | |
| | |
Hotels, Restaurants & Leisure 3.9% | | | | | | | | |
Chipotle Mexican Grill, Inc.* | | | 4,986 | | | | 3,966,513 | |
Marriott International, Inc. (Class A Stock) | | | 30,756 | | | | 4,276,929 | |
Yum! Brands, Inc. | | | 10,546 | | | | 1,186,636 | |
| | | | | | | | |
| | | | | | | 9,430,078 | |
| | |
Insurance 0.3% | | | | | | | | |
Progressive Corp. (The) | | | 7,568 | | | | 612,857 | |
| | |
Interactive Media & Services 9.4% | | | | | | | | |
Alphabet, Inc. (Class A Stock)* | | | 7,940 | | | | 9,672,508 | |
Facebook, Inc. (Class A Stock)* | | | 32,444 | | | | 6,301,598 | |
See Notes to Financial Statements.
| | | | | | | | |
| Description | | Shares | | | Value | |
COMMON STOCKS (Continued) | | | | | | | | |
| | |
Interactive Media & Services (cont’d.) | | | | | | | | |
Match Group, Inc. | | | 25,343 | | | $ | 1,908,074 | |
Tencent Holdings Ltd. (China), ADR | | | 108,797 | | | | 5,059,061 | |
| | | | | | | | |
| | | | | | | 22,941,241 | |
| | |
Internet & Direct Marketing Retail 8.0% | | | | | | | | |
Alibaba Group Holding Ltd. (China), ADR* | | | 37,704 | | | | 6,526,939 | |
Amazon.com, Inc.* | | | 5,762 | | | | 10,756,386 | |
eBay, Inc. | | | 57,399 | | | | 2,364,265 | |
| | | | | | | | |
| | | | | | | 19,647,590 | |
| | |
IT Services 12.6% | | | | | | | | |
Booz Allen Hamilton Holding Corp. | | | 8,772 | | | | 603,075 | |
FleetCor Technologies, Inc.* | | | 14,266 | | | | 4,053,969 | |
Mastercard, Inc. (Class A Stock) | | | 36,825 | | | | 10,026,343 | |
Paychex, Inc. | | | 7,091 | | | | 588,907 | |
PayPal Holdings, Inc.* | | | 36,055 | | | | 3,980,472 | |
VeriSign, Inc.* | | | 3,152 | | | | 665,356 | |
Visa, Inc. (Class A Stock) | | | 50,849 | | | | 9,051,122 | |
Western Union Co. (The)(a) | | | 89,261 | | | | 1,874,481 | |
| | | | | | | | |
| | | | | | | 30,843,725 | |
| | |
Life Sciences Tools & Services 2.8% | | | | | | | | |
Bruker Corp. | | | 12,572 | | | | 601,570 | |
Illumina, Inc.* | | | 14,768 | | | | 4,421,244 | |
Thermo Fisher Scientific, Inc. | | | 6,718 | | | | 1,865,454 | |
| | | | | | | | |
| | | | | | | 6,888,268 | |
| | |
Machinery 1.0% | | | | | | | | |
Allison Transmission Holdings, Inc. | | | 40,767 | | | | 1,873,244 | |
Caterpillar, Inc. | | | 4,605 | | | | 606,340 | |
| | | | | | | | |
| | | | | | | 2,479,584 | |
| | |
Media 1.9% | | | | | | | | |
AMC Networks, Inc. (Class A Stock)* | | | 31,365 | | | | 1,674,264 | |
CBS Corp. (Class B Stock) | | | 22,212 | | | | 1,144,140 | |
Omnicom Group, Inc. | | | 21,397 | | | | 1,716,467 | |
| | | | | | | | |
| | | | | | | 4,534,871 | |
See Notes to Financial Statements.
| | | | |
| PGIM Jennison Diversified Growth Fund | | | 17 | |
Schedule of Investments(continued)
as of July 31, 2019
| | | | | | | | |
| Description | | Shares | | | Value | |
COMMON STOCKS (Continued) | | | | | | | | |
| | |
Personal Products 1.8% | | | | | | | | |
Estee Lauder Cos., Inc. (The) (Class A Stock) | | | 20,998 | | | $ | 3,867,621 | |
Herbalife Nutrition Ltd.* | | | 14,690 | | | | 602,584 | |
| | | | | | | | |
| | | | | | | 4,470,205 | |
| | |
Pharmaceuticals 1.7% | | | | | | | | |
AstraZeneca PLC (United Kingdom), ADR | | | 47,521 | | | | 2,062,886 | |
Merck & Co., Inc. | | | 24,214 | | | | 2,009,520 | |
| | | | | | | | |
| | | | | | | 4,072,406 | |
| | |
Real Estate Management & Development 0.7% | | | | | | | | |
CBRE Group, Inc. (Class A Stock)* | | | 32,463 | | | | 1,720,864 | |
| | |
Road & Rail 0.3% | | | | | | | | |
Union Pacific Corp. | | | 3,523 | | | | 633,964 | |
| | |
Semiconductors & Semiconductor Equipment 2.8% | | | | | | | | |
NVIDIA Corp. | | | 8,363 | | | | 1,411,006 | |
QUALCOMM, Inc. | | | 57,658 | | | | 4,218,259 | |
Universal Display Corp. | | | 2,864 | | | | 604,533 | |
Xilinx, Inc. | | | 5,109 | | | | 583,499 | |
| | | | | | | | |
| | | | | | | 6,817,297 | |
| | |
Software 20.5% | | | | | | | | |
Adobe, Inc.* | | | 23,923 | | | | 7,149,628 | |
Aspen Technology, Inc.* | | | 4,765 | | | | 628,361 | |
Autodesk, Inc.* | | | 3,809 | | | | 594,851 | |
Cadence Design Systems, Inc.* | | | 20,432 | | | | 1,510,129 | |
Fair Isaac Corp.* | | | 1,746 | | | | 606,595 | |
Intuit, Inc. | | | 2,808 | | | | 778,686 | |
Microsoft Corp. | | | 122,669 | | | | 16,716,105 | |
Oracle Corp. | | | 36,712 | | | | 2,066,886 | |
Paylocity Holding Corp.* | | | 5,920 | | | | 604,373 | |
salesforce.com, Inc.* | | | 42,626 | | | | 6,585,717 | |
SAP SE (Germany), ADR | | | 10,453 | | | | 1,286,033 | |
ServiceNow, Inc.* | | | 16,173 | | | | 4,486,228 | |
Synopsys, Inc.* | | | 5,021 | | | | 666,588 | |
VMware, Inc. (Class A Stock) | | | 10,190 | | | | 1,778,053 | |
Workday, Inc. (Class A Stock)* | | | 20,071 | | | | 4,013,799 | |
Zscaler, Inc.* | | | 7,213 | | | | 607,839 | |
| | | | | | | | |
| | | | | | | 50,079,871 | |
See Notes to Financial Statements.
| | | | | | | | |
| Description | | Shares | | | Value | |
COMMON STOCKS (Continued) | | | | | | | | |
| | |
Specialty Retail 0.5% | | | | | | | | |
Home Depot, Inc. (The) | | | 2,810 | | | $ | 600,469 | |
Williams-Sonoma, Inc. | | | 10,935 | | | | 729,146 | |
| | | | | | | | |
| | | | | | | 1,329,615 | |
| | |
Technology Hardware, Storage & Peripherals 3.4% | | | | | | | | |
Apple, Inc. | | | 36,091 | | | | 7,688,827 | |
HP, Inc. | | | 28,355 | | | | 596,589 | |
| | | | | | | | |
| | | | | | | 8,285,416 | |
| | |
Textiles, Apparel & Luxury Goods 3.9% | | | | | | | | |
Kering SA (France), ADR | | | 38,162 | | | | 1,970,686 | |
Lululemon Athletica, Inc.* | | | 21,119 | | | | 4,035,630 | |
NIKE, Inc. (Class B Stock) | | | 18,152 | | | | 1,561,616 | |
VF Corp. | | | 23,220 | | | | 2,029,196 | |
| | | | | | | | |
| | | | | | | 9,597,128 | |
| | | | | | | | |
TOTAL LONG-TERM INVESTMENTS
(cost $163,411,535) | | | | | | | 241,248,703 | |
| | | | | | | | |
| | |
SHORT-TERM INVESTMENTS 1.6% | | | | | | | | |
| | |
AFFILIATED MUTUAL FUNDS | | | | | | | | |
PGIM Core Ultra Short Bond Fund(w) | | | 1,940,962 | | | | 1,940,962 | |
PGIM Institutional Money Market Fund
(cost $1,955,393; includes $1,942,890 of cash collateral for securities on loan)(b)(w) | | | 1,955,578 | | | | 1,955,969 | |
| | | | | | | | |
TOTAL SHORT-TERM INVESTMENTS
(cost $3,896,355) | | | | | | | 3,896,931 | |
| | | | | | | | |
TOTAL INVESTMENTS 100.4%
(cost $167,307,890) | | | | | | | 245,145,634 | |
Liabilities in excess of other assets (0.4)% | | | | | | | (931,648 | ) |
| | | | | | | | |
NET ASSETS 100.0% | | | | | | $ | 244,213,986 | |
| | | | | | | | |
Below is a list of the abbreviation(s) used in the annual report:
ADR—American Depositary Receipt
LIBOR—London Interbank Offered Rate
REITs—Real Estate Investment Trust
| * | Non-income producing security. |
See Notes to Financial Statements.
| | | | |
| PGIM Jennison Diversified Growth Fund | | | 19 | |
Schedule of Investments(continued)
as of July 31, 2019
| (a) | All or a portion of security is on loan. The aggregate market value of such securities, including those sold and pending settlement, is $1,913,100; cash collateral of $1,942,890 (included in liabilities) was received with which the Fund purchased highly liquid short-term investments. |
| (b) | Represents security purchased with cash collateral received for securities on loan and includes dividend reinvestment. |
| (w) | PGIM Investments LLC, the manager of the Fund, also serves as manager of the PGIM Core Ultra Short Bond Fund and PGIM Institutional Money Market Fund. |
Fair Value Measurements:
Various inputs are used in determining the value of the Fund’s investments. These inputs are summarized in the three broad levels listed below.
Level 1—unadjusted quoted prices generally in active markets for identical securities.
Level 2—quoted prices for similar securities, interest rates and yield curves, prepayment speeds, foreign currency exchange rates and other observable inputs.
Level 3—unobservable inputs for securities valued in accordance with Board approved fair valuation procedures.
The following is a summary of the inputs used as of July 31, 2019 in valuing such portfolio securities:
| | | | | | | | | | | | |
| | | Level 1 | | | Level 2 | | | Level 3 | |
Investments in Securities | | | | | | | | | | | | |
Common Stocks | | | | | | | | | | | | |
Aerospace & Defense | | $ | 8,107,916 | | | $ | — | | | $ | — | |
Airlines | | | 4,784,351 | | | | — | | | | — | |
Banks | | | 2,608,840 | | | | — | | | | — | |
Beverages | | | 597,939 | | | | — | | | | — | |
Biotechnology | | | 9,982,900 | | | | — | | | | — | |
Consumer Finance | | | 4,473,839 | | | | — | | | | — | |
Diversified Consumer Services | | | 1,835,432 | | | | — | | | | — | |
Entertainment | | | 9,046,513 | | | | — | | | | — | |
Equity Real Estate Investment Trusts (REITs) | | | 1,222,875 | | | | — | | | | — | |
Food & Staples Retailing | | | 5,681,561 | | | | — | | | | — | |
Food Products | | | 600,074 | | | | — | | | | — | |
Health Care Equipment & Supplies | | | 4,389,163 | | | | — | | | | — | |
Health Care Providers & Services | | | 2,765,364 | | | | — | | | | — | |
Health Care Technology | | | 766,956 | | | | — | | | | — | |
Hotels, Restaurants & Leisure | | | 9,430,078 | | | | — | | | | — | |
Insurance | | | 612,857 | | | | — | | | | — | |
Interactive Media & Services | | | 22,941,241 | | | | — | | | | — | |
Internet & Direct Marketing Retail | | | 19,647,590 | | | | — | | | | — | |
IT Services | | | 30,843,725 | | | | — | | | | — | |
Life Sciences Tools & Services | | | 6,888,268 | | | | — | | | | — | |
Machinery | | | 2,479,584 | | | | — | | | | — | |
Media | | | 4,534,871 | | | | — | | | | — | |
Personal Products | | | 4,470,205 | | | | — | | | | — | |
Pharmaceuticals | | | 4,072,406 | | | | — | | | | — | |
Real Estate Management & Development | | | 1,720,864 | | | | — | | | | — | |
Road & Rail | | | 633,964 | | | | — | | | | — | |
Semiconductors & Semiconductor Equipment | | | 6,817,297 | | | | — | | | | — | |
Software | | | 50,079,871 | | | | — | | | | — | |
See Notes to Financial Statements.
| | | | | | | | | | | | |
| | | Level 1 | | | Level 2 | | | Level 3 | |
Investments in Securities (continued) | | | | | | | | | | | | |
Common Stocks (continued) | | | | | | | | | | | | |
Specialty Retail | | $ | 1,329,615 | | | $ | — | | | $ | — | |
Technology Hardware, Storage & Peripherals | | | 8,285,416 | | | | — | | | | — | |
Textiles, Apparel & Luxury Goods | | | 9,597,128 | | | | — | | | | — | |
Affiliated Mutual Funds | | | 3,896,931 | | | | — | | | | — | |
| | | | | | | | | | | | |
Total | | $ | 245,145,634 | | | $ | — | | | $ | — | |
| | | | | | | | | | | | |
Industry Classification:
The industry classification of investments and liabilities in excess of other assets shown as a percentage of net assets as of July 31, 2019 were as follows (unaudited):
| | | | |
Software | | | 20.5 | % |
IT Services | | | 12.6 | |
Interactive Media & Services | | | 9.4 | |
Internet & Direct Marketing Retail | | | 8.0 | |
Biotechnology | | | 4.1 | |
Textiles, Apparel & Luxury Goods | | | 3.9 | |
Hotels, Restaurants & Leisure | | | 3.9 | |
Entertainment | | | 3.7 | |
Technology Hardware, Storage & Peripherals | | | 3.4 | |
Aerospace & Defense | | | 3.3 | |
Life Sciences Tools & Services | | | 2.8 | |
Semiconductors & Semiconductor Equipment | | | 2.8 | |
Food & Staples Retailing | | | 2.3 | |
Airlines | | | 2.0 | |
Media | | | 1.9 | |
Consumer Finance | | | 1.8 | |
Personal Products | | | 1.8 | |
Health Care Equipment & Supplies | | | 1.8 | |
Pharmaceuticals | | | 1.7 | |
Affiliated Mutual Funds (0.8% represents investments purchased with collateral from securities on loan) | | | 1.6 | |
| | | | |
Health Care Providers & Services | | | 1.1 | % |
Banks | | | 1.1 | |
Machinery | | | 1.0 | |
Diversified Consumer Services | | | 0.8 | |
Real Estate Management & Development | | | 0.7 | |
Specialty Retail | | | 0.5 | |
Equity Real Estate Investment Trusts (REITs) | | | 0.5 | |
Health Care Technology | | | 0.3 | |
Road & Rail | | | 0.3 | |
Insurance | | | 0.3 | |
Food Products | | | 0.3 | |
Beverages | | | 0.2 | |
| | | | |
| | | 100.4 | |
Liabilities in excess of other assets | | | (0.4 | ) |
| | | | |
| | | 100.0 | % |
| | | | |
Financial Instruments/Transactions—Summary of Offsetting and Netting Arrangements:
The Fund entered into financial instruments/transactions during the reporting period that are either offset in accordance with current requirements or are subject to enforceable master netting arrangements or similar agreements that permit offsetting. The information about offsetting and related netting arrangements for financial instruments/transactions, where the legal right toset-off exists, is presented in the summary below.
See Notes to Financial Statements.
| | | | |
| PGIM Jennison Diversified Growth Fund | | | 21 | |
Schedule of Investments(continued)
as of July 31, 2019
Offsetting of financial instrument/transaction assets and liabilities:
| | | | | | | | | | | | |
Description | | Gross Market
Value of
Recognized
Assets/(Liabilities) | | | Collateral
Pledged/(Received)(1) | | | Net Amount | |
Securities on Loan | | $ | 1,913,100 | | | $ | (1,913,100 | ) | | $ | — | |
| | | | | | | | | | | | |
| (1) | Collateral amount disclosed by the Fund is limited to the market value of financial instruments/transactions. |
See Notes to Financial Statements.
Statement of Assets & Liabilities
as of July 31, 2019
| | | | |
Assets | | | | |
Investments at value, including securities on loan of $1,913,100: | | | | |
Unaffiliated investments (cost $163,411,535) | | $ | 241,248,703 | |
Affiliated investments (cost $3,896,355) | | | 3,896,931 | |
Receivable for investments sold | | | 20,782,570 | |
Dividends receivable | | | 52,209 | |
Receivable for Fund shares sold | | | 27,668 | |
Tax reclaim receivable | | | 24,897 | |
Prepaid expenses and other assets | | | 1,011 | |
| | | | |
Total Assets | | | 266,033,989 | |
| | | | |
| |
Liabilities | | | | |
Payable for investments purchased | | | 19,311,287 | |
Payable to broker for collateral for securities on loan | | | 1,942,890 | |
Accrued expenses and other liabilities | | | 169,084 | |
Payable for Fund shares reacquired | | | 151,828 | |
Management fee payable | | | 146,158 | |
Distribution fee payable | | | 57,817 | |
Affiliated transfer agent fee payable | | | 40,939 | |
| | | | |
Total Liabilities | | | 21,820,003 | |
| | | | |
| |
Net Assets | | $ | 244,213,986 | |
| | | | |
| | | | | |
Net assets were comprised of: | | | | |
Shares of beneficial interest, at par | | $ | 18,406 | |
Paid-in capital in excess of par | | | 157,423,956 | |
Total distributable earnings (loss) | | | 86,771,624 | |
| | | | |
Net assets, July 31, 2019 | | $ | 244,213,986 | |
| | | | |
See Notes to Financial Statements.
| | | | |
| PGIM Jennison Diversified Growth Fund | | | 23 | |
Statement of Assets & Liabilities
as of July 31, 2019
| | | | |
Class A | | | | |
Net asset value and redemption price per share,
($229,202,027 ÷ 17,115,229 shares of beneficial interest issued and outstanding) | | $ | 13.39 | |
Maximum sales charge (5.50% of offering price) | | | 0.78 | |
| | | | |
Maximum offering price to public | | $ | 14.17 | |
| | | | |
| |
Class B | | | | |
Net asset value, offering price and redemption price per share, | | | | |
($990,687 ÷ 91,821 shares of beneficial interest issued and outstanding) | | $ | 10.79 | |
| | | | |
| |
Class C | | | | |
Net asset value, offering price and redemption price per share, | | | | |
($8,697,796 ÷ 802,047 shares of beneficial interest issued and outstanding) | | $ | 10.84 | |
| | | | |
| |
Class Z | | | | |
Net asset value, offering price and redemption price per share, | | | | |
($5,269,550 ÷ 393,003 shares of beneficial interest issued and outstanding) | | $ | 13.41 | |
| | | | |
| |
Class R6 | | | | |
Net asset value, offering price and redemption price per share, | | | | |
($53,926 ÷ 4,021 shares of beneficial interest issued and outstanding) | | $ | 13.41 | |
| | | | |
See Notes to Financial Statements.
Statement of Operations
Year Ended July 31, 2019
| | | | |
Net Investment Income (Loss) | | | | |
Income | | | | |
Unaffiliated dividend income (net of $23,057 foreign withholding tax) | | $ | 2,462,244 | |
Affiliated dividend income | | | 57,394 | |
Affiliated income from securities lending, net | | | 20,541 | |
| | | | |
Total income | | | 2,540,179 | |
| | | | |
| |
Expenses | | | | |
Management fee | | | 1,673,790 | |
Distribution fee(a) | | | 951,793 | |
Transfer agent’s fees and expenses (including affiliated expense of $244,783)(a) | | | 460,229 | |
Custodian and accounting fees | | | 75,335 | |
Registration fees(a) | | | 65,890 | |
Shareholders’ reports | | | 43,892 | |
Audit fee | | | 24,050 | |
Legal fees and expenses | | | 20,761 | |
Trustees’ fees | | | 15,423 | |
Miscellaneous | | | 19,198 | |
| | | | |
Total expenses | | | 3,350,361 | |
Less: Fee waiver and/or expense reimbursement(a) | | | (38,044 | ) |
Distribution fee waiver(a) | | | (99,598 | ) |
| | | | |
Net expenses | | | 3,212,719 | |
| | | | |
Net investment income (loss) | | | (672,540 | ) |
| | | | |
| |
Realized And Unrealized Gain (Loss) On Investments | | | | |
Net realized gain (loss) on investment transactions (including affiliated of $(995)) | | | 10,922,583 | |
Net change in unrealized appreciation (depreciation) on investments (including affiliated of $576) | | | 5,362,609 | |
| | | | |
Net gain (loss) on investment transactions | | | 16,285,192 | |
| | | | |
Net Increase (Decrease) In Net Assets Resulting From Operations | | $ | 15,612,652 | |
| | | | |
| (a) | Class specific expenses and waivers were as follows: |
| | | | | | | | | | | | | | | | | | | | |
| | | Class A | | | Class B | | | Class C | | | Class Z | | | Class R6 | |
Distribution fee | | | 597,583 | | | | 12,398 | | | | 341,812 | | | | — | | | | — | |
Transfer agent’s fees and expenses | | | 379,736 | | | | 11,040 | | | | 66,249 | | | | 3,159 | | | | 45 | |
Registration fees | | | 13,722 | | | | 12,859 | | | | 12,809 | | | | 13,250 | | | | 13,250 | |
Fee waiver and/or expense reimbursement | | | — | | | | (17,972 | ) | | | — | | | | (6,816 | ) | | | (13,256 | ) |
Distribution fee waiver | | | (99,598 | ) | | | — | | | | — | | | | — | | | | — | |
See Notes to Financial Statements.
| | | | |
| PGIM Jennison Diversified Growth Fund | | | 25 | |
Statements of Changes in Net Assets
| | | | | | | | |
| |
| | | Year Ended July 31, | |
| | |
| | | 2019 | | | 2018 | |
Increase (Decrease) in Net Assets | | | | | | | | |
Operations | | | | | | | | |
Net investment income (loss) | | $ | (672,540 | ) | | $ | 190,507 | |
Net realized gain (loss) on investment transactions | | | 10,922,583 | | | | 25,494,152 | |
Net change in unrealized appreciation (depreciation) on investments | | | 5,362,609 | | | | 17,758,751 | |
| | | | | | | | |
Net increase (decrease) in net assets resulting from operations | | | 15,612,652 | | | | 43,443,410 | |
| | | | | | | | |
| | |
Dividends and Distributions | | | | | | | | |
Distributions from distributable earnings* | | | | | | | | |
Class A | | | (16,246,746 | ) | | | — | |
Class B | | | (141,819 | ) | | | — | |
Class C | | | (4,685,728 | ) | | | — | |
Class Z | | | (424,868 | ) | | | — | |
Class R6 | | | (1,051 | ) | | | — | |
| | | | | | | | |
| | | (21,500,212 | ) | | | — | |
| | | | | | | | |
Dividends from net investment income* | | | | | | | | |
Class A | | | | | | | (359,379 | ) |
Class Z | | | | | | | (183 | ) |
Class R6 | | | | | | | (21 | ) |
| | | | | | | | |
| | | * | | | | (359,583 | ) |
| | | | | | | | |
Distributions from net realized gains* | | | | | | | | |
Class A | | | | | | | (18,411,360 | ) |
Class B | | | | | | | (225,437 | ) |
Class C | | | | | | | (5,884,435 | ) |
Class Z | | | | | | | (9,397 | ) |
Class R6 | | | | | | | (1,059 | ) |
| | | | | | | | |
| | | * | | | | (24,531,688 | ) |
| | | | | | | | |
Fund share transactions (Net of share conversions) | | | | | | | | |
Net proceeds from shares sold | | | 7,221,290 | | | | 8,114,816 | |
Net asset value of shares issued in reinvestment of dividends and distributions | | | 21,290,091 | | | | 24,639,762 | |
Cost of shares reacquired | | | (27,685,368 | ) | | | (33,347,805 | ) |
| | | | | | | | |
Net increase (decrease) in net assets from Fund share transactions | | | 826,013 | | | | (593,227 | ) |
| | | | | | | | |
Total increase (decrease) | | | (5,061,547 | ) | | | 17,958,912 | |
| | |
Net Assets: | | | | | | | | |
Beginning of year | | | 249,275,533 | | | | 231,316,621 | |
| | | | | | | | |
End of year(a) | | $ | 244,213,986 | | | $ | 249,275,533 | |
| | | | | | | | |
(a) Includes undistributed/(distributions in excess of) net investment income of: | | $ | * | | | $ | 181,997 | |
| | | | | | | | |
| * | For the year ended July 31, 2019, the disclosures have been revised to reflect revisions to RegulationS-X adopted by the SEC in 2018 (refer to Note 9). |
See Notes to Financial Statements.
Notes to Financial Statements
Prudential Investment Portfolios 5 (the “Trust”) is registered under the Investment Company Act of 1940, as amended (“1940 Act”), as a diversified,open-end management investment company. The Trust currently consists of fifteen funds: Prudential Day One Income Fund, Prudential Day One 2010 Fund, Prudential Day One 2015 Fund, Prudential Day One 2020 Fund, Prudential Day One 2025 Fund, Prudential Day One 2030 Fund, Prudential Day One 2035 Fund, Prudential Day One 2040 Fund, Prudential Day One 2045 Fund, Prudential Day One 2050 Fund, Prudential Day One 2055 Fund, Prudential Day One 2060 Fund, PGIM 60/40 Allocation Fund, PGIM Jennison Diversified Growth Fund and PGIM Jennison Rising Dividend Fund. These financial statements relate only to the PGIM Jennison Diversified Growth Fund (the “Fund”).
The investment objective of the Fund is long-term capital appreciation.
1. Accounting Policies
The Fund follows the investment company accounting and reporting guidance of the Financial Accounting Standards Board (“FASB”) Accounting Standard Codification (“ASC”) Topic 946 Financial Services—Investment Companies. The following accounting policies conform to U.S. generally accepted accounting principles. The Fund consistently follows such policies in the preparation of its financial statements.
Securities Valuation:The Fund holds securities and other assets and liabilities that are fair valued at the close of each day (generally, 4:00 PM Eastern time) the New York Stock Exchange (“NYSE”) is open for trading. Fair value is the price that would be received to sell an asset or paid to transfer a liability in an orderly transaction between market participants on the measurement date. The Trust’s Board of Trustees (the “Board”) has adopted valuation procedures for security valuation under which fair valuation responsibilities have been delegated to PGIM Investments LLC (“PGIM Investments” or the “Manager”). Pursuant to the Board’s delegation, the Manager has established a Valuation Committee responsible for supervising the fair valuation of portfolio securities and other assets and liabilities. The valuation procedures permit the Fund to utilize independent pricing vendor services, quotations from market makers, and alternative valuation methods when market quotations are either not readily available or not deemed representative of fair value. A record of the Valuation Committee’s actions is subject to the Board’s review, approval, and ratification at its next regularly scheduled quarterly meeting.
For the fiscal reportingyear-end, securities and other assets and liabilities were fair valued at the close of the last U.S. business day. Trading in certain foreign securities may occur when the NYSE is closed (including weekends and holidays). Because such foreign securities
| | | | |
| PGIM Jennison Diversified Growth Fund | | | 27 | |
Notes to Financial Statements(continued)
trade in markets that are open on weekends and U.S. holidays, the values of some of the Fund’s foreign investments may change on days when investors cannot purchase or redeem Fund shares.
Various inputs determine how the Fund’s investments are valued, all of which are categorized according to the three broad levels (Level 1, 2, or 3) detailed in the Schedule of Investments and referred to herein as the “fair value hierarchy” in accordance with FASB ASC Topic 820—Fair Value Measurements and Disclosures.
Common and preferred stocks, exchange-traded funds, and derivative instruments, such as futures or options, that are traded on a national securities exchange are valued at the last sale price as of the close of trading on the applicable exchange where the security principally trades. Securities traded via NASDAQ are valued at the NASDAQ official closing price. To the extent these securities are valued at the last sale price or NASDAQ official closing price, they are classified as Level 1 in the fair value hierarchy. In the event that no sale or official closing price on valuation date exists, these securities are generally valued at the mean between the last reported bid and ask prices, or at the last bid price in the absence of an ask price. These securities are classified as Level 2 in the fair value hierarchy.
Investments inopen-end,non-exchange-traded mutual funds are valued at their net asset values as of the close of the NYSE on the date of valuation. These securities are classified as Level 1 in the fair value hierarchy since they may be purchased or sold at their net asset values on the date of valuation.
Securities and other assets that cannot be priced according to the methods described above are valued based on pricing methodologies approved by the Board. In the event that unobservable inputs are used when determining such valuations, the securities will be classified as Level 3 in the fair value hierarchy.
When determining the fair value of securities, some of the factors influencing the valuation include: the nature of any restrictions on disposition of the securities; assessment of the general liquidity of the securities; the issuer’s financial condition and the markets in which it does business; the cost of the investment; the size of the holding and the capitalization of the issuer; the prices of any recent transactions or bids/offers for such securities or any comparable securities; any available analyst media or other reports or information deemed reliable by the Manager regarding the issuer or the markets or industry in which it operates. Using fair value to price securities may result in a value that is different from a security’s most recent closing price and from the price used by other unaffiliated mutual funds to calculate their net asset values.
Illiquid Securities:Pursuant to Rule22e-4 under the 1940 Act, the Fund has adopted a Board approved Liquidity Risk Management Program (“LRMP”) that requires, among other things, that the Fund limit its illiquid investments that are assets to no more than 15% of net assets. Illiquid securities are those that, because of the absence of a readily available market or due to legal or contractual restrictions on resale, may not reasonably be expected to be sold or disposed of in current market conditions in seven calendar days or less without the sale or disposition significantly changing the market value of the investment. The Fund may find it difficult to sell illiquid securities at the time considered most advantageous by its subadviser and may incur transaction costs that would not be incurred in the sale of securities that were freely marketable.
Restricted Securities:Securities acquired in unregistered, private sales from the issuing company or from an affiliate of the issuer are considered restricted as to disposition under federal securities law (“restricted securities”). Such restricted securities are valued pursuant to the valuation procedures noted above. Restricted securities that would otherwise be considered illiquid investments pursuant to the Fund’s LRMP because of legal restrictions on resale to the general public may be traded among qualified institutional buyers under Rule 144A of the Securities Act of 1933. Therefore, these Rule 144A securities, as well as commercial paper that is sold in private placements under Section 4(2) of the Securities Act of 1933, may be classified higher than “illiquid” under the LRMP (i.e. “moderately liquid” or “less liquid” investments). However, the liquidity of the Fund’s investments in restricted securities could be impaired if trading does not develop or declines.
Foreign Currency Translation:The books and records of the Fund are maintained in U.S. dollars. Foreign currency amounts are translated into U.S. dollars on the following basis:
(i) market value of investment securities, other assets and liabilities—at the current rates of exchange;
(ii) purchases and sales of investment securities, income and expenses—at the rates of exchange prevailing on the respective dates of such transactions.
Although the net assets of the Fund are presented at the foreign exchange rates and market values at the close of the period, the Fund does not generally isolate that portion of the results of operations arising as a result of changes in the foreign exchange rates from the fluctuations arising from changes in the market prices of long-term portfolio securities held at the end of the period. Similarly, the Fund does not isolate the effect of changes in foreign exchange rates from the fluctuations arising from changes in the market prices of long-term portfolio securities sold during the period. Accordingly, holding period realized foreign currency gains (losses) are included in the reported net realized gains (losses) on investment transactions.
Net realized gains (losses) on foreign currency transactions represent net foreign exchange gains (losses) from the disposition of holdings of foreign currencies, currency gains (losses) realized between the trade and settlement dates on forward currency transactions, and the
| | | | |
| PGIM Jennison Diversified Growth Fund | | | 29 | |
Notes to Financial Statements(continued)
difference between the amounts of interest, dividends and foreign withholding taxes recorded on the Fund’s books and the U.S. dollar equivalent amounts actually received or paid. Net unrealized currency gains (losses) arise from valuing foreign currency denominated assets and liabilities (other than investments) at period end exchange rates.
Master Netting Arrangements:The Trust, on behalf of the Fund, is subject to various Master Agreements, or netting arrangements, with select counterparties. These are agreements which a subadviser may have negotiated and entered into on behalf of all or a portion of the Fund. A master netting arrangement between the Fund and the counterparty permits the Fund to offset amounts payable by the Fund to the same counterparty against amounts to be received; and by the receipt of collateral from the counterparty by the Fund to cover the Fund’s exposure to the counterparty. However, there is no assurance that such mitigating factors are easily enforceable. In addition to master netting arrangements, the right toset-off exists when all the conditions are met such that each of the parties owes the other determinable amounts, the reporting party has the right toset-off the amount owed with the amount owed by the other party, the reporting party intends toset-off and the right ofset-off is enforceable by law. During the reporting period, there was no intention to settle on a net basis and all amounts are presented on a gross basis on the Statement of Assets and Liabilities.
Securities Lending:The Fund lends its portfolio securities to banks and broker-dealers. The loans are secured by collateral at least equal to the market value of the securities loaned. Collateral pledged by each borrower is invested in an affiliated money market fund and is marked to market daily, based on the previous day’s market value, such that the value of the collateral exceeds the value of the loaned securities. In the event of significant appreciation in value of securities on loan on the last business day of the reporting period, the financial statements may reflect a collateral value that is less than the market value of the loaned securities. Such shortfall is remedied as described above. Loans are subject to termination at the option of the borrower or the Fund. Upon termination of the loan, the borrower will return to the Fund securities identical to the loaned securities. Should the borrower of the securities fail financially, the Fund has the right to repurchase the securities in the open market using the collateral.
The Fund recognizes income, net of any rebate and securities lending agent fees, for lending its securities in the form of fees or interest on the investment of any cash received as collateral. The borrower receives all interest and dividends from the securities loaned and such payments are passed back to the lender in amounts equivalent thereto. The Fund also continues to recognize any unrealized gain (loss) in the market price of the securities loaned and on the change in the value of the collateral invested that may occur during the term of the loan. In addition, realized gain (loss) is recognized on changes in the value of the
collateral invested upon liquidation of the collateral. Net earnings from securities lending are disclosed on the Statement of Operations as “Income from securities lending, net”.
Securities Transactions and Net Investment Income:Securities transactions are recorded on the trade date. Realized gains (losses) from investment and currency transactions are calculated on the specific identification method. Dividend income is recorded on theex-date, or for certain foreign securities, when the Fund becomes aware of such dividends. Expenses are recorded on an accrual basis, which may require the use of certain estimates by management that may differ from actual. Net investment income or loss (other than class specific expenses and waivers, which are allocated as noted below) and unrealized and realized gains (losses) are allocated daily to each class of shares based upon the relative proportion of adjusted net assets of each class at the beginning of the day. Class specific expenses and waivers, where applicable, are charged to the respective share classes. Class specific expenses include distribution fees and distribution fee waivers, shareholder servicing fees, transfer agent’s fees and expenses, registration fees and fee waivers and/or expense reimbursements, as applicable.
Taxes:It is the Fund’s policy to continue to meet the requirements of the Internal Revenue Code applicable to regulated investment companies and to distribute all of its taxable net investment income and capital gains, if any, to its shareholders. Therefore, no federal income tax provision is required. Withholding taxes on foreign dividends, interest and capital gains, if any, are recorded, net of reclaimable amounts, at the time the related income is earned.
Dividends and Distributions:The Fund expects to pay dividends from net investment income and distributions from net realized capital gains, if any, annually. Dividends and distributions to shareholders, which are determined in accordance with federal income tax regulations and which may differ from generally accepted accounting principles, are recorded on theex-date. Permanent book/tax differences relating to income and gain (loss) are reclassified between total distributable earnings (loss) andpaid-in capital in excess of par, as appropriate.
Estimates:The preparation of financial statements requires management to make estimates and assumptions that affect the reported amounts and disclosures in the financial statements. Actual results could differ from those estimates.
2. Agreements
The Trust, on behalf of the Fund, has a management agreement with the Manager. Pursuant to this agreement, the Manager has responsibility for all investment advisory services and supervises the subadviser’s performance of such services. In addition, under the management agreement, the Manager provides all of the administrative functions necessary for the organization, operation and management of the Fund. The Manager administers the corporate affairs of the Fund and, in connection therewith, furnishes the Fund with office facilities, together with those ordinary clerical and bookkeeping services which are not being
| | | | |
| PGIM Jennison Diversified Growth Fund | | | 31 | |
Notes to Financial Statements(continued)
furnished by the Fund’s custodian and the Fund’s transfer agent. The Manager is also responsible for the staffing and management of dedicated groups of legal, marketing, compliance and related personnel necessary for the operation of the Fund. The legal, marketing, compliance and related personnel are also responsible for the management and oversight of the various service providers to the Fund, including, but not limited to, the custodian, transfer agent, and accounting agent.
The Manager has entered into a subadvisory agreement with Jennison Associates LLC (“Jennison”). The subadvisory agreement provides that Jennison will furnish investment advisory services in connection with the management of the Fund. In connection therewith, Jennison is obligated to keep certain books and records of the Fund. The Manager pays for the services of Jennison, the cost of compensation of officers of the Fund, occupancy and certain clerical and bookkeeping costs of the Fund. The Fund bears all other costs and expenses.
The management fee paid to the Manager is accrued daily and payable monthly at an annual rate of 0.70% average daily net assets on the first $500 million, 0.65% of the average daily net assets on the next $500 million and 0.60% of the average daily net assets assets in excess of $1 billion. The effective management fee rate before any waivers and/or expense reimbursements was 0.70% for the reporting period ended July 31, 2019.
The Manager has contractually agreed, through November 30, 2020, to limit total annual operating expenses after fee waivers and/or expense reimbursements to 2.26% of average daily net assets for Class B shares, 1.00% of average daily net assets for Class Z shares, and 1.00% of average daily net assets for Class R6 shares. This contractual waiver excludes interest, brokerage, taxes (such as income and foreign withholding taxes, stamp duty and deferred tax expenses), acquired fund fees and expenses, extraordinary expenses, and certain other Fund expenses such as dividend and interest expense and broker charges on short sales. Where applicable, the Manager agrees to waive management fees or shared operating expenses on any share class to the same extent that it waives similar expenses on any other share class. In addition, total annual operating expenses for Class R6 shares will not exceed total annual operating expenses for Class Z shares. Fees and/or expenses waived and/or reimbursed by the Manager may be recouped by the Manager within the same fiscal year during which such waiver and/or reimbursement is made if such recoupment can be realized without exceeding the expense limit in effect at the time of the recoupment for that fiscal year.
The Trust, on behalf of the Fund, has a distribution agreement with Prudential Investment Management Services LLC (“PIMS”), which acts as the distributor of the Class A, Class B, Class C, Class Z and Class R6 shares of the Fund. The Fund compensates PIMS for distributing and servicing the Fund’s Class A, Class B and Class C shares, pursuant to the
plans of distribution (the “Distribution Plans”), regardless of expenses actually incurred by PIMS. The distribution fees are accrued daily and payable monthly. No distribution or service fees are paid to PIMS as distributor of the Class Z and Class R6 shares of the Fund.
Pursuant to the Distribution Plans, the Fund compensates PIMS for distribution related activities at an annual rate of up to 0.30%, 1% and 1% of the average daily net assets of the Class A, Class B and Class C shares, respectively. PIMS has contractually agreed through November 30, 2020 to limit such fees to 0.25% of the average daily net assets of Class A shares.
For the year ended July 31, 2019, PIMS received $74,527 infront-end sales charges resulting from sales of Class A shares. Additionally, for the year ended July 31, 2019, PIMS received $461 and $700 in contingent deferred sales charges imposed upon redemptions by certain Class B and Class C shareholders, respectively. From these fees, PIMS paid such sales charges to broker-dealers, who in turn paid commissions to salespersons and incurred other distribution costs.
PGIM Investments, PIMS and Jennison are indirect, wholly-owned subsidiaries of Prudential Financial, Inc. (“Prudential”).
3. Other Transactions with Affiliates
Prudential Mutual Fund Services LLC (“PMFS”), an affiliate of PGIM Investments and an indirect, wholly-owned subsidiary of Prudential, serves as the Fund’s transfer agent. Transfer agent’s fees and expenses in the Statement of Operations include certainout-of-pocket expenses paid tonon-affiliates, where applicable.
The Fund may invest its overnight sweep cash in the PGIM Core Ultra Short Bond Fund (the “Core Fund”), and its securities lending cash collateral in the PGIM Institutional Money Market Fund (the “Money Market Fund”), each a series of Prudential Investment Portfolios 2, registered under the 1940 Act and managed by PGIM Investments. Through the Fund’s investments in the mentioned underlying funds, PGIM Investments and/or its affiliates are paid fees or reimbursed for providing their services. Earnings from the Core Fund and Money Market Fund are disclosed on the Statement of Operations as “Affiliated dividend income” and “Income from securities lending, net”, respectively.
The Fund may enter into certain securities purchase or sale transactions under Board approved Rule17a-7 procedures. Rule17a-7 is an exemptive rule under the 1940 Act, that subject to certain conditions, permits purchase and sale transactions among affiliated investment companies, or between an investment company and a person that is affiliated solely by reason of having a common (or affiliated) investment adviser, common directors, and/or common officers. Pursuant to the Rule17a-7 procedures and consistent with guidance issued by the SEC, the Trust’s Chief Compliance Officer (“CCO”) prepares a quarterly summary of all such transactions for submission to the Board, together with the CCO’s written representation that all such17a-7 transactions were effected in accordance
| | | | |
| PGIM Jennison Diversified Growth Fund | | | 33 | |
Notes to Financial Statements(continued)
with the Fund’s Rule17a-7 procedures. For the year ended July 31, 2019, no17a-7 transactions were entered into by the Fund.
4. Portfolio Securities
The aggregate cost of purchases and proceeds from sales of portfolio securities (excluding short-term investments and U.S. Government securities) for the year ended July 31, 2019, were $297,052,316 and $319,125,589, respectively.
A summary of the cost of purchases and proceeds from sales of shares of affiliated investments for the year ended July 31, 2019, is presented as follows:
| | | | | | | | | | | | | | | | | | | | | | | | | | | | | | |
Value,
Beginning
of Year | | | Cost of
Purchases | | | Proceeds
from Sales | | | Change in
Unrealized
Gain
(Loss) | | | Realized
Gain
(Loss) | | | Value,
End of
Year | | | Shares,
End of
Year | | | Income | |
| | PGIM Core Ultra Short Bond Fund* | |
| $ | 2,529,399 | | | $ | 32,972,795 | | | $ | 33,561,232 | | | $ | — | | | $ | — | | | $ | 1,940,962 | | | | 1,940,962 | | | $ | 57,394 | |
|
| | PGIM Institutional Money Market Fund* | |
| | 11,164,184 | | | | 167,694,334 | | | | 176,902,130 | | | | 576 | | | | (995 | ) | | | 1,955,969 | | | | 1,955,578 | | | | 20,541 | ** |
| | | | | | | | | | | | | | | | | | | | | | | | | | | | | | |
| $ | 13,693,583 | | | $ | 200,667,129 | | | $ | 210,463,362 | | | $ | 576 | | | $ | (995 | ) | | $ | 3,896,931 | | | | | | | $ | 77,935 | |
| | | | | | | | | | | | | | | | | | | | | | | | | | | | | | |
| * | The Fund did not have any capital gain distributions during the reporting period. |
| ** | This amount is included in “Income from securities lending, net” on the Statement of Operations. |
5. Distributions and Tax Information
Distributions to shareholders, which are determined in accordance with federal income tax regulations and which may differ from generally accepted accounting principles, are recorded on theex-date. In order to present total distributable earnings (loss) andpaid-in capital in excess of par on the Statement of Assets and Liabilities that more closely represent their tax character, certain adjustments have been made to total distributable earnings (loss) andpaid-in capital in excess of par. For the year ended July 31, 2019, the adjustments were to increase total distributable earnings and decreasepaid-in capital in excess of par by $672,540 due to a net operating loss. Net investment income (loss), net realized gain (loss) on investment transactions and net assets were not affected by this change.
For the year ended July 31, 2019, the tax character of dividends paid by the Fund were $8,020,741 of ordinary income and $13,479,471 of long-term capital gains. For the year ended July 31, 2018, the tax character of dividends paid by the Fund were $12,429,569 of ordinary income and $12,461,702 of long-term capital gains.
As of July 31, 2019, the accumulated undistributed earnings on a tax basis was $9,183,239 of long-term capital gains.
The United States federal income tax basis of the Fund’s investments and the net unrealized appreciation as of July 31, 2019 were as follows:
| | | | | | |
Tax Basis | | Gross Unrealized Appreciation | | Gross Unrealized Depreciation | | Net Unrealized Appreciation |
| $167,557,249 | | $80,188,545 | | $(2,600,160) | | $77,588,385 |
The difference between book basis and tax basis was primarily attributable to deferred losses on wash sales.
The Manager has analyzed the Fund’s tax positions taken on federal, state and local income tax returns for all open tax years and has concluded that no provision for income tax is required in the Fund’s financial statements for the current reporting period. The Fund’s federal, state and local income and federal excise tax returns for tax years for which the applicable statutes of limitations have not expired are subject to examination by the Internal Revenue Service and state departments of revenue.
6. Capital and Ownership
The Fund offers Class A, Class B, Class C, Class Z and Class R6 shares. Class A shares are sold with a maximumfront-end sales charge of 5.50%. Investors who purchase $1 million or more of Class A shares and sell these shares within 12 months of purchase are subject to a contingent deferred sales charge (“CDSC”) of 1%, although they are not subject to an initial sales charge. The Class A CDSC is waived for certain retirement and/or benefit plans. A special exchange privilege is also available for shareholders who qualified to purchase Class A shares at net asset value. Class B shares are sold with a CDSC which declines from 5% to zero depending on the period of time the shares are held. Class B shares will automatically convert to Class A shares on a monthly basis approximately seven years after purchase. Class B shares are closed to new purchases. Class C shares are sold with a CDSC of 1% on sales made within 12 months of purchase. Class C shares will automatically convert to Class A shares on a monthly basis approximately 10 years after purchase. Class Z and Class R6 shares are not subject to any sales or redemption charge and are available exclusively for sale to a limited group of investors.
Under certain circumstances, an exchange may be made from specified share classes of the Fund to one or more other share classes of the Fund as presented in the table of transactions in shares of beneficial interest.
The Trust has authorized an unlimited number of shares of beneficial interest of the Fund at $0.001 par value per share.
| | | | |
| PGIM Jennison Diversified Growth Fund | | | 35 | |
Notes to Financial Statements(continued)
As of July 31, 2019, Prudential, through its affiliated entities, including affiliated funds (if applicable), owned 957 Class Z shares and 957 Class R6 shares of the Fund. At reporting period end, three shareholders of record, each holding greater than 5% of the Fund, held 23% of the Fund’s outstanding shares.
Transactions in shares of beneficial interest were as follows:
| | | | | | | | |
Class A | | Shares | | | Amount | |
Year ended July 31, 2019: | | | | | | | | |
Shares sold | | | 405,843 | | | $ | 5,121,454 | |
Shares issued in reinvestment of dividends and distributions | | | 1,368,750 | | | | 16,082,820 | |
Shares reacquired | | | (1,645,139 | ) | | | (21,255,240 | ) |
| | | | | | | | |
Net increase (decrease) in shares outstanding before conversion | | | 129,454 | | | | (50,966 | ) |
Shares issued upon conversion from other share class(es) | | | 2,905,640 | | | | 38,026,887 | |
Shares reacquired upon conversion into other share class(es) | | | (258,077 | ) | | | (3,639,999 | ) |
| | | | | | | | |
Net increase (decrease) in shares outstanding | | | 2,777,017 | | | $ | 34,335,922 | |
| | | | | | | | |
Year ended July 31, 2018: | | | | | | | | |
Shares sold | | | 423,776 | | | $ | 5,602,895 | |
Shares issued in reinvestment of dividends and distributions | | | 1,503,353 | | | | 18,566,414 | |
Shares reacquired | | | (1,630,778 | ) | | | (21,550,211 | ) |
| | | | | | | | |
Net increase (decrease) in shares outstanding before conversion | | | 296,351 | | | | 2,619,098 | |
Shares issued upon conversion from other share class(es) | | | 69,799 | | | | 931,379 | |
Shares reacquired upon conversion into other share class(es) | | | (60,641 | ) | | | (812,950 | ) |
| | | | | | | | |
Net increase (decrease) in shares outstanding | | | 305,509 | | | $ | 2,737,527 | |
| | | | | | | | |
Class B | | | | | | |
Year ended July 31, 2019: | | | | | | | | |
Shares sold | | | 6,261 | | | $ | 64,869 | |
Shares issued in reinvestment of dividends and distributions | | | 14,643 | | | | 139,545 | |
Shares reacquired | | | (19,135 | ) | | | (203,886 | ) |
| | | | | | | | |
Net increase (decrease) in shares outstanding before conversion | | | 1,769 | | | | 528 | |
Shares reacquired upon conversion into other share class(es) | | | (47,436 | ) | | | (495,138 | ) |
| | | | | | | | |
Net increase (decrease) in shares outstanding | | | (45,667 | ) | | $ | (494,610 | ) |
| | | | | | | | |
Year ended July 31, 2018: | | | | | | | | |
Shares sold | | | 8,965 | | | $ | 100,545 | |
Shares issued in reinvestment of dividends and distributions | | | 21,374 | | | | 220,576 | |
Shares reacquired | | | (35,107 | ) | | | (388,334 | ) |
| | | | | | | | |
Net increase (decrease) in shares outstanding before conversion | | | (4,768 | ) | | | (67,213 | ) |
Shares reacquired upon conversion into other share class(es) | | | (56,226 | ) | | | (641,424 | ) |
| | | | | | | | |
Net increase (decrease) in shares outstanding | | | (60,994 | ) | | $ | (708,637 | ) |
| | | | | | | | |
| | | | | | | | |
Class C | | Shares | | | Amount | |
Year ended July 31, 2019: | | | | | | | | |
Shares sold | | | 158,179 | | | $ | 1,590,798 | |
Shares issued in reinvestment of dividends and distributions | | | 486,308 | | | | 4,658,833 | |
Shares reacquired | | | (517,777 | ) | | | (5,502,741 | ) |
| | | | | | | | |
Net increase (decrease) in shares outstanding before conversion | | | 126,710 | | | | 746,890 | |
Shares reacquired upon conversion into other share class(es) | | | (3,533,827 | ) | | | (37,659,019 | ) |
| | | | | | | | |
Net increase (decrease) in shares outstanding | | | (3,407,117 | ) | | $ | (36,912,129 | ) |
| | | | | | | | |
Year ended July 31, 2018: | | | | | | | | |
Shares sold | | | 127,453 | | | $ | 1,441,309 | |
Shares issued in reinvestment of dividends and distributions | | | 565,001 | | | | 5,842,112 | |
Shares reacquired | | | (987,811 | ) | | | (11,122,006 | ) |
| | | | | | | | |
Net increase (decrease) in shares outstanding before conversion | | | (295,357 | ) | | | (3,838,585 | ) |
Shares reacquired upon conversion into other share class(es) | | | (34,928 | ) | | | (383,288 | ) |
| | | | | | | | |
Net increase (decrease) in shares outstanding | | | (330,285 | ) | | $ | (4,221,873 | ) |
| | | | | | | | |
Class Z | | | | | | |
Year ended July 31, 2019: | | | | | | | | |
Shares sold | | | 30,834 | | | $ | 404,392 | |
Shares issued in reinvestment of dividends and distributions | | | 34,710 | | | | 407,842 | |
Shares reacquired | | | (57,220 | ) | | | (723,501 | ) |
| | | | | | | | |
Net increase (decrease) in shares outstanding before conversion | | | 8,324 | | | | 88,733 | |
Shares issued upon conversion from other share class(es) | | | 266,760 | | | | 3,767,269 | |
| | | | | | | | |
Net increase (decrease) in shares outstanding | | | 275,084 | | | $ | 3,856,002 | |
| | | | | | | | |
Period ended July 31, 2018*: | | | | | | | | |
Shares sold | | | 70,666 | | | $ | 960,067 | |
Shares issued in reinvestment of dividends and distributions | | | 776 | | | | 9,581 | |
Shares reacquired | | | (21,145 | ) | | | (287,254 | ) |
| | | | | | | | |
Net increase (decrease) in shares outstanding before conversion | | | 50,297 | | | | 682,394 | |
Shares issued upon conversion from other share class(es) | | | 67,622 | | | | 906,283 | |
| | | | | | | | |
Net increase (decrease) in shares outstanding | | | 117,919 | | | $ | 1,588,677 | |
| | | | | | | | |
Class R6 | | | | | | |
Year ended July 31, 2019: | | | | | | | | |
Shares sold | | | 3,065 | | | $ | 39,777 | |
Shares issued in reinvestment of dividends and distributions | | | 89 | | | | 1,051 | |
| | | | | | | | |
Net increase (decrease) in shares outstanding | | | 3,154 | | | $ | 40,828 | |
| | | | | | | | |
Period ended July 31, 2018*: | | | | | | | | |
Shares sold | | | 780 | | | $ | 10,000 | |
Shares issued in reinvestment of dividends and distributions | | | 87 | | | | 1,079 | |
| | | | | | | | |
Net increase (decrease) in shares outstanding | | | 867 | | | $ | 11,079 | |
| | | | | | | | |
| * | Commencement of offering was September 27, 2017. |
7. Borrowings
The Trust, on behalf of the Fund, along with other affiliated registered investment companies (the “Funds”), is a party to a Syndicated Credit Agreement (“SCA”) with a group of banks. The purpose of the SCA is to provide an alternative source of temporary funding for capital share redemptions. The SCA provides for a commitment of $900 million for the period October 4, 2018 through October 3, 2019. The Funds pay an annualized commitment fee
| | | | |
| PGIM Jennison Diversified Growth Fund | | | 37 | |
Notes to Financial Statements(continued)
of 0.15% of the unused portion of the SCA. The Fund’s portion of the commitment fee for the unused amount, allocated based upon a method approved by the Board, is accrued daily and paid quarterly. Prior to October 4, 2018, the Funds had another SCA that provided a commitment of $900 million and the Funds paid an annualized commitment fee of 0.15% of the unused portion of the SCA. The interest on borrowings under both SCAs is paid monthly and at a per annum interest rate based upon a contractual spread plus the higher of (1) the effective federal funds rate, (2) the1-month LIBOR rate or (3) zero percent.
Certain affiliated registered investment companies that are parties to the SCA include portfolios that are subject to a predetermined mathematical formula used to manage certain benefit guarantees offered under variable annuity contracts. The formula may result in large scale asset flows into and out of these portfolios. Consequently, these portfolios may be more likely to utilize the SCA for purposes of funding redemptions. It may be possible for those portfolios to fully exhaust the committed amount of the SCA, thereby requiring the Manager to allocate available funding per a Board-approved methodology designed to treat the Funds in the SCA equitably. The Fund did not utilize the SCA during the year ended July 31, 2019.
8. Risks of Investing in the Fund
The Fund’s risks include, but are not limited to, some or all of the risks discussed below:
Equity and Equity-Related Securities Risks:The value of a particular security could go down and you could lose money. In addition to an individual security losing value, the value of the equity markets or a sector in which the Fund invests could go down. The Fund’s holdings can vary significantly from broad market indexes and the performance of the Fund can deviate from the performance of these indexes. Different parts of a market can react differently to adverse issuer, market, regulatory, political and economic developments.
Foreign Securities Risk:The Fund’s investments in securities of foreign issuers or issuers with significant exposure to foreign markets involve additional risk. Foreign countries in which the Fund may invest may have markets that are less liquid, less regulated and more volatile than US markets. The value of the Fund’s investments may decline because of factors affecting the particular issuer as well as foreign markets and issuers generally, such as unfavorable government actions, and political or financial instability.
Market and Credit Risk:Securities markets may be volatile and the market prices of the Fund’s securities may decline. Securities fluctuate in price based on changes in an issuer’s financial condition and overall market and economic conditions. If the market prices of the securities owned by the Fund fall, the value of an investment in the Fund will decline. Additionally, the Fund may also be exposed to credit risk in the event that an issuer or guarantor fails to perform or that an institution or entity with which the Fund has unsettled or
open transactions defaults.
9. Recent Accounting Pronouncements and Reporting Updates
In August 2018, the Securities and Exchange Commission (the “SEC”) adopted amendments to RegulationS-X to update and simplify the disclosure requirements for registered investment companies by eliminating requirements that are redundant or duplicative of US GAAP requirements or other SEC disclosure requirements. The new amendments require the presentation of the total, rather than the components, of distributable earnings on the Statement of Assets and Liabilities and the total, rather than the components, of dividends from net investment income and distributions from net realized gains on the Statements of Changes in Net Assets. The amendments also removed the requirement for the parenthetical disclosure of undistributed net investment income on the Statements of Changes in Net Assets and certain tax adjustments that were reflected in the Notes to Financial Statements. The Manager has adopted the amendments and reflected them in the Fund’s financial statements.
In August 2018, the FASB issued Accounting Standards Update (“ASU”)No. 2018-13, which changes certain fair value measurement disclosure requirements. The new ASU, in addition to other modifications and additions, removes the requirement to disclose the amount and reasons for transfers between Level 1 and Level 2 of the fair value hierarchy, and the Fund’s policy for the timing of transfers between levels. The amendments are effective for financial statements issued for fiscal years beginning after December 15, 2019, and interim periods within those fiscal years. The Manager has evaluated the implications of certain provisions of the ASU and has determined to early adopt aspects related to the removal and modification of certain fair value measurement disclosures under the ASU effective immediately. The Manager continues to evaluate certain other provisions of the ASU and does not expect a material impact to financial statement disclosures.
| | | | |
| PGIM Jennison Diversified Growth Fund | | | 39 | |
Financial Highlights
| | | | | | | | | | | | | | | | | | | | |
| Class A Shares | | | | | | | | | | | | | | | |
| | | Year Ended July 31, | |
| | | 2019 | | | 2018 | | | 2017 | | | 2016 | | | 2015 | |
| Per Share Operating Performance(a): | | | | | | | | | | | | | | | | | | | | |
| Net Asset Value, Beginning of Year | | | $13.79 | | | | $12.79 | | | | $11.03 | | | | $12.01 | | | | $11.81 | |
| Income (loss) from investment operations: | | | | | | | | | | | | | | | | | | | | |
| Net investment income (loss) | | | (0.02 | ) | | | 0.03 | | | | 0.04 | | | | 0.06 | | | | 0.06 | |
| Net realized and unrealized gain (loss) on investment and foreign currency transactions | | | 0.80 | | | | 2.35 | | | | 2.09 | | | | (0.19 | ) | | | 1.28 | |
| Total from investment operations | | | 0.78 | | | | 2.38 | | | | 2.13 | | | | (0.13 | ) | | | 1.34 | |
| Less Dividends and Distributions: | | | | | | | | | | | | | | | | | | | | |
| Dividends from net investment income | | | (0.01 | ) | | | (0.02 | ) | | | (0.06 | ) | | | (0.03 | ) | | | (0.04 | ) |
| Distributions from net realized gains | | | (1.17 | ) | | | (1.36 | ) | | | (0.31 | ) | | | (0.82 | ) | | | (1.10 | ) |
| Total dividends and distributions | | | (1.18 | ) | | | (1.38 | ) | | | (0.37 | ) | | | (0.85 | ) | | | (1.14 | ) |
| Net asset value, end of year | | | $13.39 | | | | $13.79 | | | | $12.79 | | | | $11.03 | | | | $12.01 | |
| Total Return(b): | | | 6.93% | | | | 19.90% | | | | 19.78% | | | | (0.82)% | | | | 11.84% | |
| |
| Ratios/Supplemental Data: | | | | |
| Net assets, end of year (000) | | | $229,202 | | | | $197,689 | | | | $179,539 | | | | $166,997 | | | | $186,770 | |
| Average net assets (000) | | | $199,190 | | | | $190,178 | | | | $169,500 | | | | $167,524 | | | | $181,444 | |
| Ratios to average net assets(c)(d): | | | | | | | | | | | | | | | | | | | | |
| Expenses after waivers and/or expense reimbursement | | | 1.23% | | | | 1.20% | | | | 1.24% | | | | 1.28% | | | | 1.24% | |
| Expenses before waivers and/or expense reimbursement | | | 1.28% | | | | 1.25% | | | | 1.29% | | | | 1.33% | | | | 1.29% | |
| Net investment income (loss) | | | (0.18)% | | | | 0.24% | | | | 0.38% | | | | 0.52% | | | | 0.47% | |
| Portfolio turnover rate(e) | | | 125% | | | | 185% | | | | 181% | | | | 246% | | | | 295% | |
| (a) | Calculated based on average shares outstanding during the year. |
| (b) | Total return does not consider the effects of sales loads. Total return is calculated assuming a purchase of a share on the first day and a sale on the last day of each year reported and includes reinvestment of dividends and distributions, if any. Total returns may reflect adjustments to conform to generally accepted accounting principles. |
| (c) | Does not include expenses of the underlying funds in which the Fund invests. |
| (d) | Effective August 1, 2017, class specific expenses include transfer agent fees and expenses and registration fees, which are charged to their respective share class. |
| (e) | The Fund’s portfolio turnover rate is calculated in accordance with regulatory requirements, without regard to transactions involving short-term investments and certain derivatives. If such transactions were included, the Fund’s portfolio turnover rate may be higher. |
See Notes to Financial Statements.
| | | | | | | | | | | | | | | | | | | | |
| Class B Shares | | | | | | | | | | | | | | | |
| | | Year Ended July 31, | |
| | | 2019 | | | 2018 | | | 2017 | | | 2016 | | | 2015 | |
| Per Share Operating Performance(a): | | | | | | | | | | | | | | | | | | | | |
| Net Asset Value, Beginning of Year | | | $11.45 | | | | $10.93 | | | | $9.49 | | | | $10.49 | | | | $10.49 | |
| Income (loss) from investment operations: | | | | | | | | | | | | | | | | | | | | |
| Net investment income (loss) | | | (0.13 | ) | | | (0.10 | ) | | | (0.03 | ) | | | (0.02 | ) | | | (0.03 | ) |
| Net realized and unrealized gain (loss) on investment and foreign currency transactions | | | 0.64 | | | | 1.98 | | | | 1.78 | | | | (0.16 | ) | | | 1.13 | |
| Total from investment operations | | | 0.51 | | | | 1.88 | | | | 1.75 | | | | (0.18 | ) | | | 1.10 | |
| Less Dividends and Distributions: | | | | | | | | | | | | | | | | | | | | |
| Distributions from net realized gains | | | (1.17 | ) | | | (1.36 | ) | | | (0.31 | ) | | | (0.82 | ) | | | (1.10 | ) |
| Net asset value, end of year | | | $10.79 | | | | $11.45 | | | | $10.93 | | | | $9.49 | | | | $10.49 | |
| Total Return(b): | | | 5.79% | | | | 18.53% | | | | 18.90% | | | | (1.51)% | | | | 11.01% | |
| |
| Ratios/Supplemental Data: | | | | |
| Net assets, end of year (000) | | | $991 | | | | $1,574 | | | | $2,169 | | | | $2,898 | | | | $4,200 | |
| Average net assets (000) | | | $1,240 | | | | $1,898 | | | | $2,508 | | | | $3,375 | | | | $4,801 | |
| Ratios to average net assets(c)(d): | | | | | | | | | | | | | | | | | | | | |
| Expenses after waivers and/or expense reimbursement | | | 2.26% | | | | 2.26% | | | | 1.99% | | | | 2.03% | | | | 1.99% | |
| Expenses before waivers and/or expense reimbursement | | | 3.71% | | | | 3.12% | | | | 1.99% | | | | 2.03% | | | | 1.99% | |
| Net investment income (loss) | | | (1.19)% | | | | (0.85)% | | | | (0.33)% | | | | (0.21)% | | | | (0.25)% | |
| Portfolio turnover rate(e) | | | 125% | | | | 185% | | | | 181% | | | | 246% | | | | 295% | |
| (a) | Calculated based on average shares outstanding during the year. |
| (b) | Total return does not consider the effects of sales loads. Total return is calculated assuming a purchase of a share on the first day and a sale on the last day of each year reported and includes reinvestment of dividends and distributions, if any. Total returns may reflect adjustments to conform to generally accepted accounting principles. |
| (c) | Does not include expenses of the underlying funds in which the Fund invests. |
| (d) | Effective August 1, 2017, class specific expenses include transfer agent fees and expenses and registration fees, which are charged to their respective share class. |
| (e) | The Fund’s portfolio turnover rate is calculated in accordance with regulatory requirements, without regard to transactions involving short-term investments and certain derivatives. If such transactions were included, the Fund’s portfolio turnover rate may be higher. |
See Notes to Financial Statements.
| | | | |
| PGIM Jennison Diversified Growth Fund | | | 41 | |
Financial Highlights(continued)
| | | | | | | | | | | | | | | | | | | | |
| Class C Shares | | | | | | | | | | | | | | | |
| | | Year Ended July 31, | |
| | | 2019 | | | 2018 | | | 2017 | | | 2016 | | | 2015 | |
| Per Share Operating Performance(a): | | | | | | | | | | | | | | | | | | | | |
| Net Asset Value, Beginning of Year | | | $11.49 | | | | $10.93 | | | | $9.49 | | | | $10.49 | | | | $10.49 | |
| Income (loss) from investment operations: | | | | | | | | | | | | | | | | | | | | |
| Net investment income (loss) | | | (0.10 | ) | | | (0.06 | ) | | | (0.04 | ) | | | (0.02 | ) | | | (0.03 | ) |
| Net realized and unrealized gain (loss) on investment and foreign currency transactions | | | 0.62 | | | | 1.98 | | | | 1.79 | | | | (0.16 | ) | | | 1.13 | |
| Total from investment operations | | | 0.52 | | | | 1.92 | | | | 1.75 | | | | (0.18 | ) | | | 1.10 | |
| Less Dividends and Distributions: | | | | | | | | | | | | | | | | | | | | |
| Distributions from net realized gains | | | (1.17 | ) | | | (1.36 | ) | | | (0.31 | ) | | | (0.82 | ) | | | (1.10 | ) |
| Net asset value, end of year | | | $10.84 | | | | $11.49 | | | | $10.93 | | | | $9.49 | | | | $10.49 | |
| Total Return(b): | | | 5.95% | | | | 18.92% | | | | 18.90% | | | | (1.51)% | | | | 11.01% | |
| |
| Ratios/Supplemental Data: | |
| Net assets, end of year (000) | | | $8,698 | | | | $48,373 | | | | $49,609 | | | | $48,858 | | | | $55,384 | |
| Average net assets (000) | | | $34,180 | | | | $50,985 | | | | $48,525 | | | | $49,288 | | | | $56,581 | |
| Ratios to average net assets(c)(d): | | | | | | | | | | | | | | | | | | | | |
| Expenses after waivers and/or expense reimbursement | | | 2.01% | | | | 1.92% | | | | 1.99% | | | | 2.03% | | | | 1.99% | |
| Expenses before waivers and/or expense reimbursement | | | 2.01% | | | | 1.92% | | | | 1.99% | | | | 2.03% | | | | 1.99% | |
| Net investment income (loss) | | | (0.91)% | | | | (0.49)% | | | | (0.36)% | | | | (0.23)% | | | | (0.27)% | |
| Portfolio turnover rate(e) | | | 125% | | | | 185% | | | | 181% | | | | 246% | | | | 295% | |
| (a) | Calculated based on average shares outstanding during the year. |
| (b) | Total return does not consider the effects of sales loads. Total return is calculated assuming a purchase of a share on the first day and a sale on the last day of each year reported and includes reinvestment of dividends and distributions, if any. Total returns may reflect adjustments to conform to generally accepted accounting principles. |
| (c) | Does not include expenses of the underlying funds in which the Fund invests. |
| (d) | Effective August 1, 2017, class specific expenses include transfer agent fees and expenses and registration fees, which are charged to their respective share class. |
| (e) | The Fund’s portfolio turnover rate is calculated in accordance with regulatory requirements, without regard to transactions involving short-term investments and certain derivatives. If such transactions were included, the Fund’s portfolio turnover rate may be higher. |
See Notes to Financial Statements.
| | | | | | | | | | | | |
| Class Z Shares | | | | | | | | | |
| | | Year Ended July 31, 2019 | | | | | | September 27, 2017(a) through July 31, 2018 | |
| Per Share Operating Performance(b): | | | | | | | | | | | | |
| Net Asset Value, Beginning of Period | | | $13.81 | | | | | | | | $12.82 | |
| Income (loss) from investment operations: | | | | | | | | | | | | |
| Net investment income (loss) | | | 0.01 | | | | | | | | 0.08 | |
| Net realized and unrealized gain (loss) on investment and foreign currency transactions | | | 0.80 | | | | | | | | 2.29 | |
| Total from investment operations | | | 0.81 | | | | | | | | 2.37 | |
| Less Dividends and Distributions: | | | | | | | | | | | | |
| Dividends from net investment income | | | (0.04 | ) | | | | | | | (0.02 | ) |
| Distributions from net realized gains | | | (1.17 | ) | | | | | | | (1.36 | ) |
| Total dividends and distributions | | | (1.21 | ) | | | | | | | (1.38 | ) |
| Net asset value, end of period | | | $13.41 | | | | | | | | $13.81 | |
| Total Return(c): | | | 7.20% | | | | | | | | 19.79% | |
| |
| Ratios/Supplemental Data: | | | | | | | |
| Net assets, end of period (000) | | | $5,270 | | | | | | | | $1,628 | |
| Average net assets (000) | | | $4,485 | | | | | | | | $656 | |
| Ratios to average net assets(d): | | | | | | | | | | | | |
| Expenses after waivers and/or expense reimbursement | | | 1.00% | | | | | | | | 1.00% | (e) |
| Expenses before waivers and/or expense reimbursement | | | 1.15% | | | | | | | | 5.77% | (e) |
| Net investment income (loss) | | | 0.05% | | | | | | | | 0.70% | (e) |
| Portfolio turnover rate(f) | | | 125% | | | | | | | | 185% | |
| (a) | Commencement of offering. |
| (b) | Calculated based on average shares outstanding during the period. |
| (c) | Total return is calculated assuming a purchase of a share on the first day and a sale on the last day of each period reported and includes reinvestment of dividends and distributions, if any. Total returns may reflect adjustments to conform to generally accepted accounting principles. Total returns for periods less than one full year are not annualized. |
| (d) | Does not include expenses of the underlying funds in which the Fund invests. |
| (f) | The Fund’s portfolio turnover rate is calculated in accordance with regulatory requirements, without regard to transactions involving short-term investments and certain derivatives. If such transactions were included, the Fund’s portfolio turnover rate may be higher. |
See Notes to Financial Statements.
| | | | |
| PGIM Jennison Diversified Growth Fund | | | 43 | |
Financial Highlights(continued)
| | | | | | | | | | | | |
| Class R6 Shares | | | | | | | | | |
| | | Year Ended July 31, 2019 | | | | | | September 27,
2017(a) through July 31, 2018 | |
| Per Share Operating Performance(b): | | | | | | | | | | | | |
| Net Asset Value, Beginning of Period | | | $13.81 | | | | | | | | $12.82 | |
| Income (loss) from investment operations: | | | | | | | | | | | | |
| Net investment income (loss) | | | (0.01 | ) | | | | | | | 0.04 | |
| Net realized and unrealized gain (loss) on investment and foreign currency transactions | | | 0.82 | | | | | | | | 2.33 | |
| Total from investment operations | | | 0.81 | | | | | | | | 2.37 | |
| Less Dividends and Distributions: | | | | | | | | | | | | |
| Dividends from net investment income | | | (0.04 | ) | | | | | | | (0.02 | ) |
| Distributions from net realized gains | | | (1.17 | ) | | | | | | | (1.36 | ) |
| Total dividends and distributions | | | (1.21 | ) | | | | | | | (1.38 | ) |
| Net asset value, end of period | | | $13.41 | | | | | | | | $13.81 | |
| Total Return(c): | | | 7.20% | | | | | | | | 19.79% | |
| |
| Ratios/Supplemental Data: | | | | | | | | | |
| Net assets, end of period (000) | | | $54 | | | | | | | | $12 | |
| Average net assets (000) | | | $17 | | | | | | | | $11 | |
| Ratios to average net assets(d): | | | | | | | | | | | | |
| Expenses after waivers and/or expense reimbursement | | | 1.00% | | | | | | | | 1.00% | (e) |
| Expenses before waivers and/or expense reimbursement | | | 77.09% | | | | | | | | 283.30% | (e) |
| Net investment income (loss) | | | (0.10)% | | | | | | | | 0.36% | (e) |
| Portfolio turnover rate(f) | | | 125% | | | | | | | | 185% | |
| (a) | Commencement of offering. |
| (b) | Calculated based on average shares outstanding during the period. |
| (c) | Total return is calculated assuming a purchase of a share on the first day and a sale on the last day of each period reported and includes reinvestment of dividends and distributions, if any. Total returns may reflect adjustments to conform to generally accepted accounting principles. Total returns for periods less than one full year are not annualized. |
| (d) | Does not include expenses of the underlying funds in which the Fund invests. |
| (f) | The Fund’s portfolio turnover rate is calculated in accordance with regulatory requirements, without regard to transactions involving short-term investments and certain derivatives. If such transactions were included, the Fund’s portfolio turnover rate may be higher. |
See Notes to Financial Statements.
Report of Independent Registered Public Accounting Firm
To the Shareholders of PGIM Jennison Diversified Growth Fund and Board of Trustees
Prudential Investment Portfolios 5:
Opinion on the Financial Statements
We have audited the accompanying statement of assets and liabilities of PGIM Jennison Diversified Growth Fund, a series of Prudential Investment Portfolios 5, (the Fund), including the schedule of investments, as of July 31, 2019, the related statement of operations for the year then ended, the statements of changes in net assets for each of the years in the two-year period then ended, and the related notes (collectively, the financial statements) and the financial highlights for each of the years or period indicated therein. In our opinion, the financial statements and financial highlights present fairly, in all material respects, the financial position of the Fund as of July 31, 2019, the results of its operations for the year then ended, the changes in its net assets for each of the years in the two-year period then ended, and the financial highlights for each of the years or period indicated therein, in conformity with U.S. generally accepted accounting principles.
Basis for Opinion
These financial statements and financial highlights are the responsibility of the Fund’s management. Our responsibility is to express an opinion on these financial statements and financial highlights based on our audits. We are a public accounting firm registered with the Public Company Accounting Oversight Board (United States) (PCAOB) and are required to be independent with respect to the Fund in accordance with the U.S. federal securities laws and the applicable rules and regulations of the Securities and Exchange Commission and the PCAOB.
We conducted our audits in accordance with the standards of the PCAOB. Those standards require that we plan and perform the audit to obtain reasonable assurance about whether the financial statements and financial highlights are free of material misstatement, whether due to error or fraud. Our audits included performing procedures to assess the risks of material misstatement of the financial statements and financial highlights, whether due to error or fraud, and performing procedures that respond to those risks. Such procedures included examining, on a test basis, evidence regarding the amounts and disclosures in the financial statements and financial highlights. Such procedures also included confirmation of securities owned as of July 31, 2019, by correspondence with the custodian, transfer agent, and brokers, or by other appropriate auditing procedures when replies were not received. Our audits also included evaluating the accounting principles used and significant estimates made by management, as well as evaluating the overall presentation of the financial statements and financial highlights. We believe that our audits provide a reasonable basis for our opinion.

We have served as the auditor of one or more PGIM and/or Prudential Retail investment companies since 2003.
New York, New York
September 19, 2019
| | | | |
| PGIM Jennison Diversified Growth Fund | | | 45 | |
Tax Information(unaudited)
We are advising you that during the fiscal year ended July 31, 2019, the Fund reported the maximum amount allowed per share but not less than $0.73 per share for Class A, B, C, Z and R6 shares as a capital gain distribution in accordance with Section 852(b)(3)(C) of the Internal Revenue Code.
For the year ended July 31, 2019, the Fund reports, in accordance with Section 854 of the Internal Revenue Code, the following percentages of the ordinary income dividends paid as 1) qualified dividend income (QDI); and 2) eligible for corporate dividends received deduction (DRD):
| | | | | | | | |
| | | QDI | | | DRD | |
PGIM Jennison Diversified Growth Fund | | | 29.68 | % | | | 26.85 | % |
In January 2020, you will be advised on IRS Form1099-DIV or substitute1099-DIV, as to the federal tax status of dividends and distributions received by you in calendar year 2019.
INFORMATION ABOUT BOARD MEMBERS AND OFFICERS(unaudited)
Information about Board Members and Officers of the Fund is set forth below. Board Members who are not deemed to be “interested persons” of the Fund, as defined in the 1940 Act, are referred to as “Independent Board Members.” Board Members who are deemed to be “interested persons” of the Fund are referred to as “Interested Board Members.” The Board Members are responsible for the overall supervision of the operations of the Fund and perform the various duties imposed on the directors of investment companies by the 1940 Act. The Board in turn elects the Officers, who are responsible for administering theday-to-day operations of the Fund.
| | | | | | |
| Independent Board Members | | | | |
| | | | |
Name Date of Birth Position(s) Portfolios Overseen | | Principal Occupation(s) During Past Five Years | | Other Directorships
Held During Past Five Years | | Length of
Board Service |
| | | | |
Ellen S. Alberding 3/11/58 Board Member Portfolios Overseen: 96 | | President and Board Member, The Joyce Foundation (charitable foundation) (since 2002); Vice Chair, City Colleges of Chicago (community college system)(2011-2015); Trustee, National Park Foundation (charitable foundation for national park system) (2009-2018); Trustee, Economic Club of Chicago (since 2009); Trustee, Loyola University (since 2018). | | None. | | Since September 2013 |
| | | | |
Kevin J. Bannon 7/13/52 Board Member Portfolios Overseen: 96 | | Retired; Managing Director (April 2008-May 2015) and Chief Investment Officer (October 2008-November 2013) of Highmount Capital LLC (registered investment adviser); formerly Executive Vice President and Chief Investment Officer (April 1993-August 2007) of Bank of New York Company; President(May 2003-May 2007) of BNY Hamilton Family of Mutual Funds. | | Director of Urstadt Biddle Properties (equity real estate investment trust) (since September 2008). | | Since July 2008 |
PGIM Jennison Diversified Growth Fund
| | | | | | |
| Independent Board Members | | | | |
| | | | |
Name Date of Birth Position(s) Portfolios Overseen | | Principal Occupation(s) During Past Five Years | | Other Directorships
Held During Past Five Years | | Length of Board Service |
| | | | |
Linda W. Bynoe 7/9/52 Board Member Portfolios Overseen: 96 | | President and Chief Executive Officer (since March 1995) and formerly Chief Operating Officer (December 1989-February 1995) of Telemat Ltd. (management consulting); formerly Vice President (January 1985-June 1989) at Morgan Stanley & Co. (broker-dealer). | | Director of Anixter International, Inc. (communication products distributor) (since January 2006); Director of Northern Trust Corporation (financial services) (since April 2006); Trustee of Equity Residential (residential real estate) (since December 2009). | | Since March 2005 |
| | | | |
Barry H. Evans 11/2/60 Board Member Portfolios Overseen: 95 | | Retired; formerly President (2005 – 2016), Global Chief Operating Officer (2014–2016), Chief Investment Officer – Global Head of Fixed Income (1998-2014), and various portfolio manager roles (1986-2006), Manulife Asset Management U.S. | | Formerly Director, Manulife Trust Company (2011-2018); formerly Director, Manulife Asset Management Limited (2015-2017); formerly Chairman of the Board of Directors of Manulife Asset Management U.S. (2005-2016); formerly Chairman of the Board, Declaration Investment Management and Research (2008-2016). | | Since September 2017 |
| | | | |
Keith F. Hartstein 10/13/56 Board Member & Independent Chair Portfolios Overseen: 96 | | Retired; Member (since November 2014) of the Governing Council of the Independent Directors Council (organization of independent mutual fund directors); formerly President and Chief Executive Officer (2005-2012), Senior Vice President (2004-2005), Senior Vice President of Sales and Marketing (1997-2004), and various executive management positions (1990-1997), John Hancock Funds, LLC (asset management); Chairman, Investment Company Institute’s Sales Force Marketing Committee (2003-2008). | | None. | | Since September 2013 |
Visit our website at pgiminvestments.com
| | | | | | |
| Independent Board Members | | | | |
| | | | |
Name Date of Birth Position(s) Portfolios Overseen | | Principal Occupation(s) During Past Five Years | | Other Directorships
Held During Past Five Years | | Length of Board Service |
| | | | |
Laurie Simon Hodrick 9/29/62 Board Member Portfolios Overseen: 95 | | A. Barton Hepburn Professor Emerita of Economics in the Faculty of Business, Columbia Business School (since 2018); Visiting Professor of Law, Stanford Law School (since 2015); Visiting Fellow at the Hoover Institution, Stanford University (since 2015); Sole Member, ReidCourt LLC (since 2008) (a consulting firm); formerly A. Barton Hepburn Professor of Economics in the Faculty of Business, Columbia Business School (1996-2017); formerly Managing Director, Global Head of Alternative Investment Strategies, Deutsche Bank (2006-2008). | | Independent Director, Synnex Corporation (since April 2019) (information technology); Independent Director, Kabbage, Inc. (since July 2018) (financial services); Independent Director, Corporate Capital Trust (2017-2018) (a business development company). | | Since September 2017 |
| | | | |
Michael S. Hyland, CFA 10/4/45 Board Member Portfolios Overseen: 96 | | Retired (since February 2005); formerly Senior Managing Director (July 2001-February 2005) of Bear Stearns & Co, Inc.; Global Partner, INVESCO (1999-2001); Managing Director and President of Salomon Brothers Asset Management (1989-1999). | | None. | | Since July 2008 |
| | | | |
Brian K. Reid 9/22/61 Board Member Portfolios Overseen: 95 | | Retired; formerly Chief Economist for the Investment Company Institute (ICI) (2005-2017); formerly Senior Economist and Director of Industry and Financial Analysis at the ICI (1998-2004); formerly Senior Economist, Industry and Financial Analysis at the ICI (1996-1998); formerly Staff Economist at the Federal Reserve Board (1989-1996); Director, ICI Mutual Insurance Company (2012-2017). | | None. | | Since March 2018 |
PGIM Jennison Diversified Growth Fund
| | | | | | |
Independent Board Members | | | | |
| | | | |
Name Date of Birth Position(s) Portfolios Overseen | | Principal Occupation(s) During Past Five Years | | Other Directorships
Held During Past Five Years | | Length of Board Service |
| | | | |
Grace C. Torres 6/28/59 Board Member Portfolios Overseen: 95 | | Retired; formerly Treasurer and Principal Financial and Accounting Officer of the PGIM Funds, Target Funds, Advanced Series Trust, Prudential Variable Contract Accounts and The Prudential Series Fund (1998-June 2014); Assistant Treasurer (March 1999-June 2014) and Senior Vice President (September 1999-June 2014) of PGIM Investments LLC; Assistant Treasurer (May 2003-June 2014) and Vice President (June 2005-June 2014) of AST Investment Services, Inc.; Senior Vice President and Assistant Treasurer (May 2003-June 2014) of Prudential Annuities Advisory Services, Inc. | | Formerly Director (July 2015-January 2018) of Sun Bancorp, Inc. N.A. and Sun National Bank; Director (since January 2018) of OceanFirst Financial Corp. and OceanFirst Bank. | | Since November 2014 |
| | | | | | |
Interested Board Members | | | | |
| | | | |
Name Date of Birth Position(s) Portfolios Overseen | | Principal Occupation(s) During Past Five Years | | Other Directorships
Held During Past Five Years | | Length of Board Service |
| | | | |
Stuart S. Parker 10/5/62 Board Member & President Portfolios Overseen: 96 | | President of PGIM Investments LLC (formerly known as Prudential Investments LLC) (since January 2012); Executive Vice President of Prudential Investment Management Services LLC (since December 2012); formerly Executive Vice President of Jennison Associates LLC and Head of Retail Distribution of PGIM Investments LLC (June 2005-December 2011). | | None. | | Since January 2012 |
Visit our website at pgiminvestments.com
| | | | | | |
Interested Board Members | | | | |
| | | | |
Name Date of Birth Position(s) Portfolios Overseen | | Principal Occupation(s) During Past Five Years | | Other Directorships
Held During Past Five Years | | Length of Board Service |
| | | | |
Scott E. Benjamin 5/21/73 Board Member & Vice President Portfolios Overseen: 96 | | Executive Vice President (since June 2009) of PGIM Investments LLC; Executive Vice President (June 2009-June 2012) and Vice President (since June 2012) of Prudential Investment Management Services LLC; Executive Vice President (since September 2009) of AST Investment Services, Inc.; Senior Vice President of Product Development and Marketing, PGIM Investments (since February 2006); formerly Vice President of Product Development and Product Management, PGIM Investments LLC (2003-2006). | | None. | | Since March 2010 |
| | | | |
| Fund Officers(a) | | | | |
| | | |
Name Date of Birth Fund Position | | Principal Occupation(s) During Past Five Years | | Length of Service as Fund Officer |
| | | |
Raymond A. O’Hara 9/11/55 Chief Legal Officer | | Vice President and Corporate Counsel (since July 2010) of Prudential Insurance Company of America (Prudential); Vice President (March 2011-Present) of Pruco Life Insurance Company and Pruco Life Insurance Company of New Jersey; Vice President and Corporate Counsel (March 2011-Present) of Prudential Annuities Life Assurance Corporation; Chief Legal Officer of PGIM Investments LLC (since June 2012); Chief Legal Officer of Prudential Mutual Fund Services LLC (since June 2012) and Corporate Counsel of AST Investment Services, Inc. (since June 2012); formerly Assistant Vice President and Corporate Counsel (September 2008-July 2010) of The Hartford Financial Services Group, Inc.; formerly Associate (September 1980-December 1987) and Partner (January 1988–August 2008) of Blazzard & Hasenauer, P.C. (formerly, Blazzard, Grodd & Hasenauer, P.C.). | | Since June 2012 |
PGIM Jennison Diversified Growth Fund
| | | | |
| Fund Officers(a) | | | | |
| | | |
Name Date of Birth Fund Position | | Principal Occupation(s) During Past Five Years | | Length of Service as Fund Officer |
| | | |
Dino Capasso 8/19/74 Chief Compliance Officer | | Chief Compliance Officer (July 2019-Present) of PGIM Investments LLC; Chief Compliance Officer (July 2019-Present) of the PGIM Funds, Target Funds, Advanced Series Trust, The Prudential Series Fund, Prudential’s Gibraltar Fund, Inc., PGIM Global High Yield Fund, Inc., and PGIM High Yield Bond Fund, Inc.; Vice President and Deputy Chief Compliance Officer (June 2017-2019) of PGIM Investments LLC; formerly, Senior Vice President and Senior Counsel (January 2016-June 2017), and Vice President and Counsel (February 2012-December 2015) of Pacific Investment Management Company LLC. | | Since March 2018 |
| | | |
Andrew R. French 12/22/62 Secretary | | Vice President of PGIM Investments LLC (December 2018-Present); formerly Vice President and Corporate Counsel (February 2010-December 2018) of Prudential; formerly Director and Corporate Counsel (2006-2010) of Prudential; Vice President and Assistant Secretary (since January 2007) of PGIM Investments LLC; Vice President and Assistant Secretary (since January 2007) of Prudential Mutual Fund Services LLC. | | Since October 2006 |
| | | |
Jonathan D. Shain 8/9/58 Assistant Secretary | | Vice President and Corporate Counsel (since August 1998) of Prudential; Vice President and Assistant Secretary (since May 2001) of PGIM Investments LLC; Vice President and Assistant Secretary (since February 2001) of Prudential Mutual Fund Services LLC; formerly Vice President and Assistant Secretary (May 2003-June 2005) of AST Investment Services, Inc. | | Since May 2005 |
| | | |
Claudia DiGiacomo 10/14/74 Assistant Secretary | | Vice President and Corporate Counsel (since January 2005) of Prudential; Vice President and Assistant Secretary of PGIM Investments LLC (since December 2005); formerly Associate at Sidley Austin Brown & Wood LLP (1999-2004). | | Since December 2005 |
| | | |
Diana N. Huffman 4/14/82 Assistant Secretary | | Vice President and Corporate Counsel (since September 2015) of Prudential; formerly Associate at Willkie Farr & Gallagher LLP (2009-2015). | | Since March 2019 |
| | | |
Christian J. Kelly 5/5/75 Treasurer and Principal Financial and Accounting Officer | | Vice President, Head of Fund Administration of PGIM Investments LLC (since November 2018); formerly, Director of Fund Administration of Lord Abbett & Co. LLC (2009-2018), Treasurer and Principal Accounting Officer of the Lord Abbett Family of Funds (2017-2018); Director of Accounting, Avenue Capital Group (2008-2009); Senior Manager, Investment Management Practice of Deloitte & Touche LLP (1998-2007). | | Since January 2019 |
| | | |
Peter Parrella 8/21/58 Assistant Treasurer | | Vice President (since 2007) and Director (2004-2007) within PGIM Investments Fund Administration; formerly Tax Manager at SSB Citi Fund Management LLC (1997-2004). | | Since June 2007 |
| | |
| Visit our website at pgiminvestments.com | | |
| | | | |
| Fund Officers(a) | | | | |
| | | |
Name Date of Birth Fund Position | | Principal Occupation(s) During Past Five Years | | Length of Service as Fund Officer |
| | | |
Lana Lomuti 6/7/67 Assistant Treasurer | | Vice President (since 2007) and Director (2005-2007), within PGIM Investments Fund Administration; formerly Assistant Treasurer (December 2007-February 2014) of The Greater China Fund, Inc. | | Since April 2014 |
| | | |
Linda McMullin 7/10/61 Assistant Treasurer | | Vice President (since 2011) and Director (2008-2011) within PGIM Investments Fund Administration. | | Since April 2014 |
| | | |
Kelly A. Coyne 8/8/68 Assistant Treasurer | | Director, Investment Operations of Prudential Mutual Fund Services LLC (since 2010). | | Since March 2015 |
| | | |
Charles H. Smith 1/11/73 Anti-Money Laundering Compliance Officer | | Vice President, Corporate Compliance, Anti-Money Laundering Unit (since January 2015) of Prudential; committee member of the American Council of Life Insurers Anti-Money Laundering and Critical Infrastructure Committee (since January 2016); formerly Global Head of Economic Sanctions Compliance at AIG Property Casualty (February 2007-December 2014); Assistant Attorney General at the New York State Attorney General’s Office, Division of Public Advocacy. (August 1998-January 2007). | | Since January 2017 |
(a)Excludes Mr. Parker and Mr. Benjamin, interested Board Members who also serve as President and Vice President, respectively.
Explanatory Notes to Tables:
| ∎ | | Board Members are deemed to be “Interested,” as defined in the 1940 Act, by reason of their affiliation with PGIM Investments LLC and/or an affiliate of PGIM Investments LLC. |
| ∎ | | Unless otherwise noted, the address of all Board Members and Officers is c/o PGIM Investments LLC, 655 Broad Street, Newark, New Jersey 07102-4410. |
| ∎ | | There is no set term of office for Board Members or Officers. The Board Members have adopted a retirement policy, which calls for the retirement of Board Members on December 31 of the year in which they reach the age of 75. |
| ∎ | | “Other Directorships Held” includes only directorships of companies required to register or file reports with the SEC under the 1934 Act (that is, “public companies”) or other investment companies registered under the 1940 Act. |
| ∎ | | “Portfolios Overseen” includes all investment companies managed by PGIM Investments LLC. The investment companies for which PGIM Investments LLC serves as manager include the PGIM Funds, The Prudential Variable Contract Accounts, PGIM ETF Trust, PGIM High Yield Bond Fund, Inc., PGIM Global High Yield Fund, Inc., The Prudential Series Fund, Prudential’s Gibraltar Fund, Inc. and the Advanced Series Trust. |
PGIM Jennison Diversified Growth Fund
Approval of Advisory Agreements
The Fund’s Board of Trustees
The Board of Trustees (the “Board”) of PGIM Jennison Diversified Growth Fund (the “Fund”)1 consists of eleven individuals, nine2 of whom are not “interested persons” of the Fund, as defined in the Investment Company Act of 1940, as amended (the “1940 Act”) (the “Independent Trustees”). The Board is responsible for the oversight of the Fund and its operations, and performs the various duties imposed on the directors of investment companies by the 1940 Act. The Independent Trustees have retained independent legal counsel to assist them in connection with their duties. The Chair of the Board is an Independent Trustee. The Board has established four standing committees: the Audit Committee, the Nominating and Governance Committee, and two Investment Committees. Each committee is chaired by, and composed of, Independent Trustees.
Annual Approval of the Fund’s Advisory Agreements
As required under the 1940 Act, the Board determines annually whether to renew the Fund’s management agreement with PGIM Investments LLC (“PGIM Investments”) and the Fund’s subadvisory agreement with Jennison Associates LLC (“Jennison”). In considering the renewal of the agreements, the Board, including all of the Independent Trustees, met on May 30, 2019 and on June11-13, 2019 and approved the renewal of the agreements through July 31, 2020, after concluding that the renewal of the agreements was in the best interests of the Fund and its shareholders.
In advance of the meetings, the Board requested and received materials relating to the agreements, and had the opportunity to ask questions and request further information in connection with its consideration. Among other things, the Board considered comparative fee information from PGIM Investments and Jennison. Also, the Board considered comparisons with other mutual funds in relevant Peer Universes and Peer Groups, as is further discussed below.
In approving the agreements, the Board, including the Independent Trustees advised by independent legal counsel, considered the factors it deemed relevant, including the nature, quality and extent of services provided by PGIM Investments and the subadviser, the performance of the Fund, the profitability of PGIM Investments and its affiliates, expenses and fees, and the potential for economies of scale that may be shared with the Fund and its shareholders as the Fund’s assets grow. In their deliberations, the Trustees did not identify any single factor which alone was responsible for the Board’s decision to approve the agreements with respect to the Fund. In connection with its deliberations, the Board considered information provided by PGIM Investments throughout the year at regular Board
| 1 | PGIM Jennison Diversified Growth Fund is a series of Prudential Investment Portfolios 5. |
| 2 | Grace C. Torres was an Interested Trustee of the Fund at the time the Board considered and approved the renewal of the Fund’s advisory agreements, but has since become an Independent Trustee of the Fund. |
| | |
| PGIM Jennison Diversified Growth Fund |
Approval of Advisory Agreements(continued)
meetings, presentations from portfolio managers and other information, as well as information furnished at or in advance of the meetings on May 30, 2019 and onJune 11-13 , 2019.
The Trustees determined that the overall arrangements between the Fund and PGIM Investments, which serves as the Fund’s investment manager pursuant to a management agreement, and between PGIM Investments and Jennison, which serves as the Fund’s subadviser pursuant to the terms of a subadvisory agreement with PGIM Investments, are in the best interests of the Fund and its shareholders in light of the services performed, fees charged and such other matters as the Trustees considered relevant in the exercise of their business judgment.
The material factors and conclusions that formed the basis for the Trustees’ determinations to approve the renewal of the agreements are discussed separately below.
Nature, Quality and Extent of Services
The Board received and considered information regarding the nature, quality and extent of services provided to the Fund by PGIM Investments and Jennison. The Board noted that Jennison is affiliated with PGIM Investments. The Board considered the services provided by PGIM Investments, including but not limited to the oversight of the subadviser for the Fund, as well as the provision of fund recordkeeping, compliance and other services to the Fund, and PGIM Investments’ role as administrator for the Fund’s liquidity risk management program. With respect to PGIM Investments’ oversight of the subadviser, the Board noted that PGIM Investments’ Strategic Investment Research Group (“SIRG”), a business unit of PGIM Investments, is responsible for monitoring and reporting to PGIM Investments’ senior management on the performance and operations of the subadviser. The Board also considered that PGIM Investments pays the salaries of all of the officers and interested Trustees of the Fund who are part of Fund management. The Board also considered the investment subadvisory services provided by Jennison, including investment research and security selection, as well as compliance with the Fund’s investment restrictions, policies and procedures. The Board considered PGIM Investments’ evaluation of Jennison as well as PGIM Investments’ recommendation, based on its review of Jennison, to renew the subadvisory agreement.
The Board considered the qualifications, backgrounds and responsibilities of PGIM Investments’ senior management responsible for the oversight of the Fund and Jennison, and also considered the qualifications, backgrounds and responsibilities of Jennison’s portfolio managers who are responsible for theday-to-day management of the Fund’s portfolio. The Board was provided with information pertaining to PGIM Investments’ and Jennison’s organizational structure, senior management, investment operations, and other relevant information pertaining to both PGIM Investments and Jennison. The Board also noted that it received favorable compliance reports from the Fund’s Chief Compliance Officer (“CCO”) as to both PGIM Investments and Jennison.
| | |
| Visit our website at pgiminvestments.com | | |
The Board concluded that it was satisfied with the nature, extent and quality of the investment management services provided by PGIM Investments and the subadvisory services provided to the Fund by Jennison, and that there was a reasonable basis on which to conclude that the Fund benefits from the services provided by PGIM Investments and Jennison under the management and subadvisory agreements.
Costs of Services and Profits Realized by PGIM Investments
The Board was provided with information on the profitability of PGIM Investments and its affiliates in serving as the Fund’s investment manager. The Board discussed with PGIM Investments the methodology utilized in assembling the information regarding profitability and considered its reasonableness. The Board recognized that it is difficult to make comparisons of profitability from fund management contracts because comparative information is not generally publicly available and is affected by numerous factors, including the structure of the particular adviser, the types of funds it manages, its business mix, numerous assumptions regarding allocations and the adviser’s capital structure and cost of capital. However, the Board considered that the cost of services provided by PGIM Investments for the year ended December 31, 2018 exceeded the management fees received by PGIM Investments, resulting in an operating loss to PGIM Investments. Taking these factors into account, the Board concluded that the profitability of PGIM Investments and its affiliates in relation to the services rendered was not unreasonable.
Economies of Scale
The Board received and discussed information concerning economies of scale that PGIM Investments may realize as the Fund’s assets grow beyond current levels. The Board noted that the management fee schedule for the Fund includes breakpoints, which have the effect of decreasing the fee rate as assets increase. During the course of time, the Board has considered information regarding the launch date of the Fund, the management fees of the Fund compared to those of similarly managed funds and PGIM Investments’ investment in the Fund over time. The Board noted that economies of scale can be shared with the Fund in other ways, including low management fees from inception, additional technological and personnel investments to enhance shareholder services, and maintaining existing expense structures in the face of a rising cost environment. The Board also considered PGIM Investments’ assertion that it continually evaluates the management fee schedule of the Fund and the potential to share economies of scale through breakpoints or fee waivers as asset levels increase.
The Board recognized the inherent limitations of any analysis of economies of scale, stemming largely from the Board’s understanding that most of PGIM Investments’ costs are not specific to individual funds, but rather are incurred across a variety of products and services.
| | |
| PGIM Jennison Diversified Growth Fund |
Approval of Advisory Agreements(continued)
Other Benefits to PGIM Investments and Jennison
The Board considered potential ancillary benefits that might be received by PGIM Investments and Jennison and their affiliates as a result of their relationship with the Fund. The Board concluded that potential benefits to be derived by PGIM Investments included transfer agency fees received by the Fund’s transfer agent (which is affiliated with PGIM Investments), as well as benefits to its reputation or other intangible benefits resulting from PGIM Investments’ association with the Fund. The Board concluded that the potential benefits to be derived by Jennison included its ability to use soft dollar credits, as well as the potential benefits consistent with those generally resulting from an increase in assets under management, specifically, potential access to additional research resources and benefits to its reputation. The Board concluded that the benefits derived by PGIM Investments and Jennison were consistent with the types of benefits generally derived by investment managers and subadvisers to mutual funds.
Performance of the Fund / Fees and Expenses
The Board considered certain additional factors and made related conclusions relating to the historical performance of the Fund for theone-, three-, five- andten-year periods ended December 31, 2018.
The Board also considered the Fund’s actual management fee, as well as the Fund’s net total expense ratio, for the fiscal year ended July 31, 2018. The Board considered the management fee for the Fund as compared to the management fee charged by PGIM Investments to other funds and the fee charged by other advisers to comparable mutual funds in a Peer Group. The actual management fee represents the fee rate actually paid by Fund shareholders and includes any fee waivers or reimbursements. The net total expense ratio for the Fund represents the actual expense ratio incurred by Fund shareholders.
The mutual funds included in the Peer Universe, which was used to consider performance, and the Peer Group, which was used to consider fees and expenses, were objectively determined by Broadridge, an independent provider of mutual fund data. In certain circumstances, PGIM Investments also provided supplemental Peer Universe or Peer Group information, for reasons addressed with the Board. The comparisons placed the Fund in various quartiles over various periods, with the first quartile being the best 25% of the mutual funds (for performance, the best performing mutual funds and, for expenses, the lowest cost mutual funds).
The section below summarizes key factors considered by the Board and the Board’s conclusions regarding the Fund’s performance, fees and overall expenses. The table sets forth net performance comparisons (which reflect the impact on performance of fund
| | |
| Visit our website at pgiminvestments.com | | |
expenses, or any subsidies, expense caps or waivers that may be applicable) with the Peer Universe, actual management fees with the Peer Group (which reflect the impact of any subsidies or fee waivers), and net total expenses with the Peer Group, each of which were key factors considered by the Board.
| | | | | | | | |
| Net Performance | | 1 Year | | 3 Years | | 5 Years | | 10 Years |
| | | 3rd Quartile | | 3rd Quartile | | 3rd Quartile | | 4th Quartile |
| Actual Management Fees:1st Quartile |
| Net Total Expenses: 4th Quartile |
| | • | | The Board noted that the Fund outperformed its benchmark index over theone-year period, although it underperformed over the other periods. |
| | • | | The Board considered PGIM Investments’ assertion that the Fund’s underperformance against its Peer Universe was reflective of the Fund’s greater exposure to stocks with strong earnings growth, which were not favored in the market during the second half of 2018. |
| | • | | The Board also considered that during 2017, the Fund changed its optimization process to the Russell 1000 Growth Index and that previously, the Fund was optimized to the S&P 500 Index, which led to periods of underperformance during periods when growth investing was favored. The Board further considered that the Fund outperformed its benchmark and performed in the second quartile (41st percentile) of its Peer Universe during the fourth quarter of 2018. |
| | • | | The Board noted information provided by PGIM Investments indicating that the Fund’s net total expense ratio was within eight basis points of the median of all funds in the Peer Group. |
| | • | | The Board and PGIM Investments agreed to retain the existing contractual expense cap, which (exclusive of certain fees and expenses) caps the Fund’s annual operating expenses at 2.26% for Class B shares, 1.00% for Class R6 shares, and 1.00% for Class Z shares through November 30, 2019. |
| | • | | In addition, PGIM Investments will waive management fees or shared operating expenses on any share class to the same extent that it waives such expenses on any other share class, and has agreed that total annual fund operating expenses for Class R6 shares will not exceed total annual fund operating expenses for Class Z shares. |
| | • | | The Board concluded that, in light of the above, it would be in the best interests of the Fund and its shareholders to allow the Fund’s investment team time to develop a longer performance record under the new optimization process and to renew the agreements. |
| | • | | The Board concluded that the management fees (including subadvisory fees) and total expenses were reasonable in light of the services provided. |
* * *
After full consideration of these factors, the Board concluded that approval of the agreements was in the best interests of the Fund and its shareholders.
| | |
| PGIM Jennison Diversified Growth Fund |
| | | | |
| | |
| ∎ MAIL | | ∎ TELEPHONE | | ∎ WEBSITE |
655 Broad Street Newark, NJ 07102 | | (800) 225-1852 | | pgiminvestments.com |
|
| PROXY VOTING |
| The Board of Trustees of the Fund has delegated to the Fund’s subadviser the responsibility for voting any proxies and maintaining proxy recordkeeping with respect to the Fund. A description of these proxy voting policies and procedures is available without charge, upon request, by calling (800) 225-1852. Information regarding how the Fund voted proxies relating to portfolio securities during the most recent 12-month period ended June 30 is available on the Fund’s website and on the Commission’s website atsec.gov. |
|
| TRUSTEES |
| Ellen S. Alberding• Kevin J. Bannon• Scott E. Benjamin• Linda W. Bynoe• Barry H. Evans• Keith F. Hartstein • Laurie Simon Hodrick• Michael S. Hyland• Stuart S. Parker• Brian K. Reid • Grace C. Torres |
|
| OFFICERS |
| Stuart S. Parker,President• Scott E. Benjamin,Vice President• Christian J. Kelly,Treasurer and Principal Financial and Accounting Officer• Raymond A. O’Hara,Chief Legal Officer• Dino Capasso,Chief Compliance Officer• Andrew R. French,Secretary• Jonathan D. Shain,Assistant Secretary• Claudia DiGiacomo,Assistant Secretary• Diana N. Huffman,Assistant Secretary•Peter Parrella,Assistant Treasurer• Lana Lomuti,Assistant Treasurer• Linda McMullin,Assistant Treasurer• Kelly Coyne,Assistant Treasurer• Charles H. Smith,Anti-Money Laundering Compliance Officer |
| | | | |
| MANAGER | | PGIM Investments LLC | | 655 Broad Street
Newark, NJ 07102 |
|
| SUBADVISER | | Jennison Associates LLC | | 466 Lexington Avenue
New York, NY 10017 |
|
| DISTRIBUTOR | | Prudential Investment
Management Services LLC | | 655 Broad Street
Newark, NJ 07102 |
|
| CUSTODIAN | | The Bank of New York Mellon | | 240 Greenwich Street New York, NY 10286 |
|
| TRANSFER AGENT | | Prudential Mutual Fund
Services LLC | | PO Box 9658 Providence, RI 02940 |
|
| INDEPENDENT REGISTERED PUBLIC ACCOUNTING FIRM | | KPMG LLP | | 345 Park Avenue
New York, NY 10154 |
|
| FUND COUNSEL | | Willkie Farr & Gallagher LLP | | 787 Seventh Avenue
New York, NY 10019 |
|
|
| An investor should consider the investment objectives, risks, charges, and expenses of the Fund carefully before investing. The prospectus and summary prospectus contain this and other information about the Fund. An investor may obtain a prospectus and summary prospectus by visiting our website atpgiminvestments.com or bycalling (800) 225-1852. The prospectus and summary prospectus should be read carefully before investing. |
|
| E-DELIVERY |
| To receive your mutual fund documents on-line, go topgiminvestments.com/edelivery and enroll. Instead of receiving printed documents by mail, you will receive notification via email when new materials are available. You can cancel your enrollment or change your email address at any time by visiting the website address above. |
|
| SHAREHOLDER COMMUNICATIONS WITH TRUSTEES |
| Shareholders can communicate directly with the Board of Trustees by writing to the Chair of the Board, PGIM Jennison Diversified Growth Fund, PGIM Investments, Attn: Board of Trustees, 655 Broad Street, Newark, NJ 07102. Shareholders can communicate directly with an individual Trustee by writing to the same address. Communications are not screened before being delivered to the addressee. |
|
| AVAILABILITY OF PORTFOLIO SCHEDULE |
| The Fund files its complete schedule of portfolio holdings with the Securities and Exchange Commission onForm N-PORT. The Fund’sForm N-PORT filings are available on the Commission’s website atsec.gov.Form N-PORT is filed with the Commission quarterly, and each Fund’s full portfolio holdings as of the first and third fiscal quarter-ends (as of the third month of the Fund’s fiscal quarter for reporting periods on or after September 30, 2019) will be made publicly available 60 days after the end of each quarter atsec.gov. |
|
| The Fund’s Statement of Additional Information contains additional information about the Fund’s Trustees and is available without charge, upon request, by calling (800) 225-1852. |
Mutual Funds:
| | | | |
| ARE NOT INSURED BY THE FDIC OR ANY FEDERAL GOVERNMENT AGENCY | | MAY LOSE VALUE | | ARE NOT A DEPOSIT OF OR GUARANTEED BY ANY BANK OR ANY BANK AFFILIATE |
PGIM JENNISON DIVERSIFIED GROWTH FUND
| | | | | | | | | | |
| SHARE CLASS | | A | | B | | C | | Z | | R6 |
| NASDAQ | | TBDAX | | TBDBX | | TBDCX | | TBDZX | | TBDQX |
| CUSIP | | 74440V104 | | 74440V203 | | 74440V302 | | 74440V690 | | 74440V716 |
MF503E

PGIM JENNISON RISING DIVIDEND FUND
ANNUAL REPORT
JULY 31, 2019
COMING SOON: PAPERLESS SHAREHOLDER REPORTS
Beginning on January 1, 2021, as permitted by regulations adopted by the Securities and Exchange Commission, paper copies of the Fund’s annual and semiannual shareholder reports will no longer be sent by mail, unless you specifically request paper copies of the reports. Instead, the reports will be made available on the Fund’s website (pgiminvestments.com), and you will be notified by mail each time a report is posted and provided with a website link to access the report.
If you already elected to receive shareholder reports electronically, you will not be affected by this change and you need not take any action. You may elect to receive shareholder reports and other communications from the Fund electronically anytime by contacting your financial intermediary (such as a broker-dealer or bank) or, if you are a direct investor, by calling 1-800-225-1852 or by sending an email request to PGIM Investments at shareholderreports@pgim.com.
You may elect to receive all future reports in paper free of charge. If you invest through a financial intermediary, you can contact your financial intermediary or follow instructions included with this notice to elect to continue to receive paper copies of your shareholder reports. If you invest directly with the Fund, you can call 1-800-225-1852 or send an email request to shareholderreports@pgim.com to let the Fund know you wish to continue receiving paper copies of your shareholder reports. Your election to receive reports in paper will apply to all funds held in your account if you invest through your financial intermediary or all funds held with the fund complex if you invest directly with the Fund.

To enroll in e-delivery, go to pgiminvestments.com/edelivery
|
| Objective:Capital appreciation and income |
Highlights
| • | | Stock selection within the aerospace & defense and semiconductor industries drove the majority of the Fund’s relative performance during the period. An underweight allocation to biotechnology firms also contributed. |
| • | | Top absolute contributors to performance included Universal Display Corp., Hershey, and Abbott Laboratories. |
| • | | Overweight allocations to regional banks and underweight positioning within household products and systems software firms detracted from the Fund’s relative performance during the period. |
| • | | Top absolute detractors to the Fund’s performance included Suncor Energy, Allergan, and Moelis & Co. |
This report is not authorized for distribution to prospective investors unless preceded or accompanied by a current prospectus.
The views expressed in this report and information about the Fund’s portfolio holdings are for the period covered by this report and are subject to change thereafter.
Mutual funds are distributed by Prudential Investment Management Services LLC, member SIPC. Jennison Associates LLC is a registered investment adviser. Both are Prudential Financial companies.© 2019 Prudential Financial, Inc. and its related entities. Jennison Associates, Jennison, PGIM, and the PGIM logo are service marks of Prudential Financial, Inc. and its related entities, registered in many jurisdictions worldwide.
| | |
| 2 | | Visit our website at pgiminvestments.com |
Table of Contents
| | | | |
| PGIM Jennison Rising Dividend Fund | | | 3 | |
This Page Intentionally Left Blank
Letter from the President

Dear Shareholder:
We hope you find the annual report for the PGIM Jennison Rising Dividend Fund informative and useful. The report covers performance for the 12-month period that ended July 31, 2019.
While the US economy remained healthy, with rising corporate profits and strong job growth, the Federal Reserve cut interest rates on the last day of the period for the first time since the Great Recession more than a decade ago. After nine rate increases in recent years, the cut was a proactive attempt by the Fed to extend the longest domestic economic expansion on record as growth in many other regions weakened. China in particular showed signs of slowing amid trade tensions with the US, and turmoil in the United Kingdom continued as it negotiated an exit from the European Union.
Despite the growing US economy, volatility returned to the equity markets during the period. After corporate tax cuts and regulatory reforms helped boost US stocks early in the period, equities declined significantly at the end of 2018 on concerns about China’s economy, a potential global trade war, higher interest rates, and worries that profit growth might slow. Stocks reversed course early in 2019, rising sharply after the Fed moderated its position on additional rate hikes for the remainder of the year. For the period overall, large-cap US equities rose while small-cap US stocks fell. Stocks also declined in developed foreign and emerging markets.
The overall US bond market posted strong returns during the period on a significant rally in interest rates that saw the 10-year US Treasury yield decline from around 3% to 2%. Investment grade corporate bonds led the way with a double-digit gain, while corporate high yield and municipal bonds each had a high single-digit return. Globally, bonds in developed markets delivered solid returns, while emerging markets debt also posted positive results. A continuing trend during the period was the inversion of a portion of the US Treasury yield curve, as the yield on certain shorter maturities exceeded the yield on the 10-year bond.
Regarding your investments with PGIM, we believe it is important to maintain a diversified portfolio of funds consistent with your tolerance for risk, time horizon, and financial goals. Your financial advisor can help you create a diversified investment plan that may include funds covering all the basic asset classes and that reflects your personal investor profile and risk tolerance. However, diversification and asset allocation strategies do not assure a profit or protect against loss in declining markets.
At PGIM Investments, we consider it a great privilege and responsibility to help investors participate in opportunities across global markets while meeting their toughest investment challenges. PGIM is a top-10 global investment manager with more than $1 trillion in assets under management. This scale and investment expertise allow us to deliver actively managed funds and strategies to meet the needs of investors around the globe.
Thank you for choosing our family of funds.
Sincerely,

Stuart S. Parker, President
PGIM Jennison Rising Dividend Fund
September 16, 2019
| | | | |
| PGIM Jennison Rising Dividend Fund | | | 5 | |
Your Fund’s Performance(unaudited)
Performance data quoted represent past performance. Past performance does not guarantee future results. The investment return and principal value of an investment will fluctuate, so that an investor’s shares, when redeemed, may be worth more or less than their original cost. Current performance may be lower or higher than the past performance data quoted. An investor may obtain performance data as of the most recent month-end by visiting our website atpgiminvestments.com or by calling (800) 225-1852.
| | | | | | |
| |
| | | Average Annual Total Returns as of 7/31/19
(with sales charges) |
| | | One Year (%) | | 5 Years (%) | | Since Inception (%) |
| Class A | | 2.31 | | 7.54 | | 7.67 (3/5/14) |
| Class C | | 6.42 | | 7.98 | | 8.01 (3/5/14) |
| Class Z | | 8.54 | | 9.05 | | 9.10 (3/5/14) |
| Class R6 | | 8.55 | | N/A | | 10.16 (9/27/17) |
| S&P 500 Index | | | | |
| | 7.98 | | 11.33 | | — |
| Lipper Equity Income Funds Average |
| | | 4.24 | | 7.62 | | — |
| | | | | | |
| |
| | | Average Annual Total Returns as of 7/31/19
(without sales charges) |
| | | One Year (%) | | 5 Years (%) | | Since Inception (%) |
| Class A | | 8.27 | | 8.77 | | 8.80 (3/5/14) |
| Class C | | 7.40 | | 7.98 | | 8.01 (3/5/14) |
| Class Z | | 8.54 | | 9.05 | | 9.10 (3/5/14) |
| Class R6 | | 8.55 | | N/A | | 10.16 (9/27/17) |
| S&P 500 Index | | 7.98 | | 11.33 | | — |
| Lipper Equity Income Funds Average | | 4.24 | | 7.62 | | — |
Source: PGIM Investments LLC and Lipper Inc.
Since Inception returns are provided for any share class with less than 10 fiscal years of returns. Since Inception returns for the Index and the Lipper Average are measured from the closest month-end to the class’ inception date.
| | |
| 6 | | Visit our website at pgiminvestments.com |
Growth of a $10,000 Investment
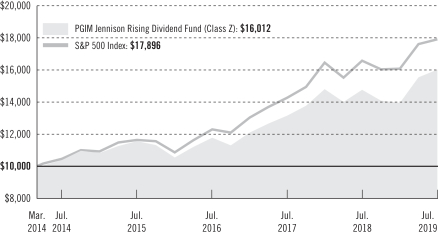
The graph compares a $10,000 investment in the Fund’s Class Z shares with a similar investment in the S&P 500 Index by portraying the initial account values at the commencement of operations of Class Z shares (March 5, 2014) and the account values at the end of the current fiscal year (July 31, 2019), as measured on a quarterly basis. For purposes of the graph, and unless otherwise indicated, it has been assumed that (a) all recurring fees (including management fees) were deducted; and (b) all dividends and distributions were reinvested. The line graph provides information for Class Z shares only. As indicated in the tables provided earlier, performance for Class A, Class C and Class R6 shares will vary due to the differing charges and expenses applicable to each share class (as indicated in the following paragraphs). Without waiver of fees and/or expense reimbursements, if any, the returns would have been lower.
Past performance does not predict future performance. Total returns and the ending account values in the graph include changes in share price and reinvestment of dividends and capital gains distributions in a hypothetical investment for the periods shown. The Fund’s total returns do not reflect the deduction of income taxes on an individual’s investment. Taxes may reduce your actual investment returns on income or gains paid by the Fund or any gains you may realize if you sell your shares.
| | | | |
| PGIM Jennison Rising Dividend Fund | | | 7 | |
Your Fund’s Performance(continued)
The returns in the tables do not reflect the deduction of taxes that a shareholder would pay on Fund distributions or following the redemption of Fund shares. The average annual total returns take into account applicable sales charges, which are described for each share class in the table below.
| | | | | | | | |
| | | | | |
| | | Class A | | Class C | | Class Z | | Class R6 |
| Maximum initial sales charge | | 5.50% of the public offering price | | None | | None | | None |
| Contingent deferred sales charge (CDSC) (as a percentage of the lower of original purchase price or net asset value at redemption) | | 1.00% on sales of $1 million or more made within 12 months of purchase | | 1.00% on sales made within 12 months of purchase | | None | | None |
| Annual distribution or distribution and service (12b-1) fees (shown as a percentage of average daily net assets) | | 0.30%
(0.25%
currently) | | 1.00% | | None | | None |
Benchmark Definitions
S&P 500 Index—The S&P 500 Index is an unmanaged index of over 500 stocks of large US public companies. It gives a broad look at how stock prices in the United States have performed. The average annual total return for the Index measured from the month-end closest to the inception date of the Fund’s Class A, Class C, and Class Z shares is 11.34% and 11.76% for Class R6 shares.
Lipper Equity Income Funds Average—The Lipper Equity Income Funds Average (Lipper Average) is based on the return of all mutual funds in the Lipper Equity Income Funds universe. Funds in the Lipper Average seek relatively high current income and growth of income through investing 65% or more of their portfolios in dividend-paying equity securities. The average annual total return for the Lipper Average measured from the month-end closest to the inception date of the Fund’s Class A, Class C, and Class Z shares is 7.83% and 7.05% for Class R6 shares.
Investors cannot invest directly in an index or average. The returns for the Index would be lower if they included the effects of sales charges, operating expenses of a mutual fund, or taxes that may be paid by an investor. Returns for the Lipper Average reflect the deduction of operating expenses, but not sales charges or taxes.
| | |
| 8 | | Visit our website at pgiminvestments.com |
Presentation of Fund Holdings
| | | | | | |
Ten Largest Holdings | | Line of Business | | % of Net Assets | |
| PepsiCo, Inc. | | Beverages | | | 2.9 | % |
| Abbott Laboratories | | Health Care Equipment & Supplies | | | 2.8 | % |
| SunTrust Banks, Inc. | | Banks | | | 2.6 | % |
| Hershey Co. (The) | | Food Products | | | 2.6 | % |
| Comcast Corp. (Class A Stock) | | Media | | | 2.5 | % |
| Northrop Grumman Corp. | | Aerospace & Defense | | | 2.5 | % |
| Sempra Energy | | Multi-Utilities | | | 2.5 | % |
| Thermo Fisher Scientific, Inc. | | Life Sciences Tools & Services | | | 2.5 | % |
| Honeywell International, Inc. | | Industrial Conglomerates | | | 2.4 | % |
| Airbus SE (France), ADR | | Aerospace & Defense | | | 2.4 | % |
For a complete list of holdings, please refer to the Schedule of Investments section of this report. Holdings reflect only long-term Investments. Holdings/Issues/Industries/Sectors are subject to change.
| | | | |
| PGIM Jennison Rising Dividend Fund | | | 9 | |
Strategy and Performance Overview
How did the Fund perform?
ThePGIM Jennison Rising Dividend Fund’s Class Z shares returned 8.54% in the12-month reporting period that ended July 31, 2019, outperforming the 7.98% return of the S&P 500 Index (the Index) and the 4.24% return of the Lipper Equity Income Funds Average.
Within the Index, 9 of the 11 sectors generated positive returns during the period, with four sectors producing double-digit gains. Information technology, real estate, utilities, and consumer staples drove the Index’s gain. Energy was the worst-performing sector, declining nearly 16%, which was coincidentally in line with the price drop of West Texas Intermediate (WTI) crude oil over the same period. The materials sector fell slightly.
What was the market environment?
| • | | Enthusiasm for US equity markets was called into question during the fourth quarter of 2018. Trade concerns with China, unsettling White House initiatives, and investor fears about a global economic slowdown led the CBOE Volatility Index to spike more than 105% during the quarter, causing a sell-off across global equity markets and a rotation out of growth stocks and into value stocks. |
| • | | US equity markets rebounded in the early months of 2019 on investors’ belief that measures to stimulate slumping domestic economic activity appeared to gather steam after the Federal Reserve signaled a pause in its federal funds rate hikes and corporate earnings reports generally indicated continued strength. Together, these factors helped improve market sentiment and abate trade fears. |
| • | | After heightened volatility and a more than 20% decline in WTI crude oil prices in 2018, oil prices steadily climbed during the first four months of 2019, up nearly 18% in January alone. In May, markets turned “risk-off” as global economic growth concerns and trade tensions between the US and China bubbled up again, driving investors to sell their “riskier” assets. WTI crude oil prices tumbled 16.50% in May. Other commodities prices, such as steel and copper, also fell. |
| • | | Following a volatile May, global equity markets resumed their advance in June to close the second quarter of 2019 in positive territory as investors’ bearishness paused. Economic growth in Europe remained soft, while the UK economy teetered on the brink of anemic growth, slipping closer toward recession amid the rancor and uncertainty around Brexit. At the end of the second quarter, US housing and auto sales remained weak, while global manufacturing purchasing managers indexes continued to deteriorate, with some reaching their lowest levels since February 2016. |
| • | | Uncertainty—often viewed as “the enemy of the business cycle”—remained front and center with investors at the end of the period as lingering trade uncertainty hung over both corporate and consumer sentiment. |
| | |
| 10 | | Visit our website at pgiminvestments.com |
What worked?
Stock selection within the aerospace & defense and semiconductor industries drove the majority of the Fund’s relative performance during the period. An underweight allocation to biotechnology firms also contributed.
Top absolute contributors:
| • | | Within information technology, shares of semiconductor companyUniversal Display Corp. outperformed during the period overall after struggling in 2018. The company reported better-than-expected financial results for two consecutive quarters, driven by the resumption of orders from all three of its major customers and significant improvement in its operating margins. At the end of the period, Jennison favored the company as a pure-play on the fast-growing OLED (organic light emitting diode) market, which is slowly but steadily replacing the LCD (liquid crystal display) market. Universal Display researches, develops, and commercializes OLED technologies and materials. It also licenses its proprietary OLED technology to manufacturers of products for display applications, such as cell phones, portable media devices, tablets, laptop computers, televisions, and specialty and general lighting products. |
| • | | US confectionary companyThe Hershey Co. outperformed during the period, benefitting from improved gross margin expansion on better cost controls and organic sales. Hershey’s “margin for growth” cost-savings program, along with a CEO who is refocusing on the company’s snacking portfolio, helped drive shares higher. At the end of the period, Jennison believed the company was set to accelerate its top line based on innovation and new capacity additions that should help drive its earnings growth in the years ahead. |
| • | | In the health care sector, shares ofAbbott Laboratories rose as the company posted solid quarterly earnings throughout the period, benefitting from its new diagnostic devices and favorable growth dynamics. This diversified health care firm’s businesses include cardiovascular care, nutritionals, diagnostics, and pharmaceuticals. At the end of the period, Jennison believed Abbott’s broad-based pipeline could generate steady revenue and solid earnings growth in the years ahead. |
What didn’t work?
Overweight allocations to regional banks and underweight positioning within household products and systems software firms detracted from the Fund’s relative performance during the period.
Top absolute detractors:
| • | | Within energy, integrated oil and gas firmSuncor Energy Inc. underperformed over the period. As mentioned earlier, the broad energy sector suffered amid poor investor |
| | | | |
| PGIM Jennison Rising Dividend Fund | | | 11 | |
Strategy and Performance Overview(continued)
| | sentiment and sharply declining WTI crude oil prices, putting pressure on the company’s share price. Its stock underperformed despite the firm beating quarterly earnings expectations and boosting its dividend in December 2018, which marked its 17th consecutive year of annual dividend increases. |
| • | | In the health care sector, shares of pharmaceutical companyAllergan plc suffered during the period for a multitude of reasons. In March 2019, the firm announced its marquee pipeline drug, Rapstinel, had failed its Phase III trials, prompting a sharp response by activist investors calling for the company to install an experienced independent chairman to bring new leadership. Jennison liquidated the Fund’s position in Allergan in April 2019 in favor of what it considered to be more attractive investment opportunities. |
| • | | Moelis & Co. is a global investment bank, providing strategic advisory services to a variety of private, public, and government institutions. The company’s shares underperformed over the period amid the “risk-off” environment, particularly in the fourth quarter of 2018 when credit markets seized up in the financials sector and equity markets fell sharply. Additionally, an overall decline in merger and acquisition deals and a number of analysts cutting their earnings estimates combined to negatively affect the company’s shares. In March 2019, Jennison sold the Fund’s position in Moelis in favor of what it saw as more attractive investment opportunities. |
Current outlook
| • | | At the end of the period, Jennison continued to build the Fund from the bottom up, looking for opportunities to invest in companies that have the potential to consistently grow their dividend. In Jennison’s view, the key to success is finding companies that can generate high and increasing free cash flow that can be returned to investors in the form of a growing dividend. Overall, Jennison favored companies that it believes are attractively valued and for which it is willing to be patient for its investment theses to play out. Jennison believes this approach should result in lower turnover and lower beta relative to the broader market over time. |
| • | | While Jennison believed there may be economic growth in the months ahead, exogenous factors, such as the US/China trade war, geopolitical tensions in the Middle East, or other headline-news grabbing events, could slow the global economic engine, eventually leading to increased market volatility or, potentially worse, a global recession. Despite the premature recession forecasts some had called for in the fourth quarter of 2018, the global gross domestic product environment, in Jennison’s view, was clearly muted at the end of the period. As a result, Jennison was comfortable with the Fund’s defensive positioning and intends to remain watchful over the coming months as it seeks to take advantage of any potential market mispricing. |
| | |
| 12 | | Visit our website at pgiminvestments.com |
| • | | In Jennison’s view, despite bouts of market volatility, dividend-paying stocks should remain attractive in this “lower-for-longer” interest rate environment, and Jennison found solace in the fact that dividends and share buybacks remain an overall priority in firms’ corporate allocation strategies. Jennison continued to keep a close eye on monetary policy and believed that, while US interest rates could move and stay lower in the near term, longer-term rates were likely on an upward trajectory overall. Looking ahead, Jennison expected interest rate changes to be episodic, looking more like a roller coaster in short increments. |
| • | | Given this likely interest rate trajectory, high dividend-yielding companies that do not demonstrate improving underlying fundamentals could face a challenging period ahead, in Jennison’s view. The focus on a company’s fundamental improvement may be even more important in this environment. As a result, Jennison has largely positioned the Fund’s portfolio to adjust for such market conditions. |
| • | | Jennison believes that being nimble, along with balancing its short-term convictions with its long-term risks, have begun to pay off and is encouraged by the results. |
| | | | |
| PGIM Jennison Rising Dividend Fund | | | 13 | |
Fees and Expenses(unaudited)
As a shareholder of the Fund, you incur two types of costs: (1) transaction costs, including sales charges (loads) on purchase payments and redemptions, as applicable, and (2) ongoing costs, including management fees, distribution, and/or service (12b-1) fees, and other Fund expenses, as applicable. This example is intended to help you understand your ongoing costs (in dollars) of investing in the Fund and to compare these costs with the ongoing costs of investing in other mutual funds.
The example is based on an investment of $1,000 held through thesix-month period ended July 31, 2019. The example is for illustrative purposes only; you should consult the Prospectus for information on initial and subsequent minimum investment requirements.
Actual Expenses
The first line for each share class in the table on the following page provides information about actual account values and actual expenses. You may use the information on this line, together with the amount you invested, to estimate the expenses that you paid over the period. Simply divide your account value by $1,000 (for example, an $8,600 account value ÷ $1,000 = 8.6), then multiply the result by the number on the first line under the heading “Expenses Paid During the Six-Month Period” to estimate the expenses you paid on your account during this period.
Hypothetical Example for Comparison Purposes
The second line for each share class in the table on the following page provides information about hypothetical account values and hypothetical expenses based on the Fund’s actual expense ratio and an assumed rate of return of 5% per year before expenses, which is not the Fund’s actual return. The hypothetical account values and expenses may not be used to estimate the actual ending account balance or expenses you paid for the period. You may use this information to compare the ongoing costs of investing in the Fund and other funds. To do so, compare this 5% hypothetical example with the 5% hypothetical examples that appear in the shareholder reports of the other funds.
The Fund’s transfer agent may charge additional fees to holders of certain accounts that are not included in the expenses shown in the table on the following page. These fees apply to individual retirement accounts (IRAs) and Section 403(b) accounts. As of the close of the six-month period covered by the table, IRA fees included an annual maintenance fee of $15 per account (subject to a maximum annual maintenance fee of $25 for all accounts held by the same shareholder). Section 403(b) accounts are charged an annual $25 fiduciary maintenance fee. Some of the fees may vary in amount, or may be waived, based on your total account balance or the number of Prudential funds, including the Fund, that you own. You should consider the additional fees that were charged to your Fund account over the six-month period when you estimate the total ongoing expenses paid over the period and
| | |
| 14 | | Visit our website at pgiminvestments.com |
the impact of these fees on your ending account value, as these additional expenses are not reflected in the information provided in the expense table. Additional fees have the effect of reducing investment returns.
Please note that the expenses shown in the table are meant to highlight your ongoing costs only and do not reflect any transactional costs such as sales charges (loads). Therefore, the second line for each share class in the table is useful in comparing ongoing costs only and will not help you determine the relative total costs of owning different funds. In addition, if these transactional costs were included, your costs would have been higher.
| | | | | | | | | | | | | | | | | | |
| | | | |
PGIM Jennison Rising
Dividend Fund | | Beginning Account
Value
February 1, 2019 | | | Ending Account
Value
July 31, 2019 | | | Annualized
Expense Ratio
Based on the
Six-Month Period | | | Expenses Paid
During the
Six-Month Period* | |
| Class A | | Actual | | $ | 1,000.00 | | | $ | 1,145.90 | | | | 1.24 | % | | $ | 6.60 | |
| | Hypothetical | | $ | 1,000.00 | | | $ | 1,018.65 | | | | 1.24 | % | | $ | 6.21 | |
| Class C | | Actual | | $ | 1,000.00 | | | $ | 1,142.00 | | | | 1.99 | % | | $ | 10.57 | |
| | Hypothetical | | $ | 1,000.00 | | | $ | 1,014.93 | | | | 1.99 | % | | $ | 9.94 | |
| Class Z | | Actual | | $ | 1,000.00 | | | $ | 1,147.80 | | | | 0.99 | % | | $ | 5.27 | |
| | Hypothetical | | $ | 1,000.00 | | | $ | 1,019.89 | | | | 0.99 | % | | $ | 4.96 | |
| Class R6 | | Actual | | $ | 1,000.00 | | | $ | 1,148.00 | | | | 0.99 | % | | $ | 5.27 | |
| | | Hypothetical | | $ | 1,000.00 | | | $ | 1,019.89 | | | | 0.99 | % | | $ | 4.96 | |
*Fund expenses (net of fee waivers or subsidies, if any) for each share class are equal to the annualized expense ratio for each share class (provided in the table), multiplied by the average account value over the period, multiplied by the 181 days in the six-month period ended July 31, 2019, and divided by the 365 days in the Fund’s fiscal year ended July 31, 2019 (to reflect the six-month period). Expenses presented in the table include the expenses of any underlying portfolios in which the Fund may invest.
| | | | |
| PGIM Jennison Rising Dividend Fund | | | 15 | |
Schedule of Investments
as of July 31, 2019
| | | | | | | | |
| Description | | Shares | | | Value | |
LONG-TERM INVESTMENTS 98.9% | | | | | | | | |
| | |
COMMON STOCKS | | | | | | | | |
| | |
Aerospace & Defense 4.9% | | | | | | | | |
Airbus SE (France), ADR | | | 11,208 | | | $ | 396,315 | |
Northrop Grumman Corp. | | | 1,196 | | | | 413,302 | |
| | | | | | | | |
| | | | | | | 809,617 | |
| | |
Banks 10.8% | | | | | | | | |
Bank of America Corp. | | | 9,066 | | | | 278,145 | |
Citigroup, Inc. | | | 4,637 | | | | 329,969 | |
JPMorgan Chase & Co. | | | 3,200 | | | | 371,200 | |
PNC Financial Services Group, Inc. (The) | | | 2,582 | | | | 368,968 | |
SunTrust Banks, Inc. | | | 6,308 | | | | 420,112 | |
| | | | | | | | |
| | | | | | | 1,768,394 | |
| | |
Beverages 5.6% | | | | | | | | |
Coca-Cola European Partners PLC (United Kingdom) | | | 3,616 | | | | 199,893 | |
Diageo PLC (United Kingdom), ADR | | | 1,413 | | | | 235,801 | |
PepsiCo, Inc. | | | 3,742 | | | | 478,265 | |
| | | | | | | | |
| | | | | | | 913,959 | |
| | |
Chemicals 2.1% | | | | | | | | |
Ecolab, Inc. | | | 1,688 | | | | 340,520 | |
| | |
Commercial Services & Supplies 2.2% | | | | | | | | |
Waste Management, Inc. | | | 3,147 | | | | 368,199 | |
| | |
Consumer Finance 2.3% | | | | | | | | |
American Express Co. | | | 2,999 | | | | 372,986 | |
| | |
Containers & Packaging 1.6% | | | | | | | | |
Avery Dennison Corp. | | | 2,295 | | | | 263,627 | |
| | |
Diversified Consumer Services 1.5% | | | | | | | | |
Service Corp. International | | | 5,323 | | | | 245,603 | |
| | |
Electric Utilities 4.0% | | | | | | | | |
American Electric Power Co., Inc. | | | 3,652 | | | | 320,682 | |
NextEra Energy, Inc. | | | 1,593 | | | | 330,022 | |
| | | | | | | | |
| | | | | | | 650,704 | |
See Notes to Financial Statements.
| | | | |
| PGIM Jennison Rising Dividend Fund | | | 17 | |
Schedule of Investments(continued)
as of July 31, 2019
| | | | | | | | |
| Description | | Shares | | | Value | |
COMMON STOCKS (Continued) | | | | | | | | |
| | |
Electronic Equipment, Instruments & Components 2.0% | | | | | | | | |
CDW Corp. | | | 2,771 | | | $ | 327,421 | |
| | |
Equity Real Estate Investment Trusts (REITs) 6.0% | | | | | | | | |
AvalonBay Communities, Inc. | | | 1,693 | | | | 353,481 | |
Crown Castle International Corp. | | | 2,222 | | | | 296,104 | |
Equinix, Inc. | | | 681 | | | | 341,930 | |
| | | | | | | | |
| | | | | | | 991,515 | |
| | |
Food & Staples Retailing 2.0% | | | | | | | | |
Walmart, Inc. | | | 2,992 | | | | 330,257 | |
| | |
Food Products 2.6% | | | | | | | | |
Hershey Co. (The) | | | 2,766 | | | | 419,713 | |
| | |
Health Care Equipment & Supplies 2.8% | | | | | | | | |
Abbott Laboratories | | | 5,342 | | | | 465,288 | |
| | |
Hotels, Restaurants & Leisure 2.7% | | | | | | | | |
Domino’s Pizza, Inc. | | | 275 | | | | 67,246 | |
McDonald’s Corp. | | | 1,816 | | | | 382,667 | |
| | | | | | | | |
| | | | | | | 449,913 | |
| | |
Industrial Conglomerates 2.4% | | | | | | | | |
Honeywell International, Inc. | | | 2,311 | | | | 398,555 | |
| | |
IT Services 3.7% | | | | | | | | |
Automatic Data Processing, Inc. | | | 2,091 | | | | 348,193 | |
Mastercard, Inc. (Class A Stock) | | | 942 | | | | 256,479 | |
| | | | | | | | |
| | | | | | | 604,672 | |
| | |
Life Sciences Tools & Services 2.5% | | | | | | | | |
Thermo Fisher Scientific, Inc. | | | 1,462 | | | | 405,968 | |
| | |
Media 2.5% | | | | | | | | |
Comcast Corp. (Class A Stock) | | | 9,585 | | | | 413,785 | |
| | |
Multi-Utilities 4.4% | | | | | | | | |
Ameren Corp. | | | 1,973 | | | | 149,337 | |
See Notes to Financial Statements.
| | | | | | | | |
| Description | | Shares | | | Value | |
COMMON STOCKS (Continued) | | | | | | | | |
| | |
Multi-Utilities (cont’d.) | | | | | | | | |
CMS Energy Corp. | | | 2,760 | | | $ | 160,687 | |
Sempra Energy | | | 3,026 | | | | 409,811 | |
| | | | | | | | |
| | | | | | | 719,835 | |
| | |
Oil, Gas & Consumable Fuels 6.3% | | | | | | | | |
Chevron Corp. | | | 2,377 | | | | 292,633 | |
Enbridge, Inc. (Canada) | | | 8,083 | | | | 269,891 | |
Kinder Morgan, Inc. | | | 15,743 | | | | 324,621 | |
Suncor Energy, Inc. (Canada) | | | 4,950 | | | | 142,065 | |
| | | | | | | | |
| | | | | | | 1,029,210 | |
| | |
Pharmaceuticals 5.6% | | | | | | | | |
AstraZeneca PLC (United Kingdom), ADR | | | 8,288 | | | | 359,782 | |
Eli Lilly & Co. | | | 1,509 | | | | 164,406 | |
Zoetis, Inc. | | | 3,364 | | | | 386,490 | |
| | | | | | | | |
| | | | | | | 910,678 | |
| | |
Road & Rail 1.9% | | | | | | | | |
Norfolk Southern Corp. | | | 1,632 | | | | 311,908 | |
| | |
Semiconductors & Semiconductor Equipment 6.0% | | | | | | | | |
ASML Holding NV (Netherlands) | | | 1,270 | | | | 282,969 | |
Broadcom, Inc. | | | 582 | | | | 168,774 | |
QUALCOMM, Inc. | | | 4,671 | | | | 341,730 | |
Texas Instruments, Inc. | | | 669 | | | | 83,632 | |
Universal Display Corp. | | | 490 | | | | 103,429 | |
| | | | | | | | |
| | | | | | | 980,534 | |
| | |
Software 3.5% | | | | | | | | |
Intuit, Inc. | | | 779 | | | | 216,024 | |
Microsoft Corp. | | | 2,585 | | | | 352,258 | |
| | | | | | | | |
| | | | | | | 568,282 | |
| | |
Specialty Retail 3.6% | | | | | | | | |
TJX Cos., Inc. (The) | | | 5,033 | | | | 274,600 | |
Tractor Supply Co. | | | 2,853 | | | | 310,435 | |
| | | | | | | | |
| | | | | | | 585,035 | |
See Notes to Financial Statements.
| | | | |
| PGIM Jennison Rising Dividend Fund | | | 19 | |
Schedule of Investments(continued)
as of July 31, 2019
| | | | | | | | |
| Description | | Shares | | | Value | |
COMMON STOCKS (Continued) | | | | | | | | |
| | |
Technology Hardware, Storage & Peripherals 2.3% | | | | | | | | |
Apple, Inc. | | | 1,761 | | | $ | 375,163 | |
| | |
Textiles, Apparel & Luxury Goods 1.1% | | | | | | | | |
NIKE, Inc. (Class B Stock) | | | 2,085 | | | | 179,373 | |
| | | | | | | | |
TOTAL LONG-TERM INVESTMENTS
(cost $13,152,983) | | | | | | | 16,200,714 | |
| | | | | | | | |
| | |
SHORT-TERM INVESTMENTS 1.6% | | | | | | | | |
| | |
AFFILIATED MUTUAL FUNDS | | | | | | | | |
PGIM Core Ultra Short Bond Fund(w) | | | 263,449 | | | | 263,449 | |
PGIM Institutional Money Market Fund(w) | | | 43 | | | | 43 | |
| | | | | | | | |
TOTAL SHORT-TERM INVESTMENTS
(cost $263,492) | | | | | | | 263,492 | |
| | | | | | | | |
TOTAL INVESTMENTS 100.5%
(cost $13,416,475) | | | | | | | 16,464,206 | |
Liabilities in excess of other assets (0.5)% | | | | | | | (87,429 | ) |
| | | | | | | | |
NET ASSETS 100.0% | | | | | | $ | 16,376,777 | |
| | | | | | | | |
Below is a list of the abbreviation(s) used in the annual report:
ADR—American Depositary Receipt
LIBOR—London Interbank Offered Rate
REITs—Real Estate Investment Trust
| (w) | PGIM Investments LLC, the manager of the Fund, also serves as manager of the PGIM Core Ultra Short Bond Fund and PGIM Institutional Money Market Fund. |
Fair Value Measurements:
Various inputs are used in determining the value of the Fund’s investments. These inputs are summarized in the three broad levels listed below.
Level 1—unadjusted quoted prices generally in active markets for identical securities.
Level 2—quoted prices for similar securities, interest rates and yield curves, prepayment speeds, foreign currency exchange rates and other observable inputs.
Level 3—unobservable inputs for securities valued in accordance with Board approved fair valuation procedures.
See Notes to Financial Statements.
The following is a summary of the inputs used as of July 31, 2019 in valuing such portfolio securities:
| | | | | | | | | | | | |
| | | Level 1 | | | Level 2 | | | Level 3 | |
Investments in Securities | | | | | | | | | | | | |
Common Stocks | | | | | | | | | | | | |
Aerospace & Defense | | $ | 809,617 | | | $ | — | | | $ | — | |
Banks | | | 1,768,394 | | | | — | | | | — | |
Beverages | | | 913,959 | | | | — | | | | — | |
Chemicals | | | 340,520 | | | | — | | | | — | |
Commercial Services & Supplies | | | 368,199 | | | | — | | | | — | |
Consumer Finance | | | 372,986 | | | | — | | | | — | |
Containers & Packaging | | | 263,627 | | | | — | | | | — | |
Diversified Consumer Services | | | 245,603 | | | | — | | | | — | |
Electric Utilities | | | 650,704 | | | | — | | | | — | |
Electronic Equipment, Instruments & Components | | | 327,421 | | | | — | | | | — | |
Equity Real Estate Investment Trusts (REITs) | | | 991,515 | | | | — | | | | — | |
Food & Staples Retailing | | | 330,257 | | | | — | | | | — | |
Food Products | | | 419,713 | | | | — | | | | — | |
Health Care Equipment & Supplies | | | 465,288 | | | | — | | | | — | |
Hotels, Restaurants & Leisure | | | 449,913 | | | | — | | | | — | |
Industrial Conglomerates | | | 398,555 | | | | — | | | | — | |
IT Services | | | 604,672 | | | | — | | | | — | |
Life Sciences Tools & Services | | | 405,968 | | | | — | | | | — | |
Media | | | 413,785 | | | | — | | | | — | |
Multi-Utilities | | | 719,835 | | | | — | | | | — | |
Oil, Gas & Consumable Fuels | | | 1,029,210 | | | | — | | | | — | |
Pharmaceuticals | | | 910,678 | | | | — | | | | — | |
Road & Rail | | | 311,908 | | | | — | | | | — | |
Semiconductors & Semiconductor Equipment | | | 980,534 | | | | — | | | | — | |
Software | | | 568,282 | | | | — | | | | — | |
Specialty Retail | | | 585,035 | | | | — | | | | — | |
Technology Hardware, Storage & Peripherals | | | 375,163 | | | | — | | | | — | |
Textiles, Apparel & Luxury Goods | | | 179,373 | | | | — | | | | — | |
Affiliated Mutual Funds | | | 263,492 | | | | — | | | | — | |
| | | | | | | | | | | | |
Total | | $ | 16,464,206 | | | $ | — | | | $ | — | |
| | | | | | | | | | | | |
Industry Classification:
The industry classification of investments and liabilities in excess of other assets shown as a percentage of net assets as of July 31, 2019 were as follows (unaudited):
| | | | |
Banks | | | 10.8 | % |
Oil, Gas & Consumable Fuels | | | 6.3 | |
Equity Real Estate Investment Trusts (REITs) | | | 6.0 | |
Semiconductors & Semiconductor Equipment | | | 6.0 | |
Beverages | | | 5.6 | |
Pharmaceuticals | | | 5.6 | |
Aerospace & Defense | | | 4.9 | |
Multi-Utilities | | | 4.4 | |
Electric Utilities | | | 4.0 | |
IT Services | | | 3.7 | % |
Specialty Retail | | | 3.6 | |
Software | | | 3.5 | |
Health Care Equipment & Supplies | | | 2.8 | |
Hotels, Restaurants & Leisure | | | 2.7 | |
Food Products | | | 2.6 | |
Media | | | 2.5 | |
Life Sciences Tools & Services | | | 2.5 | |
Industrial Conglomerates | | | 2.4 | |
See Notes to Financial Statements.
| | | | |
| PGIM Jennison Rising Dividend Fund | | | 21 | |
Schedule of Investments(continued)
as of July 31, 2019
| | | | |
Industry Classification (cont’d): | |
Technology Hardware, Storage & Peripherals | | | 2.3 | % |
Consumer Finance | | | 2.3 | |
Commercial Services & Supplies | | | 2.2 | |
Chemicals | | | 2.1 | |
Food & Staples Retailing | | | 2.0 | |
Electronic Equipment, Instruments & Components | | | 2.0 | |
Road & Rail | | | 1.9 | |
Containers & Packaging | | | 1.6 | |
Affiliated Mutual Funds | | | 1.6 | |
| | | | |
Diversified Consumer Services | | | 1.5 | % |
Textiles, Apparel & Luxury Goods | | | 1.1 | |
| | | | |
| | | 100.5 | |
Liabilities in excess of other assets | | | (0.5 | ) |
| | | | |
| | | 100.0 | % |
| | | | |
See Notes to Financial Statements.
Statement of Assets & Liabilities
as of July 31, 2019
| | | | |
Assets | | | | |
Investments at value: | | | | |
Unaffiliated investments (cost $13,152,983) | | $ | 16,200,714 | |
Affiliated investments (cost $263,492) | | | 263,492 | |
Dividends receivable | | | 10,940 | |
Receivable for Fund shares sold | | | 5,070 | |
Due from Manager | | | 2,919 | |
| | | | |
Total Assets | | | 16,483,135 | |
| | | | |
| |
Liabilities | | | | |
Payable for Fund shares reacquired | | | 34,072 | |
Audit fee payable | | | 24,050 | |
Custodian and accounting fees payable | | | 23,158 | |
Registration fees payable | | | 7,784 | |
Accrued expenses and other liabilities | | | 7,465 | |
Printing fee payable | | | 6,214 | |
Distribution fee payable | | | 2,730 | |
Affiliated transfer agent fee payable | | | 885 | |
| | | | |
Total Liabilities | | | 106,358 | |
| | | | |
| |
Net Assets | | $ | 16,376,777 | |
| | | | |
| | | | | |
Net assets were comprised of: | | | | |
Shares of beneficial interest, at par | | $ | 1,209 | |
Paid-in capital in excess of par | | | 13,035,697 | |
Total distributable earnings (loss) | | | 3,339,871 | |
| | | | |
Net assets, July 31, 2019 | | $ | 16,376,777 | |
| | | | |
See Notes to Financial Statements.
| | | | |
| PGIM Jennison Rising Dividend Fund | | | 23 | |
Statement of Assets & Liabilities(continued)
as of July 31, 2019
| | | | |
Class A | | | | |
Net asset value, offering price and redemption price per share,
($5,391,310 ÷ 398,074 shares of beneficial interest issued and outstanding) | | $ | 13.54 | |
Maximum sales charge (5.50% of offering price) | | | 0.79 | |
| | | | |
Maximum offering price to public | | $ | 14.33 | |
| | | | |
| |
Class C | | | | |
Net asset value, offering price and redemption price per share,
($1,851,711 ÷ 137,030 shares of beneficial interest issued and outstanding) | | $ | 13.51 | |
| | | | |
| |
Class Z | | | | |
Net asset value, offering price and redemption price per share,
($9,121,804 ÷ 672,764 shares of beneficial interest issued and outstanding) | | $ | 13.56 | |
| | | | |
| |
Class R6 | | | | |
Net asset value, offering price and redemption price per share,
($11,952 ÷ 882 shares of beneficial interest issued and outstanding) | | $ | 13.55 | |
| | | | |
See Notes to Financial Statements.
Statement of Operations
Year Ended July 31, 2019
| | | | |
Net Investment Income (Loss) | | | | |
Income | | | | |
Unaffiliated dividend income (net of $3,071 foreign withholding tax) | | $ | 319,667 | |
Affiliated dividend income | | | 8,576 | |
Income from securities lending, net (including affiliated income of $72) | | | 3,357 | |
| | | | |
Total income | | | 331,600 | |
| | | | |
| |
Expenses | | | | |
Management fee | | | 114,872 | |
Distribution fee(a) | | | 32,843 | |
Custodian and accounting fees | | | 61,156 | |
Registration fees(a) | | | 50,055 | |
Shareholders’ reports | | | 25,135 | |
Audit fee | | | 24,050 | |
Legal fees and expenses | | | 20,113 | |
Transfer agent’s fees and expenses (including affiliated expense of $5,509)(a) | | | 13,519 | |
Trustees’ fees | | | 11,334 | |
Miscellaneous | | | 16,660 | |
| | | | |
Total expenses | | | 369,737 | |
Less: Fee waiver and/or expense reimbursement(a) | | | (190,154 | ) |
Distribution fee waiver(a) | | | (2,365 | ) |
| | | | |
Net expenses | | | 177,218 | |
| | | | |
Net investment income (loss) | | | 154,382 | |
| | | | |
| |
Realized And Unrealized Gain (Loss) On Investment And Foreign Currency Transactions | | | | |
Net realized gain (loss) on: | | | | |
Investment transactions (including affiliated of $43) | | | 726,427 | |
Foreign currency transactions | | | 35 | |
| | | | |
| | | 726,462 | |
| | | | |
Net change in unrealized appreciation (depreciation) on investments | | | 358,983 | |
| | | | |
Net gain (loss) on investment and foreign currency transactions | | | 1,085,445 | |
| | | | |
Net Increase (Decrease) In Net Assets Resulting From Operations | | $ | 1,239,827 | |
| | | | |
| (a) | Class specific expenses and waivers were as follows: |
| | | | | | | | | | | | | | | | |
| | | Class A | | | Class C | | | Class Z | | | Class R6 | |
Distribution fee | | | 14,188 | | | | 18,655 | | | | — | | | | — | |
Registration fees | | | 12,376 | | | | 12,376 | | | | 12,376 | | | | 12,927 | |
Transfer agent’s fees and expenses | | | 8,926 | | | | 2,458 | | | | 2,078 | | | | 57 | |
Fee waiver and/or expense reimbursement | | | (61,788 | ) | | | (30,759 | ) | | | (84,530 | ) | | | (13,077 | ) |
Distribution fee waiver | | | (2,365 | ) | | | — | | | | — | | | | — | |
See Notes to Financial Statements.
| | | | |
| PGIM Jennison Rising Dividend Fund | | | 25 | |
Statements of Changes in Net Assets
| | | | | | | | |
| |
| | | Year Ended July 31, | |
| | |
| | | 2019 | | | 2018 | |
Increase (Decrease) in Net Assets | | | | | | | | |
Operations | | | | | | | | |
Net investment income (loss) | | $ | 154,382 | | | $ | 101,702 | |
Net realized gain (loss) on investment and foreign currency transactions | | | 726,462 | | | | 834,092 | |
Net change in unrealized appreciation (depreciation) on investments | | | 358,983 | | | | 615,645 | |
| | | | | | | | |
Net increase (decrease) in net assets resulting from operations | | | 1,239,827 | | | | 1,551,439 | |
| | | | | | | | |
| | |
Dividends and Distributions | | | | | | | | |
Distributions from distributable earnings* | | | | | | | | |
Class A | | | (400,210 | ) | | | — | |
Class C | | | (144,172 | ) | | | — | |
Class Z | | | (706,047 | ) | | | — | |
Class R6 | | | (942 | ) | | | — | |
| | | | | | | | |
| | | (1,251,371 | ) | | | — | |
| | | | | | | | |
Dividends from net investment income* | | | | | | | | |
Class A | | | | | | | (29,725 | ) |
Class C | | | | | | | (665 | ) |
Class Z | | | | | | | (77,697 | ) |
Class R6 | | | | | | | (77 | ) |
| | | | | | | | |
| | | * | | | | (108,164 | ) |
| | | | | | | | |
Distributions from net realized gains* | | | | | | | | |
Class A | | | | | | | (26,846 | ) |
Class C | | | | | | | (11,229 | ) |
Class Z | | | | | | | (54,449 | ) |
Class R6 | | | | | | | (70 | ) |
| | | | | | | | |
| | | * | | | | (92,594 | ) |
| | | | | | | | |
| | |
Fund share transactions (Net of share conversions) | | | | | | | | |
Net proceeds from shares sold | | | 2,264,252 | | | | 2,573,470 | |
Net asset value of shares issued in reinvestment of dividends and distributions | | | 1,245,996 | | | | 199,015 | |
Cost of shares reacquired | | | (1,792,582 | ) | | | (1,853,000 | ) |
| | | | | | | | |
Net increase (decrease) in net assets from Fund share transactions | | | 1,717,666 | | | | 919,485 | |
| | | | | | | | |
Total increase (decrease) | | | 1,706,122 | | | | 2,270,166 | |
| | |
Net Assets: | | | | | | | | |
Beginning of year | | | 14,670,655 | | | | 12,400,489 | |
| | | | | | | | |
End of year(a) | | $ | 16,376,777 | | | $ | 14,670,655 | |
| | | | | | | | |
(a) Includes undistributed/(distributions in excess of) net investment income of: | | $ | * | | | $ | — | |
| | | | | | | | |
| * | For the year ended July 31, 2019, the disclosures have been revised to reflect revisions to RegulationS-X adopted by the SEC in 2018 (refer to Note 9). |
See Notes to Financial Statements.
Notes to Financial Statements
Prudential Investment Portfolios 5 (the “Trust”) is registered under the Investment Company Act of 1940, as amended (“1940 Act”), as a diversified,open-end management investment company. The Trust currently consists of fifteen funds: Prudential Day One Income Fund, Prudential Day One 2010 Fund, Prudential Day One 2015 Fund, Prudential Day One 2020 Fund, Prudential Day One 2025 Fund, Prudential Day One 2030 Fund, Prudential Day One 2035 Fund, Prudential Day One 2040 Fund, Prudential Day One 2045 Fund, Prudential Day One 2050 Fund, Prudential Day One 2055 Fund, Prudential Day One 2060 Fund, PGIM 60/40 Allocation Fund, PGIM Jennison Diversified Growth Fund and PGIM Jennison Rising Dividend Fund. These financial statements relate only to the PGIM Jennison Rising Dividend Fund (the “Fund”).
The investment objective of the Fund is capital appreciation and income.
1. Accounting Policies
The Fund follows the investment company accounting and reporting guidance of the Financial Accounting Standards Board (“FASB”) Accounting Standard Codification (“ASC”) Topic 946 Financial Services—Investment Companies.The following accounting policies conform to U.S. generally accepted accounting principles. The Fund consistently follows such policies in the preparation of its financial statements.
Securities Valuation:The Fund holds securities and other assets and liabilities that are fair valued at the close of each day (generally, 4:00 PM Eastern time) the New York Stock Exchange (“NYSE”) is open for trading. Fair value is the price that would be received to sell an asset or paid to transfer a liability in an orderly transaction between market participants on the measurement date. The Trust’s Board of Trustees (the “Board”) has adopted valuation procedures for security valuation under which fair valuation responsibilities have been delegated to PGIM Investments LLC (“PGIM Investments” or the “Manager”). Pursuant to the Board’s delegation, the Manager has established a Valuation Committee responsible for supervising the fair valuation of portfolio securities and other assets and liabilities. The valuation procedures permit the Fund to utilize independent pricing vendor services, quotations from market makers, and alternative valuation methods when market quotations are either not readily available or not deemed representative of fair value. A record of the Valuation Committee’s actions is subject to the Board’s review, approval, and ratification at its next regularly scheduled quarterly meeting.
For the fiscal reportingyear-end, securities and other assets and liabilities were fair valued at the close of the last U.S. business day. Trading in certain foreign securities may occur when the NYSE is closed (including weekends and holidays). Because such foreign securities
| | | | |
| PGIM Jennison Rising Dividend Fund | | | 27 | |
Notes to Financial Statements(continued)
trade in markets that are open on weekends and U.S. holidays, the values of some of the Fund’s foreign investments may change on days when investors cannot purchase or redeem Fund shares.
Various inputs determine how the Fund’s investments are valued, all of which are categorized according to the three broad levels (Level 1, 2, or 3) detailed in the Schedule of Investments and referred to herein as the “fair value hierarchy” in accordance with FASB ASC Topic 820 - Fair Value Measurements and Disclosures.
Common and preferred stocks, exchange-traded funds, and derivative instruments, such as futures or options, that are traded on a national securities exchange are valued at the last sale price as of the close of trading on the applicable exchange where the security principally trades. Securities traded via NASDAQ are valued at the NASDAQ official closing price. To the extent these securities are valued at the last sale price or NASDAQ official closing price, they are classified as Level 1 in the fair value hierarchy. In the event that no sale or official closing price on valuation date exists, these securities are generally valued at the mean between the last reported bid and ask prices, or at the last bid price in the absence of an ask price. These securities are classified as Level 2 in the fair value hierarchy.
Investments inopen-end,non-exchange-traded mutual funds are valued at their net asset values as of the close of the NYSE on the date of valuation. These securities are classified as Level 1 in the fair value hierarchy since they may be purchased or sold at their net asset values on the date of valuation.
Securities and other assets that cannot be priced according to the methods described above are valued based on pricing methodologies approved by the Board. In the event that unobservable inputs are used when determining such valuations, the securities will be classified as Level 3 in the fair value hierarchy.
When determining the fair value of securities, some of the factors influencing the valuation include: the nature of any restrictions on disposition of the securities; assessment of the general liquidity of the securities; the issuer’s financial condition and the markets in which it does business; the cost of the investment; the size of the holding and the capitalization of the issuer; the prices of any recent transactions or bids/offers for such securities or any comparable securities; any available analyst media or other reports or information deemed reliable by the Manager regarding the issuer or the markets or industry in which it operates. Using fair value to price securities may result in a value that is different from a security’s most recent closing price and from the price used by other unaffiliated mutual funds to calculate their net asset values.
Illiquid Securities:Pursuant to Rule22e-4 under the 1940 Act, the Fund has adopted a Board approved Liquidity Risk Management Program (“LRMP”) that requires, among other things, that the Fund limit its illiquid investments that are assets to no more than 15% of net assets. Illiquid securities are those that, because of the absence of a readily available market or due to legal or contractual restrictions on resale, may not reasonably be expected to be sold or disposed of in current market conditions in seven calendar days or less without the sale or disposition significantly changing the market value of the investment. The Fund may find it difficult to sell illiquid securities at the time considered most advantageous by its subadviser and may incur transaction costs that would not be incurred in the sale of securities that were freely marketable.
Restricted Securities:Securities acquired in unregistered, private sales from the issuing company or from an affiliate of the issuer are considered restricted as to disposition under federal securities law (“restricted securities”). Such restricted securities are valued pursuant to the valuation procedures noted above. Restricted securities that would otherwise be considered illiquid investments pursuant to the Fund’s LRMP because of legal restrictions on resale to the general public may be traded among qualified institutional buyers under Rule 144A of the Securities Act of 1933. Therefore, these Rule 144A securities, as well as commercial paper that is sold in private placements under Section 4(2) of the Securities Act of 1933, may be classified higher than “illiquid” under the LRMP (i.e. “moderately liquid” or “less liquid” investments). However, the liquidity of the Fund’s investments in restricted securities could be impaired if trading does not develop or declines.
Master Netting Arrangements:The Trust, on behalf of the Fund, is subject to various Master Agreements, or netting arrangements, with select counterparties. These are agreements which a subadviser may have negotiated and entered into on behalf of all or a portion of the Fund. A master netting arrangement between the Fund and the counterparty permits the Fund to offset amounts payable by the Fund to the same counterparty against amounts to be received; and by the receipt of collateral from the counterparty by the Fund to cover the Fund’s exposure to the counterparty. However, there is no assurance that such mitigating factors are easily enforceable. In addition to master netting arrangements, the right toset-off exists when all the conditions are met such that each of the parties owes the other determinable amounts, the reporting party has the right toset-off the amount owed with the amount owed by the other party, the reporting party intends toset-off and the right ofset-off is enforceable by law. During the reporting period, there was no intention to settle on a net basis and all amounts are presented on a gross basis on the Statement of Assets and Liabilities.
Securities Lending:The Fund lends its portfolio securities to banks and broker-dealers. The loans are secured by collateral at least equal to the market value of the securities loaned. Collateral pledged by each borrower is invested in an affiliated money market fund and is marked to market daily, based on the previous day’s market value, such that the value of the collateral exceeds the value of the loaned securities. In the event of significant appreciation in value of securities on loan on the last business day of the reporting period, the financial statements may reflect a collateral value that is less than the market value of the loaned
| | | | |
| PGIM Jennison Rising Dividend Fund | | | 29 | |
Notes to Financial Statements(continued)
securities. Such shortfall is remedied as described above. Loans are subject to termination at the option of the borrower or the Fund. Upon termination of the loan, the borrower will return to the Fund securities identical to the loaned securities. Should the borrower of the securities fail financially, the Fund has the right to repurchase the securities in the open market using the collateral.
The Fund recognizes income, net of any rebate and securities lending agent fees, for lending its securities in the form of fees or interest on the investment of any cash received as collateral. The borrower receives all interest and dividends from the securities loaned and such payments are passed back to the lender in amounts equivalent thereto. The Fund also continues to recognize any unrealized gain (loss) in the market price of the securities loaned and on the change in the value of the collateral invested that may occur during the term of the loan. In addition, realized gain (loss) is recognized on changes in the value of the collateral invested upon liquidation of the collateral. Net earnings from securities lending are disclosed on the Statement of Operations as “Income from securities lending, net”.
Equity and Mortgage Real Estate Investment Trusts (collectively equity REITs):The Fund invested in equity REITs, which report information on the source of their distributions annually. Based on current and historical information, a portion of distributions received from equity REITs during the period is estimated to be dividend income, capital gain or return of capital and recorded accordingly. When material, these estimates are adjusted periodically when the actual source of distributions is disclosed by the equity REITs.
Securities Transactions and Net Investment Income:Securities transactions are recorded on the trade date. Realized gains (losses) from investment and currency transactions are calculated on the specific identification method. Dividend income is recorded on theex-date, or for certain foreign securities, when the Fund becomes aware of such dividends. Expenses are recorded on an accrual basis, which may require the use of certain estimates by management that may differ from actual. Net investment income or loss (other than class specific expenses and waivers, which are allocated as noted below) and unrealized and realized gains (losses) are allocated daily to each class of shares based upon the relative proportion of adjusted net assets of each class at the beginning of the day. Class specific expenses and waivers, where applicable, are charged to the respective share classes. Class specific expenses include distribution fees and distribution fee waivers, shareholder servicing fees, transfer agent’s fees and expenses, registration fees and fee waivers and/or expense reimbursements, as applicable.
Taxes:It is the Fund’s policy to continue to meet the requirements of the Internal Revenue Code applicable to regulated investment companies and to distribute all of its taxable net investment income and capital gains, if any, to its shareholders. Therefore, no federal
income tax provision is required. Withholding taxes on foreign dividends, interest and capital gains, if any, are recorded, net of reclaimable amounts, at the time the related income is earned.
Tax reform legislation commonly referred to as the Tax Cuts and Jobs Act permits a direct REIT shareholder to claim a 20% “qualified business income” deduction for ordinary REIT dividends. On January 18, 2019, the Internal Revenue Service issued final regulations that expressly permit RICs to pass through this “qualified business income” to their shareholders.
Dividends and Distributions:The Fund expects to pay dividends from net investment income quarterly. Distributions from net realized capital and currency gains, if any, are declared and paid annually. Dividends and distributions to shareholders, which are determined in accordance with federal income tax regulations and which may differ from generally accepted accounting principles, are recorded on theex-date. Permanent book/tax differences relating to income and gain (loss) are reclassified between total distributable earnings (loss) andpaid-in capital in excess of par, as appropriate.
Estimates:The preparation of financial statements requires management to make estimates and assumptions that affect the reported amounts and disclosures in the financial statements. Actual results could differ from those estimates.
2. Agreements
The Trust, on behalf of the Fund, has a management agreement with the Manager. Pursuant to this agreement, the Manager has responsibility for all investment advisory services and supervises the subadviser’s performance of such services. In addition, under the management agreement, the Manager provides all of the administrative functions necessary for the organization, operation and management of the Fund. The Manager administers the corporate affairs of the Fund and, in connection therewith, furnishes the Fund with office facilities, together with those ordinary clerical and bookkeeping services which are not being furnished by the Fund’s custodian and the Fund’s transfer agent. The Manager is also responsible for the staffing and management of dedicated groups of legal, marketing, compliance and related personnel necessary for the operation of the Fund. The legal, marketing, compliance and related personnel are also responsible for the management and oversight of the various service providers to the Fund, including, but not limited to, the custodian, transfer agent, and accounting agent.
The Manager has entered into a subadvisory agreement with Jennison Associates LLC (“Jennison”). The subadvisory agreement provides that Jennison will furnish investment advisory services in connection with the management of the Fund. In connection therewith, Jennison is obligated to keep certain books and records of the Fund. The Manager pays for the services of Jennison, the cost of compensation of officers of the Fund, occupancy and certain clerical and bookkeeping costs of the Fund. The Fund bears all other costs and expenses.
| | | | |
| PGIM Jennison Rising Dividend Fund | | | 31 | |
Notes to Financial Statements(continued)
The management fee paid to the Manager is accrued daily and payable monthly at an annual rate of 0.775% on average daily net assets up to and including $1 billion, 0.755% on the next $2 billion of average daily net assets, 0.735% on the next $2 billion of average daily net assets, 0.715% on the next $5 billion of average daily net assets and 0.705% of the average daily net assets assets in excess of $10 billion. The effective management fee rate before any waivers and/or expense reimbursements was 0.775% for the year ended July 31, 2019.
The Manager has contractually agreed, through November 30, 2020, to limit total annual operating expenses after fee waivers and/or expense reimbursements to 1.24% of average daily net assets for Class A shares, 1.99% of average daily net assets for Class C shares, 0.99% of average daily net assets for Class Z shares, and 0.99% of average daily net assets for Class R6 shares. This contractual waiver excludes interest, brokerage, taxes (such as income and foreign withholding taxes, stamp duty and deferred tax expenses), acquired fund fees and expenses, extraordinary expenses, and certain other Fund expenses such as dividend and interest expense and broker charges on short sales. Where applicable, the Manager agrees to waive management fees or shared operating expenses on any share class to the same extent that it waives similar expenses on any other share class. In addition, total annual operating expenses for Class R6 shares will not exceed total annual operating expenses for Class Z shares. Fees and/or expenses waived and/or reimbursed by the Manager may be recouped by the Manager within the same fiscal year during which such waiver and/or reimbursement is made if such recoupment can be realized without exceeding the expense limit in effect at the time of the recoupment for that fiscal year.
The Trust, on behalf of the Fund has a distribution agreement with Prudential Investment Management Services LLC (“PIMS”), which acts as the distributor of the Class A, Class C, Class Z and Class R6 shares of the Fund. The Fund compensates PIMS for distributing and servicing the Fund’s Class A and Class C shares, pursuant to the plans of distribution (the “Distribution Plans”), regardless of expenses actually incurred by PIMS. The distribution fees are accrued daily and payable monthly. No distribution or service fees are paid to PIMS as distributor of the Class Z and Class R6 shares of the Fund.
Pursuant to the Distribution Plans, the Fund compensates PIMS for distribution related activities at an annual rate of up to 0.30% and 1% of the average daily net assets of the Class A and Class C shares, respectively. PIMS has contractually agreed through November 30, 2020 to limit such fees to 0.25% of the average daily net assets of Class A shares.
For the year ended July 31, 2019, PIMS received $30,340 infront-end sales charges resulting from sales of Class A shares. Additionally, for the year ended July 31, 2019, PIMS
received $133 in contingent deferred sales charges imposed upon redemptions by certain Class C shareholders.
PGIM Investments, PIMS and Jennison are indirect, wholly-owned subsidiaries of Prudential Financial, Inc. (“Prudential”).
3. Other Transactions with Affiliates
Prudential Mutual Fund Services LLC (“PMFS”), an affiliate of PGIM Investments and an indirect, wholly-owned subsidiary of Prudential, serves as the Fund’s transfer agent. Transfer agent’s fees and expenses in the Statement of Operations include certainout-of-pocket expenses paid tonon-affiliates, where applicable.
The Fund may invest its overnight sweep cash in the PGIM Core Ultra Short Bond Fund (the “Core Fund”), and its securities lending cash collateral in the PGIM Institutional Money Market Fund (the “Money Market Fund”), each a series of Prudential Investment Portfolios 2, registered under the 1940 Act and managed by PGIM Investments. Through the Fund’s investments in the mentioned underlying funds, PGIM Investments and/or its affiliates are paid fees or reimbursed for providing their services. Earnings from the Core Fund and Money Market Fund are disclosed on the Statement of Operations as “Affiliated dividend income” and “Income from securities lending, net”, respectively.
The Fund may enter into certain securities purchase or sale transactions under Board approved Rule17a-7 procedures. Rule17a-7 is an exemptive rule under the 1940 Act, that subject to certain conditions, permits purchase and sale transactions among affiliated investment companies, or between an investment company and a person that is affiliated solely by reason of having a common (or affiliated) investment adviser, common directors, and/or common officers. Pursuant to the Rule17a-7 procedures and consistent with guidance issued by the SEC, the Trust’s Chief Compliance Officer (“CCO”) prepares a quarterly summary of all such transactions for submission to the Board, together with the CCO’s written representation that all such17a-7 transactions were effected in accordance with the Fund’s Rule17a-7 procedures. For the year ended July 31, 2019, no17a-7 transactions were entered into by the Fund.
4. Portfolio Securities
The aggregate cost of purchases and proceeds from sales of portfolio securities (excluding short-term investments and U.S. Government securities) for the year ended July 31, 2019, were $15,110,727 and $14,573,658, respectively.
A summary of the cost of purchases and proceeds from sales of shares of affiliated investments for the year ended July 31, 2019, is presented as follows:
| | | | |
| PGIM Jennison Rising Dividend Fund | | | 33 | |
Notes to Financial Statements(continued)
| | | | | | | | | | | | | | | | | | | | | | | | | | | | | | |
Value,
Beginning
of Year | | | Cost of
Purchases | | | Proceeds
from Sales | | | Change in
Unrealized
Gain
(Loss) | | | Realized
Gain
(Loss) | | | Value,
End of Year | | | Shares,
End
of Year | | | Income | |
| | | | |
| | PGIM Core Ultra Short Bond Fund* | | | | | | | | | | | | | | | | | |
| $ | 259,723 | | | $ | 5,315,005 | | | $ | 5,311,279 | | | $ | — | | | $ | — | | | $ | 263,449 | | | | 263,449 | | | $ | 8,576 | |
| | | | |
| | PGIM Institutional Money Market Fund* | | | | | | | | | | | | | | | | | |
| | 137,854 | | | | 835,932 | | | | 973,786 | | | | — | | | | 43 | | | | 43 | | | | 43 | | | | 72 | ** |
| | | | | | | | | | | | | | | | | | | | | | | | | | | | | | |
| $ | 397,577 | | | $ | 6,150,937 | | | $ | 6,285,065 | | | $ | — | | | $ | 43 | | | $ | 263,492 | | | | | | | $ | 8,648 | |
| | | | | | | | | | | | | | | | | | | | | | | | | | | | | | |
| * | The Fund did not have any capital gain distributions during the reporting period. |
| ** | This amount is included in “Income from securities lending, net” on the Statement of Operations. |
5. Distributions and Tax Information
Distributions to shareholders, which are determined in accordance with federal income tax regulations and which may differ from generally accepted accounting principles, are recorded on theex-date.
For the year ended July 31, 2019, the tax character of dividends paid by the Fund were $153,008 of ordinary income and $1,098,363 of long-term capital gains. For the year ended July 31, 2018, the tax character of dividends paid by the Fund were $105,423 of ordinary income and $95,335 of long-term capital gains.
As of July 31, 2019, the accumulated undistributed earnings on a tax basis were $1,409 of ordinary income and $537,722 of long-term capital gains.
The United States federal income tax basis of the Fund’s investments and the net unrealized appreciation as of July 31, 2019 were as follows:
| | | | | | |
Tax Basis | | Gross
Unrealized
Appreciation | | Gross
Unrealized
Depreciation | | Net
Unrealized
Appreciation |
| $13,429,379 | | $3,086,495 | | $(51,668) | | $3,034,827 |
The book basis differs from tax basis primarily due to deferred losses on wash sales.
The Fund elected to treat post-October capital losses of approximately $234,000 as having been incurred in the following fiscal year (July 31, 2020).
The Manager has analyzed the Fund’s tax positions taken on federal, state and local income tax returns for all open tax years and has concluded that no provision for income tax is
required in the Fund’s financial statements for the current reporting period. The Fund’s federal, state and local income and federal excise tax returns for tax years for which the applicable statutes of limitations have not expired are subject to examination by the Internal Revenue Service and state departments of revenue.
6. Capital and Ownership
The Fund offers Class A, Class C, Class Z and Class R6 shares. Class A shares are sold with a maximumfront-end sales charge of 5.50%. Investors who purchase $1 million or more of Class A shares and sell these shares within 12 months of purchase are subject to a contingent deferred sales charge (“CDSC”) of 1%, although they are not subject to an initial sales charge. The Class A CDSC is waived for certain retirement and/or benefit plans. A special exchange privilege is also available for shareholders who qualified to purchase Class A shares at net asset value. Class C shares are sold with a CDSC of 1% on sales made within 12 months of purchase. Class C shares will automatically convert to Class A shares on a monthly basis approximately 10 years after purchase. Class Z and Class R6 shares are not subject to any sales or redemption charge and are available exclusively for sale to a limited group of investors.
Under certain circumstances, an exchange may be made from specified share classes of the Fund to one or more other share classes of the Fund as presented in the table of transactions in shares of beneficial interest.
The Trust is authorized to issue an unlimited number of shares of beneficial interest at $0.001 par value of share.
As of July 31, 2019, Prudential, through its affiliated entities, including affiliated funds (if applicable), owned 590,400 Class Z shares and 882 Class R6 shares of the Fund. At reporting period end, four shareholders of record, each holding greater than 5% of the Fund, held 75% of the Fund’s outstanding shares, of which 49% were held by an affiliate of Prudential.
| | | | |
| PGIM Jennison Rising Dividend Fund | | | 35 | |
Notes to Financial Statements(continued)
Transactions in shares of beneficial interest were as follows:
| | | | | | | | |
Class A | | Shares | | | Amount | |
Year ended July 31, 2019: | | | | | | | | |
Shares sold | | | 114,096 | | | $ | 1,490,557 | |
Shares issued in reinvestment of dividends and distributions | | | 35,666 | | | | 394,965 | |
Shares reacquired | | | (86,818 | ) | | | (1,106,751 | ) |
| | | | | | | | |
Net increase (decrease) in shares outstanding before conversion | | | 62,944 | | | | 778,771 | |
Shares issued upon conversion from other share class(es) | | | 18,808 | | | | 242,782 | |
Shares reacquired upon conversion into other share class(es) | | | (6,692 | ) | | | (88,931 | ) |
| | | | | | | | |
Net increase (decrease) in shares outstanding | | | 75,060 | | | $ | 932,622 | |
| | | | | | | | |
Year ended July 31, 2018: | | | | | | | | |
Shares sold | | | 105,476 | | | $ | 1,373,379 | |
Shares issued in reinvestment of dividends and distributions | | | 4,160 | | | | 54,829 | |
Shares reacquired | | | (66,100 | ) | | | (867,254 | ) |
| | | | | | | | |
Net increase (decrease) in shares outstanding before conversion | | | 43,536 | | | | 560,954 | |
Shares issued upon conversion from other share class(es) | | | 2,676 | | | | 34,772 | |
Shares reacquired upon conversion into other share class(es) | | | (1,047 | ) | | | (13,261 | ) |
| | | | | | | | |
Net increase (decrease) in shares outstanding | | | 45,165 | | | $ | 582,465 | |
| | | | | | | | |
Class C | | | | | | |
Year ended July 31, 2019: | | | | | | | | |
Shares sold | | | 40,744 | | | $ | 493,657 | |
Shares issued in reinvestment of dividends and distributions | | | 13,121 | | | | 144,172 | |
Shares reacquired | | | (30,516 | ) | | | (385,193 | ) |
| | | | | | | | |
Net increase (decrease) in shares outstanding before conversion | | | 23,349 | | | | 252,636 | |
Shares reacquired upon conversion into other share class(es) | | | (19,051 | ) | | | (245,473 | ) |
| | | | | | | | |
Net increase (decrease) in shares outstanding | | | 4,298 | | | $ | 7,163 | |
| | | | | | | | |
Year ended July 31, 2018: | | | | | | | | |
Shares sold | | | 51,921 | | | $ | 693,162 | |
Shares issued in reinvestment of dividends and distributions | | | 895 | | | | 11,894 | |
Shares reacquired | | | (45,770 | ) | | | (609,333 | ) |
| | | | | | | | |
Net increase (decrease) in shares outstanding before conversion | | | 7,046 | | | | 95,723 | |
Shares reacquired upon conversion into other share class(es) | | | (2,892 | ) | | | (37,596 | ) |
| | | | | | | | |
Net increase (decrease) in shares outstanding | | | 4,154 | | | $ | 58,127 | |
| | | | | | | | |
| | | | | | | | |
Class Z | | Shares | | | Amount | |
Year ended July 31, 2019: | | | | | | | | |
Shares sold | | | 20,755 | | | $ | 280,038 | |
Shares issued in reinvestment of dividends and distributions | | | 63,490 | | | | 705,917 | |
Shares reacquired | | | (23,993 | ) | | | (300,638 | ) |
| | �� | | | | | | |
Net increase (decrease) in shares outstanding before conversion | | | 60,252 | | | | 685,317 | |
Shares issued upon conversion from other share class(es) | | | 6,900 | | | | 91,622 | |
| | | | | | | | |
Net increase (decrease) in shares outstanding | | | 67,152 | | | $ | 776,939 | |
| | | | | | | | |
Year ended July 31, 2018: | | | | | | | | |
Shares sold | | | 38,079 | | | $ | 496,929 | |
Shares issued in reinvestment of dividends and distributions | | | 10,030 | | | | 132,145 | |
Shares reacquired | | | (28,474 | ) | | | (376,413 | ) |
| | | | | | | | |
Net increase (decrease) in shares outstanding before conversion | | | 19,635 | | | | 252,661 | |
Shares issued upon conversion from other share class(es) | | | 1,262 | | | | 16,085 | |
| | | | | | | | |
Net increase (decrease) in shares outstanding | | | 20,897 | | | $ | 268,746 | |
| | | | | | | | |
Class R6 | | | | | | |
Year ended July 31, 2019: | | | | | | | | |
Shares issued in reinvestment of dividends and distributions | | | 85 | | | $ | 942 | |
| | | | | | | | |
Net increase (decrease) in shares outstanding | | | 85 | | | $ | 942 | |
| | | | | | | | |
Period ended July 31, 2018*: | | | | | | | | |
Shares sold | | | 786 | | | $ | 10,000 | |
Shares issued in reinvestment of dividends and distributions | | | 11 | | | | 147 | |
| | | | | | | | |
Net increase (decrease) in shares outstanding | | | 797 | | | $ | 10,147 | |
| | | | | | | | |
| * | Commencement of offering was September 27, 2017. |
7. Borrowings
The Trust, on behalf of the Fund along with other affiliated registered investment companies (the “Funds”), is a party to a Syndicated Credit Agreement (“SCA”) with a group of banks. The purpose of the SCA is to provide an alternative source of temporary funding for capital share redemptions. The SCA provides for a commitment of $900 million for the period October 4, 2018 through October 3, 2019. The Funds pay an annualized commitment fee of 0.15% of the unused portion of the SCA. The Fund’s portion of the commitment fee for the unused amount, allocated based upon a method approved by the Board, is accrued daily and paid quarterly. Prior to October 4, 2018, the Funds had another SCA that provided a commitment of $900 million and the Funds paid an annualized commitment fee of 0.15% of the unused portion of the SCA. The interest on borrowings under both SCAs is paid monthly and at a per annum interest rate based upon a contractual spread plus the higher of (1) the effective federal funds rate, (2) the1-month LIBOR rate or (3) zero percent.
Certain affiliated registered investment companies that are parties to the SCA include portfolios that are subject to a predetermined mathematical formula used to manage certain benefit guarantees offered under variable annuity contracts. The formula may result in large scale asset flows into and out of these portfolios. Consequently, these portfolios may be more likely to utilize the SCA for purposes of funding redemptions. It may be possible for those
| | | | |
| PGIM Jennison Rising Dividend Fund | | | 37 | |
Notes to Financial Statements(continued)
portfolios to fully exhaust the committed amount of the SCA, thereby requiring the Manager to allocate available funding per a Board-approved methodology designed to treat the Funds in the SCA equitably. The Fund did not utilize the SCA during the year ended July 31, 2019.
8. Risks of Investing in the Fund
The Fund’s risks include, but are not limited to, some or all of the risks discussed below:
Equity and Equity-Related Securities Risks:The value of a particular security could go down and you could lose money. In addition to an individual security losing value, the value of the equity markets or a sector in which the Fund invests could go down. The Fund’s holdings can vary significantly from broad market indexes and the performance of the Fund can deviate from the performance of these indexes. Different parts of a market can react differently to adverse issuer, market, regulatory, political and economic developments.
Market and Credit Risk:Securities markets may be volatile and the market prices of the Fund’s securities may decline. Securities fluctuate in price based on changes in an issuer’s financial condition and overall market and economic conditions. If the market prices of the securities owned by the Fund fall, the value of an investment in the Fund will decline. Additionally, the Fund may also be exposed to credit risk in the event that an issuer or guarantor fails to perform or that an institution or entity with which the Fund has unsettled or open transactions defaults.
Risks of Investing in equity REITs:Real estate securities are subject to similar risks as direct investments in real estate and mortgages, and their value will depend on the value of the underlying properties or the underlying loans or interests. The underlying loans may be subject to the risks of default or of payments that occur earlier or later than expected, and such loans may also includeso-called “subprime” mortgages. The value of these securities will rise and fall in response to many factors, including economic conditions, the demand for rental property and interest rates. In particular, the value of these securities may decline when interest rates rise and will also be affected by the real estate market and by the management of the underlying properties.
In addition, investing in equity REITs involves certain unique risks in addition to those risks associated with investing in the real estate industry in general. Equity REITs may be affected by changes in the value of the underlying property owned by the equity REITs, while mortgage REITs may be affected by the quality of any credit extended. Equity REITs are dependent upon management skills, may not be diversified geographically or by property/mortgage asset type, and are subject to heavy cash flow dependency, default by borrowers and self-liquidation. Since equity REITs are relatively smaller in size when compared to the broader market, and smaller companies tend to be more volatile than
larger companies, they may be more volatile and/or more illiquid than other types of equity securities. Equity REITs are subject to interest rate risks. Equity REITs may incur significant amounts of leverage. The Fund will indirectly bear a portion of the expenses, including management fees, paid by each equity REIT in which it invests, in addition to the expenses of the Fund.
9. Recent Accounting Pronouncements and Reporting Updates
In August 2018, the Securities and Exchange Commission (the “SEC”) adopted amendments to RegulationS-X to update and simplify the disclosure requirements for registered investment companies by eliminating requirements that are redundant or duplicative of US GAAP requirements or other SEC disclosure requirements. The new amendments require the presentation of the total, rather than the components, of distributable earnings on the Statement of Assets and Liabilities and the total, rather than the components, of dividends from net investment income and distributions from net realized gains on the Statements of Changes in Net Assets. The amendments also removed the requirement for the parenthetical disclosure of undistributed net investment income on the Statements of Changes in Net Assets and certain tax adjustments that were reflected in the Notes to Financial Statements. The Manager has adopted the amendments and reflected them in the Fund’s financial statements.
In August 2018, the FASB issued Accounting Standards Update (“ASU”)No. 2018-13, which changes certain fair value measurement disclosure requirements. The new ASU, in addition to other modifications and additions, removes the requirement to disclose the amount and reasons for transfers between Level 1 and Level 2 of the fair value hierarchy, and the Fund’s policy for the timing of transfers between levels. The amendments are effective for financial statements issued for fiscal years beginning after December 15, 2019, and interim periods within those fiscal years. The Manager has evaluated the implications of certain provisions of the ASU and has determined to early adopt aspects related to the removal and modification of certain fair value measurement disclosures under the ASU effective immediately. The Manager continues to evaluate certain other provisions of the ASU and does not expect a material impact to financial statement disclosures.
| | | | |
| PGIM Jennison Rising Dividend Fund | | | 39 | |
Financial Highlights
| | | | | | | | | | | | | | | | | | | | |
| Class A Shares | | | | | | | | | | | | | | | |
| | | Year Ended July 31, | |
| | | 2019(a) | | | 2018(a) | | | 2017(a) | | | 2016(a) | | | 2015 | |
| Per Share Operating Performance: | | | | | | | | | | | | | | | | | | | | |
| Net Asset Value, Beginning of Year | | | $13.80 | | | | $12.50 | | | | $11.37 | | | | $11.33 | | | | $10.34 | |
| Income (loss) from investment operations: | | | | | | | | | | | | | | | | | | | | |
| Net investment income (loss) | | | 0.13 | | | | 0.09 | | | | 0.14 | | | | 0.13 | | | | 0.10 | |
| Net realized and unrealized gain (loss) on investment transactions | | | 0.75 | | | | 1.39 | | | | 1.14 | | | | 0.04 | | | | 1.03 | |
| Total from investment operations | | | 0.88 | | | | 1.48 | | | | 1.28 | | | | 0.17 | | | | 1.13 | |
| Less Dividends and Distributions: | | | | | | | | | | | | | | | | | | | | |
| Dividends from net investment income | | | (0.13 | ) | | | (0.09 | ) | | | (0.15 | ) | | | (0.13 | ) | | | (0.11 | ) |
| Distributions from net realized gains | | | (1.01 | ) | | | (0.09 | ) | | | - | | | | - | | | | (0.03 | ) |
| Total dividends and distributions | | | (1.14 | ) | | | (0.18 | ) | | | (0.15 | ) | | | (0.13 | ) | | | (0.14 | ) |
| Net asset value, end of year | | | $13.54 | | | | $13.80 | | | | $12.50 | | | | $11.37 | | | | $11.33 | |
| Total Return(b): | | | 8.27% | | | | 11.95% | | | | 11.32% | | | | 1.61% | | | | 11.03% | |
| |
| Ratios/Supplemental Data: | |
| Net assets, end of year (000) | | | $5,391 | | | | $4,459 | | | | $3,474 | | | | $2,785 | | | | $1,087 | |
| Average net assets (000) | | | $4,729 | | | | $4,078 | | | | $2,912 | | | | $1,831 | | | | $822 | |
| Ratios to average net assets(c)(d): | | | | | | | | | | | | | | | | | | | | |
| Expenses after waivers and/or expense reimbursement | | | 1.24% | | | | 1.24% | | | | 1.24% | | | | 1.24% | | | | 1.24% | |
| Expenses before waivers and/or expense reimbursement | | | 2.60% | | | | 2.55% | | | | 2.65% | | | | 3.38% | | | | 3.54% | |
| Net investment income (loss) | | | 0.98% | | | | 0.67% | | | | 1.22% | | | | 1.24% | | | | 1.09% | |
| Portfolio turnover rate(e) | | | 100% | | | | 104% | | | | 67% | | | | 51% | | | | 45% | |
| (a) | Calculated based on average shares outstanding during the year. |
| (b) | Total return does not consider the effects of sales loads. Total return is calculated assuming a purchase of a share on the first day and a sale on the last day of each year reported and includes reinvestment of dividends and distributions, if any. Total returns may reflect adjustments to conform to generally accepted accounting principles. |
| (c) | Does not include expenses of the underlying funds in which the Fund invests. |
| (d) | Effective August 1, 2017, class specific expenses include transfer agent fees and expenses and registration fees, which are charged to their respective share class. |
| (e) | The Fund’s portfolio turnover rate is calculated in accordance with regulatory requirements, without regard to transactions involving short-term investments and certain derivatives. If such transactions were included, the Fund’s portfolio turnover rate may be higher. |
See Notes to Financial Statements.
| | | | | | | | | | | | | | | | | | | | |
| Class C Shares | | | | | | | | | | | | | | | |
| | | Year Ended July 31, | |
| | | 2019(a) | | | 2018(a) | | | 2017(a) | | | 2016(a) | | | 2015 | |
| Per Share Operating Performance: | | | | | | | | | | | | | | | | | | | | |
| Net Asset Value, Beginning of Year | | | $13.80 | | | | $12.50 | | | | $11.36 | | | | $11.32 | | | | $10.33 | |
| Income (loss) from investment operations: | | | | | | | | | | | | | | | | | | | | |
| Net investment income (loss) | | | 0.04 | | | | (0.01 | ) | | | 0.06 | | | | 0.06 | | | | 0.02 | |
| Net realized and unrealized gain (loss) on investment transactions | | | 0.73 | | | | 1.40 | | | | 1.14 | | | | 0.03 | | | | 1.03 | |
| Total from investment operations | | | 0.77 | | | | 1.39 | | | | 1.20 | | | | 0.09 | | | | 1.05 | |
| Less Dividends and Distributions: | | | | | | | | | | | | | | | | | | | | |
| Dividends from net investment income | | | (0.05 | ) | | | - | (b) | | | (0.06 | ) | | | (0.05 | ) | | | (0.03 | ) |
| Distributions from net realized gains | | | (1.01 | ) | | | (0.09 | ) | | | - | | | | - | | | | (0.03 | ) |
| Total dividends and distributions | | | (1.06 | ) | | | (0.09 | ) | | | (0.06 | ) | | | (0.05 | ) | | | (0.06 | ) |
| Net asset value, end of year | | | $13.51 | | | | $13.80 | | | | $12.50 | | | | $11.36 | | | | $11.32 | |
| Total Return(c): | | | 7.40% | | | | 11.18% | | | | 10.59% | | | | 0.85% | | | | 10.23% | |
| |
| Ratios/Supplemental Data: | |
| Net assets, end of year (000) | | | $1,852 | | | | $1,831 | | | | $1,608 | | | | $1,411 | | | | $423 | |
| Average net assets (000) | | | $1,865 | | | | $1,703 | | | | $1,401 | | | | $1,160 | | | | $188 | |
| Ratios to average net assets(d)(e): | | | | | | | | | | | | | | | | | | | | |
| Expenses after waivers and/or expense reimbursement | | | 1.99% | | | | 1.99% | | | | 1.99% | | | | 1.99% | | | | 1.99% | |
| Expenses before waivers and/or expense reimbursement | | | 3.64% | | | | 3.65% | | | | 3.36% | | | | 4.02% | | | | 4.16% | |
| Net investment income (loss) | | | 0.28% | | | | (0.07)% | | | | 0.48% | | | | 0.56% | | | | 0.32% | |
| Portfolio turnover rate(f) | | | 100% | | | | 104% | | | | 67% | | | | 51% | | | | 45% | |
| (a) | Calculated based on average shares outstanding during the year. |
| (b) | Less than $(0.005) per share. |
| (c) | Total return does not consider the effects of sales loads. Total return is calculated assuming a purchase of a share on the first day and a sale on the last day of each year reported and includes reinvestment of dividends and distributions, if any. Total returns may reflect adjustments to conform to generally accepted accounting principles. |
| (d) | Does not include expenses of the underlying funds in which the Fund invests. |
| (e) | Effective August 1, 2017, class specific expenses include transfer agent fees and expenses and registration fees, which are charged to their respective share class. |
| (f) | The Fund’s portfolio turnover rate is calculated in accordance with regulatory requirements, without regard to transactions involving short-term investments and certain derivatives. If such transactions were included, the Fund’s portfolio turnover rate may be higher. |
See Notes to Financial Statements.
| | | | |
| PGIM Jennison Rising Dividend Fund | | | 41 | |
Financial Highlights(continued)
| | | | | | | | | | | | | | | | | | | | |
| Class Z Shares | | | | | | | | | | | | | | | |
| | | Year Ended July 31, | |
| | | 2019(a) | | | 2018(a) | | | 2017(a) | | | 2016(a) | | | 2015 | |
| Per Share Operating Performance: | | | | | | | | | | | | | | | | | | | | |
| Net Asset Value, Beginning of Year | | | $13.82 | | | | $12.52 | | | | $11.38 | | | | $11.33 | | | | $10.35 | |
| Income (loss) from investment operations: | | | | | | | | | | | | | | | | | | | | |
| Net investment income (loss) | | | 0.16 | | | | 0.12 | | | | 0.17 | | | | 0.16 | | | | 0.14 | |
| Net realized and unrealized gain (loss) on investment transactions | | | 0.75 | | | | 1.40 | | | | 1.15 | | | | 0.05 | | | | 1.01 | |
| Total from investment operations | | | 0.91 | | | | 1.52 | | | | 1.32 | | | | 0.21 | | | | 1.15 | |
| Less Dividends and Distributions: | | | | | | | | | | | | | | | | | | | | |
| Dividends from net investment income | | | (0.16 | ) | | | (0.13 | ) | | | (0.18 | ) | | | (0.16 | ) | | | (0.14 | ) |
| Distributions from net realized gains | | | (1.01 | ) | | | (0.09 | ) | | | - | | | | - | | | | (0.03 | ) |
| Total dividends and distributions | | | (1.17 | ) | | | (0.22 | ) | | | (0.18 | ) | | | (0.16 | ) | | | (0.17 | ) |
| Net asset value, end of year | | | $13.56 | | | | $13.82 | | | | $12.52 | | | | $11.38 | | | | $11.33 | |
| Total Return(b): | | | 8.54% | | | | 12.21% | | | | 11.68% | | | | 1.95% | | | | 11.19% | |
| |
| Ratios/Supplemental Data: | |
| Net assets, end of year (000) | | | $9,122 | | | | $8,369 | | | | $7,319 | | | | $6,349 | | | | $6,190 | |
| Average net assets (000) | | | $8,216 | | | | $8,066 | | | | $6,704 | | | | $5,935 | | | | $5,953 | |
| Ratios to average net assets(c)(d): | | | | | | | | | | | | | | | | | | | | |
| Expenses after waivers and/or expense reimbursement | | | 0.99% | | | | 0.99% | | | | 0.99% | | | | 0.99% | | | | 0.99% | |
| Expenses before waivers and/or expense reimbursement | | | 2.02% | | | | 1.98% | | | | 2.36% | | | | 3.08% | | | | 3.31% | |
| Net investment income (loss) | | | 1.25% | | | | 0.94% | | | | 1.48% | | | | 1.49% | | | | 1.33% | |
| Portfolio turnover rate(e) | | | 100% | | | | 104% | | | | 67% | | | | 51% | | | | 45% | |
| (a) | Calculated based on average shares outstanding during the year. |
| (b) | Total return is calculated assuming a purchase of a share on the first day and a sale on the last day of each year reported and includes reinvestment of dividends and distributions, if any. Total returns may reflect adjustments to conform to generally accepted accounting principles. |
| (c) | Does not include expenses of the underlying funds in which the Fund invests. |
| (d) | Effective August 1, 2017, class specific expenses include transfer agent fees and expenses and registration fees, which are charged to their respective share class. |
| (e) | The Fund’s portfolio turnover rate is calculated in accordance with regulatory requirements, without regard to transactions involving short-term investments and certain derivatives. If such transactions were included, the Fund’s portfolio turnover rate may be higher. |
See Notes to Financial Statements.
| | | | | | | | | | | | |
| Class R6 Shares | | | | | | | | | |
| | | Year Ended
July 31,
2019 | | | | | | September 27,
2017(a)
through
July 31,
2018 | |
| Per Share Operating Performance(b): | | | | | | | | | | | | |
| Net Asset Value, Beginning of Period | | | $13.81 | | | | | | | | $12.72 | |
| Income (loss) from investment operations: | | | | | | | | | | | | |
| Net investment income (loss) | | | 0.16 | | | | | | | | 0.10 | |
| Net realized and unrealized gain (loss) on investment transactions | | | 0.75 | | | | | | | | 1.18 | |
| Total from investment operations | | | 0.91 | | | | | | | | 1.28 | |
| Less Dividends and Distributions: | | | | | | | | | | | | |
| Dividends from net investment income | | | (0.16 | ) | | | | | | | (0.10 | ) |
| Distributions from net realized gains | | | (1.01 | ) | | | | | | | (0.09 | ) |
| Total dividends and distributions | | | (1.17 | ) | | | | | | | (0.19 | ) |
| Net asset value, end of period | | | $13.55 | | | | | | | | $13.81 | |
| Total Return(c): | | | 8.55% | | | | | | | | 10.10% | |
| |
| Ratios/Supplemental Data: | |
| Net assets, end of period (000) | | | $12 | | | | | | | | $11 | |
| Average net assets (000) | | | $11 | | | | | | | | $11 | |
| Ratios to average net assets(d): | | | | | | | | | | | | |
| Expenses after waivers and/or expense reimbursement | | | 0.99% | | | | | | | | 0.99% | (e) |
| Expenses before waivers and/or expense reimbursement | | | 119.91% | | | | | | | | 307.60% | (e) |
| Net investment income (loss) | | | 1.25% | | | | | | | | 0.88% | (e) |
| Portfolio turnover rate(f) | | | 100% | | | | | | | | 104% | |
| (a) | Commencement of offering. |
| (b) | Calculated based on average shares outstanding during the period. |
| (c) | Total return is calculated assuming a purchase of a share on the first day and a sale on the last day of each period reported and includes reinvestment of dividends and distributions, if any. Total returns may reflect adjustments to conform to generally accepted accounting principles. Total returns for periods less than one full year are not annualized. |
| (d) | Does not include expenses of the underlying funds in which the Fund invests. |
| (f) | The Fund’s portfolio turnover rate is calculated in accordance with regulatory requirements, without regard to transactions involving short-term investments and certain derivatives. If such transactions were included, the Fund’s portfolio turnover rate may be higher. |
See Notes to Financial Statements.
| | | | |
| PGIM Jennison Rising Dividend Fund | | | 43 | |
Report of Independent Registered Public
Accounting Firm
To the Shareholders of PGIM Jennison Rising Dividend Fund and Board of Trustees
Prudential Investment Portfolios 5:
Opinion on the Financial Statements
We have audited the accompanying statement of assets and liabilities of PGIM Jennison Rising Dividend Fund, a series of Prudential Investment Portfolios 5, (the Fund), including the schedule of investments, as of July 31, 2019, the related statement of operations for the year then ended, the statements of changes in net assets for each of the years in the two-year period then ended, and the related notes (collectively, the financial statements) and the financial highlights for each of the years or period indicated therein. In our opinion, the financial statements and financial highlights present fairly, in all material respects, the financial position of the Fund as of July 31, 2019, the results of its operations for the year then ended, the changes in its net assets for each of the years in the two-year period then ended, and the financial highlights for each of the years or period indicated therein, in conformity with U.S. generally accepted accounting principles.
Basis for Opinion
These financial statements and financial highlights are the responsibility of the Fund’s management. Our responsibility is to express an opinion on these financial statements and financial highlights based on our audits. We are a public accounting firm registered with the Public Company Accounting Oversight Board (United States) (PCAOB) and are required to be independent with respect to the Fund in accordance with the U.S. federal securities laws and the applicable rules and regulations of the Securities and Exchange Commission and the PCAOB.
We conducted our audits in accordance with the standards of the PCAOB. Those standards require that we plan and perform the audit to obtain reasonable assurance about whether the financial statements and financial highlights are free of material misstatement, whether due to error or fraud. Our audits included performing procedures to assess the risks of material misstatement of the financial statements and financial highlights, whether due to error or fraud, and performing procedures that respond to those risks. Such procedures included examining, on a test basis, evidence regarding the amounts and disclosures in the financial statements and financial highlights. Such procedures also included confirmation of securities owned as of July 31, 2019, by correspondence with the custodian, transfer agent, and brokers, or by other appropriate auditing procedures when replies were not received. Our audits also included evaluating the accounting principles used and significant estimates made by management, as well as evaluating the overall presentation of the financial statements and financial highlights. We believe that our audits provide a reasonable basis for our opinion.

We have served as the auditor of one or more PGIM and/or Prudential Retail investment companies since 2003.
New York, New York
September 19, 2019
Tax Information(unaudited)
We are advising you that during the fiscal year ended July 31, 2019, the Fund reported the maximum amount allowed per share but not less than $1.01 per share for Class A, C, Z and R6 shares as a capital gain distribution in accordance with Section 852(b)(3)(C) of the Internal Revenue Code.
For the year ended July 31, 2019, the Fund reports the maximum amount allowable under Section 854 of the Internal Revenue Code, but not less than, the following percentages of the ordinary income dividends paid as: 1) qualified dividend income (QDI); and 2) eligible for corporate dividends received deduction (DRD):
| | | | | | | | |
| | | QDI | | | DRD | |
PGIM Jennison Rising Dividend Fund | | | 100.00 | % | | | 100.00 | % |
In January 2020, you will be advised on IRS Form1099-DIV or substitute1099-DIV as to the federal tax status of the distributions received by you in calendar year 2019.
| | | | |
| PGIM Jennison Rising Dividend Fund | | | 45 | |
INFORMATION ABOUT BOARD MEMBERS AND OFFICERS(unaudited)
Information about Board Members and Officers of the Fund is set forth below. Board Members who are not deemed to be “interested persons” of the Fund, as defined in the 1940 Act, are referred to as “Independent Board Members.” Board Members who are deemed to be “interested persons” of the Fund are referred to as “Interested Board Members.” The Board Members are responsible for the overall supervision of the operations of the Fund and perform the various duties imposed on the directors of investment companies by the 1940 Act. The Board in turn elects the Officers, who are responsible for administering theday-to-day operations of the Fund.
| | | | | | |
| Independent Board Members | | | | |
| | | | |
Name Date of Birth Position(s) Portfolios Overseen | | Principal Occupation(s) During Past Five Years | | Other Directorships
Held During
Past Five Years | | Length of
Board Service |
| | | | |
Ellen S. Alberding 3/11/58 Board Member Portfolios Overseen: 96 | | President and Board Member, The Joyce Foundation (charitable foundation) (since 2002); Vice Chair, City Colleges of Chicago (community college system) (2011-2015); Trustee, National Park Foundation (charitable foundation for national park system) (2009-2018); Trustee, Economic Club of Chicago (since 2009); Trustee, Loyola University (since 2018). | | None. | | Since September 2013 |
| | | | |
Kevin J. Bannon 7/13/52 Board Member Portfolios Overseen: 96 | | Retired; Managing Director (April2008-May 2015) and Chief Investment Officer (October 2008-November 2013) of Highmount Capital LLC (registered investment adviser); formerly Executive Vice President and Chief Investment Officer (April 1993-August 2007) of Bank of New York Company; President (May2003-May 2007) of BNY Hamilton Family of Mutual Funds. | | Director of Urstadt Biddle Properties (equity real estate investment trust) (since September 2008). | | Since July 2008 |
PGIM Jennison Rising Dividend Fund
| | | | | | |
| Independent Board Members | | | | |
| | | | |
Name Date of Birth Position(s) Portfolios Overseen | | Principal Occupation(s) During Past Five Years | | Other Directorships
Held During
Past Five Years | | Length of
Board Service |
| | | | |
Linda W. Bynoe 7/9/52 Board Member Portfolios Overseen: 96 | | President and Chief Executive Officer (since March 1995) and formerly Chief Operating Officer (December 1989-February 1995) of Telemat Ltd. (management consulting); formerly Vice President (January 1985-June 1989) at Morgan Stanley & Co. (broker-dealer). | | Director of Anixter International, Inc. (communication products distributor) (since January 2006); Director of Northern Trust Corporation (financial services) (since April 2006); Trustee of Equity Residential (residential real estate) (since December 2009). | | Since March 2005 |
| | | | |
Barry H. Evans 11/2/60 Board Member Portfolios Overseen: 95 | | Retired; formerly President (2005 – 2016), Global Chief Operating Officer (2014–2016), Chief Investment Officer – Global Head of Fixed Income (1998-2014), and various portfolio manager roles (1986-2006), Manulife Asset Management U.S. | | Formerly Director, Manulife Trust Company(2011-2018); formerly Director, Manulife Asset Management Limited (2015-2017); formerly Chairman of the Board of Directors of Manulife Asset Management U.S. (2005-2016); formerly Chairman of the Board, Declaration Investment Management and Research (2008-2016). | | Since September 2017 |
| | | | |
Keith F. Hartstein 10/13/56 Board Member & Independent Chair Portfolios Overseen: 96 | | Retired; Member (since November 2014) of the Governing Council of the Independent Directors Council (organization of independent mutual fund directors); formerly President and Chief Executive Officer (2005-2012), Senior Vice President(2004-2005), Senior Vice President of Sales and Marketing (1997-2004), and various executive management positions (1990-1997), John Hancock Funds, LLC (asset management); Chairman, Investment Company Institute’s Sales Force Marketing Committee (2003-2008). | | None. | | Since September 2013 |
Visit our website at pgiminvestments.com
| | | | | | |
| Independent Board Members | | | | |
| | | | |
Name Date of Birth Position(s) Portfolios Overseen | | Principal Occupation(s) During Past Five Years | | Other Directorships
Held During
Past Five Years | | Length of
Board Service |
| | | | |
Laurie Simon Hodrick 9/29/62 Board Member Portfolios Overseen: 95 | | A. Barton Hepburn Professor Emerita of Economics in the Faculty of Business, Columbia Business School (since 2018); Visiting Professor of Law, Stanford Law School (since 2015); Visiting Fellow at the Hoover Institution, Stanford University (since 2015); Sole Member, ReidCourt LLC (since 2008) (a consulting firm); formerly A. Barton Hepburn Professor of Economics in the Faculty of Business, Columbia Business School (1996-2017); formerly Managing Director, Global Head of Alternative Investment Strategies, Deutsche Bank (2006-2008). | | Independent Director, Synnex Corporation (since April 2019) (information technology); Independent Director, Kabbage, Inc. (since July 2018) (financial services); Independent Director, Corporate Capital Trust (2017-2018) (a business development company). | | Since September 2017 |
| | | | |
Michael S. Hyland, CFA 10/4/45 Board Member Portfolios Overseen: 96 | | Retired (since February 2005); formerly Senior Managing Director (July 2001-February 2005) of Bear Stearns & Co, Inc.; Global Partner, INVESCO (1999-2001); Managing Director and President of Salomon Brothers Asset Management (1989-1999). | | None. | | Since July 2008 |
| | | | |
Brian K. Reid 9/22/61 Board Member Portfolios Overseen: 95 | | Retired; formerly Chief Economist for the Investment Company Institute (ICI) (2005-2017); formerly Senior Economist and Director of Industry and Financial Analysis at the ICI(1998-2004); formerly Senior Economist, Industry and Financial Analysis at the ICI (1996-1998); formerly Staff Economist at the Federal Reserve Board(1989-1996); Director, ICI Mutual Insurance Company (2012-2017). | | None. | | Since March 2018 |
PGIM Jennison Rising Dividend Fund
| | | | | | |
Independent Board Members | | | | |
| | | | |
Name Date of Birth Position(s) Portfolios Overseen | | Principal Occupation(s) During Past Five Years | | Other Directorships
Held During
Past Five Years | | Length of
Board Service |
| | | | |
Grace C. Torres 6/28/59 Board Member Portfolios Overseen: 95 | | Retired; formerly Treasurer and Principal Financial and Accounting Officer of the PGIM Funds, Target Funds, Advanced Series Trust, Prudential Variable Contract Accounts and The Prudential Series Fund (1998-June 2014); Assistant Treasurer (March 1999-June 2014) and Senior Vice President (September 1999-June 2014) of PGIM Investments LLC; Assistant Treasurer (May 2003-June 2014) and Vice President (June 2005-June 2014) of AST Investment Services, Inc.; Senior Vice President and Assistant Treasurer (May 2003-June 2014) of Prudential Annuities Advisory Services, Inc. | | Formerly Director (July 2015-January 2018) of Sun Bancorp, Inc. N.A. and Sun National Bank; Director (since January 2018) of OceanFirst Financial Corp. and OceanFirst Bank. | | Since November 2014 |
| | | | | | |
Interested Board Members | | | | |
| | | | |
Name Date of Birth Position(s) Portfolios Overseen | | Principal Occupation(s) During Past Five Years | | Other Directorships
Held During
Past Five Years | | Length of
Board Service |
| | | | |
Stuart S. Parker 10/5/62 Board Member & President Portfolios Overseen: 96 | | President of PGIM Investments LLC (formerly known as Prudential Investments LLC) (since January 2012); Executive Vice President of Prudential Investment Management Services LLC (since December 2012); formerly Executive Vice President of Jennison Associates LLC and Head of Retail Distribution of PGIM Investments LLC (June 2005-December 2011). | | None. | | Since January 2012 |
Visit our website at pgiminvestments.com
| | | | | | |
Interested Board Members | | | | |
| | | | |
Name Date of Birth Position(s) Portfolios Overseen | | Principal Occupation(s) During Past Five Years | | Other Directorships
Held During
Past Five Years | | Length of
Board Service |
| | | | |
Scott E. Benjamin 5/21/73 Board Member & Vice President Portfolios Overseen:96 | | Executive Vice President (since June 2009) of PGIM Investments LLC; Executive Vice President (June 2009-June 2012) and Vice President (since June 2012) of Prudential Investment Management Services LLC; Executive Vice President (since September 2009) of AST Investment Services, Inc.; Senior Vice President of Product Development and Marketing, PGIM Investments (since February 2006); formerly Vice President of Product Development and Product Management, PGIM Investments LLC (2003-2006). | | None. | | Since March 2010 |
| | | | |
| Fund Officers(a) | | | | |
| | | |
Name Date of Birth Fund Position | | Principal Occupation(s) During Past Five Years | | Length of
Service as Fund
Officer |
| | | |
Raymond A. O’Hara 9/11/55 Chief Legal Officer | | Vice President and Corporate Counsel (since July 2010) of Prudential Insurance Company of America (Prudential); Vice President (March 2011-Present) of Pruco Life Insurance Company and Pruco Life Insurance Company of New Jersey; Vice President and Corporate Counsel (March 2011-Present) of Prudential Annuities Life Assurance Corporation; Chief Legal Officer of PGIM Investments LLC (since June 2012); Chief Legal Officer of Prudential Mutual Fund Services LLC (since June 2012) and Corporate Counsel of AST Investment Services, Inc. (since June 2012); formerly Assistant Vice President and Corporate Counsel (September 2008-July 2010) of The Hartford Financial Services Group, Inc.; formerly Associate (September 1980-December 1987) and Partner (January 1988–August 2008) of Blazzard & Hasenauer, P.C. (formerly, Blazzard, Grodd & Hasenauer, P.C.). | | Since June 2012 |
PGIM Jennison Rising Dividend Fund
| | | | |
| Fund Officers(a) | | | | |
| | | |
Name Date of Birth Fund Position | | Principal Occupation(s) During Past Five Years | | Length of Service as Fund Officer |
| | | |
Dino Capasso 8/19/74 Chief Compliance Officer | | Chief Compliance Officer (July 2019-Present) of PGIM Investments LLC; Chief Compliance Officer (July 2019-Present) of the PGIM Funds, Target Funds, Advanced Series Trust, The Prudential Series Fund, Prudential’s Gibraltar Fund, Inc., PGIM Global High Yield Fund, Inc., and PGIM High Yield Bond Fund, Inc.; Vice President and Deputy Chief Compliance Officer (June 2017-2019) of PGIM Investments LLC; formerly, Senior Vice President and Senior Counsel (January 2016-June 2017), and Vice President and Counsel (February 2012-December 2015) of Pacific Investment Management Company LLC. | | Since March 2018 |
| | | |
Andrew R. French 12/22/62 Secretary | | Vice President of PGIM Investments LLC (December 2018-Present); formerly Vice President and Corporate Counsel (February 2010-December 2018) of Prudential; formerly Director and Corporate Counsel (2006-2010) of Prudential; Vice President and Assistant Secretary (since January 2007) of PGIM Investments LLC; Vice President and Assistant Secretary (since January 2007) of Prudential Mutual Fund Services LLC. | | Since October 2006 |
| | | |
Jonathan D. Shain 8/9/58 Assistant Secretary | | Vice President and Corporate Counsel (since August 1998) of Prudential; Vice President and Assistant Secretary (since May 2001) of PGIM Investments LLC; Vice President and Assistant Secretary (since February 2001) of Prudential Mutual Fund Services LLC; formerly Vice President and Assistant Secretary (May 2003-June 2005) of AST Investment Services, Inc. | | Since May 2005 |
| | | |
Claudia DiGiacomo 10/14/74 Assistant Secretary | | Vice President and Corporate Counsel (since January 2005) of Prudential; Vice President and Assistant Secretary of PGIM Investments LLC (since December 2005); formerly Associate at Sidley Austin Brown & Wood LLP (1999-2004). | | Since December 2005 |
| | | |
Diana N. Huffman 4/14/82 Assistant Secretary | | Vice President and Corporate Counsel (since September 2015) of Prudential; formerly Associate at Willkie Farr & Gallagher LLP (2009-2015). | | Since March 2019 |
| | | |
Christian J. Kelly 5/5/75 Treasurer and Principal Financial
and Accounting Officer | | Vice President, Head of Fund Administration of PGIM Investments LLC (since November 2018); formerly, Director of Fund Administration of Lord Abbett & Co. LLC (2009-2018), Treasurer and Principal Accounting Officer of the Lord Abbett Family of Funds (2017-2018); Director of Accounting, Avenue Capital Group (2008-2009); Senior Manager, Investment Management Practice of Deloitte & Touche LLP (1998-2007). | | Since January 2019 |
| | | |
Peter Parrella 8/21/58 Assistant Treasurer | | Vice President (since 2007) and Director (2004-2007) within PGIM Investments Fund Administration; formerly Tax Manager at SSB Citi Fund Management LLC (1997-2004). | | Since June 2007 |
Visit our website at pgiminvestments.com
| | | | |
| Fund Officers(a) | | | | |
| | | |
Name Date of Birth Fund Position | | Principal Occupation(s) During Past Five Years | | Length of Service as Fund Officer |
| | | |
Lana Lomuti 6/7/67 Assistant Treasurer | | Vice President (since 2007) and Director (2005-2007), within PGIM Investments Fund Administration; formerly Assistant Treasurer (December 2007-February 2014) of The Greater China Fund, Inc. | | Since April 2014 |
| | | |
Linda McMullin 7/10/61 Assistant Treasurer | | Vice President (since 2011) and Director (2008-2011) within PGIM Investments Fund Administration. | | Since April 2014 |
| | | |
Kelly A. Coyne 8/8/68 Assistant Treasurer | | Director, Investment Operations of Prudential Mutual Fund Services LLC (since 2010). | | Since March 2015 |
| | | |
Charles H. Smith 1/11/73 Anti-Money Laundering Compliance Officer | | Vice President, Corporate Compliance, Anti-Money Laundering Unit (since January 2015) of Prudential; committee member of the American Council of Life Insurers Anti-Money Laundering and Critical Infrastructure Committee (since January 2016); formerly Global Head of Economic Sanctions Compliance at AIG Property Casualty (February 2007-December 2014); Assistant Attorney General at the New York State Attorney General’s Office, Division of Public Advocacy. (August 1998-January 2007). | | Since January 2017 |
(a) Excludes Mr. Parker and Mr. Benjamin, interested Board Members who also serve as President and Vice President, respectively.
Explanatory Notes to Tables:
| ∎ | | Board Members are deemed to be “Interested,” as defined in the 1940 Act, by reason of their affiliation with PGIM Investments LLC and/or an affiliate of PGIM Investments LLC. |
| ∎ | | Unless otherwise noted, the address of all Board Members and Officers is c/o PGIM Investments LLC, 655 Broad Street, Newark, New Jersey 07102-4410. |
| ∎ | | There is no set term of office for Board Members or Officers. The Board Members have adopted a retirement policy, which calls for the retirement of Board Members on December 31 of the year in which they reach the age of 75. |
| ∎ | | “Other Directorships Held” includes only directorships of companies required to register or file reports with the SEC under the 1934 Act (that is, “public companies”) or other investment companies registered under the 1940 Act. |
| ∎ | | “Portfolios Overseen” includes all investment companies managed by PGIM Investments LLC. The investment companies for which PGIM Investments LLC serves as manager include the PGIM Funds, The Prudential Variable Contract Accounts, PGIM ETF Trust, PGIM High Yield Bond Fund, Inc., PGIM Global High Yield Fund, Inc., The Prudential Series Fund, Prudential’s Gibraltar Fund, Inc. and the Advanced Series Trust. |
PGIM Jennison Rising Dividend Fund
Approval of Advisory Agreements
The Fund’s Board of Trustees
The Board of Trustees (the “Board”) of PGIM Jennison Rising Dividend Fund (the “Fund”)1 consists of eleven individuals, nine2 of whom are not “interested persons” of the Fund, as defined in the Investment Company Act of 1940, as amended (the “1940 Act”) (the “Independent Trustees”). The Board is responsible for the oversight of the Fund and its operations, and performs the various duties imposed on the directors of investment companies by the 1940 Act. The Independent Trustees have retained independent legal counsel to assist them in connection with their duties. The Chair of the Board is an Independent Trustee. The Board has established four standing committees: the Audit Committee, the Nominating and Governance Committee, and two Investment Committees. Each committee is chaired by, and composed of, Independent Trustees.
Annual Approval of the Fund’s Advisory Agreements
As required under the 1940 Act, the Board determines annually whether to renew the Fund’s management agreement with PGIM Investments LLC (“PGIM Investments”) and the Fund’s subadvisory agreement with Jennison Associates LLC (“Jennison”). In considering the renewal of the agreements, the Board, including all of the Independent Trustees, met on May 30, 2019 and onJune 11-13, 2019 and approved the renewal of the agreements through July 31, 2020, after concluding that the renewal of the agreements was in the best interests of the Fund and its shareholders.
In advance of the meetings, the Board requested and received materials relating to the agreements, and had the opportunity to ask questions and request further information in connection with its consideration. Among other things, the Board considered comparative fee information from PGIM Investments and Jennison. Also, the Board considered comparisons with other mutual funds in relevant Peer Universes and Peer Groups, as is further discussed below.
In approving the agreements, the Board, including the Independent Trustees advised by independent legal counsel, considered the factors it deemed relevant, including the nature, quality and extent of services provided by PGIM Investments and the subadviser, the performance of the Fund, the profitability of PGIM Investments and its affiliates, expenses and fees, and the potential for economies of scale that may be shared with the Fund and its shareholders as the Fund’s assets grow. In their deliberations, the Trustees did not identify any single factor which alone was responsible for the Board’s decision to approve the agreements with respect to the Fund. In connection with its deliberations, the Board
| 1 | PGIM Jennison Rising Dividend Fund is a series of Prudential Investment Portfolios 5. |
| 2 | Grace C. Torres was an Interested Trustee of the Fund at the time the Board considered and approved the renewal of the Fund’s advisory agreements, but has since become an Independent Trustee of the Fund. |
| | |
| PGIM Jennison Rising Dividend Fund |
Approval of Advisory Agreements(continued)
considered information provided by PGIM Investments throughout the year at regular Board meetings, presentations from portfolio managers and other information, as well as information furnished at or in advance of the meetings on May 30, 2019 and onJune 11-13, 2019.
The Trustees determined that the overall arrangements between the Fund and PGIM Investments, which serves as the Fund’s investment manager pursuant to a management agreement, and between PGIM Investments and Jennison, which serves as the Fund’s subadviser pursuant to the terms of a subadvisory agreement with PGIM Investments, are in the best interests of the Fund and its shareholders in light of the services performed, fees charged and such other matters as the Trustees considered relevant in the exercise of their business judgment.
Several of the material factors and conclusions that formed the basis for the Trustees’ reaching their determinations to approve the renewal of the agreements are discussed separately below.
Nature, Quality and Extent of Services
The Board received and considered information regarding the nature, quality and extent of services provided to the Fund by PGIM Investments and Jennison. The Board noted that Jennison is affiliated with PGIM Investments. The Board considered the services provided by PGIM Investments, including but not limited to the oversight of the subadviser for the Fund, as well as the provision of fund recordkeeping, compliance and other services to the Fund, and PGIM Investments’ role as administrator for the Fund’s liquidity risk management program. With respect to PGIM Investments’ oversight of the subadviser, the Board noted that PGIM Investments’ Strategic Investment Research Group (“SIRG”), which is a business unit of PGIM Investments, is responsible for monitoring and reporting to PGIM Investments’ senior management on the performance and operations of the subadviser. The Board also considered that PGIM Investments pays the salaries of all of the officers and interested Trustees of the Fund who are part of Fund management. The Board also considered the investment subadvisory services provided by Jennison, including investment research and security selection, as well as compliance with the Fund’s investment restrictions, policies and procedures. The Board considered PGIM Investments’ evaluation of Jennison, as well as PGIM Investments’ recommendation, based on its review of Jennison, to renew the subadvisory agreement.
The Board considered the qualifications, backgrounds and responsibilities of PGIM Investments’ senior management responsible for the oversight of the Fund and Jennison, and also considered the qualifications, backgrounds and responsibilities of Jennison’s portfolio managers who are responsible for theday-to-day management of the Fund’s
| | |
| Visit our website at pgiminvestments.com | | |
portfolio. The Board was provided with information pertaining to PGIM Investments’ and Jennison’s organizational structure, senior management, investment operations, and other relevant information pertaining to both PGIM Investments and Jennison. The Board also noted that it received favorable compliance reports from the Fund’s Chief Compliance Officer (“CCO”) as to both PGIM Investments and Jennison.
The Board concluded that it was satisfied with the nature, extent and quality of the investment management services provided by PGIM Investments and the subadvisory services provided to the Fund by Jennison, and that there was a reasonable basis on which to conclude that the Fund benefits from the services provided by PGIM Investments and Jennison under the management and subadvisory agreements.
Costs of Services and Profits Realized by PGIM Investments
The Board was provided with information on the profitability of PGIM Investments and its affiliates in serving as the Fund’s investment manager. The Board discussed with PGIM Investments the methodology utilized in assembling the information regarding profitability and considered its reasonableness. The Board recognized that it is difficult to make comparisons of profitability from fund management contracts because comparative information is not generally publicly available and is affected by numerous factors, including the structure of the particular adviser, the types of funds it manages, its business mix, numerous assumptions regarding allocations and the adviser’s capital structure and cost of capital. However, the Board considered that the cost of services provided by PGIM Investments to the Fund during the year ended December 31, 2018 exceeded the management fees paid by the Fund, resulting in an operating loss to PGIM Investments. Taking these factors into account, the Board concluded that the profitability of PGIM Investments and its affiliates in relation to the services rendered was not unreasonable.
Economies of Scale
The Board received and discussed information concerning economies of scale that PGIM Investments may realize as the Fund’s assets grow beyond current levels. The Board noted that the management fee schedule for the Fund includes breakpoints, which have the effect of decreasing the fee rate as assets increase. During the course of time, the Board has considered information regarding the launch date of the Fund, the management fees of the Fund compared to those of similarly managed funds and PGIM Investments’ investment in the Fund over time. The Board noted that economies of scale can be shared with the Fund in other ways, including low management fees from inception, additional technological and personnel investments to enhance shareholder services, and maintaining existing expense structures in the face of a rising cost environment. The Board also considered PGIM Investments’ assertion that it continually evaluates the management fee
| | |
| PGIM Jennison Rising Dividend Fund |
Approval of Advisory Agreements(continued)
schedule of the Fund and the potential to share economies of scale through breakpoints or fee waivers as asset levels increase.
The Board recognized the inherent limitations of any analysis of economies of scale, stemming largely from the Board’s understanding that most of PGIM Investments’ costs are not specific to individual funds, but rather are incurred across a variety of products and services.
Other Benefits to PGIM Investments and Jennison
The Board considered potential ancillary benefits that might be received by PGIM Investments, Jennison and their affiliates as a result of their relationship with the Fund. The Board concluded that potential benefits to be derived by PGIM Investments included transfer agency fees received by the Fund’s transfer agent (which is affiliated with PGIM Investments), as well as benefits to its reputation or other intangible benefits resulting from PGIM Investments’ association with the Fund. The Board concluded that the potential benefits to be derived by Jennison included its ability to use soft dollar credits, as well as the potential benefits consistent with those generally resulting from an increase in assets under management, specifically, potential access to additional research resources and benefits to its reputation. The Board concluded that the benefits derived by PGIM Investments and Jennison were consistent with the types of benefits generally derived by investment managers and subadvisers to mutual funds.
Performance of the Fund / Fees and Expenses
The Board considered certain additional factors and made related conclusions relating to the historical performance of the Fund for theone- and three-year periods ended December 31, 2018. The Board considered that the Fund commenced operations on March 5, 2014 and that longer-term performance was not yet available.
The Board also considered the Fund’s actual management fee, as well as the Fund’s net total expense ratio, for the fiscal year ended July 31, 2018. The Board considered the management fee for the Fund as compared to the management fee charged by PGIM Investments to other funds and the fee charged by other advisers to comparable mutual funds in a Peer Group. The actual management fee represents the fee rate actually paid by Fund shareholders and includes any fee waivers or reimbursements. The net total expense ratio for the Fund represents the actual expense ratio incurred by Fund shareholders.
The mutual funds included in the Peer Universe, which was used to consider performance, and the Peer Group, which was used to consider expenses and fees, were objectively determined by Broadridge, an independent provider of mutual fund data. In certain
| | |
| Visit our website at pgiminvestments.com | | |
circumstances, PGIM Investments also provided supplemental Peer Universe or Peer Group information for reasons addressed with the Board. The comparisons placed the Fund in various quartiles over various periods, with the first quartile being the best 25% of the mutual funds (for performance, the best performing mutual funds and, for expenses, the lowest cost mutual funds).
The section below summarizes key factors considered by the Board and the Board’s conclusions regarding the Fund’s performance, fees and overall expenses. The table sets forth net performance comparisons (which reflect the impact on performance of fund expenses, or any subsidies, expense caps or waivers that may be applicable) with the Peer Universe, actual management fees with the Peer Group (which reflect the impact of any subsidies or fee waivers), and net total expenses with the Peer Group, each of which were key factors considered by the Board.
| | | | | | | | |
| Net Performance | | 1 Year | | 3 Years | | 5 Years | | 10 Years |
| | | 2nd Quartile | | 3rd Quartile | | N/A | | N/A |
| Actual Management Fees: 1st Quartile |
| Net Total Expenses: 2nd Quartile |
| | • | | The Board noted that the Fund underperformed its benchmark index for all periods. |
| | • | | The Board considered that the Fund commenced investment operations on March 5, 2014 and that longer-term performance was not yet available. |
| | • | | The Board and PGIM Investments agreed to retain the Fund’s existing contractual expense cap which (exclusive of certain fees and expenses) caps total annual operating expenses at 1.24% for Class A shares, 1.99% for Class C shares, 0.99% for Class R6 shares, and 0.99% for Class Z shares through November 30, 2019. |
| | • | | In addition, PGIM Investments will waive management fees or shared operating expenses on any share class to the same extent that it waives such expenses on any other share class, and has agreed that total annual fund operating expenses for Class R6 shares will not exceed total annual fund operating expenses for Class Z shares. |
| | • | | The Board concluded that in light of the above, it would be in the best interests of the Fund and its shareholders to renew the agreements. |
| | • | | The Board concluded that the management fees (including subadvisory fees) and total expenses were reasonable in light of the services provided. |
* * *
After full consideration of these factors, the Board concluded that the approval of the agreements was in the best interests of the Fund and its shareholders.
| | |
| PGIM Jennison Rising Dividend Fund |
| | | | |
| | |
| ∎ MAIL | | ∎ TELEPHONE | | ∎ WEBSITE |
655 Broad Street Newark, NJ 07102 | | (800) 225-1852 | | pgiminvestments.com |
|
| PROXY VOTING |
| The Board of Trustees of the Fund has delegated to the Fund’s subadviser the responsibility for voting any proxies and maintaining proxy recordkeeping with respect to the Fund. A description of these proxy voting policies and procedures is available without charge, upon request, by calling (800) 225-1852. Information regarding how the Fund voted proxies relating to portfolio securities during the most recent 12-month period ended June 30 is available on the Fund’s website and on the Commission’s website at sec.gov. |
|
| TRUSTEES |
| Ellen S. Alberding• Kevin J. Bannon• Scott E. Benjamin• Linda W. Bynoe• Barry H. Evans• Keith F. Hartstein • Laurie Simon Hodrick• Michael S. Hyland• Stuart S. Parker• Brian K. Reid• Grace C. Torres |
|
| OFFICERS |
| Stuart S. Parker,President• Scott E. Benjamin,Vice President• Christian J. Kelly,Treasurer and Principal Financial and Accounting Officer• Raymond A. O’Hara,Chief Legal Officer• Dino Capasso,Chief Compliance Officer• Andrew R. French,Secretary• Jonathan D. Shain,Assistant Secretary• Claudia DiGiacomo,Assistant Secretary• Diana N. Huffman,Assistant Secretary• Peter Parrella, Assistant Treasurer•Lana Lomuti, Assistant Treasurer•Linda McMullin, Assistant Treasurer•Kelly Coyne, Assistant Treasurer•Charles H. Smith, Anti-Money Laundering Compliance Officer |
| | | | |
| MANAGER | | PGIM Investments LLC | | 655 Broad Street
Newark, NJ 07102 |
|
| SUBADVISER | | Jennison Associates LLC | | 466 Lexington Avenue
New York, NY 10017 |
|
| DISTRIBUTOR | | Prudential Investment
Management Services LLC | | 655 Broad Street Newark, NJ 07102 |
|
| CUSTODIAN | | The Bank of New York Mellon | | 240 Greenwich Street
New York, NY 10286 |
|
| TRANSFER AGENT | | Prudential Mutual Fund
Services LLC | | PO Box 9658
Providence, RI 02940 |
|
INDEPENDENT REGISTERED
PUBLIC ACCOUNTING FIRM | | KPMG LLP | | 345 Park Avenue New York, NY 10154 |
|
| FUND COUNSEL | | Willkie Farr & Gallagher LLP | | 787 Seventh Avenue
New York, NY 10019 |
|
|
| An investor should consider the investment objectives, risks, charges, and expenses of the Fund carefully before investing. The prospectus and summary prospectus contain this and other information about the Fund. An investor may obtain a prospectus and summary prospectus by visiting our website atpgiminvestments.com or by calling(800) 225-1852. The prospectus and summary prospectus should be read carefully before investing. |
|
| E-DELIVERY |
| To receive your mutual fund documents online, go topgiminvestments.com/edelivery and enroll. Instead of receiving printed documents by mail, you will receive notification via email when new materials are available. You can cancel your enrollment or change your email address at any time byvisiting the website address above. |
|
| SHAREHOLDER COMMUNICATIONS WITH TRUSTEES |
| Shareholders can communicate directly with the Board of Trustees by writing to the Chair of the Board, PGIM Jennison Rising Dividend Fund, PGIM Investments, Attn: Board of Trustees, 655 Broad Street, Newark, NJ 07102. Shareholders can communicate directly with an individual Trustee by writing to the same address. Communications are not screened before being delivered to the addressee. |
|
| AVAILABILITY OF PORTFOLIO SCHEDULE |
The Fund files its complete schedule of portfolio holdings with the Securities and Exchange Commission on Form N-PORT. The Fund’s Form N-PORT filings are available on the Commission’s website atsec.gov. Form N-PORT is filed with the Commission quarterly, and each Fund’s full portfolio holdings as of the first and third fiscal quarter-ends (as of the third month of the Fund’s fiscal quarter for reporting periods on or after September 30, 2019) will be made publicly available 60 days after the end of each quarter atsec.gov. |
|
| The Fund’s Statement of Additional Information contains additional information about the Fund’s Trustees and is available without charge, upon request, by calling (800) 225-1852. |
Mutual Funds:
| | | | |
| ARE NOT INSURED BY THE FDIC OR ANY FEDERAL GOVERNMENT AGENCY | | MAY LOSE VALUE | | ARE NOT A DEPOSIT OF OR GUARANTEED BY ANY BANK OR ANY BANK AFFILIATE |
PGIM JENNISON RISING DIVIDEND FUND
| | | | | | | | |
| SHARE CLASS | | A | | C | | Z | | R6 |
| NASDAQ | | PJDAX | | PJDCX | | PJDZX | | PJDQX |
| CUSIP | | 74440V823 | | 74440V815 | | 74440V799 | | 74440V682 |
MF220 E

PRUDENTIAL DAY ONE FUNDS
ANNUAL REPORT
JULY 31, 2019
COMING SOON: PAPERLESS SHAREHOLDER REPORTS
Beginning on January 1, 2021, as permitted by regulations adopted by the Securities and Exchange Commission, paper copies of the Fund’s annual and semiannual shareholder reports will no longer be sent by mail, unless you specifically request paper copies of the reports. Instead, the reports will be made available on the Fund’s website (pgiminvestments.com), and you will be notified by mail each time a report is posted and provided with a website link to access the report.
If you already elected to receive shareholder reports electronically, you will not be affected by this change and you need not take any action. You may elect to receive shareholder reports and other communications from the Fund electronically anytime by contacting your financial intermediary (such as a broker-dealer or bank) or, if you are a direct investor, by calling 1-800-225-1852 or by sending an email request to PGIM Investments at shareholderreports@pgim.com.
You may elect to receive all future reports in paper free of charge. If you invest through a financial intermediary, you can contact your financial intermediary or follow instructions included with this notice to elect to continue to receive paper copies of your shareholder reports. If you invest directly with the Fund, you can call 1-800-225-1852 or send an email request to shareholderreports@pgim.com to let the Fund know you wish to continue receiving paper copies of your shareholder reports. Your election to receive reports in paper will apply to all funds held in your account if you invest through your financial intermediary or all funds held with the fund complex if you invest directly with the Fund.

To enroll in e-delivery, go to pgiminvestments.com/edelivery
|
| Objective: Seek a balance between growth and conservation of capital |
Highlights
| • | | During the 12-month reporting period that ended July 31, 2019, returns for R6 shares of the Prudential Day One Funds ranged from 1.39% for the Prudential Day One 2060 Fund to 5.33% for the Prudential Day One Income Fund. |
| • | | Through investment in underlying funds, the Prudential Day One Funds have an overall bias toward US stocks relative to non-US stocks. Higher exposure to US stocks contributed to the Funds’ overall results, as US stocks—with the exception of US small-cap stocks—outperformed by a significant margin during the period. |
| • | | Also, through investment in underlying funds, the Funds’ overall allocation to commodities, US small-cap stocks, and non-US stocks detracted from performance, as these asset classes turned in negative returns for the period. |
This report is not authorized for distribution to prospective investors unless preceded or accompanied by a current prospectus.
The views expressed in this report and information about the Fund’s portfolio holdings are for the period covered by this report and are subject to change thereafter.
Mutual funds are distributed by Prudential Investment Management Services LLC, a Prudential Financial company and member SIPC. QMA is the primary business name for QMA LLC, a wholly owned subsidiary of PGIM, Inc. (PGIM), a Prudential Financial company.© 2019 Prudential Financial, Inc. and its related entities. PGIM and the PGIM logo are service marks of Prudential Financial, Inc. and its related entities, registered in many jurisdictions worldwide.
| | |
| 2 | | Visit our website at pgiminvestments.com |
Prudential Day One Funds
TABLE OF CONTENTS
| | | | |
| Prudential Day One Funds | | | 3 | |
This Page Intentionally Left Blank
Letter from the President

Dear Shareholder:
We hope you find the annual report for the Prudential Day One Funds informative and useful. The report covers performance for the 12-month period that ended July 31, 2019.
While the US economy remained healthy, with rising corporate profits and strong job growth, the Federal Reserve cut interest rates on the last day of the period for the first time since the Great Recession more than a decade ago. After nine rate increases in recent years, the cut was a proactive attempt by the Fed to extend the longest domestic economic expansion on record as growth in many other regions weakened. China in particular showed signs of slowing amid trade tensions with the US, and turmoil in the United Kingdom continued as it negotiated an exit from the European Union.
Despite the growing US economy, volatility returned to the equity markets during the period. After corporate tax cuts and regulatory reforms helped boost US stocks early in the period, equities declined significantly at the end of 2018 on concerns about China’s economy, a potential global trade war, higher interest rates, and worries that profit growth might slow. Stocks reversed course early in 2019, rising sharply after the Fed moderated its position on additional rate hikes for the remainder of the year. For the period overall, large-cap US equities rose while small-cap US stocks fell. Stocks also declined in developed foreign and emerging markets.
The overall US bond market posted strong returns during the period on a significant rally in interest rates that saw the 10-year US Treasury yield decline from around 3% to 2%. Investment grade corporate bonds led the way with a double-digit gain, while corporate high yield and municipal bonds each had a high single-digit return. Globally, bonds in developed markets delivered solid returns, while emerging markets debt also posted positive results. A continuing trend during the period was the inversion of a portion of the US Treasury yield curve, as the yield on certain shorter maturities exceeded the yield on the 10-year bond.
Regarding your investments with PGIM, we believe it is important to maintain a diversified portfolio of funds consistent with your tolerance for risk, time horizon, and financial goals. Your financial advisor can help you create a diversified investment plan that may include funds covering all the basic asset classes and that reflects your personal investor profile and risk tolerance. However, diversification and asset allocation strategies do not assure a profit or protect against loss in declining markets.
At PGIM Investments, we consider it a great privilege and responsibility to help investors participate in opportunities across global markets while meeting their toughest investment challenges. PGIM is atop-10 global investment manager with more than $1 trillion in assets under management. This scale and investment expertise allow us to deliver actively managed funds and strategies to meet the needs of investors around the globe.
Thank you for choosing our family of funds.
Sincerely,

Stuart S. Parker, President
Prudential Day One Funds
September 16, 2019
| | | | |
| Prudential Day One Funds | | | 5 | |
Prudential Day One Income Fund
Your Fund’s Performance(unaudited)
Performance data quoted represent past performance. Past performance does not guarantee future results. The investment return and principal value of an investment will fluctuate, so that an investor’s shares, when redeemed, may be worth more or less than their original cost. Current performance may be lower or higher than the past performance data quoted. An investor may obtain performance data as of the most recent month-end by visiting our website atpgiminvestments.com or by calling(800) 225-1852.
| | | | |
| |
| | | Average Annual Total Returns as of 7/31/19 |
| | | One Year (%) | | Since Inception (%) |
| Class R1 | | 4.46 | | 4.60 (12/13/16) |
| Class R2 | | 4.72 | | 4.83 (12/13/16) |
| Class R3 | | 4.87 | | 5.01 (12/13/16) |
| Class R4 | | 5.06 | | 5.15 (12/13/16) |
| Class R5 | | 5.09 | | 5.22 (12/13/16) |
| Class R6 | | 5.33 | | 5.43 (12/13/16) |
| Prudential Day One Income Custom Benchmark |
| | 5.65 | | 5.60 |
| Lipper Mixed-Asset Target Today Funds Average |
| | 5.20 | | 5.55 |
| S&P Target Date Retirement Income Index |
| | | 5.27 | | 5.77 |
Source: PGIM Investments LLC and Lipper Inc.
The returns in the table do not reflect the deduction of taxes that a shareholder would pay on Fund distributions or following the redemption of Fund shares. Since Inception returns are provided since the Fund has less than 10 fiscal years of returns. Since Inception returns for the Indexes and the Lipper Average are measured from the closest month-end to the Fund’s inception date.
| | |
| 6 | | Visit our website at pgiminvestments.com |
Growth of a $10,000 Investment
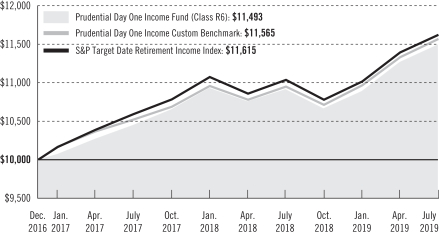
The graph compares a $10,000 investment in the Prudential Day One Income Fund’s Class R6 shares with a similar investment in the Prudential Day One Income Custom Benchmark and S&P Target Date Retirement Income Index (Index) over time periods ending at the end of the current fiscal year (July 31, 2019). The R6 share class assumes an initial investment on December 13, 2016, while the Custom Benchmark and the Index assume that the initial investment occurred on November 30, 2016. For purposes of the graph, and unless otherwise indicated, it has been assumed that (a) all recurring fees (including management fees) were deducted; and (b) all dividends and distributions were reinvested. The line graph provides information for Class R6 shares only. As indicated in the tables provided earlier, performance for Class R1, Class R2, Class R3, Class R4 and Class R5 shares will vary due to the differing fees and expenses applicable to each share class (as indicated in the following paragraphs). Without waiver of fees and/or expense reimbursements, the returns would have been lower.
Past performance does not predict future performance. Total returns and the ending account values in the graph include changes in share price and reinvestment of dividends and capital gains distributions in a hypothetical investment for the periods shown. The Fund’s total returns do not reflect the deduction of income taxes on an individual’s investment. Taxes may reduce your actual investment returns on income or gains paid by the Fund or any gains you may realize if you sell your shares.
| | | | |
| Prudential Day One Funds | | | 7 | |
Prudential Day One Income Fund
Your Fund’s Performance(continued)
The average annual total returns take into account applicable charges and fees, which are described for each share class in the table below.
| | | | | | | | | | | | |
| | | | | | | |
| | | Class R1 | | Class R2 | | Class R3 | | Class R4 | | Class R5 | | Class R6 |
| Maximum initial sales charge | | None | | None | | None | | None | | None | | None |
| Contingent deferred sales charge (CDSC) (as a percentage of the lower of original purchase price or net asset value at redemption) | | None | | None | | None | | None | | None | | None |
| Annual distribution or distribution and service (12b-1) fees (shown as a percentage of average daily net assets) | | 0.50% | | 0.25% | | 0.10% | | None | | None | | None |
| Shareholder service fees | | 0.10% | | 0.10% | | 0.10% | | 0.10% | | None | | None |
Benchmark Definitions
Prudential Day One Income Custom Benchmark—The Prudential Day One Income Custom Benchmark reflects the normal weighted average of the underlying funds’ stock/non-traditional assets/bond/cash allocation, as represented by the S&P 1500 Composite Index, FTSE Developed ex-North America Index1,2, MSCI Emerging Markets Net Index, Bloomberg Barclays US Treasury Inflation-Protected Securities (TIPS) Index, Bloomberg Barclays US Aggregate Bond Index, FTSE 3-Month T-Bill1, Bloomberg Commodity Index, and the FTSE EPRA/NAREIT Developed Real Estate Net Index1. Because the asset allocation of the Fund changes over time with the glide path, the custom benchmark allocations also change over time. All indices are unmanaged.
Lipper Mixed-Asset Target Today Funds Average—The Lipper Mixed-Asset Target Today Funds (Lipper Average) are funds that by portfolio practice, maintain a conservative mix of equity, bonds, cash, and cash equivalents designed to provide income to investors who are in or close to retirement.
S&P Target Date® Retirement Income Index—The S&P Target Date Series comprises 11 multi-asset class indices, each corresponding to a particular target retirement date. Each index provides varying levels of exposure to equities and fixed income. Each target date allocation is created and retired according to a predetermined schedule related to the respective target date.
Investors cannot invest directly in an index or average. The returns for the Indexes would be lower if they included the effects of sales charges, operating expenses of a mutual fund, or taxes. Returns for the Lipper Average reflect the deduction of operating expenses, but not sales charges or taxes.
| | |
| 8 | | Visit our website at pgiminvestments.com |
Presentation of Fund Holdings
| | | | | | |
Prudential Day One Income Fund Ten Largest Holdings | | Asset Class | | % of Net Assets | |
| PGIM TIPS Fund | | TIPS | | | 26.1 | % |
| PGIM Total Return Bond Fund | | Total Return Bond | | | 15.1 | % |
| PGIM Core Conservative Bond Fund | | Core Bond | | | 14.0 | % |
| PGIM QMALarge-Cap Core Equity Fund | | Large Cap | | | 10.9 | % |
| PGIM Global Real Estate Fund | | Real Estate | | | 5.9 | % |
| PGIM QMA US Broad Market Index Fund | | Broad Market | | | 5.9 | % |
| PGIM QMA Commodity Strategies Fund | | Commodity | | | 5.0 | % |
| PGIM QMA International Developed Markets Index Fund | | International Developed Markets | | | 5.0 | % |
| PGIM QMAMid-Cap Core Equity Fund | | Mid Cap | | | 1.0 | % |
| PGIM JennisonSmall-Cap Core Equity Fund | | Small Cap | | | 1.0 | % |
For a complete list of holdings, please refer to the Schedule of Investments section of this report. Holdings reflect only long-term Investments. Holdings/Issues/Industries/Sectors are subject to change.
| | | | |
| Prudential Day One Funds | | | 9 | |
Prudential Day One 2010 Fund
Your Fund’s Performance(unaudited)
Performance data quoted represent past performance. Past performance does not guarantee future results. The investment return and principal value of an investment will fluctuate, so that an investor’s shares, when redeemed, may be worth more or less than their original cost. Current performance may be lower or higher than the past performance data quoted. An investor may obtain performance data as of the most recent month-end by visiting our website atpgiminvestments.com or by calling (800) 225-1852.
| | | | |
| |
| | | Average Annual Total Returns as of 7/31/19 |
| | | One Year (%) | | Since Inception (%) |
| Class R1 | | 4.58 | | 4.90 (12/13/16) |
| Class R2 | | 4.85 | | 5.14 (12/13/16) |
| Class R3 | | 5.01 | | 5.29 (12/13/16) |
| Class R4 | | 5.02 | | 5.38 (12/13/16) |
| Class R5 | | 5.13 | | 5.50 (12/13/16) |
| Class R6 | | 5.30 | | 5.66 (12/13/16) |
| Prudential Day One 2010 Custom Benchmark |
| | 5.73 | | 5.80 |
| Lipper Mixed-Asset Target 2010 Funds Average |
| | 5.09 | | 6.27 |
| S&P Target Date 2010 Index |
| | | 5.05 | | 6.37 |
Source: PGIM Investments LLC and Lipper Inc.
The returns in the table do not reflect the deduction of taxes that a shareholder would pay on Fund distributions or following the redemption of Fund shares. Since Inception returns are provided since the Fund has less than 10 fiscal years of returns. Since Inception returns for the Indexes and the Lipper Average are measured from the closest month-end to the Fund’s inception date.
| | |
| 10 | | Visit our website at pgiminvestments.com |
Growth of a $10,000 Investment
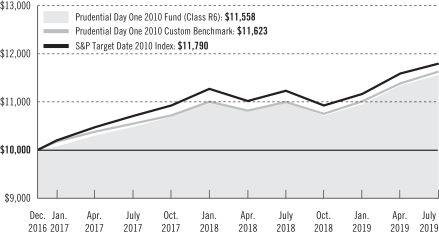
The graph compares a $10,000 investment in the Prudential Day One 2010 Fund’s Class R6 shares with a similar investment in the Prudential Day One 2010 Custom Benchmark and S&P Target Date 2010 Index (Index) over time periods ending at the end of the current fiscal year (July 31, 2019). The R6 share class assumes an initial investment on December 13, 2016, while the Custom Benchmark and the Index assume that the initial investment occurred on November 30, 2016. For purposes of the graph, and unless otherwise indicated, it has been assumed that (a) all recurring fees (including management fees) were deducted; and (b) all dividends and distributions were reinvested. The line graph provides information for Class R6 shares only. As indicated in the tables provided earlier, performance for Class R1, Class R2, Class R3, Class R4 and Class R5 shares will vary due to the differing fees and expenses applicable to each share class (as indicated in the following paragraphs). Without waiver of fees and/or expense reimbursements, the returns would have been lower.
Past performance does not predict future performance. Total returns and the ending account values in the graph include changes in share price and reinvestment of dividends and capital gains distributions in a hypothetical investment for the periods shown. The Fund’s total returns do not reflect the deduction of income taxes on an individual’s investment. Taxes may reduce your actual investment returns on income or gains paid by the Fund or any gains you may realize if you sell your shares.
| | | | |
| Prudential Day One Funds | | | 11 | |
Prudential Day One 2010 Fund
Your Fund’s Performance(continued)
The average annual total returns take into account applicable charges and fees, which are described for each share class in the table below.
| | | | | | | | | | | | |
| | | | | | | |
| | | Class R1 | | Class R2 | | Class R3 | | Class R4 | | Class R5 | | Class R6 |
| Maximum initial sales charge | | None | | None | | None | | None | | None | | None |
| Contingent deferred sales charge (CDSC) (as a percentage of the lower of original purchase price or net asset value at redemption) | | None | | None | | None | | None | | None | | None |
| Annual distribution or distribution and service (12b-1) fees (shown as a percentage of average daily net assets) | | 0.50% | | 0.25% | | 0.10% | | None | | None | | None |
| Shareholder service fees | | 0.10% | | 0.10% | | 0.10% | | 0.10% | | None | | None |
Benchmark Definitions
Prudential Day One 2010 Custom Benchmark—The Prudential Day One 2010 Custom Benchmark reflects the normal weighted average of the underlying funds’ stock/non-traditional assets/bond/cash allocation, as represented by the S&P 1500 Composite Index, FTSE Developed ex-North America Index,1,2, MSCI Emerging Markets Net Index, Bloomberg Barclays US Treasury Inflation-Protected Securities (TIPS) Index, Bloomberg Barclays US Aggregate Bond Index, FTSE 3-Month T-Bill1, Bloomberg Commodity Index, and the FTSE EPRA/NAREIT Developed Real Estate Net Index1. Because the asset allocation of the Fund changes over time with the Glidepath, the custom benchmark allocations also change over time. All indices are unmanaged.
Lipper Mixed-Asset Target 2010 Funds Average—The Lipper Mixed-Asset Target 2010 Funds (Lipper Average) are funds that seek to maximize assets for retirement or other purposes with an expected time horizon not exceeding December 31, 2010.
S&P Target Date® 2010 Index—The S&P Target Date Series comprises 11 multi-asset class indices, each corresponding to a particular target retirement date. Each index provides varying levels of exposure to equities and fixed income. Each target date allocation is created and retired according to a predetermined schedule related to the respective target date.
Investors cannot invest directly in an index or average. The returns for the Indexes would be lower if they included the effects of sales charges, operating expenses of a mutual fund, or taxes. Returns for the Lipper Average reflect the deduction of operating expenses, but not sales charges or taxes.
| | |
| 12 | | Visit our website at pgiminvestments.com |
Presentation of Fund Holdings
| | | | | | |
Prudential Day One 2010 Fund Ten Largest Holdings | | Asset Class | | % of Net Assets | |
| PGIM TIPS Fund | | TIPS | | | 26.1 | % |
| PGIM Total Return Bond Fund | | Total Return Bond | | | 15.1 | % |
| PGIM Core Conservative Bond Fund | | Core Bond | | | 14.0 | % |
| PGIM QMALarge-Cap Core Equity Fund | | Large Cap | | | 11.9 | % |
| PGIM Global Real Estate Fund | | Real Estate | | | 5.9 | % |
| PGIM QMA US Broad Market Index Fund | | Broad Market | | | 5.9 | % |
| PGIM QMA Commodity Strategies Fund | | Commodity | | | 5.0 | % |
| PGIM QMA International Developed Markets Index Fund | | International Developed Markets | | | 5.0 | % |
| PGIM QMAMid-Cap Core Equity Fund | | Mid Cap | | | 1.0 | % |
| PGIM JennisonSmall-Cap Core Equity Fund | | Small Cap | | | 1.0 | % |
For a complete list of holdings, please refer to the Schedule of Investments section of this report. Holdings reflect only long-term Investments. Holdings/Issues/Industries/Sectors are subject to change.
| | | | |
| Prudential Day One Funds | | | 13 | |
Prudential Day One 2015 Fund
Your Fund’s Performance(unaudited)
Performance data quoted represent past performance. Past performance does not guarantee future results. The investment return and principal value of an investment will fluctuate, so that an investor’s shares, when redeemed, may be worth more or less than their original cost. Current performance may be lower or higher than the past performance data quoted. An investor may obtain performance data as of the most recent month-end by visiting our website atpgiminvestments.com or by calling (800) 225-1852.
| | | | |
| |
| | | Average Annual Total Returns as of 7/31/19 |
| | | One Year (%) | | Since Inception (%) |
| Class R1 | | 4.17 | | 5.17 (12/13/16) |
| Class R2 | | 4.34 | | 5.41 (12/13/16) |
| Class R3 | | 4.50 | | 5.57 (12/13/16) |
| Class R4 | | 4.62 | | 5.66 (12/13/16) |
| Class R5 | | 4.82 | | 5.81 (12/13/16) |
| Class R6 | | 4.89 | | 5.93 (12/13/16) |
| Prudential Day One 2015 Custom Benchmark |
| | 5.49 | | 6.25 |
| Lipper Mixed-Asset Target 2015 Funds Average |
| | 4.94 | | 6.81 |
| S&P Target Date 2015 Index |
| | | 4.81 | | 7.01 |
Source: PGIM Investments LLC and Lipper Inc.
The returns in the table do not reflect the deduction of taxes that a shareholder would pay on Fund distributions or following the redemption of Fund shares. Since Inception returns are provided since the Fund has less than 10 fiscal years of returns. Since Inception returns for the Indexes and the Lipper Average are measured from the closest month-end to the Fund’s inception date.
| | |
| 14 | | Visit our website at pgiminvestments.com |
Growth of a $10,000 Investment
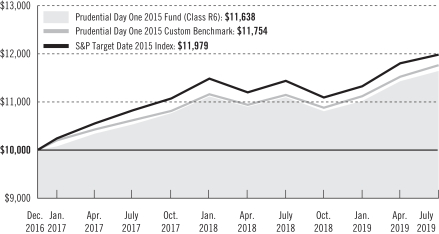
The graph compares a $10,000 investment in the Prudential Day One 2015 Fund’s Class R6 shares with a similar investment in the Prudential Day One 2015 Custom Benchmark and S&P Target Date 2015 Index (Index) over time periods ending at the end of the current fiscal year (July 31, 2019). The R6 share class assumes an initial investment on December 13, 2016, while the Custom Benchmark and the Index assume that the initial investment occurred on November 30, 2016. For purposes of the graph, and unless otherwise indicated, it has been assumed that (a) all recurring fees (including management fees) were deducted; and (b) all dividends and distributions were reinvested. The line graph provides information for Class R6 shares only. As indicated in the tables provided earlier, performance for Class R1, Class R2, Class R3, Class R4 and Class R5 shares will vary due to the differing fees and expenses applicable to each share class (as indicated in the following paragraphs). Without waiver of fees and/or expense reimbursements, the returns would have been lower.
Past performance does not predict future performance. Total returns and the ending account values in the graph include changes in share price and reinvestment of dividends and capital gains distributions in a hypothetical investment for the periods shown. The Fund’s total returns do not reflect the deduction of income taxes on an individual’s investment. Taxes may reduce your actual investment returns on income or gains paid by the Fund or any gains you may realize if you sell your shares.
| | | | |
| Prudential Day One Funds | | | 15 | |
Prudential Day One 2015 Fund
Your Fund’s Performance(continued)
The average annual total returns take into account applicable charges and fees, which are described for each share class in the table below.
| | | | | | | | | | | | |
| | | | | | | |
| | | Class R1 | | Class R2 | | Class R3 | | Class R4 | | Class R5 | | Class R6 |
| Maximum initial sales charge | | None | | None | | None | | None | | None | | None |
| Contingent deferred sales charge (CDSC) (as a percentage of the lower of original purchase price or net asset value at redemption) | | None | | None | | None | | None | | None | | None |
| Annual distribution or distribution and service (12b-1) fees (shown as a percentage of average daily net assets) | | 0.50% | | 0.25% | | 0.10% | | None | | None | | None |
| Shareholder service fees | | 0.10% | | 0.10% | | 0.10% | | 0.10% | | None | | None |
Benchmark Definitions
Prudential Day One 2015 Custom Benchmark—The Prudential Day One 2015 Custom Benchmark reflects the normal weighted average of the underlying funds’ stock/non-traditional assets/bond/cash allocation, as represented by the S&P 1500 Composite Index, FTSE Developed ex-North America Index1,2, MSCI Emerging Markets Net Index, Bloomberg Barclays US Treasury Inflation-Protected Securities (TIPS) Index, Bloomberg Barclays US Aggregate Bond Index, FTSE 3-Month T-Bill1, Bloomberg Commodity Index, and the FTSE EPRA/NAREIT Developed Real Estate Net Index1. Because the asset allocation of the Fund changes over time with the Glidepath, the custom benchmark allocations also change over time. All indices are unmanaged.
Lipper Mixed-Asset Target 2015 Funds Average—The Lipper Mixed-Asset Target 2015 Funds (Lipper Average) are funds that seek to maximize assets for retirement or other purposes with an expected time horizon from January 1, 2011 to December 31, 2015.
S&P Target Date® 2015 Index—The S&P Target Date Series comprises 11 multi-asset class indices, each corresponding to a particular target retirement date. Each index provides varying levels of exposure to equities and fixed income. Each target date allocation is created and retired according to a predetermined schedule related to the respective target date.
Investors cannot invest directly in an index or average. The returns for the Indexes would be lower if they included the effects of sales charges, operating expenses of a mutual fund, or taxes. Returns for the Lipper Average reflect the deduction of operating expenses, but not sales charges or taxes.
| | |
| 16 | | Visit our website at pgiminvestments.com |
Presentation of Fund Holdings
| | | | | | |
Prudential Day One 2015 Fund Ten Largest Holdings | | Asset Class | | % of Net Assets | |
| PGIM TIPS Fund | | TIPS | | | 24.1 | % |
| PGIM Total Return Bond Fund | | Total Return Bond | | | 14.1 | % |
| PGIM Core Conservative Bond Fund | | Core Bond | | | 13.1 | % |
| PGIM QMALarge-Cap Core Equity Fund | | Large Cap | | | 12.9 | % |
| PGIM QMA US Broad Market Index Fund | | Broad Market | | | 6.9 | % |
| PGIM Global Real Estate Fund | | Real Estate | | | 5.9 | % |
| PGIM QMA International Developed Markets Index Fund | | International Developed Markets | | | 5.9 | % |
| PGIM QMA Commodity Strategies Fund | | Commodity | | | 5.0 | % |
| PGIM QMAMid-Cap Core Equity Fund | | Mid Cap | | | 2.0 | % |
| PGIM JennisonSmall-Cap Core Equity Fund | | Small Cap | | | 1.0 | % |
For a complete list of holdings, please refer to the Schedule of Investments section of this report. Holdings reflect only long-term Investments. Holdings/Issues/Industries/Sectors are subject to change.
| | | | |
| Prudential Day One Funds | | | 17 | |
Prudential Day One 2020 Fund
Your Fund’s Performance(unaudited)
Performance data quoted represent past performance. Past performance does not guarantee future results. The investment return and principal value of an investment will fluctuate, so that an investor’s shares, when redeemed, may be worth more or less than their original cost. Current performance may be lower or higher than the past performance data quoted. An investor may obtain performance data as of the most recent month-end by visiting our website atpgiminvestments.com or by calling (800) 225-1852.
| | | | |
| |
| | | Average Annual Total Returns as of 7/31/19 |
| | | One Year (%) | | Since Inception (%) |
| Class R1 | | 4.19 | | 5.59 (12/13/16) |
| Class R2 | | 4.47 | | 5.83 (12/13/16) |
| Class R3 | | 4.63 | | 6.02 (12/13/16) |
| Class R4 | | 4.64 | | 6.14 (12/13/16) |
| Class R5 | | 4.75 | | 6.23 (12/13/16) |
| Class R6 | | 4.93 | | 6.25 (12/13/16) |
| Prudential Day One 2020 Custom Benchmark |
| | 5.58 | | 6.77 |
| Lipper Mixed-Asset Target 2020 Funds Average |
| | 4.76 | | 6.96 |
| S&P Target Date 2020 Index |
| | | 4.66 | | 7.62 |
Source: PGIM Investments LLC and Lipper Inc.
The returns in the table do not reflect the deduction of taxes that a shareholder would pay on Fund distributions or following the redemption of Fund shares. Since Inception returns are provided since the Fund has less than 10 fiscal years of returns. Since Inception returns for the Indexes and the Lipper Average are measured from the closest month-end to the Fund’s inception date.
| | |
| 18 | | Visit our website at pgiminvestments.com |
Growth of a $10,000 Investment
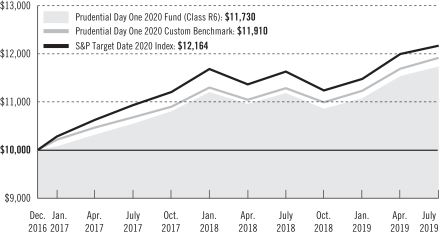
The graph compares a $10,000 investment in the Prudential Day One 2020 Fund’s Class R6 shares with a similar investment in the Prudential Day One 2020 Custom Benchmark and S&P Target Date 2020 Index (Index) over time periods ending at the end of the current fiscal year (July 31, 2019). The R6 share class assumes an initial investment on December 13, 2016, while the Custom Benchmark and the Index assume that the initial investment occurred on November 30, 2016. For purposes of the graph, and unless otherwise indicated, it has been assumed that (a) all recurring fees (including management fees) were deducted; and (b) all dividends and distributions were reinvested. The line graph provides information for Class R6 shares only. As indicated in the tables provided earlier, performance for Class R1, Class R2, Class R3, Class R4 and Class R5 shares will vary due to the differing fees and expenses applicable to each share class (as indicated in the following paragraphs). Without waiver of fees and/or expense reimbursements, the returns would have been lower.
Past performance does not predict future performance. Total returns and the ending account values in the graph include changes in share price and reinvestment of dividends and capital gains distributions in a hypothetical investment for the periods shown. The Fund’s total returns do not reflect the deduction of income taxes on an individual’s investment. Taxes may reduce your actual investment returns on income or gains paid by the Fund or any gains you may realize if you sell your shares.
| | | | |
| Prudential Day One Funds | | | 19 | |
Prudential Day One 2020 Fund
Your Fund’s Performance(continued)
The average annual total returns take into account applicable charges and fees, which are described for each share class in the table below.
| | | | | | | | | | | | |
| | | | | | | |
| | | Class R1 | | Class R2 | | Class R3 | | Class R4 | | Class R5 | | Class R6 |
| Maximum initial sales charge | | None | | None | | None | | None | | None | | None |
| Contingent deferred sales charge (CDSC) (as a percentage of the lower of original purchase price or net asset value at redemption) | | None | | None | | None | | None | | None | | None |
| Annual distribution or distribution and service (12b-1) fees (shown as a percentage of average daily net assets) | | 0.50% | | 0.25% | | 0.10% | | None | | None | | None |
| Shareholder service fees | | 0.10% | | 0.10% | | 0.10% | | 0.10% | | None | | None |
Benchmark Definitions
Prudential Day One 2020 Custom Benchmark—The Prudential Day One 2020 Custom Benchmark reflects the normal weighted average of the underlying funds’ stock/non-traditional assets/bond/cash allocation, as represented by the S&P 1500 Composite Index, FTSE Developed ex-North America Index1,2, MSCI Emerging Markets Net Index, Bloomberg Barclays US Treasury Inflation-Protected Securities (TIPS) Index, Bloomberg Barclays US Aggregate Bond Index, FTSE 3-Month T-Bill1, Bloomberg Commodity Index, and the FTSE EPRA/NAREIT Developed Real Estate Net Index1. Because the asset allocation of the Fund changes over time with the Glidepath, the custom benchmark allocations also change over time. All indices are unmanaged.
Lipper Mixed-Asset Target 2020 Funds Average—The Lipper Mixed-Asset Target 2020 Funds (Lipper Average) are funds that seek to maximize assets for retirement or other purposes with an expected time horizon from January 1, 2016 to December 31, 2020.
S&P Target Date® 2020 Index—The S&P Target Date Series comprises 11 multi-asset class indices, each corresponding to a particular target retirement date. Each index provides varying levels of exposure to equities and fixed income. Each target date allocation is created and retired according to a predetermined schedule related to the respective target date.
Investors cannot invest directly in an index or average. The returns for the Indexes would be lower if they included the effects of sales charges, operating expenses of a mutual fund, or taxes. Returns for the Lipper Average reflect the deduction of operating expenses, but not sales charges or taxes.
| | |
| 20 | | Visit our website at pgiminvestments.com |
Presentation of Fund Holdings
| | | | | | |
Prudential Day One 2020 Fund Ten Largest Holdings | | Asset Class | | % of Net Assets | |
| PGIM TIPS Fund | | TIPS | | | 22.1 | % |
| PGIM QMALarge-Cap Core Equity Fund | | Large Cap | | | 16.8 | % |
| PGIM Total Return Bond Fund | | Total Return Bond | | | 12.1 | % |
| PGIM Core Conservative Bond Fund | | Core Bond | | | 12.1 | % |
| PGIM QMA US Broad Market Index Fund | | Broad Market | | | 7.9 | % |
| PGIM QMA International Developed Markets Index Fund | | International Developed Markets | | | 6.9 | % |
| PGIM Global Real Estate Fund | | Real Estate | | | 6.0 | % |
| PGIM QMA Commodity Strategies Fund | | Commodity | | | 5.0 | % |
| PGIM QMAMid-Cap Core Equity Fund | | Mid Cap | | | 2.0 | % |
| PGIM JennisonSmall-Cap Core Equity Fund | | Small Cap | | | 1.0 | % |
For a complete list of holdings, please refer to the Schedule of Investments section of this report. Holdings reflect only long-term Investments. Holdings/Issues/Industries/Sectors are subject to change.
| | | | |
| Prudential Day One Funds | | | 21 | |
Prudential Day One 2025 Fund
Your Fund’s Performance(unaudited)
Performance data quoted represent past performance. Past performance does not guarantee future results. The investment return and principal value of an investment will fluctuate, so that an investor’s shares, when redeemed, may be worth more or less than their original cost. Current performance may be lower or higher than the past performance data quoted. An investor may obtain performance data as of the most recent month-end by visiting our website atpgiminvestments.com or by calling (800) 225-1852.
| | | | |
| |
| | | Average Annual Total Returns as of 7/31/19 |
| | | One Year (%) | | Since Inception (%) |
| Class R1 | | 3.73 | | 6.05 (12/13/16) |
| Class R2 | | 4.09 | | 6.33 (12/13/16) |
| Class R3 | | 4.17 | | 6.49 (12/13/16) |
| Class R4 | | 4.27 | | 6.58 (12/13/16) |
| Class R5 | | 4.29 | | 6.66 (12/13/16) |
| Class R6 | | 4.55 | | 6.89 (12/13/16) |
| Prudential Day One 2025 Custom Benchmark |
| | 5.18 | | 7.49 |
| Lipper Mixed-Asset Target 2025 Funds Average |
| | 4.55 | | 7.83 |
| S&P Target Date 2025 Index |
| | | 4.33 | | 8.34 |
Source: PGIM Investments LLC and Lipper Inc.
The returns in the table do not reflect the deduction of taxes that a shareholder would pay on Fund distributions or following the redemption of Fund shares. Since Inception returns are provided since the Fund has less than 10 fiscal years of returns. Since Inception returns for the Indexes and the Lipper Average are measured from the closest month-end to the Fund’s inception date.
| | |
| 22 | | Visit our website at pgiminvestments.com |
Growth of a $10,000 Investment
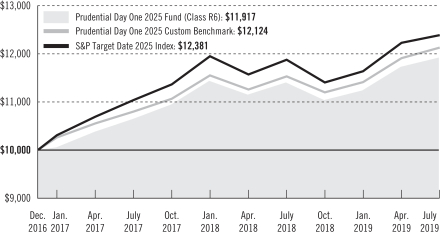
The graph compares a $10,000 investment in the Prudential Day One 2025 Fund’s Class R6 shares with a similar investment in the Prudential Day One 2025 Custom Benchmark and S&P Target Date 2025 Index (Index) over time periods ending at the end of the current fiscal year (July 31, 2019). The R6 share class assumes an initial investment on December 13, 2016, while the Custom Benchmark and the Index assume that the initial investment occurred on November 30, 2016. For purposes of the graph, and unless otherwise indicated, it has been assumed that (a) all recurring fees (including management fees) were deducted; and (b) all dividends and distributions were reinvested. The line graph provides information for Class R6 shares only. As indicated in the tables provided earlier, performance for Class R1, Class R2, Class R3, Class R4 and Class R5 shares will vary due to the differing fees and expenses applicable to each share class (as indicated in the following paragraphs). Without waiver of fees and/or expense reimbursements, the returns would have been lower.
Past performance does not predict future performance. Total returns and the ending account values in the graph include changes in share price and reinvestment of dividends and capital gains distributions in a hypothetical investment for the periods shown. The Fund’s total returns do not reflect the deduction of income taxes on an individual’s investment. Taxes may reduce your actual investment returns on income or gains paid by the Fund or any gains you may realize if you sell your shares.
| | | | |
| Prudential Day One Funds | | | 23 | |
Prudential Day One 2025 Fund
Your Fund’s Performance(continued)
The average annual total returns take into account applicable charges and fees, which are described for each share class in the table below.
| | | | | | | | | | | | |
| | | | | | | |
| | | Class R1 | | Class R2 | | Class R3 | | Class R4 | | Class R5 | | Class R6 |
| Maximum initial sales charge | | None | | None | | None | | None | | None | | None |
| Contingent deferred sales charge (CDSC) (as a percentage of the lower of original purchase price or net asset value at redemption) | | None | | None | | None | | None | | None | | None |
| Annual distribution or distribution and service (12b-1) fees (shown as a percentage of average daily net assets) | | 0.50% | | 0.25% | | 0.10% | | None | | None | | None |
| Shareholder service fees | | 0.10% | | 0.10% | | 0.10% | | 0.10% | | None | | None |
Benchmark Definitions
Prudential Day One 2025 Custom Benchmark—The Prudential Day One 2025 Custom Benchmark reflects the normal weighted average of the underlying funds’ stock/non-traditional assets/bond/cash allocation, as represented by the S&P 1500 Composite Index, FTSE Developed ex-North America Index,1,2, MSCI Emerging Markets Net Index, Bloomberg Barclays US Treasury Inflation-Protected Securities (TIPS) Index, Bloomberg Barclays US Aggregate Bond Index, FTSE 3-Month T-Bill1, Bloomberg Commodity Index, and the FTSE EPRA/NAREIT Developed Real Estate Net Index1. Because the asset allocation of the Fund changes over time with the Glidepath, the custom benchmark allocations also change over time. All indices are unmanaged.
Lipper Mixed-Asset Target 2025 Funds Average—The Lipper Mixed-Asset Target 2025 Funds (Lipper Average) are funds that seek to maximize assets for retirement or other purposes with an expected time horizon from January 1, 2021 to December 31, 2025.
S&P Target Date® 2025 Index—The S&P Target Date Series comprises 11 multi-asset class indices, each corresponding to a particular target retirement date. Each index provides varying levels of exposure to equities and fixed income. Each target date allocation is created and retired according to a predetermined schedule related to the respective target date.
Investors cannot invest directly in an index or average. The returns for the Indexes would be lower if they included the effects of sales charges, operating expenses of a mutual fund, or taxes. Returns for the Lipper Average reflect the deduction of operating expenses, but not sales charges or taxes.
| | |
| 24 | | Visit our website at pgiminvestments.com |
Presentation of Fund Holdings
| | | | | | |
Prudential Day One 2025 Fund Ten Largest Holdings | | Asset Class | | % of Net Assets | |
| PGIM TIPS Fund | | TIPS | | | 20.1 | % |
| PGIM QMALarge-Cap Core Equity Fund | | Large Cap | | | 18.8 | % |
| PGIM Total Return Bond Fund | | Total Return Bond | | | 13.1 | % |
| PGIM Core Conservative Bond Fund | | Core Bond | | | 9.1 | % |
| PGIM QMA International Developed Markets Index Fund | | International Developed Markets | | | 8.9 | % |
| PGIM QMA US Broad Market Index Fund | | Broad Market | | | 8.9 | % |
| PGIM Global Real Estate Fund | | Real Estate | | | 6.0 | % |
| PGIM QMA Commodity Strategies Fund | | Commodity | | | 5.0 | % |
| PGIM QMAMid-Cap Core Equity Fund | | Mid Cap | | | 2.0 | % |
| PGIM JennisonSmall-Cap Core Equity Fund | | Small Cap | | | 1.0 | % |
For a complete list of holdings, please refer to the Schedule of Investments section of this report. Holdings reflect only long-term Investments. Holdings/Issues/Industries/Sectors are subject to change.
| | | | |
| Prudential Day One Funds | | | 25 | |
Prudential Day One 2030 Fund
Your Fund’s Performance(unaudited)
Performance data quoted represent past performance. Past performance does not guarantee future results. The investment return and principal value of an investment will fluctuate, so that an investor’s shares, when redeemed, may be worth more or less than their original cost. Current performance may be lower or higher than the past performance data quoted. An investor may obtain performance data as of the most recent month-end by visiting our website atpgiminvestments.com or by calling (800) 225-1852.
| | | | |
| |
| | | Average Annual Total Returns as of 7/31/19 |
| | | One Year (%) | | Since Inception (%) |
| Class R1 | | 3.18 | | 7.24 (12/13/16) |
| Class R2 | | 3.46 | | 7.52 (12/13/16) |
| Class R3 | | 3.63 | | 7.65 (12/13/16) |
| Class R4 | | 3.56 | | 7.70 (12/13/16) |
| Class R5 | | 3.76 | | 7.85 (12/13/16) |
| Class R6 | | 3.93 | | 8.05 (12/13/16) |
| Prudential Day One 2030 Custom Benchmark |
| | 4.83 | | 8.88 |
| Lipper Mixed-Asset Target 2030 Funds Average |
| | 4.11 | | 8.63 |
| S&P Target Date 2030 Index |
| | | 3.92 | | 8.98 |
Source: PGIM Investments LLC and Lipper Inc.
The returns in the table do not reflect the deduction of taxes that a shareholder would pay on Fund distributions or following the redemption of Fund shares. Since Inception returns are provided since the Fund has less than 10 fiscal years of returns. Since Inception returns for the Indexes and the Lipper Average are measured from the closest month-end to the Fund’s inception date.
| | |
| 26 | | Visit our website at pgiminvestments.com |
Growth of a $10,000 Investment
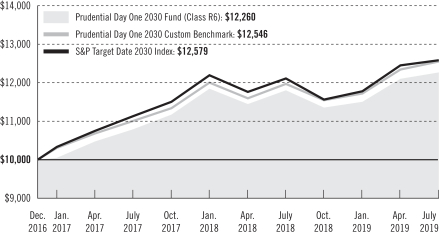
The graph compares a $10,000 investment in the Prudential Day One 2030 Fund’s Class R6 shares with a similar investment in the Prudential Day One 2030 Custom Benchmark and S&P Target Date 2030 Index (Index) over time periods ending at the end of the current fiscal year (July 31, 2019). The R6 share class assumes an initial investment on December 13, 2016, while the Custom Benchmark and the Index assume that the initial investment occurred on November 30, 2016. For purposes of the graph, and unless otherwise indicated, it has been assumed that (a) all recurring fees (including management fees) were deducted; and (b) all dividends and distributions were reinvested. The line graph provides information for Class R6 shares only. As indicated in the tables provided earlier, performance for Class R1, Class R2, Class R3, Class R4 and Class R5 shares will vary due to the differing fees and expenses applicable to each share class as indicated in the following paragraphs. Without waiver of fees and/or expense reimbursements, the returns would have been lower.
Past performance does not predict future performance. Total returns and the ending account values in the graph include changes in share price and reinvestment of dividends and capital gains distributions in a hypothetical investment for the periods shown. The Fund’s total returns do not reflect the deduction of income taxes on an individual’s investment. Taxes may reduce your actual investment returns on income or gains paid by the Fund or any gains you may realize if you sell your shares.
| | | | |
| Prudential Day One Funds | | | 27 | |
Prudential Day One 2030 Fund
Your Fund’s Performance(continued)
The average annual total returns take into account applicable charges and fees, which are described for each share class in the table below.
| | | | | | | | | | | | |
| | | | | | | |
| | | Class R1 | | Class R2 | | Class R3 | | Class R4 | | Class R5 | | Class R6 |
| Maximum initial sales charge | | None | | None | | None | | None | | None | | None |
| Contingent deferred sales charge (CDSC) (as a percentage of the lower of original purchase price or net asset value at redemption) | | None | | None | | None | | None | | None | | None |
| Annual distribution or distribution and service (12b-1) fees (shown as a percentage of average daily net assets) | | 0.50% | | 0.25% | | 0.10% | | None | | None | | None |
| Shareholder service fees | | 0.10% | | 0.10% | | 0.10% | | 0.10% | | None | | None |
Benchmark Definitions
Prudential Day One 2030 Custom Benchmark—The Prudential Day One 2030 Custom Benchmark reflects the normal weighted average of the underlying funds’ stock/non-traditional assets/bond/cash allocation, as represented by the S&P 1500 Composite Index, FTSE Developed ex-North America Index1,2, MSCI Emerging Markets Net Index, Bloomberg Barclays US Treasury Inflation-Protected Securities (TIPS) Index, Bloomberg Barclays US Aggregate Bond Index, FTSE 3-Month T-Bill1, Bloomberg Commodity Index, and the FTSE EPRA/NAREIT Developed Real Estate Net Index1. Because the asset allocation of the Fund changes over time with the Glidepath, the custom benchmark allocations also change over time. All indices are unmanaged.
Lipper Mixed-Asset Target 2030 Funds Average—The Lipper Mixed-Asset Target 2030 Funds (Lipper Average) are funds that seek to maximize assets for retirement or other purposes with an expected time horizon from January 1, 2026 to December 31, 2030.
S&P Target Date® 2030 Index—The S&P Target Date Series comprises 11 multi-asset class indices, each corresponding to a particular target retirement date. Each index provides varying levels of exposure to equities and fixed income. Each target date allocation is created and retired according to a predetermined schedule related to the respective target date.
Investors cannot invest directly in an index or average. The returns for the Indexes would be lower if they included the effects of sales charges, operating expenses of a mutual fund, or taxes. Returns for the Lipper Average reflect the deduction of operating expenses, but not sales charges or taxes.
| | |
| 28 | | Visit our website at pgiminvestments.com |
Presentation of Fund Holdings
| | | | | | |
Prudential Day One 2030 Fund Ten Largest Holdings | | Asset Class | | % of Net Assets | |
| PGIM QMALarge-Cap Core Equity Fund | | Large Cap | | | 25.8 | % |
| PGIM QMA US Broad Market Index Fund | | Broad Market | | | 12.9 | % |
| PGIM TIPS Fund | | TIPS | | | 12.1 | % |
| PGIM Total Return Bond Fund | | Total Return Bond | | | 11.1 | % |
| PGIM QMA International Developed Markets Index Fund | | International Developed Markets | | | 10.9 | % |
| PGIM Core Conservative Bond Fund | | Core Bond | | | 7.1 | % |
| PGIM Global Real Estate Fund | | Real Estate | | | 6.0 | % |
| PGIM QMA Commodity Strategies Fund | | Commodity | | | 4.0 | % |
| PGIM QMAMid-Cap Core Equity Fund | | Mid Cap | | | 3.0 | % |
| PGIM QMA Emerging Markets Equity Fund | | Emerging Markets | | | 1.0 | % |
For a complete list of holdings, please refer to the Schedule of Investments section of this report. Holdings reflect only long-term Investments. Holdings/Issues/Industries/Sectors are subject to change.
| | | | |
| Prudential Day One Funds | | | 29 | |
Prudential Day One 2035 Fund
Your Fund’s Performance(unaudited)
Performance data quoted represent past performance. Past performance does not guarantee future results. The investment return and principal value of an investment will fluctuate, so that an investor’s shares, when redeemed, may be worth more or less than their original cost. Current performance may be lower or higher than the past performance data quoted. An investor may obtain performance data as of the most recent month-end by visiting our website atpgiminvestments.com or by calling (800) 225-1852.
| | | | |
| |
| | | Average Annual Total Returns as of 7/31/19 |
| | | One Year (%) | | Since Inception (%) |
| Class R1 | | 2.55 | | 7.63 (12/13/16) |
| Class R2 | | 2.84 | | 7.88 (12/13/16) |
| Class R3 | | 3.01 | | 8.07 (12/13/16) |
| Class R4 | | 3.12 | | 8.20 (12/13/16) |
| Class R5 | | 3.15 | | 8.25 (12/13/16) |
| Class R6 | | 3.23 | | 8.41 (12/13/16) |
| Prudential Day One 2035 Custom Benchmark | | |
| | 4.80 | | 9.78 |
| Lipper Mixed-Asset Target 2035 Funds Average | | |
| | 3.65 | | 9.53 |
| S&P Target Date 2035 Index |
| | | 3.49 | | 9.57 |
Source: PGIM Investments LLC and Lipper Inc.
The returns in the table do not reflect the deduction of taxes that a shareholder would pay on Fund distributions or following the redemption of Fund shares. Since Inception returns are provided since the Fund has less than 10 fiscal years of returns. Since Inception returns for the Indexes and the Lipper Average are measured from the closest month-end to the Fund’s inception date.
| | |
| 30 | | Visit our website at pgiminvestments.com |
Growth of a $10,000 Investment
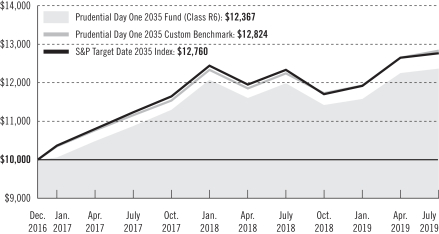
The graph compares a $10,000 investment in the Prudential Day One 2035 Fund’s Class R6 shares with a similar investment in the Prudential Day One 2035 Custom Benchmark and S&P Target Date 2035 Index (Index) over time periods ending at the end of the current fiscal year (July 31, 2019). The R6 share class assumes an initial investment on December 13, 2016, while the Custom Benchmark and the Index assume that the initial investment occurred on November 30, 2016. For purposes of the graph, and unless otherwise indicated, it has been assumed that (a) all recurring fees (including management fees) were deducted; and (b) all dividends and distributions were reinvested. The line graph provides information for Class R6 shares only. As indicated in the tables provided earlier, performance for Class R1, Class R2, Class R3, Class R4 and Class R5 shares will vary due to the differing fees and expenses applicable to each share class (as indicated in the following paragraphs). Without waiver of fees and/or expense reimbursements, the returns would have been lower.
Past performance does not predict future performance. Total returns and the ending account values in the graph include changes in share price and reinvestment of dividends and capital gains distributions in a hypothetical investment for the periods shown. The Fund’s total returns do not reflect the deduction of income taxes on an individual’s investment. Taxes may reduce your actual investment returns on income or gains paid by the Fund or any gains you may realize if you sell your shares.
| | | | |
| Prudential Day One Funds | | | 31 | |
Prudential Day One 2035 Fund
Your Fund’s Performance(continued)
The average annual total returns take into account applicable charges and fees, which are described for each share class in the table below.
| | | | | | | | | | | | |
| | | | | | | |
| | | Class R1 | | Class R2 | | Class R3 | | Class R4 | | Class R5 | | Class R6 |
| Maximum initial sales charge | | None | | None | | None | | None | | None | | None |
| Contingent deferred sales charge (CDSC) (as a percentage of the lower of original purchase price or net asset value at redemption) | | None | | None | | None | | None | | None | | None |
| Annual distribution or distribution and service (12b-1) fees (shown as a percentage of average daily net assets) | | 0.50% | | 0.25% | | 0.10% | | None | | None | | None |
| Shareholder service fees | | 0.10% | | 0.10% | | 0.10% | | 0.10% | | None | | None |
Benchmark Definitions
Prudential Day One 2035 Custom Benchmark—The Prudential Day One 2035 Custom Benchmark reflects the normal weighted average of the underlying funds’ stock/non-traditional assets/bond/cash allocation, as represented by the S&P 1500 Composite Index, FTSE Developed ex-North America Index1,2, MSCI Emerging Markets Net Index, Bloomberg Barclays US Treasury Inflation-Protected Securities (TIPS) Index, Bloomberg Barclays US Aggregate Bond Index, FTSE 3-Month T-Bill1, Bloomberg Commodity Index, and the FTSE EPRA/NAREIT Developed Real Estate Net Index1. Because the asset allocation of the Fund changes over time with the Glidepath, the custom benchmark allocations also change over time. All indices are unmanaged.
Lipper Mixed-Asset Target 2035 Funds Average—The Lipper Mixed-Asset Target 2035 Funds (Lipper Average) are funds that seek to maximize assets for retirement or other purposes with an expected time horizon from January 1, 2031 to December 31, 2035.
S&P Target Date® 2035 Index—The S&P Target Date Series comprises 11 multi-asset class indices, each corresponding to a particular target retirement date. Each index provides varying levels of exposure to equities and fixed income. Each target date allocation is created and retired according to a predetermined schedule related to the respective target date.
Investors cannot invest directly in an index or average. The returns for the Indexes would be lower if they included the effects of sales charges, operating expenses of a mutual fund, or taxes. Returns for the Lipper Average reflect the deduction of operating expenses, but not sales charges or taxes.
| | |
| 32 | | Visit our website at pgiminvestments.com |
Presentation of Fund Holdings
| | | | | | |
Prudential Day One 2035 Fund Ten Largest Holdings | | Asset Class | | % of Net Assets | |
| PGIM QMALarge-Cap Core Equity Fund | | Large Cap | | | 28.8 | % |
| PGIM QMA US Broad Market Index Fund | | Broad Market | | | 15.9 | % |
| PGIM QMA International Developed Markets Index Fund | | International Developed Markets | | | 13.0 | % |
| PGIM Total Return Bond Fund | | Total Return Bond | | | 9.1 | % |
| PGIM TIPS Fund | | TIPS | | | 8.1 | % |
| PGIM Core Conservative Bond Fund | | Core Bond | | | 5.0 | % |
| PGIM Global Real Estate Fund | | Real Estate | | | 5.0 | % |
| PGIM QMA Commodity Strategies Fund | | Commodity | | | 4.0 | % |
| PGIM QMAMid-Cap Core Equity Fund | | Mid Cap | | | 4.0 | % |
| PGIM QMA Emerging Markets Equity Fund | | Emerging Markets | | | 3.0 | % |
For a complete list of holdings, please refer to the Schedule of Investments section of this report. Holdings reflect only long-term Investments. Holdings/Issues/Industries/Sectors are subject to change.
| | | | |
| Prudential Day One Funds | | | 33 | |
Prudential Day One 2040 Fund
Your Fund’s Performance(unaudited)
Performance data quoted represent past performance. Past performance does not guarantee future results. The investment return and principal value of an investment will fluctuate, so that an investor’s shares, when redeemed, may be worth more or less than their original cost. Current performance may be lower or higher than the past performance data quoted. An investor may obtain performance data as of the most recent month-end by visiting our website atpgiminvestments.com or by calling (800) 225-1852.
| | | | |
| |
| | | Average Annual Total Returns as of 7/31/19 |
| | | One Year (%) | | Since Inception (%) |
| Class R1 | | 2.28
| | 8.10 (12/13/16) |
| Class R2 | | 2.65 | | 8.39 (12/13/16) |
| Class R3 | | 2.73 | | 8.54 (12/13/16) |
| Class R4 | | 2.84 | | 8.67 (12/13/16) |
| Class R5 | | 2.87 | | 8.75 (12/13/16) |
| Class R6 | | 3.13 | | 8.95 (12/13/16) |
| Prudential Day One 2040 Custom Benchmark |
| | 4.68 | | 10.38 |
Lipper Mixed-Asset Target 2040 Funds Average | | |
| | 3.31 | | 9.75 |
| S&P Target Date 2040 Index |
| | | 3.25 | | 10.00 |
Source: PGIM Investments LLC and Lipper Inc.
The returns in the table do not reflect the deduction of taxes that a shareholder would pay on Fund distributions or following the redemption of Fund shares. Since Inception returns are provided since the Fund has less than 10 fiscal years of returns. Since Inception returns for the Indexes and the Lipper Average are measured from the closest month-end to the Fund’s inception date.
| | |
| 34 | | Visit our website at pgiminvestments.com |
Growth of a $10,000 Investment
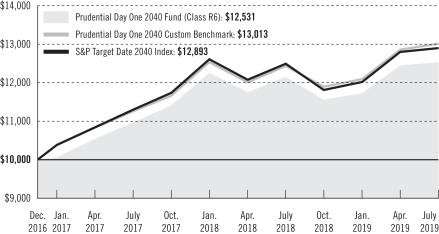
The graph compares a $10,000 investment in the Prudential Day One 2040 Fund’s Class R6 shares with a similar investment in the Prudential Day One 2040 Custom Benchmark and S&P Target Date 2040 Index (Index) over time periods ending at the end of the current fiscal year (July 31, 2019). The R6 share class assumes an initial investment on December 13, 2016, while the Custom Benchmark and the Index assume that the initial investment occurred on November 30, 2016. For purposes of the graph, and unless otherwise indicated, it has been assumed that (a) all recurring fees (including management fees) were deducted; and (b) all dividends and distributions were reinvested. The line graph provides information for Class R6 shares only. As indicated in the tables provided earlier, performance for Class R1, Class R2, Class R3, Class R4 and Class R5 shares will vary due to the differing fees and expenses applicable to each share class (as indicated in the following paragraphs). Without waiver of fees and/or expense reimbursements, the returns would have been lower.
Past performance does not predict future performance. Total returns and the ending account values in the graph include changes in share price and reinvestment of dividends and capital gains distributions in a hypothetical investment for the periods shown. The Fund’s total returns do not reflect the deduction of income taxes on an individual’s investment. Taxes may reduce your actual investment returns on income or gains paid by the Fund or any gains you may realize if you sell your shares.
| | | | |
| Prudential Day One Funds | | | 35 | |
Prudential Day One 2040 Fund
Your Fund’s Performance(continued)
The average annual total returns take into account applicable charges and fees, which are described for each share class in the table below.
| | | | | | | | | | | | |
| | | | | | | |
| | | Class R1 | | Class R2 | | Class R3 | | Class R4 | | Class R5 | | Class R6 |
| Maximum initial sales charge | | None | | None | | None | | None | | None | | None |
| Contingent deferred sales charge (CDSC) (as a percentage of the lower of original purchase price or net asset value at redemption) | | None | | None | | None | | None | | None | | None |
| Annual distribution or distribution and service (12b-1) fees (shown as a percentage of average daily net assets) | | 0.50% | | 0.25% | | 0.10% | | None | | None | | None |
| Shareholder service fees | | 0.10% | | 0.10% | | 0.10% | | 0.10% | | None | | None |
Benchmark Definitions
Prudential Day One 2040 Custom Benchmark—The Prudential Day One 2040 Custom Benchmark reflects the normal weighted average of the underlying funds’ stock/non-traditional assets/bond/cash allocation, as represented by the S&P 1500 Composite Index, FTSE Developed ex-North America Index1,2, MSCI Emerging Markets Net Index, Bloomberg Barclays US Treasury Inflation-Protected Securities (TIPS) Index, Bloomberg Barclays US Aggregate Bond Index, FTSE 3-Month T-Bill1, Bloomberg Commodity Index, and the FTSE EPRA/NAREIT Developed Real Estate Net Index1. Because the asset allocation of the Fund changes over time with the Glidepath, the custom benchmark allocations also change over time. All indices are unmanaged.
Lipper Mixed-Asset Target 2040 Funds Average—The Lipper Mixed-Asset Target 2040 Funds (Lipper Average) are funds that seek to maximize assets for retirement or other purposes with an expected time horizon from January 1, 2036 to December 31, 2040.
S&P Target Date® 2040 Index—The S&P Target Date Series comprises 11 multi-asset class indices, each corresponding to a particular target retirement date. Each index provides varying levels of exposure to equities and fixed income. Each target date allocation is created and retired according to a predetermined schedule related to the respective target date.
Investors cannot invest directly in an index or average. The returns for the Indexes would be lower if they included the effects of sales charges, operating expenses of a mutual fund, or taxes. Returns for the Lipper Average reflect the deduction of operating expenses, but not sales charges or taxes.
| | |
| 36 | | Visit our website at pgiminvestments.com |
Presentation of Fund Holdings
| | | | | | |
Prudential Day One 2040 Fund Ten Largest Holdings | | Asset Class | | % of Net Assets | |
| PGIM QMALarge-Cap Core Equity Fund | | Large Cap | | | 28.9 | % |
| PGIM QMA US Broad Market Index Fund | | Broad Market | | | 15.9 | % |
| PGIM QMA International Developed Markets Index Fund | | International Developed Markets | | | 15.0 | % |
| PGIM Total Return Bond Fund | | Total Return Bond | | | 8.1 | % |
| PGIM QMAMid-Cap Core Equity Fund | | Mid Cap | | | 6.0 | % |
| PGIM TIPS Fund | | TIPS | | | 5.0 | % |
| PGIM Global Real Estate Fund | | Real Estate | | | 5.0 | % |
| PGIM Core Conservative Bond Fund | | Core Bond | | | 4.0 | % |
| PGIM QMA Commodity Strategies Fund | | Commodity | | | 4.0 | % |
| PGIM QMA Emerging Markets Equity Fund | | Emerging Markets | | | 4.0 | % |
For a complete list of holdings, please refer to the Schedule of Investments section of this report. Holdings reflect only long-term Investments. Holdings/Issues/Industries/Sectors are subject to change.
| | | | |
| Prudential Day One Funds | | | 37 | |
Prudential Day One 2045 Fund
Your Fund’s Performance(unaudited)
Performance data quoted represent past performance. Past performance does not guarantee future results. The investment return and principal value of an investment will fluctuate, so that an investor’s shares, when redeemed, may be worth more or less than their original cost. Current performance may be lower or higher than the past performance data quoted. An investor may obtain performance data as of the most recent month-end by visiting our website atpgiminvestments.com or by calling (800) 225-1852.
| | | | |
| |
| | | Average Annual Total Returns as of 7/31/19 |
| | | One Year (%) | | Since Inception (%) |
| Class R1 | | 1.78 | | 8.24 (12/13/16) |
| Class R2 | | 1.99 | | 8.53 (12/13/16) |
| Class R3 | | 2.26 | | 8.69 (12/13/16) |
| Class R4 | | 2.29 | | 8.78 (12/13/16) |
| Class R5 | | 2.41 | | 8.90 (12/13/16) |
| Class R6 | | 2.50 | | 9.10 (12/13/16) |
| Prudential Day One 2045 Custom Benchmark | | |
| | 4.39 | | 10.67 |
| Lipper Mixed-Asset Target 2045 Funds Average | | |
| | 3.09 | | 10.20 |
| S&P Target Date 2045 Index | | |
| | | 3.07 | | 10.24 |
Source: PGIM Investments LLC and Lipper Inc.
The returns in the table do not reflect the deduction of taxes that a shareholder would pay on Fund distributions or following the redemption of Fund shares. Since Inception returns are provided since the Fund has less than 10 fiscal years of returns. Since Inception returns for the Indexes and the Lipper Average are measured from the closest month-end to the Fund’s inception date.
| | |
| 38 | | Visit our website at pgiminvestments.com |
Growth of a $10,000 Investment
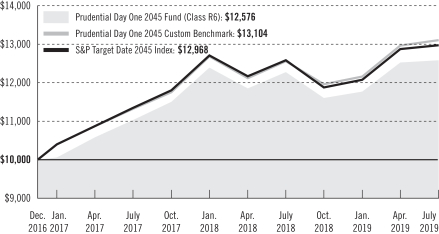
The graph compares a $10,000 investment in the Prudential Day One 2045 Fund’s Class R6 shares with a similar investment in the Prudential Day One 2045 Custom Benchmark and S&P Target Date 2045 Index (Index) over time periods ending at the end of the current fiscal year (July 31, 2019). The R6 share class assumes an initial investment on December 13, 2016, while the Custom Benchmark and the Index assume that the initial investment occurred on November 30, 2016. For purposes of the graph, and unless otherwise indicated, it has been assumed that (a) all recurring fees (including management fees) were deducted; and (b) all dividends and distributions were reinvested. The line graph provides information for Class R6 shares only. As indicated in the tables provided earlier, performance for Class R1, Class R2, Class R3, Class R4 and Class R5 shares will vary due to the differing fees and expenses applicable to each share class (as indicated in the following paragraphs). Without waiver of fees and/or expense reimbursements, the returns would have been lower.
Past performance does not predict future performance. Total returns and the ending account values in the graph include changes in share price and reinvestment of dividends and capital gains distributions in a hypothetical investment for the periods shown. The Fund’s total returns do not reflect the deduction of income taxes on an individual’s investment. Taxes may reduce your actual investment returns on income or gains paid by the Fund or any gains you may realize if you sell your shares.
| | | | |
| Prudential Day One Funds | | | 39 | |
Prudential Day One 2045 Fund
Your Fund’s Performance(continued)
The average annual total returns take into account applicable charges and fees, which are described for each share class in the table below.
| | | | | | | | | | | | |
| | | | | | | |
| | | Class R1 | | Class R2 | | Class R3 | | Class R4 | | Class R5 | | Class R6 |
| Maximum initial sales charge | | None | | None | | None | | None | | None | | None |
| Contingent deferred sales charge (CDSC) (as a percentage of the lower of original purchase price or net asset value at redemption) | | None | | None | | None | | None | | None | | None |
| Annual distribution or distribution and service (12b-1) fees (shown as a percentage of average daily net assets) | | 0.50% | | 0.25% | | 0.10% | | None | | None | | None |
| Shareholder service fees | | 0.10% | | 0.10% | | 0.10% | | 0.10% | | None | | None |
Benchmark Definitions
Prudential Day One 2045 Custom Benchmark—The Prudential Day One 2045 Custom Benchmark reflects the normal weighted average of the underlying funds’ stock/non-traditional assets/bond/cash allocation, as represented by the S&P 1500 Composite Index, FTSE Developed ex-North America Index1,2, MSCI Emerging Markets Net Index, Bloomberg Barclays US Treasury Inflation-Protected Securities (TIPS) Index, Bloomberg Barclays US Aggregate Bond Index, FTSE 3-Month T-Bill1, Bloomberg Commodity Index, and the FTSE EPRA/NAREIT Developed Real Estate Net Index1. Because the asset allocation of the Fund changes over time with the Glidepath, the custom benchmark allocations also change over time. All indices are unmanaged.
Lipper Mixed-Asset Target 2045 Funds Average—The Lipper Mixed-Asset Target 2045 Funds (Lipper Average) are funds that seek to maximize assets for retirement or other purposes with an expected time horizon from January 1, 2041 to December 31, 2045.
S&P Target Date® 2045 Index—The S&P Target Date Series comprises 11 multi-asset class indices, each corresponding to a particular target retirement date. Each index provides varying levels of exposure to equities and fixed income. Each target date allocation is created and retired according to a predetermined schedule related to the respective target date.
Investors cannot invest directly in an index or average. The returns for the Indexes would be lower if they included the effects of sales charges, operating expenses of a mutual fund, or taxes. Returns for the Lipper Average reflect the deduction of operating expenses, but not sales charges or taxes.
| | |
| 40 | | Visit our website at pgiminvestments.com |
Presentation of Fund Holdings
| | | | | | |
Prudential Day One 2045 Fund Ten Largest Holdings | | Asset Class | | % of Net Assets | |
| PGIM QMALarge-Cap Core Equity Fund | | Large Cap | | | 28.9 | % |
| PGIM QMA International Developed Markets Index Fund | | International Developed Markets | | | 18.0 | % |
| PGIM QMA US Broad Market Index Fund | | Broad Market | | | 16.9 | % |
| PGIM Total Return Bond Fund | | Total Return Bond | | | 8.1 | % |
| PGIM QMAMid-Cap Core Equity Fund | | Mid Cap | | | 7.0 | % |
| PGIM QMA Emerging Markets Equity Fund | | Emerging Markets | | | 5.0 | % |
| PGIM Global Real Estate Fund | | Real Estate | | | 5.0 | % |
| PGIM Core Conservative Bond Fund | | Core Bond | | | 3.0 | % |
| PGIM QMA Commodity Strategies Fund | | Commodity | | | 3.0 | % |
| PGIM JennisonSmall-Cap Core Equity Fund | | Small Cap | | | 3.0 | % |
For a complete list of holdings, please refer to the Schedule of Investments section of this report. Holdings reflect only long-term Investments. Holdings/Issues/Industries/Sectors are subject to change.
| | | | |
| Prudential Day One Funds | | | 41 | |
Prudential Day One 2050 Fund
Your Fund’s Performance(unaudited)
Performance data quoted represent past performance. Past performance does not guarantee future results. The investment return and principal value of an investment will fluctuate, so that an investor’s shares, when redeemed, may be worth more or less than their original cost. Current performance may be lower or higher than the past performance data quoted. An investor may obtain performance data as of the most recent month-end by visiting our website atpgiminvestments.com or by calling (800) 225-1852.
| | | | |
| |
| | | Average Annual Total Returns as of 7/31/19 |
| | | One Year (%) | | Since Inception (%) |
| Class R1 | | 1.61 | | 8.23 (12/13/16) |
| Class R2 | | 1.83 | | 8.46 (12/13/16) |
| Class R3 | | 2.01 | | 8.66 (12/13/16) |
| Class R4 | | 1.95 | | 8.68 (12/13/16) |
| Class R5 | | 2.24 | | 8.88 (12/13/16) |
| Class R6 | | 2.33 | | 9.07 (12/13/16) |
| Prudential Day One 2050 Custom Benchmark |
| | 4.32 | | 10.93 |
| Lipper Mixed-Asset Target 2050 Funds Average |
| | 3.04 | | 10.11 |
| S&P Target Date 2050 Index |
| | | 2.90 | | 10.45 |
Source: PGIM Investments LLC and Lipper Inc.
The returns in the table do not reflect the deduction of taxes that a shareholder would pay on Fund distributions or following the redemption of Fund shares. Since Inception returns are provided since the Fund has less than 10 fiscal years of returns. Since Inception returns for the Indexes and the Lipper Average are measured from the closest month-end to the Fund’s inception date.
| | |
| 42 | | Visit our website at pgiminvestments.com |
Growth of a $10,000 Investment
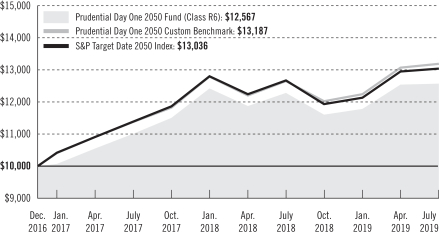
The graph compares a $10,000 investment in the Prudential Day One 2050 Fund’s Class R6 shares with a similar investment in the Prudential Day One 2050 Custom Benchmark and S&P Target Date 2050 Index (Index) over time periods ending at the end of the current fiscal year (July 31, 2019). The R6 share class assumes an initial investment on December 13, 2016, while the Custom Benchmark and the Index assume that the initial investment occurred on November 30, 2016. For purposes of the graph, and unless otherwise indicated, it has been assumed that (a) all recurring fees (including management fees) were deducted; and (b) all dividends and distributions were reinvested. The line graph provides information for Class R6 shares only. As indicated in the tables provided earlier, performance for Class R1, Class R2, Class R3, Class R4 and Class R5 shares will vary due to the differing fees and expenses applicable to each share class (as indicated in the following paragraphs). Without waiver of fees and/or expense reimbursements, the returns would have been lower.
Past performance does not predict future performance. Total returns and the ending account values in the graph include changes in share price and reinvestment of dividends and capital gains distributions in a hypothetical investment for the periods shown. The Fund’s total returns do not reflect the deduction of income taxes on an individual’s investment. Taxes may reduce your actual investment returns on income or gains paid by the Fund or any gains you may realize if you sell your shares.
| | | | |
| Prudential Day One Funds | | | 43 | |
Prudential Day One 2050 Fund
Your Fund’s Performance(continued)
The average annual total returns take into account applicable charges and fees, which are described for each share class in the table below.
| | | | | | | | | | | | |
| | | | | | | |
| | | Class R1 | | Class R2 | | Class R3 | | Class R4 | | Class R5 | | Class R6 |
| Maximum initial sales charge | | None | | None | | None | | None | | None | | None |
| Contingent deferred sales charge (CDSC) (as a percentage of the lower of original purchase price or net asset value at redemption) | | None | | None | | None | | None | | None | | None |
| Annual distribution or distribution and service (12b-1) fees (shown as a percentage of average daily net assets) | | 0.50% | | 0.25% | | 0.10% | | None | | None | | None |
| Shareholder service fees | | 0.10% | | 0.10% | | 0.10% | | 0.10% | | None | | None |
Benchmark Definitions
Prudential Day One 2050 Custom Benchmark—The Prudential Day One 2050 Custom Benchmark reflects the normal weighted average of the underlying funds’ stock/non-traditional assets/bond/cash allocation, as represented by the S&P 1500 Composite Index, FTSE Developed ex-North America Index1,2, MSCI Emerging Markets Net Index, Bloomberg Barclays US Treasury Inflation-Protected Securities (TIPS) Index, Bloomberg Barclays US Aggregate Bond Index, FTSE 3-Month T-Bill1, Bloomberg Commodity Index, and the FTSE EPRA/NAREIT Developed Real Estate Net Index1. Because the asset allocation of the Fund changes over time with the Glidepath, the custom benchmark allocations also change over time. All indices are unmanaged.
Lipper Mixed-Asset Target 2050 Funds Average—The Lipper Mixed-Asset Target 2050 Funds (Lipper Average) are funds that seek to maximize assets for retirement or other purposes with an expected time horizon from January 1, 2046 to December 31, 2050.
S&P Target Date® 2050 Index—The S&P Target Date Series comprises 11 multi-asset class indices, each corresponding to a particular target retirement date. Each index provides varying levels of exposure to equities and fixed income. Each target date allocation is created and retired according to a predetermined schedule related to the respective target date.
Investors cannot invest directly in an index or average. The returns for the Indexes would be lower if they included the effects of sales charges, operating expenses of a mutual fund, or taxes. Returns for the Lipper Average reflect the deduction of operating expenses, but not sales charges or taxes.
| | |
| 44 | | Visit our website at pgiminvestments.com |
Presentation of Fund Holdings
| | | | | | |
Prudential Day One 2050 Fund Ten Largest Holdings | | Asset Class | | % of Net Assets | |
| PGIM QMALarge-Cap Core Equity Fund | | Large Cap | | | 27.9 | % |
| PGIM QMA International Developed Markets Index Fund | | International Developed Markets | | | 19.0 | % |
| PGIM QMA US Broad Market Index Fund | | Broad Market | | | 16.9 | % |
| PGIM QMAMid-Cap Core Equity Fund | | Mid Cap | | | 8.0 | % |
| PGIM Total Return Bond Fund | | Total Return Bond | | | 7.1 | % |
| PGIM QMA Emerging Markets Equity Fund | | Emerging Markets | | | 6.0 | % |
| PGIM Global Real Estate Fund | | Real Estate | | | 5.0 | % |
| PGIM JennisonSmall-Cap Core Equity Fund | | Small Cap | | | 4.0 | % |
| PGIM QMA Commodity Strategies Fund | | Commodity | | | 3.0 | % |
| PGIM Core Conservative Bond Fund | | Core Bond | | | 2.0 | % |
For a complete list of holdings, please refer to the Schedule of Investments section of this report. Holdings reflect only long-term Investments. Holdings/Issues/Industries/Sectors are subject to change.
| | | | |
| Prudential Day One Funds | | | 45 | |
Prudential Day One 2055 Fund
Your Fund’s Performance(unaudited)
Performance data quoted represent past performance. Past performance does not guarantee future results. The investment return and principal value of an investment will fluctuate, so that an investor’s shares, when redeemed, may be worth more or less than their original cost. Current performance may be lower or higher than the past performance data quoted. An investor may obtain performance data as of the most recent month-end by visiting our website atpgiminvestments.com or by calling (800) 225-1852.
| | | | |
| |
| | | Average Annual Total Returns as of 7/31/19 |
| | | One Year (%) | | Since Inception (%) |
| Class R1 | | 0.89 | | 8.55 (12/13/16) |
| Class R2 | | 1.19 | | 8.83 (12/13/16) |
| Class R3 | | 1.37 | | 9.00 (12/13/16) |
| Class R4 | | 1.49 | | 9.12 (12/13/16) |
| Class R5 | | 1.53 | | 9.21 (12/13/16) |
| Class R6 | | 1.72 | | 9.39 (12/13/16) |
| Prudential Day One 2055 Custom Benchmark |
| | 3.85 | | 11.06 |
| Lipper Mixed-Asset Target 2055 + Funds Average |
| | 2.90 | | 10.35 |
| S&P Target Date 2055 Index |
| | | 2.88 | | 10.57 |
Source: PGIM Investments LLC and Lipper Inc.
The returns in the table do not reflect the deduction of taxes that a shareholder would pay on Fund distributions or following the redemption of Fund shares. Since Inception returns are provided since the Fund has less than 10 fiscal years of returns. Since Inception returns for the Indexes and the Lipper Average are measured from the closest month-end to the Fund’s inception date.
| | |
| 46 | | Visit our website at pgiminvestments.com |
Growth of a $10,000 Investment
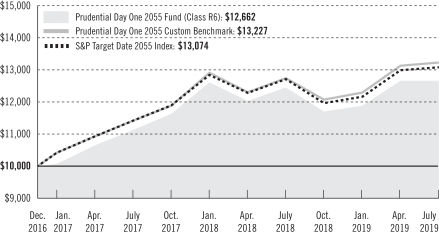
The graph compares a $10,000 investment in the Prudential Day One 2055 Fund’s Class R6 shares with a similar investment in the Prudential Day One 2055 Custom Benchmark and S&P Target Date 2055 Index (Index) over time periods ending at the end of the current fiscal year (July 31, 2019). The R6 share class assumes an initial investment on December 13, 2016, while the Custom Benchmark and the Index assume that the initial investment occurred on November 30, 2016. For purposes of the graph, and unless otherwise indicated, it has been assumed that (a) all recurring fees (including management fees) were deducted; and (b) all dividends and distributions were reinvested. The line graph provides information for Class R6 shares only. As indicated in the tables provided earlier, performance for Class R1, Class R2, Class R3, Class R4 and Class R5 shares will vary due to the differing fees and expenses applicable to each share class (as indicated in the following paragraphs). Without waiver of fees and/or expense reimbursements, the returns would have been lower.
Past performance does not predict future performance. Total returns and the ending account values in the graph include changes in share price and reinvestment of dividends and capital gains distributions in a hypothetical investment for the periods shown. The Fund’s total returns do not reflect the deduction of income taxes on an individual’s investment. Taxes may reduce your actual investment returns on income or gains paid by the Fund or any gains you may realize if you sell your shares.
| | | | |
| Prudential Day One Funds | | | 47 | |
Prudential Day One 2055 Fund
Your Fund’s Performance(continued)
The average annual total returns take into account applicable charges and fees, which are described for each share class in the table below.
| | | | | | | | | | | | |
| | | | | | | |
| | | Class R1 | | Class R2 | | Class R3 | | Class R4 | | Class R5 | | Class R6 |
| Maximum initial sales charge | | None | | None | | None | | None | | None | | None |
| Contingent deferred sales charge (CDSC) (as a percentage of the lower of original purchase price or net asset value at redemption) | | None | | None | | None | | None | | None | | None |
| Annual distribution or distribution and service (12b-1) fees (shown as a percentage of average daily net assets) | | 0.50% | | 0.25% | | 0.10% | | None | | None | | None |
| Shareholder service fees | | 0.10% | | 0.10% | | 0.10% | | 0.10% | | None | | None |
Benchmark Definitions
Prudential Day One 2055 Custom Benchmark—The Prudential Day One 2055 Custom Benchmark reflects the normal weighted average of the underlying funds’ stock/non-traditional assets/bond/cash allocation, as represented by the S&P 1500 Composite Index, FTSE Developed ex-North America Index1,2, MSCI Emerging Markets Net Index, Bloomberg Barclays US Treasury Inflation-Protected Securities (TIPS) Index, Bloomberg Barclays US Aggregate Bond Index, FTSE 3-Month T-Bill1, Bloomberg Commodity Index, and the FTSE EPRA/NAREIT Developed Real Estate Net Index1. Because the asset allocation of the Fund changes over time with the Glidepath, the custom benchmark allocations also change over time. All indices are unmanaged.
Lipper Mixed-Asset Target 2055 + Funds Average—The Lipper Mixed-Asset Target 2055 + Funds Average (Lipper Average) are funds that seek to maximize assets for retirement or other purposes with an expected time horizon exceeding December 31, 2050.
S&P Target Date® 2055 Index—The S&P Target Date Series comprises 11 multi-asset class indices, each corresponding to a particular target retirement date. Each index provides varying levels of exposure to equities and fixed income. Each target date allocation is created and retired according to a predetermined schedule related to the respective target date.
Investors cannot invest directly in an index or average. The returns for the Indexes would be lower if they included the effects of sales charges, operating expenses of a mutual fund, or taxes. Returns for the Lipper Average reflect the deduction of operating expenses, but not sales charges or taxes.
| | |
| 48 | | Visit our website at pgiminvestments.com |
Presentation of Fund Holdings
| | | | | | |
Prudential Day One 2055 Fund Top Largest Holdings | | Asset Class | | % of Net Assets | |
| PGIM QMALarge-Cap Core Equity Fund | | Large Cap | | | 26.9 | % |
| PGIM QMA International Developed Markets Index Fund | | International Developed Markets | | | 21.0 | % |
| PGIM QMA US Broad Market Index Fund | | Broad Market | | | 15.9 | % |
| PGIM QMAMid-Cap Core Equity Fund | | Mid Cap | | | 9.0 | % |
| PGIM QMA Emerging Markets Equity Fund | | Emerging Markets | | | 8.0 | % |
| PGIM Total Return Bond Fund | | Total Return Bond | | | 6.1 | % |
| PGIM Global Real Estate Fund | | Real Estate | | | 5.0 | % |
| PGIM JennisonSmall-Cap Core Equity Fund | | Small Cap | | | 5.0 | % |
| PGIM QMA Commodity Strategies Fund | | Commodity | | | 3.0 | % |
For a complete list of holdings, please refer to the Schedule of Investments section of this report. Holdings reflect only long-term Investments. Holdings/Issues/Industries/Sectors are subject to change.
| | | | |
| Prudential Day One Funds | | | 49 | |
Prudential Day One 2060 Fund
Your Fund’s Performance(unaudited)
Performance data quoted represent past performance. Past performance does not guarantee future results. The investment return and principal value of an investment will fluctuate, so that an investor’s shares, when redeemed, may be worth more or less than their original cost. Current performance may be lower or higher than the past performance data quoted. An investor may obtain performance data as of the most recent month-end by visiting our website atpgiminvestments.com or by calling (800) 225-1852.
| | | | |
| |
| | | Average Annual Total Returns as of 7/31/19 |
| | | One Year (%) | | Since Inception (%) |
| Class R1 | | 0.57 | | 8.29 (12/13/16) |
| Class R2 | | 0.79 | | 8.55 (12/13/16) |
| Class R3 | | 1.05 | | 8.74 (12/13/16) |
| Class R4 | | 1.09 | | 8.83 (12/13/16) |
| Class R5 | | 1.21 | | 8.96 (12/13/16) |
| Class R6 | | 1.39 | | 9.09 (12/13/16) |
| Prudential Day One 2060 Custom Benchmark |
| | 3.60 | | 11.12 |
| Lipper Mixed-Asset Target 2055 + Funds Average |
| | 3.01 | | 10.53 |
| S&P Target Date 2060+ Index |
| | | 2.95 | | 10.75 |
Source: PGIM Investments LLC and Lipper Inc.
The returns in the table do not reflect the deduction of taxes that a shareholder would pay on Fund distributions or following the redemption of Fund shares. Since Inception returns are provided since the Fund has less than 10 fiscal years of returns. Since Inception returns for the Indexes and the Lipper Average are measured from the closest month-end to the Fund’s inception date.
| | |
| 50 | | Visit our website at pgiminvestments.com |
Growth of a $10,000 Investment
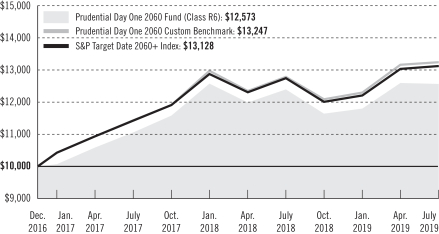
The graph compares a $10,000 investment in the Prudential Day One 2060 Fund’s Class R6 shares with a similar investment in the Prudential Day One 2060 Custom Benchmark and S&P Target Date 2060+ Index (Index) over time periods ending at the end of the current fiscal year (July 31, 2019). The R6 share class assumes an initial investment on December 13, 2016, while the Custom Benchmark and the Index assume that the initial investment occurred on November 30, 2016. For purposes of the graph, and unless otherwise indicated, it has been assumed that (a) all recurring fees (including management fees) were deducted; and (b) all dividends and distributions were reinvested. The line graph provides information for Class R6 shares only. As indicated in the tables provided earlier, performance for Class R1, Class R2, Class R3, Class R4 and Class R5 shares will vary due to the differing fees and expenses applicable to each share class (as indicated in the following paragraphs). Without waiver of fees and/or expense reimbursements, the returns would have been lower.
Past performance does not predict future performance. Total returns and the ending account values in the graph include changes in share price and reinvestment of dividends and capital gains distributions in a hypothetical investment for the periods shown. The Fund’s total returns do not reflect the deduction of income taxes on an individual’s investment. Taxes may reduce your actual investment returns on income or gains paid by the Fund or any gains you may realize if you sell your shares.
| | | | |
| Prudential Day One Funds | | | 51 | |
Prudential Day One 2060 Fund
Your Fund’s Performance(continued)
The average annual total returns take into account applicable charges and fees, which are described for each share class in the table below.
| | | | | | | | | | | | |
| | | | | | | |
| | | Class R1 | | Class R2 | | Class R3 | | Class R4 | | Class R5 | | Class R6 |
| Maximum initial sales charge | | None | | None | | None | | None | | None | | None |
| Contingent deferred sales charge (CDSC) (as a percentage of the lower of original purchase price or net asset value at redemption) | | None | | None | | None | | None | | None | | None |
| Annual distribution or distribution and service (12b-1) fees (shown as a percentage of average daily net assets) | | 0.50% | | 0.25% | | 0.10% | | None | | None | | None |
| Shareholder service fees | | 0.10% | | 0.10% | | 0.10% | | 0.10% | | None | | None |
Benchmark Definitions
Prudential Day One 2060 Custom Benchmark—The Prudential Day One 2060 Custom Benchmark reflects the normal weighted average of the underlying funds’ stock/non-traditional assets/bond/cash allocation, as represented by the S&P 1500 Composite Index, FTSE Developed ex-North America Index1,2, MSCI Emerging Markets Net Index, Bloomberg Barclays US Treasury Inflation-Protected Securities (TIPS) Index, Bloomberg Barclays US Aggregate Bond Index, FTSE 3-Month T-Bill1, Bloomberg Commodity Index, and the FTSE EPRA/NAREIT Developed Real Estate Net Index1. Because the asset allocation of the Fund changes over time with the Glidepath, the custom benchmark allocations also change over time. All indices are unmanaged.
Lipper Mixed-Asset Target 2055+ Funds Average—The Lipper Mixed-Asset Target 2055 + Funds Average (Lipper Average) are funds that seek to maximize assets for retirement or other purposes with an expected time horizon exceeding December 31, 2050.
| | |
| 52 | | Visit our website at pgiminvestments.com |
S&P Target Date® 2060+ Index—The S&P Target Date Series comprises 11 multi-asset class indices, each corresponding to a particular target retirement date. Each index provides varying levels of exposure to equities and fixed income. Each target date allocation is created and retired according to a predetermined schedule related to the respective target date.
Investors cannot invest directly in an index or average. The returns for the Indexes, would be lower if they included the effects of sales charges, operating expenses of a mutual fund, or taxes. Returns for the Lipper Average reflect the deduction of operating expenses, but not sales charges or taxes.
1 Source: London Stock Exchange Group plc and its group undertakings (collectively, the “LSE Group”).© LSE Group 2018. FTSE Russell is a trading name of certain of the LSE Group companies. “FTSE®” and “FTSE Russell®” are trade mark(s) of the relevant LSE Group companies and is/are used by any other LSE Group company under license. “TMX®” is a trade mark of TSX, Inc. and used by the LSE Group under license. All rights in the FTSE Russell indexes or data vest in the relevant LSE Group company which owns the index or the data. Neither LSE Group nor its licensors accept any liability for any errors or omissions in the indexes or data and no party may rely on any indexes or data contained in this communication. No further distribution of data from the LSE Group is permitted without the relevant LSE Group company’s express written consent. The LSE Group does not promote, sponsor or endorse the content of this communication.
2 Effective 12/31/18, The Russell Developed ex-North America Large Cap Net Index was decommissioned and subsequently replaced with the FTSE Developed ex-North America Index. Historical returns for the Prudential Day One Custom Benchmarks, prior to 12/31/18, will not be re-stated.
Presentation of Fund Holdings
| | | | | | |
Prudential Day One 2060 Fund Top Largest Holdings | | Asset Class | | % of Net Assets | |
| PGIM QMALarge-Cap Core Equity Fund | | Large Cap | | | 27.9 | % |
| PGIM QMA International Developed Markets Index Fund | | International Developed Markets | | | 23.0 | % |
| PGIM QMA US Broad Market Index Fund | | Broad Market | | | 16.0 | % |
| PGIM QMAMid-Cap Core Equity Fund | | Mid Cap | | | 9.0 | % |
| PGIM QMA Emerging Markets Equity Fund | | Emerging Markets | | | 8.0 | % |
| PGIM Global Real Estate Fund | | Real Estate | | | 5.0 | % |
| PGIM JennisonSmall-Cap Core Equity Fund | | Small Cap | | | 5.0 | % |
| PGIM Total Return Bond Fund | | Total Return Bond | | | 3.0 | % |
| PGIM QMA Commodity Strategies Fund | | Commodity | | | 3.0 | % |
For a complete list of holdings, please refer to the Schedule of Investments section of this report. Holdings reflect only long-term Investments. Holdings/Issues/Industries/Sectors are subject to change.
| | | | |
| Prudential Day One Funds | | | 53 | |
Prudential Day One Funds
Strategy and Performance Overview
What were the market conditions?
| • | | US stocks performed strongly during the12-month reporting period that ended July 31, 2019.Large-cap equities led the way, significantly outpacing theirmid- andsmall-cap counterparts. International and emerging-markets equities fell, notably trailing USlarge-cap stocks. |
| • | | The bond market delivered mixed returns during the period. The best performance was in US core bonds, which outperformed nearly all other fixed income asset classes. US investment-grade corporate bonds posted a double-digit gain, outperforming the strong performance of US government nominal bonds. |
How did the Funds perform?
The performance of each Fund’s R6 share class and benchmark returns over the reporting period are listed below.
ThePrudential Day One Income Fund returned 5.33%, underperforming the 5.65% return of the Prudential Day One Income Custom Benchmark and outperforming the 5.20% return of the Lipper Mixed-Asset Target Today Funds Average.
ThePrudential Day One 2010 Fundreturned 5.30%, underperforming the 5.73% return of the Prudential Day One 2010 Custom Benchmark and outperforming the 5.09% return of the Lipper Mixed-Asset Target 2010 Funds Average.
ThePrudential Day One 2015 Fund returned 4.89%, underperforming the 5.49% return of the Prudential Day One 2015 Custom Benchmark and the 4.94% return of the Lipper Mixed-Asset Target 2015 Funds Average.
ThePrudential Day One 2020 Fundreturned 4.93%, underperforming the 5.58% return of the Prudential Day One 2020 Custom Benchmark and outperforming the 4.76% return of the Lipper Mixed-Asset Target 2020 Funds Average.
ThePrudential Day One 2025 Fundreturned 4.55%, underperforming the 5.18% return of the Prudential Day One 2025 Custom Benchmark and performing in line with the 4.55% return of the Lipper Mixed-Asset Target 2025 Funds Average.
ThePrudential Day One 2030 Fundreturned 3.93%, underperforming the 4.83% return of the Prudential Day One 2030 Custom Benchmark and the 4.11% return of the Lipper Mixed-Asset Target 2030 Funds Average.
ThePrudential Day One 2035 Fundreturned 3.23%, underperforming the 4.80% return of the Prudential Day One 2035 Custom Benchmark and the 3.65% return of the Lipper Mixed-Asset Target 2035 Funds Average.
| | |
| 54 | | Visit our website at pgiminvestments.com |
ThePrudential Day One 2040 Fundreturned 3.13%, underperforming the 4.68% return of the Prudential Day One 2040 Custom Benchmark and the 3.31% return of the Lipper Mixed-Asset Target 2040 Funds Average.
ThePrudential Day One 2045 Fundreturned 2.50%, underperforming the 4.39% return of the Prudential Day One 2045 Custom Benchmark and the 3.09% return of the Lipper Mixed-Asset Target 2045 Funds Average.
ThePrudential Day One 2050 Fundreturned 2.33%, underperforming the 4.32% return of the Prudential Day One 2050 Custom Benchmark and the 3.04% return of the Lipper Mixed-Asset Target 2050 Funds Average.
ThePrudential Day One 2055 Fundreturned 1.72%, underperforming the 3.85% return of the Prudential Day One 2055 Custom Benchmark and the 2.90% return of the Lipper Mixed-Asset Target 2055+ Funds Average.
ThePrudential Day One 2060 Fundreturned 1.39%, underperforming the 3.60% return of the Prudential Day One 2060 Custom Benchmark and the 3.01% return of the Lipper Mixed-Asset Target 2055+ Funds Average.
What worked?
| • | | Each fund in the Day One Funds series is allocated to a combination of stocks and bonds. Both the stocks and the bonds in these allocations experienced positive and negative returns across different asset classes during the reporting period. |
| • | | Within equities, the Funds’ bias toward US stocks relative tonon-US stocks contributed to the Funds’ overall results, as US stocks—with the exception of US small caps—outperformed by a significant margin during the period. |
| • | | At the underlying fund level, the PGIM Total Return Bond Fund, PGIM Global Real Estate Fund, PGIM JennisonSmall-Cap Core Equity Fund, and the PGIM Core Short-Term Bond Fund were the greatest contributors to relative performance, as each Fund significantly outperformed its respective benchmark index for the period. |
What didn’t work?
| • | | The Funds’ allocation to commodities, USsmall-cap stocks, andnon-US stocks detracted from performance as these asset classes turned in negative returns for the period. |
| • | | Weak results from the PGIM QMALarge-Cap Core Equity Fund, PGIM QMAMid-Cap Core Equity Fund, and the PGIM QMA Emerging Markets Equity Fund, which all underperformed their respective benchmarks, detracted from overall results for the period. |
| | | | |
| Prudential Day One Funds | | | 55 | |
Prudential Day One Funds
Strategy and Performance Overview(continued)
Current outlook
| • | | QMA believes thatUS-China interests have permanently diverged and should be viewed in the context of a geopolitical competition that is unlikely to be resolved by a trade deal. |
| • | | QMA believes the current tensions are likely to persist for some time, albeit with some ebb and flow. A positive scenario for risk assets could involve aUS-China trade truce ahead of the 2020 US presidential election, along with continued central bank dovishness (i.e., moderating their stance on interest rate hikes) and additional China stimulus. |
| | |
| 56 | | Visit our website at pgiminvestments.com |
Fees and Expenses(unaudited)
As a shareholder of a Fund, you incur two types of costs: (1) transaction costs, including sales charges (loads) on purchase payments and redemptions, as applicable, and (2) ongoing costs, including management fees, distribution and/or service (12b-1) fees, and other Fund expenses, as applicable. These examples are intended to help you understand your ongoing costs (in dollars) of investing in the Funds and to compare these costs with the ongoing costs of investing in other mutual funds.
These examples are based on an investment of $1,000 held through the six-month period ended July 31, 2019. These examples are for illustrative purposes only; you should consult the Prospectus for information on initial and subsequent minimum investment requirements.
Actual Expenses
The first line for each share class in the tables on the following pages provides information about actual account values and actual expenses. You may use the information on this line, together with the amount you invested, to estimate the expenses that you paid over the period. Simply divide your account value by $1,000 (for example, an $8,600 account value ÷ $1,000 = 8.6), then multiply the result by the number on the first line under the heading “Expenses Paid During the Period” to estimate the expenses you paid on your account during this period.
Hypothetical Example for Comparison Purposes
The second line for each share class in the tables below provides information about hypothetical account values and hypothetical expenses based on each Fund’s actual expense ratio and an assumed rate of return of 5% per year before expenses, which is not each Fund’s actual return. The hypothetical account values and expenses may not be used to estimate the actual ending account balance or expenses you paid for the period. You may use this information to compare the ongoing costs of investing in each Fund and other funds. To do so, compare this 5% hypothetical example with the 5% hypothetical examples that appear in the shareholder reports of the other funds.
The Funds’ transfer agent may charge additional fees to holders of certain accounts that are not included in the expenses shown in the tables on the following pages. These fees apply to individual retirement accounts (IRAs) and Section 403(b) accounts. As of the close of the six-month period covered by the tables, IRA fees included an annual maintenance fee of $15 per account (subject to a maximum annual maintenance fee of $25 for all accounts held by the same shareholder). Section 403(b) accounts are charged an annual $25 fiduciary maintenance fee. Some of the fees may vary in amount, or may be waived, based on your total account balance or the number of Prudential funds, including the Funds, that you own. You should consider the additional fees that were charged to your
| | | | |
| Prudential Day One Funds | | | 57 | |
Fees and Expenses(continued)
Fund account over the period when you estimate the total ongoing expenses paid over the period and the impact of these fees on your ending account value, as these additional expenses are not reflected in the information provided in the expense tables. Additional fees have the effect of reducing investment returns.
Please note that the expenses shown in the tables are meant to highlight your ongoing costs only and do not reflect any transactional costs such as sales charges (loads). Therefore, the second line for each share class in the tables is useful in comparing ongoing costs only and will not help you determine the relative total costs of owning different funds. In addition, if these transactional costs were included, your costs would have been higher.
| | | | | | | | | | | | | | | | | | |
| | | | |
| Prudential Day One Income Fund | | Beginning Account
Value
February 1, 2019 | | | Ending Account
Value July 31, 2019 | | | Annualized
Expense Ratio
Based on the
Six-Month Period | | | Expenses Paid
During the
Six-Month Period* | |
| Class R1 | | Actual | | $ | 1,000.00 | | | $ | 1,051.10 | | | | 1.15 | % | | $ | 5.85 | |
| | Hypothetical | | $ | 1,000.00 | | | $ | 1,019.09 | | | | 1.15 | % | | $ | 5.76 | |
| Class R2 | | Actual | | $ | 1,000.00 | | | $ | 1,052.30 | | | | 0.90 | % | | $ | 4.58 | |
| | Hypothetical | | $ | 1,000.00 | | | $ | 1,020.33 | | | | 0.90 | % | | $ | 4.51 | |
| Class R3 | | Actual | | $ | 1,000.00 | | | $ | 1,052.90 | | | | 0.75 | % | | $ | 3.82 | |
| | Hypothetical | | $ | 1,000.00 | | | $ | 1,021.08 | | | | 0.75 | % | | $ | 3.76 | |
| Class R4 | | Actual | | $ | 1,000.00 | | | $ | 1,054.30 | | | | 0.65 | % | | $ | 3.31 | |
| | Hypothetical | | $ | 1,000.00 | | | $ | 1,021.57 | | | | 0.65 | % | | $ | 3.26 | |
| Class R5 | | Actual | | $ | 1,000.00 | | | $ | 1,053.80 | | | | 0.55 | % | | $ | 2.80 | |
| | Hypothetical | | $ | 1,000.00 | | | $ | 1,022.07 | | | | 0.55 | % | | $ | 2.76 | |
| Class R6 | | Actual | | $ | 1,000.00 | | | $ | 1,055.50 | | | | 0.40 | % | | $ | 2.04 | |
| | | Hypothetical | | $ | 1,000.00 | | | $ | 1,022.81 | | | | 0.40 | % | | $ | 2.01 | |
| | |
| 58 | | Visit our website at pgiminvestments.com |
| | | | | | | | | | | | | | | | | | |
| | | | |
Prudential Day One
2010 Fund | | Beginning Account
Value
February 1, 2019 | | | Ending Account
Value
July 31, 2019 | | | Annualized
Expense Ratio
Based on the
Six-Month Period | | | Expenses Paid
During the
Six-Month Period* | |
| Class R1 | | Actual | | $ | 1,000.00 | | | $ | 1,052.90 | | | | 1.15 | % | | $ | 5.85 | |
| | Hypothetical | | $ | 1,000.00 | | | $ | 1,019.09 | | | | 1.15 | % | | $ | 5.76 | |
| Class R2 | | Actual | | $ | 1,000.00 | | | $ | 1,053.90 | | | | 0.90 | % | | $ | 4.58 | |
| | Hypothetical | | $ | 1,000.00 | | | $ | 1,020.33 | | | | 0.90 | % | | $ | 4.51 | |
| Class R3 | | Actual | | $ | 1,000.00 | | | $ | 1,054.90 | | | | 0.75 | % | | $ | 3.82 | |
| | Hypothetical | | $ | 1,000.00 | | | $ | 1,021.08 | | | | 0.75 | % | | $ | 3.76 | |
| Class R4 | | Actual | | $ | 1,000.00 | | | $ | 1,054.90 | | | | 0.65 | % | | $ | 3.31 | |
| | Hypothetical | | $ | 1,000.00 | | | $ | 1,021.57 | | | | 0.65 | % | | $ | 3.26 | |
| Class R5 | | Actual | | $ | 1,000.00 | | | $ | 1,054.80 | | | | 0.55 | % | | $ | 2.80 | |
| | Hypothetical | | $ | 1,000.00 | | | $ | 1,022.07 | | | | 0.55 | % | | $ | 2.76 | |
| Class R6 | | Actual | | $ | 1,000.00 | | | $ | 1,055.80 | | | | 0.40 | % | | $ | 2.04 | |
| | | Hypothetical | | $ | 1,000.00 | | | $ | 1,022.81 | | | | 0.40 | % | | $ | 2.01 | |
| | | | | | | | | | | | | | | | | | |
| | | | |
Prudential Day One
2015 Fund | | Beginning Account
Value February 1, 2019 | | | Ending Account
Value
July 31, 2019 | | | Annualized
Expense Ratio Based on the
Six-Month Period | | | Expenses Paid
During the
Six-Month Period* | |
| Class R1 | | Actual | | $ | 1,000.00 | | | $ | 1,053.10 | | | | 1.15 | % | | $ | 5.85 | |
| | Hypothetical | | $ | 1,000.00 | | | $ | 1,019.09 | | | | 1.15 | % | | $ | 5.76 | |
| Class R2 | | Actual | | $ | 1,000.00 | | | $ | 1,054.10 | | | | 0.90 | % | | $ | 4.58 | |
| | Hypothetical | | $ | 1,000.00 | | | $ | 1,020.33 | | | | 0.90 | % | | $ | 4.51 | |
| Class R3 | | Actual | | $ | 1,000.00 | | | $ | 1,054.00 | | | | 0.75 | % | | $ | 3.82 | |
| | Hypothetical | | $ | 1,000.00 | | | $ | 1,021.08 | | | | 0.75 | % | | $ | 3.76 | |
| Class R4 | | Actual | | $ | 1,000.00 | | | $ | 1,055.00 | | | | 0.65 | % | | $ | 3.31 | |
| | Hypothetical | | $ | 1,000.00 | | | $ | 1,021.57 | | | | 0.65 | % | | $ | 3.26 | |
| Class R5 | | Actual | | $ | 1,000.00 | | | $ | 1,055.90 | | | | 0.55 | % | | $ | 2.80 | |
| | Hypothetical | | $ | 1,000.00 | | | $ | 1,022.07 | | | | 0.55 | % | | $ | 2.76 | |
| Class R6 | | Actual | | $ | 1,000.00 | | | $ | 1,056.90 | | | | 0.40 | % | | $ | 2.04 | |
| | | Hypothetical | | $ | 1,000.00 | | | $ | 1,022.81 | | | | 0.40 | % | | $ | 2.01 | |
| | | | |
| Prudential Day One Funds | | | 59 | |
Fees and Expenses(continued)
| | | | | | | | | | | | | | | | | | |
| | | | |
Prudential Day One
2020 Fund | | Beginning Account
Value
February 1, 2019 | | | Ending Account
Value
July 31, 2019 | | | Annualized
Expense Ratio
Based on the
Six-Month Period | | | Expenses Paid
During the
Six-Month Period* | |
| Class R1 | | Actual | | $ | 1,000.00 | | | $ | 1,055.10 | | | | 1.15 | % | | $ | 5.86 | |
| | Hypothetical | | $ | 1,000.00 | | | $ | 1,019.09 | | | | 1.15 | % | | $ | 5.76 | |
| Class R2 | | Actual | | $ | 1,000.00 | | | $ | 1,057.10 | | | | 0.90 | % | | $ | 4.59 | |
| | Hypothetical | | $ | 1,000.00 | | | $ | 1,020.33 | | | | 0.90 | % | | $ | 4.51 | |
| Class R3 | | Actual | | $ | 1,000.00 | | | $ | 1,057.00 | | | | 0.75 | % | | $ | 3.83 | |
| | Hypothetical | | $ | 1,000.00 | | | $ | 1,021.08 | | | | 0.75 | % | | $ | 3.76 | |
| Class R4 | | Actual | | $ | 1,000.00 | | | $ | 1,057.90 | | | | 0.65 | % | | $ | 3.32 | |
| | Hypothetical | | $ | 1,000.00 | | | $ | 1,021.57 | | | | 0.65 | % | | $ | 3.26 | |
| Class R5 | | Actual | | $ | 1,000.00 | | | $ | 1,057.90 | | | | 0.55 | % | | $ | 2.81 | |
| | Hypothetical | | $ | 1,000.00 | | | $ | 1,022.07 | | | | 0.55 | % | | $ | 2.76 | |
| Class R6 | | Actual | | $ | 1,000.00 | | | $ | 1,059.10 | | | | 0.40 | % | | $ | 2.04 | |
| | | Hypothetical | | $ | 1,000.00 | | | $ | 1,022.81 | | | | 0.40 | % | | $ | 2.01 | |
| | | | | | | | | | | | | | | | | | |
| | | | |
Prudential Day One
2025 Fund | | Beginning Account
Value
February 1, 2019 | | | Ending Account
Value
July 31, 2019 | | | Annualized
Expense Ratio Based on the
Six-Month Period | | | Expenses Paid
During the
Six-Month Period* | |
| Class R1 | | Actual | | $ | 1,000.00 | | | $ | 1,056.90 | | | | 1.15 | % | | $ | 5.86 | |
| | Hypothetical | | $ | 1,000.00 | | | $ | 1,019.09 | | | | 1.15 | % | | $ | 5.76 | |
| Class R2 | | Actual | | $ | 1,000.00 | | | $ | 1,058.80 | | | | 0.90 | % | | $ | 4.59 | |
| | Hypothetical | | $ | 1,000.00 | | | $ | 1,020.33 | | | | 0.90 | % | | $ | 4.51 | |
| Class R3 | | Actual | | $ | 1,000.00 | | | $ | 1,058.80 | | | | 0.75 | % | | $ | 3.83 | |
| | Hypothetical | | $ | 1,000.00 | | | $ | 1,021.08 | | | | 0.75 | % | | $ | 3.76 | |
| Class R4 | | Actual | | $ | 1,000.00 | | | $ | 1,058.80 | | | | 0.65 | % | | $ | 3.32 | |
| | Hypothetical | | $ | 1,000.00 | | | $ | 1,021.57 | | | | 0.65 | % | | $ | 3.26 | |
| Class R5 | | Actual | | $ | 1,000.00 | | | $ | 1,059.80 | | | | 0.55 | % | | $ | 2.81 | |
| | Hypothetical | | $ | 1,000.00 | | | $ | 1,022.07 | | | | 0.55 | % | | $ | 2.76 | |
| Class R6 | | Actual | | $ | 1,000.00 | | | $ | 1,060.60 | | | | 0.40 | % | | $ | 2.04 | |
| | | Hypothetical | | $ | 1,000.00 | | | $ | 1,022.81 | | | | 0.40 | % | | $ | 2.01 | |
| | |
| 60 | | Visit our website at pgiminvestments.com |
| | | | | | | | | | | | | | | | | | |
| | | | |
Prudential Day One
2030 Fund | | Beginning Account
Value
February 1, 2019 | | | Ending Account
Value July 31, 2019 | | | Annualized
Expense Ratio
Based on the
Six-Month Period | | | Expenses Paid
During the
Six-Month Period* | |
| Class R1 | | Actual | | $ | 1,000.00 | | | $ | 1,062.20 | | | | 1.15 | % | | $ | 5.88 | |
| | Hypothetical | | $ | 1,000.00 | | | $ | 1,019.09 | | | | 1.15 | % | | $ | 5.76 | |
| Class R2 | | Actual | | $ | 1,000.00 | | | $ | 1,064.00 | | | | 0.90 | % | | $ | 4.61 | |
| | Hypothetical | | $ | 1,000.00 | | | $ | 1,020.33 | | | | 0.90 | % | | $ | 4.51 | |
| Class R3 | | Actual | | $ | 1,000.00 | | | $ | 1,064.00 | | | | 0.75 | % | | $ | 3.84 | |
| | Hypothetical | | $ | 1,000.00 | | | $ | 1,021.08 | | | | 0.75 | % | | $ | 3.76 | |
| Class R4 | | Actual | | $ | 1,000.00 | | | $ | 1,063.10 | | | | 0.65 | % | | $ | 3.32 | |
| | Hypothetical | | $ | 1,000.00 | | | $ | 1,021.57 | | | | 0.65 | % | | $ | 3.26 | |
| Class R5 | | Actual | | $ | 1,000.00 | | | $ | 1,064.90 | | | | 0.55 | % | | $ | 2.82 | |
| | Hypothetical | | $ | 1,000.00 | | | $ | 1,022.07 | | | | 0.55 | % | | $ | 2.76 | |
| Class R6 | | Actual | | $ | 1,000.00 | | | $ | 1,065.80 | | | | 0.40 | % | | $ | 2.05 | |
| | | Hypothetical | | $ | 1,000.00 | | | $ | 1,022.81 | | | | 0.40 | % | | $ | 2.01 | |
| | | | | | | | | | | | | | | | | | |
| | | | |
Prudential Day One
2035 Fund | | Beginning Account
Value
February 1, 2019 | | | Ending Account
Value
July 31, 2019 | | | Annualized
Expense Ratio Based on the
Six-Month Period | | | Expenses Paid
During the
Six-Month Period* | |
| Class R1 | | Actual | | $ | 1,000.00 | | | $ | 1,065.30 | | | | 1.15 | % | | $ | 5.89 | |
| | Hypothetical | | $ | 1,000.00 | | | $ | 1,019.09 | | | | 1.15 | % | | $ | 5.76 | |
| Class R2 | | Actual | | $ | 1,000.00 | | | $ | 1,066.20 | | | | 0.90 | % | | $ | 4.61 | |
| | Hypothetical | | $ | 1,000.00 | | | $ | 1,020.33 | | | | 0.90 | % | | $ | 4.51 | |
| Class R3 | | Actual | | $ | 1,000.00 | | | $ | 1,067.10 | | | | 0.75 | % | | $ | 3.84 | |
| | Hypothetical | | $ | 1,000.00 | | | $ | 1,021.08 | | | | 0.75 | % | | $ | 3.76 | |
| Class R4 | | Actual | | $ | 1,000.00 | | | $ | 1,067.00 | | | | 0.65 | % | | $ | 3.33 | |
| | Hypothetical | | $ | 1,000.00 | | | $ | 1,021.57 | | | | 0.65 | % | | $ | 3.26 | |
| Class R5 | | Actual | | $ | 1,000.00 | | | $ | 1,068.10 | | | | 0.55 | % | | $ | 2.82 | |
| | Hypothetical | | $ | 1,000.00 | | | $ | 1,022.07 | | | | 0.55 | % | | $ | 2.76 | |
| Class R6 | | Actual | | $ | 1,000.00 | | | $ | 1,068.00 | | | | 0.40 | % | | $ | 2.05 | |
| | | Hypothetical | | $ | 1,000.00 | | | $ | 1,022.81 | | | | 0.40 | % | | $ | 2.01 | |
| | | | |
| Prudential Day One Funds | | | 61 | |
Fees and Expenses(continued)
| | | | | | | | | | | | | | | | | | |
| | | | |
Prudential Day One
2040 Fund | | Beginning Account
Value
February 1, 2019 | | | Ending Account
Value July 31, 2019 | | | Annualized
Expense Ratio
Based on the
Six-Month Period | | | Expenses Paid
During the
Six-Month Period* | |
| Class R1 | | Actual | | $ | 1,000.00 | | | $ | 1,064.20 | | | | 1.15 | % | | $ | 5.89 | |
| | Hypothetical | | $ | 1,000.00 | | | $ | 1,019.09 | | | | 1.15 | % | | $ | 5.76 | |
| Class R2 | | Actual | | $ | 1,000.00 | | | $ | 1,066.00 | | | | 0.90 | % | | $ | 4.61 | |
| | Hypothetical | | $ | 1,000.00 | | | $ | 1,020.33 | | | | 0.90 | % | | $ | 4.51 | |
| Class R3 | | Actual | | $ | 1,000.00 | | | $ | 1,066.90 | | | | 0.75 | % | | $ | 3.84 | |
| | Hypothetical | | $ | 1,000.00 | | | $ | 1,021.08 | | | | 0.75 | % | | $ | 3.76 | |
| Class R4 | | Actual | | $ | 1,000.00 | | | $ | 1,066.80 | | | | 0.65 | % | | $ | 3.33 | |
| | Hypothetical | | $ | 1,000.00 | | | $ | 1,021.57 | | | | 0.65 | % | | $ | 3.26 | |
| Class R5 | | Actual | | $ | 1,000.00 | | | $ | 1,066.80 | | | | 0.55 | % | | $ | 2.82 | |
| | Hypothetical | | $ | 1,000.00 | | | $ | 1,022.07 | | | | 0.55 | % | | $ | 2.76 | |
| Class R6 | | Actual | | $ | 1,000.00 | | | $ | 1,068.70 | | | | 0.40 | % | | $ | 2.05 | |
| | | Hypothetical | | $ | 1,000.00 | | | $ | 1,022.81 | | | | 0.40 | % | | $ | 2.01 | |
| | | | | | | | | | | | | | | | | | |
| | | | |
Prudential Day One
2045 Fund | | Beginning Account
Value
February 1, 2019 | | | Ending Account
Value
July 31, 2019 | | | Annualized
Expense Ratio Based on the
Six-Month Period | | | Expenses Paid
During the
Six-Month Period* | |
| Class R1 | | Actual | | $ | 1,000.00 | | | $ | 1,064.00 | | | | 1.15 | % | | $ | 5.89 | |
| | Hypothetical | | $ | 1,000.00 | | | $ | 1,019.09 | | | | 1.15 | % | | $ | 5.76 | |
| Class R2 | | Actual | | $ | 1,000.00 | | | $ | 1,065.90 | | | | 0.90 | % | | $ | 4.61 | |
| | Hypothetical | | $ | 1,000.00 | | | $ | 1,020.33 | | | | 0.90 | % | | $ | 4.51 | |
| Class R3 | | Actual | | $ | 1,000.00 | | | $ | 1,066.80 | | | | 0.75 | % | | $ | 3.84 | |
| | Hypothetical | | $ | 1,000.00 | | | $ | 1,021.08 | | | | 0.75 | % | | $ | 3.76 | |
| Class R4 | | Actual | | $ | 1,000.00 | | | $ | 1,067.80 | | | | 0.65 | % | | $ | 3.33 | |
| | Hypothetical | | $ | 1,000.00 | | | $ | 1,021.57 | | | | 0.65 | % | | $ | 3.26 | |
| Class R5 | | Actual | | $ | 1,000.00 | | | $ | 1,067.70 | | | | 0.55 | % | | $ | 2.82 | |
| | Hypothetical | | $ | 1,000.00 | | | $ | 1,022.07 | | | | 0.55 | % | | $ | 2.76 | |
| Class R6 | | Actual | | $ | 1,000.00 | | | $ | 1,068.60 | | | | 0.40 | % | | $ | 2.05 | |
| | | Hypothetical | | $ | 1,000.00 | | | $ | 1,022.81 | | | | 0.40 | % | | $ | 2.01 | |
| | |
| 62 | | Visit our website at pgiminvestments.com |
| | | | | | | | | | | | | | | | | | |
| | | | |
Prudential Day One
2050 Fund | | Beginning Account
Value
February 1, 2019 | | | Ending Account
Value July 31, 2019 | | | Annualized
Expense Ratio
Based on the
Six-Month Period | | | Expenses Paid
During the
Six-Month Period* | |
| Class R1 | | Actual | | $ | 1,000.00 | | | $ | 1,064.30 | | | | 1.15 | % | | $ | 5.89 | |
| | Hypothetical | | $ | 1,000.00 | | | $ | 1,019.09 | | | | 1.15 | % | | $ | 5.76 | |
| Class R2 | | Actual | | $ | 1,000.00 | | | $ | 1,064.30 | | | | 0.90 | % | | $ | 4.61 | |
| | Hypothetical | | $ | 1,000.00 | | | $ | 1,020.33 | | | | 0.90 | % | | $ | 4.51 | |
| Class R3 | | Actual | | $ | 1,000.00 | | | $ | 1,066.10 | | | | 0.75 | % | | $ | 3.84 | |
| | Hypothetical | | $ | 1,000.00 | | | $ | 1,021.08 | | | | 0.75 | % | | $ | 3.76 | |
| Class R4 | | Actual | | $ | 1,000.00 | | | $ | 1,066.20 | | | | 0.65 | % | | $ | 3.33 | |
| | Hypothetical | | $ | 1,000.00 | | | $ | 1,021.57 | | | | 0.65 | % | | $ | 3.26 | |
| Class R5 | | Actual | | $ | 1,000.00 | | | $ | 1,067.00 | | | | 0.55 | % | | $ | 2.82 | |
| | Hypothetical | | $ | 1,000.00 | | | $ | 1,022.07 | | | | 0.55 | % | | $ | 2.76 | |
| Class R6 | | Actual | | $ | 1,000.00 | | | $ | 1,066.90 | | | | 0.40 | % | | $ | 2.05 | |
| | | Hypothetical | | $ | 1,000.00 | | | $ | 1,022.81 | | | | 0.40 | % | | $ | 2.01 | |
| | | | | | | | | | | | | | | | | | |
| | | | |
Prudential Day One
2055 Fund | | Beginning Account
Value
February 1, 2019 | | | Ending Account
Value
July 31, 2019 | | | Annualized
Expense Ratio Based on the
Six-Month Period | | | Expenses Paid
During the
Six-Month Period* | |
| Class R1 | | Actual | | $ | 1,000.00 | | | $ | 1,060.80 | | | | 1.15 | % | | $ | 5.88 | |
| | Hypothetical | | $ | 1,000.00 | | | $ | 1,019.09 | | | | 1.15 | % | | $ | 5.76 | |
| Class R2 | | Actual | | $ | 1,000.00 | | | $ | 1,061.60 | | | | 0.90 | % | | $ | 4.60 | |
| | Hypothetical | | $ | 1,000.00 | | | $ | 1,020.33 | | | | 0.90 | % | | $ | 4.51 | |
| Class R3 | | Actual | | $ | 1,000.00 | | | $ | 1,063.50 | | | | 0.75 | % | | $ | 3.84 | |
| | Hypothetical | | $ | 1,000.00 | | | $ | 1,021.08 | | | | 0.75 | % | | $ | 3.76 | |
| Class R4 | | Actual | | $ | 1,000.00 | | | $ | 1,063.50 | | | | 0.65 | % | | $ | 3.33 | |
| | Hypothetical | | $ | 1,000.00 | | | $ | 1,021.57 | | | | 0.65 | % | | $ | 3.26 | |
| Class R5 | | Actual | | $ | 1,000.00 | | | $ | 1,063.50 | | | | 0.55 | % | | $ | 2.81 | |
| | Hypothetical | | $ | 1,000.00 | | | $ | 1,022.07 | | | | 0.55 | % | | $ | 2.76 | |
| Class R6 | | Actual | | $ | 1,000.00 | | | $ | 1,065.40 | | | | 0.40 | % | | $ | 2.05 | |
| | | Hypothetical | | $ | 1,000.00 | | | $ | 1,022.81 | | | | 0.40 | % | | $ | 2.01 | |
| | | | |
| Prudential Day One Funds | | | 63 | |
Fees and Expenses(continued)
| | | | | | | | | | | | | | | | | | |
| | | | |
Prudential Day One
2060 Fund | | Beginning Account
Value
February 1, 2019 | | | Ending Account
Value
July 31, 2019 | | | Annualized
Expense Ratio
Based on the
Six-Month Period | | | Expenses Paid
During the
Six-Month Period* | |
| Class R1 | | Actual | | $ | 1,000.00 | | | $ | 1,060.20 | | | | 1.15 | % | | $ | 5.87 | |
| | Hypothetical | | $ | 1,000.00 | | | $ | 1,019.09 | | | | 1.15 | % | | $ | 5.76 | |
| Class R2 | | Actual | | $ | 1,000.00 | | | $ | 1,062.10 | | | | 0.90 | % | | $ | 4.60 | |
| | Hypothetical | | $ | 1,000.00 | | | $ | 1,020.33 | | | | 0.90 | % | | $ | 4.51 | |
| Class R3 | | Actual | | $ | 1,000.00 | | | $ | 1,063.00 | | | | 0.75 | % | | $ | 3.84 | |
| | Hypothetical | | $ | 1,000.00 | | | $ | 1,021.08 | | | | 0.75 | % | | $ | 3.76 | |
| Class R4 | | Actual | | $ | 1,000.00 | | | $ | 1,063.00 | | | | 0.65 | % | | $ | 3.32 | |
| | Hypothetical | | $ | 1,000.00 | | | $ | 1,021.57 | | | | 0.65 | % | | $ | 3.26 | |
| Class R5 | | Actual | | $ | 1,000.00 | | | $ | 1,063.90 | | | | 0.55 | % | | $ | 2.81 | |
| | Hypothetical | | $ | 1,000.00 | | | $ | 1,022.07 | | | | 0.55 | % | | $ | 2.76 | |
| Class R6 | | Actual | | $ | 1,000.00 | | | $ | 1,064.80 | | | | 0.40 | % | | $ | 2.05 | |
| | | Hypothetical | | $ | 1,000.00 | | | $ | 1,022.81 | | | | 0.40 | % | | $ | 2.01 | |
* Fund expenses (net of fee waivers or subsidies, if any) for each share class are equal to the annualized expense ratio for each share class (provided in the table), multiplied by the average account value over the period, multiplied by the 181 days in the six-month period ended July 31, 2019, and divided by the 365 days in each Fund’s fiscal year ended July 31, 2019 (to reflect the six-month period). Expenses presented in the table include the expenses of any underlying portfolios in which each Fund may invest.
| | |
| 64 | | Visit our website at pgiminvestments.com |
Prudential Day One Income Fund
Schedule of Investments
as of July 31, 2019
| | | | | | | | |
| Description | | Shares | | | Value | |
LONG-TERM INVESTMENTS 89.9% | | | | | | | | |
| | |
AFFILIATED MUTUAL FUNDS | | | | | | | | |
PGIM Core Conservative Bond Fund (Class R6) | | | 138,371 | | | $ | 1,400,314 | |
PGIM Global Real Estate Fund (Class R6) | | | 23,121 | | | | 592,579 | |
PGIM JennisonSmall-Cap Core Equity Fund (Class R6) | | | 8,328 | | | | 98,355 | |
PGIM QMA Commodity Strategies Fund (Class R6) | | | 52,744 | | | | 497,899 | |
PGIM QMA International Developed Markets Index Fund (Class R6) | | | 42,448 | | | | 493,674 | |
PGIM QMALarge-Cap Core Equity Fund (Class R6) | | | 70,335 | | | | 1,083,861 | |
PGIM QMAMid-Cap Core Equity Fund (Class R6) | | | 9,090 | | | | 98,531 | |
PGIM QMA US Broad Market Index Fund (Class R6) | | | 43,471 | | | | 591,206 | |
PGIM TIPS Fund (Class R6) | | | 263,917 | | | | 2,604,862 | |
PGIM Total Return Bond Fund (Class R6) | | | 101,822 | | | | 1,503,904 | |
| | | | | | | | |
TOTAL LONG-TERM INVESTMENTS
(cost $8,693,106) | | | | | | | 8,965,185 | |
| | | | | | | | |
| | |
SHORT-TERM INVESTMENT 11.0% | | | | | | | | |
| | |
AFFILIATED MUTUAL FUND | | | | | | | | |
PGIM Core Ultra Short Bond Fund
(cost $1,098,835) | | | 1,098,835 | | | | 1,098,835 | |
| | | | | | | | |
TOTAL INVESTMENTS 100.9%
(cost $9,791,941)(w) | | | | | | | 10,064,020 | |
Liabilities in excess of other assets (0.9)% | | | | | | | (93,888 | ) |
| | | | | | | | |
NET ASSETS 100.0% | | | | | | $ | 9,970,132 | |
| | | | | | | | |
| (w) | PGIM Investments LLC, the manager of the Fund, also serves as the manager of the underlying funds in which the Fund invests. |
Fair Value Measurements:
Various inputs are used in determining the value of the Fund’s investments. These inputs are summarized in the three broad levels listed below.
Level 1—unadjusted quoted prices generally in active markets for identical securities.
Level 2—quoted prices for similar securities, interest rates and yield curves, prepayment speeds, foreign currency exchange rates and other observable inputs.
Level 3—unobservable inputs for securities valued in accordance with Board approved fair valuation procedures.
See Notes to Financial Statements.
| | | | |
| Prudential Day One Funds | | | 65 | |
Prudential Day One Income Fund
Schedule of Investments (continued)
as of July 31, 2019
The following is a summary of the inputs used as of July 31, 2019 in valuing such portfolio securities:
| | | | | | | | | | | | |
| | | Level 1 | | | Level 2 | | | Level 3 | |
Investments in Securities | | | | | | | | | | | | |
Affiliated Mutual Funds | | $ | 10,064,020 | | | $ | — | | | $ | — | |
| | | | | | | | | | | | |
Investment Allocation:
The investment allocation of portfolio holdings and liabilities in excess of other assets shown as a percentage of net assets as of July 31, 2019 were as follows (unaudited):
| | | | |
TIPS | | | 26.1 | % |
Total Return Bond | | | 15.1 | |
Core Bond | | | 14.0 | |
Short Term | | | 11.0 | |
Large Cap | | | 10.9 | |
Real Estate | | | 5.9 | |
Broad Market | | | 5.9 | |
Commodity | | | 5.0 | |
International Developed Markets | | | 5.0 | |
Mid Cap | | | 1.0 | % |
Small Cap | | | 1.0 | |
| | | | |
| | | 100.9 | |
Liabilities in excess of other assets | | | (0.9 | ) |
| | | | |
| | | 100.0 | % |
| | | | |
See Notes to Financial Statements.
Prudential Day One Income Fund
Statement of Assets & Liabilities
as of July 31, 2019
| | | | |
Assets | | | | |
Affiliated investments (cost $9,791,941) | | $ | 10,064,020 | |
Receivable for investments sold | | | 365,715 | |
Due from Manager | | | 16,812 | |
Receivable for Fund shares sold | | | 774 | |
| | | | |
Total Assets | | | 10,447,321 | |
| | | | |
| |
Liabilities | | | | |
Payable for Fund shares reacquired | | | 348,532 | |
Custodian and accounting fees payable | | | 47,545 | |
Payable for investments purchased | | | 47,147 | |
Accrued expenses and other liabilities | | | 32,254 | |
Affiliated transfer agent fee payable | | | 840 | |
Affiliated shareholder servicing fees payable | | | 451 | |
Distribution fee payable | | | 420 | |
| | | | |
Total Liabilities | | | 477,189 | |
| | | | |
| |
Net Assets | | $ | 9,970,132 | |
| | | | |
| | | | | |
Net assets were comprised of: | | | | |
Shares of beneficial interest, at par | | $ | 927 | |
Paid-in capital in excess of par | | | 9,710,284 | |
Total distributable earnings (loss) | | | 258,921 | |
| | | | |
Net assets, July 31, 2019 | | $ | 9,970,132 | |
| | | | |
See Notes to Financial Statements.
| | | | |
| Prudential Day One Funds | | | 67 | |
Prudential Day One Income Fund
Statement of Assets & Liabilities(continued)
as of July 31, 2019
| | | | |
Class R1 | | | | |
Net asset value, offering price and redemption price per share,
($11,254 ÷ 1,049 shares of beneficial interest issued and outstanding) | | $ | 10.73 | |
| | | | |
Class R2 | | | | |
Net asset value, offering price and redemption price per share,
($1,345,099 ÷ 125,335 shares of beneficial interest issued and outstanding) | | $ | 10.73 | |
| | | | |
Class R3 | | | | |
Net asset value, offering price and redemption price per share,
($1,597,337 ÷ 148,738 shares of beneficial interest issued and outstanding) | | $ | 10.74 | |
| | | | |
Class R4 | | | | |
Net asset value, offering price and redemption price per share,
($12,130 ÷ 1,129 shares of beneficial interest issued and outstanding) | | $ | 10.74 | |
| | | | |
Class R5 | | | | |
Net asset value, offering price and redemption price per share,
($65,472 ÷ 6,096 shares of beneficial interest issued and outstanding) | | $ | 10.74 | |
| | | | |
Class R6 | | | | |
Net asset value, offering price and redemption price per share,
($6,938,840 ÷ 644,991 shares of beneficial interest issued and outstanding) | | $ | 10.76 | |
| | | | |
See Notes to Financial Statements.
Prudential Day One Income Fund
Statement of Operations
Year Ended July 31, 2019
| | | | |
Net Investment Income (Loss) | | | | |
Affiliated dividend income | | $ | 238,497 | |
| | | | |
| |
Expenses | | | | |
Management fee | | | 1,738 | |
Distribution fee(a) | | | 4,021 | |
Shareholder servicing fees (including affiliated expense of $2,389)(a) | | | 2,427 | |
Custodian and accounting fees | | | 118,174 | |
Registration fees(a) | | | 68,280 | |
Audit fee | | | 20,402 | |
Legal fees and expenses | | | 17,309 | |
Trustees’ fees | | | 11,323 | |
Shareholders’ reports | | | 11,213 | |
Transfer agent’s fees and expenses (including affiliated expense of $4,568)(a) | | | 4,904 | |
Miscellaneous | | | 13,999 | |
| | | | |
Total expenses | | | 273,790 | |
Less: Fee waiver and/or expense reimbursement(a) | | | (264,640 | ) |
| | | | |
Net expenses | | | 9,150 | |
| | | | |
Net investment income (loss) | | | 229,347 | |
| | | | |
| |
Realized And Unrealized Gain (Loss) On Affiliated Investments | | | | |
Net realized gain (loss) on investment transactions | | | (176,337 | ) |
Net capital gain distributions received | | | 185,543 | |
| | | | |
| | | 9,206 | |
| | | | |
Net change in unrealized appreciation (depreciation) on investments | | | 247,270 | |
| | | | |
Net gain (loss) on investment transactions | | | 256,476 | |
| | | | |
Net Increase (Decrease) In Net Assets Resulting From Operations | | $ | 485,823 | |
| | | | |
| (a) | Class specific expenses and waivers were as follows: |
| | | | | | | | | | | | | | | | | | | | | | | | |
| | | Class R1 | | | Class R2 | | | Class R3 | | | Class R4 | | | Class R5 | | | Class R6 | |
Distribution fee | | | 54 | | | | 2,590 | | | | 1,377 | | | | — | | | | — | | | | — | |
Shareholder servicing fees | | | — | | | | 1,036 | | | | 1,377 | | | | 14 | | | | — | | | | — | |
Registration fees | | | 11,380 | | | | 11,380 | | | | 11,380 | | | | 11,380 | | | | 11,380 | | | | 11,380 | |
Transfer agent’s fees and expenses | | | 39 | | | | 1,765 | | | | 2,250 | | | | 101 | | | | 82 | | | | 667 | |
Fee waiver and/or expense reimbursement | | | (11,643 | ) | | | (35,216 | ) | | | (43,485 | ) | | | (11,790 | ) | | | (12,478 | ) | | | (150,028 | ) |
See Notes to Financial Statements.
| | | | |
| Prudential Day One Funds | | | 69 | |
Prudential Day One Income Fund
Statements of Changes in Net Assets
| | | | | | | | |
| |
| | | Year Ended July 31, | |
| | |
| | | 2019 | | | 2018 | |
Increase (Decrease) in Net Assets | | | | | | | | |
Operations | | | | | | | | |
Net investment income (loss) | | $ | 229,347 | | | $ | 101,481 | |
Net realized gain (loss) on investment transactions | | | (176,337 | ) | | | (19,490 | ) |
Net capital gain distributions received | | | 185,543 | | | | 60,710 | |
Net change in unrealized appreciation (depreciation) on investments | | | 247,270 | | | | 14,758 | |
| | | | | | | | |
Net increase (decrease) in net assets resulting from operations | | | 485,823 | | | | 157,459 | |
| | | | | | | | |
| | |
Dividends and Distributions | | | | | | | | |
Distributions from distributable earnings* | | | | | | | | |
Class R1 | | | (318 | ) | | | — | |
Class R2 | | | (30,436 | ) | | | — | |
Class R3 | | | (45,502 | ) | | | — | |
Class R4 | | | (476 | ) | | | — | |
Class R5 | | | (1,892 | ) | | | — | |
Class R6 | | | (231,940 | ) | | | — | |
| | | | | | | | |
| | | (310,564 | ) | | | — | |
| | | | | | | | |
Dividends from net investment income* | | | | | | | | |
Class R1 | | | | | | | (150 | ) |
Class R2 | | | | | | | (3,889 | ) |
Class R3 | | | | | | | (23,450 | ) |
Class R4 | | | | | | | (332 | ) |
Class R5 | | | | | | | (214 | ) |
Class R6 | | | | | | | (54,531 | ) |
| | | | | | | | |
| | | * | | | | (82,566 | ) |
| | | | | | | | |
Distributions from net realized gains* | | | | | | | | |
Class R1 | | | | | | | (4 | ) |
Class R2 | | | | | | | (4 | ) |
Class R3 | | | | | | | (497 | ) |
Class R4 | | | | | | | (7 | ) |
Class R5 | | | | | | | (4 | ) |
Class R6 | | | | | | | (860 | ) |
| | | | | | | | |
| | | * | | | | (1,376 | ) |
| | | | | | | | |
See Notes to Financial Statements.
| | | | | | | | |
| |
| | | Year Ended July 31, | |
| | |
| | | 2019 | | | 2018 | |
Fund share transactions | | | | | | | | |
Net proceeds from shares sold | | $ | 6,027,606 | | | $ | 4,309,508 | |
Net asset value of shares issued in reinvestment of dividends and distributions | | | 310,564 | | | | 83,943 | |
Cost of shares reacquired | | | (2,357,048 | ) | | | (692,336 | ) |
| | | | | | | | |
Net increase (decrease) in net assets from Fund share transactions | | | 3,981,122 | | | | 3,701,115 | |
| | | | | | | | |
Total increase (decrease) | | | 4,156,381 | | | | 3,774,632 | |
| | |
Net Assets: | | | | | | | | |
Beginning of year | | | 5,813,751 | | | | 2,039,119 | |
| | | | | | | | |
End of year(a) | | $ | 9,970,132 | | | $ | 5,813,751 | |
| | | | | | | | |
(a) Includes undistributed/(distributions in excess of) net investment income of: | | $ | * | | | $ | 25,484 | |
| | | | | | | | |
| * | For the year ended July 31, 2019, the disclosures have been revised to reflect revisions to RegulationS-X adopted by the SEC in 2018 (refer to Note 9). |
See Notes to Financial Statements.
| | | | |
| Prudential Day One Funds | | | 71 | |
Prudential Day One 2010 Fund
Schedule of Investments
as of July 31, 2019
| | | | | | | | |
| Description | | Shares | | | Value | |
LONG-TERM INVESTMENTS 90.9% | | | | | | | | |
| | |
AFFILIATED MUTUAL FUNDS | | | | | | | | |
PGIM Core Conservative Bond Fund (Class R6) | | | 66,145 | | | $ | 669,388 | |
PGIM Global Real Estate Fund (Class R6) | | | 11,054 | | | | 283,309 | |
PGIM JennisonSmall-Cap Core Equity Fund (Class R6) | | | 3,982 | | | | 47,030 | |
PGIM QMA Commodity Strategies Fund (Class R6) | | | 25,210 | | | | 237,984 | |
PGIM QMA International Developed Markets Index Fund (Class R6) | | | 20,295 | | | | 236,036 | |
PGIM QMALarge-Cap Core Equity Fund (Class R6) | | | 36,687 | | | | 565,341 | |
PGIM QMAMid-Cap Core Equity Fund (Class R6) | | | 4,346 | | | | 47,113 | |
PGIM QMA US Broad Market Index Fund (Class R6) | | | 20,785 | | | | 282,674 | |
PGIM TIPS Fund (Class R6) | | | 126,162 | | | | 1,245,219 | |
PGIM Total Return Bond Fund (Class R6) | | | 48,672 | | | | 718,891 | |
| | | | | | | | |
TOTAL LONG-TERM INVESTMENTS
(cost $4,184,702) | | | | | | | 4,332,985 | |
| | | | | | | | |
| | |
SHORT-TERM INVESTMENT 10.4% | | | | | | | | |
| | |
AFFILIATED MUTUAL FUND | | | | | | | | |
PGIM Core Ultra Short Bond Fund
(cost $493,908) | | | 493,908 | | | | 493,908 | |
| | | | | | | | |
TOTAL INVESTMENTS 101.3%
(cost $4,678,610)(w) | | | | | | | 4,826,893 | |
Liabilities in excess of other assets (1.3)% | | | | | | | (61,868 | ) |
| | | | | | | | |
NET ASSETS 100.0% | | | | | | $ | 4,765,025 | |
| | | | | | | | |
| (w) | PGIM Investments LLC, the manager of the Fund, also serves as the manager of the underlying funds in which the Fund invests. |
Fair Value Measurements:
Various inputs are used in determining the value of the Fund’s investments. These inputs are summarized in the three broad levels listed below.
Level 1—unadjusted quoted prices generally in active markets for identical securities.
Level 2—quoted prices for similar securities, interest rates and yield curves, prepayment speeds, foreign currency exchange rates and other observable inputs.
Level 3—unobservable inputs for securities valued in accordance with Board approved fair valuation procedures.
See Notes to Financial Statements.
The following is a summary of the inputs used as of July 31, 2019 in valuing such portfolio securities:
| | | | | | | | | | | | |
| | | Level 1 | | | Level 2 | | | Level 3 | |
Investments in Securities | | | | | | | | | | | | |
Affiliated Mutual Funds | | $ | 4,826,893 | | | $ | — | | | $ | — | |
| | | | | | | | | | | | |
Investment Allocation:
The investment allocation of portfolio holdings and liabilities in excess of other assets shown as a percentage of net assets as of July 31, 2019 were as follows (unaudited):
| | | | |
TIPS | | | 26.1 | % |
Total Return Bond | | | 15.1 | |
Core Bond | | | 14.0 | |
Large Cap | | | 11.9 | |
Short Term | | | 10.4 | |
Real Estate | | | 5.9 | |
Broad Market | | | 5.9 | |
Commodity | | | 5.0 | |
International Developed Markets | | | 5.0 | |
Mid Cap | | | 1.0 | % |
Small Cap | | | 1.0 | |
| | | | |
| | | 101.3 | |
Liabilities in excess of other assets | | | (1.3 | ) |
| | | | |
| | | 100.0 | % |
| | | | |
See Notes to Financial Statements.
| | | | |
| Prudential Day One Funds | | | 73 | |
Prudential Day One 2010 Fund
Statement of Assets & Liabilities
as of July 31, 2019
| | | | |
Assets | | | | |
Affiliated investments (cost $4,678,610) | | $ | 4,826,893 | |
Receivable for investments sold | | | 28,808 | |
Due from Manager | | | 15,453 | |
Receivable for Fund shares sold | | | 170 | |
| | | | |
Total Assets | | | 4,871,324 | |
| | | | |
| |
Liabilities | | | | |
Custodian and accounting fees payable | | | 47,526 | |
Payable for investments purchased | | | 26,046 | |
Audit fee payable | | | 20,402 | |
Accrued expenses and other liabilities | | | 11,477 | |
Payable for Fund shares reacquired | | | 465 | |
Affiliated transfer agent fee payable | | | 339 | |
Affiliated shareholder servicing fees payable | | | 23 | |
Distribution fee payable | | | 21 | |
| | | | |
Total Liabilities | | | 106,299 | |
| | | | |
| |
Net Assets | | $ | 4,765,025 | |
| | | | |
| | | | | |
Net assets were comprised of: | | | | |
Shares of beneficial interest, at par | | $ | 442 | |
Paid-in capital in excess of par | | | 4,544,873 | |
Total distributable earnings (loss) | | | 219,710 | |
| | | | |
Net assets, July 31, 2019 | | $ | 4,765,025 | |
| | | | |
See Notes to Financial Statements.
| | | | |
Class R1 | | | | |
Net asset value, offering price and redemption price per share,
($11,448 ÷ 1,067 shares of beneficial interest issued and outstanding) | | $ | 10.73 | |
| | | | |
| |
Class R2 | | | | |
Net asset value, offering price and redemption price per share,
($11,402 ÷ 1,061 shares of beneficial interest issued and outstanding) | | $ | 10.74 | |
| | | | |
| |
Class R3 | | | | |
Net asset value, offering price and redemption price per share,
($156,995 ÷ 14,599 shares of beneficial interest issued and outstanding) | | $ | 10.75 | |
| | | | |
| |
Class R4 | | | | |
Net asset value, offering price and redemption price per share,
($11,471 ÷ 1,067 shares of beneficial interest issued and outstanding) | | $ | 10.75 | |
| | | | |
| |
Class R5 | | | | |
Net asset value, offering price and redemption price per share,
($871,630 ÷ 80,948 shares of beneficial interest issued and outstanding) | | $ | 10.77 | |
| | | | |
| |
Class R6 | | | | |
Net asset value, offering price and redemption price per share,
($3,702,079 ÷ 343,469 shares of beneficial interest issued and outstanding) | | $ | 10.78 | |
| | | | |
See Notes to Financial Statements.
| | | | |
| Prudential Day One Funds | | | 75 | |
Prudential Day One 2010 Fund
Statement of Operations
Year Ended July 31, 2019
| | | | |
Net Investment Income (Loss) | | | | |
Affiliated dividend income | | $ | 147,585 | |
| | | | |
| |
Expenses | | | | |
Management fee | | | 1,114 | |
Distribution fee(a) | | | 231 | |
Shareholder servicing fees (including affiliated expense of $150)(a) | | | 174 | |
Custodian and accounting fees | | | 118,061 | |
Registration fees(a) | | | 68,280 | |
Audit fee | | | 20,402 | |
Legal fees and expenses | | | 17,294 | |
Trustees’ fees | | | 11,243 | |
Shareholders’ reports | | | 10,073 | |
Transfer agent’s fees and expenses (including affiliated expense of $2,012)(a) | | | 2,249 | |
Miscellaneous | | | 13,997 | |
| | | | |
Total expenses | | | 263,118 | |
Less: Fee waiver and/or expense reimbursement(a) | | | (262,063 | ) |
| | | | |
Net expenses | | | 1,055 | |
| | | | |
Net investment income (loss) | | | 146,530 | |
| | | | |
| |
Realized And Unrealized Gain (Loss) On Affiliated Investments | | | | |
Net realized gain (loss) on investment transactions | | | (69,668 | ) |
Net capital gain distributions received | | | 121,387 | |
| | | | |
| | | 51,719 | |
| | | | |
Net change in unrealized appreciation (depreciation) on investments | | | 78,484 | |
| | | | |
Net gain (loss) on investment transactions | | | 130,203 | |
| | | | |
Net Increase (Decrease) In Net Assets Resulting From Operations | | $ | 276,733 | |
| | | | |
| (a) | Class specific expenses and waivers were as follows: |
| | | | | | | | | | | | | | | | | | | | | | | | |
| | | Class R1 | | | Class R2 | | | Class R3 | | | Class R4 | | | Class R5 | | | Class R6 | |
Distribution fee | | | 55 | | | | 31 | | | | 145 | | | | — | | | | — | | | | — | |
Shareholder servicing fees | | | — | | | | — | | | | 145 | | | | 29 | | | | — | | | | — | |
Registration fees | | | 11,380 | | | | 11,380 | | | | 11,380 | | | | 11,380 | | | | 11,380 | | | | 11,380 | |
Transfer agent’s fees and expenses | | | 75 | | | | 53 | | | | 269 | | | | 98 | | | | 1,352 | | | | 402 | |
Fee waiver and/or expense reimbursement | | | (11,810 | ) | | | (11,834 | ) | | | (16,470 | ) | | | (12,430 | ) | | | (40,788 | ) | | | (168,731 | ) |
See Notes to Financial Statements.
Prudential Day One 2010 Fund
Statements of Changes in Net Assets
| | | | | | | | |
| |
| | | Year Ended July 31, | |
| | |
| | | 2019 | | | 2018 | |
Increase (Decrease) in Net Assets | | | | | | | | |
Operations | | | | | | | | |
Net investment income (loss) | | $ | 146,530 | | | $ | 130,843 | |
Net realized gain (loss) on investment transactions | | | (69,668 | ) | | | 8,759 | |
Net capital gain distributions received | | | 121,387 | | | | 78,654 | |
Net change in unrealized appreciation (depreciation) on investments | | | 78,484 | | | | 14,360 | |
| | | | | | | | |
Net increase (decrease) in net assets resulting from operations | | | 276,733 | | | | 232,616 | |
| | | | | | | | |
| | |
Dividends and Distributions | | | | | | | | |
Distributions from distributable earnings* | | | | | | | | |
Class R1 | | | (444 | ) | | | — | |
Class R2 | | | (471 | ) | | | — | |
Class R3 | | | (6,295 | ) | | | — | |
Class R4 | | | (2,395 | ) | | | — | |
Class R5 | | | (38,335 | ) | | | — | |
Class R6 | | | (220,690 | ) | | | — | |
| | | | | | | | |
| | | (268,630 | ) | | | — | |
| | | | | | | | |
Dividends from net investment income* | | | | | | | | |
Class R1 | | | | | | | (95 | ) |
Class R2 | | | | | | | (122 | ) |
Class R3 | | | | | | | (2,100 | ) |
Class R4 | | | | | | | (623 | ) |
Class R5 | | | | | | | (160 | ) |
Class R6 | | | | | | | (72,357 | ) |
| | | | | | | | |
| | | * | | | | (75,457 | ) |
| | | | | | | | |
Distributions from net realized gains* | | | | | | | | |
Class R1 | | | | | | | (18 | ) |
Class R2 | | | | | | | (18 | ) |
Class R3 | | | | | | | (269 | ) |
Class R4 | | | | | | | (74 | ) |
Class R5 | | | | | | | (18 | ) |
Class R6 | | | | | | | (7,235 | ) |
| | | | | | | | |
| | | * | | | | (7,632 | ) |
| | | | | | | | |
See Notes to Financial Statements.
| | | | |
| Prudential Day One Funds | | | 77 | |
Prudential Day One 2010 Fund
Statements of Changes in Net Assets(continued)
| | | | | | | | |
| |
| | | Year Ended July 31, | |
| | |
| | | 2019 | | | 2018 | |
Fund share transactions | | | | | | | | |
Net proceeds from shares sold | | $ | 1,535,500 | | | $ | 3,019,029 | |
Net asset value of shares issued in reinvestment of dividends and distributions | | | 268,630 | | | | 83,090 | |
Cost of shares reacquired | | | (2,688,002 | ) | | | (2,130,951 | ) |
| | | | | | | | |
Net increase (decrease) in net assets from Fund share transactions | | | (883,872 | ) | | | 971,168 | |
| | | | | | | | |
Total increase (decrease) | | | (875,769 | ) | | | 1,120,695 | |
| | |
Net Assets: | | | | | | | | |
Beginning of year | | | 5,640,794 | | | | 4,520,099 | |
| | | | | | | | |
End of year(a) | | $ | 4,765,025 | | | $ | 5,640,794 | |
| | | | | | | | |
(a) Includes undistributed/(distributions in excess of) net investment income of: | | $ | * | | | $ | 69,802 | |
| | | | | | | | |
| * | For the year ended July 31, 2019, the disclosures have been revised to reflect revisions to RegulationS-X adopted by the SEC in 2018 (refer to Note 9). |
See Notes to Financial Statements.
Prudential Day One 2015 Fund
Schedule of Investments
as of July 31, 2019
| | | | | | | | |
| Description | | Shares | | | Value | |
LONG-TERM INVESTMENTS 90.9% | | | | | | | | |
| | |
AFFILIATED MUTUAL FUNDS | | | | | | | | |
PGIM Core Conservative Bond Fund (Class R6) | | | 144,006 | | | $ | 1,457,338 | |
PGIM Global Real Estate Fund (Class R6) | | | 25,924 | | | | 664,422 | |
PGIM JennisonSmall-Cap Core Equity Fund (Class R6) | | | 9,339 | | | | 110,296 | |
PGIM QMA Commodity Strategies Fund (Class R6) | | | 59,121 | | | | 558,103 | |
PGIM QMA International Developed Markets Index Fund (Class R6) | | | 57,114 | | | | 664,241 | |
PGIM QMALarge-Cap Core Equity Fund (Class R6) | | | 93,208 | | | | 1,436,340 | |
PGIM QMAMid-Cap Core Equity Fund (Class R6) | | | 20,385 | | | | 220,972 | |
PGIM QMA US Broad Market Index Fund (Class R6) | | | 56,869 | | | | 773,424 | |
PGIM TIPS Fund (Class R6) | | | 273,026 | | | | 2,694,764 | |
PGIM Total Return Bond Fund (Class R6) | | | 106,503 | | | | 1,573,054 | |
| | | | | | | | |
TOTAL LONG-TERM INVESTMENTS
(cost $9,828,422) | | | | | | | 10,152,954 | |
| | | | | | | | |
| | |
SHORT-TERM INVESTMENT 9.6% | | | | | | | | |
| | |
AFFILIATED MUTUAL FUND | | | | | | | | |
PGIM Core Ultra Short Bond Fund
(cost $1,074,467) | | | 1,074,467 | | | | 1,074,467 | |
| | | | | | | | |
TOTAL INVESTMENTS 100.5%
(cost $10,902,889)(w) | | | | | | | 11,227,421 | |
Liabilities in excess of other assets (0.5)% | | | | | | | (60,041 | ) |
| | | | | | | | |
NET ASSETS 100.0% | | | | | | $ | 11,167,380 | |
| | | | | | | | |
| (w) | PGIM Investments LLC, the manager of the Fund, also serves as the manager of the underlying funds in which the Fund invests. |
Fair Value Measurements:
Various inputs are used in determining the value of the Fund’s investments. These inputs are summarized in the three broad levels listed below.
Level 1—unadjusted quoted prices generally in active markets for identical securities.
Level 2—quoted prices for similar securities, interest rates and yield curves, prepayment speeds, foreign currency exchange rates and other observable inputs.
Level 3—unobservable inputs for securities valued in accordance with Board approved fair valuation procedures.
See Notes to Financial Statements.
| | | | |
| Prudential Day One Funds | | | 79 | |
Prudential Day One 2015 Fund
Schedule of Investments(continued)
as of July 31, 2019
The following is a summary of the inputs used as of July 31, 2019 in valuing such portfolio securities:
| | | | | | | | | | | | |
| | | Level 1 | | | Level 2 | | | Level 3 | |
Investments in Securities | | | | | | | | | | | | |
Affiliated Mutual Funds | | $ | 11,227,421 | | | $ | — | | | $ | — | |
| | | | | | | | | | | | |
Investment Allocation:
The investment allocation of portfolio holdings and liabilities in excess of other assets shown as a percentage of net assets as of July 31, 2019 were as follows (unaudited):
| | | | |
TIPS | | | 24.1 | % |
Total Return Bond | | | 14.1 | |
Core Bond | | | 13.1 | |
Large Cap | | | 12.9 | |
Short Term | | | 9.6 | |
Broad Market | | | 6.9 | |
Real Estate | | | 5.9 | |
International Developed Markets | | | 5.9 | |
Commodity | | | 5.0 | |
Mid Cap | | | 2.0 | % |
Small Cap | | | 1.0 | |
| | | | |
| | | 100.5 | |
Liabilities in excess of other assets | | | (0.5 | ) |
| | | | |
| | | 100.0 | % |
| | | | |
See Notes to Financial Statements.
Prudential Day One 2015 Fund
Statement of Assets & Liabilities
as of July 31, 2019
| | | | |
Assets | | | | |
Affiliated investments (cost $10,902,889) | | $ | 11,227,421 | |
Receivable for investments sold | | | 65,306 | |
Due from Manager | | | 13,536 | |
Receivable for Fund shares sold | | | 1,834 | |
| | | | |
Total Assets | | | 11,308,097 | |
| | | | |
| |
Liabilities | | | | |
Payable for investments purchased | | | 61,191 | |
Custodian and accounting fees payable | | | 47,339 | |
Audit fee payable | | | 20,402 | |
Accrued expenses and other liabilities | | | 11,613 | |
Affiliated transfer agent fee payable | | | 113 | |
Payable for Fund shares reacquired | | | 51 | |
Distribution fee payable | | | 8 | |
| | | | |
Total Liabilities | | | 140,717 | |
| | | | |
| |
Net Assets | | $ | 11,167,380 | |
| | | | |
| | | | | |
Net assets were comprised of: | | | | |
Shares of beneficial interest, at par | | $ | 1,020 | |
Paid-in capital in excess of par | | | 10,742,096 | |
Total distributable earnings (loss) | | | 424,264 | |
| | | | |
Net assets, July 31, 2019 | | $ | 11,167,380 | |
| | | | |
See Notes to Financial Statements.
| | | | |
| Prudential Day One Funds | | | 81 | |
Prudential Day One 2015 Fund
Statement of Assets & Liabilities(continued)
as of July 31, 2019
| | | | |
Class R1 | | | | |
Net asset value, offering price and redemption price per share,
($11,415 ÷ 1,047 shares of beneficial interest issued and outstanding) | | $ | 10.91 | |
| | | | |
| |
Class R2 | | | | |
Net asset value, offering price and redemption price per share,
($11,640 ÷ 1,066 shares of beneficial interest issued and outstanding) | | $ | 10.92 | |
| | | | |
| |
Class R3 | | | | |
Net asset value, offering price and redemption price per share,
($11,535 ÷ 1,055 shares of beneficial interest issued and outstanding) | | $ | 10.93 | |
| | | | |
| |
Class R4 | | | | |
Net asset value, offering price and redemption price per share,
($11,556 ÷ 1,057 shares of beneficial interest issued and outstanding) | | $ | 10.93 | |
| | | | |
| |
Class R5 | | | | |
Net asset value, offering price and redemption price per share,
($39,947 ÷ 3,649 shares of beneficial interest issued and outstanding) | | $ | 10.95 | |
| | | | |
| |
Class R6 | | | | |
Net asset value, offering price and redemption price per share,
($11,081,287 ÷ 1,012,229 shares of beneficial interest issued and outstanding) | | $ | 10.95 | |
| | | | |
See Notes to Financial Statements.
Prudential Day One 2015 Fund
Statement of Operations
Year Ended July 31, 2019
| | | | |
Net Investment Income (Loss) | | | | |
Affiliated dividend income | | $ | 258,685 | |
| | | | |
| |
Expenses | | | | |
Management fee | | | 2,012 | |
Distribution fee(a) | | | 98 | |
Shareholder servicing fees (including affiliated expense of $33)(a) | | | 44 | |
Custodian and accounting fees | | | 118,017 | |
Registration fees(a) | | | 68,280 | |
Audit fee | | | 20,402 | |
Legal fees and expenses | | | 17,309 | |
Trustees’ fees | | | 11,323 | |
Shareholders’ reports | | | 10,378 | |
Transfer agent’s fees and expenses (including affiliated expense of $664)(a) | | | 878 | |
Miscellaneous | | | 14,010 | |
| | | | |
Total expenses | | | 262,751 | |
Less: Fee waiver and/or expense reimbursement(a) | | | (263,989 | ) |
| | | | |
Net expenses | | | (1,238 | ) |
| | | | |
Net investment income (loss) | | | 259,923 | |
| | | | |
| |
Realized And Unrealized Gain (Loss) On Affiliated Investments | | | | |
Net realized gain (loss) on investment transactions | | | (179,075 | ) |
Net capital gain distributions received | | | 243,889 | |
| | | | |
| | | 64,814 | |
| | | | |
Net change in unrealized appreciation (depreciation) on investments | | | 199,245 | |
| | | | |
Net gain (loss) on investment transactions | | | 264,059 | |
| | | | |
Net Increase (Decrease) In Net Assets Resulting From Operations | | $ | 523,982 | |
| | | | |
| (a) | Class specific expenses and waivers were as follows: |
| | | | | | | | | | | | | | | | | | | | | | | | |
| | | Class R1 | | | Class R2 | | | Class R3 | | | Class R4 | | | Class R5 | | | Class R6 | |
Distribution fee | | | 55 | | | | 32 | | | | 11 | | | | — | | | | — | | | | — | |
Shareholder servicing fees | | | — | | | | — | | | | — | | | | 44 | | | | — | | | | — | |
Registration fees | | | 11,380 | | | | 11,380 | | | | 11,380 | | | | 11,380 | | | | 11,380 | | | | 11,380 | |
Transfer agent’s fees and expenses | | | 40 | | | | 52 | | | | 41 | | | | 134 | | | | 96 | | | | 515 | |
Fee waiver and/or expense reimbursement | | | (11,606 | ) | | | (11,647 | ) | | | (11,608 | ) | | | (12,327 | ) | | | (11,969 | ) | | | (204,832 | ) |
See Notes to Financial Statements.
| | | | |
| Prudential Day One Funds | | | 83 | |
Prudential Day One 2015 Fund
Statements of Changes in Net Assets
| | | | | | | | |
| |
| | | Year Ended July 31, | |
| | |
| | | 2019 | | | 2018 | |
Increase (Decrease) in Net Assets | | | | | | | | |
Operations | | | | | | | | |
Net investment income (loss) | | $ | 259,923 | | | $ | 171,171 | |
Net realized gain (loss) on investment transactions | | | (179,075 | ) | | | (33,968 | ) |
Net capital gain distributions received | | | 243,889 | | | | 123,774 | |
Net change in unrealized appreciation (depreciation) on investments | | | 199,245 | | | | 62,297 | |
| | | | | | | | |
Net increase (decrease) in net assets resulting from operations | | | 523,982 | | | | 323,274 | |
| | | | | | | | |
| | |
Dividends and Distributions | | | | | | | | |
Distributions from distributable earnings* | | | | | | | | |
Class R1 | | | (369 | ) | | | — | |
Class R2 | | | (397 | ) | | | — | |
Class R3 | | | (414 | ) | | | — | |
Class R4 | | | (3,183 | ) | | | — | |
Class R5 | | | (986 | ) | | | — | |
Class R6 | | | (386,009 | ) | | | — | |
| | | | | | | | |
| | | (391,358 | ) | | | — | |
| | | | | | | | |
Dividends from net investment income* | | | | | | | | |
Class R1 | | | | | | | (85 | ) |
Class R2 | | | | | | | (113 | ) |
Class R3 | | | | | | | (129 | ) |
Class R4 | | | | | | | (811 | ) |
Class R5 | | | | | | | (151 | ) |
Class R6 | | | | | | | (94,760 | ) |
| | | | | | | | |
| | | * | | | | (96,049 | ) |
| | | | | | | | |
Distributions from net realized gains* | | | | | | | | |
Class R1 | | | | | | | (15 | ) |
Class R2 | | | | | | | (15 | ) |
Class R3 | | | | | | | (15 | ) |
Class R4 | | | | | | | (89 | ) |
Class R5 | | | | | | | (15 | ) |
Class R6 | | | | | | | (8,629 | ) |
| | | | | | | | |
| | | * | | | | (8,778 | ) |
| | | | | | | | |
See Notes to Financial Statements.
| | | | | | | | |
| |
| | | Year Ended July 31, | |
| | |
| | | 2019 | | | 2018 | |
Fund share transactions | | | | | | | | |
Net proceeds from shares sold | | $ | 4,105,944 | | | $ | 7,266,121 | |
Net asset value of shares issued in reinvestment of dividends and distributions | | | 392,135 | | | | 104,826 | |
Cost of shares reacquired | | | (2,162,180 | ) | | | (3,082,317 | ) |
| | | | | | | | |
Net increase (decrease) in net assets from Fund share transactions | | | 2,335,899 | | | | 4,288,630 | |
| | | | | | | | |
Total increase (decrease) | | | 2,468,523 | | | | 4,507,077 | |
| | |
Net Assets: | | | | | | | | |
Beginning of year | | | 8,698,857 | | | | 4,191,780 | |
| | | | | | | | |
End of year(a) | | $ | 11,167,380 | | | $ | 8,698,857 | |
| | | | | | | | |
(a) Includes undistributed/(distributions in excess of) net investment income of: | | $ | * | | | $ | 95,236 | |
| | | | | | | | |
| * | For the year ended July 31, 2019, the disclosures have been revised to reflect revisions to RegulationS-X adopted by the SEC in 2018 (refer to Note 9). |
See Notes to Financial Statements.
| | | | |
| Prudential Day One Funds | | | 85 | |
Prudential Day One 2020 Fund
Schedule of Investments
as of July 31, 2019
| | | | | | | | |
| Description | | Shares | | | Value | |
LONG-TERM INVESTMENTS 91.9% | | | | | | | | |
| | |
AFFILIATED MUTUAL FUNDS | | | | | | | | |
PGIM Core Conservative Bond Fund (Class R6) | | | 518,500 | | | $ | 5,247,222 | |
PGIM Global Real Estate Fund (Class R6) | | | 101,124 | | | | 2,591,816 | |
PGIM JennisonSmall-Cap Core Equity Fund (Class R6) | | | 36,431 | | | | 430,250 | |
PGIM QMA Commodity Strategies Fund (Class R6) | | | 230,621 | | | | 2,177,060 | |
PGIM QMA International Developed Markets Index Fund (Class R6) | | | 259,926 | | | | 3,022,939 | |
PGIM QMALarge-Cap Core Equity Fund (Class R6) | | | 475,469 | | | | 7,326,975 | |
PGIM QMAMid-Cap Core Equity Fund (Class R6) | | | 79,518 | | | | 861,979 | |
PGIM QMA US Broad Market Index Fund (Class R6) | | | 253,532 | | | | 3,448,034 | |
PGIM TIPS Fund (Class R6) | | | 976,201 | | | | 9,635,105 | |
PGIM Total Return Bond Fund (Class R6) | | | 356,075 | | | | 5,259,229 | |
| | | | | | | | |
TOTAL LONG-TERM INVESTMENTS
(cost $38,760,258) | | | | | | | 40,000,609 | |
| | | | | | | | |
| | |
SHORT-TERM INVESTMENT 8.2% | | | | | | | | |
| | |
AFFILIATED MUTUAL FUND | | | | | | | | |
PGIM Core Ultra Short Bond Fund
(cost $3,565,581) | | | 3,565,581 | | | | 3,565,581 | |
| | | | | | | | |
TOTAL INVESTMENTS 100.1%
(cost $42,325,839)(w) | | | | | | | 43,566,190 | |
Liabilities in excess of other assets (0.1)% | | | | | | | (44,275 | ) |
| | | | | | | | |
NET ASSETS 100.0% | | | | | | $ | 43,521,915 | |
| | | | | | | | |
| (w) | PGIM Investments LLC, the manager of the Fund, also serves as the manager of the underlying funds in which the Fund invests. |
Fair Value Measurements:
Various inputs are used in determining the value of the Fund’s investments. These inputs are summarized in the three broad levels listed below.
Level 1—unadjusted quoted prices generally in active markets for identical securities.
Level 2—quoted prices for similar securities, interest rates and yield curves, prepayment speeds, foreign currency exchange rates and other observable inputs.
Level 3—unobservable inputs for securities valued in accordance with Board approved fair valuation procedures.
See Notes to Financial Statements.
The following is a summary of the inputs used as of July 31, 2019 in valuing such portfolio securities:
| | | | | | | | | | | | |
| | | Level 1 | | | Level 2 | | | Level 3 | |
Investments in Securities | | | | | | | | | | | | |
Affiliated Mutual Funds | | $ | 43,566,190 | | | $ | — | | | $ | — | |
| | | | | | | | | | | | |
Investment Allocation:
The investment allocation of portfolio holdings and liabilities in excess of other assets shown as a percentage of net assets as of July 31, 2019 were as follows (unaudited):
| | | | |
TIPS | | | 22.1 | % |
Large Cap | | | 16.8 | |
Total Return Bond | | | 12.1 | |
Core Bond | | | 12.1 | |
Short Term | | | 8.2 | |
Broad Market | | | 7.9 | |
International Developed Markets | | | 6.9 | |
Real Estate | | | 6.0 | |
Commodity | | | 5.0 | |
Mid Cap | | | 2.0 | % |
Small Cap | | | 1.0 | |
| | | | |
| | | 100.1 | |
Liabilities in excess of other assets | | | (0.1 | ) |
| | | | |
| | | 100.0 | % |
| | | | |
See Notes to Financial Statements.
| | | | |
| Prudential Day One Funds | | | 87 | |
Prudential Day One 2020 Fund
Statement of Assets & Liabilities
as of July 31, 2019
| | | | |
Assets | | | | |
Affiliated investments (cost $42,325,839) | | $ | 43,566,190 | |
Receivable for investments sold | | | 307,168 | |
Due from Manager | | | 13,864 | |
Receivable for Fund shares sold | | | 10,074 | |
| | | | |
Total Assets | | | 43,897,296 | |
| | | | |
| |
Liabilities | | | | |
Payable for investments purchased | | | 249,655 | |
Custodian and accounting fees payable | | | 47,410 | |
Payable for Fund shares reacquired | | | 42,799 | |
Audit fee payable | | | 20,402 | |
Accrued expenses and other liabilities | | | 11,703 | |
Affiliated transfer agent fee payable | | | 2,077 | |
Distribution fee payable | | | 743 | |
Affiliated shareholder servicing fees payable | | | 592 | |
| | | | |
Total Liabilities | | | 375,381 | |
| | | | |
| |
Net Assets | | $ | 43,521,915 | |
| | | | |
Net assets were comprised of: | | | | |
Shares of beneficial interest, at par | | $ | 3,918 | |
Paid-in capital in excess of par | | | 41,909,334 | |
Total distributable earnings (loss) | | | 1,608,663 | |
| | | | |
Net assets, July 31, 2019 | | $ | 43,521,915 | |
| | | | |
See Notes to Financial Statements.
| | | | |
Class R1 | | | | |
Net asset value, offering price and redemption price per share,
($11,534 ÷ 1,040 shares of beneficial interest issued and outstanding) | | $ | 11.09 | |
| | | | |
| |
Class R2 | | | | |
Net asset value, offering price and redemption price per share,
($3,445,629 ÷ 310,264 shares of beneficial interest issued and outstanding) | | $ | 11.11 | |
| | | | |
| |
Class R3 | | | | |
Net asset value, offering price and redemption price per share,
($1,072,264 ÷ 96,383 shares of beneficial interest issued and outstanding) | | $ | 11.13 | |
| | | | |
| |
Class R4 | | | | |
Net asset value, offering price and redemption price per share,
($11,693 ÷ 1,050 shares of beneficial interest issued and outstanding) | | $ | 11.13 | |
| | | | |
| |
Class R5 | | | | |
Net asset value, offering price and redemption price per share,
($3,962,465 ÷ 355,743 shares of beneficial interest issued and outstanding) | | $ | 11.14 | |
| | | | |
| |
Class R6 | | | | |
Net asset value, offering price and redemption price per share,
($35,018,330 ÷ 3,153,122 shares of beneficial interest issued and outstanding) | | $ | 11.11 | |
| | | | |
See Notes to Financial Statements.
| | | | |
| Prudential Day One Funds | | | 89 | |
Prudential Day One 2020 Fund
Statement of Operations
Year Ended July 31, 2019
| | | | |
Net Investment Income (Loss) | | | | |
Affiliated dividend income | | $ | 943,961 | |
| | | | |
| |
Expenses | | | | |
Management fee | | | 7,492 | |
Distribution fee(a) | | | 7,260 | |
Shareholder servicing fees (including affiliated expense of $3,444)(a) | | | 3,559 | |
Custodian and accounting fees | | | 117,874 | |
Registration fees(a) | | | 69,000 | |
Audit fee | | | 20,402 | |
Legal fees and expenses | | | 17,353 | |
Transfer agent’s fees and expenses (including affiliated expense of $12,013)(a) | | | 12,694 | |
Trustees’ fees | | | 11,510 | |
Shareholders’ reports | | | 10,364 | |
Miscellaneous | | | 14,056 | |
| | | | |
Total expenses | | | 291,564 | |
Less: Fee waiver and/or expense reimbursement(a) | | | (274,525 | ) |
| | | | |
Net expenses | | | 17,039 | |
| | | | |
Net investment income (loss) | | | 926,922 | |
| | | | |
| |
Realized And Unrealized Gain (Loss) On Affiliated Investments | | | | |
Net realized gain (loss) on investment transactions | | | (802,876 | ) |
Net capital gain distributions received | | | 1,053,090 | |
| | | | |
| | | 250,214 | |
| | | | |
Net change in unrealized appreciation (depreciation) on investments | | | 716,872 | |
| | | | |
Net gain (loss) on investment transactions | | | 967,086 | |
| | | | |
Net Increase (Decrease) In Net Assets Resulting From Operations | | $ | 1,894,008 | |
| | | | |
| (a) | Class specific expenses and waivers were as follows: |
| | | | | | | | | | | | | | | | | | | | | | | | |
| | | Class R1 | | | Class R2 | | | Class R3 | | | Class R4 | | | Class R5 | | | Class R6 | |
Distribution fee | | | 55 | | | | 6,139 | | | | 1,066 | | | | — | | | | — | | | | — | |
Shareholder servicing fees | | | — | | | | 2,456 | | | | 1,066 | | | | 37 | | | | — | | | | — | |
Registration fees | | | 11,500 | | | | 11,500 | | | | 11,500 | | | | 11,500 | | | | 11,500 | | | | 11,500 | |
Transfer agent’s fees and expenses | | | 40 | | | | 3,872 | | | | 1,814 | | | | 119 | | | | 5,904 | | | | 945 | |
Fee waiver and/or expense reimbursement | | | (11,574 | ) | | | (25,127 | ) | | | (17,567 | ) | | | (11,772 | ) | | | (32,486 | ) | | | (175,999 | ) |
See Notes to Financial Statements.
Prudential Day One 2020 Fund
Statements of Changes in Net Assets
| | | | | | | | |
| |
| | | Year Ended July 31, | |
| | |
| | | 2019 | | | 2018 | |
Increase (Decrease) in Net Assets | | | | | | | | |
Operations | | | | | | | | |
Net investment income (loss) | | $ | 926,922 | | | $ | 465,939 | |
Net realized gain (loss) on investment transactions | | | (802,876 | ) | | | (119,090 | ) |
Net capital gain distributions received | | | 1,053,090 | | | | 396,521 | |
Net change in unrealized appreciation (depreciation) on investments | | | 716,872 | | | | 332,048 | |
| | | | | | | | |
Net increase (decrease) in net assets resulting from operations | | | 1,894,008 | | | | 1,075,418 | |
| | | | | | | | |
| | |
Dividends and Distributions | | | | | | | | |
Distributions from distributable earnings* | | | | | | | | |
Class R1 | | | (309 | ) | | | — | |
Class R2 | | | (73,312 | ) | | | — | |
Class R3 | | | (39,719 | ) | | | — | |
Class R4 | | | (2,046 | ) | | | — | |
Class R5 | | | (131,171 | ) | | | — | |
Class R6 | | | (1,057,196 | ) | | | — | |
| | | | | | | | |
| | | (1,303,753 | ) | | | — | |
| | | | | | | | |
Dividends from net investment income* | | | | | | | | |
Class R1 | | | | | | | (86 | ) |
Class R2 | | | | | | | (315 | ) |
Class R3 | | | | | | | (9,100 | ) |
Class R4 | | | | | | | (2,476 | ) |
Class R5 | | | | | | | (152 | ) |
Class R6 | | | | | | | (246,578 | ) |
| | | | | | | | |
| | | * | | | | (258,707 | ) |
| | | | | | | | |
Distributions from net realized gains* | | | | | | | | |
Class R1 | | | | | | | (8 | ) |
Class R2 | | | | | | | (22 | ) |
Class R3 | | | | | | | (556 | ) |
Class R4 | | | | | | | (139 | ) |
Class R5 | | | | | | | (8 | ) |
Class R6 | | | | | | | (11,492 | ) |
| | | | | | | | |
| | | * | | | | (12,225 | ) |
| | | | | | | | |
See Notes to Financial Statements.
| | | | |
| Prudential Day One Funds | | | 91 | |
Prudential Day One 2020 Fund
Statements of Changes in Net Assets(continued)
| | | | | | | | |
| |
| | | Year Ended July 31, | |
| | |
| | | 2019 | | | 2018 | |
Fund share transactions | | | | | | | | |
Net proceeds from shares sold | | $ | 20,455,132 | | | $ | 23,677,446 | |
Net asset value of shares issued in reinvestment of dividends and distributions | | | 1,303,753 | | | | 270,932 | |
Cost of shares reacquired | | | (8,918,999 | ) | | | (7,248,986 | ) |
| | | | | | | | |
Net increase (decrease) in net assets from Fund share transactions | | | 12,839,886 | | | | 16,699,392 | |
| | | | | | | | |
Total increase (decrease) | | | 13,430,141 | | | | 17,503,878 | |
| | |
Net Assets: | | | | | | | | |
Beginning of year | | | 30,091,774 | | | | 12,587,896 | |
| | | | | | | | |
End of year(a) | | $ | 43,521,915 | | | $ | 30,091,774 | |
| | | | | | | | |
(a) Includes undistributed/(distributions in excess of) net investment income of: | | $ | * | | | $ | 265,589 | |
| | | | | | | | |
| * | For the year ended July 31, 2019, the disclosures have been revised to reflect revisions to RegulationS-X adopted by the SEC in 2018 (refer to Note 9). |
See Notes to Financial Statements.
Prudential Day One 2025 Fund
Schedule of Investments
as of July 31, 2019
| | | | | | | | |
| Description | | Shares | | | Value | |
LONG-TERM INVESTMENTS 92.9% | | | | | | | | |
| | |
AFFILIATED MUTUAL FUNDS | | | | | | | | |
PGIM Core Conservative Bond Fund (Class R6) | | | 444,951 | | | $ | 4,502,908 | |
PGIM Global Real Estate Fund (Class R6) | | | 115,703 | | | | 2,965,474 | |
PGIM JennisonSmall-Cap Core Equity Fund (Class R6) | | | 41,683 | | | | 492,281 | |
PGIM QMA Commodity Strategies Fund (Class R6) | | | 263,867 | | | | 2,490,905 | |
PGIM QMA International Developed Markets Index Fund (Class R6) | | | 382,373 | | | | 4,446,994 | |
PGIM QMALarge-Cap Core Equity Fund (Class R6) | | | 608,019 | | | | 9,369,575 | |
PGIM QMAMid-Cap Core Equity Fund (Class R6) | | | 90,983 | | | | 986,256 | |
PGIM QMA US Broad Market Index Fund (Class R6) | | | 326,344 | | | | 4,438,279 | |
PGIM TIPS Fund (Class R6) | | | 1,015,438 | | | | 10,022,369 | |
PGIM Total Return Bond Fund (Class R6) | | | 441,376 | | | | 6,519,125 | |
| | | | | | | | |
TOTAL LONG-TERM INVESTMENTS
(cost $44,654,511) | | | | | | | 46,234,166 | |
| | | | | | | | |
| | |
SHORT-TERM INVESTMENT 7.2% | | | | | | | | |
| | |
AFFILIATED MUTUAL FUND | | | | | | | | |
PGIM Core Ultra Short Bond Fund
(cost $3,568,123)(w) | | | 3,568,123 | | | | 3,568,123 | |
| | | | | | | | |
TOTAL INVESTMENTS 100.1%
(cost $48,222,634) | | | | | | | 49,802,289 | |
Liabilities in excess of other assets (0.1)% | | | | | | | (37,898 | ) |
| | | | | | | | |
NET ASSETS 100.0% | | | | | | $ | 49,764,391 | |
| | | | | | | | |
| (w) | PGIM Investments LLC, the manager of the Fund, also serves as the manager of the underlying funds in which the Fund invests. |
Fair Value Measurements:
Various inputs are used in determining the value of the Fund’s investments. These inputs are summarized in the three broad levels listed below.
Level 1—unadjusted quoted prices generally in active markets for identical securities.
Level 2—quoted prices for similar securities, interest rates and yield curves, prepayment speeds, foreign currency exchange rates and other observable inputs.
Level 3—unobservable inputs for securities valued in accordance with Board approved fair valuation procedures.
See Notes to Financial Statements.
| | | | |
| Prudential Day One Funds | | | 93 | |
Prudential Day One 2025 Fund
Schedule of Investments (continued)
as of July 31, 2019
The following is a summary of the inputs used as of July 31, 2019 in valuing such portfolio securities:
| | | | | | | | | | | | |
| | | Level 1 | | | Level 2 | | | Level 3 | |
Investments in Securities | | | | | | | | | | | | |
Affiliated Mutual Funds | | $ | 49,802,289 | | | $ | — | | | $ | — | |
| | | | | | | | | | | | |
Investment Allocation:
The investment allocation of portfolio holdings and liabilities in excess of other assets shown as a percentage of net assets as of July 31, 2019 were as follows (unaudited):
| | | | |
TIPS | | | 20.1 | % |
Large Cap | | | 18.8 | |
Total Return Bond | | | 13.1 | |
Core Bond | | | 9.1 | |
International Developed Markets | | | 8.9 | |
Broad Market | | | 8.9 | |
Short Term | | | 7.2 | |
Real Estate | | | 6.0 | |
Commodity | | | 5.0 | |
Mid Cap | | | 2.0 | % |
Small Cap | | | 1.0 | |
| | | | |
| | | 100.1 | |
Liabilities in excess of other assets | | | (0.1 | ) |
| | | | |
| | | 100.0 | % |
| | | | |
See Notes to Financial Statements.
Prudential Day One 2025 Fund
Statement of Assets & Liabilities
as of July 31, 2019
| | | | |
Assets | | | | |
Affiliated investments (cost $48,222,634) | | $ | 49,802,289 | |
Receivable for investments sold | | | 347,057 | |
Due from Manager | | | 16,011 | |
Receivable for Fund shares sold | | | 10,858 | |
| | | | |
Total Assets | | | 50,176,215 | |
| | | | |
| |
Liabilities | | | | |
Payable for investments purchased | | | 322,985 | |
Custodian and accounting fees payable | | | 47,411 | |
Accrued expenses and other liabilities | | | 32,350 | |
Payable for Fund shares reacquired | | | 4,804 | |
Affiliated transfer agent fee payable | | | 2,080 | |
Affiliated shareholder servicing fees payable | | | 1,226 | |
Distribution fee payable | | | 968 | |
| | | | |
Total Liabilities | | | 411,824 | |
| | | | |
| |
Net Assets | | $ | 49,764,391 | |
| | | | |
| | | | | |
Net assets were comprised of: | | | | |
Shares of beneficial interest, at par | | $ | 4,447 | |
Paid-in capital in excess of par | | | 47,820,602 | |
Total distributable earnings (loss) | | | 1,939,342 | |
| | | | |
Net assets, July 31, 2019 | | $ | 49,764,391 | |
| | | | |
See Notes to Financial Statements.
| | | | |
| Prudential Day One Funds | | | 95 | |
Prudential Day One 2025 Fund
Statement of Assets & Liabilities(continued)
as of July 31, 2019
| | | | |
Class R1 | | | | |
Net asset value, offering price and redemption price per share,
($671,388 ÷ 60,280 shares of beneficial interest issued and outstanding) | | $ | 11.14 | |
| | | | |
| |
Class R2 | | | | |
Net asset value, offering price and redemption price per share,
($117,373 ÷ 10,523 shares of beneficial interest issued and outstanding) | | $ | 11.15 | |
| | | | |
| |
Class R3 | | | | |
Net asset value, offering price and redemption price per share,
($7,737,072 ÷ 692,931 shares of beneficial interest issued and outstanding) | | $ | 11.17 | |
| | | | |
| |
Class R4 | | | | |
Net asset value, offering price and redemption price per share,
($11,824 ÷ 1,059 shares of beneficial interest issued and outstanding) | | $ | 11.17 | |
| | | | |
| |
Class R5 | | | | |
Net asset value, offering price and redemption price per share,
($295,048 ÷ 26,407 shares of beneficial interest issued and outstanding) | | $ | 11.17 | |
| | | | |
| |
Class R6 | | | | |
Net asset value, offering price and redemption price per share,
($40,931,686 ÷ 3,656,297 shares of beneficial interest issued and outstanding) | | $ | 11.19 | |
| | | | |
See Notes to Financial Statements.
Prudential Day One 2025 Fund
Statement of Operations
Year Ended July 31, 2019
| | | | |
Net Investment Income (Loss) | | | | |
Affiliated dividend income | | $ | 1,065,097 | |
| | | | |
| |
Expenses | | | | |
Management fee | | | 8,514 | |
Distribution fee(a) | | | 9,985 | |
Shareholder servicing fees (including affiliated expense of $6,747)(a) | | | 7,470 | |
Custodian and accounting fees | | | 117,909 | |
Registration fees(a) | | | 68,610 | |
Audit fee | | | 20,402 | |
Legal fees and expenses | | | 17,380 | |
Transfer agent’s fees and expenses (including affiliated expense of $11,551)(a) | | | 12,640 | |
Trustees’ fees | | | 11,607 | |
Shareholders’ reports | | | 11,307 | |
Miscellaneous | | | 14,037 | |
| | | | |
Total expenses | | | 299,861 | |
Less: Fee waiver and/or expense reimbursement(a) | | | (274,765 | ) |
| | | | |
Net expenses | | | 25,096 | |
| | | | |
Net investment income (loss) | | | 1,040,001 | |
| | | | |
| |
Realized And Unrealized Gain (Loss) On Affiliated Investments | | | | |
Net realized gain (loss) on investment transactions | | | (1,132,568 | ) |
Net capital gain distributions received | | | 1,461,984 | |
| | | | |
| | | 329,416 | |
| | | | |
Net change in unrealized appreciation (depreciation) on investments | | | 839,486 | |
| | | | |
Net gain (loss) on investment transactions | | | 1,168,902 | |
| | | | |
Net Increase (Decrease) In Net Assets Resulting From Operations | | $ | 2,208,903 | |
| | | | |
| (a) | Class specific expenses and waivers were as follows: |
| | | | | | | | | | | | | | | | | | | | | | | | |
| | | Class R1 | | | Class R2 | | | Class R3 | | | Class R4 | | | Class R5 | | | Class R6 | |
Distribution fee | | | 3,127 | | | | 97 | | | | 6,761 | | | | — | | | | — | | | | — | |
Shareholder servicing fees | | | 625 | | | | 39 | | | | 6,761 | | | | 45 | | | | — | | | | — | |
Registration fees | | | 11,435 | | | | 11,435 | | | | 11,435 | | | | 11,435 | | | | 11,435 | | | | 11,435 | |
Transfer agent’s fees and expenses | | | 654 | | | | 328 | | | | 10,306 | | | | 124 | | | | 177 | | | | 1,051 | |
Fee waiver and/or expense reimbursement | | | (14,204 | ) | | | (11,888 | ) | | | (44,407 | ) | | | (11,730 | ) | | | (11,842 | ) | | | (180,694 | ) |
See Notes to Financial Statements.
| | | | |
| Prudential Day One Funds | | | 97 | |
Prudential Day One 2025 Fund
Statements of Changes in Net Assets
| | | | | | | | |
| |
| | | Year Ended July 31, | |
| | |
| | | 2019 | | | 2018 | |
Increase (Decrease) in Net Assets | | | | | | | | |
Operations | | | | | | | | |
Net investment income (loss) | | $ | 1,040,001 | | | $ | 568,650 | |
Net realized gain (loss) on investment transactions | | | (1,132,568 | ) | | | (130,872 | ) |
Net capital gain distributions received | | | 1,461,984 | | | | 695,392 | |
Net change in unrealized appreciation (depreciation) on investments | | | 839,486 | | | | 522,080 | |
| | | | | | | | |
Net increase (decrease) in net assets resulting from operations | | | 2,208,903 | | | | 1,655,250 | |
| | | | | | | | |
| | |
Dividends and Distributions | | | | | | | | |
Distributions from distributable earnings* | | | | | | | | |
Class R1 | | | (21,333 | ) | | | — | |
Class R2 | | | (676 | ) | | | — | |
Class R3 | | | (256,516 | ) | | | — | |
Class R4 | | | (1,775 | ) | | | — | |
Class R5 | | | (2,238 | ) | | | — | |
Class R6 | | | (1,479,753 | ) | | | — | |
| | | | | | | | |
| | | (1,762,291 | ) | | | — | |
| | | | | | | | |
Dividends from net investment income* | | | | | | | | |
Class R1 | | | | | | | (5,622 | ) |
Class R2 | | | | | | | (333 | ) |
Class R3 | | | | | | | (56,820 | ) |
Class R4 | | | | | | | (1,397 | ) |
Class R5 | | | | | | | (255 | ) |
Class R6 | | | | | | | (330,455 | ) |
| | | | | | | | |
| | | * | | | | (394,882 | ) |
| | | | | | | | |
Distributions from net realized gains* | | | | | | | | |
Class R1 | | | | | | | (171 | ) |
Class R2 | | | | | | | (8 | ) |
Class R3 | | | | | | | (1,179 | ) |
Class R4 | | | | | | | (27 | ) |
Class R5 | | | | | | | (4 | ) |
Class R6 | | | | | | | (5,354 | ) |
| | | | | | | | |
| | | * | | | | (6,743 | ) |
| | | | | | | | |
See Notes to Financial Statements.
| | | | | | | | |
| |
| | | Year Ended July 31, | |
| | |
| | | 2019 | | | 2018 | |
Fund share transactions | | | | | | | | |
Net proceeds from shares sold | | $ | 25,275,277 | | | $ | 21,103,109 | |
Net asset value of shares issued in reinvestment of dividends and distributions | | | 1,762,291 | | | | 401,625 | |
Cost of shares reacquired | | | (10,309,438 | ) | | | (8,205,921 | ) |
| | | | | | | | |
Net increase (decrease) in net assets from Fund share transactions | | | 16,728,130 | | | | 13,298,813 | |
| | | | | | | | |
Total increase (decrease) | | | 17,174,742 | | | | 14,552,438 | |
| | |
Net Assets: | | | | | | | | |
Beginning of year | | | 32,589,649 | | | | 18,037,211 | |
| | | | | | | | |
End of year(a) | | $ | 49,764,391 | | | $ | 32,589,649 | |
| | | | | | | | |
(a) Includes undistributed/(distributions in excess of) net investment income of: | | $ | * | | | $ | 257,832 | |
| | | | | | | | |
| * | For the year ended July 31, 2019, the disclosures have been revised to reflect revisions to RegulationS-X adopted by the SEC in 2018 (refer to Note 9). |
See Notes to Financial Statements.
| | | | |
| Prudential Day One Funds | | | 99 | |
Prudential Day One 2030 Fund
Schedule of Investments
as of July 31, 2019
| | | | | | | | |
| Description | | Shares | | | Value | |
LONG-TERM INVESTMENTS 94.9% | | | | | | | | |
| | |
AFFILIATED MUTUAL FUNDS | | | | | | | | |
PGIM Core Conservative Bond Fund (Class R6) | | | 308,927 | | | $ | 3,126,340 | |
PGIM Global Real Estate Fund (Class R6) | | | 103,285 | | | | 2,647,207 | |
PGIM JennisonSmall-Cap Core Equity Fund (Class R6) | | | 37,210 | | | | 439,450 | |
PGIM QMA Commodity Strategies Fund (Class R6) | | | 188,435 | | | | 1,778,830 | |
PGIM QMA Emerging Markets Equity Fund (Class R6) | | | 39,581 | | | | 441,327 | |
PGIM QMA International Developed Markets Index Fund (Class R6) | | | 417,188 | | | | 4,851,897 | |
PGIM QMALarge-Cap Core Equity Fund (Class R6) | | | 742,732 | | | | 11,445,508 | |
PGIM QMAMid-Cap Core Equity Fund (Class R6) | | | 121,828 | | | | 1,320,616 | |
PGIM QMA US Broad Market Index Fund (Class R6) | | | 420,796 | | | | 5,722,830 | |
PGIM TIPS Fund (Class R6) | | | 543,866 | | | | 5,367,956 | |
PGIM Total Return Bond Fund (Class R6) | | | 333,384 | | | | 4,924,079 | |
| | | | | | | | |
TOTAL LONG-TERM INVESTMENTS
(cost $40,666,267) | | | | | | | 42,066,040 | |
| | | | | | | | |
| | |
SHORT-TERM INVESTMENT 5.2% | | | | | | | | |
| | |
AFFILIATED MUTUAL FUND | | | | | | | | |
PGIM Core Ultra Short Bond Fund
(cost $2,297,551) | | | 2,297,551 | | | | 2,297,551 | |
| | | | | | | | |
TOTAL INVESTMENTS 100.1%
(cost $42,963,818)(w) | | | | | | | 44,363,591 | |
Liabilities in excess of other assets (0.1)% | | | | | | | (36,427 | ) |
| | | | | | | | |
NET ASSETS 100.0% | | | | | | $ | 44,327,164 | |
| | | | | | | | |
| (w) | PGIM Investments LLC, the manager of the Fund, also serves as the manager of the underlying funds in which the Fund invests. |
Fair Value Measurements:
Various inputs are used in determining the value of the Fund’s investments. These inputs are summarized in the three broad levels listed below.
Level 1—unadjusted quoted prices generally in active markets for identical securities.
Level 2—quoted prices for similar securities, interest rates and yield curves, prepayment speeds, foreign currency exchange rates and other observable inputs.
Level 3—unobservable inputs for securities valued in accordance with Board approved fair valuation procedures.
See Notes to Financial Statements.
The following is a summary of the inputs used as of July 31, 2019 in valuing such portfolio securities:
| | | | | | | | | | | | |
| | | Level 1 | | | Level 2 | | | Level 3 | |
Investments in Securities | | | | | | | | | | | | |
Affiliated Mutual Funds | | $ | 44,363,591 | | | $ | — | | | $ | — | |
| | | | | | | | | | | | |
Investment Allocation:
The investment allocation of portfolio holdings and liabilities in excess of other assets shown as a percentage of net assets as of July 31, 2019 were as follows (unaudited):
| | | | |
Large Cap | | | 25.8 | % |
Broad Market | | | 12.9 | |
TIPS | | | 12.1 | |
Total Return Bond | | | 11.1 | |
International Developed Markets | | | 10.9 | |
Core Bond | | | 7.1 | |
Real Estate | | | 6.0 | |
Short Term | | | 5.2 | |
Commodity | | | 4.0 | |
Mid Cap | | | 3.0 | % |
Emerging Markets | | | 1.0 | |
Small Cap | | | 1.0 | |
| | | | |
| | | 100.1 | |
Liabilities in excess of other assets | | | (0.1 | ) |
| | | | |
| | | 100.0 | % |
| | | | |
See Notes to Financial Statements.
| | | | |
| Prudential Day One Funds | | | 101 | |
Prudential Day One 2030 Fund
Statement of Assets & Liabilities
as of July 31, 2019
| | | | |
Assets | | | | |
Affiliated investments (cost $42,963,818) | | $ | 44,363,591 | |
Receivable for investments sold | | | 400,900 | |
Receivable for Fund shares sold | | | 18,505 | |
Due from Manager | | | 15,438 | |
| | | | |
Total Assets | | | 44,798,434 | |
| | | | |
| |
Liabilities | | | | |
Payable for investments purchased | | | 324,881 | |
Payable for Fund shares reacquired | | | 62,926 | |
Custodian and accounting fees payable | | | 47,240 | |
Accrued expenses and other liabilities | | | 32,488 | |
Affiliated transfer agent fee payable | | | 2,067 | |
Distribution fee payable | | | 876 | |
Affiliated shareholder servicing fees payable | | | 792 | |
| | | | |
Total Liabilities | | | 471,270 | |
| | | | |
| |
Net Assets | | $ | 44,327,164 | |
| | | | |
Net assets were comprised of: | | | | |
Shares of beneficial interest, at par | | $ | 3,856 | |
Paid-in capital in excess of par | | | 42,425,714 | |
Total distributable earnings (loss) | | | 1,897,594 | |
| | | | |
Net assets, July 31, 2019 | | $ | 44,327,164 | |
| | | | |
See Notes to Financial Statements.
| | | | |
Class R1 | | | | |
Net asset value, offering price and redemption price per share,
($33,261 ÷ 2,905 shares of beneficial interest issued and outstanding) | | $ | 11.45 | |
| | | | |
| |
Class R2 | | | | |
Net asset value, offering price and redemption price per share,
($3,403,560 ÷ 296,729 shares of beneficial interest issued and outstanding) | | $ | 11.47 | |
| | | | |
| |
Class R3 | | | | |
Net asset value, offering price and redemption price per share,
($1,349,457 ÷ 117,655 shares of beneficial interest issued and outstanding) | | $ | 11.47 | |
| | | | |
| |
Class R4 | | | | |
Net asset value, offering price and redemption price per share,
($12,159 ÷ 1,061 shares of beneficial interest issued and outstanding) | | $ | 11.46 | |
| | | | |
| |
Class R5 | | | | |
Net asset value, offering price and redemption price per share,
($3,011,580 ÷ 262,279 shares of beneficial interest issued and outstanding) | | $ | 11.48 | |
| | | | |
| |
Class R6 | | | | |
Net asset value, offering price and redemption price per share,
($36,517,147 ÷ 3,175,336 shares of beneficial interest issued and outstanding) | | $ | 11.50 | |
| | | | |
See Notes to Financial Statements.
| | | | |
| Prudential Day One Funds | | | 103 | |
Prudential Day One 2030 Fund
Statement of Operations
Year Ended July 31, 2019
| | | | |
Net Investment Income (Loss) | | | | |
Affiliated dividend income | | $ | 848,360 | |
| | | | |
| |
Expenses | | | | |
Management fee | | | 7,466 | |
Distribution fee(a) | | | 9,040 | |
Shareholder servicing fees (including affiliated expense of $4,614)(a) | | | 4,680 | |
Custodian and accounting fees | | | 117,715 | |
Registration fees(a) | | | 68,778 | |
Audit fee | | | 20,402 | |
Legal fees and expenses | | | 17,350 | |
Transfer agent’s fees and expenses (including affiliated expense of $12,077)(a) | | | 13,071 | |
Trustees’ fees | | | 11,470 | |
Shareholders’ reports | | | 10,885 | |
Miscellaneous | | | 14,031 | |
| | | | |
Total expenses | | | 294,888 | |
Less: Fee waiver and/or expense reimbursement(a) | | | (272,521 | ) |
| | | | |
Net expenses | | | 22,367 | |
| | | | |
Net investment income (loss) | | | 825,993 | |
| | | | |
| |
Realized And Unrealized Gain (Loss) On Affiliated Investments | | | | |
Net realized gain (loss) on investment transactions | | | (1,003,425 | ) |
Net capital gain distributions received | | | 1,638,567 | |
| | | | |
| | | 635,142 | |
| | | | |
Net change in unrealized appreciation (depreciation) on investments | | | 377,913 | |
| | | | |
Net gain (loss) on investment transactions | | | 1,013,055 | |
| | | | |
Net Increase (Decrease) In Net Assets Resulting From Operations | | $ | 1,839,048 | |
| | | | |
| (a) | Class specific expenses and waivers were as follows: |
| | | | | | | | | | | | | | | | | | | | | | | | |
| | | Class R1 | | | Class R2 | | | Class R3 | | | Class R4 | | | Class R5 | | | Class R6 | |
Distribution fee | | | 149 | | | | 7,873 | | | | 1,018 | | | | — | | | | — | | | | — | |
Shareholder servicing fees | | | 30 | | | | 3,149 | | | | 1,019 | | | | 482 | | | | — | | | | — | |
Registration fees | | | 11,463 | | | | 11,463 | | | | 11,463 | | | | 11,463 | | | | 11,463 | | | | 11,463 | |
Transfer agent’s fees and expenses | | | 129 | | | | 4,975 | | | | 1,745 | | | | 1,106 | | | | 4,199 | | | | 917 | |
Fee waiver and/or expense reimbursement | | | (11,708 | ) | | | (28,801 | ) | | | (17,168 | ) | | | (14,708 | ) | | | (26,691 | ) | | | (173,445 | ) |
See Notes to Financial Statements.
Prudential Day One 2030 Fund
Statements of Changes in Net Assets
| | | | | | | | |
| |
| | | Year Ended July 31, | |
| | |
| | | 2019 | | | 2018 | |
Increase (Decrease) in Net Assets | | | | | | | | |
Operations | | | | | | | | |
Net investment income (loss) | | $ | 825,993 | | | $ | 345,210 | |
Net realized gain (loss) on investment transactions | | | (1,003,425 | ) | | | (134,469 | ) |
Net capital gain distributions received | | | 1,638,567 | | | | 581,138 | |
Net change in unrealized appreciation (depreciation) on investments | | | 377,913 | | | | 797,100 | |
| | | | | | | | |
Net increase (decrease) in net assets resulting from operations | | | 1,839,048 | | | | 1,588,979 | |
| | | | | | | | |
| | |
Dividends and Distributions | | | | | | | | |
Distributions from distributable earnings* | | | | | | | | |
Class R1 | | | (1,022 | ) | | | — | |
Class R2 | | | (115,451 | ) | | | — | |
Class R3 | | | (35,737 | ) | | | — | |
Class R4 | | | (28,267 | ) | | | — | |
Class R5 | | | (111,145 | ) | | | — | |
Class R6 | | | (1,208,259 | ) | | | — | |
| | | | | | | | |
| | | (1,499,881 | ) | | | — | |
| | | | | | | | |
Dividends from net investment income* | | | | | | | | |
Class R1 | | | | | | | (147 | ) |
Class R2 | | | | | | | (1,420 | ) |
Class R3 | | | | | | | (7,053 | ) |
Class R4 | | | | | | | (14,481 | ) |
Class R5 | | | | | | | (2,115 | ) |
Class R6 | | | | | | | (239,010 | ) |
| | | | | | | | |
| | | * | | | | (264,226 | ) |
| | | | | | | | |
Distributions from net realized gains* | | | | | | | | |
Class R1 | | | | | | | (5 | ) |
Class R2 | | | | | | | (39 | ) |
Class R3 | | | | | | | (175 | ) |
Class R4 | | | | | | | (332 | ) |
Class R5 | | | | | | | (46 | ) |
Class R6 | | | | | | | (4,691 | ) |
| | | | | | | | |
| | | * | | | | (5,288 | ) |
| | | | | | | | |
See Notes to Financial Statements.
| | | | |
| Prudential Day One Funds | | | 105 | |
Prudential Day One 2030 Fund
Statements of Changes in Net Assets (continued)
| | | | | | | | |
| |
| | | Year Ended July 31, | |
| | |
| | | 2019 | | | 2018 | |
Fund share transactions | | | | | | | | |
Net proceeds from shares sold | | $ | 22,859,015 | | | $ | 23,458,936 | |
Net asset value of shares issued in reinvestment of dividends and distributions | | | 1,499,881 | | | | 269,515 | |
Cost of shares reacquired | | | (9,672,196 | ) | | | (6,078,246 | ) |
| | | | | | | | |
Net increase (decrease) in net assets from Fund share transactions | | | 14,686,700 | | | | 17,650,205 | |
| | | | | | | | |
Total increase (decrease) | | | 15,025,867 | | | | 18,969,670 | |
| | |
Net Assets: | | | | | | | | |
Beginning of year | | | 29,301,297 | | | | 10,331,627 | |
| | | | | | | | |
End of year(a) | | $ | 44,327,164 | | | $ | 29,301,297 | |
| | | | | | | | |
(a) Includes undistributed/(distributions in excess of) net investment income of: | | $ | * | | | $ | 151,620 | |
| | | | | | | | |
| * | For the year ended July 31, 2019, the disclosures have been revised to reflect revisions to RegulationS-X adopted by the SEC in 2018 (refer to Note 9). |
See Notes to Financial Statements.
Prudential Day One 2035 Fund
Schedule of Investments
as of July 31, 2019
| | | | | | | | |
| Description | | Shares | | | Value | |
LONG-TERM INVESTMENTS 97.9% | | | | | | | | |
| | |
AFFILIATED MUTUAL FUNDS | | | | | | | | |
PGIM Core Conservative Bond Fund (Class R6) | | | 154,882 | | | $ | 1,567,404 | |
PGIM Global Real Estate Fund (Class R6) | | | 60,415 | | | | 1,548,433 | |
PGIM JennisonSmall-Cap Core Equity Fund (Class R6) | | | 52,237 | | | | 616,924 | |
PGIM QMA Commodity Strategies Fund (Class R6) | | | 132,262 | | | | 1,248,557 | |
PGIM QMA Emerging Markets Equity Fund (Class R6) | | | 83,347 | | | | 929,323 | |
PGIM QMA International Developed Markets Index Fund (Class R6) | | | 346,074 | | | | 4,024,836 | |
PGIM QMALarge-Cap Core Equity Fund (Class R6) | | | 581,495 | | | | 8,960,835 | |
PGIM QMAMid-Cap Core Equity Fund (Class R6) | | | 114,019 | | | | 1,235,963 | |
PGIM QMA US Broad Market Index Fund (Class R6) | | | 363,528 | | | | 4,943,975 | |
PGIM TIPS Fund (Class R6) | | | 254,491 | | | | 2,511,828 | |
PGIM Total Return Bond Fund (Class R6) | | | 191,454 | | | | 2,827,782 | |
| | | | | | | | |
TOTAL LONG-TERM INVESTMENTS
(cost $29,533,597) | | | | | | | 30,415,860 | |
| | | | | | | | |
| | |
SHORT-TERM INVESTMENT 2.3% | | | | | | | | |
| | |
AFFILIATED MUTUAL FUND | | | | | | | | |
PGIM Core Ultra Short Bond Fund
(cost $705,908) | | | 705,908 | | | | 705,908 | |
| | | | | | | | |
TOTAL INVESTMENTS 100.2%
(cost $30,239,505)(w) | | | | | | | 31,121,768 | |
Liabilities in excess of other assets (0.2)% | | | | | | | (56,131 | ) |
| | | | | | | | |
NET ASSETS 100.0% | | | | | | $ | 31,065,637 | |
| | | | | | | | |
| (w) | PGIM Investments LLC, the manager of the Fund, also serves as the manager of the underlying funds in which the Fund invests. |
Fair Value Measurements:
Various inputs are used in determining the value of the Fund’s investments. These inputs are summarized in the three broad levels listed below.
Level 1—unadjusted quoted prices generally in active markets for identical securities.
Level 2—quoted prices for similar securities, interest rates and yield curves, prepayment speeds, foreign currency exchange rates and other observable inputs.
Level 3—unobservable inputs for securities valued in accordance with Board approved fair valuation procedures.
See Notes to Financial Statements.
| | | | |
| Prudential Day One Funds | | | 107 | |
Prudential Day One 2035 Fund
Schedule of Investments (continued)
as of July 31, 2019
The following is a summary of the inputs used as of July 31, 2019 in valuing such portfolio securities:
| | | | | | | | | | | | |
| | | Level 1 | | | Level 2 | | | Level 3 | |
Investments in Securities | | | | | | | | | | | | |
Affiliated Mutual Funds | | $ | 31,121,768 | | | $ | — | | | $ | — | |
| | | | | | | | | | | | |
Investment Allocation:
The investment allocation of portfolio holdings and liabilities in excess of other assets shown as a percentage of net assets as of July 31, 2019 were as follows (unaudited):
| | | | |
Large Cap | | | 28.8 | % |
Broad Market | | | 15.9 | |
International Developed Markets | | | 13.0 | |
Total Return Bond | | | 9.1 | |
TIPS | | | 8.1 | |
Core Bond | | | 5.0 | |
Real Estate | | | 5.0 | |
Commodity | | | 4.0 | |
Mid Cap | | | 4.0 | |
Emerging Markets | | | 3.0 | % |
Short Term | | | 2.3 | |
Small Cap | | | 2.0 | |
| | | | |
| | | 100.2 | |
Liabilities in excess of other assets | | | (0.2 | ) |
| | | | |
| | | 100.0 | % |
| | | | |
See Notes to Financial Statements.
Prudential Day One 2035 Fund
Statement of Assets & Liabilities
as of July 31, 2019
| | | | |
Assets | | | | |
Affiliated investments (cost $30,239,505) | | $ | 31,121,768 | |
Receivable for investments sold | | | 267,768 | |
Receivable for Fund shares sold | | | 20,228 | |
Due from Manager | | | 15,848 | |
| | | | |
Total Assets | | | 31,425,612 | |
| | | | |
| |
Liabilities | | | | |
Payable for investments purchased | | | 276,263 | |
Custodian and accounting fees payable | | | 47,471 | |
Audit fee payable | | | 20,402 | |
Accrued expenses and other liabilities | | | 11,846 | |
Affiliated transfer agent fee payable | | | 1,799 | |
Affiliated shareholder servicing fees payable | | | 1,044 | |
Distribution fee payable | | | 616 | |
Payable for Fund shares reacquired | | | 534 | |
| | | | |
Total Liabilities | | | 359,975 | |
| | | | |
| |
Net Assets | | $ | 31,065,637 | |
| | | | |
Net assets were comprised of: | | | | |
Shares of beneficial interest, at par | | $ | 2,711 | |
Paid-in capital in excess of par | | | 29,972,607 | |
Total distributable earnings (loss) | | | 1,090,319 | |
| | | | |
Net assets, July 31, 2019 | | $ | 31,065,637 | |
| | | | |
See Notes to Financial Statements.
| | | | |
| Prudential Day One Funds | | | 109 | |
Prudential Day One 2035 Fund
Statement of Assets & Liabilities(continued)
as of July 31, 2019
| | | | |
Class R1 | | | | |
Net asset value, offering price and redemption price per share,
($23,598 ÷ 2,067 shares of beneficial interest issued and outstanding) | | $ | 11.42 | |
| | | | |
| |
Class R2 | | | | |
Net asset value, offering price and redemption price per share,
($352,610 ÷ 30,857 shares of beneficial interest issued and outstanding) | | $ | 11.43 | |
| | | | |
| |
Class R3 | | | | |
Net asset value, offering price and redemption price per share,
($6,270,958 ÷ 547,836 shares of beneficial interest issued and outstanding) | | $ | 11.45 | |
| | | | |
| |
Class R4 | | | | |
Net asset value, offering price and redemption price per share,
($12,300 ÷ 1,073 shares of beneficial interest issued and outstanding) | | $ | 11.46 | |
| | | | |
| |
Class R5 | | | | |
Net asset value, offering price and redemption price per share,
($94,559 ÷ 8,257 shares of beneficial interest issued and outstanding) | | $ | 11.45 | |
| | | | |
| |
Class R6 | | | | |
Net asset value, offering price and redemption price per share,
($24,311,612 ÷ 2,120,914 shares of beneficial interest issued and outstanding) | | $ | 11.46 | |
| | | | |
See Notes to Financial Statements.
Prudential Day One 2035 Fund
Statement of Operations
Year Ended July 31, 2019
| | | | |
Net Investment Income (Loss) | | | | |
Affiliated dividend income | | $ | 557,730 | |
| | | | |
| |
Expenses | | | | |
Management fee | | | 5,267 | |
Distribution fee(a) | | | 6,783 | |
Shareholder servicing fees (including affiliated expense of $6,129)(a) | | | 6,234 | |
Custodian and accounting fees | | | 117,916 | |
Registration fees(a) | | | 68,268 | |
Audit fee | | | 20,402 | |
Legal fees and expenses | | | 17,340 | |
Transfer agent’s fees and expenses (including affiliated expense of $10,575)(a) | | | 11,912 | |
Trustees’ fees | | | 11,454 | |
Shareholders’ reports | | | 11,217 | |
Miscellaneous | | | 14,017 | |
| | | | |
Total expenses | | | 290,810 | |
Less: Fee waiver and/or expense reimbursement(a) | | | (277,273 | ) |
| | | | |
Net expenses | | | 13,537 | |
| | | | |
Net investment income (loss) | | | 544,193 | |
| | | | |
| |
Realized And Unrealized Gain (Loss) On Affiliated Investments | | | | |
Net realized gain (loss) on investment transactions | | | (858,238 | ) |
Net capital gain distributions received | | | 1,253,358 | |
| | | | |
| | | 395,120 | |
| | | | |
Net change in unrealized appreciation (depreciation) on investments | | | 83,693 | |
| | | | |
Net gain (loss) on investment transactions | | | 478,813 | |
| | | | |
Net Increase (Decrease) In Net Assets Resulting From Operations | | $ | 1,023,006 | |
| | | | |
| (a) | Class specific expenses and waivers were as follows: |
| | | | | | | | | | | | | | | | | | | | | | | | |
| | | Class R1 | | | Class R2 | | | Class R3 | | | Class R4 | | | Class R5 | | | Class R6 | |
Distribution fee | | | 83 | | | | 849 | | | | 5,851 | | | | — | | | | — | | | | — | |
Shareholder servicing fees | | | 16 | | | | 340 | | | | 5,850 | | | | 28 | | | | — | | | | — | |
Registration fees | | | 11,378 | | | | 11,378 | | | | 11,378 | | | | 11,378 | | | | 11,378 | | | | 11,378 | |
Transfer agent’s fees and expenses | | | 108 | | | | 1,319 | | | | 9,092 | | | | 102 | | | | 303 | | | | 988 | |
Fee waiver and/or expense reimbursement | | | (11,588 | ) | | | (14,881 | ) | | | (57,935 | ) | | | (11,670 | ) | | | (12,117 | ) | | | (169,082 | ) |
See Notes to Financial Statements.
| | | | |
| Prudential Day One Funds | | | 111 | |
Prudential Day One 2035 Fund
Statements of Changes in Net Assets
| | | | | | | | |
| |
| | | Year Ended July 31, | |
| | |
| | | 2019 | | | 2018 | |
Increase (Decrease) in Net Assets | | | | | | | | |
Operations | | | | | | | | |
Net investment income (loss) | | $ | 544,193 | | | $ | 287,248 | |
Net realized gain (loss) on investment transactions | | | (858,238 | ) | | | (106,866 | ) |
Net capital gain distributions received | | | 1,253,358 | | | | 645,426 | |
Net change in unrealized appreciation (depreciation) on investments | | | 83,693 | | | | 632,290 | |
| | | | | | | | |
Net increase (decrease) in net assets resulting from operations | | | 1,023,006 | | | | 1,458,098 | |
| | | | | | | | |
| | |
Dividends and Distributions | | | | | | | | |
Distributions from distributable earnings* | | | | | | | | |
Class R1 | | | (504 | ) | | | — | |
Class R2 | | | (15,170 | ) | | | — | |
Class R3 | | | (278,108 | ) | | | — | |
Class R4 | | | (2,341 | ) | | | — | |
Class R5 | | | (3,726 | ) | | | — | |
Class R6 | | | (955,310 | ) | | | — | |
| | | | | | | | |
| | | (1,255,159 | ) | | | — | |
| | | | | | | | |
Dividends from net investment income* | | | | | | | | |
Class R1 | | | | | | | (146 | ) |
Class R2 | | | | | | | (182 | ) |
Class R3 | | | | | | | (77,919 | ) |
Class R4 | | | | | | | (746 | ) |
Class R5 | | | | | | | (214 | ) |
Class R6 | | | | | | | (228,561 | ) |
| | | | | | | | |
| | | * | | | | (307,768 | ) |
| | | | | | | | |
Distributions from net realized gains* | | | | | | | | |
Class R1 | | | | | | | (3 | ) |
Class R2 | | | | | | | (3 | ) |
Class R3 | | | | | | | (1,161 | ) |
Class R4 | | | | | | | (10 | ) |
Class R5 | | | | | | | (3 | ) |
Class R6 | | | | | | | (2,797 | ) |
| | | | | | | | |
| | | * | | | | (3,977 | ) |
| | | | | | | | |
See Notes to Financial Statements.
| | | | | | | | |
| |
| | | Year Ended July 31, | |
| | |
| | | 2019 | | | 2018 | |
Fund share transactions | | | | | | | | |
Net proceeds from shares sold | | $ | 15,152,438 | | | $ | 12,790,604 | |
Net asset value of shares issued in reinvestment of dividends and distributions | | | 1,255,159 | | | | 311,745 | |
Cost of shares reacquired | | | (6,504,219 | ) | | | (3,878,913 | ) |
| | | | | | | | |
Net increase (decrease) in net assets from Fund share transactions | | | 9,903,378 | | | | 9,223,436 | |
| | | | | | | | |
Total increase (decrease) | | | 9,671,225 | | | | 10,369,789 | |
| | |
Net Assets: | | | | | | | | |
Beginning of year | | | 21,394,412 | | | | 11,024,623 | |
| | | | | | | | |
End of year(a) | | $ | 31,065,637 | | | $ | 21,394,412 | |
| | | | | | | | |
(a) Includes undistributed/(distributions in excess of) net investment income of: | | $ | * | | | $ | 78,487 | |
| | | | | | | | |
| * | For the year ended July 31, 2019, the disclosures have been revised to reflect revisions to RegulationS-X adopted by the SEC in 2018 (refer to Note 9). |
See Notes to Financial Statements.
| | | | |
| Prudential Day One Funds | | | 113 | |
Prudential Day One 2040 Fund
Schedule of Investments
as of July 31, 2019
| | | | | | | | |
| Description | | Shares | | | Value | |
LONG-TERM INVESTMENTS 98.9% | | | | | | | | |
| | |
AFFILIATED MUTUAL FUNDS | | | | | | | | |
PGIM Core Conservative Bond Fund (Class R6) | | | 110,777 | | | $ | 1,121,064 | |
PGIM Global Real Estate Fund (Class R6) | | | 54,016 | | | | 1,384,424 | |
PGIM JennisonSmall-Cap Core Equity Fund (Class R6) | | | 70,057 | | | | 827,376 | |
PGIM QMA Commodity Strategies Fund (Class R6) | | | 118,253 | | | | 1,116,304 | |
PGIM QMA Emerging Markets Equity Fund (Class R6) | | | 99,359 | | | | 1,107,852 | |
PGIM QMA International Developed Markets Index Fund (Class R6) | | | 357,021 | | | | 4,152,148 | |
PGIM QMALarge-Cap Core Equity Fund (Class R6) | | | 519,907 | | | | 8,011,761 | |
PGIM QMAMid-Cap Core Equity Fund (Class R6) | | | 152,914 | | | | 1,657,584 | |
PGIM QMA US Broad Market Index Fund (Class R6) | | | 325,025 | | | | 4,420,340 | |
PGIM TIPS Fund (Class R6) | | | 142,203 | | | | 1,403,541 | |
PGIM Total Return Bond Fund (Class R6) | | | 152,149 | | | | 2,247,236 | |
| | | | | | | | |
TOTAL LONG-TERM INVESTMENTS
(cost $26,667,044) | | | | | | | 27,449,630 | |
| | | | | | | | |
| | |
SHORT-TERM INVESTMENT 1.3% | | | | | | | | |
| | |
AFFILIATED MUTUAL FUND | | | | | | | | |
PGIM Core Ultra Short Bond Fund
(cost $361,557) | | | 361,557 | | | | 361,557 | |
| | | | | | | | |
TOTAL INVESTMENTS 100.2%
(cost $27,028,601)(w) | | | | | | | 27,811,187 | |
Liabilities in excess of other assets (0.2)% | | | | | | | (59,933 | ) |
| | | | | | | | |
NET ASSETS 100.0% | | | | | | $ | 27,751,254 | |
| | | | | | | | |
| (w) | PGIM Investments LLC, the manager of the Fund, also serves as the manager of the underlying funds in which the Fund invests. |
Fair Value Measurements:
Various inputs are used in determining the value of the Fund’s investments. These inputs are summarized in the three broad levels listed below.
Level 1—unadjusted quoted prices generally in active markets for identical securities.
Level 2—quoted prices for similar securities, interest rates and yield curves, prepayment speeds, foreign currency exchange rates and other observable inputs.
Level 3—unobservable inputs for securities valued in accordance with Board approved fair valuation procedures.
See Notes to Financial Statements.
The following is a summary of the inputs used as of July 31, 2019 in valuing such portfolio securities:
| | | | | | | | | | | | |
| | | Level 1 | | | Level 2 | | | Level 3 | |
Investments in Securities | | | | | | | | | | | | |
Affiliated Mutual Funds | | $ | 27,811,187 | | | $ | — | | | $ | — | |
| | | | | | | | | | | | |
Investment Allocation:
The investment allocation of portfolio holdings and liabilities in excess of other assets shown as a percentage of net assets as of July 31, 2019 were as follows (unaudited):
| | | | |
Large Cap | | | 28.9 | % |
Broad Market | | | 15.9 | |
International Developed Markets | | | 15.0 | |
Total Return Bond | | | 8.1 | |
Mid Cap | | | 6.0 | |
TIPS | | | 5.0 | |
Real Estate | | | 5.0 | |
Core Bond | | | 4.0 | |
Commodity | | | 4.0 | |
Emerging Markets | | | 4.0 | % |
Small Cap | | | 3.0 | |
Short Term | | | 1.3 | |
| | | | |
| | | 100.2 | |
Liabilities in excess of other assets | | | (0.2 | ) |
| | | | |
| | | 100.0 | % |
| | | | |
See Notes to Financial Statements.
| | | | |
| Prudential Day One Funds | | | 115 | |
Prudential Day One 2040 Fund
Statement of Assets & Liabilities
as of July 31, 2019
| | | | |
Assets | | | | |
Affiliated investments (cost $27,028,601) | | $ | 27,811,187 | |
Receivable for investments sold | | | 241,930 | |
Receivable for Fund shares sold | | | 29,739 | |
Due from Manager | | | 17,227 | |
| | | | |
Total Assets | | | 28,100,083 | |
| | | | |
| |
Liabilities | | | | |
Payable for investments purchased | | | 263,494 | |
Custodian and accounting fees payable | | | 47,399 | |
Audit fee payable | | | 20,402 | |
Accrued expenses and other liabilities | | | 11,511 | |
Affiliated transfer agent fee payable | | | 2,475 | |
Payable for Fund shares reacquired | | | 2,364 | |
Distribution fee payable | | | 627 | |
Affiliated shareholder servicing fees payable | | | 557 | |
| | | | |
Total Liabilities | | | 348,829 | |
| | | | |
| |
Net Assets | | $ | 27,751,254 | |
| | | | |
Net assets were comprised of: | | | | |
Shares of beneficial interest, at par | | $ | 2,381 | |
Paid-in capital in excess of par | | | 26,538,884 | |
Total distributable earnings (loss) | | | 1,209,989 | |
| | | | |
Net assets, July 31, 2019 | | $ | 27,751,254 | |
| | | | |
See Notes to Financial Statements.
| | | | |
Class R1 | | | | |
Net asset value, offering price and redemption price per share ,
($15,904 ÷ 1,370 shares of beneficial interest issued and outstanding) | | $ | 11.61 | |
| | | | |
| |
Class R2 | | | | |
Net asset value, offering price and redemption price per share ,
($2,424,195 ÷ 208,529 shares of beneficial interest issued and outstanding) | | $ | 11.63 | |
| | | | |
| |
Class R3 | | | | |
Net asset value, offering price and redemption price per share ,
($1,490,663 ÷ 128,067 shares of beneficial interest issued and outstanding) | | $ | 11.64 | |
| | | | |
| |
Class R4 | | | | |
Net asset value, offering price and redemption price per share ,
($12,445 ÷ 1,068 shares of beneficial interest issued and outstanding) | | $ | 11.65 | |
| | | | |
| |
Class R5 | | | | |
Net asset value, offering price and redemption price per share ,
($6,055,844 ÷ 519,645 shares of beneficial interest issued and outstanding) | | $ | 11.65 | |
| | | | |
| |
Class R6 | | | | |
Net asset value, offering price and redemption price per share ,
($17,752,203 ÷ 1,521,847 shares of beneficial interest issued and outstanding) | | $ | 11.66 | |
| | | | |
See Notes to Financial Statements.
| | | | |
| Prudential Day One Funds | | | 117 | |
Prudential Day One 2040 Fund
Statement of Operations
Year Ended July 31, 2019
| | | | |
Net Investment Income (Loss) | | | | |
Affiliated dividend income | | $ | 463,180 | |
| | | | |
| |
Expenses | | | | |
Management fee | | | 4,709 | |
Distribution fee(a) | | | 5,208 | |
Shareholder servicing fees (including affiliated expense of $2,585)(a) | | | 2,653 | |
Custodian and accounting fees | | | 117,902 | |
Registration fees(a) | | | 68,268 | |
Audit fee | | | 20,402 | |
Legal fees and expenses | | | 17,331 | |
Transfer agent’s fees and expenses (including affiliated expense of $13,759)(a) | | | 14,145 | |
Trustees’ fees | | | 11,404 | |
Shareholders’ reports | | | 10,477 | |
Miscellaneous | | | 14,016 | |
| | | | |
Total expenses | | | 286,515 | |
Less: Fee waiver and/or expense reimbursement(a) | | | (277,721 | ) |
| | | | |
Net expenses | | | 8,794 | |
| | | | |
Net investment income (loss) | | | 454,386 | |
| | | | |
| |
Realized And Unrealized Gain (Loss) On Affiliated Investments | | | | |
Net realized gain (loss) on investment transactions | | | (526,698 | ) |
Net capital gain distributions received | | | 1,147,991 | |
| | | | |
| | | 621,293 | |
| | | | |
Net change in unrealized appreciation (depreciation) on investments | | | (127,583 | ) |
| | | | |
Net gain (loss) on investment transactions | | | 493,710 | |
| | | | |
Net Increase (Decrease) In Net Assets Resulting From Operations | | $ | 948,096 | |
| | | | |
| (a) | Class specific expenses and waivers were as follows: |
| | | | | | | | | | | | | | | | | | | | | | | | |
| | | Class R1 | | | Class R2 | | | Class R3 | | | Class R4 | | | Class R5 | | | Class R6 | |
Distribution fee | | | 70 | | | | 4,223 | | | | 915 | | | | — | | | | — | | | | — | |
Shareholder servicing fees | | | 14 | | | | 1,689 | | | | 915 | | | | 35 | | | | — | | | | — | |
Registration fees | | | 11,378 | | | | 11,378 | | | | 11,378 | | | | 11,378 | | | | 11,378 | | | | 11,378 | |
Transfer agent’s fees and expenses | | | 78 | | | | 2,808 | | | | 1,520 | | | | 79 | | | | 8,743 | | | | 917 | |
Fee waiver and/or expense reimbursement | | | (11,560 | ) | | | (26,514 | ) | | | (19,524 | ) | | | (11,729 | ) | | | (63,098 | ) | | | (145,296 | ) |
See Notes to Financial Statements.
Prudential Day One 2040 Fund
Statements of Changes in Net Assets
| | | | | | | | |
| |
| | | Year Ended July 31, | |
| | |
| | | 2019 | | | 2018 | |
Increase (Decrease) in Net Assets | | | | | | | | |
Operations | | | | | | | | |
Net investment income (loss) | | $ | 454,386 | | | $ | 187,898 | |
Net realized gain (loss) on investment transactions | | | (526,698 | ) | | | (78,025 | ) |
Net capital gain distributions received | | | 1,147,991 | | | | 391,795 | |
Net change in unrealized appreciation (depreciation) on investments | | | (127,583 | ) | | | 729,367 | |
| | | | | | | | |
Net increase (decrease) in net assets resulting from operations | | | 948,096 | | | | 1,231,035 | |
| | | | | | | | |
| | |
Dividends and Distributions | | | | | | | | |
Distributions from distributable earnings* | | | | | | | | |
Class R1 | | | (501 | ) | | | — | |
Class R2 | | | (59,712 | ) | | | — | |
Class R3 | | | (29,211 | ) | | | — | |
Class R4 | | | (1,838 | ) | | | — | |
Class R5 | | | (246,402 | ) | | | — | |
Class R6 | | | (617,891 | ) | | | — | |
| | | | | | | | |
| | | (955,555 | ) | | | — | |
| | | | | | | | |
Dividends from net investment income* | | | | | | | | |
Class R1 | | | | | | | (156 | ) |
Class R2 | | | | | | | (229 | ) |
Class R3 | | | | | | | (4,597 | ) |
Class R4 | | | | | | | (2,380 | ) |
Class R5 | | | | | | | (229 | ) |
Class R6 | | | | | | | (190,806 | ) |
| | | | | | | | |
| | | * | | | | (198,397 | ) |
| | | | | | | | |
Distributions from net realized gains* | | | | | | | | |
Class R1 | | | | | | | (11 | ) |
Class R2 | | | | | | | (14 | ) |
Class R3 | | | | | | | (258 | ) |
Class R4 | | | | | | | (126 | ) |
Class R5 | | | | | | | (11 | ) |
Class R6 | | | | | | | (8,863 | ) |
| | | | | | | | |
| | | * | | | | (9,283 | ) |
| | | | | | | | |
See Notes to Financial Statements.
| | | | |
| Prudential Day One Funds | | | 119 | |
Prudential Day One 2040 Fund
Statements of Changes in Net Assets(continued)
| | | | | | | | |
| |
| | | Year Ended July 31, | |
| | |
| | | 2019 | | | 2018 | |
Fund share transactions | | | | | | | | |
Net proceeds from shares sold | | $ | 10,251,967 | | | $ | 16,085,787 | |
Net asset value of shares issued in reinvestment of dividends and distributions | | | 955,555 | | | | 207,681 | |
Cost of shares reacquired | | | (3,942,783 | ) | | | (2,675,851 | ) |
| | | | | | | | |
Net increase (decrease) in net assets from Fund share transactions | | | 7,264,739 | | | | 13,617,617 | |
| | | | | | | | |
Total increase (decrease) | | | 7,257,280 | | | | 14,640,972 | |
| | |
Net Assets: | | | | | | | | |
Beginning of year | | | 20,493,974 | | | | 5,853,002 | |
| | | | | | | | |
End of year(a) | | $ | 27,751,254 | | | $ | 20,493,974 | |
| | | | | | | | |
(a) Includes undistributed/(distributions in excess of) net investment income of: | | $ | * | | | $ | 60,006 | |
| | | | | | | | |
| * | For the year ended July 31, 2019, the disclosures have been revised to reflect revisions to RegulationS-X adopted by the SEC in 2018 (refer to Note 9). |
See Notes to Financial Statements.
Prudential Day One 2045 Fund
Schedule of Investments
as of July 31, 2019
| | | | | | | | |
| Description | | Shares | | | Value | |
LONG-TERM INVESTMENTS 99.9% | | | | | | | | |
| | |
AFFILIATED MUTUAL FUNDS | | | | | | | | |
PGIM Core Conservative Bond Fund (Class R6) | | | 52,596 | | | $ | 532,276 | |
PGIM Global Real Estate Fund (Class R6) | | | 34,195 | | | | 876,411 | |
PGIM JennisonSmall-Cap Core Equity Fund (Class R6) | | | 44,350 | | | | 523,769 | |
PGIM QMA Commodity Strategies Fund (Class R6) | | | 56,145 | | | | 530,010 | |
PGIM QMA Emerging Markets Equity Fund (Class R6) | | | 78,624 | | | | 876,657 | |
PGIM QMA International Developed Markets Index Fund (Class R6) | | | 271,214 | | | | 3,154,221 | |
PGIM QMALarge-Cap Core Equity Fund (Class R6) | | | 329,126 | | | | 5,071,837 | |
PGIM QMAMid-Cap Core Equity Fund (Class R6) | | | 112,935 | | | | 1,224,221 | |
PGIM QMA US Broad Market Index Fund (Class R6) | | | 218,617 | | | | 2,973,185 | |
PGIM TIPS Fund (Class R6) | | | 36,009 | | | | 355,411 | |
PGIM Total Return Bond Fund (Class R6) | | | 96,320 | | | | 1,422,640 | |
| | | | | | | | |
TOTAL LONG-TERM INVESTMENTS
(cost $17,061,723) | | | | | | | 17,540,638 | |
| | | | | | | | |
| | |
SHORT-TERM INVESTMENT 0.4% | | | | | | | | |
| | |
AFFILIATED MUTUAL FUND | | | | | | | | |
PGIM Core Ultra Short Bond Fund
(cost $73,551) | | | 73,551 | | | | 73,551 | |
| | | | | | | | |
TOTAL INVESTMENTS 100.3%
(cost $17,135,274)(w) | | | | | | | 17,614,189 | |
Liabilities in excess of other assets (0.3)% | | | | | | | (59,457 | ) |
| | | | | | | | |
NET ASSETS 100.0% | | | | | | $ | 17,554,732 | |
| | | | | | | | |
| (w) | PGIM Investments LLC, the manager of the Fund, also serves as the manager of the underlying funds in which the Fund invests. |
Fair Value Measurements:
Various inputs are used in determining the value of the Fund’s investments. These inputs are summarized in the three broad levels listed below.
Level 1—unadjusted quoted prices generally in active markets for identical securities.
Level 2—quoted prices for similar securities, interest rates and yield curves, prepayment speeds, foreign currency exchange rates and other observable inputs.
Level 3—unobservable inputs for securities valued in accordance with Board approved fair valuation procedures.
See Notes to Financial Statements.
| | | | |
| Prudential Day One Funds | | | 121 | |
Prudential Day One 2045 Fund
Schedule of Investments(continued)
as of July 31, 2019
The following is a summary of the inputs used as of July 31, 2019 in valuing such portfolio securities:
| | | | | | | | | | | | |
| | | Level 1 | | | Level 2 | | | Level 3 | |
Investments in Securities | | | | | | | | | | | | |
Affiliated Mutual Funds | | $ | 17,614,189 | | | $ | — | | | $ | — | |
| | | | | | | | | | | | |
Investment Allocation:
The investment allocation of portfolio holdings and liabilities in excess of other assets shown as a percentage of net assets as of July 31, 2019 were as follows (unaudited):
| | | | |
Large Cap | | | 28.9 | % |
International Developed Markets | | | 18.0 | |
Broad Market | | | 16.9 | |
Total Return Bond | | | 8.1 | |
Mid Cap | | | 7.0 | |
Emerging Markets | | | 5.0 | |
Real Estate | | | 5.0 | |
Core Bond | | | 3.0 | |
Commodity | | | 3.0 | |
Small Cap | | | 3.0 | % |
TIPS | | | 2.0 | |
Short Term | | | 0.4 | |
| | | | |
| | | 100.3 | |
Liabilities in excess of other assets | | | (0.3 | ) |
| | | | |
| | | 100.0 | % |
| | | | |
See Notes to Financial Statements.
Prudential Day One 2045 Fund
Statement of Assets & Liabilities
as of July 31, 2019
| | | | |
Assets | | | | |
Affiliated investments (cost $17,135,274) | | $ | 17,614,189 | |
Receivable for investments sold | | | 159,592 | |
Due from Manager | | | 18,015 | |
Receivable for Fund shares sold | | | 10,348 | |
| | | | |
Total Assets | | | 17,802,144 | |
| | | | |
| |
Liabilities | | | | |
Payable for investments purchased | | | 160,730 | |
Custodian and accounting fees payable | | | 47,600 | |
Audit fee payable | | | 20,402 | |
Accrued expenses and other liabilities | | | 12,147 | |
Payable for Fund shares reacquired | | | 2,609 | |
Affiliated transfer agent fee payable | | | 2,041 | |
Affiliated shareholder servicing fees payable | | | 1,205 | |
Distribution fee payable | | | 678 | |
| | | | |
Total Liabilities | | | 247,412 | |
| | | | |
| |
Net Assets | | $ | 17,554,732 | |
| | | | |
Net assets were comprised of: | | | | |
Shares of beneficial interest, at par | | $ | 1,524 | |
Paid-in capital in excess of par | | | 16,895,384 | |
Total distributable earnings (loss) | | | 657,824 | |
| | | | |
Net assets, July 31, 2019 | | $ | 17,554,732 | |
| | | | |
See Notes to Financial Statements.
| | | | |
| Prudential Day One Funds | | | 123 | |
Prudential Day One 2045 Fund
Statement of Assets & Liabilities(continued)
as of July 31, 2019
| | | | |
Class R1 | | | | |
Net asset value, offering price and redemption price per share,
($13,055 ÷ 1,138 shares of beneficial interest issued and outstanding) | | $ | 11.47 | |
| | | | |
| |
Class R2 | | | | |
Net asset value, offering price and redemption price per share,
($97,716 ÷ 8,502 shares of beneficial interest issued and outstanding) | | $ | 11.49 | |
| | | | |
| |
Class R3 | | | | |
Net asset value, offering price and redemption price per share,
($7,638,704 ÷ 664,420 shares of beneficial interest issued and outstanding) | | $ | 11.50 | |
| | | | |
| |
Class R4 | | | | |
Net asset value, offering price and redemption price per share,
($30,681 ÷ 2,667 shares of beneficial interest issued and outstanding) | | $ | 11.50 | |
| | | | |
| |
Class R5 | | | | |
Net asset value, offering price and redemption price per share,
($173,632 ÷ 15,080 shares of beneficial interest issued and outstanding) | | $ | 11.51 | |
| | | | |
| |
Class R6 | | | | |
Net asset value, offering price and redemption price per share,
($9,600,944 ÷ 832,498 shares of beneficial interest issued and outstanding) | | $ | 11.53 | |
| | | | |
See Notes to Financial Statements.
Prudential Day One 2045 Fund
Statement of Operations
Year Ended July 31, 2019
| | | | |
Net Investment Income (Loss) | | | | |
Affiliated dividend income | | $ | 290,800 | |
| | | | |
| |
Expenses | | | | |
Management fee | | | 3,055 | |
Distribution fee(a) | | | 6,864 | |
Shareholder servicing fees (including affiliated expense of $6,770)(a) | | | 6,943 | |
Custodian and accounting fees | | | 118,194 | |
Registration fees(a) | | | 68,268 | |
Audit fee | | | 20,402 | |
Legal fees and expenses | | | 17,311 | |
Transfer agent’s fees and expenses (including affiliated expense of $11,468)(a) | | | 12,406 | |
Trustees’ fees | | | 11,333 | |
Shareholders’ reports | | | 11,192 | |
Miscellaneous | | | 14,006 | |
| | | | |
Total expenses | | | 289,974 | |
Less: Fee waiver and/or expense reimbursement(a) | | | (274,517 | ) |
| | | | |
Net expenses | | | 15,457 | |
| | | | |
Net investment income (loss) | | | 275,343 | |
| | | | |
| |
Realized And Unrealized Gain (Loss) On Affiliated Investments | | | | |
Net realized gain (loss) on investment transactions | | | (420,494 | ) |
Net capital gain distributions received | | | 768,445 | |
| | | | |
| | | 347,951 | |
| | | | |
Net change in unrealized appreciation (depreciation) on investments | | | (101,765 | ) |
| | | | |
Net gain (loss) on investment transactions | | | 246,186 | |
| | | | |
Net Increase (Decrease) In Net Assets Resulting From Operations | | $ | 521,529 | |
| | | | |
| (a) | Class specific expenses and waivers were as follows: |
| | | | | | | | | | | | | | | | | | | | | | | | |
| | | Class R1 | | | Class R2 | | | Class R3 | | | Class R4 | | | Class R5 | | | Class R6 | |
Distribution fee | | | 60 | | | | 146 | | | | 6,658 | | | | — | | | | — | | | | — | |
Shareholder servicing fees | | | 11 | | | | 58 | | | | 6,657 | | | | 217 | | | | — | | | | — | |
Registration fees | | | 11,378 | | | | 11,378 | | | | 11,378 | | | | 11,378 | | | | 11,378 | | | | 11,378 | |
Transfer agent’s fees and expenses | | | 57 | | | | 359 | | | | 10,370 | | | | 475 | | | | 391 | | | | 754 | |
Fee waiver and/or expense reimbursement | | | (11,577 | ) | | | (12,417 | ) | | | (100,852 | ) | | | (14,492 | ) | | | (12,953 | ) | | | (122,226 | ) |
See Notes to Financial Statements.
| | | | |
| Prudential Day One Funds | | | 125 | |
Prudential Day One 2045 Fund
Statements of Changes in Net Assets
| | | | | | | | |
| |
| | | Year Ended July 31, | |
| | |
| | | 2019 | | | 2018 | |
Increase (Decrease) in Net Assets | | | | | | | | |
Operations | | | | | | | | |
Net investment income (loss) | | $ | 275,343 | | | $ | 157,098 | |
Net realized gain (loss) on investment transactions | | | (420,494 | ) | | | (61,346 | ) |
Net capital gain distributions received | | | 768,445 | | | | 429,060 | |
Net change in unrealized appreciation (depreciation) on investments | | | (101,765 | ) | | | 479,078 | |
| | | | | | | | |
Net increase (decrease) in net assets resulting from operations | | | 521,529 | | | | 1,003,890 | |
| | | | | | | | |
| | |
Dividends and Distributions | | | | | | | | |
Distributions from distributable earnings* | | | | | | | | |
Class R1 | | | (553 | ) | | | — | |
Class R2 | | | (1,341 | ) | | | — | |
Class R3 | | | (314,504 | ) | | | — | |
Class R4 | | | (13,084 | ) | | | — | |
Class R5 | | | (4,282 | ) | | | — | |
Class R6 | | | (429,583 | ) | | | — | |
| | | | | | | | |
| | | (763,347 | ) | | | — | |
| | | | | | | | |
Dividends from net investment income* | | | | | | | | |
Class R1 | | | | | | | (177 | ) |
Class R2 | | | | | | | (257 | ) |
Class R3 | | | | | | | (89,711 | ) |
Class R4 | | | | | | | (7,291 | ) |
Class R5 | | | | | | | (284 | ) |
Class R6 | | | | | | | (108,540 | ) |
| | | | | | | | |
| | | * | | | | (206,260 | ) |
| | | | | | | | |
Distributions from net realized gains* | | | | | | | | |
Class R1 | | | | | | | (9 | ) |
Class R2 | | | | | | | (11 | ) |
Class R3 | | | | | | | (3,663 | ) |
Class R4 | | | | | | | (281 | ) |
Class R5 | | | | | | | (10 | ) |
Class R6 | | | | | | | (3,724 | ) |
| | | | | | | | |
| | | * | | | | (7,698 | ) |
| | | | | | | | |
See Notes to Financial Statements.
| | | | | | | | |
| |
| | | Year Ended July 31, | |
| | |
| | | 2019 | | | 2018 | |
Fund share transactions | | | | | | | | |
Net proceeds from shares sold | | $ | 6,940,190 | | | $ | 8,107,700 | |
Net asset value of shares issued in reinvestment of dividends and distributions | | | 763,347 | | | | 213,958 | |
Cost of shares reacquired | | | (3,511,127 | ) | | | (3,051,456 | ) |
| | | | | | | | |
Net increase (decrease) in net assets from Fund share transactions | | | 4,192,410 | | | | 5,270,202 | |
| | | | | | | | |
Total increase (decrease) | | | 3,950,592 | | | | 6,060,134 | |
| | |
Net Assets: | | | | | | | | |
Beginning of year | | | 13,604,140 | | | | 7,544,006 | |
| | | | | | | | |
End of year(a) | | $ | 17,554,732 | | | $ | 13,604,140 | |
| | | | | | | | |
(a) Includes undistributed/(distributions in excess of) net investment income of: | | $ | * | | | $ | 24,373 | |
| | | | | | | | |
| * | For the year ended July 31, 2019, the disclosures have been revised to reflect revisions to RegulationS-X adopted by the SEC in 2018 (refer to Note 9). |
See Notes to Financial Statements.
| | | | |
| Prudential Day One Funds | | | 127 | |
Prudential Day One 2050 Fund
Schedule of Investments
as of July 31, 2019
| | | | | | | | |
| Description | | Shares | | | Value | |
LONG-TERM INVESTMENTS 99.9% | | | | | | | | |
| | |
AFFILIATED MUTUAL FUNDS | | | | | | | | |
PGIM Core Conservative Bond Fund (Class R6) | | | 21,927 | | | $ | 221,897 | |
PGIM Global Real Estate Fund (Class R6) | | | 21,384 | | | | 548,061 | |
PGIM JennisonSmall-Cap Core Equity Fund (Class R6) | | | 36,978 | | | | 436,716 | |
PGIM QMA Commodity Strategies Fund (Class R6) | | | 35,110 | | | | 331,441 | |
PGIM QMA Emerging Markets Equity Fund (Class R6) | | | 59,000 | | | | 657,853 | |
PGIM QMA International Developed Markets Index Fund (Class R6) | | | 179,024 | | | | 2,082,052 | |
PGIM QMALarge-Cap Core Equity Fund (Class R6) | | | 198,721 | | | | 3,062,294 | |
PGIM QMAMid-Cap Core Equity Fund (Class R6) | | | 80,713 | | | | 874,925 | |
PGIM QMA US Broad Market Index Fund (Class R6) | | | 136,711 | | | | 1,859,275 | |
PGIM TIPS Fund (Class R6) | | | 11,259 | | | | 111,122 | |
PGIM Total Return Bond Fund (Class R6) | | | 52,702 | | | | 778,403 | |
| | | | | | | | |
TOTAL LONG-TERM INVESTMENTS
(cost $10,640,545) | | | | | | | 10,964,039 | |
| | | | | | | | |
| | |
SHORT-TERM INVESTMENT 0.7% | | | | | | | | |
| | |
AFFILIATED MUTUAL FUND | | | | | | | | |
PGIM Core Ultra Short Bond Fund
(cost $71,734) | | | 71,734 | | | | 71,734 | |
| | | | | | | | |
TOTAL INVESTMENTS 100.6%
(cost $10,712,279)(w) | | | | | | | 11,035,773 | |
Liabilities in excess of other assets (0.6)% | | | | | | | (62,907 | ) |
| | | | | | | | |
NET ASSETS 100.0% | | | | | | $ | 10,972,866 | |
| | | | | | | | |
| (w) | PGIM Investments LLC, the manager of the Fund, also serves as the manager of the underlying funds in which the Fund invests. |
Fair Value Measurements:
Various inputs are used in determining the value of the Fund’s investments. These inputs are summarized in the three broad levels listed below.
Level 1—unadjusted quoted prices generally in active markets for identical securities.
Level 2—quoted prices for similar securities, interest rates and yield curves, prepayment speeds, foreign currency exchange rates and other observable inputs.
Level 3—unobservable inputs for securities valued in accordance with Board approved fair valuation procedures.
See Notes to Financial Statements.
The following is a summary of the inputs used as of July 31, 2019 in valuing such portfolio securities:
| | | | | | | | | | | | |
| | | Level 1 | | | Level 2 | | | Level 3 | |
Investments in Securities | | | | | | | | | | | | |
Affiliated Mutual Funds | | $ | 11,035,773 | | | $ | — | | | $ | — | |
| | | | | | | | | | | | |
Investment Allocation:
The investment allocation of portfolio holdings and liabilities in excess of other assets shown as a percentage of net assets as of July 31, 2019 were as follows (unaudited):
| | | | |
Large Cap | | | 27.9 | % |
International Developed Markets | | | 19.0 | |
Broad Market | | | 16.9 | |
Mid Cap | | | 8.0 | |
Total Return Bond | | | 7.1 | |
Emerging Markets | | | 6.0 | |
Real Estate | | | 5.0 | |
Small Cap | | | 4.0 | |
Commodity | | | 3.0 | |
Core Bond | | | 2.0 | % |
TIPS | | | 1.0 | |
Short Term | | | 0.7 | |
| | | | |
| | | 100.6 | |
Liabilities in excess of other assets | | | (0.6 | ) |
| | | | |
| | | 100.0 | % |
| | | | |
See Notes to Financial Statements.
| | | | |
| Prudential Day One Funds | | | 129 | |
Prudential Day One 2050 Fund
Statement of Assets & Liabilities
as of July 31, 2019
| | | | |
Assets | | | | |
Affiliated investments (cost $10,712,279) | | $ | 11,035,773 | |
Receivable for investments sold | | | 102,020 | |
Due from Manager | | | 17,421 | |
Receivable for Fund shares sold | | | 390 | |
| | | | |
Total Assets | | | 11,155,604 | |
| | | | |
| |
Liabilities | | | | |
Payable for investments purchased | | | 96,811 | |
Custodian and accounting fees payable | | | 47,491 | |
Audit fee payable | | | 20,402 | |
Accrued expenses and other liabilities | | | 11,718 | |
Payable for Fund shares reacquired | | | 4,324 | |
Affiliated transfer agent fee payable | | | 1,010 | |
Distribution fee payable | | | 552 | |
Affiliated shareholder servicing fees payable | | | 430 | |
| | | | |
Total Liabilities | | | 182,738 | |
| | | | |
| |
Net Assets | | $ | 10,972,866 | |
| | | | |
Net assets were comprised of: | | | | |
Shares of beneficial interest, at par | | $ | 944 | |
Paid-in capital in excess of par | | | 10,588,103 | |
Total distributable earnings (loss) | | | 383,819 | |
| | | | |
Net assets, July 31, 2019 | | $ | 10,972,866 | |
| | | | |
See Notes to Financial Statements.
| | | | |
Class R1 | | | | |
Net asset value, offering price and redemption price per share,
($166,388 ÷ 14,360 shares of beneficial interest issued and outstanding) | | $ | 11.59 | |
| | | | |
| |
Class R2 | | | | |
Net asset value, offering price and redemption price per share,
($1,950,870 ÷ 168,265 shares of beneficial interest issued and outstanding) | | $ | 11.59 | |
| | | | |
| |
Class R3 | | | | |
Net asset value, offering price and redemption price per share,
($1,073,820 ÷ 92,513 shares of beneficial interest issued and outstanding) | | $ | 11.61 | |
| | | | |
| |
Class R4 | | | | |
Net asset value, offering price and redemption price per share,
($12,454 ÷ 1,074 shares of beneficial interest issued and outstanding) | | $ | 11.59 | |
| | | | |
| |
Class R5 | | | | |
Net asset value, offering price and redemption price per share,
($732,077 ÷ 63,011 shares of beneficial interest issued and outstanding) | | $ | 11.62 | |
| | | | |
| |
Class R6 | | | | |
Net asset value, offering price and redemption price per share,
($7,037,257 ÷ 604,499 shares of beneficial interest issued and outstanding) | | $ | 11.64 | |
| | | | |
See Notes to Financial Statements.
| | | | |
| Prudential Day One Funds | | | 131 | |
Prudential Day One 2050 Fund
Statement of Operations
Year Ended July 31, 2019
| | | | |
Net Investment Income (Loss) | | | | |
Affiliated dividend income | | $ | 144,989 | |
| | | | |
| |
Expenses | | | | |
Management fee | | | 1,628 | |
Distribution fee(a) | | | 4,751 | |
Shareholder servicing fees (including affiliated expense of $2,013)(a) | | | 2,215 | |
Custodian and accounting fees | | | 118,030 | |
Registration fees(a) | | | 68,268 | |
Audit fee | | | 20,402 | |
Legal fees and expenses | | | 17,308 | |
Trustees’ fees | | | 11,313 | |
Shareholders’ reports | | | 10,466 | |
Transfer agent’s fees and expenses (including affiliated expense of $5,099)(a) | | | 5,763 | |
Miscellaneous | | | 13,998 | |
| | | | |
Total expenses | | | 274,142 | |
Less: Fee waiver and/or expense reimbursement(a) | | | (268,842 | ) |
| | | | |
Net expenses | | | 5,300 | |
| | | | |
Net investment income (loss) | | | 139,689 | |
| | | | |
| |
Realized And Unrealized Gain (Loss) On Affiliated Investments | | | | |
Net realized gain (loss) on investment transactions | | | (249,769 | ) |
Net capital gain distributions received | | | 382,816 | |
| | | | |
| | | 133,047 | |
| | | | |
Net change in unrealized appreciation (depreciation) on investments | | | 32,598 | |
| | | | |
Net gain (loss) on investment transactions | | | 165,645 | |
| | | | |
Net Increase (Decrease) In Net Assets Resulting From Operations | | $ | 305,334 | |
| | | | |
| (a) | Class specific expenses and waivers were as follows: |
| | | | | | | | | | | | | | | | | | | | | | | | |
| | | Class R1 | | | Class R2 | | | Class R3 | | | Class R4 | | | Class R5 | | | Class R6 | |
Distribution fee | | | 726 | | | | 3,370 | | | | 655 | | | | — | | | | — | | | | — | |
Shareholder servicing fees | | | 145 | | | | 1,348 | | | | 655 | | | | 67 | | | | — | | | | — | |
Registration fees | | | 11,378 | | | | 11,378 | | | | 11,378 | | | | 11,378 | | | | 11,378 | | | | 11,378 | |
Transfer agent’s fees and expenses | | | 241 | | | | 2,449 | | | | 1,211 | | | | 141 | | | | 1,082 | | | | 639 | |
Fee waiver and/or expense reimbursement | | | (15,018 | ) | | | (44,805 | ) | | | (27,178 | ) | | | (13,292 | ) | | | (26,654 | ) | | | (141,895 | ) |
See Notes to Financial Statements.
Prudential Day One 2050 Fund
Statements of Changes in Net Assets
| | | | | | | | |
| |
| | | Year Ended July 31, | |
| | |
| | | 2019 | | | 2018 | |
Increase (Decrease) in Net Assets | | | | | | | | |
Operations | | | | | | | | |
Net investment income (loss) | | $ | 139,689 | | | $ | 54,667 | |
Net realized gain (loss) on investment transactions | | | (249,769 | ) | | | (19,129 | ) |
Net capital gain distributions received | | | 382,816 | | | | 138,942 | |
Net change in unrealized appreciation (depreciation) on investments | | | 32,598 | | | | 228,457 | |
| | | | | | | | |
Net increase (decrease) in net assets resulting from operations | | | 305,334 | | | | 402,937 | |
| | | | | | | | |
| | |
Dividends and Distributions | | | | | | | | |
Distributions from distributable earnings* | | | | | | | | |
Class R1 | | | (5,279 | ) | | | — | |
Class R2 | | | (50,175 | ) | | | — | |
Class R3 | | | (20,972 | ) | | | — | |
Class R4 | | | (504 | ) | | | — | |
Class R5 | | | (25,567 | ) | | | — | |
Class R6 | | | (211,035 | ) | | | — | |
| | | | | | | | |
| | | (313,532 | ) | | | — | |
| | | | | | | | |
Dividends from net investment income* | | | | | | | | |
Class R1 | | | | | | | (1,853 | ) |
Class R2 | | | | | | | (535 | ) |
Class R3 | | | | | | | (2,293 | ) |
Class R4 | | | | | | | (1,851 | ) |
Class R5 | | | | | | | (250 | ) |
Class R6 | | | | | | | (64,187 | ) |
| | | | | | | | |
| | | * | | | | (70,969 | ) |
| | | | | | | | |
Distributions from net realized gains* | | | | | | | | |
Class R1 | | | | | | | (147 | ) |
Class R2 | | | | | | | (36 | ) |
Class R3 | | | | | | | (145 | ) |
Class R4 | | | | | | | (111 | ) |
Class R5 | | | | | | | (14 | ) |
Class R6 | | | | | | | (3,419 | ) |
| | | | | | | | |
| | | * | | | | (3,872 | ) |
| | | | | | | | |
See Notes to Financial Statements.
| | | | |
| Prudential Day One Funds | | | 133 | |
Prudential Day One 2050 Fund
Statements of Changes in Net Assets(continued)
| | | | | | | | |
| |
| | | Year Ended July 31, | |
| | |
| | | 2019 | | | 2018 | |
Fund share transactions | | | | | | | | |
Net proceeds from shares sold | | $ | 6,485,384 | | | $ | 5,470,653 | |
Net asset value of shares issued in reinvestment of dividends and distributions | | | 313,532 | | | | 74,841 | |
Cost of shares reacquired | | | (1,892,738 | ) | | | (2,023,608 | ) |
| | | | | | | | |
Net increase (decrease) in net assets from Fund share transactions | | | 4,906,178 | | | | 3,521,886 | |
| | | | | | | | |
Total increase (decrease) | | | 4,897,980 | | | | 3,849,982 | |
| | |
Net Assets: | | | | | | | | |
Beginning of year | | | 6,074,886 | | | | 2,224,904 | |
| | | | | | | | |
End of year(a) | | $ | 10,972,866 | | | $ | 6,074,886 | |
| | | | | | | | |
(a) Includes undistributed/(distributions in excess of) net investment income of: | | $ | * | | | $ | 10,142 | |
| | | | | | | | |
| * | For the year ended July 31, 2019, the disclosures have been revised to reflect revisions to RegulationS-X adopted by the SEC in 2018 (refer to Note 9). |
See Notes to Financial Statements.
Prudential Day One 2055 Fund
Schedule of Investments
as of July 31, 2019
| | | | | | | | |
| Description | | Shares | | | Value | |
LONG-TERM INVESTMENTS 99.9% | | | | | | | | |
| | |
AFFILIATED MUTUAL FUNDS | | | | | | | | |
PGIM Global Real Estate Fund (Class R6) | | | 14,653 | | | $ | 375,545 | |
PGIM JennisonSmall-Cap Core Equity Fund (Class R6) | | | 31,673 | | | | 374,061 | |
PGIM QMA Commodity Strategies Fund (Class R6) | | | 24,058 | | | | 227,112 | |
PGIM QMA Emerging Markets Equity Fund (Class R6) | | | 53,905 | | | | 601,042 | |
PGIM QMA International Developed Markets Index Fund (Class R6) | | | 135,586 | | | | 1,576,863 | |
PGIM QMALarge-Cap Core Equity Fund (Class R6) | | | 131,305 | | | | 2,023,417 | |
PGIM QMAMid-Cap Core Equity Fund (Class R6) | | | 62,220 | | | | 674,464 | |
PGIM QMA US Broad Market Index Fund (Class R6) | | | 88,167 | | | | 1,199,078 | |
PGIM Total Return Bond Fund (Class R6) | | | 30,955 | | | | 457,208 | |
| | | | | | | | |
TOTAL LONG-TERM INVESTMENTS
(cost $7,333,579) | | | | | | | 7,508,790 | |
| | | | | | | | |
| | |
SHORT-TERM INVESTMENT 1.0% | | | | | | | | |
| | |
AFFILIATED MUTUAL FUND | | | | | | | | |
PGIM Core Ultra Short Bond Fund
(cost $70,317) | | | 70,317 | | | | 70,317 | |
| | | | | | | | |
TOTAL INVESTMENTS 100.9%
(cost $7,403,896)(w) | | | | | | | 7,579,107 | |
Liabilities in excess of other assets (0.9)% | | | | | | | (64,277 | ) |
| | | | | | | | |
NET ASSETS 100.0% | | | | | | $ | 7,514,830 | |
| | | | | | | | |
| (w) | PGIM Investments LLC, the manager of the Fund, also serves as the manager of the underlying funds in which the Fund invests. |
Fair Value Measurements:
Various inputs are used in determining the value of the Fund’s investments. These inputs are summarized in the three broad levels listed below.
Level 1—unadjusted quoted prices generally in active markets for identical securities.
Level 2—quoted prices for similar securities, interest rates and yield curves, prepayment speeds, foreign currency exchange rates and other observable inputs.
Level 3—unobservable inputs for securities valued in accordance with Board approved fair valuation procedures.
See Notes to Financial Statements.
| | | | |
| Prudential Day One Funds | | | 135 | |
Prudential Day One 2055 Fund
Schedule of Investments (continued)
as of July 31, 2019
The following is a summary of the inputs used as of July 31, 2019 in valuing such portfolio securities:
| | | | | | | | | | | | |
| | | Level 1 | | | Level 2 | | | Level 3 | |
Investments in Securities | | | | | | | | | | | | |
Affiliated Mutual Funds | | $ | 7,579,107 | | | $ | — | | | $ | — | |
| | | | | | | | | | | | |
Investment Allocation:
The investment allocation of portfolio holdings and liabilities in excess of other assets shown as a percentage of net assets as of July 31, 2019 were as follows (unaudited):
| | | | |
Large Cap | | | 26.9 | % |
International Developed Markets | | | 21.0 | |
Broad Market | | | 15.9 | |
Mid Cap | | | 9.0 | |
Emerging Markets | | | 8.0 | |
Total Return Bond | | | 6.1 | |
Real Estate | | | 5.0 | |
Small Cap | | | 5.0 | |
Commodity | | | 3.0 | % |
Short Term | | | 1.0 | |
| | | | |
| | | 100.9 | |
Liabilities in excess of other assets | | | (0.9 | ) |
| | | | |
| | | 100.0 | % |
| | | | |
See Notes to Financial Statements.
Prudential Day One 2055 Fund
Statement of Assets & Liabilities
as of July 31, 2019
| | | | |
Assets | | | | |
Affiliated investments (cost $7,403,896) | | $ | 7,579,107 | |
Receivable for investments sold | | | 70,903 | |
Due from Manager | | | 17,173 | |
Receivable for Fund shares sold | | | 7,455 | |
| | | | |
Total Assets | | | 7,674,638 | |
| | | | |
| |
Liabilities | | | | |
Payable for investments purchased | | | 73,110 | |
Custodian and accounting fees payable | | | 47,519 | |
Audit fee payable | | | 20,402 | |
Accrued expenses and other liabilities | | | 12,108 | |
Payable for Fund shares reacquired | | | 4,736 | |
Affiliated transfer agent fee payable | | | 1,022 | |
Affiliated shareholder servicing fees payable | | | 577 | |
Distribution fee payable | | | 334 | |
| | | | |
Total Liabilities | | | 159,808 | |
| | | | |
| |
Net Assets | | $ | 7,514,830 | |
| | | | |
| | | | | |
Net assets were comprised of: | | | | |
Shares of beneficial interest, at par | | $ | 650 | |
Paid-in capital in excess of par | | | 7,299,377 | |
Total distributable earnings (loss) | | | 214,803 | |
| | | | |
Net assets, July 31, 2019 | | $ | 7,514,830 | |
| | | | |
See Notes to Financial Statements.
| | | | |
| Prudential Day One Funds | | | 137 | |
Prudential Day One 2055 Fund
Statement of Assets & Liabilities(continued)
as of July 31, 2019
| | | | |
Class R1 | | | | |
Net asset value, offering price and redemption price per share,
($15,364 ÷ 1,333 shares of beneficial interest issued and outstanding) | | $ | 11.52 | |
| | | | |
| |
Class R2 | | | | |
Net asset value, offering price and redemption price per share,
($62,627 ÷ 5,425 shares of beneficial interest issued and outstanding) | | $ | 11.54 | |
| | | | |
| |
Class R3 | | | | |
Net asset value, offering price and redemption price per share,
($3,698,863 ÷ 320,332 shares of beneficial interest issued and outstanding) | | $ | 11.55 | |
| | | | |
| |
Class R4 | | | | |
Net asset value, offering price and redemption price per share,
($12,579 ÷ 1,088 shares of beneficial interest issued and outstanding) | | $ | 11.56 | |
| | | | |
| |
Class R5 | | | | |
Net asset value, offering price and redemption price per share,
($90,425 ÷ 7,819 shares of beneficial interest issued and outstanding) | | $ | 11.56 | |
| | | | |
| |
Class R6 | | | | |
Net asset value, offering price and redemption price per share,
($3,634,972 ÷ 314,303 shares of beneficial interest issued and outstanding) | | $ | 11.57 | |
| | | | |
See Notes to Financial Statements.
Prudential Day One 2055 Fund
Statement of Operations
Year Ended July 31, 2019
| | | | |
Net Investment Income (Loss) | | | | |
Affiliated dividend income | | $ | 117,576 | |
| | | | |
| |
Expenses | | | | |
Management fee | | | 1,297 | |
Distribution fee(a) | | | 3,359 | |
Shareholder servicing fees (including affiliated expense of $3,177)(a) | | | 3,267 | |
Custodian and accounting fees | | | 117,970 | |
Registration fees(a) | | | 68,268 | |
Audit fee | | | 20,402 | |
Legal fees and expenses | | | 17,294 | |
Trustees’ fees | | | 11,243 | |
Shareholders’ reports | | | 11,070 | |
Transfer agent’s fees and expenses (including affiliated expense of $5,832)(a) | | | 6,489 | |
Miscellaneous | | | 13,997 | |
| | | | |
Total expenses | | | 274,656 | |
Less: Fee waiver and/or expense reimbursement(a) | | | (268,948 | ) |
| | | | |
Net expenses | | | 5,708 | |
| | | | |
Net investment income (loss) | | | 111,868 | |
| | | | |
| |
Realized And Unrealized Gain (Loss) On Affiliated Investments | | | | |
Net realized gain (loss) on investment transactions | | | (193,726 | ) |
Net capital gain distributions received | | | 328,773 | |
| | | | |
| | | 135,047 | |
| | | | |
Net change in unrealized appreciation (depreciation) on investments | | | (92,821 | ) |
| | | | |
Net gain (loss) on investment transactions | | | 42,226 | |
| | | | |
Net Increase (Decrease) In Net Assets Resulting From Operations | | $ | 154,094 | |
| | | | |
| (a) | Class specific expenses and waivers were as follows: |
| | | | | | | | | | | | | | | | | | | | | | | | |
| | | Class R1 | | | Class R2 | | | Class R3 | | | Class R4 | | | Class R5 | | | Class R6 | |
Distribution fee | | | 74 | | | | 108 | | | | 3,177 | | | | — | | | | — | | | | — | |
Shareholder servicing fees | | | 15 | | | | 43 | | | | 3,177 | | | | 32 | | | | — | | | | — | |
Registration fees | | | 11,378 | | | | 11,378 | | | | 11,378 | | | | 11,378 | | | | 11,378 | | | | 11,378 | |
Transfer agent’s fees and expenses | | | 75 | | | | 538 | | | | 5,020 | | | | 94 | | | | 200 | | | | 562 | |
Fee waiver and/or expense reimbursement | | | (11,886 | ) | | | (13,172 | ) | | | (109,171 | ) | | | (12,458 | ) | | | (13,010 | ) | | | (109,251 | ) |
See Notes to Financial Statements.
| | | | |
| Prudential Day One Funds | | | 139 | |
Prudential Day One 2055 Fund
Statements of Changes in Net Assets
| | | | | | | | |
| |
| | | Year Ended July 31, | |
| | |
| | | 2019 | | | 2018 | |
Increase (Decrease) in Net Assets | | | | | | | | |
Operations | | | | | | | | |
Net investment income (loss) | | $ | 111,868 | | | $ | 66,005 | |
Net realized gain (loss) on investment transactions | | | (193,726 | ) | | | (41,560 | ) |
Net capital gain distributions received | | | 328,773 | | | | 204,550 | |
Net change in unrealized appreciation (depreciation) on investments | | | (92,821 | ) | | | 229,773 | |
| | | | | | | | |
Net increase (decrease) in net assets resulting from operations | | | 154,094 | | | | 458,768 | |
| | | | | | | | |
| | |
Dividends and Distributions | | | | | | | | |
Distributions from distributable earnings* | | | | | | | | |
Class R1 | | | (720 | ) | | | — | |
Class R2 | | | (1,666 | ) | | | — | |
Class R3 | | | (163,072 | ) | | | — | |
Class R4 | | | (831 | ) | | | — | |
Class R5 | | | (1,643 | ) | | | — | |
Class R6 | | | (170,969 | ) | | | — | |
| | | | | | | | |
| | | (338,901 | ) | | | — | |
| | | | | | | | |
Dividends from net investment income* | | | | | | | | |
Class R1 | | | | | | | (193 | ) |
Class R2 | | | | | | | (361 | ) |
Class R3 | | | | | | | (44,776 | ) |
Class R4 | | | | | | | (1,142 | ) |
Class R5 | | | | | | | (278 | ) |
Class R6 | | | | | | | (51,383 | ) |
| | | | | | | | |
| | | * | | | | (98,133 | ) |
| | | | | | | | |
Fund share transactions | | | | | | | | |
Net proceeds from shares sold | | | 2,799,993 | | | | 3,478,096 | |
Net asset value of shares issued in reinvestment of dividends and distributions | | | 338,901 | | | | 98,133 | |
Cost of shares reacquired | | | (1,144,621 | ) | | | (1,061,383 | ) |
| | | | | | | | |
Net increase (decrease) in net assets from Fund share transactions | | | 1,994,273 | | | | 2,514,846 | |
| | | | | | | | |
Total increase (decrease) | | | 1,809,466 | | | | 2,875,481 | |
| | |
Net Assets: | | | | | | | | |
Beginning of year | | | 5,705,364 | | | | 2,829,883 | |
| | | | | | | | |
End of year(a) | | $ | 7,514,830 | | | $ | 5,705,364 | |
| | | | | | | | |
(a) Includes undistributed/(distributions in excess of) net investment income of: | | $ | * | | | $ | 4,611 | |
| | | | | | | | |
| * | For the year ended July 31, 2019, the disclosures have been revised to reflect revisions to RegulationS-X adopted by the SEC in 2018 (refer to Note 9). |
See Notes to Financial Statements.
Prudential Day One 2060 Fund
Schedule of Investments
as of July 31, 2019
| | | | | | | | |
| Description | | Shares | | | Value | |
LONG-TERM INVESTMENTS 99.9% | | | | | | | | |
| | |
AFFILIATED MUTUAL FUNDS | | | | | | | | |
PGIM Global Real Estate Fund (Class R6) | | | 4,258 | | | $ | 109,141 | |
PGIM JennisonSmall-Cap Core Equity Fund (Class R6) | | | 9,205 | | | | 108,711 | |
PGIM QMA Commodity Strategies Fund (Class R6) | | | 6,992 | | | | 66,003 | |
PGIM QMA Emerging Markets Equity Fund (Class R6) | | | 15,666 | | | | 174,675 | |
PGIM QMA International Developed Markets Index Fund (Class R6) | | | 43,157 | | | | 501,913 | |
PGIM QMALarge-Cap Core Equity Fund (Class R6) | | | 39,574 | | | | 609,831 | |
PGIM QMAMid-Cap Core Equity Fund (Class R6) | | | 18,082 | | | | 196,014 | |
PGIM QMA US Broad Market Index Fund (Class R6) | | | 25,624 | | | | 348,480 | |
PGIM Total Return Bond Fund (Class R6) | | | 4,498 | | | | 66,433 | |
| | | | | | | | |
TOTAL LONG-TERM INVESTMENTS
(cost $2,123,639) | | | | | | | 2,181,201 | |
| | | | | | | | |
| | |
SHORT-TERM INVESTMENT 3.0% | | | | | | | | |
| | |
AFFILIATED MUTUAL FUND | | | | | | | | |
PGIM Core Ultra Short Bond Fund
(cost $65,957) | | | 65,957 | | | | 65,957 | |
| | | | | | | | |
TOTAL INVESTMENTS 102.9%
(cost $2,189,596)(w) | | | | | | | 2,247,158 | |
Liabilities in excess of other assets (2.9)% | | | | | | | (64,206 | ) |
| | | | | | | | |
NET ASSETS 100.0% | | | | | | $ | 2,182,952 | |
| | | | | | | | |
| (w) | PGIM Investments LLC, the manager of the Fund, also serves as the manager of the underlying funds in which the Fund invests. |
Fair Value Measurements:
Various inputs are used in determining the value of the Fund’s investments. These inputs are summarized in the three broad levels listed below.
Level 1—unadjusted quoted prices generally in active markets for identical securities.
Level 2—quoted prices for similar securities, interest rates and yield curves, prepayment speeds, foreign currency exchange rates and other observable inputs.
Level 3—unobservable inputs for securities valued in accordance with Board approved fair valuation procedures.
See Notes to Financial Statements.
| | | | |
| Prudential Day One Funds | | | 141 | |
Prudential Day One 2060 Fund
Schedule of Investments(continued)
as of July 31, 2019
The following is a summary of the inputs used as of July 31, 2019 in valuing such portfolio securities:
| | | | | | | | | | | | |
| | | Level 1 | | | Level 2 | | | Level 3 | |
Investments in Securities | | | | | | | | | | | | |
Affiliated Mutual Funds. | | $ | 2,247,158 | | | $ | — | | | $ | — | |
| | | | | | | | | | | | |
Investment Allocation:
The investment allocation of portfolio holdings and liabilities in excess of other assets shown as a percentage of net assets as of July 31, 2019 were as follows (unaudited):
| | | | |
Large Cap | | | 27.9 | % |
International Developed Markets | | | 23.0 | |
Broad Market | | | 16.0 | |
Mid Cap | | | 9.0 | |
Emerging Markets | | | 8.0 | |
Real Estate | | | 5.0 | |
Small Cap | | | 5.0 | |
Total Return Bond | | | 3.0 | |
Commodity | | | 3.0 | % |
Short Term | | | 3.0 | |
| | | | |
| | | 102.9 | |
Liabilities in excess of other assets | | | (2.9 | ) |
| | | | |
| | | 100.0 | % |
| | | | |
See Notes to Financial Statements.
Prudential Day One 2060 Fund
Statement of Assets & Liabilities
as of July 31, 2019
| | | | |
Assets | | | | |
Affiliated investments (cost $2,189,596) | | $ | 2,247,158 | |
Receivable for investments sold | | | 20,404 | |
Due from Manager | | | 16,853 | |
Receivable for Fund shares sold | | | 4,014 | |
| | | | |
Total Assets | | | 2,288,429 | |
| | | | |
| |
Liabilities | | | | |
Custodian and accounting fees payable | | | 47,627 | |
Payable for investments purchased | | | 23,320 | |
Audit fee payable | | | 20,402 | |
Accrued expenses and other liabilities | | | 12,598 | |
Payable for Fund shares reacquired | | | 1,040 | |
Affiliated transfer agent fee payable | | | 296 | |
Distribution fee payable | | | 107 | |
Affiliated shareholder servicing fees payable | | | 87 | |
| | | | |
Total Liabilities | | | 105,477 | |
| | | | |
| |
Net Assets | | $ | 2,182,952 | |
| | | | |
| | | | | |
Net assets were comprised of: | | | | |
Shares of beneficial interest, at par | | $ | 187 | |
Paid-in capital in excess of par | | | 2,137,911 | |
Total distributable earnings (loss) | | | 44,854 | |
| | | | |
Net assets, July 31, 2019 | | $ | 2,182,952 | |
| | | | |
See Notes to Financial Statements.
| | | | |
| Prudential Day One Funds | | | 143 | |
Prudential Day One 2060 Fund
Statement of Assets & Liabilities(continued)
as of July 31, 2019
| | | | |
Class R1 | | | | |
Net asset value, offering price and redemption price per share,
($12,333 ÷ 1,061 shares of beneficial interest issued and outstanding) | | $ | 11.62 | |
| | | | |
| |
Class R2 | | | | |
Net asset value, offering price and redemption price per share,
($388,252 ÷ 33,373 shares of beneficial interest issued and outstanding) | | $ | 11.63 | |
| | | | |
| |
Class R3 | | | | |
Net asset value, offering price and redemption price per share,
($278,756 ÷ 23,926 shares of beneficial interest issued and outstanding) | | $ | 11.65 | |
| | | | |
| |
Class R4 | | | | |
Net asset value, offering price and redemption price per share,
($12,499 ÷ 1,073 shares of beneficial interest issued and outstanding) | | $ | 11.65 | |
| | | | |
| |
Class R5 | | | | |
Net asset value, offering price and redemption price per share,
($66,886 ÷ 5,736 shares of beneficial interest issued and outstanding) | | $ | 11.66 | |
| | | | |
| |
Class R6 | | | | |
Net asset value, offering price and redemption price per share,
($1,424,226 ÷ 122,149 shares of beneficial interest issued and outstanding) | | $ | 11.66 | |
| | | | |
See Notes to Financial Statements.
Prudential Day One 2060 Fund
Statement of Operations
Year Ended July 31, 2019
| | | | |
Net Investment Income (Loss) | | | | |
Affiliated dividend income | | $ | 24,771 | |
| | | | |
| |
Expenses | | | | |
Management fee | | | 288 | |
Distribution fee(a) | | | 797 | |
Shareholder servicing fees (including affiliated expense of $358)(a) | | | 398 | |
Custodian and accounting fees | | | 118,174 | |
Registration fees(a) | | | 68,268 | |
Audit fee | | | 20,402 | |
Legal fees and expenses | | | 17,292 | |
Trustees’ fees | | | 11,233 | |
Shareholders’ reports | | | 10,475 | |
Transfer agent’s fees and expenses (including affiliated expense of $1,616)(a) | | | 2,122 | |
Miscellaneous | | | 14,779 | |
| | | | |
Total expenses | | | 264,228 | |
Less: Fee waiver and/or expense reimbursement(a) | | | (263,645 | ) |
| | | | |
Net expenses | | | 583 | |
| | | | |
Net investment income (loss) | | | 24,188 | |
| | | | |
| |
Realized And Unrealized Gain (Loss) On Affiliated Investments | | | | |
Net realized gain (loss) on investment transactions | | | (62,776 | ) |
Net capital gain distributions received | | | 72,543 | |
| | | | |
| | | 9,767 | |
| | | | |
Net change in unrealized appreciation (depreciation) on investments | | | 25,847 | |
| | | | |
Net gain (loss) on investment transactions | | | 35,614 | |
| | | | |
Net Increase (Decrease) In Net Assets Resulting From Operations | | $ | 59,802 | |
| | | | |
| (a) | Class specific expenses and waivers were as follows: |
| | | | | | | | | | | | | | | | | | | | | | | | |
| | | Class R1 | | | Class R2 | | | Class R3 | | | Class R4 | | | Class R5 | | | Class R6 | |
Distribution fee | | | 60 | | | | 565 | | | | 172 | | | | — | | | | — | | | | — | |
Shareholder servicing fees | | | — | | | | 226 | | | | 172 | | | | — | | | | — | | | | — | |
Registration fees | | | 11,378 | | | | 11,378 | | | | 11,378 | | | | 11,378 | | | | 11,378 | | | | 11,378 | |
Transfer agent’s fees and expenses | | | 39 | | | | 719 | | | | 488 | | | | 64 | | | | 177 | | | | 635 | |
Fee waiver and/or expense reimbursement | | | (13,112 | ) | | | (41,511 | ) | | | (34,923 | ) | | | (13,237 | ) | | | (16,120 | ) | | | (144,742 | ) |
See Notes to Financial Statements.
| | | | |
| Prudential Day One Funds | | | 145 | |
Prudential Day One 2060 Fund
Statements of Changes in Net Assets
| | | | | | | | |
| |
| | | Year Ended July 31, | |
| | |
| | | 2019 | | | 2018 | |
Increase (Decrease) in Net Assets | | | | | | | | |
Operations | | | | | | | | |
Net investment income (loss) | | $ | 24,188 | | | $ | 6,373 | |
Net realized gain (loss) on investment transactions | | | (62,776 | ) | | | (5,808 | ) |
Net capital gain distributions received | | | 72,543 | | | | 20,098 | |
Net change in unrealized appreciation (depreciation) on investments | | | 25,847 | | | | 24,350 | |
| | | | | | | | |
Net increase (decrease) in net assets resulting from operations | | | 59,802 | | | | 45,013 | |
| | | | | | | | |
| | |
Dividends and Distributions | | | | | | | | |
Distributions from distributable earnings* | | | | | | | | |
Class R1 | | | (430 | ) | | | — | |
Class R2 | | | (7,416 | ) | | | — | |
Class R3 | | | (5,954 | ) | | | — | |
Class R4 | | | (531 | ) | | | — | |
Class R5 | | | (1,369 | ) | | | — | |
Class R6 | | | (41,918 | ) | | | — | |
| | | | | | | | |
| | | (57,618 | ) | | | — | |
| | | | | | | | |
Dividends from net investment income* | | | | | | | | |
Class R1 | | | | | | | (195 | ) |
Class R2 | | | | | | | (253 | ) |
Class R3 | | | | | | | (1,462 | ) |
Class R4 | | | | | | | (252 | ) |
Class R5 | | | | | | | (264 | ) |
Class R6 | | | | | | | (7,478 | ) |
| | | | | | | | |
| | | * | | | | (9,904 | ) |
| | | | | | | | |
| | |
Fund share transactions | | | | | | | | |
Net proceeds from shares sold | | | 1,819,374 | | | | 940,521 | |
Net asset value of shares issued in reinvestment of dividends and distributions | | | 57,618 | | | | 9,904 | |
Cost of shares reacquired | | | (405,229 | ) | | | (383,454 | ) |
| | | | | | | | |
Net increase (decrease) in net assets from Fund share transactions | | | 1,471,763 | | | | 566,971 | |
| | | | | | | | |
Total increase (decrease) | | | 1,473,947 | | | | 602,080 | |
| | |
Net Assets: | | | | | | | | |
Beginning of year | | | 709,005 | | | | 106,925 | |
| | | | | | | | |
End of year(a) | | $ | 2,182,952 | | | $ | 709,005 | |
| | | | | | | | |
(a) Includes undistributed/(distributions in excess of) net investment income of: | | $ | | * | | $ | 267 | |
| | | | | | | | |
| * | For the year ended July 31, 2019, the disclosures have been revised to reflect revisions to RegulationS-X adopted by the SEC in 2018 (refer to Note 9). |
See Notes to Financial Statements.
Notes to Financial Statements
Prudential Investment Portfolios 5 (the “Trust”) is registered under the Investment Company Act of 1940, as amended (“1940 Act”), as a diversified,open-end management investment company. The Trust currently consists of fifteen funds: Prudential Day One Income Fund, Prudential Day One 2010 Fund, Prudential Day One 2015 Fund, Prudential Day One 2020 Fund, Prudential Day One 2025 Fund, Prudential Day One 2030 Fund, Prudential Day One 2035 Fund, Prudential Day One 2040 Fund, Prudential Day One 2045 Fund, Prudential Day One 2050 Fund, Prudential Day One 2055 Fund, Prudential Day One 2060 Fund, PGIM 60/40 Allocation Fund, PGIM Jennison Diversified Growth Fund and PGIM Jennison Rising Dividend Fund.
These financial statements relate only to the Prudential Day One Income Fund, Prudential Day One 2010 Fund, Prudential Day One 2015 Fund, Prudential Day One 2020 Fund, Prudential Day One 2025 Fund, Prudential Day One 2030 Fund, Prudential Day One 2035 Fund, Prudential Day One 2040 Fund, Prudential Day One 2045 Fund, Prudential Day One 2050 Fund, Prudential Day One 2055 Fund and Prudential Day One 2060 Fund (collectively referred to as the “Day One Funds”).
The investment objective of each of the Day One Funds is to seek a balance between growth and conservation of capital. Each Day One Fund seeks to achieve its objective by investing in a combination of mutual funds in the PGIM mutual fund family (each, an “underlying fund”). Each of the Day One Funds is typically referred to as a “Fund of Funds” because it invests in other mutual funds. The Day One Funds may also invest directly in U.S. Government securities and money market instruments for cash management purposes or when assuming a defensive position.
1. Accounting Policies
The Day One Funds follow the investment company accounting and reporting guidance of the Financial Accounting Standards Board (“FASB”) Accounting Standard Codification (“ASC”) Topic 946 Financial Services—Investment Companies.The following accounting policies conform to U.S. generally accepted accounting principles. The Day One Funds consistently follow such policies in the preparation of their financial statements.
Securities Valuation:The Day One Funds hold securities and other assets and liabilities that are fair valued at the close of each day (generally, 4:00 PM Eastern time) the New York Stock Exchange (“NYSE”) is open for trading. Fair value is the price that would be received to sell an asset or paid to transfer a liability in an orderly transaction between market participants on the measurement date. The Trust’s Board of Trustees (the “Board”) has adopted valuation procedures for security valuation under which fair valuation responsibilities have been delegated to PGIM Investments LLC (“PGIM Investments” or the “Manager”). Pursuant to the Board’s delegation, the Manager has established a Valuation
| | | | |
| Prudential Day One Funds | | | 147 | |
Notes to Financial Statements(continued)
Committee responsible for supervising the fair valuation of portfolio securities and other assets and liabilities. The valuation procedures permit the Day One Funds to utilize independent pricing vendor services, quotations from market makers, and alternative valuation methods when market quotations are either not readily available or not deemed representative of fair value. A record of the Valuation Committee’s actions is subject to the Board’s review, approval, and ratification at its next regularly scheduled quarterly meeting.
For the fiscal reportingyear-end, securities and other assets and liabilities were fair valued at the close of the last U.S. business day. Trading in certain foreign securities may occur when the NYSE is closed (including weekends and holidays). Because such foreign securities trade in markets that are open on weekends and U.S. holidays, the values of some of the Day One Funds’ foreign investments may change on days when investors cannot purchase or redeem Day One Funds shares.
Various inputs determine how each Day One Fund’s investments are valued, all of which are categorized according to the three broad levels (Level 1, 2, or 3) detailed in the Schedule of Investments and referred to herein as the “fair value hierarchy” in accordance with FASB ASC Topic 820—Fair Value Measurements and Disclosures.
Investments inopen-end,non-exchange-traded mutual funds are valued at their net asset values as of the close of the NYSE on the date of valuation. These securities are classified as Level 1 in the fair value hierarchy since they may be purchased or sold at their net asset values on the date of valuation.
Securities and other assets that cannot be priced according to the methods described above are valued based on pricing methodologies approved by the Board. In the event that unobservable inputs are used when determining such valuations, the securities will be classified as Level 3 in the fair value hierarchy.
When determining the fair value of securities, some of the factors influencing the valuation include: the nature of any restrictions on disposition of the securities; assessment of the general liquidity of the securities; the issuer’s financial condition and the markets in which it does business; the cost of the investment; the size of the holding and the capitalization of the issuer; the prices of any recent transactions or bids/offers for such securities or any comparable securities; any available analyst media or other reports or information deemed reliable by the Manager regarding the issuer or the markets or industry in which it operates. Using fair value to price securities may result in a value that is different from a security’s most recent closing price and from the price used by other unaffiliated mutual funds to calculate their net asset values.
Securities Transactions and Net Investment Income:Securities transactions are recorded on the trade date. Realized gains (losses) from investment and currency transactions are calculated on the specific identification method. Dividend income is recorded on theex-date, or for certain foreign securities, when the Fund becomes aware of such dividends. Expenses are recorded on an accrual basis, which may require the use of certain estimates by management that may differ from actual. Net investment income or loss (other than class specific expenses and waivers, which are allocated as noted below) and unrealized and realized gains (losses) are allocated daily to each class of shares based upon the relative proportion of adjusted net assets of each class at the beginning of the day. Class specific expenses and waivers, where applicable, are charged to the respective share classes. Class specific expenses include distribution fees and distribution fee waivers, shareholder servicing fees, transfer agent’s fees and expenses, registration fees and fee waivers and/or expense reimbursements, as applicable.
Taxes:It is each of the Day One Funds’ policy to continue to meet the requirements of the Internal Revenue Code applicable to regulated investment companies and to distribute all of its taxable net investment income and capital gains, if any, to its shareholders. Therefore, no federal income tax provision is required. Withholding taxes on foreign dividends, interest and capital gains, if any, are recorded, net of reclaimable amounts, at the time the related income is earned.
Dividends and Distributions:The Prudential Day One Income Fund expects to pay dividends from net investment income quarterly. All other Day One Funds expect to pay dividends from net investment income annually. Each Day One Fund declares and pays its net realized capital gains, if any, annually. Dividends and distributions to shareholders, which are determined in accordance with federal income tax regulations and which may differ from generally accepted accounting principles, are recorded on theex-date. Permanent book/tax differences relating to income and gain (loss) are reclassified between total distributable earnings (loss) andpaid-in capital in excess of par, as appropriate.
Estimates:The preparation of financial statements requires management to make estimates and assumptions that affect the reported amounts and disclosures in the financial statements. Actual results could differ from those estimates.
2. Agreements
The Trust, on behalf of the Day One Funds, has a management agreement with the Manager. Pursuant to this agreement, the Manger has responsibility for all investment advisory services and supervises the subadviser’s performance of such services. In addition, under the management agreement, the Manager provides all of the administrative functions necessary for the organization, operation and management of the Day One Funds. The Manager administers the corporate affairs of the Day One Funds and, in connection therewith, furnishes the Day One Funds with office facilities, together with those ordinary clerical and bookkeeping services which are not being furnished by, the Day One Funds’ custodian, and the Day One Funds’ transfer agent. The Manager is also responsible for the
| | | | |
| Prudential Day One Funds | | | 149 | |
Notes to Financial Statements(continued)
staffing and management of dedicated groups of legal, marketing, compliance and related personnel necessary for the operation of the Day One Funds. The legal, marketing, compliance and related personnel are also responsible for the management and oversight of the various service providers to the Day One Funds, including, but not limited to, the custodian, transfer agent, and accounting agent.
The Manager has entered into a subadvisory agreement with QMA LLC (“QMA”) (formerly known as Quantitative Management Associates LLC). The subadvisory agreement provides that QMA will furnish investment advisory services in connection with the management of the Day One Funds. In connection therewith, QMA is obligated to keep certain books and records of the Day One Funds. The Manager pays for the services of QMA, the cost of compensation of officers of the Day One Funds, occupancy and certain clerical and bookkeeping costs of the Day One Funds. The Day One Funds bear all other costs and expenses.
The management fee paid to the Manager is accrued daily and payable monthly at an annual rate of 0.02% of each of the Day One Funds’ average daily net assets. All amounts paid or payable by the Day One Funds to the Manager, under the agreement, are reflected in the Statement of Operations.
The Manager has contractually agreed, through November 30, 2021, to limit total annual operating expenses after fee waivers and/or expense reimbursements to 1.15% of average daily net assets for Class R1 shares, 0.90% of average daily net assets for Class R2 shares, 0.75% of average daily net assets for Class R3 shares, 0.65% of average daily net assets for Class R4 shares, 0.55% of average daily net assets for Class R5 shares, and 0.40% of average daily net assets for Class R6 shares. This contractual waiver includes acquired fund fees and expenses, and excludes Fund and any acquired fund interest, brokerage, taxes (such as income and foreign withholding taxes, stamp duty and deferred tax expenses), extraordinary expenses, and certain other Fund expenses such as dividend and interest expense and broker charges on short sales. Where applicable, the Manager agrees to waive management fees or shared operating expenses on any share class to the same extent that it waives similar expenses on any other share class. Fees and/or expenses waived and/or reimbursed by the Manager may be recouped by the Manager within the same fiscal year during which such waiver and/or reimbursement is made if such recoupment can be realized without exceeding the expense limit in effect at the time of the recoupment for that fiscal year.
The Trust, on behalf of the Day One Funds, has a distribution agreement, pursuant to Rule12b-1 under the 1940 Act, with Prudential Investment Management Services LLC (“PIMS”), which acts as the distributor of the Class R1, Class R2, Class R3, Class R4, Class R5 and Class R6 shares of the Day One Funds. The Day One Funds compensate
PIMS for distributing and servicing the Day One Funds’ Class R1, Class R2 and Class R3 shares, pursuant to the plans of distribution (the “Distribution Plans”), regardless of expenses actually incurred by PIMS. The distribution fees are accrued daily and payable monthly. No distribution or service fees are paid to PIMS as distributor of the Class R4, Class R5 and Class R6 shares of the Day One Funds.
Pursuant to the Distribution Plans, the Day One Funds compensate PIMS for distribution related activities at an annual rate of up to 0.50%, 0.25% and 0.10% of the average daily net assets of the Class R1, Class R2 and Class R3 shares, respectively.
The Day One Funds have adopted a Shareholder Services Plan with respect to Class R1, Class R2, Class R3 and Class R4 shares. Under the terms of the Shareholder Services Plan, each Fund’s Class R1, Class R2, Class R3 and Class R4 shares are authorized to pay to Prudential Mutual Fund Services LLC (“PMFS”), its affiliates or third-party service providers, as compensation for services rendered to the shareholders of such Class R1, Class R2, Class R3 or Class R4 shares, a shareholder service fee at an annual rate of 0.10% of the average daily net assets attributable to Class R1, Class R2, Class R3 and Class R4 shares. The shareholder service fee is accrued daily and paid monthly.
PGIM Investments, PIMS, QMA and PMFS are indirect, wholly-owned subsidiaries of Prudential Financial, Inc. (“Prudential”).
3. Other Transactions with Affiliates
PMFS serves as the Day One Funds’ transfer agent. Transfer agent’s fees and expenses in the Statement of Operations include certainout-of-pocket expenses paid tonon-affiliates, where applicable.
The Day One Funds may invest their overnight sweep cash in the PGIM Core Ultra Short Bond Fund (the “Core Fund”), a series of Prudential Investment Portfolios 2, registered under the 1940 Act and managed by PGIM Investments. Through the Day One Funds’ investment in the mentioned underlying fund, PGIM Investments and/or its affiliates are paid fees or reimbursed for providing their services. Earnings from the Core Fund and other affiliated mutual funds are disclosed on the Statement of Operations as “Affiliated dividend income”.
4. Investments in Affiliated Issuers
The aggregate cost of purchases and proceeds from sales of portfolio securities (excluding short-term investments and U.S. Government securities) for the year ended July 31, 2019, were as follows:
| | | | | | | | |
Fund | | Cost of
Purchases | | | Proceeds
from Sales | |
Day One Income | | $ | 6,565,954 | | | $ | 2,902,081 | |
Day One 2010 | | | 2,039,793 | | | | 2,846,577 | |
Day One 2015 | | | 4,941,119 | | | | 2,721,062 | |
| | | | |
| Prudential Day One Funds | | | 151 | |
Notes to Financial Statements(continued)
| | | | | | | | |
Fund | | Cost of
Purchases | | | Proceeds
from Sales | |
Day One 2020 | | $ | 23,808,345 | | | $ | 11,393,539 | |
Day One 2025 | | | 30,060,811 | | | | 13,826,936 | |
Day One 2030 | | | 27,803,737 | | | | 12,932,521 | |
Day One 2035 | | | 19,132,910 | | | | 8,894,165 | |
Day One 2040 | | | 13,909,984 | | | | 6,079,856 | |
Day One 2045 | | | 9,227,547 | | | | 4,757,966 | |
Day One 2050 | | | 7,576,157 | | | | 2,465,003 | |
Day One 2055 | | | 3,955,840 | | | | 1,861,332 | |
Day One 2060 | | | 2,014,365 | | | | 504,664 | |
A summary of the cost of purchases and proceeds from sales of shares of affiliated investments for the year ended July 31, 2019, is presented as follows:
Day One Income:
| | | | | | | | | | | | | | | | | | | | | | | | | | | | | | | | | | |
Value,
Beginning
of Year | | | Cost of
Purchases | | | Proceeds
from Sales | | | Change in
Unrealized
Gain
(Loss) | | | Realized
Gain
(Loss) | | | Value,
End of
Year | | | Shares,
End of
Year | | | Dividend
Income | | | Capital Gain
Distributions | |
| | PGIM Core Conservative Bond Fund (Class R6) | |
| $ | 811,908 | | | $ | 937,679 | | | $ | 416,723 | | | $ | 79,471 | | | $ | (12,021 | ) | | $ | 1,400,314 | | | | 138,371 | | | $ | 34,330 | | | $ | — | |
| | PGIM Core Ultra Short Bond Fund | |
| | 623,348 | | | | 931,071 | | | | 455,584 | | | | — | | | | — | | | | 1,098,835 | | | | 1,098,835 | | | | 22,341 | | | | — | |
| | PGIM Global Real Estate Fund (Class R6) | |
| | 351,267 | | | | 435,190 | | | | 230,697 | | | | 40,017 | | | | (3,198 | ) | | | 592,579 | | | | 23,121 | | | | 15,856 | | | | 8,647 | |
| | PGIM JennisonSmall-Cap Core Equity Fund (Class R6) | |
| | 58,089 | | | | 91,214 | | | | 44,729 | | | | (1,885 | ) | | | (4,334 | ) | | | 98,355 | | | | 8,328 | | | | 372 | | | | 5,268 | |
| | PGIM QMA Commodity Strategies Fund (Class R6) | |
| | 288,775 | | | | 387,647 | | | | 135,153 | | | | (32,148 | ) | | | (11,222 | ) | | | 497,899 | | | | 52,744 | | | | 12,298 | | | | — | |
| | PGIM QMA International Developed Markets Index Fund (Class R6) | |
| | 289,115 | | | | 394,713 | | | | 166,386 | | | | (11,153 | ) | | | (12,615 | ) | | | 493,674 | | | | 42,448 | | | | 11,245 | | | | 305 | |
| | PGIM QMALarge-Cap Core Equity Fund (Class R6) | |
| | 640,487 | | | | 1,024,062 | | | | 446,297 | | | | (47,820 | ) | | | (86,571 | ) | | | 1,083,861 | | | | 70,335 | | | | 16,739 | | | | 163,193 | |
| | PGIM QMAMid-Cap Core Equity Fund (Class R6) | |
| | 58,497 | | | | 91,870 | | | | 44,552 | | | | (2,916 | ) | | | (4,368 | ) | | | 98,531 | | | | 9,090 | | | | 821 | | | | 5,032 | |
| | PGIM QMA US Broad Market Index Fund (Class R6) | |
| | 349,107 | | | | 457,053 | | | | 241,497 | | | | 34,367 | | | | (7,824 | ) | | | 591,206 | | | | 43,471 | | | | 8,366 | | | | 3,098 | |
| | PGIM TIPS Fund (Class R6) | |
| | 1,511,579 | | | | 1,735,738 | | | | 720,450 | | | | 98,970 | | | | (20,975 | ) | | | 2,604,862 | | | | 263,917 | | | | 61,121 | | | | — | |
| | PGIM Total Return Bond Fund (Class R6) | |
| | 871,555 | | | | 1,010,788 | | | | 455,597 | | | | 90,367 | | | | (13,209 | ) | | | 1,503,904 | | | | 101,822 | | | | 55,008 | | | | — | |
| | | | | | | | | | | | | | | | | | | | | | | | | | | | | | | | | | |
Day One Income (cont’d.):
| | | | | | | | | | | | | | | | | | | | | | | | | | | | | | | | | | |
Value,
Beginning
of Year | | | Cost of
Purchases | | | Proceeds
from Sales | | | Change in
Unrealized
Gain
(Loss) | | | Realized
Gain
(Loss) | | | Value,
End of
Year | | | Shares,
End of
Year | | | Dividend
Income | | | Capital Gain
Distributions | |
| $ | 5,853,727 | | | $ | 7,497,025 | | | $ | 3,357,665 | | | $ | 247,270 | | | $ | (176,337 | ) | | $ | 10,064,020 | | | | | | | $ | 238,497 | | | $ | 185,543 | |
| | | | | | | | | | | | | | | | | | | | | | | | | | | | | | | | | | |
Day One 2010:
| | | | | | | | | | | | | | | | | | | | | | | | | | | | | | | | | | |
Value,
Beginning of Year | | | Cost of
Purchases | | | Proceeds
from Sales | | | Change in
Unrealized
Gain
(Loss) | | | Realized
Gain
(Loss) | | | Value,
End of
Year | | | Shares,
End of
Year | | | Dividend
Income | | | Capital Gain
Distributions | |
| | PGIM Core Conservative Bond Fund (Class R6) | |
| $ | 843,993 | | | $ | 264,240 | | | $ | 474,015 | | | $ | 43,746 | | | $ | (8,575 | ) | | $ | 669,388 | | | | 66,145 | | | $ | 22,565 | | | $ | — | |
| | PGIM Core Ultra Short Bond Fund | |
| | 549,133 | | | | 387,009 | | | | 442,234 | | | | — | | | | — | | | | 493,908 | | | | 493,908 | | | | 12,937 | | | | — | |
| | PGIM Global Real Estate Fund (Class R6) | |
| | 340,800 | | | | 122,337 | | | | 199,831 | | | | 15,684 | | | | 4,318 | | | | 283,309 | | | | 11,054 | | | | 8,985 | | | | 5,264 | |
| | PGIM JennisonSmall-Cap Core Equity Fund (Class R6) | |
| | 56,358 | | | | 34,128 | | | | 38,618 | | | | (4,233 | ) | | | (605 | ) | | | 47,030 | | | | 3,982 | | | | 225 | | | | 3,190 | |
| | PGIM QMA Commodity Strategies Fund (Class R6) | |
| | 280,170 | | | | 122,927 | | | | 143,048 | | | | (17,557 | ) | | | (4,508 | ) | | | 237,984 | | | | 25,210 | | | | 7,484 | | | | — | |
| | PGIM QMA International Developed Markets Index Fund (Class R6) | |
| | 280,500 | | | | 132,213 | | | | 157,878 | | | | (14,037 | ) | | | (4,762 | ) | | | 236,036 | | | | 20,295 | | | | 6,842 | | | | 186 | |
| | PGIM QMALarge-Cap Core Equity Fund (Class R6) | |
| | 677,894 | | | | 405,492 | | | | 430,423 | | | | (36,647 | ) | | | (50,975 | ) | | | 565,341 | | | | 36,687 | | | | 11,060 | | | | 107,825 | |
| | PGIM QMAMid-Cap Core Equity Fund (Class R6) | |
| | 56,754 | | | | 33,932 | | | | 38,093 | | | | (3,622 | ) | | | (1,858 | ) | | | 47,113 | | | | 4,346 | | | | 497 | | | | 3,046 | |
| | PGIM QMA US Broad Market Index Fund (Class R6) | |
| | 338,705 | | | | 140,717 | | | | 213,767 | | | | 5,605 | | | | 11,414 | | | | 282,674 | | | | 20,785 | | | | 5,067 | | | | 1,876 | |
| | PGIM TIPS Fund (Class R6) | |
| | 1,410,178 | | | | 508,240 | | | | 710,154 | | | | 46,484 | | | | (9,529 | ) | | | 1,245,219 | | | | 126,162 | | | | 36,943 | | | | — | |
| | PGIM Total Return Bond Fund (Class R6) | |
| | 845,601 | | | | 275,567 | | | | 440,750 | | | | 43,061 | | | | (4,588 | ) | | | 718,891 | | | | 48,672 | | | | 34,980 | | | | — | |
| | | | | | | | | | | | | | | | | | | | | | | | | | | | | | | | | | |
| $ | 5,680,086 | | | $ | 2,426,802 | | | $ | 3,288,811 | | | $ | 78,484 | | | $ | (69,668 | ) | | $ | 4,826,893 | | | | | | | $ | 147,585 | | | $ | 121,387 | |
| | | | | | | | | | | | | | | | | | | | | | | | | | | | | | | | | | |
Prudential Day One 2015 Fund:
| | | | | | | | | | | | | | | | | | | | | | | | | | | | | | | | | | |
Value,
Beginning
of Year | | | Cost of
Purchases | | | Proceeds
from Sales | | | Change in
Unrealized
Gain
(Loss) | | | Realized
Gain
(Loss) | | | Value,
End of
Year | | | Shares,
End of
Year | | | Dividend
Income | | | Capital Gain
Distributions | |
| | PGIM Core Conservative Bond Fund (Class R6) | |
| $ | 1,127,918 | | | $ | 610,723 | | | $ | 345,356 | | | $ | 71,983 | | | $ | (7,930 | ) | | $ | 1,457,338 | | | | 144,006 | | | $ | 36,830 | | | $ | — | |
| | PGIM Core Ultra Short Bond Fund | |
| | 818,398 | | | | 812,809 | | | | 556,740 | | | | — | | | | — | | | | 1,074,467 | | | | 1,074,467 | | | | 23,173 | | | | — | |
| | | | |
| Prudential Day One Funds | | | 153 | |
Notes to Financial Statements(continued)
Prudential Day One 2015 Fund (cont’d.):
| | | | | | | | | | | | | | | | | | | | | | | | | | | | | | | | | | |
Value,
Beginning of Year | | | Cost of
Purchases | | | Proceeds
from Sales | | | Change in
Unrealized
Gain
(Loss) | | | Realized
Gain
(Loss) | | | Value,
End of
Year | | | Shares,
End of
Year | | | Dividend
Income | | | Capital Gain
Distributions | |
| | PGIM Global Real Estate Fund (Class R6) | |
| $ | 525,469 | | | $ | 301,529 | | | $ | 201,002 | | | $ | 39,618 | | | $ | (1,192 | ) | | $ | 664,422 | | | | 25,924 | | | $ | 16,792 | | | $ | 8,922 | |
| | PGIM JennisonSmall-Cap Core Equity Fund (Class R6) | |
| | 86,903 | | | | 72,088 | | | | 41,886 | | | | (3,215 | ) | | | (3,594 | ) | | | 110,296 | | | | 9,339 | | | | 386 | | | | 5,468 | |
| | PGIM QMA Commodity Strategies Fund (Class R6) | |
| | 432,043 | | | | 282,068 | | | | 116,373 | | | | (30,311 | ) | | | (9,324 | ) | | | 558,103 | | | | 59,121 | | | | 12,764 | | | | — | |
| | PGIM QMA International Developed Markets Index Fund (Class R6) | |
| | 519,058 | | | | 344,176 | | | | 164,177 | | | | (22,197 | ) | | | (12,619 | ) | | | 664,241 | | | | 57,114 | | | | 13,995 | | | | 380 | |
| | PGIM QMALarge-Cap Core Equity Fund (Class R6) | |
| | 1,219,493 | | | | 962,775 | | | | 571,334 | | | | (63,698 | ) | | | (110,896 | ) | | | 1,436,340 | | | | 93,208 | | | | 22,097 | | | | 215,426 | |
| | PGIM QMAMid-Cap Core Equity Fund (Class R6) | |
| | 175,017 | | | | 143,942 | | | | 82,396 | | | | (6,966 | ) | | | (8,625 | ) | | | 220,972 | | | | 20,385 | | | | 1,623 | | | | 9,947 | |
| | PGIM QMA US Broad Market Index Fund (Class R6) | |
| | 609,316 | | | | 370,988 | | | | 250,968 | | | | 46,246 | | | | (2,158 | ) | | | 773,424 | | | | 56,869 | | | | 10,118 | | | | 3,746 | |
| | PGIM TIPS Fund (Class R6) | |
| | 2,087,465 | | | | 1,121,423 | | | | 584,800 | | | | 85,410 | | | | (14,734 | ) | | | 2,694,764 | | | | 273,026 | | | | 64,441 | | | | — | |
| | PGIM Total Return Bond Fund (Class R6) | |
| | 1,130,045 | | | | 731,407 | | | | 362,770 | | | | 82,375 | | | | (8,003 | ) | | | 1,573,054 | | | | 106,503 | | | | 56,466 | | | | — | |
| | | | | | | | | | | | | | | | | | | | | | | | | | | | | | | | | | |
| $ | 8,731,125 | | | $ | 5,753,928 | | | $ | 3,277,802 | | | $ | 199,245 | | | $ | (179,075 | ) | | $ | 11,227,421 | | | | | | | $ | 258,685 | | | $ | 243,889 | |
| | | | | | | | | | | | | | | | | | | | | | | | | | | | | | | | | | |
Prudential Day One 2020 Fund:
| | | | | | | | | | | | | | | | | | | | | | | | | | | | | | | | | | |
Value,
Beginning of Year | | | Cost of
Purchases | | | Proceeds
from Sales | | | Change in
Unrealized
Gain
(Loss) | | | Realized
Gain
(Loss) | | | Value,
End of
Year | | | Shares,
End of
Year | | | Dividend
Income | | | Capital Gain
Distributions | |
| | PGIM Core Conservative Bond Fund (Class R6) | |
| $ | 3,601,277 | | | $ | 2,781,615 | | | $ | 1,365,216 | | | $ | 265,671 | | | $ | (36,125 | ) | | $ | 5,247,222 | | | | 518,500 | | | $ | 126,639 | | | $ | — | |
| | PGIM Core Ultra Short Bond Fund | |
| | 2,456,173 | | | | 2,360,181 | | | | 1,250,773 | | | | — | | | | — | | | | 3,565,581 | | | | 3,565,581 | | | | 75,813 | | | | — | |
| | PGIM Global Real Estate Fund (Class R6) | |
| | 1,817,795 | | | | 1,484,813 | | | | 856,992 | | | | 156,284 | | | | (10,084 | ) | | | 2,591,816 | | | | 101,124 | | | | 65,276 | | | | 35,190 | |
| | PGIM JennisonSmall-Cap Core Equity Fund (Class R6) | |
| | 300,615 | | | | 311,387 | | | | 155,434 | | | | (8,787 | ) | | | (17,531 | ) | | | 430,250 | | | | 36,431 | | | | 1,446 | | | | 20,465 | |
| | PGIM QMA Commodity Strategies Fund (Class R6) | |
| | 1,494,460 | | | | 1,338,739 | | | | 487,660 | | | | (128,609 | ) | | | (39,870 | ) | | | 2,177,060 | | | | 230,621 | | | | 50,384 | | | | — | |
Prudential Day One 2020 Fund (cont’d.):
| | | | | | | | | | | | | | | | | | | | | | | | | | | | | | | | | | |
Value,
Beginning of Year | | | Cost of
Purchases | | | Proceeds
from Sales | | | Change in
Unrealized
Gain
(Loss) | | | Realized
Gain
(Loss) | | | Value,
End of
Year | | | Shares,
End of
Year | | | Dividend
Income | | | Capital Gain
Distributions | |
| | PGIM QMA International Developed Markets Index Fund (Class R6) | |
| $ | 2,094,703 | | | $ | 1,812,826 | | | $ | 725,427 | | | $ | (95,466 | ) | | $ | (63,697 | ) | | $ | 3,022,939 | | | | 259,926 | | | $ | 63,096 | | | $ | 1,711 | |
| | PGIM QMALarge-Cap Core Equity Fund (Class R6) | |
| | 4,821,165 | | | | 5,465,326 | | | | 2,299,229 | | | | (248,228 | ) | | | (412,059 | ) | | | 7,326,975 | | | | 475,469 | | | | 96,237 | | | | 938,238 | |
| | PGIM QMAMid-Cap Core Equity Fund (Class R6) | |
| | 605,445 | | | | 618,977 | | | | 300,033 | | | | (28,200 | ) | | | (34,210 | ) | | | 861,979 | | | | 79,518 | | | | 6,375 | | | | 39,083 | |
| | PGIM QMA US Broad Market Index Fund (Class R6) | |
| | 2,709,976 | | | | 2,148,424 | | | | 1,528,229 | | | | 209,382 | | | | (91,519 | ) | | | 3,448,034 | | | | 253,532 | | | | 49,702 | | | | 18,403 | |
| | PGIM TIPS Fund (Class R6) | |
| | 6,618,312 | | | | 5,041,571 | | | | 2,279,058 | | | | 317,578 | | | | (63,298 | ) | | | 9,635,105 | | | | 976,201 | | | | 220,439 | | | | — | |
| | PGIM Total Return Bond Fund (Class R6) | |
| | 3,608,059 | | | | 2,804,667 | | | | 1,396,261 | | | | 277,247 | | | | (34,483 | ) | | | 5,259,229 | | | | 356,075 | | | | 188,554 | | | | — | |
| | | | | | | | | | | | | | | | | | | | | | | | | | | | | | | | | | |
| $ | 30,127,980 | | | $ | 26,168,526 | | | $ | 12,644,312 | | | $ | 716,872 | | | $ | (802,876 | ) | | $ | 43,566,190 | | | | | | | $ | 943,961 | | | $ | 1,053,090 | |
| | | | | | | | | | | | | | | | | | | | | | | | | | | | | | | | | | |
Prudential Day One 2025 Fund:
| | | | | | | | | | | | | | | | | | | | | | | | | | | | | | | | | | |
Value,
Beginning of Year | | | Cost of
Purchases | | | Proceeds
from Sales | | | Change in
Unrealized
Gain
(Loss) | | | Realized
Gain
(Loss) | | | Value,
End of
Year | | | Shares,
End of
Year | | | Dividend
Income | | | Capital Gain
Distributions | |
| | PGIM Core Conservative Bond Fund (Class R6) | |
| $ | 2,924,932 | | | $ | 2,605,327 | | | $ | 1,233,750 | | | $ | 240,747 | | | $ | (34,348 | ) | | $ | 4,502,908 | | | | 444,951 | | | $ | 108,034 | | | $ | — | |
| | PGIM Core Ultra Short Bond Fund | |
| | 2,336,857 | | | | 2,574,039 | | | | 1,342,773 | | | | — | | | | — | | | | 3,568,123 | | | | 3,568,123 | | | | 75,712 | | | | — | |
| | PGIM Global Real Estate Fund (Class R6) | |
| | 1,968,495 | | | | 1,790,507 | | | | 976,152 | | | | 191,708 | | | | (9,084 | ) | | | 2,965,474 | | | | 115,703 | | | | 74,288 | | | | 39,911 | |
| | PGIM JennisonSmall-Cap Core Equity Fund (Class R6) | |
| | 325,533 | | | | 366,807 | | | | 176,497 | | | | (6,304 | ) | | | (17,258 | ) | | | 492,281 | | | | 41,683 | | | | 1,640 | | | | 23,205 | |
| | PGIM QMA Commodity Strategies Fund (Class R6) | |
| | 1,618,329 | | | | 1,604,012 | | | | 538,844 | | | | (151,216 | ) | | | (41,376 | ) | | | 2,490,905 | | | | 263,867 | | | | 57,306 | | | | — | |
| | PGIM QMA International Developed Markets Index Fund (Class R6) | |
| | 2,916,422 | | | | 2,736,796 | | | | 1,013,641 | | | | (116,104 | ) | | | (76,479 | ) | | | 4,446,994 | | | | 382,373 | | | | 90,070 | | | | 2,443 | |
| | PGIM QMALarge-Cap Core Equity Fund (Class R6) | |
| | 6,526,029 | | | | 7,350,010 | | | | 3,480,505 | | | | (325,540 | ) | | | (700,419 | ) | | | 9,369,575 | | | | 608,019 | | | | 136,315 | | | | 1,328,960 | |
| | PGIM QMAMid-Cap Core Equity Fund (Class R6) | |
| | 655,636 | | | | 728,887 | | | | 338,285 | | | | (29,052 | ) | | | (30,930 | ) | | | 986,256 | | | | 90,983 | | | | 7,226 | | | | 44,296 | |
| | PGIM QMA US Broad Market Index Fund (Class R6) | |
| | 3,260,691 | | | | 2,859,708 | | | | 1,878,194 | | | | 295,045 | | | | (98,971 | ) | | | 4,438,279 | | | | 326,344 | | | | 62,574 | | | | 23,169 | |
| | PGIM TIPS Fund (Class R6) | |
| | 6,190,021 | | | | 5,985,306 | | | | 2,448,379 | | | | 369,644 | | | | (74,223 | ) | | | 10,022,369 | | | | 1,015,438 | | | | 228,199 | | | | — | |
| | | | |
| Prudential Day One Funds | | | 155 | |
Notes to Financial Statements(continued)
Prudential Day One 2025 Fund (cont’d.):
| | | | | | | | | | | | | | | | | | | | | | | | | | | | | | | | | | |
Value,
Beginning of Year | | | Cost of
Purchases | | | Proceeds
from Sales | | | Change in
Unrealized
Gain
(Loss) | | | Realized
Gain
(Loss) | | | Value,
End of
Year | | | Shares,
End of
Year | | | Dividend
Income | | | Capital Gain
Distributions | |
| | PGIM Total Return Bond Fund (Class R6) | |
| $ | 3,907,285 | | | $ | 4,033,451 | | | $ | 1,742,689 | | | $ | 370,558 | | | $ | (49,480 | ) | | $ | 6,519,125 | | | | 441,376 | | | $ | 223,733 | | | $ | — | |
| | | | | | | | | | | | | | | | | | | | | | | | | | | | | | | | | | |
| $ | 32,630,230 | | | $ | 32,634,850 | | | $ | 15,169,709 | | | $ | 839,486 | | | $ | (1,132,568 | ) | | $ | 49,802,289 | | | | | | | $ | 1,065,097 | | | $ | 1,461,984 | |
| | | | | | | | | | | | | | | | | | | | | | | | | | | | | | | | | | |
Prudential Day One 2030 Fund:
| | | | | | | | | | | | | | | | | | | | | | | | | | | | | | | | | | |
Value, Beginning of Year | | | Cost of
Purchases | | | Proceeds
from Sales | | | Change in
Unrealized
Gain
(Loss) | | | Realized
Gain
(Loss) | | | Value,
End of
Year | | | Shares,
End of
Year | | | Dividend
Income | | | Capital Gain
Distributions | |
| | PGIM Core Conservative Bond Fund (Class R6) | |
| $ | 1,752,731 | | | $ | 2,106,563 | | | $ | 869,829 | | | $ | 155,019 | | | $ | (18,144 | ) | | $ | 3,126,340 | | | | 308,927 | | | $ | 69,825 | | | $ | — | |
| | PGIM Core Ultra Short Bond Fund | |
| | 1,517,987 | | | | 5,515,574 | | | | 4,736,010 | | | | — | | | | — | | | | 2,297,551 | | | | 2,297,551 | | | | 47,916 | | | | — | |
| | PGIM Global Real Estate Fund (Class R6) | |
| | 1,769,351 | | | | 1,559,736 | | | | 839,810 | | | | 165,240 | | | | (7,310 | ) | | | 2,647,207 | | | | 103,285 | | | | 64,138 | | | | 33,757 | |
| | PGIM JennisonSmall-Cap Core Equity Fund (Class R6) | |
| | 292,603 | | | | 305,211 | | | | 138,040 | | | | (9,006 | ) | | | (11,318 | ) | | | 439,450 | | | | 37,210 | | | | 1,394 | | | | 19,726 | |
| | PGIM QMA Commodity Strategies Fund (Class R6) | |
| | 1,163,706 | | | | 1,110,756 | | | | 369,636 | | | | (93,057 | ) | | | (32,939 | ) | | | 1,778,830 | | | | 188,435 | | | | 39,138 | | | | — | |
| | PGIM QMA Emerging Markets Equity Fund (Class R6) | |
| | 292,232 | | | | 302,196 | | | | 128,551 | | | | (4,113 | ) | | | (20,437 | ) | | | 441,327 | | | | 39,581 | | | | 6,607 | | | | 3,297 | |
| | PGIM QMA International Developed Markets Index Fund (Class R6) | |
| | 3,495,225 | | | | 3,067,051 | | | | 1,453,713 | | | | (106,251 | ) | | | (150,415 | ) | | | 4,851,897 | | | | 417,188 | | | | 102,541 | | | | 2,781 | |
| | PGIM QMALarge-Cap Core Equity Fund (Class R6) | |
| | 7,918,908 | | | | 8,146,467 | | | | 3,559,304 | | | | (492,437 | ) | | | (568,126 | ) | | | 11,445,508 | | | | 742,732 | | | | 153,299 | | | | 1,494,640 | |
| | PGIM QMAMid-Cap Core Equity Fund (Class R6) | |
| | 883,964 | | | | 928,722 | | | | 416,104 | | | | (36,313 | ) | | | (39,653 | ) | | | 1,320,616 | | | | 121,828 | | | | 9,039 | | | | 55,412 | |
| | PGIM QMA US Broad Market Index Fund (Class R6) | |
| | 4,396,265 | | | | 3,410,965 | | | | 2,334,201 | | | | 345,620 | | | | (95,819 | ) | | | 5,722,830 | | | | 420,796 | | | | 78,196 | | | | 28,954 | |
| | PGIM TIPS Fund (Class R6) | |
| | 3,221,276 | | | | 3,440,729 | | | | 1,448,790 | | | | 189,007 | | | | (34,266 | ) | | | 5,367,956 | | | | 543,866 | | | | 120,085 | | | | — | |
| | PGIM Total Return Bond Fund (Class R6) | |
| | 2,634,075 | | | | 3,425,341 | | | | 1,374,543 | | | | 264,204 | | | | (24,998 | ) | | | 4,924,079 | | | | 333,384 | | | | 156,182 | | | | — | |
| | | | | | | | | | | | | | | | | | | | | | | | | | | | | | | | | | |
| $ | 29,338,323 | | | $ | 33,319,311 | | | $ | 17,668,531 | | | $ | 377,913 | | | $ | (1,003,425 | ) | | $ | 44,363,591 | | | | | | | $ | 848,360 | | | $ | 1,638,567 | |
| | | | | | | | | | | | | | | | | | | | | | | | | | | | | | | | | | |
Prudential Day One 2035 Fund:
| | | | | | | | | | | | | | | | | | | | | | | | | | | | | | | | | | |
Value,
Beginning of Year | | | Cost of
Purchases | | | Proceeds
from Sales | | | Change in
Unrealized
Gain
(Loss) | | | Realized
Gain
(Loss) | | | Value,
End of
Year | | | Shares,
End of
Year | | | Dividend
Income | | | Capital Gain
Distributions | |
| | PGIM Core Conservative Bond Fund (Class R6) | |
| $ | 1,066,464 | | | $ | 988,379 | | | $ | 555,359 | | | $ | 83,518 | | | $ | (15,598 | ) | | $ | 1,567,404 | | | | 154,882 | | | $ | 37,033 | | | $ | — | |
| | PGIM Core Ultra Short Bond Fund | |
| | 481,600 | | | | 760,576 | | | | 536,268 | | | | — | | | | — | | | | 705,908 | | | | 705,908 | | | | 14,039 | | | | — | |
| | PGIM Global Real Estate Fund (Class R6) | |
| | 1,076,534 | | | | 887,809 | | | | 496,984 | | | | 90,331 | | | | (9,257 | ) | | | 1,548,433 | | | | 60,415 | | | | 37,765 | | | | 19,541 | |
| | PGIM JennisonSmall-Cap Core Equity Fund (Class R6) | |
| | 427,284 | | | | 405,614 | | | | 179,851 | | | | (14,960 | ) | | | (21,163 | ) | | | 616,924 | | | | 52,237 | | | | 1,969 | | | | 27,858 | |
| | PGIM QMA Commodity Strategies Fund (Class R6) | |
| | 849,694 | | | | 832,153 | | | | 343,425 | | | | (60,877 | ) | | | (28,988 | ) | | | 1,248,557 | | | | 132,262 | | | | 27,581 | | | | — | |
| | PGIM QMA Emerging Markets Equity Fund (Class R6) | |
| | 853,476 | | | | 690,527 | | | | 518,363 | | | | (5,602 | ) | | | (90,715 | ) | | | 929,323 | | | | 83,347 | | | | 19,054 | | | | 9,509 | |
| | PGIM QMA International Developed Markets Index Fund (Class R6) | |
| | 2,977,366 | | | | 2,302,555 | | | | 1,015,512 | | | | (124,403 | ) | | | (115,170 | ) | | | 4,024,836 | | | | 346,074 | | | | 84,228 | | | | 2,285 | |
| | PGIM QMALarge-Cap Core Equity Fund (Class R6) | |
| | 5,996,109 | | | | 5,915,510 | | | | 2,159,880 | | | | (389,253 | ) | | | (401,651 | ) | | | 8,960,835 | | | | 581,495 | | | | 114,609 | | | | 1,117,360 | |
| | PGIM QMAMid-Cap Core Equity Fund (Class R6) | |
| | 860,521 | | | | 806,538 | | | | 344,648 | | | | (44,527 | ) | | | (41,921 | ) | | | 1,235,963 | | | | 114,019 | | | | 8,670 | | | | 53,150 | |
| | PGIM QMA US Broad Market Index Fund (Class R6) | |
| | 3,637,898 | | | | 2,657,439 | | | | 1,564,317 | | | | 299,200 | | | | (86,245 | ) | | | 4,943,975 | | | | 363,528 | | | | 63,887 | | | | 23,655 | |
| | PGIM TIPS Fund (Class R6) | |
| | 1,496,744 | | | | 1,714,860 | | | | 769,672 | | | | 92,422 | | | | (22,526 | ) | | | 2,511,828 | | | | 254,491 | | | | 55,813 | | | | — | |
| | PGIM Total Return Bond Fund (Class R6) | |
| | 1,709,570 | | | | 1,931,526 | | | | 946,154 | | | | 157,844 | | | | (25,004 | ) | | | 2,827,782 | | | | 191,454 | | | | 93,082 | | | | — | |
| | | | | | | | | | | | | | | | | | | | | | | | | | | | | | | | | | |
| $ | 21,433,260 | | | $ | 19,893,486 | | | $ | 9,430,433 | | | $ | 83,693 | | | $ | (858,238 | ) | | $ | 31,121,768 | | | | | | | $ | 557,730 | | | $ | 1,253,358 | |
| | | | | | | | | | | | | | | | | | | | | | | | | | | | | | | | | | |
Prudential Day One 2040 Fund:
| | | | | | | | | | | | | | | | | | | | | | | | | | | | | | | | | | |
Value,
Beginning of Year | | | Cost of
Purchases | | | Proceeds
from Sales | | | Change in
Unrealized
Gain
(Loss) | | | Realized
Gain
(Loss) | | | Value,
End of
Year | | | Shares,
End of
Year | | | Dividend
Income | | | Capital Gain
Distributions | |
| | PGIM Core Conservative Bond Fund (Class R6) | |
| $ | 817,161 | | | $ | 584,468 | | | $ | 327,574 | | | $ | 54,864 | | | $ | (7,855 | ) | | $ | 1,121,064 | | | | 110,777 | | | $ | 26,489 | | | $ | — | |
| | PGIM Core Ultra Short Bond Fund | |
| | 257,084 | | | | 566,523 | | | | 462,050 | | | | — | | | | — | | | | 361,557 | | | | 361,557 | | | | 6,691 | | | | — | |
| | PGIM Global Real Estate Fund (Class R6) | |
| | 1,031,105 | | | | 656,530 | | | | 377,654 | | | | 78,414 | | | | (3,971 | ) | | | 1,384,424 | | | | 54,016 | | | | 32,568 | | | | 16,571 | |
| | PGIM JennisonSmall-Cap Core Equity Fund (Class R6) | |
| | 409,255 | | | | 551,937 | | | | 149,426 | | | | 26,203 | | | | (10,593 | ) | | | 827,376 | | | | 70,057 | | | | 1,677 | | | | 23,735 | |
| | | | |
| Prudential Day One Funds | | | 157 | |
Notes to Financial Statements(continued)
Prudential Day One 2040 Fund (cont’d.):
| | | | | | | | | | | | | | | | | | | | | | | | | | | | | | | | | | |
Value, Beginning of Year | | | Cost of
Purchases | | | Proceeds
from Sales | | | Change in
Unrealized
Gain
(Loss) | | | Realized
Gain
(Loss) | | | Value,
End of
Year | | | Shares,
End of
Year | | | Dividend
Income | | | Capital Gain
Distributions | |
| | PGIM QMA Commodity Strategies Fund (Class R6) | | | | | | | | | | | | | | | | | | | | | |
| $ | 813,845 | | | $ | 623,194 | | | $ | 247,388 | | | $ | (53,531 | ) | | $ | (19,816 | ) | | $ | 1,116,304 | | | | 118,253 | | | $ | 23,447 | | | $ | — | |
| | PGIM QMA Emerging Markets Equity Fund (Class R6) | | | | | | | | | | | | | | | | | | | | | |
| | 817,465 | | | | 586,096 | | | | 223,501 | | | | (31,582 | ) | | | (40,626 | ) | | | 1,107,852 | | | | 99,359 | | | | 16,228 | | | | 8,098 | |
| | PGIM QMA International Developed Markets Index Fund (Class R6) | | | | | | | | | | | | | | | | | |
| | 3,055,444 | | | | 1,829,581 | | | | 535,562 | | | | (151,423 | ) | | | (45,892 | ) | | | 4,152,148 | | | | 357,021 | | | | 76,723 | | | | 2,081 | |
| | PGIM QMALarge-Cap Core Equity Fund (Class R6) | | | | | | | | | | | | | | | | | | | | | |
| | 6,153,316 | | | | 4,250,230 | | | | 1,658,008 | | | | (447,679 | ) | | | (286,098 | ) | | | 8,011,761 | | | | 519,907 | | | | 104,578 | | | | 1,019,558 | |
| | PGIM QMAMid-Cap Core Equity Fund (Class R6) | | | | | | | | | | | | | | | | | | | | | |
| | 1,030,259 | | | | 984,122 | | | | 306,207 | | | | (20,297 | ) | | | (30,293 | ) | | | 1,657,584 | | | | 152,914 | | | | 9,235 | | | | 56,617 | |
| | PGIM QMA US Broad Market Index Fund (Class R6) | | | | | | | | | | | | | | | | | | | | | |
| | 3,689,358 | | | | 1,787,329 | | | | 1,251,842 | | | | 253,796 | | | | (58,301 | ) | | | 4,420,340 | | | | 325,025 | | | | 57,609 | | | | 21,331 | |
| | PGIM TIPS Fund (Class R6) | | | | | | | | | | | | | | | | | | | | | | | | | | | | | |
| | 819,168 | | | | 878,904 | | | | 334,128 | | | | 47,710 | | | | (8,113 | ) | | | 1,403,541 | | | | 142,203 | | | | 30,215 | | | | — | |
| | PGIM Total Return Bond Fund (Class R6) | | | | | | | | | | | | | | | | | | | | | | | | | |
| | 1,637,407 | | | | 1,177,593 | | | | 668,566 | | | | 115,942 | | | | (15,140 | ) | | | 2,247,236 | | | | 152,149 | | | | 77,720 | | | | — | |
| | | | | | | | | | | | | | | | | | | | | | | | | | | | | | | | | | |
| $ | 20,530,867 | | | $ | 14,476,507 | | | $ | 6,541,906 | | | $ | (127,583 | ) | | $ | (526,698 | ) | | $ | 27,811,187 | | | | | | | $ | 463,180 | | | $ | 1,147,991 | |
| | | | | | | | | | | | | | | | | | | | | | | | | | | | | | | | | | |
Prudential Day One 2045 Fund:
| | | | | | | | | | | | | | | | | | | | | | | | | | | | | | | | | | |
Value, Beginning of Year | | | Cost of
Purchases | | | Proceeds
from Sales | | | Change in
Unrealized
Gain
(Loss) | | | Realized
Gain
(Loss) | | | Value,
End of
Year | | | Shares,
End of
Year | | | Dividend
Income | | | Capital Gain
Distributions | |
| | PGIM Core Conservative Bond Fund (Class R6) | | | | | | | | | | | | | | | | | | | | | |
| $ | 406,826 | | | $ | 304,561 | | | $ | 201,722 | | | $ | 28,674 | | | $ | (6,063 | ) | | $ | 532,276 | | | | 52,596 | | | $ | 12,893 | | | $ | — | |
| | PGIM Core Ultra Short Bond Fund | | | | | | | | | | | | | | | | | | | | | | | | | |
| | 49,575 | | | | 312,030 | | | | 288,054 | | | | — | | | | — | | | | 73,551 | | | | 73,551 | | | | 704 | | | | — | |
| | PGIM Global Real Estate Fund (Class R6) | | | | | | | | | | | | | | | | | |
| | 684,446 | | | | 451,383 | | | | 309,754 | | | | 52,525 | | | | (2,189 | ) | | | 876,411 | | | | 34,195 | | | | 21,071 | | | | 10,847 | |
| | PGIM JennisonSmall-Cap Core Equity Fund (Class R6) | | | | | | | | | | | | | |
| | 407,498 | | | | 288,918 | | | | 145,191 | | | | (14,487 | ) | | | (12,969 | ) | | | 523,769 | | | | 44,350 | | | | 1,648 | | | | 23,323 | |
| | PGIM QMA Commodity Strategies Fund (Class R6) | | | | | | | | | | | | | | | | | | | | | |
| | 405,179 | | | | 323,485 | | | | 162,974 | | | | (25,772 | ) | | | (9,908 | ) | | | 530,010 | | | | 56,145 | | | | 11,548 | | | | — | |
| | PGIM QMA Emerging Markets Equity Fund (Class R6) | | | | | | | | | | | | | | | | | | | | | |
| | 678,298 | | | | 503,862 | | | | 246,926 | | | | (20,262 | ) | | | (38,315 | ) | | | 876,657 | | | | 78,624 | | | | 13,282 | | | | 6,628 | |
Prudential Day One 2045 Fund (cont’d.):
| | | | | | | | | | | | | | | | | | | | | | | | | | | | | | | | | | |
Value, Beginning of Year | | | Cost of
Purchases | | | Proceeds
from Sales | | | Change in
Unrealized
Gain
(Loss) | | | Realized
Gain
(Loss) | | | Value,
End of
Year | | | Shares,
End of
Year | | | Dividend
Income | | | Capital Gain
Distributions | |
| | PGIM QMA International Developed Markets Index Fund (Class R6) | | | | | | | | | |
| $ | 2,433,877 | | | $ | 1,476,161 | | | $ | 598,011 | | | $ | (104,801 | ) | | $ | (53,005 | ) | | $ | 3,154,221 | | | | 271,214 | | | $ | 60,457 | | | $ | 1,640 | |
| | PGIM QMALarge-Cap Core Equity Fund (Class R6) | | | | | | | | | | | | | | | | | | | | | |
| | 4,084,592 | | | | 2,804,412 | | | | 1,323,737 | | | | (270,296 | ) | | | (223,134 | ) | | | 5,071,837 | | | | 329,126 | | | | 68,478 | | | | 667,613 | |
| | PGIM QMAMid-Cap Core Equity Fund (Class R6) | | | | | | | | | | | | | | | | | | | | | |
| | 820,662 | | | | 738,817 | | | | 289,456 | | | | (17,694 | ) | | | (28,108 | ) | | | 1,224,221 | | | | 112,935 | | | | 7,247 | | | | 44,426 | |
| | PGIM QMA US Broad Market Index Fund (Class R6) | | | | | | | | | | | | | | | | | | | | | |
| | 2,449,010 | | | | 1,223,820 | | | | 848,351 | | | | 177,484 | | | | (28,778 | ) | | | 2,973,185 | | | | 218,617 | | | | 37,723 | | | | 13,968 | |
| | PGIM TIPS Fund (Class R6) | | | | | | | | | | | | | | | | | |
| | 271,881 | | | | 201,547 | | | | 127,131 | | | | 13,124 | | | | (4,010 | ) | | | 355,411 | | | | 36,009 | | | | 8,215 | | | | — | |
| | PGIM Total Return Bond Fund (Class R6) | | | | | | | | | | | | | | | | | | | | | | | | | |
| | 951,047 | | | | 910,581 | | | | 504,713 | | | | 79,740 | | | | (14,015 | ) | | | 1,422,640 | | | | 96,320 | | | | 47,534 | | | | — | |
| | | | | | | | | | | | | | | | | | | | | | | | | | | | | | | | | | |
| $ | 13,642,891 | | | $ | 9,539,577 | | | $ | 5,046,020 | | | $ | (101,765 | ) | | $ | (420,494 | ) | | $ | 17,614,189 | | | | | | | $ | 290,800 | | | $ | 768,445 | |
| | | | | | | | | | | | | | | | | | | | | | | | | | | | | | | | | | |
Prudential Day One 2050 Fund:
| | | | | | | | | | | | | | | | | | | | | | | | | | | | | | | | | | |
Value, Beginning of Year | | | Cost of
Purchases | | | Proceeds
from Sales | | | Change in
Unrealized
Gain
(Loss) | | | Realized
Gain
(Loss) | | | Value,
End of
Year | | | Shares,
End of
Year | | | Dividend
Income | | | Capital Gain
Distributions | |
| | PGIM Core Conservative Bond Fund (Class R6) | | | | | | | | | | | | | | | | | | | | | |
| $ | 121,112 | | | $ | 162,428 | | | $ | 70,264 | | | $ | 10,377 | | | $ | (1,756 | ) | | $ | 221,897 | | | | 21,927 | | | $ | 4,591 | | | $ | — | |
| | PGIM Core Ultra Short Bond Fund | | | | | | | | | | | | | | | | | | | | | | | | | |
| | 42,748 | | | | 303,909 | | | | 274,923 | | | | — | | | | — | | | | 71,734 | | | | 71,734 | | | | 558 | | | | — | |
| | PGIM Global Real Estate Fund (Class R6) | | | | | | | | | | | | | | | | | |
| | 305,640 | | | | 381,291 | | | | 165,838 | | | | 28,899 | | | | (1,931 | ) | | | 548,061 | | | | 21,384 | | | | 11,395 | | | | 5,389 | |
| | PGIM JennisonSmall-Cap Core Equity Fund (Class R6) | | | | | | | | | | | | | | | | | | | | | |
| | 242,626 | | | | 308,148 | | | | 97,733 | | | | (5,103 | ) | | | (11,222 | ) | | | 436,716 | | | | 36,978 | | | | 1,106 | | | | 15,657 | |
| | PGIM QMA Commodity Strategies Fund (Class R6) | | | | | | | | | | | | | | | | | | | | | |
| | 180,935 | | | | 254,211 | | | | 84,523 | | | | (12,040 | ) | | | (7,142 | ) | | | 331,441 | | | | 35,110 | | | | 5,811 | | | | — | |
| | PGIM QMA Emerging Markets Equity Fund (Class R6) | | | | | | | | | | | | | | | | | | | | | |
| | 363,476 | | | | 482,536 | | | | 153,095 | | | | (9,158 | ) | | | (25,906 | ) | | | 657,853 | | | | 59,000 | | | | 8,073 | | | | 4,029 | |
| | PGIM QMA International Developed Markets Index Fund (Class R6) | | | | | | | | | | | | | | | | | |
| | 1,086,860 | | | | 1,366,878 | | | | 306,300 | | | | (36,353 | ) | | | (29,033 | ) | | | 2,082,052 | | | | 179,024 | | | | 30,440 | | | | 826 | |
| | PGIM QMALarge-Cap Core Equity Fund (Class R6) | | | | | | | | | | | | | | | | | | | | | |
| | 1,763,183 | | | | 2,165,775 | | | | 643,775 | | | | (106,026 | ) | | | (116,863 | ) | | | 3,062,294 | | | | 198,721 | | | | 33,536 | | | | 326,946 | |
| | PGIM QMAMid-Cap Core Equity Fund (Class R6) | | | | | | | | | | | | | | | | | | | | | |
| | 366,467 | | | | 672,597 | | | | 155,661 | | | | 7,848 | | | | (16,326 | ) | | | 874,925 | | | | 80,713 | | | | 3,670 | | | | 22,500 | |
| | PGIM QMA US Broad Market Index Fund (Class R6) | | | | | | | | | | | | | | | | | | | | | |
| | 1,154,367 | | | | 1,130,461 | | | | 504,358 | | | | 111,530 | | | | (32,725 | ) | | | 1,859,275 | | | | 136,711 | | | | 20,172 | | | | 7,469 | |
| | | | |
| Prudential Day One Funds | | | 159 | |
Notes to Financial Statements(continued)
Prudential Day One 2050 Fund (cont’d.):
| | | | | | | | | | | | | | | | | | | | | | | | | | | | | | | | | | |
Value, Beginning of Year | | | Cost of
Purchases | | | Proceeds
from Sales | | | Change in
Unrealized
Gain
(Loss) | | | Realized
Gain
(Loss) | | | Value,
End of
Year | | | Shares,
End of
Year | | | Dividend
Income | | | Capital Gain
Distributions | |
| | PGIM TIPS Fund (Class R6) | | | | | | | | | | | | | | | | | |
| $ | 60,703 | | | $ | 80,869 | | | $ | 33,185 | | | $ | 3,626 | | | $ | (891 | ) | | $ | 111,122 | | | | 11,259 | | | $ | 2,301 | | | $ | — | |
| | PGIM Total Return Bond Fund (Class R6) | | | | | | | | | | | | | |
| | 424,687 | | | | 570,963 | | | | 250,271 | | | | 38,998 | | | | (5,974 | ) | | | 778,403 | | | | 52,702 | | | | 23,336 | | | | — | |
| | | | | | | | | | | | | | | | | | | | | | | | | | | | | | | | | | |
| $ | 6,112,804 | | | $ | 7,880,066 | | | $ | 2,739,926 | | | $ | 32,598 | | | $ | (249,769 | ) | | $ | 11,035,773 | | | | | | | $ | 144,989 | | | $ | 382,816 | |
| | | | | | | | | | | | | | | | | | | | | | | | | | | | | | | | | | |
Prudential Day One 2055 Fund:
| | | | | | | | | | | | | | | | | | | | | | | | | | | | | | | | | | |
Value, Beginning of Year | | | Cost of
Purchases | | | Proceeds
from Sales | | | Change in
Unrealized
Gain
(Loss) | | | Realized
Gain
(Loss) | | | Value,
End of
Year | | | Shares,
End of
Year | | | Dividend
Income | | | Capital Gain
Distributions | |
| | PGIM Core Ultra Short Bond Fund | | | | | | | | | | | | | | | | | | | | | | | | | |
| $ | 42,782 | | | $ | 323,589 | | | $ | 296,054 | | | $ | — | | | $ | — | | | $ | 70,317 | | | | 70,317 | | | $ | 535 | | | $ | — | |
| | PGIM Global Real Estate Fund (Class R6) | | | | | | | | | | | | | |
| | 287,045 | | | | 192,092 | | | | 123,468 | | | | 21,335 | | | | (1,459 | ) | | | 375,545 | | | | 14,653 | | | | 8,991 | | | | 4,642 | |
| | PGIM JennisonSmall-Cap Core Equity Fund (Class R6) | |
| | 227,866 | | | | 228,990 | | | | 77,261 | | | | 224 | | | | (5,758 | ) | | | 374,061 | | | | 31,673 | | | | 944 | | | | 13,365 | |
| | PGIM QMA Commodity Strategies Fund (Class R6) | | | | | | | | | | | | | |
| | 169,933 | | | | 138,596 | | | | 66,173 | | | | (11,467 | ) | | | (3,777 | ) | | | 227,112 | | | | 24,058 | | | | 4,961 | | | | — | |
| | PGIM QMA Emerging Markets Equity Fund (Class R6) | | | | | | | | | | | | | |
| | 398,269 | | | | 366,604 | | | | 131,512 | | | | (10,465 | ) | | | (21,854 | ) | | | 601,042 | | | | 53,905 | | | | 7,991 | | | | 3,988 | |
| | PGIM QMA International Developed Markets Index Fund (Class R6) | | | | | | | | | |
| | 1,134,183 | | | | 757,332 | | | | 242,050 | | | | (49,747 | ) | | | (22,855 | ) | | | 1,576,863 | | | | 135,586 | | | | 28,853 | | | | 783 | |
| | PGIM QMALarge-Cap Core Equity Fund (Class R6) | | | | | | | | | | | | | |
| | 1,655,949 | | | | 1,094,803 | | | | 503,643 | | | | (124,643 | ) | | | (99,049 | ) | | | 2,023,417 | | | | 131,305 | | | | 28,451 | | | | 277,375 | |
| | PGIM QMAMid-Cap Core Equity Fund (Class R6) | | | | | | | | | | | | | | | | | | | | | |
| | 401,537 | | | | 419,149 | | | | 129,284 | | | | (4,223 | ) | | | (12,715 | ) | | | 674,464 | | | | 62,220 | | | | 3,635 | | | | 22,283 | |
| | PGIM QMA US Broad Market Index Fund (Class R6) | | | | | | | | | | | | | |
| | 1,084,160 | | | | 495,487 | | | | 420,231 | | | | 60,786 | | | | (21,124 | ) | | | 1,199,078 | | | | 88,167 | | | | 17,114 | | | | 6,337 | |
| | PGIM Total Return Bond Fund (Class R6) | | | | | | | | | | | | | |
| | 341,887 | | | | 262,787 | | | | 167,710 | | | | 25,379 | | | | (5,135 | ) | | | 457,208 | | | | 30,955 | | | | 16,101 | | | | — | |
| | | | | | | | | | | | | | | | | | | | | | | | | | | | | | | | | | |
| $ | 5,743,611 | | | $ | 4,279,429 | | | $ | 2,157,386 | | | $ | (92,821 | ) | | $ | (193,726 | ) | | $ | 7,579,107 | | | | | | | $ | 117,576 | | | $ | 328,773 | |
| | | | | | | | | | | | | | | | | | | | | | | | | | | | | | | | | | |
Prudential Day One 2060 Fund:
| | | | | | | | | | | | | | | | | | | | | | | | | | | | | | | | | | |
Value, Beginning of Year | | | Cost of
Purchases | | | Proceeds
from Sales | | | Change in
Unrealized
Gain
(Loss) | | | Realized
Gain
(Loss) | | | Value,
End of
Year | | | Shares,
End of
Year | | | Dividend
Income | | | Capital Gain
Distributions | |
| | PGIM Core Ultra Short Bond Fund | | | | | | | | | | | | | | | | | | | | | | | | | |
| $ | 38,549 | | | $ | 213,184 | | | $ | 185,776 | | | $ | — | | | $ | — | | | $ | 65,957 | | | | 65,957 | | | $ | 456 | | | $ | — | |
| | PGIM Global Real Estate Fund (Class R6) | | | | | | | | | | | | | |
| | 35,676 | | | | 100,915 | | | | 32,582 | | | | 5,697 | | | | (565 | ) | | | 109,141 | | | | 4,258 | | | | 2,113 | | | | 976 | |
| | PGIM JennisonSmall-Cap Core Equity Fund (Class R6) | | | | | | | | | | | | | |
| | 28,317 | | | | 100,709 | | | | 20,737 | | | | 3,401 | | | | (2,979 | ) | | | 108,711 | | | | 9,205 | | | | 202 | | | | 2,858 | |
| | PGIM QMA Commodity Strategies Fund (Class R6) | | | | | | | | | | | | | | | | | | | | | |
| | 21,116 | | | | 65,887 | | | | 17,789 | | | | (1,866 | ) | | | (1,345 | ) | | | 66,003 | | | | 6,992 | | | | 1,055 | | | | — | |
| | PGIM QMA Emerging Markets Equity Fund (Class R6) | | | | | | | | | | | | | | | | | | | | | |
| | 56,563 | | | | 163,745 | | | | 39,708 | | | | 148 | | | | (6,073 | ) | | | 174,675 | | | | 15,666 | | | | 1,954 | | | | 975 | |
| | PGIM QMA International Developed Markets Index Fund (Class R6) | | | | | | | | | | | | | | | | | |
| | 147,982 | | | | 440,567 | | | | 78,372 | | | | (288 | ) | | | (7,976 | ) | | | 501,913 | | | | 43,157 | | | | 6,474 | | | | 176 | |
| | PGIM QMALarge-Cap Core Equity Fund (Class R6) | | | | | | | | | | | | | | | | | | | | | |
| | 212,892 | | | | 582,565 | | | | 145,191 | | | | (11,283 | ) | | | (29,152 | ) | | | 609,831 | | | | 39,574 | | | | 6,302 | | | | 61,438 | |
| | PGIM QMAMid-Cap Core Equity Fund (Class R6) | | | | | | | | | | | | | | | | | | | | | |
| | 49,906 | | | | 182,652 | | | | 35,924 | | | | 3,848 | | | | (4,468 | ) | | | 196,014 | | | | 18,082 | | | | 777 | | | | 4,764 | |
| | PGIM QMA US Broad Market Index Fund (Class R6) | | | | | | | | | | | | | | | | | | | | | |
| | 134,734 | | | | 313,173 | | | | 112,703 | | | | 23,083 | | | | (9,807 | ) | | | 348,480 | | | | 25,624 | | | | 3,663 | | | | 1,356 | |
| | PGIM Total Return Bond Fund (Class R6) | | | | | | | | | | | | | |
| | 21,243 | | | | 64,152 | | | | 21,658 | | | | 3,107 | | | | (411 | ) | | | 66,433 | | | | 4,498 | | | | 1,775 | | | | — | |
| | | | | | | | | | | | | | | | | | | | | | | | | | | | | | | | | | |
| $ | 746,978 | | | $ | 2,227,549 | | | $ | 690,440 | | | $ | 25,847 | | | $ | (62,776 | ) | | $ | 2,247,158 | | | | | | | $ | 24,771 | | | $ | 72,543 | |
| | | | | | | | | | | | | | | | | | | | | | | | | | | | | | | | | | |
5. Distributions and Tax Information
Distributions to shareholders, which are determined in accordance with federal income tax regulations and which may differ from generally accepted accounting principles, are recorded on theex-date.
For the year ended July 31, 2019, the tax character of dividends paid as reflected in the Statement of Changes in Net Assets were as follows:
| | | | | | | | |
Fund | | Ordinary
Income | | | Long-Term
Capital Gains | |
Day One Income | | $ | 261,651 | | | $ | 48,913 | |
Day One 2010 | | | 195,278 | | | | 73,352 | |
Day One 2015 | | | 289,980 | | | | 101,378 | |
Day One 2020 | | | 1,002,544 | | | | 301,209 | |
Day One 2025 | | | 1,182,705 | | | | 579,586 | |
Day One 2030 | | | 1,042,235 | | | | 457,646 | |
Day One 2035 | | | 750,168 | | | | 504,991 | |
Day One 2040 | | | 650,368 | | | | 305,187 | |
Day One 2045 | | | 421,243 | | | | 342,104 | |
| | | | |
| Prudential Day One Funds | | | 161 | |
Notes to Financial Statements(continued)
| | | | | | | | |
Fund | | Ordinary
Income | | | Long-Term
Capital Gains | |
Day One 2050 | | $ | 204,840 | | | $ | 108,692 | |
Day One 2055 | | | 182,735 | | | | 156,166 | |
Day One 2060 | | | 44,585 | | | | 13,033 | |
For the year ended July 31, 2018, the tax character of dividends paid as reflected in the Statement of Changes in Net Assets were as follows:
| | | | |
Fund | | Ordinary
Income | |
Day One Income | | $ | 83,942 | |
Day One 2010 | | | 83,089 | |
Day One 2015 | | | 104,827 | |
Day One 2020 | | | 270,932 | |
Day One 2025 | | | 401,625 | |
Day One 2030 | | | 269,514 | |
Day One 2035 | | | 311,745 | |
Day One 2040 | | | 207,680 | |
Day One 2045 | | | 213,958 | |
Day One 2050 | | | 74,841 | |
Day One 2055 | | | 98,133 | |
Day One 2060 | | | 9,904 | |
For the year ended July 31, 2019, the Day One Funds had the following amounts of accumulated undistributed earnings on a tax basis:
| | | | | | | | |
Fund | | Undistributed
Ordinary
Income | | | Undistributed
Long-Term
Capital Gains | |
Day One Income | | $ | 57,715 | | | $ | 125,336 | |
Day One 2010 | | | 61,991 | | | | 89,936 | |
Day One 2015 | | | 148,691 | | | | 182,586 | |
Day One 2020 | | | 532,818 | | | | 742,491 | |
Day One 2025 | | | 730,976 | | | | 963,864 | |
Day One 2030 | | | 450,328 | | | | 1,219,743 | |
Day One 2035 | | | 282,961 | | | | 847,006 | |
Day One 2040 | | | 143,074 | | | | 894,486 | |
Day One 2045 | | | 65,841 | | | | 611,157 | |
Day One 2050 | | | 54,928 | | | | 280,274 | |
Day One 2055 | | | 12,598 | | | | 252,433 | |
Day One 2060 | | | 8,291 | | | | 49,021 | |
The United States federal income tax basis of the Day One Funds’ investments and the net unrealized appreciation (depreciation) as of July 31, 2019 were as follows:
| | | | | | | | | | | | | | | | |
Fund | | Tax Basis | | | Gross
Unrealized
Appreciation | | | Gross
Unrealized
Depreciation | | | Net
Unrealized
Appreciation
(Depreciation) | |
Day One Income | | $ | 9,988,150 | | | $ | 323,785 | | | $ | (247,915 | ) | | $ | 75,870 | |
Day One 2010 | | | 4,759,110 | | | | 155,656 | | | | (87,873 | ) | | | 67,783 | |
Day One 2015 | | | 11,134,434 | | | | 350,647 | | | | (257,660 | ) | | | 92,987 | |
Day One 2020 | | | 43,232,836 | | | | 1,359,368 | | | | (1,026,014 | ) | | | 333,354 | |
Day One 2025 | | | 49,557,787 | | | | 1,722,366 | | | | (1,477,864 | ) | | | 244,502 | |
Day One 2030 | | | 44,136,068 | | | | 1,555,885 | | | | (1,328,362 | ) | | | 227,523 | |
Day One 2035 | | | 31,161,416 | | | | 1,117,674 | | | | (1,157,322 | ) | | | (39,648 | ) |
Day One 2040 | | | 27,638,758 | | | | 1,023,216 | | | | (850,787 | ) | | | 172,429 | |
Day One 2045 | | | 17,633,363 | | | | 662,411 | | | | (681,585 | ) | | | (19,174 | ) |
Day One 2050 | | | 10,987,156 | | | | 361,358 | | | | (312,741 | ) | | | 48,617 | |
Day One 2055 | | | 7,629,335 | | | | 277,618 | | | | (327,846 | ) | | | (50,228 | ) |
Day One 2060 | | | 2,259,616 | | | | 61,549 | | | | (74,007 | ) | | | (12,458 | ) |
The difference between book basis and tax basis was primarily attributable to deferred losses on wash sales.
The Manager has analyzed the Day One Funds’ tax positions taken on federal, state and local income tax returns for all open tax years and has concluded that no provision for income tax is required in the Day One Funds’ financial statements for the current reporting period. The Day One Funds’ federal, state and local income and federal excise tax returns for tax years for which the applicable statutes of limitations have not expired are subject to examination by the Internal Revenue Service and state departments of revenue.
6. Capital and Ownership
The Trust is authorized to issue an unlimited number of shares of beneficial interest of the Day One Funds, at $0.001 par value per share. The Day One Funds offer Class R1, Class R2, Class R3, Class R4, Class R5 and Class R6 shares.
Under certain circumstances, an exchange may be made from specified share classes of the Day One Funds to one or more other share classes of the Day One Funds as presented in the table of transactions in shares of beneficial interest.
As of July 31, 2019, Prudential through its affiliated entities, including affiliated funds, owned the following number of shares of the Day One Funds:
| | | | | | | | | | | | | | | | | | | | | | | | |
Fund | | Class R1 | | | Class R2 | | | Class R3 | | | Class R4 | | | Class R5 | | | Class R6 | |
Day One Income | | | 1,049 | | | | 1,055 | | | | 1,059 | | | | 1,062 | | | | 1,065 | | | | 1,068 | |
Day One 2010 | | | 1,056 | | | | 1,061 | | | | 1,064 | | | | 1,067 | | | | 1,069 | | | | 1,072 | |
Day One 2015 | | | 1,047 | | | | 1,052 | | | | 1,055 | | | | 1,057 | | | | 1,060 | | | | 1,063 | |
Day One 2020 | | | 1,040 | | | | 1,045 | | | | 1,048 | | | | 1,050 | | | | 1,052 | | | | 1,056 | |
Day One 2025 | | | 1,048 | | | | 1,053 | | | | 1,056 | | | | 1,059 | | | | 1,061 | | | | 1,064 | |
Day One 2030 | | | 1,050 | | | | 1,055 | | | | 1,058 | | | | 1,061 | | | | 1,063 | | | | 1,066 | |
| | | | |
| Prudential Day One Funds | | | 163 | |
Notes to Financial Statements(continued)
| | | | | | | | | | | | | | | | | | | | | | | | |
Fund | | Class R1 | | | Class R2 | | | Class R3 | | | Class R4 | | | Class R5 | | | Class R6 | |
Day One 2035 | | | 1,063 | | | | 1,068 | | | | 1,071 | | | | 1,074 | | | | 1,076 | | | | 1,079 | |
Day One 2040 | | | 1,057 | | | | 1,063 | | | | 1,066 | | | | 1,068 | | | | 1,070 | | | | 1,074 | |
Day One 2045 | | | 1,074 | | | | 1,079 | | | | 1,083 | | | | 1,085 | | | | 1,087 | | | | 1,091 | |
Day One 2050 | | | 1,063 | | | | 1,068 | | | | 1,072 | | | | 1,074 | | | | 1,076 | | | | 1,080 | |
Day One 2055 | | | 1,077 | | | | 1,083 | | | | 1,086 | | | | 1,088 | | | | 1,091 | | | | 1,094 | |
Day One 2060 | | | 1,061 | | | | 1,067 | | | | 1,070 | | | | 1,073 | | | | 1,075 | | | | 1,078 | |
At reporting period end, the following number of shareholders of record, each holding greater than 5% of the fund, held the following percentage of the Day One Funds’ outstanding shares on behalf of multiple beneficial owners:
| | | | | | | | | | | | |
| | | Number of
Shareholders | | | % of Outstanding
Shares | | | % held by an
Affiliate
of Prudential | |
Day One Income | | | 5 | | | | 84 | | | | 50 | |
Day One 2010 | | | 4 | | | | 88 | | | | 88 | |
Day One 2015 | | | 4 | | | | 92 | | | | 82 | |
Day One 2020 | | | 7 | | | | 89 | | | | 67 | |
Day One 2025 | | | 5 | | | | 74 | | | | 49 | |
Day One 2030 | | | 7 | | | | 87 | | | | 72 | |
Day One 2035 | | | 6 | | | | 73 | | | | 53 | |
Day One 2040 | | | 6 | | | | 78 | | | | 67 | |
Day One 2045 | | | 7 | | | | 78 | | | | 65 | |
Day One 2050 | | | 7 | | | | 77 | | | | 63 | |
Day One 2055 | | | 6 | | | | 79 | | | | 58 | |
Day One 2060 | | | 8 | | | | 80 | | | | 70 | |
Transactions in shares of beneficial interest were as follows:
Prudential Day One Income Fund:
| | | | | | | | |
Class R1 | | Shares | | | Amount | |
Year ended July 31, 2019: | | | | | | | | |
Shares issued in reinvestment of dividends and distributions | | | 32 | | | $ | 319 | |
| | | | | | | | |
Net increase (decrease) in shares outstanding | | | 32 | | | $ | 319 | |
| | | | | | | | |
Year ended July 31, 2018: | | | | | | | | |
Shares issued in reinvestment of dividends and distributions | | | 14 | | | $ | 154 | |
| | | | | | | | |
Net increase (decrease) in shares outstanding | | | 14 | | | $ | 154 | |
| | | | | | | | |
Prudential Day One Income Fund (cont’d.):
| | | | | | | | |
Class R2 | | Shares | | | Amount | |
Year ended July 31, 2019: | | | | | | | | |
Shares sold | | | 54,635 | | | $ | 566,496 | |
Shares issued in reinvestment of dividends and distributions | | | 2,997 | | | | 30,436 | |
Shares reacquired | | | (11,850 | ) | | | (123,971 | ) |
| | | | | | | | |
Net increase (decrease) in shares outstanding | | | 45,782 | | | $ | 472,961 | |
| | | | | | | | |
Year ended July 31, 2018: | | | | | | | | |
Shares sold | | | 79,361 | | | $ | 831,665 | |
Shares issued in reinvestment of dividends and distributions | | | 370 | | | | 3,893 | |
Shares reacquired | | | (1,311 | ) | | | (13,760 | ) |
| | | | | | | | |
Net increase (decrease) in shares outstanding | | | 78,420 | | | $ | 821,798 | |
| | | | | | | | |
Class R3 | | | | | | |
Year ended July 31, 2019: | | | | | | | | |
Shares sold | | | 35,885 | | | $ | 376,559 | |
Shares issued in reinvestment of dividends and distributions | | | 4,479 | | | | 45,501 | |
Shares reacquired | | | (23,988 | ) | | | (251,096 | ) |
| | | | | | | | |
Net increase (decrease) in shares outstanding | | | 16,376 | | | $ | 170,964 | |
| | | | | | | | |
Year ended July 31, 2018: | | | | | | | | |
Shares sold | | | 33,980 | | | $ | 357,645 | |
Shares issued in reinvestment of dividends and distributions | | | 2,274 | | | | 23,947 | |
Shares reacquired | | | (25,050 | ) | | | (264,099 | ) |
| | | | | | | | |
Net increase (decrease) in shares outstanding | | | 11,204 | | | $ | 117,493 | |
| | | | | | | | |
Class R4 | | | | | | |
Year ended July 31, 2019: | | | | | | | | |
Shares sold | | | 11 | | | $ | 116 | |
Shares issued in reinvestment of dividends and distributions | | | 47 | | | | 475 | |
Shares reacquired | | | (588 | ) | | | (6,120 | ) |
| | | | | | | | |
Net increase (decrease) in shares outstanding | | | (530 | ) | | $ | (5,529 | ) |
| | | | | | | | |
Year ended July 31, 2018: | | | | | | | | |
Shares sold | | | 113 | | | $ | 1,196 | |
Shares issued in reinvestment of dividends and distributions | | | 32 | | | | 339 | |
Shares reacquired | | | (122 | ) | | | (1,298 | ) |
| | | | | | | | |
Net increase (decrease) in shares outstanding | | | 23 | | | $ | 237 | |
| | | | | | | | |
Class R5 | | | | | | |
Year ended July 31, 2019: | | | | | | | | |
Shares sold | | | 4,945 | | | $ | 50,710 | |
Shares issued in reinvestment of dividends and distributions | | | 188 | | | | 1,892 | |
Shares reacquired | | | (63 | ) | | | (673 | ) |
| | | | | | | | |
Net increase (decrease) in shares outstanding | | | 5,070 | | | $ | 51,929 | |
| | | | | | | | |
Year ended July 31, 2018: | | | | | | | | |
Shares issued in reinvestment of dividends and distributions | | | 20 | | | $ | 219 | |
| | | | | | | | |
Net increase (decrease) in shares outstanding | | | 20 | | | $ | 219 | |
| | | | | | | | |
| | | | |
| Prudential Day One Funds | | | 165 | |
Notes to Financial Statements(continued)
Prudential Day One Income Fund (cont’d.):
| | | | | | | | |
Class R6 | | Shares | | | Amount | |
Year ended July 31, 2019: | | | | | | | | |
Shares sold | | | 478,548 | | | $ | 5,033,725 | |
Shares issued in reinvestment of dividends and distributions | | | 22,889 | | | | 231,941 | |
Shares reacquired | | | (188,965 | ) | | | (1,975,188 | ) |
| | | | | | | | |
Net increase (decrease) in shares outstanding | | | 312,472 | | | $ | 3,290,478 | |
| | | | | | | | |
Year ended July 31, 2018: | | | | | | | | |
Shares sold | | | 295,657 | | | $ | 3,119,002 | |
Shares issued in reinvestment of dividends and distributions | | | 5,257 | | | | 55,391 | |
Shares reacquired | | | (39,075 | ) | | | (413,179 | ) |
| | | | | | | | |
Net increase (decrease) in shares outstanding | | | 261,839 | | | $ | 2,761,214 | |
| | | | | | | | |
Prudential Day One 2010 Fund: | |
Class R1 | | Shares | | | Amount | |
Year ended July 31, 2019: | | | | | | | | |
Shares sold | | | 11 | | | $ | 112 | |
Shares issued in reinvestment of dividends and distributions | | | 45 | | | | 444 | |
| | | | | | | | |
Net increase (decrease) in shares outstanding | | | 56 | | | $ | 556 | |
| | | | | | | | |
Year ended July 31, 2018: | | | | | | | | |
Shares issued in reinvestment of dividends and distributions | | | 11 | | | $ | 113 | |
| | | | | | | | |
Net increase (decrease) in shares outstanding | | | 11 | | | $ | 113 | |
| | | | | | | | |
Class R2 | | | | | | |
Year ended July 31, 2019: | | | | | | | | |
Shares sold | | | 1,229 | | | $ | 13,260 | |
Shares issued in reinvestment of dividends and distributions | | | 48 | | | | 471 | |
Shares reacquired | | | (1,229 | ) | | | (13,260 | ) |
| | | | | | | | |
Net increase (decrease) in shares outstanding | | | 48 | | | $ | 471 | |
| | | | | | | | |
Year ended July 31, 2018: | | | | | | | | |
Shares issued in reinvestment of dividends and distributions | | | 13 | | | $ | 140 | |
| | | | | | | | |
Net increase (decrease) in shares outstanding | | | 13 | | | $ | 140 | |
| | | | | | | | |
Class R3 | | | | | | |
Year ended July 31, 2019: | | | | | | | | |
Shares sold | | | 1,438 | | | $ | 15,039 | |
Shares issued in reinvestment of dividends and distributions | | | 643 | | | | 6,295 | |
Shares reacquired | | | (501 | ) | | | (5,259 | ) |
| | | | | | | | |
Net increase (decrease) in shares outstanding | | | 1,580 | | | $ | 16,075 | |
| | | | | | | | |
Year ended July 31, 2018: | | | | | | | | |
Shares sold | | | 15,274 | | | $ | 164,333 | |
Shares issued in reinvestment of dividends and distributions | | | 223 | | | | 2,370 | |
Shares reacquired | | | (3,478 | ) | | | (37,389 | ) |
| | | | | | | | |
Net increase (decrease) in shares outstanding | | | 12,019 | | | $ | 129,314 | |
| | | | | | | | |
Prudential Day One 2010 Fund (cont’d.):
| | | | | | | | |
Class R4 | | Shares | | | Amount | |
Year ended July 31, 2019: | | | | | | | | |
Shares sold | | | 45 | | | $ | 487 | |
Shares issued in reinvestment of dividends and distributions | | | 245 | | | | 2,395 | |
Shares reacquired | | | (4,179 | ) | | | (41,519 | ) |
| | | | | | | | |
Net increase (decrease) in shares outstanding | | | (3,889 | ) | | $ | (38,637 | ) |
| | | | | | | | |
Year ended July 31, 2018: | | | | | | | | |
Shares sold | | | 920 | | | $ | 9,836 | |
Shares issued in reinvestment of dividends and distributions | | | 65 | | | | 697 | |
Shares reacquired | | | (104 | ) | | | (1,103 | ) |
| | | | | | | | |
Net increase (decrease) in shares outstanding | | | 881 | | | $ | 9,430 | |
| | | | | | | | |
Class R5 | | | | | | |
Year ended July 31, 2019: | | | | | | | | |
Shares sold | | | 13,193 | | | $ | 136,912 | |
Shares issued in reinvestment of dividends and distributions | | | 3,916 | | | | 38,335 | |
Shares reacquired | | | (12,341 | ) | | | (129,649 | ) |
| | | | | | | | |
Net increase (decrease) in shares outstanding | | | 4,768 | | | $ | 45,598 | |
| | | | | | | | |
Year ended July 31, 2018: | | | | | | | | |
Shares sold | | | 76,576 | | | $ | 808,677 | |
Shares issued in reinvestment of dividends and distributions | | | 17 | | | | 178 | |
Shares reacquired | | | (1,413 | ) | | | (15,092 | ) |
| | | | | | | | |
Net increase (decrease) in shares outstanding | | | 75,180 | | | $ | 793,763 | |
| | | | | | | | |
Class R6 | | | | | | |
Year ended July 31, 2019: | | | | | | | | |
Shares sold | | | 127,995 | | | $ | 1,369,690 | |
Shares issued in reinvestment of dividends and distributions | | | 22,543 | | | | 220,690 | |
Shares reacquired | | | (234,505 | ) | | | (2,498,315 | ) |
| | | | | | | | |
Net increase (decrease) in shares outstanding | | | (83,967 | ) | | $ | (907,935 | ) |
| | | | | | | | |
Year ended July 31, 2018: | | | | | | | | |
Shares sold | | | 192,048 | | | $ | 2,036,183 | |
Shares issued in reinvestment of dividends and distributions | | | 7,480 | | | | 79,592 | |
Shares reacquired | | | (195,238 | ) | | | (2,077,367 | ) |
| | | | | | | | |
Net increase (decrease) in shares outstanding | | | 4,290 | | | $ | 38,408 | |
| | | | | | | | |
Prudential Day One 2015 Fund: | |
Class R1 | | Shares | | | Amount | |
Year ended July 31, 2019: | | | | | | | | |
Shares issued in reinvestment of dividends and distributions | | | 38 | | | $ | 369 | |
| | | | | | | | |
Net increase (decrease) in shares outstanding | | | 38 | | | $ | 369 | |
| | | | | | | | |
Year ended July 31, 2018: | | | | | | | | |
Shares issued in reinvestment of dividends and distributions | | | 9 | | | $ | 101 | |
| | | | | | | | |
Net increase (decrease) in shares outstanding | | | 9 | | | $ | 101 | |
| | | | | | | | |
| | | | |
| Prudential Day One Funds | | | 167 | |
Notes to Financial Statements(continued)
Prudential Day One 2015 Fund (cont’d.):
| | | | | | | | |
Class R2 | | Shares | | | Amount | |
Year ended July 31, 2019: | | | | | | | | |
Shares sold | | | 1,227 | | | $ | 13,410 | |
Shares issued in reinvestment of dividends and distributions | | | 40 | | | | 397 | |
Shares reacquired | | | (1,213 | ) | | | (13,272 | ) |
| | | | | | | | |
Net increase (decrease) in shares outstanding | | | 54 | | | $ | 535 | |
| | | | | | | | |
Year ended July 31, 2018: | | | | | | | | |
Shares issued in reinvestment of dividends and distributions | | | 12 | | | $ | 128 | |
| | | | | | | | |
Net increase (decrease) in shares outstanding | | | 12 | | | $ | 128 | |
| | | | | | | | |
Class R3 | | | | | | |
Year ended July 31, 2019: | | | | | | | | |
Shares issued in reinvestment of dividends and distributions | | | 42 | | | $ | 414 | |
| | | | | | | | |
Net increase (decrease) in shares outstanding | | | 42 | | | $ | 414 | |
| | | | | | | | |
Year ended July 31, 2018: | | | | | | | | |
Shares issued in reinvestment of dividends and distributions | | | 13 | | | $ | 144 | |
| | | | | | | | |
Net increase (decrease) in shares outstanding | | | 13 | | | $ | 144 | |
| | | | | | | | |
Class R4 | | | | | | |
Year ended July 31, 2019: | | | | | | | | |
Shares sold | | | 213 | | | $ | 2,331 | |
Shares issued in reinvestment of dividends and distributions | | | 322 | | | | 3,183 | |
Shares reacquired | | | (6,883 | ) | | | (69,990 | ) |
| | | | | | | | |
Net increase (decrease) in shares outstanding | | | (6,348 | ) | | $ | (64,476 | ) |
| | | | | | | | |
Year ended July 31, 2018: | | | | | | | | |
Shares sold | | | 2,462 | | | $ | 26,441 | |
Shares issued in reinvestment of dividends and distributions | | | 84 | | | | 899 | |
Shares reacquired | | | (3 | ) | | | (29 | ) |
| | | | | | | | |
Net increase (decrease) in shares outstanding | | | 2,543 | | | $ | 27,311 | |
| | | | | | | | |
Class R5 | | | | | | |
Year ended July 31, 2019: | | | | | | | | |
Shares sold | | | 1,890 | | | $ | 20,134 | |
Shares issued in reinvestment of dividends and distributions | | | 99 | | | | 986 | |
Shares reacquired | | | (10 | ) | | | (98 | ) |
| | | | | | | | |
Net increase (decrease) in shares outstanding | | | 1,979 | | | $ | 21,022 | |
| | | | | | | | |
Year ended July 31, 2018: | | | | | | | | |
Shares sold | | | 654 | | | $ | 7,089 | |
Shares issued in reinvestment of dividends and distributions | | | 16 | | | | 166 | |
| | | | | | | | |
Net increase (decrease) in shares outstanding | | | 670 | | | $ | 7,255 | |
| | | | | | | | |
Prudential Day One 2015 Fund (cont’d.):
| | | | | | | | |
Class R6 | | Shares | | | Amount | |
Year ended July 31, 2019: | | | | | | | | |
Shares sold | | | 382,922 | | | $ | 4,070,069 | |
Shares issued in reinvestment of dividends and distributions | | | 39,069 | | | | 386,786 | |
Shares reacquired | | | (195,383 | ) | | | (2,078,820 | ) |
| | | | | | | | |
Net increase (decrease) in shares outstanding | | | 226,608 | | | $ | 2,378,035 | |
| | | | | | | | |
Year ended July 31, 2018: | | | | | | | | |
Shares sold | | | 676,149 | | | $ | 7,232,591 | |
Shares issued in reinvestment of dividends and distributions | | | 9,626 | | | | 103,388 | |
Shares reacquired | | | (289,343 | ) | | | (3,082,288 | ) |
| | | | | | | | |
Net increase (decrease) in shares outstanding | | | 396,432 | | | $ | 4,253,691 | |
| | | | | | | | |
Prudential Day One 2020 Fund: | |
Class R1 | | Shares | | | Amount | |
Year ended July 31, 2019: | | | | | | | | |
Shares issued in reinvestment of dividends and distributions | | | 31 | | | $ | 310 | |
| | | | | | | | |
Net increase (decrease) in shares outstanding | | | 31 | | | $ | 310 | |
| | | | | | | | |
Year ended July 31, 2018: | | | | | | | | |
Shares issued in reinvestment of dividends and distributions | | | 9 | | | $ | 94 | |
| | | | | | | | |
Net increase (decrease) in shares outstanding | | | 9 | | | $ | 94 | |
| | | | | | | | |
Class R2 | | | | | | |
Year ended July 31, 2019: | | | | | | | | |
Shares sold | | | 128,249 | | | $ | 1,403,467 | |
Shares issued in reinvestment of dividends and distributions | | | 7,331 | | | | 73,312 | |
Shares reacquired | | | (37,446 | ) | | | (398,027 | ) |
| | | | | | | | |
Net increase (decrease) in shares outstanding | | | 98,134 | | | $ | 1,078,752 | |
| | | | | | | | |
Year ended July 31, 2018: | | | | | | | | |
Shares sold | | | 219,358 | | | $ | 2,363,997 | |
Shares issued in reinvestment of dividends and distributions | | | 31 | | | | 338 | |
Shares reacquired | | | (8,259 | ) | | | (89,220 | ) |
| | | | | | | | |
Net increase (decrease) in shares outstanding | | | 211,130 | | | $ | 2,275,115 | |
| | | | | | | | |
Class R3 | | | | | | |
Year ended July 31, 2019: | | | | | | | | |
Shares sold | | | 33,515 | | | $ | 359,569 | |
Shares issued in reinvestment of dividends and distributions | | | 3,968 | | | | 39,718 | |
Shares reacquired | | | (44,107 | ) | | | (453,132 | ) |
| | | | | | | | |
Net increase (decrease) in shares outstanding | | | (6,624 | ) | | $ | (53,845 | ) |
| | | | | | | | |
Year ended July 31, 2018: | | | | | | | | |
Shares sold | | | 101,501 | | | $ | 1,097,327 | |
Shares issued in reinvestment of dividends and distributions | | | 890 | | | | 9,656 | |
Shares reacquired | | | (384 | ) | | | (4,145 | ) |
| | | | | | | | |
Net increase (decrease) in shares outstanding | | | 102,007 | | | $ | 1,102,838 | |
| | | | | | | | |
| | | | |
| Prudential Day One Funds | | | 169 | |
Notes to Financial Statements(continued)
Prudential Day One 2020 Fund (cont’d.):
| | | | | | | | |
Class R4 | | Shares | | | Amount | |
Year ended July 31, 2019: | | | | | | | | |
Shares sold | | | 222 | | | $ | 2,461 | |
Shares issued in reinvestment of dividends and distributions | | | 204 | | | | 2,046 | |
Shares reacquired | | | (4,864 | ) | | | (51,248 | ) |
| | | | | | | | |
Net increase (decrease) in shares outstanding | | | (4,438 | ) | | $ | (46,741 | ) |
| | | | | | | | |
Year ended July 31, 2018: | | | | | | | | |
Shares sold | | | 3,680 | | | $ | 39,898 | |
Shares issued in reinvestment of dividends and distributions | | | 241 | | | | 2,615 | |
Shares reacquired | | | (15,274 | ) | | | (168,157 | ) |
| | | | | | | | |
Net increase (decrease) in shares outstanding | | | (11,353 | ) | | $ | (125,644 | ) |
| | | | | | | | |
Class R5 | | | | | | |
Year ended July 31, 2019: | | | | | | | | |
Shares sold | | | 73,314 | | | $ | 787,450 | |
Shares issued in reinvestment of dividends and distributions | | | 13,104 | | | | 131,171 | |
Shares reacquired | | | (57,361 | ) | | | (623,743 | ) |
| | | | | | | | |
Net increase (decrease) in shares outstanding | | | 29,057 | | | $ | 294,878 | |
| | | | | | | | |
Year ended July 31, 2018: | | | | | | | | |
Shares sold | | | 350,697 | | | $ | 3,771,522 | |
Shares issued in reinvestment of dividends and distributions | | | 15 | | | | 159 | |
Shares reacquired | | | (25,026 | ) | | | (272,990 | ) |
| | | | | | | | |
Net increase (decrease) in shares outstanding | | | 325,686 | | | $ | 3,498,691 | |
| | | | | | | | |
Class R6 | | | | | | |
Year ended July 31, 2019: | | | | | | | | |
Shares sold | | | 1,649,067 | | | $ | 17,902,185 | |
Shares issued in reinvestment of dividends and distributions | | | 105,931 | | | | 1,057,196 | |
Shares reacquired | | | (688,749 | ) | | | (7,392,849 | ) |
| | | | | | | | |
Net increase (decrease) in shares outstanding | | | 1,066,249 | | | $ | 11,566,532 | |
| | | | | | | | |
Year ended July 31, 2018: | | | | | | | | |
Shares sold | | | 1,515,376 | | | $ | 16,404,702 | |
Shares issued in reinvestment of dividends and distributions | | | 23,873 | | | | 258,070 | |
Shares reacquired | | | (626,082 | ) | | | (6,714,474 | ) |
| | | | | | | | |
Net increase (decrease) in shares outstanding | | | 913,167 | | | $ | 9,948,298 | |
| | | | | | | | |
Prudential Day One 2025 Fund:
| | | | | | | | |
Class R1 | | Shares | | | Amount | |
Year ended July 31, 2019: | | | | | | | | |
Shares sold | | | 3,161 | | | $ | 34,601 | |
Shares issued in reinvestment of dividends and distributions | | | 2,135 | | | | 21,333 | |
Shares reacquired | | | (5,812 | ) | | | (64,805 | ) |
| | | | | | | | |
Net increase (decrease) in shares outstanding | | | (516 | ) | | $ | (8,871 | ) |
| | | | | | | | |
Year ended July 31, 2018: | | | | | | | | |
Shares sold | | | 4,422 | | | $ | 48,115 | |
Shares issued in reinvestment of dividends and distributions | | | 527 | | | | 5,793 | |
Shares reacquired | | | (124 | ) | | | (1,375 | ) |
| | | | | | | | |
Net increase (decrease) in shares outstanding | | | 4,825 | | | $ | 52,533 | |
| | | | | | | | |
Class R2 | | | | | | |
Year ended July 31, 2019: | | | | | | | | |
Shares sold | | | 10,349 | | | $ | 113,287 | |
Shares issued in reinvestment of dividends and distributions | | | 68 | | | | 675 | |
Shares reacquired | | | (1,188 | ) | | | (13,358 | ) |
| | | | | | | | |
Net increase (decrease) in shares outstanding | | | 9,229 | | | $ | 100,604 | |
| | | | | | | | |
Year ended July 31, 2018: | | | | | | | | |
Shares sold | | | 1,803 | | | $ | 19,534 | |
Shares issued in reinvestment of dividends and distributions | | | 31 | | | | 341 | |
Shares reacquired | | | (1,540 | ) | | | (16,500 | ) |
| | | | | | | | |
Net increase (decrease) in shares outstanding | | | 294 | | | $ | 3,375 | |
| | | | | | | | |
Class R3 | | | | | | |
Year ended July 31, 2019: | | | | | | | | |
Shares sold | | | 207,276 | | | $ | 2,263,057 | |
Shares issued in reinvestment of dividends and distributions | | | 25,677 | | | | 256,516 | |
Shares reacquired | | | (65,208 | ) | | | (710,571 | ) |
| | | | | | | | |
Net increase (decrease) in shares outstanding | | | 167,745 | | | $ | 1,809,002 | |
| | | | | | | | |
Year ended July 31, 2018: | | | | | | | | |
Shares sold | | | 224,664 | | | $ | 2,461,292 | |
Shares issued in reinvestment of dividends and distributions | | | 5,277 | | | | 57,999 | |
Shares reacquired | | | (69,002 | ) | | | (748,116 | ) |
| | | | | | | | |
Net increase (decrease) in shares outstanding | | | 160,939 | | | $ | 1,771,175 | |
| | | | | | | | |
Class R4 | | | | | | |
Year ended July 31, 2019: | | | | | | | | |
Shares sold | | | 433 | | | $ | 4,872 | |
Shares issued in reinvestment of dividends and distributions | | | 178 | | | | 1,775 | |
Shares reacquired | | | (9,287 | ) | | | (99,648 | ) |
| | | | | | | | |
Net increase (decrease) in shares outstanding | | | (8,676 | ) | | $ | (93,001 | ) |
| | | | | | | | |
Year ended July 31, 2018: | | | | | | | | |
Shares sold | | | 5,050 | | | $ | 55,466 | |
Shares issued in reinvestment of dividends and distributions | | | 130 | | | | 1,424 | |
Shares reacquired | | | (11,924 | ) | | | (131,877 | ) |
| | | | | | | | |
Net increase (decrease) in shares outstanding | | | (6,744 | ) | | $ | (74,987 | ) |
| | | | | | | | |
| | | | |
| Prudential Day One Funds | | | 171 | |
Notes to Financial Statements(continued)
Prudential Day One 2025 Fund (cont’d.):
| | | | | | | | |
Class R5 | | Shares | | | Amount | |
Year ended July 31, 2019: | | | | | | | | |
Shares sold | | | 22,874 | | | $ | 254,198 | |
Shares issued in reinvestment of dividends and distributions | | | 224 | | | | 2,239 | |
Shares reacquired | | | (2 | ) | | | (25 | ) |
| | | | | | | | |
Net increase (decrease) in shares outstanding | | | 23,096 | | | $ | 256,412 | |
| | | | | | | | |
Year ended July 31, 2018: | | | | | | | | |
Shares sold | | | 3,812 | | | $ | 42,009 | |
Shares issued in reinvestment of dividends and distributions | | | 24 | | | | 259 | |
Shares reacquired | | | (2,067 | ) | | | (23,044 | ) |
| | | | | | | | |
Net increase (decrease) in shares outstanding | | | 1,769 | | | $ | 19,224 | |
| | | | | | | | |
Class R6 | | | | | | |
Year ended July 31, 2019: | | | | | | | | |
Shares sold | | | 2,065,429 | | | $ | 22,605,262 | |
Shares issued in reinvestment of dividends and distributions | | | 147,975 | | | | 1,479,753 | |
Shares reacquired | | | (865,516 | ) | | | (9,421,031 | ) |
| | | | | | | | |
Net increase (decrease) in shares outstanding | | | 1,347,888 | | | $ | 14,663,984 | |
| | | | | | | | |
Year ended July 31, 2018: | | | | | | | | |
Shares sold | | | 1,683,407 | | | $ | 18,476,693 | |
Shares issued in reinvestment of dividends and distributions | | | 30,528 | | | | 335,809 | |
Shares reacquired | | | (663,321 | ) | | | (7,285,009 | ) |
| | | | | | | | |
Net increase (decrease) in shares outstanding | | | 1,050,614 | | | $ | 11,527,493 | |
| | | | | | | | |
Prudential Day One 2030 Fund: | |
Class R1 | | Shares | | | Amount | |
Year ended July 31, 2019: | | | | | | | | |
Shares sold | | | 504 | | | $ | 5,705 | |
Shares issued in reinvestment of dividends and distributions | | | 101 | | | | 1,022 | |
Shares reacquired | | | (14 | ) | | | (159 | ) |
| | | | | | | | |
Net increase (decrease) in shares outstanding | | | 591 | | | $ | 6,568 | |
| | | | | | | | |
Year ended July 31, 2018: | | | | | | | | |
Shares sold | | | 1,201 | | | $ | 13,663 | |
Shares issued in reinvestment of dividends and distributions | | | 14 | | | | 153 | |
Shares reacquired | | | (224 | ) | | | (2,479 | ) |
| | | | | | | | |
Net increase (decrease) in shares outstanding | | | 991 | | | $ | 11,337 | |
| | | | | | | | |
Prudential Day One 2030 Fund (cont’d.):
| | | | | | | | |
Class R2 | | Shares | | | Amount | |
Year ended July 31, 2019: | | | | | | | | |
Shares sold | | | 143,276 | | | $ | 1,594,226 | |
Shares issued in reinvestment of dividends and distributions | | | 11,419 | | | | 115,450 | |
Shares reacquired | | | (86,269 | ) | | | (975,795 | ) |
| | | | | | | | |
Net increase (decrease) in shares outstanding | | | 68,426 | | | $ | 733,881 | |
| | | | | | | | |
Year ended July 31, 2018: | | | | | | | | |
Shares sold | | | 277,358 | | | $ | 3,093,847 | |
Shares issued in reinvestment of dividends and distributions | | | 129 | | | | 1,459 | |
Shares reacquired | | | (50,388 | ) | | | (579,329 | ) |
| | | | | | | | |
Net increase (decrease) in shares outstanding | | | 227,099 | | | $ | 2,515,977 | |
| | | | | | | | |
Class R3 | | | | | | |
Year ended July 31, 2019: | | | | | | | | |
Shares sold | | | 66,495 | | | $ | 737,490 | |
Shares issued in reinvestment of dividends and distributions | | | 3,538 | | | | 35,737 | |
Shares reacquired | | | (15,391 | ) | | | (170,285 | ) |
| | | | | | | | |
Net increase (decrease) in shares outstanding | | | 54,642 | | | $ | 602,942 | |
| | | | | | | | |
Year ended July 31, 2018: | | | | | | | | |
Shares sold | | | 63,939 | | | $ | 717,280 | |
Shares issued in reinvestment of dividends and distributions | | | 641 | | | | 7,228 | |
Shares reacquired | | | (2,567 | ) | | | (29,127 | ) |
| | | | | | | | |
Net increase (decrease) in shares outstanding | | | 62,013 | | | $ | 695,381 | |
| | | | | | | | |
Class R4 | | | | | | |
Year ended July 31, 2019: | | | | | | | | |
Shares sold | | | 1,616 | | | $ | 19,034 | |
Shares issued in reinvestment of dividends and distributions | | | 2,799 | | | | 28,267 | |
Shares reacquired | | | (99,730 | ) | | | (1,084,539 | ) |
| | | | | | | | |
Net increase (decrease) in shares outstanding | | | (95,315 | ) | | $ | (1,037,238 | ) |
| | | | | | | | |
Year ended July 31, 2018: | | | | | | | | |
Shares sold | | | 20,346 | | | $ | 229,433 | |
Shares issued in reinvestment of dividends and distributions | | | 1,314 | | | | 14,813 | |
Shares reacquired | | | (4,821 | ) | | | (54,575 | ) |
| | | | | | | | |
Net increase (decrease) in shares outstanding | | | 16,839 | | | $ | 189,671 | |
| | | | | | | | |
Class R5 | | | | | | |
Year ended July 31, 2019: | | | | | | | | |
Shares sold | | | 25,536 | | | $ | 285,183 | |
Shares issued in reinvestment of dividends and distributions | | | 11,004 | | | | 111,145 | |
Shares reacquired | | | (10,076 | ) | | | (112,513 | ) |
| | | | | | | | |
Net increase (decrease) in shares outstanding | | | 26,464 | | | $ | 283,815 | |
| | | | | | | | |
Year ended July 31, 2018: | | | | | | | | |
Shares sold | | | 264,542 | | | $ | 2,946,392 | |
Shares issued in reinvestment of dividends and distributions | | | 192 | | | | 2,160 | |
Shares reacquired | | | (29,919 | ) | | | (341,593 | ) |
| | | | | | | | |
Net increase (decrease) in shares outstanding | | | 234,815 | | | $ | 2,606,959 | |
| | | | | | | | |
| | | | |
| Prudential Day One Funds | | | 173 | |
Notes to Financial Statements(continued)
Prudential Day One 2030 Fund (cont’d.):
| | | | | | | | |
Class R6 | | Shares | | | Amount | |
Year ended July 31, 2019: | | | | | | | | |
Shares sold | | | 1,806,718 | | | $ | 20,217,377 | |
Shares issued in reinvestment of dividends and distributions | | | 119,512 | | | | 1,208,260 | |
Shares reacquired | | | (655,299 | ) | | | (7,328,905 | ) |
| | | | | | | | |
Net increase (decrease) in shares outstanding | | | 1,270,931 | | | $ | 14,096,732 | |
| | | | | | | | |
Year ended July 31, 2018: | | | | | | | | |
Shares sold | | | 1,461,691 | | | $ | 16,458,321 | |
Shares issued in reinvestment of dividends and distributions | | | 21,605 | | | | 243,702 | |
Shares reacquired | | | (452,241 | ) | | | (5,071,143 | ) |
| | | | | | | | |
Net increase (decrease) in shares outstanding | | | 1,031,055 | | | $ | 11,630,880 | |
| | | | | | | | |
Prudential Day One 2035 Fund: | |
Class R1 | | Shares | | | Amount | |
Year ended July 31, 2019: | | | | | | | | |
Shares sold | | | 994 | | | $ | 10,875 | |
Shares issued in reinvestment of dividends and distributions | | | 51 | | | | 504 | |
Shares reacquired | | | (4 | ) | | | (45 | ) |
| | | | | | | | |
Net increase (decrease) in shares outstanding | | | 1,041 | | | $ | 11,334 | |
| | | | | | | | |
Year ended July 31, 2018: | | | | | | | | |
Shares sold | | | 13 | | | $ | 150 | |
Shares issued in reinvestment of dividends and distributions | | | 13 | | | | 149 | |
Shares reacquired | | | (241 | ) | | | (2,691 | ) |
| | | | | | | | |
Net increase (decrease) in shares outstanding | | | (215 | ) | | $ | (2,392 | ) |
| | | | | | | | |
Class R2 | | | | | | |
Year ended July 31, 2019: | | | | | | | | |
Shares sold | | | 1,675 | | | $ | 18,767 | |
Shares issued in reinvestment of dividends and distributions | | | 1,525 | | | | 15,170 | |
Shares reacquired | | | (2,409 | ) | | | (26,510 | ) |
| | | | | | | | |
Net increase (decrease) in shares outstanding | | | 791 | | | $ | 7,427 | |
| | | | | | | | |
Year ended July 31, 2018: | | | | | | | | |
Shares sold | | | 29,052 | | | $ | 335,942 | |
Shares issued in reinvestment of dividends and distributions | | | 17 | | | | 185 | |
Shares reacquired | | | (3 | ) | | | (30 | ) |
| | | | | | | | |
Net increase (decrease) in shares outstanding | | | 29,066 | | | $ | 336,097 | |
| | | | | | | | |
Prudential Day One 2035 Fund (cont’d.):
| | | | | | | | |
Class R3 | | Shares | | | Amount | |
Year ended July 31, 2019: | | | | | | | | |
Shares sold | | | 162,179 | | | $ | 1,807,325 | |
Shares issued in reinvestment of dividends and distributions | | | 27,950 | | | | 278,108 | |
Shares reacquired | | | (141,615 | ) | | | (1,539,371 | ) |
| | | | | | | | |
Net increase (decrease) in shares outstanding | | | 48,514 | | | $ | 546,062 | |
| | | | | | | | |
Year ended July 31, 2018: | | | | | | | | |
Shares sold | | | 189,297 | | | $ | 2,147,197 | |
Shares issued in reinvestment of dividends and distributions | | | 6,937 | | | | 79,080 | |
Shares reacquired | | | (69,779 | ) | | | (784,779 | ) |
| | | | | | | | |
Net increase (decrease) in shares outstanding | | | 126,455 | | | $ | 1,441,498 | |
| | | | | | | | |
Class R4 | | | | | | |
Year ended July 31, 2019: | | | | | | | | |
Shares sold | | | 74 | | | $ | 874 | |
Shares issued in reinvestment of dividends and distributions | | | 235 | | | | 2,341 | |
Shares reacquired | | | (3,473 | ) | | | (35,192 | ) |
| | | | | | | | |
Net increase (decrease) in shares outstanding | | | (3,164 | ) | | $ | (31,977 | ) |
| | | | | | | | |
Year ended July 31, 2018: | | | | | | | | |
Shares sold | | | 626 | | | $ | 7,170 | |
Shares issued in reinvestment of dividends and distributions | | | 66 | | | | 757 | |
Shares reacquired | | | (1,744 | ) | | | (19,569 | ) |
| | | | | | | | |
Net increase (decrease) in shares outstanding | | | (1,052 | ) | | $ | (11,642 | ) |
| | | | | | | | |
Class R5 | | | | | | |
Year ended July 31, 2019: | | | | | | | | |
Shares sold | | | 8,349 | | | $ | 94,694 | |
Shares issued in reinvestment of dividends and distributions | | | 375 | | | | 3,726 | |
Shares reacquired | | | (3,280 | ) | | | (34,347 | ) |
| | | | | | | | |
Net increase (decrease) in shares outstanding | | | 5,444 | | | $ | 64,073 | |
| | | | | | | | |
Year ended July 31, 2018: | | | | | | | | |
Shares sold | | | 1,795 | | | $ | 20,782 | |
Shares issued in reinvestment of dividends and distributions | | | 19 | | | | 216 | |
Shares reacquired | | | (1 | ) | | | (7 | ) |
| | | | | | | | |
Net increase (decrease) in shares outstanding | | | 1,813 | | | $ | 20,991 | |
| | | | | | | | |
Class R6 | | | | | | |
Year ended July 31, 2019: | | | | | | | | |
Shares sold | | | 1,175,179 | | | $ | 13,219,903 | |
Shares issued in reinvestment of dividends and distributions | | | 96,011 | | | | 955,310 | |
Shares reacquired | | | (436,947 | ) | | | (4,868,754 | ) |
| | | | | | | | |
Net increase (decrease) in shares outstanding | | | 834,243 | | | $ | 9,306,459 | |
| | | | | | | | |
Year ended July 31, 2018: | | | | | | | | |
Shares sold | | | 902,631 | | | $ | 10,279,363 | |
Shares issued in reinvestment of dividends and distributions | | | 20,294 | | | | 231,358 | |
Shares reacquired | | | (270,149 | ) | | | (3,071,837 | ) |
| | | | | | | | |
Net increase (decrease) in shares outstanding | | | 652,776 | | | $ | 7,438,884 | |
| | | | | | | | |
| | | | |
| Prudential Day One Funds | | | 175 | |
Notes to Financial Statements(continued)
Prudential Day One 2040 Fund:
| | | | | | | | |
Class R1 | | Shares | | | Amount | |
Year ended July 31, 2019: | | | | | | | | |
Shares sold | | | 226 | | | $ | 2,551 | |
Shares issued in reinvestment of dividends and distributions | | | 50 | | | | 501 | |
Shares reacquired | | | (2 | ) | | | (20 | ) |
| | | | | | | | |
Net increase (decrease) in shares outstanding | | | 274 | | | $ | 3,032 | |
| | | | | | | | |
Year ended July 31, 2018: | | | | | | | | |
Shares sold | | | 81 | | | $ | 947 | |
Shares issued in reinvestment of dividends and distributions | | | 15 | | | | 168 | |
Shares reacquired | | | — | ** | | | (1 | ) |
| | | | | | | | |
Net increase (decrease) in shares outstanding | | | 96 | | | $ | 1,114 | |
| | | | | | | | |
Class R2 | | | | | | |
Year ended July 31, 2019: | | | | | | | | |
Shares sold | | | 120,504 | | | $ | 1,358,381 | |
Shares issued in reinvestment of dividends and distributions | | | 5,930 | | | | 59,712 | |
Shares reacquired | | | (15,578 | ) | | | (173,197 | ) |
| | | | | | | | |
Net increase (decrease) in shares outstanding | | | 110,856 | | | $ | 1,244,896 | |
| | | | | | | | |
Year ended July 31, 2018: | | | | | | | | |
Shares sold | | | 98,384 | | | $ | 1,126,063 | |
Shares issued in reinvestment of dividends and distributions | | | 21 | | | | 243 | |
Shares reacquired | | | (1,834 | ) | | | (21,451 | ) |
| | | | | | | | |
Net increase (decrease) in shares outstanding | | | 96,571 | | | $ | 1,104,855 | |
| | | | | | | | |
Class R3 | | | | | | |
Year ended July 31, 2019: | | | | | | | | |
Shares sold | | | 88,981 | | | $ | 990,652 | |
Shares issued in reinvestment of dividends and distributions | | | 2,901 | | | | 29,211 | |
Shares reacquired | | | (10,213 | ) | | | (115,886 | ) |
| | | | | | | | |
Net increase (decrease) in shares outstanding | | | 81,669 | | | $ | 903,977 | |
| | | | | | | | |
Year ended July 31, 2018: | | | | | | | | |
Shares sold | | | 48,724 | | | $ | 561,741 | |
Shares issued in reinvestment of dividends and distributions | | | 421 | | | | 4,855 | |
Shares reacquired | | | (3,747 | ) | | | (43,448 | ) |
| | | | | | | | |
Net increase (decrease) in shares outstanding | | | 45,398 | | | $ | 523,148 | |
| | | | | | | | |
Class R4 | | | | | | |
Year ended July 31, 2019: | | | | | | | | |
Shares sold | | | 1,159 | | | $ | 13,848 | |
Shares issued in reinvestment of dividends and distributions | | | 182 | | | | 1,838 | |
Shares reacquired | | | (5,401 | ) | | | (59,627 | ) |
| | | | | | | | |
Net increase (decrease) in shares outstanding | | | (4,060 | ) | | $ | (43,941 | ) |
| | | | | | | | |
Year ended July 31, 2018: | | | | | | | | |
Shares sold | | | 1,553 | | | $ | 17,826 | |
Shares issued in reinvestment of dividends and distributions | | | 218 | | | | 2,506 | |
Shares reacquired | | | (7,155 | ) | | | (83,139 | ) |
| | | | | | | | |
Net increase (decrease) in shares outstanding | | | (5,384 | ) | | $ | (62,807 | ) |
| | | | | | | | |
Prudential Day One 2040 Fund (cont’d.):
| | | | | | | | |
Class R5 | | Shares | | | Amount | |
Year ended July 31, 2019: | | | | | | | | |
Shares sold | | | 32,992 | | | $ | 373,640 | |
Shares issued in reinvestment of dividends and distributions | | | 24,469 | | | | 246,402 | |
Shares reacquired | | | (48,909 | ) | | | (549,965 | ) |
| | | | | | | | |
Net increase (decrease) in shares outstanding | | | 8,552 | | | $ | 70,077 | |
| | | | | | | | |
Year ended July 31, 2018: | | | | | | | | |
Shares sold | | | 536,356 | | | $ | 6,096,691 | |
Shares issued in reinvestment of dividends and distributions | | | 21 | | | | 240 | |
Shares reacquired | | | (26,284 | ) | | | (307,672 | ) |
| | | | | | | | |
Net increase (decrease) in shares outstanding | | | 510,093 | | | $ | 5,789,259 | |
| | | | | | | | |
Class R6 | | | | | | |
Year ended July 31, 2019: | | | | | | | | |
Shares sold | | | 662,466 | | | $ | 7,512,895 | |
Shares issued in reinvestment of dividends and distributions | | | 61,360 | | | | 617,891 | |
Shares reacquired | | | (265,333 | ) | | | (3,044,088 | ) |
| | | | | | | | |
Net increase (decrease) in shares outstanding | | | 458,493 | | | $ | 5,086,698 | |
| | | | | | | | |
Year ended July 31, 2018: | | | | | | | | |
Shares sold | | | 718,605 | | | $ | 8,282,519 | |
Shares issued in reinvestment of dividends and distributions | | | 17,332 | | | | 199,669 | |
Shares reacquired | | | (192,059 | ) | | | (2,220,140 | ) |
| | | | | | | | |
Net increase (decrease) in shares outstanding | | | 543,878 | | | $ | 6,262,048 | |
| | | | | | | | |
Prudential Day One 2045 Fund:
| | | | | | | | |
Class R1 | | Shares | | | Amount | |
Year ended July 31, 2019: | | | | | | | | |
Shares sold | | | 64 | | | $ | 715 | |
Shares issued in reinvestment of dividends and distributions | | | 58 | | | | 553 | |
Shares reacquired | | | — | | | | (2 | ) |
| | | | | | | | |
Net increase (decrease) in shares outstanding | | | 122 | | | $ | 1,266 | |
| | | | | | | | |
Year ended July 31, 2018: | | | | | | | | |
Shares issued in reinvestment of dividends and distributions | | | 16 | | | $ | 186 | |
| | | | | | | | |
Net increase (decrease) in shares outstanding | | | 16 | | | $ | 186 | |
| | | | | | | | |
Class R2 | | | | | | |
Year ended July 31, 2019: | | | | | | | | |
Shares sold | | | 6,122 | | | $ | 65,484 | |
Shares issued in reinvestment of dividends and distributions | | | 140 | | | | 1,341 | |
Shares reacquired | | | (13 | ) | | | (150 | ) |
| | | | | | | | |
Net increase (decrease) in shares outstanding | | | 6,249 | | | $ | 66,675 | |
| | | | | | | | |
Year ended July 31, 2018: | | | | | | | | |
Shares sold | | | 1,340 | | | $ | 15,800 | |
Shares issued in reinvestment of dividends and distributions | | | 23 | | | | 268 | |
Shares reacquired | | | (196 | ) | | | (2,322 | ) |
| | | | | | | | |
Net increase (decrease) in shares outstanding | | | 1,167 | | | $ | 13,746 | |
| | | | | | | | |
| | | | |
| Prudential Day One Funds | | | 177 | |
Notes to Financial Statements(continued)
Prudential Day One 2045 Fund (cont’d.):
| | | | | | | | |
Class R3 | | Shares | | | Amount | |
Year ended July 31, 2019: | | | | | | | | |
Shares sold | | | 233,354 | | | $ | 2,570,402 | |
Shares issued in reinvestment of dividends and distributions | | | 32,795 | | | | 314,504 | |
Shares reacquired | | | (97,971 | ) | | | (1,113,722 | ) |
| | | | | | | | |
Net increase (decrease) in shares outstanding | | | 168,178 | | | $ | 1,771,184 | |
| | | | | | | | |
Year ended July 31, 2018: | | | | | | | | |
Shares sold | | | 199,475 | | | $ | 2,304,398 | |
Shares issued in reinvestment of dividends and distributions | | | 8,056 | | | | 93,374 | |
Shares reacquired | | | (58,139 | ) | | | (668,608 | ) |
| | | | | | | | |
Net increase (decrease) in shares outstanding | | | 149,392 | | | $ | 1,729,164 | |
| | | | | | | | |
Class R4 | | | | | | |
Year ended July 31, 2019: | | | | | | | | |
Shares sold | | | 5,824 | | | $ | 61,556 | |
Shares issued in reinvestment of dividends and distributions | | | 1,366 | | | | 13,084 | |
Shares reacquired | | | (42,886 | ) | | | (463,637 | ) |
| | | | | | | | |
Net increase (decrease) in shares outstanding | | | (35,696 | ) | | $ | (388,997 | ) |
| | | | | | | | |
Year ended July 31, 2018: | | | | | | | | |
Shares sold | | | 20,115 | | | $ | 234,228 | |
Shares issued in reinvestment of dividends and distributions | | | 654 | | | | 7,572 | |
Shares reacquired | | | (4,883 | ) | | | (57,011 | ) |
| | | | | | | | |
Net increase (decrease) in shares outstanding | | | 15,886 | | | $ | 184,789 | |
| | | | | | | | |
Class R5 | | | | | | |
Year ended July 31, 2019: | | | | | | | | |
Shares sold | | | 10,785 | | | $ | 121,861 | |
Shares issued in reinvestment of dividends and distributions | | | 446 | | | | 4,282 | |
Shares reacquired | | | (412 | ) | | | (4,506 | ) |
| | | | | | | | |
Net increase (decrease) in shares outstanding | | | 10,819 | | | $ | 121,637 | |
| | | | | | | | |
Year ended July 31, 2018: | | | | | | | | |
Shares sold | | | 3,601 | | | $ | 42,321 | |
Shares issued in reinvestment of dividends and distributions | | | 25 | | | | 295 | |
Shares reacquired | | | (410 | ) | | | (4,812 | ) |
| | | | | | | | |
Net increase (decrease) in shares outstanding | | | 3,216 | | | $ | 37,804 | |
| | | | | | | | |
Class R6 | | | | | | |
Year ended July 31, 2019: | | | | | | | | |
Shares sold | | | 361,862 | | | $ | 4,120,172 | |
Shares issued in reinvestment of dividends and distributions | | | 44,748 | | | | 429,583 | |
Shares reacquired | | | (168,801 | ) | | | (1,929,110 | ) |
| | | | | | | | |
Net increase (decrease) in shares outstanding | | | 237,809 | | | $ | 2,620,645 | |
| | | | | | | | |
Year ended July 31, 2018: | | | | | | | | |
Shares sold | | | 477,283 | | | $ | 5,510,953 | |
Shares issued in reinvestment of dividends and distributions | | | 9,670 | | | | 112,263 | |
Shares reacquired | | | (205,148 | ) | | | (2,318,703 | ) |
| | | | | | | | |
Net increase (decrease) in shares outstanding | | | 281,805 | | | $ | 3,304,513 | |
| | | | | | | | |
Prudential Day One 2050 Fund:
| | | | | | | | |
Class R1 | | Shares | | | Amount | |
Year ended July 31, 2019: | | | | | | | | |
Shares sold | | | 1,922 | | | $ | 22,007 | |
Shares issued in reinvestment of dividends and distributions | | | 546 | | | | 5,279 | |
Shares reacquired | | | (2 | ) | | | (20 | ) |
| | | | | | | | |
Net increase (decrease) in shares outstanding | | | 2,466 | | | $ | 27,266 | |
| | | | | | | | |
Year ended July 31, 2018: | | | | | | | | |
Shares sold | | | 2,800 | | | $ | 31,875 | |
Shares issued in reinvestment of dividends and distributions | | | 173 | | | | 2,000 | |
| | | | | | | | |
Net increase (decrease) in shares outstanding | | | 2,973 | | | $ | 33,875 | |
| | | | | | | | |
Class R2 | | | | | | |
Year ended July 31, 2019: | | | | | | | | |
Shares sold | | | 93,441 | | | $ | 1,058,324 | |
Shares issued in reinvestment of dividends and distributions | | | 5,199 | | | | 50,175 | |
Shares reacquired | | | (12,690 | ) | | | (137,233 | ) |
| | | | | | | | |
Net increase (decrease) in shares outstanding | | | 85,950 | | | $ | 971,266 | |
| | | | | | | | |
Year ended July 31, 2018: | | | | | | | | |
Shares sold | | | 92,270 | | | $ | 1,061,227 | |
Shares issued in reinvestment of dividends and distributions | | | 49 | | | | 571 | |
Shares reacquired | | | (11,633 | ) | | | (136,067 | ) |
| | | | | | | | |
Net increase (decrease) in shares outstanding | | | 80,686 | | | $ | 925,731 | |
| | | | | | | | |
Class R3 | | | | | | |
Year ended July 31, 2019: | | | | | | | | |
Shares sold | | | 67,526 | | | $ | 758,026 | |
Shares issued in reinvestment of dividends and distributions | | | 2,173 | | | | 20,971 | |
Shares reacquired | | | (6,239 | ) | | | (71,941 | ) |
| | | | | | | | |
Net increase (decrease) in shares outstanding | | | 63,460 | | | $ | 707,056 | |
| | | | | | | | |
Year ended July 31, 2018: | | | | | | | | |
Shares sold | | | 28,393 | | | $ | 328,701 | |
Shares issued in reinvestment of dividends and distributions | | | 210 | | | | 2,438 | |
Shares reacquired | | | (550 | ) | | | (6,398 | ) |
| | | | | | | | |
Net increase (decrease) in shares outstanding | | | 28,053 | | | $ | 324,741 | |
| | | | | | | | |
Class R4 | | | | | | |
Year ended July 31, 2019: | | | | | | | | |
Shares sold | | | 151 | | | $ | 1,808 | |
Shares issued in reinvestment of dividends and distributions | | | 52 | | | | 504 | |
Shares reacquired | | | (12,526 | ) | | | (136,164 | ) |
| | | | | | | | |
Net increase (decrease) in shares outstanding | | | (12,323 | ) | | $ | (133,852 | ) |
| | | | | | | | |
Year ended July 31, 2018: | | | | | | | | |
Shares sold | | | 6,412 | | | $ | 74,850 | |
Shares issued in reinvestment of dividends and distributions | | | 169 | | | | 1,961 | |
Shares reacquired | | | (4 | ) | | | (50 | ) |
| | | | | | | | |
Net increase (decrease) in shares outstanding | | | 6,577 | | | $ | 76,761 | |
| | | | | | | | |
| | | | |
| Prudential Day One Funds | | | 179 | |
Notes to Financial Statements(continued)
Prudential Day One 2050 Fund (cont’d.):
| | | | | | | | |
Class R5 | | Shares | | | Amount | |
Year ended July 31, 2019: | | | | | | | | |
Shares sold | | | 22,648 | | | $ | 257,062 | |
Shares issued in reinvestment of dividends and distributions | | | 2,649 | | | | 25,567 | |
Shares reacquired | | | (9,094 | ) | | | (102,073 | ) |
| | | | | | | | |
Net increase (decrease) in shares outstanding | | | 16,203 | | | $ | 180,556 | |
| | | | | | | | |
Year ended July 31, 2018: | | | | | | | | |
Shares sold | | | 47,728 | | | $ | 548,268 | |
Shares issued in reinvestment of dividends and distributions | | | 23 | | | | 265 | |
Shares reacquired | | | (1,943 | ) | | | (22,688 | ) |
| | | | | | | | |
Net increase (decrease) in shares outstanding | | | 45,808 | | | $ | 525,845 | |
| | | | | | | | |
Class R6 | | | | | | |
Year ended July 31, 2019: | | | | | | | | |
Shares sold | | | 385,207 | | | $ | 4,388,157 | |
Shares issued in reinvestment of dividends and distributions | | | 21,847 | | | | 211,036 | |
Shares reacquired | | | (126,482 | ) | | | (1,445,307 | ) |
| | | | | | | | |
Net increase (decrease) in shares outstanding | | | 280,572 | | | $ | 3,153,886 | |
| | | | | | | | |
Year ended July 31, 2018: | | | | | | | | |
Shares sold | | | 296,969 | | | $ | 3,425,732 | |
Shares issued in reinvestment of dividends and distributions | | | 5,823 | | | | 67,606 | |
Shares reacquired | | | (161,744 | ) | | | (1,858,405 | ) |
| | | | | | | | |
Net increase (decrease) in shares outstanding | | | 141,048 | | | $ | 1,634,933 | |
| | | | | | | | |
Prudential Day One 2055 Fund: | |
Class R1 | | Shares | | | Amount | |
Year ended July 31, 2019: | | | | | | | | |
Shares sold | | | 16 | | | $ | 185 | |
Shares issued in reinvestment of dividends and distributions | | | 75 | | | | 720 | |
Shares reacquired | | | (2 | ) | | | (24 | ) |
| | | | | | | | |
Net increase (decrease) in shares outstanding | | | 89 | | | $ | 881 | |
| | | | | | | | |
Year ended July 31, 2018: | | | | | | | | |
Shares sold | | | 228 | | | $ | 2,742 | |
Shares issued in reinvestment of dividends and distributions | | | 16 | | | | 193 | |
| | | | | | | | |
Net increase (decrease) in shares outstanding | | | 244 | | | $ | 2,935 | |
| | | | | | | | |
Prudential Day One 2055 Fund (cont’d.):
| | | | | | | | |
Class R2 | | Shares | | | Amount | |
Year ended July 31, 2019: | | | | | | | | |
Shares sold | | | 3,006 | | | $ | 33,612 | |
Shares issued in reinvestment of dividends and distributions | | | 174 | | | | 1,666 | |
Shares reacquired | | | (708 | ) | | | (8,240 | ) |
| | | | | | | | |
Net increase (decrease) in shares outstanding | | | 2,472 | | | $ | 27,038 | |
| | | | | | | | |
Year ended July 31, 2018: | | | | | | | | |
Shares sold | | | 1,468 | | | $ | 17,522 | |
Shares issued in reinvestment of dividends and distributions | | | 31 | | | | 361 | |
Shares reacquired | | | (90 | ) | | | (1,085 | ) |
| | | | | | | | |
Net increase (decrease) in shares outstanding | | | 1,409 | | | $ | 16,798 | |
| | | | | | | | |
Class R3 | | | | | | |
Year ended July 31, 2019: | | | | | | | | |
Shares sold | | | 103,337 | | | $ | 1,174,196 | |
Shares issued in reinvestment of dividends and distributions | | | 17,004 | | | | 163,072 | |
Shares reacquired | | | (30,088 | ) | | | (343,298 | ) |
| | | | | | | | |
Net increase (decrease) in shares outstanding | | | 90,253 | | | $ | 993,970 | |
| | | | | | | | |
Year ended July 31, 2018: | | | | | | | | |
Shares sold | | | 96,950 | | | $ | 1,134,145 | |
Shares issued in reinvestment of dividends and distributions | | | 3,807 | | | | 44,776 | |
Shares reacquired | | | (32,457 | ) | | | (377,512 | ) |
| | | | | | | | |
Net increase (decrease) in shares outstanding | | | 68,300 | | | $ | 801,409 | |
| | | | | | | | |
Class R4 | | | | | | |
Year ended July 31, 2019: | | | | | | | | |
Shares sold | | | 95 | | | $ | 1,175 | |
Shares issued in reinvestment of dividends and distributions | | | 87 | | | | 831 | |
Shares reacquired | | | (4,527 | ) | | | (48,662 | ) |
| | | | | | | | |
Net increase (decrease) in shares outstanding | | | (4,345 | ) | | $ | (46,656 | ) |
| | | | | | | | |
Year ended July 31, 2018: | | | | | | | | |
Shares sold | | | 1,289 | | | $ | 15,162 | |
Shares issued in reinvestment of dividends and distributions | | | 97 | | | | 1,142 | |
Shares reacquired | | | (9 | ) | | | (100 | ) |
| | | | | | | | |
Net increase (decrease) in shares outstanding | | | 1,377 | | | $ | 16,204 | |
| | | | | | | | |
Class R5 | | | | | | |
Year ended July 31, 2019: | | | | | | | | |
Shares sold | | | 6,293 | | | $ | 70,948 | |
Shares issued in reinvestment of dividends and distributions | | | 171 | | | | 1,643 | |
Shares reacquired | | | (338 | ) | | | (3,845 | ) |
| | | | | | | | |
Net increase (decrease) in shares outstanding | | | 6,126 | | | $ | 68,746 | |
| | | | | | | | |
Year ended July 31, 2018: | | | | | | | | |
Shares sold | | | 683 | | | $ | 8,177 | |
Shares issued in reinvestment of dividends and distributions | | | 24 | | | | 278 | |
Shares reacquired | | | (14 | ) | | | (166 | ) |
| | | | | | | | |
Net increase (decrease) in shares outstanding | | | 693 | | | $ | 8,289 | |
| | | | | | | | |
| | | | |
| Prudential Day One Funds | | | 181 | |
Notes to Financial Statements(continued)
Prudential Day One 2055 Fund (cont’d.):
| | | | | | | | |
Class R6 | | Shares | | | Amount | |
Year ended July 31, 2019: | | | | | | | | |
Shares sold | | | 132,509 | | | $ | 1,519,877 | |
Shares issued in reinvestment of dividends and distributions | | | 17,847 | | | | 170,969 | |
Shares reacquired | | | (64,518 | ) | | | (740,552 | ) |
| | | | | | | | |
Net increase (decrease) in shares outstanding | | | 85,838 | | | $ | 950,294 | |
| | | | | | | | |
Year ended July 31, 2018: | | | | | | | | |
Shares sold | | | 196,590 | | | $ | 2,300,348 | |
Shares issued in reinvestment of dividends and distributions | | | 4,369 | | | | 51,383 | |
Shares reacquired | | | (57,918 | ) | | | (682,520 | ) |
| | | | | | | | |
Net increase (decrease) in shares outstanding | | | 143,041 | | | $ | 1,669,211 | |
| | | | | | | | |
Prudential Day One 2060 Fund: | |
Class R1 | | Shares | | | Amount | |
Year ended July 31, 2019: | | | | | | | | |
Shares issued in reinvestment of dividends and distributions | | | 44 | | | $ | 430 | |
| | | | | | | | |
Net increase (decrease) in shares outstanding | | | 44 | | | $ | 430 | |
| | | | | | | | |
Year ended July 31, 2018: | | | | | | | | |
Shares issued in reinvestment of dividends and distributions | | | 17 | | | $ | 195 | |
| | | | | | | | |
Net increase (decrease) in shares outstanding | | | 17 | | | $ | 195 | |
| | | | | | | | |
Class R2 | | | | | | |
Year ended July 31, 2019: | | | | | | | | |
Shares sold | | | 27,312 | | | $ | 310,649 | |
Shares issued in reinvestment of dividends and distributions | | | 768 | | | | 7,416 | |
Shares reacquired | | | (2,489 | ) | | | (28,377 | ) |
| | | | | | | | |
Net increase (decrease) in shares outstanding | | | 25,591 | | | $ | 289,688 | |
| | | | | | | | |
Year ended July 31, 2018: | | | | | | | | |
Shares sold | | | 7,565 | | | $ | 89,229 | |
Shares issued in reinvestment of dividends and distributions | | | 22 | | | | 253 | |
Shares reacquired | | | (819 | ) | | | (9,788 | ) |
| | | | | | | | |
Net increase (decrease) in shares outstanding | | | 6,768 | | | $ | 79,694 | |
| | | | | | | | |
Class R3 | | | | | | |
Year ended July 31, 2019: | | | | | | | | |
Shares sold | | | 16,347 | | | $ | 185,955 | |
Shares issued in reinvestment of dividends and distributions | | | 617 | | | | 5,954 | |
Shares reacquired | | | (3,047 | ) | | | (37,098 | ) |
| | | | | | | | |
Net increase (decrease) in shares outstanding | | | 13,917 | | | $ | 154,811 | |
| | | | | | | | |
Year ended July 31, 2018: | | | | | | | | |
Shares sold | | | 11,193 | | | $ | 129,893 | |
Shares issued in reinvestment of dividends and distributions | | | 125 | | | | 1,462 | |
Shares reacquired | | | (2,309 | ) | | | (27,685 | ) |
| | | | | | | | |
Net increase (decrease) in shares outstanding | | | 9,009 | | | $ | 103,670 | |
| | | | | | | | |
Prudential Day One 2060 Fund (cont’d.):
| | | | | | | | |
Class R4 | | Shares | | | Amount | |
Year ended July 31, 2019: | | | | | | | | |
Shares sold | | | 14 | | | $ | 164 | |
Shares issued in reinvestment of dividends and distributions | | | 55 | | | | 531 | |
Shares reacquired | | | (89 | ) | | | (966 | ) |
| | | | | | | | |
Net increase (decrease) in shares outstanding | | | (20 | ) | | $ | (271 | ) |
| | | | | | | | |
Year ended July 31, 2018: | | | | | | | | |
Shares sold | | | 75 | | | $ | 895 | |
Shares issued in reinvestment of dividends and distributions | | | 21 | | | | 252 | |
Shares reacquired | | | (7 | ) | | | (80 | ) |
| | | | | | | | |
Net increase (decrease) in shares outstanding | | | 89 | | | $ | 1,067 | |
| | | | | | | | |
Class R5 | | | | | | |
Year ended July 31, 2019: | | | | | | | | |
Shares sold | | | 4,537 | | | $ | 51,253 | |
Shares issued in reinvestment of dividends and distributions | | | 142 | | | | 1,369 | |
Shares reacquired | | | (304 | ) | | | (3,245 | ) |
| | | | | | | | |
Net increase (decrease) in shares outstanding | | | 4,375 | | | $ | 49,377 | |
| | | | | | | | |
Year ended July 31, 2018: | | | | | | | | |
Shares sold | | | 343 | | | $ | 4,140 | |
Shares issued in reinvestment of dividends and distributions | | | 22 | | | | 264 | |
Shares reacquired | | | (4 | ) | | | (45 | ) |
| | | | | | | | |
Net increase (decrease) in shares outstanding | | | 361 | | | $ | 4,359 | |
| | | | | | | | |
Class R6 | | | | | | |
Year ended July 31, 2019: | | | | | | | | |
Shares sold | | | 109,695 | | | $ | 1,271,353 | |
Shares issued in reinvestment of dividends and distributions | | | 4,348 | | | | 41,918 | |
Shares reacquired | | | (29,218 | ) | | | (335,543 | ) |
| | | | | | | | |
Net increase (decrease) in shares outstanding | | | 84,825 | | | $ | 977,728 | |
| | | | | | | | |
Year ended July 31, 2018: | | | | | | | | |
Shares sold | | | 61,021 | | | $ | 716,364 | |
Shares issued in reinvestment of dividends and distributions | | | 639 | | | | 7,478 | |
Shares reacquired | | | (28,997 | ) | | | (345,856 | ) |
| | | | | | | | |
Net increase (decrease) in shares outstanding | | | 32,663 | | | $ | 377,986 | |
| | | | | | | | |
7. Borrowings
The Trust, on behalf of the Day One Funds, along with other affiliated registered investment companies (the “Funds”), is a party to a Syndicated Credit Agreement (“SCA”) with a group of banks. The purpose of the SCA is to provide an alternative source of temporary funding for capital share redemptions. The SCA provides for a commitment of $900 million for the period October 4, 2018 through October 3, 2019. The Funds pay an annualized commitment fee of 0.15% of the unused portion of the SCA. The Day One Funds’ portion of the commitment fee for the unused amount, allocated based upon a method approved by the Board, is accrued daily and paid quarterly. Prior to October 4, 2018, the Funds had another SCA that provided a commitment of $900 million and the Funds paid an annualized commitment fee of 0.15% of the unused portion of the SCA. The interest on borrowings under both SCAs is paid monthly and at a per annum interest rate based upon a contractual
| | | | |
| Prudential Day One Funds | | | 183 | |
Notes to Financial Statements(continued)
spread plus the higher of (1) the effective federal funds rate, (2) the1-month London Interbank Offering Rate or (3) zero percent.
Certain affiliated registered investment companies that are parties to the SCA include portfolios that are subject to a predetermined mathematical formula used to manage certain benefit guarantees offered under variable annuity contracts. The formula may result in large scale asset flows into and out of these portfolios. Consequently, these portfolios may be more likely to utilize the SCA for purposes of funding redemptions. It may be possible for those portfolios to fully exhaust the committed amount of the SCA, thereby requiring the Manager to allocate available funding per a Board-approved methodology designed to treat the Funds in the SCA equitably. The Day One Funds did not utilize the SCA during the year ended July 31, 2019.
8. Risks of Investing in the Day One Funds
The Day One Funds’ risks include, but are not limited to, some or all of the risks discussed below:
Fund of Funds Risk:The value of an investment in the Day One Funds will be related, to a substantial degree, to the investment performance of the Underlying Funds in which it invests. Therefore, the principal risks of investing in the Day One Funds are closely related to the principal risks associated with these Underlying Funds and their investments. Because the Funds’ allocation among different Underlying Funds and direct investments in securities and derivatives will vary, an investment in the Day One Funds may be subject to any and all of these risks at different times and to different degrees. Investing in an Underlying Fund will also expose the Day One Funds to a pro rata portion of the Underlying Fund’s fees and expenses. In addition, one Underlying Fund may buy the same securities that another Underlying Fund sells. Therefore, the Fund would indirectly bear the costs of these trades without accomplishing the investment purpose.
Market and Credit Risk:Securities markets may be volatile and the market prices of the Day One Funds’ securities may decline. Securities fluctuate in price based on changes in an issuer’s financial condition and overall market and economic conditions. If the market prices of the securities owned by the Day One Funds fall, the value of an investment in the Day One Funds will decline. Additionally, the Day One Funds may also be exposed to credit risk in the event that an issuer or guarantor fails to perform or that an institution or entity with which the Day One Funds have unsettled or open transactions defaults.
9. Recent Accounting Pronouncements and Reporting Updates
In August 2018, the Securities and Exchange Commission (the “SEC”) adopted amendments to RegulationS-X to update and simplify the disclosure requirements for registered investment companies by eliminating requirements that are redundant or duplicative of US GAAP requirements or other SEC disclosure requirements. The new amendments require the presentation of the total, rather than the components, of distributable earnings on the Statement of Assets and Liabilities and the total, rather than the components, of dividends from net investment income and distributions from net realized gains on the Statements of Changes in Net Assets. The amendments also removed the requirement for the parenthetical disclosure of undistributed net investment income on the Statements of Changes in Net Assets and certain tax adjustments that were reflected in the Notes to Financial Statements. The Manager has adopted the amendments and reflected them in the Day One Funds’ financial statements.
In August 2018, the FASB issued Accounting Standards Update (“ASU”)No. 2018-13, which changes certain fair value measurement disclosure requirements. The new ASU, in addition to other modifications and additions, removes the requirement to disclose the amount and reasons for transfers between Level 1 and Level 2 of the fair value hierarchy, and the Day One Funds’ policy for the timing of transfers between levels. The amendments are effective for financial statements issued for fiscal years beginning after December 15, 2019, and interim periods within those fiscal years. The Manager has evaluated the implications of certain provisions of the ASU and has determined to early adopt aspects related to the removal and modification of certain fair value measurement disclosures under the ASU effective immediately. The Manager continues to evaluate certain other provisions of the ASU and does not expect a material impact to financial statement disclosures.
| | | | |
| Prudential Day One Funds | | | 185 | |
Prudential Day One Income Fund
Financial Highlights
| | | | | | | | | | | | | | | | | | | | | | | | | | | | | | | | | | | | | | | | | | | | | | | | | | | | |
| | | Per Share
Operating
Performance(a) | | | | | | Income (Loss) From Investment Operations | | | | | | Less Dividends and Distributions | |
| | | Net
Asset Value,
Beginning of
Period | | | | | | Net
investment
income
(loss) | | | | | | Net
realized
and
unrealized
gain (loss) | | | | | | Total
income
(loss) from
investment
operations | | | | | | Dividends
from net
investment
income | | | | | | Distributions
from net
realized
gains | | | | | | Total
dividends
and
distributions | |
| Class R1 | | | | | | | | | | | | | | | | | | | | | | | | | | | | | | | | | | | | | | | | | | | | | | | | | | | | |
| Year Ended 07/31/19 | | | $10.59 | | | | | | | | $0.20 | | | | | | | | $0.25 | | | | | | | | $0.45 | | | | | | | | $(0.24 | ) | | | | | | | $(0.07 | ) | | | | | | | $(0.31 | ) |
| Year Ended 07/31/18 | | | 10.36 | | | | | | | | 0.19 | | | | | | | | 0.19 | | | | | | | | 0.38 | | | | | | | | (0.15 | ) | | | | | | | (- | )(f) | | | | | | | (0.15 | ) |
December 13, 2016(g)
through July 31, 2017 | | | 10.00 | | | | | | | | 0.08 | | | | | | | | 0.31 | | | | | | | | 0.39 | | | | | | | | (0.03 | ) | | | | | | | - | | | | | | | | (0.03 | ) |
| Class R2 | | | | | | | | | | | | | | | | | | | | | | | | | | | | | | | | | | | | | | | | | | | | | | | | | | | | |
| Year Ended 07/31/19 | | | 10.59 | | | | | | | | 0.22 | | | | | | | | 0.26 | | | | | | | | 0.48 | | | | | | | | (0.27 | ) | | | | | | | (0.07 | ) | | | | | | | (0.34 | ) |
| Year Ended 07/31/18 | | | 10.37 | | | | | | | | 0.23 | | | | | | | | 0.17 | | | | | | | | 0.40 | | | | | | | | (0.18 | ) | | | | | | | (- | )(f) | | | | | | | (0.18 | ) |
December 13, 2016(g) through July 31, 2017 | | | 10.00 | | | | | | | | 0.09 | | | | | | | | 0.32 | | | | | | | | 0.41 | | | | | | | | (0.04 | ) | | | | | | | - | | | | | | | | (0.04 | ) |
| Class R3 | | | | | | | | | | | | | | | | | | | | | | | | | | | | | | | | | | | | | | | | | | | | | | | | | | | | |
| Year Ended 07/31/19 | | | 10.60 | | | | | | | | 0.24 | | | | | | | | 0.25 | | | | | | | | 0.49 | | | | | | | | (0.28 | ) | | | | | | | (0.07 | ) | | | | | | | (0.35 | ) |
| Year Ended 07/31/18 | | | 10.37 | | | | | | | | 0.24 | | | | | | | | 0.18 | | | | | | | | 0.42 | | | | | | | | (0.19 | ) | | | | | | | (- | )(f) | | | | | | | (0.19 | ) |
December 13, 2016(g)
through July 31, 2017 | | | 10.00 | | | | | | | | 0.11 | | | | | | | | 0.31 | | | | | | | | 0.42 | | | | | | | | (0.05 | ) | | | | | | | - | | | | | | | | (0.05 | ) |
| Class R4 | | | | | | | | | | | | | | | | | | | | | | | | | | | | | | | | | | | | | | | | | | | | | | | | | | | | |
| Year Ended 07/31/19 | | | 10.60 | | | | | | | | 0.25 | | | | | | | | 0.25 | | | | | | | | 0.50 | | | | | | | | (0.29 | ) | | | | | | | (0.07 | ) | | | | | | | (0.36 | ) |
| Year Ended 07/31/18 | | | 10.37 | | | | | | | | 0.25 | | | | | | | | 0.18 | | | | | | | | 0.43 | | | | | | | | (0.20 | ) | | | | | | | (- | )(f) | | | | | | | (0.20 | ) |
December 13, 2016(g)
through July 31, 2017 | | | 10.00 | | | | | | | | 0.11 | | | | | | | | 0.31 | | | | | | | | 0.42 | | | | | | | | (0.05 | ) | | | | | | | - | | | | | | | | (0.05 | ) |
| Class R5 | | | | | | | | | | | | | | | | | | | | | | | | | | | | | | | | | | | | | | | | | | | | | | | | | | | | |
| Year Ended 07/31/19 | | | 10.60 | | | | | | | | 0.29 | | | | | | | | 0.22 | | | | | | | | 0.51 | | | | | | | | (0.30 | ) | | | | | | | (0.07 | ) | | | | | | | (0.37 | ) |
| Year Ended 07/31/18 | | | 10.37 | | | | | | | | 0.26 | | | | | | | | 0.19 | | | | | | | | 0.45 | | | | | | | | (0.22 | ) | | | | | | | (- | )(f) | | | | | | | (0.22 | ) |
December 13, 2016(g)
through July 31, 2017 | | | 10.00 | | | | | | | | 0.12 | | | | | | | | 0.31 | | | | | | | | 0.43 | | | | | | | | (0.06 | ) | | | | | | | - | | | | | | | | (0.06 | ) |
| Class R6 | | | | | | | | | | | | | | | | | | | | | | | | | | | | | | | | | | | | | | | | | | | | | | | | | | | | |
| Year Ended 07/31/19 | | | 10.61 | | | | | | | | 0.29 | | | | | | | | 0.25 | | | | | | | | 0.54 | | | | | | | | (0.32 | ) | | | | | | | (0.07 | ) | | | | | | | (0.39 | ) |
| Year Ended 07/31/18 | | | 10.38 | | | | | | | | 0.28 | | | | | | | | 0.18 | | | | | | | | 0.46 | | | | | | | | (0.23 | ) | | | | | | | (- | )(f) | | | | | | | (0.23 | ) |
December 13, 2016(g)
through July 31, 2017 | | | 10.00 | | | | | | | | 0.12 | | | | | | | | 0.32 | | | | | | | | 0.44 | | | | | | | | (0.06 | ) | | | | | | | - | | | | | | | | (0.06 | ) |
| | |
| The footnote legend is at the end of the Financial Highlights. | | See Notes to Financial Statements. |
| | | | | | | | | | | | | | | | | | | | | | | | | | | | | | | | | | | | | | | | | | | | | | | | | | | | | | | | | | |
| | | | | | | | | | | | | Ratios/Supplemental Data(b)(c) | |
Net asset
value,
end of
period | | | | | | Total
Return(d) | | | | | | Net assets,
end of
period
(000) | | | | | | Average
net assets
(000) | | | | | | Expenses after
waivers and/or
expense
reimbursement | | | | | | Expenses
before waivers
and/or expense
reimbursement | | | | | | Net
investment
income
(loss) | | | | | | Portfolio
turnover
rate(e) | |
| | | | | | | | | | | | | | | | | | | | | | | | | | | | | | | | | | | | | | | | | | | | | | | | | | | | | | | | | | | |
| | $10.73 | | | | | | | | 4.46% | | | | | | | | $11 | | | | | | | | $11 | | | | | | | | 0.74% | | | | | | | | 108.50% | | | | | | | | 1.92% | | | | | | | | 38% | |
| | 10.59 | | | | | | | | 3.71 | | | | | | | | 11 | | | | | | | | 11 | | | | | | | | 0.64 | | | | | | | | 124.02 | | | | | | | | 1.84 | | | | | | | | 25 | |
|
10.36 |
| | | | | | | 3.89 | | | | | | | | 10 | | | | | | | | 10 | | | | | | | | 0.64 | (h) | | | | | | | 299.81 | (h) | | | | | | | 1.18 | (h) | | | | | | | 146 | |
| | | | | | | | | | | | | | | | | | | | | | | | | | | | | | | | | | | | | | | | | | | | | | | | | | | | | | | | | | | |
| | 10.73 | | | | | | | | 4.72 | | | | | | | | 1,345 | | | | | | | | 1,036 | | | | | | | | 0.49 | | | | | | | | 3.89 | | | | | | | | 2.13 | | | | | | | | 38 | |
| | 10.59 | | | | | | | | 3.86 | | | | | | | | 843 | | | | | | | | 248 | | | | | | | | 0.46 | | | | | | | | 9.08 | | | | | | | | 2.18 | | | | | | | | 25 | |
|
10.37 |
| | | | | | | 4.09 | | | | | | | | 12 | | | | | | | | 11 | | | | | | | | 0.39 | (h) | | | | | | | 286.56 | (h) | | | | | | | 1.43 | (h) | | | | | | | 146 | |
| | | | | | | | | | | | | | | | | | | | | | | | | | | | | | | | | | | | | | | | | | | | | | | | | | | | | | | | | | | |
| | 10.74 | | | | | | | | 4.87 | | | | | | | | 1,597 | | | | | | | | 1,377 | | | | | | | | 0.34 | | | | | | | | 3.50 | | | | | | | | 2.31 | | | | | | | | 38 | |
| | 10.60 | | | | | | | | 4.09 | | | | | | | | 1,403 | | | | | | | | 1,331 | | | | | | | | 0.24 | | | | | | | | 5.23 | | | | | | | | 2.23 | | | | | | | | 25 | |
|
10.37 |
| | | | | | | 4.17 | | | | | | | | 1,256 | | | | | | | | 32 | | | | | | | | 0.09 | (h) | | | | | | | 132.21 | (h) | | | | | | | 1.63 | (h) | | | | | | | 146 | |
| | | | | | | | | | | | | | | | | | | | | | | | | | | | | | | | | | | | | | | | | | | | | | | | | | | | | | | | | | | |
| | 10.74 | | | | | | | | 5.06 | | | | | | | | 12 | | | | | | | | 14 | | | | | | | | 0.24 | | | | | | | | 84.52 | | | | | | | | 2.36 | | | | | | | | 38 | |
| | 10.60 | | | | | | | | 4.21 | | | | | | | | 18 | | | | | | | | 18 | | | | | | | | 0.13 | | | | | | | | 76.23 | | | | | | | | 2.34 | | | | | | | | 25 | |
|
10.37 |
| | | | | | | 4.23 | | | | | | | | 17 | | | | | | | | 15 | | | | | | | | 0.14 | (h) | | | | | | | 275.84 | (h) | | | | | | | 1.67 | (h) | | | | | | | 146 | |
| | | | | | | | | | | | | | | | | | | | | | | | | | | | | | | | | | | | | | | | | | | | | | | | | | | | | | | | | | | |
| | 10.74 | | | | | | | | 5.09 | | | | | | | | 65 | | | | | | | | 51 | | | | | | | | 0.14 | | | | | | | | 24.81 | | | | | | | | 2.75 | | | | | | | | 38 | |
| | 10.60 | | | | | | | | 4.33 | | | | | | | | 11 | | | | | | | | 11 | | | | | | | | 0.04 | | | | | | | | 122.74 | | | | | | | | 2.44 | | | | | | | | 25 | |
|
10.37 |
| | | | | | | 4.29 | | | | | | | | 10 | | | | | | | | 10 | | | | | | | | 0.03 | (h) | | | | | | | 298.99 | (h) | | | | | | | 1.79 | (h) | | | | | | | 146 | |
| | | | | | | | | | | | | | | | | | | | | | | | | | | | | | | | | | | | | | | | | | | | | | | | | | | | | | | | | | | |
| | 10.76 | | | | | | | | 5.33 | | | | | | | | 6,939 | | | | | | | | 6,203 | | | | | | | | 0.00 | (j) | | | | | | | 2.41 | | | | | | | | 2.80 | | | | | | | | 38 | |
| | 10.61 | | | | | | | | 4.45 | | | | | | | | 3,529 | | | | | | | | 2,451 | | | | | | | | 0.00 | (j) | | | | | | | 4.36 | | | | | | | | 2.67 | | | | | | | | 25 | |
|
10.38 |
| | | | | | | 4.46 | | | | | | | | 734 | | | | | | | | 199 | | | | | | | | 0.00 | (j)(h) | | | | | | | 80.76 | (h) | | | | | | | 1.91 | (h) | | | | | | | 146 | |
| | |
| The footnote legend is at the end of the Financial Highlights. | | See Notes to Financial Statements. |
| | | | |
| Prudential Day One Funds | | | 187 | |
Prudential Day One 2010 Fund
Financial Highlights
| | | | | | | | | | | | | | | | | | | | | | | | | | | | | | | | | | | | | | | | | | | | | | | | | | | | |
| | | Per Share
Operating
Performance(a) | | | | | | Income (Loss) From
Investment Operations | | | | | | Less Dividends and Distributions | |
| | | Net Asset Value,
Beginning of
Period | | | | | | Net
investment
income
(loss) | | | | | | Net
realized
and
unrealized
gain (loss) | | | | | | Total
income
(loss) from
investment
operations | | | | | | Dividends
from net
investment
income | | | | | | Distributions
from net
realized
gains | | | | | | Total
dividends
and
distributions | |
| Class R1 | | | | | | | | | | | | | | | | | | | | | | | | | | | | | | | | | | | | | | | | | | | | | | | | | | | | |
| Year Ended 07/31/19 | | | $10.73 | | | | | | | | $0.20 | | | | | | | | $0.24 | | | | | | | | $0.44 | | | | | | | | $(0.26 | ) | | | | | | | $(0.18 | ) | | | | | | | $(0.44 | ) |
| Year Ended 07/31/18 | | | 10.43 | | | | | | | | 0.20 | | | | | | | | 0.21 | | | | | | | | 0.41 | | | | | | | | (0.09 | ) | | | | | | | (0.02 | ) | | | | | | | (0.11 | ) |
December 13, 2016(g)
through July 31, 2017 | | | 10.00 | | | | | | | | 0.08 | | | | | | | | 0.35 | | | | | | | | 0.43 | | | | | | | | - | | | | | | | | - | | | | | | | | - | |
| Class R2 | | | | | | | | | | | | | | | | | | | | | | | | | | | | | | | | | | | | | | | | | | | | | | | | | | | | |
| Year Ended 07/31/19 | | | 10.74 | | | | | | | | 0.21 | | | | | | | | 0.26 | | | | | | | | 0.47 | | | | | | | | (0.29 | ) | | | | | | | (0.18 | ) | | | | | | | (0.47 | ) |
| Year Ended 07/31/18 | | | 10.45 | | | | | | | | 0.22 | | | | | | | | 0.21 | | | | | | | | 0.43 | | | | | | | | (0.12 | ) | | | | | | | (0.02 | ) | | | | | | | (0.14 | ) |
December 13, 2016(g)
through July 31, 2017 | | | 10.00 | | | | | | | | 0.09 | | | | | | | | 0.36 | | | | | | | | 0.45 | | | | | | | | - | | | | | | | | - | | | | | | | | - | |
| Class R3 | | | | | | | | | | | | | | | | | | | | | | | | | | | | | | | | | | | | | | | | | | | | | | | | | | | | |
| Year Ended 07/31/19 | | | 10.75 | | | | | | | | 0.24 | | | | | | | | 0.24 | | | | | | | | 0.48 | | | | | | | | (0.30 | ) | | | | | | | (0.18 | ) | | | | | | | (0.48 | ) |
| Year Ended 07/31/18 | | | 10.46 | | | | | | | | 0.02 | | | | | | | | 0.43 | | | | | | | | 0.45 | | | | | | | | (0.14 | ) | | | | | | | (0.02 | ) | | | | | | | (0.16 | ) |
December 13, 2016(g)
through July 31, 2017 | | | 10.00 | | | | | | | | 0.10 | | | | | | | | 0.36 | | | | | | | | 0.46 | | | | | | | | - | | | | | | | | - | | | | | | | | - | |
| Class R4 | | | | | | | | | | | | | | | | | | | | | | | | | | | | | | | | | | | | | | | | | | | | | | | | | | | | |
| Year Ended 07/31/19 | | | 10.76 | | | | | | | | 0.30 | | | | | | | | 0.18 | | | | | | | | 0.48 | | | | | | | | (0.31 | ) | | | | | | | (0.18 | ) | | | | | | | (0.49 | ) |
| Year Ended 07/31/18 | | | 10.46 | | | | | | | | 0.25 | | | | | | | | 0.22 | | | | | | | | 0.47 | | | | | | | | (0.15 | ) | | | | | | | (0.02 | ) | | | | | | | (0.17 | ) |
December 13, 2016(g)
through July 31, 2017 | | | 10.00 | | | | | | | | 0.11 | | | | | | | | 0.35 | | | | | | | | 0.46 | | | | | | | | - | | | | | | | | - | | | | | | | | - | |
| Class R5 | | | | | | | | | | | | | | | | | | | | | | | | | | | | | | | | | | | | | | | | | | | | | | | | | | | | |
| Year Ended 07/31/19 | | | 10.76 | | | | | | | | 0.26 | | | | | | | | 0.25 | | | | | | | | 0.51 | | | | | | | | (0.32 | ) | | | | | | | (0.18 | ) | | | | | | | (0.50 | ) |
| Year Ended 07/31/18 | | | 10.47 | | | | | | | | 0.27 | | | | | | | | 0.20 | | | | | | | | 0.47 | | | | | | | | (0.16 | ) | | | | | | | (0.02 | ) | | | | | | | (0.18 | ) |
December 13, 2016(g)
through July 31, 2017 | | | 10.00 | | | | | | | | 0.11 | | | | | | | | 0.36 | | | | | | | | 0.47 | | | | | | | | - | | | | | | | | - | | | | | | | | - | |
| Class R6 | | | | | | | | | | | | | | | | | | | | | | | | | | | | | | | | | | | | | | | | | | | | | | | | | | | | |
| Year Ended 07/31/19 | | | 10.78 | | | | | | | | 0.28 | | | | | | | | 0.24 | | | | | | | | 0.52 | | | | | | | | (0.34 | ) | | | | | | | (0.18 | ) | | | | | | | (0.52 | ) |
| Year Ended 07/31/18 | | | 10.48 | | | | | | | | 0.27 | | | | | | | | 0.22 | | | | | | | | 0.49 | | | | | | | | (0.17 | ) | | | | | | | (0.02 | ) | | | | | | | (0.19 | ) |
December 13, 2016(g)
through July 31, 2017 | | | 10.00 | | | | | | | | 0.15 | | | | | | | | 0.33 | | | | | | | | 0.48 | | | | | | | | - | | | | | | | | - | | | | | | | | - | |
| | |
| The footnote legend is at the end of the Financial Highlights. | | See Notes to Financial Statements. |
| | | | | | | | | | | | | | | | | | | | | | | | | | | | | | | | | | | | | | | | | | | | | | | | | | | | | | | | | | |
| | | | | | | | | | | | | Ratios/Supplemental Data(b)(c) | |
Net asset
value,
end of
period | | | | | | Total
Return(d) | | | | | | Net assets,
end of
period
(000) | | | | | | Average
net assets
(000) | | | | | | Expenses after
waivers and/or
expense
reimbursement | | | | | | Expenses
before waivers
and/or expense
reimbursement | | | | | | Net
investment
income
(loss) | | | | | | Portfolio
turnover
rate(e) | |
| | | | | | | | | | | | | | | | | | | | | | | | | | | | | | | | | | | | | | | | | | | | | | | | | | | | | | | | | | | |
| | $10.73 | | | | | | | | 4.58% | | | | | | | | $11 | | | | | | | | $11 | | | | | | | | 0.73% | | | | | | | | 108.96% | | | | | | | | 1.92% | | | | | | | | 41% | |
| | 10.73 | | | | | | | | 3.96 | | | | | | | | 11 | | | | | | | | 11 | | | | | | | | 0.63 | | | | | | | | 122.38 | | | | | | | | 1.85 | | | | | | | | 53 | |
|
10.43 |
| | | | | | | 4.30 | | | | | | | | 10 | | | | | | | | 10 | | | | | | | | 0.65 | (h) | | | | | | | 336.61 | (h) | | | | | | | 1.16 | (h) | | | | | | | 9 | |
| | | | | | | | | | | | | | | | | | | | | | | | | | | | | | | | | | | | | | | | | | | | | | | | | | | | | | | | | | | |
| | 10.74 | | | | | | | | 4.85 | | | | | | | | 11 | | | | | | | | 12 | | | | | | | | 0.48 | | | | | | | | 95.25 | | | | | | | | 2.04 | | | | | | | | 41 | |
| | 10.74 | | | | | | | | 4.12 | | | | | | | | 11 | | | | | | | | 11 | | | | | | | | 0.38 | | | | | | | | 121.77 | | | | | | | | 2.10 | | | | | | | | 53 | |
|
10.45 |
| | | | | | | 4.50 | | | | | | | | 10 | | | | | | | | 10 | | | | | | | | 0.40 | (h) | | | | | | | 336.27 | (h) | | | | | | | 1.41 | (h) | | | | | | | 9 | |
| | | | | | | | | | | | | | | | | | | | | | | | | | | | | | | | | | | | | | | | | | | | | | | | | | | | | | | | | | | |
| | 10.75 | | | | | | | | 5.01 | | | | | | | | 157 | | | | | | | | 144 | | | | | | | | 0.33 | | | | | | | | 11.73 | | | | | | | | 2.32 | | | | | | | | 41 | |
| | 10.75 | | | | | | | | 4.27 | | | | | | | | 140 | | | | | | | | 93 | | | | | | | | 0.27 | | | | | | | | 17.16 | | | | | | | | 0.22 | | | | | | | | 53 | |
|
10.46 |
| | | | | | | 4.60 | | | | | | | | 10 | | | | | | | | 10 | | | | | | | | 0.26 | (h) | | | | | | | 336.07 | (h) | | | | | | | 1.56 | (h) | | | | | | | 9 | |
| | | | | | | | | | | | | | | | | | | | | | | | | | | | | | | | | | | | | | | | | | | | | | | | | | | | | | | | | | | |
| | 10.75 | | | | | | | | 5.02 | | | | | | | | 11 | | | | | | | | 30 | | | | | | | | 0.23 | | | | | | | | 41.92 | | | | | | | | 2.87 | | | | | | | | 41 | |
| | 10.76 | | | | | | | | 4.48 | | | | | | | | 53 | | | | | | | | 48 | | | | | | | | 0.13 | | | | | | | | 29.63 | | | | | | | | 2.33 | | | | | | | | 53 | |
|
10.46 |
| | | | | | | 4.60 | | | | | | | | 43 | | | | | | | | 31 | | | | | | | | 0.12 | (h) | | | | | | | 259.21 | (h) | | | | | | | 1.71 | (h) | | | | | | | 9 | |
| | | | | | | | | | | | | | | | | | | | | | | | | | | | | | | | | | | | | | | | | | | | | | | | | | | | | | | | | | | |
| | 10.77 | | | | | | | | 5.13 | | | | | | | | 872 | | | | | | | | 842 | | | | | | | | 0.13 | | | | | | | | 4.97 | | | | | | | | 2.44 | | | | | | | | 41 | |
| | 10.76 | | | | | | | | 4.49 | | | | | | | | 820 | | | | | | | | 262 | | | | | | | | 0.11 | | | | | | | | 8.20 | | | | | | | | 2.49 | | | | | | | | 53 | |
|
10.47 |
| | | | | | | 4.70 | | | | | | | | 10 | | | | | | | | 10 | | | | | | | | 0.04 | (h) | | | | | | | 335.77 | (h) | | | | | | | 1.77 | (h) | | | | | | | 9 | |
| | | | | | | | | | | | | | | | | | | | | | | | | | | | | | | | | | | | | | | | | | | | | | | | | | | | | | | | | | | |
| | 10.78 | | | | | | | | 5.30 | | | | | | | | 3,702 | | | | | | | | 4,531 | | | | | | | | 0.00 | (j) | | | | | | | 3.70 | | | | | | | | 2.68 | | | | | | | | 41 | |
| | 10.78 | | | | | | | | 4.74 | | | | | | | | 4,606 | | | | | | | | 4,776 | | | | | | | | 0.00 | (j) | | | | | | | 3.27 | | | | | | | | 2.57 | | | | | | | | 53 | |
|
10.48 |
| | | | | | | 4.80 | | | | | | | | 4,436 | | | | | | | | 452 | | | | | | | | 0.00 | (j)(h) | | | | | | | 26.49 | (h) | | | | | | | 2.20 | (h) | | | | | | | 9 | |
| | |
| The footnote legend is at the end of the Financial Highlights. | | See Notes to Financial Statements. |
| | | | |
| Prudential Day One Funds | | | 189 | |
Prudential Day One 2015 Fund
Financial Highlights
| | | | | | | | | | | | | | | | | | | | | | | | | | | | | | | | | | | | | | | | | | | | | | | | | | | | |
| | | Per Share
Operating
Performance(a) | | | | | | Income (Loss) From Investment Operations | | | | | | Less Dividends and Distributions | |
| | | Net
Asset Value,
Beginning of
Period | | | | | | Net
investment
income
(loss) | | | | | | Net
realized
and
unrealized
gain (loss) | | | | | | Total
income
(loss) from
investment
operations | | | | | | Dividends
from net
investment
income | | | | | | Distributions
from net
realized
gains | | | | | | Total
dividends
and
distributions | |
| Class R1 | | | | | | | | | | | | | | | | | | | | | | | | | | | | | | | | | | | | | | | | | | | | | | | | | | | | |
| Year Ended 07/31/19 | | | $10.86 | | | | | | | | $0.19 | | | | | | | | $0.23 | | | | | | | | $0.42 | | | | | | | | $(0.23 | ) | | | | | | | $(0.14 | ) | | | | | | | $(0.37 | ) |
| Year Ended 07/31/18 | | | 10.49 | | | | | | | | 0.19 | | | | | | | | 0.28 | | | | | | | | 0.47 | | | | | | | | (0.08 | ) | | | | | | | (0.02 | ) | | | | | | | (0.10 | ) |
December 13, 2016(g)
through July 31, 2017 | | | 10.00 | | | | | | | | 0.07 | | | | | | | | 0.42 | | | | | | | | 0.49 | | | | | | | | - | | | | | | | | - | | | | | | | | - | |
| Class R2 | | | | | | | | | | | | | | | | | | | | | | | | | | | | | | | | | | | | | | | | | | | | | | | | | | | | |
| Year Ended 07/31/19 | | | 10.88 | | | | | | | | 0.21 | | | | | | | | 0.22 | | | | | | | | 0.43 | | | | | | | | (0.25 | ) | | | | | | | (0.14 | ) | | | | | | | (0.39 | ) |
| Year Ended 07/31/18 | | | 10.50 | | | | | | | | 0.21 | | | | | | | | 0.30 | | | | | | | | 0.51 | | | | | | | | (0.11 | ) | | | | | | | (0.02 | ) | | | | | | | (0.13 | ) |
December 13, 2016(g)
through July 31, 2017 | | | 10.00 | | | | | | | | 0.09 | | | | | | | | 0.41 | | | | | | | | 0.50 | | | | | | | | - | | | | | | | | - | | | | | | | | - | |
| Class R3 | | | | | | | | | | | | | | | | | | | | | | | | | | | | | | | | | | | | | | | | | | | | | | | | | | | | |
| Year Ended 07/31/19 | | | 10.89 | | | | | | | | 0.24 | | | | | | | | 0.21 | | | | | | | | 0.45 | | | | | | | | (0.27 | ) | | | | | | | (0.14 | ) | | | | | | | (0.41 | ) |
| Year Ended 07/31/18 | | | 10.51 | | | | | | | | 0.23 | | | | | | | | 0.29 | | | | | | | | 0.52 | | | | | | | | (0.12 | ) | | | | | | | (0.02 | ) | | | | | | | (0.14 | ) |
December 13, 2016(g)
through July 31, 2017 | | | 10.00 | | | | | | | | 0.10 | | | | | | | | 0.41 | | | | | | | | 0.51 | | | | | | | | - | | | | | | | | - | | | | | | | | - | |
| Class R4 | | | | | | | | | | | | | | | | | | | | | | | | | | | | | | | | | | | | | | | | | | | | | | | | | | | | |
| Year Ended 07/31/19 | | | 10.88 | | | | | | | | 0.30 | | | | | | | | 0.17 | | | | | | | | 0.47 | | | | | | | | (0.28 | ) | | | | | | | (0.14 | ) | | | | | | | (0.42 | ) |
| Year Ended 07/31/18 | | | 10.51 | | | | | | | | 0.24 | | | | | | | | 0.29 | | | | | | | | 0.53 | | | | | | | | (0.14 | ) | | | | | | | (0.02 | ) | | | | | | | (0.16 | ) |
December 13, 2016(g)
through July 31, 2017 | | | 10.00 | | | | | | | | 0.11 | | | | | | | | 0.40 | | | | | | | | 0.51 | | | | | | | | - | | | | | | | | - | | | | | | | | - | |
| Class R5 | | | | | | | | | | | | | | | | | | | | | | | | | | | | | | | | | | | | | | | | | | | | | | | | | | | | |
| Year Ended 07/31/19 | | | 10.90 | | | | | | | | 0.26 | | | | | | | | 0.22 | | | | | | | | 0.48 | | | | | | | | (0.29 | ) | | | | | | | (0.14 | ) | | | | | | | (0.43 | ) |
| Year Ended 07/31/18 | | | 10.53 | | | | | | | | 0.25 | | | | | | | | 0.29 | | | | | | | | 0.54 | | | | | | | | (0.15 | ) | | | | | | | (0.02 | ) | | | | | | | (0.17 | ) |
December 13, 2016(g)
through July 31, 2017 | | | 10.00 | | | | | | | | 0.11 | | | | | | | | 0.42 | | | | | | | | 0.53 | | | | | | | | - | | | | | | | | - | | | | | | | | - | |
| Class R6 | | | | | | | | | | | | | | | | | | | | | | | | | | | | | | | | | | | | | | | | | | | | | | | | | | | | |
| Year Ended 07/31/19 | | | 10.90 | | | | | | | | 0.28 | | | | | | | | 0.22 | | | | | | | | 0.50 | | | | | | | | (0.31 | ) | | | | | | | (0.14 | ) | | | | | | | (0.45 | ) |
| Year Ended 07/31/18 | | | 10.53 | | | | | | | | 0.27 | | | | | | | | 0.28 | | | | | | | | 0.55 | | | | | | | | (0.16 | ) | | | | | | | (0.02 | ) | | | | | | | (0.18 | ) |
December 13, 2016(g)
through July 31, 2017 | | | 10.00 | | | | | | | | 0.13 | | | | | | | | 0.40 | | | | | | | | 0.53 | | | | | | | | - | | | | | | | | - | | | | | | | | - | |
| | |
| The footnote legend is at the end of the Financial Highlights. | | See Notes to Financial Statements. |
| | | | | | | | | | | | | | | | | | | | | | | | | | | | | | | | | | | | | | | | | | | | | | | | | | | | | | | | | | |
| | | | | | | | | | | | | Ratios/Supplemental Data(b)(c) | |
Net asset
value,
end of
period | | | | | | Total
Return(d) | | | | | | Net assets,
end of
period
(000) | | | | | | Average
net assets
(000) | | | | | | Expenses after
waivers and/or
expense
reimbursement | | | | | | Expenses
before waivers
and/or expense
reimbursement | | | | | | Net
investment
income
(loss) | | | | | | Portfolio
turnover
rate(e) | |
| | | | | | | | | | | | | | | | | | | | | | | | | | | | | | | | | | | | | | | | | | | | | | | | | | | | | | | | | | | |
| | $10.91 | | | | | | | | 4.17% | | | | | | | | $11 | | | | | | | | $11 | | | | | | | | 0.73% | | | | | | | | 106.63% | | | | | | | | 1.83% | | | | | | | | 30% | |
| | 10.86 | | | | | | | | 4.50 | | | | | | | | 11 | | | | | | | | 11 | | | | | | | | 0.63 | | | | | | | | 120.64 | | | | | | | | 1.74 | | | | | | | | 57 | |
|
10.49 |
| | | | | | | 4.90 | | | | | | | | 10 | | | | | | | | 10 | | | | | | | | 0.65 | (h) | | | | | | | 244.08 | (h) | | | | | | | 1.10 | (h) | | | | | | | 82 | |
| | | | | | | | | | | | | | | | | | | | | | | | | | | | | | | | | | | | | | | | | | | | | | | | | | | | | | | | | | | |
| | 10.92 | | | | | | | | 4.34 | | | | | | | | 12 | | | | | | | | 13 | | | | | | | | 0.48 | | | | | | | | 92.94 | | | | | | | | 1.94 | | | | | | | | 30 | |
| | 10.88 | | | | | | | | 4.85 | | | | | | | | 11 | | | | | | | | 11 | | | | | | | | 0.38 | | | | | | | | 119.98 | | | | | | | | 1.99 | | | | | | | | 57 | |
|
10.50 |
| | | | | | | 5.00 | | | | | | | | 11 | | | | | | | | 10 | | | | | | | | 0.40 | (h) | | | | | | | 243.71 | (h) | | | | | | | 1.35 | (h) | | | | | | | 82 | |
| | | | | | | | | | | | | | | | | | | | | | | | | | | | | | | | | | | | | | | | | | | | | | | | | | | | | | | | | | | |
| | 10.93 | | | | | | | | 4.50 | | | | | | | | 12 | | | | | | | | 11 | | | | | | | | 0.33 | | | | | | | | 105.36 | | | | | | | | 2.23 | | | | | | | | 30 | |
| | 10.89 | | | | | | | | 5.01 | | | | | | | | 11 | | | | | | | | 11 | | | | | | | | 0.23 | | | | | | | | 119.64 | | | | | | | | 2.14 | | | | | | | | 57 | |
|
10.51 |
| | | | | | | 5.10 | | | | | | | | 11 | | | | | | | | 10 | | | | | | | | 0.26 | (h) | | | | | | | 243.52 | (h) | | | | | | | 1.50 | (h) | | | | | | | 82 | |
| | | | | | | | | | | | | | | | | | | | | | | | | | | | | | | | | | | | | | | | | | | | | | | | | | | | | | | | | | | |
| | 10.93 | | | | | | | | 4.62 | | | | | | | | 12 | | | | | | | | 44 | | | | | | | | 0.23 | | | | | | | | 28.32 | | | | | | | | 2.82 | | | | | | | | 30 | |
| | 10.88 | | | | | | | | 5.02 | | | | | | | | 81 | | | | | | | | 65 | | | | | | | | 0.14 | | | | | | | | 22.01 | | | | | | | | 2.27 | | | | | | | | 57 | |
|
10.51 |
| | | | | | | 5.10 | | | | | | | | 51 | | | | | | | | 42 | | | | | | | | 0.16 | (h) | | | | | | | 144.74 | (h) | | | | | | | 1.72 | (h) | | | | | | | 82 | |
| | | | | | | | | | | | | | | | | | | | | | | | | | | | | | | | | | | | | | | | | | | | | | | | | | | | | | | | | | | |
| | 10.95 | | | | | | | | 4.82 | | | | | | | | 40 | | | | | | | | 28 | | | | | | | | 0.13 | | | | | | | | 43.44 | | | | | | | | 2.44 | | | | | | | | 30 | |
| | 10.90 | | | | | | | | 5.11 | | | | | | | | 18 | | | | | | | | 12 | | | | | | | | 0.04 | | | | | | | | 110.69 | | | | | | | | 2.34 | | | | | | | | 57 | |
|
10.53 |
| | | | | | | 5.30 | | | | | | | | 11 | | | | | | | | 10 | | | | | | | | 0.05 | (h) | | | | | | | 243.22 | (h) | | | | | | | 1.71 | (h) | | | | | | | 82 | |
| | | | | | | | | | | | | | | | | | | | | | | | | | | | | | | | | | | | | | | | | | | | | | | | | | | | | | | | | | | |
| | 10.95 | | | | | | | | 4.89 | | | | | | | | 11,081 | | | | | | | | 9,955 | | | | | | | | 0.00 | (j) | | | | | | | 2.04 | | | | | | | | 2.58 | | | | | | | | 30 | |
| | 10.90 | | | | | | | | 5.27 | | | | | | | | 8,567 | | | | | | | | 6,742 | | | | | | | | 0.00 | (j) | | | | | | | 2.53 | | | | | | | | 2.50 | | | | | | | | 57 | |
|
10.53 |
| | | | | | | 5.30 | | | | | | | | 4,099 | | | | | | | | 640 | | | | | | | | 0.00 | (j)(h) | | | | | | | 27.57 | (h) | | | | | | | 1.94 | (h) | | | | | | | 82 | |
| | |
| The footnote legend is at the end of the Financial Highlights. | | See Notes to Financial Statements. |
| | | | |
| Prudential Day One Funds | | | 191 | |
Prudential Day One 2020 Fund
Financial Highlights
| | | | | | | | | | | | | | | | | | | | | | | | | | | | | | | | | | | | | | | | | | | | | | | | | | | | |
| | | Per Share
Operating
Performance(a) | | | | | | Income (Loss) From Investment Operations | | | | | | Less Dividends and Distributions | |
| | | Net
Asset Value,
Beginning of
Period | | | | | | Net
investment
income
(loss) | | | | | | Net
realized
and
unrealized
gain (loss) | | | | | | Total
income
(loss) from
investment
operations | | | | | | Dividends
from net
investment
income | | | | | | Distributions
from net
realized
gains | | | | | | Total
dividends
and
distributions | |
| Class R1 | | | | | | | | | | | | | | | | | | | | | | | | | | | | | | | | | | | | | | | | | | | | | | | | | | | | |
| Year Ended 07/31/19 | | | $10.98 | | | | | | | | $0.19 | | | | | | | | $0.23 | | | | | | | | $0.42 | | | | | | | | $(0.21 | ) | | | | | | | $(0.10 | ) | | | | | | | $(0.31 | ) |
| Year Ended 07/31/18 | | | 10.52 | | | | | | | | 0.18 | | | | | | | | 0.37 | | | | | | | | 0.55 | | | | | | | | (0.08 | ) | | | | | | | (0.01 | ) | | | | | | | (0.09 | ) |
December 13, 2016(g)
through July 31, 2017 | | | 10.00 | | | | | | | | 0.07 | | | | | | | | 0.45 | | | | | | | | 0.52 | | | | | | | | - | | | | | | | | - | | | | | | | | - | |
| Class R2 | | | | | | | | | | | | | | | | | | | | | | | | | | | | | | | | | | | | | | | | | | | | | | | | | | | | |
| Year Ended 07/31/19 | | | 10.99 | | | | | | | | 0.22 | | | | | | | | 0.23 | | | | | | | | 0.45 | | | | | | | | (0.23 | ) | | | | | | | (0.10 | ) | | | | | | | (0.33 | ) |
| Year Ended 07/31/18 | | | 10.54 | | | | | | | | 0.19 | | | | | | | | 0.38 | | | | | | | | 0.57 | | | | | | | | (0.11 | ) | | | | | | | (0.01 | ) | | | | | | | (0.12 | ) |
December 13, 2016(g)
through July 31, 2017 | | | 10.00 | | | | | | | | 0.08 | | | | | | | | 0.46 | | | | | | | | 0.54 | | | | | | | | - | | | | | | | | - | | | | | | | | - | |
| Class R3 | | | | | | | | | | | | | | | | | | | | | | | | | | | | | | | | | | | | | | | | | | | | | | | | | | | | |
| Year Ended 07/31/19 | | | 11.01 | | | | | | | | 0.25 | | | | | | | | 0.22 | | | | | | | | 0.47 | | | | | | | | (0.25 | ) | | | | | | | (0.10 | ) | | | | | | | (0.35 | ) |
| Year Ended 07/31/18 | | | 10.55 | | | | | | | | 0.25 | | | | | | | | 0.35 | | | | | | | | 0.60 | | | | | | | | (0.13 | ) | | | | | | | (0.01 | ) | | | | | | | (0.14 | ) |
December 13, 2016(g)
through July 31, 2017 | | | 10.00 | | | | | | | | 0.09 | | | | | | | | 0.46 | | | | | | | | 0.55 | | | | | | | | - | | | | | | | | - | | | | | | | | - | |
| Class R4 | | | | | | | | | | | | | | | | | | | | | | | | | | | | | | | | | | | | | | | | | | | | | | | | | | | | |
| Year Ended 07/31/19 | | | 11.03 | | | | | | | | 0.28 | | | | | | | | 0.18 | | | | | | | | 0.46 | | | | | | | | (0.26 | ) | | | | | | | (0.10 | ) | | | | | | | (0.36 | ) |
| Year Ended 07/31/18 | | | 10.55 | | | | | | | | 0.24 | | | | | | | | 0.39 | | | | | | | | 0.63 | | | | | | | | (0.14 | ) | | | | | | | (0.01 | ) | | | | | | | (0.15 | ) |
December 13, 2016(g)
through July 31, 2017 | | | 10.00 | | | | | | | | 0.10 | | | | | | | | 0.45 | | | | | | | | 0.55 | | | | | | | | - | | | | | | | | - | | | | | | | | - | |
| Class R5 | | | | | | | | | | | | | | | | | | | | | | | | | | | | | | | | | | | | | | | | | | | | | | | | | | | | |
| Year Ended 07/31/19 | | | 11.03 | | | | | | | | 0.25 | | | | | | | | 0.23 | | | | | | | | 0.48 | | | | | | | | (0.27 | ) | | | | | | | (0.10 | ) | | | | | | | (0.37 | ) |
| Year Ended 07/31/18 | | | 10.56 | | | | | | | | 0.23 | | | | | | | | 0.40 | | | | | | | | 0.63 | | | | | | | | (0.15 | ) | | | | | | | (0.01 | ) | | | | | | | (0.16 | ) |
December 13, 2016(g)
through July 31, 2017 | | | 10.00 | | | | | | | | 0.11 | | | | | | | | 0.45 | | | | | | | | 0.56 | | | | | | | | - | | | | | | | | - | | | | | | | | - | |
| Class R6 | | | | | | | | | | | | | | | | | | | | | | | | | | | | | | | | | | | | | | | | | | | | | | | | | | | | |
| Year Ended 07/31/19 | | | 11.00 | | | | | | | | 0.27 | | | | | | | | 0.23 | | | | | | | | 0.50 | | | | | | | | (0.29 | ) | | | | | | | (0.10 | ) | | | | | | | (0.39 | ) |
| Year Ended 07/31/18 | | | 10.54 | | | | | | | | 0.26 | | | | | | | | 0.38 | | | | | | | | 0.64 | | | | | | | | (0.17 | ) | | | | | | | (0.01 | ) | | | | | | | (0.18 | ) |
December 13, 2016(g)
through July 31, 2017 | | | 10.00 | | | | | | | | 0.12 | | | | | | | | 0.42 | | | | | | | | 0.54 | | | | | | | | - | | | | | | | | - | | | | | | | | - | |
| | |
| The footnote legend is at the end of the Financial Highlights. | | See Notes to Financial Statements. |
| | | | | | | | | | | | | | | | | | | | | | | | | | | | | | | | | | | | | | | | | | | | | | | | | | | | | | | | | | |
| | | | | | | | | | | | | Ratios/Supplemental Data(b)(c) | |
Net asset
value,
end of
period | | | | | | Total
Return(d) | | | | | | Net assets,
end of
period
(000) | | | | | | Average
net assets
(000) | | | | | | Expenses after
waivers and/or
expense
reimbursement | | | | | | Expenses
before waivers
and/or expense
reimbursement | | | | | | Net
investment
income
(loss) | | | | | | Portfolio
turnover
rate(e) | |
| | | | | | | | | | | | | | | | | | | | | | | | | | | | | | | | | | | | | | | | | | | | | | | | | | | | | | | | | | | |
| | $11.09 | | | | | | | | 4.19% | | | | | | | | $12 | | | | | | | | $11 | | | | | | | | 0.74% | | | | | | | | 105.39% | | | | | | | | 1.74% | | | | | | | | 33% | |
| | 10.98 | | | | | | | | 5.28 | | | | | | | | 11 | | | | | | | | 11 | | | | | | | | 0.64 | | | | | | | | 118.30 | | | | | | | | 1.68 | | | | | | | | 41 | |
|
10.52 |
| | | | | | | 5.20 | | | | | | | | 11 | | | | | | | | 10 | | | | | | | | 0.67 | (h) | | | | | | | 211.29 | (h) | | | | | | | 1.02 | (h) | | | | | | | 21 | |
| | | | | | | | | | | | | | | | | | | | | | | | | | | | | | | | | | | | | | | | | | | | | | | | | | | | | | | | | | | |
| | 11.11 | | | | | | | | 4.47 | | | | | | | | 3,446 | | | | | | | | 2,456 | | | | | | | | 0.49 | | | | | | | | 1.51 | | | | | | | | 2.02 | | | | | | | | 33 | |
| | 10.99 | | | | | | | | 5.43 | | | | | | | | 2,332 | | | | | | | | 693 | | | | | | | | 0.46 | | | | | | | | 3.02 | | | | | | | | 1.78 | | | | | | | | 41 | |
|
10.54 |
| | | | | | | 5.40 | | | | | | | | 11 | | | | | | | | 10 | | | | | | | | 0.42 | (h) | | | | | | | 210.95 | (h) | | | | | | | 1.27 | (h) | | | | | | | 21 | |
| | | | | | | | | | | | | | | | | | | | | | | | | | | | | | | | | | | | | | | | | | | | | | | | | | | | | | | | | | | |
| | 11.13 | | | | | | | | 4.63 | | | | | | | | 1,072 | | | | | | | | 1,066 | | | | | | | | 0.34 | | | | | | | | 1.99 | | | | | | | | 2.28 | | | | | | | | 33 | |
| | 11.01 | | | | | | | | 5.67 | | | | | | | | 1,134 | | | | | | | | 673 | | | | | | | | 0.28 | | | | | | | | 3.00 | | | | | | | | 2.33 | | | | | | | | 41 | |
|
10.55 |
| | | | | | | 5.50 | | | | | | | | 11 | | | | | | | | 10 | | | | | | | | 0.27 | (h) | | | | | | | 210.74 | (h) | | | | | | | 1.41 | (h) | | | | | | | 21 | |
| | | | | | | | | | | | | | | | | | | | | | | | | | | | | | | | | | | | | | | | | | | | | | | | | | | | | | | | | | | |
| | 11.13 | | | | | | | | 4.64 | | | | | | | | 12 | | | | | | | | 37 | | | | | | | | 0.24 | | | | | | | | 31.79 | | | | | | | | 2.61 | | | | | | | | 33 | |
| | 11.03 | | | | | | | | 5.97 | | | | | | | | 61 | | | | | | | | 191 | | | | | | | | 0.14 | | | | | | | | 7.79 | | | | | | | | 2.19 | | | | | | | | 41 | |
|
10.55 |
| | | | | | | 5.50 | | | | | | | | 178 | | | | | | | | 160 | | | | | | | | 0.14 | (h) | | | | | | | 45.98 | (h) | | | | | | | 1.45 | (h) | | | | | | | 21 | |
| | | | | | | | | | | | | | | | | | | | | | | | | | | | | | | | | | | | | | | | | | | | | | | | | | | | | | | | | | | |
| | 11.14 | | | | | | | | 4.75 | | | | | | | | 3,962 | | | | | | | | 3,807 | | | | | | | | 0.14 | | | | | | | | 0.99 | | | | | | | | 2.34 | | | | | | | | 33 | |
| | 11.03 | | | | | | | | 5.99 | | | | | | | | 3,603 | | | | | | | | 1,162 | | | | | | | | 0.11 | | | | | | | | 1.91 | | | | | | | | 2.13 | | | | | | | | 41 | |
|
10.56 |
| | | | | | | 5.60 | | | | | | | | 11 | | | | | | | | 10 | | | | | | | | 0.06 | (h) | | | | | | | 210.44 | (h) | | | | | | | 1.62 | (h) | | | | | | | 21 | |
| | | | | | | | | | | | | | | | | | | | | | | | | | | | | | | | | | | | | | | | | | | | | | | | | | | | | | | | | | | |
| | 11.11 | | | | | | | | 4.93 | | | | | | | | 35,018 | | | | | | | | 30,081 | | | | | | | | 0.00 | (j) | | | | | | | 0.58 | | | | | | | | 2.54 | | | | | | | | 33 | |
| | 11.00 | | | | | | | | 6.06 | | | | | | | | 22,951 | | | | | | | | 16,888 | | | | | | | | 0.00 | (j) | | | | | | | 0.93 | | | | | | | | 2.42 | | | | | | | | 41 | |
|
10.54 |
| | | | | | | 5.40 | | | | | | | | 12,368 | | | | | | | | 1,944 | | | | | | | | 0.00 | (j)(h) | | | | | | | 9.10 | (h) | | | | | | | 1.80 | (h) | | | | | | | 21 | |
| | |
| The footnote legend is at the end of the Financial Highlights. | | See Notes to Financial Statements. |
| | | | |
| Prudential Day One Funds | | | 193 | |
Prudential Day One 2025 Fund
Financial Highlights
| | | | | | | | | | | | | | | | | | | | | | | | | | | | | | | | | | | | | | | | | | | | | | | | | | | | |
| | | Per Share
Operating
Performance(a) | | | | | | Income (Loss) From Investment Operations | | | | | | Less Dividends and Distributions | |
| | | Net
Asset Value,
Beginning of
Period | | | | | | Net
investment
income
(loss) | | | | | | Net
realized
and
unrealized
gain (loss) | | | | | | Total
income
(loss) from
investment
operations | | | | | | Dividends
from net
investment
income | | | | | | Distributions
from net
realized
gains | | | | | | Total
dividends
and
distributions | |
| Class R1 | | | | | | | | | | | | | | | | | | | | | | | | | | | | | | | | | | | | | | | | | | | | | | | | | | | | |
| Year Ended 07/31/19 | | | $11.15 | | | | | | | | $0.19 | | | | | | | | $0.18 | | | | | | | | $0.37 | | | | | | | | $(0.20 | ) | | | | | | | $(0.18 | ) | | | | | | | $(0.38 | ) |
| Year Ended 07/31/18 | | | 10.58 | | | | | | | | 0.17 | | | | | | | | 0.50 | | | | | | | | 0.67 | | | | | | | | (0.10 | ) | | | | | | | (- | )(f) | | | | | | | (0.10 | ) |
December 13, 2016(g)
through July 31, 2017 | | | 10.00 | | | | | | | | 0.04 | | | | | | | | 0.54 | | | | | | | | 0.58 | | | | | | | | - | | | | | | | | - | | | | | | | | - | |
| Class R2 | | | | | | | | | | | | | | | | | | | | | | | | | | | | | | | | | | | | | | | | | | | | | | | | | | | | |
| Year Ended 07/31/19 | | | 11.16 | | | | | | | | 0.18 | | | | | | | | 0.22 | | | | | | | | 0.40 | | | | | | | | (0.23 | ) | | | | | | | (0.18 | ) | | | | | | | (0.41 | ) |
| Year Ended 07/31/18 | | | 10.59 | | | | | | | | 0.24 | | | | | | | | 0.46 | | | | | | | | 0.70 | | | | | | | | (0.13 | ) | | | | | | | (- | )(f) | | | | | | | (0.13 | ) |
December 13, 2016(g)
through July 31, 2017 | | | 10.00 | | | | | | | | 0.08 | | | | | | | | 0.51 | | | | | | | | 0.59 | | | | | | | | - | | | | | | | | - | | | | | | | | - | |
| Class R3 | | | | | | | | | | | | | | | | | | | | | | | | | | | | | | | | | | | | | | | | | | | | | | | | | | | | |
| Year Ended 07/31/19 | | | 11.18 | | | | | | | | 0.23 | | | | | | | | 0.19 | | | | | | | | 0.42 | | | | | | | | (0.25 | ) | | | | | | | (0.18 | ) | | | | | | | (0.43 | ) |
| Year Ended 07/31/18 | | | 10.61 | | | | | | | | 0.21 | | | | | | | | 0.51 | | | | | | | | 0.72 | | | | | | | | (0.15 | ) | | | | | | | (- | )(f) | | | | | | | (0.15 | ) |
December 13, 2016(g)
through July 31, 2017 | | | 10.00 | | | | | | | | 0.07 | | | | | | | | 0.54 | | | | | | | | 0.61 | | | | | | | | - | | | | | | | | - | | | | | | | | - | |
| Class R4 | | | | | | | | | | | | | | | | | | | | | | | | | | | | | | | | | | | | | | | | | | | | | | | | | | | | |
| Year Ended 07/31/19 | | | 11.18 | | | | | | | | 0.22 | | | | | | | | 0.21 | | | | | | | | 0.43 | | | | | | | | (0.26 | ) | | | | | | | (0.18 | ) | | | | | | | (0.44 | ) |
| Year Ended 07/31/18 | | | 10.61 | | | | | | | | 0.20 | | | | | | | | 0.53 | | | | | | | | 0.73 | | | | | | | | (0.16 | ) | | | | | | | (- | )(f) | | | | | | | (0.16 | ) |
December 13, 2016(g)
through July 31, 2017 | | | 10.00 | | | | | | | | 0.08 | | | | | | | | 0.53 | | | | | | | | 0.61 | | | | | | | | - | | | | | | | | - | | | | | | | | - | |
| Class R5 | | | | | | | | | | | | | | | | | | | | | | | | | | | | | | | | | | | | | | | | | | | | | | | | | | | | |
| Year Ended 07/31/19 | | | 11.19 | | | | | | | | 0.24 | | | | | | | | 0.19 | | | | | | | | 0.43 | | | | | | | | (0.27 | ) | | | | | | | (0.18 | ) | | | | | | | (0.45 | ) |
| Year Ended 07/31/18 | | | 10.62 | | | | | | | | 0.23 | | | | | | | | 0.51 | | | | | | | | 0.74 | | | | | | | | (0.17 | ) | | | | | | | (- | )(f) | | | | | | | (0.17 | ) |
December 13, 2016(g)
through July 31, 2017 | | | 10.00 | | | | | | | | 0.10 | | | | | | | | 0.52 | | | | | | | | 0.62 | | | | | | | | - | | | | | | | | - | | | | | | | | - | |
| Class R6 | | | | | | | | | | | | | | | | | | | | | | | | | | | | | | | | | | | | | | | | | | | | | | | | | | | | |
| Year Ended 07/31/19 | | | 11.21 | | | | | | | | 0.27 | | | | | | | | 0.17 | | | | | | | | 0.44 | | | | | | | | (0.28 | ) | | | | | | | (0.18 | ) | | | | | | | (0.46 | ) |
| Year Ended 07/31/18 | | | 10.64 | | | | | | | | 0.25 | | | | | | | | 0.51 | | | | | | | | 0.76 | | | | | | | | (0.19 | ) | | | | | | | (- | )(f) | | | | | | | (0.19 | ) |
December 13, 2016(g)
through July 31, 2017 | | | 10.00 | | | | | | | | 0.10 | | | | | | | | 0.54 | | | | | | | | 0.64 | | | | | | | | - | | | | | | | | - | | | | | | | | - | |
| | |
| The footnote legend is at the end of the Financial Highlights. | | See Notes to Financial Statements. |
| | | | | | | | | | | | | | | | | | | | | | | | | | | | | | | | | | | | | | | | | | | | | | | | | | | | | | | | | | |
| | | | | | | | | | | | | Ratios/Supplemental Data(b)(c) | |
Net asset
value,
end of
period | | | | | | Total
Return(d) | | | | | | Net assets,
end of
period
(000) | | | | | | Average
net assets
(000) | | | | | | Expenses after
waivers and/or
expense
reimbursement | | | | | | Expenses
before waivers
and/or expense
reimbursement | | | | | | Net
investment
income
(loss) | | | | | | Portfolio
turnover
rate(e) | |
| | | | | | | | | | | | �� | | | | | | | | | | | | | | | | | | | | | | | | | | | | | | | | | | | | | | | | | | | | | | | |
| | $11.14 | | | | | | | | 3.73% | | | | | | | | $671 | | | | | | | | $625 | | | | | | | | 0.74% | | | | | | | | 3.01% | | | | | | | | 1.72% | | | | | | | | 35% | |
| | 11.15 | | | | | | | | 6.35 | | | | | | | | 678 | | | | | | | | 639 | | | | | | | | 0.65 | | | | | | | | 3.42 | | | | | | | | 1.55 | | | | | | | | 37 | |
|
10.58 |
| | | | | | | 5.80 | | | | | | | | 592 | | | | | | | | 43 | | | | | | | | 0.53 | (h) | | | | | | | 55.43 | (h) | | | | | | | 0.55 | (h) | | | | | | | 6 | |
| | | | | | | | | | | | | | | | | | | | | | | | | | | | | | | | | | | | | | | | | | | | | | | | | | | | | | | | | | | |
| | 11.15 | | | | | | | | 4.09 | | | | | | | | 117 | | | | | | | | 39 | | | | | | | | 0.49 | | | | | | | | 31.08 | | | | | | | | 1.60 | | | | | | | | 35 | |
| | 11.16 | | | | | | | | 6.62 | | | | | | | | 14 | | | | | | | | 18 | | | | | | | | 0.39 | | | | | | | | 71.60 | | | | | | | | 2.18 | | | | | | | | 37 | |
|
10.59 |
| | | | | | | 5.90 | | | | | | | | 11 | | | | | | | | 10 | | | | | | | | 0.42 | (h) | | | | | | | 215.71 | (h) | | | | | | | 1.16 | (h) | | | | | | | 6 | |
| | | | | | | | | | | | | | | | | | | | | | | | | | | | | | | | | | | | | | | | | | | | | | | | | | | | | | | | | | | |
| | 11.17 | | | | | | | | 4.17 | | | | | | | | 7,737 | | | | | | | | 6,760 | | | | | | | | 0.34 | | | | | | | | 1.00 | | | | | | | | 2.14 | | | | | | | | 35 | |
| | 11.18 | | | | | | | | 6.76 | | | | | | | | 5,871 | | | | | | | | 4,653 | | | | | | | | 0.25 | | | | | | | | 1.24 | | | | | | | | 1.94 | | | | | | | | 37 | |
|
10.61 |
| | | | | | | 6.10 | | | | | | | | 3,863 | | | | | | | | 77 | | | | | | | | 0.04 | (h) | | | | | | | 34.35 | (h) | | | | | | | 1.06 | (h) | | | | | | | 6 | |
| | | | | | | | | | | | | | | | | | | | | | | | | | | | | | | | | | | | | | | | | | | | | | | | | | | | | | | | | | | |
| | 11.17 | | | | | | | | 4.27 | | | | | | | | 12 | | | | | | | | 45 | | | | | | | | 0.25 | | | | | | | | 26.16 | | | | | | | | 2.04 | | | | | | | | 35 | |
| | 11.18 | | | | | | | | 6.88 | | | | | | | | 109 | | | | | | | | 134 | | | | | | | | 0.13 | | | | | | | | 10.37 | | | | | | | | 1.81 | | | | | | | | 37 | |
|
10.61 |
| | | | | | | 6.10 | | | | | | | | 175 | | | | | | | | 133 | | | | | | | | 0.15 | (h) | | | | | | | 49.61 | (h) | | | | | | | 1.17 | (h) | | | | | | | 6 | |
| | | | | | | | | | | | | | | | | | | | | | | | | | | | | | | | | | | | | | | | | | | | | | | | | | | | | | | | | | | |
| | 11.17 | | | | | | | | 4.29 | | | | | | | | 295 | | | | | | | | 71 | | | | | | | | 0.14 | | | | | | | | 16.90 | | | | | | | | 2.21 | | | | | | | | 35 | |
| | 11.19 | | | | | | | | 6.98 | | | | | | | | 37 | | | | | | | | 25 | | | | | | | | 0.07 | | | | | | | | 50.68 | | | | | | | | 2.05 | | | | | | | | 37 | |
|
10.62 |
| | | | | | | 6.20 | | | | | | | | 16 | | | | | | | | 12 | | | | | | | | 0.06 | (h) | | | | | | | 179.75 | (h) | | | | | | | 1.47 | (h) | | | | | | | 6 | |
| | | | | | | | | | | | | | | | | | | | | | | | | | | | | | | | | | | | | | | | | | | | | | | | | | | | | | | | | | | |
| | 11.19 | | | | | | | | 4.55 | | | | | | | | 40,932 | | | | | | | | 35,028 | | | | | | | | 0.00 | (j) | | | | | | | 0.51 | | | | | | | | 2.52 | | | | | | | | 35 | |
| | 11.21 | | | | | | | | 7.13 | | | | | | | | 25,880 | | | | | | | | 20,307 | | | | | | | | 0.00 | (j) | | | | | | | 0.70 | | | | | | | | 2.29 | | | | | | | | 37 | |
|
10.64 |
| | | | | | | 6.40 | | | | | | | | 13,380 | | | | | | | | 2,024 | | | | | | | | 0.00 | (j)(h) | | | | | | | 8.73 | (h) | | | | | | | 1.57 | (h) | | | | | | | 6 | |
| | |
| The footnote legend is at the end of the Financial Highlights. | | See Notes to Financial Statements. |
| | | | |
| Prudential Day One Funds | | | 195 | |
Prudential Day One 2030 Fund
Financial Highlights
| | | | | | | | | | | | | | | | | | | | | | | | | | | | | | | | | | | | | | | | | | | | | | | | | | | | |
| | | Per Share
Operating
Performance(a) | | | | | | Income (Loss) From Investment Operations | | | | | | Less Dividends and Distributions | |
| | | Net
Asset Value,
Beginning of
Period | | | | | | Net
investment
income
(loss) | | | | | | Net
realized
and
unrealized
gain (loss) | | | | | | Total
income
(loss) from
investment
operations | | | | | | Dividends
from net
investment
income | | | | | | Distributions
from net
realized
gains | | | | | | Total
dividends
and
distributions | |
| Class R1 | | | | | | | | | | | | | | | | | | | | | | | | | | | | | | | | | | | | | | | | | | | | | | | | | | | | |
| Year Ended 07/31/19 | | | $11.53 | | | | | | | | $0.18 | | | | | | | | $0.13 | | | | | | | | $0.31 | | | | | | | | $(0.22 | ) | | | | | | | $(0.17 | ) | | | | | | | $(0.39 | ) |
| Year Ended 07/31/18 | | | 10.74 | | | | | | | | 0.14 | | | | | | | | 0.77 | | | | | | | | 0.91 | | | | | | | | (0.12 | ) | | | | | | | (- | )(f) | | | | | | | (0.12 | ) |
December 13, 2016(g)
through July 31, 2017 | | | 10.00 | | | | | | | | 0.04 | | | | | | | | 0.70 | | | | | | | | 0.74 | | | | | | | | - | | | | | | | | - | | | | | | | | - | |
| Class R2 | | | | | | | | | | | | | | | | | | | | | | | | | | | | | | | | | | | | | | | | | | | | | | | | | | | | |
| Year Ended 07/31/19 | | | 11.55 | | | | | | | | 0.21 | | | | | | | | 0.13 | | | | | | | | 0.34 | | | | | | | | (0.25 | ) | | | | | | | (0.17 | ) | | | | | | | (0.42 | ) |
| Year Ended 07/31/18 | | | 10.75 | | | | | | | | 0.11 | | | | | | | | 0.83 | | | | | | | | 0.94 | | | | | | | | (0.14 | ) | | | | | | | (- | )(f) | | | | | | | (0.14 | ) |
December 13, 2016(g)
through July 31, 2017 | | | 10.00 | | | | | | | | 0.06 | | | | | | | | 0.69 | | | | | | | | 0.75 | | | | | | | | - | | | | | | | | - | | | | | | | | - | |
| Class R3 | | | | | | | | | | | | | | | | | | | | | | | | | | | | | | | | | | | | | | | | | | | | | | | | | | | | |
| Year Ended 07/31/19 | | | 11.55 | | | | | | | | 0.21 | | | | | | | | 0.15 | | | | | | | | 0.36 | | | | | | | | (0.27 | ) | | | | | | | (0.17 | ) | | | | | | | (0.44 | ) |
| Year Ended 07/31/18 | | | 10.76 | | | | | | | | 0.21 | | | | | | | | 0.74 | | | | | | | | 0.95 | | | | | | | | (0.16 | ) | | | | | | | (- | )(f) | | | | | | | (0.16 | ) |
December 13, 2016(g)
through July 31, 2017 | | | 10.00 | | | | | | | | 0.07 | | | | | | | | 0.69 | | | | | | | | 0.76 | | | | | | | | - | | | | | | | | - | | | | | | | | - | |
| Class R4 | | | | | | | | | | | | | | | | | | | | | | | | | | | | | | | | | | | | | | | | | | | | | | | | | | | | |
| Year Ended 07/31/19 | | | 11.56 | | | | | | | | 0.29 | | | | | | | | 0.06 | | | | | | | | 0.35 | | | | | | | | (0.28 | ) | | | | | | | (0.17 | ) | | | | | | | (0.45 | ) |
| Year Ended 07/31/18 | | | 10.77 | | | | | | | | 0.20 | | | | | | | | 0.76 | | | | | | | | 0.96 | | | | | | | | (0.17 | ) | | | | | | | (- | )(f) | | | | | | | (0.17 | ) |
December 13, 2016(g)
through July 31, 2017 | | | 10.00 | | | | | | | | 0.05 | | | | | | | | 0.72 | | | | | | | | 0.77 | | | | | | | | - | | | | | | | | - | | | | | | | | - | |
| Class R5 | | | | | | | | | | | | | | | | | | | | | | | | | | | | | | | | | | | | | | | | | | | | | | | | | | | | |
| Year Ended 07/31/19 | | | 11.57 | | | | | | | | 0.25 | | | | | | | | 0.12 | | | | | | | | 0.37 | | | | | | | | (0.29 | ) | | | | | | | (0.17 | ) | | | | | | | (0.46 | ) |
| Year Ended 07/31/18 | | | 10.78 | | | | | | | | 0.15 | | | | | | | | 0.82 | | | | | | | | 0.97 | | | | | | | | (0.18 | ) | | | | | | | (- | )(f) | | | | | | | (0.18 | ) |
December 13, 2016(g)
through July 31, 2017 | | | 10.00 | | | | | | | | 0.08 | | | | | | | | 0.70 | | | | | | | | 0.78 | | | | | | | | - | | | | | | | | - | | | | | | | | - | |
| Class R6 | | | | | | | | | | | | | | | | | | | | | | | | | | | | | | | | | | | | | | | | | | | | | | | | | | | | |
| Year Ended 07/31/19 | | | 11.59 | | | | | | | | 0.25 | | | | | | | | 0.14 | | | | | | | | 0.39 | | | | | | | | (0.31 | ) | | | | | | | (0.17 | ) | | | | | | | (0.48 | ) |
| Year Ended 07/31/18 | | | 10.79 | | | | | | | | 0.22 | | | | | | | | 0.78 | | | | | | | | 1.00 | | | | | | | | (0.20 | ) | | | | | | | (- | )(f) | | | | | | | (0.20 | ) |
December 13, 2016(g)
through July 31, 2017 | | | 10.00 | | | | | | | | 0.08 | | | | | | | | 0.71 | | | | | | | | 0.79 | | | | | | | | - | | | | | | | | - | | | | | | | | - | |
| | |
| The footnote legend is at the end of the Financial Highlights. | | See Notes to Financial Statements. |
| | | | | | | | | | | | | | | | | | | | | | | | | | | | | | | | | | | | | | | | | | | | | | | | | | | | | | | | | | |
| | | | | | | | | | | | | Ratios/Supplemental Data(b)(c) | |
Net asset
value,
end of
period | | | | | | Total
Return(d) | | | | | | Net assets,
end of
period
(000) | | | | | | Average
net assets
(000) | | | | | | Expenses after
waivers and/or
expense
reimbursement | | | | | | Expenses
before waivers
and/or expense
reimbursement | | | | | | Net
investment
income
(loss) | | | | | | Portfolio
turnover
rate(e) | |
| | | | | | | | | | | | | | | | | | | | | | | | | | | | | | | | | | | | | | | | | | | | | | | | | | | | | | | | | | | |
| | $11.45 | | | | | | | | 3.18% | | | | | | | | $33 | | | | | | | | $30 | | | | | | | | 0.74% | | | | | | | | 40.10% | | | | | | | | 1.62% | | | | | | | | 36% | |
| | 11.53 | | | | | | | | 8.47 | | | | | | | | 27 | | | | | | | | 15 | | | | | | | | 0.66 | | | | | | | | 84.71 | | | | | | | | 1.29 | | | | | | | | 36 | |
|
10.74 |
| | | | | | | 7.40 | | | | | | | | 14 | | | | | | | | 10 | | | | | | | | 0.69 | (h) | | | | | | | 195.73 | (h) | | | | | | | 0.68 | (h) | | | | | | | 5 | |
| | | | | | | | | | | | | | | | | | | | | | | | | | | | | | | | | | | | | | | | | | | | | | | | | | | | | | | | | | | |
| | 11.47 | | | | | | | | 3.46 | | | | | | | | 3,404 | | | | | | | | 3,149 | | | | | | | | 0.49 | | | | | | | | 1.40 | | | | | | | | 1.87 | | | | | | | | 36 | |
| | 11.55 | | | | | | | | 8.81 | | | | | | | | 2,637 | | | | | | | | 883 | | | | | | | | 0.47 | | | | | | | | 2.63 | | | | | | | | 0.99 | | | | | | | | 36 | |
|
10.75 |
| | | | | | | 7.50 | | | | | | | | 13 | | | | | | | | 11 | | | | | | | | 0.43 | (h) | | | | | | | 183.27 | (h) | | | | | | | 0.91 | (h) | | | | | | | 5 | |
| | | | | | | | | | | | | | | | | | | | | | | | | | | | | | | | | | | | | | | | | | | | | | | | | | | | | | | | | | | |
| | 11.47 | | | | | | | | 3.63 | | | | | | | | 1,349 | | | | | | | | 1,018 | | | | | | | | 0.34 | | | | | | | | 2.03 | | | | | | | | 1.93 | | | | | | | | 36 | |
| | 11.55 | | | | | | | | 8.86 | | | | | | | | 728 | | | | | | | | 440 | | | | | | | | 0.29 | | | | | | | | 4.05 | | | | | | | | 1.81 | | | | | | | | 36 | |
|
10.76 |
| | | | | | | 7.60 | | | | | | | | 11 | | | | | | | | 10 | | | | | | | | 0.29 | (h) | | | | | | | 198.46 | (h) | | | | | | | 1.09 | (h) | | | | | | | 5 | |
| | | | | | | | | | | | | | | | | | | | | | | | | | | | | | | | | | | | | | | | | | | | | | | | | | | | | | | | | | | |
| | 11.46 | | | | | | | | 3.56 | | | | | | | | 12 | | | | | | | | 483 | | | | | | | | 0.25 | | | | | | | | 3.30 | | | | | | | | 2.58 | | | | | | | | 36 | |
| | 11.56 | | | | | | | | 8.98 | | | | | | | | 1,114 | | | | | | | | 987 | | | | | | | | 0.17 | | | | | | | | 2.43 | | | | | | | | 1.82 | | | | | | | | 36 | |
|
10.77 |
| | | | | | | 7.70 | | | | | | | | 857 | | | | | | | | 507 | | | | | | | | 0.17 | (h) | | | | | | | 20.56 | (h) | | | | | | | 0.80 | (h) | | | | | | | 5 | |
| | | | | | | | | | | | | | | | | | | | | | | | | | | | | | | | | | | | | | | | | | | | | | | | | | | | | | | | | | | |
| | 11.48 | | | | | | | | 3.76 | | | | | | | | 3,012 | | | | | | | | 2,785 | | | | | | | | 0.14 | | | | | | | | 1.10 | | | | | | | | 2.21 | | | | | | | | 36 | |
| | 11.57 | | | | | | | | 9.08 | | | | | | | | 2,728 | | | | | | | | 934 | | | | | | | | 0.12 | | | | | | | | 2.18 | | | | | | | | 1.36 | | | | | | | | 36 | |
|
10.78 |
| | | | | | | 7.80 | | | | | | | | 11 | | | | | | | | 10 | | | | | | | | 0.08 | (h) | | | | | | | 198.14 | (h) | | | | | | | 1.30 | (h) | | | | | | | 5 | |
| | | | | | | | | | | | | | | | | | | | | | | | | | | | | | | | | | | | | | | | | | | | | | | | | | | | | | | | | | | |
| | 11.50 | | | | | | | | 3.93 | | | | | | | | 36,517 | | | | | | | | 29,867 | | | | | | | | 0.00 | (j) | | | | | | | 0.57 | | | | | | | | 2.25 | | | | | | | | 36 | |
| | 11.59 | | | | | | | | 9.33 | | | | | | | | 22,067 | | | | | | | | 15,382 | | | | | | | | 0.00 | (j) | | | | | | | 0.97 | | | | | | | | 1.94 | | | | | | | | 36 | |
|
10.79 |
| | | | | | | 7.90 | | | | | | | | 9,426 | | | | | | | | 1,557 | | | | | | | | 0.00 | (j)(h) | | | | | | | 9.71 | (h) | | | | | | | 1.23 | (h) | | | | | | | 5 | |
| | |
| The footnote legend is at the end of the Financial Highlights. | | See Notes to Financial Statements. |
| | | | |
| Prudential Day One Funds | | | 197 | |
Prudential Day One 2035 Fund
Financial Highlights
| | | | | | | | | | | | | | | | | | | | | | | | | | | | | | | | | | | | | | | | | | | | | | | | | | | | |
| | | Per Share
Operating
Performance(a) | | | | | | Income (Loss) From Investment Operations | | | | | | Less Dividends and Distributions | |
| | | Net
Asset Value,
Beginning of
Period | | | | | | Net
investment
income
(loss) | | | | | | Net
realized
and
unrealized
gain (loss) | | | | | | Total
income
(loss) from
investment
operations | | | | | | Dividends
from net
investment
income | | | | | | Distributions
from net
realized
gains | | | | | | Total
dividends
and
distributions | |
| Class R1 | | | | | | | | | | | | | | | | | | | | | | | | | | | | | | | | | | | | | | | | | | | | | | | | | | | | |
| Year Ended 07/31/19 | | | $11.68 | | | | | | | | $0.12 | | | | | | | | $0.11 | | | | | | | | $0.23 | | | | | | | | $(0.23 | ) | | | | | | | $(0.26 | ) | | | | | | | $(0.49 | ) |
| Year Ended 07/31/18 | | | 10.81 | | | | | | | | 0.12 | | | | | | | | 0.90 | | | | | | | | 1.02 | | | | | | | | (0.15 | ) | | | | | | | (- | )(f) | | | | | | | (0.15 | ) |
December 13, 2016(g)
through July 31, 2017 | | | 10.00 | | | | | | | | 0.04 | | | | | | | | 0.77 | | | | | | | | 0.81 | | | | | | | | - | | | | | | | | - | | | | | | | | - | |
| Class R2 | | | | | | | | | | | | | | | | | | | | | | | | | | | | | | | | | | | | | | | | | | | | | | | | | | | | |
| Year Ended 07/31/19 | | | 11.69 | | | | | | | | 0.18 | | | | | | | | 0.07 | | | | | | | | 0.25 | | | | | | | | (0.25 | ) | | | | | | | (0.26 | ) | | | | | | | (0.51 | ) |
| Year Ended 07/31/18 | | | 10.83 | | | | | | | | 0.08 | | | | | | | | 0.96 | | | | | | | | 1.04 | | | | | | | | (0.18 | ) | | | | | | | (- | )(f) | | | | | | | (0.18 | ) |
December 13, 2016(g)
through July 31, 2017 | | | 10.00 | | | | | | | | 0.05 | | | | | | | | 0.78 | | | | | | | | 0.83 | | | | | | | | - | | | | | | | | - | | | | | | | | - | |
| Class R3 | | | | | | | | | | | | | | | | | | | | | | | | | | | | | | | | | | | | | | | | | | | | | | | | | | | | |
| Year Ended 07/31/19 | | | 11.71 | | | | | | | | 0.20 | | | | | | | | 0.07 | | | | | | | | 0.27 | | | | | | | | (0.27 | ) | | | | | | | (0.26 | ) | | | | | | | (0.53 | ) |
| Year Ended 07/31/18 | | | 10.84 | | | | | | | | 0.17 | | | | | | | | 0.89 | | | | | | | | 1.06 | | | | | | | | (0.19 | ) | | | | | | | (- | )(f) | | | | | | | (0.19 | ) |
December 13, 2016(g)
through July 31, 2017 | | | 10.00 | | | | | | | | 0.04 | | | | | | | | 0.80 | | | | | | | | 0.84 | | | | | | | | - | | | | | | | | - | | | | | | | | - | |
| Class R4 | | | | | | | | | | | | | | | | | | | | | | | | | | | | | | | | | | | | | | | | | | | | | | | | | | | | |
| Year Ended 07/31/19 | | | 11.72 | | | | | | | | 0.31 | | | | | | | | (0.03 | ) | | | | | | | 0.28 | | | | | | | | (0.28 | ) | | | | | | | (0.26 | ) | | | | | | | (0.54 | ) |
| Year Ended 07/31/18 | | | 10.85 | | | | | | | | 0.17 | | | | | | | | 0.90 | | | | | | | | 1.07 | | | | | | | | (0.20 | ) | | | | | | | (- | )(f) | | | | | | | (0.20 | ) |
December 13, 2016(g)
through July 31, 2017 | | | 10.00 | | | | | | | | 0.05 | | | | | | | | 0.80 | | | | | | | | 0.85 | | | | | | | | - | | | | | | | | - | | | | | | | | - | |
| Class R5 | | | | | | | | | | | | | | | | | | | | | | | | | | | | | | | | | | | | | | | | | | | | | | | | | | | | |
| Year Ended 07/31/19 | | | 11.72 | | | | | | | | 0.24 | | | | | | | | 0.05 | | | | | | | | 0.29 | | | | | | | | (0.30 | ) | | | | | | | (0.26 | ) | | | | | | | (0.56 | ) |
| Year Ended 07/31/18 | | | 10.85 | | | | | | | | 0.18 | | | | | | | | 0.91 | | | | | | | | 1.09 | | | | | | | | (0.22 | ) | | | | | | | (- | )(f) | | | | | | | (0.22 | ) |
December 13, 2016(g)
through July 31, 2017 | | | 10.00 | | | | | | | | 0.08 | | | | | | | | 0.77 | | | | | | | | 0.85 | | | | | | | | - | | | | | | | | - | | | | | | | | - | |
| Class R6 | | | | | | | | | | | | | | | | | | | | | | | | | | | | | | | | | | | | | | | | | | | | | | | | | | | | |
| Year Ended 07/31/19 | | | 11.74 | | | | | | | | 0.24 | | | | | | | | 0.05 | | | | | | | | 0.29 | | | | | | | | (0.31 | ) | | | | | | | (0.26 | ) | | | | | | | (0.57 | ) |
| Year Ended 07/31/18 | | | 10.87 | | | | | | | | 0.22 | | | | | | | | 0.88 | | | | | | | | 1.10 | | | | | | | | (0.23 | ) | | | | | | | (- | )(f) | | | | | | | (0.23 | ) |
December 13, 2016(g)
through July 31, 2017 | | | 10.00 | | | | | | | | 0.07 | | | | | | | | 0.80 | | | | | | | | 0.87 | | | | | | | | - | | | | | | | | - | | | | | | | | - | |
| | |
| The footnote legend is at the end of the Financial Highlights. | | See Notes to Financial Statements. |
| | | | | | | | | | | | | | | | | | | | | | | | | | | | | | | | | | | | | | | | | | | | | | | | | | | | | | | | | | |
| | | | | | | | | | | | | Ratios/Supplemental Data(b)(c) | |
Net asset
value,
end of
period | | | | | | Total
Return(d) | | | | | | Net assets,
end of
period
(000) | | | | | | Average
net assets
(000) | | | | | | Expenses after
waivers and/or
expense
reimbursement | | | | | | Expenses
before waivers
and/or expense
reimbursement | | | | | | Net
investment
income
(loss) | | | | | | Portfolio
turnover
rate(e) | |
| | | | | | | | | | | | | | | | | | | | | | | | | | | | | | | | | | | | | | | | | | | | | | | | | | | | | | | | | | | |
| | $11.42 | | | | | | | | 2.55% | | | | | | | | $24 | | | | | | | | $17 | | | | | | | | 0.72% | | | | | | | | 70.38% | | | | | | | | 1.03% | | | | | | | | 35% | |
| | 11.68 | | | | | | | | 9.46 | | | | | | | | 12 | | | | | | | | 12 | | | | | | | | 0.63 | | | | | | | | 106.90 | | | | | | | | 1.04 | | | | | | | | 28 | |
|
10.81 |
| | | | | | | 8.10 | | | | | | | | 13 | | | | | | | | 10 | | | | | | | | 0.65 | (h) | | | | | | | 250.51 | (h) | | | | | | | 0.58 | (h) | | | | | | | 13 | |
| | | | | | | | | | | | | | | | | | | | | | | | | | | | | | | | | | | | | | | | | | | | | | | | | | | | | | | | | | | |
| | 11.43 | | | | | | | | 2.84 | | | | | | | | 353 | | | | | | | | 340 | | | | | | | | 0.47 | | | | | | | | 4.85 | | | | | | | | 1.60 | | | | | | | | 35 | |
| | 11.69 | | | | | | | | 9.62 | | | | | | | | 352 | | | | | | | | 77 | | | | | | | | 0.44 | | | | | | | | 17.83 | | | | | | | | 0.70 | | | | | | | | 28 | |
|
10.83 |
| | | | | | | 8.30 | | | | | | | | 11 | | | | | | | | 10 | | | | | | | | 0.40 | (h) | | | | | | | 246.60 | (h) | | | | | | | 0.84 | (h) | | | | | | | 13 | |
| | | | | | | | | | | | | | | | | | | | | | | | | | | | | | | | | | | | | | | | | | | | | | | | | | | | | | | | | | | |
| | 11.45 | | | | | | | | 3.01 | | | | | | | | 6,271 | | | | | | | | 5,850 | | | | | | | | 0.32 | | | | | | | | 1.31 | | | | | | | | 1.83 | | | | | | | | 35 | |
| | 11.71 | | | | | | | | 9.85 | | | | | | | | 5,849 | | | | | | | | 4,950 | | | | | | | | 0.24 | | | | | | | | 1.58 | | | | | | | | 1.46 | | | | | | | | 28 | |
|
10.84 |
| | | | | | | 8.40 | | | | | | | | 4,044 | | | | | | | | 80 | | | | | | | | 0.08 | (h) | | | | | | | 40.80 | (h) | | | | | | | 0.59 | (h) | | | | | | | 13 | |
| | | | | | | | | | | | | | | | | | | | | | | | | | | | | | | | | | | | | | | | | | | | | | | | | | | | | | | | | | | |
| | 11.46 | | | | | | | | 3.12 | | | | | | | | 12 | | | | | | | | 28 | | | | | | | | 0.21 | | | | | | | | 41.69 | | | | | | | | 2.78 | | | | | | | | 35 | |
| | 11.72 | | | | | | | | 9.96 | | | | | | | | 50 | | | | | | | | 48 | | | | | | | | 0.13 | | | | | | | | 27.89 | | | | | | | | 1.48 | | | | | | | | 28 | |
|
10.85 |
| | | | | | | 8.50 | | | | | | | | 57 | | | | | | | | 37 | | | | | | | | 0.14 | (h) | | | | | | | 122.15 | (h) | | | | | | | 0.73 | (h) | | | | | | | 13 | |
| | | | | | | | | | | | | | | | | | | | | | | | | | | | | | | | | | | | | | | | | | | | | | | | | | | | | | | | | | | |
| | 11.45 | | | | | | | | 3.15 | | | | | | | | 95 | | | | | | | | 69 | | | | | | | | 0.12 | | | | | | | | 17.68 | | | | | | | | 2.16 | | | | | | | | 35 | |
| | 11.72 | | | | | | | | 10.07 | | | | | | | | 33 | | | | | | | | 15 | | | | | | | | 0.04 | | | | | | | | 87.88 | | | | | | | | 1.54 | | | | | | | | 28 | |
|
10.85 |
| | | | | | | 8.50 | | | | | | | | 11 | | | | | | | | 10 | | | | | | | | 0.05 | (h) | | | | | | | 246.10 | (h) | | | | | | | 1.19 | (h) | | | | | | | 13 | |
| | | | | | | | | | | | | | | | | | | | | | | | | | | | | | | | | | | | | | | | | | | | | | | | | | | | | | | | | | | |
| | 11.46 | | | | | | | | 3.23 | | | | | | | | 24,312 | | | | | | | | 20,031 | | | | | | | | 0.00 | (j) | | | | | | | 0.81 | | | | | | | | 2.14 | | | | | | | | 35 | |
| | 11.74 | | | | | | | | 10.21 | | | | | | | | 15,099 | | | | | | | | 11,332 | | | | | | | | 0.00 | (j) | | | | | | | 1.10 | | | | | | | | 1.88 | | | | | | | | 28 | |
|
10.87 |
| | | | | | | 8.70 | | | | | | | | 6,889 | | | | | | | | 1,284 | | | | | | | | 0.00 | (j)(h) | | | | | | | 14.16 | (h) | | | | | | | 1.03 | (h) | | | | | | | 13 | |
| | |
| The footnote legend is at the end of the Financial Highlights. | | See Notes to Financial Statements. |
| | | | |
| Prudential Day One Funds | | | 199 | |
Prudential Day One 2040 Fund
Financial Highlights
| | | | | | | | | | | | | | | | | | | | | | | | | | | | | | | | | | | | | | | | | | | | | | | | | | | | |
| | | Per Share
Operating
Performance(a) | | | | | | Income (Loss) From Investment Operations | | | | | | Less Dividends and Distributions | |
| | | Net
Asset Value,
Beginning of
Period | | | | | | Net
investment
income
(loss) | | | | | | Net
realized
and
unrealized
gain (loss) | | | | | | Total
income
(loss) from
investment
operations | | | | | | Dividends
from net
investment
income | | | | | | Distributions
from net
realized
gains | | | | | | Total
dividends
and
distributions | |
| Class R1 | | | | | | | | | | | | | | | | | | | | | | | | | | | | | | | | | | | | | | | | | | | | | | | | | | | | |
| Year Ended 07/31/19 | | | $11.83 | | | | | | | | $0.15 | | | | | | | | $0.05 | | | | | | | | $0.20 | | | | | | | | $(0.24 | ) | | | | | | | $(0.18 | ) | | | | | | | $(0.42 | ) |
| Year Ended 07/31/18 | | | 10.90 | | | | | | | | 0.12 | | | | | | | | 0.98 | | | | | | | | 1.10 | | | | | | | | (0.16 | ) | | | | | | | (0.01 | ) | | | | | | | (0.17 | ) |
December 13, 2016(g)
through July 31, 2017 | | | 10.00 | | | | | | | | 0.03 | | | | | | | | 0.87 | | | | | | | | 0.90 | | | | | | | | - | | | | | | | | - | | | | | | | | - | |
| Class R2 | | | | | | | | | | | | | | | | | | | | | | | | | | | | | | | | | | | | | | | | | | | | | | | | | | | | |
| Year Ended 07/31/19 | | | 11.84 | | | | | | | | 0.17 | | | | | | | | 0.07 | | | | | | | | 0.24 | | | | | | | | (0.27 | ) | | | | | | | (0.18 | ) | | | | | | | (0.45 | ) |
| Year Ended 07/31/18 | | | 10.92 | | | | | | | | 0.05 | | | | | | | | 1.07 | | | | | | | | 1.12 | | | | | | | | (0.19 | ) | | | | | | | (0.01 | ) | | | | | | | (0.20 | ) |
December 13, 2016(g)
through July 31, 2017 | | | 10.00 | | | | | | | | 0.05 | | | | | | | | 0.87 | | | | | | | | 0.92 | | | | | | | | - | | | | | | | | - | | | | | | | | - | |
| Class R3 | | | | | | | | | | | | | | | | | | | | | | | | | | | | | | | | | | | | | | | | | | | | | | | | | | | | |
| Year Ended 07/31/19 | | | 11.86 | | | | | | | | 0.16 | | | | | | | | 0.09 | | | | | | | | 0.25 | | | | | | | | (0.29 | ) | | | | | | | (0.18 | ) | | | | | | | (0.47 | ) |
| Year Ended 07/31/18 | | | 10.93 | | | | | | | | 0.16 | | | | | | | | 0.98 | | | | | | | | 1.14 | | | | | | | | (0.20 | ) | | | | | | | (0.01 | ) | | | | | | | (0.21 | ) |
December 13, 2016(g)
through July 31, 2017 | | | 10.00 | | | | | | | | 0.06 | | | | | | | | 0.87 | | | | | | | | 0.93 | | | | | | | | - | | | | | | | | - | | | | | | | | - | |
| Class R4 | | | | | | | | | | | | | | | | | | | | | | | | | | | | | | | | | | | | | | | | | | | | | | | | | | | | |
| Year Ended 07/31/19 | | | 11.87 | | | | | | | | 0.25 | | | | | | | | 0.01 | | | | | | | | 0.26 | �� | | | | | | | (0.30 | ) | | | | | | | (0.18 | ) | | | | | | | (0.48 | ) |
| Year Ended 07/31/18 | | | 10.94 | | | | | | | | 0.18 | | | | | | | | 0.97 | | | | | | | | 1.15 | | | | | | | | (0.21 | ) | | | | | | | (0.01 | ) | | | | | | | (0.22 | ) |
December 13, 2016(g)
through July 31, 2017 | | | 10.00 | | | | | | | | 0.03 | | | | | | | | 0.91 | | | | | | | | 0.94 | | | | | | | | - | | | | | | | | - | | | | | | | | - | |
| Class R5 | | | | | | | | | | | | | | | | | | | | | | | | | | | | | | | | | | | | | | | | | | | | | | | | | | | | |
| Year Ended 07/31/19 | | | 11.88 | | | | | | | | 0.22 | | | | | | | | 0.04 | | | | | | | | 0.26 | | | | | | | | (0.31 | ) | | | | | | | (0.18 | ) | | | | | | | (0.49 | ) |
| Year Ended 07/31/18 | | | 10.95 | | | | | | | | 0.08 | | | | | | | | 1.09 | | | | | | | | 1.17 | | | | | | | | (0.23 | ) | | | | | | | (0.01 | ) | | | | | | | (0.24 | ) |
December 13, 2016(g)
through July 31, 2017 | | | 10.00 | | | | | | | | 0.07 | | | | | | | | 0.88 | | | | | | | | 0.95 | | | | | | | | - | | | | | | | | - | | | | | | | | - | |
| Class R6 | | | | | | | | | | | | | | | | | | | | | | | | | | | | | | | | | | | | | | | | | | | | | | | | | | | | |
| Year Ended 07/31/19 | | | 11.89 | | | | | | | | 0.23 | | | | | | | | 0.05 | | | | | | | | 0.28 | | | | | | | | (0.33 | ) | | | | | | | (0.18 | ) | | | | | | | (0.51 | ) |
| Year Ended 07/31/18 | | | 10.96 | | | | | | | | 0.20 | | | | | | | | 0.98 | | | | | | | | 1.18 | | | | | | | | (0.24 | ) | | | | | | | (0.01 | ) | | | | | | | (0.25 | ) |
December 13, 2016(g)
through July 31, 2017 | | | 10.00 | | | | | | | | 0.06 | | | | | | | | 0.90 | | | | | | | | 0.96 | | | | | | | | - | | | | | | | | - | | | | | | | | - | |
| | |
| The footnote legend is at the end of the Financial Highlights. | | See Notes to Financial Statements. |
| | | | | | | | | | | | | | | | | | | | | | | | | | | | | | | | | | | | | | | | | | | | | | | | | | | | | | | | | | |
| | | | | | | | | | | | | Ratios/Supplemental Data(b)(c) | |
Net asset
value,
end of
period | | | | | | Total
Return(d) | | | | | | Net assets,
end of
period
(000) | | | | | | Average
net assets
(000) | | | | | | Expenses after
waivers and/or
expense
reimbursement | | | | | | Expenses
before waivers
and/or expense
reimbursement | | | | | | Net
investment
income
(loss) | | | | | | Portfolio
turnover
rate(e) | |
| | | | | | | | | | | | | | | | | | | | | | | | | | | | | | | | | | | | | | | | | | | | | | | | | | | | | | | | | | | |
| | $11.61 | | | | | | | | 2.28% | | | | | | | | $16 | | | | | | | | $14 | | | | | | | | 0.70% | | | | | | | | 83.37% | | | | | | | | 1.31% | | | | | | | | 26% | |
| | 11.83 | | | | | | | | 10.11 | | | | | | | | 13 | | | | | | | | 12 | | | | | | | | 0.63 | | | | | | | | 110.40 | | | | | | | | 1.04 | | | | | | | | 27 | |
|
10.90 |
| | | | | | | 9.00 | | | | | | | | 11 | | | | | | | | 10 | | | | | | | | 0.64 | (h) | | | | | | | 226.80 | (h) | | | | | | | 0.46 | (h) | | | | | | | 27 | |
| | | | | | | | | | | | | | | | | | | | | | | | | | | | | | | | | | | | | | | | | | | | | | | | | | | | | | | | | | | |
| | 11.63 | | | | | | | | 2.65 | | | | | | | | 2,424 | | | | | | | | 1,689 | | | | | | | | 0.45 | | | | | | | | 2.02 | | | | | | | | 1.50 | | | | | | | | 26 | |
| | 11.84 | | | | | | | | 10.26 | | | | | | | | 1,157 | | | | | | | | 299 | | | | | | | | 0.43 | | | | | | | | 5.77 | | | | | | | | 0.43 | | | | | | | | 27 | |
|
10.92 |
| | | | | | | 9.20 | | | | | | | | 12 | | | | | | | | 11 | | | | | | | | 0.39 | (h) | | | | | | | 219.37 | (h) | | | | | | | 0.69 | (h) | | | | | | | 27 | |
| | | | | | | | | | | | | | | | | | | | | | | | | | | | | | | | | | | | | | | | | | | | | | | | | | | | | | | | | | | |
| | 11.64 | | | | | | | | 2.73 | | | | | | | | 1,491 | | | | | | | | 915 | | | | | | | | 0.30 | | | | | | | | 2.43 | | | | | | | | 1.42 | | | | | | | | 26 | |
| | 11.86 | | | | | | | | 10.49 | | | | | | | | 550 | | | | | | | | 281 | | | | | | | | 0.26 | | | | | | | | 6.12 | | | | | | | | 1.34 | | | | | | | | 27 | |
|
10.93 |
| | | | | | | 9.30 | | | | | | | | 11 | | | | | | | | 10 | | | | | | | | 0.24 | (h) | | | | | | | 226.24 | (h) | | | | | | | 0.86 | (h) | | | | | | | 27 | |
| | | | | | | | | | | | | | | | | | | | | | | | | | | | | | | | | | | | | | | | | | | | | | | | | | | | | | | | | | | |
| | 11.65 | | | | | | | | 2.84 | | | | | | | | 12 | | | | | | | | 35 | | | | | | | | 0.20 | | | | | | | | 33.44 | | | | | | | | 2.14 | | | | | | | | 26 | |
| | 11.87 | | | | | | | | 10.60 | | | | | | | | 61 | | | | | | | | 124 | | | | | | | | 0.13 | | | | | | | | 11.98 | | | | | | | | 1.58 | | | | | | | | 27 | |
|
10.94 |
| | | | | | | 9.40 | | | | | | | | 115 | | | | | | | | 71 | | | | | | | | 0.13 | (h) | | | | | | | 81.65 | (h) | | | | | | | 0.52 | (h) | | | | | | | 27 | |
| | | | | | | | | | | | | | | | | | | | | | | | | | | | | | | | | | | | | | | | | | | | | | | | | | | | | | | | | | | |
| | 11.65 | | | | | | | | 2.87 | | | | | | | | 6,056 | | | | | | | | 5,822 | | | | | | | | 0.10 | | | | | | | | 1.18 | | | | | | | | 1.94 | | | | | | | | 26 | |
| | 11.88 | | | | | | | | 10.71 | | | | | | | | 6,070 | | | | | | | | 1,981 | | | | | | | | 0.09 | | | | | | | | 1.75 | | | | | | | | 0.72 | | | | | | | | 27 | |
|
10.95 |
| | | | | | | 9.50 | | | | | | | | 11 | | | | | | | | 10 | | | | | | | | 0.03 | (h) | | | | | | | 225.96 | (h) | | | | | | | 1.07 | (h) | | | | | | | 27 | |
| | | | | | | | | | | | | | | | | | | | | | | | | | | | | | | | | | | | | | | | | | | | | | | | | | | | | | | | | | | |
| | 11.66 | | | | | | | | 3.13 | | | | | | | | 17,752 | | | | | | | | 15,067 | | | | | | | | 0.00 | (j) | | | | | | | 0.91 | | | | | | | | 2.01 | | | | | | | | 26 | |
| | 11.89 | | | | | | | | 10.86 | | | | | | | | 12,643 | | | | | | | | 9,501 | | | | | | | | 0.00 | (j) | | | | | | | 1.52 | | | | | | | | 1.75 | | | | | | | | 27 | |
|
10.96 |
| | | | | | | 9.60 | | | | | | | | 5,693 | | | | | | | | 1,375 | | | | | | | | 0.00 | (j)(h) | | | | | | | 13.42 | (h) | | | | | | | 0.85 | (h) | | | | | | | 27 | |
| | |
| The footnote legend is at the end of the Financial Highlights. | | See Notes to Financial Statements. |
| | | | |
| Prudential Day One Funds | | | 201 | |
Prudential Day One 2045 Fund
Financial Highlights
| | | | | | | | | | | | | | | | | | | | | | | | | | | | | | | | | | | | | | | | | | | | | | | | | | | | |
| | | Per Share
Operating
Performance(a) | | | | | | Income (Loss) From Investment Operations | | | | | | Less Dividends and Distributions | |
| | | Net
Asset Value,
Beginning of
Period | | | | | | Net
investment
income
(loss) | | | | | | Net
realized
and
unrealized
gain (loss) | | | | | | Total
income
(loss) from
investment
operations | | | | | | Dividends
from net
investment
income | | | | | | Distributions
from net
realized
gains | | | | | | Total
dividends
and
distributions | |
| Class R1 | | | | | | | | | | | | | | | | | | | | | | | | | | | | | | | | | | | | | | | | | | | | | | | | | | | | |
| Year Ended 07/31/19 | | | $11.91 | | | | | | | | $0.14 | | | | | | | | $(0.04 | ) | | | | | | | $0.10 | | | | | | | | $(0.24 | ) | | | | | | | $(0.30 | ) | | | | | | | $(0.54 | ) |
| Year Ended 07/31/18 | | | 10.97 | | | | | | | | 0.11 | | | | | | | | 1.02 | | | | | | | | 1.13 | | | | | | | | (0.18 | ) | | | | | | | (0.01 | ) | | | | | | | (0.19 | ) |
December 13, 2016(g)
through July 31, 2017 | | | 10.00 | | | | | | | | 0.03 | | | | | | | | 0.94 | | | | | | | | 0.97 | | | | | | | | - | | | | | | | | - | | | | | | | | - | |
| Class R2 | | | | | | | | | | | | | | | | | | | | | | | | | | | | | | | | | | | | | | | | | | | | | | | | | | | | |
| Year Ended 07/31/19 | | | 11.94 | | | | | | | | 0.09 | | | | | | | | 0.03 | | | | | | | | 0.12 | | | | | | | | (0.27 | ) | | | | | | | (0.30 | ) | | | | | | | (0.57 | ) |
| Year Ended 07/31/18 | | | 10.98 | | | | | | | | 0.13 | | | | | | | | 1.04 | | | | | | | | 1.17 | | | | | | | | (0.20 | ) | | | | | | | (0.01 | ) | | | | | | | (0.21 | ) |
December 13, 2016(g)
through July 31, 2017 | | | 10.00 | | | | | | | | 0.04 | | | | | | | | 0.94 | | | | | | | | 0.98 | | | | | | | | - | | | | | | | | - | | | | | | | | - | |
| Class R3 | | | | | | | | | | | | | | | | | | | | | | | | | | | | | | | | | | | | | | | | | | | | | | | | | | | | |
| Year Ended 07/31/19 | | | 11.94 | | | | | | | | 0.18 | | | | | | | | (0.03 | ) | | | | | | | 0.15 | | | | | | | | (0.29 | ) | | | | | | | (0.30 | ) | | | | | | | (0.59 | ) |
| Year Ended 07/31/18 | | | 10.99 | | | | | | | | 0.15 | | | | | | | | 1.03 | | | | | | | | 1.18 | | | | | | | | (0.22 | ) | | | | | | | (0.01 | ) | | | | | | | (0.23 | ) |
December 13, 2016(g)
through July 31, 2017 | | | 10.00 | | | | | | | | 0.03 | | | | | | | | 0.96 | | | | | | | | 0.99 | | | | | | | | - | | | | | | | | - | | | | | | | | - | |
| Class R4 | | | | | | | | | | | | | | | | | | | | | | | | | | | | | | | | | | | | | | | | | | | | | | | | | | | | |
| Year Ended 07/31/19 | | | 11.95 | | | | | | | | 0.23 | | | | | | | | (0.08 | ) | | | | | | | 0.15 | | | | | | | | (0.30 | ) | | | | | | | (0.30 | ) | | | | | | | (0.60 | ) |
| Year Ended 07/31/18 | | | 11.00 | | | | | | | | 0.24 | | | | | | | | 0.95 | | | | | | | | 1.19 | | | | | | | | (0.23 | ) | | | | | | | (0.01 | ) | | | | | | | (0.24 | ) |
December 13, 2016(g)
through July 31, 2017 | | | 10.00 | | | | | | | | 0.03 | | | | | | | | 0.97 | | | | | | | | 1.00 | | | | | | | | - | | | | | | | | - | | | | | | | | - | |
| Class R5 | | | | | | | | | | | | | | | | | | | | | | | | | | | | | | | | | | | | | | | | | | | | | | | | | | | | |
| Year Ended 07/31/19 | | | 11.96 | | | | | | | | 0.18 | | | | | | | | (0.02 | ) | | | | | | | 0.16 | | | | | | | | (0.31 | ) | | | | | | | (0.30 | ) | | | | | | | (0.61 | ) |
| Year Ended 07/31/18 | | | 11.01 | | | | | | | | 0.14 | | | | | | | | 1.06 | | | | | | | | 1.20 | | | | | | | | (0.24 | ) | | | | | | | (0.01 | ) | | | | | | | (0.25 | ) |
December 13, 2016(g)
through July 31, 2017 | | | 10.00 | | | | | | | | 0.07 | | | | | | | | 0.94 | | | | | | | | 1.01 | | | | | | | | - | | | | | | | | - | | | | | | | | - | |
| Class R6 | | | | | | | | | | | | | | | | | | | | | | | | | | | | | | | | | | | | | | | | | | | | | | | | | | | | |
| Year Ended 07/31/19 | | | 11.99 | | | | | | | | 0.22 | | | | | | | | (0.05 | ) | | | | | | | 0.17 | | | | | | | | (0.33 | ) | | | | | | | (0.30 | ) | | | | | | | (0.63 | ) |
| Year Ended 07/31/18 | | | 11.03 | | | | | | | | 0.19 | | | | | | | | 1.04 | | | | | | | | 1.23 | | | | | | | | (0.26 | ) | | | | | | | (0.01 | ) | | | | | | | (0.27 | ) |
December 13, 2016(g)
through July 31, 2017 | | | 10.00 | | | | | | | | 0.05 | | | | | | | | 0.98 | | | | | | | | 1.03 | | | | | | | | - | | | | | | | | - | | | | | | | | - | |
| | |
| The footnote legend is at the end of the Financial Highlights. | | See Notes to Financial Statements. |
| | | | | | | | | | | | | | | | | | | | | | | | | | | | | | | | | | | | | | | | | | | | | | | | | | | | | | | | | | |
| | | | | | | | | | | | | Ratios/Supplemental Data(b)(c) | |
Net asset
value,
end of
period | | | | | | Total
Return(d) | | | | | | Net assets,
end of
period
(000) | | | | | | Average
net assets
(000) | | | | | | Expenses after
waivers and/or
expense
reimbursement | | | | | | Expenses
before waivers
and/or expense
reimbursement | | | | | | Net
investment
income
(loss) | | | | | | Portfolio
turnover
rate(e) | |
| | | | | | | | | | | | | | | | | | | | | | | | | | | | | | | | | | | | | | | | | | | | | | | | | | | | | | | | | | | |
| | $11.47 | | | | | | | | 1.78% | | | | | | | | $13 | | | | | | | | $12 | | | | | | | | 0.69% | | | | | | | | 96.93% | | | | | | | | 1.26% | | | | | | | | 31% | |
| | 11.91 | | | | | | | | 10.31 | | | | | | | | 12 | | | | | | | | 12 | | | | | | | | 0.62 | | | | | | | | 110.92 | | | | | | | | 0.96 | | | | | | | | 33 | |
|
10.97 |
| | | | | | | 9.70 | | | | | | | | 11 | | | | | | | | 10 | | | | | | | | 0.64 | (h) | | | | | | | 218.87 | (h) | | | | | | | 0.39 | (h) | | | | | | | 21 | |
| | | | | | | | | | | | | | | | | | | | | | | | | | | | | | | | | | | | | | | | | | | | | | | | | | | | | | | | | | | |
| | 11.49 | | | | | | | | 1.99 | | | | | | | | 98 | | | | | | | | 58 | | | | | | | | 0.44 | | | | | | | | 21.72 | | | | | | | | 0.78 | | | | | | | | 31 | |
| | 11.94 | | | | | | | | 10.75 | | | | | | | | 27 | | | | | | | | 17 | | | | | | | | 0.38 | | | | | | | | 78.26 | | | | | | | | 1.09 | | | | | | | | 33 | |
|
10.98 |
| | | | | | | 9.80 | | | | | | | | 12 | | | | | | | | 11 | | | | | | | | 0.39 | (h) | | | | | | | 216.07 | (h) | | | | | | | 0.63 | (h) | | | | | | | 21 | |
| | | | | | | | | | | | | | | | | | | | | | | | | | | | | | | | | | | | | | | | | | | | | | | | | | | | | | | | | | | |
| | 11.50 | | | | | | | | 2.26 | | | | | | | | 7,639 | | | | | | | | 6,657 | | | | | | | | 0.29 | | | | | | | | 1.80 | | | | | | | | 1.58 | | | | | | | | 31 | |
| | 11.94 | | | | | | | | 10.79 | | | | | | | | 5,927 | | | | | | | | 4,901 | | | | | | | | 0.22 | | | | | | | | 2.11 | | | | | | | | 1.33 | | | | | | | | 33 | |
|
10.99 |
| | | | | | | 9.90 | | | | | | | | 3,812 | | | | | | | | 76 | | | | | | | | 0.09 | (h) | | | | | | | 42.49 | (h) | | | | | | | 0.38 | (h) | | | | | | | 21 | |
| | | | | | | | | | | | | | | | | | | | | | | | | | | | | | | | | | | | | | | | | | | | | | | | | | | | | | | | | | | |
| | 11.50 | | | | | | | | 2.29 | | | | | | | | 31 | | | | | | | | 217 | | | | | | | | 0.20 | | | | | | | | 6.89 | | | | | | | | 2.01 | | | | | | | | 31 | |
| | 11.95 | | | | | | | | 10.90 | | | | | | | | 458 | | | | | | | | 361 | | | | | | | | 0.13 | | | | | | | | 5.30 | | | | | | | | 2.04 | | | | | | | | 33 | |
|
11.00 |
| | | | | | | 10.00 | | | | | | | | 247 | | | | | | | | 142 | | | | | | | | 0.12 | (h) | | | | | | | 59.08 | (h) | | | | | | | 0.38 | (h) | | | | | | | 21 | |
| | | | | | | | | | | | | | | | | | | | | | | | | | | | | | | | | | | | | | | | | | | | | | | | | | | | | | | | | | | |
| | 11.51 | | | | | | | | 2.41 | | | | | | | | 174 | | | | | | | | 101 | | | | | | | | 0.09 | | | | | | | | 12.95 | | | | | | | | 1.62 | | | | | | | | 31 | |
| | 11.96 | | | | | | | | 11.00 | | | | | | | | 51 | | | | | | | | 19 | | | | | | | | 0.04 | | | | | | | | 67.28 | | | | | | | | 1.24 | | | | | | | | 33 | |
|
11.01 |
| | | | | | | 10.10 | | | | | | | | 12 | | | | | | | | 11 | | | | | | | | 0.04 | (h) | | | | | | | 216.62 | (h) | | | | | | | 0.99 | (h) | | | | | | | 21 | |
| | | | | | | | | | | | | | | | | | | | | | | | | | | | | | | | | | | | | | | | | | | | | | | | | | | | | | | | | | | |
| | 11.53 | | | | | | | | 2.50 | | | | | | | | 9,601 | | | | | | | | 8,229 | | | | | | | | 0.00 | (j) | | | | | | | 1.43 | | | | | | | | 1.99 | | | | | | | | 31 | |
| | 11.99 | | | | | | | | 11.24 | | | | | | | | 7,129 | | | | | | | | 5,157 | | | | | | | | 0.00 | (j) | | | | | | | 1.77 | | | | | | | | 1.63 | | | | | | | | 33 | |
|
11.03 |
| | | | | | | 10.30 | | | | | | | | 3,451 | | | | | | | | 665 | | | | | | | | 0.00 | (j)(h) | | | | | | | 22.86 | (h) | | | | | | | 0.80 | (h) | | | | | | | 21 | |
| | |
| The footnote legend is at the end of the Financial Highlights. | | See Notes to Financial Statements. |
| | | | |
| Prudential Day One Funds | | | 203 | |
Prudential Day One 2050 Fund
Financial Highlights
| | | | | | | | | | | | | | | | | | | | | | | | | | | | | | | | | | | | | | | | | | | | | | | | | | | | |
| | | Per Share
Operating
Performance(a) | | | | | | Income (Loss) From Investment Operations | | | | | | Less Dividends and Distributions | |
| | | Net
Asset Value,
Beginning of
Period | | | | | | Net
investment
income
(loss) | | | | | | Net
realized
and
unrealized
gain (loss) | | | | | | Total
income
(loss) from
investment
operations | | | | | | Dividends
from net
investment
income | | | | | | Distributions
from net
realized
gains | | | | | | Total
dividends
and
distributions | |
| Class R1 | | | | | | | | | | | | | | | | | | | | | | | | | | | | | | | | | | | | | | | | | | | | | | | | | | | | |
| Year Ended 07/31/19 | | | $11.92 | | | | | | | | $0.13 | | | | | | | | $(0.02 | ) | | | | | | | $0.11 | | | | | | | | $(0.25 | ) | | | | | | | $(0.19 | ) | | | | | | | $(0.44 | ) |
| Year Ended 07/31/18 | | | 10.95 | | | | | | | | 0.11 | | | | | | | | 1.05 | | | | | | | | 1.16 | | | | | | | | (0.18 | ) | | | | | | | (0.01 | ) | | | | | | | (0.19 | ) |
December 13, 2016(g)
through July 31, 2017 | | | 10.00 | | | | | | | | 0.01 | | | | | | | | 0.94 | | | | | | | | 0.95 | | | | | | | | - | | | | | | | | - | | | | | | | | - | |
| Class R2 | | | | | | | | | | | | | | | | | | | | | | | | | | | | | | | | | | | | | | | | | | | | | | | | | | | | |
| Year Ended 07/31/19 | | | 11.93 | | | | | | | | 0.15 | | | | | | | | (0.03 | ) | | | | | | | 0.12 | | | | | | | | (0.27 | ) | | | | | | | (0.19 | ) | | | | | | | (0.46 | ) |
| Year Ended 07/31/18 | | | 10.96 | | | | | | | | 0.03 | | | | | | | | 1.16 | | | | | | | | 1.19 | | | | | | | | (0.21 | ) | | | | | | | (0.01 | ) | | | | | | | (0.22 | ) |
December 13, 2016(g)
through July 31, 2017 | | | 10.00 | | | | | | | | 0.04 | | | | | | | | 0.92 | | | | | | | | 0.96 | | | | | | | | - | | | | | | | | - | | | | | | | | - | |
| Class R3 | | | | | | | | | | | | | | | | | | | | | | | | | | | | | | | | | | | | | | | | | | | | | | | | | | | | |
| Year Ended 07/31/19 | | | 11.95 | | | | | | | | 0.14 | | | | | | | | - | (i) | | | | | | | 0.14 | | | | | | | | (0.29 | ) | | | | | | | (0.19 | ) | | | | | | | (0.48 | ) |
| Year Ended 07/31/18 | | | 10.97 | | | | | | | | 0.12 | | | | | | | | 1.10 | | | | | | | | 1.22 | | | | | | | | (0.23 | ) | | | | | | | (0.01 | ) | | | | | | | (0.24 | ) |
December 13, 2016(g)
through July 31, 2017 | | | 10.00 | | | | | | | | 0.05 | | | | | | | | 0.92 | | | | | | | | 0.97 | | | | | | | | - | | | | | | | | - | | | | | | | | - | |
| Class R4 | | | | | | | | | | | | | | | | | | | | | | | | | | | | | | | | | | | | | | | | | | | | | | | | | | | | |
| Year Ended 07/31/19 | | | 11.95 | | | | | | | | 1.53 | | | | | | | | (1.40 | ) | | | | | | | 0.13 | | | | | | | | (0.30 | ) | | | | | | | (0.19 | ) | | | | | | | (0.49 | ) |
| Year Ended 07/31/18 | | | 10.98 | | | | | | | | 0.14 | | | | | | | | 1.08 | | | | | | | | 1.22 | | | | | | | | (0.24 | ) | | | | | | | (0.01 | ) | | | | | | | (0.25 | ) |
December 13, 2016(g)
through July 31, 2017 | | | 10.00 | | | | | | | | 0.03 | | | | | | | | 0.95 | | | | | | | | 0.98 | | | | | | | | - | | | | | | | | - | | | | | | | | - | |
| Class R5 | | | | | | | | | | | | | | | | | | | | | | | | | | | | | | | | | | | | | | | | | | | | | | | | | | | | |
| Year Ended 07/31/19 | | | 11.96 | | | | | | | | 0.20 | | | | | | | | (0.03 | ) | | | | | | | 0.17 | | | | | | | | (0.32 | ) | | | | | | | (0.19 | ) | | | | | | | (0.51 | ) |
| Year Ended 07/31/18 | | | 10.99 | | | | | | | | 0.07 | | | | | | | | 1.16 | | | | | | | | 1.23 | | | | | | | | (0.25 | ) | | | | | | | (0.01 | ) | | | | | | | (0.26 | ) |
December 13, 2016(g)
through July 31, 2017 | | | 10.00 | | | | | | | | 0.06 | | | | | | | | 0.93 | | | | | | | | 0.99 | | | | | | | | - | | | | | | | | - | | | | | | | | - | |
| Class R6 | | | | | | | | | | | | | | | | | | | | | | | | | | | | | | | | | | | | | | | | | | | | | | | | | | | | |
| Year Ended 07/31/19 | | | 11.99 | | | | | | | | 0.20 | | | | | | | | (0.03 | ) | | | | | | | 0.17 | | | | | | | | (0.33 | ) | | | | | | | (0.19 | ) | | | | | | | (0.52 | ) |
| Year Ended 07/31/18 | | | 11.00 | | | | | | | | 0.19 | | | | | | | | 1.08 | | | | | | | | 1.27 | | | | | | | | (0.27 | ) | | | | | | | (0.01 | ) | | | | | | | (0.28 | ) |
December 13, 2016(g)
through July 31, 2017 | | | 10.00 | | | | | | | | 0.06 | | | | | | | | 0.94 | | | | | | | | 1.00 | | | | | | | | - | | | | | | | | - | | | | | | | | - | |
| | |
| The footnote legend is at the end of the Financial Highlights. | | See Notes to Financial Statements. |
| | | | | | | | | | | | | | | | | | | | | | | | | | | | | | | | | | | | | | | | | | | | | | | | | | | | | | | | | | |
| | | | | | | | | | | | | Ratios/Supplemental Data(b)(c) | |
Net asset
value,
end of
period | | | | | | Total
Return(d) | | | | | | Net assets,
end of
period
(000) | | | | | | Average
net assets
(000) | | | | | | Expenses after
waivers and/or
expense
reimbursement | | | | | | Expenses
before waivers
and/or expense
reimbursement | | | | | | Net
investment
income
(loss) | | | | | | Portfolio
turnover
rate(e) | |
| | | | | | | | | | | | | | | | | | | | | | | | | | | | | | | | | | | | | | | | | | | | | | | | | | | | | | | | | | | |
| | $11.59 | | | | | | | | 1.61% | | | | | | | | $166 | | | | | | | | $145 | | | | | | | | 0.68% | | | | | | | | 11.03% | | | | | | | | 1.11% | | | | | | | | 30% | |
| | 11.92 | | | | | | | | 10.68 | | | | | | | | 142 | | | | | | | | 122 | | | | | | | | 0.61 | | | | | | | | 15.48 | | | | | | | | 0.95 | | | | | | | | 56 | |
|
10.95 |
| | | | | | | 9.50 | | | | | | | | 98 | | | | | | | | 15 | | | | | | | | 0.59 | (h) | | | | | | | 192.34 | (h) | | | | | | | 0.14 | (h) | | | | | | | 18 | |
| | | | | | | | | | | | | | | | | | | | | | | | | | | | | | | | | | | | | | | | | | | | | | | | | | | | | | | | | | | |
| | 11.59 | | | | | | | | 1.83 | | | | | | | | 1,951 | | | | | | | | 1,348 | | | | | | | | 0.43 | | | | | | | | 3.75 | | | | | | | | 1.33 | | | | | | | | 30 | |
| | 11.93 | | | | | | | | 10.96 | | | | | | | | 982 | | | | | | | | 284 | | | | | | | | 0.41 | | | | | | | | 8.52 | | | | | | | | 0.26 | | | | | | | | 56 | |
|
10.96 |
| | | | | | | 9.60 | | | | | | | | 18 | | | | | | | | 11 | | | | | | | | 0.38 | (h) | | | | | | | 257.36 | (h) | | | | | | | 0.54 | (h) | | | | | | | 18 | |
| | | | | | | | | | | | | | | | | | | | | | | | | | | | | | | | | | | | | | | | | | | | | | | | | | | | | | | | | | | |
| | 11.61 | | | | | | | | 2.01 | | | | | | | | 1,074 | | | | | | | | 655 | | | | | | | | 0.28 | | | | | | | | 4.43 | | | | | | | | 1.22 | | | | | | | | 30 | |
| | 11.95 | | | | | | | | 11.19 | | | | | | | | 347 | | | | | | | | 162 | | | | | | | | 0.24 | | | | | | | | 12.24 | | | | | | | | 1.01 | | | | | | | | 56 | |
|
10.97 |
| | | | | | | 9.70 | | | | | | | | 11 | | | | | | | | 10 | | | | | | | | 0.23 | (h) | | | | | | | 267.71 | (h) | | | | | | | 0.71 | (h) | | | | | | | 18 | |
| | | | | | | | | | | | | | | | | | | | | | | | | | | | | | | | | | | | | | | | | | | | | | | | | | | | | | | | | | | |
| | 11.59 | | | | | | | | 1.95 | | | | | | | | 12 | | | | | | | | 68 | | | | | | | | 0.19 | | | | | | | | 19.83 | | | | | | | | 13.14 | | | | | | | | 30 | |
| | 11.95 | | | | | | | | 11.21 | | | | | | | | 160 | | | | | | | | 113 | | | | | | | | 0.12 | | | | | | | | 15.66 | | | | | | | | 1.24 | | | | | | | | 56 | |
|
10.98 |
| | | | | | | 9.80 | | | | | | | | 75 | | | | | | | | 45 | | | | | | | | 0.11 | (h) | | | | | | | 141.42 | (h) | | | | | | | 0.39 | (h) | | | | | | | 18 | |
| | | | | | | | | | | | | | | | | | | | | | | | | | | | | | | | | | | | | | | | | | | | | | | | | | | | | | | | | | | |
| | 11.62 | | | | | | | | 2.24 | | | | | | | | 732 | | | | | | | | 608 | | | | | | | | 0.08 | | | | | | | | 4.47 | | | | | | | | 1.73 | | | | | | | | 30 | |
| | 11.96 | | | | | | | | 11.31 | | | | | | | | 560 | | | | | | | | 176 | | | | | | | | 0.06 | | | | | | | | 10.80 | | | | | | | | 0.56 | | | | | | | | 56 | |
|
10.99 |
| | | | | | | 9.90 | | | | | | | | 11 | | | | | | | | 10 | | | | | | | | 0.02 | (h) | | | | | | | 267.38 | (h) | | | | | | | 0.92 | (h) | | | | | | | 18 | |
| | | | | | | | | | | | | | | | | | | | | | | | | | | | | | | | | | | | | | | | | | | | | | | | | | | | | | | | | | | |
| | 11.64 | | | | | | | | 2.33 | | | | | | | | 7,037 | | | | | | | | 5,316 | | | | | | | | 0.00 | (j) | | | | | | | 2.60 | | | | | | | | 1.75 | | | | | | | | 30 | |
| | 11.99 | | | | | | | | 11.65 | | | | | | | | 3,884 | | | | | | | | 2,964 | | | | | | | | 0.00 | (j) | | | | | | | 4.62 | | | | | | | | 1.64 | | | | | | | | 56 | |
|
11.00 |
| | | | | | | 10.00 | | | | | | | | 2,013 | | | | | | | | 318 | | | | | | | | 0.00 | (j)(h) | | | | | | | 49.96 | (h) | | | | | | | 0.83 | (h) | | | | | | | 18 | |
| | |
| The footnote legend is at the end of the Financial Highlights. | | See Notes to Financial Statements. |
| | | | |
| Prudential Day One Funds | | | 205 | |
Prudential Day One 2055 Fund
Financial Highlights
| | | | | | | | | | | | | | | | | | | | | | | | | | | | | | | | | | | | | | | | | | | | | | | | | | | | |
| | | Per Share
Operating
Performance(a) | | | | | | Income (Loss) From Investment Operations | | | | | | Less Dividends and Distributions | |
| | | Net
Asset Value,
Beginning of
Period | | | | | | Net
investment
income
(loss) | | | | | | Net
realized
and
unrealized
gain (loss) | | | | | | Total
income
(loss) from
investment
operations | | | | | | Dividends
from net
investment
income | | | | | | Distributions
from net
realized
gains | | | | | | Total
dividends
and
distributions | |
| Class R1 | | | | | | | | | | | | | | | | | | | | | | | | | | | | | | | | | | | | | | | | | | | | | | | | | | | | |
| Year Ended 07/31/19 | | | $12.10 | | | | | | | | $0.14 | | | | | | | | $(0.15 | ) | | | | | | | $(0.01 | ) | | | | | | | $(0.24 | ) | | | | | | | $(0.33 | ) | | | | | | | $(0.57 | ) |
| Year Ended 07/31/18 | | | 11.07 | | | | | | | | 0.10 | | | | | | | | 1.12 | | | | | | | | 1.22 | | | | | | | | (0.19 | ) | | | | | | | - | | | | | | | | (0.19 | ) |
December 13, 2016(g)
through July 31, 2017 | | | 10.00 | | | | | | | | 0.02 | | | | | | | | 1.05 | | | | | | | | 1.07 | | | | | | | | - | | | | | | | | - | | | | | | | | - | |
| Class R2 | | | | | | | | | | | | | | | | | | | | | | | | | | | | | | | | | | | | | | | | | | | | | | | | | | | | |
| Year Ended 07/31/19 | | | 12.12 | | | | | | | | 0.12 | | | | | | | | (0.10 | ) | | | | | | | 0.02 | | | | | | | | (0.27 | ) | | | | | | | (0.33 | ) | | | | | | | (0.60 | ) |
| Year Ended 07/31/18 | | | 11.09 | | | | | | | | 0.10 | | | | | | | | 1.15 | | | | | | | | 1.25 | | | | | | | | (0.22 | ) | | | | | | | - | | | | | | | | (0.22 | ) |
December 13, 2016(g)
through July 31, 2017 | | | 10.00 | | | | | | | | 0.03 | | | | | | | | 1.06 | | | | | | | | 1.09 | | | | | | | | - | | | | | | | | - | | | | | | | | - | |
| Class R3 | | | | | | | | | | | | | | | | | | | | | | | | | | | | | | | | | | | | | | | | | | | | | | | | | | | | |
| Year Ended 07/31/19 | | | 12.13 | | | | | | | | 0.18 | | | | | | | | (0.14 | ) | | | | | | | 0.04 | | | | | | | | (0.29 | ) | | | | | | | (0.33 | ) | | | | | | | (0.62 | ) |
| Year Ended 07/31/18 | | | 11.10 | | | | | | | | 0.15 | | | | | | | | 1.12 | | | | | | | | 1.27 | | | | | | | | (0.24 | ) | | | | | | | - | | | | | | | | (0.24 | ) |
December 13, 2016(g)
through July 31, 2017 | | | 10.00 | | | | | | | | 0.02 | | | | | | | | 1.08 | | | | | | | | 1.10 | | | | | | | | - | | | | | | | | - | | | | | | | | - | |
| Class R4 | | | | | | | | | | | | | | | | | | | | | | | | | | | | | | | | | | | | | | | | | | | | | | | | | | | | |
| Year Ended 07/31/19 | | | 12.14 | | | | | | | | 0.26 | | | | | | | | (0.21 | ) | | | | | | | 0.05 | | | | | | | | (0.30 | ) | | | | | | | (0.33 | ) | | | | | | | (0.63 | ) |
| Year Ended 07/31/18 | | | 11.11 | | | | | | | | 0.16 | | | | | | | | 1.12 | | | | | | | | 1.28 | | | | | | | | (0.25 | ) | | | | | | | - | | | | | | | | (0.25 | ) |
December 13, 2016(g)
through July 31, 2017 | | | 10.00 | | | | | | | | 0.03 | | | | | | | | 1.08 | | | | | | | | 1.11 | | | | | | | | - | | | | | | | | - | | | | | | | | - | |
| Class R5 | | | | | | | | | | | | | | | | | | | | | | | | | | | | | | | | | | | | | | | | | | | | | | | | | | | | |
| Year Ended 07/31/19 | | | 12.15 | | | | | | | | 0.14 | | | | | | | | (0.09 | ) | | | | | | | 0.05 | | | | | | | | (0.31 | ) | | | | | | | (0.33 | ) | | | | | | | (0.64 | ) |
| Year Ended 07/31/18 | | | 11.12 | | | | | | | | 0.16 | | | | | | | | 1.13 | | | | | | | | 1.29 | | | | | | | | (0.26 | ) | | | | | | | - | | | | | | | | (0.26 | ) |
December 13, 2016(g)
through July 31, 2017 | | | 10.00 | | | | | | | | 0.06 | | | | | | | | 1.06 | | | | | | | | 1.12 | | | | | | | | - | | | | | | | | - | | | | | | | | - | |
| Class R6 | | | | | | | | | | | | | | | | | | | | | | | | | | | | | | | | | | | | | | | | | | | | | | | | | | | | |
| Year Ended 07/31/19 | | | 12.16 | | | | | | | | 0.21 | | | | | | | | (0.14 | ) | | | | | | | 0.07 | | | | | | | | (0.33 | ) | | | | | | | (0.33 | ) | | | | | | | (0.66 | ) |
| Year Ended 07/31/18 | | | 11.13 | | | | | | | | 0.19 | | | | | | | | 1.12 | | | | | | | | 1.31 | | | | | | | | (0.28 | ) | | | | | | | - | | | | | | | | (0.28 | ) |
December 13, 2016(g)
through July 31, 2017 | | | 10.00 | | | | | | | | 0.04 | | | | | | | | 1.09 | | | | | | | | 1.13 | | | | | | | | - | | | | | | | | - | | | | | | | | - | |
| | |
| The footnote legend is at the end of the Financial Highlights. | | See Notes to Financial Statements. |
| | | | | | | | | | | | | | | | | | | | | | | | | | | | | | | | | | | | | | | | | | | | | | | | | | | | | | | | | | |
| | | | | | | | | | | | | Ratios/Supplemental Data(b)(c) | |
Net asset
value,
end of
period | | | | | | Total
Return(d) | | | | | | Net assets,
end of
period
(000) | | | | | | Average
net assets
(000) | | | | | | Expenses after
waivers and/or
expense
reimbursement | | | | | | Expenses
before waivers
and/or expense
reimbursement | | | | | | Net
investment
income
(loss) | | | | | | Portfolio
turnover
rate(e) | |
| | | | | | | | | | | | | | | | | | | | | | | | | | | | | | | | | | | | | | | | | | | | | | | | | | | | | | | | | | | |
| | $11.52 | | | | | | | | 0.89% | | | | | | | | $15 | | | | | | | | $15 | | | | | | | | 0.66% | | | | | | | | 81.24% | | | | | | | | 1.22% | | | | | | | | 29% | |
| | 12.10 | | | | | | | | 11.10 | | | | | | | | 15 | | | | | | | | 12 | | | | | | | | 0.61 | | | | | | | | 110.87 | | | | | | | | 0.87 | | | | | | | | 29 | |
|
11.07 |
| | | | | | | 10.70 | | | | | | | | 11 | | | | | | | | 10 | | | | | | | | 0.64 | (h) | | | | | | | 257.86 | (h) | | | | | | | 0.23 | (h) | | | | | | | 4 | |
| | | | | | | | | | | | | | | | | | | | | | | | | | | | | | | | | | | | | | | | | | | | | | | | | | | | | | | | | | | |
| | 11.54 | | | | | | | | 1.19 | | | | | | | | 63 | | | | | | | | 43 | | | | | | | | 0.41 | | | | | | | | 30.82 | | | | | | | | 1.05 | | | | | | | | 29 | |
| | 12.12 | | | | | | | | 11.34 | | | | | | | | 36 | | | | | | | | 23 | | | | | | | | 0.37 | | | | | | | | 58.64 | | | | | | | | 0.86 | | | | | | | | 29 | |
|
11.09 |
| | | | | | | 10.90 | | | | | | | | 17 | | | | | | | | 11 | | | | | | | | 0.38 | (h) | | | | | | | 250.88 | (h) | | | | | | | 0.47 | (h) | | | | | | | 4 | |
| | | | | | | | | | | | | | | | | | | | | | | | | | | | | | | | | | | | | | | | | | | | | | | | | | | | | | | | | | | |
| | 11.55 | | | | | | | | 1.37 | | | | | | | | 3,699 | | | | | | | | 3,177 | | | | | | | | 0.26 | | | | | | | | 3.70 | | | | | | | | 1.59 | | | | | | | | 29 | |
| | 12.13 | | | | | | | | 11.48 | | | | | | | | 2,791 | | | | | | | | 2,323 | | | | | | | | 0.21 | | | | | | | | 4.29 | | | | | | | | 1.26 | | | | | | | | 29 | |
|
11.10 |
| | | | | | | 11.00 | | | | | | | | 1,795 | | | | | | | | 41 | | | | | | | | 0.13 | (h) | | | | | | | 93.88 | (h) | | | | | | | 0.25 | (h) | | | | | | | 4 | |
| | | | | | | | | | | | | | | | | | | | | | | | | | | | | | | | | | | | | | | | | | | | | | | | | | | | | | | | | | | |
| | 11.56 | | | | | | | | 1.49 | | | | | | | | 13 | | | | | | | | 33 | | | | | | | | 0.17 | | | | | | | | 37.86 | | | | | | | | 2.20 | | | | | | | | 29 | |
| | 12.14 | | | | | | | | 11.59 | | | | | | | | 66 | | | | | | | | 56 | | | | | | | | 0.11 | | | | | | | | 26.45 | | | | | | | | 1.34 | | | | | | | | 29 | |
|
11.11 |
| | | | | | | 11.10 | | | | | | | | 45 | | | | | | | | 25 | | | | | | | | 0.13 | (h) | | | | | | | 166.78 | (h) | | | | | | | 0.41 | (h) | | | | | | | 4 | |
| | | | | | | | | | | | | | | | | | | | | | | | | | | | | | | | | | | | | | | | | | | | | | | | | | | | | | | | | | | |
| | 11.56 | | | | | | | | 1.53 | | | | | | | | 90 | | | | | | | | 50 | | | | | | | | 0.05 | | | | | | | | 26.07 | | | | | | | | 1.20 | | | | | | | | 29 | |
| | 12.15 | | | | | | | | 11.69 | | | | | | | | 21 | | | | | | | | 14 | | | | | | | | 0.01 | | | | | | | | 96.19 | | | | | | | | 1.37 | | | | | | | | 29 | |
|
11.12 |
| | | | | | | 11.20 | | | | | | | | 11 | | | | | | | | 10 | | | | | | | | 0.03 | (h) | | | | | | | 257.05 | (h) | | | | | | | 0.84 | (h) | | | | | | | 4 | |
| | | | | | | | | | | | | | | | | | | | | | | | | | | | | | | | | | | | | | | | | | | | | | | | | | | | | | | | | | | |
| | 11.57 | | | | | | | | 1.72 | | | | | | | | 3,635 | | | | | | | | 3,169 | | | | | | | | 0.00 | (j) | | | | | | | 3.36 | | | | | | | | 1.87 | | | | | | | | 29 | |
| | 12.16 | | | | | | | | 11.85 | | | | | | | | 2,777 | | | | | | | | 2,185 | | | | | | | | 0.00 | (j) | | | | | | | 3.99 | | | | | | | | 1.62 | | | | | | | | 29 | |
|
11.13 |
| | | | | | | 11.30 | | | | | | | | 950 | | | | | | | | 287 | | | | | | | | 0.00 | (j)(h) | | | | | | | 60.80 | (h) | | | | | | | 0.53 | (h) | | | | | | | 4 | |
| | |
| The footnote legend is at the end of the Financial Highlights. | | See Notes to Financial Statements. |
| | | | |
| Prudential Day One Funds | | | 207 | |
Prudential Day One 2060 Fund
Financial Highlights
| | | | | | | | | | | | | | | | | | | | | | | | | | | | | | | | | | | | | | | | | | | | | | | | | | | | |
| | | Per Share
Operating
Performance(a) | | | | | | Income (Loss) From Investment Operations | | | | | | Less Dividends and Distributions | |
| | | Net
Asset Value,
Beginning of
Period | | | | | | Net
investment
income
(loss) | | | | | | Net
realized
and
unrealized
gain (loss) | | | | | | Total
income
(loss) from
investment
operations | | | | | | Dividends
from net
investment
income | | | | | | Distributions
from net
realized
gains | | | | | | Total
dividends
and
distributions | |
| Class R1 | | | | | | | | | | | | | | | | | | | | | | | | | | | | | | | | | | | | | | | | | | | | | | | | | | | | |
| Year Ended 07/31/19 | | | $12.06 | | | | | | | | $0.13 | | | | | | | | $(0.15 | ) | | | | | | | $(0.02 | ) | | | | | | | $(0.25 | ) | | | | | | | $(0.17 | ) | | | | | | | $(0.42 | ) |
| Year Ended 07/31/18 | | | 11.01 | | | | | | | | 0.10 | | | | | | | | 1.15 | | | | | | | | 1.25 | | | | | | | | (0.20 | ) | | | | | | | - | | | | | | | | (0.20 | ) |
December 13, 2016(g)
through July 31, 2017 | | | 10.00 | | | | | | | | 0.01 | | | | | | | | 1.00 | | | | | | | | 1.01 | | | | | | | | - | | | | | | | | - | | | | | | | | - | |
| Class R2 | | | | | | | | | | | | | | | | | | | | | | | | | | | | | | | | | | | | | | | | | | | | | | | | | | | | |
| Year Ended 07/31/19 | | | 12.08 | | | | | | | | 0.15 | | | | | | | | (0.15 | ) | | | | | | | - | (i) | | | | | | | (0.28 | ) | | | | | | | (0.17 | ) | | | | | | | (0.45 | ) |
| Year Ended 07/31/18 | | | 11.03 | | | | | | | | 0.06 | | | | | | | | 1.21 | | | | | | | | 1.27 | | | | | | | | (0.22 | ) | | | | | | | - | | | | | | | | (0.22 | ) |
December 13, 2016(g)
through July 31, 2017 | | | 10.00 | | | | | | | | 0.03 | | | | | | | | 1.00 | | | | | | | | 1.03 | | | | | | | | - | | | | | | | | - | | | | | | | | - | |
| Class R3 | | | | | | | | | | | | | | | | | | | | | | | | | | | | | | | | | | | | | | | | | | | | | | | | | | | | |
| Year Ended 07/31/19 | | | 12.09 | | | | | | | | 0.14 | | | | | | | | (0.11 | ) | | | | | | | 0.03 | | | | | | | | (0.30 | ) | | | | | | | (0.17 | ) | | | | | | | (0.47 | ) |
| Year Ended 07/31/18 | | | 11.04 | | | | | | | | 0.13 | | | | | | | | 1.16 | | | | | | | | 1.29 | | | | | | | | (0.24 | ) | | | | | | | - | | | | | | | | (0.24 | ) |
December 13, 2016(g)
through July 31, 2017 | | | 10.00 | | | | | | | | 0.04 | | | | | | | | 1.00 | | | | | | | | 1.04 | | | | | | | | - | | | | | | | | - | | | | | | | | - | |
| Class R4 | | | | | | | | | | | | | | | | | | | | | | | | | | | | | | | | | | | | | | | | | | | | | | | | | | | | |
| Year Ended 07/31/19 | | | 12.10 | | | | | | | | 0.19 | | | | | | | | (0.16 | ) | | | | | | | 0.03 | | | | | | | | (0.31 | ) | | | | | | | (0.17 | ) | | | | | | | (0.48 | ) |
| Year Ended 07/31/18 | | | 11.04 | | | | | | | | 0.16 | | | | | | | | 1.15 | | | | | | | | 1.31 | | | | | | | | (0.25 | ) | | | | | | | - | | | | | | | | (0.25 | ) |
December 13, 2016(g)
through July 31, 2017 | | | 10.00 | | | | | | | | 0.05 | | | | | | | | 0.99 | | | | | | | | 1.04 | | | | | | | | - | | | | | | | | - | | | | | | | | - | |
| Class R5 | | | | | | | | | | | | | | | | | | | | | | | | | | | | | | | | | | | | | | | | | | | | | | | | | | | | |
| Year Ended 07/31/19 | | | 12.11 | | | | | | | | 0.02 | | | | | | | | 0.02 | | | | | | | | 0.04 | | | | | | | | (0.32 | ) | | | | | | | (0.17 | ) | | | | | | | (0.49 | ) |
| Year Ended 07/31/18 | | | 11.05 | | | | | | | | 0.16 | | | | | | | | 1.16 | | | | | | | | 1.32 | | | | | | | | (0.26 | ) | | | | | | | - | | | | | | | | (0.26 | ) |
December 13, 2016(g)
through July 31, 2017 | | | 10.00 | | | | | | | | 0.05 | | | | | | | | 1.00 | | | | | | | | 1.05 | | | | | | | | - | | | | | | | | - | | | | | | | | - | |
| Class R6 | | | | | | | | | | | | | | | | | | | | | | | | | | | | | | | | | | | | | | | | | | | | | | | | | | | | |
| Year Ended 07/31/19 | | | 12.11 | | | | | | | | 0.22 | | | | | | | | (0.16 | ) | | | | | | | 0.06 | | | | | | | | (0.34 | ) | | | | | | | (0.17 | ) | | | | | | | (0.51 | ) |
| Year Ended 07/31/18 | | | 11.06 | | | | | | | | 0.22 | | | | | | | | 1.11 | | | | | | | | 1.33 | | | | | | | | (0.28 | ) | | | | | | | - | | | | | | | | (0.28 | ) |
December 13, 2016(g)
through July 31, 2017 | | | 10.00 | | | | | | | | 0.05 | | | | | | | | 1.01 | | | | | | | | 1.06 | | | | | | | | - | | | | | | | | - | | | | | | | | - | |
| | |
| The footnote legend is at the end of the Financial Highlights. | | See Notes to Financial Statements. |
| | | | | | | | | | | | | | | | | | | | | | | | | | | | | | | | | | | | | | | | | | | | | | | | | | | | | | | | | | |
| | | | | | | | | | | | | Ratios/Supplemental Data(b)(c) | |
Net asset
value,
end of
period | | | | | | Total
Return(d) | | | | | | Net assets,
end of
period
(000) | | | | | | Average
net assets
(000) | | | | | | Expenses after
waivers and/or
expense
reimbursement | | | | | | Expenses
before waivers
and/or expense
reimbursement | | | | | | Net
investment
income
(loss) | | | | | | Portfolio
turnover
rate(e) | |
| | | | | | | | | | | | | | | | | | | | | | | | | | | | | | | | | | | | | | | | | | | | | | | | | | | | | | | | | | | |
| | $11.62 | | | | | | | | 0.57% | | | | | | | | $12 | | | | | | | | $12 | | | | | | | | 0.66% | | | | | | | | 111.01% | | | | | | | | 1.10% | | | | | | | | 35% | |
| | 12.06 | | | | | | | | 11.37 | | | | | | | | 12 | | | | | | | | 12 | | | | | | | | 0.61 | | | | | | | | 149.96 | | | | | | | | 0.87 | | | | | | | | 90 | |
|
11.01 |
| | | | | | | 10.10 | | | | | | | | 11 | | | | | | | | 10 | | | | | | | | 0.63 | (h) | | | | | | | 479.61 | (h) | | | | | | | 0.22 | (h) | | | | | | | 18 | |
| | | | | | | | | | | | | | | | | | | | | | | | | | | | | | | | | | | | | | | | | | | | | | | | | | | | | | | | | | | |
| | 11.63 | | | | | | | | 0.79 | | | | | | | | 388 | | | | | | | | 226 | | | | | | | | 0.41 | | | | | | | | 18.79 | | | | | | | | 1.31 | | | | | | | | 35 | |
| | 12.08 | | | | | | | | 11.61 | | | | | | | | 94 | | | | | | | | 29 | | | | | | | | 0.38 | | | | | | | | 79.88 | | | | | | | | 0.51 | | | | | | | | 90 | |
|
11.03 |
| | | | | | | 10.30 | | | | | | | | 11 | | | | | | | | 10 | | | | | | | | 0.37 | (h) | | | | | | | 479.48 | (h) | | | | | | | 0.47 | (h) | | | | | | | 18 | |
| | | | | | | | | | | | | | | | | | | | | | | | | | | | | | | | | | | | | | | | | | | | | | | | | | | | | | | | | | | |
| | 11.65 | | | | | | | | 1.05 | | | | | | | | 279 | | | | | | | | 173 | | | | | | | | 0.26 | | | | | | | | 20.50 | | | | | | | | 1.25 | | | | | | | | 35 | |
| | 12.09 | | | | | | | | 11.75 | | | | | | | | 121 | | | | | | | | 80 | | | | | | | | 0.22 | | | | | | | | 53.70 | | | | | | | | 1.11 | | | | | | | | 90 | |
|
11.04 |
| | | | | | | 10.40 | | | | | | | | 11 | | | | | | | | 10 | | | | | | | | 0.23 | (h) | | | | | | | 479.19 | (h) | | | | | | | 0.61 | (h) | | | | | | | 18 | |
| | | | | | | | | | | | | | | | | | | | | | | | | | | | | | | | | | | | | | | | | | | | | | | | | | | | | | | | | | | |
| | 11.65 | | | | | | | | 1.09 | | | | | | | | 12 | | | | | | | | 12 | | | | | | | | 0.16 | | | | | | | | 106.19 | | | | | | | | 1.66 | | | | | | | | 35 | |
| | 12.10 | | | | | | | | 11.96 | | | | | | | | 13 | | | | | | | | 12 | | | | | | | | 0.11 | | | | | | | | 147.15 | | | | | | | | 1.35 | | | | | | | | 90 | |
|
11.04 |
| | | | | | | 10.40 | | | | | | | | 11 | | | | | | | | 10 | | | | | | | | 0.12 | (h) | | | | | | | 479.00 | (h) | | | | | | | 0.72 | (h) | | | | | | | 18 | |
| | | | | | | | | | | | | | | | | | | | | | | | | | | | | | | | | | | | | | | | | | | | | | | | | | | | | | | | | | | |
| | 11.66 | | | | | | | | 1.21 | | | | | | | | 67 | | | | | | | | 35 | | | | | | | | 0.06 | | | | | | | | 45.88 | | | | | | | | 0.15 | | | | | | | | 35 | |
| | 12.11 | | | | | | | | 12.06 | | | | | | | | 16 | | | | | | | | 13 | | | | | | | | 0.01 | | | | | | | | 140.94 | | | | | | | | 1.39 | | | | | | | | 90 | |
|
11.05 |
| | | | | | | 10.50 | | | | | | | | 11 | | | | | | | | 10 | | | | | | | | 0.02 | (h) | | | | | | | 478.98 | (h) | | | | | | | 0.83 | (h) | | | | | | | 18 | |
| | | | | | | | | | | | | | | | | | | | | | | | | | | | | | | | | | | | | | | | | | | | | | | | | | | | | | | | | | | |
| | 11.66 | | | | | | | | 1.39 | | | | | | | | 1,424 | | | | | | | | 981 | | | | | | | | 0.00 | (j) | | | | | | | 14.67 | | | | | | | | 1.90 | | | | | | | | 35 | |
| | 12.11 | | | | | | | | 12.12 | | | | | | | | 452 | | | | | | | | 266 | | | | | | | | 0.00 | (j) | | | | | | | 42.30 | | | | | | | | 1.84 | | | | | | | | 90 | |
|
11.06 |
| | | | | | | 10.60 | | | | | | | | 52 | | | | | | | | 19 | | | | | | | | 0.00 | (j)(h) | | | | | | | 459.90 | (h) | | | | | | | 0.79 | (h) | | | | | | | 18 | |
| | |
| The footnote legend is at the end of the Financial Highlights. | | See Notes to Financial Statements. |
| | | | |
| Prudential Day One Funds | | | 209 | |
Financial Highlights(continued)
| (a) | Calculated based on average shares outstanding during the period. |
| (b) | Effective August 1, 2017, class specific expenses include transfer agent fees and expenses and registration fees, which are charged to their respective share class. |
| (c) | Does not include expenses of the underlying funds in which the Fund invests. Expenses waived/reimbursed include those of underlying funds in which the Fund invests. Consequently, the amount waived/reimbursed may be greater than the expense ratio reflected in the financial highlights. |
| (d) | Total return is calculated assuming a purchase of a share on the first day and a sale on the last day of each period reported, and includes reinvestment of dividends and distributions, if any. Total returns may reflect adjustments to conform to generally accepted accounting principles. Total returns for periods less than one full year are not annualized. |
| (e) | The Fund’s portfolio turnover rate is calculated in accordance with regulatory requirements, without regard to transactions involving short-term investments and certain derivatives. If such transactions were included, the Fund’s portfolio turnover rate may be higher. |
| (f) | Less than $(0.005) per share. |
| (g) | Commencement of operations. |
| (i) | Less than $0.005 per share. |
| (j) | As a result of reimbursing expenses, including underlying fund expenses, the Manager may reimburse amounts in excess of the respective share classes’ operating expenses. The effect of such waivers was as follows: |
Expenses after waivers and/or reimbursement inclusive of excess expense reimbursement from the Manager
| | | | | | | | |
Fund | | Year Ended
07/31/19 | | Year Ended
07/31/18 | | | December 13, 2016(g) through
July 31, 2017* |
| Day One Income (Class R6) | | (0.01)% | | | (0.09 | )% | | (0.19)%(h) |
| Day One 2010 (Class R6) | | (0.02)% | | | (0.13 | )% | | (0.27)%(h) |
| Day One 2015 (Class R6) | | (0.02)% | | | (0.11 | )% | | (0.22)%(h) |
| Day One 2020 (Class R6) | | (0.01)% | | | (0.10 | )% | | (0.21)%(h) |
| Day One 2025 (Class R6) | | (0.01)% | | | (0.09 | )% | | (0.19)%(h) |
| Day One 2030 (Class R6) | | (0.01)% | | | (0.07 | )% | | (0.14)%(h) |
| Day One 2035 (Class R6) | | (0.03)% | | | (0.11 | )% | | (0.16)%(h) |
| Day One 2040 (Class R6) | | (0.05)% | | | (0.11 | )% | | (0.17)%(h) |
| Day One 2045 (Class R6) | | (0.06)% | | | (0.12 | )% | | (0.16)%(h) |
| Day One 2050 (Class R6) | | (0.07)% | | | (0.13 | )% | | (0.19)%(h) |
| Day One 2055 (Class R6) | | (0.09)% | | | (0.13 | )% | | (0.15)%(h) |
| Day One 2060 (Class R6) | | (0.09)% | | | (0.14 | )% | | (0.15)%(h) |
* Certain prior year amounts have been classified for consistency with the current period presentation.
| | |
| The footnote legend is at the end of the Financial Highlights. | | See Notes to Financial Statements. |
Report of Independent Registered Public Accounting Firm
To the Shareholders of the Funds and Board of Trustees
Prudential Investment Portfolios 5:
Opinion on the Financial Statements
We have audited the accompanying statement of assets and liabilities of the funds listed in Appendix A (each, a Fund and collectively, the Funds), each a series of Prudential Investment Portfolios 5, including the schedule of investments, as of July 31, 2019, the related statement of operations for the year then ended, the statements of changes in net assets for each of the years in the two-year period then ended, and the related notes (collectively, the financial statements) and the financial highlights for each of the years or period indicated therein. In our opinion, the financial statements and financial highlights present fairly, in all material respects, the financial position of each Fund as of July 31, 2019, the results of its operations for the year then ended, the changes in its net assets for each of the years in the two-year period then ended, and the financial highlights for each of the years or period indicated therein, in conformity with U.S. generally accepted accounting principles.
Basis for Opinion
These financial statements and financial highlights are the responsibility of the Funds’ management. Our responsibility is to express an opinion on these financial statements and financial highlights based on our audits. We are a public accounting firm registered with the Public Company Accounting Oversight Board (United States) (PCAOB) and are required to be independent with respect to the Funds in accordance with the U.S. federal securities laws and the applicable rules and regulations of the Securities and Exchange Commission and the PCAOB.
We conducted our audits in accordance with the standards of the PCAOB. Those standards require that we plan and perform the audit to obtain reasonable assurance about whether the financial statements and financial highlights are free of material misstatement, whether due to error or fraud. Our audits included performing procedures to assess the risks of material misstatement of the financial statements and financial highlights, whether due to error or fraud, and performing procedures that respond to those risks. Such procedures included examining, on a test basis, evidence regarding the amounts and disclosures in the financial statements and financial highlights. Such procedures also included confirmation of securities owned as of July 31, 2019, by correspondence with the transfer agent. Our audits also included evaluating the accounting principles used and significant estimates made by management, as well as evaluating the overall presentation of the financial statements and financial highlights. We believe that our audits provide a reasonable basis for our opinion.

We have served as the auditor of one or more PGIM and/or Prudential Retail investment companies since 2003.
New York, New York
September 19, 2019
| | | | |
| Prudential Day One Funds | | | 211 | |
Appendix A
Prudential Day One Income Fund
Prudential Day One 2010 Fund
Prudential Day One 2015 Fund
Prudential Day One 2020 Fund
Prudential Day One 2025 Fund
Prudential Day One 2030 Fund
Prudential Day One 2035 Fund
Prudential Day One 2040 Fund
Prudential Day One 2045 Fund
Prudential Day One 2050 Fund
Prudential Day One 2055 Fund
Prudential Day One 2060 Fund
Federal Income Tax Information(unaudited)
We are advising you that during the fiscal year ended July 31, 2019, the Funds reported the maximum amount allowed per share for Class R1, R2, R3, R4, R5 and R6 shares as a capital gain distribution in accordance with Section 852(b)(3)(C) of the Internal Revenue Code.
| | | | |
| | | Capital Gain Distributions | |
Prudential Day One Income Fund | | | 0.06 | |
Prudential Day One 2010 Fund | | | 0.14 | |
Prudential Day One 2015 Fund | | | 0.12 | |
Prudential Day One 2020 Fund | | | 0.09 | |
Prudential Day One 2025 Fund | | | 0.15 | |
Prudential Day One 2030 Fund | | | 0.14 | |
Prudential Day One 2035 Fund | | | 0.23 | |
Prudential Day One 2040 Fund | | | 0.16 | |
Prudential Day One 2045 Fund | | | 0.28 | |
Prudential Day One 2050 Fund | | | 0.18 | |
Prudential Day One 2055 Fund | | | 0.29 | |
Prudential Day One 2060 Fund | | | 0.11 | |
For the year ended July 31, 2019, the Fund reports the maximum amount allowable under Section 854 of the Internal Revenue Code, but not less than, the following percentages of the ordinary income dividends paid as 1) qualified dividend income (QDI); and 2) eligible for corporate dividends received deduction (DRD):
| | | | | | | | |
| | | QDI | | | DRD | |
Prudential Day One Income Fund | | | 18.20 | % | | | 12.28 | % |
Prudential Day One 2010 Fund | | | 15.36 | % | | | 10.60 | % |
Prudential Day One 2015 Fund | | | 20.95 | % | | | 14.53 | % |
Prudential Day One 2020 Fund | | | 26.84 | % | | | 18.71 | % |
Prudential Day One 2025 Fund | | | 31.01 | % | | | 21.56 | % |
Prudential Day One 2030 Fund | | | 40.67 | % | | | 28.29 | % |
Prudential Day One 2035 Fund | | | 45.97 | % | | | 30.62 | % |
Prudential Day One 2040 Fund | | | 48.28 | % | | | 32.39 | % |
Prudential Day One 2045 Fund | | | 52.36 | % | | | 33.35 | % |
Prudential Day One 2050 Fund | | | 55.11 | % | | | 34.68 | % |
Prudential Day One 2055 Fund | | | 54.94 | % | | | 33.39 | % |
Prudential Day One 2060 Fund | | | 50.11 | % | | | 29.92 | % |
In January 2020, you will be advised on IRS Form 1099-DIV or substitute 1099-DIV, as to the federal tax status of dividends and distributions received by you in calendar year 2019.
| | | | |
| Prudential Day One Funds | | | 213 | |
INFORMATION ABOUT BOARD MEMBERS AND OFFICERS(unaudited)
Information about Board Members and Officers of the Fund is set forth below. Board Members who are not deemed to be “interested persons” of the Fund, as defined in the 1940 Act, are referred to as “Independent Board Members.” Board Members who are deemed to be “interested persons” of the Fund are referred to as “Interested Board Members.” The Board Members are responsible for the overall supervision of the operations of the Fund and perform the various duties imposed on the directors of investment companies by the 1940 Act. The Board in turn elects the Officers, who are responsible for administering theday-to-day operations of the Fund.
| | | | | | |
| Independent Board Members | | | | |
| | | | |
Name Date of Birth Position(s)
Portfolios Overseen | | Principal Occupation(s) During Past Five Years | | Other Directorships Held During Past Five Years | | Length of
Board Service |
| | | | |
Ellen S. Alberding 3/11/58 Board Member Portfolios Overseen: 96 | | President and Board Member, The Joyce Foundation (charitable foundation) (since 2002); Vice Chair, City Colleges of Chicago (community college system) (2011-2015); Trustee, National Park Foundation (charitable foundation for national park system) (2009-2018); Trustee, Economic Club of Chicago (since 2009); Trustee, Loyola University (since 2018). | | None. | | Since September 2013 |
| | | | |
Kevin J. Bannon 7/13/52 Board Member Portfolios Overseen: 96 | | Retired; Managing Director (April2008-May 2015) and Chief Investment Officer (October 2008-November 2013) of Highmount Capital LLC (registered investment adviser); formerly Executive Vice President and Chief Investment Officer (April 1993-August 2007) of Bank of New York Company; President (May2003-May 2007) of BNY Hamilton Family of Mutual Funds. | | Director of Urstadt Biddle Properties (equity real estate investment trust) (since September 2008). | | Since July 2008 |
Prudential Day One Funds
| | | | | | |
| Independent Board Members | | | | |
| | | | |
Name Date of Birth Position(s) Portfolios Overseen | | Principal Occupation(s) During Past Five Years | | Other Directorships Held During Past Five Years | | Length of
Board Service |
| | | | |
Linda W. Bynoe 7/9/52 Board Member Portfolios Overseen: 96 | | President and Chief Executive Officer (since March 1995) and formerly Chief Operating Officer (December 1989-February 1995) of Telemat Ltd. (management consulting); formerly Vice President (January 1985-June 1989) at Morgan Stanley & Co. (broker-dealer). | | Director of Anixter International, Inc. (communication products distributor) (since January 2006); Director of Northern Trust Corporation (financial services) (since April 2006); Trustee of Equity Residential (residential real estate) (since December 2009). | | Since March 2005 |
| | | | |
Barry H. Evans 11/2/60 Board Member Portfolios Overseen: 95 | | Retired; formerly President (2005 – 2016), Global Chief Operating Officer (2014–2016), Chief Investment Officer – Global Head of Fixed Income (1998-2014), and various portfolio manager roles (1986-2006), Manulife Asset Management U.S. | | Formerly Director, Manulife Trust Company (2011-2018); formerly Director, Manulife Asset Management Limited (2015-2017); formerly Chairman of the Board of Directors of Manulife Asset Management U.S. (2005-2016); formerly Chairman of the Board, Declaration Investment Management and Research (2008-2016). | | Since September 2017 |
| | | | |
Keith F. Hartstein 10/13/56 Board Member & Independent Chair Portfolios Overseen: 96 | | Retired; Member (since November 2014) of the Governing Council of the Independent Directors Council (organization of independent mutual fund directors); formerly President and Chief Executive Officer (2005-2012), Senior Vice President (2004-2005), Senior Vice President of Sales and Marketing (1997-2004), and various executive management positions (1990-1997), John Hancock Funds, LLC (asset management); Chairman, Investment Company Institute’s Sales Force Marketing Committee (2003-2008). | | None. | | Since September 2013 |
Visit our website at pgiminvestments.com
| | | | | | |
| Independent Board Members | | | | |
| | | | |
Name Date of Birth Position(s)
Portfolios Overseen | | Principal Occupation(s) During Past Five Years | | Other Directorships Held During Past Five Years | | Length of
Board Service |
| | | | |
Laurie Simon Hodrick 9/29/62 Board Member Portfolios Overseen: 95 | | A. Barton Hepburn Professor Emerita of Economics in the Faculty of Business, Columbia Business School (since 2018); Visiting Professor of Law, Stanford Law School (since 2015); Visiting Fellow at the Hoover Institution, Stanford University (since 2015); Sole Member, ReidCourt LLC (since 2008) (a consulting firm); formerly A. Barton Hepburn Professor of Economics in the Faculty of Business, Columbia Business School (1996-2017); formerly Managing Director, Global Head of Alternative Investment Strategies, Deutsche Bank (2006-2008). | | Independent Director, Synnex Corporation (since April 2019) (information technology); Independent Director, Kabbage, Inc. (since July 2018) (financial services); Independent Director, Corporate Capital Trust (2017-2018) (a business development company). | | Since September 2017 |
| | | | |
Michael S. Hyland, CFA 10/4/45 Board Member Portfolios Overseen: 96 | | Retired (since February 2005); formerly Senior Managing Director (July 2001-February 2005) of Bear Stearns & Co, Inc.; Global Partner, INVESCO (1999-2001); Managing Director and President of Salomon Brothers Asset Management (1989-1999). | | None. | | Since July 2008 |
| | | | |
Brian K. Reid 9/22/61 Board Member Portfolios Overseen: 95 | | Retired; formerly Chief Economist for the Investment Company Institute (ICI) (2005-2017); formerly Senior Economist and Director of Industry and Financial Analysis at the ICI (1998-2004); formerly Senior Economist, Industry and Financial Analysis at the ICI (1996-1998); formerly Staff Economist at the Federal Reserve Board (1989-1996); Director, ICI Mutual Insurance Company (2012-2017). | | None. | | Since March 2018 |
Prudential Day One Funds
| | | | | | |
Independent Board Members | | | | |
| | | | |
Name Date of Birth Position(s) Portfolios Overseen | | Principal Occupation(s) During Past Five Years | | Other Directorships Held During Past Five Years | | Length of
Board Service |
| | | | |
Grace C. Torres 6/28/59 Board Member Portfolios Overseen: 95 | | Retired; formerly Treasurer and Principal Financial and Accounting Officer of the PGIM Funds, Target Funds, Advanced Series Trust, Prudential Variable Contract Accounts and The Prudential Series Fund (1998-June 2014); Assistant Treasurer (March 1999-June 2014) and Senior Vice President (September 1999-June 2014) of PGIM Investments LLC; Assistant Treasurer (May 2003-June 2014) and Vice President (June 2005-June 2014) of AST Investment Services, Inc.; Senior Vice President and Assistant Treasurer (May 2003-June 2014) of Prudential Annuities Advisory Services, Inc. | | Formerly Director (July 2015-January 2018) of Sun Bancorp, Inc. N.A. and Sun National Bank; Director (since January 2018) of OceanFirst Financial Corp. and OceanFirst Bank. | | Since November 2014 |
| | | | | | |
Interested Board Members | | | | |
| | | | |
Name Date of Birth Position(s) Portfolios Overseen | | Principal Occupation(s) During Past Five Years | | Other Directorships Held During Past Five Years | | Length of
Board Service |
| | | | |
Stuart S. Parker 10/5/62 Board Member & President Portfolios Overseen: 96 | | President of PGIM Investments LLC (formerly known as Prudential Investments LLC) (since January 2012); Executive Vice President of Prudential Investment Management Services LLC (since December 2012); formerly Executive Vice President of Jennison Associates LLC and Head of Retail Distribution of PGIM Investments LLC (June 2005-December 2011). | | None. | | Since January 2012 |
Visit our website at pgiminvestments.com
| | | | | | |
Interested Board Members | | | | |
| | | | |
Name Date of Birth Position(s) Portfolios Overseen | | Principal Occupation(s) During Past Five Years | | Other Directorships Held During Past Five Years | | Length of
Board Service |
| | | | |
Scott E. Benjamin 5/21/73 Board Member & Vice President Portfolios Overseen: 96 | | Executive Vice President (since June 2009) of PGIM Investments LLC; Executive Vice President (June 2009-June 2012) and Vice President (since June 2012) of Prudential Investment Management Services LLC; Executive Vice President (since September 2009) of AST Investment Services, Inc.; Senior Vice President of Product Development and Marketing, PGIM Investments (since February 2006); formerly Vice President of Product Development and Product Management, PGIM Investments LLC (2003-2006). | | None. | | Since March 2010 |
| | | | |
| Fund Officers(a) | | | | |
| | | |
Name Date of Birth Fund Position | | Principal Occupation(s) During Past Five Years | | Length of
Service as Fund
Officer |
| | | |
Raymond A. O’Hara 9/11/55 Chief Legal Officer | | Vice President and Corporate Counsel (since July 2010) of Prudential Insurance Company of America (Prudential); Vice President (March 2011-Present) of Pruco Life Insurance Company and Pruco Life Insurance Company of New Jersey; Vice President and Corporate Counsel (March 2011-Present) of Prudential Annuities Life Assurance Corporation; Chief Legal Officer of PGIM Investments LLC (since June 2012); Chief Legal Officer of Prudential Mutual Fund Services LLC (since June 2012) and Corporate Counsel of AST Investment Services, Inc. (since June 2012); formerly Assistant Vice President and Corporate Counsel (September 2008-July 2010) of The Hartford Financial Services Group, Inc.; formerly Associate (September 1980-December 1987) and Partner (January 1988—August 2008) of Blazzard & Hasenauer, P.C. (formerly, Blazzard, Grodd & Hasenauer, P.C.). | | Since June 2012 |
Prudential Day One Funds
| | | | |
| Fund Officers(a) | | | | |
| | | |
Name Date of Birth Fund Position | | Principal Occupation(s) During Past Five Years | | Length of Service as Fund Officer |
| | | |
Dino Capasso 8/19/74 Chief Compliance Officer | | Chief Compliance Officer (July 2019-Present) of PGIM Investments LLC; Chief Compliance Officer (July 2019-Present) of the PGIM Funds, Target Funds, Advanced Series Trust, The Prudential Series Fund, Prudential’s Gibraltar Fund, Inc., PGIM Global High Yield Fund, Inc., and PGIM High Yield Bond Fund, Inc.; Vice President and Deputy Chief Compliance Officer (June 2017-2019) of PGIM Investments LLC; formerly, Senior Vice President and Senior Counsel (January 2016-June 2017), and Vice President and Counsel (February 2012-December 2015) of Pacific Investment Management Company LLC. | | Since March 2018 |
| | | |
Andrew R. French 12/22/62 Secretary | | Vice President of PGIM Investments LLC (December 2018-Present); formerly Vice President and Corporate Counsel (February 2010-December 2018) of Prudential; formerly Director and Corporate Counsel (2006-2010) of Prudential; Vice President and Assistant Secretary (since January 2007) of PGIM Investments LLC; Vice President and Assistant Secretary (since January 2007) of Prudential Mutual Fund Services LLC. | | Since October 2006 |
| | | |
Jonathan D. Shain 8/9/58 Assistant Secretary | | Vice President and Corporate Counsel (since August 1998) of Prudential; Vice President and Assistant Secretary (since May 2001) of PGIM Investments LLC; Vice President and Assistant Secretary (since February 2001) of Prudential Mutual Fund Services LLC; formerly Vice President and Assistant Secretary (May 2003-June 2005) of AST Investment Services, Inc. | | Since May 2005 |
| | | |
Claudia DiGiacomo 10/14/74 Assistant Secretary | | Vice President and Corporate Counsel (since January 2005) of Prudential; Vice President and Assistant Secretary of PGIM Investments LLC (since December 2005); formerly Associate at Sidley Austin Brown & Wood LLP (1999-2004). | | Since December 2005 |
| | | |
Diana N. Huffman 4/14/82 Assistant Secretary | | Vice President and Corporate Counsel (since September 2015) of Prudential; formerly Associate at Willkie Farr & Gallagher LLP (2009-2015). | | Since March 2019 |
| | | |
Christian J. Kelly 5/5/75 Treasurer and Principal Financial and Accounting Officer | | Vice President, Head of Fund Administration of PGIM Investments LLC (since November 2018); formerly, Director of Fund Administration of Lord Abbett & Co. LLC (2009-2018), Treasurer and Principal Accounting Officer of the Lord Abbett Family of Funds (2017-2018); Director of Accounting, Avenue Capital Group (2008-2009); Senior Manager, Investment Management Practice of Deloitte & Touche LLP (1998-2007). | | Since January 2019 |
| | | |
Peter Parrella 8/21/58 Assistant Treasurer | | Vice President (since 2007) and Director (2004-2007) within PGIM Investments Fund Administration; formerly Tax Manager at SSB Citi Fund Management LLC (1997-2004). | | Since June 2007 |
Visit our website at pgiminvestments.com
| | | | |
| Fund Officers(a) | | | | |
| | | |
Name Date of Birth Fund Position | | Principal Occupation(s) During Past Five Years | | Length of Service as Fund Officer |
| | | |
Lana Lomuti 6/7/67 Assistant Treasurer | | Vice President (since 2007) and Director (2005-2007), within PGIM Investments Fund Administration; formerly Assistant Treasurer (December 2007-February 2014) of The Greater China Fund, Inc. | | Since April 2014 |
| | | |
Linda McMullin 7/10/61 Assistant Treasurer | | Vice President (since 2011) and Director (2008-2011) within PGIM Investments Fund Administration. | | Since April 2014 |
| | | |
Kelly A. Coyne 8/8/68 Assistant Treasurer | | Director, Investment Operations of Prudential Mutual Fund Services LLC (since 2010). | | Since March 2015 |
| | | |
Charles H. Smith 1/11/73 Anti-Money Laundering Compliance Officer | | Vice President, Corporate Compliance, Anti-Money Laundering Unit (since January 2015) of Prudential; committee member of the American Council of Life Insurers Anti-Money Laundering and Critical Infrastructure Committee (since January 2016); formerly Global Head of Economic Sanctions Compliance at AIG Property Casualty (February 2007-December 2014); Assistant Attorney General at the New York State Attorney General’s Office, Division of Public Advocacy. (August 1998-January 2007). | | Since January 2017 |
(a)Excludes Mr. Parker and Mr. Benjamin, interested Board Members who also serve as President and Vice President, respectively.
Explanatory Notes to Tables:
| ∎ | | Board Members are deemed to be “Interested,” as defined in the 1940 Act, by reason of their affiliation with PGIM Investments LLC and/or an affiliate of PGIM Investments LLC. |
| ∎ | | Unless otherwise noted, the address of all Board Members and Officers is c/o PGIM Investments LLC, 655 Broad Street, Newark, New Jersey 07102-4410. |
| ∎ | | There is no set term of office for Board Members or Officers. The Board Members have adopted a retirement policy, which calls for the retirement of Board Members on December 31 of the year in which they reach the age of 75. |
| ∎ | | “Other Directorships Held” includes only directorships of companies required to register or file reports with the SEC under the 1934 Act (that is, “public companies”) or other investment companies registered under the 1940 Act. |
| ∎ | | “Portfolios Overseen” includes all investment companies managed by PGIM Investments LLC. The investment companies for which PGIM Investments LLC serves as manager include the PGIM Funds, The Prudential Variable Contract Accounts, PGIM ETF Trust, PGIM High Yield Bond Fund, Inc., PGIM Global High Yield Fund, Inc., The Prudential Series Fund, Prudential’s Gibraltar Fund, Inc. and the Advanced Series Trust. |
Prudential Day One Funds
Approval of Advisory Agreements(unaudited)
The Funds’ Boards of Trustees
The Boards of Trustees (the “Board”) of the Prudential Day One Funds (each, a “Fund”, and collectively, the “Funds”)1 consists of eleven individuals, nine2 of whom are not “interested persons” of the Funds, as defined in the Investment Company Act of 1940, as amended (the “1940 Act”) (the “Independent Trustees”). The Board is responsible for the oversight of each Fund and its operations, and performs the various duties imposed on the directors of investment companies by the 1940 Act. The Independent Trustees have retained independent legal counsel to assist them in connection with their duties. The Chair of the Board is an Independent Trustee. The Board has established four standing committees: the Audit Committee, the Nominating and Governance Committee, and two Investment Committees. Each committee is chaired by, and composed of, Independent Trustees.
Annual Approval of the Funds’ Advisory Agreements
As required under the 1940 Act, the Board determines annually whether to renew each Fund’s management agreement with PGIM Investments LLC (“PGIM Investments”) and each Fund’s subadvisory agreement with QMA LLC (“QMA”). In considering the renewal of the agreements, the Board, including all of the Independent Trustees, met on May 30, 2019 and on June11-13, 2019 and approved the renewal of the agreements through July 31, 2020, after concluding that the renewal of the agreements was in the best interests of each Fund and its shareholders.
In advance of the meetings, the Board requested and received materials relating to the agreements, and had the opportunity to ask questions and request further information in connection with its consideration. Among other things, the Board considered comparative fee information from PGIM Investments and QMA. Also, the Board considered comparisons with other mutual funds in relevant Peer Universes and Peer Groups, as is further discussed below.
In approving the agreements, the Board, including the Independent Trustees advised by independent legal counsel, considered the factors it deemed relevant, including the nature, quality and extent of services provided, the performance of each Fund, the profitability of PGIM Investments and its affiliates, expenses and fees, and the potential for economies of scale that may be shared with each Fund and its shareholders as each Fund’s assets grow.
| 1 | Each of the Prudential Day One Funds is a series of Prudential Investment Portfolios 5. The Prudential Day One Funds are: Prudential Day One Income Fund, Prudential Day One 2010 Fund, Prudential Day One 2015 Fund, Prudential Day One 2020 Fund, Prudential Day One 2025 Fund, Prudential Day One 2030 Fund, Prudential Day One 2035 Fund, Prudential Day One 2040 Fund, Prudential Day One 2045 Fund, Prudential Day One 2050 Fund, Prudential Day One 2055 Fund, and Prudential Day One 2060 Fund. |
| 2 | Grace C. Torres was an Interested Trustee of the Fund at the time the Board considered and approved the renewal of the Fund’s advisory agreements, but has since become an Independent Trustee of the Fund. |
Approval of Advisory Agreements(continued)
In their deliberations, the Trustees did not identify any single factor which alone was responsible for the Board’s decision to approve the agreements with respect to each Fund. In connection with its deliberations, the Board considered information provided by PGIM Investments throughout the year at regular Board meetings, presentations from portfolio managers and other information, as well as information furnished at or in advance of the meetings on May 30, 2019 and on June11-13, 2019.
The Trustees determined that the overall arrangements between each Fund and PGIM Investments, which serves as each Fund’s investment manager pursuant to a management agreement, and between PGIM Investments and QMA, which serves as each Fund’s subadviser pursuant to the terms of a subadvisory agreement with PGIM Investments, are in the best interests of each Fund and its shareholders in light of the services performed, fees charged and such other matters as the Trustees considered relevant in the exercise of their business judgment.
The material factors and conclusions that formed the basis for the Trustees’ reaching their determinations to approve the continuance of the agreements are separately discussed below.
Nature, Quality and Extent of Services
The Board received and considered information regarding the nature, quality and extent of services provided to each Fund by PGIM Investments and QMA. The Board noted that QMA is affiliated with PGIM Investments. The Board considered the services provided by PGIM Investments, including but not limited to the oversight of the subadviser for each Fund, as well as the provision of fund recordkeeping, compliance and other services to each Fund, and PGIM Investments’ role as administrator for the Funds’ liquidity risk management program. With respect to PGIM Investments’ oversight of the subadviser, the Board noted that PGIM Investments’ Strategic Investment Research Group (“SIRG”), which is a business unit of PGIM Investments, is responsible for monitoring and reporting to PGIM Investments’ senior management on the performance and operations of the subadviser. The Board also considered that PGIM Investments pays the salaries of all of the officers and interested Trustees of the Funds who are part of Fund management. The Board also considered the investment subadvisory services provided by QMA, including investment research and security selection, as well as adherence to each Fund’s investment restrictions and compliance with applicable Fund policies and procedures. The Board considered PGIM Investments’ evaluation of the subadviser, as well as PGIM Investments’ recommendation, based on its review of the subadviser, to renew the subadvisory agreements.
The Board considered the qualifications, backgrounds and responsibilities of PGIM Investments’ senior management responsible for the oversight of each Fund and QMA, and also considered the qualifications, backgrounds and responsibilities of the QMA portfolio managers who are responsible for theday-to-day management of each Fund’s portfolio.
| | |
| Visit our website at pgiminvestments.com | | |
The Board was provided with information pertaining to PGIM Investments’ and QMA’s organizational structure, senior management, investment operations, and other relevant information pertaining to PGIM Investments and QMA. The Board also noted that it received favorable compliance reports from the Funds’ Chief Compliance Officer (“CCO”) as to each of PGIM Investments and QMA.
The Board concluded that it was satisfied with the nature, extent and quality of the investment management services provided by PGIM Investments and the subadvisory services provided to each Fund by QMA, and that there was a reasonable basis on which to conclude that each Fund benefits from the services provided by PGIM Investments and QMA under the management and subadvisory agreements.
Costs of Services and Profits Realized by PGIM Investments
The Board was provided with information on the profitability of PGIM Investments and its affiliates in serving as each Fund’s investment manager. The Board discussed with PGIM Investments the methodology utilized in assembling the information regarding profitability and considered its reasonableness. The Board recognized that it is difficult to make comparisons of profitability from fund management contracts because comparative information is not generally publicly available and is affected by numerous factors, including the structure of the particular adviser, the types of funds it manages, its business mix, numerous assumptions regarding allocations and the adviser’s capital structure and cost of capital. However, the Board considered that the cost of services provided by PGIM Investments during the year ended December 31, 2018 exceeded the management fees paid by each Fund, resulting in an operating loss to PGIM Investments. Taking these factors into account, the Board concluded that the profitability of PGIM Investments and its affiliates in relation to the services rendered was not unreasonable.
Economies of Scale
The Board received and discussed information concerning economies of scale that PGIM Investments may realize as each Fund’s assets grow beyond current levels. During the course of time, the Board has considered information regarding the launch date of each Fund, the management fees of the Funds compared to similarly managed funds and PGIM Investments’ investment in each Fund. The Board noted that economies of scale can be shared with each Fund in other ways, including low management fees from inception, additional technological and personnel investments to enhance shareholder services, and maintaining existing expense structures in the face of a rising cost environment. The Board also considered PGIM Investments’ assertion that it continually evaluates the management fee schedule of each Fund and the potential to share economies of scale through breakpoints or fee waivers as asset levels increase.
Approval of Advisory Agreements(continued)
The Board recognized the inherent limitations of any analysis of economies of scale, stemming largely from the Board’s understanding that most of PGIM Investments’ costs are not specific to individual funds, but rather are incurred across a variety of products and services.
Other Benefits to PGIM Investments and QMA
The Board considered potential ancillary benefits that might be received by PGIM Investments, QMA and their affiliates as a result of their relationship with each Fund. The Board concluded that potential benefits to be derived by PGIM Investments included transfer agency fees received by each Fund’s transfer agent (which is affiliated with PGIM Investments), and benefits to its reputation as well as other intangible benefits resulting from PGIM Investments’ association with the Funds. The Board concluded that the potential benefits to be derived by QMA included its ability to use soft dollar credits, as well as the potential benefits consistent with those generally resulting from an increase in assets under management, specifically, potential access to additional research resources and benefits to its reputation. The Board concluded that the benefits derived by PGIM Investments and QMA were consistent with the types of benefits generally derived by investment managers and subadvisers to mutual funds.
Performance of the Funds / Fees and Expenses
The Board considered certain additional factors and made related conclusions relating to the historical performance of each Fund for theone-year period ended December 31, 2018. The Board considered that each Fund commenced operations on December 13, 2016 and that longer-term performance was not yet available.
The Board also considered each Fund’s actual management fee, as well as each Fund’s net total expense ratio, for the fiscal year ended July 31, 2018. The Board considered the management fee for each Fund as compared to the management fee charged by PGIM Investments to other funds and the fee charged by other advisers to comparable mutual funds in a Peer Group. The actual management fee represents the fee rate actually paid by Fund shareholders and includes any fee waivers or reimbursements. The net total expense ratio for each Fund represents the actual expense ratio incurred by Fund shareholders.
The mutual funds included in the Peer Universe, which was used to consider performance, and the Peer Group, which was used to consider expenses and fees, for each Fund were objectively determined by Broadridge, an independent provider of mutual fund data. In certain circumstances, PGIM Investments also provided supplemental Peer Universe or Peer Group information, for reasons addressed with the Board. The comparisons placed each Fund in various quartiles over various periods, with the first quartile being the best 25% of the mutual funds (for performance, the best performing mutual funds and, for expenses, the lowest cost mutual funds).
| | |
| Visit our website at pgiminvestments.com | | |
The section below summarizes key factors considered by the Board and the Board’s conclusions regarding each Fund’s performance, fees and overall expenses. For each Fund, the table sets forth net performance comparisons (which reflect the impact on performance of any subsidies, expense caps or waivers that may be applicable) with the Peer Universe, actual management fees with the Peer Group (which reflect the impact of fund expenses, or any subsidies or fee waivers), and net total expenses with the Peer Group, each of which were key factors considered by the Board.
Prudential Day One Income Fund
| | | | | | | | |
| Net Performance | | 1 Year | | 3 Years | | 5 Years | | 10 Years |
| | | 2nd Quartile | | N/A | | N/A | | N/A |
| Actual Management Fees:1st Quartile |
| Net Total Expenses: 2nd Quartile |
| | • | | The Board noted that the Fund underperformed its benchmark index over theone-year period. |
| | • | | The Board noted that the Fund does not yet have a three-year performance record and that, therefore, the subadviser should have more time to develop that record. |
| | • | | The Board and PGIM Investments agreed to retain the Fund’s existing contractual expense cap which (exclusive of certain fees and expenses) caps total annual operating expenses at 1.15% for Class R1 shares, 0.90% for Class R2 shares, 0.75% for Class R3 shares, 0.65% for Class R4 shares, 0.55% for Class R5 shares, and 0.40% for Class R6 shares through November 30, 2019. |
| | • | | In addition, PGIM Investments is obligated to waive management fees or shared operating expenses on any share class to the same extent that it waives such expenses on any other share class. |
| | • | | The Board concluded that in light of the above, it would be in the best interests of the Fund and its shareholders to continue to allow the Fund to create a longer-term performance record, and to renew the agreements. |
| | • | | The Board concluded that the management fees (including subadvisory fees) and total expenses were reasonable in light of the services provided. |
Prudential Day One 2010 Fund
| | | | | | | | |
| Net Performance | | 1 Year | | 3 Years | | 5 Years | | 10 Years |
| | | 2nd Quartile | | N/A | | N/A | | N/A |
| Actual Management Fees:1st Quartile |
| Net Total Expenses: 1st Quartile |
Approval of Advisory Agreements(continued)
| | • | | The Board noted that the Fund underperformed its benchmark index over theone-year period. |
| | • | | The Board noted that the Fund does not yet have a three-year performance record and that, therefore, the subadviser should have more time to develop that record. |
| | • | | The Board and PGIM Investments agreed to retain the Fund’s existing contractual expense cap which (exclusive of certain fees and expenses) caps total annual operating expenses at 1.15% for Class R1 shares, 0.90% for Class R2 shares, 0.75% for Class R3 shares, 0.65% for Class R4 shares, 0.55% for Class R5 shares, and 0.40% for Class R6 shares through November 30, 2019. |
| | • | | In addition, PGIM Investments is obligated to waive management fees or shared operating expenses on any share class to the same extent that it waives such expenses on any other share class. |
| | • | | The Board concluded that in light of the above, it would be in the best interests of the Fund and its shareholders to continue to allow the Fund to create a longer-term performance record, and to renew the agreements. |
| | • | | The Board concluded that the management fees (including subadvisory fees) and total expenses were reasonable in light of the services provided. |
Prudential Day One 2015 Fund
| | | | | | | | |
| Net Performance | | 1 Year | | 3 Years | | 5 Years | | 10 Years |
| | | 2nd Quartile | | N/A | | N/A | | N/A |
| Actual Management Fees:1st Quartile |
| Net Total Expenses: 2nd Quartile |
| | • | | The Board noted that the Fund underperformed its benchmark index over theone-year period. |
| | • | | The Board noted that the Fund does not yet have a three-year performance record and that, therefore, the subadviser should have more time to develop that record. |
| | • | | The Board and PGIM Investments agreed to retain the Fund’s existing contractual expense cap which (exclusive of certain fees and expenses) caps total annual operating expenses at 1.15% for Class R1 shares, 0.90% for Class R2 shares, 0.75% for Class R3 shares, 0.65% for Class R4 shares, 0.55% for Class R5 shares, and 0.40% for Class R6 shares through November 30, 2019. |
| | • | | In addition, PGIM Investments is obligated to waive management fees or shared operating expenses on any share class to the same extent that it waives such expenses on any other share class. |
| | • | | The Board concluded that in light of the above, it would be in the best interests of the Fund and its shareholders to continue to allow the Fund to create a longer-term performance record, and to renew the agreements. |
| | |
| Visit our website at pgiminvestments.com | | |
| | • | | The Board concluded that the management fees (including subadvisory fees) and total expenses were reasonable in light of the services provided. |
Prudential Day One 2020 Fund
| | | | | | | | |
| Net Performance | | 1 Year | | 3 Years | | 5 Years | | 10 Years |
| | | 2nd Quartile | | N/A | | N/A | | N/A |
| Actual Management Fees:1st Quartile |
| Net Total Expenses: 1st Quartile |
| | • | | The Board noted that the Fund underperformed its benchmark index over theone-year period. |
| | • | | The Board noted that the Fund does not yet have a three-year performance record and that, therefore, the subadviser should have more time to develop that record. |
| | • | | The Board and PGIM Investments agreed to retain the Fund’s existing contractual expense cap which (exclusive of certain fees and expenses) caps total annual operating expenses at 1.15% for Class R1 shares, 0.90% for Class R2 shares, 0.75% for Class R3 shares, 0.65% for Class R4 shares, 0.55% for Class R5 shares, and 0.40% for Class R6 shares through November 30, 2019. |
| | • | | In addition, PGIM Investments is obligated to waive management fees or shared operating expenses on any share class to the same extent that it waives such expenses on any other share class. |
| | • | | The Board concluded that in light of the above, it would be in the best interests of the Fund and its shareholders to continue to allow the Fund to create a longer-term performance record, and to renew the agreements. |
| | • | | The Board concluded that the management fees (including subadvisory fees) and total expenses were reasonable in light of the services provided. |
Prudential Day One 2025 Fund
| | | | | | | | |
| Net Performance | | 1 Year | | 3 Years | | 5 Years | | 10 Years |
| | | 2nd Quartile | | N/A | | N/A | | N/A |
| Actual Management Fees:1st Quartile |
| Net Total Expenses: 1st Quartile |
| | • | | The Board noted that the Fund underperformed its benchmark index over theone-year period. |
| | • | | The Board noted that the Fund does not yet have a three-year performance record and that, therefore, the subadviser should have more time to develop that record. |
| | • | | The Board and PGIM Investments agreed to retain the Fund’s existing contractual expense cap, which (exclusive of certain fees and expenses) caps total annual operating |
Approval of Advisory Agreements(continued)
| | expenses at 1.15% for Class R1 shares, 0.90% for Class R2 shares, 0.75% for Class R3 shares, 0.65% for Class R4 shares, 0.55% for Class R5 shares, and 0.40% for Class R6 shares through November 30, 2019. |
| | • | | In addition, PGIM Investments is obligated to waive management fees or shared operating expenses on any share class to the same extent that it waives such expenses on any other share class. |
| | • | | The Board concluded that in light of the above, it would be in the best interests of the Fund and its shareholders to continue to allow the Fund to create a longer-term performance record, and to renew the agreements. |
| | • | | The Board concluded that the management fees (including subadvisory fees) and total expenses were reasonable in light of the services provided. |
Prudential Day One 2030 Fund
| | | | | | | | |
| Net Performance | | 1 Year | | 3 Years | | 5 Years | | 10 Years |
| | | 2nd Quartile | | N/A | | N/A | | N/A |
| Actual Management Fees:1st Quartile |
| Net Total Expenses: 1st Quartile |
| | • | | The Board noted that the Fund underperformed its benchmark index over theone-year period. |
| | • | | The Board noted that the Fund does not yet have a three-year performance record and that, therefore, the subadviser should have more time to develop that record. |
| | • | | The Board and PGIM Investments agreed to retain the Fund’s existing contractual expense cap which (exclusive of certain fees and expenses) caps total annual operating expenses at 1.15% for Class R1 shares, 0.90% for Class R2 shares, 0.75% for Class R3 shares, 0.65% for Class R4 shares, 0.55% for Class R5 shares, and 0.40% for Class R6 shares through November 30, 2019. |
| | • | | In addition, PGIM Investments is obligated to waive management fees or shared operating expenses on any share class to the same extent that it waives such expenses on any other share class. |
| | • | | The Board concluded that in light of the above, it would be in the best interests of the Fund and its shareholders to continue to allow the Fund to create a longer-term performance record, and to renew the agreements. |
| | • | | The Board concluded that the management fees (including subadvisory fees) and total expenses were reasonable in light of the services provided. |
| | |
| Visit our website at pgiminvestments.com | | |
Prudential Day One 2035 Fund
| | | | | | | | |
| Net Performance | | 1 Year | | 3 Years | | 5 Years | | 10 Years |
| | | 2nd Quartile | | N/A | | N/A | | N/A |
| Actual Management Fees:1st Quartile |
| Net Total Expenses: 1st Quartile |
| | • | | The Board noted that the Fund underperformed its benchmark index over theone-year period. |
| | • | | The Board noted that the Fund does not yet have a three-year performance record and that, therefore, the subadviser should have more time to develop that record. |
| | • | | The Board and PGIM Investments agreed to retain the Fund’s existing contractual expense cap which (exclusive of certain fees and expenses) caps total annual operating expenses at 1.15% for Class R1 shares, 0.90% for Class R2 shares, 0.75% for Class R3 shares, 0.65% for Class R4 shares, 0.55% for Class R5 shares, and 0.40% for Class R6 shares through November 30, 2019. |
| | • | | In addition, PGIM Investments is obligated to waive management fees or shared operating expenses on any share class to the same extent that it waives such expenses on any other share class. |
| | • | | The Board concluded that in light of the above, it would be in the best interests of the Fund and its shareholders to continue to allow the Fund to create a longer-term performance record, and to renew the agreements. |
| | • | | The Board concluded that the management fees (including subadvisory fees) and total expenses were reasonable in light of the services provided. |
Prudential Day One 2040 Fund
| | | | | | | | |
| Net Performance | | 1 Year | | 3 Years | | 5 Years | | 10 Years |
| | | 2nd Quartile | | N/A | | N/A | | N/A |
| Actual Management Fees:1st Quartile |
| Net Total Expenses: 1st Quartile |
| | • | | The Board noted that the Fund underperformed its benchmark index over theone-year period. |
| | • | | The Board noted that the Fund does not yet have a three-year performance record and that, therefore, the subadviser should have more time to develop that record. |
| | • | | The Board and PGIM Investments agreed to retain the Fund’s existing contractual expense cap, which (exclusive of certain fees and expenses) caps total annual operating expenses at 1.15% for Class R1 shares, 0.90% for Class R2 shares, 0.75% for Class R3 shares, 0.65% for Class R4 shares, 0.55% for Class R5 shares, and 0.40% for Class R6 shares through November 30, 2019. |
Approval of Advisory Agreements(continued)
| | • | | In addition, PGIM Investments is obligated to waive management fees or shared operating expenses on any share class to the same extent that it waives such expenses on any other share class. |
| | • | | The Board concluded that in light of the above, it would be in the best interests of the Fund and its shareholders to continue to allow the Fund to create a longer-term performance record, and to renew the agreements. |
| | • | | The Board concluded that the management fees (including subadvisory fees) and total expenses were reasonable in light of the services provided. |
Prudential Day One 2045 Fund
| | | | | | | | |
| Net Performance | | 1 Year | | 3 Years | | 5 Years | | 10 Years |
| | | 2nd Quartile | | N/A | | N/A | | N/A |
| Actual Management Fees:1st Quartile |
| Net Total Expenses: 1st Quartile |
| | • | | The Board noted that the Fund underperformed its benchmark index over theone-year period. |
| | • | | The Board noted that the Fund does not yet have a three-year performance record and that, therefore, the subadviser should have more time to develop that record. |
| | • | | The Board and PGIM Investments agreed to retain the Fund’s existing contractual expense cap which (exclusive of certain fees and expenses) caps total annual operating expenses at 1.15% for Class R1 shares, 0.90% for Class R2 shares, 0.75% for Class R3 shares, 0.65% for Class R4 shares, 0.55% for Class R5 shares, and 0.40% for Class R6 shares through November 30, 2019. |
| | • | | In addition, PGIM Investments is obligated to waive management fees or shared operating expenses on any share class to the same extent that it waives such expenses on any other share class. |
| | • | | The Board concluded that in light of the above, it would be in the best interests of the Fund and its shareholders to continue to allow the Fund to create a longer-term performance record, and to renew the agreements. |
| | • | | The Board concluded that the management fees (including subadvisory fees) and total expenses were reasonable in light of the services provided. |
Prudential Day One 2050 Fund
| | | | | | | | |
| Net Performance | | 1 Year | | 3 Years | | 5 Years | | 10 Years |
| | | 2nd Quartile | | N/A | | N/A | | N/A |
| Actual Management Fees:1st Quartile |
| Net Total Expenses: 1st Quartile |
| | |
| Visit our website at pgiminvestments.com | | |
| | • | | The Board noted that the Fund underperformed its benchmark index over theone-year period. |
| | • | | The Board noted that the Fund does not yet have a three-year performance record and that, therefore, the subadviser should have more time to develop that record. |
| | • | | The Board and PGIM Investments agreed to retain the Fund’s existing contractual expense cap which (exclusive of certain fees and expenses) caps total annual operating expenses at 1.15% for Class R1 shares, 0.90% for Class R2 shares, 0.75% for Class R3 shares, 0.65% for Class R4 shares, 0.55% for Class R5 shares, and 0.40% for Class R6 shares through November 30, 2019. |
| | • | | In addition, PGIM Investments is obligated to waive management fees or shared operating expenses on any share class to the same extent that it waives such expenses on any other share class. |
| | • | | The Board concluded that in light of the above, it would be in the best interests of the Fund and its shareholders to continue to allow the Fund to create a longer-term performance record, and to renew the agreements. |
| | • | | The Board concluded that the management fees (including subadvisory fees) and total expenses were reasonable in light of the services provided. |
Prudential Day One 2055 Fund
| | | | | | | | |
| Net Performance | | 1 Year | | 3 Years | | 5 Years | | 10 Years |
| | | 3rd Quartile | | N/A | | N/A | | N/A |
| Actual Management Fees:1st Quartile |
| Net Total Expenses: 1st Quartile |
| | • | | The Board noted that the Fund underperformed its benchmark index over theone-year period. |
| | • | | The Board noted that the Fund does not yet have a three-year performance record and that, therefore, the subadviser should have more time to develop that record. |
| | • | | The Board and PGIM Investments agreed to retain the Fund’s existing contractual expense cap, which (exclusive of certain fees and expenses) caps total annual operating expenses at 1.15% for Class R1 shares, 0.90% for Class R2 shares, 0.75% for Class R3 shares, 0.65% for Class R4 shares, 0.55% for Class R5 shares, and 0.40% for Class R6 shares through November 30, 2019. |
| | • | | In addition, PGIM Investments is obligated to waive management fees or shared operating expenses on any share class to the same extent that it waives such expenses on any other share class. |
| | • | | The Board concluded that in light of the above, it would be in the best interests of the Fund and its shareholders to continue to allow the Fund to create a longer-term performance record, and to renew the agreements. |
Approval of Advisory Agreements(continued)
| | • | | The Board concluded that the management fees (including subadvisory fees) and total expenses were reasonable in light of the services provided. |
Prudential Day One 2060 Fund
| | | | | | | | |
| Net Performance | | 1 Year | | 3 Years | | 5 Years | | 10 Years |
| | | 3rd Quartile | | N/A | | N/A | | N/A |
| Actual Management Fees:1st Quartile |
| Net Total Expenses: 1st Quartile |
| | • | | The Board noted that the Fund underperformed its benchmark index over theone-year period. |
| | • | | The Board noted that the Fund does not yet have a three-year performance record and that, therefore, the subadviser should have more time to develop that record. |
| | • | | The Board and PGIM Investments agreed to retain the Fund’s existing contractual expense cap, which (exclusive of certain fees and expenses) caps total annual operating expenses at 1.15% for Class R1 shares, 0.90% for Class R2 shares, 0.75% for Class R3 shares, 0.65% for Class R4 shares, 0.55% for Class R5 shares, and 0.40% for Class R6 shares through November 30, 2019. |
| | • | | In addition, PGIM Investments is obligated to waive management fees or shared operating expenses on any share class to the same extent that it waives such expenses on any other share class. |
| | • | | The Board concluded that in light of the above, it would be in the best interests of the Fund and its shareholders to continue to allow the Fund to create a longer-term performance record, and to renew the agreements. |
| | • | | The Board concluded that the management fees (including subadvisory fees) and total expenses were reasonable in light of the services provided. |
* * *
After full consideration of these factors, the Board concluded that approval of the agreements was in the best interests of each Fund and its shareholders.
| | |
| Visit our website at pgiminvestments.com | | |
| | | | |
| | |
| ∎ MAIL | | ∎ TELEPHONE | | ∎ WEBSITE |
655 Broad Street Newark, NJ 07102 | | (800) 225-1852 | | pgiminvestments.com |
|
| PROXY VOTING |
| The Board of Trustees of the Funds has delegated to the Funds’ subadviser the responsibility for voting any proxies and maintaining proxy recordkeeping with respect to the Funds. A description of these proxy voting policies and procedures is available without charge, upon request, by calling (800) 225-1852 or by visiting the Securities and Exchange Commission’s website atsec.gov. Information regarding how the Funds voted proxies relating to portfolio securities during the most recent 12-month period ended June 30 is available on the Funds’ websiteand on the Commission’s website at sec.gov. |
|
| TRUSTEES |
| Ellen S. Alberding• Kevin J. Bannon• Scott E. Benjamin• Linda W. Bynoe• Barry H. Evans • Keith F. Hartstein• Laurie Simon Hodrick• Michael S. Hyland• Stuart S. Parker • Brian K. Reid • Grace C. Torres |
|
| OFFICERS |
| Stuart S. Parker,President• Scott E. Benjamin,Vice President• Christian J. Kelly,Treasurer and Principal Financial and Accounting Officer• Raymond A. O’Hara,Chief Legal Officer •Dino Capasso,Chief Compliance Officer • Andrew R. French,Secretary• Jonathan D. Shain,Assistant Secretary• Claudia DiGiacomo,Assistant Secretary• Diana N. Huffman,Assistant Secretary•Peter Parrella,Assistant Treasurer • Lana Lomuti,Assistant Treasurer • Linda McMullin,Assistant Treasurer• Kelly Coyne,Assistant Treasurer• Charles H. Smith,Anti-Money Laundering Compliance Officer |
| | | | |
| MANAGER | | PGIM Investments LLC | | 655 Broad Street Newark, NJ 07102 |
|
| SUBADVISER | | QMA LLC | | Gateway Center Two 100 Mulberry Street Newark, NJ 07102 |
|
| DISTRIBUTOR | | Prudential Investment Management Services LLC | | 655 Broad Street Newark, NJ 07102 |
|
| CUSTODIAN | | The Bank of New York Mellon | | 240 Greenwich Street New York, NY 10286 |
|
| TRANSFER AGENT | | Prudential Mutual Fund Services LLC | | PO Box 9658 Providence, RI 02940 |
|
INDEPENDENT REGISTERED
PUBLIC ACCOUNTING FIRM | | KPMG LLP | | 345 Park Avenue New York, NY 10154 |
|
| FUND COUNSEL | | Willkie Farr & Gallagher LLP | | 787 Seventh Avenue New York, NY 10019 |
|
|
| An investor should consider the investment objectives, risks, charges, and expenses of the Funds carefully before investing. The prospectus and summary prospectus for each Fund contain this and other information about the Funds. An investor may obtain a prospectus and summary prospectus by visiting our website atpgiminvestments.com or by calling (800) 225-1852. The prospectus and summary prospectus should be read carefully before investing. |
|
| E-DELIVERY |
| To receive your mutual fund documents online, go topgiminvestments.com/edeliveryand enroll. Instead of receiving printed documents by mail, you will receive notification via email when new materials are available. You can cancel your enrollment or change your email address at any time by visiting the website address above. |
|
| SHAREHOLDER COMMUNICATIONS WITH TRUSTEES |
| Shareholders can communicate directly with the Board of Trustees by writing to the Chair of the Board, Prudential Day One Funds, PGIM Investments, Attn: Board of Trustees, 655 Broad Street, Newark, NJ 07102. Shareholders can communicate directly with an individual Trustee by writing to the same address. Communications are not screened before being delivered to the addressee. |
|
| AVAILABILITY OF PORTFOLIO SCHEDULE |
| Each Fund files its complete schedule of portfolio holdings with the Securities and Exchange Commission for the first and third quarters of each fiscal year on Form N-PORT. Each Fund’sForm N-PORT filings are available on the Commission’s website at sec.gov. Form N-PORT is filed with the Commission quarterly, and each Fund’s full portfolio holdings as of the first and third fiscal quarter-ends will be made publicly available 60 days after the end of each quarter. |
|
| The Funds’ Statement of Additional Information contains additional information about the Funds’ Trustees and is available without charge, upon request, by calling (800) 225-1852. |
Mutual Funds:
| | | | |
ARE NOT INSURED BY THE FDIC OR ANY
FEDERAL GOVERNMENT AGENCY | | MAY LOSE VALUE | | ARE NOT A DEPOSIT OF OR GUARANTEED
BY ANY BANK OR ANY BANK AFFILIATE |
| | | | | | | | | | | | | | | | | | | | |
| PRUDENTIAL DAY ONE FUNDS | | NASDAQ | | CUSIP | | | | | | NASDAQ | | CUSIP | | | | | | NASDAQ | | CUSIP |
| Prudential Day One Income Fund (Share Class R1) | | PDADX | | 74445D109 | | | | Prudential Day One 2025 Fund (Share Class R1) | | PDEDX | | 74445D711 | | | | Prudential Day One 2045 Fund (Share Class R1) | | PDIDX | | 74445D448 |
| Prudential Day One Income Fund (Share Class R2) | | PDAEX | | 74445D208 | | | | Prudential Day One 2025 Fund (Share Class R2) | | PDEEX | | 74445D695 | | | | Prudential Day One 2045 Fund (Share Class R2) | | PDIEX | | 74445D430 |
| Prudential Day One Income Fund (Share Class R3) | | PDAFX | | 74445D307 | | | | Prudential Day One 2025 Fund (Share Class R3) | | PDEFX | | 74445D687 | | | | Prudential Day One 2045 Fund (Share Class R3) | | PDIKX | | 74445D422 |
| Prudential Day One Income Fund (Share Class R4) | | PDAGX | | 74445D406 | | | | Prudential Day One 2025 Fund (Share Class R4) | | PDEGX | | 74445D679 | | | | Prudential Day One 2045 Fund (Share Class R4) | | PDIGX | | 74445D414 |
| Prudential Day One Income Fund (Share Class R5) | | PDAHX | | 74445D505 | | | | Prudential Day One 2025 Fund (Share Class R5) | | PDEHX | | 74445D661 | | | | Prudential Day One 2045 Fund (Share Class R5) | | PDIHX | | 74445D398 |
| Prudential Day One Income Fund (Share Class R6) | | PDAJX | | 74445D604 | | | | Prudential Day One 2025 Fund (Share Class R6) | | PDEJX | | 74445D653 | | | | Prudential Day One 2045 Fund (Share Class R6) | | PDIJX | | 74445D380 |
| Prudential Day One 2010 Fund (Share Class R1) | | PDBDX | | 74445D703 | | | | Prudential Day One 2030 Fund (Share Class R1) | | PDFCX | | 74445D646 | | | | Prudential Day One 2050 Fund (Share Class R1) | | PDJDX | | 74445D372 |
| Prudential Day One 2010 Fund (Share Class R2) | | PDBEX | | 74445D802 | | | | Prudential Day One 2030 Fund (Share Class R2) | | PDFEX | | 74445D638 | | | | Prudential Day One 2050 Fund (Share Class R2) | | PDJEX | | 74445D364 |
| Prudential Day One 2010 Fund (Share Class R3) | | PDBFX | | 74445D885 | | | | Prudential Day One 2030 Fund (Share Class R3) | | PDFFX | | 74445D620 | | | | Prudential Day One 2050 Fund (Share Class R3) | | PDJFX | | 74445D356 |
| Prudential Day One 2010 Fund (Share Class R4) | | PDBGX | | 74445D877 | | | | Prudential Day One 2030 Fund (Share Class R4) | | PDFGX | | 74445D612 | | | | Prudential Day One 2050 Fund (Share Class R4) | | PDJGX | | 74445D349 |
| Prudential Day One 2010 Fund (Share Class R5) | | PDBHX | | 74445D869 | | | | Prudential Day One 2030 Fund (Share Class R5) | | PDFHX | | 74445D596 | | | | Prudential Day One 2050 Fund (Share Class R5) | | PDJHX | | 74445D331 |
| Prudential Day One 2010 Fund (Share Class R6) | | PDBJX | | 74445D851 | | | | Prudential Day One 2030 Fund (Share Class R6) | | PDFJX | | 74445D588 | | | | Prudential Day One 2050 Fund (Share Class R6) | | PDJJX | | 74445D323 |
| Prudential Day One 2015 Fund (Share Class R1) | | PDCDX | | 74445D844 | | | | Prudential Day One 2035 Fund (Share Class R1) | | PDGCX | | 74445D570 | | | | Prudential Day One 2055 Fund (Share Class R1) | | PDKDX | | 74445D315 |
| Prudential Day One 2015 Fund (Share Class R2) | | PDCEX | | 74445D836 | | | | Prudential Day One 2035 Fund (Share Class R2) | | PDGEX | | 74445D562 | | | | Prudential Day One 2055 Fund (Share Class R2) | | PDKEX | | 74445D299 |
| Prudential Day One 2015 Fund (Share Class R3) | | PDCFX | | 74445D828 | | | | Prudential Day One 2035 Fund (Share Class R3) | | PDGFX | | 74445D554 | | | | Prudential Day One 2055 Fund (Share Class R3) | | PDKFX | | 74445D281 |
| Prudential Day One 2015 Fund (Share Class R4) | | PDCGX | | 74445D810 | | | | Prudential Day One 2035 Fund (Share Class R4) | | PDGGX | | 74445D547 | | | | Prudential Day One 2055 Fund (Share Class R4) | | PDKGX | | 74445D273 |
| Prudential Day One 2015 Fund (Share Class R5) | | PDCHX | | 74445D794 | | | | Prudential Day One 2035 Fund (Share Class R5) | | PDGHX | | 74445D539 | | | | Prudential Day One 2055 Fund (Share Class R5) | | PDKHX | | 74445D265 |
| Prudential Day One 2015 Fund (Share Class R6) | | PDCJX | | 74445D786 | | | | Prudential Day One 2035 Fund (Share Class R6) | | PDGJX | | 74445D521 | | | | Prudential Day One 2055 Fund (Share Class R6) | | PDKJX | | 74445D257 |
| Prudential Day One 2020 Fund (Share Class R1) | | PDDDX | | 74445D778 | | | | Prudential Day One 2040 Fund (Share Class R1) | | PDHDX | | 74445D513 | | | | Prudential Day One 2060 Fund (Share Class R1) | | PDLDX | | 74445D240 |
| Prudential Day One 2020 Fund (Share Class R2) | | PDDEX | | 74445D760 | | | | Prudential Day One 2040 Fund (Share Class R2) | | PDHEX | | 74445D497 | | | | Prudential Day One 2060 Fund (Share Class R2) | | PDLEX | | 74445D232 |
| Prudential Day One 2020 Fund (Share Class R3) | | PDDFX | | 74445D752 | | | | Prudential Day One 2040 Fund (Share Class R3) | | PDHFX | | 74445D489 | | | | Prudential Day One 2060 Fund (Share Class R3) | | PDLFX | | 74445D224 |
| Prudential Day One 2020 Fund (Share Class R4) | | PDDGX | | 74445D745 | | | | Prudential Day One 2040 Fund (Share Class R4) | | PDHGX | | 74445D471 | | | | Prudential Day One 2060 Fund (Share Class R4) | | PDLGX | | 74445D216 |
| Prudential Day One 2020 Fund (Share Class R5) | | PDDHX | | 74445D737 | | | | Prudential Day One 2040 Fund (Share Class R5) | | PDHHX | | 74445D463 | | | | Prudential Day One 2060 Fund (Share Class R5) | | PDLHX | | 74445D190 |
| Prudential Day One 2020 Fund (Share Class R6) | | PDDJX | | 74445D729 | | | | Prudential Day One 2040 Fund (Share Class R6) | | PDHJX | | 74445D455 | | | | Prudential Day One 2060 Fund (Share Class R6) | | PDLJX | | 74445D182 |
MF236E

PGIM 60/40 ALLOCATION FUND
ANNUAL REPORT
JULY 31, 2019

|
| Objective:Seek a balance between growth and conservation of capital. |
Highlights
| • | | The Fund is comprised of two underlying funds: the PGIM Total Return Bond Fund and the PGIM QMA Large-Cap Core Equity Fund. |
| • | | The Fund benefited from its underlying position in the PGIM Total Return Bond Fund, which outperformed its benchmark—the Bloomberg Barclays US Aggregate Bond Index—by 1.32% during the period for the 12-month period ending July 31, 2019. |
| • | | The Fund’s underlying stock position in the PGIM QMA Large-Cap Core Equity Fund underperformed its benchmark—the S&P 500 Index—by 3.76% during the period. |
| • | | The Fund benefited most from its exposure to bonds versus stocks, as the Bloomberg Barclays US Aggregate Bond Index outperformed the S&P 500 by 0.09% during the period. |
This report is not authorized for distribution to prospective investors unless preceded or accompanied by a current prospectus.
The views expressed in this report and information about the Fund’s portfolio holdings are for the period covered by this report and are subject to change thereafter.
Mutual funds are distributed by Prudential Investment Management Services LLC, a Prudential Financial company and member SIPC. QMA is the primary business name of QMA LLC, a registered investment adviser and, a wholly owned subsidiary of PGIM, Inc. (PGIM), a Prudential Financial company.© 2019 Prudential Financial, Inc. and its related entities. PGIM and the PGIM logo are service marks of Prudential Financial, Inc. and its related entities, registered in many jurisdictions worldwide.
| | |
| 2 | | Visit our website at pgiminvestments.com |
Table of Contents
| | | | |
| PGIM 60/40 Allocation Fund | | | 3 | |
This Page Intentionally Left Blank
Your Fund’s Performance(unaudited)
Performance data quoted represents past performance. Past performance does not guarantee future results. The investment return and principal value of an investment will fluctuate, so that an investor’s shares, when redeemed, may be worth more or less than their original cost. Current performance may be lower or higher than the past performance data quoted.
| | | | |
| |
| | | Average Annual Total Returns as of 7/31/19 |
| | | One Year (%) | | Since Inception (%) |
| Fund | | 6.73 | | 8.54 (9/13/17) |
| Custom Benchmark Index | | | | |
| | 8.47 | | 8.95 |
| Lipper Mixed Asset Target Allocation Growth Funds Average |
| | | 3.57 | | 6.20 |
Growth of a $10,000 Investment
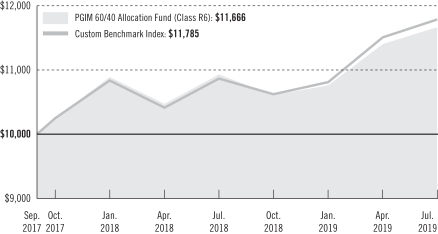
The graph compares a $10,000 investment in the Fund with a similar investment in the Custom Benchmark Index (60% S&P 500 Index/40% Bloomberg Barclays US Aggregate Bond Index) by portraying the initial account values at the commencement of operations (September 13, 2017) and the account values at the end of the current fiscal year (July 31, 2019), as measured on a quarterly basis. For purposes of the graph, and unless otherwise indicated, it has been assumed that (a) all recurring fees (including management fees) were deducted; and (b) all dividends and distributions were reinvested. Without waiver of fees and/or expense reimbursements, the returns would have been lower.
| | | | |
| PGIM 60/40 Allocation Fund | | | 5 | |
Your Fund’s Performance(continued)
Past performance does not predict future performance. Total returns and the ending account values in the graph include changes in share price and reinvestment of dividends and capital gains distributions in a hypothetical investment for the periods shown. The Fund’s total returns do not reflect the deduction of income taxes on an individual’s investment. Taxes may reduce your actual investment returns on income or gains paid by the Fund or any gains you may realize if you sell your shares.
Source: PGIM Investments LLC and Lipper Inc.
The returns in the tables do not reflect the deduction of taxes that a shareholder would pay on Fund distributions or following the redemption of Fund shares. Since Inception returns are provided since the Fund has less than 10 fiscal years of returns. Since Inception returns for the Index and the Lipper Average are measured from the closest month-end to the Fund’s inception date.
Benchmark Definitions
Custom Benchmark Index—The Custom Benchmark is comprised of 60% S&P 500 Index and 40% Bloomberg Barclays US Aggregate Bond Index.
Lipper Mixed Asset Target Allocation Growth Funds Average—Lipper Mixed Asset Target Allocation Growth Funds Average are funds that by portfolio practice maintain a mix of between 60%-80% equity securities, with the remainder invested in bonds, cash, and cash equivalents.
Investors cannot invest directly in an index or average. The returns for the Index would be lower if they included the effects of sales charges, operating expenses of a mutual fund, or taxes. Returns for the Lipper Average reflect the deduction of operating expenses, but not sales charges or taxes.
Presentation of Fund Holdings
| | | | |
60/40 Allocation Ten Largest Holdings | | Line of Business | | % of Net Assets |
| PGIM QMA Large-Cap Core Equity Fund | | Large Cap | | 59.6% |
| PGIM Total Return Bond Fund | | Total Return Bond | | 40.3% |
For a complete list of holdings, please refer to the Schedule of Investments section of this report. Holdings reflect only long-term Investments. Holdings/Issues/Industries/Sectors are subject to change.
| | |
| 6 | | Visit our website at pgiminvestments.com |
PGIM 60/40 Allocation Fund
Strategy and Performance Overview
How did the Fund perform?
ThePGIM 60/40 Allocation Fund’s Class R6 shares returned 6.73% in the 12-month reporting period that ended July 31, 2019, underperforming the 8.47% return of its custom benchmark—a 60%/40% blend of the S&P 500 Index and the Bloomberg Barclays US Aggregate Bond Index, respectively.
What were the market conditions?
| • | | US stocks performed strongly during the reporting period. Large-cap equities led the way, significantly outpacing their mid- and small-cap counterparts. International and emerging-markets equities fell, notably trailing US large-cap stocks. |
| • | | The bond market delivered mixed returns during the period. The best performance was in US core bonds, which outperformed nearly all other fixed income asset classes. US investment-grade corporate bonds posted a double-digit gain, outperforming the strong performance of US government nominal bonds. |
What worked?
| • | | The Fund benefited most from its exposure to bonds versus stocks, as the Bloomberg Barclays US Aggregate Bond Index outperformed the S&P 500 by 0.09% during the period. |
| • | | The Fund also benefited from its underlying position in the PGIM Total Return Bond Fund, which outperformed its benchmark—the Bloomberg Barclays US Aggregate Bond Index—by 1.32% during the period. |
What didn’t work?
| • | | The Fund’s underlying stock position in the PGIM QMA Large-Cap Core Equity Fund underperformed its benchmark—the S&P 500 Index—by 3.76% during the period. |
Current outlook
| • | | QMA believes that US-China interests have permanently diverged and should be viewed in the context of a geopolitical competition that is unlikely to be resolved by a trade deal. |
| • | | QMA believes the current tensions are likely to persist for some time, albeit with some ebb and flow. A positive scenario for risk assets could involve a US-China trade truce ahead of the 2020 US presidential election, along with continued central bank dovishness (i.e., moderating their stance on interest rate hikes) and additional China stimulus. |
| | | | |
| PGIM 60/40 Allocation Fund | | | 7 | |
Fees and Expenses
As a shareholder of the Fund, you incur two types of costs: (1) transaction costs, including sales charges (loads) on purchase payments and redemptions, as applicable, and (2) ongoing costs, including management fees, distribution, and/or service (12b-1) fees, and other Fund expenses, as applicable. This example is intended to help you understand your ongoing costs (in dollars) of investing in the Fund and to compare these costs with the ongoing costs of investing in other mutual funds.
The example is based on an investment of $1,000 held through the six-month period ended July 31, 2019. The example is for illustrative purposes only; you should consult the Prospectus for information on initial and subsequent minimum investment requirements.
Actual Expenses
The first line in the table on the following page provides information about actual account values and actual expenses. You may use the information on this line, together with the amount you invested, to estimate the expenses that you paid over the period. Simply divide your account value by $1,000 (for example, an $8,600 account value ÷ $1,000 = 8.6), then multiply the result by the number on the first line under the heading “Expenses Paid During the Six-Month Period” to estimate the expenses you paid on your account during this period.
Hypothetical Example for Comparison Purposes
The second line in the table on the following page provides information about hypothetical account values and hypothetical expenses based on the Fund’s actual expense ratio and an assumed rate of return of 5% per year before expenses, which is not the Fund’s actual return. The hypothetical account values and expenses may not be used to estimate the actual ending account balance or expenses you paid for the period. You may use this information to compare the ongoing costs of investing in the Fund and other funds. To do so, compare this 5% hypothetical example with the 5% hypothetical examples that appear in the shareholder reports of the other funds.
The Fund’s transfer agent may charge additional fees to holders of certain accounts that are not included in the expenses shown in the table on the following page. These fees apply to individual retirement accounts (IRAs) and Section 403(b) accounts. As of the close of the six-month period covered by the table, IRA fees included an annual maintenance fee of $15 per account (subject to a maximum annual maintenance fee of $25 for all accounts held by the same shareholder). Section 403(b) accounts are charged an annual $25 fiduciary maintenance fee. Some of the fees may vary in amount, or may be waived, based on your total account balance or the number of Prudential funds, including the Fund, that you own. You should consider the additional fees that were charged to your Fund account over the six-month period when you estimate the total ongoing expenses paid over the
| | |
| 8 | | Visit our website at pgiminvestments.com |
period and the impact of these fees on your ending account value, as these additional expenses are not reflected in the information provided in the expense table. Additional fees have the effect of reducing investment returns.
Please note that the expenses shown in the table are meant to highlight your ongoing costs only and do not reflect any transactional costs such as sales charges (loads). Therefore, the second line in the table is useful in comparing ongoing costs only and will not help you determine the relative total costs of owning different funds. In addition, if these transactional costs were included, your costs would have been higher.
| | | | | | | | | | | | | | | | | | |
| | | | | |
PGIM 60/40
Allocation Fund | | Beginning Account
Value
February 1, 2019 | | | Ending Account
Value
July 31, 2019 | | | Annualized
Expense Ratio
Based on the
Six-Month Period | | | Expenses Paid
During the
Six-Month Period* | |
| Class R6 | | Actual | | $ | 1,000.00 | | | $ | 1,084.10 | | | | 0.40 | % | | $ | 2.07 | |
| | | Hypothetical | | $ | 1,000.00 | | | $ | 1,022.81 | | | | 0.40 | % | | $ | 2.01 | |
*Fund expenses (net of fee waivers or subsidies, if any) are equal to the annualized expense ratio (provided in the table), multiplied by the average account value over the period, multiplied by the 181 days in the six-month period ended July 31, 2019, and divided by 365 days in the Fund’s fiscal year ended July 31, 2019 (to reflect the six-month period). Expenses presented in the table include the expenses of any underlying portfolios in which the Fund may invest.
| | | | |
| PGIM 60/40 Allocation Fund | | | 9 | |
PGIM 60/40 Allocation Fund
Schedule of Investments
as of July 31, 2019
| | | | | | | | |
| Description | | Shares | | | Value | |
LONG-TERM INVESTMENTS 99.9% | | | | | | | | |
| | |
AFFILIATED MUTUAL FUNDS | | | | | | | | |
PGIM QMALarge-Cap Core Equity Fund (Class R6) | | | 657,818 | | | $ | 10,136,981 | |
PGIM Total Return Bond Fund (Class R6) | | | 465,064 | | | | 6,868,996 | |
| | | | | | | | |
TOTAL LONG-TERM INVESTMENTS
(cost $15,482,380) | | | | | | | 17,005,977 | |
| | | | | | | | |
| | |
SHORT-TERM INVESTMENT 0.5% | | | | | | | | |
| | |
AFFILIATED MUTUAL FUND | | | | | | | | |
PGIM Core Ultra Short Bond Fund
(cost $79,196) | | | 79,196 | | | | 79,196 | |
| | | | | | | | |
TOTAL INVESTMENTS 100.4%
(cost $15,561,576)(w) | | | | | | | 17,085,173 | |
Liabilities in excess of other assets (0.4)% | | | | | | | (65,733 | ) |
| | | | | | | | |
NET ASSETS 100.0% | | | | | | $ | 17,019,440 | |
| | | | | | | | |
| (w) | PGIM Investments LLC, the manager of the Fund, also serves as the manager of the underlying funds in which the Fund invests. |
Fair Value Measurements:
Various inputs are used in determining the value of the Fund’s investments. These inputs are summarized in the three broad levels listed below.
Level 1—unadjusted quoted prices generally in active markets for identical securities.
Level 2—quoted prices for similar securities, interest rates and yield curves, prepayment speeds, foreign currency exchange rates and other observable inputs.
Level 3—unobservable inputs for securities valued in accordance with Board approved fair valuation procedures.
The following is a summary of the inputs used as of July 31, 2019 in valuing such portfolio securities:
| | | | | | | | | | | | |
| | | Level 1 | | | Level 2 | | | Level 3 | |
Investments in Securities | | | | | | | | | | | | |
Affiliated Mutual Funds | | $ | 17,085,173 | | | $ | — | | | $ | — | |
| | | | | | | | | | | | |
See Notes to Financial Statements.
| | | | |
| PGIM 60/40 Allocation Fund | | | 11 | |
PGIM 60/40 Allocation Fund
Schedule of Investments (continued)
as of July 31, 2019
Investment Allocation:
The investment allocation of portfolio holdings and liabilities in excess of other assets shown as a percentage of net assets as of July 31, 2019 were as follows (unaudited):
| | | | |
Large Cap | | | 59.6 | % |
Total Return Bond | | | 40.3 | |
Short Term | | | 0.5 | |
| | | | |
| | | 100.4 | |
Liabilities in excess of other assets | | | (0.4 | ) |
| | | | |
| | | 100.0 | % |
| | | | |
See Notes to Financial Statements.
Statement of Assets & Liabilities
as of July 31, 2019
| | | | |
Assets | | | | |
Affiliated investments (cost $15,561,576) | | $ | 17,085,173 | |
Receivable for Fund shares sold | | | 265,324 | |
Due from Manager | | | 19,160 | |
Dividends receivable | | | 16,397 | |
| | | | |
Total Assets | | | 17,386,054 | |
| | | | |
| |
Liabilities | | | | |
Payable for investments purchased | | | 280,767 | |
Custodian and accounting fees payable | | | 49,117 | |
Audit fee payable | | | 22,727 | |
Accrued expenses and other liabilities | | | 13,976 | |
Payable for Fund shares reacquired | | | 14 | |
Affiliated transfer agent fee payable | | | 13 | |
| | | | |
Total Liabilities | | | 366,614 | |
| | | | |
| |
Net Assets | | $ | 17,019,440 | |
| | | | |
| | | | | |
Net assets were comprised of: | | | | |
Shares of beneficial interest, at par | | $ | 1,534 | |
Paid-in capital in excess of par | | | 15,442,313 | |
Total distributable earnings (loss) | | | 1,575,593 | |
| | | | |
Net assets, July 31, 2019 | | $ | 17,019,440 | |
| | | | |
| |
Class R6 | | | | |
Net asset value, offering price and redemption price per share, | | | | |
($17,019,440 ÷ 1,534,168 shares of beneficial interest issued and outstanding) | | $ | 11.09 | |
| | | | |
See Notes to Financial Statements.
| | | | |
| PGIM 60/40 Allocation Fund | | | 13 | |
Statement of Operations
Year Ended July 31, 2019
| | | | |
Net Investment Income (Loss) | | | | |
Affiliated dividend income | | $ | 187,326 | |
| | | | |
| |
Expenses | | | | |
Management fee | | | 1,973 | |
Custodian and accounting fees | | | 74,191 | |
Legal fees and expenses | | | 30,161 | |
Audit fee | | | 22,725 | |
Shareholders’ reports | | | 20,734 | |
Trustees’ fees | | | 11,233 | |
Registration fees | | | 1,000 | |
Transfer agent’s fees and expenses (including affiliated expense of $71) | | | 88 | |
Miscellaneous | | | 13,017 | |
| | | | |
Total expenses | | | 175,122 | |
Less: Fee waiver and/or expense reimbursement | | | (172,490 | ) |
| | | | |
Net expenses | | | 2,632 | |
| | | | |
Net investment income (loss) | | | 184,694 | |
| | | | |
| |
Realized And Unrealized Gain (Loss) On Affiliated Investments | | | | |
Net realized gain (loss) on investment transactions | | | (364,322 | ) |
Net capital gain distributions received | | | 358,455 | |
| | | | |
| | | (5,867 | ) |
| | | | |
Net change in unrealized appreciation (depreciation) on investments | | | 1,490,347 | |
| | | | |
Net gain (loss) on investment transactions | | | 1,484,480 | |
| | | | |
Net Increase (Decrease) In Net Assets Resulting From Operations | | $ | 1,669,174 | |
| | | | |
See Notes to Financial Statements.
Statements of Changes in Net Assets
| | | | | | | | |
| | |
| | | Year Ended
July 31, 2019 | | | September 13, 2017* through July 31, 2018 | |
Increase (Decrease) in Net Assets | | | | | | | | |
Operations | | | | | | | | |
Net investment income (loss) | | $ | 184,694 | | | $ | 4,914 | |
Net realized gain (loss) on investment transactions | | | (364,322 | ) | | | (389 | ) |
Net capital gain distributions received | | | 358,455 | | | | 1,020 | |
Net change in unrealized appreciation (depreciation) on investments | | | 1,490,347 | | | | 33,250 | |
| | | | | | | | |
Net increase (decrease) in net assets resulting from operations | | | 1,669,174 | | | | 38,795 | |
| | | | | | | | |
| | |
Dividends and Distributions | | | | | | | | |
Distributions from distributable earnings** | | | | | | | | |
Class R6 | | | (132,175 | ) | | | — | |
| | | | | | | | |
Dividends from net investment income** | | | | | | | | |
Class R6 | | | ** | | | | (201 | ) |
| | | | | | | | |
| | |
Fund share transactions | | | | | | | | |
Net proceeds from shares sold | | | 14,210,268 | | | | 3,008,789 | |
Net asset value of shares issued in reinvestment of dividends and distributions | | | 132,175 | | | | 201 | |
Cost of shares reacquired | | | (1,758,924 | ) | | | (148,662 | ) |
| | | | | | | | |
Net increase (decrease) in net assets from Fund share transactions | | | 12,583,519 | | | | 2,860,328 | |
| | | | | | | | |
Total increase (decrease) | | | 14,120,518 | | | | 2,898,922 | |
| | |
Net Assets: | | | | | | | | |
Beginning of period | | | 2,898,922 | | | | — | |
| | | | | | | | |
End of period(a) | | $ | 17,019,440 | | | $ | 2,898,922 | |
| | | | | | | | |
(a) Includes undistributed/(distributions in excess of) net investment income of: | | $ | ** | | | $ | 4,760 | |
| | | | | | | | |
| * | Commencement of operations. |
| ** | For the year ended July 31, 2019, the disclosures have been revised to reflect revisions to RegulationS-X adopted by the SEC in 2018 (refer to Note 9). |
See Notes to Financial Statements.
| | | | |
| PGIM 60/40 Allocation Fund | | | 15 | |
Notes to Financial Statements
Prudential Investment Portfolios 5 (the “Trust”) is registered under the Investment Company Act of 1940, as amended (“1940 Act”), as a diversified,open-end management investment company. The Trust currently consists of fifteen funds: Prudential Day One Income Fund, Prudential Day One 2010 Fund, Prudential Day One 2015 Fund, Prudential Day One 2020 Fund, Prudential Day One 2025 Fund, Prudential Day One 2030 Fund, Prudential Day One 2035 Fund, Prudential Day One 2040 Fund, Prudential Day One 2045 Fund, Prudential Day One 2050 Fund, Prudential Day One 2055 Fund, Prudential Day One 2060 Fund, PGIM 60/40 Allocation Fund, PGIM Jennison Diversified Growth Fund and PGIM Jennison Rising Dividend Fund. These financial statements relate only to the PGIM 60/40 Allocation Fund (the “Fund”).
The investment objective of the Fund is to seek a balance between growth and conservation of capital.
1. Accounting Policies
The Fund follows the investment company accounting and reporting guidance of the Financial Accounting Standards Board (“FASB”) Accounting Standard Codification (“ASC”) Topic 946 Financial Services—Investment Companies. The following accounting policies conform to U.S. generally accepted accounting principles. The Fund consistently follows such policies in the preparation of its financial statements.
Securities Valuation:The Fund holds securities and other assets and liabilities that are fair valued at the close of each day (generally, 4:00 PM Eastern time) the New York Stock Exchange (“NYSE”) is open for trading. Fair value is the price that would be received to sell an asset or paid to transfer a liability in an orderly transaction between market participants on the measurement date. The Trust’s Board of Trustees (the “Board”) has adopted valuation procedures for security valuation under which fair valuation responsibilities have been delegated to PGIM Investments LLC (“PGIM Investments” or the “Manager”). Pursuant to the Board’s delegation, the Manager has established a Valuation Committee responsible for supervising the fair valuation of portfolio securities and other assets and liabilities. The valuation procedures permit the Fund to utilize independent pricing vendor services, quotations from market makers, and alternative valuation methods when market quotations are either not readily available or not deemed representative of fair value. A record of the Valuation Committee’s actions is subject to the Board’s review, approval, and ratification at its next regularly scheduled quarterly meeting.
For the fiscal reportingyear-end, securities and other assets and liabilities were fair valued at the close of the last U.S. business day. Trading in certain foreign securities may occur when the NYSE is closed (including weekends and holidays). Because such foreign securities
trade in markets that are open on weekends and U.S. holidays, the values of some of the Fund’s foreign investments may change on days when investors cannot purchase or redeem Fund shares.
Various inputs determine how the Fund’s investments are valued, all of which are categorized according to the three broad levels (Level 1, 2, or 3) detailed in the Schedule of Investments and referred to herein as the “fair value hierarchy” in accordance with FASB ASC Topic 820—Fair Value Measurements and Disclosures.
Investments inopen-end,non-exchange-traded mutual funds are valued at their net asset values as of the close of the NYSE on the date of valuation. These securities are classified as Level 1 in the fair value hierarchy since they may be purchased or sold at their net asset values on the date of valuation.
Securities and other assets that cannot be priced according to the methods described above are valued based on pricing methodologies approved by the Board. In the event that unobservable inputs are used when determining such valuations, the securities will be classified as Level 3 in the fair value hierarchy.
When determining the fair value of securities, some of the factors influencing the valuation include: the nature of any restrictions on disposition of the securities; assessment of the general liquidity of the securities; the issuer’s financial condition and the markets in which it does business; the cost of the investment; the size of the holding and the capitalization of the issuer; the prices of any recent transactions or bids/offers for such securities or any comparable securities; any available analyst media or other reports or information deemed reliable by the Manager regarding the issuer or the markets or industry in which it operates. Using fair value to price securities may result in a value that is different from a security’s most recent closing price and from the price used by other unaffiliated mutual funds to calculate their net asset values.
Securities Transactions and Net Investment Income:Securities transactions are recorded on the trade date. Realized gains (losses) from investment and currency transactions are calculated on the specific identification method. Dividend income is recorded on theex-date, or for certain foreign securities, when the Fund becomes aware of such dividends. Expenses are recorded on an accrual basis, which may require the use of certain estimates by management that may differ from actual.
Taxes:It is the Fund’s policy to continue to meet the requirements of the Internal Revenue Code applicable to regulated investment companies and to distribute all of its taxable net investment income and capital gains, if any, to its shareholders. Therefore, no federal income tax provision is required. Withholding taxes on foreign dividends, interest and capital gains, if any, are recorded, net of reclaimable amounts, at the time the related income is earned.
| | | | |
| PGIM 60/40 Allocation Fund | | | 17 | |
Notes to Financial Statements(continued)
Dividends and Distributions:The Fund expects to pay dividends from net investment income and distributions from net realized capital gains, if any, annually. Dividends and distributions to shareholders, which are determined in accordance with federal income tax regulations and which may differ from generally accepted accounting principles, are recorded on theex-date. Permanent book/tax differences relating to income and gain (loss) are reclassified between total distributable earnings (loss) andpaid-in capital in excess of par, as appropriate.
Estimates:The preparation of financial statements requires management to make estimates and assumptions that affect the reported amounts and disclosures in the financial statements. Actual results could differ from those estimates.
2. Agreements
The Trust, on behalf of the Fund, has a management agreement with the Manager. Pursuant to this agreement, the Manager has responsibility for all investment advisory services and supervises the subadviser’s performance of such services. In addition, under the management agreement, the Manager provides all of the administrative functions necessary for the organization, operation and management of the Fund. The Manager administers the corporate affairs of the Fund and, in connection therewith, furnishes the Fund with office facilities, together with those ordinary clerical and bookkeeping services which are not being furnished by the Fund’s custodian and the Fund’s transfer agent. The Manager is also responsible for the staffing and management of dedicated groups of legal, marketing, compliance and related personnel necessary for the operation of the Fund. The legal, marketing, compliance and related personnel are also responsible for the management and oversight of the various service providers to the Fund, including, but not limited to, the custodian, transfer agent, and accounting agent.
The Manager has entered into a subadvisory agreement with QMA LLC (“QMA”)(formerly known as Quantitative Management Associates, LLC). The subadvisory agreement provides that QMA will furnish investment advisory services in connection with the management of the Fund. In connection therewith, QMA is obligated to keep certain books and records of the Fund. The Manager pays for the services of QMA, the cost of compensation of officers of the Fund, occupancy and certain clerical and bookkeeping costs of the Fund. The Fund bears all other costs and expenses.
The management fee paid to the Manager is accrued daily and payable monthly at an annual rate of 0.02% average daily net assets.
The Manager has contractually agreed, through November 30, 2020, to limit total annual operating expenses after fee waivers and/or expense reimbursements to 0.40% of average
daily net assets for Class R6 shares. This contractual waiver includes acquired fund fees and expenses, and excludes Fund and any acquired fund interest, brokerage, taxes (such as income and foreign withholding taxes, stamp duty and deferred tax expenses), extraordinary expenses, and certain other Fund expenses such as dividend and interest expense and broker charges on short sales. Fees and/or expenses waived and/or reimbursed by the Manager may be recouped by the Manager within the same fiscal year during which such waiver and/or reimbursement is made if such recoupment can be realized without exceeding the expense limit in effect at the time of the recoupment for that fiscal year.
The Fund has a distribution agreement with Prudential Investment Management Services LLC (“PIMS”), which acts as the distributor of the Class R6 shares of the Fund. No distribution or service fees are paid to PIMS as distributor for Class R6 shares of the Fund.
PGIM Investments, PIMS and QMA are indirect, wholly-owned subsidiaries of Prudential Financial, Inc. (“Prudential”).
3. Other Transactions with Affiliates
Prudential Mutual Fund Services LLC (“PMFS”), an affiliate of PGIM Investments and an indirect, wholly-owned subsidiary of Prudential, serves as the Fund’s transfer agent. Transfer agent’s fees and expenses in the Statement of Operations include certainout-of-pocket expenses paid tonon-affiliates, where applicable.
The Fund may invest its overnight sweep cash in the PGIM Core Ultra Short Bond Fund (the “Core Fund”), a series of Prudential Investment Portfolios 2, registered under the 1940 Act and managed by PGIM Investments. Through the Fund’s investments in the mentioned underlying fund, PGIM Investments and/or its affiliates are paid fees or reimbursed for providing their services. Earnings from the Core Fund are disclosed on the Statement of Operations as “Affiliated dividend income”.
4. Portfolio Securities
The aggregate cost of purchases and proceeds from sales of portfolio securities (excluding short-term investments and U.S. Government securities) for the year ended July 31, 2019, were $15,973,463 and $2,990,116, respectively.
A summary of the cost of purchases and proceeds from sales of shares of affiliated investments for the year ended July 31, 2019, is presented as follows:
| | | | | | | | | | | | | | | | | | | | | | | | | | | | | | | | | | |
Value,
Beginning
of Year | | | Cost of
Purchases | | | Proceeds
from Sales | | | Change in
Unrealized
Gain
(Loss) | | | Realized
Gain
(Loss) | | | Value,
End of
Year | | | Shares,
End
of Year | | | Dividend
Income | | | Capital
Gain
Distributions | |
| | PGIM Core Ultra Short Bond Fund | |
| $ | 22,334 | | | $ | 644,594 | | | $ | 587,732 | | | $ | — | | | $ | — | | | $ | 79,196 | | | | 79,196 | | | $ | 723 | | | $ | — | |
| | | | |
| PGIM 60/40 Allocation Fund | | | 19 | |
Notes to Financial Statements(continued)
| | | | | | | | | | | | | | | | | | | | | | | | | | | | | | | | | | |
Value,
Beginning
of Year | | | Cost of
Purchases | | | Proceeds
from
Sales | | | Change in
Unrealized
Gain
(Loss) | | | Realized
Gain
(Loss) | | | Value,
End
of Year | | | Shares,
End
of Year | | | Dividend
Income | | | Capital
Gain
Distributions | |
| | PGIM QMALarge-Cap Core Equity Fund | |
| $ | 1,739,535 | | | $ | 9,313,301 | | | $ | 1,714,994 | | | $ | 1,162,587 | | | $ | (363,448 | ) | | $ | 10,136,981 | | | | 657,818 | | | $ | 36,767 | | | $ | 358,455 | |
| | PGIM Total Return Bond Fund | |
| | 1,157,070 | | | | 6,660,162 | | | | 1,275,122 | | | | 327,760 | | | | (874 | ) | | | 6,868,996 | | | | 465,064 | | | | 149,836 | | | | — | |
| | | | | | | | | | | | | | | | | | | | | | | | | | | | | | | | | | |
| $ | 2,918,939 | | | $ | 16,618,057 | | | $ | 3,577,848 | | | $ | 1,490,347 | | | $ | (364,322 | ) | | $ | 17,085,173 | | | | | | | $ | 187,326 | | | $ | 358,455 | |
| | | | | | | | | | | | | | | | | | | | | | | | | | | | | | | | | | |
5. Distributions and Tax Information
Distributions to shareholders, which are determined in accordance with federal income tax regulations and which may differ from generally accepted accounting principles, are recorded on theex-date.
For the year ended July 31, 2019, the tax character of dividends paid by the Fund were $131,032 of ordinary income and $1,143 of long-term capital gains. For the period ended July 31, 2018, the tax character of dividends paid by the Fund was $201 of ordinary income.
As of July 31, 2019, the accumulated undistributed earnings on a tax basis were $134,610 of ordinary income and $289,033 of long-term capital gains.
The United States federal income tax basis of the Fund’s investments and the net unrealized appreciation as of July 31, 2019 were as follows:
| | | | | | |
Tax Basis | | Gross Unrealized Appreciation | | Gross Unrealized Depreciation | | Net Unrealized Appreciation |
| $15,933,223 | | $1,523,597 | | $(371,647) | | $1,151,950 |
The difference between book basis and tax basis is primarily attributable to wash sales.
The Manager has analyzed the Fund’s tax positions taken on federal, state and local income tax returns for all open tax years and has concluded that no provision for income tax is required in the Fund’s financial statements for the current reporting period. The Fund’s federal, state and local income and federal excise tax returns for tax years for which the applicable statutes of limitations have not expired are subject to examination by the Internal Revenue Service and state departments of revenue.
6. Capital and Ownership
The Trust is authorized to issue an unlimited number of shares of beneficial interest of the Fund, at $0.001 par value per share, divided into one class, designated Class R6 shares.
Under certain circumstances, an exchange may be made from specified share classes of the Fund to one or more other share classes of the Fund as presented in the table of transactions in shares of beneficial interest.
At reporting period end, Prudential owned all of the shares of the Fund.
Transactions in shares of beneficial interest were as follows:
| | | | | | | | |
Class R6 | | Shares | | | Amount | |
Year ended July 31, 2019: | | | | | | | | |
Shares sold | | | 1,420,772 | | | $ | 14,210,268 | |
Shares issued in reinvestment of dividends and distributions | | | 13,683 | | | | 132,175 | |
Shares reacquired | | | (169,362 | ) | | | (1,758,924 | ) |
| | | | | | | | |
Net increase (decrease) in shares outstanding | | | 1,265,093 | | | $ | 12,583,519 | |
| | | | | | | | |
Period ended July 31, 2018*: | | | | | | | | |
Shares sold | | | 282,908 | | | $ | 3,008,789 | |
Shares issued in reinvestment of dividends and distributions | | | 19 | | | | 201 | |
Shares reacquired | | | (13,852 | ) | | | (148,662 | ) |
| | | | | | | | |
Net increase (decrease) in shares outstanding | | | 269,075 | | | $ | 2,860,328 | |
| | | | | | | | |
| * | Commencement of operations was September 13, 2017. |
7. Borrowings
The Trust, on behalf of the Fund, along with other affiliated registered investment companies (the “Funds”), is a party to a Syndicated Credit Agreement (“SCA”) with a group of banks. The purpose of the SCA is to provide an alternative source of temporary funding for capital share redemptions. The SCA provides for a commitment of $900 million for the period October 4, 2018 through October 3, 2019. The Funds pay an annualized commitment fee of 0.15% of the unused portion of the SCA. The Fund’s portion of the commitment fee for the unused amount, allocated based upon a method approved by the Board, is accrued daily and paid quarterly. Prior to October 4, 2018, the Funds had another SCA that provided a commitment of $900 million and the Funds paid an annualized commitment fee of 0.15% of the unused portion of the SCA. The interest on borrowings under both SCAs is paid monthly and at a per annum interest rate based upon a contractual spread plus the higher of (1) the effective federal funds rate, (2) the1-month LIBOR rate or (3) zero percent.
Certain affiliated registered investment companies that are parties to the SCA include portfolios that are subject to a predetermined mathematical formula used to manage certain benefit guarantees offered under variable annuity contracts. The formula may result in large scale asset flows into and out of these portfolios. Consequently, these portfolios may be more likely to utilize the SCA for purposes of funding redemptions. It may be possible for those
| | | | |
| PGIM 60/40 Allocation Fund | | | 21 | |
Notes to Financial Statements(continued)
portfolios to fully exhaust the committed amount of the SCA, thereby requiring the Manager to allocate available funding per a Board-approved methodology designed to treat the Funds in the SCA equitably. The Fund did not utilize the SCA during the year ended July 31, 2019.
8. Risks of Investing in the Fund
The Fund’s risks include, but are not limited to, some or all of the risks discussed below:
Fund of Funds Risk:The value of an investment in the Fund will be related, to a substantial degree, to the investment performance of the Underlying Funds in which it invests. Therefore, the principal risks of investing in the Fund are closely related to the principal risks associated with these Underlying Funds and their investments. Because the Fund’s allocation among different Underlying Funds and direct investments in securities and derivatives will vary, an investment in the Fund may be subject to any and all of these risks at different times and to different degrees. Investing in an Underlying Fund will also expose the Fund to a pro rata portion of the Underlying Fund’s fees and expenses. In addition, one Underlying Fund may buy the same securities that another Underlying Fund sells. Therefore, the Fund would indirectly bear the costs of these trades without accomplishing the investment purpose.
Market and Credit Risk:Securities markets may be volatile and the market prices of the Fund’s securities may decline. Securities fluctuate in price based on changes in an issuer’s financial condition and overall market and economic conditions. If the market prices of the securities owned by the Fund fall, the value of an investment in the Fund will decline. Additionally, the Fund may also be exposed to credit risk in the event that an issuer or guarantor fails to perform or that an institution or entity with which the Fund has unsettled or open transactions defaults.
9. Recent Accounting Pronouncements and Reporting Updates
In August 2018, the Securities and Exchange Commission (the “SEC”) adopted amendments to RegulationS-X to update and simplify the disclosure requirements for registered investment companies by eliminating requirements that are redundant or duplicative of US GAAP requirements or other SEC disclosure requirements. The new amendments require the presentation of the total, rather than the components, of distributable earnings on the Statement of Assets and Liabilities and the total, rather than the components, of dividends from net investment income and distributions from net realized gains on the Statements of Changes in Net Assets. The amendments also removed the requirement for the parenthetical disclosure of undistributed net investment income on the Statements of Changes in Net Assets and certain tax adjustments that were reflected in
the Notes to Financial Statements. The Manager has adopted the amendments and reflected them in the Fund’s financial statements.
In August 2018, the FASB issued Accounting Standards Update (“ASU”)No. 2018-13, which changes certain fair value measurement disclosure requirements. The new ASU, in addition to other modifications and additions, removes the requirement to disclose the amount and reasons for transfers between Level 1 and Level 2 of the fair value hierarchy, and the Fund’s policy for the timing of transfers between levels. The amendments are effective for financial statements issued for fiscal years beginning after December 15, 2019, and interim periods within those fiscal years. The Manager has evaluated the implications of certain provisions of the ASU and has determined to early adopt aspects related to the removal and modification of certain fair value measurement disclosures under the ASU effective immediately. The Manager continues to evaluate certain other provisions of the ASU and does not expect a material impact to financial statement disclosures.
| | | | |
| PGIM 60/40 Allocation Fund | | | 23 | |
PGIM 60/40 Allocation Fund
Financial Highlights
| | | | | | | | |
| Class R6 Shares | | | | | | |
| | | Year Ended
July 31, 2019 | | | September 13, 2017(a)
through July 31, 2018 | |
| Per Share Operating Performance(b): | | | | | | | | |
| Net Asset Value, Beginning of Period | | | $10.77 | | | | $10.00 | |
| Income (loss) from investment operations: | | | | | | | | |
| Net investment income (loss) | | | 0.20 | | | | 0.14 | |
| Net realized and unrealized gain (loss) on investment transactions | | | 0.47 | | | | 0.78 | |
| Total from investment operations | | | 0.67 | | | | 0.92 | |
| Less Dividends and Distributions: | | | | | | | | |
| Dividends from net investment income | | | (0.34 | ) | | | (0.15 | ) |
| Distributions from net realized gains | | | (0.01 | ) | | | - | |
| Total dividends and distributions | | | (0.35 | ) | | | (0.15 | ) |
| Net asset value, end of period | | | $11.09 | | | | $10.77 | |
| Total Return(c): | | | 6.73% | | | | 9.30% | |
| |
| Ratios/Supplemental Data: | |
| Net assets, end of period (000) | | | $17,019 | | | | $2,899 | |
| Average net assets (000) | | | $9,866 | | | | $381 | |
| Ratios to average net assets(d): | | | | | | | | |
| Expenses after waivers and/or expense reimbursement | | | 0.03% | | | | 0.02% | (e) |
| Expenses before waivers and/or expense reimbursement | | | 1.78% | | | | 28.47% | (e) |
| Net investment income (loss) | | | 1.87% | | | | 1.46% | (e) |
| Portfolio turnover rate(f) | | | 31% | | | | 37% | |
| (a) | Commencement of operations. |
| (b) | Calculated based on average shares outstanding during the period. |
| (c) | Total return is calculated assuming a purchase of a share on the first day and a sale on the last day of each period reported and includes reinvestment of dividends and distributions, if any. Total returns may reflect adjustments to conform to generally accepted accounting principles. Total returns for periods less than one full year are not annualized. |
| (d) | Does not include expenses of the underlying funds in which the Fund invests. Expenses waived/reimbursed include those of underlying funds in which the Fund invests. Consequently, the amount waived/reimbursed may be greater than the expense ratio reflected in the financial highlights. |
| (f) | The Fund’s portfolio turnover rate is calculated in accordance with regulatory requirements, without regard to transactions involving short-term investments and certain derivatives. If such transactions were included, the Fund’s portfolio turnover rate may be higher. |
See Notes to Financial Statements.
Report of Independent Registered Public Accounting Firm
To the Shareholders of PGIM 60/40 Allocation Fund and Board of Trustees
Prudential Investment Portfolios 5:
Opinion on the Financial Statements
We have audited the accompanying statement of assets and liabilities of PGIM 60/40 Allocation Fund, a series of Prudential Investment Portfolios 5, (the Fund), including the schedule of investments, as of July 31, 2019, the related statement of operations for the year then ended, the statements of changes in net assets for the year ended July 31, 2019 and the period from September 13, 2017 (commencement of operations) to July 31, 2018, and the related notes (collectively, the financial statements) and the financial highlights for the year or period indicated therein. In our opinion, the financial statements and financial highlights present fairly, in all material respects, the financial position of the Fund as of July 31, 2019, the results of its operations for the year then ended, the changes in its net assets for the year ended July 31, 2019 and the period from September 13, 2017 (commencement of operations) to July 31, 2018, and the financial highlights for the year or period indicated therein, in conformity with U.S. generally accepted accounting principles.
Basis for Opinion
These financial statements and financial highlights are the responsibility of the Fund’s management. Our responsibility is to express an opinion on these financial statements and financial highlights based on our audits. We are a public accounting firm registered with the Public Company Accounting Oversight Board (United States) (PCAOB) and are required to be independent with respect to the Fund in accordance with the U.S. federal securities laws and the applicable rules and regulations of the Securities and Exchange Commission and the PCAOB.
We conducted our audits in accordance with the standards of the PCAOB. Those standards require that we plan and perform the audit to obtain reasonable assurance about whether the financial statements and financial highlights are free of material misstatement, whether due to error or fraud. Our audits included performing procedures to assess the risks of material misstatement of the financial statements and financial highlights, whether due to error or fraud, and performing procedures that respond to those risks. Such procedures included examining, on a test basis, evidence regarding the amounts and disclosures in the financial statements and financial highlights. Such procedures also included confirmation of securities owned as of July 31, 2019, by correspondence with the transfer agent. Our audits also included evaluating the accounting principles used and significant estimates made by management, as well as evaluating the overall presentation of the financial statements and financial highlights. We believe that our audits provide a reasonable basis for our opinion.

We have served as the auditor of one or more PGIM and/or Prudential Retail investment companies since 2003.
New York, New York
September 23, 2019
| | | | |
| PGIM 60/40 Allocation Fund | | | 25 | |
Federal Income Tax Information(unaudited)
We are advising you that during the fiscal year ended July 31, 2019, the Fund reported the maximum amount allowed per share but not less than $0.003 per share for Class R6 shares as a capital gain distribution in accordance with Section 852(b)(3)(C) of the Internal Revenue Code.
For the year ended July 31, 2019, the Fund reports, in accordance with Section 854 of the Internal Revenue Code, the following percentages of the ordinary income dividends paid as 1) qualified dividend income (QDI); and 2) eligible for corporate dividends received deduction (DRD):
| | | | | | | | |
| | | QDI | | | DRD | |
PGIM 60/40 Allocation Fund | | | 38.80 | % | | | 37.62 | % |
In January 2020, you will be advised on IRS Form 1099-DIV or substitute 1099-DIV, as to the federal tax status of dividends and distributions received by you in calendar year 2019.
INFORMATION ABOUT BOARD MEMBERS AND OFFICERS(unaudited)
Information about Board Members and Officers of the Fund is set forth below. Board Members who are not deemed to be “interested persons” of the Fund, as defined in the 1940 Act, are referred to as “Independent Board Members.” Board Members who are deemed to be “interested persons” of the Fund are referred to as “Interested Board Members.” The Board Members are responsible for the overall supervision of the operations of the Fund and perform the various duties imposed on the directors of investment companies by the 1940 Act. The Board in turn elects the Officers, who are responsible for administering theday-to-day operations of the Fund.
| | | | | | |
| Independent Board Members | | | | |
| | | | |
Name Date of Birth Position(s) Portfolios Overseen | | Principal Occupation(s) During Past Five Years | | Other Directorships Held During Past Five Years | | Length of
Board Service |
| | | | |
Ellen S. Alberding 3/11/58 Board Member Portfolios Overseen: 96 | | President and Board Member, The Joyce Foundation (charitable foundation) (since 2002); Vice Chair, City Colleges of Chicago (community college system) (2011-2015); Trustee, National Park Foundation (charitable foundation for national park system) (2009-2018); Trustee, Economic Club of Chicago (since 2009); Trustee, Loyola University (since 2018). | | None. | | Since September 2013 |
| | | | |
Kevin J. Bannon 7/13/52 Board Member Portfolios Overseen: 96 | | Retired; Managing Director (April2008-May 2015) and Chief Investment Officer (October 2008-November 2013) of Highmount Capital LLC (registered investment adviser); formerly Executive Vice President and Chief Investment Officer (April 1993-August 2007) of Bank of New York Company; President (May2003-May 2007) of BNY Hamilton Family of Mutual Funds. | | Director of Urstadt Biddle Properties (equity real estate investment trust) (since September 2008). | | Since July 2008 |
PGIM 60/40 Allocation Fund
| | | | | | |
| Independent Board Members | | | | |
| | | | |
Name Date of Birth Position(s) Portfolios Overseen | | Principal Occupation(s) During Past Five Years | | Other Directorships Held During Past Five Years | | Length of Board Service |
| | | | |
Linda W. Bynoe 7/9/52 Board Member Portfolios Overseen: 96 | | President and Chief Executive Officer (since March 1995) and formerly Chief Operating Officer (December 1989-February 1995) of Telemat Ltd. (management consulting); formerly Vice President (January 1985-June 1989) at Morgan Stanley & Co. (broker-dealer). | | Director of Anixter International, Inc. (communication products distributor) (since January 2006); Director of Northern Trust Corporation (financial services) (since April 2006); Trustee of Equity Residential (residential real estate) (since December 2009). | | Since March 2005 |
| | | | |
Barry H. Evans 11/2/60 Board Member Portfolios Overseen: 95 | | Retired; formerly President (2005 – 2016), Global Chief Operating Officer (2014– 2016), Chief Investment Officer – Global Head of Fixed Income (1998-2014), and various portfolio manager roles (1986-2006), Manulife Asset Management U.S. | | Formerly Director, Manulife Trust Company (2011-2018); formerly Director, Manulife Asset Management Limited (2015-2017); formerly Chairman of the Board of Directors of Manulife Asset Management U.S. (2005-2016); formerly Chairman of the Board, Declaration Investment Management and Research (2008-2016). | | Since September 2017 |
| | | | |
Keith F. Hartstein 10/13/56 Board Member & Independent Chair Portfolios Overseen: 96 | | Retired; Member (since November 2014) of the Governing Council of the Independent Directors Council (organization of independent mutual fund directors); formerly President and Chief Executive Officer (2005-2012), Senior Vice President (2004-2005), Senior Vice President of Sales and Marketing (1997-2004), and various executive management positions (1990-1997), John Hancock Funds, LLC (asset management); Chairman, Investment Company Institute’s Sales Force Marketing Committee (2003-2008). | | None. | | Since September 2013 |
Visit our website at pgiminvestments.com
| | | | | | |
| Independent Board Members | | | | |
| | | | |
Name Date of Birth Position(s) Portfolios Overseen | | Principal Occupation(s) During Past Five Years | | Other Directorships Held During Past Five Years | | Length of Board Service |
| | | | |
Laurie Simon Hodrick 9/29/62 Board Member Portfolios Overseen: 95 | | A. Barton Hepburn Professor Emerita of Economics in the Faculty of Business, Columbia Business School (since 2018); Visiting Professor of Law, Stanford Law School (since 2015); Visiting Fellow at the Hoover Institution, Stanford University (since 2015); Sole Member, ReidCourt LLC (since 2008) (a consulting firm); formerly A. Barton Hepburn Professor of Economics in the Faculty of Business, Columbia Business School (1996-2017); formerly Managing Director, Global Head of Alternative Investment Strategies, Deutsche Bank (2006-2008). | | Independent Director, Synnex Corporation (since April 2019) (information technology); Independent Director, Kabbage, Inc. (since July 2018) (financial services); Independent Director, Corporate Capital Trust (2017-2018) (a business development company). | | Since September 2017 |
| | | | |
Michael S. Hyland, CFA 10/4/45 Board Member Portfolios Overseen: 96 | | Retired (since February 2005); formerly Senior Managing Director (July 2001-February 2005) of Bear Stearns & Co, Inc.; Global Partner, INVESCO (1999-2001); Managing Director and President of Salomon Brothers Asset Management (1989-1999). | | None. | | Since July 2008 |
| | | | |
Brian K. Reid 9/22/61 Board Member Portfolios Overseen: 95 | | Retired; formerly Chief Economist for the Investment Company Institute (ICI) (2005-2017); formerly Senior Economist and Director of Industry and Financial Analysis at the ICI (1998-2004); formerly Senior Economist, Industry and Financial Analysis at the ICI (1996-1998); formerly Staff Economist at the Federal Reserve Board (1989-1996); Director, ICI Mutual Insurance Company (2012-2017). | | None. | | Since March 2018 |
PGIM 60/40 Allocation Fund
| | | | | | |
Independent Board Members | | | | |
| | | | |
Name Date of Birth Position(s) Portfolios Overseen | | Principal Occupation(s) During Past Five Years | | Other Directorships Held During Past Five Years | | Length of Board Service |
| | | | |
Grace C. Torres 6/28/59 Board Member Portfolios Overseen: 95 | | Retired; formerly Treasurer and Principal Financial and Accounting Officer of the PGIM Funds, Target Funds, Advanced Series Trust, Prudential Variable Contract Accounts and The Prudential Series Fund (1998-June 2014); Assistant Treasurer (March 1999-June 2014) and Senior Vice President (September 1999-June 2014) of PGIM Investments LLC; Assistant Treasurer (May 2003-June 2014) and Vice President (June 2005-June 2014) of AST Investment Services, Inc.; Senior Vice President and Assistant Treasurer (May 2003-June 2014) of Prudential Annuities Advisory Services, Inc. | | Formerly Director (July 2015-January 2018) of Sun Bancorp, Inc. N.A. and Sun National Bank; Director (since January 2018) of OceanFirst Financial Corp. and OceanFirst Bank. | | Since November 2014 |
| | | | | | |
Interested Board Members | | | | |
| | | | |
Name Date of Birth Position(s) Portfolios Overseen | | Principal Occupation(s) During Past Five Years | | Other Directorships Held During Past Five Years | | Length of Board Service |
| | | | |
Stuart S. Parker 10/5/62 Board Member & President Portfolios Overseen: 96 | | President of PGIM Investments LLC (formerly known as Prudential Investments LLC) (since January 2012); Executive Vice President of Prudential Investment Management Services LLC (since December 2012); formerly Executive Vice President of Jennison Associates LLC and Head of Retail Distribution of PGIM Investments LLC (June 2005-December 2011). | | None. | | Since January 2012 |
Visit our website at pgiminvestments.com
| | | | | | |
Interested Board Members | | | | |
| | | | |
Name Date of Birth Position(s) Portfolios Overseen | | Principal Occupation(s) During Past Five Years | | Other Directorships Held During Past Five Years | | Length of Board Service |
| | | | |
Scott E. Benjamin 5/21/73 Board Member & Vice President Portfolios Overseen: 96 | | Executive Vice President (since June 2009) of PGIM Investments LLC; Executive Vice President (June 2009-June 2012) and Vice President (since June 2012) of Prudential Investment Management Services LLC; Executive Vice President (since September 2009) of AST Investment Services, Inc.; Senior Vice President of Product Development and Marketing, PGIM Investments (since February 2006); formerly Vice President of Product Development and Product Management, PGIM Investments LLC (2003-2006). | | None. | | Since March 2010 |
| | | | |
| Fund Officers(a) | | | | |
| | | |
Name Date of Birth Fund Position | | Principal Occupation(s) During Past Five Years | | Length of
Service as Fund
Officer |
| | | |
Raymond A. O’Hara 9/11/55 Chief Legal Officer | | Vice President and Corporate Counsel (since July 2010) of Prudential Insurance Company of America (Prudential); Vice President (March 2011-Present) of Pruco Life Insurance Company and Pruco Life Insurance Company of New Jersey; Vice President and Corporate Counsel (March 2011-Present) of Prudential Annuities Life Assurance Corporation; Chief Legal Officer of PGIM Investments LLC (since June 2012); Chief Legal Officer of Prudential Mutual Fund Services LLC (since June 2012) and Corporate Counsel of AST Investment Services, Inc. (since June 2012); formerly Assistant Vice President and Corporate Counsel (September 2008-July 2010) of The Hartford Financial Services Group, Inc.; formerly Associate (September 1980-December 1987) and Partner (January 1988–August 2008) of Blazzard & Hasenauer, P.C. (formerly, Blazzard, Grodd & Hasenauer, P.C.). | | Since June 2012 |
PGIM 60/40 Allocation Fund
| | | | |
| Fund Officers(a) | | | | |
| | | |
Name Date of Birth Fund Position | | Principal Occupation(s) During Past Five Years | | Length of Service as Fund Officer |
| | | |
Dino Capasso 8/19/74 Chief Compliance Officer | | Chief Compliance Officer (July 2019-Present) of PGIM Investments LLC; Chief Compliance Officer (July 2019-Present) of the PGIM Funds, Target Funds, Advanced Series Trust, The Prudential Series Fund, Prudential’s Gibraltar Fund, Inc., PGIM Global High Yield Fund, Inc., and PGIM High Yield Bond Fund, Inc.; Vice President and Deputy Chief Compliance Officer (June 2017-2019) of PGIM Investments LLC; formerly, Senior Vice President and Senior Counsel (January 2016-June 2017), and Vice President and Counsel (February 2012-December 2015) of Pacific Investment Management Company LLC. | | Since March 2018 |
| | | |
Andrew R. French 12/22/62 Secretary | | Vice President of PGIM Investments LLC (December 2018-Present); formerly Vice President and Corporate Counsel (February 2010-December 2018) of Prudential; formerly Director and Corporate Counsel (2006-2010) of Prudential; Vice President and Assistant Secretary (since January 2007) of PGIM Investments LLC; Vice President and Assistant Secretary (since January 2007) of Prudential Mutual Fund Services LLC. | | Since October 2006 |
| | | |
Jonathan D. Shain 8/9/58 Assistant Secretary | | Vice President and Corporate Counsel (since August 1998) of Prudential; Vice President and Assistant Secretary (since May 2001) of PGIM Investments LLC; Vice President and Assistant Secretary (since February 2001) of Prudential Mutual Fund Services LLC; formerly Vice President and Assistant Secretary (May 2003-June 2005) of AST Investment Services, Inc. | | Since May 2005 |
| | | |
Claudia DiGiacomo 10/14/74 Assistant Secretary | | Vice President and Corporate Counsel (since January 2005) of Prudential; Vice President and Assistant Secretary of PGIM Investments LLC (since December 2005); formerly Associate at Sidley Austin Brown & Wood LLP (1999-2004). | | Since December 2005 |
| | | |
Diana N. Huffman 4/14/82 Assistant Secretary | | Vice President and Corporate Counsel (since September 2015) of Prudential; formerly Associate at Willkie Farr & Gallagher LLP (2009-2015). | | Since March 2019 |
| | | |
Christian J. Kelly 5/5/75 Treasurer and Principal Financial and Accounting Officer | | Vice President, Head of Fund Administration of PGIM Investments LLC (since November 2018); formerly, Director of Fund Administration of Lord Abbett & Co. LLC (2009-2018), Treasurer and Principal Accounting Officer of the Lord Abbett Family of Funds (2017-2018); Director of Accounting, Avenue Capital Group (2008-2009); Senior Manager, Investment Management Practice of Deloitte & Touche LLP (1998-2007). | | Since January 2019 |
| | | |
Peter Parrella 8/21/58 Assistant Treasurer | | Vice President (since 2007) and Director (2004-2007) within PGIM Investments Fund Administration; formerly Tax Manager at SSB Citi Fund Management LLC (1997-2004). | | Since June 2007 |
Visit our website at pgiminvestments.com
| | | | |
| Fund Officers(a) | | | | |
| | | |
Name Date of Birth Fund Position | | Principal Occupation(s) During Past Five Years | | Length of Service as Fund Officer |
| | | |
Lana Lomuti 6/7/67 Assistant Treasurer | | Vice President (since 2007) and Director (2005-2007), within PGIM Investments Fund Administration; formerly Assistant Treasurer (December 2007-February 2014) of The Greater China Fund, Inc. | | Since April 2014 |
| | | |
Linda McMullin 7/10/61 Assistant Treasurer | | Vice President (since 2011) and Director (2008-2011) within PGIM Investments Fund Administration. | | Since April 2014 |
| | | |
Kelly A. Coyne 8/8/68 Assistant Treasurer | | Director, Investment Operations of Prudential Mutual Fund Services LLC (since 2010). | | Since March 2015 |
| | | |
Charles H. Smith 1/11/73 Anti-Money Laundering Compliance Officer | | Vice President, Corporate Compliance, Anti-Money Laundering Unit (since January 2015) of Prudential; committee member of the American Council of Life Insurers Anti-Money Laundering and Critical Infrastructure Committee (since January 2016); formerly Global Head of Economic Sanctions Compliance at AIG Property Casualty (February 2007-December 2014); Assistant Attorney General at the New York State Attorney General’s Office, Division of Public Advocacy. (August 1998-January 2007). | | Since January 2017 |
(a) Excludes Mr. Parker and Mr. Benjamin, interested Board Members who also serve as President and Vice President, respectively.
Explanatory Notes to Tables:
| ∎ | | Board Members are deemed to be “Interested,” as defined in the 1940 Act, by reason of their affiliation with PGIM Investments LLC and/or an affiliate of PGIM Investments LLC. |
| ∎ | | Unless otherwise noted, the address of all Board Members and Officers is c/o PGIM Investments LLC, 655 Broad Street, Newark, New Jersey 07102-4410. |
| ∎ | | There is no set term of office for Board Members or Officers. The Board Members have adopted a retirement policy, which calls for the retirement of Board Members on December 31 of the year in which they reach the age of 75. |
| ∎ | | “Other Directorships Held” includes only directorships of companies required to register or file reports with the SEC under the 1934 Act (that is, “public companies”) or other investment companies registered under the 1940 Act. |
| ∎ | | “Portfolios Overseen” includes all investment companies managed by PGIM Investments LLC. The investment companies for which PGIM Investments LLC serves as manager include the PGIM Funds, The Prudential Variable Contract Accounts, PGIM ETF Trust, PGIM High Yield Bond Fund, Inc., PGIM Global High Yield Fund, Inc., The Prudential Series Fund, Prudential’s Gibraltar Fund, Inc. and the Advanced Series Trust. |
PGIM 60/40 Allocation Fund
Approval of Advisory Agreements
The Fund’s Board of Trustees
The Board of Trustees (the “Board”) of PGIM 60/40 Allocation Fund (the “Fund”)1 consists of eleven individuals, nine2 of whom are not “interested persons” of the Fund, as defined in the Investment Company Act of 1940, as amended (the “1940 Act”) (the “Independent Trustees”). The Board is responsible for the oversight of the Fund and its operations, and performs the various duties imposed on the directors of investment companies by the 1940 Act. The Independent Trustees have retained independent legal counsel to assist them in connection with their duties. The Chair of the Board is an Independent Trustee. The Board has established four standing committees: the Audit Committee, the Nominating and Governance Committee, and two Investment Committees. Each committee is chaired by, and composed of, Independent Trustees.
Annual Approval of the Fund’s Advisory Agreements
As required under the 1940 Act, the Board determines annually whether to renew the Fund’s management agreement with PGIM Investments LLC (“PGIM Investments”) and the Fund’s subadvisory agreement with QMA LLC (“QMA”). In considering the renewal of the agreements, the Board, including all of the Independent Trustees, met on May 30, 2019 and on June11-13, 2019 and approved the renewal of the agreements through July 31, 2020, after concluding that the renewal of the agreements was in the best interests of the Fund and its shareholders.
In advance of the meetings, the Board requested and received materials relating to the agreements, and had the opportunity to ask questions and request further information in connection with its consideration. Among other things, the Board considered comparative fee information from PGIM Investments and QMA. Also, the Board considered comparisons with other mutual funds in relevant Peer Universes and Peer Groups, as is further discussed below.
In approving the agreements, the Board, including the Independent Trustees advised by independent legal counsel, considered the factors it deemed relevant, including the nature, quality and extent of services provided by PGIM Investments and the subadviser, the performance of the Fund, the profitability of PGIM Investments and its affiliates, expenses and fees, and the potential for economies of scale that may be shared with the Fund and its shareholders as the Fund’s assets grow. In their deliberations, the Trustees did not identify any single factor which alone was responsible for the Board’s decision to approve the agreements with respect to the Fund. In connection with its deliberations, the Board considered information provided by PGIM Investments throughout the year at regular Board meetings, presentations from portfolio managers and other information, as well as information furnished at or in advance of the meetings on May 30, 2019 and onJune 11-13, 2019.
| 1 | PGIM 60/40 Allocation Fund is a series of Prudential Investment Portfolios 5. |
| 2 | Grace C. Torres was an Interested Trustee of the Fund at the time the Board considered and approved the renewal of the Fund’s advisory agreements, but has since become an Independent Trustee of the Fund. |
| | |
| PGIM 60/40 Allocation Fund |
Approval of Advisory Agreements(continued)
The Trustees determined that the overall arrangements between the Fund and PGIM Investments, which serves as the Fund’s investment manager pursuant to a management agreement, and between PGIM Investments and QMA, which serves as the Fund’s subadviser pursuant to the terms of a subadvisory agreement with PGIM Investments, are in the best interests of the Fund and its shareholders in light of the services performed, fees charged and such other matters as the Trustees considered relevant in the exercise of their business judgment.
The material factors and conclusions that formed the basis for the Trustees’ reaching their determinations to approve the continuance of the agreements are separately discussed below.
Nature, Quality and Extent of Services
The Board received and considered information regarding the nature, quality and extent of services provided to the Fund by PGIM Investments and QMA. The Board noted that QMA is affiliated with PGIM Investments. The Board considered the services provided by PGIM Investments, including but not limited to the oversight of the subadviser for the Fund, as well as the provision of fund recordkeeping, compliance and other services to the Fund, and PGIM Investments’ role as administrator for the Fund’s liquidity risk management program. With respect to PGIM Investments’ oversight of the subadviser, the Board noted that PGIM Investments’ Strategic Investment Research Group (“SIRG”), which is a business unit of PGIM Investments, is responsible for monitoring and reporting to PGIM Investments’ senior management on the performance and operations of the subadviser. The Board also considered that PGIM Investments pays the salaries of all of the officers and interested Trustees of the Fund who are part of Fund management. The Board also considered the investment subadvisory services provided by QMA, including investment research and security selection, as well as adherence to the Fund’s investment restrictions and compliance with applicable Fund policies and procedures. The Board considered PGIM Investments’ evaluation of the subadviser, as well as PGIM Investments’ recommendation, based on its review of the subadviser, to renew the subadvisory agreement.
The Board considered the qualifications, backgrounds and responsibilities of PGIM Investments’ senior management responsible for the oversight of the Fund and QMA, and also considered the qualifications, backgrounds and responsibilities of QMA’s portfolio managers who are responsible for theday-to-day management of the Fund’s portfolio. The Board was provided with information pertaining to PGIM Investments’ and QMA’s organizational structure, senior management, investment operations, and other relevant information pertaining to both PGIM Investments and QMA. The Board also noted that it received favorable compliance reports from the Fund’s Chief Compliance Officer (“CCO”) as to both PGIM Investments and QMA.
| | |
| Visit our website at pgiminvestments.com | | |
The Board concluded that it was satisfied with the nature, extent and quality of the investment management services provided by PGIM Investments and the subadvisory services provided to the Fund by QMA, and that there was a reasonable basis on which to conclude that the Fund benefits from the services provided by PGIM Investments and QMA under the management and subadvisory agreements.
Costs of Services and Profits Realized by PGIM Investments
The Board was provided with information on the profitability of PGIM Investments and its affiliates in serving as the Fund’s investment manager. The Board discussed with PGIM Investments the methodology utilized in assembling the information regarding profitability and considered its reasonableness. The Board recognized that it is difficult to make comparisons of profitability from fund management contracts because comparative information is not generally publicly available and is affected by numerous factors, including the structure of the particular adviser, the types of funds it manages, its business mix, numerous assumptions regarding allocations and the adviser’s capital structure and cost of capital. However, the Board considered that the cost of services provided by PGIM Investments to the Fund during the year ended December 31, 2018 exceeded the management fees paid by the Fund, resulting in an operating loss to PGIM Investments. Taking these factors into account, the Board concluded that the profitability of PGIM Investments and its affiliates in relation to the services rendered was not unreasonable.
Economies of Scale
The Board received and discussed information concerning economies of scale that PGIM Investments may realize as the Fund’s assets grow beyond current levels. The Board noted that the management fee schedule for the Fund includes breakpoints, which have the effect of reducing the fee rate as assets increase. During the course of time, the Board has considered information regarding the launch date of the Fund, the management fees of the Fund compared to those of similarly managed funds and PGIM Investments’ investment in the Fund over time. The Board noted that economies of scale can be shared with the Fund in other ways, including low management fees from inception, additional technological and personnel investments to enhance shareholder services, and maintaining existing expense structures in the face of a rising cost environment. The Board also considered PGIM Investments’ assertion that it continually evaluates the management fee schedule of the Fund and the potential to share economies of scale through breakpoints or fee waivers as asset levels increase.
The Board recognized the inherent limitations of any analysis of economies of scale, stemming largely from the Board’s understanding that most of PGIM Investments’ costs are not specific to individual funds, but rather are incurred across a variety of products and services.
| | |
| PGIM 60/40 Allocation Fund |
Approval of Advisory Agreements(continued)
Other Benefits to PGIM Investments and QMA
The Board considered potential ancillary benefits that might be received by PGIM Investments, QMA and their affiliates as a result of their relationship with the Fund. The Board concluded that potential benefits to be derived by PGIM Investments included transfer agency fees received by the Fund’s transfer agent (which is affiliated with PGIM Investments), and benefits to its reputation as well as other intangible benefits resulting from PGIM Investments’ association with the Fund. The Board concluded that the potential benefits to be derived by QMA included its ability to use soft dollar credits, as well as the potential benefits consistent with those generally resulting from an increase in assets under management, specifically, potential access to additional research resources and benefits to its reputation. The Board concluded that the benefits derived by PGIM Investments and QMA were consistent with the types of benefits generally derived by investment managers and subadvisers to mutual funds.
Performance of the Fund / Fees and Expenses
The Board considered certain additional factors and made related conclusions relating to the historical performance of the Fund for theone-year period ended December 31, 2018. The Board considered that the Fund commenced operations on September 13, 2017 and that longer-term performance was not yet available.
The Board also considered the Fund’s actual management fee, as well as the Fund’s net total expense ratio, for the fiscal period ended July 31, 2018. The Board considered the management fee for the Fund as compared to the management fee charged by PGIM Investments to other funds and the fee charged by other advisers to comparable mutual funds in a Peer Group. The actual management fee represents the fee rate actually paid by Fund shareholders and includes any fee waivers or reimbursements. The net total expense ratio for the Fund represents the actual expense ratio incurred by Fund shareholders.
The mutual funds included in the Peer Universe, which was used to consider performance, and the Peer Group, which was used to consider expenses and fees, were objectively determined by Broadridge, an independent provider of mutual fund data. In certain circumstances, PGIM Investments also provided supplemental Peer Universe or Peer Group information for reasons addressed with the Board. The comparisons placed the Fund in various quartiles over various periods, with the first quartile being the best 25% of the mutual funds (for performance, the best performing mutual funds and, for expenses, the lowest cost mutual funds).
The section below summarizes key factors considered by the Board and the Board’s conclusions regarding the Fund’s performance, fees and overall expenses. The table sets forth net performance comparisons (which reflect the impact on performance of fund
| | |
| Visit our website at pgiminvestments.com | | |
expenses, or any subsidies, expense caps or waivers that may be applicable) with the Peer Universe, actual management fees with the Peer Group (which reflect the impact of any subsidies or fee waivers), and net total expenses with the Peer Group, each of which were key factors considered by the Board.
| | | | | | | | |
| Net Performance | | 1 Year | | 3 Years | | 5 Years | | 10 Years |
| | | 1st Quartile | | N/A | | N/A | | N/A |
| Actual Management Fees: 1st Quartile |
| Net Total Expenses: 1st Quartile |
| • | | The Board noted that the Fund underperformed its benchmark index over theone-year period. |
| • | | The Board noted that the Fund does not yet have a three-year performance record and that, therefore, the subadviser should have more time to develop that record. |
| • | | The Board and PGIM Investments agreed to retain the Fund’s existing contractual expense cap which (exclusive of certain fees and expenses) caps total annual operating expenses at 0.40% for Class R6 shares through November 30, 2019. |
| • | | The Board concluded that, in light of the above, it would be in the best interests of the Fund and its shareholders to allow the Fund to continue to create a longer-term performance record and to renew the agreements. |
| • | | The Board concluded that the management fees (including subadvisory fees) and total expenses were reasonable in light of the services provided. |
* * *
After full consideration of these factors, the Board concluded that the approval of the agreements was in the best interests of the Fund and its shareholders.
| | |
| PGIM 60/40 Allocation Fund |
| | | | |
| | |
| ∎ MAIL | | ∎ TELEPHONE | | ∎ WEBSITE |
655 Broad Street Newark, NJ 07102 | | (800) 225-1852 | | pgiminvestments.com |
|
| PROXY VOTING |
| The Board of Trustees of the Fund has delegated to the Fund’s subadviser the responsibility for voting any proxies and maintaining proxy recordkeeping with respect to the Fund. A description of these proxy voting policies and procedures is available without charge, upon request, by calling (800) 225-1852. Information regarding how the Fund voted proxies relating to portfolio securities during the most recent 12-month period ended June 30 will be available on the Fund’s website and on the Commission’s website at the end of August. |
|
| TRUSTEES |
| Ellen S. Alberding• Kevin J. Bannon• Scott E. Benjamin• Linda W. Bynoe• Barry H. Evans• Keith F. Hartstein • Laurie Simon Hodrick• Michael S. Hyland• Stuart S. Parker• Brian K. Reid• Grace C. Torres |
|
| OFFICERS |
| Stuart S. Parker,President• Scott E. Benjamin,Vice President• Christian J. Kelly,Treasurer and Principal Financial and Accounting Officer• Raymond A. O’Hara,Chief Legal Officer• Dino Capasso,Chief Compliance Officer• Andrew R. French,Secretary• Jonathan D. Shain,Assistant Secretary• Claudia DiGiacomo,Assistant Secretary• Diana N. Huffman,Assistant Secretary• Peter Parrella,Assistant Treasurer• Lana Lomuti,Assistant Treasurer• Linda McMullin,Assistant Treasurer• Kelly Coyne,Assistant Treasurer• Charles H. Smith,Anti-Money Laundering Compliance Officer |
| | | | |
| MANAGER | | PGIM Investments LLC | | 655 Broad Street
Newark, NJ 07102 |
|
| SUBADVISER | | QMA LLC | | Gateway Center Two
100 Mulberry Street
Newark, NJ 07102 |
|
| DISTRIBUTOR | | Prudential Investment
Management Services LLC | | 655 Broad Street
Newark, NJ 07102 |
|
| CUSTODIAN | | The Bank of New York Mellon | | 240 Greenwich Street
New York, NY 10286 |
|
| TRANSFER AGENT | | Prudential Mutual Fund
Services LLC | | PO Box 9658
Providence, RI 02940 |
|
| INDEPENDENT REGISTERED PUBLIC ACCOUNTING FIRM | | KPMG LLP | | 345 Park Avenue New York, NY 10154 |
|
| FUND COUNSEL | | Willkie Farr & Gallagher LLP | | 787 Seventh Avenue
New York, NY 10019 |
|
|
| An investor should consider the investment objectives, risks, charges, and expenses of the Fund carefully before investing. The prospectus and summary prospectus contains this and other information about the Fund. An investor may obtain a prospectus and summary prospectus by visiting our website atpgiminvestments.com or by calling(800) 225-1852. The prospectus and summary prospectus should be read carefully before investing. |
|
| SHAREHOLDER COMMUNICATIONS WITH TRUSTEES |
| Shareholders can communicate directly with the Board of Trustees by writing to the Chair of the Board, PGIM 60/40 Allocation Fund, PGIM Investments, Attn: Board of Trustees, 655 Broad Street, Newark, NJ 07102. Shareholders can communicate directly with an individual Trustee by writing to the same address. Communications are not screened before being delivered to the addressee. |
|
| AVAILABILITY OF PORTFOLIO SCHEDULE |
The Fund files its complete schedule of portfolio holdings with the Securities and Exchange Commission on Form N-PORT. The Fund’s Form N-PORT filings are available on the Commission’s website atsec.gov. Form N-PORT is filed with the Commission quarterly, and each Fund’s full portfolio holdings as of the first and third fiscal quarter-ends (as of the third month of the Fund’s fiscal quarter for reporting periods on or after September 30, 2019) will be made publicly available 60 days after the end of each quarter at sec.gov. |
|
| The Fund’s Statement of Additional Information contains additional information about the Fund’s Trustees and is available without charge, upon request, by calling (800) 225-1852. |
Mutual Funds:
| | | | |
ARE NOT INSURED BY THE FDIC OR ANY
FEDERAL GOVERNMENT AGENCY | | MAY LOSE VALUE | | ARE NOT A DEPOSIT OF OR GUARANTEED
BY ANY BANK OR ANY BANK AFFILIATE |
PGIM 60/40 ALLOCATION FUND
| | |
| SHARE CLASS | | R6 |
| NASDAQ | | PALDX |
| CUSIP | | 74440V724 |
Item 2 – Code of Ethics — See Exhibit (a)
As of the end of the period covered by this report, the registrant has adopted a code of ethics (the “Section 406 Standards for Investment Companies – Ethical Standards for Principal Executive and Financial Officers”) that applies to the registrant’s Principal Executive Officer and Principal Financial Officer; the registrant’s Principal Financial Officer also serves as the Principal Accounting Officer.
The registrant hereby undertakes to provide any person, without charge, upon request, a copy of the code of ethics. To request a copy of the code of ethics, contact the registrant800-225-1852, and ask for a copy of the Section 406 Standards for Investment Companies - Ethical Standards for Principal Executive and Financial Officers.
Item 3 – Audit Committee Financial Expert –
The registrant’s Board has determined that Mr. Kevin J. Bannon, member of the Board’s Audit Committee is an “audit committee financial expert,” and that he is “independent,” for purposes of this Item.
Item 4 – Principal Accountant Fees and Services – (a) Audit Fees
| | For the fiscal years ended July 31, 2019 and July 31, 2018, KPMG LLP (“KPMG”), the Registrant’s principal accountant, billed the Registrant $315,649 and $310,524 respectively, for professional services rendered for the audit of the Registrant’s annual financial statements or services that are normally provided in connection with statutory and regulatory filings. |
(b) Audit-Related Fees
| | For the fiscal years ended July 31, 2019 and July 31, 2018: none. |
(c) Tax Fees
| | For the fiscal years ended July 31, 2019 and July 31, 2018: none. |
(d)All Other Fees
| | For the fiscal years ended July 31, 2019 and July 31, 2018: none. |
(e) (1)Audit CommitteePre-Approval Policies and Procedures
THE PGIM MUTUAL FUNDS
AUDIT COMMITTEE POLICY
on
Pre-Approval of Services Provided by the Independent
Accountants
The Audit Committee of each PGIM Mutual Fund is charged with the responsibility to monitor the independence of the
Fund’s independent accountants. As part of this responsibility, the Audit Committee mustpre-approve the independent accounting firm’s engagement to render audit and/or permissiblenon-audit services, as required by law. In evaluating a proposed engagement of the independent accountants, the Audit Committee will assess the effect that the engagement might reasonably be expected to have on the accountant’s independence. The Committee’s evaluation will be based on:
| | • | | a review of the nature of the professional services expected to be provided, |
| | • | | a review of the safeguards put into place by the accounting firm to safeguard independence, and |
| | • | | periodic meetings with the accounting firm. |
Policy for Audit andNon-Audit Services Provided to the Funds
On an annual basis, the scope of audits for each Fund, audit fees and expenses, and audit-related andnon-audit services (and fees proposed in respect thereof) proposed to be performed by the Fund’s independent accountants will be presented by the Treasurer and the independent accountants to the Audit Committee for review and, as appropriate, approval prior to the initiation of such services. Such presentation shall be accompanied by confirmation by both the Treasurer and the independent accountants that the proposednon-audit services will not adversely affect the independence of the independent accountants. Such proposednon-audit services shall be described in sufficient detail to enable the Audit Committee to assess the appropriateness of such services and fees, and the compatibility of the provision of such services with the auditor’s independence. The Committee shall receive periodic reports on the progress of the audit and other services which are approved by the Committee or by the Committee Chair pursuant to authority delegated in this Policy.
The categories of services enumerated under “Audit Services”, “Audit-related Services”, and “Tax Services” are intended to provide guidance to the Treasurer and the independent accountants as to those categories of services which the Committee believes are generally consistent with the independence of the independent accountants and which the Committee (or the Committee Chair) would expect upon the presentation of specific proposals topre-approve. The enumerated categories are not intended as an exclusive list of audit, audit-related or tax services, which the Committee (or the Committee Chair) would consider forpre-approval.
Audit Services
The following categories of audit services are considered to be consistent with the role of the Fund’s independent accountants:
| | • | | Annual Fund financial statement audits |
| | • | | Seed audits (related to new product filings, as required) |
| | • | | SEC and regulatory filings and consents |
Audit-related Services
The following categories of audit-related services are considered to be consistent with the role of the Fund’s independent accountants:
| | • | | Accounting consultations |
| | • | | Fund merger support services |
| | • | | Agreed Upon Procedure Reports |
| | • | | Other Internal Control Reports |
Individual audit-related services that fall within one of these categories (except for fund merger support services) and are not presented to the Audit Committee as part of the annualpre-approval process are subject to an authorizedpre-approval by the Audit Committee so long as the estimated fee for those services does not exceed $30,000. Any services provided under suchpre-approval will be reported to the Audit Committee at its next regular meeting. Should the amount of such services exceed $30,000 any additional fees will be subject topre-approval by the Committee Chair (or any other Committee member on whom this responsibility has been delegated). Fees related to fund merger support services are subject to a separate authorizedpre-approval by the Audit Committee with fees determined on a per occurrence and merger complexity basis.
Tax Services
The following categories of tax services are considered to be consistent with the role of the Fund’s independent accountants:
| | • | | Tax compliance services related to the filing or amendment of the following: |
| | • | | Federal, state and local income tax compliance; and, |
| | • | | Sales and use tax compliance |
| | • | | Timely RIC qualification reviews |
| | • | | Tax distribution analysis and planning |
| | • | | Tax authority examination services |
| | • | | Tax appeals support services |
| | • | | Accounting methods studies |
| | • | | Fund merger support services |
| | • | | Tax consulting services and related projects |
Individual tax services that fall within one of these categories and are not presented to the Audit Committee as part of the annualpre-approval process are subject to an authorizedpre-approval by the Audit Committee so long as the estimated fee for those services does not exceed $30,000. Any services provided under suchpre-approval will be reported to the Audit Committee at its next regular meeting. Should the amount of such services exceed $30,000 any additional fees will be subject topre-approval by the Committee Chair (or any other Committee member on whom this responsibility has been delegated).
OtherNon-Audit Services
Certainnon-audit services that the independent accountants are legally permitted to render will be subject topre-approval by the Committee or by one or more Committee members to whom the Committee has delegated this authority and who will report to the full Committee anypre-approval decisions made pursuant to this Policy.Non-audit services presented forpre-approval pursuant to this paragraph will be accompanied by a confirmation from both the Treasurer and the independent accountants that the proposed services will not adversely affect the independence of the independent accountants.
Proscribed Services
The Fund’s independent accountants will not render services in the following categories ofnon-audit services:
| | • | | Bookkeeping or other services related to the accounting records or financial statements of the Fund |
| | • | | Financial information systems design and implementation |
| | • | | Appraisal or valuation services, fairness opinions, orcontribution-in-kind reports |
| | • | | Internal audit outsourcing services |
| | • | | Management functions or human resources |
| | • | | Broker or dealer, investment adviser, or investment banking services |
| | • | | Legal services and expert services unrelated to the audit |
| | • | | Any other service that the Public Company Accounting Oversight Board determines, by regulation, is impermissible. |
Pre-approval ofNon-Audit Services Provided to Other Entities Within the PGIM Fund Complex
Certainnon-audit services provided to PGIM Investments LLC or any of its affiliates that also provide ongoing services to the PGIM Mutual Funds will be subject topre-approval by the Audit Committee. The onlynon-audit services provided to these entities that will requirepre-approval are thoserelated directly to the operations and financial reporting of the Funds. Individual projects that are not presented to the Audit Committee as part of the annualpre-approval process will be subject topre-approval by the Committee Chair (or any other Committee member on whom this responsibility has been delegated) so long as the estimated fee for those services does not exceed $30,000. Services presented forpre-approval pursuant to this
paragraph
will be accompanied by a confirmation from both the Treasurer and the independent accountants that the proposed services will not adversely affect the independence of the independent accountants.
Although the Audit Committee will notpre-approve all services provided to PGIM Investments LLC and its affiliates, the Committee will receive an annual report from the Fund’s independent accounting firm showing the aggregate fees for all services provided to PGIM Investments and its affiliates.
| (e) (2) | Percentage of services referred to in 4(b) – 4(d) that were approved by the audit |
committee– For the fiscal years ended July 31, 2019 and July 31, 2018: none.
(f)Percentage of hours expended attributable to work performed by other than full time employees of principal accountant if greaterthan 50%.
| | The percentage of hours expended on the principal accountant’s engagement to audit the registrant’s financial statements for the most recent fiscal year that were attributed to work performed by persons other than the principal accountant’s full-time, permanent employees was 0%. |
(g)Non-Audit Fees
| | The aggregatenon-audit fees billed by KPMG for services rendered to the registrant’s investment adviser and any entity controlling, controlled by, or under common control with the investment adviser that provides ongoing services to the registrant for the fiscal years ended July 31, 2019 and July 31, 2018 was $0 and $0, respectively. |
(h)Principal Accountant’s Independence
| | Not applicable as KPMG has not providednon-audit services to the registrant’s investment adviser and any entity controlling, controlled by, or under common control with the investment adviser that provides ongoing services to the registrant that were notpre-approved pursuant to Rule2-01(c)(7)(ii) of RegulationS-X. |
Item 5 – Audit Committee of Listed Registrants –
| | The registrant has a separately designated standing audit committee (the “Audit Committee”) established in accordance with Section 3(a)(58)(A) of the Securities Exchange Act of 1934. The members of the Audit Committee are Kevin J. Bannon (chair), Ellen S. Alberding, Linda W. Bynoe, and Richard A. Redeker(ex-officio). |
Item 6 – Schedule of Investments – The schedule is included as part of the report to shareholders filed under Item 1 of this Form.
Item 7 – Disclosure of Proxy Voting Policies and Procedures forClosed-End Management Investment Companies – Not applicable.
Item 8 – Portfolio Managers ofClosed-End Management Investment Companies – Not applicable.
Item 9 – Purchases of Equity Securities byClosed-End Management Investment Company and Affiliated Purchasers –
Not applicable.
Item 10 – Submission of Matters to a Vote of Security Holders – There have been no material changes to these procedures.
Item 11 – Controls and Procedures
| | (a) | It is the conclusion of the registrant’s principal executive officer and principal financial officer that the effectiveness of the registrant’s current disclosure controls and procedures (such disclosure controls and procedures having been evaluated within 90 days of the date of this filing) provide reasonable assurance that the information required to be disclosed by the registrant has been recorded, processed, summarized and reported within the time period specified in the Commission’s rules and forms and that the information required to be disclosed by the registrant has been accumulated and communicated to the registrant’s principal executive officer and principal financial officer in order to allow timely decisions regarding required disclosure. |
| | (b) | There has been no significant change in the registrant’s internal control over financial reporting that occurred during the registrant’s most recent fiscal quarter of the period covered by this report that has materially affected, or is likely to materially affect, the registrant’s internal control over financial reporting. |
Item 12 – Controls and Procedures - Disclosure of Securities Lending Activities forClosed-End Management Investment Companies – Not applicable.
Item 13 – Exhibits
| | | | |
| | |
| | (a) | | (1) Code of Ethics – Attached hereto as ExhibitEX-99.CODE-ETH |
| | |
| | | | | (2) Certifications pursuant to Section 302 of the Sarbanes-Oxley Act – Attached hereto as ExhibitEX-99.CERT. |
| | |
| | | | (3) Any written solicitation to purchase securities under Rule23c-1. – Not applicable. |
| | |
| | (b) | | Certifications pursuant to Section 906 of the Sarbanes-Oxley Act – Attached hereto as ExhibitEX-99.906CERT. |
SIGNATURES
Pursuant to the requirements of the Securities Exchange Act of 1934 and the Investment Company Act of 1940, the registrant has duly caused this report to be signed on its behalf by the undersigned, thereunto duly authorized.
| | |
Registrant: | | Prudential Investment Portfolios 5 |
| |
By: | | /s/ Andrew R. French |
| | Andrew R. French |
| | Secretary |
| |
Date: | | September 23, 2019 |
Pursuant to the requirements of the Securities Exchange Act of 1934 and the Investment Company Act of 1940, this report has been signed below by the following persons on behalf of the registrant and in the capacities and on the dates indicated.
| | |
By: | | /s/ Stuart S. Parker |
| | Stuart S. Parker |
| | President and Principal Executive Officer |
| |
Date: | | September 23, 2019 |
| |
By: | | /s/ Christian J. Kelly |
| | Christian J. Kelly |
| | Treasurer and Principal Financial and Accounting Officer |
| |
Date: | | September 23, 2019 |