UNITED STATES
SECURITIES AND EXCHANGE COMMISSION
Washington, D.C. 20549
FORM N-CSR
CERTIFIED SHAREHOLDER REPORT OF REGISTERED MANAGEMENT INVESTMENT COMPANIES
| Investment Company Act file number: | 811-09439 | |
| Exact name of registrant as specified in charter: | Prudential Investment Portfolios 5 | |
| Address of principal executive offices: | 655 Broad Street, 6th Floor | |
| Newark, New Jersey 07102 | ||
| Name and address of agent for service: | Andrew R. French | |
| 655 Broad Street, 6th Floor | ||
| Newark, New Jersey 07102 | ||
| Registrant’s telephone number, including area code: | 800-225-1852 | |
| Date of fiscal year end: | 7/31/2022 | |
| Date of reporting period: | 7/31/2022 | |
Item 1 – Reports to Stockholders

PGIM JENNISON DIVERSIFIED GROWTH FUND
ANNUAL REPORT
JULY 31, 2022

To enroll in e-delivery, go to pgim.com/investments/resource/edelivery
Table of Contents
| 3 | ||||
| 4 | ||||
| 5 | ||||
| 8 | ||||
| 12 | ||||
| 15 | ||||
This report is not authorized for distribution to prospective investors unless preceded or accompanied by a current prospectus.
The views expressed in this report and information about the Fund’s portfolio holdings are for the period covered by this report and are subject to change thereafter.
Mutual funds are distributed by Prudential Investment Management Services LLC, member SIPC. Jennison Associates LLC is a registered investment adviser. Both are Prudential Financial companies. © 2022 Prudential Financial, Inc. and its related entities. Jennison Associates, Jennison, PGIM, and the PGIM logo are service marks of Prudential Financial, Inc. and its related entities, registered in many jurisdictions worldwide.
| 2 | Visit our website at pgim.com/investments |
 | Dear Shareholder:
We hope you find the annual report for the PGIM Jennison Diversified Growth Fund informative and useful. The report covers performance for the 12-month period that ended July 31, 2022.
The attention of the global economy and markets turned during the period from the impact of the COVID-19 pandemic to the challenge of rapidly rising inflation. Prices for a wide range of goods and services rose in response to economic reopenings, supply-chain disruptions, pandemic-related governmental stimulus and Russia’s invasion of Ukraine. As inflation surged at |
its fastest rate in more than 40 years, central banks, led by the US Federal Reserve, sought to restrain the trend by aggressively hiking interest rates, prompting concerns of a potential recession.
After rising to record levels during the closing months of 2021, US stocks retreated in 2022 in the face of rising prices, slowing economic growth and uncertainties related to the war in Ukraine. Growth-oriented stocks suffered the sharpest losses as investors turned for protection to traditionally defensive, value-oriented stocks. Large-cap equities ended the period in negative territory but outperformed their small-cap counterparts by a significant margin. International developed markets trailed the US market, while emerging markets lagged further behind.
Rising rates and economic uncertainty drove fixed-income prices broadly lower as well. US and global investment-grade bonds, along with US high yield corporate bonds and emerging market debt, all posted negative returns for the period.
Regarding your investments with PGIM, we believe it is important to maintain a diversified portfolio of funds consistent with your tolerance for risk, time horizon, and financial goals. Your financial advisor can help you create a diversified investment plan that may include funds covering all the basic asset classes and that reflects your personal investor profile and risk tolerance. However, diversification and asset allocation strategies do not assure a profit or protect against loss in declining markets.
At PGIM Investments, we provide access to active investment strategies across the global markets in the pursuit of consistent outperformance for investors. PGIM is the world’s 11th-largest investment manager with more than $1.5 trillion in assets under management. Our scale and investment expertise allow us to deliver a diversified suite of actively managed solutions across a broad spectrum of asset classes and investment styles.
Thank you for choosing our family of funds.
Sincerely,

Stuart S. Parker, President
PGIM Jennison Diversified Growth Fund
September 15, 2022
| PGIM Jennison Diversified Growth Fund | 3 |
Your Fund’s Performance (unaudited)
Performance data quoted represent past performance. Past performance does not guarantee future results. The investment return and principal value of an investment will fluctuate so that an investor’s shares, when redeemed, may be worth more or less than their original cost. Current performance may be lower or higher than the past performance data quoted. An investor may obtain performance data as of the most recent month-end by visiting our website at pgim.com/investments or by calling (800) 225-1852.
| Average Annual Total Returns as of 7/31/22 | ||||||||||||||||
| One Year (%) | Five Years (%) | Ten Years (%) | Since Inception (%) | |||||||||||||
| Class A | ||||||||||||||||
| (with sales charges) | -22.73 | 12.09 | 13.26 | — | ||||||||||||
| (without sales charges) | -18.23 | 13.37 | 13.90 | — | ||||||||||||
| Class C | ||||||||||||||||
| (with sales charges) | -19.69 | 12.35 | 12.99 | — | ||||||||||||
| (without sales charges) | -19.09 | 12.35 | 12.99 | — | ||||||||||||
| Class Z | ||||||||||||||||
| (without sales charges) | -18.16 | N/A | N/A | 13.99 (09/27/2017) | ||||||||||||
| Class R6 | ||||||||||||||||
| (without sales charges) | -18.12 | N/A | N/A | 13.99 (09/27/2017) | ||||||||||||
| Russell 1000® Growth Index |
| |||||||||||||||
| -11.93 | 16.30 | 15.95 | — | |||||||||||||
| ||||||||||||||||
| Average Annual Total Returns as of 7/31/22 Since Inception (%) | ||||||||||||||||
| Class Z, Class R6 | ||||||||||||||||
| (09/27/2017) | ||||||||||||||||
| Russell 1000® Growth Index |
| 16.16 | ||||||||||||||
Since Inception returns are provided for any share class with less than 10 fiscal years of returns. Since Inception returns for the Index are measured from the closest month-end to the class’ inception date.
| 4 | Visit our website at pgim.com/investments |
Growth of a $10,000 Investment (unaudited)
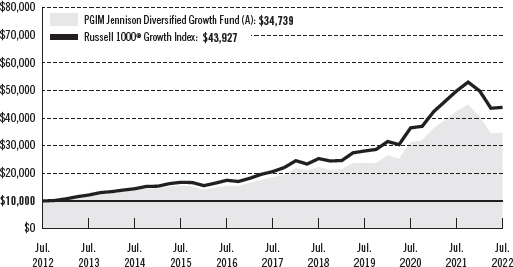
The graph compares a $10,000 investment in the Fund’s Class A shares with a similar investment in the Russell 1000 Growth Index by portraying the initial account values at the beginning of the 10-year period for Class A shares (July 31, 2012) and the account values at the end of the current fiscal year (July 31, 2022), as measured on a quarterly basis. For purposes of the graph, and unless otherwise indicated, it has been assumed that (a) all recurring fees (including management fees) were deducted and (b) all dividends and distributions were reinvested. The line graph provides information for Class A shares only. As indicated in the tables provided earlier and in the following paragraphs, performance for other share classes will vary due to the differing charges and expenses applicable to each share class (as indicated in the following paragraphs). Without waiver of fees and/or expense reimbursements, if any, the returns would have been lower.
Past performance does not predict future performance. Total returns and the ending account values in the graph include changes in share price and reinvestment of dividends and capital gains distributions in a hypothetical investment for the periods shown. The Fund’s total returns do not reflect the deduction of income taxes on an individual’s investment. Taxes may reduce your actual investment returns on income or gains paid by the Fund or any gains you may realize if you sell your shares.
| PGIM Jennison Diversified Growth Fund | 5 |
Your Fund’s Performance (continued)
The returns in the tables do not reflect the deduction of taxes that a shareholder would pay on Fund distributions or following the redemption of Fund shares. The average annual total returns take into account applicable sales charges, which are described for each share class in the table below.
| Class A | Class C | Class Z | Class R6 | |||||
| Maximum initial sales charge | 5.50% of the public offering price | None | None | None | ||||
| Contingent deferred sales charge (CDSC) (as a percentage of the lower of the original purchase price or the net asset value at redemption) | 1.00% on sales of $1 million or more made within 12 months of purchase | 1.00% on sales made within 12 months of purchase | None | None | ||||
| Annual distribution and service (12b-1) fees (shown as a percentage of average daily net assets) | 0.30% (0.25% currently) | 1.00% | None | None | ||||
Benchmark Definitions
Russell 1000 Growth Index—The Russell 1000 Growth Index is an unmanaged index which contains those securities in the Russell 1000® Index with an above-average growth orientation. Companies in this index tend to exhibit higher price-to-book and price-to-earnings ratios, lower dividend yields, and higher forecasted growth rates.
Investors cannot invest directly in an index. The returns for the Index would be lower if they included the effects of sales charges, operating expenses of a mutual fund, or taxes that may be paid by an investor.
| 6 | Visit our website at pgim.com/investments |
Presentation of Fund Holdings as of 7/31/2022
| Ten Largest Holdings | Line of Business | % of Net Assets | ||
| Microsoft Corp. | Software | 7.0% | ||
| Apple, Inc. | Technology Hardware, Storage & Peripherals | 6.9% | ||
| Tesla, Inc. | Automobiles | 6.9% | ||
| Alphabet, Inc. (Class A Stock) | Interactive Media & Services | 5.9% | ||
| Amazon.com, Inc. | Internet & Direct Marketing Retail | 5.4% | ||
| Visa, Inc. (Class A Stock) | IT Services | 3.4% | ||
| UnitedHealth Group, Inc. | Health Care Providers & Services | 2.5% | ||
| NVIDIA Corp. | Semiconductors & Semiconductor Equipment | 2.2% | ||
| LVMH Moet Hennessy Louis Vuitton SE (France) | Textiles, Apparel & Luxury Goods | 2.2% | ||
| Danaher Corp. | Life Sciences Tools & Services | 1.9% | ||
Holdings reflect only long-term investments and are subject to change.
| PGIM Jennison Diversified Growth Fund | 7 |
Strategy and Performance Overview*
(unaudited)
How did the Fund perform?
The PGIM Jennison Diversified Growth Fund’s Class Z shares returned –18.16% in the 12-month reporting period that ended July 31, 2022, underperforming the –11.93% return of the Russell 1000® Growth Index (the Index).
What was the market environment?
| ● | Over the past year, the investment backdrop changed from one of stimulus and spending to one of inflation and tightening financial conditions, with the need to control inflation moving aggressively to the fore. |
| ● | US equity markets closed out 2021 at all-time highs. However, rapidly rising inflation spurred the Federal Reserve (the Fed) to pivot to a tightening stance late in the year, leading to a spike in Treasury yields and a general repricing of risk, which weighed heavily on high-valuation, high-growth stocks. |
| ● | The investment environment at the start of 2022 was clouded by continued uncertainties related to the COVID-19 pandemic, inflation, and the prospect of slowing growth on the back of the Fed’s plans for policy tightening. The brutal military conflict in Ukraine added a dangerous new dimension of uncertainty in late February. Commodity prices rose sharply, led by crude oil, as the sanctions imposed on Russia by the US and European Union made it difficult for the world’s largest oil exporter to complete transactions. |
| ● | As the year progressed, stock prices continued to suffer from the impacts of the war in Ukraine, unexpectedly high inflation, tightening monetary policy, and ongoing COVID-19 lockdowns in China, with the S&P 500® Index suffering its worst first-half performance in more than 50 years. |
| ● | The accumulation of these events started to weigh on GDP growth around the globe. Commodity prices continued to exhibit strength due to the imbalance between Russia/Ukraine-related supply constraints and still-resilient demand, until concerns over the effects of high prices on demand and downward revisions in global growth expectations drove a reversal across many commodities in June. |
| ● | Rising US interest rates, global growth concerns, and a flight to safety drove the US dollar higher versus other global currencies later in the period, adding a further headwind to earnings for US multinationals due to the translation of foreign profits to US currency. |
| ● | The Fed’s task of bringing inflation back to its 2% target without undermining the robust employment backdrop and precipitating a recession underscored prevailing uncertainty regarding the macro outlook. |
| ● | On a positive note, some improvement in headline inflation trends toward the end of the period and solid second-quarter 2022 earnings reports from a number of the Fund’s largest holdings supported a strong rebound in stocks in the final six weeks of the period. |
| 8 | Visit our website at pgim.com/investments |
What worked?
| ● | On the positive side, Tesla produced solid performance over the entire period in both absolute and relative terms. The company’s stock price fell sharply in the second quarter of 2022 on concerns regarding CEO Elon Musk’s plan to buy Twitter and temporary production shutdowns at the company’s Shanghai plant. Despite these concerns, the company delivered exceptional operating results, with total revenues in the first quarter of 2022 up over 80% from a year earlier and operating margins setting a new record. Jennison continues to expect above-consensus earnings from Tesla over the next several years, supporting a positive, long-term view of the stock. |
| ● | Several of the Fund’s healthcare positions added value during the period, benefiting in part from the relative defensiveness of the sector, but also reflecting positive trends for a number of holdings. UnitedHealth Group, the largest healthcare benefit plan provider in the US, was a top absolute and relative performer. Jennison views UnitedHealth as a quality earnings compounder with limited macroeconomic exposure and expects the company to deliver mid-teens earnings growth for the next few years—a positive outlook not fully reflected in the stock price. Medical device maker Danaher Corporation also outperformed during the period, helped in part by diminishing concerns regarding the impact on results of a decline in COVID-19-related revenues. |
| ● | It is worth noting that the tone on enterprise technology spending, in particular relating to digital transformation initiatives, remained positive during the period. Results from Microsoft, customer relationship management software company Salesforce Inc., cloud-based data platform Snowflake Inc., and enterprise software management company Atlassian Corporation Plc pointed to the mission-critical nature of their products and services, as customer initiatives around cloud migration, data analysis, collaboration, and go-to-market optimization remain top priorities. |
What didn’t work?
| ● | The persistence of high inflation and the growing consensus that the global economy will slow meaningfully over the next year largely drove the market selloff during the period. Growth stocks underperformed the broad market, with the effect magnified in the case of long-duration growth stocks, a number of which were owned in the Fund. Reflecting this, the Fund underperformed the Index for the period, with June and July offering a degree of relative improvement. |
| ● | Relatively few stocks were responsible for the Fund’s underperformance. Five holdings accounted for the relative shortfall, with two of these—online visual communications company Snap Inc. and e-commerce platform Shopify Inc.— which was sold later in the period. Snap faced revenue pressures from Apple Inc.’s privacy changes and the slowing economy, which led to disappointing earnings reports and a mid-quarter guidance change in May. Jennison sold the Fund’s Shopify position due to concerns about gross margins and the company’s longer-term path to profitability after management confirmed that cash flow would be channeled into investments to grow the business for the foreseeable future. The company also announced that $1 |
| PGIM Jennison Diversified Growth Fund | 9 |
Strategy and Performance Overview* (continued)
billion would be directed toward developing its fulfillment network, a plan that was not well received at a time when the market was already punishing high-valuation growth stocks. |
| ● | Two of the top relative detractors, consumer electronics maker Apple and enterprise software company Microsoft Corporation, outperformed the Index during the period. Given its significant weight in the Fund and the stock’s strong performance, Apple was a top contributor to the Fund’s absolute returns. Jennison believes this performance reflected the company’s consistently impressive results, as well as the stock’s relative defensiveness at a time of elevated market volatility. However, as Apple represented an even larger weight in the Index, the stock’s outperformance weighed on the Fund’s relative performance. In similar fashion, while Microsoft remains a significant position in the Fund, the stock represented an even larger weight in the Index, so its outperformance also detracted from relative returns. |
| ● | China proved to be challenging geography for the Fund’s multinational holdings during much of period, with athletic apparel company Nike Inc., electric car manufacturer Tesla Inc., and personal products firm The Estee Lauder Companies Inc. citing the impacts of pandemic-related Chinese lockdowns on both supply and demand. Tesla shares fell sharply in the second quarter of 2022 on concerns about CEO Elon Musk’s plan to buy social media platform Twitter Inc. and production shutdowns at the company’s Shanghai plant, which resulted in reduced deliveries. However, the factory was able to reopen relatively quickly, as the company implemented a workaround that involved housing employees at the facility. In Estee Lauder’s case, the company’s largest domestic distribution center is in Shanghai, where COVID-19 lockdowns required closure for several weeks. Retail sales of cosmetics were also impacted by the closure of brick-and-mortar outlets. Nike experienced similar challenges, citing pressure on its local production and sales in stores. Jennison sold the Fund’s position in Nike later in the period. |
| ● | Elevated freight and logistics costs became a challenge during the period for companies moving goods from manufacturing through distribution and retail. Apparel retailer The TJX Companies, Inc., athletic apparel company Lululemon Athletica Inc., online retailer Amazon.com, Inc., and others identified these higher costs as headwinds. Jennison sold the Fund’s positions in TJX and Lululemon during the period. |
Current outlook
| ● | As of July 31, 2022, the Fund’s largest overweight position relative to the Index was in consumer discretionary, and its most significantly underweight positions were in information technology and industrials. Relative to the prior reporting period, the Fund had a larger allocation to healthcare, energy, consumer staples, and real estate, with a smaller allocation to communication services, information technology, and consumer discretionary. |
| ● | Companies across the Fund’s portfolio are approaching their planning with the recognition that the intermediate-term outlook poses greater uncertainty today than it |
| 10 | Visit our website at pgim.com/investments |
| did a year ago. Adjustments in hiring plans and greater impact from foreign currency translation on reported profits are among the shifts that are affecting full-year financial outlooks at this stage. |
| ● | The advantages and attributes of high-quality growth companies tend to attract greater investor attention during periods of slowing growth, given their relative resiliency to economic headwinds. For much of the past 40 years, disinflation was the common theme, and interest rates trended lower, particularly during economic slowdowns. In the current cycle, however, a spike in inflation has forced policymakers and the market to respond with sharply higher interest rates, pushing up the discount rate investors apply to the value of future cash flows for many of the growth companies that make up the Fund. As a result, the overall valuation of the Fund shifted significantly over the past several months, returning to pre-pandemic levels. |
| ● | One of the lessons learned over 50+ years of investing on behalf of clients is that extreme equity market weakness can lead to unexpected end-market weakness. Jennison is analyzing the risks to revenue growth, operating margins, cash flow, and earnings growth under different distress scenarios. Through bottom-up research and analysis, Jennison continues to see the companies held by the Fund as best positioned to withstand the slowdown through their exposure to unique products and services that address demands in growing markets through innovation and agility. The companies’ strong balance sheets and financial flexibility should allow them to gain market share from weaker competitors, while continuing to invest for future growth. Recent results from many companies represented in the Fund have been encouraging in this regard. |
| ● | Jennison remains optimistic about the prospects for the Fund’s holdings over a multiyear investment time horizon. While acknowledging the challenges of today’s complex investment landscape, Jennison firmly believes the Fund’s holdings continue to embody growth potential. |
* This strategy and performance overview, which discusses what strategies or holdings (including derivatives, if applicable) affected the Fund’s performance, is compiled based on how the Fund performed relative to the Fund’s assigned index and is viewed for performance attribution purposes at the aggregate Fund level, which in most instances will not directly correlate to the amounts disclosed in the Statement of Operations which conform to U.S. generally accepted accounting principles.
| PGIM Jennison Diversified Growth Fund | 11 |
As a shareholder of the Fund, you incur two types of costs: (1) transaction costs, including sales charges (loads) on purchase payments and redemptions, as applicable, and (2) ongoing costs, including management fees, distribution and/or service (12b-1) fees, and other Fund expenses, as applicable. This example is intended to help you understand your ongoing costs (in dollars) of investing in the Fund and to compare these costs with the ongoing costs of investing in other mutual funds.
The example is based on an investment of $1,000 held through the six-month period ended July 31, 2022. The example is for illustrative purposes only; you should consult the Prospectus for information on initial and subsequent minimum investment requirements.
Actual Expenses
The first line for each share class in the table on the following page provides information about actual account values and actual expenses. You may use the information on this line, together with the amount you invested, to estimate the expenses that you paid over the period. Simply divide your account value by $1,000 (for example, an $8,600 account value ÷ $1,000 = 8.6), then multiply the result by the number on the first line under the heading “Expenses Paid During the Six-Month Period” to estimate the expenses you paid on your account during this period.
Hypothetical Example for Comparison Purposes
The second line for each share class in the table on the following page provides information about hypothetical account values and hypothetical expenses based on the Fund’s actual expense ratio and an assumed rate of return of 5% per year before expenses, which is not the Fund’s actual return. The hypothetical account values and expenses may not be used to estimate the actual ending account balance or expenses you paid for the period. You may use this information to compare the ongoing costs of investing in the Fund and other funds. To do so, compare this 5% hypothetical example with the 5% hypothetical examples that appear in the shareholder reports of the other funds.
The Fund’s transfer agent may charge additional fees to holders of certain accounts that are not included in the expenses shown in the table on the following page. These fees apply to individual retirement accounts (IRAs) and Section 403(b) accounts. As of the close of the six-month period covered by the table, IRA fees included an annual maintenance fee of $15 per account (subject to a maximum annual maintenance fee of $25 for all accounts held by the same shareholder). Section 403(b) accounts are charged an annual $25 fiduciary maintenance fee. Some of the fees may vary in amount, or may be waived, based on your total account balance or the number of PGIM funds, including the Fund, that you own. You should consider the additional fees that were charged to your Fund account over the six-month period when you estimate the total ongoing expenses paid over the period and the impact of these fees on your ending account value, as these additional expenses are not reflected in the information
| 12 | Visit our website at pgim.com/investments |
provided in the expense table. Additional fees have the effect of reducing investment returns.
Please note that the expenses shown in the table are meant to highlight your ongoing costs only and do not reflect any transactional costs such as sales charges (loads). Therefore, the second line for each share class in the table is useful in comparing ongoing costs only and will not help you determine the relative total costs of owning different funds. In addition, if these transactional costs were included, your costs would have been higher.
PGIM Jennison Diversified Growth Fund | Beginning February 1, 2022 | Ending July 31, 2022 | Annualized Expense Six-Month Period | Expenses Paid During the Six-Month Period* | ||||||
| Class A | Actual | $1,000.00 | $ 860.90 | 1.19% | $ 5.49 | |||||
| Hypothetical | $1,000.00 | $1,018.89 | 1.19% | $ 5.96 | ||||||
| Class C | Actual | $1,000.00 | $ 856.00 | 2.22% | $10.22 | |||||
| Hypothetical | $1,000.00 | $1,013.79 | 2.22% | $11.08 | ||||||
| Class Z | Actual | $1,000.00 | $ 860.80 | 1.02% | $ 4.71 | |||||
| Hypothetical | $1,000.00 | $1,019.74 | 1.02% | $ 5.11 | ||||||
| Class R6 | Actual | $1,000.00 | $ 861.40 | 1.00% | $ 4.62 | |||||
| Hypothetical | $1,000.00 | $1,019.84 | 1.00% | $ 5.01 | ||||||
*Fund expenses (net of fee waivers or subsidies, if any) for each share class are equal to the annualized expense ratio for each share class (provided in the table), multiplied by the average account value over the period, multiplied by the 181 days in the six-month period ended July 31, 2022, and divided by the 365 days in the Fund’s fiscal year ended July 31, 2022 (to reflect the six-month period). Expenses presented in the table include the expenses of any underlying portfolios in which the Fund may invest.
| PGIM Jennison Diversified Growth Fund | 13 |
as of July 31, 2022
| Description | Shares | Value | ||||||
LONG-TERM INVESTMENTS 99.1% | ||||||||
COMMON STOCKS | ||||||||
Air Freight & Logistics 1.4% | ||||||||
United Parcel Service, Inc. (Class B Stock) | 18,663 | $ | 3,637,232 | |||||
Automobiles 6.9% | ||||||||
Tesla, Inc.* | 20,094 | 17,912,796 | ||||||
Beverages 1.3% | ||||||||
Coca-Cola Co. (The) | 9,858 | 632,588 | ||||||
PepsiCo, Inc. | 15,200 | 2,659,392 | ||||||
|
| |||||||
| 3,291,980 | ||||||||
Biotechnology 0.2% | ||||||||
AbbVie, Inc. | 4,110 | 589,826 | ||||||
Capital Markets 1.1% | ||||||||
Ameriprise Financial, Inc. | 8,174 | 2,206,326 | ||||||
Charles Schwab Corp. (The) | 10,612 | 732,759 | ||||||
|
| |||||||
| 2,939,085 | ||||||||
Chemicals 0.9% | ||||||||
Linde PLC (United Kingdom) | 7,788 | 2,351,976 | ||||||
Consumer Finance 0.8% | ||||||||
American Express Co. | 12,782 | 1,968,684 | ||||||
Containers & Packaging 0.2% | ||||||||
Ball Corp. | 8,585 | 630,311 | ||||||
Distributors 0.2% | ||||||||
Pool Corp. | 1,749 | 625,617 | ||||||
Electronic Equipment, Instruments & Components 1.8% | ||||||||
CDW Corp. | 12,417 | 2,254,058 | ||||||
Keysight Technologies, Inc.* | 14,156 | 2,301,766 | ||||||
|
| |||||||
| 4,555,824 | ||||||||
Energy Equipment & Services 0.8% | ||||||||
Schlumberger NV(a) | 56,421 | 2,089,270 | ||||||
See Notes to Financial Statements.
| PGIM Jennison Diversified Growth Fund | 15 |
Schedule of Investments (continued)
as of July 31, 2022
| Description | Shares | Value | ||||||
COMMON STOCKS (Continued) | ||||||||
Entertainment 1.2% | ||||||||
Netflix, Inc.* | 9,363 | $ | 2,105,739 | |||||
World Wrestling Entertainment, Inc. (Class A Stock)(a) | 13,288 | 920,991 | ||||||
|
| |||||||
| 3,026,730 | ||||||||
Equity Real Estate Investment Trusts (REITs) 1.1% | ||||||||
American Tower Corp. | 8,388 | 2,271,722 | ||||||
Public Storage | 1,904 | 621,485 | ||||||
|
| |||||||
| 2,893,207 | ||||||||
Food & Staples Retailing 2.1% | ||||||||
Costco Wholesale Corp. | 4,492 | 2,431,520 | ||||||
Performance Food Group Co.* | 12,209 | 606,909 | ||||||
Sysco Corp. | 28,179 | 2,392,397 | ||||||
|
| |||||||
| 5,430,826 | ||||||||
Food Products 0.5% | ||||||||
Darling Ingredients, Inc.* | 17,645 | 1,222,446 | ||||||
Health Care Equipment & Supplies 1.5% | ||||||||
Abbott Laboratories | 36,825 | 4,008,033 | ||||||
Health Care Providers & Services 2.9% | ||||||||
AmerisourceBergen Corp. | 7,284 | 1,062,954 | ||||||
UnitedHealth Group, Inc. | 12,076 | 6,549,298 | ||||||
|
| |||||||
| 7,612,252 | ||||||||
Hotels, Restaurants & Leisure 0.9% | ||||||||
Hilton Worldwide Holdings, Inc. | 4,806 | 615,504 | ||||||
Marriott International, Inc. (Class A Stock) | 3,942 | 626,069 | ||||||
Travel + Leisure Co. | 22,791 | 982,520 | ||||||
|
| |||||||
| 2,224,093 | ||||||||
Insurance 0.9% | ||||||||
Lincoln National Corp. | 15,971 | 819,951 | ||||||
Marsh & McLennan Cos., Inc. | 9,815 | 1,609,267 | ||||||
|
| |||||||
| 2,429,218 | ||||||||
Interactive Media & Services 5.9% | ||||||||
Alphabet, Inc. (Class A Stock)* | 131,734 | 15,323,299 | ||||||
See Notes to Financial Statements.
| 16 |
| Description | Shares | Value | ||||||
COMMON STOCKS (Continued) | ||||||||
Internet & Direct Marketing Retail 6.1% | ||||||||
Amazon.com, Inc.* | 104,119 | $ | 14,050,859 | |||||
MercadoLibre, Inc. (Brazil)* | 2,223 | 1,808,877 | ||||||
|
| |||||||
| 15,859,736 | ||||||||
IT Services 9.9% | ||||||||
Accenture PLC (Class A Stock) | 14,507 | 4,442,914 | ||||||
Adyen NV (Netherlands), 144A* | 1,604 | 2,885,233 | ||||||
Gartner, Inc.* | 2,381 | 632,108 | ||||||
International Business Machines Corp. | 22,253 | 2,910,470 | ||||||
Mastercard, Inc. (Class A Stock) | 10,441 | 3,693,921 | ||||||
Snowflake, Inc. (Class A Stock)*(a) | 14,656 | 2,197,081 | ||||||
Visa, Inc. (Class A Stock)(a) | 42,061 | 8,921,558 | ||||||
|
| |||||||
| 25,683,285 | ||||||||
Leisure Products 0.2% | ||||||||
Polaris, Inc. | 5,577 | 654,070 | ||||||
Life Sciences Tools & Services 2.8% | ||||||||
Danaher Corp. | 16,826 | 4,904,274 | ||||||
Thermo Fisher Scientific, Inc. | 3,823 | 2,287,722 | ||||||
|
| |||||||
| 7,191,996 | ||||||||
Media 0.4% | ||||||||
Liberty Media Corp.-Liberty SiriusXM (Class C Stock)* | 28,904 | 1,150,957 | ||||||
Multiline Retail 0.4% | ||||||||
Nordstrom, Inc.(a) | 45,211 | 1,062,911 | ||||||
Oil, Gas & Consumable Fuels 0.6% | ||||||||
Texas Pacific Land Corp. | 904 | 1,657,800 | ||||||
Personal Products 0.6% | ||||||||
Estee Lauder Cos., Inc. (The) (Class A Stock) | 5,576 | 1,522,806 | ||||||
Pharmaceuticals 4.0% | ||||||||
Eli Lilly & Co. | 13,236 | 4,363,777 | ||||||
Merck & Co., Inc. | 30,397 | 2,715,668 | ||||||
Novo Nordisk A/S (Denmark), ADR | 27,638 | 3,207,666 | ||||||
|
| |||||||
| 10,287,111 | ||||||||
See Notes to Financial Statements.
| PGIM Jennison Diversified Growth Fund | 17 |
Schedule of Investments (continued)
as of July 31, 2022
| Description | Shares | Value | ||||||
COMMON STOCKS (Continued) | ||||||||
Professional Services 0.7% | ||||||||
Robert Half International, Inc. | 22,031 | $ | 1,743,533 | |||||
Real Estate Management & Development 0.5% | ||||||||
CBRE Group, Inc. (Class A Stock)* | 16,706 | 1,430,368 | ||||||
Road & Rail 1.7% | ||||||||
CSX Corp. | 19,516 | 630,952 | ||||||
J.B. Hunt Transport Services, Inc. | 10,213 | 1,871,736 | ||||||
Old Dominion Freight Line, Inc.(a) | 6,278 | 1,905,436 | ||||||
|
| |||||||
| 4,408,124 | ||||||||
Semiconductors & Semiconductor Equipment 7.6% | ||||||||
Advanced Micro Devices, Inc.* | 18,895 | 1,785,011 | ||||||
Applied Materials, Inc. | 29,482 | 3,124,502 | ||||||
ASML Holding NV (Netherlands) | 2,535 | 1,456,206 | ||||||
Broadcom, Inc. | 2,032 | 1,088,095 | ||||||
Lam Research Corp. | 3,175 | 1,589,119 | ||||||
Micron Technology, Inc. | 16,878 | 1,044,073 | ||||||
NVIDIA Corp. | 31,865 | 5,787,640 | ||||||
ON Semiconductor Corp.* | 9,937 | 663,593 | ||||||
QUALCOMM, Inc. | 17,737 | 2,572,929 | ||||||
Texas Instruments, Inc. | 3,621 | 647,761 | ||||||
|
| |||||||
| 19,758,929 | ||||||||
Software 15.2% | ||||||||
Adobe, Inc.* | 8,637 | 3,542,206 | ||||||
Atlassian Corp. PLC (Class A Stock)* | 6,730 | 1,408,724 | ||||||
Cadence Design Systems, Inc.* | 4,596 | 855,224 | ||||||
Crowdstrike Holdings, Inc. (Class A Stock)* | 6,317 | 1,159,801 | ||||||
Datadog, Inc. (Class A Stock)* | 20,199 | 2,060,500 | ||||||
DocuSign, Inc.* | 10,485 | 670,830 | ||||||
Fortinet, Inc.* | 21,585 | 1,287,545 | ||||||
Microsoft Corp. | 64,617 | 18,140,577 | ||||||
Palo Alto Networks, Inc.* | 4,550 | 2,270,905 | ||||||
Salesforce, Inc.* | 19,931 | 3,667,703 | ||||||
ServiceNow, Inc.* | 1,968 | 879,027 | ||||||
Synopsys, Inc.* | 7,252 | 2,665,110 | ||||||
Zoom Video Communications, Inc. (Class A Stock)* | 8,335 | 865,673 | ||||||
|
| |||||||
| 39,473,825 | ||||||||
Specialty Retail 4.3% | ||||||||
AutoZone, Inc.* | 1,108 | 2,368,228 | ||||||
See Notes to Financial Statements.
| 18 |
| Description | Shares | Value | ||||||
COMMON STOCKS (Continued) | ||||||||
Specialty Retail (cont’d.) | ||||||||
Home Depot, Inc. (The) | 8,550 | $ | 2,573,037 | |||||
Lowe’s Cos., Inc. | 17,238 | 3,301,594 | ||||||
Ulta Beauty, Inc.* | 5,143 | 2,000,164 | ||||||
Williams-Sonoma, Inc.(a) | 7,332 | 1,058,888 | ||||||
|
| |||||||
| 11,301,911 | ||||||||
Technology Hardware, Storage & Peripherals 7.6% | ||||||||
Apple, Inc. | 110,755 | 17,998,795 | ||||||
Dell Technologies, Inc. (Class C Stock) | 18,219 | 820,948 | ||||||
HP, Inc. | 24,844 | 829,541 | ||||||
|
| |||||||
| 19,649,284 | ||||||||
Textiles, Apparel & Luxury Goods 2.5% | ||||||||
LVMH Moet Hennessy Louis Vuitton SE (France) | 8,315 | 5,773,560 | ||||||
Tapestry, Inc. | 18,416 | 619,330 | ||||||
|
| |||||||
| 6,392,890 | ||||||||
Trading Companies & Distributors 1.4% | ||||||||
United Rentals, Inc.* | 5,185 | 1,673,044 | ||||||
W.W. Grainger, Inc. | 3,524 | 1,915,400 | ||||||
|
| |||||||
| 3,588,444 | ||||||||
|
| |||||||
TOTAL LONG-TERM INVESTMENTS | 257,580,685 | |||||||
|
| |||||||
SHORT-TERM INVESTMENTS 6.4% | ||||||||
AFFILIATED MUTUAL FUND 5.5% | ||||||||
PGIM Institutional Money Market Fund | 14,116,184 | 14,102,068 | ||||||
|
| |||||||
See Notes to Financial Statements.
| PGIM Jennison Diversified Growth Fund | 19 |
Schedule of Investments (continued)
as of July 31, 2022
| Description | Shares | Value | ||||||
UNAFFILIATED FUND 0.9% | ||||||||
Dreyfus Government Cash Management (Institutional Shares) | 2,393,953 | $ | 2,393,953 | |||||
|
| |||||||
TOTAL SHORT-TERM INVESTMENTS | 16,496,021 | |||||||
|
| |||||||
TOTAL INVESTMENTS 105.5% | 274,076,706 | |||||||
Liabilities in excess of other assets (5.5)% | (14,225,795 | ) | ||||||
|
| |||||||
NET ASSETS 100.0% | $ | 259,850,911 | ||||||
|
| |||||||
Below is a list of the abbreviation(s) used in the annual report:
144A—Security was purchased pursuant to Rule 144A under the Securities Act of 1933 and, pursuant to the requirements of Rule 144A, may not be resold except to qualified institutional buyers.
ADR—American Depositary Receipt
LIBOR—London Interbank Offered Rate
REITs—Real Estate Investment Trust
| * | Non-income producing security. |
| (a) | All or a portion of security is on loan. The aggregate market value of such securities, including those sold and pending settlement, is $14,079,308; cash collateral of $14,081,822 (included in liabilities) was received with which the Fund purchased highly liquid short-term investments. In the event of significant appreciation in value of securities on loan on the last business day of the reporting period, the Fund may reflect a collateral value that is less than the market value of the loaned securities and such shortfall is remedied the following business day. |
| (b) | Represents security, or portion thereof, purchased with cash collateral received for securities on loan and includes dividend reinvestment. |
| (wa) | PGIM Investments LLC, the manager of the Fund, also serves as manager of the PGIM Core Ultra Short Bond Fund and PGIM Institutional Money Market Fund, if applicable. |
Fair Value Measurements:
Various inputs are used in determining the value of the Fund’s investments. These inputs are summarized in the three broad levels listed below.
Level 1—unadjusted quoted prices generally in active markets for identical securities.
Level 2—quoted prices for similar securities, interest rates and yield curves, prepayment speeds, foreign currency exchange rates and other observable inputs.
Level 3—unobservable inputs for securities valued in accordance with Board approved fair valuation procedures.
See Notes to Financial Statements.
| 20 |
The following is a summary of the inputs used as of July 31, 2022 in valuing such portfolio securities:
| Level 1 | Level 2 | Level 3 | |||||||||||||
Investments in Securities | |||||||||||||||
Assets | |||||||||||||||
Long-Term Investments | |||||||||||||||
Common Stocks | |||||||||||||||
Air Freight & Logistics | $ | 3,637,232 | $ | — | $— | ||||||||||
Automobiles | 17,912,796 | — | — | ||||||||||||
Beverages | 3,291,980 | — | — | ||||||||||||
Biotechnology | 589,826 | — | — | ||||||||||||
Capital Markets | 2,939,085 | — | — | ||||||||||||
Chemicals | 2,351,976 | — | — | ||||||||||||
Consumer Finance | 1,968,684 | — | — | ||||||||||||
Containers & Packaging | 630,311 | — | — | ||||||||||||
Distributors | 625,617 | — | — | ||||||||||||
Electronic Equipment, Instruments & Components | 4,555,824 | — | — | ||||||||||||
Energy Equipment & Services | 2,089,270 | — | — | ||||||||||||
Entertainment | 3,026,730 | — | — | ||||||||||||
Equity Real Estate Investment Trusts (REITs) | 2,893,207 | — | — | ||||||||||||
Food & Staples Retailing | 5,430,826 | — | — | ||||||||||||
Food Products | 1,222,446 | — | — | ||||||||||||
Health Care Equipment & Supplies | 4,008,033 | — | — | ||||||||||||
Health Care Providers & Services | 7,612,252 | — | — | ||||||||||||
Hotels, Restaurants & Leisure | 2,224,093 | — | — | ||||||||||||
Insurance | 2,429,218 | — | — | ||||||||||||
Interactive Media & Services | 15,323,299 | — | — | ||||||||||||
Internet & Direct Marketing Retail | 15,859,736 | — | — | ||||||||||||
IT Services | 22,798,052 | 2,885,233 | — | ||||||||||||
Leisure Products | 654,070 | — | — | ||||||||||||
Life Sciences Tools & Services | 7,191,996 | — | — | ||||||||||||
Media | 1,150,957 | — | — | ||||||||||||
Multiline Retail | 1,062,911 | — | — | ||||||||||||
Oil, Gas & Consumable Fuels | 1,657,800 | — | — | ||||||||||||
Personal Products | 1,522,806 | — | — | ||||||||||||
Pharmaceuticals | 10,287,111 | — | — | ||||||||||||
Professional Services | 1,743,533 | — | — | ||||||||||||
Real Estate Management & Development | 1,430,368 | — | — | ||||||||||||
Road & Rail | 4,408,124 | — | — | ||||||||||||
Semiconductors & Semiconductor Equipment | 19,758,929 | — | — | ||||||||||||
Software | 39,473,825 | — | — | ||||||||||||
Specialty Retail | 11,301,911 | — | — | ||||||||||||
Technology Hardware, Storage & Peripherals | 19,649,284 | — | — | ||||||||||||
Textiles, Apparel & Luxury Goods | 619,330 | 5,773,560 | — | ||||||||||||
Trading Companies & Distributors | 3,588,444 | — | — | ||||||||||||
Short-Term Investments | |||||||||||||||
Affiliated Mutual Fund | 14,102,068 | — | — | ||||||||||||
Unaffiliated Fund | 2,393,953 | — | — | ||||||||||||
|
|
|
|
|
| ||||||||||
Total | $ | 265,417,913 | $ | 8,658,793 | $— | ||||||||||
|
|
|
|
|
| ||||||||||
See Notes to Financial Statements.
| PGIM Jennison Diversified Growth Fund | 21 |
Schedule of Investments (continued)
as of July 31, 2022
Industry Classification:
The industry classification of investments and liabilities in excess of other assets shown as a percentage of net assets as of July 31, 2022 were as follows:
| Software | 15.2 | % | ||
| IT Services | 9.9 | |||
| Semiconductors & Semiconductor Equipment | 7.6 | |||
| Technology Hardware, Storage & Peripherals | 7.6 | |||
| Automobiles | 6.9 | |||
| Internet & Direct Marketing Retail | 6.1 | |||
| Interactive Media & Services | 5.9 | |||
| Affiliated Mutual Fund (5.4% represents investments purchased with collateral from securities on loan) | 5.5 | |||
| Specialty Retail | 4.3 | |||
| Pharmaceuticals | 4.0 | |||
| Health Care Providers & Services | 2.9 | |||
| Life Sciences Tools & Services | 2.8 | |||
| Textiles, Apparel & Luxury Goods | 2.5 | |||
| Food & Staples Retailing | 2.1 | |||
| Electronic Equipment, Instruments & Components | 1.8 | |||
| Road & Rail | 1.7 | |||
| Health Care Equipment & Supplies | 1.5 | |||
| Air Freight & Logistics | 1.4 | |||
| Trading Companies & Distributors | 1.4 | |||
| Beverages | 1.3 | |||
| Entertainment | 1.2 | |||
| Capital Markets | 1.1 |
| Equity Real Estate Investment Trusts (REITs) | 1.1 | % | ||
| Insurance | 0.9 | |||
| Unaffiliated Fund | 0.9 | |||
| Chemicals | 0.9 | |||
| Hotels, Restaurants & Leisure | 0.9 | |||
| Energy Equipment & Services | 0.8 | |||
| Consumer Finance | 0.8 | |||
| Professional Services | 0.7 | |||
| Oil, Gas & Consumable Fuels | 0.6 | |||
| Personal Products | 0.6 | |||
| Real Estate Management & Development | 0.5 | |||
| Food Products | 0.5 | |||
| Media | 0.4 | |||
| Multiline Retail | 0.4 | |||
| Leisure Products | 0.2 | |||
| Containers & Packaging | 0.2 | |||
| Distributors | 0.2 | |||
| Biotechnology | 0.2 | |||
|
| |||
| 105.5 | ||||
| Liabilities in excess of other assets | (5.5 | ) | ||
|
| |||
| 100.0 | % | |||
|
| |||
Financial Instruments/Transactions—Summary of Offsetting and Netting Arrangements:
The Fund entered into financial instruments/transactions during the reporting period that are either offset in accordance with current requirements or are subject to enforceable master netting arrangements or similar agreements that permit offsetting. The information about offsetting and related netting arrangements for financial instruments/transactions where the legal right to set-off exists is presented in the summary below.
Offsetting of financial instrument/transaction assets and liabilities:
| Description | Gross Market Value of Recognized Assets/(Liabilities) | Collateral Pledged/(Received)(1) | Net Amount | ||||||||||||
Securities on Loan | $14,079,308 | $(14,079,308) | $— | ||||||||||||
(1) | Collateral amount disclosed by the Fund is limited to the market value of financial instruments/transactions. |
See Notes to Financial Statements.
| 22 |
Statement of Assets and Liabilities
as of July 31, 2022
Assets | ||||
Investments at value, including securities on loan of $14,079,308: | ||||
Unaffiliated investments (cost $173,139,485) | $ | 259,974,638 | ||
Affiliated investments (cost $14,101,507) | 14,102,068 | |||
Receivable for investments sold | 31,465,732 | |||
Dividends receivable | 111,633 | |||
Tax reclaim receivable | 28,652 | |||
Receivable for Fund shares sold | 26,366 | |||
Prepaid expenses | 85 | |||
|
| |||
Total Assets | 305,709,174 | |||
|
| |||
Liabilities | ||||
Payable for investments purchased | 31,338,354 | |||
Payable to broker for collateral for securities on loan | 14,081,822 | |||
Management fee payable | 143,165 | |||
Accrued expenses and other liabilities | 109,919 | |||
Payable for Fund shares purchased | 89,149 | |||
Distribution fee payable | 52,437 | |||
Affiliated transfer agent fee payable | 42,406 | |||
Trustees’ fees payable | 1,011 | |||
|
| |||
Total Liabilities | 45,858,263 | |||
|
| |||
Net Assets | $ | 259,850,911 | ||
|
| |||
| ||||
Net assets were comprised of: | ||||
Shares of beneficial interest, at par | $ | 20,352 | ||
Paid-in capital in excess of par | 192,644,688 | |||
Total distributable earnings (loss) | 67,185,871 | |||
|
| |||
Net assets, July 31, 2022 | $ | 259,850,911 | ||
|
| |||
See Notes to Financial Statements.
| PGIM Jennison Diversified Growth Fund | 23 |
Statement of Assets and Liabilities
as of July 31, 2022
Class A | ||||
Net asset value and redemption price per share, ($248,176,872 ÷ 19,289,467 shares of beneficial interest issued and outstanding) | $ | 12.87 | ||
Maximum sales charge (5.50% of offering price) | 0.75 | |||
|
| |||
Maximum offering price to public | $ | 13.62 | ||
|
| |||
Class C | ||||
Net asset value, offering price and redemption price per share, ($4,492,370 ÷ 510,295 shares of beneficial interest issued and outstanding) | $ | 8.80 | ||
|
| |||
Class Z | ||||
Net asset value, offering price and redemption price per share, ($6,305,499 ÷ 485,251 shares of beneficial interest issued and outstanding) | $ | 12.99 | ||
|
| |||
Class R6 | ||||
Net asset value, offering price and redemption price per share, ($876,170 ÷ 67,428 shares of beneficial interest issued and outstanding) | $ | 12.99 | ||
|
| |||
See Notes to Financial Statements.
| 24 |
Statement of Operations
Year Ended July 31, 2022
Net Investment Income (Loss) | ||||
Income | ||||
Unaffiliated dividend income (net of $39,240 foreign withholding tax) | $ | 1,857,707 | ||
Income from securities lending, net (including affiliated income of $7,622) | 10,683 | |||
Affiliated dividend income | 2,161 | |||
|
| |||
Total income | 1,870,551 | |||
|
| |||
Expenses | ||||
Management fee | 2,196,822 | |||
Distribution fee(a) | 959,573 | |||
Transfer agent’s fees and expenses (including affiliated expense of $231,140)(a) | 447,532 | |||
Custodian and accounting fees | 60,658 | |||
Registration fees(a) | 40,887 | |||
Shareholders’ reports | 33,630 | |||
Audit fee | 23,800 | |||
Legal fees and expenses | 21,863 | |||
Trustees’ fees | 13,301 | |||
Miscellaneous | 21,932 | |||
|
| |||
Total expenses | 3,819,998 | |||
Less: Fee waiver and/or expense reimbursement(a) | (5,621 | ) | ||
Distribution fee waiver(a) | (149,366 | ) | ||
|
| |||
Net expenses | 3,665,011 | |||
|
| |||
Net investment income (loss) | (1,794,460 | ) | ||
|
| |||
Realized And Unrealized Gain (Loss) On Investment And Foreign Currency Transactions | ||||
Net realized gain (loss) on: | ||||
Investment transactions (including affiliated of $(3,248)) | (3,343,154 | ) | ||
Foreign currency transactions | (6,208 | ) | ||
|
| |||
| (3,349,362 | ) | |||
|
| |||
Net change in unrealized appreciation (depreciation) on: | ||||
Investments (including affiliated of $561) | (55,801,472 | ) | ||
Foreign currencies | (2,462 | ) | ||
|
| |||
| (55,803,934 | ) | |||
|
| |||
Net gain (loss) on investment and foreign currency transactions | (59,153,296 | ) | ||
|
| |||
Net Increase (Decrease) In Net Assets Resulting From Operations | $ | (60,947,756 | ) | |
|
| |||
(a) | Class specific expenses and waivers were as follows: |
| Class A | Class C | Class Z | Class R6 | |||||||||||||
Distribution fee | 896,197 | 63,376 | — | — | ||||||||||||
Transfer agent’s fees and expenses | 422,157 | 15,946 | 9,168 | 261 | ||||||||||||
Registration fees | 17,034 | 9,468 | 7,667 | 6,718 | ||||||||||||
Fee waiver and/or expense reimbursement | — | — | — | (5,621 | ) | |||||||||||
Distribution fee waiver | (149,366 | ) | — | — | — | |||||||||||
See Notes to Financial Statements.
| PGIM Jennison Diversified Growth Fund | 25 |
Statements of Changes in Net Assets
| Year Ended July 31, | ||||||||
| 2022 | 2021 | |||||||
Increase (Decrease) in Net Assets | ||||||||
Operations | ||||||||
Net investment income (loss) | $ | (1,794,460 | ) | $ | (1,586,890 | ) | ||
Net realized gain (loss) on investment and foreign currency transactions | (3,349,362 | ) | 77,861,502 | |||||
Net change in unrealized appreciation (depreciation) on investments and foreign currencies | (55,803,934 | ) | 21,923,413 | |||||
|
|
|
| |||||
Net increase (decrease) in net assets resulting from operations | (60,947,756 | ) | 98,198,025 | |||||
|
|
|
| |||||
Dividends and Distributions | ||||||||
Distributions from distributable earnings | ||||||||
Class A | (68,141,217 | ) | (44,224,571 | ) | ||||
Class C | (2,039,987 | ) | (1,896,863 | ) | ||||
Class Z | (1,926,858 | ) | (1,066,762 | ) | ||||
Class R6 | (125,175 | ) | (3,041 | ) | ||||
|
|
|
| |||||
| (72,233,237 | ) | (47,191,237 | ) | |||||
|
|
|
| |||||
Fund share transactions (Net of share conversions) | ||||||||
Net proceeds from shares sold | 8,664,267 | 7,594,178 | ||||||
Net asset value of shares issued in reinvestment of dividends and distributions | 71,514,532 | 46,719,701 | ||||||
Cost of shares purchased | (42,322,123 | ) | (40,349,200 | ) | ||||
|
|
|
| |||||
Net increase (decrease) in net assets from Fund share transactions | 37,856,676 | 13,964,679 | ||||||
|
|
|
| |||||
Total increase (decrease) | (95,324,317 | ) | 64,971,467 | |||||
Net Assets: | ||||||||
Beginning of year | 355,175,228 | 290,203,761 | ||||||
|
|
|
| |||||
End of year | $ | 259,850,911 | $ | 355,175,228 | ||||
|
|
|
| |||||
See Notes to Financial Statements.
| 26 |
Financial Highlights
| Class A Shares | ||||||||||||||||||||
| Year Ended July 31, | ||||||||||||||||||||
| 2022 | 2021 | 2020 | 2019 | 2018 | ||||||||||||||||
| Per Share Operating Performance(a): | ||||||||||||||||||||
| Net Asset Value, Beginning of Year | $19.58 | $16.92 | $13.39 | $13.79 | $12.79 | |||||||||||||||
| Income (loss) from investment operations: | ||||||||||||||||||||
| Net investment income (loss) | (0.09 | ) | (0.08 | ) | (0.06 | ) | (0.02 | ) | 0.03 | |||||||||||
| Net realized and unrealized gain (loss) on investment and foreign currency transactions | (2.57 | ) | 5.58 | 4.14 | 0.80 | 2.35 | ||||||||||||||
| Total from investment operations | (2.66 | ) | 5.50 | 4.08 | 0.78 | 2.38 | ||||||||||||||
| Less Dividends and Distributions: | ||||||||||||||||||||
| Dividends from net investment income | - | - | - | (0.01 | ) | (0.02 | ) | |||||||||||||
| Distributions from net realized gains | (4.05 | ) | (2.84 | ) | (0.55 | ) | (1.17 | ) | (1.36 | ) | ||||||||||
| Total dividends and distributions | (4.05 | ) | (2.84 | ) | (0.55 | ) | (1.18 | ) | (1.38 | ) | ||||||||||
| Net asset value, end of year | $12.87 | $19.58 | $16.92 | $13.39 | $13.79 | |||||||||||||||
| Total Return(b): | (18.23 | )% | 35.95 | % | 31.47 | % | 6.93 | % | 19.90 | % | ||||||||||
| Ratios/Supplemental Data: | ||||||||||||||||||||
| Net assets, end of year (000) | $248,177 | $337,246 | $274,044 | $229,202 | $197,689 | |||||||||||||||
| Average net assets (000) | $298,732 | $303,103 | $231,363 | $199,190 | $190,178 | |||||||||||||||
| Ratios to average net assets(c): | ||||||||||||||||||||
| Expenses after waivers and/or expense reimbursement | 1.15 | % | 1.16 | % | 1.22 | % | 1.23 | % | 1.20 | % | ||||||||||
| Expenses before waivers and/or expense reimbursement | 1.20 | % | 1.21 | % | 1.27 | % | 1.28 | % | 1.25 | % | ||||||||||
| Net investment income (loss) | (0.56 | )% | (0.48 | )% | (0.40 | )% | (0.18 | )% | 0.24 | % | ||||||||||
| Portfolio turnover rate(d) | 148 | % | 153 | % | 149 | % | 125 | % | 185 | % | ||||||||||
| (a) | Calculated based on average shares outstanding during the year. |
| (b) | Total return does not consider the effects of sales loads. Total return is calculated assuming a purchase of a share on the first day and a sale on the last day of each year reported and includes reinvestment of dividends and distributions, if any. Total returns may reflect adjustments to conform to GAAP. |
| (c) | Does not include expenses of the underlying funds in which the Fund invests. |
| (d) | The Fund’s portfolio turnover rate is calculated in accordance with regulatory requirements, without regard to transactions involving short-term investments, certain derivatives and in-kind transactions (if any). If such transactions were included, the Fund’s portfolio turnover rate may be higher. |
See Notes to Financial Statements.
| PGIM Jennison Diversified Growth Fund | 27 |
Financial Highlights (continued)
| Class C Shares | ||||||||||||||||||||
| Year Ended July 31, | ||||||||||||||||||||
| 2022 | 2021 | 2020 | 2019 | 2018 | ||||||||||||||||
| Per Share Operating Performance(a): | ||||||||||||||||||||
| Net Asset Value, Beginning of Year | $14.73 | $13.46 | $10.84 | $11.49 | $10.93 | |||||||||||||||
| Income (loss) from investment operations: | ||||||||||||||||||||
| Net investment income (loss) | (0.18 | ) | (0.18 | ) | (0.14 | ) | (0.10 | ) | (0.06 | ) | ||||||||||
| Net realized and unrealized gain (loss) on investment and foreign currency transactions | (1.70 | ) | 4.29 | 3.31 | 0.62 | 1.98 | ||||||||||||||
| Total from investment operations | (1.88 | ) | 4.11 | 3.17 | 0.52 | 1.92 | ||||||||||||||
| Less Dividends and Distributions: | ||||||||||||||||||||
| Distributions from net realized gains | (4.05 | ) | (2.84 | ) | (0.55 | ) | (1.17 | ) | (1.36 | ) | ||||||||||
| Net asset value, end of year | $8.80 | $14.73 | $13.46 | $10.84 | $11.49 | |||||||||||||||
| Total Return(b): | (19.09 | )% | 34.72 | % | 30.34 | % | 5.95 | % | 18.92 | % | ||||||||||
| Ratios/Supplemental Data: | ||||||||||||||||||||
| Net assets, end of year (000) | $4,492 | $8,266 | $9,768 | $8,698 | $48,373 | |||||||||||||||
| Average net assets (000) | $6,338 | $9,112 | $8,502 | $34,180 | $50,985 | |||||||||||||||
| Ratios to average net assets(c): | ||||||||||||||||||||
| Expenses after waivers and/or expense reimbursement | 2.16 | % | 2.03 | % | 2.04 | % | 2.01 | % | 1.92 | % | ||||||||||
| Expenses before waivers and/or expense reimbursement | 2.16 | % | 2.03 | % | 2.04 | % | 2.01 | % | 1.92 | % | ||||||||||
| Net investment income (loss) | (1.57 | )% | (1.34 | )% | (1.22 | )% | (0.91 | )% | (0.49 | )% | ||||||||||
| Portfolio turnover rate(d) | 148 | % | 153 | % | 149 | % | 125 | % | 185 | % | ||||||||||
| (a) | Calculated based on average shares outstanding during the year. |
| (b) | Total return does not consider the effects of sales loads. Total return is calculated assuming a purchase of a share on the first day and a sale on the last day of each year reported and includes reinvestment of dividends and distributions, if any. Total returns may reflect adjustments to conform to GAAP. |
| (c) | Does not include expenses of the underlying funds in which the Fund invests. |
| (d) | The Fund’s portfolio turnover rate is calculated in accordance with regulatory requirements, without regard to transactions involving short-term investments, certain derivatives and in-kind transactions (if any). If such transactions were included, the Fund’s portfolio turnover rate may be higher. |
See Notes to Financial Statements.
| 28 |
| Class Z Shares | ||||||||||||||||||||||||||||
| Year Ended July 31, | September 27, 2017(a) 2018 |
| ||||||||||||||||||||||||||
| 2022 | 2021 | 2020 | 2019 | |||||||||||||||||||||||||
| Per Share Operating Performance(b): | ||||||||||||||||||||||||||||
| Net Asset Value, Beginning of Period | $19.71 | $16.98 | $13.41 | $13.81 | $12.82 | |||||||||||||||||||||||
| Income (loss) from investment operations: | ||||||||||||||||||||||||||||
| Net investment income (loss) | (0.06 | ) | (0.05 | ) | (0.03 | ) | 0.01 | 0.08 | ||||||||||||||||||||
| Net realized and unrealized gain (loss) on investment and foreign currency transactions | (2.61 | ) | 5.62 | 4.15 | 0.80 | 2.29 | ||||||||||||||||||||||
| Total from investment operations | (2.67 | ) | 5.57 | 4.12 | 0.81 | 2.37 | ||||||||||||||||||||||
| Less Dividends and Distributions: | ||||||||||||||||||||||||||||
| Dividends from net investment income | - | - | - | (0.04 | ) | (0.02 | ) | |||||||||||||||||||||
| Distributions from net realized gains | (4.05 | ) | (2.84 | ) | (0.55 | ) | (1.17 | ) | (1.36 | ) | ||||||||||||||||||
| Total dividends and distributions | (4.05 | ) | (2.84 | ) | (0.55 | ) | (1.21 | ) | (1.38 | ) | ||||||||||||||||||
| Net asset value, end of period | $12.99 | $19.71 | $16.98 | $13.41 | $13.81 | |||||||||||||||||||||||
| Total Return(c): | (18.16 | )% | 36.27 | % | 31.73 | % | 7.20 | % | 19.79 | % | ||||||||||||||||||
| Ratios/Supplemental Data: | ||||||||||||||||||||||||||||
| Net assets, end of period (000) | $6,305 | $9,295 | $6,313 | $5,270 | $1,628 | |||||||||||||||||||||||
| Average net assets (000) | $8,098 | $7,439 | $4,915 | $4,485 | $656 | |||||||||||||||||||||||
| Ratios to average net assets(d): | ||||||||||||||||||||||||||||
| Expenses after waivers and/or expense reimbursement | 0.96 | % | 0.95 | % | 1.00 | % | 1.00 | % | 1.00 | %(e) | ||||||||||||||||||
| Expenses before waivers and/or expense reimbursement | 0.96 | % | 0.95 | % | 1.14 | % | 1.15 | % | 5.77 | %(e) | ||||||||||||||||||
| Net investment income (loss) | (0.36 | )% | (0.28 | )% | (0.18 | )% | 0.05 | % | 0.70 | %(e) | ||||||||||||||||||
| Portfolio turnover rate(f) | 148 | % | 153 | % | 149 | % | 125 | % | 185 | % | ||||||||||||||||||
| (a) | Commencement of offering. |
| (b) | Calculated based on average shares outstanding during the period. |
| (c) | Total return is calculated assuming a purchase of a share on the first day and a sale on the last day of each period reported and includes reinvestment of dividends and distributions, if any. Total returns may reflect adjustments to conform to GAAP. Total returns for periods less than one full year are not annualized. |
| (d) | Does not include expenses of the underlying funds in which the Fund invests. |
| (e) | Annualized. |
| (f) | The Fund’s portfolio turnover rate is calculated in accordance with regulatory requirements, without regard to transactions involving short-term investments, certain derivatives and in-kind transactions (if any). If such transactions were included, the Fund’s portfolio turnover rate may be higher. |
See Notes to Financial Statements.
| PGIM Jennison Diversified Growth Fund | 29 |
Financial Highlights (continued)
| Class R6 Shares | ||||||||||||||||||||||||||||
| Year Ended July 31, | September 27, 2017(a) 2018 |
| ||||||||||||||||||||||||||
| 2022 | 2021 | 2020 | 2019 | |||||||||||||||||||||||||
| Per Share Operating Performance(b): | ||||||||||||||||||||||||||||
| Net Asset Value, Beginning of Period | $19.70 | $16.98 | $13.41 | $13.81 | $12.82 | |||||||||||||||||||||||
| Income (loss) from investment operations: | ||||||||||||||||||||||||||||
| Net investment income (loss) | (0.05 | ) | (0.08 | ) | (0.03 | ) | (0.01 | ) | 0.04 | |||||||||||||||||||
| Net realized and unrealized gain (loss) on investment and foreign currency transactions | (2.61 | ) | 5.64 | 4.15 | 0.82 | 2.33 | ||||||||||||||||||||||
| Total from investment operations | (2.66 | ) | 5.56 | 4.12 | 0.81 | 2.37 | ||||||||||||||||||||||
| Less Dividends and Distributions: | ||||||||||||||||||||||||||||
| Dividends from net investment income | - | - | - | (0.04 | ) | (0.02 | ) | |||||||||||||||||||||
| Distributions from net realized gains | (4.05 | ) | (2.84 | ) | (0.55 | ) | (1.17 | ) | (1.36 | ) | ||||||||||||||||||
| Total dividends and distributions | (4.05 | ) | (2.84 | ) | (0.55 | ) | (1.21 | ) | (1.38 | ) | ||||||||||||||||||
| Net asset value, end of period | $12.99 | $19.70 | $16.98 | $13.41 | $13.81 | |||||||||||||||||||||||
| Total Return(c): | (18.12 | )% | 36.19 | % | 31.73 | % | 7.20 | % | 19.79 | % | ||||||||||||||||||
| Ratios/Supplemental Data: | ||||||||||||||||||||||||||||
| Net assets, end of period (000) | $876 | $368 | $78 | $54 | $12 | |||||||||||||||||||||||
| Average net assets (000) | $664 | $75 | $61 | $17 | $11 | |||||||||||||||||||||||
| Ratios to average net assets(d): | ||||||||||||||||||||||||||||
| Expenses after waivers and/or expense reimbursement | 0.96 | % | 0.95 | % | 1.00 | % | 1.00 | % | 1.00 | %(e) | ||||||||||||||||||
| Expenses before waivers and/or expense reimbursement | 1.81 | % | 11.34 | % | 23.28 | % | 77.09 | % | 283.30 | %(e) | ||||||||||||||||||
| Net investment income (loss) | (0.34 | )% | (0.40 | )% | (0.19 | )% | (0.10 | )% | 0.36 | %(e) | ||||||||||||||||||
| Portfolio turnover rate(f) | 148 | % | 153 | % | 149 | % | 125 | % | 185 | % | ||||||||||||||||||
| (a) | Commencement of offering. |
| (b) | Calculated based on average shares outstanding during the period. |
| (c) | Total return is calculated assuming a purchase of a share on the first day and a sale on the last day of each period reported and includes reinvestment of dividends and distributions, if any. Total returns may reflect adjustments to conform to GAAP. Total returns for periods less than one full year are not annualized. |
| (d) | Does not include expenses of the underlying funds in which the Fund invests. |
| (e) | Annualized. |
| (f) | The Fund’s portfolio turnover rate is calculated in accordance with regulatory requirements, without regard to transactions involving short-term investments, certain derivatives and in-kind transactions (if any). If such transactions were included, the Fund’s portfolio turnover rate may be higher. |
See Notes to Financial Statements.
| 30 |
Notes to Financial Statements
1. Organization
Prudential Investment Portfolios 5 (the “Registered Investment Company” or “RIC”) is registered under the Investment Company Act of 1940, as amended (“1940 Act”), as an open-end management investment company. The RIC is organized as a Delaware Statutory Trust. These financial statements relate only to the PGIM Jennison Diversified Growth Fund (the “Fund”), a series of the RIC. The Fund is classified as a diversified fund for purposes of the 1940 Act.
The investment objective of the Fund is long-term capital appreciation.
2. Accounting Policies
The Fund follows the investment company accounting and reporting guidance of the Financial Accounting Standards Board (“FASB”) Accounting Standard Codification (“ASC”) Topic 946 Financial Services — Investment Companies. The following is a summary of significant accounting policies followed by the Fund in the preparation of its financial statements. The policies conform to U.S. generally accepted accounting principles (“GAAP”). The Fund consistently follows such policies in the preparation of its financial statements.
Securities Valuation: The Fund holds securities and other assets and liabilities that are fair valued as of the close of each day (generally, 4:00 PM Eastern time) the New York Stock Exchange (“NYSE”) is open for trading. As described in further detail below, the Fund’s investments are valued daily based on a number of factors, including the type of investment and whether market quotations are readily available. The RIC’s Board of Trustees (the “Board”) has adopted valuation procedures for security valuation under which fair valuation responsibilities have been delegated to PGIM Investments LLC (“PGIM Investments” or the “Manager”). Pursuant to the Board’s delegation, the Manager has established a Valuation Committee responsible for supervising the fair valuation of portfolio securities and other assets and liabilities. The valuation procedures permit the Fund to utilize independent pricing vendor services, quotations from market makers, and alternative valuation methods when market quotations are either not readily available or not deemed representative of fair value. Fair value is the price that would be received to sell an asset or paid to transfer a liability in an orderly transaction between market participants on the measurement date. A record of the Valuation Committee’s actions is subject to the Board’s review at its first quarterly meeting following the quarter in which such actions take place.
For the fiscal reporting year-end, securities and other assets and liabilities were fair valued at the close of the last U.S. business day. Trading in certain foreign securities may occur when the NYSE is closed (including weekends and holidays). Because such foreign securities
| PGIM Jennison Diversified Growth Fund | 31 |
Notes to Financial Statements (continued)
trade in markets that are open on weekends and U.S. holidays, the values of some of the Fund’s foreign investments may change on days when investors cannot purchase or redeem Fund shares.
Various inputs determine how the Fund’s investments are valued, all of which are categorized according to the three broad levels (Level 1, 2, or 3) detailed in the Schedule of Investments and referred to herein as the “fair value hierarchy” in accordance with FASB ASC Topic 820 - Fair Value Measurement.
Common or preferred stocks, exchange-traded funds and derivative instruments, if applicable, that are traded on a national securities exchange are valued at the last sale price as of the close of trading on the applicable exchange where the security principally trades. Securities traded via NASDAQ are valued at the NASDAQ official closing price. To the extent these securities are valued at the last sale price or NASDAQ official closing price, they are classified as Level 1 in the fair value hierarchy. In the event that no sale or official closing price on valuation date exists, these securities are generally valued at the mean between the last reported bid and ask prices, or at the last bid price in the absence of an ask price. These securities are classified as Level 2 in the fair value hierarchy.
Investments in open-end funds (other than exchange-traded funds) are valued at their net asset values as of the close of the NYSE on the date of valuation. These securities are classified as Level 1 in the fair value hierarchy since they may be purchased or sold at their net asset values on the date of valuation.
Securities and other assets that cannot be priced according to the methods described above are valued based on pricing methodologies approved by the Board. In the event that unobservable inputs are used when determining such valuations, the securities will be classified as Level 3 in the fair value hierarchy. Altering one or more unobservable inputs may result in a significant change to a Level 3 security’s fair value measurement.
When determining the fair value of securities, some of the factors influencing the valuation include: the nature of any restrictions on disposition of the securities; assessment of the general liquidity of the securities; the issuer’s financial condition and the markets in which it does business; the cost of the investment; the size of the holding and the capitalization of the issuer; the prices of any recent transactions or bids/offers for such securities or any comparable securities; any available analyst media or other reports or information deemed reliable by the Manager regarding the issuer or the markets or industry in which it operates. Using fair value to price securities may result in a value that is different from a security’s most recent closing price and from the price used by other unaffiliated mutual funds to calculate their net asset values.
| 32 |
Foreign Currency Translation: The books and records of the Fund are maintained in U.S. dollars. Foreign currency amounts are translated into U.S. dollars on the following basis:
(i) market value of investment securities, other assets and liabilities — at the exchange rate as of the valuation date;
(ii) purchases and sales of investment securities, income and expenses — at the rates of exchange prevailing on the respective dates of such transactions.
Although the net assets of the Fund are presented at the foreign exchange rates and market values at the close of the period, the Fund does not generally isolate that portion of the results of operations arising as a result of changes in the foreign exchange rates from the fluctuations arising from changes in the market prices of long-term portfolio securities held at the end of the period. Similarly, the Fund does not isolate the effect of changes in foreign exchange rates from the fluctuations arising from changes in the market prices of long-term portfolio securities sold during the period. Accordingly, holding period unrealized and realized foreign currency gains (losses) are included in the reported net change in unrealized appreciation (depreciation) on investments and net realized gains (losses) on investment transactions on the Statements of Operations.
Net realized gains (losses) on foreign currency transactions represent net foreign exchange gains (losses) from the disposition of holdings of foreign currencies, currency gains (losses) realized between the trade and settlement dates on investment transactions, and the difference between the amounts of interest, dividends and foreign withholding taxes recorded on the Fund’s books and the U.S. dollar equivalent amounts actually received or paid. Net unrealized currency gains (losses) arise from valuing foreign currency denominated assets and liabilities (other than investments) at period end exchange rates.
Master Netting Arrangements: The RIC, on behalf of the Fund, is subject to various Master Agreements, or netting arrangements, with select counterparties. These are agreements which a subadviser may have negotiated and entered into on behalf of all or a portion of the Fund. A master netting arrangement between the Fund and the counterparty permits the Fund to offset amounts payable by the Fund to the same counterparty against amounts to be received; and by the receipt of collateral from the counterparty by the Fund to cover the Fund’s exposure to the counterparty. However, there is no assurance that such mitigating factors are easily enforceable. In addition to master netting arrangements, the right to set-off exists when all the conditions are met such that each of the parties owes the other determinable amounts, the reporting party has the right to set-off the amount owed with the amount owed by the other party, the reporting party intends to set-off and the right of set-off is enforceable by law.
Securities Lending: The Fund lends its portfolio securities to banks and broker-dealers. The loans are secured by collateral at least equal to the market value of the securities loaned. Collateral pledged by each borrower is invested in an affiliated money market fund and is marked to market daily, based on the previous day’s market value, such that the value of the
| PGIM Jennison Diversified Growth Fund | 33 |
Notes to Financial Statements (continued)
collateral exceeds the value of the loaned securities. In the event of significant appreciation in value of securities on loan on the last business day of the reporting period, the financial statements may reflect a collateral value that is less than the market value of the loaned securities. Such shortfall is remedied as described above. Loans are subject to termination at the option of the borrower or the Fund. Upon termination of the loan, the borrower will return to the Fund securities identical to the loaned securities. The remaining open loans of the securities lending transactions are considered overnight and continuous. Should the borrower of the securities fail financially, the Fund has the right to repurchase the securities in the open market using the collateral.
The Fund recognizes income, net of any rebate and securities lending agent fees, for lending its securities in the form of fees or interest on the investment of any cash received as collateral. The borrower receives all interest and dividends from the securities loaned and such payments are passed back to the lender in amounts equivalent thereto, which are reflected in interest income or unaffiliated dividend income based on the nature of the payment on the Statement of Operations. The Fund also continues to recognize any unrealized gain (loss) in the market price of the securities loaned and on the change in the value of the collateral invested that may occur during the term of the loan. In addition, realized gain (loss) is recognized on changes in the value of the collateral invested upon liquidation of the collateral. Net earnings from securities lending are disclosed in the Statement of Operations.
Equity and Mortgage Real Estate Investment Trusts (collectively REITs): The Fund invested in REITs, which report information on the source of their distributions annually. Based on current and historical information, a portion of distributions received from REITs during the period is estimated to be dividend income, capital gain or return of capital and recorded accordingly. When material, these estimates are adjusted periodically when the actual source of distributions is disclosed by the REITs.
Securities Transactions and Net Investment Income: Securities transactions are recorded on the trade date. Realized gains (losses) from investment and currency transactions are calculated on the specific identification method. Dividend income is recorded on the ex-date, or for certain foreign securities, when the Fund becomes aware of such dividends. Expenses are recorded on an accrual basis, which may require the use of certain estimates by management that may differ from actual. Net investment income or loss (other than class specific expenses and waivers, which are allocated as noted below) and unrealized and realized gains (losses) are allocated daily to each class of shares based upon the relative proportion of adjusted net assets of each class at the beginning of the day. Class specific expenses and waivers, where applicable, are charged to the respective share classes. Such class specific expenses and waivers include distribution fees and distribution fee waivers,
| 34 |
shareholder servicing fees, transfer agent’s fees and expenses, registration fees and fee waivers and/or expense reimbursements, as applicable.
Taxes: It is the Fund’s policy to continue to meet the requirements of the Internal Revenue Code applicable to regulated investment companies and to distribute all of its taxable net investment income and capital gains, if any, to its shareholders. Therefore, no federal income tax provision is required. Withholding taxes on foreign dividends, interest and capital gains, if any, are recorded, net of reclaimable amounts, at the time the related income is earned.
Dividends and Distributions: Dividends and distributions to shareholders, which are determined in accordance with federal income tax regulations and which may differ from GAAP, are recorded on the ex-date. Permanent book/tax differences relating to income and gain (loss) are reclassified between total distributable earnings (loss) and paid-in capital in excess of par, as appropriate. The chart below sets forth the expected frequency of dividend and capital gains distributions to shareholders. Various factors may impact the frequency of dividend distributions to shareholders, including but not limited to adverse market conditions or portfolio holding-specific events.
| Expected Distribution Schedule to Shareholders* | Frequency | |
| Net Investment Income | Annually | |
| Short-Term Capital Gains | Annually | |
| Long-Term Capital Gains | Annually | |
| * | Under certain circumstances, the Fund may make more than one distribution of short-term and/or long-term capital gains during a fiscal year. |
Estimates: The preparation of financial statements requires management to make estimates and assumptions that affect the reported amounts and disclosures in the financial statements. Actual results could differ from those estimates.
3. Agreements
The RIC, on behalf of the Fund, has a management agreement with the Manager. Pursuant to this agreement, the Manager has responsibility for all investment advisory services and supervises the subadviser’s performance of such services.
The Manager has entered into a subadvisory agreement with Jennison Associates LLC (“Jennison” or the “subadviser”). The Manager pays for the services of Jennison.
Fees payable under the management agreement are computed daily and paid monthly. For the reporting period ended July 31, 2022, the contractual and effective management fee rates were as follows:
| PGIM Jennison Diversified Growth Fund | 35 |
Notes to Financial Statements (continued)
| Contractual Management Rate | Effective Management Fee, before any waivers and/or expense reimbursements | |
| 0.70% on first $500 million of average daily net assets; | 0.70% | |
| 0.65% on next $500 million of average daily net assets; | ||
| 0.60% over $1 billion of average daily net assets | ||
The Manager has contractually agreed, through November 30, 2023, to limit total annual operating expenses after fee waivers and/or expense reimbursements. This contractual waiver excludes interest, brokerage, taxes (such as income and foreign withholding taxes, stamp duty and deferred tax expenses), acquired fund fees and expenses, extraordinary expenses, and certain other Fund expenses such as dividend and interest expense and broker charges on short sales.
Where applicable, the Manager agrees to waive management fees or shared operating expenses on any share class to the same extent that it waives such expenses on any other share class. In addition, total annual operating expenses for Class R6 shares will not exceed total annual operating expenses for Class Z shares. Fees and/or expenses waived and/or reimbursed by the Manager may be recouped by the Manager within the same fiscal year during which such waiver and/or reimbursement is made if such recoupment can be realized without exceeding the expense limit in effect at the time of the recoupment for that fiscal year. The expense limitations attributable to each class are as follows:
| Class | Expense Limitations | |||
| A | —% | |||
| C | — | |||
| Z | 1.00 | |||
| R6 | 1.00 | |||
The RIC, on behalf of the Fund, has a distribution agreement with Prudential Investment Management Services LLC (“PIMS”), which acts as the distributor of the Class A, Class C, Class Z and Class R6 shares of the Fund. The Fund compensates PIMS for distributing and servicing the Fund’s Class A and Class C shares, pursuant to the plans of distribution (the “Distribution Plans”), regardless of expenses actually incurred by PIMS.
Pursuant to the Distribution Plans, the Fund compensates PIMS for distribution related activities at an annual rate based on average daily net assets per class. The distribution fees are accrued daily and payable monthly.
The Fund’s annual gross and net distribution rate, where applicable, are as follows:
| 36 |
| Class | Gross Distribution Fee | Net Distribution Fee | ||
| A | 0.30% | 0.25% | ||
| C | 1.00 | 1.00 | ||
| Z | N/A | N/A | ||
| R6 | N/A | N/A | ||
For the year ended July 31, 2022, PIMS received front-end sales charges (“FESL”) resulting from sales of certain class shares and contingent deferred sales charges (“CDSC”) imposed upon redemptions by certain shareholders. From these fees, PIMS paid such sales charges to broker-dealers, who in turn paid commissions to salespersons and incurred other distribution costs. The sales charges are as follows where applicable:
| Class | FESL | CDSC | ||||||
| A | $ | 72,032 | $ | — | ||||
| C | — | 885 | ||||||
PGIM Investments, PIMS and Jennison are indirect, wholly-owned subsidiaries of Prudential Financial, Inc. (“Prudential”).
4. Other Transactions with Affiliates
Prudential Mutual Fund Services LLC (“PMFS”), an affiliate of PGIM Investments and an indirect, wholly-owned subsidiary of Prudential, serves as the Fund’s transfer agent. Transfer agent’s fees and expenses in the Statement of Operations include certain out-of-pocket expenses paid to non-affiliates, where applicable.
The Fund may invest its overnight sweep cash in the PGIM Core Ultra Short Bond Fund (the “Core Fund”), and its securities lending cash collateral in the PGIM Institutional Money Market Fund (the “Money Market Fund”), each a fund of Prudential Investment Portfolios 2, registered under the 1940 Act and managed by PGIM Investments. PGIM Investments and/or its affiliates are paid fees or reimbursed for providing their services to the Core Fund and the Money Market Fund. In addition to the realized and unrealized gains on investments in the Core Fund and Money Market Fund, earnings from such investments are disclosed on the Statement of Operations as “Affiliated dividend income” and “Income from securities lending, net”, respectively. Effective January 2022, the Fund changed its overnight cash sweep vehicle from the Core Fund to an unaffiliated money market fund.
The Fund may enter into certain securities purchase or sale transactions under Board approved Rule 17a-7 procedures. Rule 17a-7 is an exemptive rule under the 1940 Act, that subject to certain conditions, permits purchase and sale transactions among affiliated investment companies, or between an investment company and a person that is affiliated solely by reason of having a common (or affiliated) investment adviser, common directors/trustees, and/or common officers. For the year ended July 31, 2022, no 17a-7 transactions were entered into by the Fund.
| PGIM Jennison Diversified Growth Fund | 37 |
Notes to Financial Statements (continued)
5. Portfolio Securities
The aggregate cost of purchases and proceeds from sales of portfolio securities (excluding short-term investments and U.S. Government securities) for the reporting period ended July 31, 2022, were as follows:
| Cost of Purchases | Proceeds from Sales | |
$461,082,151 | $496,184,949 | |
A summary of the cost of purchases and proceeds from sales of shares of affiliated mutual funds for the year ended July 31, 2022, is presented as follows:
| Value, Beginning of Year | Cost of Purchases | Proceeds from Sales | Change in (Loss) | Realized (Loss) | Value, End of Year | Shares, End of Year | Income | |||||||||||||||||||||
| Short-Term Investments - Affiliated Mutual Funds: |
| |||||||||||||||||||||||||||
| PGIM Core Ultra Short Bond Fund(1)(wa) |
| |||||||||||||||||||||||||||
$3,811,970 | $ 20,297,886 | $ 24,109,856 | $ — | $ — | $ — | — | $2,161 | |||||||||||||||||||||
| PGIM Institutional Money Market Fund(1)(b)(wa) |
| |||||||||||||||||||||||||||
5,080,173 | 184,862,460 | 175,837,878 | 561 | (3,248) | 14,102,068 | 14,116,184 | 7,622 | (2) | ||||||||||||||||||||
$8,892,143 | $205,160,346 | $199,947,734 | $561 | $(3,248) | $14,102,068 | $9,783 | ||||||||||||||||||||||
| (1) | The Fund did not have any capital gain distributions during the reporting period. |
| (2) | The amount, or a portion thereof, represents the affiliated securities lending income shown on the Statement of Operations. |
| (b) | Represents security, or portion thereof, purchased with cash collateral received for securities on loan and includes dividend reinvestment. |
| (wa) | PGIM Investments LLC, the manager of the Fund, also serves as manager of the PGIM Core Ultra Short Bond Fund and PGIM Institutional Money Market Fund, if applicable. |
6. Distributions and Tax Information
Distributions to shareholders, which are determined in accordance with federal income tax regulations and which may differ from GAAP, are recorded on the ex-date.
In order to present total distributable earnings (loss) and paid-in capital in excess of par on the Statement of Assets and Liabilities that more closely represent their tax character, certain adjustments have been made to total distributable earnings (loss) and paid-in capital in excess of par. For the year ended July 31, 2022, the adjustments were to increase total distributable earnings and decrease paid-in capital in excess of par by $1,800,668 due to a net operating loss. Net investment income (loss), net realized gain (loss) on investment and foreign currency transactions and net assets were not affected by this change.
| 38 |
For the year ended July 31, 2022, the tax character of dividends paid by the Fund were $27,492,640 of ordinary income and $44,740,597 of long-term capital gains. For the year ended July 31, 2021, the tax character of dividends paid by the Fund were $13,265,513 of ordinary income and $33,925,724 of long-term capital gains.
As of July 31, 2022, there were no accumulated undistributed earnings on a tax basis.
The United States federal income tax basis of the Fund’s investments and the net unrealized appreciation as of July 31, 2022 were as follows:
| Tax Basis | Gross Unrealized Appreciation | Gross Unrealized Depreciation | Net Unrealized Appreciation | |||
| $189,293,714 | $91,627,341 | $(6,844,349) | $84,782,992 | |||
The difference between GAAP and tax basis was primarily attributable to deferred losses on wash sales.
The Fund elected to treat post-October capital losses of approximately $17,597,000 as having been incurred in the following fiscal year (July 31, 2023).
The Manager has analyzed the Fund’s tax positions taken on federal, state and local income tax returns for all open tax years and has concluded that no provision for income tax is required in the Fund’s financial statements for the current reporting period. Since tax authorities can examine previously filed tax returns, the Fund’s U.S. federal and state tax returns for each of the four fiscal years up to the most recent fiscal year ended July 31, 2022 are subject to such review.
7. Capital and Ownership
The Fund offers Class A, Class C, Class Z and Class R6 shares. Class A shares are sold with a maximum front-end sales charge of 5.50%. Investors who purchase $1 million or more of Class A shares and sell these shares within 12 months of purchase are subject to a contingent deferred sales charge (“CDSC”) of 1%, although they are not subject to an initial sales charge. The Class A CDSC is waived for certain retirement and/or benefit plans. A special exchange privilege is also available for shareholders who qualified to purchase Class A shares at net asset value. Class C shares are sold with a CDSC of 1% on sales made within 12 months of purchase. Class C shares will automatically convert to Class A shares on a monthly basis approximately eight years (ten years prior to January 22, 2021) after purchase. Class Z and Class R6 shares are not subject to any sales or redemption charges and are available exclusively for sale to a limited group of investors.
Under certain circumstances, an exchange may be made from specified share classes of the Fund to one or more other share classes of the Fund as presented in the table of transactions in shares of beneficial interest, below.
| PGIM Jennison Diversified Growth Fund | 39 |
Notes to Financial Statements (continued)
The RIC has authorized an unlimited number of shares of beneficial interest of the Fund at $0.001 par value per share, currently divided into four classes, designated Class A, Class C, Class Z and Class R6.
As of July 31, 2022, Prudential, through its affiliated entities, including affiliated funds (if applicable), owned shares of the Fund as follows:
| Class | Number of Shares | Percentage of Outstanding Shares | ||
A | 13,497 | 0.1% | ||
R6 | 1,451 | 2.2 |
At the reporting period end, the number of shareholders holding greater than 5% of the Fund are as follows:
| Number of Shareholders | Percentage of Outstanding Shares | |||
Affiliated | — | —% | ||
Unaffiliated | 3 | 21.5 |
Transactions in shares of beneficial interest were as follows:
| Share Class | Shares | Amount | ||||||||
Class A | ||||||||||
Year ended July 31, 2022: | ||||||||||
Shares sold | 419,157 | $ | 6,495,480 | |||||||
Shares issued in reinvestment of dividends and distributions | 4,069,863 | 67,478,335 | ||||||||
Shares purchased | (2,212,530 | ) | (33,978,263 | ) | ||||||
Net increase (decrease) in shares outstanding before conversion | 2,276,490 | 39,995,552 | ||||||||
Shares issued upon conversion from other share class(es) | 60,100 | 1,012,457 | ||||||||
Shares purchased upon conversion into other share class(es) | (269,500 | ) | (3,843,955 | ) | ||||||
Net increase (decrease) in shares outstanding | 2,067,090 | $ | 37,164,054 | |||||||
Year ended July 31, 2021: | ||||||||||
Shares sold | 368,342 | $ | 6,592,088 | |||||||
Shares issued in reinvestment of dividends and distributions | 2,696,787 | 43,795,826 | ||||||||
Shares purchased | (2,079,102 | ) | (36,713,090 | ) | ||||||
Net increase (decrease) in shares outstanding before conversion | 986,027 | 13,674,824 | ||||||||
Shares issued upon conversion from other share class(es) | 161,792 | 2,913,187 | ||||||||
Shares purchased upon conversion into other share class(es) | (120,178 | ) | (2,118,438 | ) | ||||||
Net increase (decrease) in shares outstanding | 1,027,641 | $ | 14,469,573 | |||||||
| 40 |
| Share Class | Shares | Amount | ||||||||
Class C | ||||||||||
Year ended July 31, 2022: | ||||||||||
Shares sold | 53,481 | $ | 544,671 | |||||||
Shares issued in reinvestment of dividends and distributions | 178,313 | 2,036,336 | ||||||||
Shares purchased | (190,070 | ) | (2,026,005 | ) | ||||||
Net increase (decrease) in shares outstanding before conversion | 41,724 | 555,002 | ||||||||
Shares purchased upon conversion into other share class(es) | (92,524 | ) | (1,107,397 | ) | ||||||
Net increase (decrease) in shares outstanding | (50,800 | ) | $ | (552,395 | ) | |||||
Year ended July 31, 2021: | ||||||||||
Shares sold | 44,430 | $ | 602,537 | |||||||
Shares issued in reinvestment of dividends and distributions | 154,106 | 1,893,964 | ||||||||
Shares purchased | (117,321 | ) | (1,604,347 | ) | ||||||
Net increase (decrease) in shares outstanding before conversion | 81,215 | 892,154 | ||||||||
Shares purchased upon conversion into other share class(es) | (245,962 | ) | (3,361,195 | ) | ||||||
Net increase (decrease) in shares outstanding | (164,747 | ) | $ | (2,469,041 | ) | |||||
Class Z | ||||||||||
Year ended July 31, 2022: | ||||||||||
Shares sold | 40,113 | $ | 706,162 | |||||||
Shares issued in reinvestment of dividends and distributions | 112,055 | 1,874,686 | ||||||||
Shares purchased | (405,451 | ) | (5,975,403 | ) | ||||||
Net increase (decrease) in shares outstanding before conversion | (253,283 | ) | (3,394,555 | ) | ||||||
Shares issued upon conversion from other share class(es) | 266,864 | 3,834,685 | ||||||||
Net increase (decrease) in shares outstanding | 13,581 | $ | 440,130 | |||||||
Year ended July 31, 2021: | ||||||||||
Shares sold | 18,443 | $ | 335,325 | |||||||
Shares issued in reinvestment of dividends and distributions | 62,921 | 1,026,870 | ||||||||
Shares purchased | (111,328 | ) | (1,960,726 | ) | ||||||
Net increase (decrease) in shares outstanding before conversion | (29,964 | ) | (598,531 | ) | ||||||
Shares issued upon conversion from other share class(es) | 129,927 | 2,296,063 | ||||||||
Net increase (decrease) in shares outstanding | 99,963 | $ | 1,697,532 | |||||||
Class R6 | ||||||||||
Year ended July 31, 2022: | ||||||||||
Shares sold | 59,857 | $ | 917,954 | |||||||
Shares issued in reinvestment of dividends and distributions | 7,482 | 125,175 | ||||||||
Shares purchased | (25,105 | ) | (342,452 | ) | ||||||
Net increase (decrease) in shares outstanding before conversion | 42,234 | 700,677 | ||||||||
Shares issued upon conversion from other share class(es) | 6,519 | 104,210 | ||||||||
Net increase (decrease) in shares outstanding | 48,753 | $ | 804,887 | |||||||
| PGIM Jennison Diversified Growth Fund | 41 |
Notes to Financial Statements (continued)
| Share Class | Shares | Amount | ||||||||
Year ended July 31, 2021: | ||||||||||
Shares sold | 3,318 | $ | 64,228 | |||||||
Shares issued in reinvestment of dividends and distributions | 186 | 3,041 | ||||||||
Shares purchased | (3,649 | ) | (71,037 | ) | ||||||
Net increase (decrease) in shares outstanding before conversion | (145 | ) | (3,768 | ) | ||||||
Shares issued upon conversion from other share class(es) | 14,216 | 270,383 | ||||||||
Net increase (decrease) in shares outstanding | 14,071 | $ | 266,615 | |||||||
8. Borrowings
The RIC, on behalf of the Fund, along with other affiliated registered investment companies (the “Participating Funds”), is a party to a Syndicated Credit Agreement (“SCA”) with a group of banks. The purpose of the SCA is to provide an alternative source of temporary funding for capital share redemptions. The table below provides details of the current SCA in effect at the reporting period-end as well as the prior SCA.
| Current SCA | Prior SCA | |||
Term of Commitment | 10/1/2021 – 9/29/2022 | 10/2/2020 – 9/30/2021 | ||
Total Commitment | $1,200,000,000 | $1,200,000,000 | ||
| Annualized Commitment Fee on the Unused Portion of the SCA | 0.15% | 0.15% | ||
| Annualized Interest Rate on Borrowings | 1.20% plus the higher of (1) the effective federal funds rate, (2) the one-month LIBOR rate or (3) zero percent | 1.30% plus the higher of (1) the effective federal funds rate, (2) the one-month LIBOR rate or (3) zero percent |
Certain affiliated registered investment companies that are parties to the SCA include portfolios that are subject to a predetermined mathematical formula used to manage certain benefit guarantees offered under variable annuity contracts. The formula may result in large scale asset flows into and out of these portfolios. Consequently, these portfolios may be more likely to utilize the SCA for purposes of funding redemptions. It may be possible for those portfolios to fully exhaust the committed amount of the SCA, thereby requiring the Manager to allocate available funding per a Board-approved methodology designed to treat the Participating Funds in the SCA equitably.
The Fund utilized the SCA during the year ended July 31, 2022. The average daily balance for the 6 days that the Fund had loans outstanding during the period was approximately $1,218,667, borrowed at a weighted average interest rate of 1.33%. The maximum loan outstanding amount during the period was $1,940,000. At July 31, 2022, the Fund did not have an outstanding loan amount.
| 42 |
9. Risks of Investing in the Fund
The Fund’s risks include, but are not limited to, some or all of the risks discussed below. For further information on the Fund’s risks, please refer to the Fund’s Prospectus and Statement of Additional Information.
Economic and Market Events Risk: Events in the U.S. and global financial markets, including actions taken by the U.S. Federal Reserve or foreign central banks to stimulate or stabilize economic growth or the functioning of the securities markets, may at times result in unusually high market volatility, which could negatively impact performance. Relatively reduced liquidity in credit and fixed income markets could adversely affect issuers worldwide.
Equity and Equity-Related Securities Risk: Equity and equity-related securities may be subject to changes in value, and their values may be more volatile than those of other asset classes. In addition to an individual security losing value, the value of the equity markets or a sector in which the Fund invests could go down. Different parts of a market can react differently to adverse issuer, market, regulatory, political and economic developments.
Foreign Securities Risk: Investments in securities of non-U.S. issuers (including those denominated in U.S. dollars) may involve more risk than investing in securities of U.S. issuers. Foreign political, economic and legal systems, especially those in developing and emerging market countries, may be less stable and more volatile than in the United States. Foreign legal systems generally have fewer regulatory requirements than the U.S. legal system, particularly those of emerging markets. In general, less information is publicly available with respect to non-U.S. companies than U.S. companies. Non-U.S. companies generally are not subject to the same accounting, auditing, and financial reporting standards as are U.S. companies. Additionally, the changing value of foreign currencies and changes in exchange rates could also affect the value of the assets the Fund holds and the Fund’s performance. Certain foreign countries may impose restrictions on the ability of issuers of foreign securities to make payment of principal and interest or dividends to investors located outside the country, due to blockage of foreign currency exchanges or otherwise. Investments in emerging markets are subject to greater volatility and price declines.
In addition, the Fund’s investments in non-U.S. securities may be subject to the risks of nationalization or expropriation of assets, imposition of currency exchange controls or restrictions on the repatriation of non-U.S. currency, confiscatory taxation and adverse diplomatic developments. Special U.S. tax considerations may apply.
Growth Style Risk: The Fund’s growth style may subject the Fund to above-average fluctuations as a result of seeking higher than average capital growth. Historically, growth stocks have performed best during later stages of economic expansion and value stocks have performed best during periods of economic recovery. Since the Fund follows a growth investment style, there is the risk that the growth investment style may be out of favor for long periods of time. At times when the style is out of favor, the Fund may underperform the market in general, its benchmark and other mutual funds.
| PGIM Jennison Diversified Growth Fund | 43 |
Notes to Financial Statements (continued)
Increase in Expenses Risk: Your actual cost of investing in the Fund may be higher than the expenses shown in the Fund’s prospectus expense table for a variety of reasons. For example, expense ratios may be higher than those shown if average net assets decrease. Net assets are more likely to decrease and Fund expense ratios are more likely to increase when markets are volatile. Active and frequent trading of Fund securities can increase expenses.
Large Capitalization Company Risk: Companies with large market capitalizations go in and out of favor based on market and economic conditions. Larger companies tend to be less volatile than companies with smaller market capitalizations. In exchange for this potentially lower risk, the Fund’s value may not rise or fall as much as the value of funds that emphasize companies with smaller market capitalizations.
Large Shareholder and Large Scale Redemption Risk: Certain individuals, accounts, funds (including funds affiliated with the Manager) or institutions, including the Manager and its affiliates, may from time to time own or control a substantial amount of the Fund’s shares. There is no requirement that these entities maintain their investment in the Fund. There is a risk that such large shareholders or that the Fund’s shareholders generally may redeem all or a substantial portion of their investments in the Fund in a short period of time, which could have a significant negative impact on the Fund’s NAV, liquidity, and brokerage costs. Large redemptions could also result in tax consequences to shareholders and impact the Fund’s ability to implement its investment strategy. The Fund’s ability to pursue its investment objective after one or more large scale redemptions may be impaired and, as a result, the Fund may invest a larger portion of its assets in cash or cash equivalents.
Management Risk: The value of your investment may decrease if judgments by the subadviser about the attractiveness, value or market trends affecting a particular security, industry or sector or about market movements are incorrect.
Market Disruption and Geopolitical Risks: Market disruption can be caused by economic, financial or political events and factors, including but not limited to, international wars or conflicts (including Russia’s military invasion of Ukraine), geopolitical developments (including trading and tariff arrangements, sanctions and cybersecurity attacks), instability in regions such as Asia, Eastern Europe and the Middle East, terrorism, natural disasters and public health epidemics (including the outbreak of COVID-19 globally).
The extent and duration of such events and resulting market disruptions cannot be predicted, but could be substantial and could magnify the impact of other risks to the Fund. These and other similar events could adversely affect the U.S. and foreign financial markets and lead to increased market volatility, reduced liquidity in the securities markets, significant negative impacts on issuers and the markets for certain securities and commodities and/or
| 44 |
government intervention. They may also cause short- or long-term economic uncertainties in the United States and worldwide. As a result, whether or not the Fund invests in securities of issuers located in or with significant exposure to the countries directly affected, the value and liquidity of the Fund’s investments may be negatively impacted. Further, due to closures of certain markets and restrictions on trading certain securities, the value of certain securities held by the Fund could be significantly impacted, which could lead to such securities being valued at zero.
COVID-19 and the related governmental and public responses have had and may continue to have an impact on the Fund’s investments and net asset value and have led and may continue to lead to increased market volatility and the potential for illiquidity in certain classes of securities and sectors of the market. They have also had and may continue to result in periods of business disruption, business closures, inability to obtain raw materials, supplies and component parts, and reduced or disrupted operations for the issuers in which the Fund invests. The occurrence, reoccurrence and pendency of public health epidemics could adversely affect the economies and financial markets either in specific countries or worldwide.
Market Risk: Securities markets may be volatile and the market prices of the Fund’s securities may decline. Securities fluctuate in price based on changes in an issuer’s financial condition and overall market and economic conditions. If the market prices of the securities owned by the Fund fall, the value of your investment in the Fund will decline.
Portfolio Turnover Risk: The length of time the Fund has held a particular security is not generally a consideration in investment decisions. Under certain market conditions, the Fund’s turnover rate may be higher than that of other mutual funds. Portfolio turnover generally involves some expense to the Fund, including brokerage commissions or dealer mark-ups and other transaction costs on the sale of securities and reinvestment in other securities. These transactions may result in realization of taxable capital gains. The trading costs and tax effects associated with portfolio turnover may adversely affect the Fund’s investment performance.
| PGIM Jennison Diversified Growth Fund | 45 |
Report of Independent Registered Public Accounting Firm
To the Board of Trustees of Prudential Investment Portfolios 5 and Shareholders of PGIM Jennison Diversified Growth Fund
Opinion on the Financial Statements
We have audited the accompanying statement of assets and liabilities, including the schedule of investments, of PGIM Jennison Diversified Growth Fund (one of the funds constituting Prudential Investment Portfolios 5, referred to hereafter as the “Fund”) as of July 31, 2022, the related statement of operations for the year ended July 31, 2022, the statements of changes in net assets for each of the two years in the period ended July 31, 2022, including the related notes, and the financial highlights for each of the two years in the period ended July 31, 2022 (collectively referred to as the “financial statements”). In our opinion, the financial statements present fairly, in all material respects, the financial position of the Fund as of July 31, 2022, the results of its operations for the year then ended, and the changes in its net assets and the financial highlights for each of the two years in the period ended July 31, 2022 in conformity with accounting principles generally accepted in the United States of America.
The financial statements of the Fund as of and for the year ended July 31, 2020 and the financial highlights for each of the periods ended on or prior to July 31, 2020 (not presented herein, other than the financial highlights) were audited by other auditors whose report dated September 16, 2020 expressed an unqualified opinion on those financial statements and financial highlights.
Basis for Opinion
These financial statements are the responsibility of the Fund’s management. Our responsibility is to express an opinion on the Fund’s financial statements based on our audits. We are a public accounting firm registered with the Public Company Accounting Oversight Board (United States) (PCAOB) and are required to be independent with respect to the Fund in accordance with the U.S. federal securities laws and the applicable rules and regulations of the Securities and Exchange Commission and the PCAOB.
We conducted our audits of these financial statements in accordance with the standards of the PCAOB. Those standards require that we plan and perform the audit to obtain reasonable assurance about whether the financial statements are free of material misstatement, whether due to error or fraud.
Our audits included performing procedures to assess the risks of material misstatement of the financial statements, whether due to error or fraud, and performing procedures that respond to those risks. Such procedures included examining, on a test basis, evidence regarding the amounts and disclosures in the financial statements. Our audits also included evaluating the accounting principles used and significant estimates made by management, as well as evaluating the overall presentation of the financial statements. Our procedures included confirmation of securities owned as of July 31, 2022 by correspondence with the custodian, transfer agent and brokers; when replies were not received from brokers, we performed other auditing procedures. We believe that our audits provide a reasonable basis for our opinion.
/s/PricewaterhouseCoopers LLP
New York, New York
September 16, 2022
We have served as the auditor of one or more investment companies in the PGIM Retail Funds complex since 2020.
| 46 |
Tax Information (unaudited)
We are advising you that during the fiscal year ended July 31, 2022, the Fund reported the maximum amount allowed per share but not less than $2.30 per share for Class A, C, Z and R6 shares as a capital gain distribution in accordance with Section 852(b)(3)(C) of the Internal Revenue Code.
For the year ended July 31, 2022, the Fund reports, in accordance with Section 854 of the Internal Revenue Code, the following percentages of the ordinary income dividends paid as 1) qualified dividend income (QDI); and 2) eligible for corporate dividends received deduction (DRD).
| Fund | QDI | DRD | ||||||
PGIM Jennison Diversified Growth Fund | 5.37 | % | 5.02 | % | ||||
In January 2023, you will be advised on IRS Form 1099-DIV or substitute 1099-DIV, as to the federal tax status of dividends and distributions received by you in calendar year 2022.
| PGIM Jennison Diversified Growth Fund | 47 |
Liquidity Risk Management Program
(unaudited)
Consistent with Rule 22e-4 under the 1940 Act (the “Liquidity Rule”), the Fund has adopted and implemented a liquidity risk management program (the “LRMP”). The Fund’s LRMP seeks to assess and manage the Fund’s liquidity risk, which is defined as the risk that the Fund is unable to meet investor redemption requests without significantly diluting the remaining investors’ interests in the Fund. The Board has approved PGIM Investments LLC (“PGIM Investments”), the Fund’s investment manager, to serve as the administrator of the Fund’s LRMP. As part of its responsibilities as administrator, PGIM Investments has retained a third party to perform certain functions, including providing market data and liquidity classification model information.
The Fund’s LRMP includes a number of processes designed to support the assessment and management of its liquidity risk. In particular, the Fund’s LRMP includes no less than annual assessments of factors that influence the Fund’s liquidity risk; no less than monthly classifications of the Fund’s investments into one of four liquidity classifications provided for in the Liquidity Rule; a 15% of net assets limit on the acquisition of “illiquid investments” (as defined under the Liquidity Rule); establishment of a minimum percentage of the Fund’s assets to be invested in investments classified as “highly liquid” (as defined under the Liquidity Rule) if the Fund does not invest primarily in highly liquid investments; and regular reporting to the Board.
At a meeting of the Board on March 1-3, 2022, PGIM Investments provided a written report (“LRMP Report”) to the Board addressing the operation, adequacy, and effectiveness of the Fund’s LRMP, including any material changes to the LRMP for the period from January 1, 2021 through December 31, 2021 (“Reporting Period”). The LRMP Report concluded that the Fund’s LRMP was reasonably designed to assess and manage the Fund’s liquidity risk and was adequately and effectively implemented during the Reporting Period. There were no material changes to the LRMP during the Reporting Period. The LRMP Report further concluded that the Fund’s investment strategies continue to be appropriate given the Fund’s status as an open-end fund.
There can be no assurance that the LRMP will achieve its objectives in the future. Additional information regarding risks of investing in the Fund, including liquidity risks presented by the Fund’s investment portfolio, is found in the Fund’s Prospectus and Statement of Additional Information.
| Visit our website at pgim.com/investments |
INFORMATION ABOUT BOARD MEMBERS AND OFFICERS (unaudited)
Information about Board Members and Officers of the Fund is set forth below. Board Members who are not deemed to be “interested persons” of the Fund, as defined in the 1940 Act, are referred to as “Independent Board Members.” Board Members who are deemed to be “interested persons” of the Fund are referred to as “Interested Board Members.” The Board Members are responsible for the overall supervision of the operations of the Fund and perform the various duties imposed on the directors of investment companies by the 1940 Act. The Board in turn elects the Officers, who are responsible for administering the day-to-day operations of the Fund.
| Independent Board Members | ||||||
Name Year of Birth Position(s) Portfolios Overseen | Principal Occupation(s) During Past Five Years | Other Directorships Held During Past Five Years | Length of Board Service | |||
Ellen S. Alberding 1958 Board Member Portfolios Overseen: 97 | President and Board Member, The Joyce Foundation (charitable foundation) (since 2002); formerly Vice Chair, City Colleges of Chicago (community college system) (2011-2015); Trustee, National Park Foundation (charitable foundation for national park system) (2009-2018); Trustee, Economic Club of Chicago (2009-2016); Trustee, Loyola University (since 2018). | None. | Since September 2013 | |||
Kevin J. Bannon 1952 Board Member Portfolios Overseen: 97 | Retired; formerly Managing Director (April 2008-May 2015) and Chief Investment Officer (October 2008-November 2013) of Highmount Capital LLC (registered investment adviser); formerly Executive Vice President and Chief Investment Officer (April 1993-August 2007) of Bank of New York Company; President (May 2003-May 2007) of BNY Hamilton Family of Mutual Funds. | Director of Urstadt Biddle Properties (equity real estate investment trust) (since September 2008). | Since July 2008 | |||
| PGIM Jennison Diversified Growth Fund | ||
| Independent Board Members | ||||||
Name Year of Birth Position(s) Portfolios Overseen | Principal Occupation(s) During Past Five Years | Other Directorships Held During Past Five Years | Length of Board Service | |||
Linda W. Bynoe 1952 Board Member Portfolios Overseen: 94 | President and Chief Executive Officer (since March 1995) and formerly Chief Operating Officer (December 1989-February 1995) of Telemat Limited LLC (formerly Telemat Ltd) (management consulting); formerly Vice President (January 1985-June 1989) at Morgan Stanley & Co. (broker-dealer). | Trustee of Equity Residential (residential real estate) (since December 2009); Director of Northern Trust Corporation (financial services) (since April 2006); formerly Director of Anixter International, Inc. (communication products distributor) (January 2006-June 2020). | Since March 2005 | |||
Barry H. Evans 1960 Board Member Portfolios Overseen: 96 | Retired; formerly President (2005-2016), Global Chief Operating Officer (2014-2016), Chief Investment Officer - Global Head of Fixed Income (1998-2014), and various portfolio manager roles (1986-2006), Manulife Asset Management (asset management). | Formerly Director, Manulife Trust Company (2011-2018); formerly Director, Manulife Asset Management Limited (2015-2017); formerly Chairman of the Board of Directors of Manulife Asset Management U.S. (2005-2016); formerly Chairman of the Board, Declaration Investment Management and Research (2008-2016). | Since September 2017 | |||
Keith F. Hartstein 1956 Board Member & Portfolios Overseen: 97 | Retired; Member (since November 2014) of the Governing Council of the Independent Directors Council (IDC) (organization of independent mutual fund directors); formerly Executive Committee of the IDC Board of Governors (October 2019-December 2021); formerly President and Chief Executive Officer (2005-2012), Senior Vice President (2004-2005), Senior Vice President of Sales and Marketing (1997-2004), and various executive management positions (1990-1997), John Hancock Funds, LLC (asset management); Chairman, Investment Company Institute’s Sales Force Marketing Committee (2003-2008). | None. | Since September 2013 | |||
| Visit our website at pgim.com/investments |
| Independent Board Members | ||||||
Name Year of Birth Position(s) Portfolios Overseen | Principal Occupation(s) During Past Five Years | Other Directorships Held During Past Five Years | Length of Board Service | |||
Laurie Simon Hodrick 1962 Board Member Portfolios Overseen: 93 | A. Barton Hepburn Professor Emerita of Economics in the Faculty of Business, Columbia Business School (since 2018); Visiting Fellow at the Hoover Institution, Stanford University (since 2015); Sole Member, ReidCourt LLC (since 2008) (a consulting firm); formerly Visiting Professor of Law, Stanford Law School (2015-2021); formerly A. Barton Hepburn Professor of Economics in the Faculty of Business, Columbia Business School (1996-2017); formerly Managing Director, Global Head of Alternative Investment Strategies, Deutsche Bank (2006-2008). | Independent Director, Andela (since January 2022) (global talent network); Independent Director, Roku (since December 2020) (communication services); formerly Independent Director, Synnex Corporation (2019-2021) (information technology); formerly Independent Director, Kabbage, Inc. (2018-2020) (financial services); formerly Independent Director, Corporate Capital Trust (2017-2018) (a business development company). | Since September 2017 | |||
Brian K. Reid 1961 Board Member Portfolios Overseen: 96 | Retired; formerly Chief Economist for the Investment Company Institute (ICI) (2005-2017); formerly Senior Economist and Director of Industry and Financial Analysis at the ICI (1998-2004); formerly Senior Economist, Industry and Financial Analysis at the ICI (1996-1998); formerly Staff Economist at the Federal Reserve Board (1989-1996); Director, ICI Mutual Insurance Company (2012-2017). | None. | Since March 2018 | |||
| PGIM Jennison Diversified Growth Fund | ||
| Independent Board Members | ||||||
Name Year of Birth Position(s) Portfolios Overseen | Principal Occupation(s) During Past Five Years | Other Directorships Held During Past Five Years | Length of Board Service | |||
Grace C. Torres 1959 Board Member Portfolios Overseen: 96 | Retired; formerly Treasurer and Principal Financial and Accounting Officer of the PGIM Funds, Target Funds, Advanced Series Trust, Prudential Variable Contract Accounts and The Prudential Series Fund (1998-June 2014); Assistant Treasurer (March 1999-June 2014) and Senior Vice President (September 1999-June 2014) of PGIM Investments LLC; Assistant Treasurer (May 2003-June 2014) and Vice President (June 2005-June 2014) of AST Investment Services, Inc.; Senior Vice President and Assistant Treasurer (May 2003-June 2014) of Prudential Annuities Advisory Services, Inc. | Director (since January 2018) of OceanFirst Financial Corp. and OceanFirst Bank; formerly Director (July 2015-January 2018) of Sun Bancorp, Inc. N.A. and Sun National Bank. | Since November 2014 | |||
| Interested Board Members | ||||||
Name Year of Birth Position(s) Portfolios Overseen | Principal Occupation(s) During Past Five Years | Other Directorships Held During Past Five Years | Length of Board Service | |||
Stuart S. Parker 1962 Board Member & President Portfolios Overseen: 96 | President, Chief Executive Officer, Chief Operating Officer and Officer in Charge of PGIM Investments LLC (formerly known as Prudential Investments LLC) (since January 2012); President and PEO (since March 2022) of the PGIM Private Real Estate Fund, Inc.; formerly Executive Vice President of Jennison Associates LLC and Head of Retail Distribution of PGIM Investments LLC (June 2005-December 2011); Investment Company Institute - Board of Governors (since May 2012). | None. | Since January 2012 | |||
| Visit our website at pgim.com/investments |
| Interested Board Members | ||||||
Name Year of Birth Position(s) Portfolios Overseen | Principal Occupation(s) During Past Five Years | Other Directorships Held During Past Five Years | Length of Board Service | |||
Scott E. Benjamin 1973 Board Member & Vice President Portfolios Overseen: 97 | Executive Vice President (since May 2009) of PGIM Investments LLC; Vice President (since June 2012) of Prudential Investment Management Services LLC; Executive Vice President (since September 2009) of AST Investment Services, Inc.; Senior Vice President of Product Development and Marketing, PGIM Investments (since February 2006); Vice President (since March 2022) of the PGIM Private Real Estate Fund, Inc.; formerly Vice President of Product Development and Product Management, PGIM Investments LLC (2003-2006). | None. | Since March 2010 | |||
| Fund Officers(a) | ||||
Name Year of Birth Fund Position | Principal Occupation(s) During Past Five Years | Length of Service as Fund Officer | ||
Claudia DiGiacomo 1974 Chief Legal Officer | Chief Legal Officer (since July 2022) of the PGIM Private Real Estate Fund, Inc.; Chief Legal Officer, Executive Vice President and Secretary of PGIM Investments LLC (since August 2020); Chief Legal Officer of Prudential Mutual Fund Services LLC (since August 2020); Chief Legal Officer of PIFM Holdco, LLC (since August 2020); Vice President and Corporate Counsel (since January 2005) of Prudential; and Corporate Counsel of AST Investment Services, Inc. (since August 2020); formerly Vice President and Assistant Secretary of PGIM Investments LLC (2005-2020); formerly Associate at Sidley Austin Brown & Wood LLP (1999-2004). | Since December 2005 | ||
| PGIM Jennison Diversified Growth Fund | ||
| Fund Officers(a) | ||||
Name Year of Birth Fund Position | Principal Occupation(s) During Past Five Years | Length of Service as Fund Officer | ||
Isabelle Sajous 1976 Chief Compliance Officer | Chief Compliance Officer (since April 2022) of PGIM Investments LLC, the PGIM Funds, Target Funds, PGIM ETF Trust, PGIM Global High Yield Fund, Inc., PGIM High Yield Bond Fund, Inc., PGIM Short Duration High Yield Opportunities Fund, Advanced Series Trust, The Prudential Series Fund and Prudential’s Gibraltar Fund, Inc.; Chief Compliance Officer (since March 2022) of the PGIM Private Real Estate Fund, Inc.; Vice President, Compliance of PGIM Investments LLC (since December 2020); formerly Director, Compliance (July 2018-December 2020) of Credit Suisse Asset Management LLC; and Vice President, Associate General Counsel & Deputy Chief Compliance Officer of Cramer Rosenthal McGlynn, LLC (August 2014-July 2018). | Since April 2022 | ||
Andrew R. French 1962 Secretary | Vice President (since December 2018) of PGIM Investments LLC; Secretary (since March 2022) of the PGIM Private Real Estate Fund, Inc.; formerly Vice President and Corporate Counsel (2010-2018) of Prudential; formerly Director and Corporate Counsel (2006-2010) of Prudential; Vice President and Assistant Secretary (since January 2007) of PGIM Investments LLC; Vice President and Assistant Secretary (since January 2007) of Prudential Mutual Fund Services LLC. | Since October 2006 | ||
Melissa Gonzalez 1980 Assistant Secretary | Vice President and Corporate Counsel (since September 2018) of Prudential; Vice President and Assistant Secretary (since August 2020) of PGIM Investments LLC; Assistant Secretary (since March 2022) of the PGIM Private Real Estate Fund, Inc.; formerly Director and Corporate Counsel (March 2014-September 2018) of Prudential. | Since March 2020 | ||
Patrick E. McGuinness 1986 Assistant Secretary | Vice President and Assistant Secretary (since August 2020) of PGIM Investments LLC; Director and Corporate Counsel (since February 2017) of Prudential; Assistant Secretary (since March 2022) of the PGIM Private Real Estate Fund, Inc. | Since June 2020 | ||
Debra Rubano 1975 Assistant Secretary | Vice President and Corporate Counsel (since November 2020) of Prudential; Assistant Secretary (since March 2022) of the PGIM Private Real Estate Fund, Inc; formerly Director and Senior Counsel of Allianz Global Investors U.S. Holdings LLC (2010-2020) and Assistant Secretary of numerous funds in the Allianz fund complex (2015-2020). | Since December 2020 | ||
Kelly A. Coyne 1968 Assistant Secretary | Director, Investment Operations of Prudential Mutual Fund Services LLC (since 2010); Assistant Secretary (since March 2022) of the PGIM Private Real Estate Fund, Inc. | Since March 2015 | ||
| Visit our website at pgim.com/investments |
| Fund Officers(a) | ||||
Name Year of Birth Fund Position | Principal Occupation(s) During Past Five Years | Length of Service as Fund Officer | ||
Christian J. Kelly 1975 Treasurer and Principal Financial and Accounting Officer | Vice President, Head of Fund Administration of PGIM Investments LLC (since November 2018); Principal Financial Officer (since March 2022) of the PGIM Private Real Estate Fund, Inc.; formerly, Treasurer and Principal Accounting Officer (March 2022- July 2022) of the PGIM Private Real Estate Fund, Inc.; formerly Director of Fund Administration of Lord Abbett & Co. LLC (2009-2018), Treasurer and Principal Accounting Officer of the Lord Abbett Family of Funds (2017-2018); Director of Accounting, Avenue Capital Group (2008-2009); Senior Manager, Investment Management Practice of Deloitte & Touche LLP (1998-2007). | Since January 2019 | ||
Lana Lomuti 1967 Assistant Treasurer | Vice President (since 2007) and Director (2005-2007), within PGIM Investments Fund Administration; formerly Assistant Treasurer (December 2007-February 2014) of The Greater China Fund, Inc. | Since April 2014 | ||
Russ Shupak 1973 Assistant Treasurer | Vice President (since 2017) and Director (2013-2017), within PGIM Investments Fund Administration; Treasurer and Principal Accounting Officer (since July 2022) of the PGIM Private Real Estate Fund, Inc.; formerly Assistant Treasurer (March 2022 – July 2022) of the PGIM Private Real Estate Fund, Inc. | Since October 2019 | ||
Deborah Conway 1969 Assistant Treasurer | Vice President (since 2017) and Director (2007-2017), within PGIM Investments Fund Administration. | Since October 2019 | ||
Elyse M. McLaughlin 1974 Assistant Treasurer | Vice President (since 2017) and Director (2011-2017), within PGIM Investments Fund Administration; Assistant Treasurer (since March 2022) of the PGIM Private Real Estate Fund, Inc. | Since October 2019 | ||
Kelly Florio 1978 Anti-Money Laundering Compliance Officer | Vice President, Corporate Compliance, Global Compliance Programs and Compliance Risk Management (since December 2021) of Prudential; formerly, Head of Fraud Risk Management (October 2019 to December 2021) at New York Life Insurance Company; formerly, Head of Key Risk Area Operations (November 2018 to October 2019), Director of the US Anti-Money Laundering Compliance Unit (2009-2018) and Bank Loss Prevention Associate (2006 -2009) at MetLife. | Since June 2022 | ||
(a) Excludes Mr. Parker and Mr. Benjamin, interested Board Members who also serve as President and Vice President, respectively.
Explanatory Notes to Tables:
| ∎ | Board Members are deemed to be “Interested,” as defined in the 1940 Act, by reason of their affiliation with PGIM Investments LLC and/or an affiliate of PGIM Investments LLC. |
| ∎ | Unless otherwise noted, the address of all Board Members and Officers is c/o PGIM Investments LLC, 655 Broad Street, Newark, New Jersey 07102-4410. |
| ∎ | There is no set term of office for Board Members or Officers. The Board Members have adopted a retirement policy, which calls for the retirement of Board Members on December 31 of the year in which they reach the age of 75. |
| PGIM Jennison Diversified Growth Fund | ||
| ∎ | “Other Directorships Held” includes all directorships of companies required to register or file reports with the SEC under the 1934 Act (that is, “public companies”) or other investment companies registered under the 1940 Act. |
| ∎ | “Portfolios Overseen” includes all investment companies managed by PGIM Investments LLC. The investment companies for which PGIM Investments LLC serves as manager include the PGIM Mutual Funds, Target Funds, The Prudential Variable Contract Accounts, PGIM ETF Trust, PGIM Private Real Estate Fund, Inc., PGIM High Yield Bond Fund, Inc., PGIM Global High Yield Fund, Inc., PGIM Short Duration High Yield Opportunities Fund, The Prudential Series Fund, Prudential’s Gibraltar Fund, Inc. and the Advanced Series Trust. |
| ∎ | As used in the Fund Officers table “Prudential” means The Prudential Insurance Company of America. |
| Visit our website at pgim.com/investments |
Approval of Advisory Agreements (unaudited)
The Fund’s Board of Trustees
The Board of Trustees (the “Board”) of PGIM Jennison Diversified Growth Fund (the “Fund”)1 consists of ten individuals, eight of whom are not “interested persons” of the Fund, as defined in the Investment Company Act of 1940, as amended (the “1940 Act”) (the “Independent Trustees”). The Board is responsible for the oversight of the Fund and its operations, and performs the various duties imposed on the directors of investment companies by the 1940 Act. The Independent Trustees have retained independent legal counsel to assist them in connection with their duties. The Chair of the Board is an Independent Trustee. The Board has established five standing committees: the Audit Committee, the Nominating and Governance Committee, the Compliance Committee and two Investment Committees. Each committee is chaired by, and composed of, Independent Trustees.
Annual Approval of the Fund’s Advisory Agreements
As required under the 1940 Act, the Board determines annually whether to renew the Fund’s management agreement with PGIM Investments LLC (“PGIM Investments”) and the Fund’s subadvisory agreement with Jennison Associates LLC (“Jennison”). In considering the renewal of the agreements, the Board, including all of the Independent Trustees, met on May 26 and June 7-9, 2022 (the “Board Meeting”) and approved the renewal of the agreements through July 31, 2023, after concluding that the renewal of the agreements was in the best interests of the Fund and its shareholders.
In advance of the meetings, the Board requested and received materials relating to the agreements, and had the opportunity to ask questions and request further information in connection with its consideration. Among other things, the Board considered comparative fee information from PGIM Investments and Jennison. Also, the Board considered comparisons with other mutual funds in relevant Peer Universes and Peer Groups, as is further discussed below.
In approving the agreements, the Board, including the Independent Trustees advised by independent legal counsel, considered the factors it deemed relevant, including the nature, quality and extent of services provided by PGIM Investments and the subadviser, the performance of the Fund, the profitability of PGIM Investments and its affiliates, expenses and fees, and the potential for economies of scale that may be shared with the Fund and its shareholders as the Fund’s assets grow. In their deliberations, the Trustees did not identify any single factor which alone was responsible for the Board’s decision to approve the agreements with respect to the Fund. In connection with its deliberations, the Board considered information provided by PGIM Investments throughout the year at regular Board meetings, presentations from portfolio managers and other information, as well as information furnished at or in advance of the Board Meeting.
The Trustees determined that the overall arrangements between the Fund and PGIM Investments, which serves as the Fund’s investment manager pursuant to a
1PGIM Jennison Diversified Growth Fund is a series of Prudential Investment Portfolios 5
| PGIM Jennison Diversified Growth Fund | ||
Approval of Advisory Agreements (continued)
management agreement, and between PGIM Investments and Jennison, which serves as the Fund’s subadviser pursuant to the terms of a subadvisory agreement with PGIM Investments, are in the best interests of the Fund and its shareholders in light of the services performed, fees charged and such other matters as the Trustees considered relevant in the exercise of their business judgment.
The material factors and conclusions that formed the basis for the Trustees’ determinations to approve the renewal of the agreements are discussed separately below.
Nature, Quality and Extent of Services
The Board received and considered information regarding the nature, quality and extent of services provided to the Fund by PGIM Investments and Jennison. The Board noted that Jennison is affiliated with PGIM Investments. The Board considered the services provided by PGIM Investments, including but not limited to the oversight of the subadviser for the Fund, as well as the provision of fund recordkeeping, compliance and other services to the Fund, and PGIM Investments’ role as administrator for the Fund’s liquidity risk management program. With respect to PGIM Investments’ oversight of the subadviser, the Board noted that PGIM Investments’ Strategic Investment Research Group (“SIRG”), a business unit of PGIM Investments, is responsible for monitoring and reporting to PGIM Investments’ senior management on the performance and operations of the subadviser. The Board also considered that PGIM Investments pays the salaries of all of the officers and interested Trustees of the Fund who are part of Fund management. The Board also considered the investment subadvisory services provided by Jennison, including investment research and security selection, as well as compliance with the Fund’s investment restrictions, policies and procedures. The Board considered PGIM Investments’ evaluation of Jennison as well as PGIM Investments’ recommendation, based on its review of Jennison, to renew the subadvisory agreement.
The Board considered the qualifications, backgrounds and responsibilities of PGIM Investments’ senior management responsible for the oversight of the Fund and Jennison, and also considered the qualifications, backgrounds and responsibilities of Jennison’s portfolio managers who are responsible for the day-to-day management of the Fund’s portfolio. The Board was provided with information pertaining to PGIM Investments’ and Jennison’s organizational structure, senior management, investment operations, and other relevant information pertaining to both PGIM Investments and Jennison. The Board also noted that it received favorable compliance reports from the Fund’s Chief Compliance Officer (“CCO”) as to both PGIM Investments and Jennison.
The Board concluded that it was satisfied with the nature, extent and quality of the investment management services provided by PGIM Investments and the subadvisory services provided to the Fund by Jennison, and that there was a reasonable basis on which to conclude that the Fund benefits from the services provided by PGIM Investments and Jennison under the management and subadvisory agreements.
| Visit our website at pgim.com/investments |
Costs of Services and Profits Realized by PGIM Investments
The Board was provided with information on the profitability of PGIM Investments and its affiliates in serving as the Fund’s investment manager. The Board discussed with PGIM Investments the methodology utilized in assembling the information regarding profitability and considered its reasonableness. The Board recognized that it is difficult to make comparisons of profitability from fund management contracts because comparative information is not generally publicly available and is affected by numerous factors, including the structure of the particular adviser, the types of funds it manages, its business mix, numerous assumptions regarding allocations and the adviser’s capital structure and cost of capital. Taking these factors into account, the Board concluded that the profitability of PGIM Investments and its affiliates in relation to the services rendered was not unreasonable.
Economies of Scale
The Board received and discussed information concerning economies of scale that PGIM Investments may realize as the Fund’s assets grow beyond current levels. The Board noted that the management fee schedule for the Fund includes breakpoints, which have the effect of decreasing the fee rate as assets increase. During the course of time, the Board has considered information regarding the launch date of the Fund, the management fees of the Fund compared to those of similarly managed funds and PGIM Investments’ investment in the Fund over time. The Board noted that economies of scale can be shared with the Fund in other ways, including low management fees from inception, additional technological and personnel investments to enhance shareholder services, and maintaining existing expense structures in the face of a rising cost environment. The Board also considered PGIM Investments’ assertion that it continually evaluates the management fee schedule of the Fund and the potential to share economies of scale through breakpoints or fee waivers as asset levels increase.
The Board recognized the inherent limitations of any analysis of economies of scale, stemming largely from the Board’s understanding that most of PGIM Investments’ costs are not specific to individual funds, but rather are incurred across a variety of products and services.
Other Benefits to PGIM Investments and Jennison
The Board considered potential ancillary benefits that might be received by PGIM Investments and Jennison and their affiliates as a result of their relationship with the Fund. The Board concluded that potential benefits to be derived by PGIM Investments included transfer agency fees received by the Fund’s transfer agent (which is affiliated with PGIM Investments), as well as benefits to its reputation or other intangible benefits resulting from PGIM Investments’ association with the Fund. The Board concluded that the potential benefits to be derived by Jennison included its ability to use soft dollar credits, as well as the potential benefits consistent with those generally resulting from an increase in assets under management, specifically, potential access to additional research resources and benefits to its reputation. The Board concluded that the benefits
| PGIM Jennison Diversified Growth Fund | ||
Approval of Advisory Agreements (continued)
derived by PGIM Investments and Jennison were consistent with the types of benefits generally derived by investment managers and subadvisers to mutual funds.
Performance of the Fund / Fees and Expenses
The Board considered certain additional factors and made related conclusions relating to the historical performance of the Fund for the one-, three-, five- and ten-year periods ended December 31, 2021.
The Board also considered the Fund’s actual management fee, as well as the Fund’s net total expense ratio, for the fiscal year ended July 31, 2021. The Board considered the management fee for the Fund as compared to the management fee charged by PGIM Investments to other funds and the fee charged by other advisers to comparable mutual funds in a Peer Group. The actual management fee represents the fee rate actually paid by Fund shareholders and includes any fee waivers or reimbursements. The net total expense ratio for the Fund represents the actual expense ratio incurred by Fund shareholders.
The mutual funds included in the Peer Universe, which was used to consider performance, and the Peer Group, which was used to consider fees and expenses, were objectively determined by Broadridge, an independent provider of mutual fund data. In certain circumstances, PGIM Investments also provided supplemental Peer Universe or Peer Group information, for reasons addressed with the Board. The comparisons placed the Fund in various quartiles over various periods, with the first quartile being the best 25% of the mutual funds (for performance, the best performing mutual funds and, for expenses, the lowest cost mutual funds).
The section below summarizes key factors considered by the Board and the Board’s conclusions regarding the Fund’s performance, fees and overall expenses. The table sets forth net performance comparisons (which reflect the impact on performance of fund expenses, or any subsidies, expense caps or waivers that may be applicable) with the Peer Universe, actual management fees with the Peer Group (which reflect the impact of any subsidies or fee waivers), and net total expenses with the Peer Group, each of which were key factors considered by the Board.
| Net Performance | 1 Year | 3 Years | 5 Years | 10 Years | ||||
2nd Quartile | 2nd Quartile | N/A | N/A | |||||
| Actual Management Fees: 4th Quartile | ||||||||
| Net Total Expenses: 4th Quartile | ||||||||
| ● | The Board noted that the Fund underperformed its benchmark index over the one-and three-year periods. |
| Visit our website at pgim.com/investments |
| ● | The Board considered that in 2017, the Fund changed its investment process to optimize its portfolio to the Russell 1000 Growth Index and that previously, the Fund was optimized to the S&P 500 Index, which led to periods of underperformance during periods when growth investing was favored. |
| ● | The Board considered PGIM Investments’ assertion that the Fund’s valuation-sensitive approach to growth investing was the primary driver of outperformance versus peers. |
| ● | The Board and PGIM Investments agreed to retain the existing contractual expense cap, which (exclusive of certain fees and expenses) caps the Fund’s annual operating expenses at 1.00% for Class R6 shares and 1.00% for Class Z shares through November 30, 2022. |
| ● | In addition, PGIM Investments will waive management fees or shared operating expenses on any share class to the same extent that it waives such expenses on any other share class, and has agreed that total annual fund operating expenses for Class R6 shares will not exceed total annual fund operating expenses for Class Z shares. |
| ● | The Board concluded that, in light of the above, it would be in the best interests of the Fund and its shareholders to allow the Fund’s investment team time to develop a longer performance record under the new optimization process and to renew the agreements. |
| ● | The Board concluded that the management fees (including subadvisory fees) and total expenses were reasonable in light of the services provided. |
* * *
After full consideration of these factors, the Board concluded that approval of the agreements was in the best interests of the Fund and its shareholders.
| PGIM Jennison Diversified Growth Fund | ||
∎ TELEPHONE | ∎ WEBSITE | |||
655 Broad Street Newark, NJ 07102 | (800) 225-1852 | pgim.com/investments | ||
| PROXY VOTING |
| The Board of Trustees of the Fund has delegated to the Fund’s subadviser the responsibility for voting any proxies and maintaining proxy recordkeeping with respect to the Fund. A description of these proxy voting policies and procedures is available without charge, upon request, by calling (800) 225-1852 or by visiting the Securities and Exchange Commission’s website at sec.gov. Information regarding how the Fund voted proxies relating to portfolio securities during the most recent 12-month period ended June 30 is available on the Fund’s website and on the Securities and Exchange Commission’s website. |
| TRUSTEES |
| Ellen S. Alberding ● Kevin J. Bannon ● Scott E. Benjamin ● Linda W. Bynoe ● Barry H. Evans ● Keith F. Hartstein ● Laurie Simon Hodrick ● Stuart S. Parker ● Brian K. Reid ● Grace C. Torres |
| OFFICERS |
| Stuart S. Parker, President ● Scott E. Benjamin, Vice President ● Christian J. Kelly, Treasurer and Principal Financial and Accounting Officer ● Claudia DiGiacomo, Chief Legal Officer ● Isabelle Sajous, Chief Compliance Officer ● Kelly Florio, Anti-Money Laundering Compliance Officer ● Andrew R. French, Secretary ● Melissa Gonzalez, Assistant Secretary ● Kelly A. Coyne, Assistant Secretary ● Patrick E. McGuinness, Assistant Secretary ● Debra Rubano, Assistant Secretary ● Lana Lomuti, Assistant Treasurer ● Russ Shupak, Assistant Treasurer ● Elyse M. McLaughlin, Assistant Treasurer ● Deborah Conway, Assistant Treasurer |
| MANAGER | PGIM Investments LLC | 655 Broad Street Newark, NJ 07102 | ||
| ||||
| SUBADVISER | Jennison Associates LLC | 466 Lexington Avenue New York, NY 10017 | ||
| ||||
| DISTRIBUTOR | Prudential Investment Management Services LLC | 655 Broad Street Newark, NJ 07102 | ||
| ||||
| CUSTODIAN | The Bank of New York Mellon | 240 Greenwich Street New York, NY 10286 | ||
| ||||
| TRANSFER AGENT | Prudential Mutual Fund Services LLC | PO Box 9658 Providence, RI 02940 | ||
| ||||
| INDEPENDENT REGISTERED PUBLIC ACCOUNTING FIRM | PricewaterhouseCoopers LLP | 300 Madison Avenue New York, NY 10017 | ||
| ||||
| FUND COUNSEL | Willkie Farr & Gallagher LLP | 787 Seventh Avenue New York, NY 10019 | ||
| ||||
| An investor should consider the investment objectives, risks, charges, and expenses of the Fund carefully before investing. The prospectus and summary prospectus contain this and other information about the Fund. An investor may obtain a prospectus and summary prospectus by visiting our website at pgim.com/investments or by calling (800) 225-1852. The prospectus and summary prospectus should be read carefully before investing. |
| E-DELIVERY |
| To receive your mutual fund documents online, go to pgim.com/investments/resource/edelivery and enroll. Instead of receiving printed documents by mail, you will receive notification via email when new materials are available. You can cancel your enrollment or change your email address at any time by visiting the website address above. |
| SHAREHOLDER COMMUNICATIONS WITH TRUSTEES |
| Shareholders can communicate directly with the Board of Trustees by writing to the Chair of the Board, PGIM Jennison Diversified Growth Fund, PGIM Investments, Attn: Board of Trustees, 655 Broad Street, Newark, NJ 07102. Shareholders can communicate directly with an individual Trustee by writing to that Trustee at the same address. Communications are not screened before being delivered to the addressee. |
| AVAILABILITY OF PORTFOLIO HOLDINGS |
| The Fund files its complete schedule of portfolio holdings with the Securities and Exchange Commission for the first and third quarters of each fiscal year as an exhibit to its reports on Form N-PORT. The Fund’s Form N-PORT filings are available on the Commission’s website at sec.gov. |
| The Fund’s Statement of Additional Information contains additional information about the Fund’s Trustees and is available without charge, upon request, by calling (800) 225-1852. |
Mutual Funds:
ARE NOT INSURED BY THE FDIC OR ANY FEDERAL GOVERNMENT AGENCY | MAY LOSE VALUE | ARE NOT A DEPOSIT OF OR GUARANTEED BY ANY BANK OR ANY BANK AFFILIATE | ||

PGIM JENNISON DIVERSIFIED GROWTH FUND
| SHARE CLASS | A | C | Z | R6 | ||||
| NASDAQ | TBDAX | TBDCX | TBDZX | TBDQX | ||||
| CUSIP | 74440V104 | 74440V302 | 74440V690 | 74440V716 | ||||
MF503 E

PGIM JENNISON RISING DIVIDEND FUND
ANNUAL REPORT
JULY 31, 2022

To enroll in e-delivery, go to pgim.com/investments/resource/edelivery
| 3 | ||||
| 4 | ||||
| 5 | ||||
| 8 | ||||
| 12 | ||||
| 15 | ||||
This report is not authorized for distribution to prospective investors unless preceded or accompanied by a current prospectus.
The views expressed in this report and information about the Fund’s portfolio holdings are for the period covered by this report and are subject to change thereafter.
Mutual funds are distributed by Prudential Investment Management Services LLC, member SIPC. Jennison Associates LLC is a registered investment adviser. Both are Prudential Financial companies. © 2022 Prudential Financial, Inc. and its related entities. Jennison Associates, Jennison, PGIM, and the PGIM logo are service marks of Prudential Financial, Inc. and its related entities, registered in many jurisdictions worldwide.
| 2 | Visit our website at pgim.com/investments |
 | Dear Shareholder:
We hope you find the annual report for the PGIM Jennison Rising Dividend Fund informative and useful. The report covers performance for the 12-month period that ended July 31, 2022.
The attention of the global economy and markets turned during the period from the impact of the COVID-19 pandemic to the challenge of rapidly rising inflation. Prices for a wide range of goods and services rose in response to economic reopenings, supply-chain disruptions, pandemic-related governmental stimulus and Russia’s invasion of Ukraine. |
As inflation surged at its fastest rate in more than 40 years, central banks, led by the US Federal Reserve, sought to restrain the trend by aggressively hiking interest rates, prompting concerns of a potential recession.
After rising to record levels during the closing months of 2021, US stocks retreated in 2022 in the face of rising prices, slowing economic growth and uncertainties related to the war in Ukraine. Growth-oriented stocks suffered the sharpest losses as investors turned for protection to traditionally defensive, value-oriented stocks. Large-cap equities ended the period in negative territory but outperformed their small-cap counterparts by a significant margin. International developed markets trailed the US market, while emerging markets lagged further behind.
Rising rates and economic uncertainty drove fixed-income prices broadly lower as well. US and global investment-grade bonds, along with US high yield corporate bonds and emerging market debt, all posted negative returns for the period.
Regarding your investments with PGIM, we believe it is important to maintain a diversified portfolio of funds consistent with your tolerance for risk, time horizon, and financial goals. Your financial advisor can help you create a diversified investment plan that may include funds covering all the basic asset classes and that reflects your personal investor profile and risk tolerance. However, diversification and asset allocation strategies do not assure a profit or protect against loss in declining markets.
At PGIM Investments, we provide access to active investment strategies across the global markets in the pursuit of consistent outperformance for investors. PGIM is the world’s 11th-largest investment manager with more than $1.5 trillion in assets under management. Our scale and investment expertise allow us to deliver a diversified suite of actively managed solutions across a broad spectrum of asset classes and investment styles.
Thank you for choosing our family of funds.
Sincerely,

Stuart S. Parker, President
PGIM Jennison Rising Dividend Fund
September 15, 2022
PGIM Jennison Rising Dividend Fund | 3 |
Your Fund’s Performance (unaudited)
Performance data quoted represent past performance. Past performance does not guarantee future results. The investment return and principal value of an investment will fluctuate so that an investor’s shares, when redeemed, may be worth more or less than their original cost. Current performance may be lower or higher than the past performance data quoted. An investor may obtain performance data as of the most recent month-end by visiting our website at pgim.com/investments or by calling (800) 225-1852.
| Average Annual Total Returns as of 7/31/22 | ||||||
| One Year (%) | Five Years (%) | Since Inception (%) | ||||
| Class A | ||||||
| (with sales charges) | -8.04 | 9.91 | 9.15 (03/05/2014) | |||
| (without sales charges) | -2.69 | 11.16 | 9.89 (03/05/2014) | |||
| Class C | ||||||
| (with sales charges) | -4.35 | 10.32 | 9.08 (03/05/2014) | |||
| (without sales charges) | -3.46 | 10.32 | 9.08 (03/05/2014) | |||
| Class Z | ||||||
| (without sales charges) | -2.46 | 11.41 | 10.17 (03/05/2014) | |||
| Class R6 | ||||||
| (without sales charges) | -2.49 | N/A | 11.38 (09/27/2017) | |||
| S&P 500 Index | ||||||
| -4.64 | 12.82 | — | ||||
| Average Annual Total Returns as of 7/31/22 Since Inception (%) | ||||
Class A, Class C, Class Z (03/05/2014) | Class R6 (09/27/2017) | |||
| S&P 500 Index | 12.06 | 12.75 | ||
Since Inception returns are provided for any share class with less than 10 fiscal years of returns. Since Inception returns for the Index are measured from the closest month-end to the class’ inception date.
| 4 | Visit our website at pgim.com/investments |
Growth of a $10,000 Investment (unaudited)
The graph compares a $10,000 investment in the Fund’s Class Z shares with a similar investment in the S&P 500 Index by portraying the initial account values at the commencement of operations of Class Z shares (March 5, 2014) and the account values at the end of the current fiscal year (July 31, 2022), as measured on a quarterly basis. For purposes of the graph, and unless otherwise indicated, it has been assumed that (a) all recurring fees (including management fees) were deducted and (b) all dividends and distributions were reinvested. The line graph provides information for Class Z shares only. As indicated in the tables provided earlier and in the following paragraphs, performance for other share classes will vary due to the differing charges and expenses applicable to each share class (as indicated in the following paragraphs). Without waiver of fees and/or expense reimbursements, if any, the returns would have been lower.
Past performance does not predict future performance. Total returns and the ending account values in the graph include changes in share price and reinvestment of dividends and capital gains distributions in a hypothetical investment for the periods shown. The Fund’s total returns do not reflect the deduction of income taxes on an individual’s investment. Taxes may reduce your actual investment returns on income or gains paid by the Fund or any gains you may realize if you sell your shares.
PGIM Jennison Rising Dividend Fund | 5 |
Your Fund’s Performance (continued)
The returns in the tables do not reflect the deduction of taxes that a shareholder would pay on Fund distributions or following the redemption of Fund shares. The average annual total returns take into account applicable sales charges, which are described for each share class in the table below.
| Class A | Class C | Class Z | Class R6 | |||||
| Maximum initial sales charge | 5.50% of the public offering price | None | None | None | ||||
| Contingent deferred sales charge (CDSC) (as a percentage of the lower of the original purchase price or the net asset value at redemption) | 1.00% on sales of $1 million or more made within 12 months of purchase | 1.00% on sales made within 12 months of purchase | None | None | ||||
| Annual distribution and service (12b-1) fees (shown as a percentage of average daily net assets) | 0.30% (0.25% currently) | 1.00% | None | None | ||||
Benchmark Definitions
S&P 500 Index*—The S&P 500 Index is an unmanaged index of over 500 stocks of large US public companies. It gives a broad look at how stock prices in the United States have performed.
*The S&P 500 Index (“Index”) is a product of S&P Dow Jones Indices LLC and/or its affiliates and has been licensed for use by PGIM, Inc. Copyright © 2022 S&P Dow Jones Indices LLC, a division of S&P Global, Inc., and/or its affiliates. All rights reserved. Redistribution or reproduction in whole or in part are prohibited without written permission of S&P Dow Jones Indices LLC. For more information on any of S&P Dow Jones Indices LLC’s indices please visit www.spdji.com. S&P® is a registered trademark of S&P Global and Dow Jones® is a registered trademark of Dow Jones Trademark Holdings LLC.
Investors cannot invest directly in an index. The returns for the Index would be lower if they included the effects of sales charges, operating expenses of a mutual fund, or taxes that may be paid by an investor.
| 6 | Visit our website at pgim.com/investments |
Presentation of Fund Holdings as of 7/31/22
| Ten Largest Holdings | Line of Business | % of Net Assets | ||
| Eli Lilly & Co. | Pharmaceuticals | 3.9% | ||
| CenterPoint Energy, Inc. | Multi-Utilities | 3.6% | ||
| Bristol-Myers Squibb Co. | Pharmaceuticals | 3.3% | ||
| CMS Energy Corp. | Multi-Utilities | 3.0% | ||
| AstraZeneca PLC (United Kingdom), ADR | Pharmaceuticals | 3.0% | ||
| Hershey Co. (The) | Food Products | 3.0% | ||
| Northrop Grumman Corp. | Aerospace & Defense | 2.9% | ||
| AT&T, Inc. | Diversified Telecommunication Services | 2.7% | ||
| Lamb Weston Holdings, Inc. | Food Products | 2.6% | ||
| International Business Machines Corp. | IT Services | 2.6% | ||
Holdings reflect only long-term investments and are subject to change.
PGIM Jennison Rising Dividend Fund | 7 |
Strategy and Performance Overview* (unaudited)
How did the Fund perform?
The PGIM Jennison Rising Dividend Fund’s Class Z shares returned -2.46% in the 12-month period ended July 31, 2022, outperforming the -4.64% return of the S&P 500® Index (the Index).
What was the market environment?
| • | Over the past year, the investment backdrop changed from one of stimulus and spending to one of inflation and tightening financial conditions, with the need to control inflation moving aggressively to the fore. |
| • | The final months of 2021 were marked by the emergence of the Omicron variant of COVID-19, as well as heightened concerns over inflation, which led the Federal Reserve (the Fed) to announce an accelerated plan of reduced asset purchases. Against this backdrop, equity markets rose to all-time highs to close out the year. |
| • | The investment environment at the start of 2022 was clouded by continued uncertainties related to the pandemic, inflation, and the prospect of slowing growth on the back of plans by the Fed for policy tightening. The brutal military conflict in Ukraine added a dangerous new dimension of uncertainty in late February. Commodity prices rose sharply, led by crude oil, as the sanctions imposed on Russia by the US and European Union made it difficult for the world’s largest oil exporter to complete transactions. |
| • | As the year continued, stock prices continued to suffer from the impacts of the war in Ukraine, unexpectedly high inflation, tightening monetary policy, and ongoing COVID-19 lockdowns in China, leading to one of the largest selloffs since the global financial crisis nearly fifteen years ago. |
| • | The accumulation of these events started to weigh on GDP growth around the globe. Commodity prices continued to exhibit strength due to the imbalance between Russia/Ukraine-related supply constraints and still-resilient demand, until concerns over the effects of high prices on demand and downward revisions in global growth expectations drove a reversal across many commodities during June. |
| • | Rising US interest rates, global growth concerns, and a flight to safety drove the US dollar higher versus other global currencies later in the period, adding a further headwind from translation of foreign profits for US multinationals. |
| • | The Fed’s task of bringing inflation back to its 2% target without undermining the robust employment backdrop and precipitating a recession underscored prevailing uncertainty regarding the macro outlook. |
| • | The Index experienced sharp declines in the communications services and consumer discretionary sectors, along with more modest declines in information technology, industrials, financials, and materials. Positive sector performance was led by energy, which gained 67% for the period. The utility sector also saw strong gains of 15%. Other positive performance came from the consumer staples and healthcare sectors. |
| 8 | Visit our website at pgim.com/investments |
What worked?
| • | Relative to the Index, the Fund benefited from overweight allocations to the strong-performing energy and utility sectors, as well as underweight exposure to the weak-performing communications services sector. Relative performance was further supported by modestly overweight positions in materials, financials, and consumer staples, along with modestly underweight exposure to consumer discretionary stocks. |
| • | Given data in 2022 indicating that inflation would persist for some time (although commodity inflation seems to have rolled over), economic growth would decelerate, and market volatility would remain elevated, Jennison shifted the Fund to a more defensive posture. |
| • | Top-performing holdings during the period included Chevron Corporation, Eli Lilly & Company and The Williams Companies Inc. |
| • | Integrated oil and gas company Chevron engages in the exploration, development, and production of crude oil and natural gas, as well as the transportation, storage, and marketing of natural gas and refined products. In Jennison’s opinion, Chevron’s record as the best-executing major oil company has positioned the company to benefit from higher oil prices. Chevron is using its strong cash flow in a prudent manner through a mix of debt reduction, returning cash back to shareholders via additional stock buybacks, value-enhancing acquisitions, and investing in profitable expansion in its upstream business. Jennison believes that the company will continue to execute along these vectors, thus enhancing shareholder value over the prevailing energy cycle. |
| • | Diversified biopharmaceutical company Eli Lilly is best known for its core franchises in areas such as neuroscience, women’s health, oncology, cardiovascular medicine, and immunology. The company has benefited from a stable-growth business model during the recent, uncertainty-driven economic downturn. Additional drivers that could significantly enhance shareholder value include key pipeline drugs Mounjaro and Donanemab. Obesity drug Mounjaro has shown a meaningful reduction in obesity and type 2 diabetes. The data on Mounjaro is excellent, and Jennison believes it will likely receive approval for use against obesity in the second half of 2022. Alzheimer drug Donanemab is currently in phase 3 trials. While the data so far is promising, there are no assurances that it will succeed. Nonetheless, it is the most promising Alzheimer treatment on the horizon, with no viable alternatives to date. As a result of these opportunities, Jennison believes there is still meaningful upside in Eli Lilly stock. |
| • | Williams owns and operates an integrated natural gas pipeline-infrastructure network stretching from the Northeast US to the Gulf Coast, and a large gas-gathering network in the Marcellus region. The company also owns and operates the Transco pipeline, the largest US pipeline. In Jennison’s view, these assets position the firm for growth from both US gas demand and global liquid natural gas demand. While the stock price has experienced several ups and downs, the company operates a stable energy-infrastructure business with a high percentage of take-or-pay contracts. |
PGIM Jennison Rising Dividend Fund | 9 |
Strategy and Performance Overview* (continued)
Williams has been reducing its debt level and has recently been able to return capital to shareholders. As long as it continues to do so, Jennison believes that the future of this business is likely to remain very solid.
What didn’t work?
| • | Relative performance suffered due to stock section in the energy, information technology, materials, and financial sectors, as well as underweight exposure to the healthcare sector. |
| • | Notably weak-performing holdings during the period included Barrick Gold Corporation, Qualcomm Incorporated, and Stryker Corporation. |
| • | Mining company Barrick Gold engages in the production and sale of gold and copper, as well as mine exploration and development. Overall, the company is executing well in terms of gold volume produced with a reasonable cost structure. Nonetheless, gold prices pulled back during the last five months of the period, negatively affecting Barrick shares. Jennison reduced the Fund’s Barrick holdings to manage position-size risk. |
| • | US-based, multinational technology company Qualcomm provides semiconductors, software, and services related to wireless technology. It owns patents critical to 4G, 5G, CDMA, and other mobile communications standards. While the company has done a good job of diversifying its business away from smartphone maker Apple Inc., concerns remain that overall smartphone volume may decline as the economic environment weakens. Furthermore, in diversifying away from Apple, the incremental smartphone customers that Qualcomm deals with are primarily Chinese companies. In the current environment with China’s zero-COVID-19 policy, it remains to be seen how well that market will be able to perform. Additionally, a potential, upcoming global recession may reduce the unit volume of new smartphone devices. While management continues to execute well, Jennison reduced the Fund’s Qualcomm position given the global headwinds the company faces. |
| • | Medical technology company Stryker provides implants used in joint replacement surgeries, among other medical products. As the population ages, orthopedics and other medical and surgical devices are expected to be used in larger quantities. During the COVID-19 pandemic, hospitals reduced or eliminated optional surgeries, such as knee and hip replacements, to focus on pandemic-related hospitalizations. While Jennison anticipated that a more broadly vaccinated population would lead to a rebound in optional surgery volumes, this did not play out as anticipated during the period. The lack of nurses in the healthcare system limited the number of operations that could be performed in hospitals, keeping the system focused on more critical surgeries. Jennison reduced the Fund’s position and continues to monitor the overall environment. |
Current outlook
| • | While there had been significant unease over inflation earlier in 2022, Jennison believes those concerns are largely behind us. Labor inflation, however, remains an |
| 10 | Visit our website at pgim.com/investments |
| area of concern. While that trend may be peaking as well, it appears too early to declare victory. Accordingly, Jennison remains vigilant, vigorously monitoring the labor component of inflation. |
| • | Going forward, Jennison believes the market will focus squarely on whether or not a recession will occur and, if so, how severe it will be. Most market commentators believe that the economy can either avoid a recession or experience a mild one. Unfortunately, economic data continues to deteriorate, leading Jennison to see greater risk to the downside. Therefore, Jennison intends to maintain the Fund’s defensive positioning until the outlook turns positive. |
| • | Relative to the Index, the Fund is overweight the energy, utilities, consumer staples, and real estate sectors. The most significantly underweight areas include information technology, communication services (interactive media/entertainment), consumer discretionary, and financials. |
| • | Jennison remains committed to an investment philosophy of seeking quality businesses that can generate high/increasing free cash flows that can be returned to investors in the form of growing dividends. At the same time, as the economic environment becomes more uncertain, Jennison has emphasized investments in quality companies likely to maintain cash-flow-generation during a recession, although such companies may experience slightly lower dividend growth rates and less demanding valuations. |
* This strategy and performance overview, which discusses what strategies or holdings (including derivatives, if applicable) affected the Fund’s performance, is compiled based on how the Fund performed relative to the Fund’s assigned index and is viewed for performance attribution purposes at the aggregate Fund level, which in most instances will not directly correlate to the amounts disclosed in the Statement of Operations which conform to U.S. generally accepted accounting principles.
PGIM Jennison Rising Dividend Fund | 11 |
As a shareholder of the Fund, you incur two types of costs: (1) transaction costs, including sales charges (loads) on purchase payments and redemptions, as applicable, and (2) ongoing costs, including management fees, distribution and/or service (12b-1) fees, and other Fund expenses, as applicable. This example is intended to help you understand your ongoing costs (in dollars) of investing in the Fund and to compare these costs with the ongoing costs of investing in other mutual funds.
The example is based on an investment of $1,000 held through the six-month period ended July 31, 2022. The example is for illustrative purposes only; you should consult the Prospectus for information on initial and subsequent minimum investment requirements.
Actual Expenses
The first line for each share class in the table on the following page provides information about actual account values and actual expenses. You may use the information on this line, together with the amount you invested, to estimate the expenses that you paid over the period. Simply divide your account value by $1,000 (for example, an $8,600 account value ÷ $1,000 = 8.6), then multiply the result by the number on the first line under the heading “Expenses Paid During the Six-Month Period” to estimate the expenses you paid on your account during this period.
Hypothetical Example for Comparison Purposes
The second line for each share class in the table on the following page provides information about hypothetical account values and hypothetical expenses based on the Fund’s actual expense ratio and an assumed rate of return of 5% per year before expenses, which is not the Fund’s actual return. The hypothetical account values and expenses may not be used to estimate the actual ending account balance or expenses you paid for the period. You may use this information to compare the ongoing costs of investing in the Fund and other funds. To do so, compare this 5% hypothetical example with the 5% hypothetical examples that appear in the shareholder reports of the other funds.
The Fund’s transfer agent may charge additional fees to holders of certain accounts that are not included in the expenses shown in the table on the following page. These fees apply to individual retirement accounts (IRAs) and Section 403(b) accounts. As of the close of the six-month period covered by the table, IRA fees included an annual maintenance fee of $15 per account (subject to a maximum annual maintenance fee of $25 for all accounts held by the same shareholder). Section 403(b) accounts are charged an annual $25 fiduciary maintenance fee. Some of the fees may vary in amount, or may be waived, based on your total account balance or the number of PGIM funds, including the Fund, that you own. You should consider the additional fees that were charged to your Fund account over the six-month period when you estimate the total ongoing expenses paid over the period and the impact of these fees on your ending account value, as these additional expenses are not reflected in the information
| 12 | Visit our website at pgim.com/investments |
provided in the expense table. Additional fees have the effect of reducing investment returns.
Please note that the expenses shown in the table are meant to highlight your ongoing costs only and do not reflect any transactional costs such as sales charges (loads). Therefore, the second line for each share class in the table is useful in comparing ongoing costs only and will not help you determine the relative total costs of owning different funds. In addition, if these transactional costs were included, your costs would have been higher.
PGIM Jennison Rising Dividend Fund | Beginning Account Value February 1, 2022 | Ending Account Value July 31, 2022 | Annualized Expense Ratio Based on the Six-Month Period | Expenses Paid During the Six-Month Period* | ||||||
| Class A | Actual | $1,000.00 | $ 955.10 | 1.24% | $6.01 | |||||
| Hypothetical | $1,000.00 | $1,018.65 | 1.24% | $6.21 | ||||||
| Class C | Actual | $1,000.00 | $ 951.20 | 1.99% | $9.63 | |||||
| Hypothetical | $1,000.00 | $1,014.93 | 1.99% | $9.94 | ||||||
| Class Z | Actual | $1,000.00 | $ 955.90 | 0.99% | $4.80 | |||||
| Hypothetical | $1,000.00 | $1,019.89 | 0.99% | $4.96 | ||||||
| Class R6 | Actual | $1,000.00 | $ 955.60 | 0.99% | $4.80 | |||||
| Hypothetical | $1,000.00 | $1,019.89 | 0.99% | $4.96 | ||||||
*Fund expenses (net of fee waivers or subsidies, if any) for each share class are equal to the annualized expense ratio for each share class (provided in the table), multiplied by the average account value over the period, multiplied by the 181 days in the six-month period ended July 31, 2022, and divided by the 365 days in the Fund’s fiscal year ended July 31, 2022 (to reflect the six-month period). Expenses presented in the table include the expenses of any underlying portfolios in which the Fund may invest.
PGIM Jennison Rising Dividend Fund | 13 |
as of July 31, 2022
| Description | Shares | Value | ||||||
| LONG-TERM INVESTMENTS 93.8% | ||||||||
| COMMON STOCKS | ||||||||
| Aerospace & Defense 2.9% | ||||||||
Northrop Grumman Corp. | 10,871 | $ | 5,206,122 | |||||
| Banks 3.6% | ||||||||
Bank of America Corp. | 52,652 | 1,780,164 | ||||||
JPMorgan Chase & Co. | 22,483 | 2,593,639 | ||||||
PNC Financial Services Group, Inc. (The) | 12,600 | 2,090,844 | ||||||
|
| |||||||
| 6,464,647 | ||||||||
| Beverages 4.2% | ||||||||
Diageo PLC (United Kingdom), ADR | 3,080 | 589,512 | ||||||
Keurig Dr. Pepper, Inc. | 80,464 | 3,117,175 | ||||||
PepsiCo, Inc. | 22,523 | 3,940,624 | ||||||
|
| |||||||
| 7,647,311 | ||||||||
| Capital Markets 0.6% | ||||||||
Goldman Sachs Group, Inc. (The) | 3,448 | 1,149,529 | ||||||
| Commercial Services & Supplies 1.4% | ||||||||
Republic Services, Inc. | 18,934 | 2,625,388 | ||||||
| Containers & Packaging 1.1% | ||||||||
Crown Holdings, Inc. | 20,428 | 2,077,119 | ||||||
| Diversified Consumer Services 2.5% | ||||||||
Service Corp. International | 62,061 | 4,621,062 | ||||||
| Diversified Telecommunication Services 2.7% | ||||||||
AT&T, Inc. | 259,610 | 4,875,476 | ||||||
| Electric Utilities 3.3% | ||||||||
American Electric Power Co., Inc. | 40,251 | 3,967,139 | ||||||
Exelon Corp. | 42,758 | 1,987,819 | ||||||
|
| |||||||
| 5,954,958 | ||||||||
| Electronic Equipment, Instruments & Components 0.3% | ||||||||
Corning, Inc. | 16,015 | 588,711 | ||||||
| Entertainment 2.5% | ||||||||
Activision Blizzard, Inc. | 56,395 | 4,508,780 | ||||||
See Notes to Financial Statements.
PGIM Jennison Rising Dividend Fund | 15 |
Schedule of Investments (continued)
as of July 31, 2022
| Description | Shares | Value | ||||||
| COMMON STOCKS (Continued) | ||||||||
| Equity Real Estate Investment Trusts (REITs) 6.3% | ||||||||
Alexandria Real Estate Equities, Inc. | 15,896 | $ | 2,635,239 | |||||
AvalonBay Communities, Inc. | 18,161 | 3,885,364 | ||||||
First Industrial Realty Trust, Inc. | 30,266 | 1,572,319 | ||||||
SBA Communications Corp. | 9,866 | 3,312,904 | ||||||
|
| |||||||
| 11,405,826 | ||||||||
| Food & Staples Retailing 3.0% | ||||||||
Sysco Corp. | 18,682 | 1,586,102 | ||||||
Walmart, Inc. | 29,616 | 3,910,793 | ||||||
|
| |||||||
| 5,496,895 | ||||||||
| Food Products 5.6% | ||||||||
Hershey Co. (The) | 23,536 | 5,365,267 | ||||||
Lamb Weston Holdings, Inc.(a) | 60,047 | 4,783,344 | ||||||
|
| |||||||
| 10,148,611 | ||||||||
| Health Care Equipment & Supplies 2.9% | ||||||||
Abbott Laboratories | 32,007 | 3,483,642 | ||||||
Stryker Corp. | 8,738 | 1,876,485 | ||||||
|
| |||||||
| 5,360,127 | ||||||||
| Health Care Providers & Services 2.0% | ||||||||
UnitedHealth Group, Inc. | 6,714 | 3,641,271 | ||||||
| Hotels, Restaurants & Leisure 1.4% | ||||||||
McDonald’s Corp. | 9,612 | 2,531,512 | ||||||
| Insurance 2.1% | ||||||||
Chubb Ltd. | 8,948 | 1,687,951 | ||||||
Marsh & McLennan Cos., Inc. | 12,879 | 2,111,641 | ||||||
|
| |||||||
| 3,799,592 | ||||||||
| IT Services 3.6% | ||||||||
International Business Machines Corp. | 35,939 | 4,700,462 | ||||||
Mastercard, Inc. (Class A Stock) | 5,458 | 1,930,986 | ||||||
|
| |||||||
| 6,631,448 | ||||||||
| Machinery 1.9% | ||||||||
Deere & Co. | 9,908 | 3,400,227 | ||||||
See Notes to Financial Statements.
| 16 |
| Description | Shares | Value | ||||||
| COMMON STOCKS (Continued) | ||||||||
| Metals & Mining 1.5% | ||||||||
Barrick Gold Corp. (Canada) | 172,813 | $ | 2,720,077 | |||||
| Multiline Retail 1.8% | ||||||||
Dollar General Corp. | 13,252 | 3,292,194 | ||||||
| Multi-Utilities 9.3% | ||||||||
CenterPoint Energy, Inc. | 207,003 | 6,559,925 | ||||||
CMS Energy Corp. | 80,672 | 5,544,586 | ||||||
DTE Energy Co. | 24,132 | 3,144,400 | ||||||
Public Service Enterprise Group, Inc. | 25,083 | 1,647,201 | ||||||
|
| |||||||
| 16,896,112 | ||||||||
| Oil, Gas & Consumable Fuels 9.4% | ||||||||
Cheniere Energy, Inc. | 12,302 | 1,840,133 | ||||||
Enbridge, Inc. (Canada) | 102,437 | 4,602,494 | ||||||
Exxon Mobil Corp. | 26,599 | 2,578,241 | ||||||
Pioneer Natural Resources Co. | 6,661 | 1,578,324 | ||||||
Valero Energy Corp. | 26,850 | 2,974,175 | ||||||
Williams Cos., Inc. (The) | 104,145 | 3,550,303 | ||||||
|
| |||||||
| 17,123,670 | ||||||||
| Pharmaceuticals 10.3% | ||||||||
AstraZeneca PLC (United Kingdom), ADR | 83,169 | 5,508,283 | ||||||
Bristol-Myers Squibb Co. | 81,643 | 6,023,621 | ||||||
Eli Lilly & Co. | 21,774 | 7,178,670 | ||||||
|
| |||||||
| 18,710,574 | ||||||||
| Road & Rail 2.0% | ||||||||
TFI International, Inc. (Canada) | 13,853 | 1,384,330 | ||||||
Union Pacific Corp. | 10,043 | 2,282,774 | ||||||
|
| |||||||
| 3,667,104 | ||||||||
| Semiconductors & Semiconductor Equipment 0.6% | ||||||||
QUALCOMM, Inc. | 7,158 | 1,038,340 | ||||||
| Software 1.0% | ||||||||
Intuit, Inc. | 1,914 | 873,110 | ||||||
Microsoft Corp. | 3,399 | 954,235 | ||||||
|
| |||||||
| 1,827,345 | ||||||||
See Notes to Financial Statements.
PGIM Jennison Rising Dividend Fund | 17 |
Schedule of Investments (continued)
as of July 31, 2022
| Description | Shares | Value | ||||||
| COMMON STOCKS (Continued) | ||||||||
| Technology Hardware, Storage & Peripherals 2.1% | ||||||||
Apple, Inc. | 23,679 | $ | 3,848,074 | |||||
| Wireless Telecommunication Services 1.9% | ||||||||
Rogers Communications, Inc. (Canada) (Class B Stock) | 76,795 | 3,529,498 | ||||||
|
| |||||||
TOTAL LONG-TERM INVESTMENTS | ||||||||
(cost $161,093,381) | 170,787,600 | |||||||
|
| |||||||
SHORT-TERM INVESTMENTS 6.6% | ||||||||
AFFILIATED MUTUAL FUND 0.7% | ||||||||
PGIM Institutional Money Market Fund | ||||||||
(cost $1,309,044; includes $1,308,800 of cash collateral for securities on loan)(b)(wa) | 1,310,355 | 1,309,044 | ||||||
|
| |||||||
UNAFFILIATED FUND 5.9% | ||||||||
Dreyfus Government Cash Management (Institutional Shares) | ||||||||
(cost $10,724,415) | 10,724,415 | 10,724,415 | ||||||
|
| |||||||
TOTAL SHORT-TERM INVESTMENTS | ||||||||
(cost $12,033,459) | 12,033,459 | |||||||
|
| |||||||
TOTAL INVESTMENTS 100.4% | ||||||||
(cost $173,126,840) | 182,821,059 | |||||||
Liabilities in excess of other assets (0.4)% | (709,214 | ) | ||||||
|
| |||||||
NET ASSETS 100.0% | $ | 182,111,845 | ||||||
|
| |||||||
Below is a list of the abbreviation(s) used in the annual report:
ADR—American Depositary Receipt
LIBOR—London Interbank Offered Rate
REITs—Real Estate Investment Trust
| (a) | All or a portion of security is on loan. The aggregate market value of such securities, including those sold and pending settlement, is $1,274,560; cash collateral of $1,308,800 (included in liabilities) was received with which the Fund purchased highly liquid short-term investments. In the event of significant appreciation in value of securities on loan on the last business day of the reporting period, the Fund may reflect a collateral value that is less than the market value of the loaned securities and such shortfall is remedied the following business day. |
| (b) | Represents security, or portion thereof, purchased with cash collateral received for securities on loan and includes dividend reinvestment. |
| (wa) | PGIM Investments LLC, the manager of the Fund, also serves as manager of the PGIM Core Ultra Short Bond Fund and PGIM Institutional Money Market Fund, if applicable. |
See Notes to Financial Statements.
| 18 |
Fair Value Measurements:
Various inputs are used in determining the value of the Fund’s investments. These inputs are summarized in the three broad levels listed below.
Level 1—unadjusted quoted prices generally in active markets for identical securities.
Level 2—quoted prices for similar securities, interest rates and yield curves, prepayment speeds, foreign currency exchange rates and other observable inputs.
Level 3—unobservable inputs for securities valued in accordance with Board approved fair valuation procedures.
The following is a summary of the inputs used as of July 31, 2022 in valuing such portfolio securities:
| Level 1 | Level 2 | Level 3 | ||||||
| Investments in Securities | ||||||||
| Assets | ||||||||
| Long-Term Investments | ||||||||
| Common Stocks | ||||||||
Aerospace & Defense | $ | 5,206,122 | $— | $— | ||||
Banks | 6,464,647 | — | — | |||||
Beverages | 7,647,311 | — | — | |||||
Capital Markets | 1,149,529 | — | — | |||||
Commercial Services & Supplies | 2,625,388 | — | — | |||||
Containers & Packaging | 2,077,119 | — | — | |||||
Diversified Consumer Services | 4,621,062 | — | — | |||||
Diversified Telecommunication Services | 4,875,476 | — | — | |||||
Electric Utilities | 5,954,958 | — | — | |||||
Electronic Equipment, Instruments & Components | 588,711 | — | — | |||||
Entertainment | 4,508,780 | — | — | |||||
Equity Real Estate Investment Trusts (REITs) | 11,405,826 | — | — | |||||
Food & Staples Retailing | 5,496,895 | — | — | |||||
Food Products | 10,148,611 | — | — | |||||
Health Care Equipment & Supplies | 5,360,127 | — | — | |||||
Health Care Providers & Services | 3,641,271 | — | — | |||||
Hotels, Restaurants & Leisure | 2,531,512 | — | — | |||||
Insurance | 3,799,592 | — | — | |||||
IT Services | 6,631,448 | — | — | |||||
Machinery | 3,400,227 | — | — | |||||
Metals & Mining | 2,720,077 | — | — | |||||
Multiline Retail | 3,292,194 | — | — | |||||
Multi-Utilities | 16,896,112 | — | — | |||||
Oil, Gas & Consumable Fuels | 17,123,670 | — | — | |||||
Pharmaceuticals | 18,710,574 | — | — | |||||
Road & Rail | 3,667,104 | — | — | |||||
Semiconductors & Semiconductor Equipment | 1,038,340 | — | — | |||||
Software | 1,827,345 | — | — | |||||
Technology Hardware, Storage & Peripherals | 3,848,074 | — | — | |||||
Wireless Telecommunication Services | 3,529,498 | — | — | |||||
See Notes to Financial Statements.
PGIM Jennison Rising Dividend Fund | 19 |
Schedule of Investments (continued)
as of July 31, 2022
Level 1 | Level 2 | Level 3 | ||||||
| Investments in Securities (continued) | ||||||||
| Assets (continued) | ||||||||
| Short-Term Investments | ||||||||
Affiliated Mutual Fund | $ 1,309,044 | $— | $— | |||||
Unaffiliated Fund | 10,724,415 | — | — | |||||
|
|
| ||||||
Total | $182,821,059 | $— | $— | |||||
|
|
| ||||||
Industry Classification:
The industry classification of investments and liabilities in excess of other assets shown as a percentage of net assets as of July 31, 2022 were as follows:
Pharmaceuticals | 10.3 | % | ||
Oil, Gas & Consumable Fuels | 9.4 | |||
Multi-Utilities | 9.3 | |||
Equity Real Estate Investment Trusts (REITs) | 6.3 | |||
Unaffiliated Fund | 5.9 | |||
Food Products | 5.6 | |||
Beverages | 4.2 | |||
IT Services | 3.6 | |||
Banks | 3.6 | |||
Electric Utilities | 3.3 | |||
Food & Staples Retailing | 3.0 | |||
Health Care Equipment & Supplies | 2.9 | |||
Aerospace & Defense | 2.9 | |||
Diversified Telecommunication Services | 2.7 | |||
Diversified Consumer Services | 2.5 | |||
Entertainment | 2.5 | |||
Technology Hardware, Storage & Peripherals | 2.1 | |||
Insurance | 2.1 | |||
Road & Rail | 2.0 | |||
Health Care Providers & Services | 2.0 |
Wireless Telecommunication Services | 1.9 | % | ||
Machinery | 1.9 | |||
Multiline Retail | 1.8 | |||
Metals & Mining | 1.5 | |||
Commercial Services & Supplies | 1.4 | |||
Hotels, Restaurants & Leisure | 1.4 | |||
Containers & Packaging | 1.1 | |||
Software | 1.0 | |||
Affiliated Mutual Fund (0.7% represents investments purchased with collateral from securities on loan) | 0.7 | |||
Capital Markets | 0.6 | |||
Semiconductors & Semiconductor Equipment | 0.6 | |||
Electronic Equipment, Instruments & Components | 0.3 | |||
|
| |||
| 100.4 | ||||
Liabilities in excess of other assets | (0.4 | ) | ||
|
| |||
| 100.0 | % | |||
|
|
Financial Instruments/Transactions—Summary of Offsetting and Netting Arrangements:
The Fund entered into financial instruments/transactions during the reporting period that are either offset in accordance with current requirements or are subject to enforceable master netting arrangements or similar agreements that permit offsetting. The information about offsetting and related netting arrangements for financial instruments/transactions where the legal right to set-off exists is presented in the summary below.
Offsetting of financial instrument/transaction assets and liabilities:
See Notes to Financial Statements.
| 20 |
Description | Gross Market Value of Recognized Assets/(Liabilities) | Collateral Pledged/(Received)(1) | Net Amount | |||
Securities on Loan | $1,274,560 | $(1,274,560) | $— |
| (1) | Collateral amount disclosed by the Fund is limited to the market value of financial instruments/transactions. |
See Notes to Financial Statements.
PGIM Jennison Rising Dividend Fund | 21 |
Statement of Assets and Liabilities
as of July 31, 2022
Assets | |||||||
Investments at value, including securities on loan of $1,274,560: | |||||||
Unaffiliated investments (cost $171,817,796) | $181,512,015 | ||||||
Affiliated investments (cost $1,309,044) | 1,309,044 | ||||||
Receivable for Fund shares sold | 829,649 | ||||||
Dividends receivable | 173,631 | ||||||
Tax reclaim receivable | 6,029 | ||||||
Prepaid expenses and other assets | 20,616 | ||||||
| |||||||
Total Assets | 183,850,984 | ||||||
| |||||||
Liabilities | |||||||
Payable to broker for collateral for securities on loan | 1,308,800 | ||||||
Payable for Fund shares purchased | 286,853 | ||||||
Accrued expenses and other liabilities | 89,429 | ||||||
Management fee payable | 43,021 | ||||||
Distribution fee payable | 7,614 | ||||||
Affiliated transfer agent fee payable | 2,505 | ||||||
Trustees’ fees payable | 917 | ||||||
| |||||||
Total Liabilities | 1,739,139 | ||||||
| |||||||
Net Assets | $182,111,845 | ||||||
| |||||||
Net assets were comprised of: | |||||||
Shares of beneficial interest, at par | $11,292 | ||||||
Paid-in capital in excess of par | 173,215,920 | ||||||
Total distributable earnings (loss) | 8,884,633 | ||||||
| |||||||
Net assets, July 31, 2022 | $182,111,845 | ||||||
| |||||||
See Notes to Financial Statements.
| 22 |
Class A | ||||||||||
Net asset value, offering price and redemption price per share, | $16.12 | |||||||||
Maximum sales charge (5.50% of offering price) | 0.94 | |||||||||
|
| |||||||||
Maximum offering price to public | $17.06 | |||||||||
|
| |||||||||
Class C | ||||||||||
Net asset value, offering price and redemption price per share, | $15.97 | |||||||||
|
| |||||||||
Class Z | ||||||||||
Net asset value, offering price and redemption price per share, | $16.13 | |||||||||
|
| |||||||||
Class R6 | ||||||||||
Net asset value, offering price and redemption price per share, | $16.12 | |||||||||
|
| |||||||||
Net asset value per share may not recalculate due to rounding.
See Notes to Financial Statements.
| PGIM Jennison Rising Dividend Fund | 23 |
Statement of Operations
Year Ended July 31, 2022
Net Investment Income (Loss) | |||||
Income | |||||
Unaffiliated dividend income (net of $25,069 foreign withholding tax) | $ | 1,307,937 | |||
Income from securities lending, net (including affiliated income of $956) | 1,118 | ||||
Affiliated dividend income | 315 | ||||
|
| ||||
Total income | 1,309,370 | ||||
|
| ||||
Expenses | |||||
Management fee | 498,824 | ||||
Distribution fee(a) | 79,481 | ||||
Transfer agent’s fees and expenses (including affiliated expense of $12,417)(a) | 94,819 | ||||
Registration fees(a) | 62,675 | ||||
Custodian and accounting fees | 48,312 | ||||
Audit fee | 23,800 | ||||
Legal fees and expenses | 20,630 | ||||
Shareholders’ reports | 19,856 | ||||
SEC registration fees | 12,350 | ||||
Trustees’ fees | 10,204 | ||||
Miscellaneous | 20,716 | ||||
|
| ||||
Total expenses | 891,667 | ||||
Less: Fee waiver and/or expense reimbursement(a) | (173,985 | ) | |||
Distribution fee waiver(a) | (8,576 | ) | |||
|
| ||||
Net expenses | 709,106 | ||||
|
| ||||
Net investment income (loss) | 600,264 | ||||
|
| ||||
Realized And Unrealized Gain (Loss) On Investment And Foreign Currency Transactions | |||||
Net realized gain (loss) on: | |||||
Investment transactions (including affiliated of $(172)) | (750,405 | ) | |||
Foreign currency transactions | (670 | ) | |||
|
| ||||
| (751,075 | ) | ||||
|
| ||||
Net change in unrealized appreciation (depreciation) on: | |||||
Investments | 938,079 | ||||
Foreign currencies | (8 | ) | |||
|
| ||||
| 938,071 | |||||
|
| ||||
Net gain (loss) on investment and foreign currency transactions | 186,996 | ||||
|
| ||||
Net Increase (Decrease) In Net Assets Resulting From Operations | $ | 787,260 | |||
|
| ||||
| (a) | Class specific expenses and waivers were as follows: |
| Class A | Class C | Class Z | Class R6 | |||||||||||||
Distribution fee | 51,454 | 28,027 | — | — | ||||||||||||
Transfer agent’s fees and expenses | 21,229 | 4,500 | 69,042 | 48 | ||||||||||||
Registration fees | 19,972 | 11,853 | 24,472 | 6,378 | ||||||||||||
Fee waiver and/or expense reimbursement | (57,878 | ) | (18,885 | ) | (90,778 | ) | (6,444 | ) | ||||||||
Distribution fee waiver | (8,576 | ) | — | — | — | |||||||||||
See Notes to Financial Statements.
| 24 |
Statements of Changes in Net Assets
| Year Ended July 31, | ||||||||
| ||||||||
| 2022 | 2021 | |||||||
Increase (Decrease) in Net Assets | ||||||||
Operations | ||||||||
Net investment income (loss) | $ 600,264 | $ | 144,617 | |||||
Net realized gain (loss) on investment and foreign currency transactions | (751,075) | 4,088,846 | ||||||
Net change in unrealized appreciation (depreciation) on investments and foreign currencies | 938,071 | 3,182,613 | ||||||
|
|
| ||||||
Net increase (decrease) in net assets resulting from operations | 787,260 | 7,416,076 | ||||||
|
|
| ||||||
Dividends and Distributions |
| |||||||
Distributions from distributable earnings | ||||||||
Class A | (1,281,153) | (370,608 | ) | |||||
Class C | (176,578) | (63,821 | ) | |||||
Class Z | (1,557,517) | (523,131 | ) | |||||
Class R6 | (1,457) | (635 | ) | |||||
|
|
| ||||||
| (3,016,705) | (958,195 | ) | ||||||
|
|
| ||||||
Fund share transactions (Net of share conversions) | ||||||||
Net proceeds from shares sold | 170,973,991 | 10,305,817 | ||||||
Net asset value of shares issued in reinvestment of dividends and distributions | 3,009,232 | 955,139 | ||||||
Cost of shares purchased | (21,182,936) | (13,785,458 | ) | |||||
|
|
| ||||||
Net increase (decrease) in net assets from Fund share transactions | 152,800,287 | (2,524,502 | ) | |||||
|
|
| ||||||
Total increase (decrease) | 150,570,842 | 3,933,379 | ||||||
Net Assets: | ||||||||
Beginning of year | 31,541,003 | 27,607,624 | ||||||
|
|
| ||||||
End of year | $182,111,845 | $ | 31,541,003 | |||||
|
|
| ||||||
See Notes to Financial Statements.
| PGIM Jennison Rising Dividend Fund | 25 |
Financial Highlights
| Class A Shares | ||||||||||||||||||||
| Year Ended July 31, | ||||||||||||||||||||
| 2022 | 2021 | 2020 | 2019 | 2018 | ||||||||||||||||
| Per Share Operating Performance(a): | ||||||||||||||||||||
| Net Asset Value, Beginning of Year | $18.00 | $13.86 | $13.54 | $13.80 | $12.50 | |||||||||||||||
| Income (loss) from investment operations: | ||||||||||||||||||||
| Net investment income (loss) | 0.12 | 0.07 | 0.11 | 0.13 | 0.09 | |||||||||||||||
| Net realized and unrealized gain (loss) on investment transactions | (0.53 | )(b) | 4.72 | 0.73 | 0.75 | 1.39 | ||||||||||||||
| Total from investment operations | (0.41 | ) | 4.79 | 0.84 | 0.88 | 1.48 | ||||||||||||||
| Less Dividends and Distributions: | ||||||||||||||||||||
| Dividends from net investment income | (0.11 | ) | (0.07 | ) | (0.08 | ) | (0.13 | ) | (0.09 | ) | ||||||||||
| Distributions from net realized gains | (1.36 | ) | (0.58 | ) | (0.44 | ) | (1.01 | ) | (0.09 | ) | ||||||||||
| Total dividends and distributions | (1.47 | ) | (0.65 | ) | (0.52 | ) | (1.14 | ) | (0.18 | ) | ||||||||||
| Net asset value, end of year | $16.12 | $18.00 | $13.86 | $13.54 | $13.80 | |||||||||||||||
| Total Return(c): | (2.69 | )% | 35.44 | % | 6.24 | % | 8.27 | % | 11.95 | % | ||||||||||
| Ratios/Supplemental Data: | ||||||||||||||||||||
| Net assets, end of year (000) | $22,003 | $13,908 | $7,269 | $5,391 | $4,459 | |||||||||||||||
| Average net assets (000) | $17,151 | $10,058 | $6,608 | $4,729 | $4,078 | |||||||||||||||
| Ratios to average net assets(d): | ||||||||||||||||||||
| Expenses after waivers and/or expense reimbursement | 1.24 | % | 1.24 | % | 1.24 | % | 1.24 | % | 1.24 | % | ||||||||||
| Expenses before waivers and/or expense reimbursement | 1.63 | % | 1.87 | % | 2.22 | % | 2.60 | % | 2.55 | % | ||||||||||
| Net investment income (loss) | 0.71 | % | 0.46 | % | 0.85 | % | 0.98 | % | 0.67 | % | ||||||||||
| Portfolio turnover rate(e) | 99 | % | 86 | % | 106 | % | 100 | % | 104 | % | ||||||||||
| (a) | Calculated based on average shares outstanding during the year. |
| (b) | The per share amount of realized and unrealized gain (loss) on investments does not directly correlate to the amounts reported in the Statement of Operations due to the timing of portfolio share transactions in relation to fluctuating market values. |
| (c) | Total return does not consider the effects of sales loads. Total return is calculated assuming a purchase of a share on the first day and a sale on the last day of each year reported and includes reinvestment of dividends and distributions, if any. Total returns may reflect adjustments to conform to GAAP. |
| (d) | Does not include expenses of the underlying funds in which the Fund invests. |
| (e) | The Fund’s portfolio turnover rate is calculated in accordance with regulatory requirements, without regard to transactions involving short-term investments, certain derivatives and in-kind transactions (if any). If such transactions were included, the Fund’s portfolio turnover rate may be higher. |
See Notes to Financial Statements.
| 26 |
| Class C Shares | ||||||||||||||||||||
| Year Ended July 31, | ||||||||||||||||||||
| 2022 | 2021 | 2020 | 2019 | 2018 | ||||||||||||||||
| Per Share Operating Performance(a): | ||||||||||||||||||||
| Net Asset Value, Beginning of Year | $17.88 | $13.81 | $13.51 | $13.80 | $12.50 | |||||||||||||||
| Income (loss) from investment operations: | ||||||||||||||||||||
| Net investment income (loss) | (0.01 | )(b) | (0.04 | )(b) | 0.02 | 0.04 | (0.01 | ) | ||||||||||||
| Net realized and unrealized gain (loss) on investment transactions | (0.53 | )(c) | 4.69 | 0.72 | 0.73 | 1.40 | ||||||||||||||
| Total from investment operations | (0.54 | ) | 4.65 | 0.74 | 0.77 | 1.39 | ||||||||||||||
| Less Dividends and Distributions: | ||||||||||||||||||||
| Dividends from net investment income | (0.01 | ) | (- | )(d) | (- | )(d) | (0.05 | ) | (- | )(d) | ||||||||||
| Distributions from net realized gains | (1.36 | ) | (0.58 | ) | (0.44 | ) | (1.01 | ) | (0.09 | ) | ||||||||||
| Total dividends and distributions | (1.37 | ) | (0.58 | ) | (0.44 | ) | (1.06 | ) | (0.09 | ) | ||||||||||
| Net asset value, end of year | $15.97 | $17.88 | $13.81 | $13.51 | $13.80 | |||||||||||||||
| Total Return(e): | (3.46 | )% | 34.45 | % | 5.45 | % | 7.40 | % | 11.18 | % | ||||||||||
| Ratios/Supplemental Data: | ||||||||||||||||||||
| Net assets, end of year (000) | $4,001 | $2,252 | $1,498 | $1,852 | $1,831 | |||||||||||||||
| Average net assets (000) | $2,803 | $1,735 | $1,711 | $1,865 | $1,703 | |||||||||||||||
| Ratios to average net assets(f): | ||||||||||||||||||||
| Expenses after waivers and/or expense reimbursement | 1.99 | % | 1.99 | % | 1.99 | % | 1.99 | % | 1.99 | % | ||||||||||
| Expenses before waivers and/or expense reimbursement | 2.66 | % | 2.97 | % | 3.55 | % | 3.64 | % | 3.65 | % | ||||||||||
| Net investment income (loss) | (0.05 | )% | (0.27 | )% | 0.13 | % | 0.28 | % | (0.07 | )% | ||||||||||
| Portfolio turnover rate(g) | 99 | % | 86 | % | 106 | % | 100 | % | 104 | % | ||||||||||
| (a) | Calculated based on average shares outstanding during the year. |
| (b) | The per share amount of net investment income (loss) does not directly correlate to the amounts reported in the Statement of Operations due to class specific expenses. |
| (c) | The per share amount of realized and unrealized gain (loss) on investments does not directly correlate to the amounts reported in the Statement of Operations due to the timing of portfolio share transactions in relation to fluctuating market values. |
| (d) | Amount rounds to zero. |
| (e) | Total return does not consider the effects of sales loads. Total return is calculated assuming a purchase of a share on the first day and a sale on the last day of each year reported and includes reinvestment of dividends and distributions, if any. Total returns may reflect adjustments to conform to GAAP. |
| (f) | Does not include expenses of the underlying funds in which the Fund invests. |
| (g) | The Fund’s portfolio turnover rate is calculated in accordance with regulatory requirements, without regard to transactions involving short-term investments, certain derivatives and in-kind transactions (if any). If such transactions were included, the Fund’s portfolio turnover rate may be higher. |
See Notes to Financial Statements.
| PGIM Jennison Rising Dividend Fund | 27 |
Financial Highlights (continued)
| Class Z Shares | ||||||||||||||||||||
| Year Ended July 31, | ||||||||||||||||||||
| 2022 | 2021 | 2020 | 2019 | 2018 | ||||||||||||||||
| Per Share Operating Performance(a): | ||||||||||||||||||||
| Net Asset Value, Beginning of Year | $18.01 | $13.87 | $13.56 | $13.82 | $12.52 | |||||||||||||||
| Income (loss) from investment operations: | ||||||||||||||||||||
| Net investment income (loss) | 0.18 | 0.12 | 0.14 | 0.16 | 0.12 | |||||||||||||||
| Net realized and unrealized gain (loss) on investment transactions | (0.55 | )(b) | 4.71 | 0.72 | 0.75 | 1.40 | ||||||||||||||
| Total from investment operations | (0.37 | ) | 4.83 | 0.86 | 0.91 | 1.52 | ||||||||||||||
| Less Dividends and Distributions: | ||||||||||||||||||||
| Dividends from net investment income | (0.15 | ) | (0.11 | ) | (0.11 | ) | (0.16 | ) | (0.13 | ) | ||||||||||
| Distributions from net realized gains | (1.36 | ) | (0.58 | ) | (0.44 | ) | (1.01 | ) | (0.09 | ) | ||||||||||
| Total dividends and distributions | (1.51 | ) | (0.69 | ) | (0.55 | ) | (1.17 | ) | (0.22 | ) | ||||||||||
| Net asset value, end of year | $16.13 | $18.01 | $13.87 | $13.56 | $13.82 | |||||||||||||||
| Total Return(c): | (2.46) | % | 35.74 | % | 6.46 | % | 8.54 | % | 12.21 | % | ||||||||||
| Ratios/Supplemental Data: | ||||||||||||||||||||
| Net assets, end of year (000) | $156,090 | $15,364 | $18,828 | $9,122 | $8,369 | |||||||||||||||
| Average net assets (000) | $44,393 | $13,377 | $12,973 | $8,216 | $8,066 | |||||||||||||||
| Ratios to average net assets(d): | ||||||||||||||||||||
| Expenses after waivers and/or expense reimbursement | 0.99 | % | 0.99 | % | 0.99 | % | 0.99 | % | 0.99 | % | ||||||||||
| Expenses before waivers and/or expense reimbursement | 1.19 | % | 1.58 | % | 1.70 | % | 2.02 | % | 1.98 | % | ||||||||||
| Net investment income (loss) | 1.08 | % | 0.77 | % | 1.06 | % | 1.25 | % | 0.94 | % | ||||||||||
| Portfolio turnover rate(e) | 99 | % | 86 | % | 106 | % | 100 | % | 104 | % | ||||||||||
| (a) | Calculated based on average shares outstanding during the year. |
| (b) | The per share amount of realized and unrealized gain (loss) on investments does not directly correlate to the amounts reported in the Statement of Operations due to the timing of portfolio share transactions in relation to fluctuating market values. |
| (c) | Total return is calculated assuming a purchase of a share on the first day and a sale on the last day of each year reported and includes reinvestment of dividends and distributions, if any. Total returns may reflect adjustments to conform to GAAP. |
| (d) | Does not include expenses of the underlying funds in which the Fund invests. |
| (e) | The Fund’s portfolio turnover rate is calculated in accordance with regulatory requirements, without regard to transactions involving short-term investments, certain derivatives and in-kind transactions (if any). If such transactions were included, the Fund’s portfolio turnover rate may be higher. |
See Notes to Financial Statements.
| 28 |
| Class R6 Shares | |||||||||||||||||||||||||||||||||||
| Year Ended July 31, | September 27, 2017(a) through July 31, 2018 |
| |||||||||||||||||||||||||||||||||
| 2022 | 2021 | 2020 | 2019 | ||||||||||||||||||||||||||||||||
| Per Share Operating Performance(b): | |||||||||||||||||||||||||||||||||||
| Net Asset Value, Beginning of Period | $18.01 | $13.87 | $13.55 | $13.81 | $12.72 | ||||||||||||||||||||||||||||||
| Income (loss) from investment operations: | |||||||||||||||||||||||||||||||||||
| Net investment income (loss) | 0.17 | 0.12 | 0.15 | 0.16 | 0.10 | ||||||||||||||||||||||||||||||
| Net realized and unrealized gain (loss) on investment transactions | (0.55 | )(c) | 4.71 | 0.72 | 0.75 | 1.18 | |||||||||||||||||||||||||||||
| Total from investment operations | (0.38 | ) | 4.83 | 0.87 | 0.91 | 1.28 | |||||||||||||||||||||||||||||
| Less Dividends and Distributions: | |||||||||||||||||||||||||||||||||||
| Dividends from net investment income | (0.15 | ) | (0.11 | ) | (0.11 | ) | (0.16 | ) | (0.10 | ) | |||||||||||||||||||||||||
| Distributions from net realized gains | (1.36 | ) | (0.58 | ) | (0.44 | ) | (1.01 | ) | (0.09 | ) | |||||||||||||||||||||||||
| Total dividends and distributions | (1.51 | ) | (0.69 | ) | (0.55 | ) | (1.17 | ) | (0.19 | ) | |||||||||||||||||||||||||
| Net asset value, end of period | $16.12 | $18.01 | $13.87 | $13.55 | $13.81 | ||||||||||||||||||||||||||||||
| Total Return(d): | (2.49) | % | 35.74 | % | 6.54 | % | 8.55 | % | 10.10 | % | |||||||||||||||||||||||||
| Ratios/Supplemental Data: | |||||||||||||||||||||||||||||||||||
| Net assets, end of period (000) | $17 | $17 | $13 | $12 | $11 | ||||||||||||||||||||||||||||||
| Average net assets (000) | $17 | $15 | $12 | $11 | $11 | ||||||||||||||||||||||||||||||
| Ratios to average net assets(e): | |||||||||||||||||||||||||||||||||||
| Expenses after waivers and/or expense reimbursement | 0.99 | % | 0.99 | % | 0.99 | % | 0.99 | % | 0.99 | %(f) | |||||||||||||||||||||||||
| Expenses before waivers and/or expense reimbursement | 37.99 | % | 48.96 | % | 123.09 | % | 119.91 | % | 307.60 | %(f) | |||||||||||||||||||||||||
| Net investment income (loss) | 0.97 | % | 0.73 | % | 1.10 | % | 1.25 | % | 0.88 | %(f) | |||||||||||||||||||||||||
| Portfolio turnover rate(g) | 99 | % | 86 | % | 106 | % | 100 | % | 104 | % | |||||||||||||||||||||||||
| (a) | Commencement of offering. |
| (b) | Calculated based on average shares outstanding during the period. |
| (c) | The per share amount of realized and unrealized gain (loss) on investments does not directly correlate to the amounts reported in the Statement of Operations due to the timing of portfolio share transactions in relation to fluctuating market values. |
| (d) | Total return is calculated assuming a purchase of a share on the first day and a sale on the last day of each period reported and includes reinvestment of dividends and distributions, if any. Total returns may reflect adjustments to conform to GAAP. Total returns for periods less than one full year are not annualized. |
| (e) | Does not include expenses of the underlying funds in which the Fund invests. |
| (f) | Annualized. |
| (g) | The Fund’s portfolio turnover rate is calculated in accordance with regulatory requirements, without regard to transactions involving short-term investments, certain derivatives and in-kind transactions (if any). If such transactions were included, the Fund’s portfolio turnover rate may be higher. |
See Notes to Financial Statements.
PGIM Jennison Rising Dividend Fund | 29 |
Notes to Financial Statements
1. Organization
Prudential Investment Portfolios 5 (the “Registered Investment Company” or “RIC”) is registered under the Investment Company Act of 1940, as amended (“1940 Act”), as an open-end management investment company. The RIC is organized as a Delaware Statutory Trust. These financial statements relate only to the PGIM Jennison Rising Dividend Fund (the “Fund”), a series of the RIC. The Fund is classified as a diversified fund for purposes of the 1940 Act.
The investment objective of the Fund is to seek capital appreciation and income.
2. Accounting Policies
The Fund follows the investment company accounting and reporting guidance of the Financial Accounting Standards Board (“FASB”) Accounting Standard Codification (“ASC”) Topic 946 Financial Services — Investment Companies. The following is a summary of significant accounting policies followed by the Fund in the preparation of its financial statements. The policies conform to U.S. generally accepted accounting principles (“GAAP”). The Fund consistently follows such policies in the preparation of its financial statements.
Securities Valuation: The Fund holds securities and other assets and liabilities that are fair valued as of the close of each day (generally, 4:00 PM Eastern time) the New York Stock Exchange (“NYSE”) is open for trading. As described in further detail below, the Fund’s investments are valued daily based on a number of factors, including the type of investment and whether market quotations are readily available. The RIC’s Board of Trustees (the “Board”) has adopted valuation procedures for security valuation under which fair valuation responsibilities have been delegated to PGIM Investments LLC (“PGIM Investments” or the “Manager”). Pursuant to the Board’s delegation, the Manager has established a Valuation Committee responsible for supervising the fair valuation of portfolio securities and other assets and liabilities. The valuation procedures permit the Fund to utilize independent pricing vendor services, quotations from market makers, and alternative valuation methods when market quotations are either not readily available or not deemed representative of fair value. Fair value is the price that would be received to sell an asset or paid to transfer a liability in an orderly transaction between market participants on the measurement date. A record of the Valuation Committee’s actions is subject to the Board’s review at its first quarterly meeting following the quarter in which such actions take place.
For the fiscal reporting year-end, securities and other assets and liabilities were fair valued at the close of the last U.S. business day. Trading in certain foreign securities may occur when the NYSE is closed (including weekends and holidays). Because such foreign securities
| 30 |
trade in markets that are open on weekends and U.S. holidays, the values of some of the Fund’s foreign investments may change on days when investors cannot purchase or redeem Fund shares.
Various inputs determine how the Fund’s investments are valued, all of which are categorized according to the three broad levels (Level 1, 2, or 3) detailed in the Schedule of Investments and referred to herein as the “fair value hierarchy” in accordance with FASB ASC Topic 820 - Fair Value Measurement.
Common or preferred stocks, exchange-traded funds and derivative instruments, if applicable, that are traded on a national securities exchange are valued at the last sale price as of the close of trading on the applicable exchange where the security principally trades. Securities traded via NASDAQ are valued at the NASDAQ official closing price. To the extent these securities are valued at the last sale price or NASDAQ official closing price, they are classified as Level 1 in the fair value hierarchy. In the event that no sale or official closing price on valuation date exists, these securities are generally valued at the mean between the last reported bid and ask prices, or at the last bid price in the absence of an ask price. These securities are classified as Level 2 in the fair value hierarchy.
Investments in open-end funds (other than exchange-traded funds) are valued at their net asset values as of the close of the NYSE on the date of valuation. These securities are classified as Level 1 in the fair value hierarchy since they may be purchased or sold at their net asset values on the date of valuation.
Securities and other assets that cannot be priced according to the methods described above are valued based on pricing methodologies approved by the Board. In the event that unobservable inputs are used when determining such valuations, the securities will be classified as Level 3 in the fair value hierarchy. Altering one or more unobservable inputs may result in a significant change to a Level 3 security’s fair value measurement.
When determining the fair value of securities, some of the factors influencing the valuation include: the nature of any restrictions on disposition of the securities; assessment of the general liquidity of the securities; the issuer’s financial condition and the markets in which it does business; the cost of the investment; the size of the holding and the capitalization of the issuer; the prices of any recent transactions or bids/offers for such securities or any comparable securities; any available analyst media or other reports or information deemed reliable by the Manager regarding the issuer or the markets or industry in which it operates. Using fair value to price securities may result in a value that is different from a security’s most recent closing price and from the price used by other unaffiliated mutual funds to calculate their net asset values.
Foreign Currency Translation: The books and records of the Fund are maintained in U.S. dollars. Foreign currency amounts are translated into U.S. dollars on the following basis:
PGIM Jennison Rising Dividend Fund | 31 |
Notes to Financial Statements (continued)
(i) market value of investment securities, other assets and liabilities — at the exchange rate as of the valuation date;
(ii) purchases and sales of investment securities, income and expenses — at the rates of exchange prevailing on the respective dates of such transactions.
Although the net assets of the Fund are presented at the foreign exchange rates and market values at the close of the period, the Fund does not generally isolate that portion of the results of operations arising as a result of changes in the foreign exchange rates from the fluctuations arising from changes in the market prices of long-term portfolio securities held at the end of the period. Similarly, the Fund does not isolate the effect of changes in foreign exchange rates from the fluctuations arising from changes in the market prices of long-term portfolio securities sold during the period. Accordingly, holding period unrealized and realized foreign currency gains (losses) are included in the reported net change in unrealized appreciation (depreciation) on investments and net realized gains (losses) on investment transactions on the Statements of Operations.
Net realized gains (losses) on foreign currency transactions represent net foreign exchange gains (losses) from the disposition of holdings of foreign currencies, currency gains (losses) realized between the trade and settlement dates on investment transactions, and the difference between the amounts of interest, dividends and foreign withholding taxes recorded on the Fund’s books and the U.S. dollar equivalent amounts actually received or paid. Net unrealized currency gains (losses) arise from valuing foreign currency denominated assets and liabilities (other than investments) at period end exchange rates.
Master Netting Arrangements: The RIC, on behalf of the Fund, is subject to various Master Agreements, or netting arrangements, with select counterparties. These are agreements which a subadviser may have negotiated and entered into on behalf of all or a portion of the Fund. A master netting arrangement between the Fund and the counterparty permits the Fund to offset amounts payable by the Fund to the same counterparty against amounts to be received; and by the receipt of collateral from the counterparty by the Fund to cover the Fund’s exposure to the counterparty. However, there is no assurance that such mitigating factors are easily enforceable. In addition to master netting arrangements, the right to set-off exists when all the conditions are met such that each of the parties owes the other determinable amounts, the reporting party has the right to set-off the amount owed with the amount owed by the other party, the reporting party intends to set-off and the right of set-off is enforceable by law.
Securities Lending: The Fund lends its portfolio securities to banks and broker-dealers. The loans are secured by collateral at least equal to the market value of the securities loaned. Collateral pledged by each borrower is invested in an affiliated money market fund and is
| 32 |
marked to market daily, based on the previous day’s market value, such that the value of the collateral exceeds the value of the loaned securities. In the event of significant appreciation in value of securities on loan on the last business day of the reporting period, the financial statements may reflect a collateral value that is less than the market value of the loaned securities. Such shortfall is remedied as described above. Loans are subject to termination at the option of the borrower or the Fund. Upon termination of the loan, the borrower will return to the Fund securities identical to the loaned securities. The remaining open loans of the securities lending transactions are considered overnight and continuous. Should the borrower of the securities fail financially, the Fund has the right to repurchase the securities in the open market using the collateral.
The Fund recognizes income, net of any rebate and securities lending agent fees, for lending its securities in the form of fees or interest on the investment of any cash received as collateral. The borrower receives all interest and dividends from the securities loaned and such payments are passed back to the lender in amounts equivalent thereto, which are reflected in interest income or unaffiliated dividend income based on the nature of the payment on the Statement of Operations. The Fund also continues to recognize any unrealized gain (loss) in the market price of the securities loaned and on the change in the value of the collateral invested that may occur during the term of the loan. In addition, realized gain (loss) is recognized on changes in the value of the collateral invested upon liquidation of the collateral. Net earnings from securities lending are disclosed in the Statement of Operations.
Equity and Mortgage Real Estate Investment Trusts (collectively REITs): The Fund invested in REITs, which report information on the source of their distributions annually. Based on current and historical information, a portion of distributions received from REITs during the period is estimated to be dividend income, capital gain or return of capital and recorded accordingly. When material, these estimates are adjusted periodically when the actual source of distributions is disclosed by the REITs.
Securities Transactions and Net Investment Income: Securities transactions are recorded on the trade date. Realized gains (losses) from investment and currency transactions are calculated on the specific identification method. Dividend income is recorded on the ex-date, or for certain foreign securities, when the Fund becomes aware of such dividends. Expenses are recorded on an accrual basis, which may require the use of certain estimates by management that may differ from actual. Net investment income or loss (other than class specific expenses and waivers, which are allocated as noted below) and unrealized and realized gains (losses) are allocated daily to each class of shares based upon the relative proportion of adjusted net assets of each class at the beginning of the day. Class specific expenses and waivers, where applicable, are charged to the respective share classes. Such class specific expenses and waivers include distribution fees and distribution fee waivers, shareholder servicing fees, transfer agent’s fees and expenses, registration fees and fee waivers and/or expense reimbursements, as applicable.
PGIM Jennison Rising Dividend Fund | 33 |
Notes to Financial Statements (continued)
Taxes: It is the Fund’s policy to continue to meet the requirements of the Internal Revenue Code applicable to regulated investment companies and to distribute all of its taxable net investment income and capital gains, if any, to its shareholders. Therefore, no federal income tax provision is required. Withholding taxes on foreign dividends, interest and capital gains, if any, are recorded, net of reclaimable amounts, at the time the related income is earned.
Dividends and Distributions: Dividends and distributions to shareholders, which are determined in accordance with federal income tax regulations and which may differ from GAAP, are recorded on the ex-date. Permanent book/tax differences relating to income and gain (loss) are reclassified between total distributable earnings (loss) and paid-in capital in excess of par, as appropriate. The chart below sets forth the expected frequency of dividend and capital gains distributions to shareholders. Various factors may impact the frequency of dividend distributions to shareholders, including but not limited to adverse market conditions or portfolio holding-specific events.
| Expected Distribution Schedule to Shareholders* | Frequency | |
| Net Investment Income | Quarterly | |
| Short-Term Capital Gains | Annually | |
| Long-Term Capital Gains | Annually | |
| * | Under certain circumstances, the Fund may make more than one distribution of short-term and/or long-term capital gains during a fiscal year. |
Estimates: The preparation of financial statements requires management to make estimates and assumptions that affect the reported amounts and disclosures in the financial statements. Actual results could differ from those estimates.
3. Agreements
The RIC, on behalf of the Fund, has a management agreement with the Manager. Pursuant to this agreement, the Manager has responsibility for all investment advisory services and supervises the subadviser’s performance of such services.
The Manager has entered into a subadvisory agreement with Jennison Associates LLC (“Jennison” or the “subadviser”). The Manager pays for the services of Jennison.
| 34 |
Fees payable under the management agreement are computed daily and paid monthly. For the reporting period ended July 31, 2022, the contractual and effective management fee rates were as follows:
| Contractual Management Rate | Effective Management Fee, before any waivers and/or expense reimbursements | |
0.775% of average daily net assets up to $1 billion; | 0.775% | |
0.755% of average daily net assets from $1 billion to $3 billion; | ||
0.735% of average daily net assets from $3 billion to $5 billion; | ||
0.715% of average daily net assets from $5 billion to $10 billion; | ||
0.705% of average daily net assets over $10 billion | ||
The Manager has contractually agreed, through November 30, 2023, to limit total annual operating expenses after fee waivers and/or expense reimbursements. This contractual waiver excludes interest, brokerage, taxes (such as income and foreign withholding taxes, stamp duty and deferred tax expenses), acquired fund fees and expenses, extraordinary expenses, and certain other Fund expenses such as dividend and interest expense and broker charges on short sales.
Where applicable, the Manager agrees to waive management fees or shared operating expenses on any share class to the same extent that it waives such expenses on any other share class. In addition, total annual operating expenses for Class R6 shares will not exceed total annual operating expenses for Class Z shares. Fees and/or expenses waived and/or reimbursed by the Manager may be recouped by the Manager within the same fiscal year during which such waiver and/or reimbursement is made if such recoupment can be realized without exceeding the expense limit in effect at the time of the recoupment for that fiscal year. The expense limitations attributable to each class are as follows:
| Class | Expense Limitations | ||||
| A | 1.24% | ||||
| C | 1.99 | ||||
| Z | 0.99 | ||||
| R6 | 0.99 | ||||
The RIC, on behalf of the Fund has a distribution agreement with Prudential Investment Management Services LLC (“PIMS”), which acts as the distributor of the Class A, Class C, Class Z and Class R6 shares of the Fund. The Fund compensates PIMS for distributing and servicing the Fund’s Class A and Class C shares, pursuant to the plans of distribution (the “Distribution Plans”), regardless of expenses actually incurred by PIMS.
Pursuant to the Distribution Plans, the Fund compensates PIMS for distribution related activities at an annual rate based on average daily net assets per class. PIMS has contractually agreed through November 30, 2023 to limit such fees on certain classes based on the daily net assets. The distribution fees are accrued daily and payable monthly.
PGIM Jennison Rising Dividend Fund | 35 |
Notes to Financial Statements (continued)
The Fund’s annual gross and net distribution rate, where applicable, are as follows:
| Class | Gross Distribution Fee | Net Distribution Fee | ||||||||||||||||||
| A | 0.30 | % | 0.25 | % | ||||||||||||||||
| C | 1.00 | 1.00 | ||||||||||||||||||
| Z | N/A | N/A | ||||||||||||||||||
| R6 | N/A | N/A | ||||||||||||||||||
For the year ended July 31, 2022, PIMS received front-end sales charges (“FESL”) resulting from sales of certain class shares and contingent deferred sales charges (“CDSC”) imposed upon redemptions by certain shareholders. From these fees, PIMS paid such sales charges to broker-dealers, who in turn paid commissions to salespersons and incurred other distribution costs. The sales charges are as follows where applicable:
| Class | FESL | CDSC | ||||||
| A | $ | 73,197 | $ | 653 | ||||
| C | — | 858 | ||||||
PGIM Investments, PIMS and Jennison are indirect, wholly-owned subsidiaries of Prudential Financial, Inc. (“Prudential”).
4. Other Transactions with Affiliates
Prudential Mutual Fund Services LLC (“PMFS”), an affiliate of PGIM Investments and an indirect, wholly-owned subsidiary of Prudential, serves as the Fund’s transfer agent. Transfer agent’s fees and expenses in the Statement of Operations include certain out-of-pocket expenses paid to non-affiliates, where applicable.
The Fund may invest its overnight sweep cash in the PGIM Core Ultra Short Bond Fund (the “Core Fund”), and its securities lending cash collateral in the PGIM Institutional Money Market Fund (the “Money Market Fund”), each a fund of Prudential Investment Portfolios 2, registered under the 1940 Act and managed by PGIM Investments. PGIM Investments and/or its affiliates are paid fees or reimbursed for providing their services to the Core Fund and the Money Market Fund. In addition to the realized and unrealized gains on investments in the Core Fund and Money Market Fund, earnings from such investments are disclosed on the Statement of Operations as “Affiliated dividend income” and “Income from securities lending, net”, respectively. Effective January 2022, the Fund changed its overnight cash sweep vehicle from the Core Fund to an unaffiliated money market fund.
The Fund may enter into certain securities purchase or sale transactions under Board approved Rule 17a-7 procedures. Rule 17a-7 is an exemptive rule under the 1940 Act, that subject to certain conditions, permits purchase and sale transactions among affiliated
| 36 |
investment companies, or between an investment company and a person that is affiliated solely by reason of having a common (or affiliated) investment adviser, common directors/trustees, and/or common officers. For the year ended July 31, 2022, no 17a-7 transactions were entered into by the Fund.
5. Portfolio Securities
The aggregate cost of purchases and proceeds from sales of portfolio securities (excluding short-term investments and U.S. Government securities) for the reporting period ended July 31, 2022, were as follows:
| Cost of Purchases | Proceeds from Sales | |
$202,869,008 | $63,544,022 | |
A summary of the cost of purchases and proceeds from sales of shares of affiliated mutual funds for the year ended July 31, 2022, is presented as follows:
| Value, Beginning of Year | Cost of Purchases | Proceeds from Sales | Change in Unrealized Gain (Loss) | Realized Gain (Loss) | Value, End of Year | Shares, End of Year | Income | |||||||||||||||||||||
| Short-Term Investments - Affiliated Mutual Funds: |
| |||||||||||||||||||||||||||
| PGIM Core Ultra Short Bond Fund(1)(wa) |
| |||||||||||||||||||||||||||
$ 535,742 | $ 6,301,693 | $6,837,435 | $— | $ — | $ — | — | $ 315 | |||||||||||||||||||||
| PGIM Institutional Money Market Fund(1)(b)(wa) |
| |||||||||||||||||||||||||||
569,203 | 26,778,116 | 26,038,103 | — | (172) | 1,309,044 | 1,310,355 | 956 | (2) | ||||||||||||||||||||
$1,104,945 | $33,079,809 | $32,875,538 | $— | $(172) | $1,309,044 | $1,271 | ||||||||||||||||||||||
| (1) | The Fund did not have any capital gain distributions during the reporting period. |
| (2) | The amount, or a portion thereof, represents the affiliated securities lending income shown on the Statement of Operations. |
| (b) | Represents security, or portion thereof, purchased with cash collateral received for securities on loan and includes dividend reinvestment. |
| (wa) | PGIM Investments LLC, the manager of the Fund, also serves as manager of the PGIM Core Ultra Short Bond Fund and PGIM Institutional Money Market Fund, if applicable. |
6. Distributions and Tax Information
Distributions to shareholders, which are determined in accordance with federal income tax regulations and which may differ from GAAP, are recorded on the ex-date.
For the year ended July 31, 2022, the tax character of dividends paid by the Fund were $1,854,564 of ordinary income and $1,162,141 of long-term capital gains. For the year ended July 31, 2021, the tax character of dividends paid by the Fund were $179,840 of ordinary income $778,355 of long-term capital gains.
As of July 31, 2022, the accumulated undistributed earnings on a tax basis was $192,573 of ordinary income.
PGIM Jennison Rising Dividend Fund | 37 |
Notes to Financial Statements (continued)
The United States federal income tax basis of the Fund’s investments and the net unrealized appreciation as of July 31, 2022 were as follows:
| Tax Basis | Gross Unrealized Appreciation | Gross Unrealized Depreciation | Net Unrealized Appreciation | |||
| $174,128,203 | $12,060,172 | $(3,367,316) | $8,692,856 | |||
The difference between GAAP and tax basis was primarily attributable to deferred losses on wash sales.
The Fund elected to treat post-October capital losses of approximately $1,000 as having been incurred in the following fiscal year (July 31, 2023).
The Manager has analyzed the Fund’s tax positions taken on federal, state and local income tax returns for all open tax years and has concluded that no provision for income tax is required in the Fund’s financial statements for the current reporting period. Since tax authorities can examine previously filed tax returns, the Fund’s U.S. federal and state tax returns for each of the four fiscal years up to the most recent fiscal year ended July 31, 2022 are subject to such review.
7. Capital and Ownership
The Fund offers Class A, Class C, Class Z and Class R6 shares. Class A shares are sold with a maximum front-end sales charge of 5.50%. Investors who purchase $1 million or more of Class A shares and sell these shares within 12 months of purchase are subject to a contingent deferred sales charge (“CDSC”) of 1%, although they are not subject to an initial sales charge. The Class A CDSC is waived for certain retirement and/or benefit plans. A special exchange privilege is also available for shareholders who qualified to purchase Class A shares at net asset value. Class C shares are sold with a CDSC of 1% on sales made within 12 months of purchase. Class C shares will automatically convert to Class A shares on a monthly basis approximately eight years (ten years prior to January 22, 2021) after purchase. Class Z and Class R6 shares are not subject to any sales or redemption charges and are available exclusively for sale to a limited group of investors.
Under certain circumstances, an exchange may be made from specified share classes of the Fund to one or more other share classes of the Fund as presented in the table of transactions in shares of beneficial interest, below.
The RIC has authorized an unlimited number of shares of beneficial interest of the Fund at $0.001 par value per share currently divided into four classes, designated Class A, Class C, Class Z and Class R6.
| 38 |
As of July 31, 2022, Prudential, through its affiliated entities, including affiliated funds (if applicable), owned shares of the Fund as follows:
| Class | Number of Shares | Percentage of Outstanding Shares | ||
R6 | 1,046 | 100.0% |
At the reporting period end, the number of shareholders holding greater than 5% of the Fund are as follows:
| Number of Shareholders | Percentage of Outstanding Shares | |||
Affiliated | — | —% | ||
Unaffiliated | 2 | 89.2 |
Transactions in shares of beneficial interest were as follows:
| Share Class | Shares | Amount | ||||||
Class A | ||||||||
Year ended July 31, 2022: | ||||||||
Shares sold | 667,715 | $ | 11,322,372 | |||||
Shares issued in reinvestment of dividends and distributions | 75,002 | 1,273,949 | ||||||
Shares purchased | (155,662 | ) | (2,697,811 | ) | ||||
Net increase (decrease) in shares outstanding before conversion | 587,055 | 9,898,510 | ||||||
Shares issued upon conversion from other share class(es) | 8,885 | 153,847 | ||||||
Shares purchased upon conversion into other share class(es) | (3,355 | ) | (58,380 | ) | ||||
Net increase (decrease) in shares outstanding | 592,585 | $ | 9,993,977 | |||||
Year ended July 31, 2021: | ||||||||
Shares sold | 294,692 | $ | 4,886,644 | |||||
Shares issued in reinvestment of dividends and distributions | 24,173 | 367,654 | ||||||
Shares purchased | (102,032 | ) | (1,643,038 | ) | ||||
Net increase (decrease) in shares outstanding before conversion | 216,833 | 3,611,260 | ||||||
Shares issued upon conversion from other share class(es) | 33,287 | 559,425 | ||||||
Shares purchased upon conversion into other share class(es) | (1,819 | ) | (32,544 | ) | ||||
Net increase (decrease) in shares outstanding | 248,301 | $ | 4,138,141 | |||||
Class C | ||||||||
Year ended July 31, 2022: | ||||||||
Shares sold | 156,179 | $ | 2,589,972 | |||||
Shares issued in reinvestment of dividends and distributions | 10,447 | 176,578 | ||||||
Shares purchased | (29,909 | ) | (508,608 | ) | ||||
Net increase (decrease) in shares outstanding before conversion | 136,717 | 2,257,942 | ||||||
Shares purchased upon conversion into other share class(es) | (12,138 | ) | (204,482 | ) | ||||
Net increase (decrease) in shares outstanding | 124,579 | $ | 2,053,460 | |||||
PGIM Jennison Rising Dividend Fund | 39 |
Notes to Financial Statements (continued)
| Share Class | Shares | Amount | ||||||
Year ended July 31, 2021: | ||||||||
Shares sold | 67,438 | $ | 1,145,639 | |||||
Shares issued in reinvestment of dividends and distributions | 4,210 | 63,821 | ||||||
Shares purchased | (16,752 | ) | (270,321 | ) | ||||
Net increase (decrease) in shares outstanding before conversion | 54,896 | 939,139 | ||||||
Shares purchased upon conversion into other share class(es) | (37,371 | ) | (621,149 | ) | ||||
Net increase (decrease) in shares outstanding | 17,525 | $ | 317,990 | |||||
Class Z | ||||||||
Year ended July 31, 2022: | ||||||||
Shares sold | 9,833,631 | $ | 157,061,647 | |||||
Shares issued in reinvestment of dividends and distributions | 93,114 | 1,557,248 | ||||||
Shares purchased | (1,111,138 | ) | (17,976,517 | ) | ||||
Net increase (decrease) in shares outstanding before conversion | 8,815,607 | 140,642,378 | ||||||
Shares issued upon conversion from other share class(es) | 6,506 | 109,015 | ||||||
Net increase (decrease) in shares outstanding | 8,822,113 | $ | 140,751,393 | |||||
Year ended July 31, 2021: | ||||||||
Shares sold | 266,205 | $ | 4,273,534 | |||||
Shares issued in reinvestment of dividends and distributions | 34,305 | 523,029 | ||||||
Shares purchased | (810,511 | ) | (11,872,099 | ) | ||||
Net increase (decrease) in shares outstanding before conversion | (510,001 | ) | (7,075,536 | ) | ||||
Shares issued upon conversion from other share class(es) | 5,738 | 94,268 | ||||||
Net increase (decrease) in shares outstanding | (504,263 | ) | $ | (6,981,268 | ) | |||
Class R6 | ||||||||
Year ended July 31, 2022: | ||||||||
Shares issued in reinvestment of dividends and distributions | 86 | $ | 1,457 | |||||
Net increase (decrease) in shares outstanding | 86 | $ | 1,457 | |||||
Year ended July 31, 2021: | ||||||||
Shares issued in reinvestment of dividends and distributions | 42 | $ | 635 | |||||
Net increase (decrease) in shares outstanding | 42 | $ | 635 | |||||
8. Borrowings
The RIC, on behalf of the Fund along with other affiliated registered investment companies (the “Participating Funds”), is a party to a Syndicated Credit Agreement (“SCA”) with a group of banks. The purpose of the SCA is to provide an alternative source of temporary
| 40 |
funding for capital share redemptions. The table below provides details of the current SCA in effect at the reporting period-end as well as the prior SCA.
| Current SCA | Prior SCA | |||
Term of Commitment | 10/1/2021 – 9/29/2022 | 10/2/2020 – 9/30/2021 | ||
Total Commitment | $ 1,200,000,000 | $ 1,200,000,000 | ||
Annualized Commitment Fee on the Unused Portion of the SCA | 0.15% | 0.15% | ||
Annualized Interest Rate on Borrowings | 1.20% plus the higher of (1) the effective federal funds rate, (2) the one-month LIBOR rate or (3) zero percent | 1.30% plus the higher of (1) the effective federal funds rate, (2) the one-month LIBOR rate or (3) zero percent | ||
Certain affiliated registered investment companies that are parties to the SCA include portfolios that are subject to a predetermined mathematical formula used to manage certain benefit guarantees offered under variable annuity contracts. The formula may result in large scale asset flows into and out of these portfolios. Consequently, these portfolios may be more likely to utilize the SCA for purposes of funding redemptions. It may be possible for those portfolios to fully exhaust the committed amount of the SCA, thereby requiring the Manager to allocate available funding per a Board-approved methodology designed to treat the Participating Funds in the SCA equitably.
The Fund utilized the SCA during the year ended July 31, 2022. The average daily balance for the 2 days that the Fund had loans outstanding during the period was approximately $8,743,000, borrowed at a weighted average interest rate of 2.04%. The maximum loan outstanding amount during the period was $8,743,000. At July 31, 2022, the Fund did not have an outstanding loan amount.
9. Risks of Investing in the Fund
The Fund’s risks include, but are not limited to, some or all of the risks discussed below. For further information on the Fund’s risks, please refer to the Fund’s Prospectus and Statement of Additional Information.
Dividend Risk: There is no guarantee that the issuers of the stocks held by the Fund will pay dividends in the future or that, if dividends are paid, they will remain at their current levels or increase over time. High-dividend stocks may not experience high earnings growth or capital appreciation. The Fund’s performance during a broad market advance could suffer because dividend paying stocks may not experience the same capital appreciation as non-dividend paying stocks. A sharp rise in interest rates or economic downturn could cause a company to unexpectedly reduce or eliminate its dividend.
Economic and Market Events Risk: Events in the U.S. and global financial markets, including actions taken by the U.S. Federal Reserve or foreign central banks to stimulate or stabilize economic growth or the functioning of the securities markets, may at times result in
PGIM Jennison Rising Dividend Fund | 41 |
Notes to Financial Statements (continued)
unusually high market volatility, which could negatively impact performance. Relatively reduced liquidity in credit and fixed income markets could adversely affect issuers worldwide.
Emerging Markets Risk: The risks of foreign investments are greater for investments in or exposed to emerging markets. Emerging market countries typically have economic and political systems that are less fully developed, and can be expected to be less stable, than those of more developed countries. For example, the economies of such countries can be subject to rapid and unpredictable rates of inflation or deflation. Low trading volumes may result in a lack of liquidity and price volatility. Emerging market countries may have policies that restrict investment by non-U.S. investors, or that prevent non-U.S. investors from withdrawing their money at will.
The Fund may invest in some emerging markets that subject it to risks such as those associated with illiquidity, custody of assets, different settlement and clearance procedures and asserting legal title under a developing legal and regulatory regime to a greater degree than in developed markets or even in other emerging markets.
Equity and Equity-Related Securities Risk: Equity and equity-related securities may be subject to changes in value, and their values may be more volatile than those of other asset classes. In addition to an individual security losing value, the value of the equity markets or a sector in which the Fund invests could go down. Different parts of a market can react differently to adverse issuer, market, regulatory, political and economic developments.
Foreign Securities Risk: Investments in securities of non-U.S. issuers (including those denominated in U.S. dollars) may involve more risk than investing in securities of U.S. issuers. Foreign political, economic and legal systems, especially those in developing and emerging market countries, may be less stable and more volatile than in the United States. Foreign legal systems generally have fewer regulatory requirements than the U.S. legal system, particularly those of emerging markets. In general, less information is publicly available with respect to non-U.S. companies than U.S. companies. Non-U.S. companies generally are not subject to the same accounting, auditing, and financial reporting standards as are U.S. companies. Additionally, the changing value of foreign currencies and changes in exchange rates could also affect the value of the assets the Fund holds and the Fund’s performance. Certain foreign countries may impose restrictions on the ability of issuers of foreign securities to make payment of principal and interest or dividends to investors located outside the country, due to blockage of foreign currency exchanges or otherwise. Investments in emerging markets are subject to greater volatility and price declines.
In addition, the Fund’s investments in non-U.S. securities may be subject to the risks of nationalization or expropriation of assets, imposition of currency exchange controls or
| 42 |
restrictions on the repatriation of non-U.S. currency, confiscatory taxation and adverse diplomatic developments. Special U.S. tax considerations may apply.
Increase in Expenses Risk: Your actual cost of investing in the Fund may be higher than the expenses shown in the expense table in the Fund’s prospectus for a variety of reasons. For example, expense ratios may be higher than those shown if average net assets decrease. Net assets are more likely to decrease and Fund expense ratios are more likely to increase when markets are volatile. Active and frequent trading of Fund securities can increase expenses.
Large Capitalization Company Risk: Companies with large market capitalizations go in and out of favor based on market and economic conditions. Larger companies tend to be less volatile than companies with smaller market capitalizations. In exchange for this potentially lower risk, the Fund’s value may not rise or fall as much as the value of funds that emphasize companies with smaller market capitalizations.
Large Shareholder and Large Scale Redemption Risk: Certain individuals, accounts, funds (including funds affiliated with the Manager) or institutions, including the Manager and its affiliates, may from time to time own or control a substantial amount of the Fund’s shares. There is no requirement that these entities maintain their investment in the Fund. There is a risk that such large shareholders or that the Fund’s shareholders generally may redeem all or a substantial portion of their investments in the Fund in a short period of time, which could have a significant negative impact on the Fund’s NAV, liquidity, and brokerage costs. Large redemptions could also result in tax consequences to shareholders and impact the Fund’s ability to implement its investment strategy. The Fund’s ability to pursue its investment objective after one or more large scale redemptions may be impaired and, as a result, the Fund may invest a larger portion of its assets in cash or cash equivalents.
Management Risk: The value of your investment may decrease if judgments by the subadviser about the attractiveness, value or market trends affecting a particular security, industry or sector or about market movements are incorrect.
Market Capitalization Risk: The Fund may invest in companies of any market capitalization. Generally, the stock prices of small- and mid-cap companies are less stable than the prices of large-cap stocks and may present greater risks. Large capitalization companies as a group could fall out of favor with the market, causing the Fund to underperform compared to investments that focus on smaller capitalized companies.
Market Disruption and Geopolitical Risks: Market disruption can be caused by economic, financial or political events and factors, including but not limited to, international wars or conflicts (including Russia’s military invasion of Ukraine), geopolitical developments (including trading and tariff arrangements, sanctions and cybersecurity attacks), instability in regions such as Asia, Eastern Europe and the Middle East, terrorism, natural disasters and public health epidemics (including the outbreak of COVID-19 globally).
PGIM Jennison Rising Dividend Fund | 43 |
Notes to Financial Statements (continued)
The extent and duration of such events and resulting market disruptions cannot be predicted, but could be substantial and could magnify the impact of other risks to the Fund. These and other similar events could adversely affect the U.S. and foreign financial markets and lead to increased market volatility, reduced liquidity in the securities markets, significant negative impacts on issuers and the markets for certain securities and commodities and/or government intervention. They may also cause short- or long-term economic uncertainties in the United States and worldwide. As a result, whether or not the Fund invests in securities of issuers located in or with significant exposure to the countries directly affected, the value and liquidity of the Fund’s investments may be negatively impacted. Further, due to closures of certain markets and restrictions on trading certain securities, the value of certain securities held by the Fund could be significantly impacted, which could lead to such securities being valued at zero.
COVID-19 and the related governmental and public responses have had and may continue to have an impact on the Fund’s investments and net asset value and have led and may continue to lead to increased market volatility and the potential for illiquidity in certain classes of securities and sectors of the market. They have also had and may continue to result in periods of business disruption, business closures, inability to obtain raw materials, supplies and component parts, and reduced or disrupted operations for the issuers in which the Fund invests. The occurrence, reoccurrence and pendency of public health epidemics could adversely affect the economies and financial markets either in specific countries or worldwide.
Market Risk: Securities markets may be volatile and the market prices of the Fund’s securities may decline. Securities fluctuate in price based on changes in an issuer’s financial condition and overall market and economic conditions. If the market prices of the securities owned by the Fund fall, the value of your investment in the Fund will decline.
Portfolio Turnover Risk: The length of time the Fund has held a particular security is not generally a consideration in investment decisions. Under certain market conditions, the Fund’s turnover rate may be higher than that of other mutual funds. Portfolio turnover generally involves some expense to the Fund, including brokerage commissions or dealer mark-ups and other transaction costs on the sale of securities and reinvestment in other securities. These transactions may result in realization of taxable capital gains. The trading costs and tax effects associated with portfolio turnover may adversely affect the Fund’s investment performance.
| 44 |
Report of Independent Registered Public Accounting Firm
To the Board of Trustees of Prudential Investment Portfolios 5 and Shareholders of PGIM Jennison Rising Dividend Fund
Opinion on the Financial Statements
We have audited the accompanying statement of assets and liabilities, including the schedule of investments, of PGIM Jennison Rising Dividend Fund (one of the funds constituting Prudential Investment Portfolios 5, referred to hereafter as the “Fund”) as of July 31, 2022, the related statement of operations for the year ended July 31, 2022, the statements of changes in net assets for each of the two years in the period ended July 31, 2022, including the related notes, and the financial highlights for each of the two years in the period ended July 31, 2022 (collectively referred to as the “financial statements”). In our opinion, the financial statements present fairly, in all material respects, the financial position of the Fund as of July 31, 2022, the results of its operations for the year then ended, and the changes in its net assets and the financial highlights for each of the two years in the period ended July 31, 2022 in conformity with accounting principles generally accepted in the United States of America.
The financial statements of the Fund as of and for the year ended July 31, 2020 and the financial highlights for each of the periods ended on or prior to July 31, 2020 (not presented herein, other than the financial highlights) were audited by other auditors whose report dated September 16, 2020 expressed an unqualified opinion on those financial statements and financial highlights.
Basis for Opinion
These financial statements are the responsibility of the Fund’s management. Our responsibility is to express an opinion on the Fund’s financial statements based on our audits. We are a public accounting firm registered with the Public Company Accounting Oversight Board (United States) (PCAOB) and are required to be independent with respect to the Fund in accordance with the U.S. federal securities laws and the applicable rules and regulations of the Securities and Exchange Commission and the PCAOB.
We conducted our audits of these financial statements in accordance with the standards of the PCAOB. Those standards require that we plan and perform the audit to obtain reasonable assurance about whether the financial statements are free of material misstatement, whether due to error or fraud.
Our audits included performing procedures to assess the risks of material misstatement of the financial statements, whether due to error or fraud, and performing procedures that respond to those risks. Such procedures included examining, on a test basis, evidence regarding the amounts and disclosures in the financial statements. Our audits also included evaluating the accounting principles used and significant estimates made by management, as well as evaluating the overall presentation of the financial statements. Our procedures included confirmation of securities owned as of July 31, 2022 by correspondence with the custodian, transfer agent and broker. We believe that our audits provide a reasonable basis for our opinion.
/s/PricewaterhouseCoopers LLP
New York, New York
September 16, 2022
We have served as the auditor of one or more investment companies in the PGIM Retail Funds complex since 2020.
PGIM Jennison Rising Dividend Fund | 45 |
Tax Information (unaudited)
We are advising you that during the fiscal year ended July 31, 2022, the Fund reported the maximum amount allowed per share but not less than $.61 per share for Class A, C, Z and R6 shares as a capital gain distribution in accordance with Section 852(b)(3)(C) of the Internal Revenue Code.
For the year ended July 31, 2022, the Fund reports the maximum amount allowable under Section 854 of the Internal Revenue Code, but not less than, the following percentages of the ordinary income dividends paid as: 1) qualified dividend income (QDI); and 2) eligible for corporate dividends received deduction (DRD):
| Fund | QDI | DRD | ||||||||||||||||||
| PGIM Jennison Rising Dividend Fund | 42.46% | 39.25% | ||||||||||||||||||
In January 2023, you will be advised on IRS Form 1099-DIV or substitute 1099-DIV as to the federal tax status of the distributions received by you in calendar year 2022.
| 46 |
Liquidity Risk Management Program (unaudited)
Consistent with Rule 22e-4 under the 1940 Act (the “Liquidity Rule”), the Fund has adopted and implemented a liquidity risk management program (the “LRMP”). The Fund’s LRMP seeks to assess and manage the Fund’s liquidity risk, which is defined as the risk that the Fund is unable to meet investor redemption requests without significantly diluting the remaining investors’ interests in the Fund. The Board has approved PGIM Investments LLC (“PGIM Investments”), the Fund’s investment manager, to serve as the administrator of the Fund’s LRMP. As part of its responsibilities as administrator, PGIM Investments has retained a third party to perform certain functions, including providing market data and liquidity classification model information.
The Fund’s LRMP includes a number of processes designed to support the assessment and management of its liquidity risk. In particular, the Fund’s LRMP includes no less than annual assessments of factors that influence the Fund’s liquidity risk; no less than monthly classifications of the Fund’s investments into one of four liquidity classifications provided for in the Liquidity Rule; a 15% of net assets limit on the acquisition of “illiquid investments” (as defined under the Liquidity Rule); establishment of a minimum percentage of the Fund’s assets to be invested in investments classified as “highly liquid” (as defined under the Liquidity Rule) if the Fund does not invest primarily in highly liquid investments; and regular reporting to the Board.
At a meeting of the Board on March 1-3, 2022, PGIM Investments provided a written report (“LRMP Report”) to the Board addressing the operation, adequacy, and effectiveness of the Fund’s LRMP, including any material changes to the LRMP for the period from January 1, 2021 through December 31, 2021 (“Reporting Period”). The LRMP Report concluded that the Fund’s LRMP was reasonably designed to assess and manage the Fund’s liquidity risk and was adequately and effectively implemented during the Reporting Period. There were no material changes to the LRMP during the Reporting Period. The LRMP Report further concluded that the Fund’s investment strategies continue to be appropriate given the Fund’s status as an open-end fund.
There can be no assurance that the LRMP will achieve its objectives in the future. Additional information regarding risks of investing in the Fund, including liquidity risks presented by the Fund’s investment portfolio, is found in the Fund’s Prospectus and Statement of Additional Information.
PGIM Jennison Rising Dividend Fund |
INFORMATION ABOUT BOARD MEMBERS AND OFFICERS (unaudited)
Information about Board Members and Officers of the Fund is set forth below. Board Members who are not deemed to be “interested persons” of the Fund, as defined in the 1940 Act, are referred to as “Independent Board Members.” Board Members who are deemed to be “interested persons” of the Fund are referred to as “Interested Board Members.” The Board Members are responsible for the overall supervision of the operations of the Fund and perform the various duties imposed on the directors of investment companies by the 1940 Act. The Board in turn elects the Officers, who are responsible for administering the day-to-day operations of the Fund.
| Independent Board Members | ||||||
Name Year of Birth Position(s) Portfolios Overseen | Principal Occupation(s) During Past Five Years | Other Directorships Held During Past Five Years | Length of Board Service | |||
Ellen S. Alberding 1958 Board Member Portfolios Overseen: 97 | President and Board Member, The Joyce Foundation (charitable foundation) (since 2002); formerly Vice Chair, City Colleges of Chicago (community college system) (2011-2015); Trustee, National Park Foundation (charitable foundation for national park system) (2009-2018); Trustee, Economic Club of Chicago (2009-2016); Trustee, Loyola University (since 2018). | None. | Since September 2013 | |||
Kevin J. Bannon 1952 Board Member Portfolios Overseen: 97 | Retired; formerly Managing Director (April 2008-May 2015) and Chief Investment Officer (October 2008-November 2013) of Highmount Capital LLC (registered investment adviser); formerly Executive Vice President and Chief Investment Officer (April 1993-August 2007) of Bank of New York Company; President (May 2003-May 2007) of BNY Hamilton Family of Mutual Funds. | Director of Urstadt Biddle Properties (equity real estate investment trust) (since September 2008). | Since July 2008 | |||
PGIM Jennison Rising Dividend Fund
| Independent Board Members | ||||||
Name Year of Birth Position(s) Portfolios Overseen | Principal Occupation(s) During Past Five Years | Other Directorships Held During Past Five Years | Length of Board Service | |||
Linda W. Bynoe 1952 Board Member Portfolios Overseen: 94 | President and Chief Executive Officer (since March 1995) and formerly Chief Operating Officer (December 1989-February 1995) of Telemat Limited LLC (formerly Telemat Ltd) (management consulting); formerly Vice President (January 1985-June 1989) at Morgan Stanley & Co. (broker-dealer). | Trustee of Equity Residential (residential real estate) (since December 2009); Director of Northern Trust Corporation (financial services) (since April 2006); formerly Director of Anixter International, Inc. (communication products distributor) (January 2006-June 2020). | Since March 2005 | |||
Barry H. Evans 1960 Board Member Portfolios Overseen: 96 | Retired; formerly President (2005-2016), Global Chief Operating Officer (2014-2016), Chief Investment Officer - Global Head of Fixed Income (1998-2014), and various portfolio manager roles (1986-2006), Manulife Asset Management (asset management). | Formerly Director, Manulife Trust Company (2011-2018); formerly Director, Manulife Asset Management Limited (2015-2017); formerly Chairman of the Board of Directors of Manulife Asset Management U.S. (2005-2016); formerly Chairman of the Board, Declaration Investment Management and Research (2008-2016). | Since September 2017 | |||
Keith F. Hartstein 1956 Board Member & Independent Chair Portfolios Overseen: 97 | Retired; Member (since November 2014) of the Governing Council of the Independent Directors Council (IDC) (organization of independent mutual fund directors); formerly Executive Committee of the IDC Board of Governors (October 2019-December 2021); formerly President and Chief Executive Officer (2005-2012), Senior Vice President (2004-2005), Senior Vice President of Sales and Marketing (1997-2004), and various executive management positions (1990-1997), John Hancock Funds, LLC (asset management); Chairman, Investment Company Institute’s Sales Force Marketing Committee (2003-2008). | None. | Since September 2013 | |||
Visit our website at pgim.com/investments
| Independent Board Members | ||||||
Name Year of Birth Position(s) Portfolios Overseen | Principal Occupation(s) During Past Five Years | Other Directorships Held During Past Five Years | Length of Board Service | |||
Laurie Simon Hodrick 1962 Board Member Portfolios Overseen: 93 | A. Barton Hepburn Professor Emerita of Economics in the Faculty of Business, Columbia Business School (since 2018); Visiting Fellow at the Hoover Institution, Stanford University (since 2015); Sole Member, ReidCourt LLC (since 2008) (a consulting firm); formerly Visiting Professor of Law, Stanford Law School (2015-2021); formerly A. Barton Hepburn Professor of Economics in the Faculty of Business, Columbia Business School (1996-2017); formerly Managing Director, Global Head of Alternative Investment Strategies, Deutsche Bank (2006-2008). | Independent Director, Andela (since January 2022) (global talent network); Independent Director, Roku (since December 2020) (communication services); formerly Independent Director, Synnex Corporation (2019-2021) (information technology); formerly Independent Director, Kabbage, Inc. (2018-2020) (financial services); formerly Independent Director, Corporate Capital Trust (2017-2018) (a business development company). | Since September 2017 | |||
Brian K. Reid 1961 Board Member Portfolios Overseen: 96 | Retired; formerly Chief Economist for the Investment Company Institute (ICI) (2005-2017); formerly Senior Economist and Director of Industry and Financial Analysis at the ICI (1998-2004); formerly Senior Economist, Industry and Financial Analysis at the ICI (1996-1998); formerly Staff Economist at the Federal Reserve Board (1989-1996); Director, ICI Mutual Insurance Company (2012-2017). | None. | Since March 2018 | |||
PGIM Jennison Rising Dividend Fund
| Independent Board Members | ||||||
Name Year of Birth Position(s) Portfolios Overseen | Principal Occupation(s) During Past Five Years | Other Directorships Held During Past Five Years | Length of Board Service | |||
Grace C. Torres 1959 Board Member Portfolios Overseen: 96 | Retired; formerly Treasurer and Principal Financial and Accounting Officer of the PGIM Funds, Target Funds, Advanced Series Trust, Prudential Variable Contract Accounts and The Prudential Series Fund (1998-June 2014); Assistant Treasurer (March 1999-June 2014) and Senior Vice President (September 1999-June 2014) of PGIM Investments LLC; Assistant Treasurer (May 2003-June 2014) and Vice President (June 2005-June 2014) of AST Investment Services, Inc.; Senior Vice President and Assistant Treasurer (May 2003-June 2014) of Prudential Annuities Advisory Services, Inc. | Director (since January 2018) of OceanFirst Financial Corp. and OceanFirst Bank; formerly Director (July 2015-January 2018) of Sun Bancorp, Inc. N.A. and Sun National Bank. | Since November 2014 | |||
| Interested Board Members | ||||||
Name Year of Birth Position(s) Portfolios Overseen | Principal Occupation(s) During Past Five Years | Other Directorships Held During Past Five Years | Length of Board Service | |||
Stuart S. Parker 1962 Board Member & President Portfolios Overseen: 96 | President, Chief Executive Officer, Chief Operating Officer and Officer in Charge of PGIM Investments LLC (formerly known as Prudential Investments LLC) (since January 2012); President and PEO (since March 2022) of the PGIM Private Real Estate Fund, Inc.; formerly Executive Vice President of Jennison Associates LLC and Head of Retail Distribution of PGIM Investments LLC (June 2005-December 2011); Investment Company Institute - Board of Governors (since May 2012). | None. | Since January 2012 | |||
Visit our website at pgim.com/investments
| Interested Board Members | ||||||
Name Year of Birth Position(s) Portfolios Overseen | Principal Occupation(s) During Past Five Years | Other Directorships Held During Past Five Years | Length of Board Service | |||
Scott E. Benjamin 1973 Board Member & Vice President Portfolios Overseen: 97 | Executive Vice President (since May 2009) of PGIM Investments LLC; Vice President (since June 2012) of Prudential Investment Management Services LLC; Executive Vice President (since September 2009) of AST Investment Services, Inc.; Senior Vice President of Product Development and Marketing, PGIM Investments (since February 2006); Vice President (since March 2022) of the PGIM Private Real Estate Fund, Inc.; formerly Vice President of Product Development and Product Management, PGIM Investments LLC (2003-2006). | None. | Since March 2010 | |||
| Fund Officers(a) | ||||
Name Year of Birth Fund Position | Principal Occupation(s) During Past Five Years | Length of Service as Fund Officer | ||
Claudia DiGiacomo 1974 Chief Legal Officer | Chief Legal Officer (since July 2022) of the PGIM Private Real Estate Fund, Inc.; Chief Legal Officer, Executive Vice President and Secretary of PGIM Investments LLC (since August 2020); Chief Legal Officer of Prudential Mutual Fund Services LLC (since August 2020); Chief Legal Officer of PIFM Holdco, LLC (since August 2020); Vice President and Corporate Counsel (since January 2005) of Prudential; and Corporate Counsel of AST Investment Services, Inc. (since August 2020); formerly Vice President and Assistant Secretary of PGIM Investments LLC (2005-2020); formerly Associate at Sidley Austin Brown & Wood LLP (1999-2004). | Since December 2005 | ||
PGIM Jennison Rising Dividend Fund
| Fund Officers(a) | ||||
Name Year of Birth Fund Position | Principal Occupation(s) During Past Five Years | Length of Service as Fund Officer | ||
Isabelle Sajous 1976 Chief Compliance Officer | Chief Compliance Officer (since April 2022) of PGIM Investments LLC, the PGIM Funds, Target Funds, PGIM ETF Trust, PGIM Global High Yield Fund, Inc., PGIM High Yield Bond Fund, Inc., PGIM Short Duration High Yield Opportunities Fund, Advanced Series Trust, The Prudential Series Fund and Prudential’s Gibraltar Fund, Inc.; Chief Compliance Officer (since March 2022) of the PGIM Private Real Estate Fund, Inc.; Vice President, Compliance of PGIM Investments LLC (since December 2020); formerly Director, Compliance (July 2018-December 2020) of Credit Suisse Asset Management LLC; and Vice President, Associate General Counsel & Deputy Chief Compliance Officer of Cramer Rosenthal McGlynn, LLC (August 2014-July 2018). | Since April 2022 | ||
Andrew R. French 1962 Secretary | Vice President (since December 2018) of PGIM Investments LLC; Secretary (since March 2022) of the PGIM Private Real Estate Fund, Inc.; formerly Vice President and Corporate Counsel (2010-2018) of Prudential; formerly Director and Corporate Counsel (2006-2010) of Prudential; Vice President and Assistant Secretary (since January 2007) of PGIM Investments LLC; Vice President and Assistant Secretary (since January 2007) of Prudential Mutual Fund Services LLC. | Since October 2006 | ||
Melissa Gonzalez 1980 Assistant Secretary | Vice President and Corporate Counsel (since September 2018) of Prudential; Vice President and Assistant Secretary (since August 2020) of PGIM Investments LLC; Assistant Secretary (since March 2022) of the PGIM Private Real Estate Fund, Inc.; formerly Director and Corporate Counsel (March 2014-September 2018) of Prudential. | Since March 2020 | ||
Patrick E. McGuinness 1986 Assistant Secretary | Vice President and Assistant Secretary (since August 2020) of PGIM Investments LLC; Director and Corporate Counsel (since February 2017) of Prudential; Assistant Secretary (since March 2022) of the PGIM Private Real Estate Fund, Inc. | Since June 2020 | ||
Debra Rubano 1975 Assistant Secretary | Vice President and Corporate Counsel (since November 2020) of Prudential; Assistant Secretary (since March 2022) of the PGIM Private Real Estate Fund, Inc; formerly Director and Senior Counsel of Allianz Global Investors U.S. Holdings LLC (2010-2020) and Assistant Secretary of numerous funds in the Allianz fund complex (2015-2020). | Since December 2020 | ||
Kelly A. Coyne 1968 Assistant Secretary | Director, Investment Operations of Prudential Mutual Fund Services LLC (since 2010); Assistant Secretary (since March 2022) of the PGIM Private Real Estate Fund, Inc. | Since March 2015 | ||
Visit our website at pgim.com/investments
| Fund Officers(a) | ||||
Name Year of Birth Fund Position | Principal Occupation(s) During Past Five Years | Length of Service as Fund Officer | ||
Christian J. Kelly 1975 Treasurer and Principal Financial and Accounting Officer | Vice President, Head of Fund Administration of PGIM Investments LLC (since November 2018); Principal Financial Officer (since March 2022) of the PGIM Private Real Estate Fund, Inc.; formerly, Treasurer and Principal Accounting Officer (March 2022- July 2022) of the PGIM Private Real Estate Fund, Inc.; formerly Director of Fund Administration of Lord Abbett & Co. LLC (2009-2018), Treasurer and Principal Accounting Officer of the Lord Abbett Family of Funds (2017-2018); Director of Accounting, Avenue Capital Group (2008-2009); Senior Manager, Investment Management Practice of Deloitte & Touche LLP (1998-2007). | Since January 2019 | ||
Lana Lomuti 1967 Assistant Treasurer | Vice President (since 2007) and Director (2005-2007), within PGIM Investments Fund Administration; formerly Assistant Treasurer (December 2007-February 2014) of The Greater China Fund, Inc. | Since April 2014 | ||
Russ Shupak 1973 Assistant Treasurer | Vice President (since 2017) and Director (2013-2017), within PGIM Investments Fund Administration; Treasurer and Principal Accounting Officer (since July 2022) of the PGIM Private Real Estate Fund, Inc.; formerly Assistant Treasurer (March 2022 – July 2022) of the PGIM Private Real Estate Fund, Inc. | Since October 2019 | ||
Deborah Conway 1969 Assistant Treasurer | Vice President (since 2017) and Director (2007-2017), within PGIM Investments Fund Administration. | Since October 2019 | ||
Elyse M. McLaughlin 1974 Assistant Treasurer | Vice President (since 2017) and Director (2011-2017), within PGIM Investments Fund Administration; Assistant Treasurer (since March 2022) of the PGIM Private Real Estate Fund, Inc. | Since October 2019 | ||
Kelly Florio 1978 Anti-Money Laundering Compliance Officer | Vice President, Corporate Compliance, Global Compliance Programs and Compliance Risk Management (since December 2021) of Prudential; formerly, Head of Fraud Risk Management (October 2019 to December 2021) at New York Life Insurance Company; formerly, Head of Key Risk Area Operations (November 2018 to October 2019), Director of the US Anti-Money Laundering Compliance Unit (2009-2018) and Bank Loss Prevention Associate (2006 -2009) at MetLife. | Since June 2022 | ||
(a) Excludes Mr. Parker and Mr. Benjamin, interested Board Members who also serve as President and Vice President, respectively.
Explanatory Notes to Tables:
| ∎ | Board Members are deemed to be “Interested,” as defined in the 1940 Act, by reason of their affiliation with PGIM Investments LLC and/or an affiliate of PGIM Investments LLC. |
| ∎ | Unless otherwise noted, the address of all Board Members and Officers is c/o PGIM Investments LLC, 655 Broad Street, Newark, New Jersey 07102-4410. |
| ∎ | There is no set term of office for Board Members or Officers. The Board Members have adopted a retirement policy, which calls for the retirement of Board Members on December 31 of the year in which they reach the age of 75. |
PGIM Jennison Rising Dividend Fund
| ∎ | “Other Directorships Held” includes all directorships of companies required to register or file reports with the SEC under the 1934 Act (that is, “public companies”) or other investment companies registered under the 1940 Act. |
| ∎ | “Portfolios Overseen” includes all investment companies managed by PGIM Investments LLC. The investment companies for which PGIM Investments LLC serves as manager include the PGIM Mutual Funds, Target Funds, The Prudential Variable Contract Accounts, PGIM ETF Trust, PGIM Private Real Estate Fund, Inc., PGIM High Yield Bond Fund, Inc., PGIM Global High Yield Fund, Inc., PGIM Short Duration High Yield Opportunities Fund, The Prudential Series Fund, Prudential’s Gibraltar Fund, Inc. and the Advanced Series Trust. |
| ∎ | As used in the Fund Officers table “Prudential” means The Prudential Insurance Company of America. |
Visit our website at pgim.com/investments
Approval of Advisory Agreements (unaudited)
The Fund’s Board of Trustees
The Board of Trustees (the “Board”) of PGIM Jennison Rising Dividend Fund (the “Fund”)1 consists of ten individuals, eight of whom are not “interested persons” of the Fund, as defined in the Investment Company Act of 1940, as amended (the “1940 Act”) (the “Independent Trustees”). The Board is responsible for the oversight of the Fund and its operations, and performs the various duties imposed on the directors of investment companies by the 1940 Act. The Independent Trustees have retained independent legal counsel to assist them in connection with their duties. The Chair of the Board is an Independent Trustee. The Board has established five standing committees: the Audit Committee, the Nominating and Governance Committee, the Compliance Committee and two Investment Committees. Each committee is chaired by, and composed of, Independent Trustees.
Annual Approval of the Fund’s Advisory Agreements
As required under the 1940 Act, the Board determines annually whether to renew the Fund’s management agreement with PGIM Investments LLC (“PGIM Investments”) and the Fund’s subadvisory agreement with Jennison Associates LLC (“Jennison”). In considering the renewal of the agreements, the Board, including all of the Independent Trustees, met on May 26 and June 7-9, 2022 (the “Board Meeting”) and approved the renewal of the agreements through July 31, 2023, after concluding that the renewal of the agreements was in the best interests of the Fund and its shareholders.
In advance of the meetings, the Board requested and received materials relating to the agreements, and had the opportunity to ask questions and request further information in connection with its consideration. Among other things, the Board considered comparative fee information from PGIM Investments and Jennison. Also, the Board considered comparisons with other mutual funds in relevant Peer Universes and Peer Groups, as is further discussed below.
In approving the agreements, the Board, including the Independent Trustees advised by independent legal counsel, considered the factors it deemed relevant, including the nature, quality and extent of services provided by PGIM Investments and the subadviser, the performance of the Fund, the profitability of PGIM Investments and its affiliates, expenses and fees, and the potential for economies of scale that may be shared with the Fund and its shareholders as the Fund’s assets grow. In their deliberations, the Trustees did not identify any single factor which alone was responsible for the Board’s decision to approve the agreements with respect to the Fund. In connection with its deliberations, the Board considered information provided by PGIM Investments throughout the year at regular Board meetings, presentations from portfolio managers and other information, as well as information furnished at or in advance of the Board Meeting.
The Trustees determined that the overall arrangements between the Fund and PGIM Investments, which serves as the Fund’s investment manager pursuant to a
1PGIM Jennison Rising Dividend Fund is a series of Prudential Investment Portfolios 5
PGIM Jennison Rising Dividend Fund
Approval of Advisory Agreements (continued)
management agreement, and between PGIM Investments and Jennison, which serves as the Fund’s subadviser pursuant to the terms of a subadvisory agreement with PGIM Investments, are in the best interests of the Fund and its shareholders in light of the services performed, fees charged and such other matters as the Trustees considered relevant in the exercise of their business judgment.
Several of the material factors and conclusions that formed the basis for the Trustees’ reaching their determinations to approve the renewal of the agreements are discussed separately below.
Nature, Quality and Extent of Services
The Board received and considered information regarding the nature, quality and extent of services provided to the Fund by PGIM Investments and Jennison. The Board noted that Jennison is affiliated with PGIM Investments. The Board considered the services provided by PGIM Investments, including but not limited to the oversight of the subadviser for the Fund, as well as the provision of fund recordkeeping, compliance and other services to the Fund, and PGIM Investments’ role as administrator for the Fund’s liquidity risk management program. With respect to PGIM Investments’ oversight of the subadviser, the Board noted that PGIM Investments’ Strategic Investment Research Group (“SIRG”), which is a business unit of PGIM Investments, is responsible for monitoring and reporting to PGIM Investments’ senior management on the performance and operations of the subadviser. The Board also considered that PGIM Investments pays the salaries of all of the officers and interested Trustees of the Fund who are part of Fund management. The Board also considered the investment subadvisory services provided by Jennison, including investment research and security selection, as well as compliance with the Fund’s investment restrictions, policies and procedures. The Board considered PGIM Investments’ evaluation of Jennison, as well as PGIM Investments’ recommendation, based on its review of Jennison, to renew the subadvisory agreement.
The Board considered the qualifications, backgrounds and responsibilities of PGIM Investments’ senior management responsible for the oversight of the Fund and Jennison, and also considered the qualifications, backgrounds and responsibilities of Jennison’s portfolio managers who are responsible for the day-to-day management of the Fund’s portfolio. The Board was provided with information pertaining to PGIM Investments’ and Jennison’s organizational structure, senior management, investment operations, and other relevant information pertaining to both PGIM Investments and Jennison. The Board also noted that it received favorable compliance reports from the Fund’s Chief Compliance Officer (“CCO”) as to both PGIM Investments and Jennison.
The Board concluded that it was satisfied with the nature, extent and quality of the investment management services provided by PGIM Investments and the subadvisory services provided to the Fund by Jennison, and that there was a reasonable basis on which to conclude that the Fund benefits from the services provided by PGIM Investments and Jennison under the management and subadvisory agreements.
Visit our website at pgim.com/investments
Costs of Services and Profits Realized by PGIM Investments
The Board was provided with information on the profitability of PGIM Investments and its affiliates in serving as the Fund’s investment manager. The Board discussed with PGIM Investments the methodology utilized in assembling the information regarding profitability and considered its reasonableness. The Board recognized that it is difficult to make comparisons of profitability from fund management contracts because comparative information is not generally publicly available and is affected by numerous factors, including the structure of the particular adviser, the types of funds it manages, its business mix, numerous assumptions regarding allocations and the adviser’s capital structure and cost of capital. However, the Board considered that the cost of services provided by PGIM Investments to the Fund during the year ended December 31, 2021 exceeded the management fees paid by the Fund, resulting in an operating loss to PGIM Investments. Taking these factors into account, the Board concluded that the profitability of PGIM Investments and its affiliates in relation to the services rendered was not unreasonable.
Economies of Scale
The Board received and discussed information concerning economies of scale that PGIM Investments may realize as the Fund’s assets grow beyond current levels. The Board noted that the management fee schedule for the Fund includes breakpoints, which have the effect of decreasing the fee rate as assets increase. During the course of time, the Board has considered information regarding the launch date of the Fund, the management fees of the Fund compared to those of similarly managed funds and PGIM Investments’ investment in the Fund over time. The Board noted that economies of scale can be shared with the Fund in other ways, including low management fees from inception, additional technological and personnel investments to enhance shareholder services, and maintaining existing expense structures in the face of a rising cost environment. The Board also considered PGIM Investments’ assertion that it continually evaluates the management fee schedule of the Fund and the potential to share economies of scale through breakpoints or fee waivers as asset levels increase.
The Board recognized the inherent limitations of any analysis of economies of scale, stemming largely from the Board’s understanding that most of PGIM Investments’ costs are not specific to individual funds, but rather are incurred across a variety of products and services.
Other Benefits to PGIM Investments and Jennison
The Board considered potential ancillary benefits that might be received by PGIM Investments, Jennison and their affiliates as a result of their relationship with the Fund. The Board concluded that potential benefits to be derived by PGIM Investments included transfer agency fees received by the Fund’s transfer agent (which is affiliated with PGIM Investments), as well as benefits to its reputation or other intangible benefits resulting from PGIM Investments’ association with the Fund. The Board concluded that the potential benefits to be derived by Jennison included its ability to use soft dollar
PGIM Jennison Rising Dividend Fund
Approval of Advisory Agreements (continued)
credits, as well as the potential benefits consistent with those generally resulting from an increase in assets under management, specifically, potential access to additional research resources and benefits to its reputation. The Board concluded that the benefits derived by PGIM Investments and Jennison were consistent with the types of benefits generally derived by investment managers and subadvisers to mutual funds.
Performance of the Fund / Fees and Expenses
The Board considered certain additional factors and made related conclusions relating to the historical performance of the Fund for the one-, three- and five-year periods ended December 31, 2021. The Board considered that the Fund commenced operations on March 5, 2014 and that longer-term performance was not yet available.
The Board also considered the Fund’s actual management fee, as well as the Fund’s net total expense ratio, for the fiscal year ended July 31, 2021. The Board considered the management fee for the Fund as compared to the management fee charged by PGIM Investments to other funds and the fee charged by other advisers to comparable mutual funds in a Peer Group. The actual management fee represents the fee rate actually paid by Fund shareholders and includes any fee waivers or reimbursements. The net total expense ratio for the Fund represents the actual expense ratio incurred by Fund shareholders.
The mutual funds included in the Peer Universe, which was used to consider performance, and the Peer Group, which was used to consider expenses and fees, were objectively determined by Broadridge, an independent provider of mutual fund data. In certain circumstances, PGIM Investments also provided supplemental Peer Universe or Peer Group information for reasons addressed with the Board. The comparisons placed the Fund in various quartiles over various periods, with the first quartile being the best 25% of the mutual funds (for performance, the best performing mutual funds and, for expenses, the lowest cost mutual funds).
The section below summarizes key factors considered by the Board and the Board’s conclusions regarding the Fund’s performance, fees and overall expenses. The table sets forth net performance comparisons (which reflect the impact on performance of fund expenses, or any subsidies, expense caps or waivers that may be applicable) with the Peer Universe, actual management fees with the Peer Group (which reflect the impact of any subsidies or fee waivers), and net total expenses with the Peer Group, each of which were key factors considered by the Board.
| Net Performance | 1 Year | 3 Years | 5 Years | 10 Years | ||||
3rd Quartile | 1st Quartile | 1st Quartile | N/A | |||||
Actual Management Fees: 1st Quartile
| ||||||||
Net Total Expenses: 2nd Quartile
| ||||||||
| ● | The Board noted that the Fund underperformed its benchmark index for all periods. |
Visit our website at pgim.com/investments
| ● | The Board considered PGIM Investments’ assertions that index concentration had an outsized negative impact on performance relative to the benchmark index as some top constituents detracted, and as high-quality, dividend-paying stocks gain favor, PGIM Investments expects the Fund’s relative performance to improve. |
| ● | The Board and PGIM Investments agreed to retain the Fund’s existing contractual expense cap, which (exclusive of certain fees and expenses) caps total annual operating expenses at 1.24% for Class A shares, 1.99% for Class C shares, 0.99% for Class R6 shares, and 0.99% for Class Z shares through November 30, 2022. |
| ● | In addition, PGIM Investments will waive management fees or shared operating expenses on any share class to the same extent that it waives such expenses on any other share class, and has agreed that total annual fund operating expenses for Class R6 shares will not exceed total annual fund operating expenses for Class Z shares. |
| ● | The Board concluded that, in light of the above, it would be in the best interests of the Fund and its shareholders to renew the agreements. |
| ● | The Board concluded that the management fees (including subadvisory fees) and total expenses were reasonable in light of the services provided. |
* * *
After full consideration of these factors, the Board concluded that the approval of the agreements was in the best interests of the Fund and its shareholders.
PGIM Jennison Rising Dividend Fund | ||
|
∎ TELEPHONE |
∎ WEBSITE | ||
655 Broad Street Newark, NJ 07102
| (800) 225-1852 | pgim.com/investments | ||
PROXY VOTING |
The Board of Trustees of the Fund has of the Fund has delegated to the Fund’s subadviser the responsibility for voting any proxies and maintaining proxy recordkeeping with respect to the Fund. A description of these proxy voting policies and procedures is available without charge, upon request, by calling (800) 225-1852 or by visiting the Securities and Exchange Commission’s website at sec.gov. Information regarding how the Fund voted proxies relating to portfolio securities during the most recent 12-month period ended June 30 is available on the Fund’s website and on the Securities and Exchange Commission’s website.
|
TRUSTEES |
Ellen S. Alberding • Kevin J. Bannon • Scott E. Benjamin • Linda W. Bynoe • Barry H. Evans • Keith F. Hartstein • Laurie Simon Hodrick • Stuart S. Parker • Brian K. Reid • Grace C. Torres
|
OFFICERS |
Stuart S. Parker, President • Scott E. Benjamin, Vice President • Christian J. Kelly, Treasurer and Principal Financial and Accounting Officer • Claudia DiGiacomo, Chief Legal Officer • Isabelle Sajous, Chief Compliance Officer • Kelly Florio, Anti-Money Laundering Compliance Officer • Andrew R. French, Secretary • Melissa Gonzalez, Assistant Secretary • Kelly A. Coyne, Assistant Secretary • Patrick E. McGuinness, Assistant Secretary • Debra Rubano, Assistant Secretary • Lana Lomuti, Assistant Treasurer • Russ Shupak, Assistant Treasurer • Elyse M. McLaughlin, Assistant Treasurer • Deborah Conway, Assistant Treasurer
|
| MANAGER | PGIM Investments LLC | 655 Broad Street Newark, NJ 07102 | ||
| SUBADVISER | Jennison Associates LLC | 466 Lexington Avenue New York, NY 10017 | ||
| DISTRIBUTOR | Prudential Investment Management Services LLC | 655 Broad Street Newark, NJ 07102 | ||
| CUSTODIAN | The Bank of New York Mellon | 240 Greenwich Street New York, NY 10286 | ||
| TRANSFER AGENT | Prudential Mutual Fund Services LLC | PO Box 9658 Providence, RI 02940 | ||
| INDEPENDENT REGISTERED PUBLIC ACCOUNTING FIRM | PricewaterhouseCoopers LLP | 300 Madison Avenue New York, NY 10017 | ||
| FUND COUNSEL | Willkie Farr & Gallagher LLP | 787 Seventh Avenue New York, NY 10019 | ||
An investor should consider the investment objectives, risks, charges, and expenses of the Fund carefully before investing. The prospectus and summary prospectus contain this and other information about the Fund. An investor may obtain a prospectus and summary prospectus by visiting our website at pgim.com/investments or by calling (800) 225-1852. The prospectus and summary prospectus should be read carefully before investing. |
E-DELIVERY |
To receive your mutual fund documents online, go to pgim.com/investments/resource/edelivery and enroll. Instead of receiving printed documents by mail, you will receive notification via email when new materials are available. You can cancel your enrollment or change your email address at any time by visiting the website address above.
|
SHAREHOLDER COMMUNICATIONS WITH TRUSTEES |
Shareholders can communicate directly with the Board of Trustees by writing to the Chair of the Board, PGIM Jennison Rising Dividend Fund, PGIM Investments, Attn: Board of Trustees, 655 Broad Street, Newark, NJ 07102. Shareholders can communicate directly with an individual Trustee by writing to that Trustee at the same address. Communications are not screened before being delivered to the addressee.
|
| AVAILABILITY OF PORTFOLIO HOLDINGS |
| The Fund files its complete schedule of portfolio holdings with the Securities and Exchange Commission for the first and third quarters of each fiscal year as an exhibit to its reports on Form N-PORT. The Fund’s Form N-PORT filings are available on the Commission’s website at sec.gov. |
| The Fund’s Statement of Additional Information contains additional information about the Fund’s Trustees and is available without charge, upon request, by calling (800) 225-1852. |
Mutual Funds:
ARE NOT INSURED BY THE FDIC OR ANY
| MAY LOSE VALUE | ARE NOT A DEPOSIT OF OR GUARANTEED
|

PGIM JENNISON RISING DIVIDEND FUND
| SHARE CLASS | A | C | Z | R6 | ||||
| NASDAQ | PJDAX | PJDCX | PJDZX | PJDQX | ||||
| CUSIP | 74440V823 | 74440V815 | 74440V799 | 74440V682 | ||||
MF220E

PGIM 60/40 ALLOCATION FUND

ANNUAL REPORT
JULY 31, 2022

To enroll in e-delivery, go to pgim.com/investments/resource/edelivery
|
| 3
|
| |
Growth of a $10,000 Investment
|
| 3
|
| |
Strategy and Performance Overview
|
| 5
|
| |
|
| 7
|
| |
Holdings and Financial Statements
|
| 9
|
| |
Approval of Advisory Agreements
| ||||
This report is not authorized for distribution to prospective investors unless preceded or accompanied by a current prospectus.
The views expressed in this report and information about the Fund’s portfolio holdings are for the period covered by this report and are subject to change thereafter.
Mutual funds are distributed by Prudential Investment Management Services LLC, a Prudential Financial company and member SIPC. PGIM Quantitative Solutions is the primary business name of PGIM Quantitative Solutions LLC (formerly known as QMA LLC), a wholly owned subsidiary of PGIM, Inc. (PGIM), a registered investment adviser and Prudential Financial company. © 2022 Prudential Financial, Inc. and its related entities. PGIM and the PGIM logo are service marks of Prudential Financial, Inc. and its related entities, registered in many jurisdictions worldwide.
| 2 | Visit our website at pgim.com/investments |
Your Fund’s Performance (unaudited)
Performance data quoted represent past performance. Past performance does not guarantee future results. The investment return and principal value of an investment will fluctuate so that an investor’s shares, when redeemed, may be worth more or less than their original cost. Current performance may be lower or higher than the past performance data quoted.
Average Annual Total Returns as of 7/31/22 | ||||
One Year (%)
| Since Inception (%)
| |||
Fund |
-6.34 |
7.71 (09/13/2017) | ||
Custom Benchmark Index | ||||
| -6.16
| 7.20
| |||
Since Inception returns are provided for any share class with less than 10 fiscal years of returns. Since Inception returns for the Index are measured from the closest month-end to the class’ inception date.
The returns in the table do not reflect the deduction of taxes that a shareholder would pay on Fund distributions or following the redemption of Fund shares. Since Inception returns are provided since the Fund has less than 10 fiscal years of returns. Since Inception returns for the Index are measured from the closest month-end to the class’ inception date.
Growth of a $10,000 Investment (unaudited)
The graph compares a $10,000 investment in the Fund with a similar investment in the Custom Benchmark Index (60% S&P 500 Index/40% Bloomberg US Aggregate Bond Index) by portraying the initial account values at the commencement of operations (September 13, 2017) and the account values at the end of the current fiscal year (July 31, 2022), as measured on a quarterly basis. For purposes of the graph, and unless otherwise indicated, it has been assumed that (a) all recurring fees (including
PGIM 60/40 Allocation Fund 3
Your Fund’s Performance (continued)
management fees) were deducted and (b) all dividends and distributions were reinvested. Without waiver of fees and/or expense reimbursements, if any, the returns would have been lower.
Past performance does not predict future performance. Total returns and the ending account values in the graph include changes in share price and reinvestment of dividends and capital gains distributions in a hypothetical investment for the periods shown. The Fund’s total returns do not reflect the deduction of income taxes on an individual’s investment. Taxes may reduce your actual investment returns on income or gains paid by the Fund or any gains you may realize if you sell your shares.
Benchmark Definitions
Custom Benchmark Index—The Custom Benchmark is comprised of 60% S&P 500 Index and 40% Bloomberg US Aggregate Bond Index.
S&P 500 Index—The S&P 500 Index is an unmanaged index of over 500 stocks of large US public companies. It gives a broad look at how stock prices in the United States have performed.
Bloomberg US Aggregate Bond Index—The Bloomberg US Aggregate Bond Index is unmanaged and represents securities that are taxable and dollar denominated. It covers the US investment-grade fixed rate bond market, with index components for government and corporate securities, mortgage pass-through securities, and asset-backed securities.
Investors cannot invest directly in an index. The returns for the Index would be lower if they included the effects of sales charges, operating expenses of a mutual fund, or taxes that may be paid by an investor.
Presentation of Fund Holdings as of 7/31/22
Top Largest Holdings | Asset Class | % of Net Assets | ||
PGIM Quant Solutions Large-Cap Core Fund (Class R6) | Large Cap | 60.1% | ||
| PGIM Total Return Bond Fund (Class R6) | Total Return Bond | 39.8% |
Holdings reflect only long-term investments and are subject to change.
| 4 | Visit our website at pgim.com/investments |
Strategy and Performance Overview*
(unaudited)
How did the Fund perform?
The PGIM 60/40 Allocation Fund’s Class R6 shares returned –6.34% in the 12-month reporting period that ended July 31, 2022, underperforming the –6.16% return of its custom benchmark—a 60%/40% blend of the S&P 500 Index and the Bloomberg US Aggregate Bond Index, respectively.
What were the market conditions?
| ● | Elevated economic uncertainty, rising inflation, and investor expectations of a downshift in global growth from the stellar rebound of 2021 were already underway at the start of 2022. New shocks—most notably Russia’s invasion of Ukraine and the reinstatement of COVID-19-related shutdowns in China—significantly worsened the trend of lower global growth and higher inflation during the first seven months of 2022. |
| ● | Rising recession fears gripped global markets in 2022 as a challenging combination of macro economic events led stocks into bear market territory, and investors assumed a “risk off” stance across most asset segments (Investors who take a “risk off” stance perceive risk to be high in current market conditions. In response, they tend to gravitate toward lower-risk investments and focus on protecting their capital). |
| ● | Stocks struggled globally during the 12-month reporting period that ended July 31, 2022, with most equity asset classes turning in negative returns. US stocks outpaced non-US equities during the period. The decline in stocks was driven primarily by a significant compression in earnings multiples. |
| ● | Declines in bonds (the flip-side of higher rates) were also substantial, with the bond bear market growling even louder. The Bloomberg Global Aggregate Index extended its losses, falling about 15% from its January 2021 high, the biggest drawdown since 1990. |
What worked?
| ● | The Fund benefited most from its heavier exposure to stocks versus bonds. The S&P 500 Index outperformed the Bloomberg US Aggregate Bond Index by 4.5% during the reporting period. |
| ● | The Fund is comprised of two underlying funds: the PGIM Quant Solutions Large-Cap Core Fund and the PGIM Total Return Bond Fund. The underlying equity position in the PGIM Quant Solutions Large-Cap Core Fund outperformed its benchmark, the S&P 500 Index, by 1.51% during the period. |
What didn’t work?
The underlying bond position in the PGIM Total Return Bond Fund underperformed its benchmark, the Bloomberg US Aggregate Bond Index, by 2.25% during the period.
PGIM 60/40 Allocation Fund 5
Strategy and Performance Overview* (continued)
Current outlook
| ● | PGIM Quantitative Solutions believes that the US economy is relatively insulated from the global downturn and remains supported by a strong labor market for now. Nevertheless, headwinds—including higher gasoline prices, negative real wage growth, and negative wealth effects from declining financial markets—persist. |
| ● | Central banks continue their attempts at walking a tightrope, looking to balance efforts to combat an intensifying inflation problem with increasing risks to growth stemming from multiple shocks and policy tightening. After initially misjudging the inflation problem as “transitory” and thus facing credibility challenges, central banks are likely to front-load rate hikes, increasing the risks of policy overtightening and economic downturn. |
| ● | Despite significant equity market declines and improved valuations, we remain cautious on stocks due to the combination of heightened recession risk, hawkish central banks, and significant potential for corporate earnings downgrades. |
| ● | The tough macro economic environment argues for caution on fixed income risk assets. However, some bond segments exhibit very attractive value (emerging market debt), while others have yet to fully price in recession risk (US high yield debt). |
| ● | Successful COVID-19 vaccine distributions and the robust size of policy stimulus have been key drivers of performance during the economic rebound. Preferential access to vaccines and the implementation of aggressive fiscal and monetary policies have led to a sharper rebound in developed economies. |
| ● | The US continues to lead the economic recovery in the developed world, supported by its comparatively high vaccination rate and fiscal stimulus measures. China and Taiwan are leading the recovery among emerging economies, as a new wave of infections are limiting growth in emerging markets outside of China. |
| ● | The surge in inflation during the period is fueling an intense debate among different groups. Generally, central banks outside of the US are taking a relatively benign view of rising inflation, describing it as “transitory.” In contrast, investment markets are more nervous that rising prices could herald in a new phase of higher costs following decades of low inflation and deflationary fears. |
| ● | Most developed market central banks remain on hold as they consider rising inflation to be a “transitory” phenomenon. Among emerging markets, there is a split between central banks that have begun to follow a path toward normalization as the recovery gains strength and other central banks still grappling with virus-related downside risks. |
* This strategy and performance overview, which discusses what strategies or holdings (including derivatives, if applicable) affected the Fund’s performance, is compiled based on how the Fund performed relative to the Fund’s assigned index and is viewed for performance attribution purposes at the aggregate Fund level, which in most instances will not directly correlate to the amounts disclosed in the Statement of Operations which conform to U.S. generally accepted accounting principles.
| 6 | Visit our website at pgim.com/investments |
As a shareholder of the Fund, you incur two types of costs: (1) transaction costs, including sales charges (loads) on purchase payments and redemptions, as applicable, and (2) ongoing costs, including management fees, distribution and/or service (12b-1) fees, and other Fund expenses, as applicable. This example is intended to help you understand your ongoing costs (in dollars) of investing in the Fund and to compare these costs with the ongoing costs of investing in other mutual funds.
The example is based on an investment of $1,000 held through the six-month period ended July 31, 2022. The example is for illustrative purposes only; you should consult the Prospectus for information on initial and subsequent minimum investment requirements.
Actual Expenses
The first line for each share class in the table on the following page provides information about actual account values and actual expenses. You may use the information on this line, together with the amount you invested, to estimate the expenses that you paid over the period. Simply divide your account value by $1,000 (for example, an $8,600 account value ÷ $1,000 = 8.6), then multiply the result by the number on the first line under the heading “Expenses Paid During the Six-Month Period” to estimate the expenses you paid on your account during this period.
Hypothetical Example for Comparison Purposes
The second line for each share class in the table on the following page provides information about hypothetical account values and hypothetical expenses based on the Fund’s actual expense ratio and an assumed rate of return of 5% per year before expenses, which is not the Fund’s actual return. The hypothetical account values and expenses may not be used to estimate the actual ending account balance or expenses you paid for the period. You may use this information to compare the ongoing costs of investing in the Fund and other funds. To do so, compare this 5% hypothetical example with the 5% hypothetical examples that appear in the shareholder reports of the other funds.
The Fund’s transfer agent may charge additional fees to holders of certain accounts that are not included in the expenses shown in the table on the following page. These fees apply to individual retirement accounts (IRAs) and Section 403(b) accounts. As of the close of the six-month period covered by the table, IRA fees included an annual maintenance fee of $15 per account (subject to a maximum annual maintenance fee of $25 for all accounts held by the same shareholder). Section 403(b) accounts are charged an annual $25 fiduciary maintenance fee. Some of the fees may vary in amount, or may be waived, based on your total account balance or the number of PGIM funds, including the Fund, that you own. You should consider the additional fees that were charged to your Fund account over the six-month period when you estimate the total ongoing expenses paid over the period and the impact of these fees on your ending account value, as these additional expenses are not reflected in the information
PGIM 60/40 Allocation Fund 7
Fees and Expenses (continued)
provided in the expense table. Additional fees have the effect of reducing investment returns.
Please note that the expenses shown in the table are meant to highlight your ongoing costs only and do not reflect any transactional costs such as sales charges (loads). Therefore, the second line for each share class in the table is useful in comparing ongoing costs only and will not help you determine the relative total costs of owning different funds. In addition, if these transactional costs were included, your costs would have been higher.
PGIM 60/40 Allocation Fund
| Beginning
| Ending
|
Annualized Expense Ratio Based on the
| Expenses Paid
| ||||||
| Class R6 | Actual | $1,000.00 | $ 927.50 | 0.40% | $1.91 | |||||
Hypothetical
| $1,000.00
| $1,022.81
| 0.40%
| $2.01
| ||||||
*Fund expenses (net of fee waivers or subsidies, if any) are equal to the annualized expense ratio (provided in the table), multiplied by the average account value over the period, multiplied by the 181 days in the six-month period ended July 31, 2022, and divided by the 365 days in the Fund’s fiscal year ended July 31, 2022 (to reflect the six-month period). Expenses presented in the table include the expenses of any underlying portfolios in which the Fund may invest.
| 8 | Visit our website at pgim.com/investments |
Schedule of Investments
as of July 31, 2022
| Description | Shares | Value | ||||||
LONG-TERM INVESTMENTS 99.9% | ||||||||
AFFILIATED MUTUAL FUNDS | ||||||||
PGIM Quant Solutions Large-Cap Core Fund (Class R6) | 2,844,703 | $ | 49,640,063 | |||||
PGIM Total Return Bond Fund (Class R6) | 2,578,891 | 32,829,279 | ||||||
|
| |||||||
TOTAL LONG-TERM INVESTMENTS | 82,469,342 | |||||||
|
| |||||||
SHORT-TERM INVESTMENT 0.1% | ||||||||
AFFILIATED MUTUAL FUND | ||||||||
PGIM Core Ultra Short Bond Fund | 101,563 | 101,563 | ||||||
|
| |||||||
TOTAL INVESTMENTS 100.0% | 82,570,905 | |||||||
Liabilities in excess of other assets (0.0)% | (36,181 | ) | ||||||
|
| |||||||
NET ASSETS 100.0% | $ | 82,534,724 | ||||||
|
| |||||||
Below is a list of the abbreviation(s) used in the annual report:
LIBOR—London Interbank Offered Rate
| (wd) | PGIM Investments LLC, the manager of the Fund, also serves as the manager of the underlying funds in which the Fund invests. |
Fair Value Measurements:
Various inputs are used in determining the value of the Fund’s investments. These inputs are summarized in the three broad levels listed below.
Level 1—unadjusted quoted prices generally in active markets for identical securities.
Level 2—quoted prices for similar securities, interest rates and yield curves, prepayment speeds, foreign currency exchange rates and other observable inputs.
Level 3—unobservable inputs for securities valued in accordance with Board approved fair valuation procedures.
See Notes to Financial Statements.
PGIM 60/40 Allocation Fund 9
PGIM 60/40 Allocation Fund
Schedule of Investments (continued)
as of July 31, 2022
The following is a summary of the inputs used as of July 31, 2022 in valuing such portfolio securities:
| Level 1 | Level 2 | Level 3 | ||||||
|
|
|
| |||||
Investments in Securities | ||||||||
Assets | ||||||||
Long-Term Investments | ||||||||
Affiliated Mutual Funds | $ | 82,469,342 | $— | $— | ||||
Short-Term Investment | ||||||||
Affiliated Mutual Fund | 101,563 | — | — | |||||
|
|
|
| |||||
Total | $ | 82,570,905 | $— | $— | ||||
|
|
|
| |||||
Investment Allocation:
The investment allocation of portfolio holdings and liabilities in excess of other assets shown as a percentage of net assets as of July 31, 2022 were as follows:
Large Cap | 60.1 | % | ||
Total Return Bond | 39.8 | |||
Short Term | 0.1 | |||
|
| |||
| 100.0 | ||||
Liabilities in excess of other assets | (0.0 | )* | ||
|
| |||
| 100.0 | % | |||
|
|
| * | Less than +/- 0.05% |
See Notes to Financial Statements.
10
Statement of Assets and Liabilities
as of July 31, 2022
Assets | ||||
Affiliated investments (cost $82,455,223) | $ | 82,570,905 | ||
Receivable for investments sold | 740,005 | |||
Due from Manager | 7,244 | |||
Prepaid expenses | 66 | |||
|
| |||
Total Assets | 83,318,220 | |||
|
| |||
Liabilities | ||||
Payable for investments purchased | 700,579 | |||
Accrued expenses and other liabilities | 47,711 | |||
Payable for Fund shares purchased | 34,295 | |||
Trustees’ fees payable | 893 | |||
Affiliated transfer agent fee payable | 18 | |||
|
| |||
Total Liabilities | 783,496 | |||
|
| |||
Net Assets | $ | 82,534,724 | ||
|
| |||
| ||||
Net assets were comprised of: | ||||
Shares of beneficial interest, at par | $ | 6,942 | ||
Paid-in capital in excess of par | 81,725,958 | |||
Total distributable earnings (loss) | 801,824 | |||
|
| |||
Net assets, July 31, 2022 | $ | 82,534,724 | ||
|
| |||
Class R6 | ||||
Net asset value, offering price and redemption price per share, | ||||
($82,534,724 ÷ 6,942,282 shares of beneficial interest issued and outstanding) | $ | 11.89 | ||
|
| |||
See Notes to Financial Statements.
PGIM 60/40 Allocation Fund 11
Statement of Operations
Year Ended July 31, 2022
Net Investment Income (Loss) | ||||
Affiliated dividend income | $ | 1,665,106 | ||
|
| |||
Expenses | ||||
Management fee | 16,572 | |||
Custodian and accounting fees | 45,963 | |||
Legal fees and expenses | 21,123 | |||
Audit fee | 20,500 | |||
Shareholders’ reports | 13,010 | |||
Trustees’ fees | 10,950 | |||
Pricing fees | 2,974 | |||
SEC registration fees | 1,804 | |||
Transfer agent’s fees and expenses (including affiliated expense of $102) | 156 | |||
Miscellaneous | 9,742 | |||
|
| |||
Total expenses | 142,794 | |||
Less: Fee waiver and/or expense reimbursement | (113,957 | ) | ||
|
| |||
Net expenses | 28,837 | |||
|
| |||
Net investment income (loss) | 1,636,269 | |||
|
| |||
Realized And Unrealized Gain (Loss) On Investments | ||||
Net realized gain (loss) on investment transactions (including affiliated of $(1,676,776)) | (1,672,354 | ) | ||
Net capital gain distributions received on affiliated investments | 6,691,501 | |||
|
| |||
| 5,019,147 | ||||
|
| |||
Net change in unrealized appreciation (depreciation) on affiliated investments | (12,387,169 | ) | ||
|
| |||
Net gain (loss) on affiliated investment transactions | (7,368,022 | ) | ||
|
| |||
Net Increase (Decrease) In Net Assets Resulting From Operations | $ | (5,731,753 | ) | |
|
| |||
See Notes to Financial Statements.
12
Statements of Changes in Net Assets
Year Ended July 31, | ||||||||
2022
| 2021
| |||||||
Increase (Decrease) in Net Assets | ||||||||
Operations | ||||||||
Net investment income (loss) | $ | 1,636,269 | $ | 935,269 | ||||
Net realized gain (loss) on investment transactions | (1,672,354 | ) | (94,058 | ) | ||||
Net capital gain distributions received | 6,691,501 | 294,121 | ||||||
Net change in unrealized appreciation (depreciation) on investments | (12,387,169 | ) | 9,044,994 | |||||
|
|
|
| |||||
Net increase (decrease) in net assets resulting from operations | (5,731,753 | ) | 10,180,326 | |||||
|
|
|
| |||||
Dividends and Distributions | ||||||||
Distributions from distributable earnings | ||||||||
Class R6 | (5,561,442 | ) | (1,216,736 | ) | ||||
|
|
|
| |||||
Fund share transactions | ||||||||
Net proceeds from shares sold (1,565,348 and 3,277,933 shares, respectively) | 20,559,822 | 40,911,412 | ||||||
Net asset value of shares issued in reinvestment of dividends and distributions (430,786 and 100,723 shares, respectively) | 5,561,442 | 1,216,736 | ||||||
Cost of shares purchased (699,905 and 532,096 shares, respectively) | (9,002,640 | ) | (6,648,545 | ) | ||||
|
|
|
| |||||
Net increase (decrease) in net assets from Fund share transactions | 17,118,624 | 35,479,603 | ||||||
|
|
|
| |||||
Total increase (decrease) | 5,825,429 | 44,443,193 | ||||||
Net Assets: | ||||||||
Beginning of year | 76,709,295 | 32,266,102 | ||||||
|
|
|
| |||||
End of year | $ | 82,534,724 | $ | 76,709,295 | ||||
|
|
|
| |||||
See Notes to Financial Statements.
PGIM 60/40 Allocation Fund 13
PGIM 60/40 Allocation Fund
Financial Highlights
Class R6 Shares | |||||||||||||||||||||||||||||||||||
| September 13, 2017(a) | |||||||||||||||||||||||||||||||||||
Year Ended July 31, | through July 31, | ||||||||||||||||||||||||||||||||||
| 2022 | 2021 | 2020 | 2019 | 2018 | |||||||||||||||||||||||||||||||
Per Share Operating Performance(b): | |||||||||||||||||||||||||||||||||||
Net Asset Value, Beginning of Period | $13.59 | $11.53 | $11.09 | $10.77 | $ | 10.00 | |||||||||||||||||||||||||||||
Income (loss) from investment operations: | |||||||||||||||||||||||||||||||||||
Net investment income (loss) | 0.25 | 0.22 | 0.24 | 0.20 | 0.14 | ||||||||||||||||||||||||||||||
Net realized and unrealized gain (loss) on investment transactions | (1.04 | ) | 2.15 | 0.72 | 0.47 | 0.78 | |||||||||||||||||||||||||||||
Total from investment operations | (0.79 | ) | 2.37 | 0.96 | 0.67 | 0.92 | |||||||||||||||||||||||||||||
Less Dividends and Distributions: | |||||||||||||||||||||||||||||||||||
Dividends from net investment income | (0.85 | ) | (0.19 | ) | (0.33 | ) | (0.34 | ) | (0.15 | ) | |||||||||||||||||||||||||
Distributions from net realized gains | (0.06 | ) | (0.12 | ) | (0.19 | ) | (0.01 | ) | - | ||||||||||||||||||||||||||
Total dividends and distributions | (0.91 | ) | (0.31 | ) | (0.52 | ) | (0.35 | ) | (0.15 | ) | |||||||||||||||||||||||||
Net asset value, end of period | $11.89 | $13.59 | $11.53 | $11.09 | $ | 10.77 | |||||||||||||||||||||||||||||
Total Return(c): | (6.34 | )% | 20.93 | % | 8.75 | % | 6.73 | % | 9.30 | % | |||||||||||||||||||||||||
Ratios/Supplemental Data: | |||||||||||||||||||||||||||||||||||
Net assets, end of period (000) | $ | 82,535 | $ | 76,709 | $ | 32,266 | $ | 17,019 | $ | 2,899 | |||||||||||||||||||||||||
Average net assets (000) | $ | 82,858 | $ | 53,068 | $ | 23,312 | $9,866 | $381 | |||||||||||||||||||||||||||
Ratios to average net assets(d): |
| ||||||||||||||||||||||||||||||||||
Expenses after waivers and/or expense reimbursement | 0.03 | % | 0.04 | % | 0.03 | % | 0.03 | % | 0.02 | %(e) | |||||||||||||||||||||||||
Expenses before waivers and/or expense reimbursement | 0.17 | % | 0.27 | % | 0.72 | % | 1.78 | % | 28.47 | %(e) | |||||||||||||||||||||||||
Net investment income (loss) | 1.97 | % | 1.76 | % | 2.15 | % | 1.87 | % | 1.46 | %(e) | |||||||||||||||||||||||||
Portfolio turnover rate(f) | 20 | % | 22 | % | 30 | % | 31 | % | 37 | % | |||||||||||||||||||||||||
| (a) | Commencement of operations. |
| (b) | Calculated based on average shares outstanding during the period. |
| (c) | Total return is calculated assuming a purchase of a share on the first day and a sale on the last day of each period reported and includes reinvestment of dividends and distributions, if any. Total returns may reflect adjustments to conform to GAAP. Total returns for periods less than one full year are not annualized. |
| (d) | Does not include expenses of the underlying funds in which the Fund invests. Expenses waived/reimbursed include those of underlying funds in which the Fund invests. Consequently, the amount waived/reimbursed may be greater than the expense ratio reflected in the financial highlights. |
| (e) | Annualized. |
| (f) | The Fund’s portfolio turnover rate is calculated in accordance with regulatory requirements, without regard to transactions involving short-term investments, certain derivatives and in-kind transactions (if any). If such transactions were included, the Fund’s portfolio turnover rate may be higher. |
See Notes to Financial Statements.
14
Notes to Financial Statements
| 1. | Organization |
Prudential Investment Portfolios 5 (the “Registered Investment Company” or “RIC”) is registered under the Investment Company Act of 1940, as amended (“1940 Act”), as an open-end management investment company. The RIC is organized as a Delaware Statutory Trust. These financial statements relate only to the PGIM 60/40 Allocation Fund (the “Fund”), a series of the RIC. The Fund is classified as a diversified fund for purposes of the 1940 Act.
The investment objective of the Fund is to seek a balance between growth and conservation of capital.
The Fund pursues its objective by primarily investing in a portfolio of other mutual funds within the PGIM fund family (collectively, the “Underlying Funds”) that provide exposure to equity and fixed income.
| 2. | Accounting Policies |
The Fund follows the investment company accounting and reporting guidance of the Financial Accounting Standards Board (“FASB”) Accounting Standard Codification (“ASC”) Topic 946 Financial Services — Investment Companies. The following is a summary of significant accounting policies followed by the Fund in the preparation of its financial statements. The policies conform to U.S. generally accepted accounting principles (“GAAP”). The Fund consistently follows such policies in the preparation of its financial statements.
Securities Valuation: The Fund holds securities and other assets and liabilities that are fair valued as of the close of each day (generally, 4:00 PM Eastern time) the New York Stock Exchange (“NYSE”) is open for trading. As described in further detail below, the Fund’s investments are valued daily based on a number of factors, including the type of investment and whether market quotations are readily available. The RIC’s Board of Trustees (the “Board”) has adopted valuation procedures for security valuation under which fair valuation responsibilities have been delegated to PGIM Investments LLC (“PGIM Investments” or the “Manager”). Pursuant to the Board’s delegation, the Manager has established a Valuation Committee responsible for supervising the fair valuation of portfolio securities and other assets and liabilities. The valuation procedures permit the Fund to utilize independent pricing vendor services, quotations from market makers, and alternative valuation methods when market quotations are either not readily available or not deemed representative of fair value. Fair value is the price that would be received to sell an asset or paid to transfer a liability in an orderly transaction between market participants on the measurement date. A record of the Valuation Committee’s actions is subject to the Board’s review at its first quarterly meeting following the quarter in which such actions take place.
PGIM 60/40 Allocation Fund 15
Notes to Financial Statements (continued)
For the fiscal reporting year-end, securities and other assets and liabilities were fair valued at the close of the last U.S. business day. Trading in certain foreign securities may occur when the NYSE is closed (including weekends and holidays). Because such foreign securities trade in markets that are open on weekends and U.S. holidays, the values of some of the Fund’s foreign investments may change on days when investors cannot purchase or redeem Fund shares.
Various inputs determine how the Fund’s investments are valued, all of which are categorized according to the three broad levels (Level 1, 2, or 3) detailed in the Schedule of Investments and referred to herein as the “fair value hierarchy” in accordance with FASB ASC Topic 820 - Fair Value Measurement.
Investments in open-end funds (other than exchange-traded funds) are valued at their net asset values as of the close of the NYSE on the date of valuation. These securities are classified as Level 1 in the fair value hierarchy since they may be purchased or sold at their net asset values on the date of valuation.
Securities and other assets that cannot be priced according to the methods described above are valued based on pricing methodologies approved by the Board. In the event that unobservable inputs are used when determining such valuations, the securities will be classified as Level 3 in the fair value hierarchy. Altering one or more unobservable inputs may result in a significant change to a Level 3 security’s fair value measurement.
When determining the fair value of securities, some of the factors influencing the valuation include: the nature of any restrictions on disposition of the securities; assessment of the general liquidity of the securities; the issuer’s financial condition and the markets in which it does business; the cost of the investment; the size of the holding and the capitalization of the issuer; the prices of any recent transactions or bids/offers for such securities or any comparable securities; any available analyst media or other reports or information deemed reliable by the Manager regarding the issuer or the markets or industry in which it operates. Using fair value to price securities may result in a value that is different from a security’s most recent closing price and from the price used by other unaffiliated mutual funds to calculate their net asset values.
Securities Transactions and Net Investment Income: Securities transactions are recorded on the trade date. Realized gains (losses) from investment and currency transactions are calculated on the specific identification method. Dividend income is recorded on the ex-date, or for certain foreign securities, when the Fund becomes aware of such dividends. Expenses are recorded on an accrual basis, which may require the use of certain estimates by management that may differ from actual.
16
Taxes: It is the Fund’s policy to continue to meet the requirements of the Internal Revenue Code applicable to regulated investment companies and to distribute all of its taxable net investment income and capital gains, if any, to its shareholders. Therefore, no federal income tax provision is required.Withholding taxes on foreign dividends, interest and capital gains, if any, are recorded, net of reclaimable amounts, at the time the related income is earned.
Dividends and Distributions: Dividends and distributions to shareholders, which are determined in accordance with federal income tax regulations and which may differ from GAAP, are recorded on the ex-date. Permanent book/tax differences relating to income and gain (loss) are reclassified between total distributable earnings (loss) and paid-in capital in excess of par, as appropriate. The chart below sets forth the expected frequency of dividend and capital gains distributions to shareholders. Various factors may impact the frequency of dividend distributions to shareholders, including but not limited to adverse market conditions or portfolio holding-specific events.
| Expected Distribution Schedule to Shareholders* | Frequency | |
| Net Investment Income | Annually | |
| Short-Term Capital Gains | Annually | |
| Long-Term Capital Gains | Annually |
* Under certain circumstances, the Fund may make more than one distribution of short-term and/or long-term capital gains during a fiscal year.
Estimates: The preparation of financial statements requires management to make estimates and assumptions that affect the reported amounts and disclosures in the financial statements. Actual results could differ from those estimates.
| 3. | Agreements |
The RIC, on behalf of the Fund, has a management agreement with the Manager. Pursuant to this agreement, the Manager has responsibility for all investment advisory services and supervises the subadviser’s performance of such services.
The Manager has entered into a subadvisory agreement with PGIM Quantitative Solutions LLC (formerly known as QMA LLC) (“PGIM Quantative Solutions” or the “subadviser”). The Manager pays for the services of the subadviser.
Fees payable under the management agreement are computed daily and paid monthly. For the reporting period ended July 31, 2022, the contractual and effective management fee rates were as follows:
| Contractual Management Rate | Effective Management Fee, before any waivers and/or expense reimbursements | |
| 0.02% of average daily net assets | 0.02% |
PGIM 60/40 Allocation Fund 17
Notes to Financial Statements (continued)
The Manager has contractually agreed, through November 30, 2023, to limit total annual operating expenses after fee waivers and/or expense reimbursements. This contractual waiver includes acquired fund fees and expenses, and excludes Fund and any acquired fund interest, brokerage, taxes (such as income and foreign withholding taxes, stamp duty and deferred tax expenses), extraordinary expenses, and certain other Fund expenses such as dividend and interest expense and broker charges on short sales. Fees and/or expenses waived and/or reimbursed by the Manager may be recouped by the Manager within the same fiscal year during which such waiver and/or reimbursement is made if such recoupment can be realized without exceeding the expense limit in effect at the time of the recoupment for that fiscal year. The expense limitations attributable to below class is:
Expense | ||
Class
| Limitations
| |
R6
|
0.40%
|
The RIC, on behalf of the Fund, has a distribution agreement with Prudential Investment Management Services LLC (“PIMS”), which acts as the distributor of the Class R6 shares of the Fund. No distribution or service fees are paid to PIMS as distributor for Class R6 shares of the Fund.
PGIM Investments, PIMS and PGIM Quantitative Solutions are indirect, wholly-owned subsidiaries of Prudential Financial, Inc. (“Prudential”).
| 4. | Other Transactions with Affiliates |
Prudential Mutual Fund Services LLC (“PMFS”), an affiliate of PGIM Investments and an indirect, wholly-owned subsidiary of Prudential, serves as the Fund’s transfer agent. Transfer agent’s fees and expenses in the Statement of Operations include certain out-of-pocket expenses paid to non-affiliates, where applicable.
The Fund may invest its overnight sweep cash in the PGIM Core Ultra Short Bond Fund (the “Core Fund”), a series of PGIM Investments and/or its affiliates are paid fees or reimbursed for providing their services to the Core Fund. Prudential Investment Portfolios 2, registered under the 1940 Act and managed by PGIM Investments. PGIM Investments and/or its affiliates are paid fees or reimbursed for providing their services to the Core Fund. In addition to the realized and unrealized gains on investments in the Core Fund, earnings from such investments are disclosed on the Statement of Operations as “Affiliated dividend income”.
18
| 5. | Portfolio Securities |
The aggregate cost of purchases and proceeds from sales of portfolio securities (excluding short-term investments and U.S. Government securities) for the reporting period ended July 31, 2022, were as follows:
Cost of Purchases
|
Proceeds from Sales
| |
$36,157,741
| $16,270,330
|
A summary of the cost of purchases and proceeds from sales of shares of affiliated mutual funds for the year ended July 31, 2022, is presented as follows:
Value, Beginning of Year
| Cost of Purchases
| Proceeds
|
Change in (Loss)
| Realized Gain (Loss)
| Value, End of Year
| Shares, of Year
| Dividend
| Capital Gain
| ||||||||||||||||||||||||
Long-Term Investments - Affiliated Mutual Funds(wd):
|
| |||||||||||||||||||||||||||||||
PGIM Quant Solutions Large-Cap Core Fund (Class R6) | ||||||||||||||||||||||||||||||||
| $45,808,343 | $22,235,187 | $ 9,639,765 | $ (7,892,966 | ) | $ (870,736) | $49,640,063 | 2,844,703 | $ 557,519 | $6,691,501 | |||||||||||||||||||||||
PGIM Total Return Bond Fund (Class R6) | ||||||||||||||||||||||||||||||||
| 30,837,533 | 13,922,554 | 6,630,565 | (4,494,203 | ) | (806,040) | 32,829,279 | 2,578,891 | 1,107,161 | — | |||||||||||||||||||||||
| $76,645,876 | $36,157,741 | $16,270,330 | $(12,387,169 | ) | $(1,676,776) | $82,469,342 | $1,664,680 | $6,691,501 | ||||||||||||||||||||||||
Short-Term Investments - Affiliated Mutual Fund(wd):
|
| |||||||||||||||||||||||||||||||
PGIM Core Ultra Short Bond Fund | ||||||||||||||||||||||||||||||||
| $ 96,656 | $ 213,175 | $ 208,268 | $ — | $ — | $ 101,563 | 101,563 | $ 426 | $ — | ||||||||||||||||||||||||
| $76,742,532 | $36,370,916 | $16,478,598 | �� | $(12,387,169 | ) | $(1,676,776) | $82,570,905 | $1,665,106 | $6,691,501 | |||||||||||||||||||||||
| (wd) | PGIM Investments LLC, the manager of the Fund, also serves as the manager of the underlying funds in which the Fund invests. |
| 6. | Distributions and Tax Information |
Distributions to shareholders, which are determined in accordance with federal income tax regulations and which may differ from GAAP, are recorded on the ex-date.
For the year ended July 31, 2022, the tax character of dividends paid by the Fund were $5,252,463 of ordinary income and $308,979 of long-term capital gains. For the year ended July 31, 2021, the tax character of dividends paid by the Fund were $758,520 of ordinary income and $458,216 of long-term capital gains.
As of July 31, 2022, the accumulated undistributed earnings on a tax basis were $787,843 of ordinary income and $2,358,550 of long-term capital gains.
PGIM 60/40 Allocation Fund 19
Notes to Financial Statements (continued)
The United States federal income tax basis of the Funds’ investments and the net unrealized depreciation as of July 31, 2022 were as follows:
| Tax Basis |
Gross Unrealized Appreciation
| Gross Unrealized Depreciation | Net Unrealized Depreciation | |||||||
$84,915,474
| $3,749,663
| $(6,094,232)
| $(2,344,569)
|
The difference between GAAP and tax basis was primarily attributable to deferred losses on wash sales.
The Manager has analyzed the Fund’s tax positions taken on federal, state and local income tax returns for all open tax years and has concluded that no provision for income tax is required in the Fund’s financial statements for the current reporting period. Since tax authorities can examine previously filed tax returns, the Fund’s U.S. federal and state tax returns for each of the four fiscal years up to the most recent fiscal year ended July 31, 2022 are subject to such review.
| 7. | Capital and Ownership |
The RIC is authorized to issue an unlimited number of shares of beneficial interest of the Fund, at $0.001 par value per share, currently divided into one class, designated Class R6 shares.
Under certain circumstances, an exchange may be made from specified share classes of the Fund to one or more other share classes of the Fund as presented in the table of transactions in shares of beneficial interest, below.
As of July 31, 2022, Prudential, through its affiliated entities, including affiliated funds (if applicable), owned shares of the Fund as follows:
Class
| Number of Shares
| Percentage of Outstanding Shares
| ||
R6
| 6,941,590
| 99.9%
|
At the reporting period end, the number of shareholders holding greater than 5% of the Fund are as follows:
Number of Shareholders
| Percentage of Outstanding Shares
| |||
Affiliated | 1 | 99.9% | ||
Unaffiliated
| —
| —
|
20
| 8. | Borrowings |
The RIC, on behalf of the Fund, along with other affiliated registered investment companies (the “Participating Funds”), is a party to a Syndicated Credit Agreement (“SCA”) with a group of banks. The purpose of the SCA is to provide an alternative source of temporary funding for capital share redemptions. The table below provides details of the current SCA in effect at the reporting period-end as well as the prior SCA.
| Current SCA | Prior SCA | |||
Term of Commitment | 10/1/2021 – 9/29/2022 | 10/2/2020 – 9/30/2021 | ||
Total Commitment | $ 1,200,000,000 | $ 1,200,000,000 | ||
| Annualized Commitment Fee on the Unused Portion of the SCA | 0.15% | 0.15% | ||
Annualized Interest Rate on Borrowings | 1.20% plus the higher of (1) the effective federal funds rate, (2) the one-month LIBOR rate or (3) zero percent | 1.30% plus the higher of (1) the effective federal funds rate, (2) the one-month LIBOR rate or (3) zero percent | ||
Certain affiliated registered investment companies that are parties to the SCA include portfolios that are subject to a predetermined mathematical formula used to manage certain benefit guarantees offered under variable annuity contracts. The formula may result in large scale asset flows into and out of these portfolios. Consequently, these portfolios may be more likely to utilize the SCA for purposes of funding redemptions. It may be possible for those portfolios to fully exhaust the committed amount of the SCA, thereby requiring the Manager to allocate available funding per a Board-approved methodology designed to treat the Participating Funds in the SCA equitably.
The Fund did not utilize the SCA during the year ended July 31, 2022.
| 9. | Risks of Investing in the Fund |
The risks of the Fund and/or the Underlying Funds risks include, but are not limited to, some or all of the risks discussed below. For further information on the Fund’s risks, please refer to the Fund’s Prospectus and Statement of Additional Information.
Affiliated Funds Risk: The Fund’s Manager serves as manager of the Underlying Funds. In addition, the Fund invests in certain Underlying Funds for which the subadviser serves as subadviser. It is possible that a conflict of interest among the Fund and the Underlying Funds could affect how the Manager and subadviser fulfill their fiduciary duties to the Fund and the Underlying Funds. For example, the subadviser may have an incentive to allocate the Fund’s assets to those Underlying Funds for which the fees paid to the Manager or the subadviser are higher than the fees paid by other Underlying Funds for which the subadviser also serves as a subadviser. However, the Fund has adopted procedures to mitigate these concerns.
Asset Allocation Risk: The Fund’s risks will directly correspond to the risks of the Underlying Funds in which it invests. The selection of the Underlying Funds and the allocation of the
PGIM 60/40 Allocation Fund 21
Notes to Financial Statements (continued)
Fund’s assets among the various asset classes and market sectors could cause the Fund to underperform other funds with a similar investment objective.
Asset Class Variation Risk: The Underlying Funds invest principally in the securities constituting their asset class (i.e., equity and fixed income). However, under normal market conditions, an Underlying Fund may vary the percentage of assets in these securities (subject to any applicable regulatory requirements). Depending on the percentage of securities in a particular asset class held by the Underlying Funds at any given time and the percentage of the Fund’s assets invested in various Underlying Funds, the Fund’s actual exposure to the securities in a particular asset class may vary substantially from the allocation to that asset class. There is a risk that the Manager’s evaluations and assumptions regarding asset classes or Underlying Funds may be incorrect in view of actual market conditions.
Credit Risk: This is the risk that the issuer, the guarantor or the insurer of a fixed income security, or the counterparty to a contract may be unable or unwilling to make timely principal and interest payments or to otherwise honor its obligations. Additionally, the securities could lose value due to a loss of confidence in the ability of the issuer, guarantor, insurer or counterparty to pay back debt. The longer the maturity and the lower the credit quality of a bond, the more sensitive it is to credit risk.
Economic and Market Events Risk: Events in the US and global financial markets, including actions taken by the US Federal Reserve or foreign central banks to stimulate or stabilize economic growth or the functioning of the securities markets, may at times result in unusually high market volatility, which could negatively impact performance. Relatively reduced liquidity in credit and fixed income markets could adversely affect issuers worldwide.
Equity and Equity-Related Securities Risks: Certain Underlying Funds invest in equity and equity-related securities. Equity and equity-related securities may be subject to changes in value, and their values may be more volatile than those of other asset classes. In addition to an individual security losing value, the value of the equity markets or a sector in which an Underlying Fund invests could go down. An Underlying Fund’s holdings can vary significantly from broad market indices and the performance of the Underlying Fund can deviate from the performance of these indices. Different parts of a market can react differently to adverse issuer, market, regulatory, political and economic developments.
Fixed Income Risk: As with credit risk, market risk and interest rate risk, an Underlying Fund’s holdings, share price, yield and total return may fluctuate in response to bond market movements. The value of bonds may decline for issuer-related reasons, including management performance, financial leverage and reduced demand for the issuer’s goods
22
and services. Certain types of fixed income obligations also may be subject to call and redemption risk, which is the risk that the issuer may call a bond held by an Underlying Fund for redemption before it matures and the Underlying Fund may lose income.
Fund of Funds Risk: The value of an investment in the Fund will be related, to a substantial degree, to the investment performance of the Underlying Funds in which it invests. Therefore, the principal risks of investing in the Fund are closely related to the principal risks associated with these Underlying Funds and their investments. Because the Fund’s allocation among different Underlying Funds and direct investments in securities and derivatives will vary, an investment in the Fund may be subject to any and all of these risks at different times and to different degrees. Investing in an Underlying Fund will also expose the Fund to a pro rata portion of the Underlying Fund’s fees and expenses. In addition, one Underlying Fund may buy the same securities that another Underlying Fund sells. Therefore, the Fund would indirectly bear the costs of these trades without accomplishing the investment purpose.
Fund Rebalancing Risk: Underlying Funds may experience relatively large redemptions or investments due to a rebalancing of the Fund’s allocations. In such event, an Underlying Fund may be required to sell securities or to invest cash at a time when it is not advantageous to do so. Rebalancing may increase brokerage and/or other transaction costs of an Underlying Fund, increase the Underlying Fund’s expenses or result in the Underlying Fund’s becoming too small to be economically viable. Rebalancing may also adversely affect an Underlying Fund’s performance and thus the Fund’s performance. The impact of rebalancing is likely to be greater when the Fund purchases, redeems or invests in a substantial portion of an Underlying Fund.
The subadviser will seek to cooperate with the subadvisers of the Underlying Funds to minimize any adverse impact on the Underlying Funds. The subadvisers of the Underlying Funds may take such actions as they deem appropriate to minimize such adverse impact, considering the potential benefits of such investments to the Underlying Funds and consistent with their obligations to the Underlying Funds. Such actions may delay the rebalancing of the Fund’s investments in the event of significant market or other events that may require more rapid action.
Increase in Expenses Risk: Your actual cost of investing in the Fund may be higher than the expenses shown in the Prospectus expense table for a variety of reasons. For example, expense ratios may be higher than those shown if average net assets decrease. Net assets are more likely to decrease and Fund expense ratios are more likely to increase when markets are volatile. Active and frequent trading of Underlying Fund securities can increase expenses.
Interest Rate Risk: The value of your investment may go down when interest rates rise. A rise in rates tends to have a greater impact on the prices of longer term or duration debt securities. For example, a fixed income security with a duration of three years is expected to decrease in value by approximately 3% if interest rates increase by 1%. This is referred to as
PGIM 60/40 Allocation Fund 23
Notes to Financial Statements (continued)
“duration risk.” When interest rates fall, the issuers of debt obligations may prepay principal more quickly than expected, and the Fund may be required to reinvest the proceeds at a lower interest rate. This is referred to as “prepayment risk.” When interest rates rise, debt obligations may be repaid more slowly than expected, and the value of the Fund’s holdings may fall sharply. This is referred to as “extension risk.” The Fund may lose money if short-term or long-term interest rates rise sharply or in a manner not anticipated by the subadviser.
Investment Style Risk: Under certain market conditions, growth investments have performed better during the later stages of economic expansion and value investments have performed better during periods of economic recovery. Therefore, these investment styles may over time go in and out of favor. At times when an investment style used by an Underlying Fund is out of favor, the Fund may underperform other funds that use different investment styles.
Junk Bonds Risk: High-yield, high-risk bonds have predominantly speculative characteristics, including particularly high credit risk. Junk bonds tend to be less liquid than higher-rated securities. The liquidity of particular issuers or industries within a particular investment category may shrink or disappear suddenly and without warning. The non-investment grade bond market can experience sudden and sharp price swings and become illiquid due to a variety of factors, including changes in economic forecasts, stock market activity, large sustained sales by major investors, a high profile default or a change in the market’s psychology.
Large Capitalization Company Risk: Companies with large market capitalizations go in and out of favor based on market and economic conditions. Larger companies tend to be less volatile than companies with smaller market capitalizations. In exchange for this potentially lower risk, the Fund’s value may not rise or fall as much as the value of funds that emphasize companies with smaller market capitalizations.
Large Shareholder and Large Scale Redemption Risk: Certain individuals, accounts, funds (including funds affiliated with the Manager) or institutions, including the Manager and its affiliates, may from time to time own or control a substantial amount of the Fund’s shares. There is no requirement that these entities maintain their investment in the Fund. There is a risk that such large shareholders or that the Fund’s shareholders generally may redeem all or a substantial portion of their investments in the Fund in a short period of time, which could have a significant negative impact on the Fund’s NAV, liquidity, and brokerage costs. Large redemptions could also result in tax consequences to shareholders and impact the Fund’s ability to implement its investment strategy. The Fund’s ability to pursue its investment objective after one or more large scale redemptions may be impaired and, as a result, the Fund may invest a larger portion of its assets in cash or cash equivalents.
24
LIBOR Risk: Many financial instruments use or may use a floating rate based on the London Interbank Offered Rate, or “LIBOR,” which is the offered rate for short-term Eurodollar deposits between major international banks. Over the course of the last several years, global regulators have indicated an intent to phase out the use of LIBOR and similar interbank offering rates (“IBOR”). There still remains uncertainty regarding the nature of any replacement rates for LIBOR and the other IBORs as well as around fallback approaches for instruments extending beyond the any phase-out of these reference rates. The lack of consensus around replacement rates and the uncertainty of the phase out of LIBOR and other IBORs may result in increased volatility in corporate or governmental debt, bank loans, derivatives and other instruments invested in by the Fund as well as loan facilities used by the Fund.
The potential effect of a transition away from LIBOR on the Fund or the financial instruments in which the Fund invests cannot yet be determined. The elimination of LIBOR or changes to other reference rates or any other changes or reforms to the determination or supervision of reference rates could have an adverse impact on the market for, or value of, any securities or payments linked to those reference rates, which may adversely affect the Fund’s performance and/or net asset value. Certain proposed replacement rates to LIBOR, such as the Secured Overnight Financing Rate (“SOFR”), are materially different from LIBOR, and changes in the applicable spread for instruments previously linked to LIBOR will need to be made in order for instruments to pay similar rates. Uncertainty and risk also remain regarding the willingness and ability of issuers and lenders to include revised provisions in new and existing contracts or instruments. Consequently, the transition away from LIBOR to other reference rates may lead to reduced coupons on debt held by the Fund, higher rates required to be paid by the Fund on bank lines of credit due to increases in spreads, increased volatility and illiquidity in markets that are tied to LIBOR, fluctuations in values of LIBOR-related investments or investments in issuers that utilize LIBOR, increased difficulty in borrowing or refinancing and diminished effectiveness of hedging strategies, adversely affecting the Fund’s performance. Furthermore, the risks associated with the expected discontinuation of LIBOR and transition may be exacerbated if the work necessary to effect an orderly transition to an alternative reference rate is not completed in a timely manner. Because the usefulness of LIBOR and the other IBORs as benchmarks could deteriorate during the transition period, these effects could begin to be experienced by the end of 2021 and beyond until the anticipated discontinuance date in 2023 for the majority of the LIBOR rates.
Management Risk: The value of your investment may decrease if judgments by the Fund’s subadviser or the subadvisers of the Underlying Funds about the attractiveness, value or market trends affecting a particular security, industry or sector or about market movements are incorrect.
Market Disruption and Geopolitical Risks: International wars or conflicts and geopolitical developments in foreign countries, along with instability in regions such as Asia, Eastern Europe, and the Middle East, possible terrorist attacks in the United States or around the world, public health epidemics such as the outbreak of infectious diseases like the outbreak
PGIM 60/40 Allocation Fund 25
Notes to Financial Statements (continued)
of COVID-19 globally in 2020 or the 2014–2016 outbreak in West Africa of the Ebola virus, and other similar events could adversely affect the U.S. and foreign financial markets, including increases in market volatility, reduced liquidity in the securities markets and government intervention, and may cause further long-term economic uncertainties in the United States and worldwide generally. The coronavirus pandemic and the related governmental and public responses have had and may continue to have an impact on the Fund’s investments and net asset value and have led and may continue to lead to increased market volatility and the potential for illiquidity in certain classes of securities and sectors of the market. Preventative or protective actions that governments may take in respect of pandemic or epidemic diseases may result in periods of business disruption, business closures, inability to obtain raw materials, supplies and component parts, and reduced or disrupted operations for the issuers in which the Fund invests. Government intervention in markets may impact interest rates, market volatility and security pricing. The occurrence, reoccurrence and pendency of such diseases could adversely affect the economies (including through changes in business activity and increased unemployment) and financial markets either in specific countries or worldwide.
Market Risk: Securities markets may be volatile and the market prices of an Underlying Fund’s securities may decline. Securities fluctuate in price based on changes in an issuer’s financial condition and overall market and economic conditions. If the market prices of the securities owned by an Underlying Fund fall, the value of the Fund’s investment in the Underlying Fund will decline.
Portfolio Turnover Risk: The Fund does not intend to re-allocate assets among the Underlying Funds frequently in response to day-to-day changes in markets. Historically, however, certain Underlying Funds have actively and frequently traded their portfolio securities. High portfolio turnover results in higher transaction costs and can affect an Underlying Fund’s, and, therefore, the Fund’s, performance and can have adverse tax consequences.
| 10. | Recent Accounting Pronouncement and Regulatory Developments |
In March 2020, the FASB issued Accounting Standard Update (“ASU”) No. 2020-04, which provides optional guidance for applying GAAP to contract modifications, hedging relationships and other transactions affected by the reference rate reform if certain criteria are met. ASU 2020-04 is elective and is effective on March 12, 2020 through December 31, 2022. Management does not expect ASU 2020-04 to have a material impact on the financial statements.
26
Report of Independent Registered Public Accounting Firm
To the Board of Trustees of Prudential Investment Portfolios 5 and Shareholders of PGIM 60/40 Allocation Fund
Opinion on the Financial Statements
We have audited the accompanying statement of assets and liabilities, including the schedule of investments, of PGIM 60/40 Allocation Fund (one of the funds constituting Prudential Investment Portfolios 5, referred to hereafter as the “Fund”) as of July 31, 2022, the related statement of operations for the year ended July 31, 2022, the statements of changes in net assets for each of the two years in the period ended July 31, 2022, including the related notes, and the financial highlights for each of the two years in the period ended July 31, 2022 (collectively referred to as the “financial statements”). In our opinion, the financial statements present fairly, in all material respects, the financial position of the Fund as of July 31, 2022, the results of its operations for the year then ended, and the changes in its net assets and the financial highlights for each of the two years in the period ended July 31, 2022 in conformity with accounting principles generally accepted in the United States of America.
The financial statements of the Fund as of and for the year ended July 31, 2020 and the financial highlights for each of the periods ended on or prior to July 31, 2020 (not presented herein, other than the financial highlights) were audited by other auditors whose report dated September 18, 2020 expressed an unqualified opinion on those financial statements and financial highlights.
Basis for Opinion
These financial statements are the responsibility of the Fund’s management. Our responsibility is to express an opinion on the Fund’s financial statements based on our audits. We are a public accounting firm registered with the Public Company Accounting Oversight Board (United States) (PCAOB) and are required to be independent with respect to the Fund in accordance with the U.S. federal securities laws and the applicable rules and regulations of the Securities and Exchange Commission and the PCAOB.
We conducted our audits of these financial statements in accordance with the standards of the PCAOB. Those standards require that we plan and perform the audit to obtain reasonable assurance about whether the financial statements are free of material misstatement, whether due to error or fraud.
Our audits included performing procedures to assess the risks of material misstatement of the financial statements, whether due to error or fraud, and performing procedures that respond to those risks. Such procedures included examining, on a test basis, evidence regarding the amounts and disclosures in the financial statements. Our audits also included evaluating the accounting principles used and significant estimates made by management, as well as evaluating the overall presentation of the financial statements. Our procedures included confirmation of securities owned as of July 31, 2022 by correspondence with the transfer agent. We believe that our audits provide a reasonable basis for our opinion.
/s/PricewaterhouseCoopers LLP
New York, New York
September 19, 2022
We have served as the auditor of one or more investment companies in the PGIM Retail Funds complex since 2020.
PGIM 60/40 Allocation Fund 27
Tax Information (unaudited)
We are advising you that during the fiscal year ended July 31, 2022, the Fund reported the maximum amount allowed per share but not less than $.05 per share for Class R6 shares as a capital gain distribution in accordance with Section 852(b)(3)(C) of the Internal Revenue Code.
For the year ended July 31, 2022, the Fund reports, in accordance with Section 854 of the Internal Revenue Code, the following percentages of the ordinary income dividends paid as 1) qualified dividend income (QDI); and 2) eligible for corporate dividends received deduction (DRD):
| Fund | QDI | DRD | ||||||
PGIM 60/40 Allocation Fund | 13.86 | % | 13.91 | % | ||||
In January 2023, you will be advised on IRS Form 1099-DIV or substitute 1099-DIV, as to the federal tax status of dividends and distributions received by you in calendar year 2022.
28
Liquidity Risk Management Program
(unaudited)
Consistent with Rule 22e-4 under the 1940 Act (the “Liquidity Rule”), the Fund has adopted and implemented a liquidity risk management program (the “LRMP”). The Fund’s LRMP seeks to assess and manage the Fund’s liquidity risk, which is defined as the risk that the Fund is unable to meet investor redemption requests without significantly diluting the remaining investors’ interests in the Fund. The Board has approved PGIM Investments LLC (“PGIM Investments”), the Fund’s investment manager, to serve as the administrator of the Fund’s LRMP. As part of its responsibilities as administrator, PGIM Investments has retained a third party to perform certain functions, including providing market data and liquidity classification model information.
The Fund’s LRMP includes a number of processes designed to support the assessment and management of its liquidity risk. In particular, the Fund’s LRMP includes no less than annual assessments of factors that influence the Fund’s liquidity risk; no less than monthly classifications of the Fund’s investments into one of four liquidity classifications provided for in the Liquidity Rule; a 15% of net assets limit on the acquisition of “illiquid investments” (as defined under the Liquidity Rule); establishment of a minimum percentage of the Fund’s assets to be invested in investments classified as “highly liquid” (as defined under the Liquidity Rule) if the Fund does not invest primarily in highly liquid investments; and regular reporting to the Board.
At a meeting of the Board on March 1-3, 2022, PGIM Investments provided a written report (“LRMP Report”) to the Board addressing the operation, adequacy, and effectiveness of the Fund’s LRMP, including any material changes to the LRMP for the period from January 1, 2021 through December 31, 2021 (“Reporting Period”). The LRMP Report concluded that the Fund’s LRMP was reasonably designed to assess and manage the Fund’s liquidity risk and was adequately and effectively implemented during the Reporting Period. There were no material changes to the LRMP during the Reporting Period. The LRMP Report further concluded that the Fund’s investment strategies continue to be appropriate given the Fund’s status as an open-end fund.
There can be no assurance that the LRMP will achieve its objectives in the future. Additional information regarding risks of investing in the Fund, including liquidity risks presented by the Fund’s investment portfolio, is found in the Fund’s Prospectus and Statement of Additional Information.
PGIM 60/40 Allocation Fund
INFORMATION ABOUT BOARD MEMBERS AND OFFICERS (unaudited)
Information about Board Members and Officers of the Fund is set forth below. Board Members who are not deemed to be “interested persons” of the Fund, as defined in the 1940 Act, are referred to as “Independent Board Members.” Board Members who are deemed to be “interested persons” of the Fund are referred to as “Interested Board Members.” The Board Members are responsible for the overall supervision of the operations of the Fund and perform the various duties imposed on the directors of investment companies by the 1940 Act. The Board in turn elects the Officers, who are responsible for administering the day-to-day operations of the Fund.
Independent Board Members
| ||||||
Name Year of Birth Position(s) Portfolios Overseen | Principal Occupation(s) During Past Five Years | Other Directorships Held During Past Five Years | Length of Board Service | |||
Ellen S. Alberding 1958 Board Member Portfolios Overseen: 97 | President and Board Member, The Joyce Foundation (charitable foundation) (since 2002); formerly Vice Chair, City Colleges of Chicago (community college system) (2011-2015); Trustee, National Park Foundation (charitable foundation for national park system) (2009-2018); Trustee, Economic Club of Chicago (2009-2016); Trustee, Loyola University (since 2018). | None. | Since September 2013 | |||
Kevin J. Bannon 1952 Board Member Portfolios Overseen: 97 | Retired; formerly Managing Director (April 2008-May 2015) and Chief Investment Officer (October 2008-November 2013) of Highmount Capital LLC (registered investment adviser); formerly Executive Vice President and Chief Investment Officer (April 1993-August 2007) of Bank of New York Company; President (May 2003-May 2007) of BNY Hamilton Family of Mutual Funds. | Director of Urstadt Biddle Properties (equity real estate investment trust) (since September 2008). | Since July 2008 | |||
PGIM 60/40 Allocation Fund
Independent Board Members
| ||||||
Name Year of Birth Position(s) Portfolios Overseen | Principal Occupation(s) During Past Five Years | Other Directorships Held During Past Five Years | Length of Board Service | |||
Linda W. Bynoe 1952 Board Member Portfolios Overseen: 94 | President and Chief Executive Officer (since March 1995) and formerly Chief Operating Officer (December 1989-February 1995) of Telemat Limited LLC (formerly Telemat Ltd) (management consulting); formerly Vice President (January 1985-June 1989) at Morgan Stanley & Co. (broker-dealer). | Trustee of Equity Residential (residential real estate) (since December 2009); Director of Northern Trust Corporation (financial services) (since April 2006); formerly Director of Anixter International, Inc. (communication products distributor) (January 2006-June 2020). | Since March 2005 | |||
Barry H. Evans 1960 Board Member Portfolios Overseen: 96 | Retired; formerly President (2005-2016), Global Chief Operating Officer (2014-2016), Chief Investment Officer - Global Head of Fixed Income (1998-2014), and various portfolio manager roles (1986-2006), Manulife Asset Management (asset management). | Formerly Director, Manulife Trust Company (2011-2018); formerly Director, Manulife Asset Management Limited (2015-2017); formerly Chairman of the Board of Directors of Manulife Asset Management U.S. (2005-2016); formerly Chairman of the Board, Declaration Investment Management and Research (2008-2016). | Since September 2017 | |||
Keith F. Hartstein 1956 Board Member & Independent Chair Portfolios Overseen: 97 | Retired; Member (since November 2014) of the Governing Council of the Independent Directors Council (IDC) (organization of independent mutual fund directors); formerly Executive Committee of the IDC Board of Governors (October 2019-December 2021); formerly President and Chief Executive Officer (2005-2012), Senior Vice President (2004-2005), Senior Vice President of Sales and Marketing (1997-2004), and various executive management positions (1990-1997), John Hancock Funds, LLC (asset management); Chairman, Investment Company Institute’s Sales Force Marketing Committee (2003-2008). | None. | Since September 2013 | |||
Visit our website at pgim.com/investments
Independent Board Members
| ||||||
Name Year of Birth Position(s) Portfolios Overseen | Principal Occupation(s) During Past Five Years | Other Directorships Held During Past Five Years | Length of Board Service | |||
Laurie Simon Hodrick 1962 Board Member Portfolios Overseen: 93 | A. Barton Hepburn Professor Emerita of Economics in the Faculty of Business, Columbia Business School (since 2018); Visiting Fellow at the Hoover Institution, Stanford University (since 2015); Sole Member, ReidCourt LLC (since 2008) (a consulting firm); formerly Visiting Professor of Law, Stanford Law School (2015-2021); formerly A. Barton Hepburn Professor of Economics in the Faculty of Business, Columbia Business School (1996-2017); formerly Managing Director, Global Head of Alternative Investment Strategies, Deutsche Bank (2006-2008). | Independent Director, Andela (since January 2022) (global talent network); Independent Director, Roku (since December 2020) (communication services); formerly Independent Director, Synnex Corporation (2019-2021) (information technology); formerly Independent Director, Kabbage, Inc. (2018-2020) (financial services); formerly Independent Director, Corporate Capital Trust (2017-2018) (a business development company). | Since September 2017 | |||
Brian K. Reid 1961 Board Member Portfolios Overseen: 96 | Retired; formerly Chief Economist for the Investment Company Institute (ICI) (2005-2017); formerly Senior Economist and Director of Industry and Financial Analysis at the ICI (1998-2004); formerly Senior Economist, Industry and Financial Analysis at the ICI (1996-1998); formerly Staff Economist at the Federal Reserve Board (1989-1996); Director, ICI Mutual Insurance Company (2012-2017). | None. | Since March 2018 | |||
PGIM 60/40 Allocation Fund
Independent Board Members
| ||||||
Name Year of Birth Position(s) Portfolios Overseen | Principal Occupation(s) During Past Five Years | Other Directorships Held During Past Five Years | Length of Board Service | |||
Grace C. Torres 1959 Board Member Portfolios Overseen: 96 | Retired; formerly Treasurer and Principal Financial and Accounting Officer of the PGIM Funds, Target Funds, Advanced Series Trust, Prudential Variable Contract Accounts and The Prudential Series Fund (1998-June 2014); Assistant Treasurer (March 1999-June 2014) and Senior Vice President (September 1999-June 2014) of PGIM Investments LLC; Assistant Treasurer (May 2003-June 2014) and Vice President (June 2005-June 2014) of AST Investment Services, Inc.; Senior Vice President and Assistant Treasurer (May 2003-June 2014) of Prudential Annuities Advisory Services, Inc. | Director (since January 2018) of OceanFirst Financial Corp. and OceanFirst Bank; formerly Director (July 2015-January 2018) of Sun Bancorp, Inc. N.A. and Sun National Bank. | Since November 2014 | |||
Interested Board Members
| ||||||
Name Year of Birth Position(s) Portfolios Overseen | Principal Occupation(s) During Past Five Years | Other Directorships Held During Past Five Years | Length of Board Service | |||
Stuart S. Parker 1962 Board Member & President Portfolios Overseen: 96 | President, Chief Executive Officer, Chief Operating Officer and Officer in Charge of PGIM Investments LLC (formerly known as Prudential Investments LLC) (since January 2012); President and PEO (since March 2022) of the PGIM Private Real Estate Fund, Inc.; formerly Executive Vice President of Jennison Associates LLC and Head of Retail Distribution of PGIM Investments LLC (June 2005-December 2011); Investment Company Institute - Board of Governors (since May 2012). | None. | Since January 2012 | |||
Visit our website at pgim.com/investments
Interested Board Members
| ||||||
Name Year of Birth Position(s) Portfolios Overseen | Principal Occupation(s) During Past Five Years | Other Directorships Held During Past Five Years | Length of Board Service | |||
Scott E. Benjamin 1973 Board Member & Vice President Portfolios Overseen: 97 | Executive Vice President (since May 2009) of PGIM Investments LLC; Vice President (since June 2012) of Prudential Investment Management Services LLC; Executive Vice President (since September 2009) of AST Investment Services, Inc.; Senior Vice President of Product Development and Marketing, PGIM Investments (since February 2006); Vice President (since March 2022) of the PGIM Private Real Estate Fund, Inc.; formerly Vice President of Product Development and Product Management, PGIM Investments LLC (2003-2006). | None. | Since March 2010 | |||
Fund Officers(a)
| ||||
Name Year of Birth Fund Position | Principal Occupation(s) During Past Five Years | Length of Service as Fund Officer | ||
Claudia DiGiacomo 1974 Chief Legal Officer | Chief Legal Officer (since July 2022) of the PGIM Private Real Estate Fund, Inc.; Chief Legal Officer, Executive Vice President and Secretary of PGIM Investments LLC (since August 2020); Chief Legal Officer of Prudential Mutual Fund Services LLC (since August 2020); Chief Legal Officer of PIFM Holdco, LLC (since August 2020); Vice President and Corporate Counsel (since January 2005) of Prudential; and Corporate Counsel of AST Investment Services, Inc. (since August 2020); formerly Vice President and Assistant Secretary of PGIM Investments LLC (2005-2020); formerly Associate at Sidley Austin Brown & Wood LLP (1999-2004). | Since December 2005 | ||
PGIM 60/40 Allocation Fund
Fund Officers(a)
| ||||
Name Year of Birth Fund Position | Principal Occupation(s) During Past Five Years | Length of Service as Fund Officer | ||
Isabelle Sajous 1976 Chief Compliance Officer | Chief Compliance Officer (since April 2022) of PGIM Investments LLC, the PGIM Funds, Target Funds, PGIM ETF Trust, PGIM Global High Yield Fund, Inc., PGIM High Yield Bond Fund, Inc., PGIM Short Duration High Yield Opportunities Fund, Advanced Series Trust, The Prudential Series Fund and Prudential’s Gibraltar Fund, Inc.; Chief Compliance Officer (since March 2022) of the PGIM Private Real Estate Fund, Inc.; Vice President, Compliance of PGIM Investments LLC (since December 2020); formerly Director, Compliance (July 2018-December 2020) of Credit Suisse Asset Management LLC; and Vice President, Associate General Counsel & Deputy Chief Compliance Officer of Cramer Rosenthal McGlynn, LLC (August 2014-July 2018). | Since April 2022 | ||
Andrew R. French 1962 Secretary | Vice President (since December 2018) of PGIM Investments LLC; Secretary (since March 2022) of the PGIM Private Real Estate Fund, Inc.; formerly Vice President and Corporate Counsel (2010-2018) of Prudential; formerly Director and Corporate Counsel (2006-2010) of Prudential; Vice President and Assistant Secretary (since January 2007) of PGIM Investments LLC; Vice President and Assistant Secretary (since January 2007) of Prudential Mutual Fund Services LLC. | Since October 2006 | ||
Melissa Gonzalez 1980 Assistant Secretary | Vice President and Corporate Counsel (since September 2018) of Prudential; Vice President and Assistant Secretary (since August 2020) of PGIM Investments LLC; Assistant Secretary (since March 2022) of the PGIM Private Real Estate Fund, Inc.; formerly Director and Corporate Counsel (March 2014-September 2018) of Prudential. | Since March 2020 | ||
Patrick E. McGuinness 1986 Assistant Secretary | Vice President and Assistant Secretary (since August 2020) of PGIM Investments LLC; Director and Corporate Counsel (since February 2017) of Prudential; Assistant Secretary (since March 2022) of the PGIM Private Real Estate Fund, Inc. | Since June 2020 | ||
Debra Rubano 1975 Assistant Secretary | Vice President and Corporate Counsel (since November 2020) of Prudential; Assistant Secretary (since March 2022) of the PGIM Private Real Estate Fund, Inc; formerly Director and Senior Counsel of Allianz Global Investors U.S. Holdings LLC (2010-2020) and Assistant Secretary of numerous funds in the Allianz fund complex (2015-2020). | Since December 2020 | ||
Kelly A. Coyne 1968 Assistant Secretary | Director, Investment Operations of Prudential Mutual Fund Services LLC (since 2010); Assistant Secretary (since March 2022) of the PGIM Private Real Estate Fund, Inc. | Since March 2015 | ||
Visit our website at pgim.com/investments
Fund Officers(a)
| ||||
Name Year of Birth Fund Position | Principal Occupation(s) During Past Five Years | Length of Service as Fund Officer | ||
| Christian J. Kelly 1975 Treasurer and Principal Financial and Accounting Officer | Vice President, Head of Fund Administration of PGIM Investments LLC (since November 2018); Principal Financial Officer (since March 2022) of the PGIM Private Real Estate Fund, Inc.; formerly, Treasurer and Principal Accounting Officer (March 2022- July 2022) of the PGIM Private Real Estate Fund, Inc.; formerly Director of Fund Administration of Lord Abbett & Co. LLC (2009-2018), Treasurer and Principal Accounting Officer of the Lord Abbett Family of Funds (2017-2018); Director of Accounting, Avenue Capital Group (2008-2009); Senior Manager, Investment Management Practice of Deloitte & Touche LLP (1998-2007). | Since January 2019 | ||
| Lana Lomuti 1967 Assistant Treasurer | Vice President (since 2007) and Director (2005-2007), within PGIM Investments Fund Administration; formerly Assistant Treasurer (December 2007-February 2014) of The Greater China Fund, Inc. | Since April 2014 | ||
| Russ Shupak 1973 Assistant Treasurer | Vice President (since 2017) and Director (2013-2017), within PGIM Investments Fund Administration; Treasurer and Principal Accounting Officer (since July 2022) of the PGIM Private Real Estate Fund, Inc.; formerly Assistant Treasurer (March 2022 – July 2022) of the PGIM Private Real Estate Fund, Inc. | Since October 2019 | ||
| Deborah Conway 1969 Assistant Treasurer | Vice President (since 2017) and Director (2007-2017), within PGIM Investments Fund Administration. | Since October 2019 | ||
| Elyse M. McLaughlin 1974 Assistant Treasurer | Vice President (since 2017) and Director (2011-2017), within PGIM Investments Fund Administration; Assistant Treasurer (since March 2022) of the PGIM Private Real Estate Fund, Inc. | Since October 2019 | ||
| Kelly Florio 1978 Anti-Money Laundering Compliance Officer | Vice President, Corporate Compliance, Global Compliance Programs and Compliance Risk Management (since December 2021) of Prudential; formerly, Head of Fraud Risk Management (October 2019 to December 2021) at New York Life Insurance Company; formerly, Head of Key Risk Area Operations (November 2018 to October 2019), Director of the US Anti-Money Laundering Compliance Unit (2009-2018) and Bank Loss Prevention Associate (2006 -2009) at MetLife. | Since June 2022 | ||
(a) Excludes Mr. Parker and Mr. Benjamin, interested Board Members who also serve as President and Vice President, respectively.
Explanatory Notes to Tables:
| ∎ | Board Members are deemed to be “Interested,” as defined in the 1940 Act, by reason of their affiliation with PGIM Investments LLC and/or an affiliate of PGIM Investments LLC. |
| ∎ | Unless otherwise noted, the address of all Board Members and Officers is c/o PGIM Investments LLC, 655 Broad Street, Newark, New Jersey 07102-4410. |
| ∎ | There is no set term of office for Board Members or Officers. The Board Members have adopted a retirement policy, which calls for the retirement of Board Members on December 31 of the year in which they reach the age of 75. |
PGIM 60/40 Allocation Fund
| ∎ | “Other Directorships Held” includes all directorships of companies required to register or file reports with the SEC under the 1934 Act (that is, “public companies”) or other investment companies registered under the 1940 Act. |
| ∎ | “Portfolios Overseen” includes all investment companies managed by PGIM Investments LLC. The investment companies for which PGIM Investments LLC serves as manager include the PGIM Mutual Funds, Target Funds, The Prudential Variable Contract Accounts, PGIM ETF Trust, PGIM Private Real Estate Fund, Inc., PGIM High Yield Bond Fund, Inc., PGIM Global High Yield Fund, Inc., PGIM Short Duration High Yield Opportunities Fund, The Prudential Series Fund, Prudential’s Gibraltar Fund, Inc. and the Advanced Series Trust. |
| ∎ | As used in the Fund Officers table “Prudential” means The Prudential Insurance Company of America. |
Visit our website at pgim.com/investments
Approval of Advisory Agreements (unaudited)
The Fund’s Board of Trustees
The Board of Trustees (the “Board”) of PGIM 60/40 Allocation Fund (the “Fund”)1 consists of ten individuals, eight of whom are not “interested persons” of the Fund, as defined in the Investment Company Act of 1940, as amended (the “1940 Act”) (the “Independent Trustees”). The Board is responsible for the oversight of the Fund and its operations, and performs the various duties imposed on the directors of investment companies by the 1940 Act. The Independent Trustees have retained independent legal counsel to assist them in connection with their duties. The Chair of the Board is an Independent Trustee. The Board has established five standing committees: the Audit Committee, the Nominating and Governance Committee, the Compliance Committee and two Investment Committees. Each committee is chaired by, and composed of, Independent Trustees.
Annual Approval of the Fund’s Advisory Agreements
As required under the 1940 Act, the Board determines annually whether to renew the Fund’s management agreement with PGIM Investments LLC (“PGIM Investments”) and the Fund’s subadvisory agreement with PGIM Quantitative Solutions LLC (“PGIM Quantitative Solutions”). In considering the renewal of the agreements, the Board, including all of the Independent Trustees, met on May 26 and June 7-9, 2022 (the “Board Meeting”) and approved the renewal of the agreements through July 31, 2023, after concluding that the renewal of the agreements was in the best interests of the Fund and its shareholders.
In advance of the meetings, the Board requested and received materials relating to the agreements, and had the opportunity to ask questions and request further information in connection with its consideration. Among other things, the Board considered comparative fee information from PGIM Investments and PGIM Quantitative Solutions. Also, the Board considered comparisons with other mutual funds in relevant Peer Universes and Peer Groups, as is further discussed below.
In approving the agreements, the Board, including the Independent Trustees advised by independent legal counsel, considered the factors it deemed relevant, including the nature, quality and extent of services provided by PGIM Investments and the subadviser, the performance of the Fund, the profitability of PGIM Investments and its affiliates, expenses and fees, and the potential for economies of scale that may be shared with the Fund and its shareholders as the Fund’s assets grow. In their deliberations, the Trustees did not identify any single factor which alone was responsible for the Board’s decision to approve the agreements with respect to the Fund. In connection with its deliberations, the Board considered information provided by PGIM Investments throughout the year at regular Board meetings, presentations from portfolio managers and other information, as well as information furnished at or in advance of the Board Meeting.
| 1PGIM | 60/40 Allocation Fund is a series of Prudential Investment Portfolios 5 |
PGIM 60/40 Allocation Fund
Approval of Advisory Agreements (continued)
The Trustees determined that the overall arrangements between the Fund and PGIM Investments, which serves as the Fund’s investment manager pursuant to a management agreement, and between PGIM Investments and PGIM Quantitative Solutions, which serves as the Fund’s subadviser pursuant to the terms of a subadvisory agreement with PGIM Investments, are in the best interests of the Fund and its shareholders in light of the services performed, fees charged and such other matters as the Trustees considered relevant in the exercise of their business judgment.
The material factors and conclusions that formed the basis for the Trustees’ reaching their determinations to approve the continuance of the agreements are separately discussed below.
Nature, Quality and Extent of Services
The Board received and considered information regarding the nature, quality and extent of services provided to the Fund by PGIM Investments and PGIM Quantitative Solutions. The Board noted that PGIM Quantitative Solutions is affiliated with PGIM Investments. The Board considered the services provided by PGIM Investments, including but not limited to the oversight of the subadviser for the Fund, as well as the provision of fund recordkeeping, compliance and other services to the Fund, and PGIM Investments’ role as administrator for the Fund’s liquidity risk management program. With respect to PGIM Investments’ oversight of the subadviser, the Board noted that PGIM Investments’ Strategic Investment Research Group (“SIRG”), which is a business unit of PGIM Investments, is responsible for monitoring and reporting to PGIM Investments’ senior management on the performance and operations of the subadviser. The Board also considered that PGIM Investments pays the salaries of all of the officers and interested Trustees of the Fund who are part of Fund management. The Board also considered the investment subadvisory services provided by PGIM Quantitative Solutions, including investment research and security selection, as well as adherence to the Fund’s investment restrictions and compliance with applicable Fund policies and procedures. The Board considered PGIM Investments’ evaluation of the subadviser, as well as PGIM Investments’ recommendation, based on its review of the subadviser, to renew the subadvisory agreement.
The Board considered the qualifications, backgrounds and responsibilities of PGIM Investments’ senior management responsible for the oversight of the Fund and PGIM Quantitative Solutions, and also considered the qualifications, backgrounds and responsibilities of PGIM Quantitative Solutions’ portfolio managers who are responsible for the day-to-day management of the Fund’s portfolio. The Board was provided with information pertaining to PGIM Investments’ and PGIM Quantitative Solutions’ organizational structure, senior management, investment operations, and other relevant information pertaining to both PGIM Investments and PGIM Quantitative Solutions. The Board also noted that it received favorable compliance reports from the Fund’s Chief Compliance Officer (“CCO”) as to both PGIM Investments and PGIM Quantitative Solutions.
Visit our website at pgim.com/investments
The Board concluded that it was satisfied with the nature, extent and quality of the investment management services provided by PGIM Investments and the subadvisory services provided to the Fund by PGIM Quantitative Solutions, and that there was a reasonable basis on which to conclude that the Fund benefits from the services provided by PGIM Investments and PGIM Quantitative Solutions under the management and subadvisory agreements.
Costs of Services and Profits Realized by PGIM Investments
The Board was provided with information on the profitability of PGIM Investments and its affiliates in serving as the Fund’s investment manager. The Board discussed with PGIM Investments the methodology utilized in assembling the information regarding profitability and considered its reasonableness. The Board recognized that it is difficult to make comparisons of profitability from fund management contracts because comparative information is not generally publicly available and is affected by numerous factors, including the structure of the particular adviser, the types of funds it manages, its business mix, numerous assumptions regarding allocations and the adviser’s capital structure and cost of capital. However, the Board considered that the cost of services provided by PGIM Investments to the Fund during the year ended December 31, 2021 exceeded the management fees paid by the Fund, resulting in an operating loss to PGIM Investments. Taking these factors into account, the Board concluded that the profitability of PGIM Investments and its affiliates in relation to the services rendered was not unreasonable.
Economies of Scale
The Board received and discussed information concerning economies of scale that PGIM Investments may realize as the Fund’s assets grow beyond current levels. The Board noted that the management fee schedule for the Fund includes breakpoints, which have the effect of reducing the fee rate as assets increase. During the course of time, the Board has considered information regarding the launch date of the Fund, the management fees of the Fund compared to those of similarly managed funds and PGIM Investments’ investment in the Fund over time. The Board noted that economies of scale can be shared with the Fund in other ways, including low management fees from inception, additional technological and personnel investments to enhance shareholder services, and maintaining existing expense structures in the face of a rising cost environment. The Board also considered PGIM Investments’ assertion that it continually evaluates the management fee schedule of the Fund and the potential to share economies of scale through breakpoints or fee waivers as asset levels increase.
The Board recognized the inherent limitations of any analysis of economies of scale, stemming largely from the Board’s understanding that most of PGIM Investments’ costs are not specific to individual funds, but rather are incurred across a variety of products and services.
PGIM 60/40 Allocation Fund
Approval of Advisory Agreements (continued)
Other Benefits to PGIM Investments and PGIM Quantitative Solutions
The Board considered potential ancillary benefits that might be received by PGIM Investments, PGIM Quantitative Solutions and their affiliates as a result of their relationship with the Fund. The Board concluded that potential benefits to be derived by PGIM Investments included transfer agency fees received by the Fund’s transfer agent (which is affiliated with PGIM Investments), and benefits to its reputation as well as other intangible benefits resulting from PGIM Investments’ association with the Fund. The Board concluded that the potential benefits to be derived by PGIM Quantitative Solutions included its ability to use soft dollar credits, as well as the potential benefits consistent with those generally resulting from an increase in assets under management, specifically, potential access to additional research resources and benefits to its reputation. The Board concluded that the benefits derived by PGIM Investments and PGIM Quantitative Solutions were consistent with the types of benefits generally derived by investment managers and subadvisers to mutual funds.
Performance of the Fund / Fees and Expenses
The Board considered certain additional factors and made related conclusions relating to the historical performance of the Fund for the one-year and the three-year periods ended December 31, 2021. The Board considered that the Fund commenced operations on September 13, 2017 and that longer-term performance was not yet available.
The Board also considered the Fund’s actual management fee, as well as the Fund’s net total expense ratio, for the fiscal year ended July 31, 2021. The Board considered the management fee for the Fund as compared to the management fee charged by PGIM Investments to other funds and the fee charged by other advisers to comparable mutual funds in a Peer Group. The actual management fee represents the fee rate actually paid by Fund shareholders and includes any fee waivers or reimbursements. The net total expense ratio for the Fund represents the actual expense ratio incurred by Fund shareholders.
The mutual funds included in the Peer Universe, which was used to consider performance, and the Peer Group, which was used to consider expenses and fees, were objectively determined by Broadridge, an independent provider of mutual fund data. In certain circumstances, PGIM Investments also provided supplemental Peer Universe or Peer Group information for reasons addressed with the Board. The comparisons placed the Fund in various quartiles over various periods, with the first quartile being the best 25% of the mutual funds (for performance, the best performing mutual funds and, for expenses, the lowest cost mutual funds).
The section below summarizes key factors considered by the Board and the Board’s conclusions regarding the Fund’s performance, fees and overall expenses. The table sets forth net performance comparisons (which reflect the impact on performance of fund expenses, or any subsidies, expense caps or waivers that may be applicable) with the Peer Universe, actual management fees with the Peer Group (which reflect the
Visit our website at pgim.com/investments
impact of any subsidies or fee waivers), and net total expenses with the Peer Group, each of which were key factors considered by the Board.
| Net Performance | 1 Year | 3 Years | 5 Years | 10Years | ||||
| 2nd Quartile | 3rd Quartile | N/A | N/A | |||||
| Actual Management Fees: 1st Quartile | ||||||||
| Net Total Expenses: 1st Quartile | ||||||||
| ● | The Board noted that the Fund outperformed its benchmark index over the one-year period and underperformed its benchmark index over the three-year period. |
| ● | The Board considered that the Fund commenced operations on September 13, 2017 and that longer-term performance was not yet available. |
| ● | The Board and PGIM Investments agreed to retain the Fund’s existing contractual expense cap, which (exclusive of certain fees and expenses) caps total annual operating expenses at 0.40% for Class R6 shares through November 30, 2022. |
| ● | The Board concluded that, in light of the above, it would be in the best interests of the Fund and its shareholders to allow the Fund to continue to create a longer-term performance record and to renew the agreements. |
| ● | The Board concluded that the management fees (including subadvisory fees) and total expenses were reasonable in light of the services provided. |
* * *
After full consideration of these factors, the Board concluded that the approval of the agreements was in the best interests of the Fund and its shareholders.
PGIM 60/40 Allocation Fund
| ∎ TELEPHONE | ∎ WEBSITE | |||
655 Broad Street | (800) 225-1852 | pgim.com/investments | ||
PROXY VOTING The Board of Trustees of the Fund has delegated to the Fund’s subadviser the responsibility for voting any proxies and maintaining proxy recordkeeping with respect to the Fund. A description of these proxy voting policies and procedures is available without charge, upon request, by calling (800) 225-1852 or by visiting the Securities and Exchange Commission’s website at sec.gov. Information regarding how the Fund voted proxies relating to portfolio securities during the most recent 12-month period ended June 30 is available on the Fund’s website and on the Securities and Exchange Commission’s website. |
TRUSTEES Ellen S. Alberding ● Kevin J. Bannon ● Scott E. Benjamin ● Linda W. Bynoe ● Barry H. Evans ● Keith F. Hartstein ● Laurie Simon Hodrick ● Stuart S. Parker ● Brian K. Reid ● Grace C. Torres |
OFFICERS Stuart S. Parker, President ● Scott E. Benjamin, Vice President ● Christian J. Kelly, Treasurer and Principal Financial and Accounting Officer ● Claudia DiGiacomo, Chief Legal Officer ● Isabelle Sajous, Chief Compliance Officer ● Kelly Florio, Anti-Money Laundering Compliance Officer ● Andrew R. French, Secretary ● Melissa Gonzalez, Assistant Secretary ● Kelly A. Coyne, Assistant Secretary ● Patrick E. McGuinness, Assistant Secretary ● Debra Rubano, Assistant Secretary ● Lana Lomuti, Assistant Treasurer ● Russ Shupak, Assistant Treasurer ● Elyse M. McLaughlin, Assistant Treasurer ● Deborah Conway, Assistant Treasurer |
| MANAGER | PGIM Investments LLC | 655 Broad Street Newark, NJ 07102 | ||
| ||||
| SUBADVISER | PGIM Quantitative Solutions LLC | Gateway Center Two 100 Mulberry Street Newark, NJ 07102 | ||
| ||||
| DISTRIBUTOR | Prudential Investment Management Services LLC | 655 Broad Street Newark, NJ 07102 | ||
| ||||
| CUSTODIAN | The Bank of New York Mellon | 240 Greenwich Street New York, NY 10286 | ||
| ||||
| TRANSFER AGENT | Prudential Mutual Fund Services LLC | PO Box 9658 Providence, RI 02940 | ||
| ||||
| INDEPENDENT REGISTERED PUBLIC ACCOUNTING FIRM | PricewaterhouseCoopers LLP | 300 Madison Avenue New York, NY 10017 | ||
| ||||
| FUND COUNSEL | Willkie Farr & Gallagher LLP | 787 Seventh Avenue New York, NY 10019 | ||
| ||||
An investor should consider the investment objectives, risks, charges, and expenses of the Fund carefully before investing. The prospectus and summary prospectus contain this and other information about the Fund. An investor may obtain a prospectus and summary prospectus by visiting our website at pgim.com/investments or by calling (800) 225-1852. The prospectus and summary prospectus should be read carefully before investing. |
E-DELIVERY |
To receive your mutual fund documents online, go to pgim.com/investments/resource/edelivery and enroll. Instead of receiving printed documents by mail, you will receive notification via email when new materials are available. You can cancel your enrollment or change your email address at any time by visiting the website address above. |
SHAREHOLDER COMMUNICATIONS WITH TRUSTEES |
Shareholders can communicate directly with the Board of Trustees by writing to the Chair of the Board, PGIM 60/40 Allocation Fund, PGIM Investments, Attn: Board of Trustees, 655 Broad Street, Newark, NJ 07102. Shareholders can communicate directly with an individual Trustee by writing to that Trustee at the same address. Communications are not screened before being delivered to the addressee. |
AVAILABILITY OF PORTFOLIO HOLDINGS |
The Fund files its complete schedule of portfolio holdings with the Securities and Exchange Commission for the first and third quarters of each fiscal year as an exhibit to its reports on Form N-PORT. The Fund’s Form N-PORT filings are available on the Commission’s website at sec.gov. The Fund’s Statement of Additional Information contains additional information about the Fund’s Trustees and is available without charge, upon request, by calling (800) 225-1852. |
Mutual Funds:
| ARE NOT INSURED BY THE FDIC OR ANY FEDERAL GOVERNMENT AGENCY | MAY LOSE VALUE | ARE NOT A DEPOSIT OF OR GUARANTEED BY ANY BANK OR ANY BANK AFFILIATE | ||
 |
PGIM 60/40 ALLOCATION FUND
SHARE CLASS
|
R6
| |
NASDAQ
|
PALDX
| |
CUSIP
|
74440V724
|

PRUDENTIAL DAY ONE FUNDS
ANNUAL REPORT
JULY 31, 2022

To enroll in e-delivery, go to pgim.com/investments/resource/edelivery
| 3 | ||
| 4 | ||
| 9 | ||
| 13 | ||
| 17 | ||
| 21 | ||
| 25 | ||
| 29 | ||
| 33 | ||
| 37 | ||
| 41 | ||
| 45 | ||
| 49 | ||
| 54 | ||
| 58 | ||
| 65 | ||
This report is not authorized for distribution to prospective investors unless preceded or accompanied by a current prospectus.
The views expressed in this report and information about the Funds’ portfolio holdings are for the period covered by this report and are subject to change thereafter.
Mutual funds are distributed by Prudential Investment Management Services LLC, a Prudential Financial company and member SIPC. PGIM Quantitative Solutions is the primary business name of PGIM Quantitative Solutions LLC (formerly known as QMA LLC), a wholly owned subsidiary of PGIM, Inc. (PGIM), a registered investment adviser and Prudential Financial company. © 2022 Prudential Financial, Inc. and its related entities. PGIM and the PGIM logo are service marks of Prudential Financial, Inc. and its related entities, registered in many jurisdictions worldwide.
2 Visit our website at pgim.com/investments
 | Dear Shareholder:
| |
We hope you find the annual report for the Prudential Day One Funds informative and useful. The report covers performance for the 12-month period that ended July 31, 2022.
| ||
| The attention of the global economy and markets turned during the period from the impact of the COVID-19 pandemic to the challenge of rapidly rising inflation. Prices for a wide range of goods and services rose in response to economic reopenings, supply-chain disruptions, pandemic-related governmental stimulus and Russia’s invasion of Ukraine. As inflation surged at its fastest rate in more than 40 years, central banks, led by the US Federal Reserve, sought to restrain the trend by aggressively hiking interest rates, prompting concerns of a potential recession. | ||
After rising to record levels during the closing months of 2021, US stocks retreated in 2022 in the face of rising prices, slowing economic growth and uncertainties related to the war in Ukraine. Growth-oriented stocks suffered the sharpest losses as investors turned for protection to traditionally defensive, value-oriented stocks. Large-cap equities ended the period in negative territory but outperformed their small-cap counterparts by a significant margin. International developed markets trailed the US market, while emerging markets lagged further behind. | ||
Rising rates and economic uncertainty drove fixed-income prices broadly lower as well. US and global investment-grade bonds, along with US high yield corporate bonds and emerging market debt, all posted negative returns for the period.
Regarding your investments with PGIM, we believe it is important to maintain a diversified portfolio of funds consistent with your tolerance for risk, time horizon, and financial goals. Your financial advisor can help you create a diversified investment plan that may include funds covering all the basic asset classes and that reflects your personal investor profile and risk tolerance. However, diversification and asset allocation strategies do not assure a profit or protect against loss in declining markets.
At PGIM Investments, we provide access to active investment strategies across the global markets in the pursuit of consistent outperformance for investors. PGIM is the world’s 11th-largest investment manager with more than $1.5 trillion in assets under management. Our scale and investment expertise allow us to deliver a diversified suite of actively managed solutions across a broad spectrum of asset classes and investment styles. | ||
Thank you for choosing our family of funds.
Sincerely,

Stuart S. Parker, President
Prudential Day One Funds
September 15, 2022
Prudential Day One Funds 3
Prudential Day One Income Fund
Your Fund’s Performance (unaudited)
Performance data quoted represent past performance. Past performance does not guarantee future results. The investment return and principal value of an investment will fluctuate so that an investor’s shares, when redeemed, may be worth more or less than their original cost. Current performance may be lower or higher than the past performance data quoted. An investor may obtain performance data as of the most recent month-end by visiting our website at pgim.com/investments or by calling (800) 225-1852.
| Average Annual Total Returns as of 7/31/22 | ||||||
| One Year (%) | Five Years (%) | Since Inception (%) | ||||
Class R1 | -5.43 | 4.04 | 4.28 (12/13/2016) | |||
Class R2 | -5.20 | 4.28 | 4.54 (12/13/2016) | |||
Class R3 | -5.03 | 4.46 | 4.71 (12/13/2016) | |||
Class R4 | -4.94 | 4.57 | 4.81 (12/13/2016) | |||
Class R5 | -4.93 | 4.66 | 4.90 (12/13/2016) | |||
Class R6 | -4.78 | 4.83 | 5.08 (12/13/2016) | |||
Prudential Day One Income Custom Benchmark |
-4.49 | 4.87 | 5.22 | |||
S&P Target Date Retirement Income Index |
-7.36 | 3.64 | 4.25 | |||
The returns in the table do not reflect the deduction of taxes that a shareholder would pay on Fund distributions or following the redemption of Fund shares. Since Inception returns are provided since the Fund has less than 10 fiscal years of returns. Since Inception returns for the Indexes are measured from the closest month-end to the Fund’s inception date.
4 Visit our website at pgim.com/investments
Growth of a $10,000 Investment
The graph compares a $10,000 investment in the Prudential Day One Income Fund’s Class R6 shares with a similar investment in the Prudential Day One Income Custom Benchmark and S&P Target Date Retirement Income Index (Index) over time periods ending at the end of the current fiscal year (July 31, 2022) and the account values at the end of the current fiscal year, as measured on a quarterly basis. The R6 share class assumes an initial investment on December 13, 2016, while the Custom Benchmark and the Index assume that the initial investment occurred on November 30, 2016. For purposes of the graph, and unless otherwise indicated, it has been assumed that (a) all recurring fees (including management fees) were deducted and (b) all dividends and distributions were reinvested. The line graph provides information for Class R6 shares only. As indicated in the tables provided earlier, and in the following paragraphs, performance for other share classes will vary due to the differing charges and expenses applicable to each share class (as indicated in the following paragraphs). Without waiver of fees and/or expense reimbursements, if any, the returns would have been lower.
Past performance does not predict future performance. Total returns and the ending account values in the graph include changes in share price and reinvestment of dividends and capital gains distributions in a hypothetical investment for the periods shown. The Fund’s total returns do not reflect the deduction of income taxes on an individual’s investment. Taxes may reduce your actual investment returns on income or gains paid by the Fund or any gains you may realize if you sell your shares.
Prudential Day One Funds 5
Prudential Day One Income Fund
Your Fund’s Performance (continued)
The average annual total returns take into account applicable charges and fees, which are described for each share class in the table below.
| Class R1 | Class R2 | Class R3 | Class R4 | Class R5 | Class R6 | |||||||
| Maximum initial sales charge | None | None | None | None | None | None | ||||||
| Contingent deferred sales charge (CDSC) (as a percentage of the lower of the original purchase price or the net asset value at redemption) | None | None | None | None | None | None | ||||||
| Annual distribution or distribution and service (12b-1) fees (shown as a percentage of average daily net assets) | 0.50% | 0.25% | 0.10% | None | None | None | ||||||
| Shareholder service fee | 0.10%* | 0.10%* | 0.10%* | 0.10%* | None | None | ||||||
*Shareholder service fee reflects maximum allowable fees under a shareholder services plan.
Benchmark Definitions
Prudential Day One Income Custom Benchmark*—The Prudential Day One Income Custom Benchmark reflects the normal weighted average of the underlying funds’ stock/non-traditional assets/bond/cash allocation, as represented by the S&P 1500 Composite Index, FTSE Developed ex-North America Index1,2, MSCI Emerging Markets Net Index, Bloomberg US Treasury Inflation-Protected (TIPS) Index, Bloomberg US Aggregate Bond Index, FTSE 3-Month T-Bill1, Bloomberg Commodity Index, and the FTSE EPRA/NAREIT Developed Real Estate Net Index1. Because the asset allocation of the Fund changes over time with the Glidepath, the custom benchmark allocations also change over time. All indices are unmanaged.
S&P Target Date® Retirement Income Index**—The S&P Target Date Index series is comprised of 13 multi-asset class indices, each of which (with the exception of the S&P Target Date Retirement Income Index) corresponds to a particular retirement date. Each index provides varying levels of exposure to equities and fixed income. Each target date allocation is created and retired according to a predetermined schedule relative to the respective target date.
*The Prudential Day One Income Custom Benchmark is calculated by PGIM, Inc. and/or its affiliates with permission from S&P Dow Jones Indices LLC and/or its affiliates. Neither S&P Dow Jones Indices LLC, Dow Jones Trademark Holdings LLC, their affiliates nor their third party licensors make any representation or warranty, express or implied, as to the ability of any index, including the Prudential Day One Income Custom Benchmark, to accurately represent the asset class or market sector that it purports to represent and neither S&P Dow Jones Indices LLC, Dow Jones Trademark Holdings LLC, their affiliates nor their third
6 Visit our website at pgim.com/investments
party licensors shall have any liability for any errors, omissions, or interruptions of any index, including the Prudential Day One Income Custom Benchmark, or the data included therein.
**The S&P Target Date Retirement Income Index is a product of S&P Dow Jones Indices LLC and/or its affiliates and has been licensed for use by PGIM, Inc. and/or its affiliates. Copyright© 2022 S&P Dow Jones Indices LLC, a division of S&P Global, Inc., and/or its affiliates. All rights reserved. Redistribution or reproduction in whole or in part are prohibited without written permission of S&P Dow Jones Indices LLC. For more information on any of S&P Dow Jones Indices LLC’s indices please visit www.spdji.com. S&P® is a registered trademark of S&P Global and Dow Jones® is a registered trademark of Dow Jones Trademark Holdings LLC.
Investors cannot invest directly in an index. The returns for the Indexes would be lower if they included the effects of sales charges, operating expenses of a mutual fund, or taxes that may be paid by an investor.
Prudential Day One Funds 7
Prudential Day One Income Fund
Your Fund’s Performance (continued)
Presentation of Fund Holdings as of 7/31/22
| Ten Largest Holdings | Asset Class | % of Net Assets | ||
PGIM TIPS Fund (Class R6) | TIPS | 23.1% | ||
PGIM Total Return Bond Fund (Class R6) | Total Return Bond | 15.9% | ||
PGIM Core Conservative Bond Fund (Class R6) | Core Bond | 15.9% | ||
PGIM Quant Solutions Large-Cap Core Fund (Class R6) | Large Cap | 11.8% | ||
PGIM Quant Solutions US Broad Market Index Fund (Class R6) | Broad Market | 6.3% | ||
PGIM Quant Solutions Commodity Strategies Fund (Class R6) | Commodity | 5.0% | ||
PGIM Quant Solutions International Developed Markets Index Fund (Class R6) | International Developed Markets | 5.0% | ||
PGIM Global Real Estate Fund (Class R6) | Real Estate | 5.0% | ||
PGIM Quant Solutions Mid-Cap Core Fund (Class R6) | Mid Cap | 1.0% | ||
PGIM Jennison Small-Cap Core Equity Fund (Class R6) | Small Cap | 1.0% | ||
Holdings reflect only long-term investments and are subject to change.
8 Visit our website at pgim.com/investments
Your Fund’s Performance (unaudited)
Performance data quoted represent past performance. Past performance does not guarantee future results. The investment return and principal value of an investment will fluctuate so that an investor’s shares, when redeemed, may be worth more or less than their original cost. Current performance may be lower or higher than the past performance data quoted. An investor may obtain performance data as of the most recent month-end by visiting our website at pgim.com/investments or by calling (800) 225-1852.
| Average Annual Total Returns as of 7/31/22 | ||||||
| One Year (%) | Five Years (%) | Since Inception (%) | ||||
Class R1 | -5.31 | 4.42 | 4.80 (12/13/2016) | |||
Class R2 | -5.05 | 4.68 | 5.05 (12/13/2016) | |||
Class R3 | -4.91 | 4.85 | 5.22 (12/13/2016) | |||
Class R4 | -4.90 | 4.94 | 5.30 (12/13/2016) | |||
Class R5 | -4.70 | 5.05 | 5.43 (12/13/2016) | |||
Class R6 | -4.57 | 5.21 | 5.57 (12/13/2016) | |||
Prudential Day One 2015 Custom Benchmark |
-4.43 | 5.31 | 5.78 | |||
S&P Target Date 2015 Index |
-7.26 | 4.63 | 5.53 | |||
The returns in the table do not reflect the deduction of taxes that a shareholder would pay on Fund distributions or following the redemption of Fund shares. Since Inception returns are provided since the Fund has less than 10 fiscal years of returns. Since Inception returns for the Indexes are measured from the closest month-end to the Fund’s inception date.
Prudential Day One Funds 9
Prudential Day One 2015 Fund
Your Fund’s Performance (continued)
Growth of a $10,000 Investment
The graph compares a $10,000 investment in the Prudential Day One 2015 Fund’s Class R6 shares with a similar investment in the Prudential Day One 2015 Custom Benchmark and S&P Target Date 2015 Index (Index) over time periods ending at the end of the current fiscal year (July 31, 2022) and the account values at the end of the current fiscal year, as measured on a quarterly basis. The R6 share class assumes an initial investment on December 13, 2016, while the Custom Benchmark and the Index assume that the initial investment occurred on November 30, 2016. For purposes of the graph, and unless otherwise indicated, it has been assumed that (a) all recurring fees (including management fees) were deducted and (b) all dividends and distributions were reinvested. The line graph provides information for Class R6 shares only. As indicated in the tables provided earlier, and in the following paragraphs, performance for other share classes will vary due to the differing charges and expenses applicable to each share class (as indicated in the following paragraphs). Without waiver of fees and/or expense reimbursements, if any, the returns would have been lower.
Past performance does not predict future performance. Total returns and the ending account values in the graph include changes in share price and reinvestment of dividends and capital gains distributions in a hypothetical investment for the periods shown. The Fund’s total returns do not reflect the deduction of income taxes on an individual’s investment. Taxes may reduce your actual investment returns on income or gains paid by the Fund or any gains you may realize if you sell your shares.
10 Visit our website at pgim.com/investments
The average annual total returns take into account applicable charges and fees, which are described for each share class in the table below.
| Class R1 | Class R2 | Class R3 | Class R4 | Class R5 | Class R6 | |||||||
| Maximum initial sales charge | None | None | None | None | None | None | ||||||
| Contingent deferred sales charge (CDSC) (as a percentage of the lower of the original purchase price or the net asset value at redemption) | None | None | None | None | None | None | ||||||
| Annual distribution or distribution and service (12b-1) fees (shown as a percentage of average daily net assets) | 0.50% | 0.25% | 0.10% | None | None | None | ||||||
| Shareholder service fee | 0.10%* | 0.10%* | 0.10%* | 0.10%* | None | None | ||||||
*Shareholder service fee reflects maximum allowable fees under a shareholder services plan.
Benchmark Definitions
Prudential Day One 2015 Custom Benchmark*—The Prudential Day One 2015 Custom Benchmark reflects the normal weighted average of the underlying funds’ stock/non-traditional assets/bond/cash allocation, as represented by the S&P 1500 Composite Index, FTSE Developed ex-North America Index1,2, MSCI Emerging Markets Net Index, Bloomberg US Treasury Inflation-Protected (TIPS) Index, Bloomberg US Aggregate Bond Index, FTSE 3-Month T-Bill1, Bloomberg Commodity Index, and the FTSE EPRA/NAREIT Developed Real Estate Net Index1. Because the asset allocation of the Fund changes over time with the Glidepath, the custom benchmark allocations also change over time. All indices are unmanaged.
S&P Target Date® 2015 Index**—The S&P Target Date Index series is comprised of 13 multi-asset class indices, each of which (with the exception of the S&P Target Date Retirement Income Index) corresponds to a particular retirement date. Each index provides varying levels of exposure to equities and fixed income. Each target date allocation is created and retired according to a predetermined schedule relative to the respective target date.
*The Prudential Day One 2015 Custom Benchmark is calculated by PGIM, Inc. and/or its affiliates with permission from S&P Dow Jones Indices LLC and/or its affiliates. Neither S&P Dow Jones Indices LLC, Dow Jones Trademark Holdings LLC, their affiliates nor their third party licensors make any representation or warranty, express or implied, as to the ability of any index, including the Prudential Day One 2015 Custom Benchmark, to accurately represent the asset class or market sector that it purports to represent and neither S&P Dow Jones Indices LLC, Dow Jones Trademark Holdings LLC, their affiliates nor their third party
Prudential Day One Funds 11
Prudential Day One 2015 Fund
Your Fund’s Performance (continued)
licensors shall have any liability for any errors, omissions, or interruptions of any index, including the Prudential Day One 2015 Custom Benchmark, or the data included therein.
**The S&P Target Date 2015 Index is a product of S&P Dow Jones Indices LLC and/or its affiliates and has been licensed for use by PGIM, Inc. and/or its affiliates. Copyright© 2022 S&P Dow Jones Indices LLC, a division of S&P Global, Inc., and/or its affiliates. All rights reserved. Redistribution or reproduction in whole or in part are prohibited without written permission of S&P Dow Jones Indices LLC. For more information on any of S&P Dow Jones Indices LLC’s indices please visit www.spdji.com. S&P® is a registered trademark of S&P Global and Dow Jones® is a registered trademark of Dow Jones Trademark Holdings LLC.
Investors cannot invest directly in an index. The returns for the Indexes would be lower if they included the effects of sales charges, operating expenses of a mutual fund, or taxes that may be paid by an investor.
Presentation of Fund Holdings as of 7/31/22
Prudential Day One 2015 Fund Ten Largest Holdings | Asset Class | % of Net Assets | ||
PGIM TIPS Fund (Class R6) | TIPS | 22.5% | ||
PGIM Total Return Bond Fund (Class R6) | Total Return Bond | 15.9% | ||
PGIM Core Conservative Bond Fund (Class R6) | Core Bond | 14.1% | ||
PGIM Quant Solutions Large-Cap Core Fund (Class R6) | Large Cap | 12.8% | ||
PGIM Quant Solutions US Broad Market Index Fund (Class R6) | Broad Market | 7.1% | ||
PGIM Quant Solutions International Developed Markets Index Fund (Class R6) | International Developed Markets | 5.6% | ||
PGIM Quant Solutions Commodity Strategies Fund (Class R6) | Commodity | 5.0% | ||
PGIM Global Real Estate Fund (Class R6) | Real Estate | 5.0% | ||
PGIM Quant Solutions Mid-Cap Core Fund (Class R6) | Mid Cap | 1.3% | ||
PGIM Jennison Small-Cap Core Equity Fund (Class R6) | Small Cap | 1.3% | ||
Holdings reflect only long-term investments and are subject to change.
12 Visit our website at pgim.com/investments
Your Fund’s Performance (unaudited)
Performance data quoted represent past performance. Past performance does not guarantee future results. The investment return and principal value of an investment will fluctuate so that an investor’s shares, when redeemed, may be worth more or less than their original cost. Current performance may be lower or higher than the past performance data quoted. An investor may obtain performance data as of the most recent month-end by visiting our website at pgim.com/investments or by calling (800) 225-1852.
| Average Annual Total Returns as of 7/31/22 | ||||||
| One Year (%) | Five Years (%) | Since Inception (%) | ||||
Class R1 | -5.37 | 4.86 | 5.25 (12/13/2016) | |||
Class R2 | -5.05 | 5.11 | 5.50 (12/13/2016) | |||
Class R3 | -4.89 | 5.29 | 5.69 (12/13/2016) | |||
Class R4 | -4.79 | 5.41 | 5.79 (12/13/2016) | |||
Class R5 | -4.77 | 5.50 | 5.89 (12/13/2016) | |||
Class R6 | -4.56 | 5.65 | 5.99 (12/13/2016) | |||
Prudential Day One 2020 Custom Benchmark |
-4.49 | 5.80 | 6.32 | |||
S&P Target Date 2020 Index |
-7.56 | 4.83 | 5.89 | |||
The returns in the table do not reflect the deduction of taxes that a shareholder would pay on Fund distributions or following the redemption of Fund shares. Since Inception returns are provided since the Fund has less than 10 fiscal years of returns. Since Inception returns for the Indexes are measured from the closest month-end to the Fund’s inception date.
Prudential Day One Funds 13
Prudential Day One 2020 Fund
Your Fund’s Performance (continued)
Growth of a $10,000 Investment
The graph compares a $10,000 investment in the Prudential Day One 2020 Fund’s Class R6 shares with a similar investment in the Prudential Day One 2020 Custom Benchmark and S&P Target Date 2020 Index (Index) over time periods ending at the end of the current fiscal year (July 31, 2022) and the account values at the end of the current fiscal year, as measured on a quarterly basis. The R6 share class assumes an initial investment on December 13, 2016, while the Custom Benchmark and the Index assume that the initial investment occurred on November 30, 2016. For purposes of the graph, and unless otherwise indicated, it has been assumed that (a) all recurring fees (including management fees) were deducted and (b) all dividends and distributions were reinvested. The line graph provides information for Class R6 shares only. As indicated in the tables provided earlier, and in the following paragraphs, performance for other share classes will vary due to the differing charges and expenses applicable to each share class (as indicated in the following paragraphs). Without waiver of fees and/or expense reimbursements, if any, the returns would have been lower.
Past performance does not predict future performance. Total returns and the ending account values in the graph include changes in share price and reinvestment of dividends and capital gains distributions in a hypothetical investment for the periods shown. The Fund’s total returns do not reflect the deduction of income taxes on an individual’s investment. Taxes may reduce your actual investment returns on income or gains paid by the Fund or any gains you may realize if you sell your shares.
14 Visit our website at pgim.com/investments
The average annual total returns take into account applicable charges and fees, which are described for each share class in the table below.
| Class R1 | Class R2 | Class R3 | Class R4 | Class R5 | Class R6 | |||||||
| Maximum initial sales charge | None | None | None | None | None | None | ||||||
| Contingent deferred sales charge (CDSC) (as a percentage of the lower of the original purchase price or the net asset value at redemption) | None | None | None | None | None | None | ||||||
| Annual distribution or distribution and service (12b-1) fees (shown as a percentage of average daily net assets) | 0.50% | 0.25% | 0.10% | None | None | None | ||||||
| Shareholder service fee | 0.10%* | 0.10%* | 0.10%* | 0.10%* | None | None | ||||||
*Shareholder service fee reflects maximum allowable fees under a shareholder services plan.
Benchmark Definitions
Prudential Day One 2020 Custom Benchmark*—The Prudential Day One 2020 Custom Benchmark reflects the normal weighted average of the underlying funds’ stock/non-traditional assets/bond/cash allocation, as represented by the S&P 1500 Composite Index, FTSE Developed ex-North America Index1,2, MSCI Emerging Markets Net Index, Bloomberg US Treasury Inflation-Protected (TIPS) Index, Bloomberg US Aggregate Bond Index, FTSE 3-Month T-Bill1, Bloomberg Commodity Index, and the FTSE EPRA/NAREIT Developed Real Estate Net Index1. Because the asset allocation of the Fund changes over time with the Glidepath, the custom benchmark allocations also change over time. All indices are unmanaged.
S&P Target Date® 2020 Index**—The S&P Target Date Index series is comprised of 13 multi-asset class indices, each of which (with the exception of the S&P Target Date Retirement Income Index) corresponds to a particular retirement date. Each index provides varying levels of exposure to equities and fixed income. Each target date allocation is created and retired according to a predetermined schedule relative to the respective target date.
*The Prudential Day One 2020 Custom Benchmark is calculated by PGIM, Inc. and/or its affiliates with permission from S&P Dow Jones Indices LLC and/or its affiliates. Neither S&P Dow Jones Indices LLC, Dow Jones Trademark Holdings LLC, their affiliates nor their third party licensors make any representation or warranty, express or implied, as to the ability of any index, including the Prudential Day One 2020 Custom Benchmark, to accurately represent the asset class or market sector that it purports to represent and neither S&P Dow Jones Indices LLC, Dow Jones Trademark Holdings LLC, their affiliates nor their third party
Prudential Day One Funds 15
Prudential Day One 2020 Fund
Your Fund’s Performance (continued)
licensors shall have any liability for any errors, omissions, or interruptions of any index, including the Prudential Day One 2020 Custom Benchmark, or the data included therein.
**The S&P Target Date 2020 Index is a product of S&P Dow Jones Indices LLC and/or its affiliates and has been licensed for use by PGIM, Inc. and/or its affiliates. Copyright© 2022 S&P Dow Jones Indices LLC, a division of S&P Global, Inc., and/or its affiliates. All rights reserved. Redistribution or reproduction in whole or in part are prohibited without written permission of S&P Dow Jones Indices LLC. For more information on any of S&P Dow Jones Indices LLC’s indices please visit www.spdji.com. S&P® is a registered trademark of S&P Global and Dow Jones® is a registered trademark of Dow Jones Trademark Holdings LLC.
Investors cannot invest directly in an index. The returns for the Indexes would be lower if they included the effects of sales charges, operating expenses of a mutual fund, or taxes that may be paid by an investor.
Presentation of Fund Holdings as of 7/31/22
| Ten Largest Holdings | Asset Class | % of Net Assets | ||
PGIM TIPS Fund (Class R6) | TIPS | 20.9% | ||
PGIM Total Return Bond Fund (Class R6) | Total Return Bond | 15.3% | ||
PGIM Quant Solutions Large-Cap Core Fund (Class R6) | Large Cap | 15.2% | ||
PGIM Core Conservative Bond Fund (Class R6) | Core Bond | 12.3% | ||
PGIM Quant Solutions US Broad Market Index Fund (Class R6) | Broad Market | 7.8% | ||
PGIM Quant Solutions International Developed Markets Index Fund (Class R6) | International Developed Markets | 6.6% | ||
PGIM Quant Solutions Commodity Strategies Fund (Class R6) | Commodity | 5.0% | ||
PGIM Global Real Estate Fund (Class R6) | Real Estate | 5.0% | ||
PGIM Quant Solutions Mid-Cap Core Fund (Class R6) | Mid Cap | 1.8% | ||
PGIM Jennison Small-Cap Core Equity Fund (Class R6) | Small Cap | 1.7% | ||
Holdings reflect only long-term investments and are subject to change.
16 Visit our website at pgim.com/investments
Your Fund’s Performance (unaudited)
Performance data quoted represent past performance. Past performance does not guarantee future results. The investment return and principal value of an investment will fluctuate so that an investor’s shares, when redeemed, may be worth more or less than their original cost. Current performance may be lower or higher than the past performance data quoted. An investor may obtain performance data as of the most recent month-end by visiting our website at pgim.com/investments or by calling (800) 225-1852.
| Average Annual Total Returns as of 7/31/22 | ||||||
| One Year (%) | Five Years (%) | Since Inception (%) | ||||
Class R1 | -5.37 | 5.28 | 5.73 (12/13/2016) | |||
Class R2 | -5.12 | 5.57 | 6.00 (12/13/2016) | |||
Class R3 | -5.04 | 5.71 | 6.16 (12/13/2016) | |||
Class R4 | -4.87 | 5.83 | 6.27 (12/13/2016) | |||
Class R5 | -4.77 | 5.93 | 6.38 (12/13/2016) | |||
Class R6 | -4.70 | 6.08 | 6.54 (12/13/2016) | |||
Prudential Day One 2025 Custom Benchmark |
-4.58 | 6.23 | 6.92 | |||
S&P Target Date 2025 Index |
-7.86 | 5.53 | 6.70 | |||
The returns in the table do not reflect the deduction of taxes that a shareholder would pay on Fund distributions or following the redemption of Fund shares. Since Inception returns are provided since the Fund has less than 10 fiscal years of returns. Since Inception returns for the Indexes are measured from the closest month-end to the Fund’s inception date.
Prudential Day One Funds 17
Prudential Day One 2025 Fund
Your Fund’s Performance (continued)
Growth of a $10,000 Investment
The graph compares a $10,000 investment in the Prudential Day One 2025 Fund’s Class R6 shares with a similar investment in the Prudential Day One 2025 Custom Benchmark and S&P Target Date 2025 Index (Index) over time periods ending at the end of the current fiscal year (July 31, 2022) and the account values at the end of the current fiscal year, as measured on a quarterly basis. The R6 share class assumes an initial investment on December 13, 2016, while the Custom Benchmark and the Index assume that the initial investment occurred on November 30, 2016. For purposes of the graph, and unless otherwise indicated, it has been assumed that (a) all recurring fees (including management fees) were deducted and (b) all dividends and distributions were reinvested. The line graph provides information for Class R6 shares only. As indicated in the tables provided earlier, and in the following paragraphs, performance for other share classes will vary due to the differing charges and expenses applicable to each share class (as indicated in the following paragraphs). Without waiver of fees and/or expense reimbursements, if any, the returns would have been lower.
Past performance does not predict future performance. Total returns and the ending account values in the graph include changes in share price and reinvestment of dividends and capital gains distributions in a hypothetical investment for the periods shown. The Fund’s total returns do not reflect the deduction of income taxes on an individual’s investment. Taxes may reduce your actual investment returns on income or gains paid by the Fund or any gains you may realize if you sell your shares.
18 Visit our website at pgim.com/investments
The average annual total returns take into account applicable charges and fees, which are described for each share class in the table below.
| Class R1 | Class R2 | Class R3 | Class R4 | Class R5 | Class R6 | |||||||
| Maximum initial sales charge | None | None | None | None | None | None | ||||||
| Contingent deferred sales charge (CDSC) (as a percentage of the lower of the original purchase price or the net asset value at redemption) | None | None | None | None | None | None | ||||||
| Annual distribution or distribution and service (12b-1) fees (shown as a percentage of average daily net assets) | 0.50% | 0.25% | 0.10% | None | None | None | ||||||
| Shareholder service fee | 0.10%* | 0.10%* | 0.10%* | 0.10%* | None | None | ||||||
*Shareholder service fee reflects maximum allowable fees under a shareholder services plan.
Benchmark Definitions
Prudential Day One 2025 Custom Benchmark*—The Prudential Day One 2025 Custom Benchmark reflects the normal weighted average of the underlying funds’ stock/non-traditional assets/bond/cash allocation, as represented by the S&P 1500 Composite Index, FTSE Developed ex-North America Index,1,2, MSCI Emerging Markets Net Index, Bloomberg US Treasury Inflation-Protected (TIPS) Index, Bloomberg US Aggregate Bond Index, FTSE 3-Month T-Bill1, Bloomberg Commodity Index, and the FTSE EPRA/NAREIT Developed Real Estate Net Index1. Because the asset allocation of the Fund changes over time with the Glidepath, the custom benchmark allocations also change over time. All indices are unmanaged.
S&P Target Date® 2025 Index**—The S&P Target Date Index series is comprised of 13 multi-asset class indices, each of which (with the exception of the S&P Target Date Retirement Income Index) corresponds to a particular retirement date. Each index provides varying levels of exposure to equities and fixed income. Each target date allocation is created and retired according to a predetermined schedule relative to the respective target date.
*The Prudential Day One 2025 Custom Benchmark is calculated by PGIM, Inc. and/or its affiliates with permission from S&P Dow Jones Indices LLC and/or its affiliates. Neither S&P Dow Jones Indices LLC, Dow Jones Trademark Holdings LLC, their affiliates nor their third party licensors make any representation or warranty, express or implied, as to the ability of any index, including the Prudential Day One 2025 Custom Benchmark, to accurately represent the asset class or market sector that it purports to represent and neither S&P Dow Jones Indices LLC, Dow Jones Trademark Holdings LLC, their affiliates nor their third party
Prudential Day One Funds 19
Prudential Day One 2025 Fund
Your Fund’s Performance (continued)
licensors shall have any liability for any errors, omissions, or interruptions of any index, including the Prudential Day One 2025 Custom Benchmark, or the data included therein.
**The S&P Target Date 2025 Index is a product of S&P Dow Jones Indices LLC and/or its affiliates and has been licensed for use by PGIM, Inc. and/or its affiliates. Copyright© 2022 S&P Dow Jones Indices LLC, a division of S&P Global, Inc., and/or its affiliates. All rights reserved. Redistribution or reproduction in whole or in part are prohibited without written permission of S&P Dow Jones Indices LLC. For more information on any of S&P Dow Jones Indices LLC’s indices please visit www.spdji.com. S&P® is a registered trademark of S&P Global and Dow Jones® is a registered trademark of Dow Jones Trademark Holdings LLC.
Investors cannot invest directly in an index. The returns for the Indexes would be lower if they included the effects of sales charges, operating expenses of a mutual fund, or taxes that may be paid by an investor.
Presentation of Fund Holdings as of 7/31/22
| Ten Largest Holdings | Asset Class | % of Net Assets | ||
PGIM TIPS Fund (Class R6) | TIPS | 19.5% | ||
PGIM Quant Solutions Large-Cap Core Fund (Class R6) | Large Cap | 17.5% | ||
PGIM Total Return Bond Fund (Class R6) | Total Return Bond | 14.9% | ||
PGIM Core Conservative Bond Fund (Class R6) | Core Bond | 9.5% | ||
PGIM Quant Solutions US Broad Market Index Fund (Class R6) | Broad Market | 9.0% | ||
PGIM Quant Solutions International Developed Markets Index Fund (Class R6) | International Developed Markets | 8.2% | ||
PGIM Quant Solutions Commodity Strategies Fund (Class R6) | Commodity | 5.0% | ||
PGIM Global Real Estate Fund (Class R6) | Real Estate | 5.0% | ||
PGIM Quant Solutions Mid-Cap Core Fund (Class R6) | Mid Cap | 2.0% | ||
PGIM Jennison Small-Cap Core Equity Fund (Class R6) | Small Cap | 2.0% | ||
Holdings reflect only long-term investments and are subject to change.
20 Visit our website at pgim.com/investments
Your Fund’s Performance (unaudited)
Performance data quoted represent past performance. Past performance does not guarantee future results. The investment return and principal value of an investment will fluctuate so that an investor’s shares, when redeemed, may be worth more or less than their original cost. Current performance may be lower or higher than the past performance data quoted. An investor may obtain performance data as of the most recent month-end by visiting our website at pgim.com/investments or by calling (800) 225-1852.
| Average Annual Total Returns as of 7/31/22 | ||||||
| One Year (%) | Five Years (%) | Since Inception (%) | ||||
Class R1 | -5.94 | 6.08 | 6.73 (12/13/2016) | |||
Class R2 | -5.69 | 6.37 | 7.00 (12/13/2016) | |||
Class R3 | -5.55 | 6.51 | 7.14 (12/13/2016) | |||
Class R4 | -5.47 | 6.59 | 7.23 (12/13/2016) | |||
Class R5 | -5.36 | 6.71 | 7.36 (12/13/2016) | |||
Class R6 | -5.20 | 6.90 | 7.54 (12/13/2016) | |||
Prudential Day One 2030 Custom Benchmark |
-5.09 | 7.14 | 8.08 | |||
S&P Target Date 2030 Index |
-8.15 | 6.15 | 7.41 | |||
The returns in the table do not reflect the deduction of taxes that a shareholder would pay on Fund distributions or following the redemption of Fund shares. Since Inception returns are provided since the Fund has less than 10 fiscal years of returns. Since Inception returns for the Indexes are measured from the closest month-end to the Fund’s inception date.
Prudential Day One Funds 21
Prudential Day One 2030 Fund
Your Fund’s Performance (continued)
Growth of a $10,000 Investment

The graph compares a $10,000 investment in the Prudential Day One 2030 Fund’s Class R6 shares with a similar investment in the Prudential Day One 2030 Custom Benchmark and S&P Target Date 2030 Index (Index) over time periods ending at the end of the current fiscal year (July 31, 2022) and the account values at the end of the current fiscal year, as measured on a quarterly basis. The R6 share class assumes an initial investment on December 13, 2016, while the Custom Benchmark and the Index assume that the initial investment occurred on November 30, 2016. For purposes of the graph, and unless otherwise indicated, it has been assumed that (a) all recurring fees (including management fees) were deducted and (b) all dividends and distributions were reinvested. The line graph provides information for Class R6 shares only. As indicated in the tables provided earlier, and in the following paragraphs, performance for other share classes will vary due to the differing charges and expenses applicable to each share class (as indicated in the following paragraphs). Without waiver of fees and/or expense reimbursements, if any, the returns would have been lower.
Past performance does not predict future performance. Total returns and the ending account values in the graph include changes in share price and reinvestment of dividends and capital gains distributions in a hypothetical investment for the periods shown. The Fund’s total returns do not reflect the deduction of income taxes on an individual’s investment. Taxes may reduce your actual investment returns on income or gains paid by the Fund or any gains you may realize if you sell your shares.
22 Visit our website at pgim.com/investments
The average annual total returns take into account applicable charges and fees, which are described for each share class in the table below.
| Class R1 | Class R2 | Class R3 | Class R4 | Class R5 | Class R6 | |||||||
| Maximum initial sales charge | None | None | None | None | None | None | ||||||
| Contingent deferred sales charge (CDSC) (as a percentage of the lower of the original purchase price or the net asset value at redemption) | None | None | None | None | None | None | ||||||
| Annual distribution or distribution and service (12b-1) fees (shown as a percentage of average daily net assets) | 0.50% | 0.25% | 0.10% | None | None | None | ||||||
| Shareholder service fee | 0.10%* | 0.10%* | 0.10%* | 0.10%* | None | None | ||||||
*Shareholder service fee reflects maximum allowable fees under a shareholder services plan.
Benchmark Definitions
Prudential Day One 2030 Custom Benchmark*—The Prudential Day One 2030 Custom Benchmark reflects the normal weighted average of the underlying funds’ stock/non-traditional assets/bond/cash allocation, as represented by the S&P 1500 Composite Index, FTSE Developed ex-North America Index1,2, MSCI Emerging Markets Net Index, Bloomberg US Treasury Inflation-Protected (TIPS) Index, Bloomberg US Aggregate Bond Index, FTSE 3-Month T-Bill1, Bloomberg Commodity Index, and the FTSE EPRA/NAREIT Developed Real Estate Net Index1. Because the asset allocation of the Fund changes over time with the Glidepath, the custom benchmark allocations also change over time. All indices are unmanaged.
S&P Target Date® 2030 Index**—The S&P Target Date Index series is comprised of 13 multi-asset class indices, each of which (with the exception of the S&P Target Date Retirement Income Index) corresponds to a particular retirement date. Each index provides varying levels of exposure to equities and fixed income. Each target date allocation is created and retired according to a predetermined schedule relative to the respective target date.
*The Prudential Day One 2030 Custom Benchmark is calculated by PGIM, Inc. and/or its affiliates with permission from S&P Dow Jones Indices LLC and/or its affiliates. Neither S&P Dow Jones Indices LLC, Dow Jones Trademark Holdings LLC, their affiliates nor their third party licensors make any representation or warranty, express or implied, as to the ability of any index, including the Prudential Day One 2030 Custom Benchmark, to accurately represent the asset class or market sector that it purports to represent and neither S&P Dow Jones Indices LLC, Dow Jones Trademark Holdings LLC, their affiliates nor their third party
Prudential Day One Funds 23
Prudential Day One 2030 Fund
Your Fund’s Performance (continued)
licensors shall have any liability for any errors, omissions, or interruptions of any index, including the Prudential Day One 2030 Custom Benchmark, or the data included therein.
**The S&P Target Date 2030 Index is a product of S&P Dow Jones Indices LLC and/or its affiliates and has been licensed for use by PGIM, Inc. and/or its affiliates. Copyright© 2022 S&P Dow Jones Indices LLC, a division of S&P Global, Inc., and/or its affiliates. All rights reserved. Redistribution or reproduction in whole or in part are prohibited without written permission of S&P Dow Jones Indices LLC. For more information on any of S&P Dow Jones Indices LLC’s indices please visit www.spdji.com. S&P® is a registered trademark of S&P Global and Dow Jones® is a registered trademark of Dow Jones Trademark Holdings LLC.
Investors cannot invest directly in an index. The returns for the Indexes would be lower if they included the effects of sales charges, operating expenses of a mutual fund, or taxes that may be paid by an investor.
Presentation of Fund Holdings as of 7/31/22
| Ten Largest Holdings | Asset Class | % of Net Assets | ||
PGIM Quant Solutions Large-Cap Core Fund (Class R6) | Large Cap | 19.8% | ||
PGIM TIPS Fund (Class R6) | TIPS | 15.5% | ||
PGIM Total Return Bond Fund (Class R6) | Total Return Bond | 13.7% | ||
PGIM Quant Solutions US Broad Market Index Fund (Class R6) | Broad Market | 11.7% | ||
PGIM Quant Solutions International Developed Markets Index Fund (Class R6) | International Developed Markets | 10.6% | ||
PGIM Core Conservative Bond Fund (Class R6) | Core Bond | 6.7% | ||
PGIM Global Real Estate Fund (Class R6) | Real Estate | 5.0% | ||
PGIM Quant Solutions Commodity Strategies Fund (Class R6) | Commodity | 4.4% | ||
PGIM Quant Solutions Mid-Cap Core Fund (Class R6) | Mid Cap | 2.8% | ||
PGIM Jennison Small-Cap Core Equity Fund (Class R6) | Small Cap | 2.8% | ||
Holdings reflect only long-term investments and are subject to change.
24 Visit our website at pgim.com/investments
Your Fund’s Performance (unaudited)
Performance data quoted represent past performance. Past performance does not guarantee future results. The investment return and principal value of an investment will fluctuate so that an investor’s shares, when redeemed, may be worth more or less than their original cost. Current performance may be lower or higher than the past performance data quoted. An investor may obtain performance data as of the most recent month-end by visiting our website at pgim.com/investments or by calling (800) 225-1852.
| Average Annual Total Returns as of 7/31/22 | ||||||
| One Year (%) | Five Years (%) | Since Inception (%) | ||||
Class R1 | -6.67 | 6.62 | 7.33 (12/13/2016) | |||
Class R2 | -6.36 | 6.88 | 7.60 (12/13/2016) | |||
Class R3 | -6.29 | 7.04 | 7.76 (12/13/2016) | |||
Class R4 | -6.17 | 7.16 | 7.89 (12/13/2016) | |||
Class R5 | -6.08 | 7.27 | 7.98 (12/13/2016) | |||
Class R6 | -5.94 | 7.40 | 8.13 (12/13/2016) | |||
Prudential Day One 2035 Custom Benchmark |
-5.74 | 7.87 | 8.98 | |||
S&P Target Date 2035 Index |
-8.44 | 6.79 | 8.16 | |||
The returns in the table do not reflect the deduction of taxes that a shareholder would pay on Fund distributions or following the redemption of Fund shares. Since Inception returns are provided since the Fund has less than 10 fiscal years of returns. Since Inception returns for the Indexes are measured from the closest month-end to the Fund’s inception date.
Prudential Day One Funds 25
Prudential Day One 2035 Fund
Your Fund’s Performance (continued)
Growth of a $10,000 Investment
The graph compares a $10,000 investment in the Prudential Day One 2035 Fund’s Class R6 shares with a similar investment in the Prudential Day One 2035 Custom Benchmark and S&P Target Date 2035 Index (Index) over time periods ending at the end of the current fiscal year (July 31, 2022) and the account values at the end of the current fiscal year, as measured on a quarterly basis. The R6 share class assumes an initial investment on December 13, 2016, while the Custom Benchmark and the Index assume that the initial investment occurred on November 30, 2016. For purposes of the graph, and unless otherwise indicated, it has been assumed that (a) all recurring fees (including management fees) were deducted and (b) all dividends and distributions were reinvested. The line graph provides information for Class R6 shares only. As indicated in the tables provided earlier, and in the following paragraphs, performance for other share classes will vary due to the differing charges and expenses applicable to each share class (as indicated in the following paragraphs). Without waiver of fees and/or expense reimbursements, if any, the returns would have been lower.
Past performance does not predict future performance. Total returns and the ending account values in the graph include changes in share price and reinvestment of dividends and capital gains distributions in a hypothetical investment for the periods shown. The Fund’s total returns do not reflect the deduction of income taxes on an individual’s investment. Taxes may reduce your actual investment returns on income or gains paid by the Fund or any gains you may realize if you sell your shares.
26 Visit our website at pgim.com/investments
The average annual total returns take into account applicable charges and fees, which are described for each share class in the table below.
| Class R1 | Class R2 | Class R3 | Class R4 | Class R5 | Class R6 | |||||||
| Maximum initial sales charge | None | None | None | None | None | None | ||||||
| Contingent deferred sales charge (CDSC) (as a percentage of the lower of the original purchase price or the net asset value at redemption) | None | None | None | None | None | None | ||||||
| Annual distribution or distribution and service (12b-1) fees (shown as a percentage of average daily net assets) | 0.50% | 0.25% | 0.10% | None | None | None | ||||||
| Shareholder service fee | 0.10%* | 0.10%* | 0.10%* | 0.10%* | None | None | ||||||
*Shareholder service fee reflects maximum allowable fees under a shareholder services plan.
Benchmark Definitions
Prudential Day One 2035 Custom Benchmark*—The Prudential Day One 2035 Custom Benchmark reflects the normal weighted average of the underlying funds’ stock/non-traditional assets/bond/cash allocation, as represented by the S&P 1500 Composite Index, FTSE Developed ex-North America Index1,2, MSCI Emerging Markets Net Index, Bloomberg US Treasury Inflation-Protected (TIPS) Index, Bloomberg US Aggregate Bond Index, FTSE 3-Month T-Bill1, Bloomberg Commodity Index, and the FTSE EPRA/NAREIT Developed Real Estate Net Index1. Because the asset allocation of the Fund changes over time with the Glidepath, the custom benchmark allocations also change over time. All indices are unmanaged.
S&P Target Date® 2035 Index**—The S&P Target Date Index series is comprised of 13 multi-asset class indices, each of which (with the exception of the S&P Target Date Retirement Income Index) corresponds to a particular retirement date. Each index provides varying levels of exposure to equities and fixed income. Each target date allocation is created and retired according to a predetermined schedule relative to the respective target date.
*The Prudential Day One 2035 Custom Benchmark is calculated by PGIM, Inc. and/or its affiliates with permission from S&P Dow Jones Indices LLC and/or its affiliates. Neither S&P Dow Jones Indices LLC, Dow Jones Trademark Holdings LLC, their affiliates nor their third party licensors make any representation or warranty, express or implied, as to the ability of any index, including the Prudential Day One 2035 Custom Benchmark, to accurately represent the asset class or market sector that it purports to represent and neither S&P Dow Jones Indices LLC, Dow Jones Trademark Holdings LLC, their affiliates nor their third party
Prudential Day One Funds 27
Prudential Day One 2035 Fund
Your Fund’s Performance (continued)
licensors shall have any liability for any errors, omissions, or interruptions of any index, including the Prudential Day One 2035 Custom Benchmark, or the data included therein.
**The S&P Target Date 2035 Index is a product of S&P Dow Jones Indices LLC and/or its affiliates and has been licensed for use by PGIM, Inc. and/or its affiliates. Copyright© 2022 S&P Dow Jones Indices LLC, a division of S&P Global, Inc., and/or its affiliates. All rights reserved. Redistribution or reproduction in whole or in part are prohibited without written permission of S&P Dow Jones Indices LLC. For more information on any of S&P Dow Jones Indices LLC’s indices please visit www.spdji.com. S&P® is a registered trademark of S&P Global and Dow Jones® is a registered trademark of Dow Jones Trademark Holdings LLC.
Investors cannot invest directly in an index. The returns for the Indexes would be lower if they included the effects of sales charges, operating expenses of a mutual fund, or taxes that may be paid by an investor.
Presentation of Fund Holdings as of 7/31/22
| Ten Largest Holdings | Asset Class | % of Net Assets | ||
PGIM Quant Solutions Large-Cap Core Fund (Class R6) | Large Cap | 23.2% | ||
PGIM Quant Solutions US Broad Market Index Fund (Class R6) | Broad Market | 14.6% | ||
PGIM Quant Solutions International Developed Markets Index Fund (Class R6) | International Developed Markets | 13.3% | ||
PGIM Total Return Bond Fund (Class R6) | Total Return Bond | 11.1% | ||
PGIM TIPS Fund (Class R6) | TIPS | 10.6% | ||
PGIM Core Conservative Bond Fund (Class R6) | Core Bond | 5.3% | ||
PGIM Global Real Estate Fund (Class R6) | Real Estate | 4.4% | ||
PGIM Quant Solutions Commodity Strategies Fund (Class R6) | Commodity | 4.0% | ||
PGIM Quant Solutions Mid-Cap Core Fund (Class R6) | Mid Cap | 3.8% | ||
PGIM Jennison Small-Cap Core Equity Fund (Class R6) | Small Cap | 3.8% | ||
Holdings reflect only long-term investments and are subject to change.
28 Visit our website at pgim.com/investments
Your Fund’s Performance (unaudited)
Performance data quoted represent past performance. Past performance does not guarantee future results. The investment return and principal value of an investment will fluctuate so that an investor’s shares, when redeemed, may be worth more or less than their original cost. Current performance may be lower or higher than the past performance data quoted. An investor may obtain performance data as of the most recent month-end by visiting our website at pgim.com/investments or by calling (800) 225-1852.
| Average Annual Total Returns as of 7/31/22 | ||||||
| One Year (%) | Five Years (%) | Since Inception (%) | ||||
Class R1 | -7.02 | 6.87 | 7.71 (12/13/2016) | |||
Class R2 | -6.85 | 7.12 | 7.97 (12/13/2016) | |||
Class R3 | -6.69 | 7.28 | 8.14 (12/13/2016) | |||
Class R4 | -6.53 | 7.40 | 8.26 (12/13/2016) | |||
Class R5 | -6.43 | 7.50 | 8.37 (12/13/2016) | |||
Class R6 | -6.35 | 7.66 | 8.52 (12/13/2016) | |||
Prudential Day One 2040 Custom Benchmark |
-6.34 | 8.17 | 9.43 | |||
S&P Target Date 2040 Index |
-8.63 | 7.24 | 8.67 | |||
The returns in the table do not reflect the deduction of taxes that a shareholder would pay on Fund distributions or following the redemption of Fund shares. Since Inception returns are provided since the Fund has less than 10 fiscal years of returns. Since Inception returns for the Indexes are measured from the closest month-end to the Fund’s inception date.
Prudential Day One Funds 29
Prudential Day One 2040 Fund
Your Fund’s Performance (continued)
Growth of a $10,000 Investment
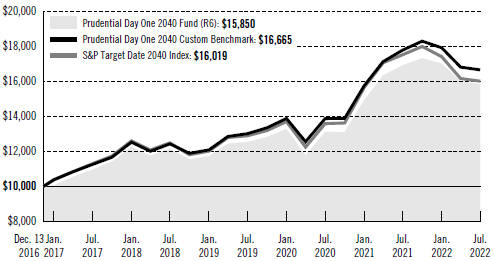
The graph compares a $10,000 investment in the Prudential Day One 2040 Fund’s Class R6 shares with a similar investment in the Prudential Day One 2040 Custom Benchmark and S&P Target Date 2040 Index (Index) over time periods ending at the end of the current fiscal year (July 31, 2022) and the account values at the end of the current fiscal year, as measured on a quarterly basis. The R6 share class assumes an initial investment on December 13, 2016, while the Custom Benchmark and the Index assume that the initial investment occurred on November 30, 2016. For purposes of the graph, and unless otherwise indicated, it has been assumed that (a) all recurring fees (including management fees) were deducted and (b) all dividends and distributions were reinvested. The line graph provides information for Class R6 shares only. As indicated in the tables provided earlier, and in the following paragraphs, performance for other share classes will vary due to the differing charges and expenses applicable to each share class (as indicated in the following paragraphs). Without waiver of fees and/or expense reimbursements, if any, the returns would have been lower.
Past performance does not predict future performance. Total returns and the ending account values in the graph include changes in share price and reinvestment of dividends and capital gains distributions in a hypothetical investment for the periods shown. The Fund’s total returns do not reflect the deduction of income taxes on an individual’s investment. Taxes may reduce your actual investment returns on income or gains paid by the Fund or any gains you may realize if you sell your shares.
30 Visit our website at pgim.com/investments
The average annual total returns take into account applicable charges and fees, which are described for each share class in the table below.
| Class R1 | Class R2 | Class R3 | Class R4 | Class R5 | Class R6 | |||||||
| Maximum initial sales charge | None | None | None | None | None | None | ||||||
| Contingent deferred sales charge (CDSC) (as a percentage of the lower of the original purchase price or the net asset value at redemption) | None | None | None | None | None | None | ||||||
| Annual distribution or distribution and service (12b-1) fees (shown as a percentage of average daily net assets) | 0.50% | 0.25% | 0.10% | None | None | None | ||||||
| Shareholder service fee | 0.10%* | 0.10%* | 0.10%* | 0.10%* | None | None | ||||||
*Shareholder service fee reflects maximum allowable fees under a shareholder services plan.
Benchmark Definitions
Prudential Day One 2040 Custom Benchmark*—The Prudential Day One 2040 Custom Benchmark reflects the normal weighted average of the underlying funds’ stock/non-traditional assets/bond/cash allocation, as represented by the S&P 1500 Composite Index, FTSE Developed ex-North America Index1,2, MSCI Emerging Markets Net Index, Bloomberg US Treasury Inflation-Protected (TIPS) Index, Bloomberg US Aggregate Bond Index, FTSE 3-Month T-Bill1, Bloomberg Commodity Index, and the FTSE EPRA/NAREIT Developed Real Estate Net Index1. Because the asset allocation of the Fund changes over time with the Glidepath, the custom benchmark allocations also change over time. All indices are unmanaged.
S&P Target Date® 2040 Index**—The S&P Target Date Index series is comprised of 13 multi-asset class indices, each of which (with the exception of the S&P Target Date Retirement Income Index) corresponds to a particular retirement date. Each index provides varying levels of exposure to equities and fixed income. Each target date allocation is created and retired according to a predetermined schedule relative to the respective target date.
*The Prudential Day One 2040 Custom Benchmark is calculated by PGIM, Inc. and/or its affiliates with permission from S&P Dow Jones Indices LLC and/or its affiliates. Neither S&P Dow Jones Indices LLC, Dow Jones Trademark Holdings LLC, their affiliates nor their third party licensors make any representation or warranty, express or implied, as to the ability of any index, including the Prudential Day One 2040 Custom Benchmark, to accurately represent the asset class or market sector that it purports to represent and neither S&P Dow Jones Indices LLC, Dow Jones Trademark Holdings LLC, their affiliates nor their third party
Prudential Day One Funds 31
Prudential Day One 2040 Fund
Your Fund’s Performance (continued)
licensors shall have any liability for any errors, omissions, or interruptions of any index, including the Prudential Day One 2040 Custom Benchmark, or the data included therein.
**The S&P Target Date 2040 Index is a product of S&P Dow Jones Indices LLC and/or its affiliates and has been licensed for use by PGIM, Inc. and/or its affiliates. Copyright© 2022 S&P Dow Jones Indices LLC, a division of S&P Global, Inc., and/or its affiliates. All rights reserved. Redistribution or reproduction in whole or in part are prohibited without written permission of S&P Dow Jones Indices LLC. For more information on any of S&P Dow Jones Indices LLC’s indices please visit www.spdji.com. S&P® is a registered trademark of S&P Global and Dow Jones® is a registered trademark of Dow Jones Trademark Holdings LLC.
Investors cannot invest directly in an index. The returns for the Indexes would be lower if they included the effects of sales charges, operating expenses of a mutual fund, or taxes that may be paid by an investor.
Presentation of Fund Holdings as of 7/31/22
| Ten Largest Holdings | Asset Class | % of Net Assets | ||
PGIM Quant Solutions Large-Cap Core Fund (Class R6) | Large Cap | 24.1% | ||
PGIM Quant Solutions International Developed Markets Index Fund (Class R6) | International Developed Markets | 15.9% | ||
PGIM Quant Solutions US Broad Market Index Fund (Class R6) | Broad Market | 15.6% | ||
PGIM Total Return Bond Fund (Class R6) | Total Return Bond | 8.7% | ||
PGIM TIPS Fund (Class R6) | TIPS | 7.2% | ||
PGIM Quant Solutions Mid-Cap Core Fund (Class R6) | Mid Cap | 6.0% | ||
PGIM Jennison Small-Cap Core Equity Fund (Class R6) | Small Cap | 4.5% | ||
PGIM Core Conservative Bond Fund (Class R6) | Core Bond | 4.4% | ||
PGIM Quant Solutions Emerging Markets Equity Fund (Class R6) | Emerging Markets | 4.1% | ||
PGIM Quant Solutions Commodity Strategies Fund (Class R6) | Commodity | 4.0% | ||
Holdings reflect only long-term investments and are subject to change.
32 Visit our website at pgim.com/investments
Your Fund’s Performance (unaudited)
Performance data quoted represent past performance. Past performance does not guarantee future results. The investment return and principal value of an investment will fluctuate so that an investor’s shares, when redeemed, may be worth more or less than their original cost. Current performance may be lower or higher than the past performance data quoted. An investor may obtain performance data as of the most recent month-end by visiting our website at pgim.com/investments or by calling (800) 225-1852.
| Average Annual Total Returns as of 7/31/22 | ||||||
| One Year (%) | Five Years (%) | Since Inception (%) | ||||
Class R1 | -7.75 | 6.96 | 7.91 (12/13/2016) | |||
Class R2 | -7.56 | 7.23 | 8.18 (12/13/2016) | |||
Class R3 | -7.43 | 7.38 | 8.33 (12/13/2016) | |||
Class R4 | -7.31 | 7.50 | 8.45 (12/13/2016) | |||
Class R5 | -7.20 | 7.61 | 8.57 (12/13/2016) | |||
Class R6 | -7.12 | 7.76 | 8.73 (12/13/2016) | |||
Prudential Day One 2045 Custom Benchmark |
-7.09 | 8.30 | 9.67 | |||
S&P Target Date 2045 Index |
-8.76 | 7.48 | 8.96 | |||
The returns in the table do not reflect the deduction of taxes that a shareholder would pay on Fund distributions or following the redemption of Fund shares. Since Inception returns are provided since the Fund has less than 10 fiscal years of returns. Since Inception returns for the Indexes are measured from the closest month-end to the Fund’s inception date.
Prudential Day One Funds 33
Prudential Day One 2045 Fund
Your Fund’s Performance (continued)
Growth of a $10,000 Investment
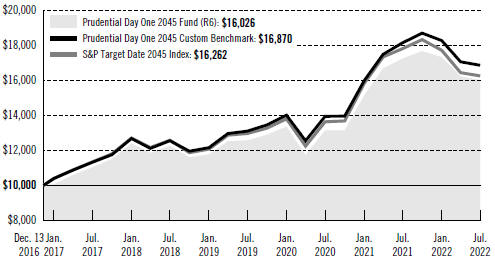
The graph compares a $10,000 investment in the Prudential Day One 2045 Fund’s Class R6 shares with a similar investment in the Prudential Day One 2045 Custom Benchmark and S&P Target Date 2045 Index (Index) over time periods ending at the end of the current fiscal year (July 31, 2022) and the account values at the end of the current fiscal year, as measured on a quarterly basis. The R6 share class assumes an initial investment on December 13, 2016, while the Custom Benchmark and the Index assume that the initial investment occurred on November 30, 2016. For purposes of the graph, and unless otherwise indicated, it has been assumed that (a) all recurring fees (including management fees) were deducted and (b) all dividends and distributions were reinvested. The line graph provides information for Class R6 shares only. As indicated in the tables provided earlier, and in the following paragraphs, performance for other share classes will vary due to the differing charges and expenses applicable to each share class (as indicated in the following paragraphs). Without waiver of fees and/or expense reimbursements, if any, the returns would have been lower.
Past performance does not predict future performance. Total returns and the ending account values in the graph include changes in share price and reinvestment of dividends and capital gains distributions in a hypothetical investment for the periods shown. The Fund’s total returns do not reflect the deduction of income taxes on an individual’s investment. Taxes may reduce your actual investment returns on income or gains paid by the Fund or any gains you may realize if you sell your shares.
34 Visit our website at pgim.com/investments
The average annual total returns take into account applicable charges and fees, which are described for each share class in the table below.
| Class R1 | Class R2 | Class R3 | Class R4 | Class R5 | Class R6 | |||||||
| Maximum initial sales charge | None | None | None | None | None | None | ||||||
| Contingent deferred sales charge (CDSC) (as a percentage of the lower of the original purchase price or the net asset value at redemption) | None | None | None | None | None | None | ||||||
| Annual distribution or distribution and service (12b-1) fees (shown as a percentage of average daily net assets) | 0.50% | 0.25% | 0.10% | None | None | None | ||||||
| Shareholder service fee | 0.10%* | 0.10%* | 0.10%* | 0.10%* | None | None | ||||||
*Shareholder service fee reflects maximum allowable fees under a shareholder services plan.
Benchmark Definitions
Prudential Day One 2045 Custom Benchmark*—The Prudential Day One 2045 Custom Benchmark reflects the normal weighted average of the underlying funds’ stock/non-traditional assets/bond/cash allocation, as represented by the S&P 1500 Composite Index, FTSE Developed ex-North America Index1,2, MSCI Emerging Markets Net Index, Bloomberg US Treasury Inflation-Protected (TIPS) Index, Bloomberg US Aggregate Bond Index, FTSE 3-Month T-Bill1, Bloomberg Commodity Index, and the FTSE EPRA/NAREIT Developed Real Estate Net Index1. Because the asset allocation of the Fund changes over time with the Glidepath, the custom benchmark allocations also change over time. All indices are unmanaged.
S&P Target Date® 2045 Index**—The S&P Target Date Index series is comprised of 13 multi-asset class indices, each of which (with the exception of the S&P Target Date Retirement Income Index) corresponds to a particular retirement date. Each index provides varying levels of exposure to equities and fixed income. Each target date allocation is created and retired according to a predetermined schedule relative to the respective target date.
*The Prudential Day One 2045 Custom Benchmark is calculated by PGIM, Inc. and/or its affiliates with permission from S&P Dow Jones Indices LLC and/or its affiliates. Neither S&P Dow Jones Indices LLC, Dow Jones Trademark Holdings LLC, their affiliates nor their third party licensors make any representation or warranty, express or implied, as to the ability of any index, including the Prudential Day One 2045 Custom Benchmark, to accurately represent the asset class or market sector that it purports to represent and neither S&P Dow Jones Indices LLC, Dow Jones Trademark Holdings LLC, their affiliates nor their third party
Prudential Day One Funds 35
Prudential Day One 2045 Fund
Your Fund’s Performance (continued)
licensors shall have any liability for any errors, omissions, or interruptions of any index, including the Prudential Day One 2045 Custom Benchmark, or the data included therein.
**The S&P Target Date 2045 Index is a product of S&P Dow Jones Indices LLC and/or its affiliates and has been licensed for use by PGIM, Inc. and/or its affiliates. Copyright© 2022 S&P Dow Jones Indices LLC, a division of S&P Global, Inc., and/or its affiliates. All rights reserved. Redistribution or reproduction in whole or in part are prohibited without written permission of S&P Dow Jones Indices LLC. For more information on any of S&P Dow Jones Indices LLC’s indices please visit www.spdji.com. S&P® is a registered trademark of S&P Global and Dow Jones® is a registered trademark of Dow Jones Trademark Holdings LLC.
Investors cannot invest directly in an index. The returns for the Indexes would be lower if they included the effects of sales charges, operating expenses of a mutual fund, or taxes that may be paid by an investor.
Presentation of Fund Holdings as of 7/31/22
| Ten Largest Holdings | Asset Class | % of Net Assets | ||
PGIM Quant Solutions Large-Cap Core Fund (Class R6) | Large Cap | 24.4% | ||
PGIM Quant Solutions International Developed Markets Index Fund (Class R6) | International Developed Markets | 19.0% | ||
PGIM Quant Solutions US Broad Market Index Fund (Class R6) | Broad Market | 16.1% | ||
PGIM Total Return Bond Fund (Class R6) | Total Return Bond | 8.0% | ||
PGIM Quant Solutions Mid-Cap Core Fund (Class R6) | Mid Cap | 7.8% | ||
PGIM Quant Solutions Emerging Markets Equity Fund (Class R6) | Emerging Markets | 5.5% | ||
PGIM Jennison Small-Cap Core Equity Fund (Class R6) | Small Cap | 4.9% | ||
PGIM Global Real Estate Fund (Class R6) | Real Estate | 4.0% | ||
PGIM TIPS Fund (Class R6) | TIPS | 3.6% | ||
PGIM Quant Solutions Commodity Strategies Fund (Class R6) | Commodity | 3.4% | ||
Holdings reflect only long-term investments and are subject to change.
36 Visit our website at pgim.com/investments
Your Fund’s Performance (unaudited)
Performance data quoted represent past performance. Past performance does not guarantee future results. The investment return and principal value of an investment will fluctuate so that an investor’s shares, when redeemed, may be worth more or less than their original cost. Current performance may be lower or higher than the past performance data quoted. An investor may obtain performance data as of the most recent month-end by visiting our website at pgim.com/investments or by calling (800) 225-1852.
| Average Annual Total Returns as of 7/31/22 | ||||||
| One Year (%) | Five Years (%) | Since Inception (%) | ||||
Class R1 | -8.23 | 6.96 | 7.88 (12/13/2016) | |||
Class R2 | -7.92 | 7.25 | 8.15 (12/13/2016) | |||
Class R3 | -7.83 | 7.41 | 8.32 (12/13/2016) | |||
Class R4 | -7.79 | 7.47 | 8.39 (12/13/2016) | |||
Class R5 | -7.63 | 7.61 | 8.54 (12/13/2016) | |||
Class R6 | -7.47 | 7.81 | 8.73 (12/13/2016) | |||
Prudential Day One 2050 Custom Benchmark |
-7.60 | 8.36 | 9.80 | |||
S&P Target Date 2050 Index |
-8.83 | 7.61 | 9.15 | |||
The returns in the table do not reflect the deduction of taxes that a shareholder would pay on Fund distributions or following the redemption of Fund shares. Since Inception returns are provided since the Fund has less than 10 fiscal years of returns. Since Inception returns for the Indexes are measured from the closest month-end to the Fund’s inception date.
Prudential Day One Funds 37
Prudential Day One 2050 Fund
Your Fund’s Performance (continued)
Growth of a $10,000 Investment
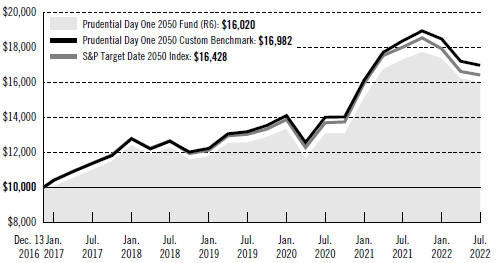
The graph compares a $10,000 investment in the Prudential Day One 2050 Fund’s Class R6 shares with a similar investment in the Prudential Day One 2050 Custom Benchmark and S&P Target Date 2050 Index (Index) over time periods ending at the end of the current fiscal year (July 31, 2022) and the account values at the end of the current fiscal year, as measured on a quarterly basis. The R6 share class assumes an initial investment on December 13, 2016, while the Custom Benchmark and the Index assume that the initial investment occurred on November 30, 2016. For purposes of the graph, and unless otherwise indicated, it has been assumed that (a) all recurring fees (including management fees) were deducted and (b) all dividends and distributions were reinvested. The line graph provides information for Class R6 shares only. As indicated in the tables provided earlier, and in the following paragraphs, performance for other share classes will vary due to the differing charges and expenses applicable to each share class (as indicated in the following paragraphs). Without waiver of fees and/or expense reimbursements, if any, the returns would have been lower.
Past performance does not predict future performance. Total returns and the ending account values in the graph include changes in share price and reinvestment of dividends and capital gains distributions in a hypothetical investment for the periods shown. The Fund’s total returns do not reflect the deduction of income taxes on an individual’s investment. Taxes may reduce your actual investment returns on income or gains paid by the Fund or any gains you may realize if you sell your shares.
38 Visit our website at pgim.com/investments
The average annual total returns take into account applicable charges and fees, which are described for each share class in the table below.
| Class R1 | Class R2 | Class R3 | Class R4 | Class R5 | Class R6 | |||||||
| Maximum initial sales charge | None | None | None | None | None | None | ||||||
| Contingent deferred sales charge (CDSC) (as a percentage of the lower of the original purchase price or the net asset value at redemption) | None | None | None | None | None | None | ||||||
| Annual distribution or distribution and service (12b-1) fees (shown as a percentage of average daily net assets) | 0.50% | 0.25% | 0.10% | None | None | None | ||||||
| Shareholder service fee | 0.10%* | 0.10%* | 0.10%* | 0.10%* | None | None | ||||||
*Shareholder service fee reflects maximum allowable fees under a shareholder services plan.
Benchmark Definitions
Prudential Day One 2050 Custom Benchmark*—The Prudential Day One 2050 Custom Benchmark reflects the normal weighted average of the underlying funds’ stock/non-traditional assets/bond/cash allocation, as represented by the S&P 1500 Composite Index, FTSE Developed ex-North America Index1,2, MSCI Emerging Markets Net Index, Bloomberg US Treasury Inflation-Protected (TIPS) Index, Bloomberg US Aggregate Bond Index, FTSE 3-Month T-Bill1, Bloomberg Commodity Index, and the FTSE EPRA/NAREIT Developed Real Estate Net Index1. Because the asset allocation of the Fund changes over time with the Glidepath, the custom benchmark allocations also change over time. All indices are unmanaged.
S&P Target Date® 2050 Index**—The S&P Target Date Index series is comprised of 13 multi-asset class indices, each of which (with the exception of the S&P Target Date Retirement Income Index) corresponds to a particular retirement date. Each index provides varying levels of exposure to equities and fixed income. Each target date allocation is created and retired according to a predetermined schedule relative to the respective target date.
*The Prudential Day One 2050 Custom Benchmark is calculated by PGIM, Inc. and/or its affiliates with permission from S&P Dow Jones Indices LLC and/or its affiliates. Neither S&P Dow Jones Indices LLC, Dow Jones Trademark Holdings LLC, their affiliates nor their third party licensors make any representation or warranty, express or implied, as to the ability of any index, including the Prudential Day One 2050 Custom Benchmark, to accurately represent the asset class or market sector that it purports to represent and neither S&P Dow Jones Indices LLC, Dow Jones Trademark Holdings LLC, their affiliates nor their third party
Prudential Day One Funds 39
Prudential Day One 2050 Fund
Your Fund’s Performance (continued)
licensors shall have any liability for any errors, omissions, or interruptions of any index, including the Prudential Day One 2050 Custom Benchmark, or the data included therein.
**The S&P Target Date 2050 Index is a product of S&P Dow Jones Indices LLC and/or its affiliates and has been licensed for use by PGIM, Inc. and/or its affiliates. Copyright© 2022 S&P Dow Jones Indices LLC, a division of S&P Global, Inc., and/or its affiliates. All rights reserved. Redistribution or reproduction in whole or in part are prohibited without written permission of S&P Dow Jones Indices LLC. For more information on any of S&P Dow Jones Indices LLC’s indices please visit www.spdji.com. S&P® is a registered trademark of S&P Global and Dow Jones® is a registered trademark of Dow Jones Trademark Holdings LLC.
Investors cannot invest directly in an index. The returns for the Indexes would be lower if they included the effects of sales charges, operating expenses of a mutual fund, or taxes that may be paid by an investor.
Presentation of Fund Holdings as of 7/31/22
| Ten Largest Holdings | Asset Class | % of Net Assets | ||
PGIM Quant Solutions Large-Cap Core Fund (Class R6) | Large Cap | 25.7% | ||
PGIM Quant Solutions International Developed Markets Index Fund (Class R6) | International Developed Markets | 21.4% | ||
PGIM Quant Solutions US Broad Market Index Fund (Class R6) | Broad Market | 16.5% | ||
PGIM Quant Solutions Mid-Cap Core Fund (Class R6) | Mid Cap | 8.2% | ||
PGIM Total Return Bond Fund (Class R6) | Total Return Bond | 6.8% | ||
PGIM Quant Solutions Emerging Markets Equity Fund (Class R6) | Emerging Markets | 6.5% | ||
PGIM Jennison Small-Cap Core Equity Fund (Class R6) | Small Cap | 5.0% | ||
PGIM Global Real Estate Fund (Class R6) | Real Estate | 4.0% | ||
PGIM Quant Solutions Commodity Strategies Fund (Class R6) | Commodity | 3.0% | ||
PGIM TIPS Fund (Class R6) | TIPS | 1.4% | ||
Holdings reflect only long-term investments and are subject to change.
40 Visit our website at pgim.com/investments
Your Fund’s Performance (unaudited)
Performance data quoted represent past performance. Past performance does not guarantee future results. The investment return and principal value of an investment will fluctuate so that an investor’s shares, when redeemed, may be worth more or less than their original cost. Current performance may be lower or higher than the past performance data quoted. An investor may obtain performance data as of the most recent month-end by visiting our website at pgim.com/investments or by calling (800) 225-1852.
| Average Annual Total Returns as of 7/31/22 | ||||||
| One Year (%) | Five Years (%) | Since Inception (%) | ||||
Class R1 | -8.47 | 6.96 | 8.09 (12/13/2016) | |||
Class R2 | -8.28 | 7.23 | 8.36 (12/13/2016) | |||
Class R3 | -8.03 | 7.39 | 8.53 (12/13/2016) | |||
Class R4 | -8.01 | 7.50 | 8.64 (12/13/2016) | |||
Class R5 | -7.88 | 7.61 | 8.76 (12/13/2016) | |||
Class R6 | -7.82 | 7.74 | 8.89 (12/13/2016) | |||
Prudential Day One 2055 Custom Benchmark |
-7.89 | 8.36 | 9.88 | |||
S&P Target Date 2055 Index |
-8.86 | 7.66 | 9.24 | |||
The returns in the table do not reflect the deduction of taxes that a shareholder would pay on Fund distributions or following the redemption of Fund shares. Since Inception returns are provided since the Fund has less than 10 fiscal years of returns. Since Inception returns for the Indexes are measured from the closest month-end to the Fund’s inception date.
Prudential Day One Funds 41
Prudential Day One 2055 Fund
Your Fund’s Performance (continued)
Growth of a $10,000 Investment
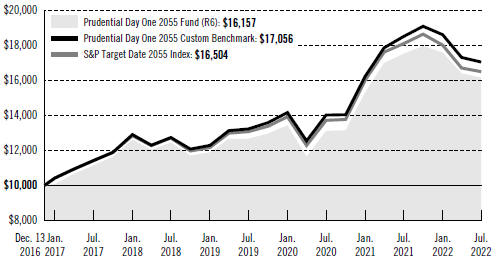
The graph compares a $10,000 investment in the Prudential Day One 2055 Fund’s Class R6 shares with a similar investment in the Prudential Day One 2055 Custom Benchmark and S&P Target Date 2055 Index (Index) over time periods ending at the end of the current fiscal year (July 31, 2022) and the account values at the end of the current fiscal year, as measured on a quarterly basis. The R6 share class assumes an initial investment on December 13, 2016, while the Custom Benchmark and the Index assume that the initial investment occurred on November 30, 2016. For purposes of the graph, and unless otherwise indicated, it has been assumed that (a) all recurring fees (including management fees) were deducted and (b) all dividends and distributions were reinvested. The line graph provides information for Class R6 shares only. As indicated in the tables provided earlier, and in the following paragraphs, performance for other share classes will vary due to the differing charges and expenses applicable to each share class (as indicated in the following paragraphs). Without waiver of fees and/or expense reimbursements, if any, the returns would have been lower.
Past performance does not predict future performance. Total returns and the ending account values in the graph include changes in share price and reinvestment of dividends and capital gains distributions in a hypothetical investment for the periods shown. The Fund’s total returns do not reflect the deduction of income taxes on an individual’s investment. Taxes may reduce your actual investment returns on income or gains paid by the Fund or any gains you may realize if you sell your shares.
42 Visit our website at pgim.com/investments
The average annual total returns take into account applicable charges and fees, which are described for each share class in the table below.
| Class R1 | Class R2 | Class R3 | Class R4 | Class R5 | Class R6 | |||||||
| Maximum initial sales charge | None | None | None | None | None | None | ||||||
| Contingent deferred sales charge (CDSC) (as a percentage of the lower of the original purchase price or the net asset value at redemption) | None | None | None | None | None | None | ||||||
| Annual distribution or distribution and service (12b-1) fees (shown as a percentage of average daily net assets) | 0.50% | 0.25% | 0.10% | None | None | None | ||||||
| Shareholder service fee | 0.10%* | 0.10%* | 0.10%* | 0.10%* | None | None | ||||||
*Shareholder service fee reflects maximum allowable fees under a shareholder services plan.
Benchmark Definitions
Prudential Day One 2055 Custom Benchmark*—The Prudential Day One 2055 Custom Benchmark reflects the normal weighted average of the underlying funds’ stock/non-traditional assets/bond/cash allocation, as represented by the S&P 1500 Composite Index, FTSE Developed ex-North America Index1,2, MSCI Emerging Markets Net Index, Bloomberg US Treasury Inflation-Protected (TIPS) Index, Bloomberg US Aggregate Bond Index, FTSE 3-Month T-Bill1, Bloomberg Commodity Index, and the FTSE EPRA/NAREIT Developed Real Estate Net Index1. Because the asset allocation of the Fund changes over time with the Glidepath, the custom benchmark allocations also change over time. All indices are unmanaged.
S&P Target Date® 2055 Index**—The S&P Target Date Index series is comprised of 13 multi-asset class indices, each of which (with the exception of the S&P Target Date Retirement Income Index) corresponds to a particular retirement date. Each index provides varying levels of exposure to equities and fixed income. Each target date allocation is created and retired according to a predetermined schedule relative to the respective target date.
*The Prudential Day One 2055 Custom Benchmark is calculated by PGIM, Inc. and/or its affiliates with permission from S&P Dow Jones Indices LLC and/or its affiliates. Neither S&P Dow Jones Indices LLC, Dow Jones Trademark Holdings LLC, their affiliates nor their third party licensors make any representation or warranty, express or implied, as to the ability of any index, including the Prudential Day One 2055 Custom Benchmark, to accurately represent the asset class or market sector that it purports to represent and neither S&P Dow Jones Indices LLC, Dow Jones Trademark Holdings LLC, their affiliates nor their third party
Prudential Day One Funds 43
Prudential Day One 2055 Fund
Your Fund’s Performance (continued)
licensors shall have any liability for any errors, omissions, or interruptions of any index, including the Prudential Day One 2055 Custom Benchmark, or the data included therein.
**The S&P Target Date 2055 Index is a product of S&P Dow Jones Indices LLC and/or its affiliates and has been licensed for use by PGIM, Inc. and/or its affiliates. Copyright© 2022 S&P Dow Jones Indices LLC, a division of S&P Global, Inc., and/or its affiliates. All rights reserved. Redistribution or reproduction in whole or in part are prohibited without written permission of S&P Dow Jones Indices LLC. For more information on any of S&P Dow Jones Indices LLC’s indices please visit www.spdji.com. S&P® is a registered trademark of S&P Global and Dow Jones® is a registered trademark of Dow Jones Trademark Holdings LLC.
Investors cannot invest directly in an index. The returns for the Indexes would be lower if they included the effects of sales charges, operating expenses of a mutual fund, or taxes that may be paid by an investor.
Presentation of Fund Holdings as of 7/31/22
| Top Largest Holdings | Asset Class | % of Net Assets | ||
PGIM Quant Solutions Large-Cap Core Fund (Class R6) | Large Cap | 25.5% | ||
PGIM Quant Solutions International Developed Markets Index Fund (Class R6) | International Developed Markets | 22.8% | ||
PGIM Quant Solutions US Broad Market Index Fund (Class R6) | Broad Market | 16.5% | ||
PGIM Quant Solutions Mid-Cap Core Fund (Class R6) | Mid Cap | 8.8% | ||
PGIM Quant Solutions Emerging Markets Equity Fund (Class R6) | Emerging Markets | 7.5% | ||
PGIM Total Return Bond Fund (Class R6) | Total Return Bond | 6.8% | ||
PGIM Jennison Small-Cap Core Equity Fund (Class R6) | Small Cap | 5.0% | ||
PGIM Global Real Estate Fund (Class R6) | Real Estate | 4.0% | ||
PGIM Quant Solutions Commodity Strategies Fund (Class R6) | Commodity | 3.0% | ||
Holdings reflect only long-term investments and are subject to change.
44 Visit our website at pgim.com/investments
Your Fund’s Performance (unaudited)
Performance data quoted represent past performance. Past performance does not guarantee future results. The investment return and principal value of an investment will fluctuate so that an investor’s shares, when redeemed, may be worth more or less than their original cost. Current performance may be lower or higher than the past performance data quoted. An investor may obtain performance data as of the most recent month-end by visiting our website at pgim.com/investments or by calling (800) 225-1852.
| Average Annual Total Returns as of 7/31/22 | ||||||
| One Year (%) | Five Years (%) | Since Inception (%) | ||||
Class R1 | -8.62 | 7.00 | 8.02 (12/13/2016) | |||
Class R2 | -8.37 | 7.26 | 8.29 (12/13/2016) | |||
Class R3 | -8.28 | 7.42 | 8.45 (12/13/2016) | |||
Class R4 | -8.12 | 7.55 | 8.57 (12/13/2016) | |||
Class R5 | -8.01 | 7.66 | 8.68 (12/13/2016) | |||
Class R6 | -7.93 | 7.81 | 8.83 (12/13/2016) | |||
Prudential Day One 2060 Custom Benchmark |
-8.09 | 8.39 | 9.94 | |||
S&P Target Date 2060 Index |
-8.90 | 7.73 | 9.33 | |||
The returns in the table do not reflect the deduction of taxes that a shareholder would pay on Fund distributions or following the redemption of Fund shares. Since Inception returns are provided since the Fund has less than 10 fiscal years of returns. Since Inception returns for the Indexes are measured from the closest month-end to the Fund’s inception date.
Prudential Day One Funds 45
Prudential Day One 2060 Fund
Your Fund’s Performance (continued)
Growth of a $10,000 Investment
The graph compares a $10,000 investment in the Prudential Day One 2060 Fund’s Class R6 shares with a similar investment in the Prudential Day One 2060 Custom Benchmark and S&P Target Date 2060 Index (Index) over time periods ending at the end of the current fiscal year (July 31, 2022) and the account values at the end of the current fiscal year, as measured on a quarterly basis. The R6 share class assumes an initial investment on December 13, 2016, while the Custom Benchmark and the Index assume that the initial investment occurred on November 30, 2016. For purposes of the graph, and unless otherwise indicated, it has been assumed that (a) all recurring fees (including management fees) were deducted and (b) all dividends and distributions were reinvested. The line graph provides information for Class R6 shares only. As indicated in the tables provided earlier, and in the following paragraphs, performance for other share classes will vary due to the differing charges and expenses applicable to each share class (as indicated in the following paragraphs). Without waiver of fees and/or expense reimbursements, if any, the returns would have been lower.
Past performance does not predict future performance. Total returns and the ending account values in the graph include changes in share price and reinvestment of dividends and capital gains distributions in a hypothetical investment for the periods shown. The Fund’s total returns do not reflect the deduction of income taxes on an individual’s investment. Taxes may reduce your actual investment returns on income or gains paid by the Fund or any gains you may realize if you sell your shares.
46 Visit our website at pgim.com/investments
The average annual total returns take into account applicable charges and fees, which are described for each share class in the table below.
| Class R1 | Class R2 | Class R3 | Class R4 | Class R5 | Class R6 | |||||||
| Maximum initial sales charge | None | None | None | None | None | None | ||||||
| Contingent deferred sales charge (CDSC) (as a percentage of the lower of the original purchase price or the net asset value at redemption) | None | None | None | None | None | None | ||||||
| Annual distribution or distribution and service (12b-1) fees (shown as a percentage of average daily net assets) | 0.50% | 0.25% | 0.10% | None | None | None | ||||||
| Shareholder service fee | 0.10%* | 0.10%* | 0.10%* | 0.10%* | None | None | ||||||
*Shareholder service fee reflects maximum allowable fees under a shareholder services plan.
Benchmark Definitions
Prudential Day One 2060 Custom Benchmark*—The Prudential Day One 2060 Custom Benchmark reflects the normal weighted average of the underlying funds’ stock/non-traditional assets/bond/cash allocation, as represented by the S&P 1500 Composite Index, FTSE Developed ex-North America Index1,2, MSCI Emerging Markets Net Index, Bloomberg US Treasury Inflation-Protected (TIPS) Index, Bloomberg US Aggregate Bond Index, FTSE 3-Month T-Bill1, Bloomberg Commodity Index, and the FTSE EPRA/NAREIT Developed Real Estate Net Index1. Because the asset allocation of the Fund changes over time with the Glidepath, the custom benchmark allocations also change over time. All indices are unmanaged.
S&P Target Date® 2060 Index**—The S&P Target Date Index series is comprised of 13 multi-asset class indices, each of which (with the exception of the S&P Target Date Retirement Income Index) corresponds to a particular retirement date. Each index provides varying levels of exposure to equities and fixed income. Each target date allocation is created and retired according to a predetermined schedule relative to the respective target date.
*The Prudential Day One 2060 Custom Benchmark is calculated by PGIM, Inc. and/or its affiliates with permission from S&P Dow Jones Indices LLC and/or its affiliates. Neither S&P Dow Jones Indices LLC, Dow Jones Trademark Holdings LLC, their affiliates nor their third party licensors make any representation or warranty, express or implied, as to the ability of any index, including the Prudential Day One 2060 Custom Benchmark, to accurately represent the asset class or market sector that it purports to represent and neither S&P Dow Jones Indices LLC, Dow Jones Trademark Holdings LLC, their affiliates nor their third party
Prudential Day One Funds 47
Prudential Day One 2060 Fund
Your Fund’s Performance (continued)
licensors shall have any liability for any errors, omissions, or interruptions of any index, including the Prudential Day One 2060 Custom Benchmark, or the data included therein.
**The S&P Target Date 2060 Index is a product of S&P Dow Jones Indices LLC and/or its affiliates and has been licensed for use by PGIM, Inc. and/or its affiliates. Copyright© 2022 S&P Dow Jones Indices LLC, a division of S&P Global, Inc., and/or its affiliates. All rights reserved. Redistribution or reproduction in whole or in part are prohibited without written permission of S&P Dow Jones Indices LLC. For more information on any of S&P Dow Jones Indices LLC’s indices please visit www.spdji.com. S&P® is a registered trademark of S&P Global and Dow Jones® is a registered trademark of Dow Jones Trademark Holdings LLC.
Investors cannot invest directly in an index. The returns for the Indexes would be lower if they included the effects of sales charges, operating expenses of a mutual fund, or taxes that may be paid by an investor.
Presentation of Fund Holdings as of 7/31/22
| Top Largest Holdings | Asset Class | % of Net Assets | ||
PGIM Quant Solutions Large-Cap Core Fund (Class R6) | Large Cap | 25.0% | ||
PGIM Quant Solutions International Developed Markets Index Fund (Class R6) | International Developed Markets | 23.9% | ||
PGIM Quant Solutions US Broad Market Index Fund (Class R6) | Broad Market | 16.5% | ||
PGIM Quant Solutions Mid-Cap Core Fund (Class R6) | Mid Cap | 9.2% | ||
PGIM Quant Solutions Emerging Markets Equity Fund (Class R6) | Emerging Markets | 8.5% | ||
PGIM Jennison Small-Cap Core Equity Fund (Class R6) | Small Cap | 5.0% | ||
PGIM Total Return Bond Fund (Class R6) | Total Return Bond | 4.8% | ||
PGIM Global Real Estate Fund (Class R6) | Real Estate | 4.0% | ||
PGIM Quant Solutions Commodity Strategies Fund (Class R6) | Commodity | 3.0% | ||
Holdings reflect only long-term investments and are subject to change.
48 Visit our website at pgim.com/investments
Your Fund’s Performance (unaudited)
Performance data quoted represent past performance. Past performance does not guarantee future results. The investment return and principal value of an investment will fluctuate so that an investor’s shares, when redeemed, may be worth more or less than their original cost. Current performance may be lower or higher than the past performance data quoted. An investor may obtain performance data as of the most recent month-end by visiting our website at pgim.com/investments or by calling (800) 225-1852.
| Average Annual Total Returns as of 7/31/22 | ||||
| One Year (%) | Since Inception (%) | |||
Class R1 | -8.61 | 6.36 (12/16/2019) | ||
Class R2 | -8.45 | 6.62 (12/16/2019) | ||
Class R3 | -8.30 | 6.77 (12/16/2019) | ||
Class R4 | -8.21 | 6.89 (12/16/2019) | ||
Class R5 | -8.11 | 7.00 (12/16/2019) | ||
Class R6 | -7.97 | 7.15 (12/16/2019) | ||
Prudential Day One 2065 Custom Benchmark |
-8.20 | 6.99 | ||
S&P Target Date 2065+ Index |
-8.76 | 6.38 | ||
The returns in the table do not reflect the deduction of taxes that a shareholder would pay on Fund distributions or following the redemption of Fund shares. Since Inception returns are provided since the Fund has less than 10 fiscal years of returns. Since Inception returns for the Indexes are measured from the closest month-end to the Fund’s inception date.
Prudential Day One Funds 49
Prudential Day One 2065 Fund
Your Fund’s Performance (continued)
Growth of a $10,000 Investment
The graph compares a $10,000 investment in the Prudential Day One 2065 Fund’s Class R6 shares with a similar investment in the Prudential Day One 2065 Custom Benchmark and S&P Target Date 2065+ Index (Index) over time periods ending at the end of the current fiscal year (July 31, 2022) and the account values at the end of the current fiscal year, as measured on a quarterly basis. The R6 share class assumes an initial investment on December 16, 2019, while the Custom Benchmark and the Index assume that the initial investment occurred on December 31, 2019. For purposes of the graph, and unless otherwise indicated, it has been assumed that (a) all recurring fees (including management fees) were deducted and (b) all dividends and distributions were reinvested. The line graph provides information for Class R6 shares only. As indicated in the tables provided earlier, and in the following paragraphs, performance for other share classes will vary due to the differing charges and expenses applicable to each share class (as indicated in the following paragraphs). Without waiver of fees and/or expense reimbursements, if any, the returns would have been lower.
Past performance does not predict future performance. Total returns and the ending account values in the graph include changes in share price and reinvestment of dividends and capital gains distributions in a hypothetical investment for the periods shown. The Fund’s total returns do not reflect the deduction of income taxes on an individual’s investment. Taxes may reduce your actual investment returns on income or gains paid by the Fund or any gains you may realize if you sell your shares.
50 Visit our website at pgim.com/investments
The average annual total returns take into account applicable charges and fees, which are described for each share class in the table below.
| Class R1 | Class R2 | Class R3 | Class R4 | Class R5 | Class R6 | |||||||
| Maximum initial sales charge | None | None | None | None | None | None | ||||||
| Contingent deferred sales charge (CDSC) (as a percentage of the lower of the original purchase price or the net asset value at redemption) | None | None | None | None | None | None | ||||||
| Annual distribution or distribution and service (12b-1) fees (shown as a percentage of average daily net assets) | 0.50% | 0.25% | 0.10% | None | None | None | ||||||
| Shareholder service fee | 0.10%* | 0.10%* | 0.10%* | 0.10%* | None | None | ||||||
*Shareholder service fee reflects maximum allowable fees under a shareholder services plan.
Benchmark Definitions
Prudential Day One 2065 Custom Benchmark*—The Prudential Day One 2065 Custom Benchmark reflects the normal weighted average of the underlying funds’ stock/non-traditional assets/bond/cash allocation, as represented by the S&P 1500 Composite Index, FTSE Developed ex-North America Index,1,2, MSCI Emerging Markets Net Index, Bloomberg US Treasury Inflation-Protected (TIPS) Index, Bloomberg US Aggregate Bond Index, FTSE 3-Month T-Bill1, Bloomberg Commodity Index, and the FTSE EPRA/NAREIT Developed Real Estate Net Index1. Because the asset allocation of the Fund changes over time with the Glidepath, the custom benchmark allocations also change over time. All indices are unmanaged.
S&P Target Date® 2065+ Index**—The S&P Target Date Index series is comprised of 13 multi-asset class indices, each of which (with the exception of the S&P Target Date Retirement Income Index) corresponds to a particular retirement date. Each index provides varying levels of exposure to equities and fixed income. Each target date allocation is created and retired according to a predetermined schedule relative to the respective target date.
*The Prudential Day One 2065 Custom Benchmark is calculated by PGIM, Inc. and/or its affiliates with permission from S&P Dow Jones Indices LLC and/or its affiliates. Neither S&P Dow Jones Indices LLC, Dow Jones Trademark Holdings LLC, their affiliates nor their third party licensors make any representation or warranty, express or implied, as to the ability of any index, including the Prudential Day One 2065 Custom Benchmark, to accurately represent the asset class or market sector that it purports to represent and neither S&P Dow Jones Indices LLC, Dow Jones Trademark Holdings LLC, their affiliates nor their third party
Prudential Day One Funds 51
Prudential Day One 2065 Fund
Your Fund’s Performance (continued)
licensors shall have any liability for any errors, omissions, or interruptions of any index, including the Prudential Day One 2065 Custom Benchmark, or the data included therein.
**The S&P Target Date 2065+ Index is a product of S&P Dow Jones Indices LLC and/or its affiliates and has been licensed for use by PGIM, Inc. and/or its affiliates. Copyright© 2022 S&P Dow Jones Indices LLC, a division of S&P Global, Inc., and/or its affiliates. All rights reserved. Redistribution or reproduction in whole or in part are prohibited without written permission of S&P Dow Jones Indices LLC. For more information on any of S&P Dow Jones Indices LLC’s indices please visit www.spdji.com. S&P® is a registered trademark of S&P Global and Dow Jones® is a registered trademark of Dow Jones Trademark Holdings LLC.
Investors cannot invest directly in an index. The returns for the Indexes would be lower if they included the effects of sales charges, operating expenses of a mutual fund, or taxes that may be paid by an investor.
52 Visit our website at pgim.com/investments
1 Source: London Stock Exchange Group plc and its group undertakings (collectively, the “LSE Group”). © LSE Group 2018. FTSE Russell is a trading name of certain of the LSE Group companies. “FTSE®” and “FTSE Russell®” are trade mark(s) of the relevant LSE Group companies and is/are used by any other LSE Group company under license. “TMX®” is a trade mark of TSX, Inc. and used by the LSE Group under license. All rights in the FTSE Russell indexes or data vest in the relevant LSE Group company which owns the index or the data. Neither LSE Group nor its licensors accept any liability for any errors or omissions in the indexes or data and no party may rely on any indexes or data contained in this communication. No further distribution of data from the LSE Group is permitted without the relevant LSE Group company’s express written consent. The LSE Group does not promote, sponsor or endorse the content of this communication.
2 Effective 12/31/18, the Russell Developed ex-North America Large Cap Net Index was decommissioned and subsequently replaced with the FTSE Developed ex-North America Index. Historical returns for the Prudential Day One Custom Benchmarks, prior to 12/31/18, will not be re-stated.
Presentation of Fund Holdings as of 7/31/22
| Top Largest Holdings | Asset Class | % of Net Assets | ||
PGIM Quant Solutions Large-Cap Core Fund (Class R6) | Large Cap | 25.0% | ||
PGIM Quant Solutions International Developed Markets Index Fund (Class R6) | International Developed Markets | 24.9% | ||
PGIM Quant Solutions US Broad Market Index Fund (Class R6) | Broad Market | 16.5% | ||
PGIM Quant Solutions Mid-Cap Core Fund (Class R6) | Mid Cap | 9.2% | ||
PGIM Quant Solutions Emerging Markets Equity Fund (Class R6) | Emerging Markets | 8.9% | ||
PGIM Jennison Small-Cap Core Equity Fund (Class R6) | Small Cap | 5.0% | ||
PGIM Global Real Estate Fund (Class R6) | Real Estate | 4.0% | ||
PGIM Total Return Bond Fund (Class R6) | Total Return Bond | 3.4% | ||
PGIM Quant Solutions Commodity Strategies Fund (Class R6) | Commodity | 3.0% | ||
Holdings reflect only long-term investments and are subject to change.
Prudential Day One Funds 53
Strategy and Performance Overview* (unaudited)
What were the market conditions?
| · | Elevated economic uncertainty, rising inflation, and investor expectations of a downshift in global growth from the stellar rebound of 2021 were already underway at the start of 2022. New shocks—most notably Russia’s invasion of Ukraine and the reinstatement of COVID-19-related shutdowns in China—significantly worsened the trend of lower global growth and higher inflation during the first seven months of 2022. |
| · | Rising recession fears gripped global markets in 2022 as a challenging combination of macro economic events led stocks into bear market territory, and investors assumed a “risk off” stance across most asset segments (Investors who take a “risk-off” stance perceive risk to be high in current market conditions. In response, they tend to gravitate toward lower-risk investments and focus on protecting their capital). |
| · | Stocks struggled globally during the 12-month reporting period that ended July 31, 2022, with most equity asset classes turning in negative returns. US stocks outpaced non-US equities during the period. The decline in stocks was driven primarily by a significant compression in earnings multiples. |
| · | Commodities stood out as a shining-star asset class and an attractive hedge in the prevailing, inflation-prone economic context. |
| · | Declines in bonds (the flip-side of higher rates) were also substantial, with the bond bear market growling even louder. The Bloomberg Global Aggregate Index extended its losses, falling about 15% from its January 2021 high, the biggest drawdown since 1990. |
How did the Funds perform?
The performance of each Fund’s R6 share class and benchmark for the reporting period follows:
The Prudential Day One Income Fund returned –4.78%, underperforming the –4.49% return of the Prudential Day One Income Custom Benchmark and outperforming the –7.36% return of the S&P Target Date Retirement Income Index.
The Prudential Day One 2015 Fund returned –4.57%, underperforming the –4.43% return of the Prudential Day One 2015 Custom Benchmark and outperforming the –7.26% return of the S&P Target Date 2015 Index.
The Prudential Day One 2020 Fund returned –4.56%, underperforming the –4.49% return of the Prudential Day One 2020 Custom Benchmark and outperforming the –7.56% return of the S&P Target Date 2020 Index.
54 Visit our website at pgim.com/investments
The Prudential Day One 2025 Fund returned –4.70%, underperforming the –4.58% return of the Prudential Day One 2025 Custom Benchmark and outperforming the –7.86% return of the S&P Target Date 2025 Index.
The Prudential Day One 2030 Fund returned –5.20%, underperforming the –5.09% return of the Prudential Day One 2030 Custom Benchmark and outperforming the –8.15% return of the S&P Target Date 2030 Index.
The Prudential Day One 2035 Fund returned –5.94%, underperforming the –5.74% return of the Prudential Day One 2035 Custom Benchmark and outperforming the –8.44% return of the S&P Target Date 2035 Index.
The Prudential Day One 2040 Fund returned –6.35%, underperforming the –6.34% return of the Prudential Day One 2040 Custom Benchmark and outperforming the –8.63% return of the S&P Target Date 2040 Index.
The Prudential Day One 2045 Fund returned –7.12%, underperforming the –7.09% return of the Prudential Day One 2045 Custom Benchmark and outperforming the –8.76% return of the S&P Target Date 2045 Index.
The Prudential Day One 2050 Fund returned –7.47%, outperforming the –7.60% return of the Prudential Day One 2050 Custom Benchmark and the –8.83% return of the S&P Target Date 2050 Index.
The Prudential Day One 2055 Fund returned –7.82%, outperforming the –7.89% return of the Prudential Day One 2055 Custom Benchmark and the –8.86% return of the S&P Target Date 2055 Index.
The Prudential Day One 2060 Fund returned –7.93%, outperforming the –8.09% return of the Prudential Day One 2060 Custom Benchmark and the –8.90% return of the S&P Target Date 2060 Index.
The Prudential Day One 2065 Fund returned –7.97%, outperforming the –8.20% return of the Prudential Day One 2065 Custom Benchmark and the –8.76% return of the S&P Target Date 2065+ Index.
What worked?
| · | Each Fund in the Prudential Day One Funds series is allocated to a combination of stocks and bonds. Stocks outperformed bonds by approximately 4.5% during the reporting period, which provided greater benefit to more equity-centric funds. |
| · | The Funds’ allocation to commodities was a major positive contributor to performance during the period as the asset class outperformed both stocks and bonds by over 30%. |
Prudential Day One Funds 55
Strategy and Performance Overview* (continued)
| · | Within equities, the Funds’ bias toward US stocks relative to non-US stocks added to overall results, as non-US stocks trailed by a significant margin. Within bonds, the Funds’ strong allocation to TIPS (Treasury Inflation-Protected Securities) and money markets significantly contributed to overall results, as core US bonds were the worst-performing fixed income asset class. |
| · | At the underlying fund level, the PGIM Quant Solutions Commodity Strategies, Emerging Markets Equity, PGIM Quant Solutions Mid-Cap Core, and PGIM Quant Solutions Large-Cap Core Funds were the greatest contributors to relative performance, as each Fund significantly outperformed its respective benchmark for the period. |
What didn’t work?
| · | Although it is standard for target date funds to allocate to both stocks and bonds, the Funds’ allocation to both equities and bonds did not provide much safety as both asset classes turned in negative performance during the period. |
| · | At the underlying fund level, the PGIM Total Return Bond Fund, PGIM Global Real Estate Fund, PGIM Core Conservative Bond Fund, and PGIM TIPS Fund were the most significant underperformers relative to their respective benchmarks, which detracted from overall results relative to the custom benchmark for the period. |
Current outlook
| · | PGIM Quant Solutions believes that the US economy is relatively insulated from the global downturn and remains supported by a strong labor market for now. Nevertheless, headwinds—including higher gasoline prices, negative real wage growth, and negative wealth effects from declining financial markets—persist. |
| · | Central banks continue their attempts at walking a tightrope, looking to balance efforts to combat an intensifying inflation problem with increasing risks to growth stemming from multiple shocks and policy tightening. After initially misjudging the inflation problem as “transitory” and thus facing credibility challenges, central banks are likely to front-load rate hikes, increasing the risks of policy overtightening and economic downturn. |
| · | Despite significant equity market declines and improved valuations, we remain cautious on stocks due to the combination of heightened recession risk, hawkish central banks, and significant potential for corporate earnings downgrades. |
| · | The tough macro economic environment argues for caution on fixed income risk assets. However, some bond segments exhibit very attractive value (emerging market debt), while others have yet to fully price in recession risk (US high yield debt). |
* This strategy and performance overview, which discusses what strategies or holdings (including derivatives, if applicable) affected the Fund’s performance, is compiled based on how the Fund performed relative to the Fund’s assigned index and is viewed for
56 Visit our website at pgim.com/investments
performance attribution purposes at the aggregate Fund level, which in most instances will not directly correlate to the amounts disclosed in the Statement of Operations which conform to U.S. generally accepted accounting principles.
Prudential Day One Funds 57
As a shareholder of a Fund, you incur two types of costs: (1) transaction costs, including sales charges (loads) on purchase payments and redemptions, as applicable, and (2) ongoing costs, including management fees, distribution and/or service (12b-1) fees, and other Fund expenses, as applicable. These examples are intended to help you understand your ongoing costs (in dollars) of investing in the Funds and to compare these costs with the ongoing costs of investing in other mutual funds.
These examples are based on an investment of $1,000 held through the six-month period ended July 31, 2022. These examples are for illustrative purposes only; you should consult the Fund’s Prospectus for information on initial and subsequent minimum investment requirements.
Actual Expenses
The first line for each share class in the tables on the following pages provides information about actual account values and actual expenses. You may use the information on this line, together with the amount you invested, to estimate the expenses that you paid over the period. Simply divide your account value by $1,000 (for example, an $8,600 account value ÷ $1,000 = 8.6), then multiply the result by the number on the first line under the heading “Expenses Paid During the Six-Month Period” to estimate the expenses you paid on your account during this period.
Hypothetical Example for Comparison Purposes
The second line for each share class in the tables on the following pages provides information about hypothetical account values and hypothetical expenses based on each Fund’s actual expense ratio and an assumed rate of return of 5% per year before expenses, which is not each Fund’s actual return. The hypothetical account values and expenses may not be used to estimate the actual ending account balance or expenses you paid for the period. You may use this information to compare the ongoing costs of investing in each Fund and other funds. To do so, compare this 5% hypothetical example with the 5% hypothetical examples that appear in the shareholder reports of the other funds.
The Funds’ transfer agent may charge additional fees to holders of certain accounts that are not included in the expenses shown in the tables on the following pages. These fees apply to individual retirement accounts (IRAs) and Section 403(b) accounts. As of the close of the six-month period covered by the tables, IRA fees included an annual maintenance fee of $15 per account (subject to a maximum annual maintenance fee of $25 for all accounts held by the same shareholder). Section 403(b) accounts are charged an annual $25 fiduciary maintenance fee. Some of the fees may vary in amount, or may be waived, based on your total account balance or the number of PGIM funds, including the Funds, that you own. You should consider the additional fees that were charged to your Fund account over the period when you estimate the total ongoing expenses paid over the period and the impact of these fees on your ending account value, as these additional expenses are not reflected in the information provided in the expense tables. Additional fees have the effect of reducing investment returns.
58 Visit our website at pgim.com/investments
Please note that the expenses shown in the tables are meant to highlight your ongoing costs only and do not reflect any transactional costs such as sales charges (loads). Therefore, the second line for each share class in the tables is useful in comparing ongoing costs only and will not help you determine the relative total costs of owning different funds. In addition, if these transactional costs were included, your costs would have been higher.
Prudential Day One Income Fund | Beginning Account Value February 1, 2022 | Ending Account Value July 31, 2022 | Annualized Expense Six-Month Period | Expenses Paid During the Six-Month Period* | ||||||
Class R1 | Actual | $1,000.00 | $ 951.10 | 1.15% | $5.56 | |||||
| Hypothetical | $1,000.00 | $1,019.09 | 1.15% | $5.76 | ||||||
Class R2 | Actual | $1,000.00 | $ 952.10 | 0.90% | $4.36 | |||||
| Hypothetical | $1,000.00 | $1,020.33 | 0.90% | $4.51 | ||||||
Class R3 | Actual | $1,000.00 | $ 952.90 | 0.75% | $3.63 | |||||
| Hypothetical | $1,000.00 | $1,021.08 | 0.75% | $3.76 | ||||||
Class R4 | Actual | $1,000.00 | $ 953.30 | 0.65% | $3.15 | |||||
| Hypothetical | $1,000.00 | $1,021.57 | 0.65% | $3.26 | ||||||
Class R5 | Actual | $1,000.00 | $ 952.90 | 0.55% | $2.66 | |||||
| Hypothetical | $1,000.00 | $1,022.07 | 0.55% | $2.76 | ||||||
Class R6 | Actual | $1,000.00 | $ 954.40 | 0.40% | $1.94 | |||||
| Hypothetical | $1,000.00 | $1,022.81 | 0.40% | $2.01 | ||||||
| Prudential Day One 2015 Fund | Beginning Account Value February 1, 2022 | Ending Account Value July 31, 2022 | Annualized Expense Six-Month Period | Expenses Paid During the Six-Month Period* | ||||||
Class R1 | Actual | $1,000.00 | $ 950.70 | 1.15% | $5.56 | |||||
| Hypothetical | $1,000.00 | $1,019.09 | 1.15% | $5.76 | ||||||
Class R2 | Actual | $1,000.00 | $ 951.60 | 0.90% | $4.36 | |||||
| Hypothetical | $1,000.00 | $1,020.33 | 0.90% | $4.51 | ||||||
Class R3 | Actual | $1,000.00 | $ 952.50 | 0.75% | $3.63 | |||||
| Hypothetical | $1,000.00 | $1,021.08 | 0.75% | $3.76 | ||||||
Class R4 | Actual | $1,000.00 | $ 952.50 | 0.65% | $3.15 | |||||
| Hypothetical | $1,000.00 | $1,021.57 | 0.65% | $3.26 | ||||||
Class R5 | Actual | $1,000.00 | $ 953.40 | 0.55% | $2.66 | |||||
| Hypothetical | $1,000.00 | $1,022.07 | 0.55% | $2.76 | ||||||
Class R6 | Actual | $1,000.00 | $ 954.30 | 0.40% | $1.94 | |||||
| Hypothetical | $1,000.00 | $1,022.81 | 0.40% | $2.01 | ||||||
Prudential Day One Funds 59
Fees and Expenses (continued)
| Prudential Day One 2020 Fund | Beginning Account Value February 1, 2022 | Ending Account Value July 31, 2022 | Annualized Expense Ratio Based on the Six-Month Period | Expenses Paid During the Six-Month Period* | ||||||
Class R1 | Actual | $1,000.00 | $ 948.80 | 1.15% | $5.56 | |||||
| Hypothetical | $1,000.00 | $1,019.09 | 1.15% | $5.76 | ||||||
Class R2 | Actual | $1,000.00 | $ 950.50 | 0.90% | $4.35 | |||||
| Hypothetical | $1,000.00 | $1,020.33 | 0.90% | $4.51 | ||||||
Class R3 | Actual | $1,000.00 | $ 951.40 | 0.75% | $3.63 | |||||
| Hypothetical | $1,000.00 | $1,021.08 | 0.75% | $3.76 | ||||||
Class R4 | Actual | $1,000.00 | $ 951.50 | 0.65% | $3.15 | |||||
| Hypothetical | $1,000.00 | $1,021.57 | 0.65% | $3.26 | ||||||
Class R5 | Actual | $1,000.00 | $ 951.50 | 0.55% | $2.66 | |||||
| Hypothetical | $1,000.00 | $1,022.07 | 0.55% | $2.76 | ||||||
Class R6 | Actual | $1,000.00 | $ 953.00 | 0.40% | $1.94 | |||||
| Hypothetical | $1,000.00 | $1,022.81 | 0.40% | $2.01 | ||||||
| Prudential Day One 2025 Fund | Beginning Account Value February 1, 2022 | Ending Account Value July 31, 2022 | Annualized Expense Ratio Based on the | Expenses Paid During the Six-Month Period* | ||||||
Class R1 | Actual | $1,000.00 | $ 946.70 | 1.15% | $5.55 | |||||
| Hypothetical | $1,000.00 | $1,019.09 | 1.15% | $5.76 | ||||||
Class R2 | Actual | $1,000.00 | $ 947.60 | 0.90% | $4.35 | |||||
| Hypothetical | $1,000.00 | $1,020.33 | 0.90% | $4.51 | ||||||
Class R3 | Actual | $1,000.00 | $ 948.50 | 0.75% | $3.62 | |||||
| Hypothetical | $1,000.00 | $1,021.08 | 0.75% | $3.76 | ||||||
Class R4 | Actual | $1,000.00 | $ 949.30 | 0.65% | $3.14 | |||||
| Hypothetical | $1,000.00 | $1,021.57 | 0.65% | $3.26 | ||||||
Class R5 | Actual | $1,000.00 | $ 950.20 | 0.55% | $2.66 | |||||
| Hypothetical | $1,000.00 | $1,022.07 | 0.55% | $2.76 | ||||||
Class R6 | Actual | $1,000.00 | $ 950.30 | 0.40% | $1.93 | |||||
| Hypothetical | $1,000.00 | $1,022.81 | 0.40% | $2.01 | ||||||
60 Visit our website at pgim.com/investments
| Prudential Day One 2030 Fund | Beginning Account Value February 1, 2022 | Ending Account Value July 31, 2022 | Annualized Expense Ratio Based on the Six-Month Period | Expenses Paid During the Six-Month Period* | ||||||
Class R1 | Actual | $1,000.00 | $ 940.10 | 1.15% | $5.53 | |||||
| Hypothetical | $1,000.00 | $1,019.09 | 1.15% | $5.76 | ||||||
Class R2 | Actual | $1,000.00 | $ 940.90 | 0.90% | $4.33 | |||||
| Hypothetical | $1,000.00 | $1,020.33 | 0.90% | $4.51 | ||||||
Class R3 | Actual | $1,000.00 | $ 941.70 | 0.75% | $3.61 | |||||
| Hypothetical | $1,000.00 | $1,021.08 | 0.75% | $3.76 | ||||||
Class R4 | Actual | $1,000.00 | $ 942.40 | 0.65% | $3.13 | |||||
| Hypothetical | $1,000.00 | $1,021.57 | 0.65% | $3.26 | ||||||
Class R5 | Actual | $1,000.00 | $ 942.50 | 0.55% | $2.65 | |||||
| Hypothetical | $1,000.00 | $1,022.07 | 0.55% | $2.76 | ||||||
Class R6 | Actual | $1,000.00 | $ 943.40 | 0.40% | $1.93 | |||||
| Hypothetical | $1,000.00 | $1,022.81 | 0.40% | $2.01 | ||||||
| Prudential Day One 2035 Fund | Beginning Account Value February 1, 2022 | Ending Account Value July 31, 2022 | Annualized Expense Ratio Based on the Six-Month Period | Expenses Paid During the Six-Month Period* | ||||||
Class R1 | Actual | $1,000.00 | $ 931.00 | 1.15% | $5.51 | |||||
| Hypothetical | $1,000.00 | $1,019.09 | 1.15% | $5.76 | ||||||
Class R2 | Actual | $1,000.00 | $ 932.50 | 0.90% | $4.31 | |||||
| Hypothetical | $1,000.00 | $1,020.33 | 0.90% | $4.51 | ||||||
Class R3 | Actual | $1,000.00 | $ 932.60 | 0.75% | $3.59 | |||||
| Hypothetical | $1,000.00 | $1,021.08 | 0.75% | $3.76 | ||||||
Class R4 | Actual | $1,000.00 | $ 933.50 | 0.65% | $3.12 | |||||
| Hypothetical | $1,000.00 | $1,021.57 | 0.65% | $3.26 | ||||||
Class R5 | Actual | $1,000.00 | $ 934.20 | 0.55% | $2.64 | |||||
| Hypothetical | $1,000.00 | $1,022.07 | 0.55% | $2.76 | ||||||
Class R6 | Actual | $1,000.00 | $ 935.00 | 0.40% | $1.92 | |||||
| Hypothetical | $1,000.00 | $1,022.81 | 0.40% | $2.01 | ||||||
Prudential Day One Funds 61
Fees and Expenses (continued)
| Prudential Day One 2040 Fund | Beginning Account Value February 1, 2022 | Ending Account Value July 31, 2022 | Annualized Expense Ratio Based on the Six-Month Period | Expenses Paid During the Six-Month Period* | ||||||
Class R1 | Actual | $1,000.00 | $ 927.80 | 1.15% | $5.50 | |||||
| Hypothetical | $1,000.00 | $1,019.09 | 1.15% | $5.76 | ||||||
Class R2 | Actual | $1,000.00 | $ 928.60 | 0.90% | $4.30 | |||||
| Hypothetical | $1,000.00 | $1,020.33 | 0.90% | $4.51 | ||||||
Class R3 | Actual | $1,000.00 | $ 929.40 | 0.75% | $3.59 | |||||
| Hypothetical | $1,000.00 | $1,021.08 | 0.75% | $3.76 | ||||||
Class R4 | Actual | $1,000.00 | $ 930.20 | 0.65% | $3.11 | |||||
| Hypothetical | $1,000.00 | $1,021.57 | 0.65% | $3.26 | ||||||
Class R5 | Actual | $1,000.00 | $ 931.00 | 0.55% | $2.63 | |||||
| Hypothetical | $1,000.00 | $1,022.07 | 0.55% | $2.76 | ||||||
Class R6 | Actual | $1,000.00 | $ 931.00 | 0.40% | $1.92 | |||||
| Hypothetical | $1,000.00 | $1,022.81 | 0.40% | $2.01 | ||||||
| Prudential Day One 2045 Fund | Beginning Account Value February 1, 2022 | Ending Account Value July 31, 2022 | Annualized Expense Ratio Based on the Six-Month Period | Expenses Paid During the Six-Month Period* | ||||||
Class R1 | Actual | $1,000.00 | $ 921.80 | 1.15% | $5.48 | |||||
| Hypothetical | $1,000.00 | $1,019.09 | 1.15% | $5.76 | ||||||
Class R2 | Actual | $1,000.00 | $ 921.90 | 0.90% | $4.29 | |||||
| Hypothetical | $1,000.00 | $1,020.33 | 0.90% | $4.51 | ||||||
Class R3 | Actual | $1,000.00 | $ 922.70 | 0.75% | $3.58 | |||||
| Hypothetical | $1,000.00 | $1,021.08 | 0.75% | $3.76 | ||||||
Class R4 | Actual | $1,000.00 | $ 924.20 | 0.65% | $3.10 | |||||
| Hypothetical | $1,000.00 | $1,021.57 | 0.65% | $3.26 | ||||||
Class R5 | Actual | $1,000.00 | $ 924.30 | 0.55% | $2.62 | |||||
| Hypothetical | $1,000.00 | $1,022.07 | 0.55% | $2.76 | ||||||
Class R6 | Actual | $1,000.00 | $ 924.50 | 0.40% | $1.91 | |||||
| Hypothetical | $1,000.00 | $1,022.81 | 0.40% | $2.01 | ||||||
62 Visit our website at pgim.com/investments
| Prudential Day One 2050 Fund | Beginning Account Value February 1, 2022 | Ending Account Value July 31, 2022 | Annualized Expense Ratio Based on the Six-Month Period | Expenses Paid During the Six-Month Period* | ||||||
Class R1 | Actual | $1,000.00 | $ 917.30 | 1.15% | $5.47 | |||||
| Hypothetical | $1,000.00 | $1,019.09 | 1.15% | $5.76 | ||||||
Class R2 | Actual | $1,000.00 | $ 919.00 | 0.90% | $4.28 | |||||
| Hypothetical | $1,000.00 | $1,020.33 | 0.90% | $4.51 | ||||||
Class R3 | Actual | $1,000.00 | $ 919.10 | 0.75% | $3.57 | |||||
| Hypothetical | $1,000.00 | $1,021.08 | 0.75% | $3.76 | ||||||
Class R4 | Actual | $1,000.00 | $ 919.60 | 0.65% | $3.09 | |||||
| Hypothetical | $1,000.00 | $1,021.57 | 0.65% | $3.26 | ||||||
Class R5 | Actual | $1,000.00 | $ 920.50 | 0.55% | $2.62 | |||||
| Hypothetical | $1,000.00 | $1,022.07 | 0.55% | $2.76 | ||||||
Class R6 | Actual | $1,000.00 | $ 921.40 | 0.40% | $1.91 | |||||
| Hypothetical | $1,000.00 | $1,022.81 | 0.40% | $2.01 | ||||||
| Prudential Day One 2055 Fund | Beginning Account Value February 1, 2022 | Ending Account Value July 31, 2022 | Annualized Expense Ratio Based on the Six-Month Period | Expenses Paid During the Six-Month Period* | ||||||
Class R1 | Actual | $1,000.00 | $ 915.40 | 1.15% | $5.46 | |||||
| Hypothetical | $1,000.00 | $1,019.09 | 1.15% | $5.76 | ||||||
Class R2 | Actual | $1,000.00 | $ 916.40 | 0.90% | $4.28 | |||||
| Hypothetical | $1,000.00 | $1,020.33 | 0.90% | $4.51 | ||||||
Class R3 | Actual | $1,000.00 | $ 917.30 | 0.75% | $3.57 | |||||
| Hypothetical | $1,000.00 | $1,021.08 | 0.75% | $3.76 | ||||||
Class R4 | Actual | $1,000.00 | $ 918.20 | 0.65% | $3.09 | |||||
| Hypothetical | $1,000.00 | $1,021.57 | 0.65% | $3.26 | ||||||
Class R5 | Actual | $1,000.00 | $ 918.40 | 0.55% | $2.62 | |||||
| Hypothetical | $1,000.00 | $1,022.07 | 0.55% | $2.76 | ||||||
Class R6 | Actual | $1,000.00 | $ 918.30 | 0.40% | $1.90 | |||||
| Hypothetical | $1,000.00 | $1,022.81 | 0.40% | $2.01 | ||||||
Prudential Day One Funds 63
Fees and Expenses (continued)
| Prudential Day One 2060 Fund | Beginning Account Value February 1, 2022 | Ending Account Value July 31, 2022 | Annualized Expense Ratio Based on the Six-Month Period | Expenses Paid During the Six-Month Period* | ||||||
Class R1 | Actual | $1,000.00 | $ 914.40 | 1.15% | $5.46 | |||||
| Hypothetical | $1,000.00 | $1,019.09 | 1.15% | $5.76 | ||||||
Class R2 | Actual | $1,000.00 | $ 915.30 | 0.90% | $4.27 | |||||
| Hypothetical | $1,000.00 | $1,020.33 | 0.90% | $4.51 | ||||||
Class R3 | Actual | $1,000.00 | $ 916.10 | 0.75% | $3.56 | |||||
| Hypothetical | $1,000.00 | $1,021.08 | 0.75% | $3.76 | ||||||
Class R4 | Actual | $1,000.00 | $ 916.90 | 0.65% | $3.09 | |||||
| Hypothetical | $1,000.00 | $1,021.57 | 0.65% | $3.26 | ||||||
Class R5 | Actual | $1,000.00 | $ 917.70 | 0.55% | $2.62 | |||||
| Hypothetical | $1,000.00 | $1,022.07 | 0.55% | $2.76 | ||||||
Class R6 | Actual | $1,000.00 | $ 917.80 | 0.40% | $1.90 | |||||
| Hypothetical | $1,000.00 | $1,022.81 | 0.40% | $2.01 | ||||||
| Prudential Day One 2065 Fund | Beginning Account Value February 1, 2022 | Ending Account Value July 31, 2022 | Annualized Expense Ratio Based on the Six-Month Period | Expenses Paid During the Six-Month Period* | ||||||
Class R1 | Actual | $1,000.00 | $ 914.50 | 1.15% | $5.46 | |||||
| Hypothetical | $1,000.00 | $1,019.09 | 1.15% | $5.76 | ||||||
Class R2 | Actual | $1,000.00 | $ 915.40 | 0.90% | $4.27 | |||||
| Hypothetical | $1,000.00 | $1,020.33 | 0.90% | $4.51 | ||||||
Class R3 | Actual | $1,000.00 | $ 915.50 | 0.75% | $3.56 | |||||
| Hypothetical | $1,000.00 | $1,021.08 | 0.75% | $3.76 | ||||||
Class R4 | Actual | $1,000.00 | $ 916.30 | 0.65% | $3.09 | |||||
| Hypothetical | $1,000.00 | $1,021.57 | 0.65% | $3.26 | ||||||
Class R5 | Actual | $1,000.00 | $ 916.40 | 0.55% | $2.61 | |||||
| Hypothetical | $1,000.00 | $1,022.07 | 0.55% | $2.76 | ||||||
Class R6 | Actual | $1,000.00 | $ 917.20 | 0.40% | $1.90 | |||||
| Hypothetical | $1,000.00 | $1,022.81 | 0.40% | $2.01 | ||||||
*Fund expenses (net of fee waivers or subsidies, if any) for each share class are equal to the annualized expense ratio for each share class (provided in the table), multiplied by the average account value over the period, multiplied by the 181 days in the six-month period ended July 31, 2022, and divided by the 365 days in the Fund’s fiscal year ended July 31, 2022 (to reflect the six-month period). Expenses presented in the table include the expenses of any underlying portfolios in which the Fund may invest.
64 Visit our website at pgim.com/investments
Prudential Day One Income Fund
Schedule of Investments
as of July 31, 2022
| Description | Shares | Value | ||||||
LONG-TERM INVESTMENTS 90.0% | ||||||||
AFFILIATED MUTUAL FUNDS | ||||||||
PGIM Core Conservative Bond Fund (Class R6) | 424,096 | $ | 3,880,482 | |||||
PGIM Global Real Estate Fund (Class R6) | 59,603 | 1,220,068 | ||||||
PGIM Jennison Small-Cap Core Equity Fund (Class R6) | 19,873 | 244,046 | ||||||
PGIM Quant Solutions Commodity Strategies Fund (Class R6) | 116,346 | 1,225,123 | ||||||
PGIM Quant Solutions International Developed Markets Index Fund (Class R6) | 101,523 | 1,222,333 | ||||||
PGIM Quant Solutions Large-Cap Core Fund (Class R6) | 164,330 | 2,867,561 | ||||||
PGIM Quant Solutions Mid-Cap Core Fund (Class R6) | 22,801 | 245,111 | ||||||
PGIM Quant Solutions US Broad Market Index Fund (Class R6) | 91,745 | 1,544,980 | ||||||
PGIM TIPS Fund (Class R6) | 598,598 | 5,650,764 | ||||||
PGIM Total Return Bond Fund (Class R6) | 305,563 | 3,889,817 | ||||||
|
| |||||||
TOTAL LONG-TERM INVESTMENTS | ||||||||
(cost $21,383,446) | 21,990,285 | |||||||
|
| |||||||
SHORT-TERM INVESTMENT 9.8% | ||||||||
AFFILIATED MUTUAL FUND | ||||||||
PGIM Core Ultra Short Bond Fund | 2,399,328 | 2,399,328 | ||||||
|
| |||||||
(cost $2,399,328) | ||||||||
TOTAL INVESTMENTS 99.8% | 24,389,613 | |||||||
(cost $23,782,774)(wd) | ||||||||
Other assets in excess of liabilities 0.2% | 37,809 | |||||||
|
| |||||||
NET ASSETS 100.0% | $ | 24,427,422 | ||||||
|
| |||||||
Below is a list of the abbreviation(s) used in the annual report:
LIBOR—London Interbank Offered Rate
TIPS—Treasury Inflation-Protected Securities
(wd) PGIM Investments LLC, the manager of the Fund, also serves as the manager of the underlying funds in which the Fund invests.
Fair Value Measurements:
Various inputs are used in determining the value of the Fund’s investments. These inputs are summarized in the three broad levels listed below.
Level 1—unadjusted quoted prices generally in active markets for identical securities.
Level 2—quoted prices for similar securities, interest rates and yield curves, prepayment speeds, foreign currency exchange rates and other observable inputs.
Level 3—unobservable inputs for securities valued in accordance with Board approved fair valuation procedures.
See Notes to Financial Statements.
Prudential Day One Funds 65
Prudential Day One Income Fund
Schedule of Investments (continued)
as of July 31, 2022
The following is a summary of the inputs used as of July 31, 2022 in valuing such portfolio securities:
| Level 1 | Level 2 | Level 3 | ||||||||||
Investments in Securities | ||||||||||||
Assets | ||||||||||||
Long-Term Investments | ||||||||||||
Affiliated Mutual Funds | $ | 21,990,285 | $— | $— | ||||||||
Short-Term Investment | ||||||||||||
Affiliated Mutual Fund | 2,399,328 | — | — | |||||||||
|
| |||||||||||
Total | $ | 24,389,613 | $— | $— | ||||||||
|
|
|
|
|
| |||||||
Investment Allocation:
The investment allocation of portfolio holdings and other assets in excess of liabilities shown as a percentage of net assets as of July 31, 2022 were as follows:
TIPS | 23.1 | % | ||
Total Return Bond | 15.9 | |||
Core Bond | 15.9 | |||
Large Cap | 11.8 | |||
Short Term | 9.8 | |||
Broad Market | 6.3 | |||
Commodity | 5.0 | |||
International Developed Markets | 5.0 |
Real Estate | 5.0 | % | ||||
Mid Cap | 1.0 | |||||
Small Cap | 1.0 | |||||
|
| |||||
| 99.8 | ||||||
Other assets in excess of liabilities | 0.2 | |||||
|
| |||||
| 100.0 | % | |||||
|
| |||||
See Notes to Financial Statements.
66
Prudential Day One Income Fund
Statement of Assets & Liabilities
as of July 31, 2022
Assets | ||||||
Affiliated investments (cost $23,782,774) | $24,389,613 | |||||
Receivable for investments sold | 236,912 | |||||
Due from Manager | 10,892 | |||||
Receivable for Fund shares sold | 370 | |||||
Prepaid expenses | 65 | |||||
|
| |||||
Total Assets | 24,637,852 | |||||
|
| |||||
Liabilities | ||||||
Payable for investments purchased | 151,349 | |||||
Audit fee payable | 17,499 | |||||
Custodian and accounting fees payable | 14,871 | |||||
Payable for Fund shares purchased | 13,532 | |||||
Accrued expenses and other liabilities | 12,055 | |||||
Trustees’ fees payable | 804 | |||||
Affiliated transfer agent fee payable | 289 | |||||
Distribution fee payable | 31 | |||||
|
| |||||
Total Liabilities | 210,430 | |||||
|
| |||||
Net Assets | $24,427,422 | |||||
|
| |||||
Net assets were comprised of: | ||||||
Shares of beneficial interest, at par | $ 2,292 | |||||
Paid-in capital in excess of par | 24,388,024 | |||||
Total distributable earnings (loss) | 37,106 | |||||
|
| |||||
Net assets, July 31, 2022 | $24,427,422 | |||||
|
| |||||
See Notes to Financial Statements.
Prudential Day One Funds 67
Prudential Day One Income Fund
Statement of Assets & Liabilities (continued)
as of July 31, 2022
Class R1 | ||||||||
Net asset value, offering price and redemption price per share, ($25,821 ÷ 2,427 shares of beneficial interest issued and outstanding) | $ | 10.64 | ||||||
|
| |||||||
Class R2 | ||||||||
Net asset value, offering price and redemption price per share, ($48,196 ÷ 4,530 shares of beneficial interest issued and outstanding) | $ | 10.64 | ||||||
|
| |||||||
Class R3 | ||||||||
Net asset value, offering price and redemption price per share, ($160,025 ÷ 15,032 shares of beneficial interest issued and outstanding) | $ | 10.65 | ||||||
|
| |||||||
Class R4 | ||||||||
Net asset value, offering price and redemption price per share, ($26,139 ÷ 2,455 shares of beneficial interest issued and outstanding) | $ | 10.65 | ||||||
|
| |||||||
Class R5 | ||||||||
Net asset value, offering price and redemption price per share, ($931,102 ÷ 87,474 shares of beneficial interest issued and outstanding) | $ | 10.64 | ||||||
|
| |||||||
Class R6 | ||||||||
Net asset value, offering price and redemption price per share, ($23,236,139 ÷ 2,179,608 shares of beneficial interest issued and outstanding) | $ | 10.66 | ||||||
|
| |||||||
Net asset value per share may not recalculate due to rounding.
See Notes to Financial Statements.
68
Prudential Day One Income Fund
Statement of Operations
Year Ended July 31, 2022
Net Investment Income (Loss) | ||||
Affiliated dividend income | $ | 1,386,682 | ||
|
| |||
Expenses | ||||
Management fee | 5,711 | |||
Distribution fee(a) | 3,761 | |||
Shareholder servicing fees (including affiliated expense of $1,042)(a) | 1,042 | |||
Custodian and accounting fees | 63,559 | |||
Registration fees(a) | 22,862 | |||
Legal fees and expenses | 20,489 | |||
Audit fee | 17,500 | |||
Trustees’ fees | 9,720 | |||
Shareholders’ reports | 8,210 | |||
Transfer agent’s fees and expenses (including affiliated expense of $4,626)(a) | 5,979 | |||
Pricing fees | 2,974 | |||
Miscellaneous | 12,135 | |||
|
| |||
Total expenses | 173,942 | |||
Less: Fee waiver and/or expense reimbursement(a) | (162,136 | ) | ||
|
| |||
Net expenses | 11,806 | |||
|
| |||
Net investment income (loss) | 1,374,876 | |||
|
| |||
Realized And Unrealized Gain (Loss) On Affiliated Investments | ||||
Net realized gain (loss) on investment transactions | (330,088 | ) | ||
Net capital gain distributions received | 1,115,284 | |||
|
| |||
| 785,196 | ||||
|
| |||
Net change in unrealized appreciation (depreciation) on investments | (3,456,678 | ) | ||
|
| |||
Net gain (loss) on investment transactions | (2,671,482 | ) | ||
|
| |||
Net Increase (Decrease) In Net Assets Resulting From Operations | $ | (1,296,606 | ) | |
|
| |||
| (a) | Class specific expenses and waivers were as follows: |
| Class R1 | Class R2 | Class R3 | Class R4 | Class R5 | Class R6 | |||||||||||||||||||
Distribution fee | 133 | 3,432 | 196 | — | — | — | ||||||||||||||||||
Shareholder servicing fees | — | 1,042 | — | — | — | — | ||||||||||||||||||
Registration fees | 3,665 | 4,265 | 3,665 | 3,665 | 3,665 | 3,937 | ||||||||||||||||||
Transfer agent’s fees and expenses | 91 | 2,414 | 48 | 53 | 1,559 | 1,814 | ||||||||||||||||||
Fee waiver and/or expense reimbursement | (3,818 | ) | (10,528 | ) | (4,178 | ) | (3,782 | ) | (8,394 | ) | (131,436 | ) | ||||||||||||
See Notes to Financial Statements.
Prudential Day One Funds 69
Prudential Day One Income Fund
Statements of Changes in Net Assets
Year Ended July 31, | ||||||||
|
| |||||||
| 2022 | 2021 | |||||||
Increase (Decrease) in Net Assets | ||||||||
Operations | ||||||||
Net investment income (loss) | $ | 1,374,876 | $ | 558,764 | ||||
Net realized gain (loss) on investment transactions | (330,088 | ) | 266,323 | |||||
Net capital gain distributions received | 1,115,284 | 152,692 | ||||||
Net change in unrealized appreciation (depreciation) on investments | (3,456,678 | ) | 2,596,613 | |||||
|
|
|
| |||||
Net increase (decrease) in net assets resulting from operations | (1,296,606 | ) | 3,574,392 | |||||
|
|
|
| |||||
Dividends and Distributions | ||||||||
Distributions from distributable earnings | ||||||||
Class R1 | (2,001 | ) | (413 | ) | ||||
Class R2 | (146,014 | ) | (51,947 | ) | ||||
Class R3 | (13,092 | ) | (32,737 | ) | ||||
Class R4 | (2,163 | ) | (543 | ) | ||||
Class R5 | (75,927 | ) | (20,518 | ) | ||||
Class R6 | (2,154,067 | ) | (539,316 | ) | ||||
|
|
|
| |||||
| (2,393,264 | ) | (645,474 | ) | |||||
|
|
|
| |||||
Fund share transactions | ||||||||
Net proceeds from shares sold | 8,837,860 | 12,764,617 | ||||||
Net asset value of shares issued in reinvestment of dividends and distributions | 2,393,225 | 645,474 | ||||||
Cost of shares purchased | (12,064,261 | ) | (8,713,688 | ) | ||||
|
|
|
| |||||
Net increase (decrease) in net assets from Fund share transactions | (833,176 | ) | 4,696,403 | |||||
|
|
|
| |||||
Total increase (decrease) | (4,523,046 | ) | 7,625,321 | |||||
Net Assets: | ||||||||
Beginning of year | 28,950,468 | 21,325,147 | ||||||
|
|
|
| |||||
End of year | $ | 24,427,422 | $ | 28,950,468 | ||||
|
|
|
| |||||
See Notes to Financial Statements.
70
Prudential Day One Income Fund
Financial Highlights
Class R1 Shares |
| |||||||||||||||||||
| Year Ended July 31, | ||||||||||||||||||||
| 2022 | 2021 | 2020 | 2019 | 2018 | ||||||||||||||||
Per Share Operating Performance(a): | ||||||||||||||||||||
Net Asset Value, Beginning of Year | $12.13 | $10.94 | $10.73 | $10.59 | $10.36 | |||||||||||||||
Income (loss) from investment operations: | ||||||||||||||||||||
Net investment income (loss) | 0.47 | 0.15 | 0.09 | 0.20 | 0.19 | |||||||||||||||
Net realized and unrealized gain (loss) on investment and foreign currency transactions | (1.08 | ) | 1.23 | 0.50 | 0.25 | 0.19 | ||||||||||||||
Total from investment operations | (0.61 | ) | 1.38 | 0.59 | 0.45 | 0.38 | ||||||||||||||
Less Dividends and Distributions: | ||||||||||||||||||||
Dividends from net investment income | (0.68 | ) | (0.13 | ) | (0.21 | ) | (0.24 | ) | (0.15 | ) | ||||||||||
Distributions from net realized gains | (0.20 | ) | (0.06 | ) | (0.17 | ) | (0.07 | ) | (- | )(b) | ||||||||||
Total dividends and distributions | (0.88 | ) | (0.19 | ) | (0.38 | ) | (0.31 | ) | (0.15 | ) | ||||||||||
Net asset value, end of year | $10.64 | $12.13 | $10.94 | $10.73 | $10.59 | |||||||||||||||
Total Return(c): | (5.43 | )% | 12.70 | % | 5.57 | % | 4.46 | % | 3.71 | % | ||||||||||
Ratios/Supplemental Data: | ||||||||||||||||||||
Net assets, end of year (000) | $26 | $27 | $24 | $11 | $11 | |||||||||||||||
Average net assets (000) | $27 | $25 | $18 | $11 | $11 | |||||||||||||||
Ratios to average net assets(d): | ||||||||||||||||||||
Expenses after waivers and/or expense reimbursement | 0.76 | % | 0.75 | % | 0.74 | % | 0.74 | % | 0.64 | % | ||||||||||
Expenses before waivers and/or expense reimbursement | 15.10 | % | 28.84 | % | 77.98 | % | 108.50 | % | 124.02 | % | ||||||||||
Net investment income (loss) | 4.09 | % | 1.33 | % | 0.89 | % | 1.92 | % | 1.84 | % | ||||||||||
Portfolio turnover rate(e) | 62 | % | 45 | % | 65 | % | 38 | % | 25 | % | ||||||||||
| (a) | Calculated based on average shares outstanding during the year. |
| (b) | Amount rounds to zero. |
| (c) | Total return is calculated assuming a purchase of a share on the first day and a sale on the last day of each year reported and includes reinvestment of dividends and distributions, if any. Total returns may reflect adjustments to conform to GAAP. |
| (d) | Does not include expenses of the underlying funds in which the Fund invests. Expenses waived/reimbursed include those of underlying funds in which the Fund invests. Consequently, the amount waived/reimbursed may be greater than the expense ratio reflected in the financial highlights. |
| (e) | The Fund’s portfolio turnover rate is calculated in accordance with regulatory requirements, without regard to transactions involving short-term investments, certain derivatives and in-kind transactions (if any). If such transactions were included, the Fund’s portfolio turnover rate may be higher. |
See Notes to Financial Statements.
Prudential Day One Funds 71
Prudential Day One Income Fund
Financial Highlights (continued)
Class R2 Shares |
| |||||||||||||||||||
| Year Ended July 31, | ||||||||||||||||||||
| 2022 | 2021 | 2020 | 2019 | 2018 | ||||||||||||||||
Per Share Operating Performance(a): | ||||||||||||||||||||
Net Asset Value, Beginning of Year | $12.13 | $10.94 | $10.73 | $10.59 | $10.37 | |||||||||||||||
Income (loss) from investment operations: | ||||||||||||||||||||
Net investment income (loss) | 0.58 | 0.18 | 0.20 | 0.22 | 0.23 | |||||||||||||||
Net realized and unrealized gain (loss) on investment and foreign currency transactions | (1.16 | ) | 1.23 | 0.42 | 0.26 | 0.17 | ||||||||||||||
Total from investment operations | (0.58 | ) | 1.41 | 0.62 | 0.48 | 0.40 | ||||||||||||||
Less Dividends and Distributions: | ||||||||||||||||||||
Dividends from net investment income | (0.71 | ) | (0.16 | ) | (0.24 | ) | (0.27 | ) | (0.18 | ) | ||||||||||
Distributions from net realized gains | (0.20 | ) | (0.06 | ) | (0.17 | ) | (0.07 | ) | (- | )(b) | ||||||||||
Total dividends and distributions | (0.91 | ) | (0.22 | ) | (0.41 | ) | (0.34 | ) | (0.18 | ) | ||||||||||
Net asset value, end of year | $10.64 | $12.13 | $10.94 | $10.73 | $10.59 | |||||||||||||||
Total Return(c): | (5.20 | )% | 12.98 | % | 5.88 | % | 4.72 | % | 3.86 | % | ||||||||||
Ratios/Supplemental Data: | ||||||||||||||||||||
Net assets, end of year (000) | $48 | $2,123 | $1,846 | $1,345 | $843 | |||||||||||||||
Average net assets (000) | $1,373 | $2,453 | $1,435 | $1,036 | $248 | |||||||||||||||
Ratios to average net assets(d): | ||||||||||||||||||||
Expenses after waivers and/or expense reimbursement | 0.51 | % | 0.50 | % | 0.49 | % | 0.49 | % | 0.46 | % | ||||||||||
Expenses before waivers and/or expense reimbursement | 1.28 | % | 1.37 | % | 3.26 | % | 3.89 | % | 9.08 | % | ||||||||||
Net investment income (loss) | 4.96 | % | 1.58 | % | 1.90 | % | 2.13 | % | 2.18 | % | ||||||||||
Portfolio turnover rate(e) | 62 | % | 45 | % | 65 | % | 38 | % | 25 | % | ||||||||||
| (a) | Calculated based on average shares outstanding during the year. |
| (b) | Amount rounds to zero. |
| (c) | Total return is calculated assuming a purchase of a share on the first day and a sale on the last day of each year reported and includes reinvestment of dividends and distributions, if any. Total returns may reflect adjustments to conform to GAAP. |
| (d) | Does not include expenses of the underlying funds in which the Fund invests. Expenses waived/reimbursed include those of underlying funds in which the Fund invests. Consequently, the amount waived/reimbursed may be greater than the expense ratio reflected in the financial highlights. |
| (e) | The Fund’s portfolio turnover rate is calculated in accordance with regulatory requirements, without regard to transactions involving short-term investments, certain derivatives and in-kind transactions (if any). If such transactions were included, the Fund’s portfolio turnover rate may be higher. |
See Notes to Financial Statements.
72
Prudential Day One Income Fund
Financial Highlights (continued)
Class R3 Shares | ||||||||||||||||||||
| Year Ended July 31, | ||||||||||||||||||||
| 2022 | 2021 | 2020 | 2019 | 2018 | ||||||||||||||||
Per Share Operating Performance(a): | ||||||||||||||||||||
Net Asset Value, Beginning of Year | $12.14 | $10.94 | $10.74 | $10.60 | $10.37 | |||||||||||||||
Income (loss) from investment operations: | ||||||||||||||||||||
Net investment income (loss) | 0.47 | 0.19 | 0.22 | 0.24 | 0.24 | |||||||||||||||
Net realized and unrealized gain (loss) on investment and foreign currency transactions | (1.03 | ) | 1.24 | 0.40 | 0.25 | 0.18 | ||||||||||||||
Total from investment operations | (0.56 | ) | 1.43 | 0.62 | 0.49 | 0.42 | ||||||||||||||
Less Dividends and Distributions: | ||||||||||||||||||||
Dividends from net investment income | (0.73 | ) | (0.17 | ) | (0.25 | ) | (0.28 | ) | (0.19 | ) | ||||||||||
Distributions from net realized gains | (0.20 | ) | (0.06 | ) | (0.17 | ) | (0.07 | ) | (- | )(b) | ||||||||||
Total dividends and distributions | (0.93 | ) | (0.23 | ) | (0.42 | ) | (0.35 | ) | (0.19 | ) | ||||||||||
Net asset value, end of year | $10.65 | $12.14 | $10.94 | $10.74 | $10.60 | |||||||||||||||
Total Return(c): | (5.03 | )% | 13.24 | % | 5.95 | % | 4.87 | % | 4.09 | % | ||||||||||
Ratios/Supplemental Data: | ||||||||||||||||||||
Net assets, end of year (000) | $160 | $1,623 | $1,645 | $1,597 | $1,403 | |||||||||||||||
Average net assets (000) | $196 | $1,634 | $1,557 | $1,377 | $1,331 | |||||||||||||||
Ratios to average net assets(d): | ||||||||||||||||||||
Expenses after waivers and/or expense reimbursement | 0.36 | % | 0.35 | % | 0.34 | % | 0.34 | % | 0.24 | % | ||||||||||
Expenses before waivers and/or expense reimbursement | 2.49 | % | 1.36 | % | 3.02 | % | 3.50 | % | 5.23 | % | ||||||||||
Net investment income (loss) | 4.19 | % | 1.70 | % | 2.09 | % | 2.31 | % | 2.23 | % | ||||||||||
Portfolio turnover rate(e) | 62 | % | 45 | % | 65 | % | 38 | % | 25 | % | ||||||||||
| (a) | Calculated based on average shares outstanding during the year. |
| (b) | Amount rounds to zero. |
| (c) | Total return is calculated assuming a purchase of a share on the first day and a sale on the last day of each year reported and includes reinvestment of dividends and distributions, if any. Total returns may reflect adjustments to conform to GAAP. |
| (d) | Does not include expenses of the underlying funds in which the Fund invests. Expenses waived/reimbursed include those of underlying funds in which the Fund invests. Consequently, the amount waived/reimbursed may be greater than the expense ratio reflected in the financial highlights. |
| (e) | The Fund’s portfolio turnover rate is calculated in accordance with regulatory requirements, without regard to transactions involving short-term investments, certain derivatives and in-kind transactions (if any). If such transactions were included, the Fund’s portfolio turnover rate may be higher. |
See Notes to Financial Statements.
Prudential Day One Funds 73
Prudential Day One Income Fund
Financial Highlights (continued)
Class R4 Shares | ||||||||||||||||||||
| Year Ended July 31, | ||||||||||||||||||||
| 2022 | 2021 | 2020 | 2019 | 2018 | ||||||||||||||||
Per Share Operating Performance(a): | ||||||||||||||||||||
Net Asset Value, Beginning of Year | $12.14 | $10.94 | $10.74 | $10.60 | $10.37 | |||||||||||||||
Income (loss) from investment operations: | ||||||||||||||||||||
Net investment income (loss) | 0.52 | 0.21 | 0.15 | 0.25 | 0.25 | |||||||||||||||
Net realized and unrealized gain (loss) on investment and foreign currency transactions | (1.07 | ) | 1.23 | 0.49 | 0.25 | 0.18 | ||||||||||||||
Total from investment operations | (0.55 | ) | 1.44 | 0.64 | 0.50 | 0.43 | ||||||||||||||
Less Dividends and Distributions: | ||||||||||||||||||||
Dividends from net investment income | (0.74 | ) | (0.18 | ) | (0.27 | ) | (0.29 | ) | (0.20 | ) | ||||||||||
Distributions from net realized gains | (0.20 | ) | (0.06 | ) | (0.17 | ) | (0.07 | ) | (- | )(b) | ||||||||||
Total dividends and distributions | (0.94 | ) | (0.24 | ) | (0.44 | ) | (0.36 | ) | (0.20 | ) | ||||||||||
Net asset value, end of year | $10.65 | $12.14 | $10.94 | $10.74 | $10.60 | |||||||||||||||
Total Return(c): | (4.94 | )% | 13.34 | % | 5.98 | % | 5.06 | % | 4.21 | % | ||||||||||
Ratios/Supplemental Data: | ||||||||||||||||||||
Net assets, end of year (000) | $26 | $28 | $24 | $12 | $18 | |||||||||||||||
Average net assets (000) | $27 | $26 | $18 | $14 | $18 | |||||||||||||||
Ratios to average net assets(d): | ||||||||||||||||||||
Expenses after waivers and/or expense reimbursement | 0.26 | % | 0.25 | % | 0.25 | % | 0.24 | % | 0.13 | % | ||||||||||
Expenses before waivers and/or expense reimbursement | 14.28 | % | 26.37 | % | 76.14 | % | 84.52 | % | 76.23 | % | ||||||||||
Net investment income (loss) | 4.59 | % | 1.83 | % | 1.44 | % | 2.36 | % | 2.34 | % | ||||||||||
Portfolio turnover rate(e) | 62 | % | 45 | % | 65 | % | 38 | % | 25 | % | ||||||||||
| (a) | Calculated based on average shares outstanding during the year. |
| (b) | Amount rounds to zero. |
| (c) | Total return is calculated assuming a purchase of a share on the first day and a sale on the last day of each year reported and includes reinvestment of dividends and distributions, if any. Total returns may reflect adjustments to conform to GAAP. |
| (d) | Does not include expenses of the underlying funds in which the Fund invests. Expenses waived/reimbursed include those of underlying funds in which the Fund invests. Consequently, the amount waived/reimbursed may be greater than the expense ratio reflected in the financial highlights. |
| (e) | The Fund’s portfolio turnover rate is calculated in accordance with regulatory requirements, without regard to transactions involving short-term investments, certain derivatives and in-kind transactions (if any). If such transactions were included, the Fund’s portfolio turnover rate may be higher. |
See Notes to Financial Statements.
74
Prudential Day One Income Fund
Financial Highlights (continued)
Class R5 Shares | ||||||||||||||||||||
| Year Ended July 31, | ||||||||||||||||||||
| 2022 | 2021 | 2020 | 2019 | 2018 | ||||||||||||||||
Per Share Operating Performance(a): | ||||||||||||||||||||
Net Asset Value, Beginning of Year | $12.14 | $10.94 | $10.74 | $10.60 | $10.37 | |||||||||||||||
Income (loss) from investment operations: | ||||||||||||||||||||
Net investment income (loss) | 0.53 | 0.22 | 0.02 | 0.29 | 0.26 | |||||||||||||||
Net realized and unrealized gain (loss) on investment and foreign currency transactions | (1.08 | ) | 1.24 | 0.63 | 0.22 | 0.19 | ||||||||||||||
Total from investment operations | (0.55 | ) | 1.46 | 0.65 | 0.51 | 0.45 | ||||||||||||||
Less Dividends and Distributions: | ||||||||||||||||||||
Dividends from net investment income | (0.75 | ) | (0.20 | ) | (0.28 | ) | (0.30 | ) | (0.22 | ) | ||||||||||
Distributions from net realized gains | (0.20 | ) | (0.06 | ) | (0.17 | ) | (0.07 | ) | (- | )(b) | ||||||||||
Total dividends and distributions | (0.95 | ) | (0.26 | ) | (0.45 | ) | (0.37 | ) | (0.22 | ) | ||||||||||
Net asset value, end of year | $10.64 | $12.14 | $10.94 | $10.74 | $10.60 | |||||||||||||||
Total Return(c): | (4.93 | )% | 13.46 | % | 6.18 | % | 5.09 | % | 4.33 | % | ||||||||||
Ratios/Supplemental Data: | ||||||||||||||||||||
Net assets, end of year (000) | $931 | $965 | $914 | $65 | $11 | |||||||||||||||
Average net assets (000) | $944 | $909 | $534 | $51 | $11 | |||||||||||||||
Ratios to average net assets(d): | ||||||||||||||||||||
Expenses after waivers and/or expense reimbursement | 0.16 | % | 0.15 | % | 0.15 | % | 0.14 | % | 0.04 | % | ||||||||||
Expenses before waivers and/or expense reimbursement | 1.05 | % | 1.47 | % | 4.36 | % | 24.81 | % | 122.74 | % | ||||||||||
Net investment income (loss) | 4.67 | % | 1.94 | % | 0.15 | % | 2.75 | % | 2.44 | % | ||||||||||
Portfolio turnover rate(e) | 62 | % | 45 | % | 65 | % | 38 | % | 25 | % | ||||||||||
| (a) | Calculated based on average shares outstanding during the year. |
| (b) | Amount rounds to zero. |
| (c) | Total return is calculated assuming a purchase of a share on the first day and a sale on the last day of each year reported and includes reinvestment of dividends and distributions, if any. Total returns may reflect adjustments to conform to GAAP. |
| (d) | Does not include expenses of the underlying funds in which the Fund invests. Expenses waived/reimbursed include those of underlying funds in which the Fund invests. Consequently, the amount waived/reimbursed may be greater than the expense ratio reflected in the financial highlights. |
| (e) | The Fund’s portfolio turnover rate is calculated in accordance with regulatory requirements, without regard to transactions involving short-term investments, certain derivatives and in-kind transactions (if any). If such transactions were included, the Fund’s portfolio turnover rate may be higher. |
See Notes to Financial Statements.
Prudential Day One Funds 75
Prudential Day One Income Fund
Financial Highlights (continued)
Class R6 Shares | ||||||||||||||||||||
| Year Ended July 31, | ||||||||||||||||||||
| 2022 | 2021 | 2020 | 2019 | 2018 | ||||||||||||||||
Per Share Operating Performance(a): | ||||||||||||||||||||
Net Asset Value, Beginning of Year | $12.16 | $10.96 | $10.76 | $10.61 | $10.38 | |||||||||||||||
Income (loss) from investment operations: | ||||||||||||||||||||
Net investment income (loss) | 0.55 | 0.24 | 0.21 | 0.29 | 0.28 | |||||||||||||||
| Net realized and unrealized gain (loss) on investment and foreign currency transactions | (1.08 | ) | 1.23 | 0.46 | 0.25 | 0.18 | ||||||||||||||
Total from investment operations | (0.53 | ) | 1.47 | 0.67 | 0.54 | 0.46 | ||||||||||||||
Less Dividends and Distributions: | ||||||||||||||||||||
Dividends from net investment income | (0.77 | ) | (0.21 | ) | (0.30 | ) | (0.32 | ) | (0.23 | ) | ||||||||||
Distributions from net realized gains | (0.20 | ) | (0.06 | ) | (0.17 | ) | (0.07 | ) | (- | )(b) | ||||||||||
Total dividends and distributions | (0.97 | ) | (0.27 | ) | (0.47 | ) | (0.39 | ) | (0.23 | ) | ||||||||||
Net asset value, end of year | $10.66 | $12.16 | $10.96 | $10.76 | $10.61 | |||||||||||||||
Total Return(c): | (4.78 | )% | 13.59 | % | 6.36 | % | 5.33 | % | 4.45 | % | ||||||||||
Ratios/Supplemental Data: | ||||||||||||||||||||
Net assets, end of year (000) | $23,236 | $24,185 | $16,871 | $6,939 | $3,529 | |||||||||||||||
Average net assets (000) | $25,990 | $22,559 | $9,392 | $6,203 | $2,451 | |||||||||||||||
Ratios to average net assets(d): | ||||||||||||||||||||
Expenses after waivers and/or expense reimbursement(e) | 0.00 | % | 0.00 | % | 0.00 | % | 0.00 | % | 0.00 | % | ||||||||||
| Expenses after waivers and/or reimbursement inclusive of excess expense reimbursement from the manager | 0.01 | % | (0.00 | )%(b) | (0.00 | )%(b) | (0.01 | )% | (0.09 | )% | ||||||||||
Expenses before waivers and/or expense reimbursement | 0.52 | % | 0.61 | % | 1.92 | % | 2.41 | % | 4.36 | % | ||||||||||
Net investment income (loss) | 4.82 | % | 2.10 | % | 1.95 | % | 2.80 | % | 2.67 | % | ||||||||||
Portfolio turnover rate(f) | 62 | % | 45 | % | 65 | % | 38 | % | 25 | % | ||||||||||
| (a) | Calculated based on average shares outstanding during the year. |
| (b) | Amount rounds to zero. |
| (c) | Total return is calculated assuming a purchase of a share on the first day and a sale on the last day of each year reported and includes reinvestment of dividends and distributions, if any. Total returns may reflect adjustments to conform to GAAP. |
| (d) | Does not include expenses of the underlying funds in which the Fund invests. Expenses waived/reimbursed include those of underlying funds in which the Fund invests. Consequently, the amount waived/reimbursed may be greater than the expense ratio reflected in the financial highlights. |
| (e) | As a result of reimbursing expenses, including underlying fund expenses, the Manager may reimburse amounts in excess of the respective share classes’ operating expenses. |
| (f) | The Fund’s portfolio turnover rate is calculated in accordance with regulatory requirements, without regard to transactions involving short-term investments, certain derivatives and in-kind transactions (if any). If such transactions were included, the Fund’s portfolio turnover rate may be higher. |
See Notes to Financial Statements.
76
Prudential Day One 2015 Fund
Schedule of Investments
as of July 31, 2022
Description | Shares | Value | ||||||
LONG-TERM INVESTMENTS 90.6% | ||||||||
AFFILIATED MUTUAL FUNDS | ||||||||
PGIM Core Conservative Bond Fund (Class R6) | 182,427 | $ | 1,669,210 | |||||
PGIM Global Real Estate Fund (Class R6) | 28,887 | 591,310 | ||||||
PGIM Jennison Small-Cap Core Equity Fund (Class R6) | 12,521 | 153,760 | ||||||
PGIM Quant Solutions Commodity Strategies Fund (Class R6) | 56,387 | 593,756 | ||||||
PGIM Quant Solutions International Developed Markets Index Fund (Class R6) | 55,108 | 663,495 | ||||||
PGIM Quant Solutions Large-Cap Core Fund (Class R6) | 86,994 | 1,518,047 | ||||||
PGIM Quant Solutions Mid-Cap Core Fund (Class R6) | 14,366 | 154,430 | ||||||
PGIM Quant Solutions US Broad Market Index Fund (Class R6) | 49,546 | 834,347 | ||||||
PGIM TIPS Fund (Class R6) | 282,610 | 2,667,835 | ||||||
PGIM Total Return Bond Fund (Class R6) | 148,104 | 1,885,363 | ||||||
|
| |||||||
TOTAL LONG-TERM INVESTMENTS | 10,731,553 | |||||||
|
| |||||||
SHORT-TERM INVESTMENT 9.4% | ||||||||
AFFILIATED MUTUAL FUND | ||||||||
PGIM Core Ultra Short Bond Fund | 1,106,544 | 1,106,544 | ||||||
|
| |||||||
TOTAL INVESTMENTS 100.0% | 11,838,097 | |||||||
Other assets in excess of liabilities 0.0% | 4,331 | |||||||
|
| |||||||
NET ASSETS 100.0% | $ | 11,842,428 | ||||||
|
| |||||||
Below is a list of the abbreviation(s) used in the annual report:
LIBOR—London Interbank Offered Rate
TIPS—Treasury Inflation-Protected Securities
(wd) PGIM Investments LLC, the manager of the Fund, also serves as the manager of the underlying funds in which the Fund invests.
Fair Value Measurements:
Various inputs are used in determining the value of the Fund’s investments. These inputs are summarized in the three broad levels listed below.
Level 1—unadjusted quoted prices generally in active markets for identical securities.
Level 2—quoted prices for similar securities, interest rates and yield curves, prepayment speeds, foreign currency exchange rates and other observable inputs.
Level 3—unobservable inputs for securities valued in accordance with Board approved fair valuation procedures.
See Notes to Financial Statements.
Prudential Day One Funds 77
Prudential Day One 2015 Fund
Schedule of Investments (continued)
as of July 31, 2022
The following is a summary of the inputs used as of July 31, 2022 in valuing such portfolio securities:
| Level 1 | Level 2 | Level 3 | ||||||||||||||||||||||||||
Investments in Securities | ||||||||||||||||||||||||||||
Assets | ||||||||||||||||||||||||||||
Long-Term Investments | ||||||||||||||||||||||||||||
Affiliated Mutual Funds | $ | 10,731,553 | $ | — | $ | — | ||||||||||||||||||||||
Short-Term Investment | ||||||||||||||||||||||||||||
Affiliated Mutual Fund | 1,106,544 | — | — | |||||||||||||||||||||||||
|
|
|
|
|
| |||||||||||||||||||||||
Total | $ | 11,838,097 | $ | — | $ | — | ||||||||||||||||||||||
|
|
|
|
|
| |||||||||||||||||||||||
Investment Allocation:
The investment allocation of portfolio holdings and other assets in excess of liabilities shown as a percentage of net assets as of July 31, 2022 were as follows:
TIPS | 22.5 | % | ||
Total Return Bond | 15.9 | |||
Core Bond | 14.1 | |||
Large Cap | 12.8 | |||
Short Term | 9.4 | |||
Broad Market | 7.1 | |||
International Developed Markets | 5.6 | |||
Commodity | 5.0 | |||
Real Estate | 5.0 |
Mid Cap | 1.3 | % | ||
Small Cap | 1.3 | |||
|
| |||
| 100.0 | ||||
Other assets in excess of liabilities | 0.0 | * | ||
|
| |||
| 100.0 | % | |||
|
| |||
| * | Less than +/- 0.05% |
See Notes to Financial Statements.
78
Prudential Day One 2015 Fund
Statement of Assets & Liabilities
as of July 31, 2022
Assets | ||||
Affiliated investments (cost $11,127,210) | $11,838,097 | |||
Receivable for investments sold | 113,737 | |||
Due from Manager | 13,830 | |||
Receivable for Fund shares sold | 140 | |||
Prepaid expenses | 65 | |||
| ||||
Total Assets | 11,965,869 | |||
| ||||
Liabilities | ||||
Payable for investments purchased | 78,889 | |||
Audit fee payable | 17,500 | |||
Custodian and accounting fees payable | 14,849 | |||
Accrued expenses and other liabilities | 11,204 | |||
Trustees’ fees payable | 801 | |||
Affiliated transfer agent fee payable | 180 | |||
Distribution fee payable | 17 | |||
Payable for Fund shares purchased | 1 | |||
| ||||
Total Liabilities | 123,441 | |||
| ||||
Net Assets | $11,842,428 | |||
| ||||
Net assets were comprised of: | ||||
Shares of beneficial interest, at par | $ 1,092 | |||
Paid-in capital in excess of par | 11,564,503 | |||
Total distributable earnings (loss) | 276,833 | |||
| ||||
Net assets, July 31, 2022 | $11,842,428 | |||
| ||||
See Notes to Financial Statements.
Prudential Day One Funds 79
Prudential Day One 2015 Fund
Statement of Assets & Liabilities (continued)
as of July 31, 2022
Class R1 | ||||||
Net asset value, offering price and redemption price per share, ($13,017 ÷ 1,206 shares of beneficial interest issued and outstanding) | $ | 10.80 | ||||
|
| |||||
Class R2 | ||||||
Net asset value, offering price and redemption price per share, ($50,637 ÷ 4,680 shares of beneficial interest issued and outstanding) | $ | 10.82 | ||||
|
| |||||
Class R3 | ||||||
Net asset value, offering price and redemption price per share, ($13,313 ÷ 1,229 shares of beneficial interest issued and outstanding) | $ | 10.83 | ||||
|
| |||||
Class R4 | ||||||
Net asset value, offering price and redemption price per share, ($13,377 ÷ 1,236 shares of beneficial interest issued and outstanding) | $ | 10.82 | ||||
|
| |||||
Class R5 | ||||||
Net asset value, offering price and redemption price per share, ($174,912 ÷ 16,125 shares of beneficial interest issued and outstanding) | $ | 10.85 | ||||
|
| |||||
Class R6 | ||||||
Net asset value, offering price and redemption price per share, ($11,577,172 ÷ 1,067,137 shares of beneficial interest issued and outstanding) | $ | 10.85 | ||||
|
| |||||
Net asset value per share may not recalculate due to rounding.
See Notes to Financial Statements.
80
Prudential Day One 2015 Fund
Statement of Operations
Year Ended July 31, 2022
Net Investment Income (Loss) | ||||
Affiliated dividend income | $ | 675,508 | ||
|
| |||
Expenses | ||||
Management fee | 2,813 | |||
Distribution fee(a) | 209 | |||
Custodian and accounting fees | 63,387 | |||
Registration fees(a) | 22,897 | |||
Legal fees and expenses | 20,471 | |||
Audit fee | 17,500 | |||
Trustees’ fees | 9,680 | |||
Shareholders’ reports | 7,576 | |||
Pricing fees | 2,986 | |||
Fund data services | 2,347 | |||
Transfer agent’s fees and expenses (including affiliated expense of $ 1,199)(a) | 1,891 | |||
Miscellaneous | 9,838 | |||
|
| |||
Total expenses | 161,595 | |||
Less: Fee waiver and/or expense reimbursement(a) | (159,828 | ) | ||
|
| |||
Net expenses | 1,767 | |||
|
| |||
Net investment income (loss) | 673,741 | |||
|
| |||
Realized And Unrealized Gain (Loss) On Affiliated Investments | ||||
Net realized gain (loss) on investment transactions | 7,625 | |||
Net capital gain distributions received | 604,862 | |||
|
| |||
| 612,487 | ||||
|
| |||
Net change in unrealized appreciation (depreciation) on investments | (1,961,215 | ) | ||
|
| |||
Net gain (loss) on investment transactions | (1,348,728 | ) | ||
|
| |||
Net Increase (Decrease) In Net Assets Resulting From Operations | $ | (674,987 | ) | |
|
| |||
| (a) | Class specific expenses and waivers were as follows: |
| Class R1 | Class R2 | Class R3 | Class R4 | Class R5 | Class R6 | |||||||||||||||||||
Distribution fee | 68 | 127 | 14 | — | — | — | ||||||||||||||||||
Registration fees | 3,608 | 3,608 | 3,608 | 3,608 | 3,608 | 4,857 | ||||||||||||||||||
Transfer agent’s fees and expenses | 50 | 273 | 50 | 50 | 332 | 1,136 | ||||||||||||||||||
Fee waiver and/or expense reimbursement | (3,755 | ) | (4,245 | ) | (3,758 | ) | (3,758 | ) | (5,315 | ) | (138,997 | ) | ||||||||||||
See Notes to Financial Statements.
Prudential Day One Funds 81
Prudential Day One 2015 Fund
Statements of Changes in Net Assets
Year Ended July 31, | ||||||||||
| 2022 | 2021 | |||||||||
Increase (Decrease) in Net Assets | ||||||||||
Operations | ||||||||||
Net investment income (loss) | $ | 673,741 | $ | 321,923 | ||||||
Net realized gain (loss) on investment transactions | 7,625 | 310,401 | ||||||||
Net capital gain distributions received | 604,862 | 85,946 | ||||||||
Net change in unrealized appreciation (depreciation) on investments | (1,961,215 | ) | 1,516,787 | |||||||
|
|
|
| |||||||
Net increase (decrease) in net assets resulting from operations | (674,987 | ) | 2,235,057 | |||||||
|
|
|
| |||||||
Dividends and Distributions | ||||||||||
Distributions from distributable earnings | ||||||||||
Class R1 | (1,166 | ) | (228 | ) | ||||||
Class R2 | (4,443 | ) | (899 | ) | ||||||
Class R3 | (1,239 | ) | (279 | ) | ||||||
Class R4 | (1,259 | ) | (292 | ) | ||||||
Class R5 | (13,383 | ) | (6,668 | ) | ||||||
Class R6 | (1,336,020 | ) | (389,317 | ) | ||||||
|
|
|
| |||||||
| (1,357,510 | ) | (397,683 | ) | |||||||
|
|
|
| |||||||
Fund share transactions | ||||||||||
Net proceeds from shares sold | 1,300,353 | 6,641,027 | ||||||||
Net asset value of shares issued in reinvestment of dividends and distributions | 1,357,510 | 397,683 | ||||||||
Cost of shares purchased | (3,978,523 | ) | (6,063,399 | ) | ||||||
|
|
|
| |||||||
Net increase (decrease) in net assets from Fund share transactions | (1,320,660 | ) | 975,311 | |||||||
|
|
|
| |||||||
Total increase (decrease) | (3,353,157 | ) | 2,812,685 | |||||||
Net Assets: | ||||||||||
Beginning of year | 15,195,585 | 12,382,900 | ||||||||
|
|
|
| |||||||
End of year | $ | 11,842,428 | $ | 15,195,585 | ||||||
|
|
|
| |||||||
See Notes to Financial Statements.
82
Prudential Day One 2015 Fund
Financial Highlights
Class R1 Shares | ||||||||||||||||||||
| Year Ended July 31, | ||||||||||||||||||||
| 2022 | 2021 | 2020 | 2019 | 2018 | ||||||||||||||||
Per Share Operating Performance(a): | ||||||||||||||||||||
Net Asset Value, Beginning of Year | $12.43 | $11.08 | $10.91 | $10.86 | $10.49 | |||||||||||||||
Income (loss) from investment operations: | ||||||||||||||||||||
Net investment income (loss) | 0.47 | 0.15 | 0.16 | 0.19 | 0.19 | |||||||||||||||
Net realized and unrealized gain (loss) on investment transactions | (1.05 | ) | 1.41 | 0.42 | 0.23 | 0.28 | ||||||||||||||
Total from investment operations | (0.58 | ) | 1.56 | 0.58 | 0.42 | 0.47 | ||||||||||||||
Less Dividends and Distributions: | ||||||||||||||||||||
Dividends from net investment income | (0.67 | ) | (0.11 | ) | (0.22 | ) | (0.23 | ) | (0.08 | ) | ||||||||||
Distributions from net realized gains | (0.38 | ) | (0.10 | ) | (0.19 | ) | (0.14 | ) | (0.02 | ) | ||||||||||
Total dividends and distributions | (1.05 | ) | (0.21 | ) | (0.41 | ) | (0.37 | ) | (0.10 | ) | ||||||||||
Net asset value, end of year | $10.80 | $12.43 | $11.08 | $10.91 | $10.86 | |||||||||||||||
Total Return(b): | (5.31 | )% | 14.32 | % | 5.35 | % | 4.17 | % | 4.50 | % | ||||||||||
Ratios/Supplemental Data: | ||||||||||||||||||||
Net assets, end of year (000) | $13 | $14 | $12 | $11 | $11 | |||||||||||||||
Average net assets (000) | $13 | $13 | $12 | $11 | $11 | |||||||||||||||
Ratios to average net assets(c): | ||||||||||||||||||||
Expenses after waivers and/or expense reimbursement | 0.76 | % | 0.75 | % | 0.74 | % | 0.73 | % | 0.63 | % | ||||||||||
Expenses before waivers and/or expense reimbursement | 28.64 | % | 52.16 | % | 114.82 | % | 106.63 | % | 120.64 | % | ||||||||||
Net investment income (loss) | 4.05 | % | 1.29 | % | 1.53 | % | 1.83 | % | 1.74 | % | ||||||||||
Portfolio turnover rate(d) | 43 | % | 58 | % | 75 | % | 30 | % | 57 | % | ||||||||||
| (a) | Calculated based on average shares outstanding during the year. |
| (b) | Total return is calculated assuming a purchase of a share on the first day and a sale on the last day of each year reported and includes reinvestment of dividends and distributions, if any. Total returns may reflect adjustments to conform to GAAP. |
| (c) | Does not include expenses of the underlying funds in which the Fund invests. Expenses waived/reimbursed include those of underlying funds in which the Fund invests. Consequently, the amount waived/reimbursed may be greater than the expense ratio reflected in the financial highlights. |
| (d) | The Fund’s portfolio turnover rate is calculated in accordance with regulatory requirements, without regard to transactions involving short-term investments, certain derivatives and in-kind transactions (if any). If such transactions were included, the Fund’s portfolio turnover rate may be higher. |
See Notes to Financial Statements.
Prudential Day One Funds 83
Prudential Day One 2015 Fund
Financial Highlights (continued)
Class R2 Shares | ||||||||||||||||||||
| Year Ended July 31, | ||||||||||||||||||||
| 2022 | 2021 | 2020 | 2019 | 2018 | ||||||||||||||||
Per Share Operating Performance(a): | ||||||||||||||||||||
Net Asset Value, Beginning of Year | $12.46 | $11.10 | $10.92 | $10.88 | $10.50 | |||||||||||||||
Income (loss) from investment operations: | ||||||||||||||||||||
Net investment income (loss) | 0.50 | 0.18 | 0.20 | 0.21 | 0.21 | |||||||||||||||
Net realized and unrealized gain (loss) on investment transactions | (1.05 | ) | 1.42 | 0.41 | 0.22 | 0.30 | ||||||||||||||
Total from investment operations | (0.55 | ) | 1.60 | 0.61 | 0.43 | 0.51 | ||||||||||||||
Less Dividends and Distributions: | ||||||||||||||||||||
Dividends from net investment income | (0.71 | ) | (0.14 | ) | (0.24 | ) | (0.25 | ) | (0.11 | ) | ||||||||||
Distributions from net realized gains | (0.38 | ) | (0.10 | ) | (0.19 | ) | (0.14 | ) | (0.02 | ) | ||||||||||
Total dividends and distributions | (1.09 | ) | (0.24 | ) | (0.43 | ) | (0.39 | ) | (0.13 | ) | ||||||||||
Net asset value, end of year | $10.82 | $12.46 | $11.10 | $10.92 | $10.88 | |||||||||||||||
Total Return(b): | (5.05 | )% | 14.57 | % | 5.62 | % | 4.34 | % | 4.85 | % | ||||||||||
Ratios/Supplemental Data: | ||||||||||||||||||||
Net assets, end of year (000) | $51 | $50 | $42 | $12 | $11 | |||||||||||||||
Average net assets (000) | $51 | $46 | $37 | $13 | $11 | |||||||||||||||
Ratios to average net assets(c): | ||||||||||||||||||||
Expenses after waivers and/or expense reimbursement | 0.51 | % | 0.50 | % | 0.49 | % | 0.48 | % | 0.38 | % | ||||||||||
Expenses before waivers and/or expense reimbursement | 8.87 | % | 15.87 | % | 37.60 | % | 92.94 | % | 119.98 | % | ||||||||||
Net investment income (loss) | 4.28 | % | 1.54 | % | 1.85 | % | 1.94 | % | 1.99 | % | ||||||||||
Portfolio turnover rate(d) | 43 | % | 58 | % | 75 | % | 30 | % | 57 | % | ||||||||||
| (a) | Calculated based on average shares outstanding during the year. |
| (b) | Total return is calculated assuming a purchase of a share on the first day and a sale on the last day of each year reported and includes reinvestment of dividends and distributions, if any. Total returns may reflect adjustments to conform to GAAP. |
| (c) | Does not include expenses of the underlying funds in which the Fund invests. Expenses waived/reimbursed include those of underlying funds in which the Fund invests. Consequently, the amount waived/reimbursed may be greater than the expense ratio reflected in the financial highlights. |
| (d) | The Fund’s portfolio turnover rate is calculated in accordance with regulatory requirements, without regard to transactions involving short-term investments, certain derivatives and in-kind transactions (if any). If such transactions were included, the Fund’s portfolio turnover rate may be higher. |
See Notes to Financial Statements.
84
Prudential Day One 2015 Fund
Financial Highlights (continued)
Class R3 Shares | ||||||||||||||||||||
| Year Ended July 31, | ||||||||||||||||||||
| 2022 | 2021 | 2020 | 2019 | 2018 | ||||||||||||||||
Per Share Operating Performance(a): | ||||||||||||||||||||
Net Asset Value, Beginning of Year | $12.47 | $11.11 | $10.93 | $10.89 | $10.51 | |||||||||||||||
Income (loss) from investment operations: | ||||||||||||||||||||
Net investment income (loss) | 0.52 | 0.20 | 0.21 | 0.24 | 0.23 | |||||||||||||||
Net realized and unrealized gain (loss) on investment transactions | (1.06 | ) | 1.41 | 0.42 | 0.21 | 0.29 | ||||||||||||||
Total from investment operations | (0.54 | ) | 1.61 | 0.63 | 0.45 | 0.52 | ||||||||||||||
Less Dividends and Distributions: | ||||||||||||||||||||
Dividends from net investment income | (0.72 | ) | (0.15 | ) | (0.26 | ) | (0.27 | ) | (0.12 | ) | ||||||||||
Distributions from net realized gains | (0.38 | ) | (0.10 | ) | (0.19 | ) | (0.14 | ) | (0.02 | ) | ||||||||||
Total dividends and distributions | (1.10 | ) | (0.25 | ) | (0.45 | ) | (0.41 | ) | (0.14 | ) | ||||||||||
Net asset value, end of year | $10.83 | $12.47 | $11.11 | $10.93 | $10.89 | |||||||||||||||
Total Return(b): | (4.91 | )% | 14.71 | % | 5.84 | % | 4.50 | % | 5.01 | % | ||||||||||
Ratios/Supplemental Data: | ||||||||||||||||||||
Net assets, end of year (000) | $13 | $14 | $12 | $12 | $11 | |||||||||||||||
Average net assets (000) | $14 | $13 | $12 | $11 | $11 | |||||||||||||||
Ratios to average net assets(c): | ||||||||||||||||||||
Expenses after waivers and/or expense reimbursement | 0.36 | % | 0.35 | % | 0.34 | % | 0.33 | % | 0.23 | % | ||||||||||
Expenses before waivers and/or expense reimbursement | 27.69 | % | 50.95 | % | 113.01 | % | 105.36 | % | 119.64 | % | ||||||||||
Net investment income (loss) | 4.45 | % | 1.69 | % | 1.93 | % | 2.23 | % | 2.14 | % | ||||||||||
Portfolio turnover rate(d) | 43 | % | 58 | % | 75 | % | 30 | % | 57 | % | ||||||||||
| (a) | Calculated based on average shares outstanding during the year. |
| (b) | Total return is calculated assuming a purchase of a share on the first day and a sale on the last day of each year reported and includes reinvestment of dividends and distributions, if any. Total returns may reflect adjustments to conform to GAAP. |
| (c) | Does not include expenses of the underlying funds in which the Fund invests. Expenses waived/reimbursed include those of underlying funds in which the Fund invests. Consequently, the amount waived/reimbursed may be greater than the expense ratio reflected in the financial highlights. |
| (d) | The Fund’s portfolio turnover rate is calculated in accordance with regulatory requirements, without regard to transactions involving short-term investments, certain derivatives and in-kind transactions (if any). If such transactions were included, the Fund’s portfolio turnover rate may be higher. |
See Notes to Financial Statements.
Prudential Day One Funds 85
Prudential Day One 2015 Fund
Financial Highlights (continued)
Class R4 Shares | ||||||||||||||||||||
| Year Ended July 31, | ||||||||||||||||||||
| 2022 | 2021 | 2020 | 2019 | 2018 | ||||||||||||||||
Per Share Operating Performance(a): | ||||||||||||||||||||
Net Asset Value, Beginning of Year | $12.46 | $11.11 | $10.93 | $10.88 | $10.51 | |||||||||||||||
Income (loss) from investment operations: | ||||||||||||||||||||
Net investment income (loss) | 0.53 | 0.21 | 0.22 | 0.30 | 0.24 | |||||||||||||||
Net realized and unrealized gain (loss) on investment transactions | (1.05 | ) | 1.41 | 0.42 | 0.17 | 0.29 | ||||||||||||||
Total from investment operations | (0.52 | ) | 1.62 | 0.64 | 0.47 | 0.53 | ||||||||||||||
Less Dividends and Distributions: | ||||||||||||||||||||
Dividends from net investment income | (0.74 | ) | (0.17 | ) | (0.27 | ) | (0.28 | ) | (0.14 | ) | ||||||||||
Distributions from net realized gains | (0.38 | ) | (0.10 | ) | (0.19 | ) | (0.14 | ) | (0.02 | ) | ||||||||||
Total dividends and distributions | (1.12 | ) | (0.27 | ) | (0.46 | ) | (0.42 | ) | (0.16 | ) | ||||||||||
Net asset value, end of year | $10.82 | $12.46 | $11.11 | $10.93 | $10.88 | |||||||||||||||
Total Return(b): | (4.90 | )% | 14.82 | % | 5.97 | % | 4.62 | % | 5.02 | % | ||||||||||
Ratios/Supplemental Data: | ||||||||||||||||||||
Net assets, end of year (000) | $13 | $14 | $12 | $12 | $81 | |||||||||||||||
Average net assets (000) | $14 | $13 | $12 | $44 | $65 | |||||||||||||||
Ratios to average net assets(c): | ||||||||||||||||||||
Expenses after waivers and/or expense reimbursement | 0.26 | % | 0.25 | % | 0.24 | % | 0.23 | % | 0.14 | % | ||||||||||
Expenses before waivers and/or expense reimbursement | 27.47 | % | 50.67 | % | 112.64 | % | 28.32 | % | 22.01 | % | ||||||||||
Net investment income (loss) | 4.55 | % | 1.79 | % | 2.03 | % | 2.82 | % | 2.27 | % | ||||||||||
Portfolio turnover rate(d) | 43 | % | 58 | % | 75 | % | 30 | % | 57 | % | ||||||||||
| (a) | Calculated based on average shares outstanding during the year. |
| (b) | Total return is calculated assuming a purchase of a share on the first day and a sale on the last day of each year reported and includes reinvestment of dividends and distributions, if any. Total returns may reflect adjustments to conform to GAAP. |
| (c) | Does not include expenses of the underlying funds in which the Fund invests. Expenses waived/reimbursed include those of underlying funds in which the Fund invests. Consequently, the amount waived/reimbursed may be greater than the expense ratio reflected in the financial highlights. |
| (d) | The Fund’s portfolio turnover rate is calculated in accordance with regulatory requirements, without regard to transactions involving short-term investments, certain derivatives and in-kind transactions (if any). If such transactions were included, the Fund’s portfolio turnover rate may be higher. |
See Notes to Financial Statements.
86
Prudential Day One 2015 Fund
Financial Highlights (continued)
Class R5 Shares | ||||||||||||||||||||
| Year Ended July 31, | ||||||||||||||||||||
| 2022 | 2021 | 2020 | 2019 | 2018 | ||||||||||||||||
Per Share Operating Performance(a): | ||||||||||||||||||||
Net Asset Value, Beginning of Year | $12.49 | $11.13 | $10.95 | $10.90 | $10.53 | |||||||||||||||
Income (loss) from investment operations: | ||||||||||||||||||||
Net investment income (loss) | 0.51 | 0.22 | 0.01 | 0.26 | 0.25 | |||||||||||||||
Net realized and unrealized gain (loss) on investment transactions | (1.02 | ) | 1.42 | 0.64 | 0.22 | 0.29 | ||||||||||||||
Total from investment operations | (0.51 | ) | 1.64 | 0.65 | 0.48 | 0.54 | ||||||||||||||
Less Dividends and Distributions: | ||||||||||||||||||||
Dividends from net investment income | (0.75 | ) | (0.18 | ) | (0.28 | ) | (0.29 | ) | (0.15 | ) | ||||||||||
Distributions from net realized gains | (0.38 | ) | (0.10 | ) | (0.19 | ) | (0.14 | ) | (0.02 | ) | ||||||||||
Total dividends and distributions | (1.13 | ) | (0.28 | ) | (0.47 | ) | (0.43 | ) | (0.17 | ) | ||||||||||
Net asset value, end of year | $10.85 | $12.49 | $11.13 | $10.95 | $10.90 | |||||||||||||||
Total Return(b): | (4.70 | )% | 14.91 | % | 6.03 | % | 4.82 | % | 5.11 | % | ||||||||||
Ratios/Supplemental Data: | ||||||||||||||||||||
Net assets, end of year (000) | $175 | $133 | $256 | $40 | $18 | |||||||||||||||
Average net assets (000) | $166 | $199 | $142 | $28 | $12 | |||||||||||||||
Ratios to average net assets(c): | ||||||||||||||||||||
Expenses after waivers and/or expense reimbursement | 0.16 | % | 0.15 | % | 0.14 | % | 0.13 | % | 0.04 | % | ||||||||||
Expenses before waivers and/or expense reimbursement | 3.36 | % | 4.45 | % | 10.96 | % | 43.44 | % | 110.69 | % | ||||||||||
Net investment income (loss) | 4.45 | % | 1.90 | % | 0.11 | % | 2.44 | % | 2.34 | % | ||||||||||
Portfolio turnover rate(d) | 43 | % | 58 | % | 75 | % | 30 | % | 57 | % | ||||||||||
| (a) | Calculated based on average shares outstanding during the year. |
| (b) | Total return is calculated assuming a purchase of a share on the first day and a sale on the last day of each year reported and includes reinvestment of dividends and distributions, if any. Total returns may reflect adjustments to conform to GAAP. |
| (c) | Does not include expenses of the underlying funds in which the Fund invests. Expenses waived/reimbursed include those of underlying funds in which the Fund invests. Consequently, the amount waived/reimbursed may be greater than the expense ratio reflected in the financial highlights. |
| (d) | The Fund’s portfolio turnover rate is calculated in accordance with regulatory requirements, without regard to transactions involving short-term investments, certain derivatives and in-kind transactions (if any). If such transactions were included, the Fund’s portfolio turnover rate may be higher. |
See Notes to Financial Statements.
Prudential Day One Funds 87
Prudential Day One 2015 Fund
Financial Highlights (continued)
Class R6 Shares | ||||||||||||||||||||
| Year Ended July 31, | ||||||||||||||||||||
| 2022 | 2021 | 2020 | 2019 | 2018 | ||||||||||||||||
Per Share Operating Performance(a): | ||||||||||||||||||||
Net Asset Value, Beginning of Year | $12.49 | $11.13 | $10.95 | $10.90 | $10.53 | |||||||||||||||
Income (loss) from investment operations: | ||||||||||||||||||||
Net investment income (loss) | 0.56 | 0.24 | 0.24 | 0.28 | 0.27 | |||||||||||||||
Net realized and unrealized gain (loss) on investment transactions | (1.05 | ) | 1.41 | 0.43 | 0.22 | 0.28 | ||||||||||||||
Total from investment operations | (0.49 | ) | 1.65 | 0.67 | 0.50 | 0.55 | ||||||||||||||
Less Dividends and Distributions: | ||||||||||||||||||||
Dividends from net investment income | (0.77 | ) | (0.19 | ) | (0.30 | ) | (0.31 | ) | (0.16 | ) | ||||||||||
Distributions from net realized gains | (0.38 | ) | (0.10 | ) | (0.19 | ) | (0.14 | ) | (0.02 | ) | ||||||||||
Total dividends and distributions | (1.15 | ) | (0.29 | ) | (0.49 | ) | (0.45 | ) | (0.18 | ) | ||||||||||
Net asset value, end of year | $10.85 | $12.49 | $11.13 | $10.95 | $10.90 | |||||||||||||||
Total Return(b): | (4.57 | )% | 15.07 | % | 6.19 | % | 4.89 | % | 5.27 | % | ||||||||||
Ratios/Supplemental Data: | ||||||||||||||||||||
Net assets, end of year (000) | $11,577 | $14,970 | $12,049 | $11,081 | $8,567 | |||||||||||||||
Average net assets (000) | $13,808 | $15,418 | $12,078 | $9,955 | $6,742 | |||||||||||||||
Ratios to average net assets(c): | ||||||||||||||||||||
Expenses after waivers and/or expense reimbursement(d) | 0.00 | % | 0.00 | % | 0.00 | % | 0.00 | % | 0.00 | % | ||||||||||
| Expenses after waivers and/or reimbursement inclusive of excess expense reimbursement from the manager | 0.01 | % | (0.00 | )%(e) | (0.01 | )% | (0.02 | )% | (0.11 | )% | ||||||||||
Expenses before waivers and/or expense reimbursement | 1.02 | % | 1.00 | % | 1.72 | % | 2.04 | % | 2.53 | % | ||||||||||
Net investment income (loss) | 4.80 | % | 2.05 | % | 2.23 | % | 2.58 | % | 2.50 | % | ||||||||||
Portfolio turnover rate(f) | 43 | % | 58 | % | 75 | % | 30 | % | 57 | % | ||||||||||
| (a) | Calculated based on average shares outstanding during the year. |
| (b) | Total return is calculated assuming a purchase of a share on the first day and a sale on the last day of each year reported and includes reinvestment of dividends and distributions, if any. Total returns may reflect adjustments to conform to GAAP. |
| (c) | Does not include expenses of the underlying funds in which the Fund invests. Expenses waived/reimbursed include those of underlying funds in which the Fund invests. Consequently, the amount waived/reimbursed may be greater than the expense ratio reflected in the financial highlights. |
| (d) | As a result of reimbursing expenses, including underlying fund expenses, the Manager may reimburse amounts in excess of the respective share classes’ operating expenses. |
| (e) | Amount rounds to zero. |
| (f) | The Fund’s portfolio turnover rate is calculated in accordance with regulatory requirements, without regard to transactions involving short-term investments, certain derivatives and in-kind transactions (if any). If such transactions were included, the Fund’s portfolio turnover rate may be higher. |
See Notes to Financial Statements.
88
Prudential Day One 2020 Fund
Schedule of Investments
as of July 31, 2022
Description | Shares | Value | ||||||
LONG-TERM INVESTMENTS 91.6% | ||||||||
AFFILIATED MUTUAL FUNDS | ||||||||
PGIM Core Conservative Bond Fund (Class R6) | 684,184 | $ | 6,260,282 | |||||
PGIM Global Real Estate Fund (Class R6) | 124,064 | 2,539,591 | ||||||
PGIM Jennison Small-Cap Core Equity Fund (Class R6) | 71,978 | 883,891 | ||||||
PGIM Quant Solutions Commodity Strategies Fund (Class R6) | 242,172 | 2,550,070 | ||||||
PGIM Quant Solutions International Developed Markets Index Fund (Class R6) | 278,942 | 3,358,457 | ||||||
PGIM Quant Solutions Large-Cap Core Fund (Class R6) | 442,033 | 7,713,477 | ||||||
PGIM Quant Solutions Mid-Cap Core Fund (Class R6) | 82,580 | 887,735 | ||||||
PGIM Quant Solutions US Broad Market Index Fund (Class R6) | 236,432 | 3,981,509 | ||||||
PGIM TIPS Fund (Class R6) | 1,126,998 | 10,638,864 | ||||||
PGIM Total Return Bond Fund (Class R6) | 612,227 | 7,793,654 | ||||||
|
| |||||||
TOTAL LONG-TERM INVESTMENTS | 46,607,530 | |||||||
|
| |||||||
SHORT-TERM INVESTMENT 8.2% | ||||||||
AFFILIATED MUTUAL FUND | ||||||||
PGIM Core Ultra Short Bond Fund | 4,159,850 | 4,159,850 | ||||||
|
| |||||||
TOTAL INVESTMENTS 99.8% | 50,767,380 | |||||||
Other assets in excess of liabilities 0.2% | 108,006 | |||||||
|
| |||||||
NET ASSETS 100.0% | $ | 50,875,386 | ||||||
|
| |||||||
Below is a list of the abbreviation(s) used in the annual report:
LIBOR—London Interbank Offered Rate
TIPS—Treasury Inflation-Protected Securities
(wd) PGIM Investments LLC, the manager of the Fund, also serves as the manager of the underlying funds in which the Fund invests.
Fair Value Measurements:
Various inputs are used in determining the value of the Fund’s investments. These inputs are summarized in the three broad levels listed below.
Level 1—unadjusted quoted prices generally in active markets for identical securities.
Level 2—quoted prices for similar securities, interest rates and yield curves, prepayment speeds, foreign currency exchange rates and other observable inputs.
Level 3—unobservable inputs for securities valued in accordance with Board approved fair valuation procedures.
See Notes to Financial Statements.
Prudential Day One Funds 89
Prudential Day One 2020 Fund
Schedule of Investments (continued)
as of July 31, 2022
The following is a summary of the inputs used as of July 31, 2022 in valuing such portfolio securities:
| Level 1 | Level 2 | Level 3 | ||||||||||||||||||||||||||
Investments in Securities | ||||||||||||||||||||||||||||
Assets | ||||||||||||||||||||||||||||
Long-Term Investments | ||||||||||||||||||||||||||||
Affiliated Mutual Funds | $ | 46,607,530 | $ | — | $ | — | ||||||||||||||||||||||
Short-Term Investment | ||||||||||||||||||||||||||||
Affiliated Mutual Fund | 4,159,850 | — | — | |||||||||||||||||||||||||
|
|
|
|
|
| |||||||||||||||||||||||
Total | $ | 50,767,380 | $ | — | $ | — | ||||||||||||||||||||||
|
|
|
|
|
| |||||||||||||||||||||||
Investment Allocation:
The investment allocation of portfolio holdings and other assets in excess of liabilities shown as a percentage of net assets as of July 31, 2022 were as follows:
TIPS | 20.9 | % | ||
Total Return Bond | 15.3 | |||
Large Cap | 15.2 | |||
Core Bond | 12.3 | |||
Short Term | 8.2 | |||
Broad Market | 7.8 | |||
International Developed Markets | 6.6 | |||
Commodity | 5.0 |
Real Estate | 5.0 | % | ||
Mid Cap | 1.8 | |||
Small Cap | 1.7 | |||
|
| |||
| 99.8 | ||||
Other assets in excess of liabilities | 0.2 | |||
|
| |||
| 100.0 | % | |||
|
| |||
See Notes to Financial Statements.
90
Prudential Day One 2020 Fund
Statement of Assets & Liabilities
as of July 31, 2022
Assets | ||||||
Affiliated investments (cost $47,307,330) | $ | 50,767,380 | ||||
Receivable for investments sold | 517,349 | |||||
Due from Manager | 10,417 | |||||
Receivable for Fund shares sold | 686 | |||||
Prepaid expenses | 67 | |||||
|
| |||||
Total Assets | 51,295,899 | |||||
|
| |||||
Liabilities | ||||||
Payable for investments purchased | 374,002 | |||||
Accrued expenses and other liabilities | 45,260 | |||||
Trustees’ fees payable | 821 | |||||
Affiliated transfer agent fee payable | 243 | |||||
Distribution fee payable | 160 | |||||
Payable for Fund shares purchased | 27 | |||||
|
| |||||
Total Liabilities | 420,513 | |||||
|
| |||||
Net Assets | $ | 50,875,386 | ||||
|
| |||||
Net assets were comprised of: | ||||||
Shares of beneficial interest, at par | $ | 4,564 | ||||
Paid-in capital in excess of par | 48,280,194 | |||||
Total distributable earnings (loss) | 2,590,628 | |||||
|
| |||||
Net assets, July 31, 2022 | $ | 50,875,386 | ||||
|
| |||||
See Notes to Financial Statements.
Prudential Day One Funds 91
Prudential Day One 2020 Fund
Statement of Assets & Liabilities (continued)
as of July 31, 2022
Class R1 | ||||||||
Net asset value, offering price and redemption price per share, | $ | 11.12 | ||||||
|
| |||||||
Class R2 | ||||||||
Net asset value, offering price and redemption price per share, | $ | 11.14 | ||||||
|
| |||||||
Class R3 | ||||||||
Net asset value, offering price and redemption price per share, | $ | 11.17 | ||||||
|
| |||||||
Class R4 | ||||||||
Net asset value, offering price and redemption price per share, | $ | 11.18 | ||||||
|
| |||||||
Class R5 | ||||||||
Net asset value, offering price and redemption price per share, | $ | 11.18 | ||||||
|
| |||||||
Class R6 | ||||||||
Net asset value, offering price and redemption price per share, | $ | 11.15 | ||||||
|
| |||||||
Net asset value per share may not recalculate due to rounding.
See Notes to Financial Statements.
92
Prudential Day One 2020 Fund
Statement of Operations
Year Ended July 31, 2022
Net Investment Income (Loss) | ||||
Affiliated dividend income | $ | 2,961,223 | ||
|
| |||
Expenses | ||||
Management fee | 12,482 | |||
Distribution fee(a) | 9,147 | |||
Shareholder servicing fees (including affiliated expense of $2,672)(a) | 2,961 | |||
Custodian and accounting fees | 63,375 | |||
Registration fees(a) | 22,196 | |||
Legal fees and expenses | 20,625 | |||
Audit fee | 17,500 | |||
Transfer agent’s fees and expenses (including affiliated expense of $9,057)(a) | 11,801 | |||
Trustees’ fees | 9,928 | |||
Shareholders’ reports | 7,720 | |||
Pricing fees | 2,974 | |||
Miscellaneous | 11,749 | |||
|
| |||
Total expenses | 192,458 | |||
Less: Fee waiver and/or expense reimbursement(a) | (163,138 | ) | ||
|
| |||
Net expenses | 29,320 | |||
|
| |||
Net investment income (loss) | 2,931,903 | |||
|
| |||
Realized And Unrealized Gain (Loss) On Affiliated Investments | ||||
Net realized gain (loss) on investment transactions | 400,114 | |||
Net capital gain distributions received | 3,063,332 | |||
|
| |||
| 3,463,446 | ||||
|
| |||
Net change in unrealized appreciation (depreciation) on investments | (9,294,316 | ) | ||
|
| |||
Net gain (loss) on investment transactions | (5,830,870 | ) | ||
|
| |||
Net Increase (Decrease) In Net Assets Resulting From Operations | $ | (2,898,967 | ) | |
|
| |||
| (a) | Class specific expenses and waivers were as follows: |
| Class R1 | Class R2 | Class R3 | Class R4 | Class R5 | Class R6 | |||||||||||||||||||
Distribution fee | 69 | 7,850 | 1,228 | — | — | — | ||||||||||||||||||
Shareholder servicing fees | — | 2,936 | 25 | — | — | — | ||||||||||||||||||
Registration fees | 3,666 | 3,666 | 3,666 | 3,666 | 3,666 | 3,866 | ||||||||||||||||||
Transfer agent’s fees and expenses | 51 | 4,385 | 101 | 51 | 5,482 | 1,731 | ||||||||||||||||||
Fee waiver and/or expense reimbursement | (3,714 | ) | (9,945 | ) | (3,530 | ) | (3,714 | ) | (11,856 | ) | (130,379 | ) | ||||||||||||
See Notes to Financial Statements.
Prudential Day One Funds 93
Prudential Day One 2020 Fund
Statements of Changes in Net Assets
Year Ended July 31, | ||||||||
|
| |||||||
| 2022 | 2021 | |||||||
Increase (Decrease) in Net Assets | ||||||||
Operations | ||||||||
Net investment income (loss) | $ | 2,931,903 | $ | 1,332,231 | ||||
Net realized gain (loss) on investment transactions | 400,114 | 1,174,233 | ||||||
Net capital gain distributions received | 3,063,332 | 373,657 | ||||||
Net change in unrealized appreciation (depreciation) on investments | (9,294,316 | ) | 7,831,972 | |||||
|
|
|
| |||||
Net increase (decrease) in net assets resulting from operations | (2,898,967 | ) | 10,712,093 | |||||
|
|
|
| |||||
Dividends and Distributions | ||||||||
Distributions from distributable earnings | ||||||||
Class R1 | (1,202 | ) | (244 | ) | ||||
Class R2 | (390,989 | ) | (88,673 | ) | ||||
Class R3 | (113,256 | ) | (35,790 | ) | ||||
Class R4 | (1,296 | ) | (308 | ) | ||||
Class R5 | (327,317 | ) | (78,525 | ) | ||||
Class R6 | (5,214,209 | ) | (1,511,954 | ) | ||||
|
|
|
| |||||
| (6,048,269 | ) | (1,715,494 | ) | |||||
|
|
|
| |||||
Fund share transactions | ||||||||
Net proceeds from shares sold | 6,812,377 | 23,637,723 | ||||||
Net asset value of shares issued in reinvestment of dividends and distributions | 6,048,269 | 1,715,494 | ||||||
Cost of shares purchased | (22,840,078 | ) | (23,091,994 | ) | ||||
|
|
|
| |||||
Net increase (decrease) in net assets from Fund share transactions | (9,979,432 | ) | 2,261,223 | |||||
|
|
|
| |||||
Total increase (decrease) | (18,926,668 | ) | 11,257,822 | |||||
Net Assets: | ||||||||
Beginning of year | 69,802,054 | 58,544,232 | ||||||
|
|
|
| |||||
End of year | $ | 50,875,386 | $ | 69,802,054 | ||||
|
|
|
| |||||
See Notes to Financial Statements.
94
Prudential Day One 2020 Fund
Financial Highlights
Class R1 Shares | ||||||||||||||||||||
| Year Ended July 31, | ||||||||||||||||||||
| 2022 | 2021 | 2020 | 2019 | 2018 | ||||||||||||||||
Per Share Operating Performance(a): | ||||||||||||||||||||
Net Asset Value, Beginning of Year | $12.82 | $11.27 | $11.09 | $10.98 | $10.52 | |||||||||||||||
Income (loss) from investment operations: | ||||||||||||||||||||
Net investment income (loss) | 0.47 | 0.15 | 0.16 | 0.19 | 0.18 | |||||||||||||||
Net realized and unrealized gain (loss) on investment transactions | (1.08 | ) | 1.63 | 0.44 | 0.23 | 0.37 | ||||||||||||||
Total from investment operations | (0.61 | ) | 1.78 | 0.60 | 0.42 | 0.55 | ||||||||||||||
Less Dividends and Distributions: | ||||||||||||||||||||
Dividends from net investment income | (0.72 | ) | (0.12 | ) | (0.21 | ) | (0.21 | ) | (0.08 | ) | ||||||||||
Distributions from net realized gains | (0.37 | ) | (0.11 | ) | (0.21 | ) | (0.10 | ) | (0.01 | ) | ||||||||||
Total dividends and distributions | (1.09 | ) | (0.23 | ) | (0.42 | ) | (0.31 | ) | (0.09 | ) | ||||||||||
Net asset value, end of year | $11.12 | $12.82 | $11.27 | $11.09 | $10.98 | |||||||||||||||
Total Return(b): | (5.37 | )% | 15.93 | % | 5.35 | % | 4.19 | % | 5.28 | % | ||||||||||
Ratios/Supplemental Data: | ||||||||||||||||||||
Net assets, end of year (000) | $13 | $14 | $12 | $12 | $11 | |||||||||||||||
Average net assets (000) | $14 | $13 | $12 | $11 | $11 | |||||||||||||||
Ratios to average net assets(c): | ||||||||||||||||||||
Expenses after waivers and/or expense reimbursement | 0.76 | % | 0.75 | % | 0.74 | % | 0.74 | % | 0.64 | % | ||||||||||
Expenses before waivers and/or expense reimbursement | 27.64 | % | 51.00 | % | 113.14 | % | 105.39 | % | 118.30 | % | ||||||||||
Net investment income (loss) | 3.94 | % | 1.23 | % | 1.46 | % | 1.74 | % | 1.68 | % | ||||||||||
Portfolio turnover rate(d) | 45 | % | 49 | % | 61 | % | 33 | % | 41 | % | ||||||||||
| (a) | Calculated based on average shares outstanding during the year. |
| (b) | Total return is calculated assuming a purchase of a share on the first day and a sale on the last day of each year reported and includes reinvestment of dividends and distributions, if any. Total returns may reflect adjustments to conform to GAAP. |
| (c) | Does not include expenses of the underlying funds in which the Fund invests. Expenses waived/reimbursed include those of underlying funds in which the Fund invests. Consequently, the amount waived/reimbursed may be greater than the expense ratio reflected in the financial highlights. |
| (d) | The Fund’s portfolio turnover rate is calculated in accordance with regulatory requirements, without regard to transactions involving short-term investments, certain derivatives and in-kind transactions (if any). If such transactions were included, the Fund’s portfolio turnover rate may be higher. |
See Notes to Financial Statements.
Prudential Day One Funds 95
Prudential Day One 2020 Fund
Financial Highlights (continued)
Class R2 Shares | ||||||||||||||||||||
| Year Ended July 31, | ||||||||||||||||||||
| 2022 | 2021 | 2020 | 2019 | 2018 | ||||||||||||||||
Per Share Operating Performance(a): | ||||||||||||||||||||
Net Asset Value, Beginning of Year | $12.83 | $11.28 | $11.11 | $10.99 | $10.54 | |||||||||||||||
Income (loss) from investment operations: | ||||||||||||||||||||
Net investment income (loss) | 0.57 | 0.18 | 0.18 | 0.22 | 0.19 | |||||||||||||||
Net realized and unrealized gain (loss) on investment transactions | (1.14 | ) | 1.62 | 0.44 | 0.23 | 0.38 | ||||||||||||||
Total from investment operations | (0.57 | ) | 1.80 | 0.62 | 0.45 | 0.57 | ||||||||||||||
Less Dividends and Distributions: | ||||||||||||||||||||
Dividends from net investment income | (0.75 | ) | (0.14 | ) | (0.24 | ) | (0.23 | ) | (0.11 | ) | ||||||||||
Distributions from net realized gains | (0.37 | ) | (0.11 | ) | (0.21 | ) | (0.10 | ) | (0.01 | ) | ||||||||||
Total dividends and distributions | (1.12 | ) | (0.25 | ) | (0.45 | ) | (0.33 | ) | (0.12 | ) | ||||||||||
Net asset value, end of year | $11.14 | $12.83 | $11.28 | $11.11 | $10.99 | |||||||||||||||
Total Return(b): | (5.05 | )% | 16.19 | % | 5.59 | % | 4.47 | % | 5.43 | % | ||||||||||
| ||||||||||||||||||||
Ratios/Supplemental Data: | ||||||||||||||||||||
Net assets, end of year (000) | $55 | $5,742 | $4,355 | $3,446 | $2,332 | |||||||||||||||
Average net assets (000) | $3,140 | $4,596 | $3,904 | $2,456 | $693 | |||||||||||||||
Ratios to average net assets(c): | ||||||||||||||||||||
Expenses after waivers and/or expense reimbursement | 0.51 | % | 0.50 | % | 0.49 | % | 0.49 | % | 0.46 | % | ||||||||||
Expenses before waivers and/or expense reimbursement | 0.83 | % | 0.88 | % | 1.27 | % | 1.51 | % | 3.02 | % | ||||||||||
Net investment income (loss) | 4.69 | % | 1.49 | % | 1.61 | % | 2.02 | % | 1.78 | % | ||||||||||
Portfolio turnover rate(d) | 45 | % | 49 | % | 61 | % | 33 | % | 41 | % | ||||||||||
| (a) | Calculated based on average shares outstanding during the year. |
| (b) | Total return is calculated assuming a purchase of a share on the first day and a sale on the last day of each year reported and includes reinvestment of dividends and distributions, if any. Total returns may reflect adjustments to conform to GAAP. |
| (c) | Does not include expenses of the underlying funds in which the Fund invests. Expenses waived/reimbursed include those of underlying funds in which the Fund invests. Consequently, the amount waived/reimbursed may be greater than the expense ratio reflected in the financial highlights. |
| (d) | The Fund’s portfolio turnover rate is calculated in accordance with regulatory requirements, without regard to transactions involving short-term investments, certain derivatives and in-kind transactions (if any). If such transactions were included, the Fund’s portfolio turnover rate may be higher. |
See Notes to Financial Statements.
96
Prudential Day One 2020 Fund
Financial Highlights (continued)
Class R3 Shares | ||||||||||||||||||||
| Year Ended July 31, | ||||||||||||||||||||
| 2022 | 2021 | 2020 | 2019 | 2018 | ||||||||||||||||
Per Share Operating Performance(a): | ||||||||||||||||||||
Net Asset Value, Beginning of Year | $12.86 | $11.30 | $11.13 | $11.01 | $10.55 | |||||||||||||||
Income (loss) from investment operations: | ||||||||||||||||||||
Net investment income (loss) | 0.52 | 0.20 | 0.21 | 0.25 | 0.25 | |||||||||||||||
Net realized and unrealized gain (loss) on investment transactions | (1.07 | ) | 1.63 | 0.42 | 0.22 | 0.35 | ||||||||||||||
Total from investment operations | (0.55 | ) | 1.83 | 0.63 | 0.47 | 0.60 | ||||||||||||||
Less Dividends and Distributions: | ||||||||||||||||||||
Dividends from net investment income | (0.77 | ) | (0.16 | ) | (0.25 | ) | (0.25 | ) | (0.13 | ) | ||||||||||
Distributions from net realized gains | (0.37 | ) | (0.11 | ) | (0.21 | ) | (0.10 | ) | (0.01 | ) | ||||||||||
Total dividends and distributions | (1.14 | ) | (0.27 | ) | (0.46 | ) | (0.35 | ) | (0.14 | ) | ||||||||||
Net asset value, end of year | $11.17 | $12.86 | $11.30 | $11.13 | $11.01 | |||||||||||||||
Total Return(b): | (4.89 | )% | 16.41 | % | 5.73 | % | 4.63 | % | 5.67 | % | ||||||||||
| ||||||||||||||||||||
Ratios/Supplemental Data: | ||||||||||||||||||||
Net assets, end of year (000) | $1,099 | $1,844 | $1,541 | $1,072 | $1,134 | |||||||||||||||
Average net assets (000) | $1,228 | $1,655 | $1,294 | $1,066 | $673 | |||||||||||||||
Ratios to average net assets(c): | ||||||||||||||||||||
Expenses after waivers and/or expense reimbursement | 0.36 | % | 0.35 | % | 0.34 | % | 0.34 | % | 0.28 | % | ||||||||||
Expenses before waivers and/or expense reimbursement | 0.65 | % | 0.97 | % | 1.80 | % | 1.99 | % | 3.00 | % | ||||||||||
Net investment income (loss) | 4.37 | % | 1.63 | % | 1.87 | % | 2.28 | % | 2.33 | % | ||||||||||
Portfolio turnover rate(d) | 45 | % | 49 | % | 61 | % | 33 | % | 41 | % | ||||||||||
| (a) | Calculated based on average shares outstanding during the year. |
| (b) | Total return is calculated assuming a purchase of a share on the first day and a sale on the last day of each year reported and includes reinvestment of dividends and distributions, if any. Total returns may reflect adjustments to conform to GAAP. |
| (c) | Does not include expenses of the underlying funds in which the Fund invests. Expenses waived/reimbursed include those of underlying funds in which the Fund invests. Consequently, the amount waived/reimbursed may be greater than the expense ratio reflected in the financial highlights. |
| (d) | The Fund’s portfolio turnover rate is calculated in accordance with regulatory requirements, without regard to transactions involving short-term investments, certain derivatives and in-kind transactions (if any). If such transactions were included, the Fund’s portfolio turnover rate may be higher. |
See Notes to Financial Statements.
Prudential Day One Funds 97
Prudential Day One 2020 Fund
Financial Highlights (continued)
Class R4 Shares | ||||||||||||||||||||
| Year Ended July 31, | ||||||||||||||||||||
| 2022 | 2021 | 2020 | 2019 | 2018 | ||||||||||||||||
Per Share Operating Performance(a): | ||||||||||||||||||||
Net Asset Value, Beginning of Year | $12.87 | $11.31 | $11.13 | $11.03 | $10.55 | |||||||||||||||
Income (loss) from investment operations: | ||||||||||||||||||||
Net investment income (loss) | 0.53 | 0.21 | 0.21 | 0.28 | 0.24 | |||||||||||||||
Net realized and unrealized gain (loss) on investment transactions | (1.06 | ) | 1.63 | 0.44 | 0.18 | 0.39 | ||||||||||||||
Total from investment operations | (0.53 | ) | 1.84 | 0.65 | 0.46 | 0.63 | ||||||||||||||
Less Dividends and Distributions: | ||||||||||||||||||||
Dividends from net investment income | (0.79 | ) | (0.17 | ) | (0.26 | ) | (0.26 | ) | (0.14 | ) | ||||||||||
Distributions from net realized gains | (0.37 | ) | (0.11 | ) | (0.21 | ) | (0.10 | ) | (0.01 | ) | ||||||||||
Total dividends and distributions | (1.16 | ) | (0.28 | ) | (0.47 | ) | (0.36 | ) | (0.15 | ) | ||||||||||
Net asset value, end of year | $11.18 | $12.87 | $11.31 | $11.13 | $11.03 | |||||||||||||||
Total Return(b): | (4.79 | )% | 16.50 | % | 5.82 | % | 4.64 | % | 5.97 | % | ||||||||||
| ||||||||||||||||||||
Ratios/Supplemental Data: | ||||||||||||||||||||
Net assets, end of year (000) | $14 | $14 | $12 | $12 | $61 | |||||||||||||||
Average net assets (000) | $14 | $13 | $12 | $37 | $191 | |||||||||||||||
Ratios to average net assets(c): | ||||||||||||||||||||
Expenses after waivers and/or expense reimbursement | 0.26 | % | 0.25 | % | 0.24 | % | 0.24 | % | 0.14 | % | ||||||||||
Expenses before waivers and/or expense reimbursement | 26.44 | % | 49.43 | % | 110.87 | % | 31.79 | % | 7.79 | % | ||||||||||
Net investment income (loss) | 4.44 | % | 1.73 | % | 1.95 | % | 2.61 | % | 2.19 | % | ||||||||||
Portfolio turnover rate(d) | 45 | % | 49 | % | 61 | % | 33 | % | 41 | % | ||||||||||
| (a) | Calculated based on average shares outstanding during the year. |
| (b) | Total return is calculated assuming a purchase of a share on the first day and a sale on the last day of each year reported and includes reinvestment of dividends and distributions, if any. Total returns may reflect adjustments to conform to GAAP. |
| (c) | Does not include expenses of the underlying funds in which the Fund invests. Expenses waived/reimbursed include those of underlying funds in which the Fund invests. Consequently, the amount waived/reimbursed may be greater than the expense ratio reflected in the financial highlights. |
| (d) | The Fund’s portfolio turnover rate is calculated in accordance with regulatory requirements, without regard to transactions involving short-term investments, certain derivatives and in-kind transactions (if any). If such transactions were included, the Fund’s portfolio turnover rate may be higher. |
See Notes to Financial Statements.
98
Prudential Day One 2020 Fund
Financial Highlights (continued)
Class R5 Shares | ||||||||||||||||||||
| Year Ended July 31, | ||||||||||||||||||||
| 2022 | 2021 | 2020 | 2019 | 2018 | ||||||||||||||||
Per Share Operating Performance(a): | ||||||||||||||||||||
Net Asset Value, Beginning of Year | $12.88 | $11.32 | $11.14 | $11.03 | $10.56 | |||||||||||||||
Income (loss) from investment operations: | ||||||||||||||||||||
Net investment income (loss) | 0.55 | 0.22 | 0.24 | 0.25 | 0.23 | |||||||||||||||
Net realized and unrealized gain (loss) on investment transactions | (1.08 | ) | 1.63 | 0.42 | 0.23 | 0.40 | ||||||||||||||
Total from investment operations | (0.53 | ) | 1.85 | 0.66 | 0.48 | 0.63 | ||||||||||||||
Less Dividends and Distributions: | ||||||||||||||||||||
Dividends from net investment income | (0.80 | ) | (0.18 | ) | (0.27 | ) | (0.27 | ) | (0.15 | ) | ||||||||||
Distributions from net realized gains | (0.37 | ) | (0.11 | ) | (0.21 | ) | (0.10 | ) | (0.01 | ) | ||||||||||
Total dividends and distributions | (1.17 | ) | (0.29 | ) | (0.48 | ) | (0.37 | ) | (0.16 | ) | ||||||||||
Net asset value, end of year | $11.18 | $12.88 | $11.32 | $11.14 | $11.03 | |||||||||||||||
Total Return(b): | (4.77 | )% | 16.60 | % | 6.03 | % | 4.75 | % | 5.99 | % | ||||||||||
| ||||||||||||||||||||
Ratios/Supplemental Data: | ||||||||||||||||||||
Net assets, end of year (000) | $2,967 | $3,585 | $3,624 | $3,962 | $3,603 | |||||||||||||||
Average net assets (000) | $3,448 | $3,427 | $3,783 | $3,807 | $1,162 | |||||||||||||||
Ratios to average net assets(c): | ||||||||||||||||||||
Expenses after waivers and/or expense reimbursement | 0.16 | % | 0.15 | % | 0.14 | % | 0.14 | % | 0.11 | % | ||||||||||
Expenses before waivers and/or expense reimbursement | 0.50 | % | 0.58 | % | 0.92 | % | 0.99 | % | 1.91 | % | ||||||||||
Net investment income (loss) | 4.58 | % | 1.81 | % | 2.22 | % | 2.34 | % | 2.13 | % | ||||||||||
Portfolio turnover rate(d) | 45 | % | 49 | % | 61 | % | 33 | % | 41 | % | ||||||||||
| (a) | Calculated based on average shares outstanding during the year. |
| (b) | Total return is calculated assuming a purchase of a share on the first day and a sale on the last day of each year reported and includes reinvestment of dividends and distributions, if any. Total returns may reflect adjustments to conform to GAAP. |
| (c) | Does not include expenses of the underlying funds in which the Fund invests. Expenses waived/reimbursed include those of underlying funds in which the Fund invests. Consequently, the amount waived/reimbursed may be greater than the expense ratio reflected in the financial highlights. |
| (d) | The Fund’s portfolio turnover rate is calculated in accordance with regulatory requirements, without regard to transactions involving short-term investments, certain derivatives and in-kind transactions (if any). If such transactions were included, the Fund’s portfolio turnover rate may be higher. |
See Notes to Financial Statements.
Prudential Day One Funds 99
Prudential Day One 2020 Fund
Financial Highlights (continued)
Class R6 Shares | ||||||||||||||||||||
| Year Ended July 31, | ||||||||||||||||||||
| 2022 | 2021 | 2020 | 2019 | 2018 | ||||||||||||||||
Per Share Operating Performance(a): | ||||||||||||||||||||
Net Asset Value, Beginning of Year | $12.84 | $11.28 | $11.11 | $11.00 | $10.54 | |||||||||||||||
Income (loss) from investment operations: | ||||||||||||||||||||
Net investment income (loss) | 0.56 | 0.24 | 0.23 | 0.27 | 0.26 | |||||||||||||||
Net realized and unrealized gain (loss) on investment transactions | (1.06 | ) | 1.63 | 0.44 | 0.23 | 0.38 | ||||||||||||||
Total from investment operations | (0.50 | ) | 1.87 | 0.67 | 0.50 | 0.64 | ||||||||||||||
Less Dividends and Distributions: | ||||||||||||||||||||
Dividends from net investment income | (0.82 | ) | (0.20 | ) | (0.29 | ) | (0.29 | ) | (0.17 | ) | ||||||||||
Distributions from net realized gains | (0.37 | ) | (0.11 | ) | (0.21 | ) | (0.10 | ) | (0.01 | ) | ||||||||||
Total dividends and distributions | (1.19 | ) | (0.31 | ) | (0.50 | ) | (0.39 | ) | (0.18 | ) | ||||||||||
Net asset value, end of year | $11.15 | $12.84 | $11.28 | $11.11 | $11.00 | |||||||||||||||
Total Return(b): | (4.56 | )% | 16.82 | % | 6.10 | % | 4.93 | % | 6.06 | % | ||||||||||
| ||||||||||||||||||||
Ratios/Supplemental Data: | ||||||||||||||||||||
Net assets, end of year (000) | $46,728 | $58,602 | $49,000 | $35,018 | $22,951 | |||||||||||||||
Average net assets (000) | $54,565 | $59,237 | $39,274 | $30,081 | $16,888 | |||||||||||||||
Ratios to average net assets(c): | ||||||||||||||||||||
Expenses after waivers and/or expense reimbursement(d) | 0.00 | % | 0.00 | % | 0.00 | % | 0.00 | % | 0.00 | % | ||||||||||
| Expenses after waivers and/or reimbursement inclusive of excess expense reimbursement from the manager | 0.01 | % | (0.00 | )%(e) | (0.01 | )% | (0.01 | )% | (0.10 | )% | ||||||||||
Expenses before waivers and/or expense reimbursement | 0.25 | % | 0.25 | % | 0.46 | % | 0.58 | % | 0.93 | % | ||||||||||
Net investment income (loss) | 4.71 | % | 1.98 | % | 2.11 | % | 2.54 | % | 2.42 | % | ||||||||||
Portfolio turnover rate(f) | 45 | % | 49 | % | 61 | % | 33 | % | 41 | % | ||||||||||
| (a) | Calculated based on average shares outstanding during the year. |
| (b) | Total return is calculated assuming a purchase of a share on the first day and a sale on the last day of each year reported and includes reinvestment of dividends and distributions, if any. Total returns may reflect adjustments to conform to GAAP. |
| (c) | Does not include expenses of the underlying funds in which the Fund invests. Expenses waived/reimbursed include those of underlying funds in which the Fund invests. Consequently, the amount waived/reimbursed may be greater than the expense ratio reflected in the financial highlights. |
| (d) | As a result of reimbursing expenses, including underlying fund expenses, the Manager may reimburse amounts in excess of the respective share classes’ operating expenses. |
| (e) | Amount rounds to zero. |
| (f) | The Fund’s portfolio turnover rate is calculated in accordance with regulatory requirements, without regard to transactions involving short-term investments, certain derivatives and in-kind transactions (if any). If such transactions were included, the Fund’s portfolio turnover rate may be higher. |
See Notes to Financial Statements.
100
Prudential Day One 2025 Fund
Schedule of Investments
as of July 31, 2022
Description | Shares | Value | ||||||
LONG-TERM INVESTMENTS 92.6% | ||||||||
AFFILIATED MUTUAL FUNDS | ||||||||
PGIM Core Conservative Bond Fund (Class R6) | 754,420 | $ | 6,902,942 | |||||
PGIM Global Real Estate Fund (Class R6) | 176,693 | 3,616,897 | ||||||
PGIM Jennison Small-Cap Core Equity Fund (Class R6) | 117,240 | 1,439,710 | ||||||
PGIM Quant Solutions Commodity Strategies Fund (Class R6) | 344,900 | 3,631,796 | ||||||
PGIM Quant Solutions International Developed Markets Index Fund (Class R6) | 493,577 | 5,942,665 | ||||||
PGIM Quant Solutions Large-Cap Core Fund (Class R6) | 726,971 | 12,685,640 | ||||||
PGIM Quant Solutions Mid-Cap Core Fund (Class R6) | 134,508 | 1,445,959 | ||||||
PGIM Quant Solutions US Broad Market Index Fund (Class R6) | 386,801 | 6,513,737 | ||||||
PGIM TIPS Fund (Class R6) | 1,497,265 | 14,134,183 | ||||||
PGIM Total Return Bond Fund (Class R6) | 849,335 | 10,812,040 | ||||||
|
| |||||||
TOTAL LONG-TERM INVESTMENTS | 67,125,569 | |||||||
|
| |||||||
SHORT-TERM INVESTMENT 7.2% | ||||||||
AFFILIATED MUTUAL FUND | ||||||||
PGIM Core Ultra Short Bond Fund | 5,203,999 | 5,203,999 | ||||||
|
| |||||||
TOTAL INVESTMENTS 99.8% | 72,329,568 | |||||||
Other assets in excess of liabilities 0.2% | 157,654 | |||||||
|
| |||||||
NET ASSETS 100.0% | $ | 72,487,222 | ||||||
|
| |||||||
Below is a list of the abbreviation(s) used in the annual report:
LIBOR—London Interbank Offered Rate
TIPS—Treasury Inflation-Protected Securities
(wd) PGIM Investments LLC, the manager of the Fund, also serves as the manager of the underlying funds in which the Fund invests.
Fair Value Measurements:
Various inputs are used in determining the value of the Fund’s investments. These inputs are summarized in the three broad levels listed below.
Level 1—unadjusted quoted prices generally in active markets for identical securities.
Level 2—quoted prices for similar securities, interest rates and yield curves, prepayment speeds, foreign currency exchange rates and other observable inputs.
Level 3—unobservable inputs for securities valued in accordance with Board approved fair valuation procedures.
See Notes to Financial Statements.
Prudential Day One Funds 101
Prudential Day One 2025 Fund
Schedule of Investments (continued)
as of July 31, 2022
The following is a summary of the inputs used as of July 31, 2022 in valuing such portfolio securities:
Level 1 | Level 2 | Level 3 | ||||||||||||||||||||||||||
Investments in Securities | ||||||||||||||||||||||||||||
Assets | ||||||||||||||||||||||||||||
Long-Term Investments | ||||||||||||||||||||||||||||
Affiliated Mutual Funds | $ | 67,125,569 | $ | — | $ | — | ||||||||||||||||||||||
Short-Term Investment | ||||||||||||||||||||||||||||
Affiliated Mutual Fund | 5,203,999 | — | — | |||||||||||||||||||||||||
|
|
|
|
|
| |||||||||||||||||||||||
Total | $ | 72,329,568 | $ | — | $ | — | ||||||||||||||||||||||
|
|
|
|
|
| |||||||||||||||||||||||
Investment Allocation:
The investment allocation of portfolio holdings and other assets in excess of liabilities shown as a percentage of net assets as of July 31, 2022 were as follows:
TIPS | 19.5 | % | ||
Large Cap | 17.5 | |||
Total Return Bond | 14.9 | |||
Core Bond | 9.5 | |||
Broad Market | 9.0 | |||
International Developed Markets | 8.2 | |||
Short Term | 7.2 | |||
Commodity | 5.0 |
Real Estate | 5.0 | % | ||
Mid Cap | 2.0 | |||
Small Cap | 2.0 | |||
|
| |||
| 99.8 | ||||
Other assets in excess of liabilities | 0.2 | |||
|
| |||
| 100.0 | % | |||
|
| |||
See Notes to Financial Statements.
102
Prudential Day One 2025 Fund
Statement of Assets & Liabilities
as of July 31, 2022
Assets | ||||||
Affiliated investments (cost $67,334,567) | $ | 72,329,568 | ||||
Receivable for investments sold | 795,292 | |||||
Due from Manager | 13,810 | |||||
Receivable for Fund shares sold | 5,221 | |||||
Prepaid expenses | 68 | |||||
|
| |||||
Total Assets | 73,143,959 | |||||
|
| |||||
Liabilities | ||||||
Payable for investments purchased | 564,242 | |||||
Payable for Fund shares purchased | 46,895 | |||||
Accrued expenses and other liabilities | 44,286 | |||||
Trustees’ fees payable | 894 | |||||
Affiliated transfer agent fee payable | 357 | |||||
Distribution fee payable | 63 | |||||
|
| |||||
Total Liabilities | 656,737 | |||||
|
| |||||
Net Assets | $ | 72,487,222 | ||||
|
| |||||
Net assets were comprised of: | ||||||
Shares of beneficial interest, at par | $ | 6,430 | ||||
Paid-in capital in excess of par | 69,712,400 | |||||
Total distributable earnings (loss) | 2,768,392 | |||||
|
| |||||
Net assets, July 31, 2022 | $ | 72,487,222 | ||||
|
| |||||
See Notes to Financial Statements.
Prudential Day One Funds 103
Prudential Day One 2025 Fund
Statement of Assets & Liabilities (continued)
as of July 31, 2022
Class R1 | ||||||||
Net asset value, offering price and redemption price per share, ($13,692 ÷ 1,223 shares of beneficial interest issued and outstanding) | $ | 11.19 | ||||||
|
| |||||||
Class R2 | ||||||||
Net asset value, offering price and redemption price per share, ($105,849 ÷ 9,433 shares of beneficial interest issued and outstanding) | $ | 11.22 | ||||||
|
| |||||||
Class R3 | ||||||||
Net asset value, offering price and redemption price per share, ($449,174 ÷ 39,982 shares of beneficial interest issued and outstanding) | $ | 11.23 | ||||||
|
| |||||||
Class R4 | ||||||||
Net asset value, offering price and redemption price per share, ($22,429 ÷ 1,996 shares of beneficial interest issued and outstanding) | $ | 11.24 | ||||||
|
| |||||||
Class R5 | ||||||||
Net asset value, offering price and redemption price per share, ($605,836 ÷ 53,867 shares of beneficial interest issued and outstanding) | $ | 11.25 | ||||||
|
| |||||||
Class R6 | ||||||||
Net asset value, offering price and redemption price per share, ($71,290,242 ÷ 6,323,795 shares of beneficial interest issued and outstanding) | $ | 11.27 | ||||||
|
| |||||||
Net asset value per share may not recalculate due to rounding.
See Notes to Financial Statements.
104
Prudential Day One 2025 Fund
Statement of Operations
Year Ended July 31, 2022
Net Investment Income (Loss)
| ||||
Affiliated dividend income | $ | 3,889,909 | ||
|
| |||
Expenses | ||||
Management fee | 16,823 | |||
Distribution fee(a) | 964 | |||
Shareholder servicing fees (including affiliated expense of $401)(a) | 409 | |||
Custodian and accounting fees | 63,434 | |||
Registration fees(a) | 25,731 | |||
Legal fees and expenses | 20,997 | |||
Audit fee | 17,500 | |||
Trustees’ fees | 10,901 | |||
Shareholders’ reports | 8,936 | |||
Transfer agent’s fees and expenses (including affiliated expense of $3,018)(a) | 4,530 | |||
Pricing fees | 2,986 | |||
Miscellaneous | 11,372 | |||
|
| |||
Total expenses | 184,583 | |||
Less: Fee waiver and/or expense reimbursement(a) | (173,140 | ) | ||
|
| |||
Net expenses | 11,443 | |||
|
| |||
Net investment income (loss) | 3,878,466 | |||
|
| |||
Realized And Unrealized Gain (Loss) On Affiliated Investments
| ||||
Net realized gain (loss) on investment transactions | (407,133 | ) | ||
Net capital gain distributions received | 4,408,605 | |||
|
| |||
| 4,001,472 | ||||
|
| |||
Net change in unrealized appreciation (depreciation) on investments | (12,272,511 | ) | ||
|
| |||
Net gain (loss) on investment transactions | (8,271,039 | ) | ||
|
| |||
Net Increase (Decrease) In Net Assets Resulting From Operations | $ | (4,392,573 | ) | |
|
| |||
| (a) | Class specific expenses and waivers were as follows: |
| Class R1 | Class R2 | Class R3 | Class R4 | Class R5 | Class R6 | |||||||||||||||||||
Distribution fee | 71 | 230 | 663 | — | — | — | ||||||||||||||||||
Shareholder servicing fees | — | — | 407 | 2 | — | — | ||||||||||||||||||
Registration fees | 3,750 | 4,750 | 3,750 | 3,750 | 3,750 | 5,981 | ||||||||||||||||||
Transfer agent’s fees and expenses | 82 | 622 | 721 | 87 | 739 | 2,279 | ||||||||||||||||||
Fee waiver and/or expense reimbursement | (3,820 | ) | (5,301 | ) | (4,345 | ) | (3,825 | ) | (4,597 | ) | (151,252 | ) | ||||||||||||
See Notes to Financial Statements.
Prudential Day One Funds 105
Prudential Day One 2025 Fund
Statements of Changes in Net Assets
Year Ended July 31, | ||||||||||||
|
| |||||||||||
| 2022 | 2021 | |||||||||||
Increase (Decrease) in Net Assets
| ||||||||||||
Operations | ||||||||||||
Net investment income (loss) | $ | 3,878,466 | $ | 1,677,379 | ||||||||
Net realized gain (loss) on investment transactions | (407,133 | ) | 1,413,612 | |||||||||
Net capital gain distributions received | 4,408,605 | 475,327 | ||||||||||
Net change in unrealized appreciation (depreciation) on investments | (12,272,511 | ) | 11,576,517 | |||||||||
|
|
|
| |||||||||
Net increase (decrease) in net assets resulting from operations | (4,392,573 | ) | 15,142,835 | |||||||||
|
|
|
| |||||||||
Dividends and Distributions | ||||||||||||
Distributions from distributable earnings | ||||||||||||
Class R1 | (1,353 | ) | (225 | ) | ||||||||
Class R2 | (8,344 | ) | (933 | ) | ||||||||
Class R3 | (46,210 | ) | (181,348 | ) | ||||||||
Class R4 | (1,671 | ) | (290 | ) | ||||||||
Class R5 | (33,003 | ) | (4,518 | ) | ||||||||
Class R6 | (8,656,371 | ) | (1,879,266 | ) | ||||||||
|
|
|
| |||||||||
| (8,746,952 | ) | (2,066,580 | ) | |||||||||
|
|
|
| |||||||||
Fund share transactions | ||||||||||||
Net proceeds from shares sold | 21,309,172 | 31,038,595 | ||||||||||
Net asset value of shares issued in reinvestment of dividends and distributions | 8,746,952 | 2,066,580 | ||||||||||
Cost of shares purchased | (34,928,838 | ) | (26,155,552 | ) | ||||||||
|
|
|
| |||||||||
Net increase (decrease) in net assets from Fund share transactions | (4,872,714 | ) | 6,949,623 | |||||||||
|
|
|
| |||||||||
Total increase (decrease) | (18,012,239 | ) | 20,025,878 | |||||||||
Net Assets:
| ||||||||||||
Beginning of year | 90,499,461 | 70,473,583 | ||||||||||
|
|
|
| |||||||||
End of year | $ | 72,487,222 | $ | 90,499,461 | ||||||||
|
|
|
| |||||||||
See Notes to Financial Statements.
106
Prudential Day One 2025 Fund
Financial Highlights
Class R1 Shares | ||||||||||||||||||||
| Year Ended July 31, | ||||||||||||||||||||
| 2022 | 2021 | 2020 | 2019 | 2018 | ||||||||||||||||
Per Share Operating Performance(a): | ||||||||||||||||||||
Net Asset Value, Beginning of Year | $13.01 | $11.24 | $11.14 | $11.15 | $10.58 | |||||||||||||||
Income (loss) from investment operations: | ||||||||||||||||||||
Net investment income (loss) | 0.47 | 0.14 | 0.05 | 0.19 | 0.17 | |||||||||||||||
Net realized and unrealized gain (loss) on investment transactions | (1.07 | ) | 1.84 | 0.53 | 0.18 | 0.50 | ||||||||||||||
Total from investment operations | (0.60 | ) | 1.98 | 0.58 | 0.37 | 0.67 | ||||||||||||||
Less Dividends and Distributions: | ||||||||||||||||||||
Dividends from net investment income | (0.75 | ) | (0.11 | ) | (0.21 | ) | (0.20 | ) | (0.10 | ) | ||||||||||
Distributions from net realized gains | (0.47 | ) | (0.10 | ) | (0.27 | ) | (0.18 | ) | (- | )(b) | ||||||||||
Total dividends and distributions | (1.22 | ) | (0.21 | ) | (0.48 | ) | (0.38 | ) | (0.10 | ) | ||||||||||
Net asset value, end of year | $11.19 | $13.01 | $11.24 | $11.14 | $11.15 | |||||||||||||||
Total Return(c): | (5.37 | )% | 17.76 | % | 5.25 | % | 3.73 | % | 6.35 | % | ||||||||||
Ratios/Supplemental Data: | ||||||||||||||||||||
Net assets, end of year (000) | $14 | $14 | $12 | $671 | $678 | |||||||||||||||
Average net assets (000) | $14 | $13 | $122 | $625 | $639 | |||||||||||||||
Ratios to average net assets(d): | ||||||||||||||||||||
Expenses after waivers and/or expense reimbursement | 0.76 | % | 0.75 | % | 0.75 | % | 0.74 | % | 0.65 | % | ||||||||||
Expenses before waivers and/or expense reimbursement | 27.65 | % | 50.15 | % | 11.62 | % | 3.01 | % | 3.42 | % | ||||||||||
Net investment income (loss) | 3.86 | % | 1.18 | % | 0.49 | % | 1.72 | % | 1.55 | % | ||||||||||
Portfolio turnover rate(e) | 58 | % | 44 | % | 57 | % | 35 | % | 37 | % | ||||||||||
| (a) | Calculated based on average shares outstanding during the year. |
| (b) | Amount rounds to zero. |
| (c) | Total return is calculated assuming a purchase of a share on the first day and a sale on the last day of each year reported and includes reinvestment of dividends and distributions, if any. Total returns may reflect adjustments to conform to GAAP. |
| (d) | Does not include expenses of the underlying funds in which the Fund invests. Expenses waived/reimbursed include those of underlying funds in which the Fund invests. Consequently, the amount waived/reimbursed may be greater than the expense ratio reflected in the financial highlights. |
| (e) | The Fund’s portfolio turnover rate is calculated in accordance with regulatory requirements, without regard to transactions involving short-term investments, certain derivatives and in-kind transactions (if any). If such transactions were included, the Fund’s portfolio turnover rate may be higher. |
See Notes to Financial Statements.
Prudential Day One Funds 107
Prudential Day One 2025 Fund
Financial Highlights (continued)
Class R2 Shares |
| |||||||||||||||||||||||
| Year Ended July 31, | ||||||||||||||||||||||||
| 2022 | 2021 | 2020 | 2019 | 2018 | ||||||||||||||||||||
Per Share Operating Performance(a): | ||||||||||||||||||||||||
Net Asset Value, Beginning of Year | $13.04 | $11.26 | $11.15 | $11.16 | $10.59 | |||||||||||||||||||
Income (loss) from investment operations: | ||||||||||||||||||||||||
Net investment income (loss) | 0.48 | 0.15 | (0.01 | ) | 0.18 | 0.24 | ||||||||||||||||||
Net realized and unrealized gain (loss) on investment transactions | (1.05 | ) | 1.86 | 0.63 | 0.22 | 0.46 | ||||||||||||||||||
Total from investment operations | (0.57 | ) | 2.01 | 0.62 | 0.40 | 0.70 | ||||||||||||||||||
Less Dividends and Distributions: | ||||||||||||||||||||||||
Dividends from net investment income | (0.78 | ) | (0.13 | ) | (0.24 | ) | (0.23 | ) | (0.13 | ) | ||||||||||||||
Distributions from net realized gains | (0.47 | ) | (0.10 | ) | (0.27 | ) | (0.18 | ) | (- | )(b) | ||||||||||||||
Total dividends and distributions | (1.25 | ) | (0.23 | ) | (0.51 | ) | (0.41 | ) | (0.13 | ) | ||||||||||||||
Net asset value, end of year | $11.22 | $13.04 | $11.26 | $11.15 | $11.16 | |||||||||||||||||||
Total Return(c): | (5.12 | )% | 18.09 | % | 5.45 | % | 4.09 | % | 6.62 | % | ||||||||||||||
Ratios/Supplemental Data: | ||||||||||||||||||||||||
Net assets, end of year (000) | $106 | $82 | $90 | $117 | $14 | |||||||||||||||||||
Average net assets (000) | $92 | $71 | $136 | $39 | $18 | |||||||||||||||||||
Ratios to average net assets(d): | ||||||||||||||||||||||||
Expenses after waivers and/or expense reimbursement | 0.51 | % | 0.50 | % | 0.50 | % | 0.49 | % | 0.39 | % | ||||||||||||||
Expenses before waivers and/or expense reimbursement | 6.27 | % | 10.60 | % | 10.64 | % | 31.08 | % | 71.60 | % | ||||||||||||||
Net investment income (loss) | 3.99 | % | 1.29 | % | (0.13 | )% | 1.60 | % | 2.18 | % | ||||||||||||||
Portfolio turnover rate(e) | 58 | % | 44 | % | 57 | % | 35 | % | 37 | % | ||||||||||||||
| (a) | Calculated based on average shares outstanding during the year. |
| (b) | Amount rounds to zero. |
| (c) | Total return is calculated assuming a purchase of a share on the first day and a sale on the last day of each year reported and includes reinvestment of dividends and distributions, if any. Total returns may reflect adjustments to conform to GAAP. |
| (d) | Does not include expenses of the underlying funds in which the Fund invests. Expenses waived/reimbursed include those of underlying funds in which the Fund invests. Consequently, the amount waived/reimbursed may be greater than the expense ratio reflected in the financial highlights. |
| (e) | The Fund’s portfolio turnover rate is calculated in accordance with regulatory requirements, without regard to transactions involving short-term investments, certain derivatives and in-kind transactions (if any). If such transactions were included, the Fund’s portfolio turnover rate may be higher. |
See Notes to Financial Statements.
108
Prudential Day One 2025 Fund
Financial Highlights (continued)
Class R3 Shares |
| |||||||||||||||||||||||
| Year Ended July 31, | ||||||||||||||||||||||||
| 2022 | 2021 | 2020 | 2019 | 2018 | ||||||||||||||||||||
Per Share Operating Performance(a): | ||||||||||||||||||||||||
Net Asset Value, Beginning of Year | $13.06 | $11.27 | $11.17 | $11.18 | $10.61 | |||||||||||||||||||
Income (loss) from investment operations: | ||||||||||||||||||||||||
Net investment income (loss) | 0.43 | 0.19 | 0.21 | 0.23 | 0.21 | |||||||||||||||||||
Net realized and unrealized gain (loss) on investment transactions | (0.99 | ) | 1.85 | 0.41 | 0.19 | 0.51 | ||||||||||||||||||
Total from investment operations | (0.56 | ) | 2.04 | 0.62 | 0.42 | 0.72 | ||||||||||||||||||
Less Dividends and Distributions: | ||||||||||||||||||||||||
Dividends from net investment income | (0.80 | ) | (0.15 | ) | (0.25 | ) | (0.25 | ) | (0.15 | ) | ||||||||||||||
Distributions from net realized gains | (0.47 | ) | (0.10 | ) | (0.27 | ) | (0.18 | ) | (- | )(b) | ||||||||||||||
Total dividends and distributions | (1.27 | ) | (0.25 | ) | (0.52 | ) | (0.43 | ) | (0.15 | ) | ||||||||||||||
Net asset value, end of year | $11.23 | $13.06 | $11.27 | $11.17 | $11.18 | |||||||||||||||||||
Total Return(c): | (5.04 | )% | 18.32 | % | 5.62 | % | 4.17 | % | 6.76 | % | ||||||||||||||
Ratios/Supplemental Data: | ||||||||||||||||||||||||
Net assets, end of year (000) | $449 | $9,911 | $8,064 | $7,737 | $5,871 | |||||||||||||||||||
Average net assets (000) | $663 | $8,876 | $7,803 | $6,760 | $4,653 | |||||||||||||||||||
Ratios to average net assets(d): | ||||||||||||||||||||||||
Expenses after waivers and/or expense reimbursement | 0.36 | % | 0.35 | % | 0.35 | % | 0.34 | % | 0.25 | % | ||||||||||||||
Expenses before waivers and/or expense reimbursement | 1.02 | % | 0.61 | % | 0.90 | % | 1.00 | % | 1.24 | % | ||||||||||||||
Net investment income (loss) | 3.60 | % | 1.59 | % | 1.89 | % | 2.14 | % | 1.94 | % | ||||||||||||||
Portfolio turnover rate(e) | 58 | % | 44 | % | 57 | % | 35 | % | 37 | % | ||||||||||||||
| (a) | Calculated based on average shares outstanding during the year. |
| (b) | Amount rounds to zero. |
| (c) | Total return is calculated assuming a purchase of a share on the first day and a sale on the last day of each year reported and includes reinvestment of dividends and distributions, if any. Total returns may reflect adjustments to conform to GAAP. |
| (d) | Does not include expenses of the underlying funds in which the Fund invests. Expenses waived/reimbursed include those of underlying funds in which the Fund invests. Consequently, the amount waived/reimbursed may be greater than the expense ratio reflected in the financial highlights. |
| (e) | The Fund’s portfolio turnover rate is calculated in accordance with regulatory requirements, without regard to transactions involving short-term investments, certain derivatives and in-kind transactions (if any). If such transactions were included, the Fund’s portfolio turnover rate may be higher. |
See Notes to Financial Statements.
Prudential Day One Funds 109
Prudential Day One 2025 Fund
Financial Highlights (continued)
Class R4 Shares |
| |||||||||||||||||||||||
Year Ended July 31, | ||||||||||||||||||||||||
| 2022 | 2021 | 2020 | 2019 | 2018 | ||||||||||||||||||||
Per Share Operating Performance(a): | ||||||||||||||||||||||||
Net Asset Value, Beginning of Year | $13.06 | $11.28 | $11.17 | $11.18 | $10.61 | |||||||||||||||||||
Income (loss) from investment operations: | ||||||||||||||||||||||||
Net investment income (loss) | 0.51 | 0.20 | 0.22 | 0.22 | 0.20 | |||||||||||||||||||
Net realized and unrealized gain (loss) on investment transactions | (1.05 | ) | 1.84 | 0.43 | 0.21 | 0.53 | ||||||||||||||||||
Total from investment operations | (0.54 | ) | 2.04 | 0.65 | 0.43 | 0.73 | ||||||||||||||||||
Less Dividends and Distributions: | ||||||||||||||||||||||||
Dividends from net investment income | (0.81 | ) | (0.16 | ) | (0.27 | ) | (0.26 | ) | (0.16 | ) | ||||||||||||||
Distributions from net realized gains | (0.47 | ) | (0.10 | ) | (0.27 | ) | (0.18 | ) | (- | )(b) | ||||||||||||||
Total dividends and distributions | (1.28 | ) | (0.26 | ) | (0.54 | ) | (0.44 | ) | (0.16 | ) | ||||||||||||||
Net asset value, end of year | $11.24 | $13.06 | $11.28 | $11.17 | $11.18 | |||||||||||||||||||
Total Return(c): | (4.87 | )% | 18.43 | % | 5.73 | % | 4.27 | % | 6.88 | % | ||||||||||||||
Ratios/Supplemental Data: | ||||||||||||||||||||||||
Net assets, end of year (000) | $22 | $15 | $13 | $12 | $109 | |||||||||||||||||||
Average net assets (000) | $18 | $14 | $12 | $45 | $134 | |||||||||||||||||||
Ratios to average net assets(d): | ||||||||||||||||||||||||
Expenses after waivers and/or expense reimbursement | 0.26 | % | 0.25 | % | 0.25 | % | 0.25 | % | 0.13 | % | ||||||||||||||
Expenses before waivers and/or expense reimbursement | 21.59 | % | 48.41 | % | 109.74 | % | 26.16 | % | 10.37 | % | ||||||||||||||
Net investment income (loss) | 4.24 | % | 1.68 | % | 1.99 | % | 2.04 | % | 1.81 | % | ||||||||||||||
Portfolio turnover rate(e) | 58 | % | 44 | % | 57 | % | 35 | % | 37 | % | ||||||||||||||
| (a) | Calculated based on average shares outstanding during the year. |
| (b) | Amount rounds to zero. |
| (c) | Total return is calculated assuming a purchase of a share on the first day and a sale on the last day of each year reported and includes reinvestment of dividends and distributions, if any. Total returns may reflect adjustments to conform to GAAP. |
| (d) | Does not include expenses of the underlying funds in which the Fund invests. Expenses waived/reimbursed include those of underlying funds in which the Fund invests. Consequently, the amount waived/reimbursed may be greater than the expense ratio reflected in the financial highlights. |
| (e) | The Fund’s portfolio turnover rate is calculated in accordance with regulatory requirements, without regard to transactions involving short-term investments, certain derivatives and in-kind transactions (if any). If such transactions were included, the Fund’s portfolio turnover rate may be higher. |
See Notes to Financial Statements.
110
Prudential Day One 2025 Fund
Financial Highlights (continued)
Class R5 Shares | ||||||||||||||||||||
| Year Ended July 31, | ||||||||||||||||||||
| 2022 | 2021 | 2020 | 2019 | 2018 | ||||||||||||||||
Per Share Operating Performance(a): | ||||||||||||||||||||
Net Asset Value, Beginning of Year | $ | 13.07 | $ | 11.28 | $ | 11.17 | $ | 11.19 | $ | 10.62 | ||||||||||
Income (loss) from investment operations: | ||||||||||||||||||||
Net investment income (loss) | 0.49 | 0.22 | 0.24 | 0.24 | 0.23 | |||||||||||||||
Net realized and unrealized gain (loss) on investment transactions | (1.02 | ) | 1.84 | 0.41 | 0.19 | 0.51 | ||||||||||||||
Total from investment operations | (0.53 | ) | 2.06 | 0.65 | 0.43 | 0.74 | ||||||||||||||
Less Dividends and Distributions: | ||||||||||||||||||||
Dividends from net investment income | (0.82 | ) | (0.17 | ) | (0.27 | ) | (0.27 | ) | (0.17 | ) | ||||||||||
Distributions from net realized gains | (0.47 | ) | (0.10 | ) | (0.27 | ) | (0.18 | ) | (- | )(b) | ||||||||||
Total dividends and distributions | (1.29 | ) | (0.27 | ) | (0.54 | ) | (0.45 | ) | (0.17 | ) | ||||||||||
Net asset value, end of year | $ | 11.25 | $ | 13.07 | $ | 11.28 | $ | 11.17 | $ | 11.19 | ||||||||||
Total Return(c): | (4.77 | )% | 18.53 | % | 5.90 | % | 4.29 | % | 6.98 | % | ||||||||||
Ratios/Supplemental Data: | ||||||||||||||||||||
Net assets, end of year (000) | $606 | $266 | $160 | $295 | $37 | |||||||||||||||
Average net assets (000) | $425 | $197 | $238 | $71 | $25 | |||||||||||||||
Ratios to average net assets(d): | ||||||||||||||||||||
Expenses after waivers and/or expense reimbursement | 0.16 | % | 0.15 | % | 0.16 | % | 0.14 | % | 0.07 | % | ||||||||||
Expenses before waivers and/or expense reimbursement | 1.24 | % | 3.68 | % | 6.04 | % | 16.90 | % | 50.68 | % | ||||||||||
Net investment income (loss) | 4.12 | % | 1.85 | % | 2.12 | % | 2.21 | % | 2.05 | % | ||||||||||
Portfolio turnover rate(e) | 58 | % | 44 | % | 57 | % | 35 | % | 37 | % | ||||||||||
| (a) | Calculated based on average shares outstanding during the year. |
| (b) | Amount rounds to zero. |
| (c) | Total return is calculated assuming a purchase of a share on the first day and a sale on the last day of each year reported and includes reinvestment of dividends and distributions, if any. Total returns may reflect adjustments to conform to GAAP. |
| (d) | Does not include expenses of the underlying funds in which the Fund invests. Expenses waived/reimbursed include those of underlying funds in which the Fund invests. Consequently, the amount waived/reimbursed may be greater than the expense ratio reflected in the financial highlights. |
| (e) | The Fund’s portfolio turnover rate is calculated in accordance with regulatory requirements, without regard to transactions involving short-term investments, certain derivatives and in-kind transactions (if any). If such transactions were included, the Fund’s portfolio turnover rate may be higher. |
See Notes to Financial Statements.
Prudential Day One Funds 111
Prudential Day One 2025 Fund
Financial Highlights (continued)
Class R6 Shares | ||||||||||||||||||||
Year Ended July 31, | ||||||||||||||||||||
| 2022 | 2021 | 2020 | 2019 | 2018 | ||||||||||||||||
Per Share Operating Performance(a): | ||||||||||||||||||||
Net Asset Value, Beginning of Year | $13.10 | $11.30 | $11.19 | $11.21 | $10.64 | |||||||||||||||
Income (loss) from investment operations: | ||||||||||||||||||||
Net investment income (loss) | 0.56 | 0.24 | 0.23 | 0.27 | 0.25 | |||||||||||||||
| Net realized and unrealized gain (loss) on investment transactions | (1.08 | ) | 1.85 | 0.44 | 0.17 | 0.51 | ||||||||||||||
Total from investment operations | (0.52 | ) | 2.09 | 0.67 | 0.44 | 0.76 | ||||||||||||||
Less Dividends and Distributions: | ||||||||||||||||||||
Dividends from net investment income | (0.84 | ) | (0.19 | ) | (0.29 | ) | (0.28 | ) | (0.19 | ) | ||||||||||
Distributions from net realized gains | (0.47 | ) | (0.10 | ) | (0.27 | ) | (0.18 | ) | (- | )(b) | ||||||||||
Total dividends and distributions | (1.31 | ) | (0.29 | ) | (0.56 | ) | (0.46 | ) | (0.19 | ) | ||||||||||
Net asset value, end of year | $11.27 | $13.10 | $11.30 | $11.19 | $11.21 | |||||||||||||||
Total Return(c): | (4.70 | )% | 18.75 | % | 5.96 | % | 4.55 | % | 7.13 | % | ||||||||||
| ||||||||||||||||||||
Ratios/Supplemental Data: | ||||||||||||||||||||
Net assets, end of year (000) | $71,290 | $80,212 | $62,135 | $40,932 | $25,880 | |||||||||||||||
Average net assets (000) | $82,904 | $79,030 | $47,867 | $35,028 | $20,307 | |||||||||||||||
Ratios to average net assets(d): | ||||||||||||||||||||
Expenses after waivers and/or expense reimbursement(e) | 0.00 | % | 0.00 | % | 0.00 | % | 0.00 | % | 0.00 | % | ||||||||||
| Expenses after waivers and/or reimbursement inclusive of excess expense reimbursement from the manager | 0.01 | % | 0.00 | %(b) | (0.00 | )%(b) | (0.01 | )% | (0.09 | )% | ||||||||||
Expenses before waivers and/or expense reimbursement | 0.19 | % | 0.20 | % | 0.40 | % | 0.51 | % | 0.70 | % | ||||||||||
Net investment income (loss) | 4.62 | % | 1.94 | % | 2.09 | % | 2.52 | % | 2.29 | % | ||||||||||
Portfolio turnover rate(f) | 58 | % | 44 | % | 57 | % | 35 | % | 37 | % | ||||||||||
| (a) | Calculated based on average shares outstanding during the year. |
| (b) | Amount rounds to zero. |
| (c) | Total return is calculated assuming a purchase of a share on the first day and a sale on the last day of each year reported and includes reinvestment of dividends and distributions, if any. Total returns may reflect adjustments to conform to GAAP. |
| (d) | Does not include expenses of the underlying funds in which the Fund invests. Expenses waived/reimbursed include those of underlying funds in which the Fund invests. Consequently, the amount waived/reimbursed may be greater than the expense ratio reflected in the financial highlights. |
| (e) | As a result of reimbursing expenses, including underlying fund expenses, the Manager may reimburse amounts in excess of the respective share classes’ operating expenses. |
| (f) | The Fund’s portfolio turnover rate is calculated in accordance with regulatory requirements, without regard to transactions involving short-term investments, certain derivatives and in-kind transactions (if any). If such transactions were included, the Fund’s portfolio turnover rate may be higher. |
See Notes to Financial Statements.
112
Prudential Day One 2030 Fund
Schedule of Investments
as of July 31, 2022
Description | Shares | Value | ||||||
LONG-TERM INVESTMENTS 94.2% | ||||||||
AFFILIATED MUTUAL FUNDS | ||||||||
PGIM Core Conservative Bond Fund (Class R6) | 525,468 | $ | 4,808,029 | |||||
PGIM Global Real Estate Fund (Class R6) | 173,747 | 3,556,595 | ||||||
PGIM Jennison Small-Cap Core Equity Fund (Class R6) | 163,949 | 2,013,289 | ||||||
PGIM Quant Solutions Commodity Strategies Fund (Class R6) | 298,447 | 3,142,645 | ||||||
PGIM Quant Solutions Emerging Markets Equity Fund (Class R6) | 79,052 | 841,903 | ||||||
PGIM Quant Solutions International Developed Markets Index Fund (Class R6) | 626,804 | 7,546,714 | ||||||
PGIM Quant Solutions Large-Cap Core Fund (Class R6) | 806,954 | 14,081,345 | ||||||
PGIM Quant Solutions Mid-Cap Core Fund (Class R6) | 188,092 | 2,021,988 | ||||||
PGIM Quant Solutions US Broad Market Index Fund (Class R6) | 494,107 | 8,320,768 | ||||||
PGIM TIPS Fund (Class R6) | 1,168,485 | 11,030,502 | ||||||
PGIM Total Return Bond Fund (Class R6) | 768,333 | 9,780,876 | ||||||
|
| |||||||
TOTAL LONG-TERM INVESTMENTS | 67,144,654 | |||||||
|
| |||||||
SHORT-TERM INVESTMENT 5.6% | ||||||||
AFFILIATED MUTUAL FUND | ||||||||
PGIM Core Ultra Short Bond Fund | ||||||||
(cost $4,016,555) | 4,016,555 | 4,016,555 | ||||||
|
| |||||||
TOTAL INVESTMENTS 99.8% | ||||||||
(cost $65,471,697)(wd) | 71,161,209 | |||||||
Other assets in excess of liabilities 0.2% | 128,112 | |||||||
|
| |||||||
NET ASSETS 100.0% | $ | 71,289,321 | ||||||
|
| |||||||
Below is a list of the abbreviation(s) used in the annual report:
LIBOR—London Interbank Offered Rate
TIPS—Treasury Inflation-Protected Securities
| (wd) | PGIM Investments LLC, the manager of the Fund, also serves as the manager of the underlying funds in which the Fund invests. |
Fair Value Measurements:
Various inputs are used in determining the value of the Fund’s investments. These inputs are summarized in the three broad levels listed below.
Level 1—unadjusted quoted prices generally in active markets for identical securities.
Level 2—quoted prices for similar securities, interest rates and yield curves, prepayment speeds, foreign currency exchange rates and other observable inputs.
Level 3—unobservable inputs for securities valued in accordance with Board approved fair valuation procedures.
See Notes to Financial Statements.
Prudential Day One Funds 113
Prudential Day One 2030 Fund
Schedule of Investments (continued)
as of July 31, 2022
The following is a summary of the inputs used as of July 31, 2022 in valuing such portfolio securities:
| Level 1 | Level 2 | Level 3 | ||||||||||
Investments in Securities | ||||||||||||
Assets | ||||||||||||
Long-Term Investments | ||||||||||||
Affiliated Mutual Funds | $ | 67,144,654 | $— | $— | ||||||||
Short-Term Investment | ||||||||||||
| Affiliated Mutual Fund | 4,016,555 | — | — | |||||||||
Total | $ | 71,161,209 | $— | $— | ||||||||
|
|
|
|
|
| |||||||
Investment Allocation:
The investment allocation of portfolio holdings and other assets in excess of liabilities shown as a percentage of net assets as of July 31, 2022 were as follows:
Large Cap | 19.8 | % | ||
TIPS | 15.5 | |||
Total Return Bond | 13.7 | |||
Broad Market | 11.7 | |||
International Developed Markets | 10.6 | |||
Core Bond | 6.7 | |||
Short Term | 5.6 | |||
Real Estate | 5.0 | |||
Commodity | 4.4 |
Mid Cap | 2.8 | % | ||
Small Cap | 2.8 | |||
Emerging Markets | 1.2 | |||
|
| |||
| 99.8 | ||||
Other assets in excess of liabilities | 0.2 | |||
|
| |||
| 100.0 | % | |||
|
| |||
See Notes to Financial Statements.
114
Prudential Day One 2030 Fund
Statement of Assets & Liabilities
as of July 31, 2022
Assets | ||||||
Affiliated investments (cost $65,471,697) | $ | 71,161,209 | ||||
Receivable for investments sold | 744,203 | |||||
Receivable for Fund shares sold | 14,251 | |||||
Due from Manager | 10,930 | |||||
Prepaid expenses | 67 | |||||
|
| |||||
Total Assets | 71,930,660 | |||||
|
| |||||
Liabilities
| ||||||
Payable for investments purchased | 573,175 | |||||
Accrued expenses and other liabilities | 46,042 | |||||
Payable for Fund shares purchased | 20,673 | |||||
Trustees’ fees payable | 893 | |||||
Affiliated transfer agent fee payable | 364 | |||||
Distribution fee payable | 192 | |||||
|
| |||||
Total Liabilities | 641,339 | |||||
|
| |||||
Net Assets | $ | 71,289,321 | ||||
|
| |||||
Net assets were comprised of: | ||||||
Shares of beneficial interest, at par | $ | 5,944 | ||||
Paid-in capital in excess of par | 66,600,123 | |||||
Total distributable earnings (loss) | 4,683,254 | |||||
|
| |||||
Net assets, July 31, 2022 | $ | 71,289,321 | ||||
|
| |||||
See Notes to Financial Statements.
Prudential Day One Funds 115
Prudential Day One 2030 Fund
Statement of Assets & Liabilities (continued)
as of July 31, 2022
Class R1 | ||||
Net asset value, offering price and redemption price per share, | $ | 11.92 | ||
|
| |||
Class R2 | ||||
Net asset value, offering price and redemption price per share, | $ | 11.95 | ||
|
| |||
Class R3 | ||||
Net asset value, offering price and redemption price per share, | $ | 11.95 | ||
|
| |||
Class R4 | ||||
Net asset value, offering price and redemption price per share, | $ | 11.94 | ||
|
| |||
Class R5 | ||||
Net asset value, offering price and redemption price per share, | $ | 11.97 | ||
|
| |||
Class R6 | ||||
Net asset value, offering price and redemption price per share, | $ | 12.00 | ||
|
| |||
Net asset value per share may not recalculate due to rounding.
See Notes to Financial Statements.
116
Prudential Day One 2030 Fund
Statement of Operations
Year Ended July 31, 2022
Net Investment Income (Loss) | ||||
Affiliated dividend income | $ | 3,493,507 | ||
|
| |||
Expenses | ||||
Management fee | 16,731 | |||
Distribution fee(a) | 14,408 | |||
Shareholder servicing fees (including affiliated expense of $4,494)(a) | 4,494 | |||
Custodian and accounting fees | 63,489 | |||
Registration fees(a) | 25,253 | |||
Legal fees and expenses | 21,001 | |||
Audit fee | 17,500 | |||
Transfer agent’s fees and expenses (including affiliated expense of $13,140)(a) | 16,765 | |||
Trustees’ fees | 10,909 | |||
Shareholders’ reports | 8,759 | |||
Pricing fees | 2,974 | |||
Miscellaneous | 14,066 | |||
|
| |||
Total expenses | 216,349 | |||
Less: Fee waiver and/or expense reimbursement(a) | (183,762 | ) | ||
|
| |||
Net expenses | 32,587 | |||
|
| |||
Net investment income (loss) | 3,460,920 | |||
|
| |||
Realized And Unrealized Gain (Loss) On Affiliated Investments | ||||
Net realized gain (loss) on investment transactions | (902,373 | ) | ||
Net capital gain distributions received | 5,457,059 | |||
|
| |||
| 4,554,686 | ||||
|
| |||
Net change in unrealized appreciation (depreciation) on investments | (12,500,339 | ) | ||
|
| |||
Net gain (loss) on investment transactions | (7,945,653 | ) | ||
|
| |||
Net Increase (Decrease) In Net Assets Resulting From Operations | $ | (4,484,733 | ) | |
|
| |||
| (a) | Class specific expenses and waivers were as follows: |
| Class R1 | Class R2 | Class R3 | Class R4 | Class R5 | Class R6 | |||||||||||||||||||
Distribution fee | 291 | 12,720 | 1,397 | — | — | — | ||||||||||||||||||
Shareholder servicing fees | 26 | 4,454 | — | 14 | — | — | ||||||||||||||||||
Registration fees | 3,675 | 4,676 | 3,676 | 3,676 | 3,676 | 5,874 | ||||||||||||||||||
Transfer agent’s fees and expenses | 221 | 7,858 | 214 | 83 | 6,004 | 2,385 | ||||||||||||||||||
Fee waiver and/or expense reimbursement | (3,886 | ) | (13,539 | ) | (3,068 | ) | (3,757 | ) | (11,293 | ) | (148,219 | ) | ||||||||||||
See Notes to Financial Statements.
Prudential Day One Funds 117
Prudential Day One 2030 Fund
Statements of Changes in Net Assets
| Year Ended July 31, | ||||||||
| 2022 | 2021 | |||||||
Increase (Decrease) in Net Assets | ||||||||
Operations | ||||||||
Net investment income (loss) | $ | 3,460,920 | $ | 1,399,527 | ||||
Net realized gain (loss) on investment transactions | (902,373 | ) | 1,162,274 | |||||
Net capital gain distributions received | 5,457,059 | 452,612 | ||||||
Net change in unrealized appreciation (depreciation) on investments | (12,500,339 | ) | 13,087,317 | |||||
|
|
|
| |||||
Net increase (decrease) in net assets resulting from operations | (4,484,733 | ) | 16,101,730 | |||||
|
|
|
| |||||
Dividends and Distributions | ||||||||
Distributions from distributable earnings | ||||||||
Class R1 | (4,666 | ) | (770 | ) | ||||
Class R2 | (625,131 | ) | (107,950 | ) | ||||
Class R3 | (114,735 | ) | (56,315 | ) | ||||
Class R4 | (2,155 | ) | (352 | ) | ||||
Class R5 | (327,886 | ) | (77,457 | ) | ||||
Class R6 | (6,412,830 | ) | (1,538,097 | ) | ||||
|
|
|
| |||||
| (7,487,403 | ) | (1,780,941 | ) | |||||
|
|
|
| |||||
Fund share transactions | ||||||||
Net proceeds from shares sold | 17,485,548 | 33,959,813 | ||||||
Net asset value of shares issued in reinvestment of dividends and distributions | 7,487,403 | 1,780,941 | ||||||
Cost of shares purchased | (27,641,160 | ) | (26,022,590 | ) | ||||
|
|
|
| |||||
Net increase (decrease) in net assets from Fund share transactions | (2,668,209 | ) | 9,718,164 | |||||
|
|
|
| |||||
Total increase (decrease) | (14,640,345 | ) | 24,038,953 | |||||
Net Assets: | ||||||||
Beginning of year | 85,929,666 | 61,890,713 | ||||||
|
|
|
| |||||
End of year | $ | 71,289,321 | $ | 85,929,666 | ||||
|
|
|
| |||||
See Notes to Financial Statements.
118
Prudential Day One 2030 Fund
Financial Highlights
Class R1 Shares | ||||||||||||||||||||
Year Ended July 31, | ||||||||||||||||||||
| 2022 | 2021 | 2020 | 2019 | 2018 | ||||||||||||||||
Per Share Operating Performance(a): | ||||||||||||||||||||
Net Asset Value, Beginning of Year | $13.72 | $11.48 | $11.45 | $11.53 | $10.74 | |||||||||||||||
Income (loss) from investment operations: | ||||||||||||||||||||
Net investment income (loss) | 0.43 | 0.13 | 0.17 | 0.18 | 0.14 | |||||||||||||||
Net realized and unrealized gain (loss) on investment transactions | (1.15 | ) | 2.32 | 0.41 | 0.13 | 0.77 | ||||||||||||||
Total from investment operations | (0.72 | ) | 2.45 | 0.58 | 0.31 | 0.91 | ||||||||||||||
Less Dividends and Distributions: | ||||||||||||||||||||
Dividends from net investment income | (0.79 | ) | (0.11 | ) | (0.20 | ) | (0.22 | ) | (0.12 | ) | ||||||||||
Distributions from net realized gains | (0.29 | ) | (0.10 | ) | (0.35 | ) | (0.17 | ) | (- | )(b) | ||||||||||
Total dividends and distributions | (1.08 | ) | (0.21 | ) | (0.55 | ) | (0.39 | ) | (0.12 | ) | ||||||||||
Net asset value, end of year | $11.92 | $13.72 | $11.48 | $11.45 | $11.53 | |||||||||||||||
Total Return(c): | (5.94 | )% | 21.50 | % | 5.04 | % | 3.18 | % | 8.47 | % | ||||||||||
Ratios/Supplemental Data: | ||||||||||||||||||||
Net assets, end of year (000) | $59 | $55 | $38 | $33 | $27 | |||||||||||||||
Average net assets (000) | $58 | $48 | $36 | $30 | $15 | |||||||||||||||
Ratios to average net assets(d): | ||||||||||||||||||||
Expenses after waivers and/or expense reimbursement | 0.75 | % | 0.74 | % | 0.74 | % | 0.74 | % | 0.66 | % | ||||||||||
Expenses before waivers and/or expense reimbursement | 7.42 | % | 14.75 | % | 37.24 | % | 40.10 | % | 84.71 | % | ||||||||||
Net investment income (loss) | 3.37 | % | 1.05 | % | 1.54 | % | 1.62 | % | 1.29 | % | ||||||||||
Portfolio turnover rate(e) | 56 | % | 46 | % | 55 | % | 36 | % | 36 | % | ||||||||||
| (a) | Calculated based on average shares outstanding during the year. |
| (b) | Amount rounds to zero. |
| (c) | Total return is calculated assuming a purchase of a share on the first day and a sale on the last day of each year reported and includes reinvestment of dividends and distributions, if any. Total returns may reflect adjustments to conform to GAAP. |
| (d) | Does not include expenses of the underlying funds in which the Fund invests. Expenses waived/reimbursed include those of underlying funds in which the Fund invests. Consequently, the amount waived/reimbursed may be greater than the expense ratio reflected in the financial highlights. |
| (e) | The Fund’s portfolio turnover rate is calculated in accordance with regulatory requirements, without regard to transactions involving short-term investments, certain derivatives and in-kind transactions (if any). If such transactions were included, the Fund’s portfolio turnover rate may be higher. |
See Notes to Financial Statements.
Prudential Day One Funds 119
Prudential Day One 2030 Fund
Financial Highlights (continued)
Class R2 Shares | ||||||||||||||||||||
| Year Ended July 31, | ||||||||||||||||||||
| 2022 | 2021 | 2020 | 2019 | 2018 | ||||||||||||||||
Per Share Operating Performance(a): | ||||||||||||||||||||
Net Asset Value, Beginning of Year | $13.74 | $11.50 | $11.47 | $11.55 | $10.75 | |||||||||||||||
Income (loss) from investment operations: | ||||||||||||||||||||
Net investment income (loss) | 0.58 | 0.16 | 0.16 | 0.21 | 0.11 | |||||||||||||||
Net realized and unrealized gain (loss) on investment transactions | (1.26 | ) | 2.31 | 0.45 | 0.13 | 0.83 | ||||||||||||||
Total from investment operations | (0.68 | ) | 2.47 | 0.61 | 0.34 | 0.94 | ||||||||||||||
Less Dividends and Distributions: | ||||||||||||||||||||
Dividends from net investment income | (0.82 | ) | (0.13 | ) | (0.23 | ) | (0.25 | ) | (0.14 | ) | ||||||||||
Distributions from net realized gains | (0.29 | ) | (0.10 | ) | (0.35 | ) | (0.17 | ) | (- | )(b) | ||||||||||
Total dividends and distributions | (1.11 | ) | (0.23 | ) | (0.58 | ) | (0.42 | ) | (0.14 | ) | ||||||||||
Net asset value, end of year | $11.95 | $13.74 | $11.50 | $11.47 | $11.55 | |||||||||||||||
Total Return(c): | (5.69 | )% | 21.83 | % | 5.29 | % | 3.46 | % | 8.81 | % | ||||||||||
Ratios/Supplemental Data: | ||||||||||||||||||||
Net assets, end of year (000) | $299 | $7,308 | $4,896 | $3,404 | $2,637 | |||||||||||||||
Average net assets (000) | $5,088 | $6,013 | $4,148 | $3,149 | $883 | |||||||||||||||
Ratios to average net assets(d): | ||||||||||||||||||||
Expenses after waivers and/or expense reimbursement | 0.49 | % | 0.49 | % | 0.49 | % | 0.49 | % | 0.47 | % | ||||||||||
Expenses before waivers and/or expense reimbursement | 0.76 | % | 0.84 | % | 1.25 | % | 1.40 | % | 2.63 | % | ||||||||||
Net investment income (loss) | 4.39 | % | 1.29 | % | 1.42 | % | 1.87 | % | 0.99 | % | ||||||||||
Portfolio turnover rate(e) | 56 | % | 46 | % | 55 | % | 36 | % | 36 | % | ||||||||||
| (a) | Calculated based on average shares outstanding during the year. |
| (b) | Amount rounds to zero. |
| (c) | Total return is calculated assuming a purchase of a share on the first day and a sale on the last day of each year reported and includes reinvestment of dividends and distributions, if any. Total returns may reflect adjustments to conform to GAAP. |
| (d) | Does not include expenses of the underlying funds in which the Fund invests. Expenses waived/reimbursed include those of underlying funds in which the Fund invests. Consequently, the amount waived/reimbursed may be greater than the expense ratio reflected in the financial highlights. |
| (e) | The Fund’s portfolio turnover rate is calculated in accordance with regulatory requirements, without regard to transactions involving short-term investments, certain derivatives and in-kind transactions (if any). If such transactions were included, the Fund’s portfolio turnover rate may be higher. |
See Notes to Financial Statements.
120
Prudential Day One 2030 Fund
Financial Highlights (continued)
Class R3 Shares | ||||||||||||||||||||
| Year Ended July 31, | ||||||||||||||||||||
| 2022 | 2021 | 2020 | 2019 | 2018 | ||||||||||||||||
Per Share Operating Performance(a): | ||||||||||||||||||||
Net Asset Value, Beginning of Year | $13.75 | $11.50 | $11.47 | $11.55 | $10.76 | |||||||||||||||
Income (loss) from investment operations: | ||||||||||||||||||||
Net investment income (loss) | 0.47 | 0.18 | 0.19 | 0.21 | 0.21 | |||||||||||||||
Net realized and unrealized gain (loss) on investment transactions | (1.13 | ) | 2.32 | 0.44 | 0.15 | 0.74 | ||||||||||||||
Total from investment operations | (0.66 | ) | 2.50 | 0.63 | 0.36 | 0.95 | ||||||||||||||
Less Dividends and Distributions: | ||||||||||||||||||||
Dividends from net investment income | (0.85 | ) | (0.15 | ) | (0.25 | ) | (0.27 | ) | (0.16 | ) | ||||||||||
Distributions from net realized gains | (0.29 | ) | (0.10 | ) | (0.35 | ) | (0.17 | ) | (- | )(b) | ||||||||||
Total dividends and distributions | (1.14 | ) | (0.25 | ) | (0.60 | ) | (0.44 | ) | (0.16 | ) | ||||||||||
Net asset value, end of year | $11.95 | $13.75 | $11.50 | $11.47 | $11.55 | |||||||||||||||
Total Return(c): | (5.55 | )% | 22.00 | % | 5.44 | % | 3.63 | % | 8.86 | % | ||||||||||
Ratios/Supplemental Data: | ||||||||||||||||||||
Net assets, end of year (000) | $1,341 | $3,414 | $2,416 | $1,349 | $728 | |||||||||||||||
Average net assets (000) | $1,397 | $2,857 | $1,832 | $1,018 | $440 | |||||||||||||||
Ratios to average net assets(d): | ||||||||||||||||||||
Expenses after waivers and/or expense reimbursement | 0.35 | % | 0.34 | % | 0.34 | % | 0.34 | % | 0.29 | % | ||||||||||
Expenses before waivers and/or expense reimbursement | 0.57 | % | 0.78 | % | 1.50 | % | 2.03 | % | 4.05 | % | ||||||||||
Net investment income (loss) | 3.71 | % | 1.45 | % | 1.67 | % | 1.93 | % | 1.81 | % | ||||||||||
Portfolio turnover rate(e) | 56 | % | 46 | % | 55 | % | 36 | % | 36 | % | ||||||||||
| (a) | Calculated based on average shares outstanding during the year. |
| (b) | Amount rounds to zero. |
| (c) | Total return is calculated assuming a purchase of a share on the first day and a sale on the last day of each year reported and includes reinvestment of dividends and distributions, if any. Total returns may reflect adjustments to conform to GAAP. |
| (d) | Does not include expenses of the underlying funds in which the Fund invests. Expenses waived/reimbursed include those of underlying funds in which the Fund invests. Consequently, the amount waived/reimbursed may be greater than the expense ratio reflected in the financial highlights. |
| (e) | The Fund’s portfolio turnover rate is calculated in accordance with regulatory requirements, without regard to transactions involving short-term investments, certain derivatives and in-kind transactions (if any). If such transactions were included, the Fund’s portfolio turnover rate may be higher. |
See Notes to Financial Statements.
Prudential Day One Funds 121
Prudential Day One 2030 Fund
Financial Highlights (continued)
Class R4 Shares | ||||||||||||||||||||
| Year Ended July 31, | ||||||||||||||||||||
| 2022 | 2021 | 2020 | 2019 | 2018 | ||||||||||||||||
Per Share Operating Performance(a): | ||||||||||||||||||||
Net Asset Value, Beginning of Year | $13.74 | $11.49 | $11.46 | $11.56 | $10.77 | |||||||||||||||
Income (loss) from investment operations: | ||||||||||||||||||||
Net investment income (loss) | 0.48 | 0.19 | 0.23 | 0.29 | 0.20 | |||||||||||||||
Net realized and unrealized gain (loss) on investment transactions | (1.13 | ) | 2.32 | 0.41 | 0.06 | 0.76 | ||||||||||||||
Total from investment operations | (0.65 | ) | 2.51 | 0.64 | 0.35 | 0.96 | ||||||||||||||
Less Dividends and Distributions: | ||||||||||||||||||||
Dividends from net investment income | (0.86 | ) | (0.16 | ) | (0.26 | ) | (0.28 | ) | (0.17 | ) | ||||||||||
Distributions from net realized gains | (0.29 | ) | (0.10 | ) | (0.35 | ) | (0.17 | ) | (- | )(b) | ||||||||||
Total dividends and distributions | (1.15 | ) | (0.26 | ) | (0.61 | ) | (0.45 | ) | (0.17 | ) | ||||||||||
Net asset value, end of year | $11.94 | $13.74 | $11.49 | $11.46 | $11.56 | |||||||||||||||
Total Return(c): | (5.47 | )% | 22.12 | % | 5.58 | % | 3.56 | % | 8.98 | % | ||||||||||
Ratios/Supplemental Data: | ||||||||||||||||||||
Net assets, end of year (000) | $31 | $22 | $14 | $12 | $1,114 | |||||||||||||||
Average net assets (000) | $26 | $18 | $12 | $483 | $987 | |||||||||||||||
Ratios to average net assets(d): | ||||||||||||||||||||
Expenses after waivers and/or expense reimbursement | 0.25 | % | 0.24 | % | 0.24 | % | 0.25 | % | 0.17 | % | ||||||||||
Expenses before waivers and/or expense reimbursement | 14.46 | % | 37.53 | % | 106.51 | % | 3.30 | % | 2.43 | % | ||||||||||
Net investment income (loss) | 3.79 | % | 1.54 | % | 2.01 | % | 2.58 | % | 1.82 | % | ||||||||||
Portfolio turnover rate(e) | 56 | % | 46 | % | 55 | % | 36 | % | 36 | % | ||||||||||
| (a) | Calculated based on average shares outstanding during the year. |
| (b) | Amount rounds to zero. |
| (c) | Total return is calculated assuming a purchase of a share on the first day and a sale on the last day of each year reported and includes reinvestment of dividends and distributions, if any. Total returns may reflect adjustments to conform to GAAP. |
| (d) | Does not include expenses of the underlying funds in which the Fund invests. Expenses waived/reimbursed include those of underlying funds in which the Fund invests. Consequently, the amount waived/reimbursed may be greater than the expense ratio reflected in the financial highlights. |
| (e) | The Fund’s portfolio turnover rate is calculated in accordance with regulatory requirements, without regard to transactions involving short-term investments, certain derivatives and in-kind transactions (if any). If such transactions were included, the Fund’s portfolio turnover rate may be higher. |
See Notes to Financial Statements.
122
Prudential Day One 2030 Fund
Financial Highlights (continued)
Class R5 Shares | ||||||||||||||||||||
| Year Ended July 31, | ||||||||||||||||||||
| 2022 | 2021 | 2020 | 2019 | 2018 | ||||||||||||||||
Per Share Operating Performance(a): | ||||||||||||||||||||
Net Asset Value, Beginning of Year | $13.77 | $11.52 | $11.48 | $11.57 | $10.78 | |||||||||||||||
Income (loss) from investment operations: | ||||||||||||||||||||
Net investment income (loss) | 0.51 | 0.21 | 0.25 | 0.25 | 0.15 | |||||||||||||||
Net realized and unrealized gain (loss) on investment transactions | (1.15 | ) | 2.31 | 0.41 | 0.12 | 0.82 | ||||||||||||||
Total from investment operations | (0.64 | ) | 2.52 | 0.66 | 0.37 | 0.97 | ||||||||||||||
Less Dividends and Distributions: | ||||||||||||||||||||
Dividends from net investment income | (0.87 | ) | (0.17 | ) | (0.27 | ) | (0.29 | ) | (0.18 | ) | ||||||||||
Distributions from net realized gains | (0.29 | ) | (0.10 | ) | (0.35 | ) | (0.17 | ) | (- | )(b) | ||||||||||
Total dividends and distributions | (1.16 | ) | (0.27 | ) | (0.62 | ) | (0.46 | ) | (0.18 | ) | ||||||||||
Net asset value, end of year | $11.97 | $13.77 | $11.52 | $11.48 | $11.57 | |||||||||||||||
Total Return(c): | (5.36 | )% | 22.18 | % | 5.73 | % | 3.76 | % | 9.08 | % | ||||||||||
Ratios/Supplemental Data: | ||||||||||||||||||||
Net assets, end of year (000) | $3,921 | $3,877 | $3,222 | $3,012 | $2,728 | |||||||||||||||
Average net assets (000) | $3,888 | $3,548 | $3,087 | $2,785 | $934 | |||||||||||||||
Ratios to average net assets(d): | ||||||||||||||||||||
Expenses after waivers and/or expense reimbursement | 0.15 | % | 0.14 | % | 0.14 | % | 0.14 | % | 0.12 | % | ||||||||||
Expenses before waivers and/or expense reimbursement | 0.44 | % | 0.55 | % | 1.00 | % | 1.10 | % | 2.18 | % | ||||||||||
Net investment income (loss) | 3.94 | % | 1.66 | % | 2.19 | % | 2.21 | % | 1.36 | % | ||||||||||
Portfolio turnover rate(e) | 56 | % | 46 | % | 55 | % | 36 | % | 36 | % | ||||||||||
| (a) | Calculated based on average shares outstanding during the year. |
| (b) | Amount rounds to zero. |
| (c) | Total return is calculated assuming a purchase of a share on the first day and a sale on the last day of each year reported and includes reinvestment of dividends and distributions, if any. Total returns may reflect adjustments to conform to GAAP. |
| (d) | Does not include expenses of the underlying funds in which the Fund invests. Expenses waived/reimbursed include those of underlying funds in which the Fund invests. Consequently, the amount waived/reimbursed may be greater than the expense ratio reflected in the financial highlights. |
| (e) | The Fund’s portfolio turnover rate is calculated in accordance with regulatory requirements, without regard to transactions involving short-term investments, certain derivatives and in-kind transactions (if any). If such transactions were included, the Fund’s portfolio turnover rate may be higher. |
See Notes to Financial Statements.
Prudential Day One Funds 123
Prudential Day One 2030 Fund
Financial Highlights (continued)
Class R6 Shares | ||||||||||||||||||||
| Year Ended July 31, | ||||||||||||||||||||
| 2022 | 2021 | 2020 | 2019 | 2018 | ||||||||||||||||
Per Share Operating Performance(a): | ||||||||||||||||||||
Net Asset Value, Beginning of Year | $13.80 | $11.54 | $11.50 | $11.59 | $10.79 | |||||||||||||||
Income (loss) from investment operations: | ||||||||||||||||||||
Net investment income (loss) | 0.53 | 0.23 | 0.24 | 0.25 | 0.22 | |||||||||||||||
Net realized and unrealized gain (loss) on investment transactions | (1.15 | ) | 2.32 | 0.44 | 0.14 | 0.78 | ||||||||||||||
Total from investment operations | (0.62 | ) | 2.55 | 0.68 | 0.39 | 1.00 | ||||||||||||||
Less Dividends and Distributions: | ||||||||||||||||||||
Dividends from net investment income | (0.89 | ) | (0.19 | ) | (0.29 | ) | (0.31 | ) | (0.20 | ) | ||||||||||
Distributions from net realized gains | (0.29 | ) | (0.10 | ) | (0.35 | ) | (0.17 | ) | (- | )(b) | ||||||||||
Total dividends and distributions | (1.18 | ) | (0.29 | ) | (0.64 | ) | (0.48 | ) | (0.20 | ) | ||||||||||
Net asset value, end of year | $12.00 | $13.80 | $11.54 | $11.50 | $11.59 | |||||||||||||||
Total Return(c): | (5.20 | )% | 22.40 | % | 5.87 | % | 3.93 | % | 9.33 | % | ||||||||||
Ratios/Supplemental Data: | ||||||||||||||||||||
Net assets, end of year (000) | $65,639 | $71,254 | $51,305 | $36,517 | $22,067 | |||||||||||||||
Average net assets (000) | $73,198 | $68,119 | $40,094 | $29,867 | $15,382 | |||||||||||||||
Ratios to average net assets(d): | ||||||||||||||||||||
Expenses after waivers and/or expense reimbursement(e) | 0.00 | % | 0.00 | % | 0.00 | % | 0.00 | % | 0.00 | % | ||||||||||
| Expenses after waivers and/or reimbursement inclusive of excess expense reimbursement from the manager | (0.00 | )% | (0.01 | )% | (0.01 | )% | (0.01 | )% | (0.07 | )% | ||||||||||
Expenses before waivers and/or expense reimbursement | 0.20 | % | 0.22 | % | 0.46 | % | 0.57 | % | 0.97 | % | ||||||||||
Net investment income (loss) | 4.14 | % | 1.79 | % | 2.13 | % | 2.25 | % | 1.94 | % | ||||||||||
Portfolio turnover rate(f) | 56 | % | 46 | % | 55 | % | 36 | % | 36 | % | ||||||||||
| (a) | Calculated based on average shares outstanding during the year. |
| (b) | Amount rounds to zero. |
| (c) | Total return is calculated assuming a purchase of a share on the first day and a sale on the last day of each year reported and includes reinvestment of dividends and distributions, if any. Total returns may reflect adjustments to conform to GAAP. |
| (d) | Does not include expenses of the underlying funds in which the Fund invests. Expenses waived/reimbursed include those of underlying funds in which the Fund invests. Consequently, the amount waived/reimbursed may be greater than the expense ratio reflected in the financial highlights. |
| (e) | As a result of reimbursing expenses, including underlying fund expenses, the Manager may reimburse amounts in excess of the respective share classes’ operating expenses. |
| (f) | The Fund’s portfolio turnover rate is calculated in accordance with regulatory requirements, without regard to transactions involving short-term investments, certain derivatives and in-kind transactions (if any). If such transactions were included, the Fund’s portfolio turnover rate may be higher. |
See Notes to Financial Statements.
124
Prudential Day One 2035 Fund
Schedule of Investments
as of July 31, 2022
Description | Shares | Value | ||||||
LONG-TERM INVESTMENTS 96.7% | ||||||||
AFFILIATED MUTUAL FUNDS | ||||||||
PGIM Core Conservative Bond Fund (Class R6) | 287,919 | $ | 2,634,456 | |||||
PGIM Global Real Estate Fund (Class R6) | 105,490 | 2,159,389 | ||||||
PGIM Jennison Small-Cap Core Equity Fund (Class R6) | 150,687 | 1,850,438 | ||||||
PGIM Quant Solutions Commodity Strategies Fund (Class R6) | 187,189 | 1,971,098 | ||||||
PGIM Quant Solutions Emerging Markets Equity Fund (Class R6) | 118,181 | 1,258,628 | ||||||
PGIM Quant Solutions International Developed Markets Index Fund (Class R6) | 543,122 | 6,539,183 | ||||||
PGIM Quant Solutions Large-Cap Core Fund (Class R6) | 653,627 | 11,405,794 | ||||||
PGIM Quant Solutions Mid-Cap Core Fund (Class R6) | 175,625 | 1,887,970 | ||||||
PGIM Quant Solutions US Broad Market Index Fund (Class R6) | 426,416 | 7,180,838 | ||||||
PGIM TIPS Fund (Class R6) | 554,974 | 5,238,954 | ||||||
PGIM Total Return Bond Fund (Class R6) | 430,258 | 5,477,182 | ||||||
|
| |||||||
TOTAL LONG-TERM INVESTMENTS | 47,603,930 | |||||||
|
| |||||||
SHORT-TERM INVESTMENT 3.2% | ||||||||
AFFILIATED MUTUAL FUND | ||||||||
PGIM Core Ultra Short Bond Fund | ||||||||
(cost $1,557,028) | 1,557,028 | 1,557,028 | ||||||
|
| |||||||
TOTAL INVESTMENTS 99.9% | ||||||||
(cost $44,371,508)(wd) | 49,160,958 | |||||||
Other assets in excess of liabilities 0.1% | 38,195 | |||||||
|
| |||||||
NET ASSETS 100.0% | $ | 49,199,153 | ||||||
|
| |||||||
Below is a list of the abbreviation(s) used in the annual report:
LIBOR—London Interbank Offered Rate
TIPS—Treasury Inflation-Protected Securities
| (wd) | PGIM Investments LLC, the manager of the Fund, also serves as the manager of the underlying funds in which the Fund invests. |
Fair Value Measurements:
Various inputs are used in determining the value of the Fund’s investments. These inputs are summarized in the three broad levels listed below.
Level 1—unadjusted quoted prices generally in active markets for identical securities.
Level 2—quoted prices for similar securities, interest rates and yield curves, prepayment speeds, foreign currency exchange rates and other observable inputs.
Level 3—unobservable inputs for securities valued in accordance with Board approved fair valuation procedures.
See Notes to Financial Statements.
Prudential Day One Funds 125
Prudential Day One 2035 Fund
Schedule of Investments (continued)
as of July 31, 2022
The following is a summary of the inputs used as of July 31, 2022 in valuing such portfolio securities:
| Level 1 | Level 2 | Level 3 | ||||||||||||||||||||||||||
Investments in Securities | ||||||||||||||||||||||||||||
Assets | ||||||||||||||||||||||||||||
Long-Term Investments | ||||||||||||||||||||||||||||
Affiliated Mutual Funds | $ | 47,603,930 | $ | — | $ | — | ||||||||||||||||||||||
Short-Term Investment | ||||||||||||||||||||||||||||
Affiliated Mutual Fund | 1,557,028 | — | — | |||||||||||||||||||||||||
|
|
|
|
|
| |||||||||||||||||||||||
Total | $ | 49,160,958 | $ | — | $ | — | ||||||||||||||||||||||
|
|
|
|
|
| |||||||||||||||||||||||
Investment Allocation:
The investment allocation of portfolio holdings and other assets in excess of liabilities shown as a percentage of net assets as of July 31, 2022 were as follows:
Large Cap | 23.2 | % | ||
Broad Market | 14.6 | |||
International Developed Markets | 13.3 | |||
Total Return Bond | 11.1 | |||
TIPS | 10.6 | |||
Core Bond | 5.3 | |||
Real Estate | 4.4 | |||
Commodity | 4.0 | |||
Mid Cap | 3.8 |
Small Cap | 3.8 | % | ||
Short Term | 3.2 | |||
Emerging Markets | 2.6 | |||
|
| |||
| 99.9 | ||||
Other assets in excess of liabilities | 0.1 | |||
|
| |||
| 100.0 | % | |||
|
| |||
See Notes to Financial Statements.
126
Prudential Day One 2035 Fund
Statement of Assets & Liabilities
as of July 31, 2022
Assets | ||||||
Affiliated investments (cost $44,371,508) | $ | 49,160,958 | ||||
Receivable for investments sold | 455,328 | |||||
Due from Manager | 13,821 | |||||
Receivable for Fund shares sold | 7,471 | |||||
Prepaid expenses | 66 | |||||
|
| |||||
Total Assets | 49,637,644 | |||||
|
| |||||
Liabilities | ||||||
Payable for investments purchased | 391,514 | |||||
Accrued expenses and other liabilities | 44,937 | |||||
Trustees’ fees payable | 820 | |||||
Payable for Fund shares purchased | 722 | |||||
Affiliated transfer agent fee payable | 352 | |||||
Distribution fee payable | 146 | |||||
|
| |||||
Total Liabilities | 438,491 | |||||
|
| |||||
Net Assets | $ | 49,199,153 | ||||
|
| |||||
Net assets were comprised of: | ||||||
Shares of beneficial interest, at par | $ | 4,170 | ||||
Paid-in capital in excess of par | 45,286,815 | |||||
Total distributable earnings (loss) | 3,908,168 | |||||
|
| |||||
Net assets, July 31, 2022 | $ | 49,199,153 | ||||
|
| |||||
See Notes to Financial Statements.
Prudential Day One Funds 127
Prudential Day One 2035 Fund
Statement of Assets & Liabilities (continued)
as of July 31, 2022
Class R1 | ||||||||
Net asset value, offering price and redemption price per share, | $ | 11.73 | ||||||
|
| |||||||
Class R2 | ||||||||
Net asset value, offering price and redemption price per share, | $ | 11.75 | ||||||
|
| |||||||
Class R3 | ||||||||
Net asset value, offering price and redemption price per share, | $ | 11.77 | ||||||
|
| |||||||
Class R4 | ||||||||
Net asset value, offering price and redemption price per share, | $ | 11.79 | ||||||
|
| |||||||
Class R5 | ||||||||
Net asset value, offering price and redemption price per share, | $ | 11.79 | ||||||
|
| |||||||
Class R6 | ||||||||
Net asset value, offering price and redemption price per share, | $ | 11.80 | ||||||
|
| |||||||
Net asset value per share may not recalculate due to rounding.
See Notes to Financial Statements.
128
Prudential Day One 2035 Fund
Statement of Operations
Year Ended July 31, 2022
Net Investment Income (Loss) | ||||
Affiliated dividend income | $ | 2,094,324 | ||
|
| |||
Expenses | ||||
Management fee | 11,141 | |||
Distribution fee(a) | 1,959 | |||
Shareholder servicing fees (including affiliated expense of $708)(a) | 822 | |||
Custodian and accounting fees | 63,420 | |||
Registration fees(a) | 22,691 | |||
Legal fees and expenses | 20,564 | |||
Audit fee | 17,500 | |||
Trustees’ fees | 9,886 | |||
Shareholders’ reports | 9,321 | |||
Transfer agent’s fees and expenses (including affiliated expense of $3,372)(a) | 6,215 | |||
Pricing fees | 2,974 | |||
Miscellaneous | 12,810 | |||
|
| |||
Total expenses | 179,303 | |||
Less: Fee waiver and/or expense reimbursement(a) | (185,215 | ) | ||
|
| |||
Net expenses | (5,912 | ) | ||
|
| |||
Net investment income (loss) | 2,100,236 | |||
|
| |||
Realized And Unrealized Gain (Loss) On Affiliated Investments | ||||
Net realized gain (loss) on investment transactions | 753,082 | |||
Net capital gain distributions received | 4,042,769 | |||
|
| |||
| 4,795,851 | ||||
|
| |||
Net change in unrealized appreciation (depreciation) on investments | (10,560,948 | ) | ||
|
| |||
Net gain (loss) on investment transactions | (5,765,097 | ) | ||
|
| |||
Net Increase (Decrease) In Net Assets Resulting From Operations | $ | (3,664,861 | ) | |
|
| |||
| (a) | Class specific expenses and waivers were as follows: |
| Class R1 | Class R2 | Class R3 | Class R4 | Class R5 | Class R6 | |||||||||||||||||||
Distribution fee | 158 | 1,338 | 463 | — | — | — | ||||||||||||||||||
Shareholder servicing fees | — | 535 | 287 | — | — | — | ||||||||||||||||||
Registration fees | 3,666 | 4,165 | 3,665 | 3,665 | 3,665 | 3,865 | ||||||||||||||||||
Transfer agent’s fees and expenses | 193 | 2,159 | 727 | 75 | 759 | 2,302 | ||||||||||||||||||
Fee waiver and/or expense reimbursement | (3,872 | ) | (7,047 | ) | (4,787 | ) | (3,746 | ) | (4,980 | ) | (160,783 | ) | ||||||||||||
See Notes to Financial Statements.
Prudential Day One Funds 129
Prudential Day One 2035 Fund
Statements of Changes in Net Assets
| Year Ended July 31, | ||||||||||
| July 31, | ||||||||||
| 2022 | 2021 | |||||||||
Increase (Decrease) in Net Assets | ||||||||||
Operations | ||||||||||
Net investment income (loss) | $ | 2,100,236 | $ | 982,283 | ||||||
Net realized gain (loss) on investment transactions | 753,082 | 1,278,032 | ||||||||
Net capital gain distributions received | 4,042,769 | 360,334 | ||||||||
Net change in unrealized appreciation (depreciation) on investments | (10,560,948 | ) | 11,510,209 | |||||||
|
|
|
| |||||||
Net increase (decrease) in net assets resulting from operations | (3,664,861 | ) | 14,130,858 | |||||||
|
|
|
| |||||||
Dividends and Distributions | ||||||||||
Distributions from distributable earnings | ||||||||||
Class R1 | (3,686 | ) | (462 | ) | ||||||
Class R2 | (63,858 | ) | (7,066 | ) | ||||||
Class R3 | (31,195 | ) | (163,407 | ) | ||||||
Class R4 | (1,959 | ) | (300 | ) | ||||||
Class R5 | (43,940 | ) | (4,273 | ) | ||||||
Class R6 | (6,732,940 | ) | (1,177,657 | ) | ||||||
|
|
|
| |||||||
| (6,877,578 | ) | (1,353,165 | ) | |||||||
|
|
|
| |||||||
Fund share transactions | ||||||||||
Net proceeds from shares sold | 11,175,683 | 18,288,140 | ||||||||
Net asset value of shares issued in reinvestment of dividends and distributions | 6,877,578 | 1,353,165 | ||||||||
Cost of shares purchased | (22,420,206 | ) | (18,776,898 | ) | ||||||
|
|
|
| |||||||
Net increase (decrease) in net assets from Fund share transactions | (4,366,945 | ) | 864,407 | |||||||
|
|
|
| |||||||
Total increase (decrease) | (14,909,384 | ) | 13,642,100 | |||||||
Net Assets: | ||||||||||
Beginning of year | 64,108,537 | 50,466,437 | ||||||||
|
|
|
| |||||||
End of year | $ | 49,199,153 | $ | 64,108,537 | ||||||
|
|
|
| |||||||
See Notes to Financial Statements.
130
Prudential Day One 2035 Fund
Financial Highlights
Class R1 Shares | ||||||||||||||||||||
| Year Ended July 31, | ||||||||||||||||||||
| 2022 | 2021 | 2020 | 2019 | 2018 | ||||||||||||||||
Per Share Operating Performance(a): | ||||||||||||||||||||
Net Asset Value, Beginning of Year | $14.14 | $11.47 | $11.42 | $11.68 | $10.81 | |||||||||||||||
Income (loss) from investment operations: | ||||||||||||||||||||
Net investment income (loss) | 0.39 | 0.12 | 0.16 | 0.12 | 0.12 | |||||||||||||||
Net realized and unrealized gain (loss) on investment transactions | (1.17 | ) | 2.76 | 0.41 | 0.11 | 0.90 | ||||||||||||||
Total from investment operations | (0.78 | ) | 2.88 | 0.57 | 0.23 | 1.02 | ||||||||||||||
Less Dividends and Distributions: | ||||||||||||||||||||
Dividends from net investment income | (0.86 | ) | (0.11 | ) | (0.18 | ) | (0.23 | ) | (0.15 | ) | ||||||||||
Distributions from net realized gains | (0.77 | ) | (0.10 | ) | (0.34 | ) | (0.26 | ) | (- | )(b) | ||||||||||
Total dividends and distributions | (1.63 | ) | (0.21 | ) | (0.52 | ) | (0.49 | ) | (0.15 | ) | ||||||||||
Net asset value, end of year | $11.73 | $14.14 | $11.47 | $11.42 | $11.68 | |||||||||||||||
Total Return(c): | (6.67 | )% | 25.33 | % | 4.94 | % | 2.55 | % | 9.46 | % | ||||||||||
Ratios/Supplemental Data: | ||||||||||||||||||||
Net assets, end of year (000) | $31 | $32 | $25 | $24 | $12 | |||||||||||||||
Average net assets (000) | $31 | $29 | $24 | $17 | $12 | |||||||||||||||
Ratios to average net assets(d): | ||||||||||||||||||||
Expenses after waivers and/or expense reimbursement | 0.73 | % | 0.73 | % | 0.72 | % | 0.72 | % | 0.63 | % | ||||||||||
Expenses before waivers and/or expense reimbursement | 13.02 | % | 29.33 | % | 56.33 | % | 70.38 | % | 106.90 | % | ||||||||||
Net investment income (loss) | 3.02 | % | 0.91 | % | 1.44 | % | 1.03 | % | 1.04 | % | ||||||||||
Portfolio turnover rate(e) | 52 | % | 45 | % | 45 | % | 35 | % | 28 | % | ||||||||||
| (a) | Calculated based on average shares outstanding during the year. |
| (b) | Amount rounds to zero. |
| (c) | Total return is calculated assuming a purchase of a share on the first day and a sale on the last day of each year reported and includes reinvestment of dividends and distributions, if any. Total returns may reflect adjustments to conform to GAAP. |
| (d) | Does not include expenses of the underlying funds in which the Fund invests. Expenses waived/reimbursed include those of underlying funds in which the Fund invests. Consequently, the amount waived/reimbursed may be greater than the expense ratio reflected in the financial highlights. |
| (e) | The Fund’s portfolio turnover rate is calculated in accordance with regulatory requirements, without regard to transactions involving short-term investments, certain derivatives and in-kind transactions (if any). If such transactions were included, the Fund’s portfolio turnover rate may be higher. |
See Notes to Financial Statements.
Prudential Day One Funds 131
Prudential Day One 2035 Fund
Financial Highlights (continued)
Class R2 Shares | ||||||||||||||||||||
| Year Ended July 31, | ||||||||||||||||||||
| 2022 | 2021 | 2020 | 2019 | 2018 | ||||||||||||||||
Per Share Operating Performance(a): | ||||||||||||||||||||
Net Asset Value, Beginning of Year | $14.15 | $11.48 | $11.43 | $11.69 | $10.83 | |||||||||||||||
Income (loss) from investment operations: | ||||||||||||||||||||
Net investment income (loss) | 0.42 | 0.15 | 0.19 | 0.18 | 0.08 | |||||||||||||||
Net realized and unrealized gain (loss) on investment transactions | (1.16 | ) | 2.76 | 0.41 | 0.07 | 0.96 | ||||||||||||||
Total from investment operations | (0.74 | ) | 2.91 | 0.60 | 0.25 | 1.04 | ||||||||||||||
Less Dividends and Distributions: | ||||||||||||||||||||
Dividends from net investment income | (0.89 | ) | (0.14 | ) | (0.21 | ) | (0.25 | ) | (0.18 | ) | ||||||||||
Distributions from net realized gains | (0.77 | ) | (0.10 | ) | (0.34 | ) | (0.26 | ) | (- | )(b) | ||||||||||
Total dividends and distributions | (1.66 | ) | (0.24 | ) | (0.55 | ) | (0.51 | ) | (0.18 | ) | ||||||||||
Net asset value, end of year | $11.75 | $14.15 | $11.48 | $11.43 | $11.69 | |||||||||||||||
Total Return(c): | (6.36 | )% | 25.59 | % | 5.20 | % | 2.84 | % | 9.62 | % | ||||||||||
Ratios/Supplemental Data: | ||||||||||||||||||||
Net assets, end of year (000) | $546 | $526 | $324 | $353 | $352 | |||||||||||||||
Average net assets (000) | $535 | $409 | $359 | $340 | $77 | |||||||||||||||
Ratios to average net assets(d): | ||||||||||||||||||||
Expenses after waivers and/or expense reimbursement | 0.48 | % | 0.48 | % | 0.47 | % | 0.47 | % | 0.44 | % | ||||||||||
Expenses before waivers and/or expense reimbursement | 1.80 | % | 2.54 | % | 4.84 | % | 4.85 | % | 17.83 | % | ||||||||||
Net investment income (loss) | 3.25 | % | 1.13 | % | 1.66 | % | 1.60 | % | 0.70 | % | ||||||||||
Portfolio turnover rate(e) | 52 | % | 45 | % | 45 | % | 35 | % | 28 | % | ||||||||||
| (a) | Calculated based on average shares outstanding during the year. |
| (b) | Amount rounds to zero. |
| (c) | Total return is calculated assuming a purchase of a share on the first day and a sale on the last day of each year reported and includes reinvestment of dividends and distributions, if any. Total returns may reflect adjustments to conform to GAAP. |
| (d) | Does not include expenses of the underlying funds in which the Fund invests. Expenses waived/reimbursed include those of underlying funds in which the Fund invests. Consequently, the amount waived/reimbursed may be greater than the expense ratio reflected in the financial highlights. |
| (e) | The Fund’s portfolio turnover rate is calculated in accordance with regulatory requirements, without regard to transactions involving short-term investments, certain derivatives and in-kind transactions (if any). If such transactions were included, the Fund’s portfolio turnover rate may be higher. |
See Notes to Financial Statements.
132
Prudential Day One 2035 Fund
Financial Highlights (continued)
Class R3 Shares | ||||||||||||||||||||
| Year Ended July 31, | ||||||||||||||||||||
| 2022 | 2021 | 2020 | 2019 | 2018 | ||||||||||||||||
Per Share Operating Performance(a): | ||||||||||||||||||||
Net Asset Value, Beginning of Year | $14.18 | $11.50 | $11.45 | $11.71 | $10.84 | |||||||||||||||
Income (loss) from investment operations: | ||||||||||||||||||||
Net investment income (loss) | 0.30 | 0.17 | 0.20 | 0.20 | 0.17 | |||||||||||||||
Net realized and unrealized gain (loss) on investment transactions | (1.03 | ) | 2.76 | 0.42 | 0.07 | 0.89 | ||||||||||||||
Total from investment operations | (0.73 | ) | 2.93 | 0.62 | 0.27 | 1.06 | ||||||||||||||
Less Dividends and Distributions: | ||||||||||||||||||||
Dividends from net investment income | (0.91 | ) | (0.15 | ) | (0.23 | ) | (0.27 | ) | (0.19 | ) | ||||||||||
Distributions from net realized gains | (0.77 | ) | (0.10 | ) | (0.34 | ) | (0.26 | ) | (- | )(b) | ||||||||||
Total dividends and distributions | (1.68 | ) | (0.25 | ) | (0.57 | ) | (0.53 | ) | (0.19 | ) | ||||||||||
Net asset value, end of year | $11.77 | $14.18 | $11.50 | $11.45 | $11.71 | |||||||||||||||
Total Return(c): | (6.29 | )% | 25.80 | % | 5.34 | % | 3.01 | % | 9.85 | % | ||||||||||
Ratios/Supplemental Data: | ||||||||||||||||||||
Net assets, end of year (000) | $303 | $9,978 | $7,298 | $6,271 | $5,849 | |||||||||||||||
Average net assets (000) | $463 | $8,548 | $6,663 | $5,850 | $4,950 | |||||||||||||||
Ratios to average net assets(d): | ||||||||||||||||||||
Expenses after waivers and/or expense reimbursement | 0.33 | % | 0.33 | % | 0.32 | % | 0.32 | % | 0.24 | % | ||||||||||
Expenses before waivers and/or expense reimbursement | 1.36 | % | 0.70 | % | 1.11 | % | 1.31 | % | 1.58 | % | ||||||||||
Net investment income (loss) | 2.36 | % | 1.30 | % | 1.82 | % | 1.83 | % | 1.46 | % | ||||||||||
Portfolio turnover rate(e) | 52 | % | 45 | % | 45 | % | 35 | % | 28 | % | ||||||||||
| (a) | Calculated based on average shares outstanding during the year. |
| (b) | Amount rounds to zero. |
| (c) | Total return is calculated assuming a purchase of a share on the first day and a sale on the last day of each year reported and includes reinvestment of dividends and distributions, if any. Total returns may reflect adjustments to conform to GAAP. |
| (d) | Does not include expenses of the underlying funds in which the Fund invests. Expenses waived/reimbursed include those of underlying funds in which the Fund invests. Consequently, the amount waived/reimbursed may be greater than the expense ratio reflected in the financial highlights. |
| (e) | The Fund’s portfolio turnover rate is calculated in accordance with regulatory requirements, without regard to transactions involving short-term investments, certain derivatives and in-kind transactions (if any). If such transactions were included, the Fund’s portfolio turnover rate may be higher. |
See Notes to Financial Statements.
Prudential Day One Funds 133
Prudential Day One 2035 Fund
Financial Highlights (continued)
Class R4 Shares | ||||||||||||||||||||
| Year Ended July 31, | ||||||||||||||||||||
| 2022 | 2021 | 2020 | 2019 | 2018 | ||||||||||||||||
Per Share Operating Performance(a): | ||||||||||||||||||||
Net Asset Value, Beginning of Year | $14.20 | $11.51 | $11.46 | $11.72 | $10.85 | |||||||||||||||
Income (loss) from investment operations: | ||||||||||||||||||||
Net investment income (loss) | 0.46 | 0.18 | 0.22 | 0.31 | 0.17 | |||||||||||||||
Net realized and unrealized gain (loss) on investment transactions | (1.17 | ) | 2.78 | 0.41 | (0.03 | ) | 0.90 | |||||||||||||
Total from investment operations | (0.71 | ) | 2.96 | 0.63 | 0.28 | 1.07 | ||||||||||||||
Less Dividends and Distributions: | ||||||||||||||||||||
Dividends from net investment income | (0.93 | ) | (0.17 | ) | (0.24 | ) | (0.28 | ) | (0.20 | ) | ||||||||||
Distributions from net realized gains | (0.77 | ) | (0.10 | ) | (0.34 | ) | (0.26 | ) | (- | )(b) | ||||||||||
Total dividends and distributions | (1.70 | ) | (0.27 | ) | (0.58 | ) | (0.54 | ) | (0.20 | ) | ||||||||||
Net asset value, end of year | $11.79 | $14.20 | $11.51 | $11.46 | $11.72 | |||||||||||||||
Total Return(c): | (6.17 | )% | 25.98 | % | 5.43 | % | 3.12 | % | 9.96 | % | ||||||||||
Ratios/Supplemental Data: | ||||||||||||||||||||
Net assets, end of year (000) | $15 | $16 | $13 | $12 | $50 | |||||||||||||||
Average net assets (000) | $16 | $15 | $12 | $28 | $48 | |||||||||||||||
Ratios to average net assets(d): | ||||||||||||||||||||
Expenses after waivers and/or expense reimbursement | 0.23 | % | 0.23 | % | 0.22 | % | 0.21 | % | 0.13 | % | ||||||||||
Expenses before waivers and/or expense reimbursement | 23.52 | % | 44.91 | % | 106.41 | % | 41.69 | % | 27.89 | % | ||||||||||
Net investment income (loss) | 3.53 | % | 1.41 | % | 1.94 | % | 2.78 | % | 1.48 | % | ||||||||||
Portfolio turnover rate(e) | 52 | % | 45 | % | 45 | % | 35 | % | 28 | % | ||||||||||
| (a) | Calculated based on average shares outstanding during the year. |
| (b) | Amount rounds to zero. |
| (c) | Total return is calculated assuming a purchase of a share on the first day and a sale on the last day of each year reported and includes reinvestment of dividends and distributions, if any. Total returns may reflect adjustments to conform to GAAP. |
| (d) | Does not include expenses of the underlying funds in which the Fund invests. Expenses waived/reimbursed include those of underlying funds in which the Fund invests. Consequently, the amount waived/reimbursed may be greater than the expense ratio reflected in the financial highlights. |
| (e) | The Fund’s portfolio turnover rate is calculated in accordance with regulatory requirements, without regard to transactions involving short-term investments, certain derivatives and in-kind transactions (if any). If such transactions were included, the Fund’s portfolio turnover rate may be higher. |
See Notes to Financial Statements.
134
Prudential Day One 2035 Fund
Financial Highlights (continued)
Class R5 Shares | ||||||||||||||||||||
| Year Ended July 31, | ||||||||||||||||||||
| 2022 | 2021 | 2020 | 2019 | 2018 | ||||||||||||||||
Per Share Operating Performance(a): | ||||||||||||||||||||
Net Asset Value, Beginning of Year | $14.20 | $11.51 | $11.45 | $11.72 | $10.85 | |||||||||||||||
Income (loss) from investment operations: | ||||||||||||||||||||
Net investment income (loss) | 0.43 | 0.19 | 0.20 | 0.24 | 0.18 | |||||||||||||||
Net realized and unrealized gain (loss) on investment transactions | (1.13 | ) | 2.78 | 0.45 | 0.05 | 0.91 | ||||||||||||||
Total from investment operations | (0.70 | ) | 2.97 | 0.65 | 0.29 | 1.09 | ||||||||||||||
Less Dividends and Distributions: | ||||||||||||||||||||
Dividends from net investment income | (0.94 | ) | (0.18 | ) | (0.25 | ) | (0.30 | ) | (0.22 | ) | ||||||||||
Distributions from net realized gains | (0.77 | ) | (0.10 | ) | (0.34 | ) | (0.26 | ) | (- | )(b) | ||||||||||
Total dividends and distributions | (1.71 | ) | (0.28 | ) | (0.59 | ) | (0.56 | ) | (0.22 | ) | ||||||||||
Net asset value, end of year | $11.79 | $14.20 | $11.51 | $11.45 | $11.72 | |||||||||||||||
Total Return(c): | (6.08 | )% | 26.09 | % | 5.62 | % | 3.15 | % | 10.07 | % | ||||||||||
Ratios/Supplemental Data: | ||||||||||||||||||||
Net assets, end of year (000) | $542 | $314 | $147 | $95 | $33 | |||||||||||||||
Average net assets (000) | $408 | $219 | $122 | $69 | $15 | |||||||||||||||
Ratios to average net assets(d): | ||||||||||||||||||||
Expenses after waivers and/or expense reimbursement | 0.13 | % | 0.13 | % | 0.12 | % | 0.12 | % | 0.04 | % | ||||||||||
Expenses before waivers and/or expense reimbursement | 1.35 | % | 3.46 | % | 11.56 | % | 17.68 | % | 87.88 | % | ||||||||||
Net investment income (loss) | 3.38 | % | 1.47 | % | 1.81 | % | 2.16 | % | 1.54 | % | ||||||||||
Portfolio turnover rate(e) | 52 | % | 45 | % | 45 | % | 35 | % | 28 | % | ||||||||||
| (a) | Calculated based on average shares outstanding during the year. |
| (b) | Amount rounds to zero. |
| (c) | Total return is calculated assuming a purchase of a share on the first day and a sale on the last day of each year reported and includes reinvestment of dividends and distributions, if any. Total returns may reflect adjustments to conform to GAAP. |
| (d) | Does not include expenses of the underlying funds in which the Fund invests. Expenses waived/reimbursed include those of underlying funds in which the Fund invests. Consequently, the amount waived/reimbursed may be greater than the expense ratio reflected in the financial highlights. |
| (e) | The Fund’s portfolio turnover rate is calculated in accordance with regulatory requirements, without regard to transactions involving short-term investments, certain derivatives and in-kind transactions (if any). If such transactions were included, the Fund’s portfolio turnover rate may be higher. |
See Notes to Financial Statements.
Prudential Day One Funds 135
Prudential Day One 2035 Fund
Financial Highlights (continued)
Class R6 Shares | ||||||||||||||||||||
| Year Ended July 31, | ||||||||||||||||||||
| 2022 | 2021 | 2020 | 2019 | 2018 | ||||||||||||||||
Per Share Operating Performance(a): | ||||||||||||||||||||
Net Asset Value, Beginning of Year | $14.21 | $11.52 | $11.46 | $11.74 | $10.87 | |||||||||||||||
Income (loss) from investment operations: | ||||||||||||||||||||
Net investment income (loss) | 0.49 | 0.21 | 0.22 | 0.24 | 0.22 | |||||||||||||||
Net realized and unrealized gain (loss) on investment transactions | (1.17 | ) | 2.77 | 0.45 | 0.05 | 0.88 | ||||||||||||||
Total from investment operations | (0.68 | ) | 2.98 | 0.67 | 0.29 | 1.10 | ||||||||||||||
Less Dividends and Distributions: | ||||||||||||||||||||
Dividends from net investment income | (0.96 | ) | (0.19 | ) | (0.27 | ) | (0.31 | ) | (0.23 | ) | ||||||||||
Distributions from net realized gains | (0.77 | ) | (0.10 | ) | (0.34 | ) | (0.26 | ) | (- | )(b) | ||||||||||
Total dividends and distributions | (1.73 | ) | (0.29 | ) | (0.61 | ) | (0.57 | ) | (0.23 | ) | ||||||||||
Net asset value, end of year | $11.80 | $14.21 | $11.52 | $11.46 | $11.74 | |||||||||||||||
Total Return(c): | (5.94 | )% | 26.25 | % | 5.77 | % | 3.23 | % | 10.21 | % | ||||||||||
Ratios/Supplemental Data: | ||||||||||||||||||||
Net assets, end of year (000) | $47,761 | $53,243 | $42,659 | $24,312 | $15,099 | |||||||||||||||
Average net assets (000) | $54,250 | $52,063 | $28,765 | $20,031 | $11,332 | |||||||||||||||
Ratios to average net assets(d): | ||||||||||||||||||||
Expenses after waivers and/or expense reimbursement(e) | 0.00 | % | 0.00 | % | 0.00 | % | 0.00 | % | 0.00 | % | ||||||||||
| Expenses after waivers and/or reimbursement inclusive of excess expense reimbursement from the manager | (0.02 | )% | (0.02 | )% | (0.03 | )% | (0.03 | )% | (0.11 | )% | ||||||||||
Expenses before waivers and/or expense reimbursement | 0.28 | % | 0.28 | % | 0.61 | % | 0.81 | % | 1.10 | % | ||||||||||
Net investment income (loss) | 3.79 | % | 1.66 | % | 1.99 | % | 2.14 | % | 1.88 | % | ||||||||||
Portfolio turnover rate(f) | 52 | % | 45 | % | 45 | % | 35 | % | 28 | % | ||||||||||
| (a) | Calculated based on average shares outstanding during the year. |
| (b) | Amount rounds to zero. |
| (c) | Total return is calculated assuming a purchase of a share on the first day and a sale on the last day of each year reported and includes reinvestment of dividends and distributions, if any. Total returns may reflect adjustments to conform to GAAP. |
| (d) | Does not include expenses of the underlying funds in which the Fund invests. Expenses waived/reimbursed include those of underlying funds in which the Fund invests. Consequently, the amount waived/reimbursed may be greater than the expense ratio reflected in the financial highlights. |
| (e) | As a result of reimbursing expenses, including underlying fund expenses, the Manager may reimburse amounts in excess of the respective share classes’ operating expenses. |
| (f) | The Fund’s portfolio turnover rate is calculated in accordance with regulatory requirements, without regard to transactions involving short-term investments, certain derivatives and in-kind transactions (if any). If such transactions were included, the Fund’s portfolio turnover rate may be higher. |
See Notes to Financial Statements.
136
Prudential Day One 2040 Fund
Schedule of Investments
as of July 31, 2022
Description | Shares | Value | ||||||
LONG-TERM INVESTMENTS 98.5% | ||||||||
AFFILIATED MUTUAL FUNDS | ||||||||
PGIM Core Conservative Bond Fund (Class R6) | 216,392 | $ | 1,979,983 | |||||
PGIM Global Real Estate Fund (Class R6) | 88,451 | 1,810,600 | ||||||
PGIM Jennison Small-Cap Core Equity Fund (Class R6) | 165,895 | 2,037,188 | ||||||
PGIM Quant Solutions Commodity Strategies Fund (Class R6) | 172,647 | 1,817,977 | ||||||
PGIM Quant Solutions Emerging Markets Equity Fund (Class R6) | 176,081 | 1,875,267 | ||||||
PGIM Quant Solutions International Developed Markets Index Fund (Class R6) | 597,732 | 7,196,689 | ||||||
PGIM Quant Solutions Large-Cap Core Fund (Class R6) | 628,127 | 10,960,818 | ||||||
PGIM Quant Solutions Mid-Cap Core Fund (Class R6) | 252,914 | 2,718,828 | ||||||
PGIM Quant Solutions US Broad Market Index Fund (Class R6) | 419,765 | 7,068,846 | ||||||
PGIM TIPS Fund (Class R6) | 347,786 | 3,283,097 | ||||||
PGIM Total Return Bond Fund (Class R6) | 311,830 | 3,969,594 | ||||||
|
| |||||||
TOTAL LONG-TERM INVESTMENTS | 44,718,887 | |||||||
|
| |||||||
SHORT-TERM INVESTMENT 1.5% | ||||||||
AFFILIATED MUTUAL FUND | ||||||||
PGIM Core Ultra Short Bond Fund | ||||||||
(cost $667,529) | 667,529 | 667,529 | ||||||
|
| |||||||
TOTAL INVESTMENTS 100.0% | ||||||||
(cost $40,264,504)(wd) | 45,386,416 | |||||||
Liabilities in excess of other assets (0.0)% | (3,530 | ) | ||||||
|
| |||||||
NET ASSETS 100.0% | $ | 45,382,886 | ||||||
|
| |||||||
Below is a list of the abbreviation(s) used in the annual report:
LIBOR—London Interbank Offered Rate
TIPS—Treasury Inflation-Protected Securities
| (wd) | PGIM Investments LLC, the manager of the Fund, also serves as the manager of the underlying funds in which the Fund invests. |
Fair Value Measurements:
Various inputs are used in determining the value of the Fund’s investments. These inputs are summarized in the three broad levels listed below.
Level 1—unadjusted quoted prices generally in active markets for identical securities.
Level 2—quoted prices for similar securities, interest rates and yield curves, prepayment speeds, foreign currency exchange rates and other observable inputs.
Level 3—unobservable inputs for securities valued in accordance with Board approved fair valuation procedures.
See Notes to Financial Statements.
Prudential Day One Funds 137
Prudential Day One 2040 Fund
Schedule of Investments (continued)
as of July 31, 2022
The following is a summary of the inputs used as of July 31, 2022 in valuing such portfolio securities:
| Level 1 | Level 2 | Level 3 | ||||||||||
Investments in Securities | ||||||||||||
Assets | ||||||||||||
Long-Term Investments | ||||||||||||
Affiliated Mutual Funds | $ | 44,718,887 | $— | $— | ||||||||
Short-Term Investment | ||||||||||||
| Affiliated Mutual Fund | 667,529 | — | — | |||||||||
Total | $ | 45,386,416 | $— | $— | ||||||||
|
|
|
|
|
| |||||||
Investment Allocation:
The investment allocation of portfolio holdings and liabilities in excess of other assets shown as a percentage of net assets as of July 31, 2022 were as follows:
Large Cap | 24.1 | % | ||
International Developed Markets | 15.9 | |||
Broad Market | 15.6 | |||
Total Return Bond | 8.7 | |||
TIPS | 7.2 | |||
Mid Cap | 6.0 | |||
Small Cap | 4.5 | |||
Core Bond | 4.4 | |||
Emerging Markets | 4.1 | |||
Commodity | 4.0 |
Real Estate | 4.0 | % | ||
Short Term | 1.5 | |||
|
| |||
| 100.0 | ||||
Liabilities in excess of other assets | (0.0 | )* | ||
|
| |||
| 100.0 | % | |||
|
| |||
| * | Less than +/- 0.05% |
See Notes to Financial Statements.
138
Prudential Day One 2040 Fund
Statement of Assets & Liabilities
as of July 31, 2022
Assets | ||||
Affiliated investments (cost $40,264,504) | $ | 45,386,416 | ||
Receivable for investments sold | 474,314 | |||
Due from Manager | 14,480 | |||
Receivable for Fund shares sold | 6,661 | |||
Prepaid expenses | 66 | |||
|
| |||
Total Assets | 45,881,937 | |||
|
| |||
Liabilities | ||||
Payable for investments purchased | 334,133 | |||
Payable for Fund shares purchased | 117,202 | |||
Accrued expenses and other liabilities | 46,470 | |||
Trustees’ fees payable | 817 | |||
Affiliated transfer agent fee payable | 328 | |||
Distribution fee payable | 101 | |||
|
| |||
Total Liabilities | 499,051 | |||
|
| |||
Net Assets | $ | 45,382,886 | ||
|
| |||
Net assets were comprised of: | ||||
Shares of beneficial interest, at par | $ | 3,654 | ||
Paid-in capital in excess of par | 40,592,847 | |||
Total distributable earnings (loss) | 4,786,385 | |||
|
| |||
Net assets, July 31, 2022 | $ | 45,382,886 | ||
|
| |||
See Notes to Financial Statements.
Prudential Day One Funds 139
Prudential Day One 2040 Fund
Statement of Assets & Liabilities (continued)
as of July 31, 2022
Class R1 | ||||
Net asset value, offering price and redemption price per share, | $ | 12.34 | ||
|
| |||
Class R2 | ||||
Net asset value, offering price and redemption price per share, | $ | 12.36 | ||
|
| |||
Class R3 | ||||
Net asset value, offering price and redemption price per share, | $ | 12.38 | ||
|
| |||
Class R4 | ||||
Net asset value, offering price and redemption price per share, | $ | 12.40 | ||
|
| |||
Class R5 | ||||
Net asset value, offering price and redemption price per share, | $ | 12.41 | ||
|
| |||
Class R6 | ||||
Net asset value, offering price and redemption price per share, | $ | 12.42 | ||
|
| |||
Net asset value per share may not recalculate due to rounding.
See Notes to Financial Statements.
140
Prudential Day One 2040 Fund
Statement of Operations
Year Ended July 31, 2022
Net Investment Income (Loss) | ||||
Affiliated dividend income | $ | 2,065,531 | ||
|
| |||
Expenses | ||||
Management fee | 11,416 | |||
Distribution fee(a) | 11,260 | |||
Shareholder servicing fees (including affiliated expense of $3,854)(a) | 3,854 | |||
Custodian and accounting fees | 63,423 | |||
Registration fees(a) | 22,195 | |||
Legal fees and expenses | 20,572 | |||
Transfer agent’s fees and expenses (including affiliated expense of $15,039)(a) | 20,286 | |||
Audit fee | 17,500 | |||
Trustees’ fees | 9,921 | |||
Shareholders’ reports | 8,036 | |||
Pricing fees | 2,986 | |||
Miscellaneous | 12,585 | |||
|
| |||
Total expenses | 204,034 | |||
Less: Fee waiver and/or expense reimbursement(a) | (197,262 | ) | ||
|
| |||
Net expenses | 6,772 | |||
|
| |||
Net investment income (loss) | 2,058,759 | |||
|
| |||
Realized And Unrealized Gain (Loss) On Affiliated Investments | ||||
Net realized gain (loss) on investment transactions | (402,809 | ) | ||
Net capital gain distributions received | 4,687,103 | |||
|
| |||
| 4,284,294 | ||||
|
| |||
Net change in unrealized appreciation (depreciation) on investments | (10,111,836 | ) | ||
|
| |||
Net gain (loss) on investment transactions | (5,827,542 | ) | ||
|
| |||
Net Increase (Decrease) In Net Assets Resulting From Operations | $ | (3,768,783 | ) | |
|
| |||
| (a) | Class specific expenses and waivers were as follows: |
| Class R1 | Class R2 | Class R3 | Class R4 | Class R5 | Class R6 | |||||||||||||||||||
Distribution fee | 185 | 10,413 | 662 | — | — | — | ||||||||||||||||||
Shareholder servicing fees | 4 | 3,822 | — | 28 | — | — | ||||||||||||||||||
Registration fees | 3,666 | 3,666 | 3,666 | 3,666 | 3,666 | 3,865 | ||||||||||||||||||
Transfer agent’s fees and expenses | 115 | 6,741 | 284 | 120 | 10,948 | 2,078 | ||||||||||||||||||
Fee waiver and/or expense reimbursement | (3,806 | ) | (15,986 | ) | (4,317 | ) | (3,838 | ) | (25,588 | ) | (143,727 | ) | ||||||||||||
See Notes to Financial Statements.
Prudential Day One Funds 141
Prudential Day One 2040 Fund
Statements of Changes in Net Assets
| Year Ended July 31, | ||||||||
| 2022 | 2021 | |||||||
Increase (Decrease) in Net Assets | ||||||||
Operations | ||||||||
Net investment income (loss) | $ | 2,058,759 | $ | 824,811 | ||||
Net realized gain (loss) on investment transactions | (402,809 | ) | 997,236 | |||||
Net capital gain distributions received | 4,687,103 | 328,445 | ||||||
Net change in unrealized appreciation (depreciation) on investments | (10,111,836 | ) | 11,962,706 | |||||
|
|
|
| |||||
Net increase (decrease) in net assets resulting from operations | (3,768,783 | ) | 14,113,198 | |||||
|
|
|
| |||||
Dividends and Distributions | ||||||||
Distributions from distributable earnings | ||||||||
Class R1 | (3,376 | ) | (415 | ) | ||||
Class R2 | (602,390 | ) | (74,226 | ) | ||||
Class R3 | (57,666 | ) | (57,765 | ) | ||||
Class R4 | (3,749 | ) | (470 | ) | ||||
Class R5 | (689,048 | ) | (135,338 | ) | ||||
Class R6 | (4,467,114 | ) | (902,712 | ) | ||||
|
|
|
| |||||
| (5,823,343 | ) | (1,170,926 | ) | |||||
|
|
|
| |||||
Fund share transactions | ||||||||
Net proceeds from shares sold | 12,328,455 | 18,021,024 | ||||||
Net asset value of shares issued in reinvestment of dividends and distributions | 5,823,291 | 1,170,926 | ||||||
Cost of shares purchased | (23,320,467 | ) | (15,164,542 | ) | ||||
|
|
|
| |||||
Net increase (decrease) in net assets from Fund share transactions | (5,168,721 | ) | 4,027,408 | |||||
|
|
|
| |||||
Total increase (decrease) | (14,760,847 | ) | 16,969,680 | |||||
Net Assets: | ||||||||
Beginning of year | 60,143,733 | 43,174,053 | ||||||
|
|
|
| |||||
End of year | $ | 45,382,886 | $ | 60,143,733 | ||||
|
|
|
| |||||
See Notes to Financial Statements.
142
Prudential Day One 2040 Fund
Financial Highlights
Class R1 Shares | ||||||||||||||||||||
| Year Ended July 31, | ||||||||||||||||||||
| 2022 | 2021 | 2020 | 2019 | 2018 | ||||||||||||||||
Per Share Operating Performance(a): | ||||||||||||||||||||
Net Asset Value, Beginning of Year | $14.54 | $11.53 | $11.61 | $11.83 | $10.90 | |||||||||||||||
Income (loss) from investment operations: | ||||||||||||||||||||
Net investment income (loss) | 0.38 | 0.10 | 0.14 | 0.15 | 0.12 | |||||||||||||||
Net realized and unrealized gain (loss) on investment transactions | (1.26 | ) | 3.11 | 0.33 | 0.05 | 0.98 | ||||||||||||||
Total from investment operations | (0.88 | ) | 3.21 | 0.47 | 0.20 | 1.10 | ||||||||||||||
Less Dividends and Distributions: | ||||||||||||||||||||
Dividends from net investment income | (0.91 | ) | (0.11 | ) | (0.18 | ) | (0.24 | ) | (0.16 | ) | ||||||||||
Distributions from net realized gains | (0.41 | ) | (0.09 | ) | (0.37 | ) | (0.18 | ) | (0.01 | ) | ||||||||||
Total dividends and distributions | (1.32 | ) | (0.20 | ) | (0.55 | ) | (0.42 | ) | (0.17 | ) | ||||||||||
Net asset value, end of year | $12.34 | $14.54 | $11.53 | $11.61 | $11.83 | |||||||||||||||
Total Return(b): | (7.02 | )% | 28.07 | % | 3.95 | % | 2.28 | % | 10.11 | % | ||||||||||
Ratios/Supplemental Data: | ||||||||||||||||||||
Net assets, end of year (000) | $39 | $34 | $22 | $16 | $13 | |||||||||||||||
Average net assets (000) | $37 | $28 | $18 | $14 | $12 | |||||||||||||||
Ratios to average net assets(c): | ||||||||||||||||||||
Expenses after waivers and/or expense reimbursement | 0.70 | % | 0.69 | % | 0.69 | % | 0.70 | % | 0.63 | % | ||||||||||
Expenses before waivers and/or expense reimbursement | 11.02 | % | 24.36 | % | 73.98 | % | 83.37 | % | 110.40 | % | ||||||||||
Net investment income (loss) | 2.81 | % | 0.78 | % | 1.29 | % | 1.31 | % | 1.04 | % | ||||||||||
Portfolio turnover rate(d) | 54 | % | 41 | % | 44 | % | 26 | % | 27 | % | ||||||||||
| (a) | Calculated based on average shares outstanding during the year. |
| (b) | Total return is calculated assuming a purchase of a share on the first day and a sale on the last day of each year reported and includes reinvestment of dividends and distributions, if any. Total returns may reflect adjustments to conform to GAAP. |
| (c) | Does not include expenses of the underlying funds in which the Fund invests. Expenses waived/reimbursed include those of underlying funds in which the Fund invests. Consequently, the amount waived/reimbursed may be greater than the expense ratio reflected in the financial highlights. |
| (d) | The Fund’s portfolio turnover rate is calculated in accordance with regulatory requirements, without regard to transactions involving short-term investments, certain derivatives and in-kind transactions (if any). If such transactions were included, the Fund’s portfolio turnover rate may be higher. |
See Notes to Financial Statements.
Prudential Day One Funds 143
Prudential Day One 2040 Fund
Financial Highlights (continued)
Class R2 Shares | ||||||||||||||||||||
| Year Ended July 31, | ||||||||||||||||||||
| 2022 | 2021 | 2020 | 2019 | 2018 | ||||||||||||||||
Per Share Operating Performance(a): | ||||||||||||||||||||
Net Asset Value, Beginning of Year | $14.57 | $11.55 | $11.63 | $11.84 | $10.92 | |||||||||||||||
Income (loss) from investment operations: | ||||||||||||||||||||
Net investment income (loss) | 0.59 | 0.14 | 0.18 | 0.17 | 0.05 | |||||||||||||||
Net realized and unrealized gain (loss) on investment transactions | (1.45 | ) | 3.11 | 0.32 | 0.07 | 1.07 | ||||||||||||||
Total from investment operations | (0.86 | ) | 3.25 | 0.50 | 0.24 | 1.12 | ||||||||||||||
Less Dividends and Distributions: | ||||||||||||||||||||
Dividends from net investment income | (0.94 | ) | (0.14 | ) | (0.21 | ) | (0.27 | ) | (0.19 | ) | ||||||||||
Distributions from net realized gains | (0.41 | ) | (0.09 | ) | (0.37 | ) | (0.18 | ) | (0.01 | ) | ||||||||||
Total dividends and distributions | (1.35 | ) | (0.23 | ) | (0.58 | ) | (0.45 | ) | (0.20 | ) | ||||||||||
Net asset value, end of year | $12.36 | $14.57 | $11.55 | $11.63 | $11.84 | |||||||||||||||
Total Return(b): | (6.85 | )% | 28.40 | % | 4.18 | % | 2.65 | % | 10.26 | % | ||||||||||
Ratios/Supplemental Data: | ||||||||||||||||||||
Net assets, end of year (000) | $169 | $5,733 | $3,501 | $2,424 | $1,157 | |||||||||||||||
Average net assets (000) | $4,165 | $4,508 | $2,845 | $1,689 | $299 | |||||||||||||||
Ratios to average net assets(c): | ||||||||||||||||||||
Expenses after waivers and/or expense reimbursement | 0.45 | % | 0.44 | % | 0.44 | % | 0.45 | % | 0.43 | % | ||||||||||
Expenses before waivers and/or expense reimbursement | 0.83 | % | 0.94 | % | 1.61 | % | 2.02 | % | 5.77 | % | ||||||||||
Net investment income (loss) | 4.25 | % | 1.02 | % | 1.57 | % | 1.50 | % | 0.43 | % | ||||||||||
Portfolio turnover rate(d) | 54 | % | 41 | % | 44 | % | 26 | % | 27 | % | ||||||||||
| (a) | Calculated based on average shares outstanding during the year. |
| (b) | Total return is calculated assuming a purchase of a share on the first day and a sale on the last day of each year reported and includes reinvestment of dividends and distributions, if any. Total returns may reflect adjustments to conform to GAAP. |
| (c) | Does not include expenses of the underlying funds in which the Fund invests. Expenses waived/reimbursed include those of underlying funds in which the Fund invests. Consequently, the amount waived/reimbursed may be greater than the expense ratio reflected in the financial highlights. |
| (d) | The Fund’s portfolio turnover rate is calculated in accordance with regulatory requirements, without regard to transactions involving short-term investments, certain derivatives and in-kind transactions (if any). If such transactions were included, the Fund’s portfolio turnover rate may be higher. |
See Notes to Financial Statements.
144
Prudential Day One 2040 Fund
Financial Highlights (continued)
Class R3 Shares | ||||||||||||||||||||
| Year Ended July 31, | ||||||||||||||||||||
| 2022 | 2021 | 2020 | 2019 | 2018 | ||||||||||||||||
Per Share Operating Performance(a): | ||||||||||||||||||||
Net Asset Value, Beginning of Year | $14.59 | $11.57 | $11.64 | $11.86 | $10.93 | |||||||||||||||
Income (loss) from investment operations: | ||||||||||||||||||||
Net investment income (loss) | 0.40 | 0.16 | 0.19 | 0.16 | 0.16 | |||||||||||||||
Net realized and unrealized gain (loss) on investment transactions | (1.23 | ) | 3.11 | 0.34 | 0.09 | 0.98 | ||||||||||||||
Total from investment operations | (0.83 | ) | 3.27 | 0.53 | 0.25 | 1.14 | ||||||||||||||
Less Dividends and Distributions: | ||||||||||||||||||||
Dividends from net investment income | (0.97 | ) | (0.16 | ) | (0.23 | ) | (0.29 | ) | (0.20 | ) | ||||||||||
Distributions from net realized gains | (0.41 | ) | (0.09 | ) | (0.37 | ) | (0.18 | ) | (0.01 | ) | ||||||||||
Total dividends and distributions | (1.38 | ) | (0.25 | ) | (0.60 | ) | (0.47 | ) | (0.21 | ) | ||||||||||
Net asset value, end of year | $12.38 | $14.59 | $11.57 | $11.64 | $11.86 | |||||||||||||||
Total Return(b): | (6.69 | )% | 28.52 | % | 4.42 | % | 2.73 | % | 10.49 | % | ||||||||||
Ratios/Supplemental Data: | ||||||||||||||||||||
Net assets, end of year (000) | $627 | $3,617 | $2,187 | $1,491 | $550 | |||||||||||||||
Average net assets (000) | $662 | $2,996 | $1,720 | $915 | $281 | |||||||||||||||
Ratios to average net assets(c): | ||||||||||||||||||||
Expenses after waivers and/or expense reimbursement | 0.30 | % | 0.29 | % | 0.29 | % | 0.30 | % | 0.26 | % | ||||||||||
Expenses before waivers and/or expense reimbursement | 0.95 | % | 0.85 | % | 1.76 | % | 2.43 | % | 6.12 | % | ||||||||||
Net investment income (loss) | 3.00 | % | 1.23 | % | 1.69 | % | 1.42 | % | 1.34 | % | ||||||||||
Portfolio turnover rate(d) | 54 | % | 41 | % | 44 | % | 26 | % | 27 | % | ||||||||||
| (a) | Calculated based on average shares outstanding during the year. |
| (b) | Total return is calculated assuming a purchase of a share on the first day and a sale on the last day of each year reported and includes reinvestment of dividends and distributions, if any. Total returns may reflect adjustments to conform to GAAP. |
| (c) | Does not include expenses of the underlying funds in which the Fund invests. Expenses waived/reimbursed include those of underlying funds in which the Fund invests. Consequently, the amount waived/reimbursed may be greater than the expense ratio reflected in the financial highlights. |
| (d) | The Fund’s portfolio turnover rate is calculated in accordance with regulatory requirements, without regard to transactions involving short-term investments, certain derivatives and in-kind transactions (if any). If such transactions were included, the Fund’s portfolio turnover rate may be higher. |
See Notes to Financial Statements.
Prudential Day One Funds 145
Prudential Day One 2040 Fund
Financial Highlights (continued)
Class R4 Shares | ||||||||||||||||||||
| Year Ended July 31, | ||||||||||||||||||||
| 2022 | 2021 | 2020 | 2019 | 2018 | ||||||||||||||||
Per Share Operating Performance(a): | ||||||||||||||||||||
Net Asset Value, Beginning of Year | $14.60 | $11.58 | $11.65 | $11.87 | $10.94 | |||||||||||||||
Income (loss) from investment operations: | ||||||||||||||||||||
Net investment income (loss) | 0.42 | 0.17 | 0.21 | 0.25 | 0.18 | |||||||||||||||
Net realized and unrealized gain (loss) on investment transactions | (1.23 | ) | 3.11 | 0.33 | 0.01 | 0.97 | ||||||||||||||
Total from investment operations | (0.81 | ) | 3.28 | 0.54 | 0.26 | 1.15 | ||||||||||||||
Less Dividends and Distributions: | ||||||||||||||||||||
Dividends from net investment income | (0.98 | ) | (0.17 | ) | (0.24 | ) | (0.30 | ) | (0.21 | ) | ||||||||||
Distributions from net realized gains | (0.41 | ) | (0.09 | ) | (0.37 | ) | (0.18 | ) | (0.01 | ) | ||||||||||
Total dividends and distributions | (1.39 | ) | (0.26 | ) | (0.61 | ) | (0.48 | ) | (0.22 | ) | ||||||||||
Net asset value, end of year | $12.40 | $14.60 | $11.58 | $11.65 | $11.87 | |||||||||||||||
Total Return(b): | (6.53 | )% | 28.61 | % | 4.52 | % | 2.84 | % | 10.60 | % | ||||||||||
Ratios/Supplemental Data: | ||||||||||||||||||||
Net assets, end of year (000) | $50 | $34 | $17 | $12 | $61 | |||||||||||||||
Average net assets (000) | $42 | $26 | $13 | $35 | $124 | |||||||||||||||
Ratios to average net assets(c): | ||||||||||||||||||||
Expenses after waivers and/or expense reimbursement | 0.20 | % | 0.19 | % | 0.19 | % | 0.20 | % | 0.13 | % | ||||||||||
Expenses before waivers and/or expense reimbursement | 9.44 | % | 26.10 | % | 98.42 | % | 33.44 | % | 11.98 | % | ||||||||||
Net investment income (loss) | 3.13 | % | 1.25 | % | 1.84 | % | 2.14 | % | 1.58 | % | ||||||||||
Portfolio turnover rate(d) | 54 | % | 41 | % | 44 | % | 26 | % | 27 | % | ||||||||||
| (a) | Calculated based on average shares outstanding during the year. |
| (b) | Total return is calculated assuming a purchase of a share on the first day and a sale on the last day of each year reported and includes reinvestment of dividends and distributions, if any. Total returns may reflect adjustments to conform to GAAP. |
| (c) | Does not include expenses of the underlying funds in which the Fund invests. Expenses waived/reimbursed include those of underlying funds in which the Fund invests. Consequently, the amount waived/reimbursed may be greater than the expense ratio reflected in the financial highlights. |
| (d) | The Fund’s portfolio turnover rate is calculated in accordance with regulatory requirements, without regard to transactions involving short-term investments, certain derivatives and in-kind transactions (if any). If such transactions were included, the Fund’s portfolio turnover rate may be higher. |
See Notes to Financial Statements.
146
Prudential Day One 2040 Fund
Financial Highlights (continued)
Class R5 Shares | ||||||||||||||||||||
| Year Ended July 31, | ||||||||||||||||||||
| 2022 | 2021 | 2020 | 2019 | 2018 | ||||||||||||||||
Per Share Operating Performance(a): | ||||||||||||||||||||
Net Asset Value, Beginning of Year | $14.61 | $11.58 | $11.65 | $11.88 | $10.95 | |||||||||||||||
Income (loss) from investment operations: | ||||||||||||||||||||
Net investment income (loss) | 0.47 | 0.18 | 0.24 | 0.22 | 0.08 | |||||||||||||||
Net realized and unrealized gain (loss) on investment transactions | (1.27 | ) | 3.12 | 0.31 | 0.04 | 1.09 | ||||||||||||||
Total from investment operations | (0.80 | ) | 3.30 | 0.55 | 0.26 | 1.17 | ||||||||||||||
Less Dividends and Distributions: | ||||||||||||||||||||
Dividends from net investment income | (0.99 | ) | (0.18 | ) | (0.25 | ) | (0.31 | ) | (0.23 | ) | ||||||||||
Distributions from net realized gains | (0.41 | ) | (0.09 | ) | (0.37 | ) | (0.18 | ) | (0.01 | ) | ||||||||||
Total dividends and distributions | (1.40 | ) | (0.27 | ) | (0.62 | ) | (0.49 | ) | (0.24 | ) | ||||||||||
Net asset value, end of year | $12.41 | $14.61 | $11.58 | $11.65 | $11.88 | |||||||||||||||
Total Return(b): | (6.43 | )% | 28.81 | % | 4.61 | % | 2.87 | % | 10.71 | % | ||||||||||
Ratios/Supplemental Data: | ||||||||||||||||||||
Net assets, end of year (000) | $6,697 | $7,393 | $6,114 | $6,056 | $6,070 | |||||||||||||||
Average net assets (000) | $7,073 | $6,748 | $5,963 | $5,822 | $1,981 | |||||||||||||||
Ratios to average net assets(c): | ||||||||||||||||||||
Expenses after waivers and/or expense reimbursement | 0.10 | % | 0.09 | % | 0.09 | % | 0.10 | % | 0.09 | % | ||||||||||
Expenses before waivers and/or expense reimbursement | 0.46 | % | 0.53 | % | 1.01 | % | 1.18 | % | 1.75 | % | ||||||||||
Net investment income (loss) | 3.43 | % | 1.39 | % | 2.09 | % | 1.94 | % | 0.72 | % | ||||||||||
Portfolio turnover rate(d) | 54 | % | 41 | % | 44 | % | 26 | % | 27 | % | ||||||||||
| (a) | Calculated based on average shares outstanding during the year. |
| (b) | Total return is calculated assuming a purchase of a share on the first day and a sale on the last day of each year reported and includes reinvestment of dividends and distributions, if any. Total returns may reflect adjustments to conform to GAAP. |
| (c) | Does not include expenses of the underlying funds in which the Fund invests. Expenses waived/reimbursed include those of underlying funds in which the Fund invests. Consequently, the amount waived/reimbursed may be greater than the expense ratio reflected in the financial highlights. |
| (d) | The Fund’s portfolio turnover rate is calculated in accordance with regulatory requirements, without regard to transactions involving short-term investments, certain derivatives and in-kind transactions (if any). If such transactions were included, the Fund’s portfolio turnover rate may be higher. |
See Notes to Financial Statements.
Prudential Day One Funds 147
Prudential Day One 2040 Fund
Financial Highlights (continued)
Class R6 Shares | ||||||||||||||||||||
| Year Ended July 31, | ||||||||||||||||||||
| 2022 | 2021 | 2020 | 2019 | 2018 | ||||||||||||||||
Per Share Operating Performance(a): | ||||||||||||||||||||
Net Asset Value, Beginning of Year | $14.63 | $11.59 | $11.66 | $11.89 | $10.96 | |||||||||||||||
Income (loss) from investment operations: | ||||||||||||||||||||
Net investment income (loss) | 0.49 | 0.20 | 0.22 | 0.23 | 0.20 | |||||||||||||||
Net realized and unrealized gain (loss) on investment transactions | (1.27 | ) | 3.13 | 0.35 | 0.05 | 0.98 | ||||||||||||||
Total from investment operations | (0.78 | ) | 3.33 | 0.57 | 0.28 | 1.18 | ||||||||||||||
Less Dividends and Distributions: | ||||||||||||||||||||
Dividends from net investment income | (1.02 | ) | (0.20 | ) | (0.27 | ) | (0.33 | ) | (0.24 | ) | ||||||||||
Distributions from net realized gains | (0.41 | ) | (0.09 | ) | (0.37 | ) | (0.18 | ) | (0.01 | ) | ||||||||||
Total dividends and distributions | (1.43 | ) | (0.29 | ) | (0.64 | ) | (0.51 | ) | (0.25 | ) | ||||||||||
Net asset value, end of year | $12.42 | $14.63 | $11.59 | $11.66 | $11.89 | |||||||||||||||
Total Return(b): | (6.35 | )% | 29.05 | % | 4.67 | % | 3.13 | % | 10.86 | % | ||||||||||
Ratios/Supplemental Data: | ||||||||||||||||||||
Net assets, end of year (000) | $37,802 | $43,332 | $31,333 | $17,752 | $12,643 | |||||||||||||||
Average net assets (000) | $45,103 | $41,893 | $20,948 | $15,067 | $9,501 | |||||||||||||||
Ratios to average net assets(c): | ||||||||||||||||||||
Expenses after waivers and/or expense reimbursement(d) | 0.00 | % | 0.00 | % | 0.00 | % | 0.00 | % | 0.00 | % | ||||||||||
| Expenses after waivers and/or reimbursement inclusive of excess expense reimbursement from the manager | (0.05 | )% | (0.06 | )% | (0.06 | )% | (0.05 | )% | (0.11 | )% | ||||||||||
Expenses before waivers and/or expense reimbursement | 0.27 | % | 0.30 | % | 0.70 | % | 0.91 | % | 1.52 | % | ||||||||||
Net investment income (loss) | 3.58 | % | 1.54 | % | 1.96 | % | 2.01 | % | 1.75 | % | ||||||||||
Portfolio turnover rate(e) | 54 | % | 41 | % | 44 | % | 26 | % | 27 | % | ||||||||||
| (a) | Calculated based on average shares outstanding during the year. |
| (b) | Total return is calculated assuming a purchase of a share on the first day and a sale on the last day of each year reported and includes reinvestment of dividends and distributions, if any. Total returns may reflect adjustments to conform to GAAP. |
| (c) | Does not include expenses of the underlying funds in which the Fund invests. Expenses waived/reimbursed include those of underlying funds in which the Fund invests. Consequently, the amount waived/reimbursed may be greater than the expense ratio reflected in the financial highlights. |
| (d) | As a result of reimbursing expenses, including underlying fund expenses, the Manager may reimburse amounts in excess of the respective share classes’ operating expenses. |
| (e) | The Fund’s portfolio turnover rate is calculated in accordance with regulatory requirements, without regard to transactions involving short-term investments, certain derivatives and in-kind transactions (if any). If such transactions were included, the Fund’s portfolio turnover rate may be higher. |
See Notes to Financial Statements.
148
Prudential Day One 2045 Fund
Schedule of Investments
as of July 31, 2022
Description | Shares | Value | ||||||
LONG-TERM INVESTMENTS 99.9% | ||||||||
AFFILIATED MUTUAL FUNDS | ||||||||
PGIM Core Conservative Bond Fund (Class R6) | 107,710 | $ | 985,544 | |||||
PGIM Global Real Estate Fund (Class R6) | 60,535 | 1,239,160 | ||||||
PGIM Jennison Small-Cap Core Equity Fund (Class R6) | 124,123 | 1,524,228 | ||||||
PGIM Quant Solutions Commodity Strategies Fund (Class R6) | 100,505 | 1,058,319 | ||||||
PGIM Quant Solutions Emerging Markets Equity Fund (Class R6) | 160,714 | 1,711,605 | ||||||
PGIM Quant Solutions International Developed Markets Index Fund (Class R6) | 490,842 | 5,909,743 | ||||||
PGIM Quant Solutions Large-Cap Core Fund (Class R6) | 434,014 | 7,573,547 | ||||||
PGIM Quant Solutions Mid-Cap Core Fund (Class R6) | 225,792 | 2,427,267 | ||||||
PGIM Quant Solutions US Broad Market Index Fund (Class R6) | 297,631 | 5,012,109 | ||||||
PGIM TIPS Fund (Class R6) | 118,981 | 1,123,177 | ||||||
PGIM Total Return Bond Fund (Class R6) | 194,010 | 2,469,751 | ||||||
|
| |||||||
TOTAL LONG-TERM INVESTMENTS | 31,034,450 | |||||||
|
| |||||||
SHORT-TERM INVESTMENT 0.2% | ||||||||
AFFILIATED MUTUAL FUND | ||||||||
PGIM Core Ultra Short Bond Fund | ||||||||
(cost $56,693) | 56,693 | 56,693 | ||||||
|
| |||||||
TOTAL INVESTMENTS 100.1% | ||||||||
(cost $27,538,488)(wd) | 31,091,143 | |||||||
Liabilities in excess of other assets (0.1)% | (32,113 | ) | ||||||
|
| |||||||
NET ASSETS 100.0% | $ | 31,059,030 | ||||||
|
| |||||||
Below is a list of the abbreviation(s) used in the annual report:
LIBOR—London Interbank Offered Rate
TIPS—Treasury Inflation-Protected Securities
| (wd) | PGIM Investments LLC, the manager of the Fund, also serves as the manager of the underlying funds in which the Fund invests. |
Fair Value Measurements:
Various inputs are used in determining the value of the Fund’s investments. These inputs are summarized in the three broad levels listed below.
Level 1—unadjusted quoted prices generally in active markets for identical securities.
Level 2—quoted prices for similar securities, interest rates and yield curves, prepayment speeds, foreign currency exchange rates and other observable inputs.
Level 3—unobservable inputs for securities valued in accordance with Board approved fair valuation procedures.
See Notes to Financial Statements.
Prudential Day One Funds 149
Prudential Day One 2045 Fund
Schedule of Investments (continued)
as of July 31, 2022
The following is a summary of the inputs used as of July 31, 2022 in valuing such portfolio securities:
| Level 1 | Level 2 | Level 3 | ||||||||||
Investments in Securities | ||||||||||||
Assets | ||||||||||||
Long-Term Investments | ||||||||||||
Affiliated Mutual Funds | $ | 31,034,450 | $— | $— | ||||||||
Short-Term Investment | ||||||||||||
| Affiliated Mutual Fund | 56,693 | — | — | |||||||||
Total | $ | 31,091,143 | $— | $— | ||||||||
|
|
|
|
|
| |||||||
Investment Allocation:
The investment allocation of portfolio holdings and liabilities in excess of other assets shown as a percentage of net assets as of July 31, 2022 were as follows:
Large Cap | 24.4 | % | ||
International Developed Markets | 19.0 | |||
Broad Market | 16.1 | |||
Total Return Bond | 8.0 | |||
Mid Cap | 7.8 | |||
Emerging Markets | 5.5 | |||
Small Cap | 4.9 | |||
Real Estate | 4.0 | |||
TIPS | 3.6 |
Commodity | 3.4 | % | ||
Core Bond | 3.2 | |||
Short Term | 0.2 | |||
|
| |||
| 100.1 | ||||
Liabilities in excess of other assets | (0.1 | ) | ||
|
| |||
| 100.0 | % | |||
|
| |||
See Notes to Financial Statements.
150
Prudential Day One 2045 Fund
Statement of Assets & Liabilities
as of July 31, 2022
Assets | ||||
Affiliated investments (cost $27,538,488) | $ | 31,091,143 | ||
Receivable for investments sold | 251,795 | |||
Due from Manager | 15,444 | |||
Receivable for Fund shares sold | 3,312 | |||
Prepaid expenses | 66 | |||
|
| |||
Total Assets | 31,361,760 | |||
|
| |||
Liabilities | ||||
Payable for investments purchased | 256,944 | |||
Accrued expenses and other liabilities | 26,747 | |||
Audit fee payable | 17,500 | |||
Trustees’ fees payable | 813 | |||
Affiliated transfer agent fee payable | 378 | |||
Payable for Fund shares purchased | 274 | |||
Distribution fee payable | 74 | |||
|
| |||
Total Liabilities | 302,730 | |||
|
| |||
Net Assets | $ | 31,059,030 | ||
|
| |||
Net assets were comprised of: | ||||
Shares of beneficial interest, at par | $ | 2,616 | ||
Paid-in capital in excess of par | 28,336,999 | |||
Total distributable earnings (loss) | 2,719,415 | |||
|
| |||
Net assets, July 31, 2022 | $ | 31,059,030 | ||
|
| |||
See Notes to Financial Statements.
Prudential Day One Funds 151
Prudential Day One 2045 Fund
Statement of Assets & Liabilities (continued)
as of July 31, 2022
Class R1 | ||||||||
Net asset value, offering price and redemption price per share, ($15,349 ÷ 1,302 shares of beneficial interest issued and outstanding) | $ | 11.79 | ||||||
|
| |||||||
Class R2 | ||||||||
Net asset value, offering price and redemption price per share, ($316,343 ÷ 26,782 shares of beneficial interest issued and outstanding) | $ | 11.81 | ||||||
|
| |||||||
Class R3 | ||||||||
Net asset value, offering price and redemption price per share, ($36,440 ÷ 3,082 shares of beneficial interest issued and outstanding) | $ | 11.82 | ||||||
|
| |||||||
Class R4 | ||||||||
Net asset value, offering price and redemption price per share, ($46,485 ÷ 3,931 shares of beneficial interest issued and outstanding) | $ | 11.83 | ||||||
|
| |||||||
Class R5 | ||||||||
Net asset value, offering price and redemption price per share, ($785,874 ÷ 66,342 shares of beneficial interest issued and outstanding) | $ | 11.85 | ||||||
|
| |||||||
Class R6 | ||||||||
Net asset value, offering price and redemption price per share, ($29,858,539 ÷ 2,514,949 shares of beneficial interest issued and outstanding) | $ | 11.87 | ||||||
|
| |||||||
Net asset value per share may not recalculate due to rounding.
See Notes to Financial Statements.
152
Prudential Day One 2045 Fund
Statement of Operations
Year Ended July 31, 2022
Net Investment Income (Loss) | ||||
Affiliated dividend income | $ | 1,094,076 | ||
|
| |||
Expenses | ||||
Management fee | 7,112 | |||
Distribution fee(a) | 1,314 | |||
Shareholder servicing fees (including affiliated expense of $317)(a) | 317 | |||
Custodian and accounting fees | 63,497 | |||
Registration fees(a) | 26,096 | |||
Legal fees and expenses | 20,495 | |||
Audit fee | 17,500 | |||
Trustees’ fees | 9,790 | |||
Shareholders’ reports | 7,891 | |||
Transfer agent’s fees and expenses (including affiliated expense of $3,676)(a) | 5,875 | |||
Pricing fees | 2,974 | |||
Miscellaneous | 11,937 | |||
|
| |||
Total expenses | 174,798 | |||
Less: Fee waiver and/or expense reimbursement(a) | (194,504 | ) | ||
|
| |||
Net expenses | (19,706 | ) | ||
|
| |||
Net investment income (loss) | 1,113,782 | |||
|
| |||
Realized And Unrealized Gain (Loss) On Affiliated Investments | ||||
Net realized gain (loss) on investment transactions | 1,202,945 | |||
Net capital gain distributions received | 3,024,482 | |||
|
| |||
| 4,227,427 | ||||
|
| |||
Net change in unrealized appreciation (depreciation) on investments | (8,041,517 | ) | ||
|
| |||
Net gain (loss) on investment transactions | (3,814,090 | ) | ||
|
| |||
Net Increase (Decrease) In Net Assets Resulting From Operations | $ | (2,700,308 | ) | |
|
| |||
| (a) | Class specific expenses and waivers were as follows: |
| Class R1 | Class R2 | Class R3 | Class R4 | Class R5 | Class R6 | |||||||||||||||||||
Distribution fee | 90 | 923 | 301 | — | — | — | ||||||||||||||||||
Shareholder servicing fees | 2 | — | 288 | 27 | — | — | ||||||||||||||||||
Registration fees | 3,666 | 4,266 | 3,666 | 3,666 | 3,666 | 7,166 | ||||||||||||||||||
Transfer agent’s fees and expenses | 86 | 1,008 | 1,148 | 154 | 1,376 | 2,103 | ||||||||||||||||||
Fee waiver and/or expense reimbursement | (3,790 | ) | (6,069 | ) | (5,554 | ) | (3,936 | ) | (7,260 | ) | (167,895 | ) | ||||||||||||
See Notes to Financial Statements.
Prudential Day One Funds 153
Prudential Day One 2045 Fund
Statements of Changes in Net Assets
Year Ended July 31, | ||||||||
|
| |||||||
| 2022 | 2021 | |||||||
Increase (Decrease) in Net Assets | ||||||||
Operations | ||||||||
Net investment income (loss) | $ | 1,113,782 | $ | 515,850 | ||||
Net realized gain (loss) on investment transactions | 1,202,945 | 148,503 | ||||||
Net capital gain distributions received | 3,024,482 | 221,241 | ||||||
Net change in unrealized appreciation (depreciation) on investments | (8,041,517 | ) | 9,461,216 | |||||
|
|
|
| |||||
Net increase (decrease) in net assets resulting from operations | (2,700,308 | ) | 10,346,810 | |||||
|
|
|
| |||||
Dividends and Distributions | ||||||||
Distributions from distributable earnings | ||||||||
Class R1 | (2,362 | ) | (246 | ) | ||||
Class R2 | (45,862 | ) | (3,426 | ) | ||||
Class R3 | (5,013 | ) | (190,190 | ) | ||||
Class R4 | (5,548 | ) | (702 | ) | ||||
Class R5 | (93,097 | ) | (10,095 | ) | ||||
Class R6 | (4,631,941 | ) | (575,652 | ) | ||||
|
|
|
| |||||
| (4,783,823 | ) | (780,311 | ) | |||||
|
|
|
| |||||
Fund share transactions | ||||||||
Net proceeds from shares sold | 7,560,098 | 17,302,341 | ||||||
Net asset value of shares issued in reinvestment of dividends and distributions | 4,783,050 | 780,311 | ||||||
Cost of shares purchased | (20,159,482 | ) | (10,890,337 | ) | ||||
|
|
|
| |||||
Net increase (decrease) in net assets from Fund share transactions | (7,816,334 | ) | 7,192,315 | |||||
|
|
|
| |||||
Total increase (decrease) | (15,300,465 | ) | 16,758,814 | |||||
Net Assets: | ||||||||
Beginning of year | 46,359,495 | 29,600,681 | ||||||
|
|
|
| |||||
End of year | $ | 31,059,030 | $ | 46,359,495 | ||||
|
|
|
| |||||
See Notes to Financial Statements.
154
Prudential Day One 2045 Fund
Financial Highlights
Class R1 Shares | ||||||||||||||||||||
| Year Ended July 31, | ||||||||||||||||||||
| 2022 | 2021 | 2020 | 2019 | 2018 | ||||||||||||||||
Per Share Operating Performance(a): | ||||||||||||||||||||
Net Asset Value, Beginning of Year | $14.56 | $11.34 | $11.47 | $11.91 | $10.97 | |||||||||||||||
Income (loss) from investment operations: | ||||||||||||||||||||
Net investment income (loss) | 0.32 | 0.09 | 0.17 | 0.14 | 0.11 | |||||||||||||||
Net realized and unrealized gain (loss) on investment transactions | (1.25 | ) | 3.32 | 0.27 | (0.04 | ) | 1.02 | |||||||||||||
Total from investment operations | (0.93 | ) | 3.41 | 0.44 | 0.10 | 1.13 | ||||||||||||||
Less Dividends and Distributions: | ||||||||||||||||||||
Dividends from net investment income | (0.90 | ) | (0.11 | ) | (0.18 | ) | (0.24 | ) | (0.18 | ) | ||||||||||
Distributions from net realized gains | (0.94 | ) | (0.08 | ) | (0.39 | ) | (0.30 | ) | (0.01 | ) | ||||||||||
Total dividends and distributions | (1.84 | ) | (0.19 | ) | (0.57 | ) | (0.54 | ) | (0.19 | ) | ||||||||||
Net asset value, end of year | $11.79 | $14.56 | $11.34 | $11.47 | $11.91 | |||||||||||||||
Total Return(b): | (7.75 | )% | 30.36 | % | 3.66 | % | 1.78 | % | 10.31 | % | ||||||||||
| ||||||||||||||||||||
Ratios/Supplemental Data: | ||||||||||||||||||||
Net assets, end of year (000) | $15 | $19 | $14 | $13 | $12 | |||||||||||||||
Average net assets (000) | $18 | $17 | $13 | $12 | $12 | |||||||||||||||
Ratios to average net assets(c): | ||||||||||||||||||||
Expenses after waivers and/or expense reimbursement | 0.68 | % | 0.68 | % | 0.68 | % | 0.69 | % | 0.62 | % | ||||||||||
Expenses before waivers and/or expense reimbursement | 21.60 | % | 40.37 | % | 98.28 | % | 96.93 | % | 110.92 | % | ||||||||||
Net investment income (loss) | 2.44 | % | 0.69 | % | 1.54 | % | 1.26 | % | 0.96 | % | ||||||||||
Portfolio turnover rate(d) | 50 | % | 38 | % | 47 | % | 31 | % | 33 | % | ||||||||||
| (a) | Calculated based on average shares outstanding during the year. |
| (b) | Total return is calculated assuming a purchase of a share on the first day and a sale on the last day of each year reported and includes reinvestment of dividends and distributions, if any. Total returns may reflect adjustments to conform to GAAP. |
| (c) | Does not include expenses of the underlying funds in which the Fund invests. Expenses waived/reimbursed include those of underlying funds in which the Fund invests. Consequently, the amount waived/reimbursed may be greater than the expense ratio reflected in the financial highlights. |
| (d) | The Fund’s portfolio turnover rate is calculated in accordance with regulatory requirements, without regard to transactions involving short-term investments, certain derivatives and in-kind transactions (if any). If such transactions were included, the Fund’s portfolio turnover rate may be higher. |
See Notes to Financial Statements.
Prudential Day One Funds 155
Prudential Day One 2045 Fund
Financial Highlights (continued)
Class R2 Shares |
| |||||||||||||||||||
Year Ended July 31, | ||||||||||||||||||||
| 2022 | 2021 | 2020 | 2019 | 2018 | ||||||||||||||||
Per Share Operating Performance(a): | ||||||||||||||||||||
Net Asset Value, Beginning of Year | $14.59 | $11.36 | $11.49 | $11.94 | $10.98 | |||||||||||||||
Income (loss) from investment operations: | ||||||||||||||||||||
Net investment income (loss) | 0.33 | 0.11 | 0.03 | 0.09 | 0.13 | |||||||||||||||
Net realized and unrealized gain (loss) on investment transactions | (1.24 | ) | 3.34 | 0.44 | 0.03 | 1.04 | ||||||||||||||
Total from investment operations | (0.91 | ) | 3.45 | 0.47 | 0.12 | 1.17 | ||||||||||||||
Less Dividends and Distributions: | ||||||||||||||||||||
Dividends from net investment income | (0.93 | ) | (0.14 | ) | (0.21 | ) | (0.27 | ) | (0.20 | ) | ||||||||||
Distributions from net realized gains | (0.94 | ) | (0.08 | ) | (0.39 | ) | (0.30 | ) | (0.01 | ) | ||||||||||
Total dividends and distributions | (1.87 | ) | (0.22 | ) | (0.60 | ) | (0.57 | ) | (0.21 | ) | ||||||||||
Net asset value, end of year | $11.81 | $14.59 | $11.36 | $11.49 | $11.94 | |||||||||||||||
Total Return(b): | (7.56 | )% | 30.67 | % | 3.92 | % | 1.99 | % | 10.75 | % | ||||||||||
Ratios/Supplemental Data: | ||||||||||||||||||||
Net assets, end of year (000) | $316 | $341 | $220 | $98 | $27 | |||||||||||||||
Average net assets (000) | $369 | $235 | $152 | $58 | $17 | |||||||||||||||
Ratios to average net assets(c): | ||||||||||||||||||||
Expenses after waivers and/or expense reimbursement | 0.43 | % | 0.43 | % | 0.43 | % | 0.44 | % | 0.38 | % | ||||||||||
Expenses before waivers and/or expense reimbursement | 2.07 | % | 3.78 | % | 10.18 | % | 21.72 | % | 78.26 | % | ||||||||||
Net investment income (loss) | 2.53 | % | 0.83 | % | 0.24 | % | 0.78 | % | 1.09 | % | ||||||||||
Portfolio turnover rate(d) | 50 | % | 38 | % | 47 | % | 31 | % | 33 | % | ||||||||||
| (a) | Calculated based on average shares outstanding during the year. |
| (b) | Total return is calculated assuming a purchase of a share on the first day and a sale on the last day of each year reported and includes reinvestment of dividends and distributions, if any. Total returns may reflect adjustments to conform to GAAP. |
| (c) | Does not include expenses of the underlying funds in which the Fund invests. Expenses waived/reimbursed include those of underlying funds in which the Fund invests. Consequently, the amount waived/reimbursed may be greater than the expense ratio reflected in the financial highlights. |
| (d) | The Fund’s portfolio turnover rate is calculated in accordance with regulatory requirements, without regard to transactions involving short-term investments, certain derivatives and in-kind transactions (if any). If such transactions were included, the Fund’s portfolio turnover rate may be higher. |
See Notes to Financial Statements.
156
Prudential Day One 2045 Fund
Financial Highlights (continued)
Class R3 Shares | ||||||||||||||||||||
Year Ended July 31, | ||||||||||||||||||||
| 2022 | 2021 | 2020 | 2019 | 2018 | ||||||||||||||||
Per Share Operating Performance(a): | ||||||||||||||||||||
Net Asset Value, Beginning of Year | $14.60 | $11.37 | $11.50 | $11.94 | $10.99 | |||||||||||||||
Income (loss) from investment operations: | ||||||||||||||||||||
Net investment income (loss) | 0.07 | 0.14 | 0.21 | 0.18 | 0.15 | |||||||||||||||
Net realized and unrealized gain (loss) on investment transactions | (0.96 | ) | 3.33 | 0.28 | (0.03 | ) | 1.03 | |||||||||||||
Total from investment operations | (0.89 | ) | 3.47 | 0.49 | 0.15 | 1.18 | ||||||||||||||
Less Dividends and Distributions: | ||||||||||||||||||||
Dividends from net investment income | (0.95 | ) | (0.16 | ) | (0.23 | ) | (0.29 | ) | (0.22 | ) | ||||||||||
Distributions from net realized gains | (0.94 | ) | (0.08 | ) | (0.39 | ) | (0.30 | ) | (0.01 | ) | ||||||||||
Total dividends and distributions | (1.89 | ) | (0.24 | ) | (0.62 | ) | (0.59 | ) | (0.23 | ) | ||||||||||
Net asset value, end of year | $11.82 | $14.60 | $11.37 | $11.50 | $11.94 | |||||||||||||||
Total Return(b): | (7.43 | )% | 30.83 | % | 4.07 | % | 2.26 | % | 10.79 | % | ||||||||||
Ratios/Supplemental Data: | ||||||||||||||||||||
Net assets, end of year (000) | $36 | $12,568 | $8,750 | $7,639 | $5,927 | |||||||||||||||
Average net assets (000) | $301 | $10,686 | $7,880 | $6,657 | $4,901 | |||||||||||||||
Ratios to average net assets(c): | ||||||||||||||||||||
Expenses after waivers and/or expense reimbursement | 0.28 | % | 0.28 | % | 0.28 | % | 0.29 | % | 0.22 | % | ||||||||||
Expenses before waivers and/or expense reimbursement | 2.13 | % | 0.81 | % | 1.51 | % | 1.80 | % | 2.11 | % | ||||||||||
Net investment income (loss) | 0.58 | % | 1.07 | % | 1.90 | % | 1.58 | % | 1.33 | % | ||||||||||
Portfolio turnover rate(d) | 50 | % | 38 | % | 47 | % | 31 | % | 33 | % | ||||||||||
| (a) | Calculated based on average shares outstanding during the year. |
| (b) | Total return is calculated assuming a purchase of a share on the first day and a sale on the last day of each year reported and includes reinvestment of dividends and distributions, if any. Total returns may reflect adjustments to conform to GAAP. |
| (c) | Does not include expenses of the underlying funds in which the Fund invests. Expenses waived/reimbursed include those of underlying funds in which the Fund invests. Consequently, the amount waived/reimbursed may be greater than the expense ratio reflected in the financial highlights. |
| (d) | The Fund’s portfolio turnover rate is calculated in accordance with regulatory requirements, without regard to transactions involving short-term investments, certain derivatives and in-kind transactions (if any). If such transactions were included, the Fund’s portfolio turnover rate may be higher. |
See Notes to Financial Statements.
Prudential Day One Funds 157
Prudential Day One 2045 Fund
Financial Highlights (continued)
Class R4 Shares | ||||||||||||||||||||
Year Ended July 31, | ||||||||||||||||||||
| 2022 | 2021 | 2020 | 2019 | 2018 | ||||||||||||||||
Per Share Operating Performance(a): | ||||||||||||||||||||
Net Asset Value, Beginning of Year | $14.61 | $11.37 | $11.50 | $11.95 | $11.00 | |||||||||||||||
Income (loss) from investment operations: | ||||||||||||||||||||
Net investment income (loss) | 0.38 | 0.16 | 0.22 | 0.23 | 0.24 | |||||||||||||||
Net realized and unrealized gain (loss) on investment transactions | (1.25 | ) | 3.33 | 0.28 | (0.08 | ) | 0.95 | |||||||||||||
Total from investment operations | (0.87 | ) | 3.49 | 0.50 | 0.15 | 1.19 | ||||||||||||||
Less Dividends and Distributions: | ||||||||||||||||||||
Dividends from net investment income | (0.97 | ) | (0.17 | ) | (0.24 | ) | (0.30 | ) | (0.23 | ) | ||||||||||
Distributions from net realized gains | (0.94 | ) | (0.08 | ) | (0.39 | ) | (0.30 | ) | (0.01 | ) | ||||||||||
Total dividends and distributions | (1.91 | ) | (0.25 | ) | (0.63 | ) | (0.60 | ) | (0.24 | ) | ||||||||||
Net asset value, end of year | $11.83 | $14.61 | $11.37 | $11.50 | $11.95 | |||||||||||||||
Total Return(b): | (7.31 | )% | 31.03 | % | 4.19 | % | 2.29 | % | 10.90 | % | ||||||||||
Ratios/Supplemental Data: | ||||||||||||||||||||
Net assets, end of year (000) | $46 | $42 | $32 | $31 | $458 | |||||||||||||||
Average net assets (000) | $42 | $37 | $30 | $217 | $361 | |||||||||||||||
Ratios to average net assets(c): | ||||||||||||||||||||
Expenses after waivers and/or expense reimbursement | 0.18 | % | 0.18 | % | 0.18 | % | 0.20 | % | 0.13 | % | ||||||||||
Expenses before waivers and/or expense reimbursement | 9.50 | % | 18.71 | % | 44.47 | % | 6.89 | % | 5.30 | % | ||||||||||
Net investment income (loss) | 2.88 | % | 1.19 | % | 2.02 | % | 2.01 | % | 2.04 | % | ||||||||||
Portfolio turnover rate(d) | 50 | % | 38 | % | 47 | % | 31 | % | 33 | % | ||||||||||
| (a) | Calculated based on average shares outstanding during the year. |
| (b) | Total return is calculated assuming a purchase of a share on the first day and a sale on the last day of each year reported and includes reinvestment of dividends and distributions, if any. Total returns may reflect adjustments to conform to GAAP. |
| (c) | Does not include expenses of the underlying funds in which the Fund invests. Expenses waived/reimbursed include those of underlying funds in which the Fund invests. Consequently, the amount waived/reimbursed may be greater than the expense ratio reflected in the financial highlights. |
| (d) | The Fund’s portfolio turnover rate is calculated in accordance with regulatory requirements, without regard to transactions involving short-term investments, certain derivatives and in-kind transactions (if any). If such transactions were included, the Fund’s portfolio turnover rate may be higher. |
See Notes to Financial Statements.
158
Prudential Day One 2045 Fund
Financial Highlights (continued)
Class R5 Shares | ||||||||||||||||||||
Year Ended July 31, | ||||||||||||||||||||
| 2022 | 2021 | 2020 | 2019 | 2018 | ||||||||||||||||
Per Share Operating Performance(a): | ||||||||||||||||||||
Net Asset Value, Beginning of Year | $14.63 | $11.39 | $11.51 | $11.96 | $11.01 | |||||||||||||||
Income (loss) from investment operations: | ||||||||||||||||||||
Net investment income (loss) | 0.39 | 0.17 | 0.16 | 0.18 | 0.14 | |||||||||||||||
Net realized and unrealized gain (loss) on investment transactions | (1.25 | ) | 3.33 | 0.36 | (0.02 | ) | 1.06 | |||||||||||||
Total from investment operations | (0.86 | ) | 3.50 | 0.52 | 0.16 | 1.20 | ||||||||||||||
Less Dividends and Distributions: | ||||||||||||||||||||
Dividends from net investment income | (0.98 | ) | (0.18 | ) | (0.25 | ) | (0.31 | ) | (0.24 | ) | ||||||||||
Distributions from net realized gains | (0.94 | ) | (0.08 | ) | (0.39 | ) | (0.30 | ) | (0.01 | ) | ||||||||||
Total dividends and distributions | (1.92 | ) | (0.26 | ) | (0.64 | ) | (0.61 | ) | (0.25 | ) | ||||||||||
Net asset value, end of year | $11.85 | $14.63 | $11.39 | $11.51 | $11.96 | |||||||||||||||
Total Return(b): | (7.20 | )% | 31.10 | % | 4.34 | % | 2.41 | % | 11.00 | % | ||||||||||
Ratios/Supplemental Data: | ||||||||||||||||||||
Net assets, end of year (000) | $786 | $650 | $407 | $174 | $51 | |||||||||||||||
Average net assets (000) | $703 | $525 | $265 | $101 | $19 | |||||||||||||||
Ratios to average net assets(c): | ||||||||||||||||||||
Expenses after waivers and/or expense reimbursement | 0.08 | % | 0.08 | % | 0.08 | % | 0.09 | % | 0.04 | % | ||||||||||
Expenses before waivers and/or expense reimbursement | 1.11 | % | 1.84 | % | 6.12 | % | 12.95 | % | 67.28 | % | ||||||||||
Net investment income (loss) | 2.96 | % | 1.27 | % | 1.48 | % | 1.62 | % | 1.24 | % | ||||||||||
Portfolio turnover rate(d) | 50 | % | 38 | % | 47 | % | 31 | % | 33 | % | ||||||||||
| (a) | Calculated based on average shares outstanding during the year. |
| (b) | Total return is calculated assuming a purchase of a share on the first day and a sale on the last day of each year reported and includes reinvestment of dividends and distributions, if any. Total returns may reflect adjustments to conform to GAAP. |
| (c) | Does not include expenses of the underlying funds in which the Fund invests. Expenses waived/reimbursed include those of underlying funds in which the Fund invests. Consequently, the amount waived/reimbursed may be greater than the expense ratio reflected in the financial highlights. |
| (d) | The Fund’s portfolio turnover rate is calculated in accordance with regulatory requirements, without regard to transactions involving short-term investments, certain derivatives and in-kind transactions (if any). If such transactions were included, the Fund’s portfolio turnover rate may be higher. |
See Notes to Financial Statements.
Prudential Day One Funds 159
Prudential Day One 2045 Fund
Financial Highlights (continued)
Class R6 Shares | ||||||||||||||||||||
Year Ended July 31, | ||||||||||||||||||||
| 2022 | 2021 | 2020 | 2019 | 2018 | ||||||||||||||||
Per Share Operating Performance(a): | ||||||||||||||||||||
Net Asset Value, Beginning of Year | $14.66 | $11.41 | $11.53 | $11.99 | $11.03 | |||||||||||||||
Income (loss) from investment operations: | ||||||||||||||||||||
Net investment income (loss) | 0.42 | 0.18 | 0.21 | 0.22 | 0.19 | |||||||||||||||
Net realized and unrealized gain (loss) on investment transactions | (1.27 | ) | 3.35 | 0.32 | (0.05 | ) | 1.04 | |||||||||||||
Total from investment operations | (0.85 | ) | 3.53 | 0.53 | 0.17 | 1.23 | ||||||||||||||
Less Dividends and Distributions: | ||||||||||||||||||||
Dividends from net investment income | (1.00 | ) | (0.20 | ) | (0.26 | ) | (0.33 | ) | (0.26 | ) | ||||||||||
Distributions from net realized gains | (0.94 | ) | (0.08 | ) | (0.39 | ) | (0.30 | ) | (0.01 | ) | ||||||||||
Total dividends and distributions | (1.94 | ) | (0.28 | ) | (0.65 | ) | (0.63 | ) | (0.27 | ) | ||||||||||
Net asset value, end of year | $11.87 | $14.66 | $11.41 | $11.53 | $11.99 | |||||||||||||||
Total Return(b): | (7.12 | )% | 31.31 | % | 4.49 | % | 2.50 | % | 11.24 | % | ||||||||||
Ratios/Supplemental Data: | ||||||||||||||||||||
Net assets, end of year (000) | $29,859 | $32,739 | $20,178 | $9,601 | $7,129 | |||||||||||||||
Average net assets (000) | $34,127 | $28,077 | $11,758 | $8,229 | $5,157 | |||||||||||||||
Ratios to average net assets(c): | ||||||||||||||||||||
Expenses after waivers and/or expense reimbursement(d) | 0.00 | % | 0.00 | % | 0.00 | % | 0.00 | % | 0.00 | % | ||||||||||
| Expenses after waivers and/or reimbursement inclusive of excess expense reimbursement from the manager | (0.07 | )% | (0.07 | )% | (0.07 | )% | (0.06 | )% | (0.12 | )% | ||||||||||
Expenses before waivers and/or expense reimbursement | 0.42 | % | 0.42 | % | 1.11 | % | 1.43 | % | 1.77 | % | ||||||||||
Net investment income (loss) | 3.17 | % | 1.40 | % | 1.89 | % | 1.99 | % | 1.63 | % | ||||||||||
Portfolio turnover rate(e) | 50 | % | 38 | % | 47 | % | 31 | % | 33 | % | ||||||||||
| (a) | Calculated based on average shares outstanding during the year. |
| (b) | Total return is calculated assuming a purchase of a share on the first day and a sale on the last day of each year reported and includes reinvestment of dividends and distributions, if any. Total returns may reflect adjustments to conform to GAAP. |
| (c) | Does not include expenses of the underlying funds in which the Fund invests. Expenses waived/reimbursed include those of underlying funds in which the Fund invests. Consequently, the amount waived/reimbursed may be greater than the expense ratio reflected in the financial highlights. |
| (d) | As a result of reimbursing expenses, including underlying fund expenses, the Manager may reimburse amounts in excess of the respective share classes’ operating expenses. |
| (e) | The Fund’s portfolio turnover rate is calculated in accordance with regulatory requirements, without regard to transactions involving short-term investments, certain derivatives and in-kind transactions (if any). If such transactions were included, the Fund’s portfolio turnover rate may be higher. |
See Notes to Financial Statements.
160
Prudential Day One 2050 Fund
Schedule of Investments
as of July 31, 2022
Description | Shares | Value | ||||||
LONG-TERM INVESTMENTS 99.9% | ||||||||
AFFILIATED MUTUAL FUNDS | ||||||||
PGIM Core Conservative Bond Fund (Class R6) | 30,350 | $ | 277,701 | |||||
PGIM Global Real Estate Fund (Class R6) | 38,989 | 798,115 | ||||||
PGIM Jennison Small-Cap Core Equity Fund (Class R6) | 81,245 | 997,685 | ||||||
PGIM Quant Solutions Commodity Strategies Fund (Class R6) | 57,117 | 601,445 | ||||||
PGIM Quant Solutions Emerging Markets Equity Fund (Class R6) | 121,994 | 1,299,238 | ||||||
PGIM Quant Solutions International Developed Markets Index Fund (Class R6) | 355,327 | 4,278,132 | ||||||
PGIM Quant Solutions Large-Cap Core Fund (Class R6) | 294,814 | 5,144,509 | ||||||
PGIM Quant Solutions Mid-Cap Core Fund (Class R6) | 153,445 | 1,649,535 | ||||||
PGIM Quant Solutions US Broad Market Index Fund (Class R6) | 196,461 | 3,308,404 | ||||||
PGIM TIPS Fund (Class R6) | 29,797 | 281,288 | ||||||
PGIM Total Return Bond Fund (Class R6) | 106,209 | 1,352,038 | ||||||
|
| |||||||
TOTAL LONG-TERM INVESTMENTS | ||||||||
(cost $17,520,921) | 19,988,090 | |||||||
|
| |||||||
SHORT-TERM INVESTMENT 0.3% | ||||||||
AFFILIATED MUTUAL FUND | ||||||||
PGIM Core Ultra Short Bond Fund | 48,096 | 48,096 | ||||||
|
| |||||||
TOTAL INVESTMENTS 100.2% | ||||||||
(cost $17,569,017)(wd) | 20,036,186 | |||||||
Liabilities in excess of other assets (0.2)% | (32,214 | ) | ||||||
|
| |||||||
NET ASSETS 100.0% | $ | 20,003,972 | ||||||
|
| |||||||
Below is a list of the abbreviation(s) used in the annual report:
LIBOR—London Interbank Offered Rate
TIPS—Treasury Inflation-Protected Securities
| (wd) | PGIM Investments LLC, the manager of the Fund, also serves as the manager of the underlying funds in which the Fund invests. |
Fair Value Measurements:
Various inputs are used in determining the value of the Fund’s investments. These inputs are summarized in the three broad levels listed below.
Level 1—unadjusted quoted prices generally in active markets for identical securities.
Level 2—quoted prices for similar securities, interest rates and yield curves, prepayment speeds, foreign currency exchange rates and other observable inputs.
Level 3—unobservable inputs for securities valued in accordance with Board approved fair valuation procedures.
See Notes to Financial Statements.
Prudential Day One Funds 161
Prudential Day One 2050 Fund
Schedule of Investments (continued)
as of July 31, 2022
The following is a summary of the inputs used as of July 31, 2022 in valuing such portfolio securities:
| Level 1 | Level 2 | Level 3 | ||||||||||
Investments in Securities | ||||||||||||
Assets | ||||||||||||
Long-Term Investments | ||||||||||||
Affiliated Mutual Funds | $ | 19,988,090 | $— | $— | ||||||||
Short-Term Investment | ||||||||||||
| Affiliated Mutual Fund | 48,096 | — | — | |||||||||
Total | $ | 20,036,186 | $— | $— | ||||||||
|
|
|
|
|
| |||||||
Investment Allocation:
The investment allocation of portfolio holdings and liabilities in excess of other assets shown as a percentage of net assets as of July 31, 2022 were as follows:
Large Cap | 25.7 | % | ||
International Developed Markets | 21.4 | |||
Broad Market | 16.5 | |||
Mid Cap | 8.2 | |||
Total Return Bond | 6.8 | |||
Emerging Markets | 6.5 | |||
Small Cap | 5.0 | |||
Real Estate | 4.0 | |||
Commodity | 3.0 |
TIPS | 1.4 | % | ||
Core Bond | 1.4 | |||
Short Term | 0.3 | |||
|
| |||
| 100.2 | ||||
Liabilities in excess of other assets | (0.2 | ) | ||
|
| |||
| 100.0 | % | |||
|
| |||
See Notes to Financial Statements.
162
Prudential Day One 2050 Fund
Statement of Assets & Liabilities
as of July 31, 2022
Assets | ||||
Affiliated investments (cost $17,569,017) | $ | 20,036,186 | ||
Receivable for investments sold | 194,568 | |||
Due from Manager | 14,195 | |||
Receivable for Fund shares sold | 3,210 | |||
Prepaid expenses | 65 | |||
|
| |||
Total Assets | 20,248,224 | |||
|
| |||
Liabilities | ||||
Payable for investments purchased | 133,952 | |||
Payable for Fund shares purchased | 64,702 | |||
Audit fee payable | 17,500 | |||
Custodian and accounting fees payable | 14,855 | |||
Accrued expenses and other liabilities | 11,988 | |||
Trustees’ fees payable | 800 | |||
Affiliated transfer agent fee payable | 368 | |||
Distribution fee payable | 87 | |||
|
| |||
Total Liabilities | 244,252 | |||
|
| |||
Net Assets | $ | 20,003,972 | ||
|
| |||
Net assets were comprised of: | ||||
Shares of beneficial interest, at par | $ | 1,610 | ||
Paid-in capital in excess of par | 17,683,270 | |||
Total distributable earnings (loss) | 2,319,092 | |||
|
| |||
Net assets, July 31, 2022 | $ | 20,003,972 | ||
|
| |||
See Notes to Financial Statements.
Prudential Day One Funds 163
Prudential Day One 2050 Fund
Statement of Assets & Liabilities (continued)
as of July 31, 2022
Class R1 | ||||
Net asset value, offering price and redemption price per share, ($46,638 ÷ 3,785 shares of beneficial interest issued and outstanding) | $ | 12.32 | ||
|
| |||
Class R2 | ||||
Net asset value, offering price and redemption price per share, ($336,626 ÷ 27,240 shares of beneficial interest issued and outstanding) | $ | 12.36 | ||
|
| |||
Class R3 | ||||
Net asset value, offering price and redemption price per share, ($15,309 ÷ 1,236 shares of beneficial interest issued and outstanding) | $ | 12.38 | ||
|
| |||
Class R4 | ||||
Net asset value, offering price and redemption price per share, ($88,837 ÷ 7,185 shares of beneficial interest issued and outstanding) | $ | 12.36 | ||
|
| |||
Class R5 | ||||
Net asset value, offering price and redemption price per share, ($1,170,382 ÷ 94,460 shares of beneficial interest issued and outstanding) | $ | 12.39 | ||
|
| |||
Class R6 | ||||
Net asset value, offering price and redemption price per share, ($18,346,180 ÷ 1,476,519 shares of beneficial interest issued and outstanding) | $ | 12.43 | ||
|
| |||
Net asset value per share may not recalculate due to rounding.
See Notes to Financial Statements.
164
Prudential Day One 2050 Fund
Statement of Operations
Year Ended July 31, 2022
Net Investment Income (Loss) | ||||
Affiliated dividend income | $ | 778,915 | ||
|
| |||
Expenses | ||||
Management fee | 5,112 | |||
Distribution fee(a) | 9,428 | |||
Shareholder servicing fees (including affiliated expense of $3,072)(a) | 3,072 | |||
Custodian and accounting fees | 63,472 | |||
Registration fees(a) | 23,551 | |||
Legal fees and expenses | 20,485 | |||
Audit fee | 17,500 | |||
Transfer agent’s fees and expenses (including affiliated expense of $8,360)(a) | 10,919 | |||
Trustees’ fees | 9,697 | |||
Shareholders’ reports | 7,689 | |||
Pricing fees | 2,974 | |||
Miscellaneous | 12,309 | |||
|
| |||
Total expenses | 186,208 | |||
Less: Fee waiver and/or expense reimbursement(a) | (183,906 | ) | ||
|
| |||
Net expenses | 2,302 | |||
|
| |||
Net investment income (loss) | 776,613 | |||
|
| |||
Realized And Unrealized Gain (Loss) On Affiliated Investments | ||||
Net realized gain (loss) on investment transactions | 104,153 | |||
Net capital gain distributions received | 2,390,590 | |||
|
| |||
| 2,494,743 | ||||
|
| |||
Net change in unrealized appreciation (depreciation) on investments | (5,130,592 | ) | ||
|
| |||
Net gain (loss) on investment transactions | (2,635,849 | ) | ||
|
| |||
Net Increase (Decrease) In Net Assets Resulting From Operations | $ | (1,859,236 | ) | |
|
| |||
| (a) | Class specific expenses and waivers were as follows: |
Class R1 | Class R2 | Class R3 | Class R4 | Class R5 | Class R6 | |||||||||||||||||||
Distribution fee | 230 | 9,117 | 81 | — | — | — | ||||||||||||||||||
Shareholder servicing fees | 9 | 2,938 | 82 | 43 | — | — | ||||||||||||||||||
Registration fees | 3,667 | 5,017 | 3,667 | 3,667 | 3,667 | 3,866 | ||||||||||||||||||
Transfer agent’s fees and expenses | 131 | 6,289 | 475 | 139 | 2,002 | 1,883 | ||||||||||||||||||
Fee waiver and/or expense reimbursement | (3,979 | ) | (26,322 | ) | (4,502 | ) | (4,081 | ) | (11,324 | ) | (133,698 | ) | ||||||||||||
See Notes to Financial Statements.
Prudential Day One Funds 165
Prudential Day One 2050 Fund
Statements of Changes in Net Assets
| Year Ended July 31, | ||||||||
| 2022 | 2021 | |||||||
Increase (Decrease) in Net Assets | ||||||||
Operations | ||||||||
Net investment income (loss) | $ | 776,613 | $ | 311,105 | ||||
Net realized gain (loss) on investment transactions | 104,153 | 338,645 | ||||||
Net capital gain distributions received | 2,390,590 | 140,644 | ||||||
Net change in unrealized appreciation (depreciation) on investments | (5,130,592 | ) | 6,243,431 | |||||
|
|
|
| |||||
Net increase (decrease) in net assets resulting from operations | (1,859,236 | ) | 7,033,825 | |||||
|
|
|
| |||||
Dividends and Distributions | ||||||||
Distributions from distributable earnings | ||||||||
Class R1 | (4,665 | ) | (516 | ) | ||||
Class R2 | (548,421 | ) | (63,192 | ) | ||||
Class R3 | (1,580 | ) | (54,169 | ) | ||||
Class R4 | (8,931 | ) | (286 | ) | ||||
Class R5 | (132,318 | ) | (18,148 | ) | ||||
Class R6 | (2,251,618 | ) | (365,778 | ) | ||||
|
|
|
| |||||
| (2,947,533 | ) | (502,089 | ) | |||||
|
|
|
| |||||
Fund share transactions | ||||||||
Net proceeds from shares sold | 7,235,003 | 10,483,224 | ||||||
Net asset value of shares issued in reinvestment of dividends and distributions | 2,947,533 | 502,089 | ||||||
Cost of shares purchased | (14,151,785 | ) | (7,920,055 | ) | ||||
|
|
|
| |||||
Net increase (decrease) in net assets from Fund share transactions | (3,969,249 | ) | 3,065,258 | |||||
|
|
|
| |||||
Total increase (decrease) | (8,776,018 | ) | 9,596,994 | |||||
Net Assets: | ||||||||
Beginning of year | 28,779,990 | 19,182,996 | ||||||
|
|
|
| |||||
End of year | $ | 20,003,972 | $ | 28,779,990 | ||||
|
|
|
| |||||
See Notes to Financial Statements.
166
Prudential Day One 2050 Fund
Financial Highlights
Class R1 Shares | ||||||||||||||||||||
Year Ended July 31, | ||||||||||||||||||||
| 2022 | 2021 | 2020 | 2019 | 2018 | ||||||||||||||||
Per Share Operating Performance(a): | ||||||||||||||||||||
Net Asset Value, Beginning of Year | $ | 14.87 | $ | 11.49 | $ | 11.59 | $ | 11.92 | $ | 10.95 | ||||||||||
Income (loss) from investment operations: | ||||||||||||||||||||
Net investment income (loss) | 0.30 | 0.07 | 0.08 | 0.13 | 0.11 | |||||||||||||||
Net realized and unrealized gain (loss) on investment transactions | (1.36 | ) | 3.51 | 0.31 | (0.02 | ) | 1.05 | |||||||||||||
Total from investment operations | (1.06 | ) | 3.58 | 0.39 | 0.11 | 1.16 | ||||||||||||||
Less Dividends and Distributions: | ||||||||||||||||||||
Dividends from net investment income | (0.91 | ) | (0.12 | ) | (0.19 | ) | (0.25 | ) | (0.18 | ) | ||||||||||
Distributions from net realized gains | (0.58 | ) | (0.08 | ) | (0.30 | ) | (0.19 | ) | (0.01 | ) | ||||||||||
Total dividends and distributions | (1.49 | ) | (0.20 | ) | (0.49 | ) | (0.44 | ) | (0.19 | ) | ||||||||||
Net asset value, end of year | $ | 12.32 | $ | 14.87 | $ | 11.49 | $ | 11.59 | $ | 11.92 | ||||||||||
Total Return(b): | (8.23 | )% | 31.41 | % | 3.24 | % | 1.61 | % | 10.68 | % | ||||||||||
Ratios/Supplemental Data: | ||||||||||||||||||||
Net assets, end of year (000) | $47 | $44 | $33 | $166 | $142 | |||||||||||||||
Average net assets (000) | $46 | $37 | $54 | $145 | $122 | |||||||||||||||
Ratios to average net assets(c): | ||||||||||||||||||||
Expenses after waivers and/or expense reimbursement | 0.68 | % | 0.67 | % | 0.67 | % | 0.68 | % | 0.61 | % | ||||||||||
Expenses before waivers and/or expense reimbursement | 9.34 | % | 18.74 | % | 26.33 | % | 11.03 | % | 15.48 | % | ||||||||||
Net investment income (loss) | 2.18 | % | 0.55 | % | 0.69 | % | 1.11 | % | 0.95 | % | ||||||||||
Portfolio turnover rate(d) | 59 | % | 39 | % | 42 | % | 30 | % | 56 | % | ||||||||||
| (a) | Calculated based on average shares outstanding during the year. |
| (b) | Total return is calculated assuming a purchase of a share on the first day and a sale on the last day of each year reported and includes reinvestment of dividends and distributions, if any. Total returns may reflect adjustments to conform to GAAP. |
| (c) | Does not include expenses of the underlying funds in which the Fund invests. Expenses waived/reimbursed include those of underlying funds in which the Fund invests. Consequently, the amount waived/reimbursed may be greater than the expense ratio reflected in the financial highlights. |
| (d) | The Fund’s portfolio turnover rate is calculated in accordance with regulatory requirements, without regard to transactions involving short-term investments, certain derivatives and in-kind transactions (if any). If such transactions were included, the Fund’s portfolio turnover rate may be higher. |
See Notes to Financial Statements.
Prudential Day One Funds 167
Prudential Day One 2050 Fund
Financial Highlights (continued)
Class R2 Shares | ||||||||||||||||||||
Year Ended July 31, | ||||||||||||||||||||
| 2022 | 2021 | 2020 | 2019 | 2018 | ||||||||||||||||
Per Share Operating Performance(a): | ||||||||||||||||||||
Net Asset Value, Beginning of Year | $14.90 | $11.51 | $11.59 | $11.93 | $10.96 | |||||||||||||||
Income (loss) from investment operations: | ||||||||||||||||||||
Net investment income (loss) | 0.50 | 0.11 | 0.17 | 0.15 | 0.03 | |||||||||||||||
Net realized and unrealized gain (loss) on investment transactions | (1.51 | ) | 3.51 | 0.26 | (0.03 | ) | 1.16 | |||||||||||||
Total from investment operations | (1.01 | ) | 3.62 | 0.43 | 0.12 | 1.19 | ||||||||||||||
Less Dividends and Distributions: | ||||||||||||||||||||
Dividends from net investment income | (0.95 | ) | (0.15 | ) | (0.21 | ) | (0.27 | ) | (0.21 | ) | ||||||||||
Distributions from net realized gains | (0.58 | ) | (0.08 | ) | (0.30 | ) | (0.19 | ) | (0.01 | ) | ||||||||||
Total dividends and distributions | (1.53 | ) | (0.23 | ) | (0.51 | ) | (0.46 | ) | (0.22 | ) | ||||||||||
Net asset value, end of year | $12.36 | $14.90 | $11.51 | $11.59 | $11.93 | |||||||||||||||
Total Return(b): | (7.92 | )% | 31.72 | % | 3.53 | % | 1.83 | % | 10.96 | % | ||||||||||
Ratios/Supplemental Data: | ||||||||||||||||||||
Net assets, end of year (000) | $337 | $5,209 | $3,110 | $1,951 | $982 | |||||||||||||||
Average net assets (000) | $3,647 | $4,026 | $2,447 | $1,348 | $284 | |||||||||||||||
Ratios to average net assets(c): | ||||||||||||||||||||
Expenses after waivers and/or expense reimbursement | 0.43 | % | 0.42 | % | 0.42 | % | 0.43 | % | 0.41 | % | ||||||||||
Expenses before waivers and/or expense reimbursement | 1.15 | % | 1.28 | % | 2.57 | % | 3.75 | % | 8.52 | % | ||||||||||
Net investment income (loss) | 3.51 | % | 0.81 | % | 1.53 | % | 1.33 | % | 0.26 | % | ||||||||||
Portfolio turnover rate(d) | 59 | % | 39 | % | 42 | % | 30 | % | 56 | % | ||||||||||
| (a) | Calculated based on average shares outstanding during the year. |
| (b) | Total return is calculated assuming a purchase of a share on the first day and a sale on the last day of each year reported and includes reinvestment of dividends and distributions, if any. Total returns may reflect adjustments to conform to GAAP. |
| (c) | Does not include expenses of the underlying funds in which the Fund invests. Expenses waived/reimbursed include those of underlying funds in which the Fund invests. Consequently, the amount waived/reimbursed may be greater than the expense ratio reflected in the financial highlights. |
| (d) | The Fund’s portfolio turnover rate is calculated in accordance with regulatory requirements, without regard to transactions involving short-term investments, certain derivatives and in-kind transactions (if any). If such transactions were included, the Fund’s portfolio turnover rate may be higher. |
See Notes to Financial Statements.
168
Prudential Day One 2050 Fund
Financial Highlights (continued)
Class R3 Shares | ||||||||||||||||||||
Year Ended July 31, | ||||||||||||||||||||
| 2022 | 2021 | 2020 | 2019 | 2018 | ||||||||||||||||
Per Share Operating Performance(a): | ||||||||||||||||||||
Net Asset Value, Beginning of Year | $14.93 | $11.53 | $11.61 | $11.95 | $10.97 | |||||||||||||||
Income (loss) from investment operations: | ||||||||||||||||||||
Net investment income (loss) | 0.06 | 0.13 | 0.16 | 0.14 | 0.12 | |||||||||||||||
Net realized and unrealized gain (loss) on investment transactions | (1.06 | ) | 3.51 | 0.28 | - | (b) | 1.10 | |||||||||||||
Total from investment operations | (1.00 | ) | 3.64 | 0.44 | 0.14 | 1.22 | ||||||||||||||
Less Dividends and Distributions: | ||||||||||||||||||||
Dividends from net investment income | (0.97 | ) | (0.16 | ) | (0.22 | ) | (0.29 | ) | (0.23 | ) | ||||||||||
Distributions from net realized gains | (0.58 | ) | (0.08 | ) | (0.30 | ) | (0.19 | ) | (0.01 | ) | ||||||||||
Total dividends and distributions | (1.55 | ) | (0.24 | ) | (0.52 | ) | (0.48 | ) | (0.24 | ) | ||||||||||
Net asset value, end of year | $12.38 | $14.93 | $11.53 | $11.61 | $11.95 | |||||||||||||||
Total Return(c): | (7.83 | )% | 31.93 | % | 3.65 | % | 2.01 | % | 11.19 | % | ||||||||||
Ratios/Supplemental Data: | ||||||||||||||||||||
Net assets, end of year (000) | $15 | $4,071 | $2,212 | $1,074 | $347 | |||||||||||||||
Average net assets (000) | $81 | $3,123 | $1,564 | $655 | $162 | |||||||||||||||
Ratios to average net assets(d): | ||||||||||||||||||||
Expenses after waivers and/or expense reimbursement | 0.27 | % | 0.27 | % | 0.27 | % | 0.28 | % | 0.24 | % | ||||||||||
Expenses before waivers and/or expense reimbursement | 5.80 | % | 1.15 | % | 2.70 | % | 4.43 | % | 12.24 | % | ||||||||||
Net investment income (loss) | 0.52 | % | 0.97 | % | 1.45 | % | 1.22 | % | 1.01 | % | ||||||||||
Portfolio turnover rate(e) | 59 | % | 39 | % | 42 | % | 30 | % | 56 | % | ||||||||||
| (a) | Calculated based on average shares outstanding during the year. |
| (b) | Amount rounds to zero. |
| (c) | Total return is calculated assuming a purchase of a share on the first day and a sale on the last day of each year reported and includes reinvestment of dividends and distributions, if any. Total returns may reflect adjustments to conform to GAAP. |
| (d) | Does not include expenses of the underlying funds in which the Fund invests. Expenses waived/reimbursed include those of underlying funds in which the Fund invests. Consequently, the amount waived/reimbursed may be greater than the expense ratio reflected in the financial highlights. |
| (e) | The Fund’s portfolio turnover rate is calculated in accordance with regulatory requirements, without regard to transactions involving short-term investments, certain derivatives and in-kind transactions (if any). If such transactions were included, the Fund’s portfolio turnover rate may be higher. |
See Notes to Financial Statements.
Prudential Day One Funds 169
Prudential Day One 2050 Fund
Financial Highlights (continued)
Class R4 Shares | ||||||||||||||||||||
Year Ended July 31, | ||||||||||||||||||||
| 2022 | 2021 | 2020 | 2019 | 2018 | ||||||||||||||||
Per Share Operating Performance(a): | ||||||||||||||||||||
Net Asset Value, Beginning of Year | $14.91 | $11.51 | $11.59 | $11.95 | $10.98 | |||||||||||||||
Income (loss) from investment operations: | ||||||||||||||||||||
Net investment income (loss) | 0.13 | 0.15 | 0.22 | 1.53 | 0.14 | |||||||||||||||
Net realized and unrealized gain (loss) on investment transactions | (1.12 | ) | 3.50 | 0.24 | (1.40 | ) | 1.08 | |||||||||||||
Total from investment operations | (0.99 | ) | 3.65 | 0.46 | 0.13 | 1.22 | ||||||||||||||
Less Dividends and Distributions: | ||||||||||||||||||||
Dividends from net investment income | (0.98 | ) | (0.17 | ) | (0.24 | ) | (0.30 | ) | (0.24 | ) | ||||||||||
Distributions from net realized gains | (0.58 | ) | (0.08 | ) | (0.30 | ) | (0.19 | ) | (0.01 | ) | ||||||||||
Total dividends and distributions | (1.56 | ) | (0.25 | ) | (0.54 | ) | (0.49 | ) | (0.25 | ) | ||||||||||
Net asset value, end of year | $12.36 | $14.91 | $11.51 | $11.59 | $11.95 | |||||||||||||||
Total Return(b): | (7.79 | )% | 32.10 | % | 3.81 | % | 1.95 | % | 11.21 | % | ||||||||||
Ratios/Supplemental Data: | ||||||||||||||||||||
Net assets, end of year (000) | $89 | $17 | $13 | $12 | $160 | |||||||||||||||
Average net assets (000) | $59 | $15 | $12 | $68 | $113 | |||||||||||||||
Ratios to average net assets(c): | ||||||||||||||||||||
Expenses after waivers and/or expense reimbursement | 0.18 | % | 0.17 | % | 0.17 | % | 0.19 | % | 0.12 | % | ||||||||||
Expenses before waivers and/or expense reimbursement | 7.09 | % | 43.52 | % | 106.71 | % | 19.83 | % | 15.66 | % | ||||||||||
Net investment income (loss) | 0.98 | % | 1.12 | % | 1.94 | % | 13.14 | % | 1.24 | % | ||||||||||
Portfolio turnover rate(d) | 59 | % | 39 | % | 42 | % | 30 | % | 56 | % | ||||||||||
| (a) | Calculated based on average shares outstanding during the year. |
| (b) | Total return is calculated assuming a purchase of a share on the first day and a sale on the last day of each year reported and includes reinvestment of dividends and distributions, if any. Total returns may reflect adjustments to conform to GAAP. |
| (c) | Does not include expenses of the underlying funds in which the Fund invests. Expenses waived/reimbursed include those of underlying funds in which the Fund invests. Consequently, the amount waived/reimbursed may be greater than the expense ratio reflected in the financial highlights. |
| (d) | The Fund’s portfolio turnover rate is calculated in accordance with regulatory requirements, without regard to transactions involving short-term investments, certain derivatives and in-kind transactions (if any). If such transactions were included, the Fund’s portfolio turnover rate may be higher. |
See Notes to Financial Statements.
170
Prudential Day One 2050 Fund
Financial Highlights (continued)
Class R5 Shares | ||||||||||||||||||||
Year Ended July 31, | ||||||||||||||||||||
| 2022 | 2021 | 2020 | 2019 | 2018 | ||||||||||||||||
Per Share Operating Performance(a): | ||||||||||||||||||||
Net Asset Value, Beginning of Year | $14.94 | $11.54 | $11.62 | $11.96 | $10.99 | |||||||||||||||
Income (loss) from investment operations: | ||||||||||||||||||||
Net investment income (loss) | 0.39 | 0.16 | 0.24 | 0.20 | 0.07 | |||||||||||||||
Net realized and unrealized gain (loss) on investment transactions | (1.36 | ) | 3.51 | 0.23 | (0.03 | ) | 1.16 | |||||||||||||
Total from investment operations | (0.97 | ) | 3.67 | 0.47 | 0.17 | 1.23 | ||||||||||||||
Less Dividends and Distributions: | ||||||||||||||||||||
Dividends from net investment income | (1.00 | ) | (0.19 | ) | (0.25 | ) | (0.32 | ) | (0.25 | ) | ||||||||||
Distributions from net realized gains | (0.58 | ) | (0.08 | ) | (0.30 | ) | (0.19 | ) | (0.01 | ) | ||||||||||
Total dividends and distributions | (1.58 | ) | (0.27 | ) | (0.55 | ) | (0.51 | ) | (0.26 | ) | ||||||||||
Net asset value, end of year | $12.39 | $14.94 | $11.54 | $11.62 | $11.96 | |||||||||||||||
Total Return(b): | (7.63 | )% | 32.13 | % | 3.90 | % | 2.24 | % | 11.31 | % | ||||||||||
Ratios/Supplemental Data: | ||||||||||||||||||||
Net assets, end of year (000) | $1,170 | $1,149 | $778 | $732 | $560 | |||||||||||||||
Average net assets (000) | $1,196 | $950 | $725 | $608 | $176 | |||||||||||||||
Ratios to average net assets(c): | ||||||||||||||||||||
Expenses after waivers and/or expense reimbursement | 0.08 | % | 0.07 | % | 0.07 | % | 0.08 | % | 0.06 | % | ||||||||||
Expenses before waivers and/or expense reimbursement | 1.03 | % | 1.44 | % | 3.47 | % | 4.47 | % | 10.80 | % | ||||||||||
Net investment income (loss) | 2.87 | % | 1.19 | % | 2.11 | % | 1.73 | % | 0.56 | % | ||||||||||
Portfolio turnover rate(d) | 59 | % | 39 | % | 42 | % | 30 | % | 56 | % | ||||||||||
| (a) | Calculated based on average shares outstanding during the year. |
| (b) | Total return is calculated assuming a purchase of a share on the first day and a sale on the last day of each year reported and includes reinvestment of dividends and distributions, if any. Total returns may reflect adjustments to conform to GAAP. |
| (c) | Does not include expenses of the underlying funds in which the Fund invests. Expenses waived/reimbursed include those of underlying funds in which the Fund invests. Consequently, the amount waived/reimbursed may be greater than the expense ratio reflected in the financial highlights. |
| (d) | The Fund’s portfolio turnover rate is calculated in accordance with regulatory requirements, without regard to transactions involving short-term investments, certain derivatives and in-kind transactions (if any). If such transactions were included, the Fund’s portfolio turnover rate may be higher. |
See Notes to Financial Statements.
Prudential Day One Funds 171
Prudential Day One 2050 Fund
Financial Highlights (continued)
Class R6 Shares | ||||||||||||||||||||
Year Ended July 31, | ||||||||||||||||||||
| 2022 | 2021 | 2020 | 2019 | 2018 | ||||||||||||||||
Per Share Operating Performance(a): | ||||||||||||||||||||
Net Asset Value, Beginning of Year | $14.98 | $11.57 | $11.64 | $11.99 | $11.00 | |||||||||||||||
Income (loss) from investment operations: | ||||||||||||||||||||
Net investment income (loss) | 0.41 | 0.18 | 0.24 | 0.20 | 0.19 | |||||||||||||||
Net realized and unrealized gain (loss) on investment transactions | (1.36 | ) | 3.52 | 0.26 | (0.03 | ) | 1.08 | |||||||||||||
Total from investment operations | (0.95 | ) | 3.70 | 0.50 | 0.17 | 1.27 | ||||||||||||||
Less Dividends and Distributions: | ||||||||||||||||||||
Dividends from net investment income | (1.02 | ) | (0.21 | ) | (0.27 | ) | (0.33 | ) | (0.27 | ) | ||||||||||
Distributions from net realized gains | (0.58 | ) | (0.08 | ) | (0.30 | ) | (0.19 | ) | (0.01 | ) | ||||||||||
Total dividends and distributions | (1.60 | ) | (0.29 | ) | (0.57 | ) | (0.52 | ) | (0.28 | ) | ||||||||||
Net asset value, end of year | $12.43 | $14.98 | $11.57 | $11.64 | $11.99 | |||||||||||||||
Total Return(b): | (7.47 | )% | 32.33 | % | 4.11 | % | 2.33 | % | 11.65 | % | ||||||||||
Ratios/Supplemental Data: | ||||||||||||||||||||
Net assets, end of year (000) | $18,346 | $18,291 | $13,037 | $7,037 | $3,884 | |||||||||||||||
Average net assets (000) | $20,531 | $17,795 | $8,309 | $5,316 | $2,964 | |||||||||||||||
Ratios to average net assets(c): | ||||||||||||||||||||
Expenses after waivers and/or expense reimbursement(d) | 0.00 | % | 0.00 | % | 0.00 | % | 0.00 | % | 0.00 | % | ||||||||||
| Expenses after waivers and/or reimbursement inclusive of excess expense reimbursement from the manager | (0.07 | )% | (0.08 | )% | (0.08 | )% | (0.07 | )% | (0.13 | )% | ||||||||||
Expenses before waivers and/or expense reimbursement | 0.58 | % | 0.63 | % | 1.67 | % | 2.60 | % | 4.62 | % | ||||||||||
Net investment income (loss) | 2.98 | % | 1.33 | % | 2.13 | % | 1.75 | % | 1.64 | % | ||||||||||
Portfolio turnover rate(e) | 59 | % | 39 | % | 42 | % | 30 | % | 56 | % | ||||||||||
| (a) | Calculated based on average shares outstanding during the year. |
| (b) | Total return is calculated assuming a purchase of a share on the first day and a sale on the last day of each year reported and includes reinvestment of dividends and distributions, if any. Total returns may reflect adjustments to conform to GAAP. |
| (c) | Does not include expenses of the underlying funds in which the Fund invests. Expenses waived/reimbursed include those of underlying funds in which the Fund invests. Consequently, the amount waived/reimbursed may be greater than the expense ratio reflected in the financial highlights. |
| (d) | As a result of reimbursing expenses, including underlying fund expenses, the Manager may reimburse amounts in excess of the respective share classes’ operating expenses. |
| (e) | The Fund’s portfolio turnover rate is calculated in accordance with regulatory requirements, without regard to transactions involving short-term investments, certain derivatives and in-kind transactions (if any). If such transactions were included, the Fund’s portfolio turnover rate may be higher. |
See Notes to Financial Statements.
172
Prudential Day One 2055 Fund
Schedule of Investments
as of July 31, 2022
Description | Shares | Value | ||||||
LONG-TERM INVESTMENTS 99.9% | ||||||||
AFFILIATED MUTUAL FUNDS | ||||||||
PGIM Global Real Estate Fund (Class R6) | 13,797 | $ | 282,421 | |||||
PGIM Jennison Small-Cap Core Equity Fund (Class R6) | 28,752 | 353,070 | ||||||
PGIM Quant Solutions Commodity Strategies Fund (Class R6) | 20,197 | 212,673 | ||||||
PGIM Quant Solutions Emerging Markets Equity Fund (Class R6) | 49,705 | 529,359 | ||||||
PGIM Quant Solutions International Developed Markets Index Fund (Class R6) | 134,005 | 1,613,424 | ||||||
PGIM Quant Solutions Large-Cap Core Fund (Class R6) | 103,621 | 1,808,190 | ||||||
PGIM Quant Solutions Mid-Cap Core Fund (Class R6) | 57,985 | 623,341 | ||||||
PGIM Quant Solutions US Broad Market Index Fund (Class R6) | 69,518 | 1,170,676 | ||||||
PGIM Total Return Bond Fund (Class R6) | 37,590 | 478,518 | ||||||
|
| |||||||
TOTAL LONG-TERM INVESTMENTS | 7,071,672 | |||||||
|
| |||||||
SHORT-TERM INVESTMENT 0.5% | ||||||||
AFFILIATED MUTUAL FUND | ||||||||
PGIM Core Ultra Short Bond Fund | ||||||||
(cost $36,493) | 36,493 | 36,493 | ||||||
|
| |||||||
TOTAL INVESTMENTS 100.4% | ||||||||
(cost $5,911,295)(wd) | 7,108,165 | |||||||
Liabilities in excess of other assets (0.4)% | (30,893 | ) | ||||||
|
| |||||||
NET ASSETS 100.0% | $ | 7,077,272 | ||||||
|
| |||||||
Below is a list of the abbreviation(s) used in the annual report:
LIBOR—London Interbank Offered Rate
| (wd) | PGIM Investments LLC, the manager of the Fund, also serves as the manager of the underlying funds in which the Fund invests. |
Fair Value Measurements:
Various inputs are used in determining the value of the Fund’s investments. These inputs are summarized in the three broad levels listed below.
Level 1—unadjusted quoted prices generally in active markets for identical securities.
Level 2—quoted prices for similar securities, interest rates and yield curves, prepayment speeds, foreign currency exchange rates and other observable inputs.
Level 3—unobservable inputs for securities valued in accordance with Board approved fair valuation procedures.
See Notes to Financial Statements.
Prudential Day One Funds 173
Prudential Day One 2055 Fund
Schedule of Investments (continued)
as of July 31, 2022
The following is a summary of the inputs used as of July 31, 2022 in valuing such portfolio securities:
| Level 1 | Level 2 | Level 3 | ||||||||||
Investments in Securities | ||||||||||||
Assets | ||||||||||||
Long-Term Investments | ||||||||||||
Affiliated Mutual Funds | $ | 7,071,672 | $— | $— | ||||||||
Short-Term Investment | ||||||||||||
| Affiliated Mutual Fund | 36,493 | — | — | |||||||||
Total | $ | 7,108,165 | $— | $— | ||||||||
|
|
|
|
|
| |||||||
Investment Allocation:
The investment allocation of portfolio holdings and liabilities in excess of other assets shown as a percentage of net assets as of July 31, 2022 were as follows:
Large Cap | 25.5 | % | ||
International Developed Markets | 22.8 | |||
Broad Market | 16.5 | |||
Mid Cap | 8.8 | |||
Emerging Markets | 7.5 | |||
Total Return Bond | 6.8 | |||
Small Cap | 5.0 | |||
Real Estate | 4.0 |
Commodity | 3.0 | % | ||
Short Term | 0.5 | |||
|
| |||
| 100.4 | ||||
Liabilities in excess of other assets | (0.4 | ) | ||
|
| |||
| 100.0 | % | |||
|
| |||
See Notes to Financial Statements.
174
Prudential Day One 2055 Fund
Statement of Assets & Liabilities
as of July 31, 2022
Assets | ||||
Affiliated investments (cost $5,911,295) | $ | 7,108,165 | ||
Receivable for investments sold | 39,028 | |||
Due from Manager | 13,969 | |||
Receivable for Fund shares sold | 2,948 | |||
Prepaid expenses | 65 | |||
|
| |||
Total Assets | 7,164,175 | |||
|
| |||
Liabilities | ||||
Payable for investments purchased | 41,738 | |||
Audit fee payable | 17,500 | |||
Custodian and accounting fees payable | 14,865 | |||
Accrued expenses and other liabilities | 6,093 | |||
Legal fees and expenses payable | 5,478 | |||
Trustees’ fees payable | 800 | |||
Affiliated transfer agent fee payable | 331 | |||
Distribution fee payable | 64 | |||
Payable for Fund shares purchased | 34 | |||
|
| |||
Total Liabilities | 86,903 | |||
|
| |||
Net Assets | $ | 7,077,272 | ||
|
| |||
Net assets were comprised of: | ||||
Shares of beneficial interest, at par | $ | 684 | ||
Paid-in capital in excess of par | 6,442,961 | |||
Total distributable earnings (loss) | 633,627 | |||
|
| |||
Net assets, July 31, 2022 | $ | 7,077,272 | ||
|
| |||
See Notes to Financial Statements.
Prudential Day One Funds 175
Prudential Day One 2055 Fund
Statement of Assets & Liabilities (continued)
as of July 31, 2022
Class R1 | ||||
Net asset value, offering price and redemption price per share, ($16,582 ÷ 1,613 shares of beneficial interest issued and outstanding) | $ | 10.28 | ||
|
| |||
Class R2 | ||||
Net asset value, offering price and redemption price per share, ($277,864 ÷ 26,939 shares of beneficial interest issued and outstanding) | $ | 10.31 | ||
|
| |||
Class R3 | ||||
Net asset value, offering price and redemption price per share, ($14,508 ÷ 1,406 shares of beneficial interest issued and outstanding) | $ | 10.32 | ||
|
| |||
Class R4 | ||||
Net asset value, offering price and redemption price per share, ($19,644 ÷ 1,902 shares of beneficial interest issued and outstanding) | $ | 10.33 | ||
|
| |||
Class R5 | ||||
Net asset value, offering price and redemption price per share, ($367,112 ÷ 35,484 shares of beneficial interest issued and outstanding) | $ | 10.35 | ||
|
| |||
Class R6 | ||||
Net asset value, offering price and redemption price per share, ($6,381,562 ÷ 616,902 shares of beneficial interest issued and outstanding) | $ | 10.34 | ||
|
| |||
Net asset value per share may not recalculate due to rounding.
See Notes to Financial Statements.
176
Prudential Day One 2055 Fund
Statement of Operations
Year Ended July 31, 2022
Net Investment Income (Loss) | ||||
Affiliated dividend income | $ | 262,961 | ||
|
| |||
Expenses | ||||
Management fee | 1,830 | |||
Distribution fee(a) | 1,033 | |||
Shareholder servicing fees (including affiliated expense of $167)(a) | 167 | |||
Custodian and accounting fees | 63,575 | |||
Registration fees(a) | 24,892 | |||
Legal fees and expenses | 20,457 | |||
Audit fee | 17,500 | |||
Trustees’ fees | 9,610 | |||
Shareholders’ reports | 8,091 | |||
Transfer agent’s fees and expenses (including affiliated expense of $2,715)(a) | 4,409 | |||
Pricing fees | 3,005 | |||
Miscellaneous | 12,122 | |||
|
| |||
Total expenses | 166,691 | |||
Less: Fee waiver and/or expense reimbursement(a) | (171,600 | ) | ||
|
| |||
Net expenses | (4,909 | ) | ||
|
| |||
Net investment income (loss) | 267,870 | |||
|
| |||
Realized And Unrealized Gain (Loss) On Affiliated Investments | ||||
Net realized gain (loss) on investment transactions | 1,303,319 | |||
Net capital gain distributions received | 832,907 | |||
|
| |||
| 2,136,226 | ||||
|
| |||
Net change in unrealized appreciation (depreciation) on investments | (3,204,259 | ) | ||
|
| |||
Net gain (loss) on investment transactions | (1,068,033 | ) | ||
|
| |||
Net Increase (Decrease) In Net Assets Resulting From Operations | $ | (800,163 | ) | |
|
| |||
| (a) | Class specific expenses and waivers were as follows: |
| Class R1 | Class R2 | Class R3 | Class R4 | Class R5 | Class R6 | |||||||||||||||||||
Distribution fee | 88 | 779 | 166 | — | — | — | ||||||||||||||||||
Shareholder servicing fees | 2 | — | 165 | — | — | — | ||||||||||||||||||
Registration fees | 3,607 | 6,657 | 3,607 | 3,607 | 3,607 | 3,807 | ||||||||||||||||||
Transfer agent’s fees and expenses | 83 | 1,122 | 782 | 74 | 701 | 1,647 | ||||||||||||||||||
Fee waiver and/or expense reimbursement | (3,929 | ) | (11,927 | ) | (5,914 | ) | (3,921 | ) | (8,862 | ) | (137,047 | ) | ||||||||||||
See Notes to Financial Statements.
Prudential Day One Funds 177
Prudential Day One 2055 Fund
Statements of Changes in Net Assets
| Year Ended July 31, | ||||||||
| 2022 | 2021 | |||||||
Increase (Decrease) in Net Assets | ||||||||
Operations | ||||||||
Net investment income (loss) | $ | 267,870 | $ | 159,997 | ||||
Net realized gain (loss) on investment transactions | 1,303,319 | 182,822 | ||||||
Net capital gain distributions received | 832,907 | 77,612 | ||||||
Net change in unrealized appreciation (depreciation) on investments | (3,204,259 | ) | 3,560,803 | |||||
|
|
|
| |||||
Net increase (decrease) in net assets resulting from operations | (800,163 | ) | 3,981,234 | |||||
|
|
|
| |||||
Dividends and Distributions | ||||||||
Distributions from distributable earnings | ||||||||
Class R1 | (4,484 | ) | (257 | ) | ||||
Class R2 | (78,926 | ) | (3,101 | ) | ||||
Class R3 | (3,581 | ) | (119,572 | ) | ||||
Class R4 | (4,368 | ) | (308 | ) | ||||
Class R5 | (82,969 | ) | (3,582 | ) | ||||
Class R6 | (2,244,650 | ) | (164,160 | ) | ||||
|
|
|
| |||||
| (2,418,978 | ) | (290,980 | ) | |||||
|
|
|
| |||||
Fund share transactions | ||||||||
Net proceeds from shares sold | 3,122,750 | 5,230,198 | ||||||
Net asset value of shares issued in reinvestment of dividends and distributions | 2,418,978 | 290,980 | ||||||
Cost of shares purchased | (11,063,042 | ) | (4,016,070 | ) | ||||
|
|
|
| |||||
Net increase (decrease) in net assets from Fund share transactions | (5,521,314 | ) | 1,505,108 | |||||
|
|
|
| |||||
Total increase (decrease) | (8,740,455 | ) | 5,195,362 | |||||
Net Assets: | ||||||||
Beginning of year | 15,817,727 | 10,622,365 | ||||||
|
|
|
| |||||
End of year | $ | 7,077,272 | $ | 15,817,727 | ||||
|
|
|
| |||||
See Notes to Financial Statements.
178
Prudential Day One 2055 Fund
Financial Highlights
Class R1 Shares | ||||||||||||||||||||
| Year Ended July 31, | ||||||||||||||||||||
| 2022 | 2021 | 2020 | 2019 | 2018 | ||||||||||||||||
Per Share Operating Performance(a): | ||||||||||||||||||||
Net Asset Value, Beginning of Year | $14.78 | $11.33 | $11.52 | $12.10 | $11.07 | |||||||||||||||
Income (loss) from investment operations: | ||||||||||||||||||||
Net investment income (loss) | 0.26 | 0.08 | 0.18 | 0.14 | 0.10 | |||||||||||||||
Net realized and unrealized gain (loss) on investment transactions | (1.10 | ) | 3.58 | 0.18 | (0.15 | ) | 1.12 | |||||||||||||
Total from investment operations | (0.84 | ) | 3.66 | 0.36 | (0.01 | ) | 1.22 | |||||||||||||
Less Dividends and Distributions: | ||||||||||||||||||||
Dividends from net investment income | (0.91 | ) | (0.11 | ) | (0.19 | ) | (0.24 | ) | (0.19 | ) | ||||||||||
Distributions from net realized gains | (2.75 | ) | (0.10 | ) | (0.36 | ) | (0.33 | ) | - | |||||||||||
Total dividends and distributions | (3.66 | ) | (0.21 | ) | (0.55 | ) | (0.57 | ) | (0.19 | ) | ||||||||||
Net asset value, end of year | $10.28 | $14.78 | $11.33 | $11.52 | $12.10 | |||||||||||||||
Total Return(b): | (8.47 | )% | 32.63 | % | 2.89 | % | 0.89 | % | 11.10 | % | ||||||||||
Ratios/Supplemental Data: | ||||||||||||||||||||
Net assets, end of year (000) | $17 | $18 | $14 | $15 | $15 | |||||||||||||||
Average net assets (000) | $18 | $16 | $14 | $15 | $12 | |||||||||||||||
Ratios to average net assets(c): | ||||||||||||||||||||
Expenses after waivers and/or expense reimbursement | 0.67 | % | 0.66 | % | 0.65 | % | 0.66 | % | 0.61 | % | ||||||||||
Expenses before waivers and/or expense reimbursement | 22.90 | % | 42.22 | % | 93.51 | % | 81.24 | % | 110.87 | % | ||||||||||
Net investment income (loss) | 2.17 | % | 0.57 | % | 1.62 | % | 1.22 | % | 0.87 | % | ||||||||||
Portfolio turnover rate(d) | 60 | % | 37 | % | 45 | % | 29 | % | 29 | % | ||||||||||
| (a) | Calculated based on average shares outstanding during the year. |
| (b) | Total return is calculated assuming a purchase of a share on the first day and a sale on the last day of each year reported and includes reinvestment of dividends and distributions, if any. Total returns may reflect adjustments to conform to GAAP. |
| (c) | Does not include expenses of the underlying funds in which the Fund invests. Expenses waived/reimbursed include those of underlying funds in which the Fund invests. Consequently, the amount waived/reimbursed may be greater than the expense ratio reflected in the financial highlights. |
| (d) | The Fund’s portfolio turnover rate is calculated in accordance with regulatory requirements, without regard to transactions involving short-term investments, certain derivatives and in-kind transactions (if any). If such transactions were included, the Fund’s portfolio turnover rate may be higher. |
See Notes to Financial Statements.
Prudential Day One Funds 179
Prudential Day One 2055 Fund
Financial Highlights (continued)
Class R2 Shares | ||||||||||||||||||||
| Year Ended July 31, | ||||||||||||||||||||
| 2022 | 2021 | 2020 | 2019 | 2018 | ||||||||||||||||
Per Share Operating Performance(a): | ||||||||||||||||||||
Net Asset Value, Beginning of Year | $14.82 | $11.36 | $11.54 | $12.12 | $11.09 | |||||||||||||||
Income (loss) from investment operations: | ||||||||||||||||||||
Net investment income (loss) | 0.29 | 0.10 | 0.14 | 0.12 | 0.10 | |||||||||||||||
Net realized and unrealized gain (loss) on investment transactions | (1.11 | ) | 3.60 | 0.25 | (0.10 | ) | 1.15 | |||||||||||||
Total from investment operations | (0.82 | ) | 3.70 | 0.39 | 0.02 | 1.25 | ||||||||||||||
Less Dividends and Distributions: | ||||||||||||||||||||
Dividends from net investment income | (0.94 | ) | (0.14 | ) | (0.21 | ) | (0.27 | ) | (0.22 | ) | ||||||||||
Distributions from net realized gains | (2.75 | ) | (0.10 | ) | (0.36 | ) | (0.33 | ) | - | |||||||||||
Total dividends and distributions | (3.69 | ) | (0.24 | ) | (0.57 | ) | (0.60 | ) | (0.22 | ) | ||||||||||
Net asset value, end of year | $10.31 | $14.82 | $11.36 | $11.54 | $12.12 | |||||||||||||||
Total Return(b): | (8.28 | )% | 32.93 | % | 3.19 | % | 1.19 | % | 11.34 | % | ||||||||||
Ratios/Supplemental Data: | ||||||||||||||||||||
Net assets, end of year (000) | $278 | $305 | $142 | $63 | $36 | |||||||||||||||
Average net assets (000) | $311 | $188 | $83 | $43 | $23 | |||||||||||||||
Ratios to average net assets(c): | ||||||||||||||||||||
Expenses after waivers and/or expense reimbursement | 0.42 | % | 0.41 | % | 0.40 | % | 0.41 | % | 0.37 | % | ||||||||||
Expenses before waivers and/or expense reimbursement | 4.25 | % | 6.37 | % | 19.04 | % | 30.82 | % | 58.64 | % | ||||||||||
Net investment income (loss) | 2.40 | % | 0.73 | % | 1.28 | % | 1.05 | % | 0.86 | % | ||||||||||
Portfolio turnover rate(d) | 60 | % | 37 | % | 45 | % | 29 | % | 29 | % | ||||||||||
| (a) | Calculated based on average shares outstanding during the year. |
| (b) | Total return is calculated assuming a purchase of a share on the first day and a sale on the last day of each year reported and includes reinvestment of dividends and distributions, if any. Total returns may reflect adjustments to conform to GAAP. |
| (c) | Does not include expenses of the underlying funds in which the Fund invests. Expenses waived/reimbursed include those of underlying funds in which the Fund invests. Consequently, the amount waived/reimbursed may be greater than the expense ratio reflected in the financial highlights. |
| (d) | The Fund’s portfolio turnover rate is calculated in accordance with regulatory requirements, without regard to transactions involving short-term investments, certain derivatives and in-kind transactions (if any). If such transactions were included, the Fund’s portfolio turnover rate may be higher. |
See Notes to Financial Statements.
180
Prudential Day One 2055 Fund
Financial Highlights (continued)
Class R3 Shares | ||||||||||||||||||||
Year Ended July 31, | ||||||||||||||||||||
| 2022 | 2021 | 2020 | 2019 | 2018 | ||||||||||||||||
Per Share Operating Performance(a): | ||||||||||||||||||||
Net Asset Value, Beginning of Year | $14.82 | $11.36 | $11.55 | $12.13 | $11.10 | |||||||||||||||
Income (loss) from investment operations: | ||||||||||||||||||||
Net investment income (loss) | 0.02 | 0.13 | 0.20 | 0.18 | 0.15 | |||||||||||||||
Net realized and unrealized gain (loss) on investment transactions | (0.80 | ) | 3.59 | 0.20 | (0.14 | ) | 1.12 | |||||||||||||
Total from investment operations | (0.78 | ) | 3.72 | 0.40 | 0.04 | 1.27 | ||||||||||||||
Less Dividends and Distributions: | ||||||||||||||||||||
Dividends from net investment income | (0.97 | ) | (0.16 | ) | (0.23 | ) | (0.29 | ) | (0.24 | ) | ||||||||||
Distributions from net realized gains | (2.75 | ) | (0.10 | ) | (0.36 | ) | (0.33 | ) | - | |||||||||||
Total dividends and distributions | (3.72 | ) | (0.26 | ) | (0.59 | ) | (0.62 | ) | (0.24 | ) | ||||||||||
Net asset value, end of year | $10.32 | $14.82 | $11.36 | $11.55 | $12.13 | |||||||||||||||
Total Return(b): | (8.03 | )% | 33.09 | % | 3.26 | % | 1.37 | % | 11.48 | % | ||||||||||
Ratios/Supplemental Data: | ||||||||||||||||||||
Net assets, end of year (000) | $15 | $7,549 | $4,867 | $3,699 | $2,791 | |||||||||||||||
Average net assets (000) | $166 | $6,237 | $4,140 | $3,177 | $2,323 | |||||||||||||||
Ratios to average net assets(c): | ||||||||||||||||||||
Expenses after waivers and/or expense reimbursement | 0.25 | % | 0.26 | % | 0.25 | % | 0.26 | % | 0.21 | % | ||||||||||
Expenses before waivers and/or expense reimbursement | 3.82 | % | 1.52 | % | 2.92 | % | 3.70 | % | 4.29 | % | ||||||||||
Net investment income (loss) | 0.15 | % | 0.95 | % | 1.83 | % | 1.59 | % | 1.26 | % | ||||||||||
Portfolio turnover rate(d) | 60 | % | 37 | % | 45 | % | 29 | % | 29 | % | ||||||||||
| (a) | Calculated based on average shares outstanding during the year. |
| (b) | Total return is calculated assuming a purchase of a share on the first day and a sale on the last day of each year reported and includes reinvestment of dividends and distributions, if any. Total returns may reflect adjustments to conform to GAAP. |
| (c) | Does not include expenses of the underlying funds in which the Fund invests. Expenses waived/reimbursed include those of underlying funds in which the Fund invests. Consequently, the amount waived/reimbursed may be greater than the expense ratio reflected in the financial highlights. |
| (d) | The Fund’s portfolio turnover rate is calculated in accordance with regulatory requirements, without regard to transactions involving short-term investments, certain derivatives and in-kind transactions (if any). If such transactions were included, the Fund’s portfolio turnover rate may be higher. |
See Notes to Financial Statements.
Prudential Day One Funds 181
Prudential Day One 2055 Fund
Financial Highlights (continued)
Class R4 Shares | ||||||||||||||||||||
Year Ended July 31, | ||||||||||||||||||||
| 2022 | 2021 | 2020 | 2019 | 2018 | ||||||||||||||||
Per Share Operating Performance(a): | ||||||||||||||||||||
Net Asset Value, Beginning of Year | $14.84 | $11.37 | $11.56 | $12.14 | $11.11 | |||||||||||||||
Income (loss) from investment operations: | ||||||||||||||||||||
Net investment income (loss) | 0.31 | 0.14 | 0.22 | 0.26 | 0.16 | |||||||||||||||
Net realized and unrealized gain (loss) on investment transactions | (1.09 | ) | 3.60 | 0.19 | (0.21 | ) | 1.12 | |||||||||||||
Total from investment operations | (0.78 | ) | 3.74 | 0.41 | 0.05 | 1.28 | ||||||||||||||
Less Dividends and Distributions: | ||||||||||||||||||||
Dividends from net investment income | (0.98 | ) | (0.17 | ) | (0.24 | ) | (0.30 | ) | (0.25 | ) | ||||||||||
Distributions from net realized gains | (2.75 | ) | (0.10 | ) | (0.36 | ) | (0.33 | ) | - | |||||||||||
Total dividends and distributions | (3.73 | ) | (0.27 | ) | (0.60 | ) | (0.63 | ) | (0.25 | ) | ||||||||||
Net asset value, end of year | $10.33 | $14.84 | $11.37 | $11.56 | $12.14 | |||||||||||||||
Total Return(b): | (8.01 | )% | 33.27 | % | 3.38 | % | 1.49 | % | 11.59 | % | ||||||||||
Ratios/Supplemental Data: | ||||||||||||||||||||
Net assets, end of year (000) | $20 | $17 | $13 | $13 | $66 | |||||||||||||||
Average net assets (000) | $18 | $15 | $12 | $33 | $56 | |||||||||||||||
Ratios to average net assets(c): | ||||||||||||||||||||
Expenses after waivers and/or expense reimbursement | 0.17 | % | 0.16 | % | 0.15 | % | 0.17 | % | 0.11 | % | ||||||||||
Expenses before waivers and/or expense reimbursement | 22.13 | % | 43.43 | % | 106.71 | % | 37.86 | % | 26.45 | % | ||||||||||
Net investment income (loss) | 2.54 | % | 1.07 | % | 2.02 | % | 2.20 | % | 1.34 | % | ||||||||||
Portfolio turnover rate(d) | 60 | % | 37 | % | 45 | % | 29 | % | 29 | % | ||||||||||
| (a) | Calculated based on average shares outstanding during the year. |
| (b) | Total return is calculated assuming a purchase of a share on the first day and a sale on the last day of each year reported and includes reinvestment of dividends and distributions, if any. Total returns may reflect adjustments to conform to GAAP. |
| (c) | Does not include expenses of the underlying funds in which the Fund invests. Expenses waived/reimbursed include those of underlying funds in which the Fund invests. Consequently, the amount waived/reimbursed may be greater than the expense ratio reflected in the financial highlights. |
| (d) | The Fund’s portfolio turnover rate is calculated in accordance with regulatory requirements, without regard to transactions involving short-term investments, certain derivatives and in-kind transactions (if any). If such transactions were included, the Fund’s portfolio turnover rate may be higher. |
See Notes to Financial Statements.
182
Prudential Day One 2055 Fund
Financial Highlights (continued)
Class R5 Shares | ||||||||||||||||||||
Year Ended July 31, | ||||||||||||||||||||
| 2022 | 2021 | 2020 | 2019 | 2018 | ||||||||||||||||
Per Share Operating Performance(a): | ||||||||||||||||||||
Net Asset Value, Beginning of Year | $14.86 | $11.38 | $11.56 | $12.15 | $11.12 | |||||||||||||||
Income (loss) from investment operations: | ||||||||||||||||||||
Net investment income (loss) | 0.34 | 0.15 | 0.24 | 0.14 | 0.16 | |||||||||||||||
Net realized and unrealized gain (loss) on investment transactions | (1.11 | ) | 3.61 | 0.19 | (0.09 | ) | 1.13 | |||||||||||||
Total from investment operations | (0.77 | ) | 3.76 | 0.43 | 0.05 | 1.29 | ||||||||||||||
Less Dividends and Distributions: | ||||||||||||||||||||
Dividends from net investment income | (0.99 | ) | (0.18 | ) | (0.25 | ) | (0.31 | ) | (0.26 | ) | ||||||||||
Distributions from net realized gains | (2.75 | ) | (0.10 | ) | (0.36 | ) | (0.33 | ) | - | |||||||||||
Total dividends and distributions | (3.74 | ) | (0.28 | ) | (0.61 | ) | (0.64 | ) | (0.26 | ) | ||||||||||
Net asset value, end of year | $10.35 | $14.86 | $11.38 | $11.56 | $12.15 | |||||||||||||||
Total Return(b): | (7.88 | )% | 33.45 | % | 3.51 | % | 1.53 | % | 11.69 | % | ||||||||||
Ratios/Supplemental Data: | ||||||||||||||||||||
Net assets, end of year (000) | $367 | $247 | $136 | $90 | $21 | |||||||||||||||
Average net assets (000) | $317 | $188 | $111 | $50 | $14 | |||||||||||||||
Ratios to average net assets(c): | ||||||||||||||||||||
Expenses after waivers and/or expense reimbursement | 0.07 | % | 0.06 | % | 0.05 | % | 0.05 | % | 0.01 | % | ||||||||||
Expenses before waivers and/or expense reimbursement | 2.87 | % | 4.74 | % | 14.21 | % | 26.07 | % | 96.19 | % | ||||||||||
Net investment income (loss) | 2.79 | % | 1.12 | % | 2.15 | % | 1.20 | % | 1.37 | % | ||||||||||
Portfolio turnover rate(d) | 60 | % | 37 | % | 45 | % | 29 | % | 29 | % | ||||||||||
| (a) | Calculated based on average shares outstanding during the year. |
| (b) | Total return is calculated assuming a purchase of a share on the first day and a sale on the last day of each year reported and includes reinvestment of dividends and distributions, if any. Total returns may reflect adjustments to conform to GAAP. |
| (c) | Does not include expenses of the underlying funds in which the Fund invests. Expenses waived/reimbursed include those of underlying funds in which the Fund invests. Consequently, the amount waived/reimbursed may be greater than the expense ratio reflected in the financial highlights. |
| (d) | The Fund’s portfolio turnover rate is calculated in accordance with regulatory requirements, without regard to transactions involving short-term investments, certain derivatives and in-kind transactions (if any). If such transactions were included, the Fund’s portfolio turnover rate may be higher. |
See Notes to Financial Statements.
Prudential Day One Funds 183
Prudential Day One 2055 Fund
Financial Highlights (continued)
Class R6 Shares | ||||||||||||||||||||
Year Ended July 31, | ||||||||||||||||||||
| 2022 | 2021 | 2020 | 2019 | 2018 | ||||||||||||||||
Per Share Operating Performance(a): | ||||||||||||||||||||
Net Asset Value, Beginning of Year | $14.86 | $11.38 | $11.57 | $12.16 | $11.13 | |||||||||||||||
Income (loss) from investment operations: | ||||||||||||||||||||
Net investment income (loss) | 0.37 | 0.17 | 0.22 | 0.21 | 0.19 | |||||||||||||||
Net realized and unrealized gain (loss) on investment transactions | (1.12 | ) | 3.61 | 0.22 | (0.14 | ) | 1.12 | |||||||||||||
Total from investment operations | (0.75 | ) | 3.78 | 0.44 | 0.07 | 1.31 | ||||||||||||||
Less Dividends and Distributions: | ||||||||||||||||||||
Dividends from net investment income | (1.02 | ) | (0.20 | ) | (0.27 | ) | (0.33 | ) | (0.28 | ) | ||||||||||
Distributions from net realized gains | (2.75 | ) | (0.10 | ) | (0.36 | ) | (0.33 | ) | - | |||||||||||
Total dividends and distributions | (3.77 | ) | (0.30 | ) | (0.63 | ) | (0.66 | ) | (0.28 | ) | ||||||||||
Net asset value, end of year | $10.34 | $14.86 | $11.38 | $11.57 | $12.16 | |||||||||||||||
Total Return(b): | (7.82 | )% | 33.63 | % | 3.60 | % | 1.72 | % | 11.85 | % | ||||||||||
Ratios/Supplemental Data: | ||||||||||||||||||||
Net assets, end of year (000) | $6,382 | $7,681 | $5,451 | $3,635 | $2,777 | |||||||||||||||
Average net assets (000) | $8,322 | $7,616 | $4,340 | $3,169 | $2,185 | |||||||||||||||
Ratios to average net assets(c): | ||||||||||||||||||||
Expenses after waivers and/or expense reimbursement(d) | 0.00 | % | 0.00 | % | 0.00 | % | 0.00 | % | 0.00 | % | ||||||||||
| Expenses after waivers and/or reimbursement inclusive of excess expense reimbursement from the manager | (0.08 | )% | (0.09 | )% | (0.10 | )% | (0.09 | )% | (0.13 | )% | ||||||||||
Expenses before waivers and/or expense reimbursement | 1.57 | % | 1.16 | % | 2.57 | % | 3.36 | % | 3.99 | % | ||||||||||
Net investment income (loss) | 3.01 | % | 1.27 | % | 2.01 | % | 1.87 | % | 1.62 | % | ||||||||||
Portfolio turnover rate(e) | 60 | % | 37 | % | 45 | % | 29 | % | 29 | % | ||||||||||
| (a) | Calculated based on average shares outstanding during the year. |
| (b) | Total return is calculated assuming a purchase of a share on the first day and a sale on the last day of each year reported and includes reinvestment of dividends and distributions, if any. Total returns may reflect adjustments to conform to GAAP. |
| (c) | Does not include expenses of the underlying funds in which the Fund invests. Expenses waived/reimbursed include those of underlying funds in which the Fund invests. Consequently, the amount waived/reimbursed may be greater than the expense ratio reflected in the financial highlights. |
| (d) | As a result of reimbursing expenses, including underlying fund expenses, the Manager may reimburse amounts in excess of the respective share classes’ operating expenses. |
| (e) | The Fund’s portfolio turnover rate is calculated in accordance with regulatory requirements, without regard to transactions involving short-term investments, certain derivatives and in-kind transactions (if any). If such transactions were included, the Fund’s portfolio turnover rate may be higher. |
See Notes to Financial Statements.
184
Prudential Day One 2060 Fund
Schedule of Investments
as of July 31, 2022
Description | Shares | Value | ||||||
LONG-TERM INVESTMENTS 99.9% | ||||||||
AFFILIATED MUTUAL FUNDS | ||||||||
PGIM Global Real Estate Fund (Class R6) | 13,551 | $ | 277,398 | |||||
PGIM Jennison Small-Cap Core Equity Fund (Class R6) | 28,238 | 346,762 | ||||||
PGIM Quant Solutions Commodity Strategies Fund (Class R6) | 19,852 | 209,036 | ||||||
PGIM Quant Solutions Emerging Markets Equity Fund (Class R6) | 55,253 | 588,446 | ||||||
PGIM Quant Solutions International Developed Markets Index Fund (Class R6) | 138,214 | 1,664,101 | ||||||
PGIM Quant Solutions Large-Cap Core Fund (Class R6) | 99,791 | 1,741,349 | ||||||
PGIM Quant Solutions Mid-Cap Core Fund (Class R6) | 59,293 | 637,398 | ||||||
PGIM Quant Solutions US Broad Market Index Fund (Class R6) | 68,282 | 1,149,863 | ||||||
PGIM Total Return Bond Fund (Class R6) | 26,057 | 331,706 | ||||||
|
| |||||||
TOTAL LONG-TERM INVESTMENTS | ||||||||
(cost $6,386,550) | 6,946,059 | |||||||
|
| |||||||
SHORT-TERM INVESTMENT 0.5% | ||||||||
AFFILIATED MUTUAL FUND | ||||||||
PGIM Core Ultra Short Bond Fund | ||||||||
(cost $35,876) | 35,876 | 35,876 | ||||||
|
| |||||||
TOTAL INVESTMENTS 100.4% | ||||||||
(cost $6,422,426)(wd) | 6,981,935 | |||||||
Liabilities in excess of other assets (0.4)% | (30,373 | ) | ||||||
|
| |||||||
NET ASSETS 100.0% | $ | 6,951,562 | ||||||
|
| |||||||
Below is a list of the abbreviation(s) used in the annual report:
LIBOR—London Interbank Offered Rate
| (wd) | PGIM Investments LLC, the manager of the Fund, also serves as the manager of the underlying funds in which the Fund invests. |
Fair Value Measurements:
Various inputs are used in determining the value of the Fund’s investments. These inputs are summarized in the three broad levels listed below.
Level 1—unadjusted quoted prices generally in active markets for identical securities.
Level 2—quoted prices for similar securities, interest rates and yield curves, prepayment speeds, foreign currency exchange rates and other observable inputs.
Level 3—unobservable inputs for securities valued in accordance with Board approved fair valuation procedures.
See Notes to Financial Statements.
Prudential Day One Funds 185
Prudential Day One 2060 Fund
Schedule of Investments (continued)
as of July 31, 2022
The following is a summary of the inputs used as of July 31, 2022 in valuing such portfolio securities:
| Level 1 | Level 2 | Level 3 | ||||||||||
Investments in Securities | ||||||||||||
Assets | ||||||||||||
Long-Term Investments | ||||||||||||
Affiliated Mutual Funds | $ | 6,946,059 | $— | $— | ||||||||
Short-Term Investment | ||||||||||||
| Affiliated Mutual Fund | 35,876 | — | — | |||||||||
Total | $ | 6,981,935 | $— | $— | ||||||||
|
|
|
|
|
| |||||||
Investment Allocation:
The investment allocation of portfolio holdings and liabilities in excess of other assets shown as a percentage of net assets as of July 31, 2022 were as follows:
Large Cap | 25.0 | % | ||
International Developed Markets | 23.9 | |||
Broad Market | 16.5 | |||
Mid Cap | 9.2 | |||
Emerging Markets | 8.5 | |||
Small Cap | 5.0 | |||
Total Return Bond | 4.8 | |||
Real Estate | 4.0 |
Commodity | 3.0 | % | ||
Short Term | 0.5 | |||
|
| |||
| 100.4 | ||||
Liabilities in excess of other assets | (0.4 | ) | ||
|
| |||
| 100.0 | % | |||
|
| |||
See Notes to Financial Statements.
186
Prudential Day One 2060 Fund
Statement of Assets & Liabilities
as of July 31, 2022
Assets | ||||
Affiliated investments (cost $6,422,426) | $ | 6,981,935 | ||
Receivable for investments sold | 38,978 | |||
Due from Manager | 14,763 | |||
Receivable for Fund shares sold | 2,941 | |||
Prepaid expenses | 65 | |||
|
| |||
Total Assets | 7,038,682 | |||
|
| |||
Liabilities | ||||
Payable for investments purchased | 39,384 | |||
Audit fee payable | 17,502 | |||
Custodian and accounting fees payable | 14,855 | |||
Accrued expenses and other liabilities | 5,969 | |||
Legal fees and expenses payable | 5,478 | |||
Payable for Fund shares purchased | 2,785 | |||
Trustees’ fees payable | 800 | |||
Affiliated transfer agent fee payable | 298 | |||
Distribution fee payable | 49 | |||
|
| |||
Total Liabilities | 87,120 | |||
|
| |||
Net Assets | $ | 6,951,562 | ||
|
| |||
Net assets were comprised of: | ||||
Shares of beneficial interest, at par | $ | 537 | ||
Paid-in capital in excess of par | 6,525,616 | |||
Total distributable earnings (loss) | 425,409 | |||
|
| |||
Net assets, July 31, 2022 | $ | 6,951,562 | ||
|
| |||
See Notes to Financial Statements.
Prudential Day One Funds 187
Prudential Day One 2060 Fund
Statement of Assets & Liabilities (continued)
as of July 31, 2022
Class R1 | ||||
Net asset value, offering price and redemption price per share, | $ | 12.82 | ||
|
| |||
Class R2 | ||||
Net asset value, offering price and redemption price per share, | $ | 12.86 | ||
|
| |||
Class R3 | ||||
Net asset value, offering price and redemption price per share, | $ | 12.89 | ||
|
| |||
Class R4 | ||||
Net asset value, offering price and redemption price per share, | $ | 12.91 | ||
|
| |||
Class R5 | ||||
Net asset value, offering price and redemption price per share, | $ | 12.93 | ||
|
| |||
Class R6 | ||||
Net asset value, offering price and redemption price per share, | $ | 12.95 | ||
|
| |||
Net asset value per share may not recalculate due to rounding.
See Notes to Financial Statements.
188
Prudential Day One 2060 Fund
Statement of Operations
Year Ended July 31, 2022
Net Investment Income (Loss) | ||||
Affiliated dividend income | $ | 242,653 | ||
|
| |||
Expenses | ||||
Management fee | 1,651 | |||
Distribution fee(a) | 3,464 | |||
Shareholder servicing fees (including affiliated expense of $1,172)(a) | 1,221 | |||
Custodian and accounting fees | 63,503 | |||
Registration fees(a) | 25,294 | |||
Legal fees and expenses | 20,457 | |||
Audit fee | 17,500 | |||
Trustees’ fees | 9,610 | |||
Shareholders’ reports | 7,642 | |||
Transfer agent’s fees and expenses (including affiliated expense of $3,739)(a) | 5,371 | |||
Pricing fees | 2,974 | |||
Fund data services | 2,347 | |||
Miscellaneous | 10,140 | |||
|
| |||
Total expenses | 171,174 | |||
Less: Fee waiver and/or expense reimbursement(a) | (171,309 | ) | ||
|
| |||
Net expenses | (135 | ) | ||
|
| |||
Net investment income (loss) | 242,788 | |||
|
| |||
Realized And Unrealized Gain (Loss) On Affiliated Investments | ||||
Net realized gain (loss) on investment transactions | (182,295 | ) | ||
Net capital gain distributions received | 776,890 | |||
|
| |||
| 594,595 | ||||
|
| |||
Net change in unrealized appreciation (depreciation) on investments | (1,464,573 | ) | ||
|
| |||
Net gain (loss) on investment transactions | (869,978 | ) | ||
|
| |||
Net Increase (Decrease) In Net Assets Resulting From Operations | $ | (627,190 | ) | |
|
| |||
| (a) | Class specific expenses and waivers were as follows: |
| Class R1 | Class R2 | Class R3 | Class R4 | Class R5 | Class R6 | |||||||||||||||||||
Distribution fee | 86 | 3,324 | 54 | — | — | — | ||||||||||||||||||
Shareholder servicing fees | 1 | 1,167 | 53 | — | — | — | ||||||||||||||||||
Registration fees | 3,607 | 4,707 | 3,607 | 3,607 | 3,607 | 6,159 | ||||||||||||||||||
Transfer agent’s fees and expenses | 83 | 2,675 | 201 | 85 | 631 | 1,696 | ||||||||||||||||||
Fee waiver and/or expense reimbursement | (3,949 | ) | (27,071 | ) | (4,645 | ) | (3,953 | ) | (9,640 | ) | (122,051 | ) | ||||||||||||
See Notes to Financial Statements.
Prudential Day One Funds 189
Prudential Day One 2060 Fund
Statements of Changes in Net Assets
| Year Ended July 31, | ||||||||
| 2022 | 2021 | |||||||
Increase (Decrease) in Net Assets | ||||||||
Operations | ||||||||
Net investment income (loss) | $ | 242,788 | $ | 67,338 | ||||
Net realized gain (loss) on investment transactions | (182,295 | ) | (4,842 | ) | ||||
Net capital gain distributions received | 776,890 | 32,196 | ||||||
Net change in unrealized appreciation (depreciation) on investments | (1,464,573 | ) | 1,732,791 | |||||
|
|
|
| |||||
Net increase (decrease) in net assets resulting from operations | (627,190 | ) | 1,827,483 | |||||
|
|
|
| |||||
Dividends and Distributions | ||||||||
Distributions from distributable earnings | ||||||||
Class R1 | (1,309 | ) | (156 | ) | ||||
Class R2 | (157,325 | ) | (15,188 | ) | ||||
Class R3 | (2,325 | ) | (13,805 | ) | ||||
Class R4 | (1,415 | ) | (225 | ) | ||||
Class R5 | (26,495 | ) | (2,122 | ) | ||||
Class R6 | (548,820 | ) | (74,351 | ) | ||||
|
|
|
| |||||
| (737,689 | ) | (105,847 | ) | |||||
|
|
|
| |||||
Fund share transactions | ||||||||
Net proceeds from shares sold | 3,162,413 | 5,619,691 | ||||||
Net asset value of shares issued in reinvestment of dividends and distributions | 737,689 | 105,847 | ||||||
Cost of shares purchased | (4,983,698 | ) | (1,895,876 | ) | ||||
|
|
|
| |||||
Net increase (decrease) in net assets from Fund share transactions | (1,083,596 | ) | 3,829,662 | |||||
|
|
|
| |||||
Total increase (decrease) | (2,448,475 | ) | 5,551,298 | |||||
Net Assets: | ||||||||
Beginning of year | 9,400,037 | 3,848,739 | ||||||
|
|
|
| |||||
End of year | $ | 6,951,562 | $ | 9,400,037 | ||||
|
|
|
| |||||
See Notes to Financial Statements.
190
Prudential Day One 2060 Fund
Financial Highlights
Class R1 Shares |
| |||||||||||||||||||
| Year Ended July 31, | ||||||||||||||||||||
| 2022 | 2021 | 2020 | 2019 | 2018 | ||||||||||||||||
Per Share Operating Performance(a): | ||||||||||||||||||||
Net Asset Value, Beginning of Year | $15.17 | $11.49 | $11.62 | $12.06 | $11.01 | |||||||||||||||
Income (loss) from investment operations: | ||||||||||||||||||||
Net investment income (loss) | 0.29 | 0.08 | 0.17 | 0.13 | 0.10 | |||||||||||||||
Net realized and unrealized gain (loss) on investment transactions | (1.46 | ) | 3.74 | 0.16 | (0.15 | ) | 1.15 | |||||||||||||
Total from investment operations | (1.17 | ) | 3.82 | 0.33 | (0.02 | ) | 1.25 | |||||||||||||
Less Dividends and Distributions: | ||||||||||||||||||||
Dividends from net investment income | (0.95 | ) | (0.08 | ) | (0.20 | ) | (0.25 | ) | (0.20 | ) | ||||||||||
Distributions from net realized gains | (0.23 | ) | (0.06 | ) | (0.26 | ) | (0.17 | ) | - | |||||||||||
Total dividends and distributions | (1.18 | ) | (0.14 | ) | (0.46 | ) | (0.42 | ) | (0.20 | ) | ||||||||||
Net asset value, end of year | $12.82 | $15.17 | $11.49 | $11.62 | $12.06 | |||||||||||||||
Total Return(b): | (8.62 | )% | 33.45 | % | 2.70 | % | 0.57 | % | 11.37 | % | ||||||||||
Ratios/Supplemental Data: | ||||||||||||||||||||
Net assets, end of year (000) | $17 | $17 | $13 | $12 | $12 | |||||||||||||||
Average net assets (000) | $17 | $15 | $12 | $12 | $12 | |||||||||||||||
Ratios to average net assets(c): | ||||||||||||||||||||
Expenses after waivers and/or expense reimbursement | 0.66 | % | 0.65 | % | 0.65 | % | 0.66 | % | 0.61 | % | ||||||||||
Expenses before waivers and/or expense reimbursement | 23.66 | % | 46.33 | % | 114.36 | % | 111.01 | % | 149.96 | % | ||||||||||
Net investment income (loss) | 2.06 | % | 0.56 | % | 1.56 | % | 1.10 | % | 0.87 | % | ||||||||||
Portfolio turnover rate(d) | 64 | % | 35 | % | 44 | % | 35 | % | 90 | % | ||||||||||
| (a) | Calculated based on average shares outstanding during the year. |
| (b) | Total return is calculated assuming a purchase of a share on the first day and a sale on the last day of each year reported and includes reinvestment of dividends and distributions, if any. Total returns may reflect adjustments to conform to GAAP. |
| (c) | Does not include expenses of the underlying funds in which the Fund invests. Expenses waived/reimbursed include those of underlying funds in which the Fund invests. Consequently, the amount waived/reimbursed may be greater than the expense ratio reflected in the financial highlights. |
| (d) | The Fund’s portfolio turnover rate is calculated in accordance with regulatory requirements, without regard to transactions involving short-term investments, certain derivatives and in-kind transactions (if any). If such transactions were included, the Fund’s portfolio turnover rate may be higher. |
See Notes to Financial Statements.
Prudential Day One Funds 191
Prudential Day One 2060 Fund
Financial Highlights (continued)
Class R2 Shares |
| |||||||||||||||||||
Year Ended July 31, | ||||||||||||||||||||
| 2022 | 2021 | 2020 | 2019 | 2018 | ||||||||||||||||
Per Share Operating Performance(a): | ||||||||||||||||||||
Net Asset Value, Beginning of Year | $15.21 | $11.52 | $11.63 | $12.08 | $11.03 | |||||||||||||||
Income (loss) from investment operations: | ||||||||||||||||||||
Net investment income (loss) | 0.52 | 0.10 | 0.16 | 0.15 | 0.06 | |||||||||||||||
Net realized and unrealized gain (loss) on investment transactions | (1.66 | ) | 3.76 | 0.21 | (0.15 | ) | 1.21 | |||||||||||||
Total from investment operations | (1.14 | ) | 3.86 | 0.37 | -(b | ) | 1.27 | |||||||||||||
Less Dividends and Distributions: | ||||||||||||||||||||
Dividends from net investment income | (0.98 | ) | (0.11 | ) | (0.22 | ) | (0.28 | ) | (0.22 | ) | ||||||||||
Distributions from net realized gains | (0.23 | ) | (0.06 | ) | (0.26 | ) | (0.17 | ) | - | |||||||||||
Total dividends and distributions | (1.21 | ) | (0.17 | ) | (0.48 | ) | (0.45 | ) | (0.22 | ) | ||||||||||
Net asset value, end of year | $12.86 | $15.21 | $11.52 | $11.63 | $12.08 | |||||||||||||||
Total Return(c): | (8.37 | )% | 33.76 | % | 2.96 | % | 0.79 | % | 11.61 | % | ||||||||||
Ratios/Supplemental Data: | ||||||||||||||||||||
Net assets, end of year (000) | $199 | $1,755 | $889 | $388 | $94 | |||||||||||||||
Average net assets (000) | $1,330 | $1,291 | $587 | $226 | $29 | |||||||||||||||
Ratios to average net assets(d): | ||||||||||||||||||||
Expenses after waivers and/or expense reimbursement | 0.41 | % | 0.40 | % | 0.40 | % | 0.41 | % | 0.38 | % | ||||||||||
Expenses before waivers and/or expense reimbursement | 2.45 | % | 3.46 | % | 9.69 | % | 18.79 | % | 79.88 | % | ||||||||||
Net investment income (loss) | 3.57 | % | 0.74 | % | 1.47 | % | 1.31 | % | 0.51 | % | ||||||||||
Portfolio turnover rate(e) | 64 | % | 35 | % | 44 | % | 35 | % | 90 | % | ||||||||||
| (a) | Calculated based on average shares outstanding during the year. |
| (b) | Amount rounds to zero. |
| (c) | Total return is calculated assuming a purchase of a share on the first day and a sale on the last day of each year reported and includes reinvestment of dividends and distributions, if any. Total returns may reflect adjustments to conform to GAAP. |
| (d) | Does not include expenses of the underlying funds in which the Fund invests. Expenses waived/reimbursed include those of underlying funds in which the Fund invests. Consequently, the amount waived/reimbursed may be greater than the expense ratio reflected in the financial highlights. |
| (e) | The Fund’s portfolio turnover rate is calculated in accordance with regulatory requirements, without regard to transactions involving short-term investments, certain derivatives and in-kind transactions (if any). If such transactions were included, the Fund’s portfolio turnover rate may be higher. |
See Notes to Financial Statements.
192
Prudential Day One 2060 Fund
Financial Highlights (continued)
Class R3 Shares |
| |||||||||||||||||||
| Year Ended July 31, | ||||||||||||||||||||
| 2022 | 2021 | 2020 | 2019 | 2018 | ||||||||||||||||
Per Share Operating Performance(a): | ||||||||||||||||||||
Net Asset Value, Beginning of Year | $15.25 | $11.55 | $11.65 | $12.09 | $11.04 | |||||||||||||||
Income (loss) from investment operations: | ||||||||||||||||||||
Net investment income (loss) | 0.16 | 0.12 | 0.17 | 0.14 | 0.13 | |||||||||||||||
Net realized and unrealized gain (loss) on investment transactions | (1.28 | ) | 3.77 | 0.21 | (0.11 | ) | 1.16 | |||||||||||||
Total from investment operations | (1.12 | ) | 3.89 | 0.38 | 0.03 | 1.29 | ||||||||||||||
Less Dividends and Distributions: | ||||||||||||||||||||
Dividends from net investment income | (1.01 | ) | (0.13 | ) | (0.22 | ) | (0.30 | ) | (0.24 | ) | ||||||||||
Distributions from net realized gains | (0.23 | ) | (0.06 | ) | (0.26 | ) | (0.17 | ) | - | |||||||||||
Total dividends and distributions | (1.24 | ) | (0.19 | ) | (0.48 | ) | (0.47 | ) | (0.24 | ) | ||||||||||
Net asset value, end of year | $12.89 | $15.25 | $11.55 | $11.65 | $12.09 | |||||||||||||||
Total Return(b): | (8.28 | )% | 33.94 | % | 3.12 | % | 1.05 | % | 11.75 | % | ||||||||||
Ratios/Supplemental Data: | ||||||||||||||||||||
Net assets, end of year (000) | $31 | $1,472 | $685 | $279 | $121 | |||||||||||||||
Average net assets (000) | $55 | $1,051 | $450 | $173 | $80 | |||||||||||||||
Ratios to average net assets(c): | ||||||||||||||||||||
Expenses after waivers and/or expense reimbursement | 0.25 | % | 0.25 | % | 0.25 | % | 0.26 | % | 0.22 | % | ||||||||||
Expenses before waivers and/or expense reimbursement | 8.75 | % | 3.27 | % | 10.14 | % | 20.50 | % | 53.70 | % | ||||||||||
Net investment income (loss) | 1.25 | % | 0.89 | % | 1.54 | % | 1.25 | % | 1.11 | % | ||||||||||
Portfolio turnover rate(d) | 64 | % | 35 | % | 44 | % | 35 | % | 90 | % | ||||||||||
| (a) | Calculated based on average shares outstanding during the year. |
| (b) | Total return is calculated assuming a purchase of a share on the first day and a sale on the last day of each year reported and includes reinvestment of dividends and distributions, if any. Total returns may reflect adjustments to conform to GAAP. |
| (c) | Does not include expenses of the underlying funds in which the Fund invests. Expenses waived/reimbursed include those of underlying funds in which the Fund invests. Consequently, the amount waived/reimbursed may be greater than the expense ratio reflected in the financial highlights. |
| (d) | The Fund’s portfolio turnover rate is calculated in accordance with regulatory requirements, without regard to transactions involving short-term investments, certain derivatives and in-kind transactions (if any). If such transactions were included, the Fund’s portfolio turnover rate may be higher. |
See Notes to Financial Statements.
Prudential Day One Funds 193
Prudential Day One 2060 Fund
Financial Highlights (continued)
Class R4 Shares |
| |||||||||||||||||||
| Year Ended July 31, | ||||||||||||||||||||
| 2022 | 2021 | 2020 | 2019 | 2018 | ||||||||||||||||
Per Share Operating Performance(a): | ||||||||||||||||||||
Net Asset Value, Beginning of Year | $15.26 | $11.56 | $11.65 | $12.10 | $11.04 | |||||||||||||||
Income (loss) from investment operations: | ||||||||||||||||||||
Net investment income (loss) | 0.37 | 0.14 | 0.23 | 0.19 | 0.16 | |||||||||||||||
Net realized and unrealized gain (loss) on investment transactions | (1.47 | ) | 3.76 | 0.17 | (0.16 | ) | 1.15 | |||||||||||||
Total from investment operations | (1.10 | ) | 3.90 | 0.40 | 0.03 | 1.31 | ||||||||||||||
Less Dividends and Distributions: | ||||||||||||||||||||
Dividends from net investment income | (1.02 | ) | (0.14 | ) | (0.23 | ) | (0.31 | ) | (0.25 | ) | ||||||||||
Distributions from net realized gains | (0.23 | ) | (0.06 | ) | (0.26 | ) | (0.17 | ) | - | |||||||||||
Total dividends and distributions | (1.25 | ) | (0.20 | ) | (0.49 | ) | (0.48 | ) | (0.25 | ) | ||||||||||
Net asset value, end of year | $12.91 | $15.26 | $11.56 | $11.65 | $12.10 | |||||||||||||||
Total Return(b): | (8.12 | )% | 34.14 | % | 3.18 | % | 1.09 | % | 11.96 | % | ||||||||||
Ratios/Supplemental Data: | ||||||||||||||||||||
Net assets, end of year (000) | $18 | $17 | $13 | $12 | $13 | |||||||||||||||
Average net assets (000) | $17 | $15 | $12 | $12 | $12 | |||||||||||||||
Ratios to average net assets(c): | ||||||||||||||||||||
Expenses after waivers and/or expense reimbursement | 0.16 | % | 0.15 | % | 0.15 | % | 0.16 | % | 0.11 | % | ||||||||||
Expenses before waivers and/or expense reimbursement | 22.95 | % | 44.92 | % | 112.23 | % | 106.19 | % | 147.15 | % | ||||||||||
Net investment income (loss) | 2.60 | % | 1.06 | % | 2.06 | % | 1.66 | % | 1.35 | % | ||||||||||
Portfolio turnover rate(d) | 64 | % | 35 | % | 44 | % | 35 | % | 90 | % | ||||||||||
| (a) | Calculated based on average shares outstanding during the year. |
| (b) | Total return is calculated assuming a purchase of a share on the first day and a sale on the last day of each year reported and includes reinvestment of dividends and distributions, if any. Total returns may reflect adjustments to conform to GAAP. |
| (c) | Does not include expenses of the underlying funds in which the Fund invests. Expenses waived/reimbursed include those of underlying funds in which the Fund invests. Consequently, the amount waived/reimbursed may be greater than the expense ratio reflected in the financial highlights. |
| (d) | The Fund’s portfolio turnover rate is calculated in accordance with regulatory requirements, without regard to transactions involving short-term investments, certain derivatives and in-kind transactions (if any). If such transactions were included, the Fund’s portfolio turnover rate may be higher. |
See Notes to Financial Statements.
194
Prudential Day One 2060 Fund
Financial Highlights (continued)
Class R5 Shares |
| |||||||||||||||||||
| Year Ended July 31, | ||||||||||||||||||||
| 2022 | 2021 | 2020 | 2019 | 2018 | ||||||||||||||||
Per Share Operating Performance(a): | ||||||||||||||||||||
Net Asset Value, Beginning of Year | $15.28 | $11.57 | $11.66 | $12.11 | $11.05 | |||||||||||||||
Income (loss) from investment operations: | ||||||||||||||||||||
Net investment income (loss) | 0.36 | 0.14 | 0.21 | 0.02 | 0.16 | |||||||||||||||
Net realized and unrealized gain (loss) on investment transactions | (1.45 | ) | 3.78 | 0.20 | 0.02 | 1.16 | ||||||||||||||
Total from investment operations | (1.09 | ) | 3.92 | 0.41 | 0.04 | 1.32 | ||||||||||||||
Less Dividends and Distributions: | ||||||||||||||||||||
Dividends from net investment income | (1.03 | ) | (0.15 | ) | (0.24 | ) | (0.32 | ) | (0.26 | ) | ||||||||||
Distributions from net realized gains | (0.23 | ) | (0.06 | ) | (0.26 | ) | (0.17 | ) | - | |||||||||||
Total dividends and distributions | (1.26 | ) | (0.21 | ) | (0.50 | ) | (0.49 | ) | (0.26 | ) | ||||||||||
Net asset value, end of year | $12.93 | $15.28 | $11.57 | $11.66 | $12.11 | |||||||||||||||
Total Return(b): | (8.01 | )% | 34.21 | % | 3.30 | % | 1.21 | % | 12.06 | % | ||||||||||
Ratios/Supplemental Data: | ||||||||||||||||||||
Net assets, end of year (000) | $442 | $227 | $95 | $67 | $16 | |||||||||||||||
Average net assets (000) | $333 | $154 | $84 | $35 | $13 | |||||||||||||||
Ratios to average net assets(c): | ||||||||||||||||||||
Expenses after waivers and/or expense reimbursement | 0.06 | % | 0.05 | % | 0.05 | % | 0.06 | % | 0.01 | % | ||||||||||
Expenses before waivers and/or expense reimbursement | 2.96 | % | 6.69 | % | 22.80 | % | 45.88 | % | 140.94 | % | ||||||||||
Net investment income (loss) | 2.58 | % | 1.02 | % | 1.91 | % | 0.15 | % | 1.39 | % | ||||||||||
Portfolio turnover rate(d) | 64 | % | 35 | % | 44 | % | 35 | % | 90 | % | ||||||||||
| (a) | Calculated based on average shares outstanding during the year. |
| (b) | Total return is calculated assuming a purchase of a share on the first day and a sale on the last day of each year reported and includes reinvestment of dividends and distributions, if any. Total returns may reflect adjustments to conform to GAAP. |
| (c) | Does not include expenses of the underlying funds in which the Fund invests. Expenses waived/reimbursed include those of underlying funds in which the Fund invests. Consequently, the amount waived/reimbursed may be greater than the expense ratio reflected in the financial highlights. |
| (d) | The Fund’s portfolio turnover rate is calculated in accordance with regulatory requirements, without regard to transactions involving short-term investments, certain derivatives and in-kind transactions (if any). If such transactions were included, the Fund’s portfolio turnover rate may be higher. |
See Notes to Financial Statements.
Prudential Day One Funds 195
Prudential Day One 2060 Fund
Financial Highlights (continued)
Class R6 Shares |
| |||||||||||||||||||
| Year Ended July 31, | ||||||||||||||||||||
| 2022 | 2021 | 2020 | 2019 | 2018 | ||||||||||||||||
Per Share Operating Performance(a): | ||||||||||||||||||||
Net Asset Value, Beginning of Year | $15.31 | $11.58 | $11.66 | $12.11 | $11.06 | |||||||||||||||
Income (loss) from investment operations: | ||||||||||||||||||||
Net investment income (loss) | 0.40 | 0.15 | 0.24 | 0.22 | 0.22 | |||||||||||||||
Net realized and unrealized gain (loss) on investment transactions | (1.47 | ) | 3.81 | 0.18 | (0.16 | ) | 1.11 | |||||||||||||
Total from investment operations | (1.07 | ) | 3.96 | 0.42 | 0.06 | 1.33 | ||||||||||||||
Less Dividends and Distributions: | ||||||||||||||||||||
Dividends from net investment income | (1.06 | ) | (0.17 | ) | (0.24 | ) | (0.34 | ) | (0.28 | ) | ||||||||||
Distributions from net realized gains | (0.23 | ) | (0.06 | ) | (0.26 | ) | (0.17 | ) | - | |||||||||||
Total dividends and distributions | (1.29 | ) | (0.23 | ) | (0.50 | ) | (0.51 | ) | (0.28 | ) | ||||||||||
Net asset value, end of year | $12.95 | $15.31 | $11.58 | $11.66 | $12.11 | |||||||||||||||
Total Return(b): | (7.93 | )% | 34.50 | % | 3.46 | % | 1.39 | % | 12.12 | % | ||||||||||
| ||||||||||||||||||||
Ratios/Supplemental Data: | ||||||||||||||||||||
Net assets, end of year (000) | $6,246 | $5,912 | $2,154 | $1,424 | $452 | |||||||||||||||
Average net assets (000) | $6,501 | $4,213 | $1,657 | $981 | $266 | |||||||||||||||
Ratios to average net assets(c): | ||||||||||||||||||||
Expenses after waivers and/or expense reimbursement(d) | 0.00 | % | 0.00 | % | 0.00 | % | 0.00 | % | 0.00 | % | ||||||||||
| Expenses after waivers and/or reimbursement inclusive of excess expense reimbursement from the manager | (0.09 | )% | (0.10 | )% | (0.10 | )% | (0.09 | )% | (0.14 | )% | ||||||||||
Expenses before waivers and/or expense reimbursement | 1.79 | % | 2.32 | % | 7.79 | % | 14.67 | % | 42.30 | % | ||||||||||
Net investment income (loss) | 2.85 | % | 1.11 | % | 2.09 | % | 1.90 | % | 1.84 | % | ||||||||||
Portfolio turnover rate(e) | 64 | % | 35 | % | 44 | % | 35 | % | 90 | % | ||||||||||
| (a) | Calculated based on average shares outstanding during the year. |
| (b) | Total return is calculated assuming a purchase of a share on the first day and a sale on the last day of each year reported and includes reinvestment of dividends and distributions, if any. Total returns may reflect adjustments to conform to GAAP. |
| (c) | Does not include expenses of the underlying funds in which the Fund invests. Expenses waived/reimbursed include those of underlying funds in which the Fund invests. Consequently, the amount waived/reimbursed may be greater than the expense ratio reflected in the financial highlights. |
| (d) | As a result of reimbursing expenses, including underlying fund expenses, the Manager may reimburse amounts in excess of the respective share classes’ operating expenses. |
| (e) | The Fund’s portfolio turnover rate is calculated in accordance with regulatory requirements, without regard to transactions involving short-term investments, certain derivatives and in-kind transactions (if any). If such transactions were included, the Fund’s portfolio turnover rate may be higher. |
See Notes to Financial Statements.
196
Prudential Day One 2065 Fund
Schedule of Investments
as of July 31, 2022
Description | Shares | Value | ||||||
LONG-TERM INVESTMENTS 99.9% | ||||||||
AFFILIATED MUTUAL FUNDS | ||||||||
PGIM Global Real Estate Fund (Class R6) | 894 | $ | 18,300 | |||||
PGIM Jennison Small-Cap Core Equity Fund (Class R6) | 1,863 | 22,876 | ||||||
PGIM Quant Solutions Commodity Strategies Fund (Class R6) | 1,310 | 13,790 | ||||||
PGIM Quant Solutions Emerging Markets Equity Fund (Class R6) | 3,815 | 40,625 | ||||||
PGIM Quant Solutions International Developed Markets Index Fund (Class R6) | 9,499 | 114,364 | ||||||
PGIM Quant Solutions Large-Cap Core Fund (Class R6) | 6,583 | 114,876 | ||||||
PGIM Quant Solutions Mid-Cap Core Fund (Class R6) | 3,912 | 42,048 | ||||||
PGIM Quant Solutions US Broad Market Index Fund (Class R6) | 4,504 | 75,856 | ||||||
PGIM Total Return Bond Fund (Class R6) | 1,218 | 15,500 | ||||||
|
| |||||||
TOTAL LONG-TERM INVESTMENTS (cost $446,221) | 458,235 | |||||||
|
| |||||||
SHORT-TERM INVESTMENT 0.1% | ||||||||
AFFILIATED MUTUAL FUND | ||||||||
PGIM Core Ultra Short Bond Fund (cost $277) | 277 | 277 | ||||||
|
| |||||||
TOTAL INVESTMENTS 100.0% (cost $446,498)(wd) | 458,512 | |||||||
Other assets in excess of liabilities 0.0% | 86 | |||||||
|
| |||||||
NET ASSETS 100.0% | $ | 458,598 | ||||||
|
| |||||||
Below is a list of the abbreviation(s) used in the annual report:
LIBOR—London Interbank Offered Rate
| (wd) | PGIM Investments LLC, the manager of the Fund, also serves as the manager of the underlying funds in which the Fund invests. |
Fair Value Measurements:
Various inputs are used in determining the value of the Fund’s investments. These inputs are summarized in the three broad levels listed below.
Level 1—unadjusted quoted prices generally in active markets for identical securities.
Level 2—quoted prices for similar securities, interest rates and yield curves, prepayment speeds, foreign currency exchange rates and other observable inputs.
Level 3—unobservable inputs for securities valued in accordance with Board approved fair valuation procedures.
See Notes to Financial Statements.
Prudential Day One Funds 197
Prudential Day One 2065 Fund
Schedule of Investments (continued)
as of July 31, 2022
The following is a summary of the inputs used as of July 31, 2022 in valuing such portfolio securities:
| Level 1 | Level 2 | Level 3 | ||||||||||||||||||||||||||
Investments in Securities | ||||||||||||||||||||||||||||
Assets | ||||||||||||||||||||||||||||
Long-Term Investments | ||||||||||||||||||||||||||||
Affiliated Mutual Funds | $ | 458,235 | $ | — | $ | — | ||||||||||||||||||||||
Short-Term Investment | ||||||||||||||||||||||||||||
Affiliated Mutual Fund | 277 | — | — | |||||||||||||||||||||||||
|
|
|
|
|
| |||||||||||||||||||||||
Total | $ | 458,512 | $ | — | $ | — | ||||||||||||||||||||||
|
|
|
|
|
| |||||||||||||||||||||||
Investment Allocation:
The investment allocation of portfolio holdings and other assets in excess of liabilities shown as a percentage of net assets as of July 31, 2022 were as follows:
Large Cap | 25.0 | % | ||
International Developed Markets | 24.9 | |||
Broad Market | 16.5 | |||
Mid Cap | 9.2 | |||
Emerging Markets | 8.9 | |||
Small Cap | 5.0 | |||
Real Estate | 4.0 | |||
Total Return Bond | 3.4 |
Commodity | 3.0 | % | ||
Short Term | 0.1 | |||
|
| |||
| 100.0 | ||||
Other assets in excess of liabilities | 0.0 | * | ||
|
| |||
| 100.0 | % | |||
|
| |||
| * | Less than +/- 0.05% |
See Notes to Financial Statements.
198
Prudential Day One 2065 Fund
Statement of Assets & Liabilities
as of July 31, 2022
Assets | ||||
Affiliated investments (cost $446,498) | $ | 458,512 | ||
Due from Manager | 45,263 | |||
Receivable for investments sold | 2,417 | |||
Receivable for Fund shares sold | 263 | |||
Prepaid expenses | 65 | |||
|
| |||
Total Assets | 506,520 | |||
|
| |||
Liabilities | ||||
Audit fee payable | 17,500 | |||
Custodian and accounting fees payable | 15,866 | |||
Legal fees and expenses payable | 5,478 | |||
Shareholders’ reports payable | 3,464 | |||
Payable for investments purchased | 2,672 | |||
Accrued expenses and other liabilities | 1,952 | |||
Trustees’ fees payable | 800 | |||
Affiliated transfer agent fee payable | 166 | |||
Distribution fee payable | 23 | |||
Payable for Fund shares purchased | 1 | |||
|
| |||
Total Liabilities | 47,922 | |||
|
| |||
Net Assets | $ | 458,598 | ||
|
| |||
Net assets were comprised of: | ||||
Shares of beneficial interest, at par | $ | 42 | ||
Paid-in capital in excess of par | 464,491 | |||
Total distributable earnings (loss) | (5,935 | ) | ||
|
| |||
Net assets, July 31, 2022 | $ | 458,598 | ||
|
| |||
See Notes to Financial Statements.
Prudential Day One Funds 199
Prudential Day One 2065 Fund
Statement of Assets & Liabilities (continued)
as of July 31, 2022
Class R1 | ||||||||
Net asset value, offering price and redemption price per share, ($11,755 ÷ 1,089 shares of beneficial interest issued and outstanding) | $ | 10.80 | ||||||
|
| |||||||
Class R2 | ||||||||
Net asset value, offering price and redemption price per share, ($72,883 ÷ 6,736 shares of beneficial interest issued and outstanding) | $ | 10.82 | ||||||
|
| |||||||
Class R3 | ||||||||
Net asset value, offering price and redemption price per share, ($11,879 ÷ 1,097 shares of beneficial interest issued and outstanding) | $ | 10.83 | ||||||
|
| |||||||
Class R4 | ||||||||
Net asset value, offering price and redemption price per share, ($11,910 ÷ 1,099 shares of beneficial interest issued and outstanding) | $ | 10.84 | ||||||
|
| |||||||
Class R5 | ||||||||
Net asset value, offering price and redemption price per share, ($14,187 ÷ 1,308 shares of beneficial interest issued and outstanding) | $ | 10.85 | ||||||
|
| |||||||
Class R6 | ||||||||
Net asset value, offering price and redemption price per share, ($335,984 ÷ 30,930 shares of beneficial interest issued and outstanding) | $ | 10.86 | ||||||
|
| |||||||
Net asset value per share may not recalculate due to rounding.
See Notes to Financial Statements.
200
Prudential Day One 2065 Fund
Statement of Operations
Year Ended July 31, 2022
Net Investment Income (Loss) | ||||
Affiliated dividend income | $ | 14,359 | ||
|
| |||
Expenses | ||||
Management fee | 111 | |||
Distribution fee(a) | 239 | |||
Custodian and accounting fees | 65,656 | |||
Registration fees(a) | 26,456 | |||
Legal fees and expenses | 20,625 | |||
Audit fee | 17,500 | |||
Trustees’ fees | 9,600 | |||
Shareholders’ reports | 7,917 | |||
Pricing fees | 2,974 | |||
Transfer agent’s fees and expenses (including affiliated expense of $ 907)(a) | 1,466 | |||
Miscellaneous | 11,287 | |||
|
| |||
Total expenses | 163,831 | |||
Less: Fee waiver and/or expense reimbursement(a) | (163,828 | ) | ||
|
| |||
Net expenses | 3 | |||
|
| |||
Net investment income (loss) | 14,356 | |||
|
| |||
Realized And Unrealized Gain (Loss) On Affiliated Investments | ||||
Net realized gain (loss) on investment transactions | (33,758 | ) | ||
Net capital gain distributions received | 45,678 | |||
|
| |||
| 11,920 | ||||
|
| |||
Net change in unrealized appreciation (depreciation) on investments | (87,127 | ) | ||
|
| |||
Net gain (loss) on investment transactions | (75,207 | ) | ||
|
| |||
Net Increase (Decrease) In Net Assets Resulting From Operations | $ | (60,851 | ) | |
|
| |||
| (a) | Class specific expenses and waivers were as follows: |
| Class R1 | Class R2 | Class R3 | Class R4 | Class R5 | Class R6 | |||||||||||||||||||
Distribution fee | 63 | 163 | 13 | — | — | — | ||||||||||||||||||
Registration fees | 4,201 | 5,451 | 4,201 | 4,201 | 4,201 | 4,201 | ||||||||||||||||||
Transfer agent’s fees and expenses | 50 | 607 | 46 | 46 | 101 | 616 | ||||||||||||||||||
Fee waiver and/or expense reimbursement | (7,333 | ) | (22,253 | ) | (7,356 | ) | (7,361 | ) | (7,833 | ) | (111,692 | ) | ||||||||||||
See Notes to Financial Statements.
Prudential Day One Funds 201
Prudential Day One 2065 Fund
Statements of Changes in Net Assets
Year Ended July 31, | ||||||||
|
| |||||||
| 2022 | 2021 | |||||||
Increase (Decrease) in Net Assets | ||||||||
Operations | ||||||||
Net investment income (loss) | $ | 14,356 | $ | 3,645 | ||||
Net realized gain (loss) on investment transactions | (33,758 | ) | 2,046 | |||||
Net capital gain distributions received | 45,678 | 1,603 | ||||||
Net change in unrealized appreciation (depreciation) on investments | (87,127 | ) | 94,652 | |||||
|
|
|
| |||||
Net increase (decrease) in net assets resulting from operations | (60,851 | ) | 101,946 | |||||
|
|
|
| |||||
Dividends and Distributions | ||||||||
Distributions from distributable earnings | ||||||||
Class R1 | (960 | ) | (59 | ) | ||||
Class R2 | (4,378 | ) | (136 | ) | ||||
Class R3 | (1,014 | ) | (97 | ) | ||||
Class R4 | (1,027 | ) | (107 | ) | ||||
Class R5 | (1,151 | ) | (129 | ) | ||||
Class R6 | (33,620 | ) | (3,223 | ) | ||||
|
|
|
| |||||
| (42,150 | ) | (3,751 | ) | |||||
|
|
|
| |||||
Fund share transactions | ||||||||
Net proceeds from shares sold | 297,697 | 551,887 | ||||||
Net asset value of shares issued in reinvestment of dividends and distributions | 42,150 | 3,751 | ||||||
Cost of shares purchased | (300,637 | ) | (323,751 | ) | ||||
|
|
|
| |||||
Net increase (decrease) in net assets from Fund share transactions | 39,210 | 231,887 | ||||||
|
|
|
| |||||
Total increase (decrease) | (63,791 | ) | 330,082 | |||||
Net Assets: | ||||||||
Beginning of year | 522,389 | 192,307 | ||||||
|
|
|
| |||||
End of year | $ | 458,598 | $ | 522,389 | ||||
|
|
|
| |||||
See Notes to Financial Statements.
202
Prudential Day One 2065 Fund
Financial Highlights
Class R1 Shares |
| |||||||||||||||
Year Ended July 31, | December 16, 2019(a) through July 31, 2020 | |||||||||||||||
2022 |
2021 | |||||||||||||||
Per Share Operating Performance(b): | ||||||||||||||||
Net Asset Value, Beginning of Period | $12.74 | $9.56 | $10.00 | |||||||||||||
Income (loss) from investment operations: | ||||||||||||||||
Net investment income (loss) | 0.26 | 0.06 | 0.02 | |||||||||||||
Net realized and unrealized gain (loss) on investment transactions | (1.25 | ) | 3.18 | (0.41 | ) | |||||||||||
Total from investment operations | (0.99 | ) | 3.24 | (0.39 | ) | |||||||||||
Less Dividends and Distributions: | ||||||||||||||||
Dividends from net investment income | (0.79 | ) | (0.05 | ) | (0.05 | ) | ||||||||||
Distributions from net realized gains | (0.16 | ) | (0.01 | ) | - | |||||||||||
Total dividends and distributions | (0.95 | ) | (0.06 | ) | (0.05 | ) | ||||||||||
Net asset value, end of period | $10.80 | $12.74 | $9.56 | |||||||||||||
Total Return(c): | (8.61 | )% | 33.98 | % | (3.96 | )% | ||||||||||
Ratios/Supplemental Data: | ||||||||||||||||
Net assets, end of period (000) | $12 | $13 | $10 | |||||||||||||
Average net assets (000) | $13 | $11 | $9 | |||||||||||||
Ratios to average net assets(d): | ||||||||||||||||
Expenses after waivers and/or expense reimbursement | 0.66 | % | 0.65 | % | 0.65 | %(e) | ||||||||||
Expenses before waivers and/or expense reimbursement | 59.08 | % | 96.73 | % | 485.07 | %(e) | ||||||||||
Net investment income (loss) | 2.16 | % | 0.55 | % | 0.32 | %(e) | ||||||||||
Portfolio turnover rate(f) | 67 | % | 94 | % | 19 | % | ||||||||||
| (a) | Commencement of operations. |
| (b) | Calculated based on average shares outstanding during the period. |
| (c) | Total return is calculated assuming a purchase of a share on the first day and a sale on the last day of each period reported and includes reinvestment of dividends and distributions, if any. Total returns may reflect adjustments to conform to GAAP. Total returns for periods less than one full year are not annualized. |
| (d) | Does not include expenses of the underlying funds in which the Fund invests. Expenses waived/reimbursed include those of underlying funds in which the Fund invests. Consequently, the amount waived/reimbursed may be greater than the expense ratio reflected in the financial highlights. |
| (e) | Annualized. |
| (f) | The Fund’s portfolio turnover rate is calculated in accordance with regulatory requirements, without regard to transactions involving short-term investments, certain derivatives and in-kind transactions (if any). If such transactions were included, the Fund’s portfolio turnover rate may be higher. |
See Notes to Financial Statements.
Prudential Day One Funds 203
Prudential Day One 2065 Fund
Financial Highlights (continued)
Class R2 Shares |
| |||||||||||||||
Year Ended July 31, | December 16, 2019(a) through July 31, 2020 | |||||||||||||||
2022 |
2021 | |||||||||||||||
Per Share Operating Performance(b): | ||||||||||||||||
Net Asset Value, Beginning of Period | $12.77 | $9.58 | $10.00 | |||||||||||||
Income (loss) from investment operations: | ||||||||||||||||
Net investment income (loss) | 0.23 | 0.07 | 0.03 | |||||||||||||
Net realized and unrealized gain (loss) on investment transactions | (1.20 | ) | 3.20 | (0.40 | ) | |||||||||||
Total from investment operations | (0.97 | ) | 3.27 | (0.37 | ) | |||||||||||
Less Dividends and Distributions: | ||||||||||||||||
Dividends from net investment income | (0.82 | ) | (0.07 | ) | (0.05 | ) | ||||||||||
Distributions from net realized gains | (0.16 | ) | (0.01 | ) | - | |||||||||||
Total dividends and distributions | (0.98 | ) | (0.08 | ) | (0.05 | ) | ||||||||||
Net asset value, end of period | $10.82 | $12.77 | $9.58 | |||||||||||||
Total Return(c): | (8.45 | )% | 34.30 | % | (3.75 | )% | ||||||||||
Ratios/Supplemental Data: | ||||||||||||||||
Net assets, end of period (000) | $73 | $36 | $12 | |||||||||||||
Average net assets (000) | $65 | $22 | $10 | |||||||||||||
Ratios to average net assets(d): | ||||||||||||||||
Expenses after waivers and/or expense reimbursement | 0.41 | % | 0.40 | % | 0.40 | %(e) | ||||||||||
Expenses before waivers and/or expense reimbursement | 34.43 | % | 71.91 | % | 446.28 | %(e) | ||||||||||
Net investment income (loss) | 1.97 | % | 0.63 | % | 0.49 | %(e) | ||||||||||
Portfolio turnover rate(f) | 67 | % | 94 | % | 19 | % | ||||||||||
| (a) | Commencement of operations. |
| (b) | Calculated based on average shares outstanding during the period. |
| (c) | Total return is calculated assuming a purchase of a share on the first day and a sale on the last day of each period reported and includes reinvestment of dividends and distributions, if any. Total returns may reflect adjustments to conform to GAAP. Total returns for periods less than one full year are not annualized. |
| (d) | Does not include expenses of the underlying funds in which the Fund invests. Expenses waived/reimbursed include those of underlying funds in which the Fund invests. Consequently, the amount waived/reimbursed may be greater than the expense ratio reflected in the financial highlights. |
| (e) | Annualized. |
| (f) | The Fund’s portfolio turnover rate is calculated in accordance with regulatory requirements, without regard to transactions involving short-term investments, certain derivatives and in-kind transactions (if any). If such transactions were included, the Fund’s portfolio turnover rate may be higher. |
See Notes to Financial Statements.
204
Prudential Day One 2065 Fund
Financial Highlights (continued)
Class R3 Shares |
| |||||||||||||||
Year Ended July 31, | December 16, 2019(a) through July 31, 2020 | |||||||||||||||
2022 |
2021 | |||||||||||||||
Per Share Operating Performance(b): | ||||||||||||||||
Net Asset Value, Beginning of Period | $12.78 | $9.59 | $10.00 | |||||||||||||
Income (loss) from investment operations: | ||||||||||||||||
Net investment income (loss) | 0.30 | 0.11 | 0.04 | |||||||||||||
Net realized and unrealized gain (loss) on investment transactions | (1.25 | ) | 3.18 | (0.40 | ) | |||||||||||
Total from investment operations | (0.95 | ) | 3.29 | (0.36 | ) | |||||||||||
Less Dividends and Distributions: | ||||||||||||||||
Dividends from net investment income | (0.84 | ) | (0.09 | ) | (0.05 | ) | ||||||||||
Distributions from net realized gains | (0.16 | ) | (0.01 | ) | - | |||||||||||
Total dividends and distributions | (1.00 | ) | (0.10 | ) | (0.05 | ) | ||||||||||
Net asset value, end of period | $10.83 | $12.78 | $9.59 | |||||||||||||
Total Return(c): | (8.30 | )% | 34.44 | % | (3.65 | )% | ||||||||||
Ratios/Supplemental Data: | ||||||||||||||||
Net assets, end of period (000) | $12 | $13 | $10 | |||||||||||||
Average net assets (000) | $13 | $11 | $9 | |||||||||||||
Ratios to average net assets(d): | ||||||||||||||||
Expenses after waivers and/or expense reimbursement | 0.26 | % | 0.25 | % | 0.25 | %(e) | ||||||||||
Expenses before waivers and/or expense reimbursement | 58.37 | % | 96.05 | % | 484.23 | %(e) | ||||||||||
Net investment income (loss) | 2.56 | % | 0.95 | % | 0.72 | %(e) | ||||||||||
Portfolio turnover rate(f) | 67 | % | 94 | % | 19 | % | ||||||||||
| (a) | Commencement of operations. |
| (b) | Calculated based on average shares outstanding during the period. |
| (c) | Total return is calculated assuming a purchase of a share on the first day and a sale on the last day of each period reported and includes reinvestment of dividends and distributions, if any. Total returns may reflect adjustments to conform to GAAP. Total returns for periods less than one full year are not annualized. |
| (d) | Does not include expenses of the underlying funds in which the Fund invests. Expenses waived/reimbursed include those of underlying funds in which the Fund invests. Consequently, the amount waived/reimbursed may be greater than the expense ratio reflected in the financial highlights. |
| (e) | Annualized. |
| (f) | The Fund’s portfolio turnover rate is calculated in accordance with regulatory requirements, without regard to transactions involving short-term investments, certain derivatives and in-kind transactions (if any). If such transactions were included, the Fund’s portfolio turnover rate may be higher. |
See Notes to Financial Statements.
Prudential Day One Funds 205
Prudential Day One 2065 Fund
Financial Highlights (continued)
Class R4 Shares |
| |||||||||||||||
Year Ended July 31, | December 16, 2019(a) through July 31, 2020 | |||||||||||||||
2022 |
2021 | |||||||||||||||
Per Share Operating Performance(b): | ||||||||||||||||
Net Asset Value, Beginning of Period | $12.79 | $9.59 | $10.00 | |||||||||||||
Income (loss) from investment operations: | ||||||||||||||||
Net investment income (loss) | 0.32 | 0.12 | 0.05 | |||||||||||||
Net realized and unrealized gain (loss) on investment transactions | (1.26 | ) | 3.19 | (0.41 | ) | |||||||||||
Total from investment operations | (0.94 | ) | 3.31 | (0.36 | ) | |||||||||||
Less Dividends and Distributions: | ||||||||||||||||
Dividends from net investment income | (0.85 | ) | (0.10 | ) | (0.05 | ) | ||||||||||
Distributions from net realized gains | (0.16 | ) | (0.01 | ) | - | |||||||||||
Total dividends and distributions | (1.01 | ) | (0.11 | ) | (0.05 | ) | ||||||||||
Net asset value, end of period | $10.84 | $12.79 | $9.59 | |||||||||||||
Total Return(c): | (8.21 | )% | 34.66 | % | (3.64 | )% | ||||||||||
Ratios/Supplemental Data: | ||||||||||||||||
Net assets, end of period (000) | $12 | $13 | $10 | |||||||||||||
Average net assets (000) | $13 | $11 | $9 | |||||||||||||
Ratios to average net assets(d): | ||||||||||||||||
Expenses after waivers and/or expense reimbursement | 0.16 | % | 0.15 | % | 0.15 | %(e) | ||||||||||
Expenses before waivers and/or expense reimbursement | 58.20 | % | 95.88 | % | 484.02 | %(e) | ||||||||||
Net investment income (loss) | 2.66 | % | 1.04 | % | 0.82 | %(e) | ||||||||||
Portfolio turnover rate(f) | 67 | % | 94 | % | 19 | % | ||||||||||
| (a) | Commencement of operations. |
| (b) | Calculated based on average shares outstanding during the period. |
| (c) | Total return is calculated assuming a purchase of a share on the first day and a sale on the last day of each period reported and includes reinvestment of dividends and distributions, if any. Total returns may reflect adjustments to conform to GAAP. Total returns for periods less than one full year are not annualized. |
| (d) | Does not include expenses of the underlying funds in which the Fund invests. Expenses waived/reimbursed include those of underlying funds in which the Fund invests. Consequently, the amount waived/reimbursed may be greater than the expense ratio reflected in the financial highlights. |
| (e) | Annualized. |
| (f) | The Fund’s portfolio turnover rate is calculated in accordance with regulatory requirements, without regard to transactions involving short-term investments, certain derivatives and in-kind transactions (if any). If such transactions were included, the Fund’s portfolio turnover rate may be higher. |
See Notes to Financial Statements.
206
Prudential Day One 2065 Fund
Financial Highlights (continued)
Class R5 Shares |
| |||||||||||||||
Year Ended July 31, | December 16, 2019(a) through July 31, 2020 | |||||||||||||||
2022 |
2021 | |||||||||||||||
Per Share Operating Performance(b): | ||||||||||||||||
Net Asset Value, Beginning of Period | $12.80 | $9.60 | $10.00 | |||||||||||||
Income (loss) from investment operations: | ||||||||||||||||
Net investment income (loss) | 0.32 | 0.13 | 0.05 | |||||||||||||
Net realized and unrealized gain (loss) on investment transactions | (1.24 | ) | 3.19 | (0.40 | ) | |||||||||||
Total from investment operations | (0.92 | ) | 3.32 | (0.35 | ) | |||||||||||
Less Dividends and Distributions: | ||||||||||||||||
Dividends from net investment income | (0.87 | ) | (0.11 | ) | (0.05 | ) | ||||||||||
Distributions from net realized gains | (0.16 | ) | (0.01 | ) | - | |||||||||||
Total dividends and distributions | (1.03 | ) | (0.12 | ) | (0.05 | ) | ||||||||||
Net asset value, end of period | $10.85 | $12.80 | $9.60 | |||||||||||||
Total Return(c): | (8.11 | )% | 34.74 | % | (3.54 | )% | ||||||||||
Ratios/Supplemental Data: | ||||||||||||||||
Net assets, end of period (000) | $14 | $14 | $11 | |||||||||||||
Average net assets (000) | $14 | $13 | $10 | |||||||||||||
Ratios to average net assets(d): | ||||||||||||||||
Expenses after waivers and/or expense reimbursement | 0.06 | % | 0.05 | % | 0.05 | %(e) | ||||||||||
Expenses before waivers and/or expense reimbursement | 54.91 | % | 93.88 | % | 458.95 | %(e) | ||||||||||
Net investment income (loss) | 2.72 | % | 1.14 | % | 0.83 | %(e) | ||||||||||
Portfolio turnover rate(f) | 67 | % | 94 | % | 19 | % | ||||||||||
| (a) | Commencement of operations. |
| (b) | Calculated based on average shares outstanding during the period. |
| (c) | Total return is calculated assuming a purchase of a share on the first day and a sale on the last day of each period reported and includes reinvestment of dividends and distributions, if any. Total returns may reflect adjustments to conform to GAAP. Total returns for periods less than one full year are not annualized. |
| (d) | Does not include expenses of the underlying funds in which the Fund invests. Expenses waived/reimbursed include those of underlying funds in which the Fund invests. Consequently, the amount waived/reimbursed may be greater than the expense ratio reflected in the financial highlights. |
| (e) | Annualized. |
| (f) | The Fund’s portfolio turnover rate is calculated in accordance with regulatory requirements, without regard to transactions involving short-term investments, certain derivatives and in-kind transactions (if any). If such transactions were included, the Fund’s portfolio turnover rate may be higher. |
See Notes to Financial Statements.
Prudential Day One Funds 207
Prudential Day One 2065 Fund
Financial Highlights (continued)
Class R6 Shares |
| |||||||||||||||
Year Ended July 31, | December 16, 2019(a) through July 31, 2020 | |||||||||||||||
2022 |
2021 | |||||||||||||||
Per Share Operating Performance(b): | ||||||||||||||||
Net Asset Value, Beginning of Period | $12.81 | $9.61 | $10.00 | |||||||||||||
Income (loss) from investment operations: | ||||||||||||||||
Net investment income (loss) | 0.32 | 0.11 | 0.01 | |||||||||||||
Net realized and unrealized gain (loss) on investment transactions | (1.23 | ) | 3.22 | (0.35 | ) | |||||||||||
Total from investment operations | (0.91 | ) | 3.33 | (0.34 | ) | |||||||||||
Less Dividends and Distributions: | ||||||||||||||||
Dividends from net investment income | (0.88 | ) | (0.12 | ) | (0.05 | ) | ||||||||||
Distributions from net realized gains | (0.16 | ) | (0.01 | ) | - | |||||||||||
Total dividends and distributions | (1.04 | ) | (0.13 | ) | (0.05 | ) | ||||||||||
Net asset value, end of period | $10.86 | $12.81 | $9.61 | |||||||||||||
Total Return(c): | (7.97 | )% | 34.88 | % | (3.43 | )% | ||||||||||
Ratios/Supplemental Data: | ||||||||||||||||
Net assets, end of period (000) | $336 | $433 | $141 | |||||||||||||
Average net assets (000) | $435 | $331 | $77 | |||||||||||||
Ratios to average net assets(d): | ||||||||||||||||
Expenses after waivers and/or expense reimbursement(e) | 0.00 | % | 0.00 | % | 0.00 | %(f) | ||||||||||
| Expenses after waivers and/or reimbursement inclusive of excess expense reimbursement from the manager | (0.09 | )% | (0.10 | )% | (0.11 | )%(f) | ||||||||||
Expenses before waivers and/or expense reimbursement | 25.56 | % | 34.59 | % | 166.46 | %(f) | ||||||||||
Net investment income (loss) | 2.70 | % | 0.93 | % | 0.11 | %(f) | ||||||||||
Portfolio turnover rate(g) | 67 | % | 94 | % | 19 | % | ||||||||||
| (a) | Commencement of operations. |
| (b) | Calculated based on average shares outstanding during the period. |
| (c) | Total return is calculated assuming a purchase of a share on the first day and a sale on the last day of each period reported and includes reinvestment of dividends and distributions, if any. Total returns may reflect adjustments to conform to GAAP. Total returns for periods less than one full year are not annualized. |
| (d) | Does not include expenses of the underlying funds in which the Fund invests. Expenses waived/reimbursed include those of underlying funds in which the Fund invests. Consequently, the amount waived/reimbursed may be greater than the expense ratio reflected in the financial highlights. |
| (e) | As a result of reimbursing expenses, including underlying fund expenses, the Manager may reimburse amounts in excess of the respective share classes’ operating expenses. |
| (f) | Annualized. |
| (g) | The Fund’s portfolio turnover rate is calculated in accordance with regulatory requirements, without regard to transactions involving short-term investments, certain derivatives and in-kind transactions (if any). If such transactions were included, the Fund’s portfolio turnover rate may be higher. |
See Notes to Financial Statements.
208
Notes to Financial Statements
| 1. | Organization |
Prudential Investment Portfolios 5 (the “Registered Investment Company” or “RIC”) is registered under the Investment Company Act of 1940, as amended (“1940 Act”), as an open-end management investment company. The RIC is organized as a Delaware Statutory Trust.
These financial statements relate only to the following series of the RIC: Prudential Day One Income Fund, Prudential Day One 2015 Fund, Prudential Day One 2020 Fund, Prudential Day One 2025 Fund, Prudential Day One 2030 Fund, Prudential Day One 2035 Fund, Prudential Day One 2040 Fund, Prudential Day One 2045 Fund, Prudential Day One 2050 Fund, Prudential Day One 2055 Fund, Prudential Day One 2060 Fund and Prudential Day One 2065 Fund (each a “Fund” and collectively referred to as the “Day One Funds” or the “Funds”). The Day One Funds are classified as diversified funds for purposes of the 1940 Act.
The investment objective of each of the Day One Funds is to seek a balance between growth and conservation of capital. Each Day One Fund seeks to achieve its objective by investing in a combination of mutual funds in the PGIM fund family (each, an “Underlying Fund”).
| 2. | Accounting Policies |
The Day One Funds follow the investment company accounting and reporting guidance of the Financial Accounting Standards Board (“FASB”) Accounting Standard Codification (“ASC”) Topic 946 Financial Services — Investment Companies. The following is a summary of significant accounting policies followed by the Day One Funds in the preparation of its financial statements. The policies conform to U.S. generally accepted accounting principles (“GAAP”). The Day One Funds consistently follow such policies in the preparation of their financial statements.
Securities Valuation: The Day One Funds hold securities and other assets and liabilities that are fair valued as of the close of each day (generally, 4:00 PM Eastern time) the New York Stock Exchange (“NYSE”) is open for trading. As described in further detail below, the Day One Funds’ investments are valued daily based on a number of factors, including the type of investment and whether market quotations are readily available. The RIC’s Board of Trustees (the “Board”) has adopted valuation procedures for security valuation under which fair valuation responsibilities have been delegated to PGIM Investments LLC (“PGIM Investments” or the “Manager”). Pursuant to the Board’s delegation, the Manager has established a Valuation Committee responsible for supervising the fair valuation of portfolio securities and other assets and liabilities. The valuation procedures permit the Day One Funds to utilize independent pricing vendor services, quotations from market makers, and alternative valuation methods when market quotations are either not readily available or not
Prudential Day One Funds 209
Notes to Financial Statements (continued)
deemed representative of fair value. Fair value is the price that would be received to sell an asset or paid to transfer a liability in an orderly transaction between market participants on the measurement date. A record of the Valuation Committee’s actions is subject to the Board’s review at its first quarterly meeting following the quarter in which such actions take place.
For the fiscal reporting year-end, securities and other assets and liabilities were fair valued at the close of the last U.S. business day. Trading in certain foreign securities may occur when the NYSE is closed (including weekends and holidays). Because such foreign securities trade in markets that are open on weekends and U.S. holidays, the values of some of the Day One Funds’ foreign investments may change on days when investors cannot purchase or redeem Day One Fund shares.
Various inputs determine how each Day One Fund’s investments are valued, all of which are categorized according to the three broad levels (Level 1, 2, or 3) detailed in the Schedule of Investments and referred to herein as the “fair value hierarchy” in accordance with FASB ASC Topic 820 - Fair Value Measurement.
Investments in open-end funds (other than exchange-traded funds) are valued at their net asset values as of the close of the NYSE on the date of valuation. These securities are classified as Level 1 in the fair value hierarchy since they may be purchased or sold at their net asset values on the date of valuation.
Securities and other assets that cannot be priced according to the methods described above are valued based on pricing methodologies approved by the Board. In the event that unobservable inputs are used when determining such valuations, the securities will be classified as Level 3 in the fair value hierarchy. Altering one or more unobservable inputs may result in a significant change to a Level 3 security’s fair value measurement.
When determining the fair value of securities, some of the factors influencing the valuation include: the nature of any restrictions on disposition of the securities; assessment of the general liquidity of the securities; the issuer’s financial condition and the markets in which it does business; the cost of the investment; the size of the holding and the capitalization of the issuer; the prices of any recent transactions or bids/offers for such securities or any comparable securities; any available analyst media or other reports or information deemed reliable by the Manager regarding the issuer or the markets or industry in which it operates. Using fair value to price securities may result in a value that is different from a security’s most recent closing price and from the price used by other unaffiliated mutual funds to calculate their net asset values.
210
Securities Transactions and Net Investment Income: Securities transactions are recorded on the trade date. Realized gains (losses) from investment and currency transactions are calculated on the specific identification method. Dividend income is recorded on the ex-date, or for certain foreign securities, when the Funds become aware of such dividends. Expenses are recorded on an accrual basis, which may require the use of certain estimates by management that may differ from actual. Net investment income or loss (other than class specific expenses and waivers, which are allocated as noted below) and unrealized and realized gains (losses) are allocated daily to each class of shares based upon the relative proportion of adjusted net assets of each class at the beginning of the day. Class specific expenses and waivers, where applicable, are charged to the respective share classes. Such class specific expenses and waivers include distribution fees and distribution fee waivers, shareholder servicing fees, transfer agent’s fees and expenses, registration fees and fee waivers and/or expense reimbursements, as applicable.
Taxes: It is each of the Day One Funds’ policy to continue to meet the requirements of the Internal Revenue Code applicable to regulated investment companies and to distribute all of its taxable net investment income and capital gains, if any, to its shareholders. Therefore, no federal income tax provision is required. Withholding taxes on foreign dividends, interest and capital gains, if any, are recorded, net of reclaimable amounts, at the time the related income is earned.
Dividends and Distributions: Dividends and distributions to shareholders, which are determined in accordance with federal income tax regulations and which may differ from GAAP, are recorded on the ex-date. Permanent book/tax differences relating to income and gain (loss) are reclassified between total distributable earnings (loss) and paid-in capital in excess of par, as appropriate. The chart below sets forth the expected frequency of dividend and capital gains distributions to shareholders. Various factors may impact the frequency of dividend distributions to shareholders, including but not limited to adverse market conditions or portfolio holding-specific events.
| Expected Distribution Schedule to Shareholders* | Frequency | |||
Each Fund other than Prudential Day One Income Fund: | ||||
Net Investment Income | Annually | |||
Short-Term Capital Gains | Annually | |||
Long-Term Capital Gains | Annually | |||
| ||||
Prudential Day One Income Fund: | ||||
Net Investment Income | Quarterly | |||
Short-Term Capital Gains | Annually | |||
Long-Term Capital Gains | Annually | |||
| * | Under certain circumstances, each Fund may make more than one distribution of short-term and/or long-term capital gains during a fiscal year. |
Estimates: The preparation of financial statements requires management to make estimates and assumptions that affect the reported amounts and disclosures in the financial statements. Actual results could differ from those estimates.
Prudential Day One Funds 211
Notes to Financial Statements (continued)
| 3. | Agreements |
The RIC, on behalf of the Day One Funds, has a management agreement with the Manager. Pursuant to this agreement, the Manager has responsibility for all investment advisory services and supervises the subadviser’s performance of such services.
The Manager has entered into a subadvisory agreement with PGIM Quantitative Solutions LLC (formerly known as QMA LLC) (“PGIM Quantitative Solutions” or the “subadviser”). The Manager pays for the services of PGIM Quantitative Solutions.
The management fee paid to the Manager is accrued daily and payable monthly at an annual rate of 0.02% of each of the Day One Funds’ average daily net assets. All amounts paid or payable by the Day One Funds to the Manager, under the agreement, are reflected in the Statement of Operations.
The Manager has contractually agreed, through November 30, 2023, to limit total annual operating expenses after fee waivers and/or expense reimbursements. This contractual waiver includes acquired fund fees and expenses, and excludes Fund and any acquired fund interest, brokerage, taxes (such as income and foreign withholding taxes, stamp duty and deferred tax expenses), extraordinary expenses, and certain other Fund expenses such as dividend and interest expense and broker charges on short sales.
Where applicable, the Manager agrees to waive management fees or shared operating expenses on any share class to the same extent that it waives such expenses on any other share class. Fees and/or expenses waived and/or reimbursed by the Manager may be recouped by the Manager within the same fiscal year during which such waiver and/or reimbursement is made if such recoupment can be realized without exceeding the expense limit in effect at the time of the recoupment for that fiscal year. The expense limitations attributable to each class are as follows:
| Class | Expense Limitations | |||
R1 | 1.15 | % | ||
R2 | 0.90 | |||
R3 | 0.75 | |||
R4 | 0.65 | |||
R5 | 0.55 | |||
R6 | 0.40 | |||
The RIC, on behalf of the Day One Funds, has a distribution agreement, pursuant to Rule 12b-1 under the 1940 Act, with Prudential Investment Management Services LLC (“PIMS”), which acts as the distributor of the Class R1, Class R2, Class R3, Class R4, Class R5 and Class R6 shares of Day One Funds. The Day One Funds compensate PIMS for distributing and servicing the Day One Funds’ Class R1, Class R2 and Class R3 shares,
212
pursuant to the plans of distribution (the “Distribution Plans”), regardless of expenses actually incurred by PIMS.
Pursuant to the Distribution Plans, the Day One Funds compensate PIMS for distribution related activities at an annual rate of the average daily net assets of the Class R1, Class R2 and Class R3 shares, respectively. The distribution fees are accrued daily and payable monthly. No distribution or service fees are paid to PIMS as distributor of the Class R4, Class R5 and Class R6 shares of the Day One Funds.
The Day One Funds have adopted a Shareholder Services Plan with respect to Class R1, Class R2, Class R3 and Class R4 shares. Under the terms of the Shareholder Services Plan, each Fund’s Class R1, Class R2, Class R3 and Class R4 shares are authorized to compensate Prudential Mutual Fund Services LLC (“PMFS”), its affiliates or third-party service providers, for services rendered to the shareholders of such Class R1, Class R2, Class R3 or Class R4 shares. The shareholder service fee is accrued daily and paid monthly, as applicable.
The Day One Funds’ annual gross and net distribution rates and maximum shareholder servicing fee, where applicable, are as follows:
| Class | Gross Distribution Fee | Net Distribution Fee | Shareholder Service Fee | |||||||||
R1 | 0.50 | % | 0.50 | % | 0.10 | % | ||||||
R2 | 0.25 | 0.25 | 0.10 | |||||||||
R3 | 0.10 | 0.10 | 0.10 | |||||||||
R4 | N/A | N/A | 0.10 | |||||||||
R5 | N/A | N/A | N/A | |||||||||
R6 | N/A | N/A | N/A | |||||||||
PGIM Investments, PIMS, PGIM Quantitative Solutions and PMFS are indirect, wholly-owned subsidiaries of Prudential Financial, Inc. (“Prudential”).
| 4. | Other Transactions with Affiliates |
PMFS serves as Day One Funds’ transfer agent. Transfer agent’s fees and expenses in the Statement of Operations include certain out-of-pocket expenses paid to non-affiliates, where applicable.
The Day One Funds may invest their overnight sweep cash in the PGIM Core Ultra Short Bond Fund (the “Core Fund”), a fund of Prudential Investment Portfolios 2, registered under the 1940 Act and managed by PGIM Investments. PGIM Investments and/or its affiliates are paid fees or reimbursed for providing their services to the Core Fund. In addition to the realized and unrealized gains on investments in the Core Fund, earnings from such investments are disclosed on the Statement of Operations as “Affiliated dividend income”.
Prudential Day One Funds 213
Notes to Financial Statements (continued)
| 5. | Investments in Affiliated Issuers |
The aggregate cost of purchases and proceeds from sales of portfolio securities (excluding short-term investments and U.S. Government securities) for the year ended July 31, 2022, were as follows:
| Fund | Cost of Purchases | Proceeds from Sales | ||||||
Prudential Day One Income Fund | $ | 15,832,674 | $ | 16,091,497 | ||||
Prudential Day One 2015 Fund | 5,493,776 | 6,595,394 | ||||||
Prudential Day One 2020 Fund | 25,414,121 | 33,936,820 | ||||||
Prudential Day One 2025 Fund | 45,253,674 | 49,357,784 | ||||||
Prudential Day One 2030 Fund | 43,663,092 | 44,329,872 | ||||||
Prudential Day One 2035 Fund | 27,988,895 | 32,962,062 | ||||||
Prudential Day One 2040 Fund | 29,994,813 | 34,131,009 | ||||||
Prudential Day One 2045 Fund | 18,125,481 | 26,572,980 | ||||||
Prudential Day One 2050 Fund | 14,897,215 | 18,638,415 | ||||||
Prudential Day One 2055 Fund | 5,650,108 | 12,481,845 | ||||||
Prudential Day One 2060 Fund | 5,260,367 | 6,059,529 | ||||||
Prudential Day One 2065 Fund | 426,929 | 369,757 | ||||||
A summary of the cost of purchases and proceeds from sales of shares of affiliated mutual funds for the year ended July 31, 2022, is presented as follows:
Prudential Day One Income Fund:
Value, Beginning of Year | Cost of Purchases | Proceeds from Sales | Change in Unrealized Gain (Loss) | Realized Gain (Loss) | Value, End of Year | Shares, End of Year | Dividend Income | Capital Gain Distributions | ||||||||||||||||||||||||||||||||||||||||||||||||||||||
Long-Term Investments - Affiliated Mutual Funds(wd): | ||||||||||||||||||||||||||||||||||||||||||||||||||||||||||||||
PGIM Core Conservative Bond Fund (Class R6) | ||||||||||||||||||||||||||||||||||||||||||||||||||||||||||||||
| $ 4,636,761 | $ | 2,139,606 | $ | 2,298,596 | $ | (422,030 | ) | $ | (175,259 | ) | $ | 3,880,482 | 424,096 | $ | 94,550 | $ | 14,864 | |||||||||||||||||||||||||||||||||||||||||||||
PGIM Global Real Estate Fund (Class R6) | ||||||||||||||||||||||||||||||||||||||||||||||||||||||||||||||
| 1,443,104 | 1,103,076 | 974,591 | (333,289 | ) | (18,232 | ) | 1,220,068 | 59,603 | 42,423 | 187,558 | ||||||||||||||||||||||||||||||||||||||||||||||||||||
PGIM Jennison Small-Cap Core Equity Fund (Class R6) | ||||||||||||||||||||||||||||||||||||||||||||||||||||||||||||||
| 289,510 | 298,050 | 231,334 | (103,253 | ) | (8,927 | ) | 244,046 | 19,873 | — | 62,594 | ||||||||||||||||||||||||||||||||||||||||||||||||||||
PGIM Quant Solutions Commodity Strategies Fund (Class R6) | ||||||||||||||||||||||||||||||||||||||||||||||||||||||||||||||
| 1,429,511 | 1,560,526 | 1,743,655 | (150,683 | ) | 129,424 | 1,225,123 | 116,346 | 486,786 | — | |||||||||||||||||||||||||||||||||||||||||||||||||||||
PGIM Quant Solutions International Developed Markets Index Fund (Class R6) | ||||||||||||||||||||||||||||||||||||||||||||||||||||||||||||||
| 1,432,401 | 1,009,909 | 964,195 | (244,475 | ) | (11,307 | ) | 1,222,333 | 101,523 | 44,117 | 5,697 | ||||||||||||||||||||||||||||||||||||||||||||||||||||
PGIM Quant Solutions Large-Cap Core Fund (Class R6) | ||||||||||||||||||||||||||||||||||||||||||||||||||||||||||||||
| 3,360,682 | 2,454,887 | 2,421,081 | (557,203 | ) | 30,276 | 2,867,561 | 164,330 | 38,451 | 461,498 | |||||||||||||||||||||||||||||||||||||||||||||||||||||
214
Prudential Day One Income Fund (cont’d.):
Value, Beginning of Year | Cost of Purchases | Proceeds from Sales | Change in Unrealized Gain (Loss) | Realized Gain (Loss) | Value, End of Year | Shares, End of Year | Dividend Income | Capital Gain Distributions | ||||||||||||||||||||||||||||||||||||||||||||||||||||||||||
PGIM Quant Solutions Mid-Cap Core Fund (Class R6) | ||||||||||||||||||||||||||||||||||||||||||||||||||||||||||||||||||
| $ 289,254 | $ | 245,719 | $ | 219,661 | $ | (67,447 | ) | $ | (2,754 | ) | $ | 245,111 | 22,801 | $ | 2,584 | $ | 62,516 | |||||||||||||||||||||||||||||||||||||||||||||||||
PGIM Quant Solutions US Broad Market Index Fund (Class R6) | ||||||||||||||||||||||||||||||||||||||||||||||||||||||||||||||||||
| 1,811,760 | 1,301,180 | 1,316,880 | (272,683 | ) | 21,603 | 1,544,980 | 91,745 | 24,557 | 182,303 | |||||||||||||||||||||||||||||||||||||||||||||||||||||||||
PGIM TIPS Fund (Class R6) | ||||||||||||||||||||||||||||||||||||||||||||||||||||||||||||||||||
| 6,701,661 | 3,496,230 | 3,657,848 | (737,825 | ) | (151,454 | ) | 5,650,764 | 598,598 | 490,669 | 138,254 | ||||||||||||||||||||||||||||||||||||||||||||||||||||||||
PGIM Total Return Bond Fund (Class R6) | ||||||||||||||||||||||||||||||||||||||||||||||||||||||||||||||||||
| 4,641,230 | 2,223,491 | 2,263,656 | (567,790 | ) | (143,458 | ) | 3,889,817 | 305,563 | 150,880 | — | ||||||||||||||||||||||||||||||||||||||||||||||||||||||||
| $26,035,874 | $ | 15,832,674 | $ | 16,091,497 | $ | (3,456,678 | ) | $ | (330,088 | ) | $ | 21,990,285 | $ | 1,375,017 | $ | 1,115,284 | ||||||||||||||||||||||||||||||||||||||||||||||||||
Short-Term Investments - Affiliated Mutual Fund(wd): | ||||||||||||||||||||||||||||||||||||||||||||||||||||||||||||||||||
PGIM Core Ultra Short Bond Fund | ||||||||||||||||||||||||||||||||||||||||||||||||||||||||||||||||||
| $ 2,918,023 | $ | 1,318,804 | $ | 1,837,499 | $ | — | $ | — | $ | 2,399,328 | 2,399,328 | $ | 11,665 | $ | — | |||||||||||||||||||||||||||||||||||||||||||||||||||
| $28,953,897 | $ | 17,151,478 | $ | 17,928,996 | $ | (3,456,678 | ) | $ | (330,088 | ) | $ | 24,389,613 | $ | 1,386,682 | $ | 1,115,284 | ||||||||||||||||||||||||||||||||||||||||||||||||||
|
Prudential Day One 2015 Fund:
|
| ||||||||||||||||||||||||||||||||||||||||||||||||||||||||||||||||
Value, Beginning of Year | Cost of Purchases | Proceeds from Sales | Change in Unrealized Gain (Loss) | Realized Gain (Loss) | Value, End of Year | Shares, End of Year | Dividend Income | Capital Gain Distributions | ||||||||||||||||||||||||||||||||||||||||||||||||||||||||||
Long-Term Investments - Affiliated Mutual Funds(wd): | ||||||||||||||||||||||||||||||||||||||||||||||||||||||||||||||||||
PGIM Core Conservative Bond Fund (Class R6) | ||||||||||||||||||||||||||||||||||||||||||||||||||||||||||||||||||
| $ 2,069,350 | $ | 634,036 | $ | 774,367 | $ | (205,318 | ) | $ | (54,491 | ) | $ | 1,669,210 | 182,427 | $ | 40,681 | $ | 6,297 | |||||||||||||||||||||||||||||||||||||||||||||||||
PGIM Global Real Estate Fund (Class R6) | ||||||||||||||||||||||||||||||||||||||||||||||||||||||||||||||||||
| 757,676 | 403,127 | 390,394 | (176,441 | ) | (2,658 | ) | 591,310 | 28,887 | 20,806 | 91,167 | ||||||||||||||||||||||||||||||||||||||||||||||||||||||||
PGIM Jennison Small-Cap Core Equity Fund (Class R6) | ||||||||||||||||||||||||||||||||||||||||||||||||||||||||||||||||||
| 152,002 | 173,858 | 105,090 | (59,010 | ) | (8,000 | ) | 153,760 | 12,521 | — | 30,426 | ||||||||||||||||||||||||||||||||||||||||||||||||||||||||
PGIM Quant Solutions Commodity Strategies Fund (Class R6) | ||||||||||||||||||||||||||||||||||||||||||||||||||||||||||||||||||
| 750,546 | 607,770 | 753,958 | (77,781 | ) | 67,179 | 593,756 | 56,387 | 235,901 | — | |||||||||||||||||||||||||||||||||||||||||||||||||||||||||
PGIM Quant Solutions International Developed Markets Index Fund (Class R6) | ||||||||||||||||||||||||||||||||||||||||||||||||||||||||||||||||||
| 872,391 | 390,984 | 454,503 | (154,112 | ) | 8,735 | 663,495 | 55,108 | 24,891 | 3,214 | |||||||||||||||||||||||||||||||||||||||||||||||||||||||||
PGIM Quant Solutions Large-Cap Core Fund (Class R6) | ||||||||||||||||||||||||||||||||||||||||||||||||||||||||||||||||||
| 1,990,688 | 919,796 | 1,093,271 | (357,164 | ) | 57,998 | 1,518,047 | 86,994 | 21,026 | 252,356 | |||||||||||||||||||||||||||||||||||||||||||||||||||||||||
PGIM Quant Solutions Mid-Cap Core Fund (Class R6) | ||||||||||||||||||||||||||||||||||||||||||||||||||||||||||||||||||
| 273,362 | 136,385 | 197,712 | (78,365 | ) | 20,760 | 154,430 | 14,366 | 2,253 | 54,530 | |||||||||||||||||||||||||||||||||||||||||||||||||||||||||
PGIM Quant Solutions US Broad Market Index Fund (Class R6) | ||||||||||||||||||||||||||||||||||||||||||||||||||||||||||||||||||
| 1,087,126 | 492,837 | 599,018 | (193,367 | ) | 46,769 | 834,347 | 49,546 | 13,603 | 100,978 | |||||||||||||||||||||||||||||||||||||||||||||||||||||||||
Prudential Day One Funds 215
Notes to Financial Statements (continued)
Prudential Day One 2015 Fund (cont’d.):
Value, Beginning of Year | Cost of Purchases | Proceeds from Sales | Change in Unrealized Gain (Loss) | Realized Gain (Loss) | Value, End of Year | Shares, End of Year | Dividend Income | Capital Gain Distributions | ||||||||||||||||||||||||||||||||||||||||||||||||||||||||||
PGIM TIPS Fund (Class R6) | ||||||||||||||||||||||||||||||||||||||||||||||||||||||||||||||||||
| $ 3,396,716 | $ | 1,080,832 | $ | 1,375,059 | $ | (367,837) | $ | (66,817) | $ | 2,667,835 | 282,610 | $ | 236,295 | $ | 65,894 | |||||||||||||||||||||||||||||||||||||||||||||||||||
PGIM Total Return Bond Fund (Class R6) | ||||||||||||||||||||||||||||||||||||||||||||||||||||||||||||||||||
| 2,436,904 | 654,151 | 852,022 | (291,820) | (61,850) | 1,885,363 | 148,104 | 74,558 | — | ||||||||||||||||||||||||||||||||||||||||||||||||||||||||||
| $13,786,761 | $ | 5,493,776 | $ | 6,595,394 | $ | (1,961,215) | $ | 7,625 | $ | 10,731,553 | $ | 670,014 | $ | 604,862 | ||||||||||||||||||||||||||||||||||||||||||||||||||||
Short-Term Investments - Affiliated Mutual Fund(wd): | ||||||||||||||||||||||||||||||||||||||||||||||||||||||||||||||||||
PGIM Core Ultra Short Bond Fund | ||||||||||||||||||||||||||||||||||||||||||||||||||||||||||||||||||
| $ 1,429,264 | $ | 477,319 | $ | 800,039 | $ | — | $ | — | $ | 1,106,544 | 1,106,544 | $ | 5,494 | $ | — | |||||||||||||||||||||||||||||||||||||||||||||||||||
| $15,216,025 | $ | 5,971,095 | $ | 7,395,433 | $ | (1,961,215) | $ | 7,625 | $ | 11,838,097 | $ | 675,508 | $ | 604,862 | ||||||||||||||||||||||||||||||||||||||||||||||||||||
| Prudential Day One 2020 Fund: | ||||||||||||||||||||||||||||||||||||||||||||||||||||||||||||||||||
Value, Beginning of Year | Cost of Purchases | Proceeds from Sales | Change in Unrealized Gain (Loss) | Realized Gain (Loss) | Value, End of Year | Shares, End of Year | Dividend Income | Capital Gain Distributions | ||||||||||||||||||||||||||||||||||||||||||||||||||||||||||
Long-Term Investments - Affiliated Mutual Funds(wd): | ||||||||||||||||||||||||||||||||||||||||||||||||||||||||||||||||||
PGIM Core Conservative Bond Fund (Class R6) | ||||||||||||||||||||||||||||||||||||||||||||||||||||||||||||||||||
| $ 8,531,878 | $ | 2,373,156 | $ | 3,620,942 | $ | (722,932) | $ | (300,878) | $ | 6,260,282 | 684,184 | $ | 158,765 | $ | 25,201 | |||||||||||||||||||||||||||||||||||||||||||||||||||
PGIM Global Real Estate Fund (Class R6) | ||||||||||||||||||||||||||||||||||||||||||||||||||||||||||||||||||
| 3,482,396 | 1,707,854 | 1,857,584 | (813,716) | 20,641 | 2,539,591 | 124,064 | 93,069 | 415,903 | ||||||||||||||||||||||||||||||||||||||||||||||||||||||||||
PGIM Jennison Small-Cap Core Equity Fund (Class R6) | ||||||||||||||||||||||||||||||||||||||||||||||||||||||||||||||||||
| 698,647 | 1,192,874 | 646,409 | (295,809) | (65,412) | 883,891 | 71,978 | — | 138,869 | ||||||||||||||||||||||||||||||||||||||||||||||||||||||||||
PGIM Quant Solutions Commodity Strategies Fund (Class R6) | ||||||||||||||||||||||||||||||||||||||||||||||||||||||||||||||||||
| 3,449,010 | 2,679,326 | 3,513,062 | (457,176) | 391,972 | 2,550,070 | 242,172 | 1,078,483 | — | ||||||||||||||||||||||||||||||||||||||||||||||||||||||||||
PGIM Quant Solutions International Developed Markets Index Fund (Class R6) | ||||||||||||||||||||||||||||||||||||||||||||||||||||||||||||||||||
| 4,700,682 | 1,913,949 | 2,507,105 | (835,622) | 86,553 | 3,358,457 | 278,942 | 133,182 | 17,199 | ||||||||||||||||||||||||||||||||||||||||||||||||||||||||||
PGIM Quant Solutions Large-Cap Core Fund (Class R6) | ||||||||||||||||||||||||||||||||||||||||||||||||||||||||||||||||||
| 10,951,315 | 4,684,238 | 6,344,528 | (2,059,539) | 481,991 | 7,713,477 | 442,033 | 115,033 | 1,380,654 | ||||||||||||||||||||||||||||||||||||||||||||||||||||||||||
PGIM Quant Solutions Mid-Cap Core Fund (Class R6) | ||||||||||||||||||||||||||||||||||||||||||||||||||||||||||||||||||
| 1,396,057 | 689,231 | 891,747 | (361,598) | 55,792 | 887,735 | 82,580 | 11,444 | 276,927 | ||||||||||||||||||||||||||||||||||||||||||||||||||||||||||
PGIM Quant Solutions US Broad Market Index Fund (Class R6) | ||||||||||||||||||||||||||||||||||||||||||||||||||||||||||||||||||
| 5,829,250 | 2,404,459 | 3,529,154 | (1,122,839) | 399,793 | 3,981,509 | 236,432 | 72,537 | 538,476 | ||||||||||||||||||||||||||||||||||||||||||||||||||||||||||
216
Prudential Day One 2020 Fund (cont’d.):
Value, Beginning of Year | Cost of Purchases | Proceeds from Sales | Change in Unrealized Gain (Loss) | Realized Gain (Loss) | Value, End of Year | Shares, End of Year | Dividend Income | Capital Gain Distributions | ||||||||||||||||||||||||||||||||||||||||||||||||||||||||||
PGIM TIPS Fund (Class R6) | ||||||||||||||||||||||||||||||||||||||||||||||||||||||||||||||||||
| $14,345,101 | $ | 4,764,553 | $ | 6,689,645 | $ | (1,453,957 | ) | $ | (327,188 | ) | $ | 10,638,864 | 1,126,998 | $ | 962,176 | $ | 270,103 | |||||||||||||||||||||||||||||||||||||||||||||||||
PGIM Total Return Bond Fund (Class R6) | ||||||||||||||||||||||||||||||||||||||||||||||||||||||||||||||||||
| 10,640,095 | 3,004,481 | 4,336,644 | (1,171,128 | ) | (343,150 | ) | 7,793,654 | 612,227 | 315,561 | — | ||||||||||||||||||||||||||||||||||||||||||||||||||||||||
| $64,024,431 | $ | 25,414,121 | $ | 33,936,820 | $ | (9,294,316 | ) | $ | 400,114 | $ | 46,607,530 | $ | 2,940,250 | $ | 3,063,332 | |||||||||||||||||||||||||||||||||||||||||||||||||||
Short-Term Investments - Affiliated Mutual Fund(wd): | ||||||||||||||||||||||||||||||||||||||||||||||||||||||||||||||||||
PGIM Core Ultra Short Bond Fund | ||||||||||||||||||||||||||||||||||||||||||||||||||||||||||||||||||
| $ 5,700,979 | $ | 1,518,931 | $ | 3,060,060 | $ | — | $ | — | $ | 4,159,850 | 4,159,850 | $ | 20,973 | $ | — | |||||||||||||||||||||||||||||||||||||||||||||||||||
| $69,725,410 | $ | 26,933,052 | $ | 36,996,880 | $ | (9,294,316 | ) | $ | 400,114 | $ | 50,767,380 | $ | 2,961,223 | $ | 3,063,332 | |||||||||||||||||||||||||||||||||||||||||||||||||||
| Prudential Day One 2025 Fund: | ||||||||||||||||||||||||||||||||||||||||||||||||||||||||||||||||||
Value, Beginning of Year | Cost of Purchases | Proceeds from Sales | Change in Unrealized Gain (Loss) | Realized Gain (Loss) | Value, End of Year | Shares, End of Year | Dividend Income | Capital Gain | ||||||||||||||||||||||||||||||||||||||||||||||||||||||||||
Long-Term Investments - Affiliated Mutual Funds(wd): | ||||||||||||||||||||||||||||||||||||||||||||||||||||||||||||||||||
PGIM Core Conservative Bond Fund (Class R6) | ||||||||||||||||||||||||||||||||||||||||||||||||||||||||||||||||||
| $ 7,983,661 | $ | 4,044,802 | $ | 4,053,359 | $ | (732,848 | ) | $ | (339,314 | ) | $ | 6,902,942 | 754,420 | $ | 162,215 | $ | 24,141 | |||||||||||||||||||||||||||||||||||||||||||||||||
PGIM Global Real Estate Fund (Class R6) | ||||||||||||||||||||||||||||||||||||||||||||||||||||||||||||||||||
| 4,517,688 | 2,749,717 | 2,552,309 | (1,044,567 | ) | (53,632 | ) | 3,616,897 | 176,693 | 124,402 | 542,015 | ||||||||||||||||||||||||||||||||||||||||||||||||||||||||
PGIM Jennison Small-Cap Core Equity Fund (Class R6) | ||||||||||||||||||||||||||||||||||||||||||||||||||||||||||||||||||
| 906,344 | 2,045,565 | 959,510 | (428,173 | ) | (124,516 | ) | 1,439,710 | 117,240 | — | 180,832 | ||||||||||||||||||||||||||||||||||||||||||||||||||||||||
PGIM Quant Solutions Commodity Strategies Fund (Class R6) | ||||||||||||||||||||||||||||||||||||||||||||||||||||||||||||||||||
| 4,474,481 | 4,184,152 | 4,958,404 | (483,466 | ) | 415,033 | 3,631,796 | 344,900 | 1,406,256 | — | |||||||||||||||||||||||||||||||||||||||||||||||||||||||||
PGIM Quant Solutions International Developed Markets Index Fund (Class R6) | ||||||||||||||||||||||||||||||||||||||||||||||||||||||||||||||||||
| 7,712,518 | 3,934,955 | 4,397,151 | (1,338,970 | ) | 31,313 | 5,942,665 | 493,577 | 219,359 | 28,328 | |||||||||||||||||||||||||||||||||||||||||||||||||||||||||
PGIM Quant Solutions Large-Cap Core Fund (Class R6) | ||||||||||||||||||||||||||||||||||||||||||||||||||||||||||||||||||
| 17,084,644 | 9,029,172 | 10,825,487 | (3,068,915 | ) | 466,226 | 12,685,640 | 726,971 | 180,408 | 2,165,311 | |||||||||||||||||||||||||||||||||||||||||||||||||||||||||
PGIM Quant Solutions Mid-Cap Core Fund (Class R6) | ||||||||||||||||||||||||||||||||||||||||||||||||||||||||||||||||||
| 1,811,086 | 1,164,512 | 1,095,524 | (444,703 | ) | 10,588 | 1,445,959 | 134,508 | 14,926 | 361,175 | |||||||||||||||||||||||||||||||||||||||||||||||||||||||||
PGIM Quant Solutions US Broad Market Index Fund (Class R6) | ||||||||||||||||||||||||||||||||||||||||||||||||||||||||||||||||||
| 8,282,532 | 4,455,365 | 5,046,683 | (1,361,263 | ) | 183,786 | 6,513,737 | 386,801 | 103,610 | 769,144 | |||||||||||||||||||||||||||||||||||||||||||||||||||||||||
PGIM TIPS Fund (Class R6) | ||||||||||||||||||||||||||||||||||||||||||||||||||||||||||||||||||
| 17,514,806 | 8,160,282 | 9,210,376 | (1,817,242 | ) | (513,287 | ) | 14,134,183 | 1,497,265 | 1,233,950 | 337,659 | ||||||||||||||||||||||||||||||||||||||||||||||||||||||||
PGIM Total Return Bond Fund (Class R6) | ||||||||||||||||||||||||||||||||||||||||||||||||||||||||||||||||||
| 13,621,563 | 5,485,152 | 6,258,981 | (1,552,364 | ) | (483,330 | ) | 10,812,040 | 849,335 | 418,594 | — | ||||||||||||||||||||||||||||||||||||||||||||||||||||||||
Prudential Day One Funds 217
Notes to Financial Statements (continued)
Prudential Day One 2025 Fund (cont’d.):
Value, Beginning of Year | Cost of Purchases | Proceeds from Sales | Change in Unrealized Gain (Loss) | Realized Gain (Loss) | Value, End of Year | Shares, End of Year | Dividend Income | Capital Gain Distributions | ||||||||||||||||||||||||||||||||||||||||||||||||||||||||||
| $83,909,323 | $ | 45,253,674 | $ | 49,357,784 | $ | (12,272,511 | ) | $ | (407,133 | ) | $ | 67,125,569 | $ | 3,863,720 | $ | 4,408,605 | ||||||||||||||||||||||||||||||||||||||||||||||||||
Short-Term Investments - Affiliated Mutual Fund(wd): | ||||||||||||||||||||||||||||||||||||||||||||||||||||||||||||||||||
PGIM Core Ultra Short Bond Fund | ||||||||||||||||||||||||||||||||||||||||||||||||||||||||||||||||||
| $ 6,482,524 | $ | 2,651,747 | $ | 3,930,272 | $ | — | $ | — | $ | 5,203,999 | 5,203,999 | $ | 26,189 | $ | — | |||||||||||||||||||||||||||||||||||||||||||||||||||
| $90,391,847 | $ | 47,905,421 | $ | 53,288,056 | $ | (12,272,511 | ) | $ | (407,133 | ) | $ | 72,329,568 | $ | 3,889,909 | $ | 4,408,605 | ||||||||||||||||||||||||||||||||||||||||||||||||||
| Prudential Day One 2030 Fund: | ||||||||||||||||||||||||||||||||||||||||||||||||||||||||||||||||||
Value, Beginning of Year | Cost of Purchases | Proceeds from Sales | Change in Unrealized Gain (Loss) | Realized Gain (Loss) | Value, End of Year | Shares, End of Year | Dividend Income | Capital Gain Distributions | ||||||||||||||||||||||||||||||||||||||||||||||||||||||||||
Long-Term Investments - Affiliated Mutual Funds(wd): | ||||||||||||||||||||||||||||||||||||||||||||||||||||||||||||||||||
PGIM Core Conservative Bond Fund (Class R6) | ||||||||||||||||||||||||||||||||||||||||||||||||||||||||||||||||||
| $ 5,518,797 | $ | 2,699,632 | $ | 2,658,459 | $ | (502,658 | ) | $ | (249,283 | ) | $ | 4,808,029 | 525,468 | $ | 114,892 | $ | 17,703 | |||||||||||||||||||||||||||||||||||||||||||||||||
PGIM Global Real Estate Fund (Class R6) | ||||||||||||||||||||||||||||||||||||||||||||||||||||||||||||||||||
| 4,293,974 | 2,373,622 | 2,011,134 | (989,801 | ) | (110,066 | ) | 3,556,595 | 173,747 | 125,701 | 561,756 | ||||||||||||||||||||||||||||||||||||||||||||||||||||||||
PGIM Jennison Small-Cap Core Equity Fund (Class R6) | ||||||||||||||||||||||||||||||||||||||||||||||||||||||||||||||||||
| 1,550,547 | 2,575,720 | 1,271,396 | (644,975 | ) | (196,607 | ) | 2,013,289 | 163,949 | — | 337,422 | ||||||||||||||||||||||||||||||||||||||||||||||||||||||||
PGIM Quant Solutions Commodity Strategies Fund (Class R6) | ||||||||||||||||||||||||||||||||||||||||||||||||||||||||||||||||||
| 3,573,127 | 3,410,956 | 3,827,579 | (298,251 | ) | 284,392 | 3,142,645 | 298,447 | 1,216,069 | — | |||||||||||||||||||||||||||||||||||||||||||||||||||||||||
PGIM Quant Solutions Emerging Markets Equity Fund (Class R6) | ||||||||||||||||||||||||||||||||||||||||||||||||||||||||||||||||||
| 1,361,562 | 581,563 | 862,617 | (236,009 | ) | (2,596 | ) | 841,903 | 79,052 | 39,575 | 9,126 | ||||||||||||||||||||||||||||||||||||||||||||||||||||||||
PGIM Quant Solutions International Developed Markets Index Fund (Class R6) | ||||||||||||||||||||||||||||||||||||||||||||||||||||||||||||||||||
| 9,035,897 | 4,179,250 | 3,994,516 | (1,552,200 | ) | (121,717 | ) | 7,546,714 | 626,804 | 280,156 | 36,179 | ||||||||||||||||||||||||||||||||||||||||||||||||||||||||
PGIM Quant Solutions Large-Cap Core Fund (Class R6) | ||||||||||||||||||||||||||||||||||||||||||||||||||||||||||||||||||
| 18,206,398 | 8,590,592 | 9,783,110 | (3,186,066 | ) | 253,531 | 14,081,345 | 806,954 | 208,161 | 2,498,399 | |||||||||||||||||||||||||||||||||||||||||||||||||||||||||
PGIM Quant Solutions Mid-Cap Core Fund (Class R6) | ||||||||||||||||||||||||||||||||||||||||||||||||||||||||||||||||||
| 3,098,419 | 1,716,292 | 2,059,414 | (748,639 | ) | 15,330 | 2,021,988 | 188,092 | 27,652 | 669,117 | |||||||||||||||||||||||||||||||||||||||||||||||||||||||||
PGIM Quant Solutions US Broad Market Index Fund (Class R6) | ||||||||||||||||||||||||||||||||||||||||||||||||||||||||||||||||||
| 10,696,918 | 4,961,407 | 5,805,291 | (1,695,227 | ) | 162,961 | 8,320,768 | 494,107 | 144,892 | 1,075,605 | |||||||||||||||||||||||||||||||||||||||||||||||||||||||||
PGIM TIPS Fund (Class R6) | ||||||||||||||||||||||||||||||||||||||||||||||||||||||||||||||||||
| 12,312,345 | 7,236,718 | 6,765,106 | (1,314,156 | ) | (439,299 | ) | 11,030,502 | 1,168,485 | 939,510 | 251,752 | ||||||||||||||||||||||||||||||||||||||||||||||||||||||||
218
Prudential Day One 2030 Fund (cont’d.):
Value, Beginning of Year | Cost of Purchases | Proceeds from Sales | Change in Unrealized Gain (Loss) | Realized Gain (Loss) | Value, End of Year | Shares, End of Year | Dividend Income | Capital Gain Distributions | ||||||||||||||||||||||||||||||||||||||||||||||||||||||||||
PGIM Total Return Bond Fund (Class R6) | ||||||||||||||||||||||||||||||||||||||||||||||||||||||||||||||||||
| $11,566,162 | $ | 5,337,340 | $ | 5,291,250 | $ | (1,332,357 | ) | $ | (499,019 | ) | $ | 9,780,876 | 768,333 | $ | 377,039 | $ | — | |||||||||||||||||||||||||||||||||||||||||||||||||
| $81,214,146 | $ | 43,663,092 | $ | 44,329,872 | $ | (12,500,339 | ) | $ | (902,373 | ) | $ | 67,144,654 | $ | 3,473,647 | $ | 5,457,059 | ||||||||||||||||||||||||||||||||||||||||||||||||||
Short-Term Investments - Affiliated Mutual Fund(wd): | ||||||||||||||||||||||||||||||||||||||||||||||||||||||||||||||||||
PGIM Core Ultra Short Bond Fund | ||||||||||||||||||||||||||||||||||||||||||||||||||||||||||||||||||
| $ 4,720,475 | $ | 2,159,499 | $ | 2,863,419 | $ | — | $ | — | $ | 4,016,555 | 4,016,555 | $ | 19,860 | $ | — | |||||||||||||||||||||||||||||||||||||||||||||||||||
| $85,934,621 | $ | 45,822,591 | $ | 47,193,291 | $ | (12,500,339 | ) | $ | (902,373 | ) | $ | 71,161,209 | $ | 3,493,507 | $ | 5,457,059 | ||||||||||||||||||||||||||||||||||||||||||||||||||
| Prudential Day One 2035 Fund: | ||||||||||||||||||||||||||||||||||||||||||||||||||||||||||||||||||
Value, Beginning of Year | Cost of Purchases | Proceeds from Sales | Change in Unrealized Gain (Loss) | Realized Gain (Loss) | Value, End of Year | Shares, End of Year | Dividend Income | Capital Gain Distributions | ||||||||||||||||||||||||||||||||||||||||||||||||||||||||||
Long-Term Investments - Affiliated Mutual Funds(wd): | ||||||||||||||||||||||||||||||||||||||||||||||||||||||||||||||||||
PGIM Core Conservative Bond Fund (Class R6) | ||||||||||||||||||||||||||||||||||||||||||||||||||||||||||||||||||
| $ 3,349,333 | $ | 1,371,290 | $ | 1,687,658 | $ | (271,491 | ) | $ | (127,018 | ) | $ | 2,634,456 | 287,919 | $ | 61,708 | $ | 9,432 | |||||||||||||||||||||||||||||||||||||||||||||||||
PGIM Global Real Estate Fund (Class R6) | ||||||||||||||||||||||||||||||||||||||||||||||||||||||||||||||||||
| 2,694,168 | 1,311,010 | 1,204,746 | (626,446 | ) | (14,597 | ) | 2,159,389 | 105,490 | 70,115 | 301,395 | ||||||||||||||||||||||||||||||||||||||||||||||||||||||||
PGIM Jennison Small-Cap Core Equity Fund (Class R6) | ||||||||||||||||||||||||||||||||||||||||||||||||||||||||||||||||||
| 1,286,840 | 2,134,939 | 841,704 | (680,682 | ) | (48,955 | ) | 1,850,438 | 150,687 | — | 239,330 | ||||||||||||||||||||||||||||||||||||||||||||||||||||||||
PGIM Quant Solutions Commodity Strategies Fund (Class R6) | ||||||||||||||||||||||||||||||||||||||||||||||||||||||||||||||||||
| 2,541,842 | 2,014,698 | 2,522,706 | (323,895 | ) | 261,159 | 1,971,098 | 187,189 | 745,771 | — | |||||||||||||||||||||||||||||||||||||||||||||||||||||||||
PGIM Quant Solutions Emerging Markets Equity Fund (Class R6) | ||||||||||||||||||||||||||||||||||||||||||||||||||||||||||||||||||
| 1,780,428 | 769,453 | 965,622 | (322,738 | ) | (2,893 | ) | 1,258,628 | 118,181 | 44,392 | 10,238 | ||||||||||||||||||||||||||||||||||||||||||||||||||||||||
PGIM Quant Solutions International Developed Markets Index Fund (Class R6) | ||||||||||||||||||||||||||||||||||||||||||||||||||||||||||||||||||
| 8,532,428 | 3,448,153 | 4,008,760 | (1,480,659 | ) | 48,021 | 6,539,183 | 543,122 | 226,138 | 29,203 | |||||||||||||||||||||||||||||||||||||||||||||||||||||||||
PGIM Quant Solutions Large-Cap Core Fund (Class R6) | ||||||||||||||||||||||||||||||||||||||||||||||||||||||||||||||||||
| 16,344,747 | 5,868,437 | 8,398,806 | (2,998,068 | ) | 589,484 | 11,405,794 | 653,627 | 161,101 | 1,933,586 | |||||||||||||||||||||||||||||||||||||||||||||||||||||||||
PGIM Quant Solutions Mid-Cap Core Fund (Class R6) | ||||||||||||||||||||||||||||||||||||||||||||||||||||||||||||||||||
| 3,085,784 | 1,364,518 | 1,899,061 | (763,900 | ) | 100,629 | 1,887,970 | 175,625 | 23,741 | 574,495 | |||||||||||||||||||||||||||||||||||||||||||||||||||||||||
PGIM Quant Solutions US Broad Market Index Fund (Class R6) | ||||||||||||||||||||||||||||||||||||||||||||||||||||||||||||||||||
| 9,588,107 | 3,473,928 | 4,553,309 | (1,658,548 | ) | 330,660 | 7,180,838 | 426,416 | 111,963 | 831,151 | |||||||||||||||||||||||||||||||||||||||||||||||||||||||||
PGIM TIPS Fund (Class R6) | ||||||||||||||||||||||||||||||||||||||||||||||||||||||||||||||||||
| 6,347,158 | 3,248,585 | 3,529,358 | (660,993 | ) | (166,438 | ) | 5,238,954 | 554,974 | 439,645 | 113,939 | ||||||||||||||||||||||||||||||||||||||||||||||||||||||||
PGIM Total Return Bond Fund (Class R6) | ||||||||||||||||||||||||||||||||||||||||||||||||||||||||||||||||||
| 6,834,128 | 2,983,884 | 3,350,332 | (773,528 | ) | (216,970 | ) | 5,477,182 | 430,258 | 202,125 | — | ||||||||||||||||||||||||||||||||||||||||||||||||||||||||
Prudential Day One Funds 219
Notes to Financial Statements (continued)
Prudential Day One 2035 Fund (cont’d.):
Value, Beginning of Year | Cost of Purchases | Proceeds from Sales | Change in Unrealized Gain (Loss) | Realized Gain (Loss) | Value, End of Year | Shares, End of Year | Dividend Income | Capital Gain Distributions | ||||||||||||||||||||||||||||||||||||||||||||||||||||||||||
| $62,384,963 | $ | 27,988,895 | $ | 32,962,062 | $ | (10,560,948 | ) | $ | 753,082 | $ | 47,603,930 | $ | 2,086,699 | $ | 4,042,769 | |||||||||||||||||||||||||||||||||||||||||||||||||||
Short-Term Investments - Affiliated Mutual Fund(wd): | ||||||||||||||||||||||||||||||||||||||||||||||||||||||||||||||||||
PGIM Core Ultra Short Bond Fund | ||||||||||||||||||||||||||||||||||||||||||||||||||||||||||||||||||
| $ 1,745,394 | $ | 1,960,863 | $ | 2,149,229 | $ | — | $ | — | $ | 1,557,028 | 1,557,028 | $ | 7,625 | $ | — | |||||||||||||||||||||||||||||||||||||||||||||||||||
| $64,130,357 | $ | 29,949,758 | $ | 35,111,291 | $ | (10,560,948 | ) | $ | 753,082 | $ | 49,160,958 | $ | 2,094,324 | $ | 4,042,769 | |||||||||||||||||||||||||||||||||||||||||||||||||||
| Prudential Day One 2040 Fund: | ||||||||||||||||||||||||||||||||||||||||||||||||||||||||||||||||||
Value, Beginning of Year | Cost of Purchases | Proceeds from Sales | Change in Unrealized Gain (Loss) | Realized Gain (Loss) | Value, End of Year | Shares, End of Year | Dividend Income | Capital Gain Distributions | ||||||||||||||||||||||||||||||||||||||||||||||||||||||||||
Long-Term Investments - Affiliated Mutual Funds(wd): | ||||||||||||||||||||||||||||||||||||||||||||||||||||||||||||||||||
PGIM Core Conservative Bond Fund (Class R6) | ||||||||||||||||||||||||||||||||||||||||||||||||||||||||||||||||||
| $ 2,539,774 | $ | 1,338,658 | $ | 1,561,842 | $ | (178,243 | ) | $ | (158,364 | ) | $ | 1,979,983 | 216,392 | $ | 50,959 | $ | 7,935 | |||||||||||||||||||||||||||||||||||||||||||||||||
PGIM Global Real Estate Fund (Class R6) | ||||||||||||||||||||||||||||||||||||||||||||||||||||||||||||||||||
| 2,408,946 | 1,212,789 | 1,198,635 | (554,462 | ) | (58,038 | ) | 1,810,600 | 88,451 | 68,474 | 305,845 | ||||||||||||||||||||||||||||||||||||||||||||||||||||||||
PGIM Jennison Small-Cap Core Equity Fund (Class R6) | ||||||||||||||||||||||||||||||||||||||||||||||||||||||||||||||||||
| 1,691,393 | 2,525,115 | 1,253,405 | (720,463 | ) | (205,452 | ) | 2,037,188 | 165,895 | — | 356,944 | ||||||||||||||||||||||||||||||||||||||||||||||||||||||||
PGIM Quant Solutions Commodity Strategies Fund (Class R6) | ||||||||||||||||||||||||||||||||||||||||||||||||||||||||||||||||||
| 2,386,378 | 2,166,213 | 2,689,639 | (299,439 | ) | 254,464 | 1,817,977 | 172,647 | 789,802 | — | |||||||||||||||||||||||||||||||||||||||||||||||||||||||||
PGIM Quant Solutions Emerging Markets Equity Fund (Class R6) | ||||||||||||||||||||||||||||||||||||||||||||||||||||||||||||||||||
| 2,746,092 | 1,278,482 | 1,611,582 | (484,723 | ) | (53,002 | ) | 1,875,267 | 176,081 | 77,367 | 17,843 | ||||||||||||||||||||||||||||||||||||||||||||||||||||||||
PGIM Quant Solutions International Developed Markets Index Fund (Class R6) | ||||||||||||||||||||||||||||||||||||||||||||||||||||||||||||||||||
| 9,325,742 | 3,940,314 | 4,312,175 | (1,583,241 | ) | (173,951 | ) | 7,196,689 | 597,732 | 280,444 | 36,216 | ||||||||||||||||||||||||||||||||||||||||||||||||||||||||
PGIM Quant Solutions Large-Cap Core Fund (Class R6) | ||||||||||||||||||||||||||||||||||||||||||||||||||||||||||||||||||
| 14,805,612 | 6,104,489 | 7,506,643 | (2,593,106 | ) | 150,466 | 10,960,818 | 628,127 | 164,633 | 1,975,972 | |||||||||||||||||||||||||||||||||||||||||||||||||||||||||
PGIM Quant Solutions Mid-Cap Core Fund (Class R6) | ||||||||||||||||||||||||||||||||||||||||||||||||||||||||||||||||||
| 4,466,300 | 2,199,063 | 2,881,621 | (1,123,336 | ) | 58,422 | 2,718,828 | 252,914 | 38,767 | 938,093 | |||||||||||||||||||||||||||||||||||||||||||||||||||||||||
PGIM Quant Solutions US Broad Market Index Fund (Class R6) | ||||||||||||||||||||||||||||||||||||||||||||||||||||||||||||||||||
| 9,901,862 | 3,949,687 | 5,359,791 | (1,678,695 | ) | 255,783 | 7,068,846 | 419,765 | 130,443 | 968,334 | |||||||||||||||||||||||||||||||||||||||||||||||||||||||||
PGIM TIPS Fund (Class R6) | ||||||||||||||||||||||||||||||||||||||||||||||||||||||||||||||||||
| 4,013,143 | 2,576,756 | 2,739,772 | (385,291 | ) | (181,739 | ) | 3,283,097 | 347,786 | 298,539 | 79,921 | ||||||||||||||||||||||||||||||||||||||||||||||||||||||||
220
Prudential Day One 2040 Fund (cont’d.):
Value, Beginning of Year | Cost of Purchases | Proceeds from Sales | Change in Gain (Loss) | Realized Gain (Loss) | Value, End of Year | Shares, of Year | Dividend Income | Capital Gain | ||||||||||||||||||||||||||||||||||||||||||||||||||||||||||
PGIM Total Return Bond Fund (Class R6) | ||||||||||||||||||||||||||||||||||||||||||||||||||||||||||||||||||
| $ 5,084,486 | $ | 2,703,247 | $ | 3,015,904 | $ | (510,837 | ) | $ | (291,398 | ) | $ | 3,969,594 | 311,830 | $ | 162,687 | $ | — | |||||||||||||||||||||||||||||||||||||||||||||||||
| $59,369,728 | $ | 29,994,813 | $ | 34,131,009 | $ | (10,111,836 | ) | $ | (402,809 | ) | $ | 44,718,887 | $ | 2,062,115 | $ | 4,687,103 | ||||||||||||||||||||||||||||||||||||||||||||||||||
Short-Term Investments - Affiliated Mutual Fund(wd): | ||||||||||||||||||||||||||||||||||||||||||||||||||||||||||||||||||
PGIM Core Ultra Short Bond Fund | ||||||||||||||||||||||||||||||||||||||||||||||||||||||||||||||||||
| $ 802,801 | $ | 662,737 | $ | 798,009 | $ | — | $ | — | $ | 667,529 | 667,529 | $ | 3,416 | $ | — | |||||||||||||||||||||||||||||||||||||||||||||||||||
| $60,172,529 | $ | 30,657,550 | $ | 34,929,018 | $ | (10,111,836 | ) | $ | (402,809 | ) | $ | 45,386,416 | $ | 2,065,531 | $ | 4,687,103 | ||||||||||||||||||||||||||||||||||||||||||||||||||
| Prudential Day One 2045 Fund: | ||||||||||||||||||||||||||||||||||||||||||||||||||||||||||||||||||
Value, Beginning of Year | Cost of Purchases | Proceeds from Sales | Change in (Loss) | Realized Gain (Loss) | Value, End of Year | Shares, of Year | Dividend Income | Capital Gain | ||||||||||||||||||||||||||||||||||||||||||||||||||||||||||
Long-Term Investments - Affiliated Mutual Funds(wd): | ||||||||||||||||||||||||||||||||||||||||||||||||||||||||||||||||||
PGIM Core Conservative Bond Fund (Class R6) | ||||||||||||||||||||||||||||||||||||||||||||||||||||||||||||||||||
| $ 1,119,453 | $ | 823,571 | $ | 812,847 | $ | (90,476 | ) | $ | (54,157 | ) | $ | 985,544 | 107,710 | $ | 21,289 | $ | 2,736 | |||||||||||||||||||||||||||||||||||||||||||||||||
PGIM Global Real Estate Fund (Class R6) | ||||||||||||||||||||||||||||||||||||||||||||||||||||||||||||||||||
| 1,858,119 | 737,130 | 977,234 | (415,013 | ) | 36,158 | 1,239,160 | 60,535 | 42,075 | 183,020 | |||||||||||||||||||||||||||||||||||||||||||||||||||||||||
PGIM Jennison Small-Cap Core Equity Fund (Class R6) | ||||||||||||||||||||||||||||||||||||||||||||||||||||||||||||||||||
| 1,770,580 | 1,406,357 | 977,830 | (720,110 | ) | 45,231 | 1,524,228 | 124,123 | — | 289,730 | |||||||||||||||||||||||||||||||||||||||||||||||||||||||||
PGIM Quant Solutions Commodity Strategies Fund (Class R6) | ||||||||||||||||||||||||||||||||||||||||||||||||||||||||||||||||||
| 1,472,579 | 1,172,101 | 1,573,365 | (182,577 | ) | 169,581 | 1,058,319 | 100,505 | 377,725 | — | |||||||||||||||||||||||||||||||||||||||||||||||||||||||||
PGIM Quant Solutions Emerging Markets Equity Fund (Class R6) | ||||||||||||||||||||||||||||||||||||||||||||||||||||||||||||||||||
| 2,670,762 | 1,023,820 | 1,536,709 | (422,000 | ) | (24,268 | ) | 1,711,605 | 160,714 | 58,664 | 13,530 | ||||||||||||||||||||||||||||||||||||||||||||||||||||||||
PGIM Quant Solutions International Developed Markets Index Fund (Class R6) | ||||||||||||||||||||||||||||||||||||||||||||||||||||||||||||||||||
| 8,484,484 | 2,980,847 | 4,257,111 | (1,346,849 | ) | 48,372 | 5,909,743 | 490,842 | 197,876 | 25,553 | |||||||||||||||||||||||||||||||||||||||||||||||||||||||||
PGIM Quant Solutions Large-Cap Core Fund (Class R6) | ||||||||||||||||||||||||||||||||||||||||||||||||||||||||||||||||||
| 11,836,339 | 3,641,568 | 6,362,181 | (2,108,878 | ) | 566,699 | 7,573,547 | 434,014 | 102,023 | 1,224,508 | |||||||||||||||||||||||||||||||||||||||||||||||||||||||||
PGIM Quant Solutions Mid-Cap Core Fund (Class R6) | ||||||||||||||||||||||||||||||||||||||||||||||||||||||||||||||||||
| 4,096,798 | 1,590,609 | 2,465,163 | (951,549 | ) | 156,572 | 2,427,267 | 225,792 | 27,563 | 666,969 | |||||||||||||||||||||||||||||||||||||||||||||||||||||||||
PGIM Quant Solutions US Broad Market Index Fund (Class R6) | ||||||||||||||||||||||||||||||||||||||||||||||||||||||||||||||||||
| 7,869,179 | 2,398,301 | 4,343,839 | (1,353,313 | ) | 441,781 | 5,012,109 | 297,631 | 80,356 | 596,514 | |||||||||||||||||||||||||||||||||||||||||||||||||||||||||
PGIM TIPS Fund (Class R6) | ||||||||||||||||||||||||||||||||||||||||||||||||||||||||||||||||||
| 1,407,084 | 911,339 | 1,017,544 | (127,271 | ) | (50,431 | ) | 1,123,177 | 118,981 | 92,080 | 21,922 | ||||||||||||||||||||||||||||||||||||||||||||||||||||||||
PGIM Total Return Bond Fund (Class R6) | ||||||||||||||||||||||||||||||||||||||||||||||||||||||||||||||||||
| 3,735,144 | 1,439,838 | 2,249,157 | (323,481 | ) | (132,593 | ) | 2,469,751 | 194,010 | 94,223 | — | ||||||||||||||||||||||||||||||||||||||||||||||||||||||||
Prudential Day One Funds 221
Notes to Financial Statements (continued)
Prudential Day One 2045 Fund (cont’d.):
Value, of Year | Cost of Purchases | Proceeds from Sales | Change in Gain (Loss) | Realized (Loss) | Value, End of Year | Shares, of Year | Dividend Income | Capital Gain | ||||||||||||||||||||||||||||||||||||||||||||||||||||||||||
| $46,320,521 | $ | 18,125,481 | $ | 26,572,980 | $ | (8,041,517 | ) | $ | 1,202,945 | $ | 31,034,450 | $ | 1,093,874 | $ | 3,024,482 | |||||||||||||||||||||||||||||||||||||||||||||||||||
Short-Term Investments - Affiliated Mutual Fund(wd): | ||||||||||||||||||||||||||||||||||||||||||||||||||||||||||||||||||
PGIM Core Ultra Short Bond Fund | ||||||||||||||||||||||||||||||||||||||||||||||||||||||||||||||||||
| $ 71,829 | $ | 189,365 | $ | 204,501 | $ | — | $ | — | $ | 56,693 | 56,693 | $ | 202 | $ | — | |||||||||||||||||||||||||||||||||||||||||||||||||||
| $46,392,350 | $ | 18,314,846 | $ | 26,777,481 | $ | (8,041,517 | ) | $ | 1,202,945 | $ | 31,091,143 | $ | 1,094,076 | $ | 3,024,482 | |||||||||||||||||||||||||||||||||||||||||||||||||||
| Prudential Day One 2050 Fund: | ||||||||||||||||||||||||||||||||||||||||||||||||||||||||||||||||||
Value, of Year | Cost of Purchases | Proceeds from Sales | Change in (Loss) | Realized (Loss) | Value, End of Year | Shares, of Year | Dividend Income | Capital Gain | ||||||||||||||||||||||||||||||||||||||||||||||||||||||||||
Long-Term Investments - Affiliated Mutual Funds(wd): | ||||||||||||||||||||||||||||||||||||||||||||||||||||||||||||||||||
PGIM Core Conservative Bond Fund (Class R6) | ||||||||||||||||||||||||||||||||||||||||||||||||||||||||||||||||||
| $ 347,638 | $ | 263,287 | $ | 285,872 | $ | (26,559 | ) | $ | (20,793 | ) | $ | 277,701 | 30,350 | $ | 6,939 | $ | 1,058 | |||||||||||||||||||||||||||||||||||||||||||||||||
PGIM Global Real Estate Fund (Class R6) | ||||||||||||||||||||||||||||||||||||||||||||||||||||||||||||||||||
| 1,154,066 | 603,441 | 685,450 | (260,453 | ) | (13,489 | ) | 798,115 | 38,989 | 30,860 | 141,185 | ||||||||||||||||||||||||||||||||||||||||||||||||||||||||
PGIM Jennison Small-Cap Core Equity Fund (Class R6) | ||||||||||||||||||||||||||||||||||||||||||||||||||||||||||||||||||
| 1,157,570 | 1,127,891 | 781,358 | (449,389 | ) | (57,029 | ) | 997,685 | 81,245 | — | 235,297 | ||||||||||||||||||||||||||||||||||||||||||||||||||||||||
PGIM Quant Solutions Commodity Strategies Fund (Class R6) | ||||||||||||||||||||||||||||||||||||||||||||||||||||||||||||||||||
| 857,458 | 806,269 | 1,049,393 | (122,943 | ) | 110,054 | 601,445 | 57,117 | 273,441 | — | |||||||||||||||||||||||||||||||||||||||||||||||||||||||||
PGIM Quant Solutions Emerging Markets Equity Fund (Class R6) | ||||||||||||||||||||||||||||||||||||||||||||||||||||||||||||||||||
| 1,944,814 | 1,011,297 | 1,294,911 | (324,839 | ) | (37,123 | ) | 1,299,238 | 121,994 | 52,571 | 12,124 | ||||||||||||||||||||||||||||||||||||||||||||||||||||||||
PGIM Quant Solutions International Developed Markets Index Fund (Class R6) | ||||||||||||||||||||||||||||||||||||||||||||||||||||||||||||||||||
| 5,670,671 | 3,021,445 | 3,375,504 | (919,735 | ) | (118,745 | ) | 4,278,132 | 355,327 | 164,251 | 21,211 | ||||||||||||||||||||||||||||||||||||||||||||||||||||||||
PGIM Quant Solutions Large-Cap Core Fund (Class R6) | ||||||||||||||||||||||||||||||||||||||||||||||||||||||||||||||||||
| 7,581,258 | 3,255,577 | 4,526,181 | (1,332,920 | ) | 166,775 | 5,144,509 | 294,814 | 81,225 | 974,891 | |||||||||||||||||||||||||||||||||||||||||||||||||||||||||
PGIM Quant Solutions Mid-Cap Core Fund (Class R6) | ||||||||||||||||||||||||||||||||||||||||||||||||||||||||||||||||||
| 2,602,318 | 1,374,513 | 1,712,659 | (644,722 | ) | 30,085 | 1,649,535 | 153,445 | 21,765 | 526,673 | |||||||||||||||||||||||||||||||||||||||||||||||||||||||||
PGIM Quant Solutions US Broad Market Index Fund (Class R6) | ||||||||||||||||||||||||||||||||||||||||||||||||||||||||||||||||||
| 5,002,522 | 2,109,538 | 3,129,587 | (848,358 | ) | 174,289 | 3,308,404 | 196,461 | 63,497 | 471,370 | |||||||||||||||||||||||||||||||||||||||||||||||||||||||||
PGIM TIPS Fund (Class R6) | ||||||||||||||||||||||||||||||||||||||||||||||||||||||||||||||||||
| 349,559 | 281,330 | 301,513 | (31,636 | ) | (16,452 | ) | 281,288 | 29,797 | 25,087 | 6,781 | ||||||||||||||||||||||||||||||||||||||||||||||||||||||||
222
Prudential Day One 2050 Fund (cont’d.):
Value, of Year | Cost of Purchases | Proceeds from Sales | Change in Unrealized (Loss) | Realized Gain (Loss) | Value, End of Year | Shares, of Year | Dividend Income | Capital Gain | ||||||||||||||||||||||||||||||||||||||||||||||||||||||||||
PGIM Total Return Bond Fund (Class R6) | ||||||||||||||||||||||||||||||||||||||||||||||||||||||||||||||||||
| $ 2,087,855 | $ | 1,042,627 | $ | 1,495,987 | $ | (169,038 | ) | $ | (113,419 | ) | $ | 1,352,038 | 106,209 | $ | 59,108 | $ | — | |||||||||||||||||||||||||||||||||||||||||||||||||
| $28,755,729 | $ | 14,897,215 | $ | 18,638,415 | $ | (5,130,592 | ) | $ | 104,153 | $ | 19,988,090 | $ | 778,744 | $ | 2,390,590 | |||||||||||||||||||||||||||||||||||||||||||||||||||
Short-Term Investments - Affiliated Mutual Fund(wd): | ||||||||||||||||||||||||||||||||||||||||||||||||||||||||||||||||||
PGIM Core Ultra Short Bond Fund | ||||||||||||||||||||||||||||||||||||||||||||||||||||||||||||||||||
| $ 58,190 | $ | 182,301 | $ | 192,395 | $ | — | $ | — | $ | 48,096 | 48,096 | $ | 171 | $ | — | |||||||||||||||||||||||||||||||||||||||||||||||||||
| $28,813,919 | $ | 15,079,516 | $ | 18,830,810 | $ | (5,130,592 | ) | $ | 104,153 | $ | 20,036,186 | $ | 778,915 | $ | 2,390,590 | |||||||||||||||||||||||||||||||||||||||||||||||||||
| Prudential Day One 2055 Fund: | ||||||||||||||||||||||||||||||||||||||||||||||||||||||||||||||||||
Value, of Year | Cost of Purchases | Proceeds from Sales | Change in (Loss) | Realized (Loss) | Value, End of Year | Shares, of Year | Dividend Income | Capital Gain | ||||||||||||||||||||||||||||||||||||||||||||||||||||||||||
Long-Term Investments - Affiliated Mutual Funds(wd): | ||||||||||||||||||||||||||||||||||||||||||||||||||||||||||||||||||
PGIM Global Real Estate Fund (Class R6) | ||||||||||||||||||||||||||||||||||||||||||||||||||||||||||||||||||
| $ 634,484 | $ | 238,499 | $ | 489,126 | $ | (136,549 | ) | $ | 35,113 | $ | 282,421 | 13,797 | $ | 10,917 | $ | 48,417 | ||||||||||||||||||||||||||||||||||||||||||||||||||
PGIM Jennison Small-Cap Core Equity Fund (Class R6) | ||||||||||||||||||||||||||||||||||||||||||||||||||||||||||||||||||
| 763,694 | 375,222 | 587,190 | (298,165 | ) | 99,509 | 353,070 | 28,752 | — | 96,716 | |||||||||||||||||||||||||||||||||||||||||||||||||||||||||
PGIM Quant Solutions Commodity Strategies Fund (Class R6) | ||||||||||||||||||||||||||||||||||||||||||||||||||||||||||||||||||
| 471,410 | 308,218 | 555,154 | (93,855 | ) | 82,054 | 212,673 | 20,197 | 93,478 | — | |||||||||||||||||||||||||||||||||||||||||||||||||||||||||
PGIM Quant Solutions Emerging Markets Equity Fund (Class R6) | ||||||||||||||||||||||||||||||||||||||||||||||||||||||||||||||||||
| 1,226,459 | 448,055 | 991,739 | (194,117 | ) | 40,701 | 529,359 | 49,705 | 20,805 | 4,798 | |||||||||||||||||||||||||||||||||||||||||||||||||||||||||
PGIM Quant Solutions International Developed Markets Index Fund (Class R6) | ||||||||||||||||||||||||||||||||||||||||||||||||||||||||||||||||||
| 3,401,030 | 1,196,644 | 2,577,368 | (575,063 | ) | 168,181 | 1,613,424 | 134,005 | 61,373 | 7,926 | |||||||||||||||||||||||||||||||||||||||||||||||||||||||||
PGIM Quant Solutions Large-Cap Core Fund (Class R6) | ||||||||||||||||||||||||||||||||||||||||||||||||||||||||||||||||||
| 4,057,502 | 1,258,803 | 3,076,509 | (804,424 | ) | 372,818 | 1,808,190 | 103,621 | 27,029 | 324,411 | |||||||||||||||||||||||||||||||||||||||||||||||||||||||||
PGIM Quant Solutions Mid-Cap Core Fund (Class R6) | ||||||||||||||||||||||||||||||||||||||||||||||||||||||||||||||||||
| 1,557,882 | 565,120 | 1,258,804 | (435,251 | ) | 194,394 | 623,341 | 57,985 | 8,100 | 195,993 | |||||||||||||||||||||||||||||||||||||||||||||||||||||||||
PGIM Quant Solutions US Broad Market Index Fund (Class R6) | ||||||||||||||||||||||||||||||||||||||||||||||||||||||||||||||||||
| 2,639,642 | 819,728 | 2,034,750 | (597,623 | ) | 343,679 | 1,170,676 | 69,518 | 20,832 | 154,646 | |||||||||||||||||||||||||||||||||||||||||||||||||||||||||
PGIM Total Return Bond Fund (Class R6) | ||||||||||||||||||||||||||||||||||||||||||||||||||||||||||||||||||
| 1,052,246 | 439,819 | 911,205 | (69,212 | ) | (33,130 | ) | 478,518 | 37,590 | 20,311 | — | ||||||||||||||||||||||||||||||||||||||||||||||||||||||||
| $15,804,349 | $ | 5,650,108 | $ | 12,481,845 | $ | (3,204,259 | ) | $ | 1,303,319 | $ | 7,071,672 | $ | 262,845 | $ | 832,907 | |||||||||||||||||||||||||||||||||||||||||||||||||||
Prudential Day One Funds 223
Notes to Financial Statements (continued)
Prudential Day One 2055 Fund (cont’d.):
Value, of Year | Cost of Purchases | Proceeds from Sales | Change in (Loss) | Realized Gain (Loss) | Value, End of Year | Shares, of Year | Dividend Income | Capital Gain | ||||||||||||||||||||||||||||||||||||||||||||||||||||||||||
Short-Term Investments - Affiliated Mutual Fund(wd): | ||||||||||||||||||||||||||||||||||||||||||||||||||||||||||||||||||
PGIM Core Ultra Short Bond Fund | ||||||||||||||||||||||||||||||||||||||||||||||||||||||||||||||||||
| $ 45,853 | $ | 187,559 | $ | 196,919 | $ | — | $ | — | $ | 36,493 | 36,493 | $ | 116 | $ | — | |||||||||||||||||||||||||||||||||||||||||||||||||||
| $15,850,202 | $ | 5,837,667 | $ | 12,678,764 | $ | (3,204,259 | ) | $ | 1,303,319 | $ | 7,108,165 | $ | 262,961 | $ | 832,907 | |||||||||||||||||||||||||||||||||||||||||||||||||||
| Prudential Day One 2060 Fund: | ||||||||||||||||||||||||||||||||||||||||||||||||||||||||||||||||||
Value, of Year | Cost of Purchases | Proceeds from Sales | Change in (Loss) | Realized Gain (Loss) | Value, End of Year | Shares, of Year | Dividend Income | Capital Gain | ||||||||||||||||||||||||||||||||||||||||||||||||||||||||||
Long-Term Investments - Affiliated Mutual Funds(wd): | ||||||||||||||||||||||||||||||||||||||||||||||||||||||||||||||||||
PGIM Global Real Estate Fund (Class R6) | ||||||||||||||||||||||||||||||||||||||||||||||||||||||||||||||||||
| $ 377,158 | $ | 222,670 | $ | 234,549 | $ | (80,989 | ) | $ | (6,892 | ) | $ | 277,398 | 13,551 | $ | 9,896 | $ | 44,871 | |||||||||||||||||||||||||||||||||||||||||||||||||
PGIM Jennison Small-Cap Core Equity Fund (Class R6) | ||||||||||||||||||||||||||||||||||||||||||||||||||||||||||||||||||
| 472,879 | 333,111 | 281,492 | (141,454 | ) | (36,282 | ) | 346,762 | 28,238 | — | 93,452 | ||||||||||||||||||||||||||||||||||||||||||||||||||||||||
PGIM Quant Solutions Commodity Strategies Fund (Class R6) | ||||||||||||||||||||||||||||||||||||||||||||||||||||||||||||||||||
| 280,249 | 280,640 | 350,023 | (25,474 | ) | 23,644 | 209,036 | 19,852 | 86,693 | — | |||||||||||||||||||||||||||||||||||||||||||||||||||||||||
PGIM Quant Solutions Emerging Markets Equity Fund (Class R6) | ||||||||||||||||||||||||||||||||||||||||||||||||||||||||||||||||||
| 822,348 | 469,562 | 551,432 | (114,354 | ) | (37,678 | ) | 588,446 | 55,253 | 21,608 | 4,984 | ||||||||||||||||||||||||||||||||||||||||||||||||||||||||
PGIM Quant Solutions International Developed Markets Index Fund (Class R6) | ||||||||||||||||||||||||||||||||||||||||||||||||||||||||||||||||||
| 2,134,004 | 1,172,246 | 1,268,586 | (304,150 | ) | (69,413 | ) | 1,664,101 | 138,214 | 60,088 | 7,760 | ||||||||||||||||||||||||||||||||||||||||||||||||||||||||
PGIM Quant Solutions Large-Cap Core Fund (Class R6) | ||||||||||||||||||||||||||||||||||||||||||||||||||||||||||||||||||
| 2,393,198 | 1,157,412 | 1,447,661 | (366,988 | ) | 5,388 | 1,741,349 | 99,791 | 24,875 | 298,562 | |||||||||||||||||||||||||||||||||||||||||||||||||||||||||
PGIM Quant Solutions Mid-Cap Core Fund (Class R6) | ||||||||||||||||||||||||||||||||||||||||||||||||||||||||||||||||||
| 944,954 | 546,616 | 638,847 | (186,019 | ) | (29,306 | ) | 637,398 | 59,293 | 7,668 | 185,540 | ||||||||||||||||||||||||||||||||||||||||||||||||||||||||
PGIM Quant Solutions US Broad Market Index Fund (Class R6) | �� | |||||||||||||||||||||||||||||||||||||||||||||||||||||||||||||||||
| 1,550,321 | 759,772 | 946,479 | (212,049 | ) | (1,702 | ) | 1,149,863 | 68,282 | 19,091 | 141,721 | ||||||||||||||||||||||||||||||||||||||||||||||||||||||||
PGIM Total Return Bond Fund (Class R6) | ||||||||||||||||||||||||||||||||||||||||||||||||||||||||||||||||||
| 416,978 | 318,338 | 340,460 | (33,096 | ) | (30,054 | ) | 331,706 | 26,057 | 12,623 | — | ||||||||||||||||||||||||||||||||||||||||||||||||||||||||
| $ 9,392,089 | $ | 5,260,367 | $ | 6,059,529 | $ | (1,464,573 | ) | $ | (182,295 | ) | $ | 6,946,059 | $ | 242,542 | $ | 776,890 | ||||||||||||||||||||||||||||||||||||||||||||||||||
224
Prudential Day One 2060 Fund (cont’d.):
Value, Beginning of Year | Cost of Purchases | Proceeds from Sales | Change in Unrealized Gain (Loss) | Realized Gain (Loss) | Value, End of Year | Shares, End of Year | Dividend Income | Capital Gain Distributions | ||||||||||||||||||||||||||||||||||||||||||||||||||||||||||
Short-Term Investments - Affiliated Mutual Fund(wd): | ||||||||||||||||||||||||||||||||||||||||||||||||||||||||||||||||||
PGIM Core Ultra Short Bond Fund | ||||||||||||||||||||||||||||||||||||||||||||||||||||||||||||||||||
| $ 40,664 | $ | 160,591 | $ | 165,379 | $ | — | $ | — | $ | 35,876 | 35,876 | $ | 111 | $ | — | |||||||||||||||||||||||||||||||||||||||||||||||||||
| $ 9,432,753 | $ | 5,420,958 | $ | 6,224,908 | $ | (1,464,573 | ) | $ | (182,295 | ) | $ | 6,981,935 | $ | 242,653 | $ | 776,890 | ||||||||||||||||||||||||||||||||||||||||||||||||||
|
Prudential Day One 2065 Fund:
|
| ||||||||||||||||||||||||||||||||||||||||||||||||||||||||||||||||
Value, Beginning of Year | Cost of Purchases | Proceeds from Sales | Change in Unrealized Gain (Loss) | Realized Gain (Loss) | Value, End of Year | Shares, End of Year | Dividend Income | Capital Gain Distributions | ||||||||||||||||||||||||||||||||||||||||||||||||||||||||||
Long-Term Investments - Affiliated Mutual Funds(wd): | ||||||||||||||||||||||||||||||||||||||||||||||||||||||||||||||||||
PGIM Global Real Estate Fund (Class R6) | ||||||||||||||||||||||||||||||||||||||||||||||||||||||||||||||||||
| $ 20,964 | $ | 18,259 | $ | 14,475 | $ | (4,797 | ) | $ | (1,651 | ) | $ | 18,300 | 894 | $ | 614 | $ | 2,642 | |||||||||||||||||||||||||||||||||||||||||||||||||
PGIM Jennison Small-Cap Core Equity Fund (Class R6) | ||||||||||||||||||||||||||||||||||||||||||||||||||||||||||||||||||
| 26,284 | 26,470 | 17,751 | (8,356 | ) | (3,771 | ) | 22,876 | 1,863 | — | 5,501 | ||||||||||||||||||||||||||||||||||||||||||||||||||||||||
PGIM Quant Solutions Commodity Strategies Fund (Class R6) | ||||||||||||||||||||||||||||||||||||||||||||||||||||||||||||||||||
| 15,576 | 20,302 | 22,663 | (898 | ) | 1,473 | 13,790 | 1,310 | 5,091 | — | |||||||||||||||||||||||||||||||||||||||||||||||||||||||||
PGIM Quant Solutions Emerging Markets Equity Fund (Class R6) | ||||||||||||||||||||||||||||||||||||||||||||||||||||||||||||||||||
| 46,742 | 40,398 | 35,184 | (7,073 | ) | (4,258 | ) | 40,625 | 3,815 | 1,308 | 302 | ||||||||||||||||||||||||||||||||||||||||||||||||||||||||
PGIM Quant Solutions International Developed Markets Index Fund (Class R6) | ||||||||||||||||||||||||||||||||||||||||||||||||||||||||||||||||||
| 124,859 | 99,895 | 80,528 | (20,368 | ) | (9,494 | ) | 114,364 | 9,499 | 3,725 | 481 | ||||||||||||||||||||||||||||||||||||||||||||||||||||||||
PGIM Quant Solutions Large-Cap Core Fund (Class R6) | ||||||||||||||||||||||||||||||||||||||||||||||||||||||||||||||||||
| 133,021 | 96,127 | 87,080 | (21,123 | ) | (6,069 | ) | 114,876 | 6,583 | 1,461 | 17,534 | ||||||||||||||||||||||||||||||||||||||||||||||||||||||||
PGIM Quant Solutions Mid-Cap Core Fund (Class R6) | ||||||||||||||||||||||||||||||||||||||||||||||||||||||||||||||||||
| 52,524 | 43,410 | 39,521 | (10,684 | ) | (3,681 | ) | 42,048 | 3,912 | 450 | 10,895 | ||||||||||||||||||||||||||||||||||||||||||||||||||||||||
PGIM Quant Solutions US Broad Market Index Fund (Class R6) | ||||||||||||||||||||||||||||||||||||||||||||||||||||||||||||||||||
| 86,172 | 63,693 | 57,080 | (12,202 | ) | (4,727 | ) | 75,856 | 4,504 | 1,121 | 8,323 | ||||||||||||||||||||||||||||||||||||||||||||||||||||||||
PGIM Total Return Bond Fund (Class R6) | ||||||||||||||||||||||||||||||||||||||||||||||||||||||||||||||||||
| 15,806 | 18,375 | 15,475 | (1,626 | ) | (1,580 | ) | 15,500 | 1,218 | 588 | — | ||||||||||||||||||||||||||||||||||||||||||||||||||||||||
| $ 521,948 | $ | 426,929 | $ | 369,757 | $ | (87,127 | ) | $ | (33,758 | ) | $ | 458,235 | $ | 14,358 | $ | 45,678 | ||||||||||||||||||||||||||||||||||||||||||||||||||
Short-Term Investments - Affiliated Mutual Fund(wd): | ||||||||||||||||||||||||||||||||||||||||||||||||||||||||||||||||||
PGIM Core Ultra Short Bond Fund | ||||||||||||||||||||||||||||||||||||||||||||||||||||||||||||||||||
| $ 342 | $ | 5,130 | $ | 5,195 | $ | — | $ | — | $ | 277 | 277 | $ | 1 | $ | — | |||||||||||||||||||||||||||||||||||||||||||||||||||
| $ 522,290 | $ | 432,059 | $ | 374,952 | $ | (87,127 | ) | $ | (33,758 | ) | $ | 458,512 | $ | 14,359 | $ | 45,678 | ||||||||||||||||||||||||||||||||||||||||||||||||||
| (wd) | PGIM Investments LLC, the manager of the Fund, also serves as the manager of the underlying funds in which the Fund invests. |
Prudential Day One Funds 225
Notes to Financial Statements (continued)
| 6. | Distributions and Tax Information |
Distributions to shareholders, which are determined in accordance with federal income tax regulations and which may differ from GAAP, are recorded on the ex-date.
For the year ended July 31, 2022, the tax character of dividends paid as reflected in the Statement of Changes in Net Assets were as follows:
| Fund | Ordinary Income | Long-Term Capital Gains | Total Dividends and Distributions | |||||||||
Prudential Day One Income Fund | $ | 2,233,672 | $ 159,592 | $2,393,264 | ||||||||
Prudential Day One 2015 Fund | 1,100,783 | 256,727 | 1,357,510 | |||||||||
Prudential Day One 2020 Fund | 4,599,002 | 1,449,267 | 6,048,269 | |||||||||
Prudential Day One 2025 Fund | 6,850,077 | 1,896,875 | 8,746,952 | |||||||||
Prudential Day One 2030 Fund | 6,859,944 | 627,459 | 7,487,403 | |||||||||
Prudential Day One 2035 Fund | 4,706,096 | 2,171,482 | 6,877,578 | |||||||||
Prudential Day One 2040 Fund | 5,106,036 | 717,307 | 5,823,343 | |||||||||
Prudential Day One 2045 Fund | 3,552,456 | 1,231,367 | 4,783,823 | |||||||||
Prudential Day One 2050 Fund | 2,545,421 | 402,112 | 2,947,533 | |||||||||
Prudential Day One 2055 Fund | 1,177,073 | 1,241,905 | 2,418,978 | |||||||||
Prudential Day One 2060 Fund | 712,334 | 25,355 | 737,689 | |||||||||
Prudential Day One 2065 Fund | 41,018 | 1,132 | 42,150 | |||||||||
For the year ended July 31, 2021, the tax character of dividends paid as reflected in the Statement of Changes in Net Assets were as follows:
| Fund | Ordinary Income | Long-Term Capital Gains | Total Dividends and Distributions | |||||||||
Prudential Day One Income Fund | $ | 536,784 | $108,690 | $ 645,474 | ||||||||
Prudential Day One 2015 Fund | 300,474 | 97,209 | 397,683 | |||||||||
Prudential Day One 2020 Fund | 1,230,453 | 485,041 | 1,715,494 | |||||||||
Prudential Day One 2025 Fund | 1,496,956 | 569,624 | 2,066,580 | |||||||||
Prudential Day One 2030 Fund | 1,344,614 | 436,327 | 1,780,941 | |||||||||
Prudential Day One 2035 Fund | 968,905 | 384,260 | 1,353,165 | |||||||||
Prudential Day One 2040 Fund | 851,368 | 319,558 | 1,170,926 | |||||||||
Prudential Day One 2045 Fund | 572,623 | 207,688 | 780,311 | |||||||||
Prudential Day One 2050 Fund | 363,915 | 138,174 | 502,089 | |||||||||
Prudential Day One 2055 Fund | 207,172 | 83,808 | 290,980 | |||||||||
Prudential Day One 2060 Fund | 80,997 | 24,850 | 105,847 | |||||||||
Prudential Day One 2065 Fund | 3,684 | 67 | 3,751 | |||||||||
226
For the year ended July 31, 2022, the Day One Funds had the following amounts of accumulated undistributed earnings on a tax basis:
| Fund | Undistributed Ordinary Income | Undistributed Long-Term Capital Gains | ||||||
Prudential Day One Income Fund | $ 172,489 | $ 487,230 | ||||||
Prudential Day One 2015 Fund | 226,826 | 266,791 | ||||||
Prudential Day One 2020 Fund | 1,139,661 | 1,420,338 | ||||||
Prudential Day One 2025 Fund | 1,201,472 | 1,859,107 | ||||||
Prudential Day One 2030 Fund | 953,550 | 2,776,531 | ||||||
Prudential Day One 2035 Fund | 486,015 | 1,978,069 | ||||||
Prudential Day One 2040 Fund | 325,066 | 2,257,429 | ||||||
Prudential Day One 2045 Fund | — | 1,463,107 | ||||||
Prudential Day One 2050 Fund | — | 1,166,254 | ||||||
Prudential Day One 2055 Fund | — | 347,634 | ||||||
Prudential Day One 2060 Fund | 8,926 | 369,229 | ||||||
Prudential Day One 2065 Fund | 65 | 6,856 | ||||||
The United States federal income tax basis of the Day One Funds’ investments and the net unrealized appreciation/(depreciation) as of July 31, 2022 were as follows:
| Fund | Tax Basis | Gross Unrealized Appreciation | Gross Unrealized Depreciation | Net Unrealized | ||||||||||||
Prudential Day One Income Fund | $25,012,226 | $1,568,687 | $(2,191,300 | ) | $ (622,613 | ) | ||||||||||
Prudential Day One 2015 Fund | 12,042,755 | 1,062,740 | (1,267,398 | ) | (204,658 | ) | ||||||||||
Prudential Day One 2020 Fund | 50,736,751 | 4,819,294 | (4,788,665 | ) | 30,629 | |||||||||||
Prudential Day One 2025 Fund | 72,424,038 | 6,895,471 | (6,989,941 | ) | (94,470 | ) | ||||||||||
Prudential Day One 2030 Fund | 70,164,500 | 7,346,496 | (6,349,787 | ) | 996,709 | |||||||||||
Prudential Day One 2035 Fund | 47,507,634 | 5,776,162 | (4,122,838 | ) | 1,653,324 | |||||||||||
Prudential Day One 2040 Fund | 43,129,358 | 5,702,326 | (3,445,268 | ) | 2,257,058 | |||||||||||
Prudential Day One 2045 Fund | 29,782,550 | 3,869,949 | (2,561,356 | ) | 1,308,593 | |||||||||||
Prudential Day One 2050 Fund | 18,778,361 | 2,589,201 | (1,331,376 | ) | 1,257,825 | |||||||||||
Prudential Day One 2055 Fund | 6,626,453 | 1,223,783 | (742,071 | ) | 481,712 | |||||||||||
Prudential Day One 2060 Fund | 6,905,319 | 598,939 | (522,323 | ) | 76,616 | |||||||||||
Prudential Day One 2065 Fund | 471,368 | 19,424 | (32,280 | ) | (12,856 | ) | ||||||||||
The difference between book basis and tax basis was primarily attributable to deferred losses on wash sales.
Prudential Day One Funds 227
Notes to Financial Statements (continued)
The Fund elected to treat the below post-October capital losses as having been incurred in the following fiscal year (July 31, 2023).
| Fund | Post-October Capital Losses | |||
Prudential Day One 2015 Fund | $ 12,000 | |||
Prudential Day One 2025 Fund | 198,000 | |||
Prudential Day One 2030 Fund | 44,000 | |||
Prudential Day One 2035 Fund | 209,000 | |||
Prudential Day One 2040 Fund | 53,000 | |||
Prudential Day One 2045 Fund | 52,000 | |||
Prudential Day One 2050 Fund | 105,000 | |||
Prudential Day One 2055 Fund | 196,000 | |||
Prudential Day One 2060 Fund | 29,000 | |||
The Manager has analyzed the Day One Funds’ tax positions taken on federal, state and local income tax returns for all open tax years and has concluded that no provision for income tax is required in the Day One Funds’ financial statements for the current reporting period. Since tax authorities can examine previously filed tax returns, the Day One Funds’ U.S. federal and state tax returns for each of the four fiscal years up to the most recent fiscal year ended July 31, 2022 are subject to such review.
| 7. | Capital and Ownership |
The RIC is authorized to issue an unlimited number of shares of beneficial interest of the Day One Funds, at $0.001 par value per share. The Day One Funds offer Class R1, Class R2, Class R3, Class R4, Class R5 and Class R6 shares.
Under certain circumstances, an exchange may be made from specified share classes of the Day One Funds to one or more other share classes of the Day One Funds as presented in the table of transactions in shares of beneficial interest, below.
As of July 31, 2022, Prudential, through its affiliated entities, including affiliated funds (if applicable), owned shares of the Day One Funds as follows:
| Fund | Number of Shares | Percentage of Outstanding Shares | ||||||
Prudential Day One Income Fund–Class R1 | 2,390 | 98.5 | % | |||||
Prudential Day One Income Fund–Class R2 | 2,423 | 53.5 | ||||||
Prudential Day One Income Fund–Class R4 | 2,455 | 100.0 | ||||||
Prudential Day One Income Fund–Class R5 | 87,299 | 99.8 | ||||||
Prudential Day One Income Fund–Class R6 | 1,316,752 | 60.4 | ||||||
Prudential Day One 2015 Fund–Class R1 | 1,206 | 100.0 | ||||||
Prudential Day One 2015 Fund–Class R2 | 1,220 | 26.1 | ||||||
228
| Fund | Number of Shares | Percentage of Outstanding Shares | ||||||
Prudential Day One 2015 Fund–Class R3 | 1,229 | 100.0 | % | |||||
Prudential Day One 2015 Fund–Class R4 | 1,236 | 100.0 | ||||||
Prudential Day One 2015 Fund–Class R5 | 16,125 | 100.0 | ||||||
Prudential Day One 2015 Fund–Class R6 | 829,075 | 77.7 | ||||||
Prudential Day One 2020 Fund–Class R1 | 1,199 | 100.0 | ||||||
Prudential Day One 2020 Fund–Class R4 | 1,228 | 100.0 | ||||||
Prudential Day One 2020 Fund–Class R5 | 265,345 | 100.0 | ||||||
Prudential Day One 2020 Fund–Class R6 | 2,825,005 | 67.4 | ||||||
Prudential Day One 2025 Fund–Class R1 | 1,223 | 100.0 | ||||||
Prudential Day One 2025 Fund–Class R4 | 1,253 | 62.8 | ||||||
Prudential Day One 2025 Fund–Class R5 | 53,026 | 98.4 | ||||||
Prudential Day One 2025 Fund–Class R6 | 3,339,786 | 52.8 | ||||||
Prudential Day One 2030 Fund–Class R1 | 1,210 | 24.6 | ||||||
Prudential Day One 2030 Fund–Class R4 | 1,241 | 48.1 | ||||||
Prudential Day One 2030 Fund–Class R5 | 318,700 | 97.3 | ||||||
Prudential Day One 2030 Fund–Class R6 | 3,337,087 | 61.0 | ||||||
Prudential Day One 2035 Fund–Class R1 | 1,270 | 48.4 | ||||||
Prudential Day One 2035 Fund–Class R4 | 1,301 | 100.0 | ||||||
Prudential Day One 2035 Fund–Class R5 | 37,383 | 81.3 | ||||||
Prudential Day One 2035 Fund–Class R6 | 2,027,275 | 50.1 | ||||||
Prudential Day One 2040 Fund–Class R1 | 1,231 | 39.2 | ||||||
Prudential Day One 2040 Fund–Class R4 | 1,261 | 31.3 | ||||||
Prudential Day One 2040 Fund–Class R5 | 531,808 | 98.5 | ||||||
Prudential Day One 2040 Fund–Class R6 | 1,355,550 | 44.5 | ||||||
Prudential Day One 2045 Fund–Class R1 | 1,302 | 100.0 | ||||||
Prudential Day One 2045 Fund–Class R4 | 1,335 | 34.0 | ||||||
Prudential Day One 2045 Fund–Class R5 | 59,907 | 90.3 | ||||||
Prudential Day One 2045 Fund–Class R6 | 665,467 | 26.5 | ||||||
Prudential Day One 2050 Fund–Class R1 | 1,244 | 32.9 | ||||||
Prudential Day One 2050 Fund–Class R3 | 754 | 61.0 | ||||||
Prudential Day One 2050 Fund–Class R4 | 1,274 | 17.7 | ||||||
Prudential Day One 2050 Fund–Class R5 | 91,200 | 96.5 | ||||||
Prudential Day One 2050 Fund–Class R6 | 512,346 | 34.7 | ||||||
Prudential Day One 2055 Fund–Class R1 | 1,508 | 93.5 | ||||||
Prudential Day One 2055 Fund–Class R2 | 1,525 | 5.7 | ||||||
Prudential Day One 2055 Fund–Class R3 | 887 | 63.1 | ||||||
Prudential Day One 2055 Fund–Class R4 | 1,544 | 81.2 | ||||||
Prudential Day One 2055 Fund–Class R5 | 34,481 | 97.2 | ||||||
Prudential Day One 2055 Fund–Class R6 | 142,516 | 23.1 | ||||||
Prudential Day One 2060 Fund–Class R1 | 1,205 | 91.6 | ||||||
Prudential Day One 2060 Fund–Class R4 | 1,231 | 89.4 | ||||||
Prudential Day One 2060 Fund–Class R5 | 33,800 | 98.9 | ||||||
Prudential Day One 2060 Fund–Class R6 | 89,325 | 18.5 | ||||||
Prudential Day One 2065 Fund–Class R1 | 1,089 | 100.0 | ||||||
Prudential Day One 2065 Fund–Class R2 | 1,094 | 16.2 | ||||||
Prudential Day One 2065 Fund–Class R3 | 1,097 | 100.0 | ||||||
Prudential Day One 2065 Fund–Class R4 | 1,099 | 100.0 | ||||||
Prudential Day One Funds 229
Notes to Financial Statements (continued)
| Fund | Number of Shares | Percentage of Outstanding Shares | ||||||
Prudential Day One 2065 Fund–Class R5 | 1,101 | 84.2 | % | |||||
Prudential Day One 2065 Fund–Class R6 | 23,080 | 74.6 | ||||||
At the reporting period end, the number of shareholders holding greater than 5% of the Day One Funds are as follows:
| Fund | Number of Shareholders | Percentage of Outstanding Shares | ||||
Affiliated: |
| |||||
Prudential Day One Income Fund | 1 | 57.5 | % | |||
Prudential Day One 2015 Fund | 1 | 76.0 | ||||
Prudential Day One 2020 Fund | 2 | 67.7 | ||||
Prudential Day One 2025 Fund | 1 | 51.9 | ||||
Prudential Day One 2030 Fund | 2 | 61.5 | ||||
Prudential Day One 2035 Fund | 1 | 48.6 | ||||
Prudential Day One 2040 Fund | 2 | 51.6 | ||||
Prudential Day One 2045 Fund | 1 | 25.4 | ||||
Prudential Day One 2050 Fund | 2 | 37.4 | ||||
Prudential Day One 2055 Fund | 1 | 20.8 | ||||
Prudential Day One 2060 Fund | 2 | 22.7 | ||||
Prudential Day One 2065 Fund | 2 | 67.6 | ||||
Unaffiliated: |
| |||||
Prudential Day One Income Fund | 2 | 26.6 | ||||
Prudential Day One 2015 Fund | 1 | 10.0 | ||||
Prudential Day One 2020 Fund | 2 | 21.3 | ||||
Prudential Day One 2025 Fund | 3 | 34.0 | ||||
Prudential Day One 2030 Fund | 3 | 28.2 | ||||
Prudential Day One 2035 Fund | 2 | 32.5 | ||||
Prudential Day One 2040 Fund | 2 | 33.6 | ||||
Prudential Day One 2045 Fund | 2 | 49.6 | ||||
Prudential Day One 2050 Fund | 4 | 53.3 | ||||
Prudential Day One 2055 Fund | 3 | 56.2 | ||||
Prudential Day One 2060 Fund | 3 | 62.9 | ||||
Prudential Day One 2065 Fund | 1 | 16.8 | ||||
Transactions in shares of beneficial interest were as follows:
230
Prudential Day One Income Fund:
| Share Class | Shares | Amount | ||||||||||
Class R1 | ||||||||||||
Year ended July 31, 2022: | ||||||||||||
Shares sold | 13 | $ | 148 | |||||||||
Shares issued in reinvestment of dividends and distributions | 175 | 2,001 | ||||||||||
Shares purchased | — | ** | (3 | ) | ||||||||
Net increase (decrease) in shares outstanding | 188 | $ | 2,146 | |||||||||
Year ended July 31, 2021: | ||||||||||||
Shares sold | — | ** | $ | 2 | ||||||||
Shares issued in reinvestment of dividends and distributions | 36 | 413 | ||||||||||
Shares purchased | — | ** | (3 | ) | ||||||||
Net increase (decrease) in shares outstanding | 36 | $ | 412 | |||||||||
Class R2 | ||||||||||||
Year ended July 31, 2022: | ||||||||||||
Shares sold | 14,891 | $ | 175,016 | |||||||||
Shares issued in reinvestment of dividends and distributions | 12,608 | 145,975 | ||||||||||
Shares purchased | (197,970 | ) | (2,221,669 | ) | ||||||||
Net increase (decrease) in shares outstanding | (170,471 | ) | $ | (1,900,678 | ) | |||||||
Year ended July 31, 2021: | ||||||||||||
Shares sold | 139,870 | $ | 1,561,165 | |||||||||
Shares issued in reinvestment of dividends and distributions | 4,554 | 51,947 | ||||||||||
Shares purchased | (138,265 | ) | (1,584,824 | ) | ||||||||
Net increase (decrease) in shares outstanding | 6,159 | $ | 28,288 | |||||||||
Class R3 | ||||||||||||
Year ended July 31, 2022: | ||||||||||||
Shares sold | 557 | $ | 7,043 | |||||||||
Shares issued in reinvestment of dividends and distributions | 1,146 | 13,092 | ||||||||||
Shares purchased | (120,380 | ) | (1,459,222 | ) | ||||||||
Net increase (decrease) in shares outstanding | (118,677 | ) | $ | (1,439,087 | ) | |||||||
Year ended July 31, 2021: | ||||||||||||
Shares sold | 23,084 | $ | 265,225 | |||||||||
Shares issued in reinvestment of dividends and distributions | 2,866 | 32,737 | ||||||||||
Shares purchased | (42,557 | ) | (488,317 | ) | ||||||||
Net increase (decrease) in shares outstanding | (16,607 | ) | $ | (190,355 | ) | |||||||
Class R4 | ||||||||||||
Year ended July 31, 2022: | ||||||||||||
Shares issued in reinvestment of dividends and distributions | 189 | $ | 2,163 | |||||||||
Net increase (decrease) in shares outstanding | 189 | $ | 2,163 | |||||||||
Prudential Day One Funds 231
Notes to Financial Statements (continued)
Prudential Day One Income Fund (cont’d.):
| Share Class | Shares | Amount | ||||||||||
Year ended July 31, 2021: | ||||||||||||
Shares issued in reinvestment of dividends and distributions | 48 | $ | 543 | |||||||||
Net increase (decrease) in shares outstanding | 48 | $ | 543 | |||||||||
Class R5 | ||||||||||||
Year ended July 31, 2022: | ||||||||||||
Shares sold | 4,761 | $ | 52,968 | |||||||||
Shares issued in reinvestment of dividends and distributions | 6,659 | 75,927 | ||||||||||
Shares purchased | (3,450 | ) | (40,141 | ) | ||||||||
Net increase (decrease) in shares outstanding | 7,970 | $ | 88,754 | |||||||||
Year ended July 31, 2021: | ||||||||||||
Shares sold | 13,737 | $ | 157,747 | |||||||||
Shares issued in reinvestment of dividends and distributions | 1,796 | 20,518 | ||||||||||
Shares purchased | (19,588 | ) | (223,090 | ) | ||||||||
Net increase (decrease) in shares outstanding | (4,055 | ) | $ | (44,825 | ) | |||||||
Class R6 | ||||||||||||
Year ended July 31, 2022: | ||||||||||||
Shares sold | 720,805 | $ | 8,602,685 | |||||||||
Shares issued in reinvestment of dividends and distributions | 188,349 | 2,154,067 | ||||||||||
Shares purchased | (719,230 | ) | (8,343,226 | ) | ||||||||
Net increase (decrease) in shares outstanding | 189,924 | $ | 2,413,526 | |||||||||
Year ended July 31, 2021: | ||||||||||||
Shares sold | 949,757 | $ | 10,780,478 | |||||||||
Shares issued in reinvestment of dividends and distributions | 47,075 | 539,316 | ||||||||||
Shares purchased | (546,947 | ) | (6,417,454 | ) | ||||||||
Net increase (decrease) in shares outstanding | 449,885 | $ | 4,902,340 | |||||||||
** Less than 1 share. | ||||||||||||
Prudential Day One 2015 Fund:
| ||||||||||||
| Share Class | Shares | Amount | ||||||||||
Class R1 | ||||||||||||
Year ended July 31, 2022: | ||||||||||||
Shares issued in reinvestment of dividends and distributions | 101 | $ | 1,166 | |||||||||
Net increase (decrease) in shares outstanding | 101 | $ | 1,166 | |||||||||
232
Prudential Day One 2015 Fund (cont’d.):
| Share Class | Shares | Amount | ||||||||||
Year ended July 31, 2021: | ||||||||||||
Shares issued in reinvestment of dividends and distributions | 19 | $ | 228 | |||||||||
Net increase (decrease) in shares outstanding | 19 | $ | 228 | |||||||||
Class R2 | ||||||||||||
Year ended July 31, 2022: | ||||||||||||
Shares sold | 399 | $ | 4,577 | |||||||||
Shares issued in reinvestment of dividends and distributions | 382 | 4,443 | ||||||||||
Shares purchased | (134 | ) | (1,614 | ) | ||||||||
Net increase (decrease) in shares outstanding | 647 | $ | 7,406 | |||||||||
Year ended July 31, 2021: | ||||||||||||
Shares sold | 263 | $ | 3,100 | |||||||||
Shares issued in reinvestment of dividends and distributions | 78 | 899 | ||||||||||
Shares purchased | (62 | ) | (765 | ) | ||||||||
Net increase (decrease) in shares outstanding | 279 | $ | 3,234 | |||||||||
Class R3 | ||||||||||||
Year ended July 31, 2022: | ||||||||||||
Shares issued in reinvestment of dividends and distributions | 106 | $ | 1,239 | |||||||||
Net increase (decrease) in shares outstanding | 106 | $ | 1,239 | |||||||||
Year ended July 31, 2021: | ||||||||||||
Shares issued in reinvestment of dividends and distributions | 24 | $ | 279 | |||||||||
Net increase (decrease) in shares outstanding | 24 | $ | 279 | |||||||||
Class R4 | ||||||||||||
Year ended July 31, 2022: | ||||||||||||
Shares issued in reinvestment of dividends and distributions | 108 | $ | 1,259 | |||||||||
Net increase (decrease) in shares outstanding | 108 | $ | 1,259 | |||||||||
Year ended July 31, 2021: | ||||||||||||
Shares issued in reinvestment of dividends and distributions | 26 | $ | 292 | |||||||||
Net increase (decrease) in shares outstanding | 26 | $ | 292 | |||||||||
Class R5 | ||||||||||||
Year ended July 31, 2022: | ||||||||||||
Shares sold | 7,391 | $ | 83,995 | |||||||||
Shares issued in reinvestment of dividends and distributions | 1,150 | 13,383 | ||||||||||
Shares purchased | (3,089 | ) | (32,005 | ) | ||||||||
Net increase (decrease) in shares outstanding | 5,452 | $ | 65,373 | |||||||||
Prudential Day One Funds 233
Notes to Financial Statements (continued)
Prudential Day One 2015 Fund (cont’d.):
| Share Class | Shares | Amount | ||||||||||
Year ended July 31, 2021: | ||||||||||||
Shares sold | 3,389 | $ | 39,830 | |||||||||
Shares issued in reinvestment of dividends and distributions | 578 | 6,668 | ||||||||||
Shares purchased | (16,270 | ) | (190,767 | ) | ||||||||
Net increase (decrease) in shares outstanding | (12,303 | ) | $ | (144,269 | ) | |||||||
Class R6 | ||||||||||||
Year ended July 31, 2022: | ||||||||||||
Shares sold | 98,722 | $ | 1,211,781 | |||||||||
Shares issued in reinvestment of dividends and distributions | 114,877 | 1,336,020 | ||||||||||
Shares purchased | (344,880 | ) | (3,944,904 | ) | ||||||||
Net increase (decrease) in shares outstanding | (131,281 | ) | $ | (1,397,103 | ) | |||||||
Year ended July 31, 2021: | ||||||||||||
Shares sold | 573,357 | $ | 6,598,097 | |||||||||
Shares issued in reinvestment of dividends and distributions | 33,766 | 389,317 | ||||||||||
Shares purchased | (491,206 | ) | (5,871,867 | ) | ||||||||
Net increase (decrease) in shares outstanding | 115,917 | $ | 1,115,547 | |||||||||
Prudential Day One 2020 Fund:
| ||||||||||||
| Share Class | Shares | Amount | ||||||||||
Class R1 | ||||||||||||
Year ended July 31, 2022: | ||||||||||||
Shares issued in reinvestment of dividends and distributions | 100 | $ | 1,202 | |||||||||
Net increase (decrease) in shares outstanding | 100 | $ | 1,202 | |||||||||
Year ended July 31, 2021: | ||||||||||||
Shares issued in reinvestment of dividends and distributions | 20 | $ | 244 | |||||||||
Net increase (decrease) in shares outstanding | 20 | $ | 244 | |||||||||
Class R2 | ||||||||||||
Year ended July 31, 2022: | ||||||||||||
Shares sold | 104,291 | $ | 1,312,038 | |||||||||
Shares issued in reinvestment of dividends and distributions | 32,528 | 390,989 | ||||||||||
Shares purchased | (579,301 | ) | (6,952,142 | ) | ||||||||
Net increase (decrease) in shares outstanding | (442,482 | ) | $ | (5,249,115 | ) | |||||||
234
Prudential Day One 2020 Fund (cont’d.):
| Share Class | Shares | Amount | ||||||||||
Year ended July 31, 2021: | ||||||||||||
Shares sold | 192,601 | $ | 2,297,926 | |||||||||
Shares issued in reinvestment of dividends and distributions | 7,515 | 88,673 | ||||||||||
Shares purchased | (138,830 | ) | (1,606,057 | ) | ||||||||
Net increase (decrease) in shares outstanding | 61,286 | $ | 780,542 | |||||||||
Class R3 | ||||||||||||
Year ended July 31, 2022: | ||||||||||||
Shares sold | 1,317 | $ | 17,199 | |||||||||
Shares issued in reinvestment of dividends and distributions | 9,406 | 113,256 | ||||||||||
Shares purchased | (55,636 | ) | �� | (699,284 | ) | |||||||
Net increase (decrease) in shares outstanding | (44,913 | ) | $ | (568,829 | ) | |||||||
Year ended July 31, 2021: | ||||||||||||
Shares sold | 16,731 | $ | 200,116 | |||||||||
Shares issued in reinvestment of dividends and distributions | 3,030 | 35,790 | ||||||||||
Shares purchased | (12,733 | ) | (147,665 | ) | ||||||||
Net increase (decrease) in shares outstanding | 7,028 | $ | 88,241 | |||||||||
Class R4 | ||||||||||||
Year ended July 31, 2022: | ||||||||||||
Shares issued in reinvestment of dividends and distributions | 107 | $ | 1,296 | |||||||||
Net increase (decrease) in shares outstanding | 107 | $ | 1,296 | |||||||||
Year ended July 31, 2021: | ||||||||||||
Shares issued in reinvestment of dividends and distributions | 26 | $ | 308 | |||||||||
Net increase (decrease) in shares outstanding | 26 | $ | 308 | |||||||||
Class R5 | ||||||||||||
Year ended July 31, 2022: | ||||||||||||
Shares sold | 14,637 | $ | 170,276 | |||||||||
Shares issued in reinvestment of dividends and distributions | 27,186 | 327,317 | ||||||||||
Shares purchased | (54,868 | ) | (605,130 | ) | ||||||||
Net increase (decrease) in shares outstanding | (13,045 | ) | $ | (107,537 | ) | |||||||
Year ended July 31, 2021: | ||||||||||||
Shares sold | 20,325 | $ | 248,151 | |||||||||
Shares issued in reinvestment of dividends and distributions | 6,643 | 78,525 | ||||||||||
Shares purchased | (68,856 | ) | (805,076 | ) | ||||||||
Net increase (decrease) in shares outstanding | (41,888 | ) | $ | (478,400 | ) | |||||||
Prudential Day One Funds 235
Notes to Financial Statements (continued)
Prudential Day One 2020 Fund (cont’d.):
| Share Class | Shares | Amount | ||||||||||
Class R6 | ||||||||||||
Year ended July 31, 2022: | ||||||||||||
Shares sold | 434,223 | $ | 5,312,864 | |||||||||
Shares issued in reinvestment of dividends and distributions | 434,880 | 5,214,209 | ||||||||||
Shares purchased | (1,240,115 | ) | (14,583,522 | ) | ||||||||
Net increase (decrease) in shares outstanding | (371,012 | ) | $ | (4,056,449 | ) | |||||||
Year ended July 31, 2021: | ||||||||||||
Shares sold | 1,759,390 | $ | 20,891,530 | |||||||||
Shares issued in reinvestment of dividends and distributions | 128,458 | 1,511,954 | ||||||||||
Shares purchased | (1,667,372 | ) | (20,533,196 | ) | ||||||||
Net increase (decrease) in shares outstanding | 220,476 | $ | 1,870,288 | |||||||||
Prudential Day One 2025 Fund:
|
| |||||||||||
| Share Class | Shares | Amount | ||||||||||
Class R1 | ||||||||||||
Year ended July 31, 2022: | ||||||||||||
Shares issued in reinvestment of dividends and distributions | 111 | $ | 1,353 | |||||||||
Net increase (decrease) in shares outstanding | 111 | $ | 1,353 | |||||||||
Year ended July 31, 2021: | ||||||||||||
Shares issued in reinvestment of dividends and distributions | 19 | $ | 225 | |||||||||
Net increase (decrease) in shares outstanding | 19 | $ | 225 | |||||||||
Class R2 | ||||||||||||
Year ended July 31, 2022: | ||||||||||||
Shares sold | 3,701 | $ | 44,072 | |||||||||
Shares issued in reinvestment of dividends and distributions | 686 | 8,344 | ||||||||||
Shares purchased | (1,213 | ) | (14,902 | ) | ||||||||
Net increase (decrease) in shares outstanding | 3,174 | $ | 37,514 | |||||||||
Year ended July 31, 2021: | ||||||||||||
Shares sold | 3,434 | $ | 41,766 | |||||||||
Shares issued in reinvestment of dividends and distributions | 79 | 933 | ||||||||||
Shares purchased | (5,267 | ) | (61,751 | ) | ||||||||
Net increase (decrease) in shares outstanding | (1,754 | ) | $ | (19,052 | ) | |||||||
236
Prudential Day One 2025 Fund (cont’d.):
| Share Class | Shares | Amount | ||||||||||
Class R3 | ||||||||||||
Year ended July 31, 2022: | ||||||||||||
Shares sold | 3,542 | $ | 44,924 | |||||||||
Shares issued in reinvestment of dividends and distributions | 3,800 | 46,210 | ||||||||||
Shares purchased | (726,393 | ) | (9,486,356 | ) | ||||||||
Net increase (decrease) in shares outstanding | (719,051 | ) | $ | (9,395,222 | ) | |||||||
Year ended July 31, 2021: | ||||||||||||
Shares sold | 152,946 | $ | 1,836,914 | |||||||||
Shares issued in reinvestment of dividends and distributions | 15,252 | 181,348 | ||||||||||
Shares purchased | (124,536 | ) | (1,495,173 | ) | ||||||||
Net increase (decrease) in shares outstanding | 43,662 | $ | 523,089 | |||||||||
Class R4 | ||||||||||||
Year ended July 31, 2022: | ||||||||||||
Shares sold | 726 | $ | 8,616 | |||||||||
Shares issued in reinvestment of dividends and distributions | 137 | 1,671 | ||||||||||
Shares purchased | (1 | ) | (10 | ) | ||||||||
Net increase (decrease) in shares outstanding | 862 | $ | 10,277 | |||||||||
Year ended July 31, 2021: | ||||||||||||
Shares issued in reinvestment of dividends and distributions | 25 | $ | 290 | |||||||||
Net increase (decrease) in shares outstanding | 25 | $ | 290 | |||||||||
Class R5 | ||||||||||||
Year ended July 31, 2022: | ||||||||||||
Shares sold | 41,893 | $ | 498,097 | |||||||||
Shares issued in reinvestment of dividends and distributions | 2,714 | 33,003 | ||||||||||
Shares purchased | (11,073 | ) | (122,926 | ) | ||||||||
Net increase (decrease) in shares outstanding | 33,534 | $ | 408,174 | |||||||||
Year ended July 31, 2021: | ||||||||||||
Shares sold | 8,776 | $ | 108,129 | |||||||||
Shares issued in reinvestment of dividends and distributions | 380 | 4,518 | ||||||||||
Shares purchased | (2,964 | ) | (35,568 | ) | ||||||||
Net increase (decrease) in shares outstanding | 6,192 | $ | 77,079 | |||||||||
Class R6 | ||||||||||||
Year ended July 31, 2022: | ||||||||||||
Shares sold | 1,650,400 | $ | 20,713,463 | |||||||||
Shares issued in reinvestment of dividends and distributions | 710,704 | 8,656,371 | ||||||||||
Shares purchased | (2,161,821 | ) | (25,304,644 | ) | ||||||||
Net increase (decrease) in shares outstanding | 199,283 | $ | 4,065,190 | |||||||||
Prudential Day One Funds 237
Notes to Financial Statements (continued)
Prudential Day One 2025 Fund (cont’d.):
| Share Class | Shares | Amount | ||||||||||
Year ended July 31, 2021: | ||||||||||||
Shares sold | 2,436,616 | $ | 29,051,786 | |||||||||
Shares issued in reinvestment of dividends and distributions | 157,922 | 1,879,266 | ||||||||||
Shares purchased | (1,966,940 | ) | (24,563,060 | ) | ||||||||
Net increase (decrease) in shares outstanding | 627,598 | $ | 6,367,992 | |||||||||
Prudential Day One 2030 Fund:
| ||||||||||||
| Share Class | Shares | Amount | ||||||||||
Class R1 | ||||||||||||
Year ended July 31, 2022: | ||||||||||||
Shares sold | 557 | $ | 7,268 | |||||||||
Shares issued in reinvestment of dividends and distributions | 357 | 4,666 | ||||||||||
Shares purchased | (21 | ) | (264 | ) | ||||||||
Net increase (decrease) in shares outstanding | 893 | $ | 11,670 | |||||||||
Year ended July 31, 2021: | ||||||||||||
Shares sold | 643 | $ | 7,870 | |||||||||
Shares issued in reinvestment of dividends and distributions | 62 | 770 | ||||||||||
Shares purchased | (23 | ) | (297 | ) | ||||||||
Net increase (decrease) in shares outstanding | 682 | $ | 8,343 | |||||||||
Class R2 | ||||||||||||
Year ended July 31, 2022: | ||||||||||||
Shares sold | 75,667 | $ | 1,006,436 | |||||||||
Shares issued in reinvestment of dividends and distributions | 47,756 | 625,131 | ||||||||||
Shares purchased | (630,095 | ) | (8,011,167 | ) | ||||||||
Net increase (decrease) in shares outstanding | (506,672 | ) | $ | (6,379,600 | ) | |||||||
Year ended July 31, 2021: | ||||||||||||
Shares sold | 241,987 | $ | 3,013,429 | |||||||||
Shares issued in reinvestment of dividends and distributions | 8,734 | 107,950 | ||||||||||
Shares purchased | (144,723 | ) | (1,785,584 | ) | ||||||||
Net increase (decrease) in shares outstanding | 105,998 | $ | 1,335,795 | |||||||||
238
Prudential Day One 2030 Fund (cont’d.):
| Share Class | Shares | Amount | ||||||||||
Class R3 | ||||||||||||
Year ended July 31, 2022: | ||||||||||||
Shares sold | 22,038 | $ | 280,749 | |||||||||
Shares issued in reinvestment of dividends and distributions | 8,772 | 114,735 | ||||||||||
Shares purchased | (166,870 | ) | (2,282,588 | ) | ||||||||
Net increase (decrease) in shares outstanding | (136,060 | ) | $ | (1,887,104 | ) | |||||||
Year ended July 31, 2021: | ||||||||||||
Shares sold | 70,467 | $ | 890,006 | |||||||||
Shares issued in reinvestment of dividends and distributions | 4,556 | 56,315 | ||||||||||
Shares purchased | (36,807 | ) | (453,989 | ) | ||||||||
Net increase (decrease) in shares outstanding | 38,216 | $ | 492,332 | |||||||||
Class R4 | ||||||||||||
Year ended July 31, 2022: | ||||||||||||
Shares sold | 797 | $ | 10,152 | |||||||||
Shares issued in reinvestment of dividends and distributions | 165 | 2,155 | ||||||||||
Shares purchased | (2 | ) | (29 | ) | ||||||||
Net increase (decrease) in shares outstanding | 960 | $ | 12,278 | |||||||||
Year ended July 31, 2021: | ||||||||||||
Shares sold | 409 | $ | 5,178 | |||||||||
Shares issued in reinvestment of dividends and distributions | 29 | 352 | ||||||||||
Shares purchased | (1 | ) | (10 | ) | ||||||||
Net increase (decrease) in shares outstanding | 437 | $ | 5,520 | |||||||||
Class R5 | �� | |||||||||||
Year ended July 31, 2022: | ||||||||||||
Shares sold | 33,096 | $ | 416,432 | |||||||||
Shares issued in reinvestment of dividends and distributions | 25,049 | 327,886 | ||||||||||
Shares purchased | (12,195 | ) | (164,039 | ) | ||||||||
Net increase (decrease) in shares outstanding | 45,950 | $ | 580,279 | |||||||||
Year ended July 31, 2021: | ||||||||||||
Shares sold | 34,631 | $ | 447,573 | |||||||||
Shares issued in reinvestment of dividends and distributions | 6,267 | 77,457 | ||||||||||
Shares purchased | (39,051 | ) | (501,701 | ) | ||||||||
Net increase (decrease) in shares outstanding | 1,847 | $ | 23,329 | |||||||||
Prudential Day One Funds 239
Notes to Financial Statements (continued)
Prudential Day One 2030 Fund (cont’d.):
| Share Class | Shares | Amount | ||||||||||
Class R6 | ||||||||||||
Year ended July 31, 2022: | ||||||||||||
Shares sold | 1,179,597 | $ | 15,764,511 | |||||||||
Shares issued in reinvestment of dividends and distributions | 489,529 | 6,412,830 | ||||||||||
Shares purchased | (1,362,236 | ) | (17,183,073 | ) | ||||||||
Net increase (decrease) in shares outstanding | 306,890 | $ | 4,994,268 | |||||||||
Year ended July 31, 2021: | ||||||||||||
Shares sold | 2,373,744 | $ | 29,595,757 | |||||||||
Shares issued in reinvestment of dividends and distributions | 124,341 | 1,538,097 | ||||||||||
Shares purchased | (1,779,975 | ) | (23,281,009 | ) | ||||||||
Net increase (decrease) in shares outstanding | 718,110 | $ | 7,852,845 | |||||||||
Prudential Day One 2035 Fund:
|
| |||||||||||
| Share Class | Shares | Amount | ||||||||||
Class R1 | ||||||||||||
Year ended July 31, 2022: | ||||||||||||
Shares sold | 101 | $ | 1,237 | |||||||||
Shares issued in reinvestment of dividends and distributions | 283 | 3,686 | ||||||||||
Shares purchased | (12 | ) | (155 | ) | ||||||||
Net increase (decrease) in shares outstanding | 372 | $ | 4,768 | |||||||||
Year ended July 31, 2021: | ||||||||||||
Shares sold | 31 | $ | 393 | |||||||||
Shares issued in reinvestment of dividends and distributions | 37 | 462 | ||||||||||
Shares purchased | (11 | ) | (138 | ) | ||||||||
Net increase (decrease) in shares outstanding | 57 | $ | 717 | |||||||||
Class R2 | ||||||||||||
Year ended July 31, 2022: | ||||||||||||
Shares sold | 6,192 | $ | 78,930 | |||||||||
Shares issued in reinvestment of dividends and distributions | 4,897 | 63,858 | ||||||||||
Shares purchased | (1,756 | ) | (23,133 | ) | ||||||||
Net increase (decrease) in shares outstanding | 9,333 | $ | 119,655 | |||||||||
240
Prudential Day One 2035 Fund (cont’d.):
| Share Class | Shares | Amount | ||||||||||
Year ended July 31, 2021: | ||||||||||||
Shares sold | 9,471 | $ | 124,340 | |||||||||
Shares issued in reinvestment of dividends and distributions | 563 | 7,066 | ||||||||||
Shares purchased | (1,102 | ) | (14,560 | ) | ||||||||
Net increase (decrease) in shares outstanding | 8,932 | $ | 116,846 | |||||||||
Class R3 | ||||||||||||
Year ended July 31, 2022: | ||||||||||||
Shares sold | 10,801 | $ | 144,003 | |||||||||
Shares issued in reinvestment of dividends and distributions | 2,389 | 31,195 | ||||||||||
Shares purchased | (690,934 | ) | (9,832,589 | ) | ||||||||
Net increase (decrease) in shares outstanding | (677,744 | ) | $ | (9,657,391 | ) | |||||||
Year ended July 31, 2021: | ||||||||||||
Shares sold | 134,679 | $ | 1,751,498 | |||||||||
Shares issued in reinvestment of dividends and distributions | 13,000 | 163,407 | ||||||||||
Shares purchased | (78,707 | ) | (1,005,651 | ) | ||||||||
Net increase (decrease) in shares outstanding | 68,972 | $ | 909,254 | |||||||||
Class R4 | ||||||||||||
Year ended July 31, 2022: | ||||||||||||
Shares sold | 7 | $ | 93 | |||||||||
Shares issued in reinvestment of dividends and distributions | 150 | 1,959 | ||||||||||
Shares purchased | (7 | ) | (90 | ) | ||||||||
Net increase (decrease) in shares outstanding | 150 | $ | 1,962 | |||||||||
Year ended July 31, 2021: | ||||||||||||
Shares issued in reinvestment of dividends and distributions | 24 | $ | 300 | |||||||||
Net increase (decrease) in shares outstanding | 24 | $ | 300 | |||||||||
Class R5 | ||||||||||||
Year ended July 31, 2022: | ||||||||||||
Shares sold | 25,466 | $ | 318,765 | |||||||||
Shares issued in reinvestment of dividends and distributions | 3,364 | 43,940 | ||||||||||
Shares purchased | (4,996 | ) | (62,937 | ) | ||||||||
Net increase (decrease) in shares outstanding | 23,834 | $ | 299,768 | |||||||||
Year ended July 31, 2021: | ||||||||||||
Shares sold | 9,956 | $ | 130,535 | |||||||||
Shares issued in reinvestment of dividends and distributions | 340 | 4,273 | ||||||||||
Shares purchased | (892 | ) | (11,968 | ) | ||||||||
Net increase (decrease) in shares outstanding | 9,404 | $ | 122,840 | |||||||||
Prudential Day One Funds 241
Notes to Financial Statements (continued)
Prudential Day One 2035 Fund (cont’d.):
| Share Class | Shares | Amount | ||||||||||
Class R6 | ||||||||||||
Year ended July 31, 2022: | ||||||||||||
Shares sold | 795,506 | $ | 10,632,655 | |||||||||
Shares issued in reinvestment of dividends and distributions | 515,539 | 6,732,940 | ||||||||||
Shares purchased | (1,010,332 | ) | (12,501,302 | ) | ||||||||
Net increase (decrease) in shares outstanding | 300,713 | $ | 4,864,293 | |||||||||
Year ended July 31, 2021: | ||||||||||||
Shares sold | 1,286,015 | $ | 16,281,374 | |||||||||
Shares issued in reinvestment of dividends and distributions | 93,688 | 1,177,657 | ||||||||||
Shares purchased | (1,335,697 | ) | (17,744,581 | ) | ||||||||
Net increase (decrease) in shares outstanding | 44,006 | $ | (285,550 | ) | ||||||||
Prudential Day One 2040 Fund:
|
| |||||||||||
| Share Class | Shares | Amount | ||||||||||
Class R1 | ||||||||||||
Year ended July 31, 2022: | ||||||||||||
Shares sold | 557 | $ | 7,458 | |||||||||
Shares issued in reinvestment of dividends and distributions | 245 | 3,376 | ||||||||||
Shares purchased | (17 | ) | (224 | ) | ||||||||
Net increase (decrease) in shares outstanding | 785 | $ | 10,610 | |||||||||
Year ended July 31, 2021: | ||||||||||||
Shares sold | 438 | $ | 5,745 | |||||||||
Shares issued in reinvestment of dividends and distributions | 32 | 415 | ||||||||||
Shares purchased | (11 | ) | (140 | ) | ||||||||
Net increase (decrease) in shares outstanding | 459 | $ | 6,020 | |||||||||
Class R2 | ||||||||||||
Year ended July 31, 2022: | ||||||||||||
Shares sold | 104,778 | $ | 1,493,770 | |||||||||
Shares issued in reinvestment of dividends and distributions | 43,620 | 602,390 | ||||||||||
Shares purchased | (528,402 | ) | (7,063,228 | ) | ||||||||
Net increase (decrease) in shares outstanding | (380,004 | ) | $ | (4,967,068 | ) | |||||||
242
Prudential Day One 2040 Fund (cont’d.):
| Share Class | Shares | Amount | ||||||||||
Year ended July 31, 2021: | ||||||||||||
Shares sold | 132,019 | $ | 1,735,072 | |||||||||
Shares issued in reinvestment of dividends and distributions | 5,799 | 74,226 | ||||||||||
Shares purchased | (47,299 | ) | (605,801 | ) | ||||||||
Net increase (decrease) in shares outstanding | 90,519 | $ | 1,203,497 | |||||||||
Class R3 | ||||||||||||
Year ended July 31, 2022: | ||||||||||||
Shares sold | 8,536 | $ | 115,460 | |||||||||
Shares issued in reinvestment of dividends and distributions | 4,173 | 57,666 | ||||||||||
Shares purchased | (210,041 | ) | (3,078,060 | ) | ||||||||
Net increase (decrease) in shares outstanding | (197,332 | ) | $ | (2,904,934 | ) | |||||||
Year ended July 31, 2021: | ||||||||||||
Shares sold | 107,910 | $ | 1,398,004 | |||||||||
Shares issued in reinvestment of dividends and distributions | 4,509 | 57,765 | ||||||||||
Shares purchased | (53,584 | ) | (713,845 | ) | ||||||||
Net increase (decrease) in shares outstanding | 58,835 | $ | 741,924 | |||||||||
Class R4 | ||||||||||||
Year ended July 31, 2022: | ||||||||||||
Shares sold | 1,448 | $ | 19,283 | |||||||||
Shares issued in reinvestment of dividends and distributions | 271 | 3,749 | ||||||||||
Shares purchased | (19 | ) | (246 | ) | ||||||||
Net increase (decrease) in shares outstanding | 1,700 | $ | 22,786 | |||||||||
Year ended July 31, 2021: | ||||||||||||
Shares sold | 791 | $ | 10,399 | |||||||||
Shares issued in reinvestment of dividends and distributions | 37 | 470 | ||||||||||
Shares purchased | (2 | ) | (32 | ) | ||||||||
Net increase (decrease) in shares outstanding | 826 | $ | 10,837 | |||||||||
Class R5 | ||||||||||||
Year ended July 31, 2022: | ||||||||||||
Shares sold | 26,889 | $ | 355,297 | |||||||||
Shares issued in reinvestment of dividends and distributions | 49,819 | 688,996 | ||||||||||
Shares purchased | (42,833 | ) | (594,474 | ) | ||||||||
Net increase (decrease) in shares outstanding | 33,875 | $ | 449,819 | |||||||||
Year ended July 31, 2021: | ||||||||||||
Shares sold | 28,937 | $ | 388,383 | |||||||||
Shares issued in reinvestment of dividends and distributions | 10,557 | 135,338 | ||||||||||
Shares purchased | (61,463 | ) | (795,861 | ) | ||||||||
Net increase (decrease) in shares outstanding | (21,969 | ) | $ | (272,140 | ) | |||||||
Prudential Day One Funds 243
Notes to Financial Statements (continued)
Prudential Day One 2040 Fund (cont’d.):
| Share Class | Shares | Amount | ||||||||||
Class R6 | ||||||||||||
Year ended July 31, 2022: | ||||||||||||
Shares sold | 741,422 | $ | 10,337,187 | |||||||||
Shares issued in reinvestment of dividends and distributions | 323,002 | 4,467,114 | ||||||||||
Shares purchased | (983,449 | ) | (12,584,235 | ) | ||||||||
Net increase (decrease) in shares outstanding | 80,975 | $ | 2,220,066 | |||||||||
Year ended July 31, 2021: | ||||||||||||
Shares sold | 1,136,424 | $ | 14,483,421 | |||||||||
Shares issued in reinvestment of dividends and distributions | 70,414 | 902,712 | ||||||||||
Shares purchased | (947,673 | ) | (13,048,863 | ) | ||||||||
Net increase (decrease) in shares outstanding | 259,165 | $ | 2,337,270 | |||||||||
Prudential Day One 2045 Fund:
| ||||||||||||
| Share Class | Shares | Amount | ||||||||||
Class R1 | ||||||||||||
Year ended July 31, 2022: | ||||||||||||
Shares sold | 1 | $ | 16 | |||||||||
Shares issued in reinvestment of dividends and distributions | 179 | 2,362 | ||||||||||
Shares purchased | (165 | ) | (1,817 | ) | ||||||||
Net increase (decrease) in shares outstanding | 15 | $ | 561 | |||||||||
Year ended July 31, 2021: | ||||||||||||
Shares sold | 1 | $ | 13 | |||||||||
Shares issued in reinvestment of dividends and distributions | 20 | 246 | ||||||||||
Shares purchased | (2 | ) | (20 | ) | ||||||||
Net increase (decrease) in shares outstanding | 19 | $ | 239 | |||||||||
Class R2 | ||||||||||||
Year ended July 31, 2022: | ||||||||||||
Shares sold | 11,253 | $ | 145,138 | |||||||||
Shares issued in reinvestment of dividends and distributions | 3,418 | 45,089 | ||||||||||
Shares purchased | (11,250 | ) | (133,866 | ) | ||||||||
Net increase (decrease) in shares outstanding | 3,421 | $ | 56,361 | |||||||||
244
Prudential Day One 2045 Fund (cont’d.):
| Share Class | Shares | Amount | ||||||||||
Year ended July 31, 2021: | ||||||||||||
Shares sold | 9,123 | $ | 128,021 | |||||||||
Shares issued in reinvestment of dividends and distributions | 270 | 3,426 | ||||||||||
Shares purchased | (5,351 | ) | (63,990 | ) | ||||||||
Net increase (decrease) in shares outstanding | 4,042 | $ | 67,457 | |||||||||
Class R3 | ||||||||||||
Year ended July 31, 2022: | ||||||||||||
Shares sold | 3,533 | $ | 50,715 | |||||||||
Shares issued in reinvestment of dividends and distributions | 380 | 5,013 | ||||||||||
Shares purchased | (861,635 | ) | (12,648,626 | ) | ||||||||
Net increase (decrease) in shares outstanding | (857,722 | ) | $ | (12,592,898 | ) | |||||||
Year ended July 31, 2021: | ||||||||||||
Shares sold | 158,202 | $ | 2,077,213 | |||||||||
Shares issued in reinvestment of dividends and distributions | 14,999 | 190,190 | ||||||||||
Shares purchased | (82,155 | ) | (1,066,433 | ) | ||||||||
Net increase (decrease) in shares outstanding | 91,046 | $ | 1,200,970 | |||||||||
Class R4 | ||||||||||||
Year ended July 31, 2022: | ||||||||||||
Shares sold | 655 | $ | 7,442 | |||||||||
Shares issued in reinvestment of dividends and distributions | 421 | 5,548 | ||||||||||
Shares purchased | (45 | ) | (605 | ) | ||||||||
Net increase (decrease) in shares outstanding | 1,031 | $ | 12,385 | |||||||||
Year ended July 31, 2021: | ||||||||||||
Shares sold | 303 | $ | 4,074 | |||||||||
Shares issued in reinvestment of dividends and distributions | 55 | 702 | ||||||||||
Shares purchased | (236 | ) | (3,141 | ) | ||||||||
Net increase (decrease) in shares outstanding | 122 | $ | 1,635 | |||||||||
Class R5 | ||||||||||||
Year ended July 31, 2022: | ||||||||||||
Shares sold | 28,912 | $ | 366,571 | |||||||||
Shares issued in reinvestment of dividends and distributions | 7,053 | 93,097 | ||||||||||
Shares purchased | (14,077 | ) | (181,789 | ) | ||||||||
Net increase (decrease) in shares outstanding | 21,888 | $ | 277,879 | |||||||||
Year ended July 31, 2021: | ||||||||||||
Shares sold | 11,317 | $ | 152,206 | |||||||||
Shares issued in reinvestment of dividends and distributions | 795 | 10,095 | ||||||||||
Shares purchased | (3,386 | ) | (46,569 | ) | ||||||||
Net increase (decrease) in shares outstanding | 8,726 | $ | 115,732 | |||||||||
Prudential Day One Funds 245
Notes to Financial Statements (continued)
Prudential Day One 2045 Fund (cont’d.):
| Share Class | Shares | Amount | ||||||||||
Class R6 | ||||||||||||
Year ended July 31, 2022: | ||||||||||||
Shares sold | 516,014 | $ | 6,990,216 | |||||||||
Shares issued in reinvestment of dividends and distributions | 350,374 | 4,631,941 | ||||||||||
Shares purchased | (584,830 | ) | (7,192,779 | ) | ||||||||
Net increase (decrease) in shares outstanding | 281,558 | $ | 4,429,378 | |||||||||
Year ended July 31, 2021: | ||||||||||||
Shares sold | 1,115,340 | $ | 14,940,814 | |||||||||
Shares issued in reinvestment of dividends and distributions | 45,291 | 575,652 | ||||||||||
Shares purchased | (696,112 | ) | (9,710,184 | ) | ||||||||
Net increase (decrease) in shares outstanding | 464,519 | $ | 5,806,282 | |||||||||
Prudential Day One 2050 Fund:
| ||||||||||||
| Share Class | Shares | Amount | ||||||||||
Class R1 | ||||||||||||
Year ended July 31, 2022: | ||||||||||||
Shares sold | 541 | $ | 7,379 | |||||||||
Shares issued in reinvestment of dividends and distributions | 337 | 4,665 | ||||||||||
Shares purchased | (23 | ) | (318 | ) | ||||||||
Net increase (decrease) in shares outstanding | 855 | $ | 11,726 | |||||||||
Year ended July 31, 2021: | ||||||||||||
Shares sold | 738 | $ | 9,496 | |||||||||
Shares issued in reinvestment of dividends and distributions | 40 | 516 | ||||||||||
Shares purchased | (742 | ) | (8,570 | ) | ||||||||
Net increase (decrease) in shares outstanding | 36 | $ | 1,442 | |||||||||
Class R2 | ||||||||||||
Year ended July 31, 2022: | ||||||||||||
Shares sold | 65,305 | $ | 934,169 | |||||||||
Shares issued in reinvestment of dividends and distributions | 39,540 | 548,421 | ||||||||||
Shares purchased | (427,136 | ) | (5,782,506 | ) | ||||||||
Net increase (decrease) in shares outstanding | (322,291 | ) | $ | (4,299,916 | ) | |||||||
246
Prudential Day One 2050 Fund (cont’d.):
| Share Class | Shares | Amount | ||||||||||
Year ended July 31, 2021: | ||||||||||||
Shares sold | 119,447 | $ | 1,608,950 | |||||||||
Shares issued in reinvestment of dividends and distributions | 4,895 | 63,192 | ||||||||||
Shares purchased | (44,861 | ) | (578,117 | ) | ||||||||
Net increase (decrease) in shares outstanding | 79,481 | $ | 1,094,025 | |||||||||
Class R3 | ||||||||||||
Year ended July 31, 2022: | ||||||||||||
Shares sold | 3,288 | $ | 48,256 | |||||||||
Shares issued in reinvestment of dividends and distributions | 114 | 1,580 | ||||||||||
Shares purchased | (274,825 | ) | (4,127,664 | ) | ||||||||
Net increase (decrease) in shares outstanding | (271,423 | ) | $ | (4,077,828 | ) | |||||||
Year ended July 31, 2021: | ||||||||||||
Shares sold | 109,334 | $ | 1,480,491 | |||||||||
Shares issued in reinvestment of dividends and distributions | 4,193 | 54,169 | ||||||||||
Shares purchased | (32,697 | ) | (452,451 | ) | ||||||||
Net increase (decrease) in shares outstanding | 80,830 | $ | 1,082,209 | |||||||||
Class R4 | ||||||||||||
Year ended July 31, 2022: | ||||||||||||
Shares sold | 5,418 | $ | 79,018 | |||||||||
Shares issued in reinvestment of dividends and distributions | 645 | 8,931 | ||||||||||
Shares purchased | (23 | ) | (301 | ) | ||||||||
Net increase (decrease) in shares outstanding | 6,040 | $ | 87,648 | |||||||||
Year ended July 31, 2021: | ||||||||||||
Shares issued in reinvestment of dividends and distributions | 22 | $ | 286 | |||||||||
Net increase (decrease) in shares outstanding | 22 | $ | 286 | |||||||||
Class R5 | ||||||||||||
Year ended July 31, 2022: | ||||||||||||
Shares sold | 22,409 | $ | 301,578 | |||||||||
Shares issued in reinvestment of dividends and distributions | 9,540 | 132,318 | ||||||||||
Shares purchased | (14,366 | ) | (186,409 | ) | ||||||||
Net increase (decrease) in shares outstanding | 17,583 | $ | 247,487 | |||||||||
Year ended July 31, 2021: | ||||||||||||
Shares sold | 13,639 | $ | 184,166 | |||||||||
Shares issued in reinvestment of dividends and distributions | 1,405 | 18,148 | ||||||||||
Shares purchased | (5,572 | ) | (70,272 | ) | ||||||||
Net increase (decrease) in shares outstanding | 9,472 | $ | 132,042 | |||||||||
Prudential Day One Funds 247
Notes to Financial Statements (continued)
Prudential Day One 2050 Fund (cont’d.):
| Share Class | Shares | Amount | ||||||||||
Class R6 | ||||||||||||
Year ended July 31, 2022: | ||||||||||||
Shares sold | 412,380 | $ | 5,864,603 | |||||||||
Shares issued in reinvestment of dividends and distributions | 161,987 | 2,251,618 | ||||||||||
Shares purchased | (319,029 | ) | (4,054,587 | ) | ||||||||
Net increase (decrease) in shares outstanding | 255,338 | $ | 4,061,634 | |||||||||
Year ended July 31, 2021: | ||||||||||||
Shares sold | 541,857 | $ | 7,200,121 | |||||||||
Shares issued in reinvestment of dividends and distributions | 28,267 | 365,778 | ||||||||||
Shares purchased | (476,219 | ) | (6,810,645 | ) | ||||||||
Net increase (decrease) in shares outstanding | 93,905 | $ | 755,254 | |||||||||
Prudential Day One 2055 Fund:
| ||||||||||||
| Share Class | Shares | Amount | ||||||||||
Class R1 | ||||||||||||
Year ended July 31, 2022: | ||||||||||||
Shares sold | 1 | $ | 13 | |||||||||
Shares issued in reinvestment of dividends and distributions | 387 | 4,484 | ||||||||||
Shares purchased | (1 | ) | (13 | ) | ||||||||
Net increase (decrease) in shares outstanding | 387 | $ | 4,484 | |||||||||
Year ended July 31, 2021: | ||||||||||||
Shares sold | 1 | $ | 6 | |||||||||
Shares issued in reinvestment of dividends and distributions | 20 | 257 | ||||||||||
Shares purchased | (1 | ) | (11 | ) | ||||||||
Net increase (decrease) in shares outstanding | 20 | $ | 252 | |||||||||
Class R2 | ||||||||||||
Year ended July 31, 2022: | ||||||||||||
Shares sold | 7,417 | $ | 83,810 | |||||||||
Shares issued in reinvestment of dividends and distributions | 6,804 | 78,926 | ||||||||||
Shares purchased | (7,868 | ) | (83,782 | ) | ||||||||
Net increase (decrease) in shares outstanding | 6,353 | $ | 78,954 | |||||||||
248
Prudential Day One 2055 Fund (cont’d.):
| Share Class | Shares | Amount | ||||||||||
Year ended July 31, 2021: | ||||||||||||
Shares sold | 9,437 | $ | 134,853 | |||||||||
Shares issued in reinvestment of dividends and distributions | 242 | 3,101 | ||||||||||
Shares purchased | (1,591 | ) | (20,283 | ) | ||||||||
Net increase (decrease) in shares outstanding | 8,088 | $ | 117,671 | |||||||||
Class R3 | ||||||||||||
Year ended July 31, 2022: | ||||||||||||
Shares sold | 3,300 | $ | 47,803 | |||||||||
Shares issued in reinvestment of dividends and distributions | 309 | 3,581 | ||||||||||
Shares purchased | (511,456 | ) | (7,630,926 | ) | ||||||||
Net increase (decrease) in shares outstanding | (507,847 | ) | $ | (7,579,542 | ) | |||||||
Year ended July 31, 2021: | ||||||||||||
Shares sold | 126,972 | $ | 1,683,374 | |||||||||
Shares issued in reinvestment of dividends and distributions | 9,342 | 119,572 | ||||||||||
Shares purchased | (55,535 | ) | (736,100 | ) | ||||||||
Net increase (decrease) in shares outstanding | 80,779 | $ | 1,066,846 | |||||||||
Class R4 | ||||||||||||
Year ended July 31, 2022: | ||||||||||||
Shares sold | 374 | $ | 3,972 | |||||||||
Shares issued in reinvestment of dividends and distributions | 377 | 4,368 | ||||||||||
Shares purchased | (17 | ) | (181 | ) | ||||||||
Net increase (decrease) in shares outstanding | 734 | $ | 8,159 | |||||||||
Year ended July 31, 2021: | ||||||||||||
Shares issued in reinvestment of dividends and distributions | 24 | $ | 308 | |||||||||
Net increase (decrease) in shares outstanding | 24 | $ | 308 | |||||||||
Class R5 | ||||||||||||
Year ended July 31, 2022: | ||||||||||||
Shares sold | 18,321 | $ | 217,160 | |||||||||
Shares issued in reinvestment of dividends and distributions | 7,146 | 82,969 | ||||||||||
Shares purchased | (6,633 | ) | (71,434 | ) | ||||||||
Net increase (decrease) in shares outstanding | 18,834 | $ | 228,695 | |||||||||
Year ended July 31, 2021: | ||||||||||||
Shares sold | 7,827 | $ | 108,262 | |||||||||
Shares issued in reinvestment of dividends and distributions | 279 | 3,582 | ||||||||||
Shares purchased | (3,369 | ) | (47,993 | ) | ||||||||
Net increase (decrease) in shares outstanding | 4,737 | $ | 63,851 | |||||||||
Prudential Day One Funds 249
Notes to Financial Statements (continued)
Prudential Day One 2055 Fund (cont’d.):
| Share Class | Shares | Amount | ||||||||||
Class R6 | ||||||||||||
Year ended July 31, 2022: | ||||||||||||
Shares sold | 215,261 | $ | 2,769,992 | |||||||||
Shares issued in reinvestment of dividends and distributions | 193,504 | 2,244,650 | ||||||||||
Shares purchased | (308,823 | ) | (3,276,706 | ) | ||||||||
Net increase (decrease) in shares outstanding | 99,942 | $ | 1,737,936 | |||||||||
Year ended July 31, 2021: | ||||||||||||
Shares sold | 250,509 | $ | 3,303,703 | |||||||||
Shares issued in reinvestment of dividends and distributions | 12,815 | 164,160 | ||||||||||
Shares purchased | (225,431 | ) | (3,211,683 | ) | ||||||||
Net increase (decrease) in shares outstanding | 37,893 | $ | 256,180 | |||||||||
Prudential Day One 2060 Fund:
| ||||||||||||
| Share Class | Shares | Amount | ||||||||||
Class R1 | ||||||||||||
Year ended July 31, 2022: | ||||||||||||
Shares sold | 111 | $ | 1,577 | |||||||||
Shares issued in reinvestment of dividends and distributions | 91 | 1,309 | ||||||||||
Net increase (decrease) in shares outstanding | 202 | $ | 2,886 | |||||||||
Year ended July 31, 2021: | ||||||||||||
Shares issued in reinvestment of dividends and distributions | 12 | $ | 156 | |||||||||
Net increase (decrease) in shares outstanding | 12 | $ | 156 | |||||||||
Class R2 | ||||||||||||
Year ended July 31, 2022: | ||||||||||||
Shares sold | 35,360 | $ | 520,060 | |||||||||
Shares issued in reinvestment of dividends and distributions | 10,865 | 157,325 | ||||||||||
Shares purchased | (146,134 | ) | (2,062,223 | ) | ||||||||
Net increase (decrease) in shares outstanding | (99,909 | ) | $ | (1,384,838 | ) | |||||||
Year ended July 31, 2021: | ||||||||||||
Shares sold | 49,780 | $ | 674,437 | |||||||||
Shares issued in reinvestment of dividends and distributions | 1,158 | 15,188 | ||||||||||
Shares purchased | (12,737 | ) | (169,812 | ) | ||||||||
Net increase (decrease) in shares outstanding | 38,201 | $ | 519,813 | |||||||||
250
Prudential Day One 2060 Fund (cont’d.):
| Share Class | Shares | Amount | ||||||||||
Class R3 | ||||||||||||
Year ended July 31, 2022: | ||||||||||||
Shares sold | 3,159 | $ | 47,406 | |||||||||
Shares issued in reinvestment of dividends and distributions | 160 | 2,325 | ||||||||||
Shares purchased | (97,465 | ) | (1,496,585 | ) | ||||||||
Net increase (decrease) in shares outstanding | (94,146 | ) | $ | (1,446,854 | ) | |||||||
Year ended July 31, 2021: | ||||||||||||
Shares sold | 51,569 | $ | 709,881 | |||||||||
Shares issued in reinvestment of dividends and distributions | 1,050 | 13,805 | ||||||||||
Shares purchased | (15,439 | ) | (217,745 | ) | ||||||||
Net increase (decrease) in shares outstanding | 37,180 | $ | 505,941 | |||||||||
Class R4 | ||||||||||||
Year ended July 31, 2022: | ||||||||||||
Shares sold | 146 | $ | 1,925 | |||||||||
Shares issued in reinvestment of dividends and distributions | 98 | 1,415 | ||||||||||
Shares purchased | — | ** | (1 | ) | ||||||||
Net increase (decrease) in shares outstanding | 244 | $ | 3,339 | |||||||||
Year ended July 31, 2021: | ||||||||||||
Shares issued in reinvestment of dividends and distributions | 17 | $ | 225 | |||||||||
Net increase (decrease) in shares outstanding | 17 | $ | 225 | |||||||||
Class R5 | ||||||||||||
Year ended July 31, 2022: | ||||||||||||
Shares sold | 21,647 | $ | 301,424 | |||||||||
Shares issued in reinvestment of dividends and distributions | 1,825 | 26,495 | ||||||||||
Shares purchased | (4,154 | ) | (56,905 | ) | ||||||||
Net increase (decrease) in shares outstanding | 19,318 | $ | 271,014 | |||||||||
Year ended July 31, 2021: | ||||||||||||
Shares sold | 8,249 | $ | 114,928 | |||||||||
Shares issued in reinvestment of dividends and distributions | 161 | 2,122 | ||||||||||
Shares purchased | (1,778 | ) | (24,825 | ) | ||||||||
Net increase (decrease) in shares outstanding | 6,632 | $ | 92,225 | |||||||||
Class R6 | ||||||||||||
Year ended July 31, 2022: | ||||||||||||
Shares sold | 160,960 | $ | 2,290,021 | |||||||||
Shares issued in reinvestment of dividends and distributions | 37,746 | 548,820 | ||||||||||
Shares purchased | (102,537 | ) | (1,367,984 | ) | ||||||||
Net increase (decrease) in shares outstanding | 96,169 | $ | 1,470,857 | |||||||||
Prudential Day One Funds 251
Notes to Financial Statements (continued)
Prudential Day One 2060 Fund (cont’d.):
| Share Class | Shares | Amount | ||||||||||
Year ended July 31, 2021: | ||||||||||||
Shares sold | 297,863 | $ | 4,120,445 | |||||||||
Shares issued in reinvestment of dividends and distributions | 5,650 | 74,351 | ||||||||||
Shares purchased | (103,263 | ) | (1,483,494 | ) | ||||||||
Net increase (decrease) in shares outstanding | 200,250 | $ | 2,711,302 | |||||||||
** Less than 1 share.
Prudential Day One 2065 Fund:
| ||||||||||||
| Share Class | Shares | Amount | ||||||||||
Class R1 | ||||||||||||
Year ended July 31, 2022: | ||||||||||||
Shares issued in reinvestment of dividends and distributions | 79 | $ | 960 | |||||||||
Net increase (decrease) in shares outstanding | 79 | $ | 960 | |||||||||
Year ended July 31, 2021: | ||||||||||||
Shares issued in reinvestment of dividends and distributions | 5 | $ | 59 | |||||||||
Net increase (decrease) in shares outstanding | 5 | $ | 59 | |||||||||
Class R2 | ||||||||||||
Year ended July 31, 2022: | ||||||||||||
Shares sold | 5,197 | $ | 62,397 | |||||||||
Shares issued in reinvestment of dividends and distributions | 359 | 4,378 | ||||||||||
Shares purchased | (1,640 | ) | (16,676 | ) | ||||||||
Net increase (decrease) in shares outstanding | 3,916 | $ | 50,099 | |||||||||
Year ended July 31, 2021: | ||||||||||||
Shares sold | 1,943 | $ | 22,284 | |||||||||
Shares issued in reinvestment of dividends and distributions | 12 | 136 | ||||||||||
Shares purchased | (346 | ) | (3,850 | ) | ||||||||
Net increase (decrease) in shares outstanding | 1,609 | $ | 18,570 | |||||||||
Class R3 | ||||||||||||
Year ended July 31, 2022: | ||||||||||||
Shares issued in reinvestment of dividends and distributions | 83 | $ | 1,014 | |||||||||
Net increase (decrease) in shares outstanding | 83 | $ | 1,014 | |||||||||
252
Prudential Day One 2065 Fund (cont’d.):
| Share Class | Shares | Amount | ||||||||||
Year ended July 31, 2021: | ||||||||||||
Shares issued in reinvestment of dividends and distributions | 9 | $ | 97 | |||||||||
Net increase (decrease) in shares outstanding | 9 | $ | 97 | |||||||||
Class R4 | ||||||||||||
Year ended July 31, 2022: | ||||||||||||
Shares issued in reinvestment of dividends and distributions | 85 | $ | 1,027 | |||||||||
Net increase (decrease) in shares outstanding | 85 | $ | 1,027 | |||||||||
Year ended July 31, 2021: | ||||||||||||
Shares issued in reinvestment of dividends and distributions | 9 | $ | 107 | |||||||||
Net increase (decrease) in shares outstanding | 9 | $ | 107 | |||||||||
Class R5 | ||||||||||||
Year ended July 31, 2022: | ||||||||||||
Shares sold | 91 | $ | 999 | |||||||||
Shares issued in reinvestment of dividends and distributions | 94 | 1,151 | ||||||||||
Net increase (decrease) in shares outstanding | 185 | $ | 2,150 | |||||||||
Year ended July 31, 2021: | ||||||||||||
Shares issued in reinvestment of dividends and distributions | 12 | $ | 129 | |||||||||
Net increase (decrease) in shares outstanding | 12 | $ | 129 | |||||||||
Class R6 | ||||||||||||
Year ended July 31, 2022: | ||||||||||||
Shares sold | 19,180 | $ | 234,301 | |||||||||
Shares issued in reinvestment of dividends and distributions | 2,756 | 33,620 | ||||||||||
Shares purchased | (24,817 | ) | (283,961 | ) | ||||||||
Net increase (decrease) in shares outstanding | (2,881 | ) | $ | (16,040 | ) | |||||||
Year ended July 31, 2021: | ||||||||||||
Shares sold | 45,584 | $ | 529,603 | |||||||||
Shares issued in reinvestment of dividends and distributions | 293 | 3,223 | ||||||||||
Shares purchased | (26,763 | ) | (319,901 | ) | ||||||||
Net increase (decrease) in shares outstanding | 19,114 | $ | 212,925 | |||||||||
| 8. | Borrowings |
The RIC, on behalf of the Day One Funds, along with other affiliated registered investment companies (the “Participating Funds”), is a party to a Syndicated Credit Agreement (“SCA”) with a group of banks. The purpose of the SCA is to provide an alternative source of
Prudential Day One Funds 253
Notes to Financial Statements (continued)
temporary funding for capital share redemptions. The table below provides details of the current SCA in effect at the reporting period-end as well as the prior SCA.
| Current SCA | Prior SCA | |||||
Term of Commitment | 10/1/2021 – 9/29/2022 | 10/2/2020 – 9/30/2021 | ||||
Total Commitment | $ 1,200,000,000 | $ 1,200,000,000 | ||||
Annualized Commitment Fee on the Unused Portion of the SCA | 0.15% | 0.15% | ||||
Annualized Interest Rate on Borrowings | 1.20% plus the higher of (1) the effective federal funds rate, (2) the one-month LIBOR rate or (3) zero percent
| 1.30% plus the higher of (1) the effective federal funds rate, (2) the one-month LIBOR rate or (3) zero percent
| ||||
Certain affiliated registered investment companies that are parties to the SCA include portfolios that are subject to a predetermined mathematical formula used to manage certain benefit guarantees offered under variable annuity contracts. The formula may result in large scale asset flows into and out of these portfolios. Consequently, these portfolios may be more likely to utilize the SCA for purposes of funding redemptions. It may be possible for those portfolios to fully exhaust the committed amount of the SCA, thereby requiring the Manager to allocate available funding per a Board-approved methodology designed to treat the Participating Funds in the SCA equitably.
The Day One Funds did not utilize the SCA during the year ended July 31, 2022.
| 9. | Risks of Investing in the Day One Funds |
Each Fund’s risks include, but are not limited to, some or all of the risks discussed below. For further information on the risks applicable to any given Fund, please refer to the Prospectus and Statement of Additional Information of that Fund.
| Risks | Prudential Day One Income Fund | Prudential Day One 2015 Fund | Prudential Day One 2020 Fund | Prudential Day One 2025 Fund | Prudential Day One 2030 Fund | Prudential Day One 2035 Fund | ||||||
Affiliated Funds | X | X | X | X | X | X | ||||||
Asset Allocation | X | X | X | X | X | X | ||||||
Asset Class Variation | X | X | X | X | X | X | ||||||
Credit | X | X | X | X | X | X | ||||||
Debt Obligations | X | X | X | X | X | X | ||||||
Derivatives | X | X | X | X | X | X | ||||||
Economic and Market Events | X | X | X | X | X | X | ||||||
Equity and Equity-Related Securities | X | X | X | X | X | X | ||||||
Fixed Income | X | X | X | X | X | X | ||||||
Fund of Funds | X | X | X | X | X | X | ||||||
254
| Risks | Prudential Day One Income Fund | Prudential Day One 2015 Fund | Prudential Day One 2020 Fund | Prudential Day One 2025 Fund | Prudential Day One 2030 Fund | Prudential Day One 2035 Fund | ||||||
Fund Rebalancing | X | X | X | X | X | X | ||||||
Increase in Expenses | X | X | X | X | X | X | ||||||
Index Tracking | X | X | X | X | X | X | ||||||
Interest Rate | X | X | X | X | X | X | ||||||
Investment Style | X | X | X | X | X | X | ||||||
Large Shareholder and Large Scale Redemption | X | X | X | X | X | X | ||||||
LIBOR | X | X | X | X | X | X | ||||||
Liquidity | X | X | X | X | X | X | ||||||
Management | X | X | X | X | X | X | ||||||
Market | X | X | X | X | X | X | ||||||
Market Capitalization | X | X | X | X | X | X | ||||||
Market Disruption and Geopolitical | X | X | X | X | X | X | ||||||
New Fund | – | – | – | – | – | – | ||||||
Portfolio Turnover | X | X | X | X | X | X | ||||||
Target Date/Income | X | X | X | X | X | X | ||||||
| Risks | Prudential Day One 2040 Fund | Prudential Day One 2045 Fund | Prudential Day One 2050 Fund | Prudential Day One 2055 Fund | Prudential Day One 2060 Fund | Prudential Day One 2065 Fund | ||||||
Affiliated Funds | X | X | X | X | X | X | ||||||
Asset Allocation | X | X | X | X | X | X | ||||||
Asset Class Variation | X | X | X | X | X | X | ||||||
Credit | X | X | X | X | X | X | ||||||
Debt Obligations | X | X | X | X | X | X | ||||||
Derivatives | X | X | X | X | X | X | ||||||
Economic and Market Events | X | X | X | X | X | X | ||||||
Equity and Equity-Related Securities | X | X | X | X | X | X | ||||||
Fixed Income | X | X | X | X | X | X | ||||||
Fund of Funds | X | X | X | X | X | X | ||||||
Fund Rebalancing | X | X | X | X | X | X | ||||||
Increase in Expenses | X | X | X | X | X | X | ||||||
Index Tracking | X | X | X | X | X | X | ||||||
Interest Rate | X | X | X | X | X | X | ||||||
Investment Style | X | X | X | X | X | X | ||||||
Large Shareholder and Large Scale Redemption | X | X | X | X | X | X | ||||||
LIBOR | X | X | X | X | X | X | ||||||
Liquidity | X | X | X | X | X | X | ||||||
Management | X | X | X | X | X | X | ||||||
Market | X | X | X | X | X | X | ||||||
Market Capitalization | X | X | X | X | X | X | ||||||
Market Disruption and Geopolitical | X | X | X | X | X | X | ||||||
New Fund | – | – | – | – | – | X | ||||||
Portfolio Turnover | X | X | X | X | X | X | ||||||
Target Date/Income | X | X | X | X | X | X | ||||||
Prudential Day One Funds 255
Notes to Financial Statements (continued)
Affiliated Funds Risk: The Fund’s Manager serves as manager of the Underlying Funds. In addition, the Fund may invest in certain Underlying Funds for which the subadviser serves as subadviser. It is possible that a conflict of interest among the Fund and the Underlying Funds could affect how the Manager and subadviser fulfill their fiduciary duties to the Fund and the Underlying Funds. For example, the subadviser may have an incentive to allocate the Fund’s assets to those Underlying Funds for which the fees paid to the Manager or the subadviser are higher than the fees paid by other Underlying Funds for which the subadviser also serves as a subadviser. However, the Fund has adopted procedures to mitigate these concerns.
Asset Allocation Risk: The Fund’s risks will directly correspond to the risks of the Underlying Funds in which it invests. By investing in many Underlying Funds, the Fund has partial exposure to the risks of many different areas in the market, and the Fund’s overall level of risk should decline over time. However, the selection of the Underlying Funds and the allocation of the Fund’s assets among the various asset classes and market sectors could cause the Fund to underperform other funds with a similar investment objective.
Asset Class Variation Risk: The Underlying Funds invest principally in the securities constituting their asset class (i.e., equity, non-traditional and fixed income). However, under normal market conditions, an Underlying Fund may vary the percentage of assets in these securities (subject to any applicable regulatory requirements). Depending on the percentage of securities in a particular asset class held by the Underlying Funds at any given time and the percentage of the Fund’s assets invested in various Underlying Funds, the Fund’s actual exposure to the securities in a particular asset class may vary substantially from the allocation to that asset class. There is a risk that the Manager’s evaluations and assumptions regarding asset classes or Underlying Funds may be incorrect in view of actual market conditions.
Credit Risk: This is the risk that the issuer, the guarantor or the insurer of a fixed income security, or the counterparty to acontract may be unable or unwilling to make timely principal and interest payments or to otherwise honor its obligations. Additionally, the securities could lose value due to a loss of confidence in the ability of the issuer, guarantor, insurer or counterparty to pay back debt. The longer the maturity and the lower the credit quality of a bond, the more sensitive it is to credit risk.
Debt Obligations Risk: Debt obligations are subject to credit risk, market risk and interest rate risk. The Fund’s holdings, share price, yield and total return may also fluctuate in response to bond market movements. The value of bonds may decline for issuer-related reasons, including management performance, financial leverage and reduced demand for the issuer’s goods and services. Certain types of fixed income obligations also may be
256
subject to “call and redemption risk,” which is the risk that the issuer may call a bond held by the Fund for redemption before it matures and the Fund may lose income.
Derivatives Risk: Derivatives involve special risks and costs and may result in losses to the Underlying Funds. The successful use of derivatives requires sophisticated management, and, to the extent that derivatives are used, the Underlying Funds will depend on the subadviser’s ability to analyze and manage derivatives transactions. The prices of derivatives may move in unexpected ways, especially in abnormal market conditions. Some derivatives are “leveraged” or may create economic leverage for the Underlying Funds and therefore may magnify or otherwise increase investment losses to the Underlying Funds. The Underlying Funds’ use of derivatives may also increase the amount of taxes payable by shareholders.
Other risks arise from the potential inability to terminate or sell derivatives positions. A liquid secondary market may not always exist for the Underlying Funds’ derivatives positions. In fact, many over-the-counter derivative instruments will not have liquidity beyond the counterparty to the instrument. Over-the-counter derivative instruments also involve the risk that the other party will not meet its obligations to the Underlying Funds. The use of derivatives also exposes the Underlying Funds to operational issues, such as documentation and settlement issues, systems failures, inadequate control and human error.
Derivatives may also involve legal risks, such as insufficient documentation, the lack of capacity or authority of a counterparty to execute or settle a transaction, and the legality and enforceability of derivatives contracts. The U.S. Government and foreign governments have adopted (and may adopt further) regulations governing derivatives markets, including mandatory clearing of certain derivatives, margin and reporting requirements and risk exposure limitations. Regulation of derivatives may make derivatives more costly, limit their availability or utility to the Underlying Funds, or otherwise adversely affect their performance or disrupt markets.
Economic and Market Events Risk: Events in the U.S. and global financial markets, including actions taken by the U.S. Federal Reserve or foreign central banks to stimulate or stabilize economic growth or the functioning of the securities markets, may at times result in unusually high market volatility, which could negatively impact performance. Relatively reduced liquidity in credit and fixed income markets could adversely affect issuers worldwide.
Equity and Equity-Related Securities Risks: Equity and equity-related securities may be subject to changes in value, and their values may be more volatile than those of other asset classes. In addition to an individual security losing value, the value of the equity markets or a sector in which an Underlying Fund invests could go down. Different parts of a market can react differently to adverse issuer, market, regulatory, political and economic developments.
Prudential Day One Funds 257
Notes to Financial Statements (continued)
Fixed Income Risk: As with credit risk, market risk and interest rate risk, an Underlying Fund’s holdings, share price, yield and total return may fluctuate in response to bond market movements. The value of bonds may decline for issuer-related reasons, including management performance, financial leverage and reduced demand for the issuer’s goods and services. Certain types of fixed income obligations also may be subject to call and redemption risk, which is the risk that the issuer may call a bond held by an Underlying Fund for redemption before it matures and the Underlying Fund may lose income.
Fund of Funds Risk: The value of an investment in the Fund will be related, to a substantial degree, to the investment performance of the Underlying Funds in which it invests. Therefore, the principal risks of investing in the Fund are closely related to the principal risks associated with these Underlying Funds and their investments. Because the Fund’s allocation among different Underlying Funds and direct investments in securities and derivatives will vary, an investment in the Fund may be subject to any and all of these risks at different times and to different degrees. Investing in an Underlying Fund will also expose the Fund to a pro rata portion of the Underlying Fund’s fees and expenses. In addition, one Underlying Fund may buy the same securities that another Underlying Fund sells. Therefore, the Fund would indirectly bear the costs of these trades without accomplishing the investment purpose.
Fund Rebalancing Risk: Underlying Funds may experience relatively large redemptions or investments due to a rebalancing of the Fund’s allocations. In such event, an Underlying Fund may be required to sell securities or to invest cash at a time when it is not advantageous to do so. Rebalancing may increase brokerage and/or other transaction costs of an Underlying Fund, increase the Underlying Fund’s expenses or result in the Underlying Fund’s becoming too small to be economically viable. Rebalancing may also adversely affect an Underlying Fund’s performance and thus the Fund’s performance. The impact of rebalancing is likely to be greater when the Fund purchases, redeems or invests in a substantial portion of an Underlying Fund.
The subadviser will seek to cooperate with the subadvisers of the Underlying Funds to minimize any adverse impact on the Underlying Funds. The subadvisers of the Underlying Funds may take such actions as they deem appropriate to minimize such adverse impact, considering the potential benefits of such investments to the Underlying Funds and consistent with their obligations to the Underlying Funds. Such actions may delay the rebalancing of the Fund’s investments in the event of significant market or other events that may require more rapid action.
Increase in Expenses Risk: Your actual cost of investing in the Fund may be higher than the expenses shown in the expense table in the Fund’s prospectus for a variety of reasons. For example, expense ratios may be higher than those shown if average net assets decrease.
258
Net assets are more likely to decrease and Fund expense ratios are more likely to increase when markets are volatile. Active and frequent trading of Underlying Fund securities can increase expenses.
Index Tracking Risk: While certain Underlying Funds generally seek to track the performance of an index as closely as possible (i.e., achieve a high degree of correlation with an index), the return may not match or achieve a high degree of correlation with the return of the index due to operating expenses, transaction costs, cash flows, regulatory requirements and operational inefficiencies. If an index fund is properly correlated to its stated index, the fund will perform poorly when the index performs poorly.
Interest Rate Risk: The value of your investment may go down when interest rates rise. A rise in rates tends to have a greater impact on the prices of longer term or duration debt securities. For example, a fixed income security with a duration of three years is expected to decrease in value by approximately 3% if interest rates increase by 1%. This is referred to as “duration risk.” When interest rates fall, the issuers of debt obligations may prepay principal more quickly than expected, and the Fund may be required to reinvest the proceeds at a lower interest rate. This is referred to as “prepayment risk.” When interest rates rise, debt obligations may be repaid more slowly than expected, and the value of the Fund’s holdings may fall sharply. This is referred to as “extension risk.” The Fund may lose money if short-term or long-term interest rates rise sharply or in a manner not anticipated by the subadviser.
Investment Style Risk: Under certain market conditions, growth investments have performed better during the later stages of economic expansion and value investments have performed better during periods of economic recovery. Therefore, these investment styles may over time go in and out of favor. At times when an investment style used by an Underlying Fund is out of favor, the Fund may underperform other funds that use different investment styles.
Large Shareholder and Large Scale Redemption Risk: Certain individuals, accounts, funds (including funds affiliated with the Manager) or institutions, including the Manager and its affiliates, may from time to time own or control a substantial amount of the Fund’s shares. There is no requirement that these entities maintain their investment in the Fund. There is a risk that such large shareholders or that the Funds’ shareholders generally may redeem all or a substantial portion of their investments in the Fund in a short period of time, which could have a significant negative impact on the Fund’s NAV, liquidity, and brokerage costs. Large redemptions could also result in tax consequences to shareholders and impact the Fund’s ability to implement its investment strategy. The Fund’s ability to pursue its investment objective after one or more large scale redemptions may be impaired and, as a result, the Fund may invest a larger portion of its assets in cash or cash equivalents.
LIBOR Risk: Many financial instruments use or may use a floating rate based on the London Interbank Offered Rate, or “LIBOR,” which is the offered rate for short-term Eurodollar deposits between major international banks. Over the course of the last several years, global regulators have indicated an intent to phase out the use of LIBOR and similar interbank
Prudential Day One Funds 259
Notes to Financial Statements (continued)
offering rates (“IBOR”). There still remains uncertainty regarding the nature of any replacement rates for LIBOR and the other IBORs as well as around fallback approaches for instruments extending beyond the any phase-out of these reference rates. The lack of consensus around replacement rates and the uncertainty of the phase out of LIBOR and other IBORs may result in increased volatility in corporate or governmental debt, floating rate and other loans, derivatives and other instruments invested in by the Fund as well as loan facilities used by the Fund.
The potential effect of a transition away from LIBOR on the Fund or the financial instruments in which the Fund invests cannot yet be determined. The elimination of LIBOR or changes to other reference rates or any other changes or reforms to the determination or supervision of reference rates could have an adverse impact on the market for, or value of, any securities or payments linked to those reference rates, which may adversely affect the Fund’s performance and/or net asset value. Certain proposed replacement rates to LIBOR, such as the Secured Overnight Financing Rate (“SOFR”), are materially different from LIBOR, and changes in the applicable spread for instruments previously linked to LIBOR will need to be made in order for instruments to pay similar rates. Uncertainty and risk also remain regarding the willingness and ability of issuers and lenders to include revised provisions in new and existing contracts or instruments. Consequently, the transition away from LIBOR to other reference rates may lead to reduced coupons on debt held by the Fund, higher rates required to be paid by the Fund on bank lines of credit due to increases in spreads, increased volatility and illiquidity in markets that are tied to LIBOR, fluctuations in values of LIBOR-related investments or investments in issuers that utilize LIBOR, increased difficulty in borrowing or refinancing and diminished effectiveness of hedging strategies, adversely affecting the Fund’s performance. Furthermore, the risks associated with the expected discontinuation of LIBOR and transition may be exacerbated if the work necessary to effect an orderly transition to an alternative reference rate is not completed in a timely manner. Because the usefulness of LIBOR and the other IBORs as benchmarks could deteriorate during the transition period, these effects could be experienced until the anticipated discontinuance date in 2023 for the majority of the LIBOR rates.
Liquidity Risk: An Underlying Fund may not be able to sell a holding in a timely manner at a desired price. This risk could affect both stock and bond funds in which the fund invests, but typically represents a greater risk for bond funds. Reduced liquidity in the bond markets can result from a number of events, such as limited trading activity, reductions in bond inventory, and rapid or unexpected changes in interest rates. Less liquid markets could lead to greater price volatility and limit an Underlying Fund’s ability to sell a holding at a suitable price.
260
Management Risk: The value of your investment may decrease if judgments by the Fund’s subadviser or the subadvisers of the Underlying Funds about the attractiveness, value or market trends affecting a particular security, industry or sector or about market movements are incorrect.
Market Risk: Securities markets may be volatile and the market prices of an Underlying Fund’s securities may decline. Securities fluctuate in price based on changes in an issuer’s financial condition and overall market and economic conditions. If the market prices of the securities owned by an Underlying Fund fall, the value of the Fund’s investment in the Underlying Fund will decline.
Market Capitalization Risk: Certain Underlying Funds may invest in stocks of small- and medium-size companies which may present above-average risks. These companies usually offer a smaller range of products and services than larger companies. They may also have limited financial resources and may lack management depth. As a result, the prices of stocks issued by small- and medium-size companies tend to fluctuate more than the stocks of larger, more established companies. In exchange for potentially lower risks of investing in large capitalization companies, such investments may not rise as much in value as the value of investments in smaller-capitalized companies.
Market Disruption and Geopolitical Risks: Market disruption can be caused by economic, financial or political events and factors, including but not limited to, international wars or conflicts (including Russia’s military invasion of Ukraine), geopolitical developments (including trading and tariff arrangements, sanctions and cybersecurity attacks), instability in regions such as Asia, Eastern Europe and the Middle East, terrorism, natural disasters and public health epidemics (including the outbreak of COVID-19 globally).
The extent and duration of such events and resulting market disruptions cannot be predicted, but could be substantial and could magnify the impact of other risks to the Fund. These and other similar events could adversely affect the U.S. and foreign financial markets and lead to increased market volatility, reduced liquidity in the securities markets, significant negative impacts on issuers and the markets for certain securities and commodities and/or government intervention. They may also cause short- or long-term economic uncertainties in the United States and worldwide. As a result, whether or not the Fund invests in securities of issuers located in or with significant exposure to the countries directly affected, the value and liquidity of the Fund’s investments may be negatively impacted. Further, due to closures of certain markets and restrictions on trading certain securities, the value of certain securities held by the Fund could be significantly impacted, which could lead to such securities being valued at zero.
COVID-19 and the related governmental and public responses have had and may continue to have an impact on the Fund’s investments and net asset value and have led and may continue to lead to increased market volatility and the potential for illiquidity in certain classes of securities and sectors of the market. They have also had and may continue to result in periods of business disruption, business closures, inability to obtain raw materials,
Prudential Day One Funds 261
Notes to Financial Statements (continued)
supplies and component parts, and reduced or disrupted operations for the issuers in which the Fund invests. The occurrence, reoccurrence and pendency of public health epidemics could adversely affect the economies and financial markets either in specific countries or worldwide.
New Fund Risk: The Fund recently commenced operations. As a new and relatively small fund, the Fund’s performance may not represent how the Fund is expected to or may perform in the long term if it becomes larger and after it has fully implemented its investment strategies. Investment positions may have a disproportionate impact (negative or positive) on performance in new and smaller funds. New and smaller funds may also require a period of time before they are invested in securities that meet their investment objectives and policies and achieve a representative portfolio composition. Accordingly, investors in the Fund bear the risk that the Fund may not be successful in implementing its investment strategy, and may not employ a successful investment strategy, either of which could result in the Fund being liquidated at any time without shareholder approval and/or at a time that may not be favorable for all shareholders. Such a liquidation could result in transaction costs and have negative tax consequences for shareholders.
Portfolio Turnover Risk: The Fund does not intend to re-allocate assets among the Underlying Funds frequently in response to day-to-day changes in markets. Historically, however, certain Underlying Funds have actively and frequently traded their portfolio securities. High portfolio turnover results in higher transaction costs and can affect an Underlying Fund’s, and, therefore, the Fund’s performance and can have adverse tax consequences.
Target Date/ Income Risk: The Fund may suffer losses near, at or after the target date, and the Fund does not provide a guarantee that sufficient capital appreciation will be achieved to provide adequate income at and through retirement. The Fund does not assure an investor that the assets in the Fund will provide income in amounts adequate to meet the investor’s retirement or financial goals. For investors who are close to or in retirement, the Fund’s equity exposure may result in investment volatility that could reduce an investor’s available retirement assets at a time when the investor has a need to withdraw funds. For investors who are farther from retirement, there is a risk the Fund may invest too much in investments designed to ensure capital conservation and/or current income, which may prevent the investor from meeting his or her retirement goals.
| 10. | Recent Accounting Pronouncement and Regulatory Developments |
In March 2020, the FASB issued Accounting Standard Update (“ASU”) No. 2020-04, which provides optional guidance for applying GAAP to contract modifications, hedging relationships and other transactions affected by the reference rate reform if certain criteria
262
are met. ASU 2020-04 is elective and is effective on March 12, 2020 through December 31, 2022. Management does not expect ASU 2020-04 to have a material impact on the financial statements.
Prudential Day One Funds 263
Report of Independent Registered Public Accounting Firm
To the Board of Trustees of Prudential Investment Portfolios 5 and Shareholders of Prudential Day One Income Fund, Prudential Day One 2015 Fund, Prudential Day One 2020 Fund, Prudential Day One 2025 Fund, Prudential Day One 2030 Fund, Prudential Day One 2035 Fund, Prudential Day One 2040 Fund, Prudential Day One 2045 Fund, Prudential Day One 2050 Fund, Prudential Day One 2055 Fund, Prudential Day One 2060 Fund and Prudential Day One 2065 Fund
Opinions on the Financial Statements
We have audited the accompanying statements of assets and liabilities, including the schedules of investments, of Prudential Day One Income Fund, Prudential Day One 2015 Fund, Prudential Day One 2020 Fund, Prudential Day One 2025 Fund, Prudential Day One 2030 Fund, Prudential Day One 2035 Fund, Prudential Day One 2040 Fund, Prudential Day One 2045 Fund, Prudential Day One 2050 Fund, Prudential Day One 2055 Fund, Prudential Day One 2060 Fund and Prudential Day One 2065 Fund (twelve of the funds constituting Prudential Investment Portfolios 5, hereafter collectively referred to as the “Funds”) as of July 31, 2022, the related statements of operations for the year ended July 31, 2022, the statements of changes in net assets for each of the two years in the period ended July 31, 2022, including the related notes, and the financial highlights for each of the two years in the period ended July 31, 2022 (collectively referred to as the “financial statements”). In our opinion, the financial statements present fairly, in all material respects, the financial position of each of the Funds as of July 31, 2022, the results of each of their operations for the year then ended, and the changes in each of their net assets and each of the financial highlights for each of the two years in the period ended July 31, 2022 in conformity with accounting principles generally accepted in the United States of America.
The financial statements of the Funds as of and for the year or period ended July 31, 2020 and the financial highlights for each of the periods ended on or prior to July 31, 2020 (not presented herein, other than the financial highlights) were audited by other auditors whose report dated September 16, 2020 expressed an unqualified opinion on those financial statements and financial highlights.
Basis for Opinions
These financial statements are the responsibility of the Funds’ management. Our responsibility is to express an opinion on the Funds’ financial statements based on our audits. We are a public accounting firm registered with the Public Company Accounting Oversight Board (United States) (PCAOB) and are required to be independent with respect to the Funds in accordance with the U.S. federal securities laws and the applicable rules and regulations of the Securities and Exchange Commission and the PCAOB.
We conducted our audits of these financial statements in accordance with the standards of the PCAOB. Those standards require that we plan and perform the audit to obtain reasonable assurance about whether the financial statements are free of material misstatement, whether due to error or fraud.
Our audits included performing procedures to assess the risks of material misstatement of the financial statements, whether due to error or fraud, and performing procedures that respond to those risks. Such procedures included examining, on a test basis, evidence regarding the amounts and disclosures in the financial statements. Our audits also included evaluating the accounting principles used and significant estimates made by management, as well as evaluating the overall presentation of the financial statements. Our procedures included confirmation of securities owned as of July 31, 2022 by correspondence with the transfer agent. We believe that our audits provide a reasonable basis for our opinions.
/s/PricewaterhouseCoopers LLP
New York, New York
September 16, 2022
We have served as the auditor of one or more investment companies in the PGIM Retail Funds complex since 2020.
264
Tax Information (unaudited)
We are advising you that during the fiscal year ended July 31, 2022, the Funds reported the maximum amount allowed per share for Class R1, R2, R3, R4, R5 and R6 shares as a capital gain distribution in accordance with Section 852(b)(3)(C) of the Internal Revenue Code.
| Fund | Capital Gain Distributions | ||||
Prudential Day One Income Fund | $0.06 | ||||
Prudential Day One 2015 Fund | 0.22 | ||||
Prudential Day One 2020 Fund | 0.28 | ||||
Prudential Day One 2025 Fund | 0.28 | ||||
Prudential Day One 2030 Fund | 0.10 | ||||
Prudential Day One 2035 Fund | 0.55 | ||||
Prudential Day One 2040 Fund | 0.17 | ||||
Prudential Day One 2045 Fund | 0.50 | ||||
Prudential Day One 2050 Fund | 0.22 | ||||
Prudential Day One 2055 Fund | 1.93 | ||||
Prudential Day One 2060 Fund | 0.04 | ||||
Prudential Day One 2065 Fund | 0.03 | ||||
For the year ended July 31, 2022, the Fund reports the maximum amount allowable under Section 854 of the Internal Revenue Code, but not less than, the following percentages of the ordinary income dividends paid as 1) qualified dividend income (QDI); and 2) eligible for corporate dividends received deduction (DRD):
| Fund | QDI | DRD | ||||||
Prudential Day One Income Fund | 7.02 | % | 4.60 | % | ||||
Prudential Day One 2015 Fund | 8.63 | 5.77 | ||||||
Prudential Day One 2020 Fund | 10.14 | 6.88 | ||||||
Prudential Day One 2025 Fund | 11.85 | 7.35 | ||||||
Prudential Day One 2030 Fund | 15.19 | 9.92 | ||||||
Prudential Day One 2035 Fund | 17.28 | 10.97 | ||||||
Prudential Day One 2040 Fund | 19.06 | 10.30 | ||||||
Prudential Day One 2045 Fund | 17.98 | 10.17 | ||||||
Prudential Day One 2050 Fund | 20.91 | 11.57 | ||||||
Prudential Day One 2055 Fund | 12.55 | 9.74 | ||||||
Prudential Day One 2060 Fund | 21.22 | 10.51 | ||||||
Prudential Day One 2065 Fund | 24.59 | 12.11 | ||||||
In January 2023, you will be advised on IRS Form 1099-DIV or substitute 1099-DIV, as to the federal tax status of dividends and distributions received by you in calendar year 2022.
Prudential Day One Funds 265
Liquidity Risk Management Program (unaudited)
Consistent with Rule 22e-4 under the 1940 Act (the “Liquidity Rule”), each Fund has adopted and implemented a liquidity risk management program (the “LRMP”). Each Fund’s LRMP seeks to assess and manage each Fund’s liquidity risk, which is defined as the risk that each Fund is unable to meet investor redemption requests without significantly diluting the remaining investors’ interests in each Fund. The Board has approved PGIM Investments LLC (“PGIM Investments”), each Fund’s investment manager, to serve as the administrator of each Fund’s LRMP. As part of its responsibilities as administrator, PGIM Investments has retained a third party to perform certain functions, including providing market data and liquidity classification model information.
Each Fund’s LRMP includes a number of processes designed to support the assessment and management of its liquidity risk. In particular, each Fund’s LRMP includes no less than annual assessments of factors that influence each Fund’s liquidity risk; no less than monthly classifications of each Fund’s investments into one of four liquidity classifications provided for in the Liquidity Rule; a 15% of net assets limit on the acquisition of “illiquid investments” (as defined under the Liquidity Rule); establishment of a minimum percentage of each Fund’s assets to be invested in investments classified as “highly liquid” (as defined under the Liquidity Rule) if each Fund does not invest primarily in highly liquid investments; and regular reporting to the Board.
At a meeting of the Board on March 1-3, 2022, PGIM Investments provided a written report (“LRMP Report”) to the Board addressing the operation, adequacy, and effectiveness of each Fund’s LRMP, including any material changes to the LRMP for the period from January 1, 2021 through December 31, 2021 (“Reporting Period”). The LRMP Report concluded that each Fund’s LRMP was reasonably designed to assess and manage each Fund’s liquidity risk and was adequately and effectively implemented during the Reporting Period. There were no material changes to the LRMP during the Reporting Period. The LRMP Report further concluded that each Fund’s investment strategies continue to be appropriate given each Fund’s status as an open-end fund.
There can be no assurance that the LRMP will achieve its objectives in the future. Additional information regarding risks of investing in each Fund including liquidity risks presented by each Fund’s investment portfolio, is found in each Fund’s Prospectus and Statement of Additional Information.
Prudential Day One Funds
INFORMATION ABOUT BOARD MEMBERS AND OFFICERS (unaudited)
Information about Board Members and Officers of the Fund is set forth below. Board Members who are not deemed to be “interested persons” of the Fund, as defined in the 1940 Act, are referred to as “Independent Board Members.” Board Members who are deemed to be “interested persons” of the Fund are referred to as “Interested Board Members.” The Board Members are responsible for the overall supervision of the operations of the Fund and perform the various duties imposed on the directors of investment companies by the 1940 Act. The Board in turn elects the Officers, who are responsible for administering the day-to-day operations of the Fund.
Independent Board Members
| ||||||
Name Year of Birth Position(s) Portfolios Overseen | Principal Occupation(s) During Past Five Years | Other Directorships Held During Past Five Years | Length of Board Service | |||
Ellen S. Alberding 1958 Board Member Portfolios Overseen: 97 | President and Board Member, The Joyce Foundation (charitable foundation) (since 2002); formerly Vice Chair, City Colleges of Chicago (community college system) (2011-2015); Trustee, National Park Foundation (charitable foundation for national park system) (2009-2018); Trustee, Economic Club of Chicago (2009-2016); Trustee, Loyola University (since 2018). | None. | Since September 2013 | |||
Kevin J. Bannon 1952 Board Member Portfolios Overseen: 97 | Retired; formerly Managing Director (April 2008-May 2015) and Chief Investment Officer (October 2008-November 2013) of Highmount Capital LLC (registered investment adviser); formerly Executive Vice President and Chief Investment Officer (April 1993-August 2007) of Bank of New York Company; President (May 2003-May 2007) of BNY Hamilton Family of Mutual Funds. | Director of Urstadt Biddle Properties (equity real estate investment trust) (since September 2008). | Since July 2008 | |||
Prudential Day One Funds
Independent Board Members
| ||||||
Name Year of Birth Position(s) Portfolios Overseen | Principal Occupation(s) During Past Five Years | Other Directorships Held During Past Five Years | Length of Board Service | |||
Linda W. Bynoe 1952 Board Member Portfolios Overseen: 94 | President and Chief Executive Officer (since March 1995) and formerly Chief Operating Officer (December 1989-February 1995) of Telemat Limited LLC (formerly Telemat Ltd) (management consulting); formerly Vice President (January 1985-June 1989) at Morgan Stanley & Co. (broker-dealer). | Trustee of Equity Residential (residential real estate) (since December 2009); Director of Northern Trust Corporation (financial services) (since April 2006); formerly Director of Anixter International, Inc. (communication products distributor) (January 2006-June 2020). | Since March 2005 | |||
Barry H. Evans 1960 Board Member Portfolios Overseen: 96 | Retired; formerly President (2005-2016), Global Chief Operating Officer (2014-2016), Chief Investment Officer - Global Head of Fixed Income (1998-2014), and various portfolio manager roles (1986-2006), Manulife Asset Management (asset management). | Formerly Director, Manulife Trust Company (2011-2018); formerly Director, Manulife Asset Management Limited (2015-2017); formerly Chairman of the Board of Directors of Manulife Asset Management U.S. (2005-2016); formerly Chairman of the Board, Declaration Investment Management and Research (2008-2016). | Since September 2017 | |||
Keith F. Hartstein 1956 Board Member & Independent Chair Portfolios Overseen: 97 | Retired; Member (since November 2014) of the Governing Council of the Independent Directors Council (IDC) (organization of independent mutual fund directors); formerly Executive Committee of the IDC Board of Governors (October 2019-December 2021); formerly President and Chief Executive Officer (2005-2012), Senior Vice President (2004-2005), Senior Vice President of Sales and Marketing (1997-2004), and various executive management positions (1990-1997), John Hancock Funds, LLC (asset management); Chairman, Investment Company Institute’s Sales Force Marketing Committee (2003-2008). | None. | Since September 2013 | |||
Visit our website at pgim.com/investments
Independent Board Members
| ||||||
Name Year of Birth Position(s) Portfolios Overseen | Principal Occupation(s) During Past Five Years | Other Directorships Held During Past Five Years | Length of Board Service | |||
Laurie Simon Hodrick 1962 Board Member Portfolios Overseen: 93 | A. Barton Hepburn Professor Emerita of Economics in the Faculty of Business, Columbia Business School (since 2018); Visiting Fellow at the Hoover Institution, Stanford University (since 2015); Sole Member, ReidCourt LLC (since 2008) (a consulting firm); formerly Visiting Professor of Law, Stanford Law School (2015-2021); formerly A. Barton Hepburn Professor of Economics in the Faculty of Business, Columbia Business School (1996-2017); formerly Managing Director, Global Head of Alternative Investment Strategies, Deutsche Bank (2006-2008). | Independent Director, Andela (since January 2022) (global talent network); Independent Director, Roku (since December 2020) (communication services); formerly Independent Director, Synnex Corporation (2019-2021) (information technology); formerly Independent Director, Kabbage, Inc. (2018-2020) (financial services); formerly Independent Director, Corporate Capital Trust (2017-2018) (a business development company). | Since September 2017 | |||
Brian K. Reid 1961 Board Member Portfolios Overseen: 96 | Retired; formerly Chief Economist for the Investment Company Institute (ICI) (2005-2017); formerly Senior Economist and Director of Industry and Financial Analysis at the ICI (1998-2004); formerly Senior Economist, Industry and Financial Analysis at the ICI (1996-1998); formerly Staff Economist at the Federal Reserve Board (1989-1996); Director, ICI Mutual Insurance Company (2012-2017). | None. | Since March 2018 | |||
Prudential Day One Funds
Independent Board Members
| ||||||
Name Year of Birth Position(s) Portfolios Overseen | Principal Occupation(s) During Past Five Years | Other Directorships Held During Past Five Years | Length of Board Service | |||
Grace C. Torres 1959 Board Member Portfolios Overseen: 96 | Retired; formerly Treasurer and Principal Financial and Accounting Officer of the PGIM Funds, Target Funds, Advanced Series Trust, Prudential Variable Contract Accounts and The Prudential Series Fund (1998-June 2014); Assistant Treasurer (March 1999-June 2014) and Senior Vice President (September 1999-June 2014) of PGIM Investments LLC; Assistant Treasurer (May 2003-June 2014) and Vice President (June 2005-June 2014) of AST Investment Services, Inc.; Senior Vice President and Assistant Treasurer (May 2003-June 2014) of Prudential Annuities Advisory Services, Inc. | Director (since January 2018) of OceanFirst Financial Corp. and OceanFirst Bank; formerly Director (July 2015-January 2018) of Sun Bancorp, Inc. N.A. and Sun National Bank. | Since November 2014 | |||
Interested Board Members
| ||||||
Name Year of Birth Position(s) Portfolios Overseen | Principal Occupation(s) During Past Five Years | Other Directorships Held During Past Five Years | Length of Board Service | |||
Stuart S. Parker 1962 Board Member & President Portfolios Overseen: 96 | President, Chief Executive Officer, Chief Operating Officer and Officer in Charge of PGIM Investments LLC (formerly known as Prudential Investments LLC) (since January 2012); President and PEO (since March 2022) of the PGIM Private Real Estate Fund, Inc.; formerly Executive Vice President of Jennison Associates LLC and Head of Retail Distribution of PGIM Investments LLC (June 2005-December 2011); Investment Company Institute - Board of Governors (since May 2012). | None. | Since January 2012 | |||
Visit our website at pgim.com/investments
Interested Board Members
| ||||||
Name Year of Birth Position(s) Portfolios Overseen | Principal Occupation(s) During Past Five Years | Other Directorships Held During Past Five Years | Length of Board Service | |||
Scott E. Benjamin 1973 Board Member & Vice President Portfolios Overseen: 97 | Executive Vice President (since May 2009) of PGIM Investments LLC; Vice President (since June 2012) of Prudential Investment Management Services LLC; Executive Vice President (since September 2009) of AST Investment Services, Inc.; Senior Vice President of Product Development and Marketing, PGIM Investments (since February 2006); Vice President (since March 2022) of the PGIM Private Real Estate Fund, Inc.; formerly Vice President of Product Development and Product Management, PGIM Investments LLC (2003-2006). | None. | Since March 2010 | |||
| Fund Officers(a) | ||||
Name Year of Birth Fund Position | Principal Occupation(s) During Past Five Years | Length of Service as Fund Officer | ||
Claudia DiGiacomo 1974 Chief Legal Officer | Chief Legal Officer (since July 2022) of the PGIM Private Real Estate Fund, Inc.; Chief Legal Officer, Executive Vice President and Secretary of PGIM Investments LLC (since August 2020); Chief Legal Officer of Prudential Mutual Fund Services LLC (since August 2020); Chief Legal Officer of PIFM Holdco, LLC (since August 2020); Vice President and Corporate Counsel (since January 2005) of Prudential; and Corporate Counsel of AST Investment Services, Inc. (since August 2020); formerly Vice President and Assistant Secretary of PGIM Investments LLC (2005-2020); formerly Associate at Sidley Austin Brown & Wood LLP (1999-2004). | Since December 2005 | ||
Prudential Day One Funds
| Fund Officers(a) | ||||
Name Year of Birth Fund Position | Principal Occupation(s) During Past Five Years | Length of Service as Fund Officer | ||
Isabelle Sajous 1976 Chief Compliance Officer | Chief Compliance Officer (since April 2022) of PGIM Investments LLC, the PGIM Funds, Target Funds, PGIM ETF Trust, PGIM Global High Yield Fund, Inc., PGIM High Yield Bond Fund, Inc., PGIM Short Duration High Yield Opportunities Fund, Advanced Series Trust, The Prudential Series Fund and Prudential��s Gibraltar Fund, Inc.; Chief Compliance Officer (since March 2022) of the PGIM Private Real Estate Fund, Inc.; Vice President, Compliance of PGIM Investments LLC (since December 2020); formerly Director, Compliance (July 2018-December 2020) of Credit Suisse Asset Management LLC; and Vice President, Associate General Counsel & Deputy Chief Compliance Officer of Cramer Rosenthal McGlynn, LLC (August 2014-July 2018). | Since April 2022 | ||
Andrew R. French 1962 Secretary | Vice President (since December 2018) of PGIM Investments LLC; Secretary (since March 2022) of the PGIM Private Real Estate Fund, Inc.; formerly Vice President and Corporate Counsel (2010-2018) of Prudential; formerly Director and Corporate Counsel (2006-2010) of Prudential; Vice President and Assistant Secretary (since January 2007) of PGIM Investments LLC; Vice President and Assistant Secretary (since January 2007) of Prudential Mutual Fund Services LLC. | Since October 2006 | ||
Melissa Gonzalez 1980 Assistant Secretary | Vice President and Corporate Counsel (since September 2018) of Prudential; Vice President and Assistant Secretary (since August 2020) of PGIM Investments LLC; Assistant Secretary (since March 2022) of the PGIM Private Real Estate Fund, Inc.; formerly Director and Corporate Counsel (March 2014-September 2018) of Prudential. | Since March 2020 | ||
Patrick E. McGuinness 1986 Assistant Secretary | Vice President and Assistant Secretary (since August 2020) of PGIM Investments LLC; Director and Corporate Counsel (since February 2017) of Prudential; Assistant Secretary (since March 2022) of the PGIM Private Real Estate Fund, Inc. | Since June 2020 | ||
Debra Rubano 1975 Assistant Secretary | Vice President and Corporate Counsel (since November 2020) of Prudential; Assistant Secretary (since March 2022) of the PGIM Private Real Estate Fund, Inc; formerly Director and Senior Counsel of Allianz Global Investors U.S. Holdings LLC (2010-2020) and Assistant Secretary of numerous funds in the Allianz fund complex (2015-2020). | Since December 2020 | ||
Kelly A. Coyne 1968 Assistant Secretary | Director, Investment Operations of Prudential Mutual Fund Services LLC (since 2010); Assistant Secretary (since March 2022) of the PGIM Private Real Estate Fund, Inc. | Since March 2015 | ||
Visit our website at pgim.com/investments
| Fund Officers(a) | ||||
Name Year of Birth Fund Position | Principal Occupation(s) During Past Five Years | Length of Service as Fund Officer | ||
Christian J. Kelly 1975 Treasurer and Principal Financial and Accounting Officer | Vice President, Head of Fund Administration of PGIM Investments LLC (since November 2018); Principal Financial Officer (since March 2022) of the PGIM Private Real Estate Fund, Inc.; formerly, Treasurer and Principal Accounting Officer (March 2022- July 2022) of the PGIM Private Real Estate Fund, Inc.; formerly Director of Fund Administration of Lord Abbett & Co. LLC (2009-2018), Treasurer and Principal Accounting Officer of the Lord Abbett Family of Funds (2017-2018); Director of Accounting, Avenue Capital Group (2008-2009); Senior Manager, Investment Management Practice of Deloitte & Touche LLP (1998-2007). | Since January 2019 | ||
Lana Lomuti 1967 Assistant Treasurer | Vice President (since 2007) and Director (2005-2007), within PGIM Investments Fund Administration; formerly Assistant Treasurer (December 2007-February 2014) of The Greater China Fund, Inc. | Since April 2014 | ||
Russ Shupak 1973 Assistant Treasurer | Vice President (since 2017) and Director (2013-2017), within PGIM Investments Fund Administration; Treasurer and Principal Accounting Officer (since July 2022) of the PGIM Private Real Estate Fund, Inc.; formerly Assistant Treasurer (March 2022 – July 2022) of the PGIM Private Real Estate Fund, Inc. | Since October 2019 | ||
Deborah Conway 1969 Assistant Treasurer | Vice President (since 2017) and Director (2007-2017), within PGIM Investments Fund Administration. | Since October 2019 | ||
Elyse M. McLaughlin 1974 Assistant Treasurer | Vice President (since 2017) and Director (2011-2017), within PGIM Investments Fund Administration; Assistant Treasurer (since March 2022) of the PGIM Private Real Estate Fund, Inc. | Since October 2019 | ||
Kelly Florio 1978 Anti-Money Laundering Compliance Officer | Vice President, Corporate Compliance, Global Compliance Programs and Compliance Risk Management (since December 2021) of Prudential; formerly, Head of Fraud Risk Management (October 2019 to December 2021) at New York Life Insurance Company; formerly, Head of Key Risk Area Operations (November 2018 to October 2019), Director of the US Anti-Money Laundering Compliance Unit (2009-2018) and Bank Loss Prevention Associate (2006 -2009) at MetLife. | Since June 2022 | ||
| (a) | Excludes Mr. Parker and Mr. Benjamin, interested Board Members who also serve as President and Vice President, respectively. |
Explanatory Notes to Tables:
| ∎ | Board Members are deemed to be “Interested,” as defined in the 1940 Act, by reason of their affiliation with PGIM Investments LLC and/or an affiliate of PGIM Investments LLC. |
| ∎ | Unless otherwise noted, the address of all Board Members and Officers is c/o PGIM Investments LLC, 655 Broad Street, Newark, New Jersey 07102-4410. |
| ∎ | There is no set term of office for Board Members or Officers. The Board Members have adopted a retirement policy, which calls for the retirement of Board Members on December 31 of the year in which they reach the age of 75. |
Prudential Day One Funds
| ∎ | “Other Directorships Held” includes all directorships of companies required to register or file reports with the SEC under the 1934 Act (that is, “public companies”) or other investment companies registered under the 1940 Act. |
| ∎ | “Portfolios Overseen” includes all investment companies managed by PGIM Investments LLC. The investment companies for which PGIM Investments LLC serves as manager include the PGIM Mutual Funds, Target Funds, The Prudential Variable Contract Accounts, PGIM ETF Trust, PGIM Private Real Estate Fund, Inc., PGIM High Yield Bond Fund, Inc., PGIM Global High Yield Fund, Inc., PGIM Short Duration High Yield Opportunities Fund, The Prudential Series Fund, Prudential’s Gibraltar Fund, Inc. and the Advanced Series Trust. |
| ∎ | As used in the Fund Officers table “Prudential” means The Prudential Insurance Company of America. |
Visit our website at pgim.com/investments
Approval of Advisory Agreements (unaudited)
The Funds’ Boards of Trustees
The Boards of Trustees (the “Board”) of the Prudential Day One Funds (each, a “Fund, and collectively, the “Funds”)1 consists of ten individuals, eight of whom are not “interested persons” of the Funds, as defined in the Investment Company Act of 1940, as amended (the “1940 Act”) (the “Independent Trustees”). The Board is responsible for the oversight of each Fund and its operations, and performs the various duties imposed on the directors of investment companies by the 1940 Act. The Independent Trustees have retained independent legal counsel to assist them in connection with their duties. The Chair of the Board is an Independent Trustee. The Board has established five standing committees: the Audit Committee, the Nominating and Governance Committee, the Compliance Committee and two Investment Committees. Each committee is chaired by, and composed of, Independent Trustees.
Annual Approval of the Funds’ Advisory Agreements
As required under the 1940 Act, the Board determines annually whether to renew each Fund’s management agreement with PGIM Investments LLC (“PGIM Investments”) and each Fund’s subadvisory agreement with PGIM Quantitative Solutions LLC (“PGIM Quantitative Solutions”). In considering the renewal of the agreements, the Board, including all of the Independent Trustees, met on May 26 and June 7-9, 2022 (the “Board Meeting”) and approved the renewal of the agreements through July 31, 2023, after concluding that the renewal of the agreements was in the best interests of each Fund and its shareholders.
In advance of the meetings, the Board requested and received materials relating to the agreements, and had the opportunity to ask questions and request further information in connection with its consideration. Among other things, the Board considered comparative fee information from PGIM Investments and PGIM Quantitative Solutions. Also, the Board considered comparisons with other mutual funds in relevant Peer Universes and Peer Groups, as is further discussed below.
In approving the agreements, the Board, including the Independent Trustees advised by independent legal counsel, considered the factors it deemed relevant, including the nature, quality and extent of services provided, the performance of each Fund, the profitability of PGIM Investments and its affiliates, expenses and fees, and the potential for economies of scale that may be shared with each Fund and its shareholders as each Fund’s assets grow. In their deliberations, the Trustees did not identify any single factor which alone was responsible for the Board’s decision to approve the agreements with respect to each Fund. In connection with its deliberations, the Board considered information provided by PGIM Investments throughout the year at regular Board
1Each of the Prudential Day One Funds is a series of Prudential Investment Portfolios 5. The Prudential Day One Funds are: Prudential Day One Income Fund, Prudential Day One 2015 Fund, Prudential Day One 2020 Fund, Prudential Day One 2025 Fund, Prudential Day One 2030 Fund, Prudential Day One 2035 Fund, Prudential Day One 2040 Fund, Prudential Day One 2045 Fund, Prudential Day One 2050 Fund, Prudential Day One 2055 Fund, Prudential Day One 2060 Fund, and Prudential Day One 2065 Fund.
Prudential Day One Funds
Approval of Advisory Agreements (continued)
meetings, presentations from portfolio managers and other information, as well as information furnished at or in advance of the Board Meeting.
The Trustees determined that the overall arrangements between each Fund and PGIM Investments, which serves as each Fund’s investment manager pursuant to a management agreement, and between PGIM Investments and PGIM Quantitative Solutions, which serves as each Fund’s subadviser pursuant to the terms of a subadvisory agreement with PGIM Investments, are in the best interests of each Fund and its shareholders in light of the services performed, fees charged and such other matters as the Trustees considered relevant in the exercise of their business judgment.
The material factors and conclusions that formed the basis for the Trustees’ reaching their determinations to approve the continuance of the agreements are separately discussed below.
Nature, Quality and Extent of Services
The Board received and considered information regarding the nature, quality and extent of services provided to each Fund by PGIM Investments and PGIM Quantitative Solutions. The Board noted that PGIM Quantitative Solutions is affiliated with PGIM Investments. The Board considered the services provided by PGIM Investments, including but not limited to the oversight of the subadviser for each Fund, as well as the provision of fund recordkeeping, compliance and other services to each Fund, and PGIM Investments’ role as administrator for the Funds’ liquidity risk management program. With respect to PGIM Investments’ oversight of the subadviser, the Board noted that PGIM Investments’ Strategic Investment Research Group (“SIRG”), which is a business unit of PGIM Investments, is responsible for monitoring and reporting to PGIM Investments’ senior management on the performance and operations of the subadviser. The Board also considered that PGIM Investments pays the salaries of all of the officers and interested Trustees of the Funds who are part of Fund management. The Board also considered the investment subadvisory services provided by PGIM Quantitative Solutions, including investment research and security selection, as well as adherence to each Fund’s investment restrictions and compliance with applicable Fund policies and procedures. The Board considered PGIM Investments’ evaluation of the subadviser, as well as PGIM Investments’ recommendation, based on its review of the subadviser, to renew the subadvisory agreements.
The Board considered the qualifications, backgrounds and responsibilities of PGIM Investments’ senior management responsible for the oversight of each Fund and PGIM Quantitative Solutions, and also considered the qualifications, backgrounds and responsibilities of the PGIM Quantitative Solutions portfolio managers who are responsible for the day-to-day management of each Fund’s portfolio. The Board was provided with information pertaining to PGIM Investments’ and PGIM Quantitative Solutions’ organizational structure, senior management, investment operations, and other relevant information pertaining to PGIM Investments and PGIM Quantitative Solutions. The Board also noted that it received favorable compliance reports from the
Visit our website at pgim.com/investments
Funds’ Chief Compliance Officer (“CCO”) as to each of PGIM Investments and PGIM Quantitative Solutions.
The Board concluded that it was satisfied with the nature, extent and quality of the investment management services provided by PGIM Investments and the subadvisory services provided to each Fund by PGIM Quantitative Solutions, and that there was a reasonable basis on which to conclude that each Fund benefits from the services provided by PGIM Investments and PGIM Quantitative Solutions under the management and subadvisory agreements.
Costs of Services and Profits Realized by PGIM Investments
The Board was provided with information on the profitability of PGIM Investments and its affiliates in serving as each Fund’s investment manager. The Board discussed with PGIM Investments the methodology utilized in assembling the information regarding profitability and considered its reasonableness. The Board recognized that it is difficult to make comparisons of profitability from fund management contracts because comparative information is not generally publicly available and is affected by numerous factors, including the structure of the particular adviser, the types of funds it manages, its business mix, numerous assumptions regarding allocations and the adviser’s capital structure and cost of capital. However, the Board considered that the cost of services provided by PGIM Investments during the year ended December 31, 2021 exceeded the management fees paid by each Fund, resulting in an operating loss to PGIM Investments. Taking these factors into account, the Board concluded that the profitability of PGIM Investments and its affiliates in relation to the services rendered was not unreasonable.
Economies of Scale
The Board received and discussed information concerning economies of scale that PGIM Investments may realize as each Fund’s assets grow beyond current levels. During the course of time, the Board has considered information regarding the launch date of each Fund, the management fees of the Funds compared to similarly managed funds and PGIM Investments’ investment in each Fund. The Board noted that economies of scale can be shared with each Fund in other ways, including low management fees from inception, additional technological and personnel investments to enhance shareholder services, and maintaining existing expense structures in the face of a rising cost environment. The Board also considered PGIM Investments’ assertion that it continually evaluates the management fee schedule of each Fund and the potential to share economies of scale through breakpoints or fee waivers as asset levels increase.
The Board recognized the inherent limitations of any analysis of economies of scale, stemming largely from the Board’s understanding that most of PGIM Investments’ costs are not specific to individual funds, but rather are incurred across a variety of products and services.
Prudential Day One Funds
Approval of Advisory Agreements (continued)
Other Benefits to PGIM Investments and PGIM Quantitative Solutions
The Board considered potential ancillary benefits that might be received by PGIM Investments, PGIM Quantitative Solutions and their affiliates as a result of their relationship with each Fund. The Board concluded that potential benefits to be derived by PGIM Investments included transfer agency fees received by each Fund’s transfer agent (which is affiliated with PGIM Investments), and benefits to its reputation as well as other intangible benefits resulting from PGIM Investments’ association with the Funds. The Board concluded that the potential benefits to be derived by PGIM Quantitative Solutions included its ability to use soft dollar credits, as well as the potential benefits consistent with those generally resulting from an increase in assets under management, specifically, potential access to additional research resources and benefits to its reputation. The Board concluded that the benefits derived by PGIM Investments and PGIM Quantitative Solutions were consistent with the types of benefits generally derived by investment managers and subadvisers to mutual funds.
Performance of the Funds / Fees and Expenses
The Board considered certain additional factors and made related conclusions relating to the historical performance of each Fund for the one-year and the three-year periods ended December 31, 2021. The Board considered that each Fund commenced operations on December 13, 2016 and that longer-term performance was not yet available.
The Board also considered each Fund’s actual management fee, as well as each Fund’s net total expense ratio, for the fiscal year ended July 31, 2021. The Board considered the management fee for each Fund as compared to the management fee charged by PGIM Investments to other funds and the fee charged by other advisers to comparable mutual funds in a Peer Group. The actual management fee represents the fee rate actually paid by Fund shareholders and includes any fee waivers or reimbursements. The net total expense ratio for each Fund represents the actual expense ratio incurred by Fund shareholders.
The mutual funds included in the Peer Universe, which was used to consider performance, and the Peer Group, which was used to consider expenses and fees, for each Fund were objectively determined by Broadridge, an independent provider of mutual fund data. In certain circumstances, PGIM Investments also provided supplemental Peer Universe or Peer Group information, for reasons addressed with the Board. The comparisons placed each Fund in various quartiles over various periods, with the first quartile being the best 25% of the mutual funds (for performance, the best performing mutual funds and, for expenses, the lowest cost mutual funds).
The section below summarizes key factors considered by the Board and the Board’s conclusions regarding each Fund’s performance, fees and overall expenses. For each Fund, the table sets forth net performance comparisons (which reflect the impact on performance of any subsidies, expense caps or waivers that may be applicable) with the Peer Universe, actual management fees with the Peer Group (which reflect the impact
Visit our website at pgim.com/investments
of fund expenses, or any subsidies or fee waivers), and net total expenses with the Peer Group, each of which were key factors considered by the Board.
Prudential Day One Income Fund
Net Performance | 1 Year | 3 Years | 5 Years | 10 Years | ||||
| 1st Quartile | 2nd Quartile | 2nd Quartile | N/A | |||||
| Actual Management Fees: 1st Quartile | ||||||||
| Net Total Expenses: 2nd Quartile | ||||||||
| · | The Board noted that the Fund outperformed its benchmark index over the one-year period and equaled its benchmark index over the five-year period, though it underperformed its benchmark index over the three-year period. |
| · | The Board and PGIM Investments agreed to retain the Fund’s existing contractual expense cap, which (exclusive of certain fees and expenses) caps total annual operating expenses at 1.15% for Class R1 shares, 0.90% for Class R2 shares, 0.75% for Class R3 shares, 0.65% for Class R4 shares, 0.55% for Class R5 shares, and 0.40% for Class R6 shares through November 30, 2022. |
| · | In addition, PGIM Investments is obligated to waive management fees or shared operating expenses on any share class to the same extent that it waives such expenses on any other share class. |
| · | The Board concluded that, in light of the above, it would be in the best interests of the Fund and its shareholders to renew the agreements. |
| · | The Board concluded that the management fees (including subadvisory fees) and total expenses were reasonable in light of the services provided. |
Prudential Day One 2015 Fund
| Net Performance | 1 Year | 3 Years | 5 Years | 10 Years | ||||
| 1st Quartile | 3rd Quartile | 3rd Quartile | N/A | |||||
| Actual Management Fees: 1st Quartile | ||||||||
| Net Total Expenses: 2nd Quartile | ||||||||
| · | The Board noted that the Fund outperformed its benchmark index over the one-year period and underperformed its benchmark index over the three- and five-year periods. |
| · | The Board considered PGIM Investments’ assertion that benchmark-relative performance comparisons are more appropriate when evaluating the Fund’s performance given that the Fund is managed to a blended benchmark, which is aligned to its Glidepath return. |
Prudential Day One Funds
Approval of Advisory Agreements (continued)
| · | The Board also considered the Fund’s trend of improving performance, noting that the Fund outperformed its peer group for all periods and its benchmark index for the year-to-date and one-year periods ended March 31, 2022. |
| · | The Board and PGIM Investments agreed to retain the Fund’s existing contractual expense cap, which (exclusive of certain fees and expenses) caps total annual operating expenses at 1.15% for Class R1 shares, 0.90% for Class R2 shares, 0.75% for Class R3 shares, 0.65% for Class R4 shares, 0.55% for Class R5 shares, and 0.40% for Class R6 shares through November 30, 2022. |
| · | In addition, PGIM Investments is obligated to waive management fees or shared operating expenses on any share class to the same extent that it waives such expenses on any other share class. |
| · | The Board concluded that, in light of the above, it would be in the best interests of the Fund and its shareholders to renew the agreements. |
| · | The Board concluded that the management fees (including subadvisory fees) and total expenses were reasonable in light of the services provided. |
Prudential Day One 2020 Fund
| Net Performance | 1 Year | 3 Years | 5 Years | 10 Years | ||||
| 1st Quartile | 3rd Quartile | 3rd Quartile | N/A | |||||
| Actual Management Fees: 1st Quartile | ||||||||
| Net Total Expenses: 2nd Quartile | ||||||||
| · | The Board noted that the Fund outperformed its benchmark index over the one-year period and underperformed its benchmark index over the three- and five-year periods. |
| · | The Board considered PGIM Investments’ assertion that benchmark-relative performance comparisons are more appropriate when evaluating the Fund’s performance given that the Fund is managed to a blended benchmark, which is aligned to its Glidepath return. |
| · | The Board also considered the Fund’s trend of improving performance, noting that the Fund outperformed its peer group for all periods and its benchmark index for the year-to-date and one-year periods ended March 31, 2022. |
| · | The Board and PGIM Investments agreed to retain the Fund’s existing contractual expense cap, which (exclusive of certain fees and expenses) caps total annual operating expenses at 1.15% for Class R1 shares, 0.90% for Class R2 shares, 0.75% for Class R3 shares, 0.65% for Class R4 shares, 0.55% for Class R5 shares, and 0.40% for Class R6 shares through November 30, 2022. |
Visit our website at pgim.com/investments
| · | In addition, PGIM Investments is obligated to waive management fees or shared operating expenses on any share class to the same extent that it waives such expenses on any other share class. |
| · | The Board concluded that, in light of the above, it would be in the best interests of the Fund and its shareholders to renew the agreements. |
| · | The Board concluded that the management fees (including subadvisory fees) and total expenses were reasonable in light of the services provided. |
Prudential Day One 2025 Fund
| Net Performance | 1 Year | 3 Years | 5 Years | 10 Years | ||||
| 1st Quartile | 3rd Quartile | 3rd Quartile | N/A | |||||
| Actual Management Fees: 1st Quartile | ||||||||
| Net Total Expenses: 2nd Quartile | ||||||||
| · | The Board noted that the Fund outperformed its benchmark index over the one-year period but underperformed its benchmark index over the three- and five-year periods. |
| · | The Board considered PGIM Investments’ assertion that benchmark-relative performance comparisons are more appropriate when evaluating the Fund’s performance given that the Fund is managed to a blended benchmark, which is aligned to its Glidepath return. |
| · | The Board also considered the Fund’s trend of improving performance, noting that the Fund outperformed its peer group for all periods and its benchmark index for the year-to-date period ended March 31, 2022. |
| · | The Board and PGIM Investments agreed to retain the Fund’s existing contractual expense cap, which (exclusive of certain fees and expenses) caps total annual operating expenses at 1.15% for Class R1 shares, 0.90% for Class R2 shares, 0.75% for Class R3 shares, 0.65% for Class R4 shares, 0.55% for Class R5 shares, and 0.40% for Class R6 shares through November 30, 2022. |
| · | In addition, PGIM Investments is obligated to waive management fees or shared operating expenses on any share class to the same extent that it waives such expenses on any other share class. |
| · | The Board concluded that, in light of the above, it would be in the best interests of the Fund and its shareholders to renew the agreements. |
| · | The Board concluded that the management fees (including subadvisory fees) and total expenses were reasonable in light of the services provided. |
Prudential Day One Funds
Approval of Advisory Agreements (continued)
Prudential Day One 2030 Fund
| Net Performance | 1 Year | 3 Years | 5 Years | 10 Years | ||||
| 1st Quartile | 3rd Quartile | 3rd Quartile | N/A | |||||
| Actual Management Fees: 1st Quartile | ||||||||
| Net Total Expenses: 1st Quartile | ||||||||
| · | The Board noted that the Fund outperformed its benchmark index over the one-year period and underperformed its benchmark index over the three- and five-year periods. |
| · | The Board considered PGIM Investments’ assertion that benchmark-relative performance comparisons are more appropriate when evaluating the Fund’s performance given that the Fund is managed to a blended benchmark, which is aligned to its Glidepath return. |
| · | The Board also considered the Fund’s trend of improving performance, noting that the Fund outperformed its peer group for all periods and its benchmark index for the year-to-date period ended March 31, 2022. |
| · | The Board and PGIM Investments agreed to retain the Fund’s existing contractual expense cap, which (exclusive of certain fees and expenses) caps total annual operating expenses at 1.15% for Class R1 shares, 0.90% for Class R2 shares, 0.75% for Class R3 shares, 0.65% for Class R4 shares, 0.55% for Class R5 shares, and 0.40% for Class R6 shares through November 30, 2022. |
| · | In addition, PGIM Investments is obligated to waive management fees or shared operating expenses on any share class to the same extent that it waives such expenses on any other share class. |
| · | The Board concluded that, in light of the above, it would be in the best interests of the Fund and its shareholders to renew the agreements. |
| · | The Board concluded that the management fees (including subadvisory fees) and total expenses were reasonable in light of the services provided. |
Prudential Day One 2035 Fund
| Net Performance | 1 Year | 3 Years | 5 Years | 10 Years | ||||
| 1st Quartile | 3rd Quartile | 3rd Quartile | N/A | |||||
| Actual Management Fees: 1st Quartile | ||||||||
| Net Total Expenses: 2nd Quartile | ||||||||
| · | The Board noted that the Fund outperformed its benchmark index over the one-year period and underperformed its benchmark index over the three- and five-year periods |
Visit our website at pgim.com/investments
| · | The Board considered PGIM Investments’ assertion that benchmark-relative performance comparisons are more appropriate when evaluating the Fund’s performance given that the Fund is managed to a blended benchmark, which is aligned to its Glidepath return. |
| · | The Board also considered the Fund’s trend of improving performance, noting that the Fund outperformed its peer group for all periods and its benchmark index for the year-to-date period ended March 31, 2022. |
| · | The Board and PGIM Investments agreed to retain the Fund’s existing contractual expense cap, which (exclusive of certain fees and expenses) caps total annual operating expenses at 1.15% for Class R1 shares, 0.90% for Class R2 shares, 0.75% for Class R3 shares, 0.65% for Class R4 shares, 0.55% for Class R5 shares, and 0.40% for Class R6 shares through November 30, 2022. |
| · | In addition, PGIM Investments is obligated to waive management fees or shared operating expenses on any share class to the same extent that it waives such expenses on any other share class. |
| · | The Board concluded that, in light of the above, it would be in the best interests of the Fund and its shareholders to renew the agreements. |
| · | The Board concluded that the management fees (including subadvisory fees) and total expenses were reasonable in light of the services provided. |
Prudential Day One 2040 Fund
| Net Performance | 1 Year | 3 Years | 5 Years | 10 Years | ||||
| 1st Quartile | 3rd Quartile | 3rd Quartile | N/A | |||||
| Actual Management Fees: 1st Quartile | ||||||||
| Net Total Expenses: 1st Quartile | ||||||||
| · | The Board noted that the Fund outperformed its benchmark index over the one-year period and underperformed its benchmark index over the three- and five-year periods. |
| · | The Board considered PGIM Investments’ assertion that benchmark-relative performance comparisons are more appropriate when evaluating the Fund’s performance given that the Fund is managed to a blended benchmark, which is aligned to its Glidepath return. |
| · | The Board also considered the Fund’s trend of improving performance, noting that the Fund outperformed its peer group for all periods and its benchmark index for the year-to-date period ended March 31, 2022. |
| · | The Board and PGIM Investments agreed to retain the Fund’s existing contractual expense cap, which (exclusive of certain fees and expenses) caps total annual |
Prudential Day One Funds
Approval of Advisory Agreements (continued)
operating expenses at 1.15% for Class R1 shares, 0.90% for Class R2 shares, 0.75% for Class R3 shares, 0.65% for Class R4 shares, 0.55% for Class R5 shares, and 0.40% for Class R6 shares through November 30, 2022. |
| · | In addition, PGIM Investments is obligated to waive management fees or shared operating expenses on any share class to the same extent that it waives such expenses on any other share class. |
| · | The Board concluded that, in light of the above, it would be in the best interests of the Fund and its shareholders to renew the agreements. |
| · | The Board concluded that the management fees (including subadvisory fees) and total expenses were reasonable in light of the services provided. |
Prudential Day One 2045 Fund
| Net Performance | 1 Year | 3 Years | 5 Years | 10 Years | ||||
| 1st Quartile | 3rd Quartile | 3rd Quartile | N/A | |||||
| Actual Management Fees: 1st Quartile | ||||||||
| Net Total Expenses: 1st Quartile | ||||||||
| · | The Board noted that the Fund outperformed its benchmark index over the one-year period and underperformed its benchmark index over the three- and five-year periods. |
| · | The Board considered PGIM Investments’ assertion that benchmark-relative performance comparisons are more appropriate when evaluating the Fund’s performance given that the Fund is managed to a blended benchmark, which is aligned to its Glidepath return. |
| · | The Board also considered the Fund’s trend of improving performance, noting that the Fund outperformed its peer group for all periods and its benchmark index for the year-to-date period ended March 31, 2022. |
| · | The Board and PGIM Investments agreed to retain the Fund’s existing contractual expense cap, which (exclusive of certain fees and expenses) caps total annual operating expenses at 1.15% for Class R1 shares, 0.90% for Class R2 shares, 0.75% for Class R3 shares, 0.65% for Class R4 shares, 0.55% for Class R5 shares, and 0.40% for Class R6 shares through November 30, 2022. |
| · | In addition, PGIM Investments is obligated to waive management fees or shared operating expenses on any share class to the same extent that it waives such expenses on any other share class. |
| · | The Board concluded that, in light of the above, it would be in the best interests of the Fund and its shareholders to continue to allow the Fund to renew the |
Visit our website at pgim.com/investments
agreements. The Board concluded that the management fees (including subadvisory fees) and total expenses were reasonable in light of the services provided. |
Prudential Day One 2050 Fund
| Net Performance | 1 Year | 3 Years | 5 Years | 10 Years | ||||
| 1st Quartile | 3rd Quartile | 3rd Quartile | N/A | |||||
| Actual Management Fees: 1st Quartile | ||||||||
| Net Total Expenses: 2nd Quartile | ||||||||
| · | The Board noted that the Fund outperformed its benchmark index over the one-year period and underperformed its benchmark index over the three- and five-year periods. |
| · | The Board considered PGIM Investments’ assertion that benchmark-relative performance comparisons are more appropriate when evaluating the Fund’s performance given that the Fund is managed to a blended benchmark, which is aligned to its Glidepath return. |
| · | The Board also considered the Fund’s trend of improving performance, noting that the Fund outperformed its peer group for all periods and its benchmark index for the year-to-date period ended March 31, 2022. |
| · | The Board and PGIM Investments agreed to retain the Fund’s existing contractual expense cap, which (exclusive of certain fees and expenses) caps total annual operating expenses at 1.15% for Class R1 shares, 0.90% for Class R2 shares, 0.75% for Class R3 shares, 0.65% for Class R4 shares, 0.55% for Class R5 shares, and 0.40% for Class R6 shares through November 30, 2022. |
| · | In addition, PGIM Investments is obligated to waive management fees or shared operating expenses on any share class to the same extent that it waives such expenses on any other share class. |
| · | The Board concluded that, in light of the above, it would be in the best interests of the Fund and its shareholders to renew the agreements. |
| · | The Board concluded that the management fees (including subadvisory fees) and total expenses were reasonable in light of the services provided. |
Prudential Day One 2055 Fund
| Net Performance | 1 Year | 3 Years | 5 Years | 10 Years | ||||
| 1st Quartile | 3rd Quartile | 3rd Quartile | N/A | |||||
| Actual Management Fees: 1st Quartile | ||||||||
| Net Total Expenses: 1st Quartile | ||||||||
Prudential Day One Funds
Approval of Advisory Agreements (continued)
| · | The Board noted that the Fund outperformed its benchmark index over the one-year period and underperformed its benchmark index over the three- and five-year periods. |
| · | The Board considered PGIM Investments’ assertion that benchmark-relative performance comparisons are more appropriate when evaluating the Fund’s performance given that the Fund is managed to a blended benchmark, which is aligned to its Glidepath return. |
| · | The Board and PGIM Investments agreed to retain the Fund’s existing contractual expense cap, which (exclusive of certain fees and expenses) caps total annual operating expenses at 1.15% for Class R1 shares, 0.90% for Class R2 shares, 0.75% for Class R3 shares, 0.65% for Class R4 shares, 0.55% for Class R5 shares, and 0.40% for Class R6 shares through November 30, 2022. |
| · | In addition, PGIM Investments is obligated to waive management fees or shared operating expenses on any share class to the same extent that it waives such expenses on any other share class. |
| · | The Board concluded that, in light of the above, it would be in the best interests of the Fund and its shareholders to renew the agreements. |
| · | The Board concluded that the management fees (including subadvisory fees) and total expenses were reasonable in light of the services provided. |
Prudential Day One 2060 Fund
| Net Performance | 1 Year | 3 Years | 5 Years | 10 Years | ||||
| 1st Quartile | 3rd Quartile | 3rd Quartile | N/A | |||||
| Actual Management Fees: 1st Quartile | ||||||||
| Net Total Expenses: 1st Quartile | ||||||||
| · | The Board noted that the Fund outperformed its benchmark index over the one-year period and underperformed its benchmark index over the three- and five-year periods. |
| · | The Board considered PGIM Investments’ assertion that benchmark-relative performance comparisons are more appropriate when evaluating the Fund’s performance given that the Fund is managed to a blended benchmark, which is aligned to its Glidepath return. |
| · | The Board also considered the Fund’s trend of improving performance, noting that the Fund outperformed its peer group for all periods and its benchmark index for the year-to-date period ended March 31, 2022. |
| · | The Board and PGIM Investments agreed to retain the Fund’s existing contractual expense cap, which (exclusive of certain fees and expenses) caps total annual |
Visit our website at pgim.com/investments
operating expenses at 1.15% for Class R1 shares, 0.90% for Class R2 shares, 0.75% for Class R3 shares, 0.65% for Class R4 shares, 0.55% for Class R5 shares, and 0.40% for Class R6 shares through November 30, 2022. |
| · | In addition, PGIM Investments is obligated to waive management fees or shared operating expenses on any share class to the same extent that it waives such expenses on any other share class. |
| · | The Board concluded that, in light of the above, it would be in the best interests of the Fund and its shareholders to renew the agreements. |
| · | The Board concluded that the management fees (including subadvisory fees) and total expenses were reasonable in light of the services provided. |
Prudential Day One 2065 Fund
| Net Performance | 1 Year | 3 Years | 5 Years | 10 Years | ||||
| 1st Quartile | N/A | N/A | N/A | |||||
| Actual Management Fees: 1st Quartile | ||||||||
| Net Total Expenses: 1st Quartile | ||||||||
| · | The Board noted that the Fund outperformed its benchmark index over the one-year period. |
| · | The Board considered that the Fund commenced operations on December 16, 2019 and that longer-term performance was not yet available. |
| · | The Board considered PGIM Investments’ assertion that benchmark-relative performance comparisons are more appropriate when evaluating the Fund’s performance given that the Fund is managed to a blended benchmark, which is aligned to its Glidepath return. |
| · | The Board and PGIM Investments agreed to retain the Fund’s existing contractual expense cap, which (exclusive of certain fees and expenses) caps total annual operating expenses at 1.15% for Class R1 shares, 0.90% for Class R2 shares, 0.75% for Class R3 shares, 0.65% for Class R4 shares, 0.55% for Class R5 shares, and 0.40% for Class R6 shares through November 30, 2022. |
| · | In addition, PGIM Investments is obligated to waive management fees or shared operating expenses on any share class to the same extent that it waives such expenses on any other share class. |
| · | The Board concluded that, in light of the above, it would be in the best interests of the Fund and its shareholders to continue to allow the Fund to create a longer-term performance record, and to renew the agreements. |
| · | The Board concluded that the management fees (including subadvisory fees) and total expenses were reasonable in light of the services provided. |
Prudential Day One Funds
Approval of Advisory Agreements (continued)
* * *
After full consideration of these factors, the Board concluded that approval of the agreements was in the best interests of each Fund and its shareholders.
Visit our website at pgim.com/investments
655 Broad Street
Newark, NJ 07102 | ∎ TELEPHONE
(800) 225-1852 | ∎ WEBSITE
pgim.com/investments |
PROXY VOTING
The Board of Trustees of the Funds has delegated to the Funds’ subadviser the responsibility for voting any proxies and maintaining proxy |
TRUSTEES
Ellen S. Alberding · Kevin J. Bannon · Scott E. Benjamin · Linda W. Bynoe · Barry H. Evans · Keith F. Hartstein · Laurie Simon Hodrick · Stuart S. Parker · Brian K. Reid · Grace C. Torres |
OFFICERS
Stuart S. Parker, President · Scott E. Benjamin, Vice President · Christian J. Kelly, Treasurer and Principal Financial and Accounting Officer · Claudia |
MANAGER | PGIM Investments LLC | 655 Broad Street Newark, NJ 07102 | ||
SUBADVISER | PGIM Quantitative Solutions LLC | Gateway Center Two 100 Mulberry Street Newark, NJ 07102 | ||
DISTRIBUTOR | Prudential Investment Management Services LLC | 655 Broad Street Newark, NJ 07102 | ||
CUSTODIAN | The Bank of New York Mellon | 240 Greenwich Street New York, NY 10286 | ||
TRANSFER AGENT | Prudential Mutual Fund Services LLC | PO Box 9658 Providence, RI 02940 | ||
INDEPENDENT REGISTERED PUBLIC ACCOUNTING FIRM | PricewaterhouseCoopers LLP | 300 Madison Avenue New York, NY 10017 | ||
FUND COUNSEL | Willkie Farr & Gallagher LLP | 787 Seventh Avenue New York, NY 10019 | ||
| An investor should consider the investment objectives, risks, charges, and expenses of the Funds carefully before investing. The prospectus and summary prospectus for each Fund contain this and other information about the Funds. An investor may obtain a prospectus and summary prospectus by visiting our website at pgim.com/investments or by calling (800) 225-1852. The prospectus and summary prospectus should be read carefully before investing. |
E-DELIVERY
To receive your mutual fund documents online, go to pgim.com/investments/resource/edelivery and enroll. Instead of receiving printed documents by mail, you will receive notification via email when new materials are available. You can cancel your enrollment or change your email address at any time by visiting the website address above. |
SHAREHOLDER COMMUNICATIONS WITH TRUSTEES
Shareholders can communicate directly with the Board of Trustees by writing to the Chair of the Board, Prudential Day One Funds, PGIM Investments, Attn: Board of Trustees, 655 Broad Street, Newark, NJ 07102. Shareholders can communicate directly with an individual Trustee by writing to that Trustee at the same address. Communications are not screened before being delivered to the addressee. |
AVAILABILITY OF PORTFOLIO SCHEDULE
The Fund files its complete schedule of portfolio holdings with the Securities and Exchange Commission for the first and third quarters of each fiscal year as an exhibit to its reports on Form N-PORT. The Fund’s Form N-PORT filings are available on the Commission’s website at sec.gov. |
| The Fund’s Statement of Additional Information contains additional information about the Fund’s Trustees and is available without charge, upon request, by calling (800) 225-1852. |
Mutual Funds:
ARE NOT INSURED BY THE FDIC OR ANY FEDERAL GOVERNMENT AGENCY | MAY LOSE VALUE | ARE NOT A DEPOSIT OF OR GUARANTEED BY ANY BANK OR ANY BANK AFFILIATE | ||

| PRUDENTIAL DAY ONE FUNDS | NASDAQ | CUSIP | NASDAQ | CUSIP | NASDAQ | CUSIP | ||||||||||
| Prudential Day One Income Fund (Share Class R1) | PDADX | 74445D109 | Prudential Day One 2030 Fund (Share Class R1) | PDFCX | 74445D646 | Prudential Day One 2050 Fund (Share Class R1) | PDJDX | 74445D372 | ||||||||
| Prudential Day One Income Fund (Share Class R2) | PDAEX | 74445D208 | Prudential Day One 2030 Fund (Share Class R2) | PDFEX | 74445D638 | Prudential Day One 2050 Fund (Share Class R2) | PDJEX | 74445D364 | ||||||||
| Prudential Day One Income Fund (Share Class R3) | PDAFX | 74445D307 | Prudential Day One 2030 Fund (Share Class R3) | PDFFX | 74445D620 | Prudential Day One 2050 Fund (Share Class R3) | PDJFX | 74445D356 | ||||||||
| Prudential Day One Income Fund (Share Class R4) | PDAGX | 74445D406 | Prudential Day One 2030 Fund (Share Class R4) | PDFGX | 74445D612 | Prudential Day One 2050 Fund (Share Class R4) | PDJGX | 74445D349 | ||||||||
| Prudential Day One Income Fund (Share Class R5) | PDAHX | 74445D505 | Prudential Day One 2030 Fund (Share Class R5) | PDFHX | 74445D596 | Prudential Day One 2050 Fund (Share Class R5) | PDJHX | 74445D331 | ||||||||
| Prudential Day One Income Fund (Share Class R6) | PDAJX | 74445D604 | Prudential Day One 2030 Fund (Share Class R6) | PDFJX | 74445D588 | Prudential Day One 2050 Fund (Share Class R6) | PDJJX | 74445D323 | ||||||||
| Prudential Day One 2015 Fund (Share Class R1) | PDCDX | 74445D844 | Prudential Day One 2035 Fund (Share Class R1) | PDGCX | 74445D570 | Prudential Day One 2055 Fund (Share Class R1) | PDKDX | 74445D315 | ||||||||
| Prudential Day One 2015 Fund (Share Class R2) | PDCEX | 74445D836 | Prudential Day One 2035 Fund (Share Class R2) | PDGEX | 74445D562 | Prudential Day One 2055 Fund (Share Class R2) | PDKEX | 74445D299 | ||||||||
| Prudential Day One 2015 Fund (Share Class R3) | PDCFX | 74445D828 | Prudential Day One 2035 Fund (Share Class R3) | PDGFX | 74445D554 | Prudential Day One 2055 Fund (Share Class R3) | PDKFX | 74445D281 | ||||||||
| Prudential Day One 2015 Fund (Share Class R4) | PDCGX | 74445D810 | Prudential Day One 2035 Fund (Share Class R4) | PDGGX | 74445D547 | Prudential Day One 2055 Fund (Share Class R4) | PDKGX | 74445D273 | ||||||||
| Prudential Day One 2015 Fund (Share Class R5) | PDCHX | 74445D794 | Prudential Day One 2035 Fund (Share Class R5) | PDGHX | 74445D539 | Prudential Day One 2055 Fund (Share Class R5) | PDKHX | 74445D265 | ||||||||
| Prudential Day One 2015 Fund (Share Class R6) | PDCJX | 74445D786 | Prudential Day One 2035 Fund (Share Class R6) | PDGJX | 74445D521 | Prudential Day One 2055 Fund (Share Class R6) | PDKJX | 74445D257 | ||||||||
| Prudential Day One 2020 Fund (Share Class R1) | PDDDX | 74445D778 | Prudential Day One 2040 Fund (Share Class R1) | PDHDX | 74445D513 | Prudential Day One 2060 Fund (Share Class R1) | PDLDX | 74445D240 | ||||||||
| Prudential Day One 2020 Fund (Share Class R2) | PDDEX | 74445D760 | Prudential Day One 2040 Fund (Share Class R2) | PDHEX | 74445D497 | Prudential Day One 2060 Fund (Share Class R2) | PDLEX | 74445D232 | ||||||||
| Prudential Day One 2020 Fund (Share Class R3) | PDDFX | 74445D752 | Prudential Day One 2040 Fund (Share Class R3) | PDHFX | 74445D489 | Prudential Day One 2060 Fund (Share Class R3) | PDLFX | 74445D224 | ||||||||
| Prudential Day One 2020 Fund (Share Class R4) | PDDGX | 74445D745 | Prudential Day One 2040 Fund (Share Class R4) | PDHGX | 74445D471 | Prudential Day One 2060 Fund (Share Class R4) | PDLGX | 74445D216 | ||||||||
| Prudential Day One 2020 Fund (Share Class R5) | PDDHX | 74445D737 | Prudential Day One 2040 Fund (Share Class R5) | PDHHX | 74445D463 | Prudential Day One 2060 Fund (Share Class R5) | PDLHX | 74445D190 | ||||||||
| Prudential Day One 2020 Fund (Share Class R6) | PDDJX | 74445D729 | Prudential Day One 2040 Fund (Share Class R6) | PDHJX | 74445D455 | Prudential Day One 2060 Fund (Share Class R6) | PDLJX | 74445D182 | ||||||||
| Prudential Day One 2025 Fund (Share Class R1) | PDEDX | 74445D711 | Prudential Day One 2045 Fund (Share Class R1) | PDIDX | 74445D448 | Prudential Day One 2065 Fund (Share Class R1) | PDOAX | 74440V674 | ||||||||
| Prudential Day One 2025 Fund (Share Class R2) | PDEEX | 74445D695 | Prudential Day One 2045 Fund (Share Class R2) | PDIEX | 74445D430 | Prudential Day One 2065 Fund (Share Class R2) | PDODX | 74440V666 | ||||||||
| Prudential Day One 2025 Fund (Share Class R3) | PDEFX | 74445D687 | Prudential Day One 2045 Fund (Share Class R3) | PDIKX | 74445D422 | Prudential Day One 2065 Fund (Share Class R3) | PDOEX | 74440V658 | ||||||||
| Prudential Day One 2025 Fund (Share Class R4) | PDEGX | 74445D679 | Prudential Day One 2045 Fund (Share Class R4) | PDIGX | 74445D414 | Prudential Day One 2065 Fund (Share Class R4) | PDOFX | 74440V641 | ||||||||
| Prudential Day One 2025 Fund (Share Class R5) | PDEHX | 74445D661 | Prudential Day One 2045 Fund (Share Class R5) | PDIHX | 74445D398 | Prudential Day One 2065 Fund (Share Class R5) | PDOGX | 74440V633 | ||||||||
| Prudential Day One 2025 Fund (Share Class R6) | PDEJX | 74445D653 | Prudential Day One 2045 Fund (Share Class R6) | PDIJX | 74445D380 | Prudential Day One 2065 Fund (Share Class R6) | PDOHX | 74440V625 | ||||||||
MF236E
Item 2 – Code of Ethics — See Exhibit (a)
As of the end of the period covered by this report, the registrant has adopted a code of ethics (the “Section 406 Standards for Investment Companies – Ethical Standards for Principal Executive and Financial Officers”) that applies to the registrant’s Principal Executive Officer and Principal Financial Officer; the registrant’s Principal Financial Officer also serves as the Principal Accounting Officer.
The registrant hereby undertakes to provide any person, without charge, upon request, a copy of the code of ethics. To request a copy of the code of ethics, contact the registrant 800-225-1852, and ask for a copy of the Section 406 Standards for Investment Companies - Ethical Standards for Principal Executive and Financial Officers.
Item 3 – Audit Committee Financial Expert –
The registrant’s Board has determined that Ms. Grace C. Torres, member of the Board’s Audit Committee is an “audit committee financial expert,” and that she is “independent,” for purposes of this item.
Item 4 – Principal Accountant Fees and Services –
(a) Audit Fees
For the fiscal years ended July 31, 2022 and July 31, 2021, PricewaterhouseCoopers LLP (“PwC”), the Registrant’s principal accountant, billed the Registrant $278,100 and $278,100, respectively, for professional services rendered for the audit of the Registrant’s annual financial statements or services that are normally provided in connection with statutory and regulatory filings.
(b) Audit-Related Fees
For the fiscal years ended July 31, 2022 and July 31, 2021, PwC did not bill the Registrant for audit-related services.
For the fiscal years ended July 31, 2022 and July 31, 2021, fees of $0 and $12,873 were billed to the Registrant for services rendered by KPMG LLP (the Registrant’s prior principal accountant) in connection with the auditor transition.
(c) Tax Fees
For the fiscal years ended July 31, 2022 and July 31, 2021: none.
(d) All Other Fees
For the fiscal years ended July 31, 2022 and July 31, 2021: none.
(e) (1) Audit Committee Pre-Approval Policies and Procedures
THE PGIM MUTUAL FUNDS
AUDIT COMMITTEE POLICY
on
Pre-Approval of Services Provided by the Independent
Accountants
The Audit Committee of each PGIM Mutual Fund is charged with the responsibility to monitor the independence of the Fund’s independent accountants. As part of this responsibility, the Audit Committee must pre-approve the independent accounting firm’s engagement to render audit and/or permissible non-audit services, as required by law. In evaluating a proposed engagement of the independent accountants, the Audit Committee will assess the effect that the engagement might reasonably be expected to have on the accountant’s independence. The Committee’s evaluation will be based on:
| • | a review of the nature of the professional services expected to be provided, |
| • | a review of the safeguards put into place by the accounting firm to safeguard independence, and |
| • | periodic meetings with the accounting firm. |
Policy for Audit and Non-Audit Services Provided to the Funds
On an annual basis, the scope of audits for each Fund, audit fees and expenses, and audit-related and non-audit services (and fees proposed in respect thereof) proposed to be performed by the Fund’s independent accountants will be presented by the Treasurer and the independent accountants to the Audit Committee for review and, as appropriate, approval prior to the initiation of such services.
Such presentation shall be accompanied by confirmation by both the Treasurer and the independent accountants that the proposed
non-audit services will not adversely affect the independence of the independent accountants. Such proposed non-audit services shall be described in sufficient detail to enable the Audit Committee to assess the appropriateness of such services and fees, and the compatibility of the provision of such services with the auditor’s independence. The Committee shall receive periodic reports on the progress of the audit and other services which are approved by the Committee or by the Committee Chair pursuant to authority delegated in this Policy.
The categories of services enumerated under “Audit Services”, “Audit-related Services”, and “Tax Services” are intended to provide guidance to the Treasurer and the independent accountants as to those categories of services which the Committee believes are generally consistent with the independence of the independent accountants and which the Committee (or the Committee Chair) would expect upon the presentation of specific proposals to pre-approve. The enumerated categories are not intended as an exclusive list of audit, audit-related or tax services, which the Committee (or the Committee Chair) would consider for pre-approval.
Audit Services
The following categories of audit services are considered to be consistent with the role of the Fund’s independent accountants:
| • | Annual Fund financial statement audits |
| • | Seed audits (related to new product filings, as required) |
| • | SEC and regulatory filings and consents |
Audit-related Services
The following categories of audit-related services are considered to be consistent with the role of the Fund’s independent accountants:
| • | Accounting consultations |
| • | Fund merger support services |
| • | Agreed Upon Procedure Reports |
| • | Attestation Reports |
| • | Other Internal Control Reports |
Individual audit-related services that fall within one of these categories (except for fund merger support services) and are not presented to the Audit Committee as part of the annual pre-approval process are subject to an authorized pre-approval by the
Audit Committee so long as the estimated fee for those services does not exceed $30,000. Any services provided under such pre-approval will be reported to the Audit Committee at its next regular meeting. Should the amount of such services exceed $30,000 any additional fees will be subject to pre-approval by the Committee Chair (or any other Committee member on whom this responsibility has been delegated). Fees related to fund merger support services are subject to a separate authorized pre-approval by the Audit Committee with fees determined on a per occurrence and merger complexity basis.
Tax Services
The following categories of tax services are considered to be consistent with the role of the Fund’s independent accountants:
| • | Tax compliance services related to the filing or amendment of the following: |
| • | Federal, state and local income tax compliance; and, |
| • | Sales and use tax compliance |
| • | Timely RIC qualification reviews |
| • | Tax distribution analysis and planning |
| • | Tax authority examination services |
| • | Tax appeals support services |
| • | Accounting methods studies |
| • | Fund merger support services |
| • | Tax consulting services and related projects |
Individual tax services that fall within one of these categories and are not presented to the Audit Committee as part of the annual pre-approval process are subject to an authorized pre-approval by the Audit Committee so long as the estimated fee for those services does not exceed $30,000. Any services provided under such pre-approval will be reported to the Audit Committee at its next regular meeting. Should the amount of such services exceed $30,000 any additional fees will be subject to pre-approval by the Committee Chair (or any other Committee member on whom this responsibility has been delegated).
Other Non-Audit Services
Certain non-audit services that the independent accountants are legally permitted to render will be subject to pre-approval by the Committee or by one or more Committee members to whom the Committee has delegated this authority and who will report to the full Committee any pre-approval decisions made pursuant to this Policy. Non-audit services presented for pre-approval pursuant to this paragraph will be accompanied by a confirmation from both the Treasurer and the independent accountants that the proposed services will not adversely affect the independence of the independent accountants.
Proscribed Services
The Fund’s independent accountants will not render services in the following categories of non-audit services:
| • | Bookkeeping or other services related to the accounting records or financial statements of the Fund |
| • | Financial information systems design and implementation |
| • | Appraisal or valuation services, fairness opinions, or contribution-in-kind reports |
| • | Actuarial services |
| • | Internal audit outsourcing services |
| • | Management functions or human resources |
| • | Broker or dealer, investment adviser, or investment banking services |
| • | Legal services and expert services unrelated to the audit |
| • | Any other service that the Public Company Accounting Oversight Board determines, by regulation, is impermissible. |
Pre-approval of Non-Audit Services Provided to Other Entities Within the PGIM Fund Complex
Certain non-audit services provided to PGIM Investments LLC or any of its affiliates that also provide ongoing services to the PGIM Mutual Funds will be subject to pre-approval by the Audit Committee. The only non-audit services provided to these entities that will require pre-approval are those related directly to the operations and financial reporting of the Funds. Individual projects that are not presented to the Audit Committee as part of the annual pre-approval process will be subject to pre-approval by the Committee Chair (or any other Committee member on whom this responsibility has been delegated) so long as the estimated fee for those services does not exceed $30,000. Services presented for pre-approval pursuant to this paragraph will be accompanied by a confirmation from both the Treasurer and the independent accountants that the proposed services will not adversely affect the independence of the independent accountants.
Although the Audit Committee will not pre-approve all services provided to PGIM Investments LLC and its affiliates, the Committee will receive an annual report from the Fund’s independent accounting firm showing the aggregate fees for all services provided to PGIM Investments and its affiliates.
(e) (2) Percentage of services described in each of paragraphs (b) through (d) of this Item that were approved by the audit committee pursuant to paragraph (c)(7)(i)(C) of Rule 2-01 of Regulation S-X –
Fiscal Year Ended July 31, 2022 | Fiscal Year Ended July 31, 2021 | |||||||
| 4(b) | Not applicable. | 0% | ||||||
| 4(c) | Not applicable. | Not applicable. | ||||||
| 4(d) | Not applicable. | Not applicable. | ||||||
(f) Percentage of hours expended attributable to work performed by other than full time employees of principal accountant if greater than 50%.
The percentage of hours expended on the principal accountant’s engagement to audit the registrant’s financial statements for the most recent fiscal year that were attributed to work performed by persons other than the principal accountant’s full-time, permanent employees was 0%.
(g) Non-Audit Fees
The aggregate non-audit fees billed by the Registrant’s principal accountant for services rendered to the registrant’s investment adviser and any entity controlling, controlled by, or under common control with the investment adviser that provides ongoing services to the registrant for the fiscal years ended July 31, 2022 and July 31, 2021 was $0 and $0, respectively.
(h) Principal Accountant’s Independence
Not applicable as the Registrant’s principal accountant has not provided non-audit services to the registrant’s investment adviser and any entity controlling, controlled by, or under common control with the investment adviser that provides ongoing services to the registrant that were not pre-approved pursuant to Rule 2-01(c)(7)(ii) of Regulation S-X.
(i) Not applicable.
(j) Not applicable.
Item 5 – Audit Committee of Listed Registrants – Not applicable.
Item 6 – Schedule of Investments – The schedule is included as part of the report to shareholders filed under Item 1 of this Form.
Item 7 – Disclosure of Proxy Voting Policies and Procedures for Closed-End Management Investment Companies – Not applicable.
Item 8 – Portfolio Managers of Closed-End Management Investment Companies – Not applicable.
| Item 9 – | Purchases of Equity Securities by Closed-End Management Investment Company and Affiliated Purchasers – Not applicable. |
Item 10 – Submission of Matters to a Vote of Security Holders – There have been no material changes to these procedures.
Item 11 – Controls and Procedures
| (a) | It is the conclusion of the registrant’s principal executive officer and principal financial officer that the effectiveness of the registrant’s current disclosure controls and procedures (such disclosure controls and procedures having been evaluated within 90 days of the date of this filing) provide reasonable assurance that the information required to be disclosed by the registrant has been recorded, processed, summarized and reported within the time period specified in the Commission’s rules and forms and that the information required to be disclosed by the registrant has been accumulated and communicated to the registrant’s principal executive officer and principal financial officer in order to allow timely decisions regarding required disclosure. |
| (b) | There has been no significant change in the registrant’s internal control over financial reporting (as defined in Rule 30a-3(d) under the Act (17 CFR 270.30a-3(d)) that occurred during the period covered by this report that has materially affected, or is reasonably likely to materially affect, the registrant’s internal control over financial reporting. |
Item 12 – Controls and Procedures - Disclosure of Securities Lending Activities for Closed-End Management Investment Companies – Not applicable.
Item 13 – Exhibits
| (a) | (1) Code of Ethics – Attached hereto as Exhibit EX-99.CODE-ETH. |
| (2) |
| (3) | Any written solicitation to purchase securities under Rule 23c-1 – Not applicable. |
| (b) |
SIGNATURES
Pursuant to the requirements of the Securities Exchange Act of 1934 and the Investment Company Act of 1940, the registrant has duly caused this report to be signed on its behalf by the undersigned, thereunto duly authorized.
| Registrant: | Prudential Investment Portfolios 5 | |
| By: | /s/ Andrew R. French | |
| Andrew R. French | ||
Secretary | ||
Date: | September 19, 2022 | |
Pursuant to the requirements of the Securities Exchange Act of 1934 and the Investment Company Act of 1940, this report has been signed below by the following persons on behalf of the registrant and in the capacities and on the dates indicated.
By: | /s/ Stuart S. Parker | |
Stuart S. Parker | ||
President and Principal Executive Officer | ||
Date: | September 19, 2022 | |
By: | /s/ Christian J. Kelly | |
Christian J. Kelly | ||
Treasurer and Principal Financial and Accounting Officer | ||
Date: | September 19, 2022 | |