UNITED STATES
SECURITIES AND EXCHANGE COMMISSION
Washington, D.C. 20549
FORM N-CSR
CERTIFIED SHAREHOLDER REPORT OF REGISTERED
MANAGEMENT INVESTMENT COMPANIES
Investment Company Act file number 811-09447
Jacob Funds Inc.
(Exact name of registrant as specified in charter)
C/O Jacob Asset Management of New York LLC
727 2nd Street #106
Hermosa Beach, CA 90254
(Address of principal executive offices) (Zip code)
Ryan Jacob
C/O Jacob Asset Management of New York LLC
727 2nd Street #106
Hermosa Beach, CA 90254
(Name and address of agent for service)
(424) 237-2164
Registrant's telephone number, including area code
Date of fiscal year end: August 31
Date of reporting period: February 28, 2022
Item 1. Reports to Stockholders.
Jacob Internet Fund
Jacob Small Cap Growth Fund
Jacob Discovery Fund
Jacob Forward ETF
Semi-Annual Report
February 28, 2022
The Jacob Internet Fund, Jacob Small Cap Growth Fund and
Jacob Discovery Fund are mutual funds with the primary investment
objective of long-term growth of capital. The Jacob Forward ETF
is an exchange traded fund with the primary investment objective
of long-term growth of capital.
The Jacob Internet Fund has current income as a secondary objective.
Investment Adviser
Jacob Asset Management of New York LLC
TABLE OF CONTENTS
| | | |
| Letter From the Manager | | | 1 |
| Industry Breakdowns | | | 4 |
| Schedules of Investments | | | 8 |
| Statements of Assets and Liabilities | | | 21 |
| Statements of Operations | | | 23 |
| Statements of Changes in Net Assets | | | 25 |
| Financial Highlights | | | 29 |
| Notes to the Financial Statements | | | 36 |
| Additional Information on Fund Expenses | | | 53 |
| Additional Information | | | 56 |
| | | | |
Dear Fellow Investors,
While the start of the new fiscal period was encouraging, with declining COVID cases providing optimism that the economic rebound would continue, the emergence of Omicron coupled with a more hawkish Fed led to an inauspicious start to 2022. As the markets adjusted to rising inflation and the prospect of higher interest rates, geopolitical issues then moved to the forefront with Russia’s invasion of Ukraine. This tragic development added to the tremendous amount of uncertainty and volatility that were already in the many markets. While we share these legitimate concerns and worry about whether the Fed will be able to put the inflation genie back in the bottle, we remain encouraged by current business and consumer spending. Hopefully, the markets will be able to overcome a modest rise in interest rates, which arguably might be helpful in cooling any remaining speculative embers and providing some balance to the U.S. economy as it continues to deal with stressed supply chains and an unusually robust job market.
As for the Funds, the fiscal period has been very challenging, but we’re confident that the underperformance versus our benchmarks has been mainly the result of macro conditions rather than fundamental issues with our holdings. While we do expect this higher-than-usual volatility to continue, we still are aggressively shifting away from larger, more value-oriented holdings into select smaller growth opportunities that have had extreme declines as investors greatly reduced their risk exposure. While the risk-off pendulum may swing from one extreme to the other before settling down, we believe that ultimately higher stock prices will prove to be justified for those companies able to deliver strong revenue growth and earnings leverage. Hopefully, in the not-too-distant future, many of these broader global concerns will subside – including a peaceful resolution to the Ukrainian conflict – and we will see a return to valuations that better reflect a more optimistic economic outlook.
Jacob Internet Fund
The Jacob Internet Fund was down 25.35% for the fiscal period ended February 28, 2022, while the NASDAQ Composite Index declined 9.60%. The more significant declines in technology stocks as the market weakened had the greatest impact on our negative performance versus our benchmarks and peers.
The two worst-performing names in the period were relatively small positions, WM Technology and Porch Group, each down 58% and 60% respectively. WM Technology has struggled alongside most cannabis-related names as stalled progress with federal legalization and a thriving illicit market impacts the industry. We see brighter days ahead as more states come online and the industry continues to consolidate. Porch Group has been the subject of a few short reports questioning its model and business practices, which we believe are unfounded, and are still comfortable that they are still executing their strategy to offer valuable home-related services to consumers in a still-robust real estate market. Long-time and larger holdings, such as Twilio and Block (formerly Square), were also down over 50% in the period. These declines were not due to any business or execution issues, but rather a reduction in valuations among higher-priced tech companies that has been widespread since last year.
Bright spots in the fiscal period included a trio of chip companies – Transphorm, Identiv and Impinj – that managed to post positive returns of 66%, 18% and 17%, respectively. All three companies serve exciting fast-growing chip markets such as fast charging adapters and RFID readers and tags that are becoming ubiquitous in many different sectors. Given the rampant supply chain issues among hardware companies, our holdings have skillfully managed the challenges and continue to deliver impressive results. A final standout in the fiscal period was Silvergate Capital, up more than 13%. Even with a turbulent market for cryptocurrencies, Silvergate Capital continues to benefit from its leading exchange network (SEN) and the increasing needs of institutions to transact in this 24/7 market. Additionally, Silvergate Capital recently purchased the Diem assets from Facebook in order to accelerate their entry into stablecoins, which is one of the fastest growing areas of digital currencies.
Jacob Small Cap Growth Fund
The Jacob Small Cap Growth Fund was down 29.22% through February 28, 2022 while the Russell 2000 Growth Index declined 16.35%. As with Jacob Internet Fund, there were only a few holdings that managed positive returns in the period. Most of our worst-performing holdings were in the healthcare sector, which due to their more speculative characteristics fared poorly as recent market declines deepened.
Thankfully, many of the Fund’s holdings that most negatively affected our performance were lighter weighted healthcare names. Our worst-performing name, DermTech, has had a heavy lift in convincing dermatologists to consider using their new genetic adhesive stickers as part of their practices, leading to a near 66% drop in the period. While taking longer than we expected, we still believe that clearer reimbursement coverage and easy applicability should lead to broader adoption over time. DraftKings, down over 60% in the period, was negatively affected by increasing promotional spending in order to acquire customers in new markets, with the heaviest activity in New York. Because of the high expected lifetime value of these accounts, we believe these short-term expenditures will prove wise as gaining early scale in these markets is so critical for success. As in Jacob Internet Fund, WM Technology rounded out the weakest performers in the fiscal period.
Besides Impinj and Silvergate Capital being top holdings in this fund, there were only two additional names that were positive in the fiscal period. Inspired Entertainment was a standout, up over 13% in the period, as they continue to benefit from a post-Covid
recovery in in-person gaming in Great Britain, their largest market. Additionally, Inspired Entertainment has continue to expand their virtual game offerings around the world, including the U.S., and made a recent acquisition in iLottery that will help them grow their share in the market as well. Krystal Biotech, up over 9% in the period, benefited from positive results in a final clinical trial for Dystrophic Epidermolysis Bullosa (DEB), a rare skin disease. With approval likely before the end of the year, and promising studies for additional aesthetic uses, this redosable gene therapy has potential in many more indications.
Jacob Discovery Fund
The Jacob Discovery Fund was down 24.83% for the fiscal period ended February 28, 2022, while the Russell Microcap Growth Index declined 25.11%.
While we will never be pleased with negative returns, we are encouraged that we were able to keep up with the broader benchmark given that the Discovery Fund is one of the smallest – if not the smallest – institutional growth-oriented funds available for purchase in terms of the average market cap size of its portfolio holdings. The past six months have not provided a favorable investment backdrop for small growth holdings, to say the least, and as a rule, the smaller you were, the harder your stock was hit (notice the 25% drop in the Russell Microcap Growth Index vs. the 16% drop in the broader Russell 2000 Growth Index).
Microcap biotech and healthcare names may have been the hardest hit of all, and it’s not a surprise that some of our weakest names, including four of our five worst-performing, were in this area: Precision BioSciences, DermTech, NeuBase Therapeutics, and iCAD, down 66%, 66%, 63% and 60%, respectively. These are all very different companies at different stages of development, but like most microcap biotech and healthcare names, all of them are still burning cash and unprofitable, which is a problem in the current risk-off market. Except for iCAD, which we are trimming due to uncertainty about its technology leadership and end markets, we still have confidence in the science and long-term prospects for these names and are generally holding onto our small positions in each. While we believe the extreme weakness in many of our names will lead to higher returns in the future, we have continued to reduce exposure to names that are likely to require fresh financings in the next six to twelve months.
It wasn’t all negative for the Fund during the fiscal period. Our best-performing name was a recruiting firm called Hudson Global up 74%, which benefited from strong leadership, smart acquisitions and a very healthy labor market in which finding talent was a big challenge – if not the biggest – facing corporations throughout the global economy. Although when we first invested in Hudson Global, the stock was trading at a negative enterprise value, the company still trades at a reasonable multiple given solid growth prospects. Another strong performer for the fund was First Internet Bancorp, up 64%. Rising interest rates and a healthy, post-Covid economy have been big plusses for the rather conservatively run online banker, but a fuller valuation and a yield curve that is now on the brink of inverting means we have been trimming the name.
We continue to focus our resources on the names in the portfolio we trust the most, ones that enjoy long-term secular tailwinds and/or impressive proprietary technology that give them the best likelihood of growing through a likely choppy environment. And we will continue to do our best to try and find interesting and underappreciated growth opportunities that are being overlooked by much of traditional institutional Wall Street.
Jacob Forward ETF
The Jacob Forward ETF’s net asset value was down 31.31% and its market price was down 31.24% for the fiscal period ended February 28, 2022 while the S&P 500 Index declined 2.62%. Not surprisingly, a large cap index like the S&P 500 held up much better during the recent market decline, and benefits from being diversified across many disparate sectors.
As the Jacob Forward ETF combines and incorporates many of the same top holdings as our other three strategies, the best and worst performing positions were very similar to the abovementioned holdings. DraftKings, Porch Group and WM Technology had the biggest declines in the period, down 60%, 60% and 58%, respectively. Impinj, Silvergate Capital and Krystal Biotech were the only holdings with positive returns in the period, up 18%, 13% and 10% respectively. Please refer to the abovementioned commentary for a more detailed explanation on each.
As always, we believe that staying true to our investment philosophy and process is still key to obtaining the best possible long-term investment performance for our shareholders. Thank you again for your continued confidence and trust.
Ryan Jacob
Chairman and Chief Investment Officer
Portfolio Manager
Frank Alexander
Portfolio Manager
Darren Chervitz
Portfolio Manager
Past performance is not a guarantee of future results.
Performance data reflects fee waivers and in the absence of these waivers performance would be reduced.
Diversification does not assure a profit or protect against a loss in a declining market.
Must be accompanied or preceded by a prospectus.
The opinions expressed above are those of the portfolio manager and are subject to change at any time. Forecasts cannot be guaranteed and should not be considered investment advice.
Mutual fund investing involves risk; loss of principal is possible. The Funds invest in foreign securities which involve greater volatility and political, economic and currency risks and differences in accounting methods. These risks are greater in emerging markets. Growth stocks typically are more volatile than value stocks; however, value stocks have a lower expected growth rate in earnings and sales. There are more specific risks inherent in investing in the internet area, particularly with respect to smaller capitalized companies and the high volatility of internet stocks. The Funds can invest in small-and mid-cap securities which involve additional risks such as limited liquidity and greater volatility. Investments in micro capitalization companies may involve greater risks, as these companies tend to have limited product lines, markets and financial or managerial resources. Micro cap stocks often also have a more limited trading market, such that the Adviser may not be able to sell stocks at an optimal time or price. In addition, less frequently-traded securities may be subject to more abrupt price movements than securities of larger capitalized companies. Investments in debt securities typically decrease in value when interest rates rise. This risk is usually greater for longer term debt securities.
Fund holdings are subject to change and should not be construed as a recommendation to buy or sell any security. Current and future portfolio holdings are subject to risk.
Please refer to the schedules of investments for complete Fund holdings information.
The NASDAQ Composite Index is a market capitalization weighted index that is designed to represent performance of the National Market System which includes over 5,000 stocks traded only over-the-counter and not on an exchange. The Russell 2000 Growth Index measures the performance of the small cap growth segment of the U.S. equity universe. It includes those Russell 2000 companies with higher price-to-book ratios and higher forecasted growth values. The Russell Microcap Growth Index measures the performance of the microcap growth segment of the U.S. equity market. It includes Russell Microcap companies that are considered more growth oriented relative to the overall market as defined by Russell’s leading style methodology. The Russell Microcap Growth Index is constructed to provide a comprehensive and unbiased barometer for the microcap growth segment of the market. The S&P 500 Index is a broad based unmanaged index of 500 stocks, which is widely recognized as representative of the equity market in general. It is not possible to invest directly in an index.
The Funds are distributed by Quasar Distributors, LLC.
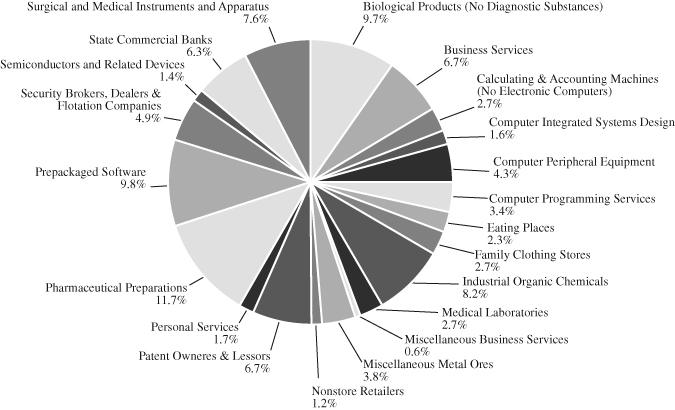
JACOB INTERNET FUND
INDUSTRY BREAKDOWN AS OF FEBRUARY 28, 2022
(as a percentage of total investments)
(Unaudited)
JACOB SMALL CAP GROWTH FUND
INDUSTRY BREAKDOWN AS OF FEBRUARY 28, 2022
(as a percentage of total investments)
(Unaudited)
JACOB DISCOVERY FUND
INDUSTRY BREAKDOWN AS OF FEBRUARY 28, 2022
(as a percentage of total investments)
(Unaudited)
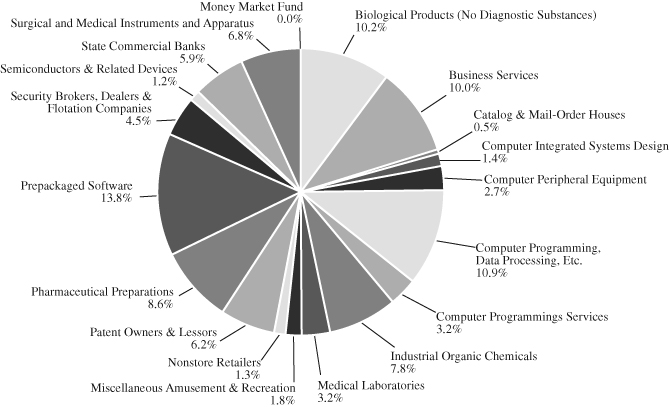
JACOB FORWARD ETF
INDUSTRY BREAKDOWN AS OF FEBRUARY 28, 2022
(as a percentage of total investments)
(Unaudited)
JACOB INTERNET FUND
SCHEDULE OF INVESTMENTS(+)
February 28, 2022 (Unaudited)
| Shares | | | | | | | | | | Value | |
| | | COMMON STOCKS | | | | | | 100.0% |
| | | |
| | | Business Services | | | 14.7 | % | | | | | | | |
| | 605,000 | | comScore, Inc.* | | | | | | | | | | $ | 1,585,100 | |
| | 195,175 | | OptimizeRx Corp.* | | | | | | | | | | | 8,839,476 | |
| | 93,675 | | Zillow Group, Inc.—Class C* | | | | | | | | | | | 5,388,186 | |
| | | | | | | | | | | | | | | 15,812,762 | |
| | | | Calculating & Accounting | | | | | | | | | | | | |
| | | | Machines (No Electronic Computers) | | | 2.7 | % | | | | | | | | |
| | 373,000 | | Cantaloupe, Inc.* | | | | | | | | | | | 2,898,210 | |
| | | | Catalog & Mail-Order Houses | | | 0.5 | % | | | | | | | | |
| | 4,800 | | Alibaba Group Holding Ltd.—ADR*^ | | | | | | | | | | | 504,912 | |
| | | | Communications Equipment | | | 1.4 | % | | | | | | | | |
| | 430,740 | | Powerfleet, Inc.* | | | | | | | | | | | 1,537,742 | |
| | | | Computer Communications Equipment | | | 3.8 | % | | | | | | | | |
| | 594,600 | | Lantronix, Inc.* | | | | | | | | | | | 4,084,902 | |
| | | | Computer Integrated Systems Design | | | 1.7 | % | | | | | | | | |
| | 162,500 | | Telos Corp.* | | | | | | | | | | | 1,855,750 | |
| | | | Computer Peripheral Equipment | | | 8.8 | % | | | | | | | | |
| | 229,726 | | Identiv, Inc.* | | | | | | | | | | | 4,815,057 | |
| | 282,911 | | Immersion Corp.* | | | | | | | | | | | 1,505,086 | |
| | 45,800 | | Impinj, Inc.* | | | | | | | | | | | 3,148,750 | |
| | | | | | | | | | | | | | | 9,468,893 | |
| | | | Computer Programming Services | | | 3.5 | % | | | | | | | | |
| | 62,000 | | Doximity, Inc.—Class A* | | | | | | | | | | | 3,803,700 | |
| | | | Computer Programing, Data Processing, Etc. | | | 12.9 | % | | | | | | | | |
| | 380 | | Alphabet, Inc.—Class C* | | | | | | | | | | | 1,025,172 | |
| | 15,800 | | MongoDB, Inc.* | | | | | | | | | | | 6,035,442 | |
| | 13,400 | | Tencent Holdings Ltd. (HKD)(a) | | | | | | | | | | | 723,082 | |
| | 171,317 | | Twitter, Inc.* | | | | | | | | | | | 6,090,319 | |
| | | | | | | | | | | | | | | 13,874,015 | |
| | | | Electric Services | | | 1.7 | % | | | | | | | | |
| | 252,817 | | Transphorm, Inc.* | | | | | | | | | | | 1,832,923 | |
| | | | Miscellaneous Amusement & Recreation | | | 2.3 | % | | | | | | | | |
| | 102,000 | | DraftKings, Inc.—Class A* | | | | | | | | | | | 2,415,360 | |
| | | | Nonstore Retailers | | | 1.3 | % | | | | | | | | |
| | 240,000 | | Rover Group, Inc.* | | | | | | | | | | | 1,370,400 | |
The accompanying notes are an integral part of these financial statements.
JACOB INTERNET FUND
SCHEDULE OF INVESTMENTS(+) (Continued)
February 28, 2022 (Unaudited)
| Shares | | | | | | | | | | Value | |
| | | COMMON STOCKS—(Continued) | | | | | | 100.0% |
| | | |
| | | Patent Owners & Lessors | | | 7.5 | % | | | | | | | |
| | 165,496 | | Digital Turbine, Inc.* | | | | | | | | | | $ | 8,023,246 | |
| | | | Personal Services | | | 1.7 | % | | | | | | | | |
| | 54,400 | | Yelp, Inc.* | | | | | | | | | | | 1,843,616 | |
| | | | Pharmaceutical Preparations | | | 1.5 | % | | | | | | | | |
| | 122,000 | | Galaxy Digital Holdings Ltd.* | | | | | | | | | | | 1,586,000 | |
| | | | Prepackaged Software | | | 19.5 | % | | | | | | | | |
| | 36,300 | | Block, Inc.* | | | | | | | | | | | 4,628,250 | |
| | 10,000 | | Cloudflare, Inc.—Class A* | | | | | | | | | | | 1,164,200 | |
| | 408,000 | | Cvent Holding Corp.* | | | | | | | | | | | 3,284,400 | |
| | 290,543 | | Inspired Entertainment, Inc.* | | | | | | | | | | | 4,186,725 | |
| | 228,400 | | Porch Group, Inc.* | | | | | | | | | | | 1,850,040 | |
| | 24,200 | | Twilio, Inc.—Class A* | | | | | | | | | | | 4,230,160 | |
| | 279,300 | | WM Technology, Inc.* | | | | | | | | | | | 1,633,905 | |
| | | | | | | | | | | | | | | 20,977,680 | |
| | | | Real Estate | | | 0.3 | % | | | | | | | | |
| | 584,681 | | Leju Holdings Ltd.—ADR*^ | | | | | | | | | | | 344,786 | |
| | | | Retail Stores | | | 0.0 | % | | | | | | | | |
| | 638 | | JD.com, Inc.—Class A (HKD)*(a) | | | | | | | | | | | 22,792 | |
| | | | Security Brokers, Dealers & Flotation Companies | | | 5.6 | % | | | | | | | | |
| | 760,000 | | Voyager Digital Ltd.* | | | | | | | | | | | 5,996,400 | |
| | | | Semiconductors and Related Devices | | | 1.4 | % | | | | | | | | |
| | 36,300 | | CEVA, Inc.* | | | | | | | | | | | 1,479,951 | |
| | | | State Commercial Banks | | | 7.2 | % | | | | | | | | |
| | 60,325 | | Silvergate Capital Corp.—Class A* | | | | | | | | | | | 7,726,426 | |
| | | | TOTAL COMMON STOCKS (Cost $81,074,768) | | | | | | | | | | | 107,460,466 | |
The accompanying notes are an integral part of these financial statements.
JACOB INTERNET FUND
SCHEDULE OF INVESTMENTS(+) (Continued)
February 28, 2022 (Unaudited)
| Shares | | | | | | | Value | |
| | | MONEY MARKET FUND | | | 0.0% |
| | | |
| | 42,184 | | First American Government Obligations Fund—Class X, 0.03%(b) | | | | | | $ | 42,184 | |
| | | | TOTAL MONEY MARKET FUND (Cost $42,184) | | | | | | | 42,184 | |
| | | | TOTAL INVESTMENTS (Cost $81,116,952)—100.0% | | | | | | | 107,502,650 | |
| | | | LIABILITIES IN EXCESS OF OTHER ASSETS—0.0% | | | | | | | (19,058 | ) |
| | | | TOTAL NET ASSETS—100.0% | | | | | | $ | 107,483,592 | |
| (+) | Schedule of Investments is classified using the U.S. Securities and Exchange Commission’s Standard Industrial Classification (SIC) Code List. |
| * | Non Income Producing. |
| ^ | U.S. Dollar-denominated foreign security. |
| ADR | American Depositary Receipt. |
| (HKD) | Security denominated in Hong Kong dollars. Value translated into U.S. dollars. |
| (a) | Level 2 Security. |
| (b) | 7-day yield. |
The accompanying notes are an integral part of these financial statements.
JACOB SMALL CAP GROWTH FUND
SCHEDULE OF INVESTMENTS(+)
February 28, 2022 (Unaudited)
| Shares | | | | | | | | | | Value | |
| | | COMMON STOCKS | | | | | | 100.0% |
| | | |
| | | Biological Products (No Diagnostic Substances) | | | 9.7 | % | | | | | | | |
| | 45,121 | | Aerie Pharmaceuticals, Inc.* | | | | | | | | | | $ | 374,504 | |
| | 2,000 | | Beam Therapeutics, Inc.* | | | | | | | | | | | 156,700 | |
| | 2,000 | | CRISPR Therapeutics AG*^ | | | | | | | | | | | 122,740 | |
| | 7,402 | | Krystal Biotech, Inc.* | | | | | | | | | | | 470,397 | |
| | 28,712 | | Precision BioSciences, Inc.* | | | | | | | | | | | 122,026 | |
| | 2,300 | | Twist Bioscience Corp.* | | | | | | | | | | | 128,662 | |
| | | | | | | | | | | | | | | 1,375,029 | |
| | | | Business Services | | | 6.7 | % | | | | | | | | |
| | 20,835 | | OptimizeRx Corp.* | | | | | | | | | | | 943,617 | |
| | | | Calculating & Accounting | | | | | | | | | | | | |
| | | | Machines (No Electronic Computers) | | | 2.7 | % | | | | | | | | |
| | 48,269 | | Cantaloupe, Inc.* | | | | | | | | | | | 375,050 | |
| | | | Computer Integrated Systems Design | | | 1.6 | % | | | | | | | | |
| | 19,633 | | Telos Corp.* | | | | | | | | | | | 224,209 | |
| | | | Computer Peripheral Equipment | | | 4.3 | % | | | | | | | | |
| | 36,391 | | Immersion Corp.* | | | | | | | | | | | 193,600 | |
| | 6,044 | | Impinj, Inc.* | | | | | | | | | | | 415,525 | |
| | | | | | | | | | | | | | | 609,125 | |
| | | | Computer Programming Services | | | 3.5 | % | | | | | | | | |
| | 8,000 | | Doximity, Inc.—Class A* | | | | | | | | | | | 490,800 | |
| | | | Eating Places | | | 2.3 | % | | | | | | | | |
| | 10,000 | | BJ’s Restaurants, Inc.* | | | | | | | | | | | 320,700 | |
| | | | Family Clothing Stores | | | 2.6 | % | | | | | | | | |
| | 17,769 | | American Eagle Outfitters, Inc. | | | | | | | | | | | 374,570 | |
| | | | Industrial Organic Chemicals | | | 8.2 | % | | | | | | | | |
| | 38,751 | | Amyris, Inc.* | | | | | | | | | | | 176,704 | |
| | 49,446 | | Codexis, Inc.* | | | | | | | | | | | 985,459 | |
| | | |
| | | | | | | | | | | 1,162,163 | |
| | | | Medical Laboratories | | | 2.7 | % | | | | | | | | |
| | 7,317 | | CareDx, Inc.* | | | | | | | | | | | 280,826 | |
| | 7,612 | | DermTech, Inc.* | | | | | | | | | | | 97,358 | |
| | | | | | | | | | | | | | | 378,184 | |
The accompanying notes are an integral part of these financial statements.
JACOB SMALL CAP GROWTH FUND
SCHEDULE OF INVESTMENTS(+) (Continued)
February 28, 2022 (Unaudited)
| Shares | | | | | | | | | | Value | |
| | | COMMON STOCKS—(Continued) | | | | | | 100.0% |
| | | |
| | | Miscellaneous Business Services | | | 0.6 | % | | | | | | | |
| | 800 | | NV5 Global, Inc.* | | | | | | | | | | $ | 85,800 | |
| | | | Miscellaneous Metal Ores | | | 3.8 | % | | | | | | | | |
| | 179,182 | | Thunderbird Entertainment Group, Inc.*^ | | | | | | | | | | | 541,058 | |
| | | | Nonstore Retailers | | | 1.2 | % | | | | | | | | |
| | 30,000 | | Rover Group, Inc.* | | | | | | | | | | | 171,300 | |
| | | | Patent Owners & Lessors | | | 6.7 | % | | | | | | | | |
| | 19,397 | | Digital Turbine, Inc.* | | | | | | | | | | | 940,367 | |
| | | | Personal Services | | | 1.7 | % | | | | | | | | |
| | 7,068 | | Yelp, Inc.* | | | | | | | | | | | 239,535 | |
| | | | Pharmaceutical Preparations | | | 11.7 | % | | | | | | | | |
| | 10,073 | | Akouos, Inc.* | | | | | | | | | | | 53,790 | |
| | 4,954 | | Apellis Pharmaceuticals, Inc.* | | | | | | | | | | | 210,694 | |
| | 3,630 | | Arcturus Therapeutics Holdings, Inc.* | | | | | | | | | | | 87,011 | |
| | 14,872 | | Galaxy Digital Holdings Ltd.* | | | | | | | | | | | 193,336 | |
| | 49,628 | | Harrow Health, Inc.* | | | | | | | | | | | 382,632 | |
| | 46,197 | | Heron Therapeutics, Inc.* | | | | | | | | | | | 327,999 | |
| | 7,549 | | Ideaya Biosciences, Inc.* | | | | | | | | | | | 99,647 | |
| | 71,424 | | NeuBase Therapeutics, Inc.* | | | | | | | | | | | 105,707 | |
| | 5,300 | | Schrodinger, Inc.* | | | | | | | | | | | 184,228 | |
| | | | | | | | | | | | | | | 1,645,044 | |
| | | | Prepackaged Software | | | 9.8 | % | | | | | | | | |
| | 52,600 | | Cvent Holding Corp.* | | | | | | | | | | | 423,430 | |
| | 37,092 | | Inspired Entertainment, Inc.* | | | | | | | | | | | 534,496 | |
| | 28,489 | | Porch Group, Inc.* | | | | | | | | | | | 230,761 | �� |
| | 34,403 | | WM Technology, Inc.* | | | | | | | | | | | 201,257 | |
| | | | | | | | | | | | | | | 1,389,944 | |
| | | | Security Brokers, Dealers & Flotation Companies | | | 4.9 | % | | | | | | | | |
| | 87,444 | | Voyager Digital Ltd.* | | | | | | | | | | | 689,933 | |
| | | | Semiconductors and Related Devices | | | 1.4 | % | | | | | | | | |
| | 4,788 | | CEVA, Inc.* | | | | | | | | | | | 195,207 | |
| | | | State Commercial Banks | | | 6.3 | % | | | | | | | | |
| | 6,982 | | Silvergate Capital Corp.—Class A* | | | | | | | | | | | 894,255 | |
The accompanying notes are an integral part of these financial statements.
JACOB SMALL CAP GROWTH FUND
SCHEDULE OF INVESTMENTS(+) (Continued)
February 28, 2022 (Unaudited)
| Shares | | | | | | | | | | Value | |
| | | COMMON STOCKS—(Continued) | | | | | | 100.0% |
| | | |
| | | Surgical and Medical Instruments and Apparatus | | | 7.6 | % | | | | | | | |
| | 97,063 | | Alphatec Holdings, Inc.* | | | | | | | | | | $ | 1,069,634 | |
| | | | TOTAL COMMON STOCKS (Cost $11,711,910) | | | | | | | | | | | 14,115,524 | |
| | | | TOTAL INVESTMENTS (Cost $11,711,910)—100.0% | | | | | | | | | | | 14,115,524 | |
| | | | LIABILITIES IN EXCESS OF OTHER ASSETS—0.0% | | | | | | | | | | | (367 | ) |
| | | | TOTAL NET ASSETS—100.0% | | | | | | | | | | $ | 14,115,157 | |
| (+) | Schedule of Investments is classified using the U.S. Securities and Exchange Commission’s Standard Industrial Classification (SIC) Code List. |
| * | Non Income Producing. |
| ^ | U.S. Dollar-denominated foreign security. |
The accompanying notes are an integral part of these financial statements.
JACOB DISCOVERY FUND
SCHEDULE OF INVESTMENTS(+)
February 28, 2022 (Unaudited)
| Shares | | | | | | | | | | Value | |
| | | COMMON STOCKS | | | | | | 98.2% |
| | | |
| | | Advertising | | | 0.4 | % | | | | | | | |
| | 265,000 | | IZEA Worldwide, Inc.* | | | | | | | | | | $ | 286,200 | |
| | | | Advertising Agencies | | | 1.0 | % | | | | | | | | |
| | 148,541 | | SRAX, Inc.* | | | | | | | | | | | 661,007 | |
| | | | Amusement & Recreation Services | | | 0.9 | % | | | | | | | | |
| | 260,000 | | Super League Gaming, Inc.* | | | | | | | | | | | 582,400 | |
| | | | Biological Products (No Diagnostic Substances) | | | 7.0 | % | | | | | | | | |
| | 182,100 | | Aerie Pharmaceuticals, Inc.* | | | | | | | | | | | 1,511,430 | |
| | 215,000 | | IMV, Inc.*^ | | | | | | | | | | | 275,200 | |
| | 34,500 | | Krystal Biotech, Inc.* | | | | | | | | | | | 2,192,475 | |
| | 167,000 | | Precision BioSciences, Inc.* | | | | | | | | | | | 709,750 | |
| | | | | | | | | | | | | | | 4,688,855 | |
| | | | Bottled & Canned Soft Drinks & Carbonated Waters | | | 0.2 | % | | | | | | | | |
| | 480,000 | | Reed’s, Inc.* | | | | | | | | | | | 141,024 | |
| | | | Business Services | | | 5.3 | % | | | | | | | | |
| | 415,000 | | comScore, Inc.* | | | | | | | | | | | 1,087,300 | |
| | 54,793 | | OptimizeRx Corp.* | | | | | | | | | | | 2,481,575 | |
| | | | | | | | | | | | | | | 3,568,875 | |
| | | | Calculating & Accounting | | | | | | | | | | | | |
| | | | Machines (No Electronic Computers) | | | 2.9 | % | | | | | | | | |
| | 248,600 | | Cantaloupe, Inc.* | | | | | | | | | | | 1,931,622 | |
| | | | Communications Equipment | | | 1.6 | % | | | | | | | | |
| | 294,599 | | Powerfleet, Inc.* | | | | | | | | | | | 1,051,718 | |
| | | | Computer Communications Equipment | | | 4.4 | % | | | | | | | | |
| | 432,279 | | Lantronix, Inc.* | | | | | | | | | | | 2,969,757 | |
| | | | Computer Peripheral Equipment | | | 9.5 | % | | | | | | | | |
| | 168,000 | | Identiv, Inc.* | | | | | | | | | | | 3,521,280 | |
| | 189,174 | | Immersion Corp.* | | | | | | | | | | | 1,006,406 | |
| | 26,700 | | Impinj, Inc.* | | | | | | | | | | | 1,835,625 | |
| | | | | | | | | | | | | | | 6,363,311 | |
| | | | Computer Processing & Data Preparation | | | 2.2 | % | | | | | | | | |
| | 228,958 | | Park City Group, Inc.* | | | | | | | | | | | 1,463,042 | |
| | | | Computer Programing Services | | | 0.6 | % | | | | | | | | |
| | 385,000 | | Scout Gaming Group AB (SEK)*(a) | | | | | | | | | | | 419,710 | |
The accompanying notes are an integral part of these financial statements.
JACOB DISCOVERY FUND
SCHEDULE OF INVESTMENTS(+) (Continued)
February 28, 2022 (Unaudited)
| Shares | | | | | | | | | | Value | |
| | | COMMON STOCKS—(Continued) | | | | | | 98.2% |
| | | |
| | | Electric Services | | | 1.7 | % | | | | | | | |
| | 161,409 | | Transphorm, Inc.* | | | | | | | | | | $ | 1,170,215 | |
| | | | Electronic Components & Accessories | | | 1.3 | % | | | | | | | | |
| | 36,000 | | IntriCon Corp.* | | | | | | | | | | | 861,480 | |
| | | | Functions Related to Depository Banking | | | 2.0 | % | | | | | | | | |
| | 410,000 | | Usio, Inc.* | | | | | | | | | | | 1,348,900 | |
| | | | Games, Toys & Children’s Vehicles (No Dolls & Bicycles) | | | 0.5 | % | | | | | | | | |
| | 560,000 | | BIGG Digital Assets, Inc.*^ | | | | | | | | | | | 364,000 | |
| | | | Gold and Silver Ores | | | 1.1 | % | | | | | | | | |
| | 1,200,000 | | Solitario Zinc Corp.* | | | | | | | | | | | 720,000 | |
| | | | Help Supply Services | | | 5.1 | % | | | | | | | | |
| | 114,907 | | Hudson Global, Inc.* | | | | | | | | | | | 3,424,229 | |
| | | | Industrial Organic Chemicals | | | 3.5 | % | | | | | | | | |
| | 119,006 | | Codexis, Inc.* | | | | | | | | | | | 2,371,790 | |
| | | | Medical Laboratories | | | 2.9 | % | | | | | | | | |
| | 137,832 | | Celcuity, Inc.* | | | | | | | | | | | 1,392,103 | |
| | 42,000 | | DermTech, Inc.* | | | | | | | | | | | 537,180 | |
| | | | | | | | | | | | | | | 1,929,283 | |
| | | | Metal Mining | | | 1.2 | % | | | | | | | | |
| | 450,000 | | Western Copper & Gold Corp.*^ | | | | | | | | | | | 801,000 | |
| | | | Mining & Quarrying of Nonmetallic Mineral (No Fuels) | | | 1.0 | % | | | | | | | | |
| | 620,000 | | Azimut Exploration, Inc.*^ | | | | | | | | | | | 688,200 | |
| | | | Miscellaneous Metal Ores | | | 4.1 | % | | | | | | | | |
| | 918,000 | | Thunderbird Entertainment Group, Inc.*^ | | | | | | | | | | | 2,771,993 | |
| | | | Nonstore Retailers | | | 0.4 | % | | | | | | | | |
| | 53,000 | | Rover Group, Inc.* | | | | | | | | | | | 302,630 | |
| | | | Pharmaceutical Preparations | | | 15.4 | % | | | | | | | | |
| | 50,000 | | Akouos, Inc.* | | | | | | | | | | | 267,000 | |
| | 200,000 | | Arbutus Biopharma Corp.* | | | | | | | | | | | 640,000 | |
| | 22,200 | | Arcturus Therapeutics Holdings, Inc.* | | | | | | | | | | | 532,134 | |
| | 650,000 | | Athersys, Inc.* | | | | | | | | | | | 583,115 | |
| | 340,000 | | Columbia Care, Inc.*^ | | | | | | | | | | | 1,054,000 | |
| | 365,000 | | ContraFect Corp.* | | | | | | | | | | | 1,211,800 | |
| | 275,000 | | DiaMedica Therapeutics, Inc.* | | | | | | | | | | | 723,250 | |
| | 249,889 | | Harrow Health, Inc.* | | | | | | | | | | | 1,926,644 | |
The accompanying notes are an integral part of these financial statements.
JACOB DISCOVERY FUND
SCHEDULE OF INVESTMENTS(+) (Continued)
February 28, 2022 (Unaudited)
| Shares | | | | | | | | | | Value | |
| | | COMMON STOCKS—(Continued) | | | | | | 98.2% |
| | | |
| | | Pharmaceutical Preparations—(Continued) | | | 15.4 | % | | | | | | | |
| | 37,000 | | Ideaya Biosciences, Inc.* | | | | | | | | | | $ | 488,400 | |
| | 355,000 | | NeuBase Therapeutics, Inc.* | | | | | | | | | | | 525,400 | |
| | 104,910 | | Omeros Corp.* | | | | | | | | | | | 755,352 | |
| | 130,994 | | Tela Bio, Inc.* | | | | | | | | | | | 1,678,033 | |
| | | |
| | | | | | | | | | | 10,385,128 | |
| | | | Prepackaged Software | | | 7.7 | % | | | | | | | | |
| | 200,596 | | Inspired Entertainment, Inc.* | | | | | | | | | | | 2,890,588 | |
| | 93,500 | | Porch Group, Inc.* | | | | | | | | | | | 757,350 | |
| | 296,700 | | Qumu Corp.* | | | | | | | | | | | 566,697 | |
| | 160,000 | | WM Technology, Inc.* | | | | | | | | | | | 936,000 | |
| | | | | | | | | | | | | | | 5,150,635 | |
| | | | Real Estate | | | 0.3 | % | | | | | | | | |
| | 400,869 | | Leju Holdings Ltd.—ADR*^ | | | | | | | | | | | 236,392 | |
| | | | Security Brokers, Dealers & Flotation Companies | | | 3.0 | % | | | | | | | | |
| | 260,000 | | Voyager Digital Ltd.* | | | | | | | | | | | 2,051,400 | |
| | | | Semiconductors and Related Devices | | | 1.5 | % | | | | | | | | |
| | 24,440 | | CEVA, Inc.* | | | | | | | | | | | 996,419 | |
| | | | State Commercial Banks | | | 3.0 | % | | | | | | | | |
| | 150,000 | | BM Technologies, Inc.* | | | | | | | | | | | 1,431,000 | |
| | 12,197 | | First Internet Bancorp | | | | | | | | | | | 596,189 | |
| | | | | | | | | | | | | | | 2,027,189 | |
| | | | Surgical and Medical Instruments and Apparatus | | | 6.5 | % | | | | | | | | |
| | 289,500 | | Alphatec Holdings, Inc.* | | | | | | | | | | | 3,190,290 | |
| | 185,000 | | CytoSorbents Corp.* | | | | | | | | | | | 715,950 | |
| | 90,910 | | iCAD, Inc.* | | | | | | | | | | | 439,095 | |
| | | | | | | | | | | | | | | 4,345,335 | |
| | | | TOTAL COMMON STOCKS (Cost $72,041,270) | | | | | | | | | | | 66,073,739 | |
| | | | | | | | | | | | | | | | |
| | | | PREFERRED STOCKS | | | | | | | 0.1% |
| | | | |
| | | | Advertising Agencies | | | 0.1 | % | | | | | | | | |
| | 368,541 | | SRAX, Inc.*(b) | | | | | | | | | | | 67,738 | |
| | | | TOTAL PREFERRED STOCKS (Cost $18,017) | | | | | | | | | | | 67,738 | |
The accompanying notes are an integral part of these financial statements.
JACOB DISCOVERY FUND
SCHEDULE OF INVESTMENTS(+) (Continued)
February 28, 2022 (Unaudited)
| Shares | | | | | | | Value | |
| | | MONEY MARKET FUND | | | 1.7% |
| | | |
| | 1,135,161 | | First American Government Obligations Fund—Class X, 0.03%(c) | | | | | | $ | 1,135,161 | |
| | | | TOTAL MONEY MARKET FUND (Cost $1,135,161) | | | | | | | 1,135,161 | |
| | | | TOTAL INVESTMENTS (Cost $73,194,448)—100.0% | | | | | | | 67,276,638 | |
| | | | LIABILITIES IN EXCESS OF OTHER ASSETS—0.0% | | | | | | | (8,210 | ) |
| | | | TOTAL NET ASSETS—100.0% | | | | | | $ | 67,268,428 | |
| (+) | Schedule of Investments is classified using the U.S. Securities and Exchange Commission’s Standard Industrial Classification (SIC) Code List. |
| * | Non Income Producing. |
| ^ | U.S. Dollar-denominated foreign security. |
| ADR | American Depositary Receipt. |
| (SEK) | Security denominated in Swedish Krona. Value translated into U.S. Dollars. |
| (a) | Level 2 Security. |
| (b) | Level 3 Security. Security is valued in good faith in accordance with procedures approved by the Board of Directors. |
| (c) | 7-day yield. |
The accompanying notes are an integral part of these financial statements.
JACOB FORWARD ETF
SCHEDULE OF INVESTMENTS(+)
February 28, 2022 (Unaudited)
| Shares | | | | | | | | | | Value | |
| | | COMMON STOCKS | | | | | | 100.0% |
| | | |
| | | Biological Products (No Diagnostic Substances) | | | 10.2 | % | | | | | | | |
| | 19,342 | | Aerie Pharmaceuticals, Inc.* | | | | | | | | | | $ | 160,539 | |
| | 826 | | Beam Therapeutics, Inc.* | | | | | | | | | | | 64,717 | |
| | 898 | | CRISPR Therapeutics AG*^ | | | | | | | | | | | 55,110 | |
| | 3,008 | | Krystal Biotech, Inc.* | | | | | | | | | | | 191,158 | |
| | 965 | | Twist Bioscience Corp.* | | | | | | | | | | | 53,982 | |
| | | | | | | | | | | | | | | 525,506 | |
| | | | Business Services | | | 10.1 | % | | | | | | | | |
| | 6,242 | | OptimizeRx Corp.* | | | | | | | | | | | 282,700 | |
| | 4,097 | | Zillow Group, Inc.—Class C* | | | | | | | | | | | 235,659 | |
| | | | | | | | | | | | | | | 518,359 | |
| | | | Catalog & Mail-Order Houses | | | 0.4 | % | | | | | | | | |
| | 216 | | Alibaba Group Holding Ltd.—ADR*^ | | | | | | | | | | | 22,721 | |
| | | | Computer Integrated Systems Design | | | 1.4 | % | | | | | | | | |
| | 6,278 | | Telos Corp.* | | | | | | | | | | | 71,695 | |
| | | | Computer Peripheral Equipment | | | 2.7 | % | | | | | | | | |
| | 2,047 | | Impinj, Inc.* | | | | | | | | | | | 140,731 | |
| | | | Computer Programmings Services | | | 3.2 | % | | | | | | | | |
| | 2,669 | | Doximity, Inc.—Class A* | | | | | | | | | | | 163,743 | |
| | | | Computer Programming, Data Processing, Etc. | | | 10.9 | % | | | | | | | | |
| | 15 | | Alphabet, Inc.—Class C* | | | | | | | | | | | 40,467 | |
| | 646 | | MongoDB, Inc.* | | | | | | | | | | | 246,766 | |
| | 626 | | Tencent Holdings Ltd.—ADR^ | | | | | | | | | | | 33,673 | |
| | 6,745 | | Twitter, Inc.* | | | | | | | | | | | 239,785 | |
| | | | | | | | | | | | | | | 560,691 | |
| | | | Industrial Organic Chemicals | | | 7.8 | % | | | | | | | | |
| | 16,065 | | Amyris, Inc.* | | | | | | | | | | | 73,256 | |
| | 16,496 | | Codexis, Inc.* | | | | | | | | | | | 328,765 | |
| | | | | | | | | | | | | | | 402,021 | |
| | | | Medical Laboratories | | | 3.2 | % | | | | | | | | |
| | 2,992 | | CareDx, Inc.* | | | | | | | | | | | 114,833 | |
| | 3,795 | | DermTech, Inc.* | | | | | | | | | | | 48,538 | |
| | | | | | | | | | | | | | | 163,371 | |
The accompanying notes are an integral part of these financial statements.
JACOB FORWARD ETF
SCHEDULE OF INVESTMENTS(+) (Continued)
February 28, 2022 (Unaudited)
| Shares | | | | | | | | | | Value | |
| | | COMMON STOCKS—(Continued) | | | | | | 100.0% |
| | | |
| | | Miscellaneous Amusement & Recreation | | | 1.8 | % | | | | | | | |
| | 4,009 | | DraftKings, Inc.—Class A* | | | | | | | | | | $ | 94,933 | |
| | | | Nonstore Retailers | | | 1.3 | % | | | | | | | | |
| | 11,489 | | Rover Group, Inc.* | | | | | | | | | | | 65,602 | |
| | | | Patent Owners & Lessors | | | 6.2 | % | | | | | | | | |
| | 6,621 | | Digital Turbine, Inc.* | | | | | | | | | | | 320,986 | |
| | | | Pharmaceutical Preparations | | | 8.6 | % | | | | | | | | |
| | 2,007 | | Apellis Pharmaceuticals, Inc.* | | | | | | | | | | | 85,358 | |
| | 1,485 | | Arcturus Therapeutics Holdings, Inc.* | | | | | | | | | | | 35,595 | |
| | 5,233 | | Galaxy Digital Holdings Ltd.* | | | | | | | | | | | 68,029 | |
| | 18,356 | | Heron Therapeutics, Inc.* | | | | | | | | | | | 130,328 | |
| | 3,318 | | Ideaya Biosciences, Inc.* | | | | | | | | | | | 43,798 | |
| | 2,351 | | Schrodinger, Inc.* | | | | | | | | | | | 81,721 | |
| | | | | | | | | | | | | | | 444,829 | |
| | | | Prepackaged Software | | | 13.8 | % | | | | | | | | |
| | 1,559 | | Block, Inc.* | | | | | | | | | | | 198,772 | |
| | 409 | | Cloudflare, Inc.—Class A* | | | | | | | | | | | 47,616 | |
| | 16,517 | | Cvent Holding Corp.* | | | | | | | | | | | 132,962 | |
| | 10,150 | | Porch Group, Inc.* | | | | | | | | | | | 82,215 | |
| | 1,041 | | Twilio, Inc.—Class A* | | | | | | | | | | | 181,967 | |
| | 11,900 | | WM Technology, Inc.* | | | | | | | | | | | 69,615 | |
| | | | | | | | | | | | | | | 713,147 | |
| | | | Security Brokers, Dealers & Flotation Companies | | | 4.5 | % | | | | | | | | |
| | 29,293 | | Voyager Digital Ltd.* | | | | | | | | | | | 231,122 | |
| | | | Semiconductors & Related Devices | | | 1.2 | % | | | | | | | | |
| | 1,473 | | CEVA, Inc.* | | | | | | | | | | | 60,054 | |
| | | | State Commercial Banks | | | 5.9 | % | | | | | | | | |
| | 2,395 | | Silvergate Capital Corp.—Class A* | | | | | | | | | | | 306,752 | |
| | | | Surgical and Medical Instruments and Apparatus | | | 6.8 | % | | | | | | | | |
| | 31,889 | | Alphatec Holdings, Inc.* | | | | | | | | | | | 351,417 | |
| | | | TOTAL COMMON STOCKS (Cost $7,058,628) | | | | | | | | | | | 5,157,680 | |
The accompanying notes are an integral part of these financial statements.
JACOB FORWARD ETF
SCHEDULE OF INVESTMENTS(+) (Continued)
February 28, 2022 (Unaudited)
| Shares | | | | | | | Value | |
| | | MONEY MARKET FUND | | | 0.0% |
| | | |
| | 1,344 | | First American Government Obligations Fund—Class X, 0.03%(a) | | | | | | $ | 1,344 | |
| | | | TOTAL MONEY MARKET FUND (Cost $1,344) | | | | | | | 1,344 | |
| | | | TOTAL INVESTMENTS (Cost $7,059,972)—100.0% | | | | | | | 5,159,024 | |
| | | | OTHER ASSETS IN EXCESS OF LIABILITIES—0.0% | | | | | | | 744 | |
| | | | TOTAL NET ASSETS—100.0% | | | | | | $ | 5,159,768 | |
| (+) | Schedule of Investments is classified using the U.S. Securities and Exchange Commission’s Standard Industrial Classification (SIC) Code List. |
| * | Non Income Producing. |
| ^ | U.S. Dollar-denominated foreign security. |
| ADR | American Depositary Receipt. |
| (a) | 7-day yield. |
The accompanying notes are an integral part of these financial statements.
JACOB FUNDS INC.
STATEMENTS OF ASSETS AND LIABILITIES
February 28, 2022 (Unaudited)
| | | | | | Jacob | | | | |
| | | Jacob | | | Small Cap | | | Jacob | |
| | | Internet Fund | | | Growth Fund | | | Discovery Fund | |
| Assets: | | | | | | | | | |
| Investments, at value (cost $81,116,952, $11,711,910 | | | | | | | | | |
| and $73,194,448, respectively) | | $ | 107,502,650 | | | $ | 14,115,524 | | | $ | 67,276,638 | |
| Receivable for capital shares sold | | | 24,629 | | | | — | | | | 100,426 | |
| Receivable for investments sold | | | 346,425 | | | | 32,396 | | | | — | |
| Dividend and interest receivable | | | 13 | | | | 1 | | | | 18 | |
| Prepaid expenses and other assets | | | 38,481 | | | | 24,625 | | | | 35,517 | |
| Total Assets | | | 107,912,198 | | | | 14,172,546 | | | | 67,412,599 | |
| | | | | | | | | | | | | |
| Liabilities: | | | | | | | | | | | | |
| Payable for securities purchased | | | 137,604 | | | | — | | | | — | |
| Payable for capital shares repurchased | | | 64,182 | | | | 1,026 | | | | 5,920 | |
| Payable for investment adviser fees | | | 101,665 | | | | 4,633 | | | | 57,053 | |
| Payable to custodian | | | — | | | | 14,324 | | | | — | |
| Payable for distribution and shareholder | | | | | | | | | | | | |
| servicing expenses – Investor Class (see Note 7) | | | 20,391 | | | | 1,065 | | | | 9,112 | |
| Accrued accounting fees | | | 7,145 | | | | 5,723 | | | | 7,440 | |
| Accrued administration fees | | | 27,059 | | | | 8,836 | | | | 17,804 | |
| Accrued audit fees | | | 7,935 | | | | 7,935 | | | | 7,935 | |
| Accrued directors fees | | | 14,275 | | | | 1,838 | | | | 8,365 | |
| Accrued legal fees | | | 1,997 | | | | 847 | | | | 535 | |
| Accrued transfer agent fees | | | 34,510 | | | | 9,977 | | | | 27,226 | |
| Accrued expenses and other liabilities | | | 11,843 | | | | 1,185 | | | | 2,781 | |
| Total Liabilities | | | 428,606 | | | | 57,389 | | | | 144,171 | |
| Net Assets | | $ | 107,483,592 | | | $ | 14,115,157 | | | $ | 67,268,428 | |
| | | | | | | | | | | | | |
| Net Assets Consist Of: | | | | | | | | | | | | |
| Capital stock | | $ | 80,582,811 | | | $ | 12,494,162 | | | $ | 80,569,867 | |
| Total distributable earnings/accumulated losses | | | 26,900,781 | | | | 1,620,995 | | | | (13,301,439 | ) |
| Total Net Assets | | $ | 107,483,592 | | | $ | 14,115,157 | | | $ | 67,268,428 | |
| | | | | | | | | | | | | |
| Institutional Class | | | | | | | | | | | | |
| Net Assets | | $ | 227,597 | | | $ | 8,469,593 | | | $ | 20,321,175 | |
Shares outstanding(1) | | | 29,507 | | | | 319,536 | | | | 600,848 | |
Net asset value, redemption price and offering price per share(2) | | $ | 7.71 | | | $ | 26.51 | | | $ | 33.82 | |
| | | | | | | | | | | | | |
| Investor Class | | | | | | | | | | | | |
| Net Assets | | $ | 107,255,995 | | | $ | 5,645,564 | | | $ | 46,947,253 | |
Shares outstanding(1) | | | 13,905,617 | | | | 220,430 | | | | 1,536,040 | |
Net asset value, redemption price and offering price per share(2) | | $ | 7.71 | | | $ | 25.61 | | | $ | 30.56 | |
_______________
(1) | 20 billion shares of $0.001 par value authorized for the Trust. |
(2) | Redemption of shares held less than 30 days may be charged a 2% redemption fee. See Note 3. |
The accompanying notes are an integral part of these financial statements.
JACOB FUNDS INC.
STATEMENTS OF ASSETS AND LIABILITIES
February 28, 2022 (Unaudited)
| | | Jacob | |
| | | Forward ETF | |
| Assets: | | | |
| Investments, at value (cost $7,059,972) | | $ | 5,159,024 | |
| Receivable for investments sold | | | 2,063 | |
| Dividend and interest receivable | | | 977 | |
| Total Assets | | | 5,162,064 | |
| | | | | |
| Liabilities: | | | | |
| Payable for investment adviser fees | | | 2,296 | |
| Total Liabilities | | | 2,296 | |
| Net Assets | | $ | 5,159,768 | |
| | | | | |
| Net Assets Consist Of: | | | | |
| Capital stock | | $ | 7,168,514 | |
| Total accumulated losses | | | (2,008,746 | ) |
| Total Net Assets | | $ | 5,159,768 | |
| | | | | |
| Net Asset Value | | | | |
| Net Assets | | $ | 5,159,768 | |
Shares outstanding(1) | | | 360,000 | |
Net asset value, redemption price and offering price per share(2) | | $ | 14.33 | |
_______________
(1) | 20 billion shares of $0.001 par value authorized for the Trust. |
(2) | Redemption of shares may be charged for a redemption fee by the Fund. See Note 3. |
The accompanying notes are an integral part of these financial statements.
JACOB FUNDS INC.
STATEMENTS OF OPERATIONS
For the Six Months Ended February 28, 2022 (Unaudited)
| | | | | | Jacob | | | | |
| | | Jacob | | | Small Cap | | | Jacob | |
| | | Internet Fund | | | Growth Fund | | | Discovery Fund | |
| Investment Income: | | | | | | | | | |
| Dividend income | | $ | 15,284 | | | $ | 4,817 | | | $ | — | |
| Interest income | | | 159 | | | | 10 | | | | 483 | |
| Total Investment Income | | | 15,443 | | | | 4,827 | | | | 483 | |
| | | | | | | | | | | | | |
| Expenses: | | | | | | | | | | | | |
| Investment adviser fees | | | 926,491 | | | | 79,924 | | | | 519,829 | |
| Foreign issuance fees | | | — | | | | — | | | | 6,766 | (1) |
| Distribution and shareholder servicing expenses – Investor Class (See Note 7) | | | 185,282 | | | | 11,506 | | | | 85,723 | |
| Administration fees | | | 82,801 | | | | 29,535 | | | | 51,299 | |
| Fund accounting fees | | | 20,200 | | | | 17,319 | | | | 21,796 | |
| Transfer agent fees | | | 101,873 | | | | 29,336 | | | | 83,240 | |
| Custody fees | | | 13,299 | | | | 4,033 | | | | 7,036 | |
| Federal and state registration | | | 20,442 | | | | 21,688 | | | | 32,461 | |
| Insurance expense | | | 3,591 | | | | 650 | | | | 1,729 | |
| Audit fees | | | 7,935 | | | | 7,935 | | | | 7,935 | |
| Legal fees | | | 32,303 | | | | 4,976 | | | | 17,903 | |
| Printing and mailing of reports to shareholders | | | 10,798 | | | | 1,286 | | | | 5,782 | |
| Directors’ fees | | | 25,755 | | | | 3,339 | | | | 16,648 | |
| Miscellaneous expenses | | | 2,776 | | | | 1,343 | | | | 1,342 | |
| Total Expenses | | | 1,433,546 | | | | 212,870 | | | | 859,489 | |
| Expense Waiver (See Note 6) | | | (2 | ) | | | (5,492 | ) | | | — | |
| Net Expenses | | | 1,433,544 | | | | 207,378 | | | | 859,489 | |
| Net Investment Loss | | | (1,418,101 | ) | | | (202,551 | ) | | | (859,006 | ) |
| | | | | | | | | | | | | |
| Realized and Unrealized Gain (Loss) on Investments: | | | | | | | | | | | | |
| Net realized gain (loss) on investments | | | 8,623,255 | | | | 871,728 | | | | (4,687,323 | ) |
| Change in net unrealized depreciation on investments | | | (46,942,341 | ) | | | (7,207,184 | ) | | | (20,707,012 | ) |
| Net realized and unrealized loss on investments | | | (38,319,086 | ) | | | (6,335,456 | ) | | | (25,394,335 | ) |
| Net Decrease in Net Assets Resulting from Operations | | $ | (39,737,187 | ) | | $ | (6,538,007 | ) | | $ | (26,253,341 | ) |
_______________
(1) | Net of $6,747 in dividend income. |
The accompanying notes are an integral part of these financial statements.
JACOB FUNDS INC.
STATEMENT OF OPERATIONS
For the Six Months Ended February 28, 2022 (Unaudited)
| | | Jacob | |
| | | Forward ETF | |
| Investment Income: | | | |
| Interest income | | $ | 1 | |
| Total Investment Income | | | 1 | |
| | | | | |
| Expenses: | | | | |
| Investment adviser fees | | | 25,504 | |
| Net Expenses | | | 25,504 | |
| Net Investment Loss | | | (25,503 | ) |
| | | | | |
| Realized and Unrealized Loss on Investments: | | | | |
| Net realized loss on investments | | | (10,449 | ) |
| Change in net unrealized depreciation on investments | | | (2,418,761 | ) |
| Net realized and unrealized loss on investments | | | (2,429,210 | ) |
| Net Decrease in Net Assets Resulting from Operations | | $ | (2,454,713 | ) |
The accompanying notes are an integral part of these financial statements.
JACOB FUNDS INC.
JACOB INTERNET FUND
STATEMENTS OF CHANGES IN NET ASSETS
| | | Six Months Ended | | | | |
| | | February 28, 2022 | | | Year Ended | |
| | | (Unaudited) | | | August 31, 2021 | |
| Operations: | | | | | | |
| Net investment loss | | $ | (1,418,101 | ) | | $ | (2,624,361 | ) |
| Net realized gain on investment transactions | | | 8,623,255 | | | | 9,203,477 | |
| Change in net unrealized appreciation/depreciation on investments | | | (46,942,341 | ) | | | 36,675,566 | |
| Net increase (decrease) in net assets resulting from operations | | | (39,737,187 | ) | | | 43,254,682 | |
| | | | | | | | | |
| Distributions to Shareholders: | | | | | | | | |
| Investor Class | | | (4,453,875 | ) | | | (11,729,504 | ) |
| Net decrease in net assets resulting from distributions paid | | | (4,453,875 | ) | | | (11,729,504 | ) |
| | | | | | | | | |
| Capital Share Transactions: (Note 3) | | | | | | | | |
| Proceeds from shares sold | | | 13,476,239 | | | | 152,314,100 | |
| Proceeds from reinvestment of distribution | | | 4,330,889 | | | | 11,281,774 | |
| Cost of shares redeemed | | | (36,271,192 | ) | | | (94,471,649 | ) |
| Redemption fees | | | 19,708 | | | | 344,107 | |
| Net increase (decrease) in net assets resulting from capital share transactions | | | (18,444,356 | ) | | | 69,468,332 | |
| | | | | | | | | |
| Net Increase (Decrease) in Net Assets | | | (62,635,418 | ) | | | 100,993,510 | |
| Net Assets: | | | | | | | | |
| Beginning of period | | | 170,119,010 | | | | 69,125,500 | |
| End of period | | $ | 107,483,592 | | | $ | 170,119,010 | |
The accompanying notes are an integral part of these financial statements.
JACOB FUNDS INC.
JACOB SMALL CAP GROWTH FUND
STATEMENTS OF CHANGES IN NET ASSETS
| | | Six Months Ended | | | | |
| | | February 28, 2022 | | | Year Ended | |
| | | (Unaudited) | | | August 31, 2021 | |
| Operations: | | | | | | |
| Net investment loss | | $ | (202,551 | ) | | $ | (447,851 | ) |
| Net realized gain on investment transactions | | | 871,728 | | | | 4,687,489 | |
| Change in net unrealized appreciation/depreciation on investments | | | (7,207,184 | ) | | | 3,681,505 | |
| Net increase (decrease) in net assets resulting from operations | | | (6,538,007 | ) | | | 7,921,143 | |
| | | | | | | | | |
| Distributions to Shareholders: | | | | | | | | |
| Institutional Class | | | (1,585,241 | ) | | | (1,415,462 | ) |
| Investor Class | | | (1,165,724 | ) | | | (840,006 | ) |
| Net decrease in net assets resulting from distributions paid | | | (2,750,965 | ) | | | (2,255,468 | ) |
| | | | | | | | | |
| Capital Share Transactions: (Note 3) | | | | | | | | |
| Proceeds from shares sold | | | 903,315 | | | | 18,437,137 | |
| Proceeds from reinvestment of distribution | | | 2,670,273 | | | | 2,180,879 | |
| Cost of shares redeemed | | | (10,336,958 | ) | | | (13,984,766 | ) |
| Redemption fees | | | 1,627 | | | | 31,345 | |
| Net increase (decrease) in net assets resulting from capital share transactions | | | (6,761,743 | ) | | | 6,664,595 | |
| | | | | | | | | |
| Net Increase (Decrease) in Net Assets | | | (16,050,715 | ) | | | 12,330,270 | |
| Net Assets: | | | | | | | | |
| Beginning of period | | | 30,165,872 | | | | 17,835,602 | |
| End of period | | $ | 14,115,157 | | | $ | 30,165,872 | |
The accompanying notes are an integral part of these financial statements.
JACOB FUNDS INC.
JACOB DISCOVERY FUND
STATEMENTS OF CHANGES IN NET ASSETS
| | | | | | | |
| | | Six Months Ended | | | | |
| | | February 28, 2022 | | | Year Ended | |
| | | (Unaudited) | | | August 31, 2021 | |
| Operations: | | | | | | |
| Net investment loss | | $ | (859,006 | ) | | $ | (1,165,303 | ) |
| Net realized gain (loss) on investment transactions | | | (4,687,323 | ) | | | 6,164,507 | |
| Change in net unrealized appreciation/depreciation on investments | | | (20,707,012 | ) | | | 7,788,815 | |
| Net increase (decrease) in net assets resulting from operations | | | (26,253,341 | ) | | | 12,788,019 | |
| | | | | | | | | |
| Distributions to Shareholders: | | | | | | | | |
| Institutional Class | | | (585,464 | ) | | | (1,111,442 | ) |
| Investor Class | | | (1,576,154 | ) | | | (671,891 | ) |
| Net decrease in net assets resulting from distributions paid | | | (2,161,618 | ) | | | (1,783,333 | ) |
| | | | | | | | | |
| Capital Share Transactions: (Note 3) | | | | | | | | |
| Proceeds from shares sold | | | 24,983,492 | | | | 170,996,300 | |
| Proceeds from reinvestment of distribution | | | 1,983,979 | | | | 1,754,688 | |
| Cost of shares redeemed | | | (43,138,649 | ) | | | (93,054,965 | ) |
| Redemption fees | | | 21,239 | | | | 206,392 | |
Other transaction(1) | | | — | | | | 3,570 | |
| Net increase (decrease) in net assets resulting from capital share transactions | | | (16,149,939 | ) | | | 79,905,985 | |
| | | | | | | | | |
| Net Increase (Decrease) in Net Assets | | | (44,564,898 | ) | | | 90,910,671 | |
| Net Assets: | | | | | | | | |
| Beginning of period | | | 111,833,326 | | | | 20,922,655 | |
| End of period | | $ | 67,268,428 | | | $ | 111,833,326 | |
_______________
(1) | Reimbursement from U.S. Bank Global Fund Services due to shareholder activity. |
The accompanying notes are an integral part of these financial statements.
JACOB FUNDS INC.
JACOB FORWARD ETF
STATEMENTS OF CHANGES IN NET ASSETS
| | | Six Months Ended | | | | |
| | | February 28, 2022 | | | Period Ended | |
| | | (Unaudited) | | | August 31, 2021(1) | |
| Operations: | | | | | | |
| Net investment loss | | $ | (25,503 | ) | | $ | (5,539 | ) |
| Net realized loss on investment transactions | | | (10,449 | ) | | | (39,443 | ) |
| Change in net unrealized appreciation/depreciation on investments | | | (2,418,761 | ) | | | 517,813 | |
| Net increase (decrease) in net assets resulting from operations | | | (2,454,713 | ) | | | 472,831 | |
| | | | | | | | | |
| Distributions to Shareholders: | | | | | | | | |
| Net dividends and distributions to shareholders | | | (26,864 | ) | | | — | |
| | | | | | | | | |
| Capital Share Transactions: (Note 3) | | | | | | | | |
| Proceeds from shares sold | | | 1,100,389 | | | | 7,063,390 | |
| Cost of shares redeemed | | | (997,390 | ) | | | — | |
| Transaction Fees (Note 3) | | | 43 | | | | 2,082 | |
| Net increase in net assets resulting from capital share transactions | | | 103,042 | | | | 7,065,472 | |
| | | | | | | | | |
| Net Increase (Decrease) in Net Assets | | | (2,378,535 | ) | | | 7,538,303 | |
| Net Assets: | | | | | | | | |
| Beginning of period | | | 7,538,303 | | | | — | |
| End of period | | $ | 5,159,768 | | | $ | 7,538,303 | |
_______________
(1) | Commencement of investment operations on July 13, 2021. |
The accompanying notes are an integral part of these financial statements.
JACOB FUNDS INC.
JACOB INTERNET FUND – INSTITUTIONAL CLASS
FINANCIAL HIGHLIGHTS
The table below sets forth financial data for a share of the Fund outstanding throughout the period presented.
| | Period Ended |
| | February 28, 2022(1) |
| | (Unaudited) |
| Per Share Data: | | | |
| Net asset value, beginning of period | | $ | 9.48 | |
| | | | | |
| Loss from investment operations: | | | | |
Net investment loss(2) | | | (0.03 | ) |
| Net realized and unrealized loss on investment transactions | | | (1.74 | ) |
| Total from investment operations | | | (1.77 | ) |
Paid in capital from redemption fees(3) | | | 0.00 | (4) |
| Net asset value, end of period | | $ | 7.71 | |
| Total return | | | -18.76 | %(5) |
| | | | | |
| Supplemental data and ratios: | | | | |
| Net assets, end of period (in thousands) | | $ | 228 | |
| Ratio of gross operating expenses (prior to waiver) to average net assets | | | 2.69 | %(6) |
Ratio of net operating expenses (after waiver) to average net assets(7) | | | 2.65 | %(6) |
| Ratio of net investment loss (prior to waiver) to average net assets | | | (2.61 | )%(6) |
Ratio of net investment loss (after waiver) to average net assets(7) | | | (2.57 | )%(6) |
Portfolio turnover rate(8) | | | 20 | %(5) |
_______________
(1) | Commencement of investment operations on December 31, 2021. |
(2) | Net investment loss per share represents net investment loss divided by the average shares outstanding throughout the period. |
(3) | Paid in capital from redemption fees per share represents redemption fees divided by the average shares outstanding throughout the period. |
(4) | Less than $0.01 per share. |
(5) | Not annualized. |
(6) | Annualized. |
(7) | For the period December 31, 2021 (inception date) through January 5, 2023, the Adviser has contractually agreed to waive its advisory fee in an amount up to an annual rate of 0.10% of the Fund’s average daily net assets, to the extent that the Fund’s gross operating expense ratio exceeds 2.65%, excluding any taxes, interest, brokerage fees, acquired fund fees and expenses, and extraordinary expenses. |
(8) | Portfolio turnover is calculated on the basis of the Fund as a whole without distinguishing between classes of shares issued. |
| | |
The accompanying notes are an integral part of these financial statements.
JACOB FUNDS INC.
JACOB INTERNET FUND – INVESTOR CLASS
FINANCIAL HIGHLIGHTS
The table below sets forth financial data for a share of the Fund outstanding throughout each period/year presented.
| | | Six Months Ended | | | Year Ended August 31, | |
| | | February 28, 2022 | | | 2021 | | | 2020 | | | 2019 | | | 2018 | | | 2017 | |
| | | (Unaudited) | | | | | | | | | | | | | | | | |
| Per Share Data: | | | | | | | | | | | | | | | | | | |
| Net asset value, beginning of period/year | | $ | 10.63 | | | $ | 7.18 | | | $ | 5.22 | | | $ | 5.40 | | | $ | 4.76 | | | $ | 4.39 | |
| | |
| Income (loss) from investment operations: | |
Net investment loss(1) | | | (0.09 | ) | | | (0.19 | ) | | | (0.12 | ) | | | (0.10 | ) | | | (0.11 | ) | | | (0.10 | ) |
| Net realized and unrealized gain (loss) | | | | | | | | | | | | | | | | | | | | | | | | |
| on investment transactions | | | (2.54 | ) | | | 4.81 | | | | 2.65 | | | | 0.29 | | | | 1.31 | | | | 0.67 | |
| Total from investment operations | | | (2.63 | ) | | | 4.62 | | | | 2.53 | | | | 0.19 | | | | 1.20 | | | | 0.57 | |
| Less distributions from net realized gains | | | (0.29 | ) | | | (1.19 | ) | | | (0.57 | ) | | | (0.37 | ) | | | (0.56 | ) | | | (0.20 | ) |
Paid in capital from redemption fees(2) | | | 0.00 | (3) | | | 0.02 | | | | 0.00 | (3) | | | 0.00 | (3) | | | 0.00 | (3) | | | 0.00 | (3) |
| Net asset value, end of period/year | | $ | 7.71 | | | $ | 10.63 | | | $ | 7.18 | | | $ | 5.22 | | | $ | 5.40 | | | $ | 4.76 | |
| Total return | | | -25.35 | %(4) | | | 71.34 | % | | | 55.45 | % | | | 4.61 | % | | | 28.12 | % | | | 13.65 | % |
| | |
| Supplemental data and ratios: | |
| Net assets, end of period/year (in thousands) | | $ | 107,256 | | | $ | 170,119 | | | $ | 69,126 | | | $ | 49,766 | | | $ | 51,240 | | | $ | 43,606 | |
Ratio of operating expenses to average net assets(5) | | | 1.93 | %(6) | | | 1.93 | % | | | 2.50 | % | | | 2.32 | % | | | 2.42 | % | | | 2.38 | % |
Ratio of net investment loss to average net assets(5) | | | (1.91 | )%(6) | | | (1.88 | )% | | | (2.42 | )% | | | (2.08 | )% | | | (2.16 | )% | | | (2.15 | )% |
Portfolio turnover rate(7) | | | 20 | %(4) | | | 44 | % | | | 52 | % | | | 50 | % | | | 46 | % | | | 46 | % |
_______________
(1) | Net investment loss per share represents net investment loss divided by the average shares outstanding throughout the period/year. |
(2) | Paid in capital from redemption fees per share represents redemption fees divided by the average shares outstanding throughout the period/year. |
(3) | Less than $0.01 per share. |
(4) | Not annualized. |
(5) | For the period September 1, 2011 through January 5, 2023, the Adviser has contractually agreed to waive its advisory fee in an amount up to an annual rate of 0.10% of the Fund’s average daily net assets, to the extent that the Fund’s gross operating expense ratio exceeds 2.95%, excluding any taxes, interest, brokerage fees, acquired fund fees and expenses, and extraordinary expenses. |
(6) | Annualized. |
(7) | Portfolio turnover is calculated on the basis of the Fund as a whole without distinguishing between classes of shares issued. |
The accompanying notes are an integral part of these financial statements.
JACOB FUNDS INC.
JACOB SMALL CAP GROWTH FUND – INSTITUTIONAL CLASS
FINANCIAL HIGHLIGHTS
The table below sets forth financial data for a share of the Fund outstanding throughout each period/year presented.
| | | Six Months Ended | | | Year Ended August 31, | |
| | | February 28, 2022 | | | 2021 | | | 2020 | | | 2019 | | | 2018 | | | 2017 | |
| | | (Unaudited) | | | | | | | | | | | | | | | | |
| Per Share Data: | | | | | | | | | | | | | | | | | | |
| Net asset value, beginning of period/year | | $ | 43.52 | | | $ | 30.80 | | | $ | 23.91 | | | $ | 28.81 | | | $ | 18.52 | | | $ | 16.82 | |
| | | | | | | | | | | | | | | | | | | | | | | | | |
| Income (loss) from investment operations: | | | | | | | | | | | | | | | | | | | | | | | | |
Net investment loss(1) | | | (0.34 | ) | | | (0.68 | ) | | | (0.42 | ) | | | (0.39 | ) | | | (0.34 | ) | | | (0.27 | ) |
| Net realized and unrealized gain (loss) | | | | | | | | | | | | | | | | | | | | | | | | |
| on investment transactions | | | (11.05 | ) | | | 18.37 | | | | 7.98 | | | | (4.26 | ) | | | 10.63 | | | | 1.97 | |
| Total from investment operations | | | (11.39 | ) | | | 17.69 | | | | 7.56 | | | | (4.65 | ) | | | 10.29 | | | | 1.70 | |
| Less distributions from net realized gains | | | (5.62 | ) | | | (5.02 | ) | | | (0.67 | ) | | | (0.25 | ) | | | — | | | | — | |
Paid in capital from redemption fees(2) | | | 0.00 | (3) | | | 0.05 | | | | 0.00 | (3) | | | — | | | | 0.00 | (3) | | | — | |
| Net asset value, end of period/year | | $ | 26.51 | | | $ | 43.52 | | | $ | 30.80 | | | $ | 23.91 | | | $ | 28.81 | | | $ | 18.52 | |
| Total return | | | -29.07 | %(4) | | | 62.04 | % | | | 32.23 | % | | | -16.17 | % | | | 55.56 | % | | | 10.11 | %(5) |
| | | | | | | | | | | | | | | | | | | | | | | | | |
| Supplemental data and ratios: | | | | | | | | | | | | | | | | | | | | | | | | |
| Net assets, end of period/year (in thousands) | | $ | 8,470 | | | $ | 12,782 | | | $ | 12,799 | | | $ | 10,825 | | | $ | 14,621 | | | $ | 10,480 | |
| Ratio of gross operating expenses | | | | | | | | | | | | | | | | | | | | | | | | |
| (prior to waiver) to average net assets | | | 2.05 | %(6) | | | 1.84 | % | | | 2.56 | % | | | 2.22 | % | | | 2.46 | % | | | 2.59 | % |
| Ratio of net operating expenses | | | | | | | | | | | | | | | | | | | | | | | | |
(after waiver) to average net assets(7) | | | 1.95 | %(6) | | | 1.74 | % | | | 1.95 | % | | | 1.95 | % | | | 1.95 | % | | | 1.95 | % |
| Ratio of net investment loss | | | | | | | | | | | | | | | | | | | | | | | | |
| (prior to waiver) to average net assets | | | (2.00 | )%(6) | | | (1.80 | )% | | | (2.32 | )% | | | (1.81 | )% | | | (2.04 | )% | | | (2.19 | )% |
| Ratio of net investment loss | | | | | | | | | | | | | | | | | | | | | | | | |
(after waiver) to average net assets(7) | | | (1.90 | )%(6) | | | (1.70 | )% | | | (1.71 | )% | | | (1.54 | )% | | | (1.53 | )% | | | (1.55 | )% |
Portfolio turnover rate(8) | | | 17 | %(4) | | | 71 | % | | | 89 | % | | | 88 | % | | | 81 | % | | | 60 | % |
_______________
(1) | Net investment loss per share represents net investment loss divided by the average shares outstanding throughout the period/year. |
(2) | Paid in capital from redemption fees per share represents redemption fees divided by the average shares outstanding throughout the period/year. |
(3) | Less than $0.01 per share. |
(4) | Not annualized. |
(5) | Includes adjustments in accordance with GAAP and, consequently, the net asset values used for financial reporting purposes and the returns based upon those net asset values may differ from the net asset values and returns for the shareholder transactions. |
(6) | Annualized. |
(7) | The Adviser has contractually agreed, effective November 12, 2012 (date of reorganization) through January 5, 2023, to waive up to 100% of its advisory fee to the extent that the Fund’s gross operating expense ratio exceeds 1.95%, excluding any taxes, interest, brokerage fees, acquired fund fees and expenses, and extraordinary expenses. |
(8) | Portfolio turnover is calculated on the basis of the Fund as a whole without distinguishing between classes of shares issued. |
The accompanying notes are an integral part of these financial statements.
JACOB FUNDS INC.
JACOB SMALL CAP GROWTH FUND – INVESTOR CLASS
FINANCIAL HIGHLIGHTS
The table below sets forth financial data for a share of the Fund outstanding throughout each period/year presented.
| | | Six Months Ended | | | Year Ended August 31, | |
| | | February 28, 2022 | | | 2021 | | | 2020 | | | 2019 | | | 2018 | | | 2017 | |
| | | (Unaudited) | | | | | | | | | | | | | | | | |
| Per Share Data: | | | | | | | | | | | | | | | | | | |
| Net asset value, beginning of period/year | | $ | 42.33 | | | $ | 30.14 | | | $ | 23.48 | | | $ | 28.36 | | | $ | 18.28 | | | $ | 16.66 | |
| | | | | | | | | | | | | | | | | | | | | | | | | |
| Income (loss) from investment operations: | | | | | | | | | | | | | | | | | | | | | | | | |
Net investment loss(1) | | | (0.39 | ) | | | (0.76 | ) | | | (0.49 | ) | | | (0.46 | ) | | | (0.40 | ) | | | (0.32 | ) |
| Net realized and unrealized gain (loss) | | | | | | | | | | | | | | | | | | | | | | | | |
| on investment transactions | | | (10.71 | ) | | | 17.92 | | | | 7.82 | | | | (4.19 | ) | | | 10.48 | | | | 1.94 | |
| Total from investment operations | | | (11.10 | ) | | | 17.16 | | | | 7.33 | | | | (4.65 | ) | | | 10.08 | | | | 1.62 | |
| Less distributions from net realized gains | | | (5.62 | ) | | | (5.02 | ) | | | (0.67 | ) | | | (0.25 | ) | | | — | | | | — | |
Paid in capital from redemption fees(2) | | | 0.00 | (3) | | | 0.05 | | | | 0.00 | (3) | | | 0.02 | | | | 0.00 | (3) | | | 0.00 | (3) |
| Net asset value, end of period/year | | $ | 25.61 | | | $ | 42.33 | | | $ | 30.14 | | | $ | 23.48 | | | $ | 28.36 | | | $ | 18.28 | |
| Total return | | | -29.22 | %(4) | | | 61.60 | % | | | 31.83 | % | | | -16.35 | % | | | 55.14 | % | | | 9.72 | %(5) |
| | | | | | | | | | | | | | | | | | | | | | | | | |
| Supplemental data and ratios: | | | | | | | | | | | | | | | | | | | | | | | | |
| Net assets, end of period/year (in thousands) | | $ | 5,645 | | | $ | 17,384 | | | $ | 5,037 | | | $ | 4,538 | | | $ | 6,415 | | | $ | 4,326 | |
| Ratio of gross operating expenses | | | | | | | | | | | | | | | | | | | | | | | | |
| (prior to waiver) to average net assets | | | 2.22 | %(6) | | | 1.97 | % | | | 2.81 | % | | | 2.47 | % | | | 2.71 | % | | | 2.84 | % |
| Ratio of net operating expenses | | | | | | | | | | | | | | | | | | | | | | | | |
(after waiver) to average net assets(7) | | | 2.22 | %(6) | | | 1.93 | % | | | 2.25 | % | | | 2.25 | % | | | 2.25 | % | | | 2.25 | % |
| Ratio of net investment loss | | | | | | | | | | | | | | | | | | | | | | | | |
| (prior to waiver) to average net assets | | | (2.18 | )%(6) | | | (1.93 | )% | | | (2.57 | )% | | | (2.05 | )% | | | (2.29 | )% | | | (2.44 | )% |
| Ratio of net investment loss | | | | | | | | | | | | | | | | | | | | | | | | |
(after waiver) to average net assets(7) | | | (2.18 | )%(6) | | | (1.89 | )% | | | (2.01 | )% | | | (1.83 | )% | | | (1.83 | )% | | | (1.85 | )% |
Portfolio turnover rate(8) | | | 17 | %(4) | | | 71 | % | | | 89 | % | | | 88 | % | | | 81 | % | | | 60 | % |
_______________
(1) | Net investment loss per share represents net investment loss divided by the average shares outstanding throughout the period/year. |
(2) | Paid in capital from redemption fees per share represents redemption fees divided by the average shares outstanding throughout the period/year. |
(3) | Less than $0.01 per share. |
(4) | Not annualized. |
(5) | Includes adjustments in accordance with GAAP and, consequently, the net asset values used for financial reporting purposes and the returns based upon those net asset values may differ from the net asset values and returns for the shareholder transactions. |
(6) | Annualized. |
(7) | The Adviser has contractually agreed, effective November 12, 2012 (date of reorganization) through January 5, 2023, to waive up to 100% of its advisory fee to the extent that the Fund’s gross operating expense ratio exceeds 2.25%, excluding any taxes, interest, brokerage fees, acquired fund fees and expenses, and extraordinary expenses. |
(8) | Portfolio turnover is calculated on the basis of the Fund as a whole without distinguishing between classes of shares issued. |
The accompanying notes are an integral part of these financial statements.
JACOB FUNDS INC.
JACOB DISCOVERY FUND – INSTITUTIONAL CLASS
FINANCIAL HIGHLIGHTS
The table below sets forth financial data for a share of the Fund outstanding throughout each period/year presented.
| | | Six Months Ended | | | Year Ended August 31, | |
| | | February 28, 2022 | | | 2021 | | | 2020 | | | 2019 | | | 2018 | | | 2017 | |
| | | (Unaudited) | | | | | | | | | | | | | | | | |
| Per Share Data: | | | | | | | | | | | | | | | | | | |
| Net asset value, beginning of period/year | | $ | 45.90 | | | $ | 27.00 | | | $ | 19.26 | | | $ | 18.50 | | | $ | 11.32 | | | $ | 12.11 | |
| | | | | | | | | | | | | | | | | | | | | | | | | |
| Income (loss) from investment operations: | | | | | | | | | | | | | | | | | | | | | | | | |
Net investment loss(1) | | | (0.33 | ) | | | (0.65 | ) | | | (0.35 | ) | | | (0.29 | ) | | | (0.29 | ) | | | (0.28 | ) |
| Net realized and unrealized gain (loss) | | | | | | | | | | | | | | | | | | | | | | | | |
| on investment transactions | | | (10.85 | ) | | | 21.69 | | | | 8.09 | | | | 1.05 | | | | 7.47 | | | | (0.51 | ) |
| Total from investment operations | | | (11.18 | ) | | | 21.04 | | | | 7.74 | | | | 0.76 | | | | 7.18 | | | | (0.79 | ) |
| Less distributions from net investment income | | | (0.18 | ) | | | — | | | | — | | | | — | | | | — | | | | — | |
| Less distributions from net realized gains | | | (0.73 | ) | | | (2.24 | ) | | | — | | | | — | | | | — | | | | — | |
Paid in capital from redemption fees(2) | | | 0.01 | | | | 0.10 | | | | 0.00 | (3) | | | — | | | | — | | | | — | |
| Net asset value, end of period/year | | $ | 33.82 | | | $ | 45.90 | | | $ | 27.00 | | | $ | 19.26 | | | $ | 18.50 | | | $ | 11.32 | |
| Total return | | | -24.72 | %(4) | | | 82.06 | % | | | 40.19 | % | | | 4.11 | % | | | 63.43 | % | | | -6.52 | % |
| | | | | | | | | | | | | | | | | | | | | | | | | |
| Supplemental data and ratios: | | | | | | | | | | | | | | | | | | | | | | | | |
| Net assets, end of period/year (in thousands) | | $ | 20,321 | | | $ | 30,536 | | | $ | 13,249 | | | $ | 9,840 | | | $ | 9,098 | | | $ | 5,870 | |
| Ratio of gross operating expenses | | | | | | | | | | | | | | | | | | | | | | | | |
| (prior to waiver) to average net assets | | | 1.64 | %(5) | | | 1.74 | % | | | 2.90 | % | | | 2.90 | % | | | 3.50 | % | | | 3.86 | % |
| Ratio of net operating expenses | | | | | | | | | | | | | | | | | | | | | | | | |
(after waiver) to average net assets(6) | | | 1.64 | %(5) | | | 1.67 | % | | | 2.00 | % | | | 2.00 | % | | | 2.40 | % | | | 2.66 | %(7) |
| Ratio of net investment loss | | | | | | | | | | | | | | | | | | | | | | | | |
| (prior to waiver) to average net assets | | | (1.64 | )%(5) | | | (1.66 | )% | | | (2.60 | )% | | | (2.52 | )% | | | (3.15 | )% | | | (3.65 | )% |
| Ratio of net investment loss | | | | | | | | | | | | | | | | | | | | | | | | |
(after waiver) to average net assets(6) | | | (1.64 | )%(5) | | | (1.59 | )% | | | (1.70 | )% | | | (1.62 | )% | | | (2.05 | )% | | | (2.45 | )%(7) |
Portfolio turnover rate(8) | | | 13 | %(4) | | | 32 | % | | | 83 | % | | | 73 | % | | | 63 | % | | | 48 | % |
_______________
(1) | Net investment loss per share represents net investment loss divided by the average shares outstanding throughout the period/year. |
(2) | Paid in capital from redemption fees per share represents redemption fees divided by the average shares outstanding throughout the period/year. |
(3) | Less than $0.01 per share. |
(4) | Not annualized. |
(5) | Annualized. |
(6) | The Adviser has contractually agreed, effective December 29, 2016 through at least January 5, 2023, to waive up to 100% of its advisory fee to the extent that the Fund’s gross operating expense ratio exceeds 2.00%, excluding any taxes, interest, brokerage fees, acquired fund fees and expenses, and extraordinary expenses. |
(7) | The Adviser has contractually agreed, effective November 12, 2012 (date of reorganization) through December 28, 2016, to waive up to 100% of its advisory fee to the extent that the Fund’s gross operating expense ratio exceeds 2.15%, excluding any taxes, interest, brokerage fees, acquired fund fees and expenses, and extraordinary expenses. |
(8) | Portfolio turnover is calculated on the basis of the Fund as a whole without distinguishing between classes of shares issued. |
| | |
The accompanying notes are an integral part of these financial statements.
JACOB FUNDS INC.
JACOB DISCOVERY FUND – INVESTOR CLASS
FINANCIAL HIGHLIGHTS
The table below sets forth financial data for a share of the Fund outstanding throughout each period/year presented.
| | | Six Months Ended | | | Year Ended August 31, | |
| | | February 28, 2022 | | | 2021 | | | 2020 | | | 2019 | | | 2018 | | | 2017 | |
| | | (Unaudited) | | | | | | | | | | | | | | | | |
| Per Share Data: | | | | | | | | | | | | | | | | | | |
| Net asset value, beginning of period/year | | $ | 41.51 | | | $ | 24.65 | | | $ | 17.62 | | | $ | 16.96 | | | $ | 10.40 | | | $ | 11.16 | |
| | | | | | | | | | | | | | | | | | | | | | | | | |
| Income (loss) from investment operations: | | | | | | | | | | | | | | | | | | | | | | | | |
Net investment loss(1) | | | (0.34 | ) | | | (0.69 | ) | | | (0.38 | ) | | | (0.32 | ) | | | (0.30 | ) | | | (0.28 | ) |
| Net realized and unrealized gain (loss) | | | | | | | | | | | | | | | | | | | | | | | | |
| on investment transactions | | | (9.82 | ) | | | 19.66 | | | | 7.41 | | | | 0.96 | | | | 6.86 | | | | (0.48 | ) |
| Total from investment operations | | | (10.16 | ) | | | 18.97 | | | | 7.03 | | | | 0.64 | | | | 6.56 | | | | (0.76 | ) |
| Less distributions from net investment income | | | (0.07 | ) | | | — | | | | — | | | | — | | | | — | | | | — | |
| Less distributions from net realized gains | | | (0.73 | ) | | | (2.24 | ) | | | — | | | | — | | | | — | | | | — | |
Paid in capital from redemption fees(2) | | | 0.01 | | | | 0.13 | | | | 0.00 | (3) | | | 0.02 | | | | 0.00 | (3) | | | — | |
| Net asset value, end of period/year | | $ | 30.56 | | | $ | 41.51 | | | $ | 24.65 | | | $ | 17.62 | | | $ | 16.96 | | | $ | 10.40 | |
| Total return | | | -24.83 | %(4) | | | 81.58 | % | | | 39.90 | % | | | 3.89 | % | | | 63.08 | % | | | -6.81 | % |
| | | | | | | | | | | | | | | | | | | | | | | | | |
| Supplemental data and ratios: | | | | | | | | | | | | | | | | | | | | | | | | |
| Net assets, end of period/year (in thousands) | | $ | 46,947 | | | $ | 81,297 | | | $ | 7,674 | | | $ | 4,254 | | | $ | 2,854 | | | $ | 1,514 | |
| Ratio of gross operating expenses | | | | | | | | | | | | | | | | | | | | | | | | |
| (prior to waiver) to average net assets | | | 1.88 | %(5) | | | 1.87 | % | | | 3.15 | % | | | 3.15 | % | | | 3.74 | % | | | 4.11 | % |
| Ratio of net operating expenses | | | | | | | | | | | | | | | | | | | | | | | | |
(after waiver) to average net assets(6) | | | 1.88 | %(5) | | | 1.85 | % | | | 2.30 | % | | | 2.30 | % | | | 2.64 | % | | | 2.91 | %(7) |
| Ratio of net investment loss | | | | | | | | | | | | | | | | | | | | | | | | |
| (prior to waiver) to average net assets | | | (1.88 | )%(5) | | | (1.76 | )% | | | (2.83 | )% | | | (2.77 | )% | | | (3.41 | )% | | | (3.90 | )% |
| Ratio of net investment loss | | | | | | | | | | | | | | | | | | | | | | | | |
(after waiver) to average net assets(6) | | | (1.88 | )%(5) | | | (1.74 | )% | | | (1.98 | )% | | | (1.92 | )% | | | (2.31 | )% | | | (2.70 | )%(7) |
Portfolio turnover rate(8) | | | 13 | %(4) | | | 32 | % | | | 83 | % | | | 73 | % | | | 63 | % | | | 48 | % |
_______________
(1) | Net investment loss per share represents net investment loss divided by the average shares outstanding throughout the period/year. |
(2) | Paid in capital from redemption fees per share represents redemption fees divided by the average shares outstanding throughout the period/year. |
(3) | Less than $0.01 per share. |
(4) | Not annualized. |
(5) | Annualized. |
(6) | The Adviser has contractually agreed, effective December 29, 2016 through at least January 5, 2023, to waive up to 100% of its advisory fee to the extent that the Fund’s gross operating expense ratio exceeds 2.30%, excluding any taxes, interest, brokerage fees, acquired fund fees and expenses, and extraordinary expenses. |
(7) | The Adviser has contractually agreed, effective November 12, 2012 (date of reorganization) through December 28, 2016, to waive up to 100% of its advisory fee to the extent that the Fund’s gross operating expense ratio exceeds 2.45%, excluding any taxes, interest, brokerage fees, acquired fund fees and expenses, and extraordinary expenses. |
(8) | Portfolio turnover is calculated on the basis of the Fund as a whole without distinguishing between classes of shares issued. |
The accompanying notes are an integral part of these financial statements.
JACOB FUNDS INC.
JACOB FORWARD ETF
FINANCIAL HIGHLIGHTS
The table below sets forth financial data for a share of the Fund outstanding throughout each period presented.
| | | Six Months Ended | | | Period Ended | |
| | | February 28, 2022 | | | August 31, 2021(1) | |
| | | (Unaudited) | | | | |
| Per Share Data: | | | | | | |
| Net asset value, beginning of period | | $ | 20.94 | | | $ | 20.00 | |
| | | | | | | | | |
| Income (loss) from investment operations: | | | | | | | | |
Net investment loss(2) | | | (0.07 | ) | | | (0.02 | ) |
| Net realized and unrealized gain (loss) on investment transactions | | | (6.47 | ) | | | 0.96 | |
| Total from investment operations | | | (6.54 | ) | | | 0.94 | |
| Less distributions from net investment income | | | (0.07 | ) | | | — | |
| Net asset value, end of period | | $ | 14.33 | | | $ | 20.94 | |
| | | | | | | | | |
| Total returns: | | | | | | | | |
Net Asset Value(3) | | | -31.31 | %(4) | | | 4.70 | %(4) |
Market Value(5) | | | -31.24 | %(4) | | | 4.55 | %(4) |
| | | | | | | | | |
| Supplemental data and ratios: | | | | | | | | |
| Net assets, end of period (in thousands) | | $ | 5,160 | | | $ | 7,538 | |
| Ratio of net operating expenses to average net assets | | | 0.75 | %(6) | | | 0.75 | %(6) |
| Ratio of net investment loss to average net assets | | | (0.75 | )%(6) | | | (0.75 | )%(6) |
Portfolio turnover rate(7) | | | 26 | %(4) | | | 3 | %(4) |
_______________
(1) | Commencement of investment operations on July 13, 2021. |
(2) | Net investment loss per share represents net investment loss divided by the average shares outstanding throughout the period. |
(3) | Net asset value total return is calculated assuming an initial investment made at the net asset value at the beginning of the period, reinvestment of all dividends and distributions at net asset value during the period and redemption on the last day of the period at net asset value. |
(4) | Not annualized. |
(5) | Market value total return is calculated assuming an initial investment made at market value at the beginning of the period, reinvestment of all dividends and distributions at net asset value during the period and redemption on the last day of the period at market value. The market value is determined by the midpoint of the bid/ask spread at 4:00 p.m. from the NYSE Arca, Inc. Exchange. Market value returns may vary from net asset value returns. |
(6) | Annualized. |
(7) | Portfolio turnover rate excludes in-kind transactions. |
The accompanying notes are an integral part of these financial statements.
JACOB FUNDS INC.
NOTES TO THE FINANCIAL STATEMENTS
February 28, 2022 (Unaudited)
NOTE 1—DESCRIPTION OF ORGANIZATION
Jacob Funds Inc. (the “Corporation”) was organized as a Maryland corporation on July 13, 1999 and is registered under the Investment Company Act of 1940, as amended (the “1940 Act”), as an open-end management investment company issuing its shares in series. The Corporation currently consists of four “diversified” series, the Jacob Internet Fund (the “Internet Fund”), the Jacob Small Cap Growth Fund (the “Small Cap Growth Fund”), the Jacob Discovery Fund (the “Discovery Fund”) and the Jacob Forward ETF (the “Forward ETF”), each a “Fund”, collectively the “Funds”, and the authorized capital stock of the Corporation consists of twenty billion shares of stock having a par value of one-tenth of one cent ($0.001) per share. The primary investment objective of the Internet Fund is long-term growth of capital with current income as a secondary objective. The primary investment objective of each of the Small Cap Growth Fund, Discovery Fund and Forward ETF is long-term growth of capital.
The Investor Class and Institutional Class shares of the Internet Fund commenced operations on December 14, 1999 and December 31, 2021, respectively. The Small Cap Growth Fund commenced operations on February 1, 2010 when it acquired the assets and liabilities of the Rockland Small Cap Growth Fund series of Rockland Funds Trust in a reorganization transaction (the Small Cap Growth Fund is the successor fund to the Rockland Small Cap Growth Fund). The Small Cap Growth Fund acquired the Class I and Class R shares of the Jacob Small Cap Growth Fund II (formerly, PineBridge US Small Cap Growth Fund) series of Jacob Funds II (formerly, the PineBridge Mutual Funds) (the “Predecessor Small Cap Growth Fund”) on November 12, 2012. The Small Cap Growth Fund acquired the Investor Class shares of the Jacob Wisdom Fund series of the Corporation on August 26, 2016. Effective December 31, 2020, the name of the Jacob Micro Cap Growth Fund was changed to the Jacob Discovery Fund. The Discovery Fund commenced operations on November 12, 2012 when it acquired the assets and liabilities of the Jacob Micro Cap Growth Fund (formerly, PineBridge US Micro Cap Growth Fund) series of Jacob Funds II (the “Predecessor Micro Cap Growth Fund”) in a reorganization transaction (the Discovery Fund is the successor fund to the Predecessor Micro Cap Growth Fund). The Forward ETF commenced operations on July 13, 2021.
The Internet Fund, Small Cap Growth Fund and Discovery Fund currently offer Investor Class and Institutional Class shares. The Forward ETF currently offers one class of shares. Each share of each class of a Fund represents an equal pro rata interest in such Fund and provides the shareholder the same voting, dividend, and other rights, except that shareholders of each class of a Fund have exclusive voting rights regarding any matter relating solely to that particular class.
NOTE 2—SIGNIFICANT ACCOUNTING POLICIES
The following is a summary of significant accounting policies consistently followed by the Funds. These policies are in conformity with accounting principles generally accepted in the United States of America (“GAAP”). The Funds are investment companies and follow accounting and reporting guidance under the Financial Accounting Standards Board (“FASB”) Accounting Standards Codification (“ASC”) Topic 946, “Financial Services – Investment Companies”.
| | (a) Investment Valuation—Investment securities traded on a national securities exchange are valued at their market value determined by their last sales price in the principal market in which these securities are normally traded (except those traded on the NASDAQ National Market and Capital Market exchanges which are valued at the NASDAQ Official Closing Price (“NOCP”)), unless there are no transactions on the valuation date, in which case they are valued at the mean between the closing bid and ask prices. Securities traded over-the-counter are valued at the last reported sales price unless there is no reported sales price, in which case the mean between the closing bid and ask prices is used. Foreign securities, currencies and other assets denominated in foreign currencies are |
JACOB FUNDS INC.
NOTES TO THE FINANCIAL STATEMENTS (Continued)
February 28, 2022 (Unaudited)
| | translated into U.S. dollars at the exchange rate of such currencies. Foreign equity securities are valued at the last sale price at the close of the exchange on which the security is principally traded. The Funds values foreign securities at fair value, using fair valuation procedures approved by the Board of Directors, taking into account the occurrence of events after the close of foreign markets in calculating the NAV. In such cases, use of fair valuation can reduce an investor’s ability to seek profit by estimating the Fund’s NAV in advance of the time the NAV is calculated. The Board of Directors have retained an independent fair value pricing service to assist in valuing foreign securities held by the Funds. Debt securities with maturities of 60 days or less are valued at amortized cost, which approximates market value. Short-term securities with 60 days or less remaining to maturity are, unless conditions indicate otherwise, amortized to maturity based on their cost to a Fund if acquired within 60 days of maturity or, if already held by a Fund on the 60th day, based on the value determined on the 61st day. If amortized cost does not approximate fair value, short-term securities are reported at fair value. Where market quotations are not readily available, are unreliable or when values have been materially affected by events occurring before the close of U.S. markets but after the close of the securities’ primary markets, securities are valued at fair value using procedures approved by the Board of Directors that are designed to determine a security’s fair value. |
| | |
| | The Funds adhere to fair valuation accounting standards which provide an authoritative definition of fair value and set out a hierarchy for measuring fair value. These standards require disclosures about the various inputs and valuation techniques used to develop the measurements of fair value and a discussion in changes in valuation techniques and related inputs during the period. These standards define fair value as the price that would be received to sell an asset or paid to transfer a liability in an orderly transaction between market participants at the measurement date. The fair value hierarchy is organized into three levels based upon the assumptions (referred to as “inputs”) used in pricing the asset or liability. These standards state that “observable inputs” reflect the assumptions market participants would use in pricing the asset or liability based on market data obtained from independent sources and “unobservable inputs” reflect an entity’s own assumptions about the assumptions market participants would use in pricing the asset or liability. |
| | |
| | Summary of Fair Value Exposure |
| | |
| | Various inputs are used in determining the value of the Funds’ investments. These inputs are summarized in the three broad levels listed below: |
| | | Level 1—Unadjusted quoted prices in active markets for identical assets or liabilities that the Funds have the ability to access. |
| | | |
| | | Level 2—Observable inputs other than quoted prices included in Level 1 that are observable for the asset or liability, either directly or indirectly. These inputs may include quoted prices for the identical instrument in an inactive market, prices for similar instruments, interest rates, prepayment speeds, credit risk, yield curves, default rates and similar data. |
| | | |
| | | Level 3—Unobservable inputs for the asset or liability, to the extent relevant observable inputs are not available, representing the Funds’ own assumptions about the assumptions a market participant would use in valuing the asset or liability, and based on the best information available. |
| | The inputs or methodology used for valuing securities are not necessarily an indication of the risk associated with investing in those securities. |
JACOB FUNDS INC.
NOTES TO THE FINANCIAL STATEMENTS (Continued)
February 28, 2022 (Unaudited)
| | The following is a summary of the inputs used to value the Internet Fund’s investments as of February 28, 2022: |
| | | | Level 1 | | | Level 2 | | | Level 3 | | | Total | |
| | Common Stocks | | | | | | | | | | | | |
| | Prepackaged Software | | $ | 20,977,680 | | | $ | — | | | $ | — | | | $ | 20,977,680 | |
| | Business Services | | | 15,812,762 | | | | — | | | | — | | | | 15,812,762 | |
| | Computer Programming, Data Processing, Etc. | | | 13,150,933 | | | | 723,082 | (a) | | | — | | | | 13,874,015 | |
| | Computer Peripheral Equipment | | | 9,468,893 | | | | — | | | | — | | | | 9,468,893 | |
| | Patent Owners & Lessors | | | 8,023,246 | | | | — | | | | — | | | | 8,023,246 | |
| | State Commercial Banks | | | 7,726,426 | | | | — | | | | — | | | | 7,726,426 | |
| | Security Brokers, Dealers & Flotation Companies | | | 5,996,400 | | | | — | | | | — | | | | 5,996,400 | |
| | Computer Communications Equipment | | | 4,084,902 | | | | — | | | | — | | | | 4,084,902 | |
| | Computer Programming Services | | | 3,803,700 | | | | — | | | | — | | | | 3,803,700 | |
| | Calculating & Accounting Machines | | | | | | | | | | | | | | | | |
| | (No Electronic Computers) | | | 2,898,210 | | | | — | | | | — | | | | 2,898,210 | |
| | Miscellaneous Amusement & Recreation | | | 2,415,360 | | | | — | | | | — | | | | 2,415,360 | |
| | Computer Integrated Systems Design | | | 1,855,750 | | | | — | | | | — | | | | 1,855,750 | |
| | Personal Services | | | 1,843,616 | | | | — | | | | — | | | | 1,843,616 | |
| | Electric Services | | | 1,832,923 | | | | — | | | | — | | | | 1,832,923 | |
| | Pharmaceutical Preparations | | | 1,586,000 | | | | — | | | | — | | | | 1,586,000 | |
| | Communications Equipment | | | 1,537,742 | | | | — | | | | — | | | | 1,537,742 | |
| | Semiconductors and Related Devices | | | 1,479,951 | | | | — | | | | — | | | | 1,479,951 | |
| | Nonstore Retailers | | | 1,370,400 | | | | — | | | | — | | | | 1,370,400 | |
| | Catalog & Mail-Order Houses | | | 504,912 | | | | — | | | | — | | | | 504,912 | |
| | Real Estate | | | 344,786 | | | | — | | | | — | | | | 344,786 | |
| | Retail Stores | | | — | | | | 22,792 | (a) | | | — | | | | 22,792 | |
| | Total Common Stocks | | | 106,714,592 | | | | 745,874 | | | | — | | | | 107,460,466 | |
| | Short Term Investment | | | | | | | | | | | | | | | | |
| | Money Market Fund | | | 42,184 | | | | — | | | | — | | | | 42,184 | |
| | Total Investments in Securities | | $ | 106,756,776 | | | $ | 745,874 | | | $ | — | | | $ | 107,502,650 | |
| | (a) | Certain non-U.S. dollar denominated securities use systematic fair valuation. |
JACOB FUNDS INC.
NOTES TO THE FINANCIAL STATEMENTS (Continued)
February 28, 2022 (Unaudited)
| | The following is a summary of the inputs used to value the Small Cap Growth Fund’s investments as of February 28, 2022: |
| | | | Level 1 | | | Level 2 | | | Level 3 | | | Total | |
| | Common Stocks | | | | | | | | | | | | |
| | Pharmaceutical Preparations | | $ | 1,645,044 | | | $ | — | | | $ | — | | | $ | 1,645,044 | |
| | Prepackaged Software | | | 1,389,944 | | | | — | | | | — | | | | 1,389,944 | |
| | Biological Products (No Diagnostic Substances) | | | 1,375,029 | | | | — | | | | — | | | | 1,375,029 | |
| | Industrial Organic Chemicals | | | 1,162,163 | | | | — | | | | — | | | | 1,162,163 | |
| | Surgical and Medical Instruments and Apparatus | | | 1,069,634 | | | | — | | | | — | | | | 1,069,634 | |
| | Business Services | | | 943,617 | | | | — | | | | — | | | | 943,617 | |
| | Patent Owners & Lessors | | | 940,367 | | | | — | | | | — | | | | 940,367 | |
| | State Commercial Banks | | | 894,255 | | | | — | | | | — | | | | 894,255 | |
| | Security Brokers, Dealers & Flotation Companies | | | 689,933 | | | | — | | | | — | | | | 689,933 | |
| | Computer Peripheral Equipment | | | 609,125 | | | | — | | | | — | | | | 609,125 | |
| | Miscellaneous Metal Ores | | | 541,058 | | | | — | | | | — | | | | 541,058 | |
| | Computer Programming Services | | | 490,800 | | | | — | | | | — | | | | 490,800 | |
| | Medical Laboratories | | | 378,184 | | | | — | | | | — | | | | 378,184 | |
| | Calculating & Accounting Machines | | | | | | | | | | | | | | | | |
| | (No Electronic Computers) | | | 375,050 | | | | — | | | | — | | | | 375,050 | |
| | Family Clothing Stores | | | 374,570 | | | | — | | | | — | | | | 374,570 | |
| | Eating Places | | | 320,700 | | | | — | | | | — | | | | 320,700 | |
| | Personal Services | | | 239,535 | | | | — | | | | — | | | | 239,535 | |
| | Computer Integrated Systems Design | | | 224,209 | | | | — | | | | — | | | | 224,209 | |
| | Semiconductors and Related Devices | | | 195,207 | | | | — | | | | — | | | | 195,207 | |
| | Nonstore Retailers | | | 171,300 | | | | — | | | | — | | | | 171,300 | |
| | Miscellaneous Business Services | | | 85,800 | | | | — | | | | — | | | | 85,800 | |
| | Total Common Stocks | | | 14,115,524 | | | | — | | | | — | | | | 14,115,524 | |
| | Total Investments in Securities | | $ | 14,115,524 | | | $ | — | | | $ | — | | | $ | 14,115,524 | |
JACOB FUNDS INC.
NOTES TO THE FINANCIAL STATEMENTS (Continued)
February 28, 2022 (Unaudited)
| | The following is a summary of the inputs used to value the Discovery Fund’s investments as of February 28, 2022: |
| | | | Level 1 | | | Level 2 | | | Level 3 | | | Total | |
| | Common Stocks | | | | | | | | | | | | |
| | Pharmaceutical Preparations | | $ | 10,385,128 | | | $ | — | | | $ | — | | | $ | 10,385,128 | |
| | Computer Peripheral Equipment | | | 6,363,311 | | | | — | | | | — | | | | 6,363,311 | |
| | Prepackaged Software | | | 5,150,635 | | | | — | | | | — | | | | 5,150,635 | |
| | Biological Products (No Diagnostic Substances) | | | 4,688,855 | | | | — | | | | — | | | | 4,688,855 | |
| | Surgical and Medical Instruments and Apparatus | | | 4,345,335 | | | | — | | | | — | | | | 4,345,335 | |
| | Business Services | | | 3,568,875 | | | | — | | | | — | | | | 3,568,875 | |
| | Help Supply Services | | | 3,424,229 | | | | — | | | | — | | | | 3,424,229 | |
| | Computer Communications Equipment | | | 2,969,757 | | | | — | | | | — | | | | 2,969,757 | |
| | Miscellaneous Metal Ores | | | 2,771,993 | | | | — | | | | — | | | | 2,771,993 | |
| | Industrial Organic Chemicals | | | 2,371,790 | | | | — | | | | — | | | | 2,371,790 | |
| | Security Brokers, Dealers & Flotation Companies | | | 2,051,400 | | | | — | | | | — | | | | 2,051,400 | |
| | State Commercial Banks | | | 2,027,189 | | | | — | | | | — | | | | 2,027,189 | |
| | Calculating & Accounting Machines | | | | | | | | | | | | | | | | |
| | (No Electronic Computers) | | | 1,931,622 | | | | — | | | | — | | | | 1,931,622 | |
| | Medical Laboratories | | | 1,929,283 | | | | — | | | | — | | | | 1,929,283 | |
| | Computer Processing & Data Preparation | | | 1,463,042 | | | | — | | | | — | | | | 1,463,042 | |
| | Functions Related to Depository Banking | | | 1,348,900 | | | | — | | | | — | | | | 1,348,900 | |
| | Electric Services | | | 1,170,215 | | | | — | | | | — | | | | 1,170,215 | |
| | Communications Equipment | | | 1,051,718 | | | | — | | | | — | | | | 1,051,718 | |
| | Semiconductors and Related Devices | | | 996,419 | | | | — | | | | — | | | | 996,419 | |
| | Electronic Components & Accessories | | | 861,480 | | | | — | | | | — | | | | 861,480 | |
| | Metal Mining | | | 801,000 | | | | — | | | | — | | | | 801,000 | |
| | Gold and Silver Ores | | | 720,000 | | | | — | | | | — | | | | 720,000 | |
| | Mining & Quarrying of | | | | | | | | | | | | | | | | |
| | Nonmetallic Minerals (No Fuels) | | | 688,200 | | | | — | | | | — | | | | 688,200 | |
| | Advertising Agencies | | | 661,007 | | | | — | | | | — | | | | 661,007 | |
| | Amusement & Recreation Services | | | 582,400 | | | | — | | | | — | | | | 582,400 | |
| | Computer Programming Services | | | — | | | | 419,710 | | | | — | | | | 419,710 | |
| | Games, Toys & Children’s Vehicles | | | | | | | | | | | | | | | | |
| | (No Dolls & Bicycles) | | | 364,000 | | | | — | | | | — | | | | 364,000 | |
| | Nonstore Retailers | | | 302,630 | | | | — | | | | — | | | | 302,630 | |
| | Advertising | | | 286,200 | | | | — | | | | — | | | | 286,200 | |
| | Real Estate | | | 236,392 | | | | — | | | | — | | | | 236,392 | |
| | Bottled & Canned Soft Drinks & Carbonated Waters | | | 141,024 | | | | — | | | | — | | | | 141,024 | |
| | Total Common Stocks | | | 65,654,029 | | | | 419,710 | | | | — | | | | 66,073,739 | |
| | Preferred Stocks | | | | | | | | | | | | | | | | |
| | Advertising Agencies | | | — | | | | — | | | | 67,738 | | | | 67,738 | |
| | Short Term Investment | | | | | | | | | | | | | | | | |
| | Money Market Fund | | | 1,135,161 | | | | — | | | | — | | | | 1,135,161 | |
| | Total Investments in Securities | | $ | 66,789,190 | | | $ | 419,710 | | | $ | 67,738 | | | $ | 67,276,638 | |
JACOB FUNDS INC.
NOTES TO THE FINANCIAL STATEMENTS (Continued)
February 28, 2022 (Unaudited)
| | The following is a reconciliation of Level 3 investments for the period from September 1, 2021 to February 28, 2022: |
| | | | Preferred Stocks | |
| | Beginning Balance – September 1, 2021 | | $ | — | |
| | Acquisitions | | | 18,017 | |
| | Change in unrealized appreciation/depreciation | | | 49,721 | |
| | Ending Balance – February 28, 2022 | | $ | 67,738 | |
| | Change in unrealized appreciation/deprecation | | | | |
| | on investments still held at February 28, 2022 | | $ | 49,721 | |
| | The Discovery Fund received preferred shares of SRAX, Inc. (the “Company”) as part of a corporate action spin off from the parent security, SRAX, Inc. – common stock on September 28, 2021. The corporate action noted that the preferred shares will hold approximately $6.5 million worth of Sequire client stock, the Company’s SasS data platform. During the six months ended February 28, 2022, the Adviser determined the fair value of the preferred shares of SRAX, Inc. considering available information including the percentage of cost factor transferred to the preferred shares, underlying value of the positions, and disclosures made by the Company in its financial reporting. The preferred shares of SRAX, Inc. are non-transferable and non-tradable. |
| | |
| | The following is a summary of the inputs used to value the Forward ETF’s investments as of February 28, 2022: |
| | | | Level 1 | | | Level 2 | | | Level 3 | | | Total | |
| | Common Stocks | | | | | | | | | | | | |
| | Prepackaged Software | | $ | 713,147 | | | $ | — | | | $ | — | | | $ | 713,147 | |
| | Computer Programming, Data Processing, Etc. | | | 560,691 | | | | — | | | | — | | | | 560,691 | |
| | Biological Products (No Diagnostic Substances) | | | 525,506 | | | | — | | | | — | | | | 525,506 | |
| | Business Services | | | 518,359 | | | | — | | | | — | | | | 518,359 | |
| | Pharmaceutical Preparations | | | 444,829 | | | | — | | | | — | | | | 444,829 | |
| | Industrial Organic Chemicals | | | 402,021 | | | | — | | | | — | | | | 402,021 | |
| | Surgical and Medical Instruments and Apparatus | | | 351,417 | | | | — | | | | — | | | | 351,417 | |
| | Patent Owners & Lessors | | | 320,986 | | | | — | | | | — | | | | 320,986 | |
| | State Commercial Banks | | | 306,752 | | | | — | | | | — | | | | 306,752 | |
| | Security Brokers, Dealers & Flotation Companies | | | 231,122 | | | | — | | | | — | | | | 231,122 | |
| | Computer Programmings Services | | | 163,743 | | | | — | | | | — | | | | 163,743 | |
| | Medical Laboratories | | | 163,371 | | | | — | | | | — | | | | 163,371 | |
| | Computer Peripheral Equipment | | | 140,731 | | | | — | | | | — | | | | 140,731 | |
| | Miscellaneous Amusement & Recreation | | | 94,933 | | | | — | | | | — | | | | 94,933 | |
| | Computer Integrated Systems Design | | | 71,695 | | | | — | | | | — | | | | 71,695 | |
| | Nonstore Retailers | | | 65,602 | | | | — | | | | — | | | | 65,602 | |
| | Semiconductors & Related Devices | | | 60,054 | | | | — | | | | — | | | | 60,054 | |
| | Catalog & Mail-Order Houses | | | 22,721 | | | | — | | | | — | | | | 22,721 | |
| | Total Common Stocks | | | 5,157,680 | | | | — | | | | — | | | | 5,157,680 | |
| | Short Term Investment | | | | | | | | | | | | | | | | |
| | Money Market Fund | | | 1,344 | | | | — | | | | — | | | | 1,344 | |
| | Total Investments in Securities | | $ | 5,159,024 | | | $ | — | | | $ | — | | | $ | 5,159,024 | |
JACOB FUNDS INC.
NOTES TO THE FINANCIAL STATEMENTS (Continued)
February 28, 2022 (Unaudited)
| | (b) Income Recognition—Interest income is accrued as earned. Dividend income is recorded on the ex-dividend date. |
| | |
| | (c) Expenses—Expenses that are not attributable to a particular Fund are typically allocated in proportion to each Fund’s respective net assets. Expenses, other than those which are class specific, are allocated to a particular share class in proportion to each class’s respective net assets. Expenses are recorded on an accrual basis. |
| | |
| | (d) Securities Transactions—Security transactions are accounted for on trade date. Realized gains and losses on securities sold are determined using specific identification. |
| | |
| | (e) Foreign Currency Transactions—The books and records are maintained in U.S. dollars. Foreign currency denominated transactions (i.e., market value of investment securities, assets and liabilities, purchases and sales of investment securities, and income and expenses) are translated into U.S. dollars at the current rate of exchange. |
| | |
| | The Funds do not isolate that portion of the results of operations resulting from changes in foreign exchange rates on investments from the fluctuations arising from changes in market prices of securities held. Such fluctuations are included with the net realized and unrealized gain or loss from investments. |
| | |
| | (f) Distributions to Shareholders—The Funds record distributions to shareholders on the ex-dividend date. Dividends from net investment income, if any, are declared and paid annually. Distributions of net realized capital gains, if any, will be declared and distributed annually. The amounts of distributions from net investment income and net realized capital gains are determined in accordance with federal income tax regulations, which may differ from those amounts determined under GAAP. These book/tax differences are either temporary or permanent in nature. To the extent these differences are permanent, reclassifications are made in the capital accounts in the period that the differences arise. The reclassifications have no effect on net assets or net asset value per share. |
| | |
| | (g) Federal Income Taxes—The Funds comply with provisions of Subchapter M of the Internal Revenue Code applicable to regulated investment companies, including the distribution of substantially all of the Funds’ taxable income. Accordingly, no provision for federal income taxes is considered necessary in the financial statements. |
| | |
| | The Funds follow accounting standards regarding recognition and measurement of tax positions taken on a tax return. No material uncertain tax positions existed as of August 31, 2021. As a result, the Funds have not recorded any liabilities for uncertain tax positions as of August 31, 2021. The standards require the Funds to analyze all open tax years, as defined by the Statute of Limitations, for all major jurisdictions. Open tax years are those that are open for examinations by taxing authorities. As of August 31, 2021, open federal tax years include the tax years ended August 31, 2018 through August 31, 2020. |
| | |
| | (h) Use of Estimates—The preparation of financial statements in conformity with GAAP requires management to make estimates and assumptions that affect the reported amount of assets and liabilities and disclosure of contingent assets and liabilities at the date of the financial statements and the reported amounts of revenues and expenses during the reporting period. Actual results could differ from those estimates. |
| | |
| | (i) Contingencies and Commitments—The Funds indemnify the Corporation’s Officers and Directors for certain liabilities that might arise from their performance of their duties to the Funds. Additionally, in the normal course of business, the Funds enter into contracts that contain a variety of representations and warranties and which provide general indemnifications. Each Fund’s maximum exposure under these arrangements is unknown, as this would involve future claims that may be made against the Funds that have not yet occurred. However, based on experience, the Corporation expects the risk of loss to be remote. |
JACOB FUNDS INC.
NOTES TO THE FINANCIAL STATEMENTS (Continued)
February 28, 2022 (Unaudited)
| | (j) COVID-19 Pandemic—The global outbreak of COVID-19 (commonly referred to as “coronavirus”) has disrupted economic markets and the prolonged economic impact is uncertain. The ultimate economic fallout from the pandemic, and the long-term impact on economies, markets, industries and individual issuers, are not known. The operational and financial performance of the issuers of securities in which the Funds invest depends on future developments, including the duration and spread of the outbreak, and such uncertainty may in turn adversely affect the value and liquidity of the Funds’ investments, impair the Funds’ ability to satisfy redemption requests, and negatively impact the Funds’ performance. |
NOTE 3—CAPITAL SHARE TRANSACTIONS
At February 28, 2022, there were twenty billion shares, $0.001 par value, authorized for the Corporation. Transactions in shares of the Internet Fund were as follows:
Institutional Class
| | | | Period Ended | |
| | | | February 28, 2022(a) | |
| | | | Shares | | | Amount | |
| | Sales | | | 29,507 | | | $ | 217,581 | |
| | Net increase | | | 29,507 | | | | 217,581 | |
| | Shares Outstanding: | | | | | | | | |
| | Beginning of period | | | — | | | | | |
| | End of period | | | 29,507 | | | | | |
| | (a) | Commencement of investment operations on December 31, 2021. |
Investor Class
| | | | Six Months Ended | | | Year Ended | |
| | | | February 28, 2022 | | | August 31, 2021 | |
| | | | Shares | | | Amount | | | Shares | | | Amount | |
| | Sales | | | 1,270,721 | | | $ | 13,258,658 | | | | 14,048,687 | | | $ | 152,314,100 | |
| | Reinvestments | | | 435,703 | | | | 4,330,889 | | | | 1,488,361 | | | | 11,281,774 | |
| | Redemptions | | | (3,803,398 | ) | | | (36,271,192 | ) | | | (9,164,639 | ) | | | (94,471,649 | ) |
| | Redemption fees | | | — | | | | 19,708 | | | | — | | | | 344,107 | |
| | Net increase (decrease) | | | (2,096,974 | ) | | $ | (18,661,937 | ) | | | 6,372,409 | | | $ | 69,468,332 | |
| | Shares Outstanding: | | | | | | | | | | | | | | | | |
| | Beginning of period/year | | | 16,002,591 | | | | | | | | 9,630,182 | | | | | |
| | End of period/year | | | 13,905,617 | | | | | | | | 16,002,591 | | | | | |
| | Total increase (decrease) | | | | | | | | | | | | | | | | |
| | for the Fund | | | | | | $ | (18,444,356 | ) | | | | | | $ | 69,468,332 | |
JACOB FUNDS INC.
NOTES TO THE FINANCIAL STATEMENTS (Continued)
February 28, 2022 (Unaudited)
Transactions in shares of the Small Cap Growth Fund were as follows:
Institutional Class
| | | | Six Months Ended | | | Year Ended | |
| | | | February 28, 2022 | | | August 31, 2021 | |
| | | | Shares | | | Amount | | | Shares | | | Amount | |
| | Sales | | | 4,734 | | | $ | 137,553 | | | | 50,759 | | | $ | 2,297,866 | |
| | Reinvestments | | | 45,139 | | | | 1,543,754 | | | | 40,082 | | | | 1,374,424 | |
| | Redemptions | | | (24,041 | ) | | | (917,310 | ) | | | (212,661 | ) | | | (8,156,837 | ) |
| | Redemption fees | | | — | | | | 946 | | | | — | | | | 16,757 | |
| | Net increase (decrease) | | | 25,832 | | | $ | 764,943 | | | | (121,820 | ) | | $ | (4,467,790 | ) |
| | Shares Outstanding: | | | | | | | | | | | | | | | | |
| | Beginning of period/year | | | 293,704 | | | | | | | | 415,524 | | | | | |
| | End of period/year | | | 319,536 | | | | | | | | 293,704 | | | | | |
| | | | | | | | | | | | | | | | | |
| Investor Class | | | | | | | | | | | | | | | | |
| | | | Six Months Ended | | | Year Ended | |
| | | | February 28, 2022 | | | August 31, 2021 | |
| | | | Shares | | | Amount | | | Shares | | | Amount | |
| | Sales | | | 17,957 | | | $ | 765,762 | | | | 359,330 | | | $ | 16,139,271 | |
| | Reinvestments | | | 34,044 | | | | 1,126,519 | | | | 24,131 | | | | 806,455 | |
| | Redemptions | | | (242,242 | ) | | | (9,419,648 | ) | | | (139,909 | ) | | | (5,827,929 | ) |
| | Redemption fees | | | — | | | | 681 | | | | — | | | | 14,588 | |
| | Net increase (decrease) | | | (190,241 | ) | | $ | (7,526,686 | ) | | | 243,552 | | | $ | 11,132,385 | |
| | Shares Outstanding: | | | | | | | | | | | | | | | | |
| | Beginning of period/year | | | 410,671 | | | | | | | | 167,119 | | | | | |
| | End of period/year | | | 220,430 | | | | | | | | 410,671 | | | | | |
| | Total increase (decrease) | | | | | | | | | | | | | | | | |
| | for the Fund | | | | | | $ | (6,761,743 | ) | | | | | | $ | 6,664,595 | |
JACOB FUNDS INC.
NOTES TO THE FINANCIAL STATEMENTS (Continued)
February 28, 2022 (Unaudited)
Transactions in shares of the Discovery Fund were as follows:
| Institutional Class | | | | | | | | | | | | |
| | | | Six Months Ended | | | Year Ended | |
| | | | February 28, 2022 | | | August 31, 2021 | |
| | | | Shares | | | Amount | | | Shares | | | Amount | |
| | Sales | | | 105,882 | | | $ | 4,499,769 | | | | 634,097 | | | $ | 29,090,401 | |
| | Reinvestments | | | 13,389 | | | | 560,864 | | | | 34,419 | | | | 1,093,502 | |
| | Redemptions | | | (183,687 | ) | | | (7,020,641 | ) | | | (493,898 | ) | | | (21,586,614 | ) |
| | Redemption fees | | | — | | | | 5,793 | | | | — | | | | 64,560 | |
| | Other transaction | | | — | | | | — | | | | — | | | | 1,272 | |
| | Net increase (decrease) | | | (64,416 | ) | | $ | (1,954,215 | ) | | | 174,618 | | | $ | 8,663,121 | |
| | Shares Outstanding: | | | | | | | | | | | | | | | | |
| | Beginning of period/year | | | 665,264 | | | | | | | | 490,646 | | | | | |
| | End of period/year | | | 600,848 | | | | | | | | 665,264 | | | | | |
| | | | | | | | | | | | | | | | | |
| Investor Class | | | | | | | | | | | | | | | | |
| | | | Six Months Ended | | | Year Ended | |
| | | | February 28, 2022 | | | August 31, 2021 | |
| | | | Shares | | | Amount | | | Shares | | | Amount | |
| | Sales | | | 545,801 | | | $ | 20,483,723 | | | | 3,453,116 | | | $ | 141,905,899 | |
| | Reinvestments | | | 37,569 | | | | 1,423,115 | | | | 22,974 | | | | 661,186 | |
| | Redemptions | | | (1,005,781 | ) | | | (36,118,008 | ) | | | (1,829,006 | ) | | | (71,468,351 | ) |
| | Redemption fees | | | — | | | | 15,446 | | | | — | | | | 141,832 | |
| | Other transaction | | | — | | | | — | | | | — | | | | 2,298 | |
| | Net increase (decrease) | | | (422,411 | ) | | $ | (14,195,724 | ) | | | 1,647,084 | | | $ | 71,242,864 | |
| | Shares Outstanding: | | | | | | | | | | | | | | | | |
| | Beginning of period/year | | | 1,958,451 | | | | | | | | 311,367 | | | | | |
| | End of period/year | | | 1,536,040 | | | | | | | | 1,958,451 | | | | | |
| | Total increase (decrease) | | | | | | | | | | | | | | | | |
| | for the Fund | | | | | | $ | (16,149,939 | ) | | | | | | $ | 79,905,985 | |
JACOB FUNDS INC.
NOTES TO THE FINANCIAL STATEMENTS (Continued)
February 28, 2022 (Unaudited)
Transactions in shares of the Forward ETF were as follows:
| | | | Six Months Ended | | | Year Ended | |
| | | | February 28, 2022 | | | August 31, 2021(b) | |
| | | | Shares | | | Amount | | | Shares | | | Amount | |
| | Sales | | | 60,000 | | | $ | 1,100,389 | | | | 360,000 | | | $ | 7,063,390 | |
| | Redemptions | | | (60,000 | ) | | | (997,390 | ) | | | — | | | | — | |
| | Transaction fees | | | — | | | | 43 | | | | — | | | | 2,082 | |
| | Net increase | | | — | | | $ | 103,042 | | | | 360,000 | | | $ | 7,065,472 | |
| | Shares Outstanding: | | | | | | | | | | | | | | | | |
| | Beginning of period | | | 360,000 | | | | | | | | — | | | | | |
| | End of period | | | 360,000 | | | | | | | | 360,000 | | | | | |
| | (b) | Commencement of investment operations on July 13, 2021. |
A 2% redemption fee is assessed on any shares of the Internet, Small Cap Growth and Discovery Funds, except those received from reinvested distributions, that are sold within 30 days following their purchase date.
Shares of the Forward ETF are listed and traded on New York Stock Exchange Arca, Inc. (“NYSE Arca”). Market prices for the shares may be different from its NAV. The Forward ETF issues and redeems shares on a continuous basis at NAV generally in blocks of 10,000 shares. The general blocks of shares issued or redeemed are called “Creation Units.” Creation Units are issued and redeemed principally in-kind for securities included in a specified universe. Once created, shares generally trade in the secondary market at market prices that change throughout the day. Except when aggregated in Creation Units, shares are not redeemable securities of a Fund. Creation Units of a Fund may only be purchased or redeemed by certain financial institutions (“Authorized Participants”). An Authorized Participant is either (i) a broker-dealer or other participant in the clearing process through the Continuous Net Settlement System of the National Securities Clearing Corporation or (ii) a Depository Trust Company participant and, in each case, must have executed a Participant Agreement with the Distributor. Most retail investors do not qualify as Authorized Participants nor have the resources to buy and sell whole Creation Units. Therefore, retail investors are unable to purchase or redeem the shares directly from a Fund. Rather, most retail investors may purchase shares in the secondary market with the assistance of a broker and are subject to customary brokerage commissions or fees.
The Forward ETF offers one class of shares, which have no front-end sales loads, no deferred sales charges, and no redemption fees. A fixed transaction fee is imposed for the transfer and other transaction costs associated with the purchase or sale of Creation Units. The Forward ETF charges $250 for the standard fixed transaction fee, payable to the Custodian. The fixed transaction fee may be waived on transaction orders if the Forward ETF’s Custodian has determined to waive some or all of the costs associated with the order, or another party, such as the Adviser, has agreed to pay such fee. In addition, a variable fee payable to the Fund may be charged on all cash transactions or substitutes for Creation Units of up to a maximum of 2% in the Forward ETF as a percentage of the value of the Creation Units subject to the transaction. Variable fees are imposed to compensate the Forward ETF for the transaction costs associated with the cash transactions fees. Variable fees received by the Forward ETF, if any, are displayed in the Capital Share Transactions sections of the Statements of Changes in Net Assets.
JACOB FUNDS INC.
NOTES TO THE FINANCIAL STATEMENTS (Continued)
February 28, 2022 (Unaudited)
From time to time, the Funds may have a concentration of shareholders holding a significant percentage of shares outstanding. Investment activities of these shareholders could have a material impact on the Funds. The following table shows the number of shareholders owning greater than 10% of the outstanding shares in each of the Funds at February 28, 2022:
| | | Number of shareholders owning greater |
| | Fund | than 10% of outstanding Fund shares |
| | Internet Fund Institutional Class | 2 |
| | Internet Fund Investor Class | 2 |
| | Small Cap Growth Fund Institutional Class | 3 |
| | Small Cap Growth Fund Investor Class | 3 |
| | Discovery Fund Institutional Class | 3 |
| | Discovery Fund Investor Class | 3 |
| | Forward ETF | 1 |
NOTE 4—INVESTMENT TRANSACTIONS
During the six months ended February 28, 2022, purchases and sales of investment securities (excluding in-kind purchases and redemptions and short-term investments) for the Funds were as follows:
| | Fund | | Purchases | | | Sales | |
| | Internet Fund | | $ | 29,417,133 | | | $ | 53,516,170 | |
| | Small Cap Growth Fund | | | 3,479,401 | | | | 13,134,476 | |
| | Discovery Fund | | | 12,071,006 | | | | 31,278,947 | |
| | Forward ETF | | | 1,757,135 | | | | 1,780,043 | |
During the six months ended February 28, 2022, in-kind transactions associated with creations and redemptions were as follows:
| | Fund | | Purchases | | | Sales | |
| | Forward ETF | | $ | 1,061,582 | | | $ | 979,186 | |
The Funds did not purchase long-term U.S. Government securities as a part of their investment strategies during the six months ended February 28, 2022.
JACOB FUNDS INC.
NOTES TO THE FINANCIAL STATEMENTS (Continued)
February 28, 2022 (Unaudited)
NOTE 5—TAX INFORMATION
At August 31, 2021, the components of accumulated earnings/(losses) on a tax basis for the Funds were as follows:
| | | | Internet | | | Small Cap | | | Discovery | | | Forward | |
| | | | Fund | | | Growth Fund | | | Fund | | | ETF | |
| | Cost of Investments | | $ | 99,118,375 | | | $ | 20,990,264 | | | $ | 98,752,659 | | | $ | 7,035,141 | |
| | Gross unrealized appreciation | | | 80,001,768 | | | | 11,452,343 | | | | 26,579,342 | | | | 691,154 | |
| | Gross unrealized depreciation | | | (8,910,203 | ) | | | (2,099,475 | ) | | | (13,627,413 | ) | | | (183,862 | ) |
| | Net unrealized appreciation | | $ | 71,091,565 | | | $ | 9,352,868 | | | $ | 12,951,929 | | | $ | 507,292 | |
| | Undistributed ordinary income | | | — | | | | — | | | | 721,115 | | | | 1,720 | |
| | Undistributed long-term capital gains | | | 1,582,410 | | | | 1,557,099 | | | | 1,440,476 | | | | — | |
| | Total distributable earnings | | $ | 1,582,410 | | | $ | 1,557,099 | | | $ | 2,161,591 | | | $ | 1,720 | |
| | Other accumulated losses | | $ | (1,582,132 | ) | | $ | — | | | $ | — | | | $ | (36,181 | ) |
| | Total accumulated earnings | | $ | 71,091,843 | | | $ | 10,909,967 | | | $ | 15,113,520 | | | $ | 472,831 | |
The differences between cost amounts for book purposes and tax purposes are primarily due to the tax deferral of losses on wash sales and Passive Foreign Investment Companies (“PFICs”). At August 31, 2021, the Forward ETF had $36,181 in short-term capital loss carryovers which are non-expiring. To the extent the Forward ETF realizes future net capital gains, taxable distributions to its shareholders will be offset by any unused capital loss carryover.
As of the fiscal year end August 31, 2021, the Internet Fund deferred, on a tax basis, late year losses of $1,582,132.
Dividends from net investment income and net realized gains, if any, are declared and paid at least annually for all Funds. All short-term capital gains are included in ordinary income for tax purposes. Distributions to shareholders are recorded on the ex-dividend date.
The tax character of distributions paid during the six months ended February 28, 2022, and the fiscal year ended August 31, 2021, were as follows:
| | | | Six Months Ended February 28, 2022 | | | Year Ended August 31, 2021 | |
| | | | Ordinary | | | Long-Term | | | Total | | | Ordinary | | | Long-Term | | | Total | |
| | | | Income | | | Capital Gains | | | Distributions | | | Income | | | Capital Gains | | | Distributions | |
| | Internet Fund | | $ | 83,992 | | | $ | 4,369,883 | | | $ | 4,453,875 | | | $ | — | | | $ | 11,729,504 | | | $ | 11,729,504 | |
| | Small Cap Growth Fund | | | 478,745 | | | | 2,272,220 | | | | 2,750,965 | | | | 1,116,015 | | | | 1,139,453 | | | | 2,255,468 | |
| | Discovery Fund | | | 721,138 | | | | 1,440,480 | | | | 2,161,618 | | | | 349,378 | | | | 1,433,955 | | | | 1,783,333 | |
| | Forward ETF | | | 26,864 | | | | — | | | | 26,864 | | | | — | | | | — | | | | — | |
JACOB FUNDS INC.
NOTES TO THE FINANCIAL STATEMENTS (Continued)
February 28, 2022 (Unaudited)
Reclassification Adjustments: Capital stock and distributable earnings (consisting of accumulated net investment income (loss) and accumulated net realized gain (loss)) have been adjusted in the Statements of Assets and Liabilities for permanent book-tax differences for the Funds. Differences primarily relate to the tax treatment of net operating losses, foreign currency gains and losses, equalization, REIT reclassifications, and short-term gains treated as ordinary income for tax purposes. To the extent these book and tax differences are permanent in nature, such amounts are reclassified at the end of the fiscal year among capital stock, accumulated net investment income (loss) and accumulated net realized gain (loss) on investments. Accordingly, at August 31, 2021 reclassifications were recorded as follows:
| | | | Internet | | | Small Cap | | | Discovery | |
| | | | Fund | | | Growth Fund | | | Fund | |
| | Distributable Earnings | | $ | (3,232,697 | ) | | $ | (1,043,405 | ) | | $ | (2,862,996 | ) |
| | Capital Stock | | | 3,232,697 | | | | 1,043,405 | | | | 2,862,996 | |
NOTE 6—INVESTMENT ADVISORY AND OTHER AGREEMENTS
The Corporation has entered into Investment Advisory Agreements (the “Advisory Agreements”) with Jacob Asset Management of New York LLC (the “Adviser”), with whom certain Officers and a Director of the Board are affiliated, to furnish investment advisory services to the Funds. Under the terms of the Advisory Agreements, the Corporation compensates the Adviser for its management services based on an annual rate of 0.80% of the Small Cap Growth Fund’s average daily net assets up to $250 million and 0.70% of annual average daily net assets over $250 million and 0.75% of the Forward ETF’s average daily net assets. The adviser fee of the Forward ETF is a unitary fee, whereby the Adviser has agreed to pay all of the ordinary operating expenses of the Fund, including the cost of transfer agency, custody, fund administration, legal, audit and other services. The Adviser is not responsible for, and the Fund will bear the cost of, (i) payments under the Fund's Rule 12b-1 plan, (ii) brokerage commissions and other expenses incidental to transactions in portfolio securities or instruments, (iii) acquired fund fees and expenses, (iv) taxes (including accrued deferred tax liability), (v) interest (including borrowing costs and dividend expenses on securities sold short and overdraft charges), (vi) litigation expenses (including litigation to which the Corporation or a Fund may be a party and indemnification of the Directors and officers with respect thereto), and (vii) other extraordinary or non-routine expenses (including expenses arising from mergers, acquisitions or similar transactions involving any Fund).
Effective June 1, 2021, the Corporation compensates the Adviser for its management services based on an annual rate of 1.25% of the Internet Fund’s average daily net assets up to $250 million and 0.90% of annual average net assets over $250 million and 1.10% of the Discovery Fund’s average daily net assets up to $250 million and 0.80% of annual average daily net assets over $250 million. Prior to June 1, 2021, the Corporation compensated the Adviser for its management services based on an annual rate of 1.25% of the Internet Fund’s average daily net assets up to $250 million and 1.00% of annual average net assets over $250 million and 1.10% of the Discovery Fund’s average daily net assets up to $250 million and 0.90% of annual average daily net assets over $250 million.
The Adviser has contractually agreed to waive its advisory fees in an amount up to an annual rate of 0.10% of the Internet Fund’s average daily net assets to the extent the Internet Fund’s total annual operating expenses (excluding any taxes, interest, brokerage fees, acquired fund fees and expenses and extraordinary expenses) exceed 2.95% of the average daily net assets through at least January 5, 2023. The Adviser has the ability to recoup amounts waived for a period of thirty-six months following such fee waivers to the extent that such recoupment by the Adviser will not cause the Internet Fund to exceed any applicable expense limitation in place when the fee was waived. For the six months ended February 28, 2022, fees of $2 were waived by the Adviser with respect to the Internet Fund.
JACOB FUNDS INC.
NOTES TO THE FINANCIAL STATEMENTS (Continued)
February 28, 2022 (Unaudited)
Effective November 12, 2012 (date of reorganization of the Predecessor Small Cap Growth Fund into the Small Cap Growth Fund) the Adviser contractually agreed to waive up to 100% of its advisory fee to the extent the Small Cap Growth Fund’s total annual operating expenses (excluding any taxes, interest, brokerage fees, acquired fund fees and expenses and extraordinary expenses) exceed 2.25% and 1.95% for Investor Class and Institutional Class Shares, respectively, of each class’ average daily net assets through at least January 5, 2023. The Adviser has the ability to recoup amounts waived for a period of thirty-six months following such fee waivers to the extent that such recoupment by the Adviser will not cause the Fund to exceed any applicable expense limitation in place when the fee was waived. For the six months ended February 28, 2022, fees of $5,492 were waived by the Adviser with respect to the Small Cap Growth Fund.
Effective November 12, 2012 (date of reorganization of the Predecessor Micro Cap Growth Fund into the Discovery Fund) the Adviser contractually agreed to waive up to 100% of its advisory fee to the extent the Discovery Fund’s total annual operating expenses (excluding any taxes, interest, brokerage fees, acquired fund fees and expenses and extraordinary expenses) exceed 2.45% and 2.15% for Investor Class and Institutional Class Shares, respectively, of each class’ average daily net assets through December 28, 2016. Effective December 29, 2016, the Adviser contractually agreed to waive up to 100% of its advisory fee to the extent the Discovery Fund’s total annual operating expenses (excluding any taxes, interest, brokerage fees, acquired fund fees and expenses and extraordinary expenses) exceed 2.30% and 2.00% for Investor Class and Institutional Class shares, respectively, of each class’ average daily net assets through at least January 5, 2023. The Adviser has the ability to recoup amounts waived for a period of thirty-six months following such fee waivers to the extent that such recoupment by the Adviser will not cause the Fund to exceed any applicable expense limitation in place when the fee was waived. For the six months ended February 28, 2022, the Adviser did not waive any fees with respect to the Discovery Fund. The amounts below are eligible for recoupment by the Adviser, however, the Adviser has not begun recouping as of February 28, 2022.
Following is a schedule of when fees may be recouped:
| | Internet | | | Small Cap | | | Discovery | | |
| | Fund | | | Growth Fund | | | Fund | | Expiration |
| | $ | — | | | $ | 27,431 | | | $ | 55,026 | | August 31, 2022 |
| | | — | | | | 90,687 | | | | 130,104 | | August 31, 2023 |
| | | — | | | | 17,434 | | | | 24,199 | | August 31, 2024 |
| | | 2 | | | | 5,492 | | | | — | | August 31, 2025 |
| | $ | 2 | | | $ | 141,044 | | | $ | 209,329 | | |
U.S. Bancorp Fund Services, LLC, doing business as U.S. Bank Global Fund Services (“Fund Services”) and an indirect wholly owned subsidiary of U.S. Bancorp, serves as transfer agent, administrator and accounting services agent for the Funds. U.S. Bank, N.A. serves as custodian for the Funds. All providers receive customary fees for services rendered.
NOTE 7—DISTRIBUTION AND SERVICE PLAN
The Corporation, on behalf of the Internet Fund, has adopted a distribution and service plan (the “Internet Fund Plan”), pursuant to Rule 12b-1 under the 1940 Act. The Internet Fund Plan provides that the Internet Fund will compensate the Adviser 0.25% per annum of the Internet Fund’s average daily net assets for certain expenses and costs incurred in connection with providing shareholder servicing and maintaining shareholder accounts and to compensate parties with which it has written agreements and whose clients own shares of the Internet Fund for providing servicing to their
JACOB FUNDS INC.
NOTES TO THE FINANCIAL STATEMENTS (Continued)
February 28, 2022 (Unaudited)
clients (“Shareholder Servicing Fee”). The Internet Fund Plan also provides for a distribution fee equal to 0.10% of the Internet Fund’s average daily net assets on an annual basis (“Asset Based Sales Charge”). The fee is used to compensate Quasar Distributors, LLC, the Funds’ distributor (the “Distributor”), for basic distribution services, out of pocket expenses incurred in connection with activities to sell Internet Fund shares, advertising, compliance reviews, and licensing of the Adviser’s staff. The Distributor may make payments from time to time from the Asset Based Sales Charge to broker-dealers and other financial professionals whose clients are Internet Fund shareholders for providing distribution assistance and promotional support to the Internet Fund. Remaining amounts of the Asset Based Sales Charge may be used to satisfy distribution costs as directed by the Adviser. Effective September 1, 2016 through at least January 5, 2023, the Board determined to reduce such fees payable under the Internet Fund Plan from 0.35% to 0.25% of the Internet Fund’s average daily net assets on an annual basis. The Internet Fund incurred $185,282 in expenses pursuant to the Internet Fund Plan for the six months ended February 28, 2022.
The Corporation, on behalf of the Small Cap Growth Fund and Discovery Fund, has adopted a distribution and service plan (the “Plan”) pursuant to Rule 12b-1 under the 1940 Act. Rule 12b-1 provides that an investment company that bears any direct or indirect expense of distributing its shares must do so only in accordance with the Plan as permitted by Rule 12b-1. Pursuant to the Plan, the Small Cap Growth Fund and Discovery Fund make payments to the Distributor, the Adviser, financial intermediaries or others to reimburse such parties for distribution and/or shareholder servicing activity in an amount not to exceed 0.35% of the average daily net assets of the Investor Class shares of the Small Cap Growth and Discovery Funds on an annual basis. Effective September 1, 2016 through at least January 5, 2023, the Board determined to reduce such fees payable under the Plan from 0.35% to 0.25% of the average daily net assets of the Investor Class shares of the Small Cap Growth and Discovery Funds. The distribution fees are “asset based” sales charges and, therefore, long-term shareholders may pay more in total sales charges than the economic equivalent of the maximum front-end sales charge permitted by the Financial Industry Regulatory Authority (FINRA). The Small Cap Growth Fund incurred $11,506 and the Discovery Fund incurred $85,723 in expenses pursuant to the Plan for the six months ended February 28, 2022.
NOTE 8—INDUSTRY CONCENTRATION RISK
Internet and Internet-Related Industries Risk: The Internet Fund invests a significant portion of its assets in Internet and Internet-related industries and thus the value of the Fund’s shares may be susceptible to factors affecting such industries, including factors affecting the computer/Internet technology area generally, and may be susceptible to greater risk and market fluctuation than an investment in a fund that invests in a broader range of portfolio securities not concentrated in any particular area or industry. Companies in Internet and Internet-related industries face special risks associated with the rapidly changing field of computer/Internet technology. For example, their products or services may not prove commercially successful or may become obsolete quickly. The computer/Internet technology area may be subject to greater governmental regulation than many other areas and changes in governmental policies and the need for regulatory approvals may have a material adverse effect on these areas. Additionally, companies in these areas may be subject to risks of developing technologies, competitive pressures and other factors and are dependent upon consumer and business acceptance as new technologies evolve. Many Internet and Internet-related companies incur large losses in the hope of capturing market share and generating future revenues, but may never be profitable.
Science and Technology Risk: The Funds’ investments in science and technology companies expose the Small Cap Growth Fund and Discovery Fund to special risks. For example, rapid advances in science and technology might cause
JACOB FUNDS INC.
NOTES TO THE FINANCIAL STATEMENTS (Continued)
February 28, 2022 (Unaudited)
existing products to become obsolete, and the Fund’s returns could suffer to the extent it holds an affected company’s shares. Companies in a number of science and technology industries are also subject to more government regulations and approval processes than many other industries. This fact may affect a company’s overall profitability and cause its stock price to be more volatile. Additionally, science and technology companies are dependent upon consumer and business acceptance as new technologies evolve.
NOTE 9—SUBSEQUENT EVENTS
In preparing these financial statements, the Funds have evaluated events after February 28, 2022 and determined that there were no subsequent events that would require adjustment to or additional disclosure in these financial statements.
JACOB FUNDS INC.
ADDITIONAL INFORMATION ON FUND EXPENSES (Unaudited)
For the Six Months Ended February 28, 2022 for the Internet Fund, Small Cap Growth Fund, Discovery Fund and Forward ETF
As a shareholder of a mutual fund, you may incur two types of costs: (1) transaction costs, including sales charges (loads) on purchase payments, reinvested dividends, or other distributions; redemption fees; and exchange fees; and (2) ongoing costs, including management fees; distribution and/or service (12b-1) fees; and other fund expenses. The Funds do not currently charge sales charges (loads) or exchange fees. The Funds assess a redemption fee of 2% on shares sold within 30 days following their purchase date. In addition, you will be assessed fees for outgoing wire transfers, returned checks and stop payment orders. The Funds charge management fees and distribution and/or service (12b-1) fees. The Expense Example is intended to help you understand your ongoing costs (in dollars) of investing in the Funds and to compare these costs with the ongoing costs of investing in other mutual funds. The Example is based on an investment of $1,000 invested at the beginning of the period and held for the entire period (9/1/2021–2/28/2022) for the Internet Fund, Small Cap Growth Fund, Discovery Fund and Forward ETF.
Actual Expenses
The first line of the table below provides information about account values based on actual returns and actual expenses. Although the Funds charge no sales load, the Funds charge a redemption fee of 2% on shares sold within 30 days following the purchase date. In addition, you will be assessed fees for outgoing wire transfers, returned checks and stop payment orders at prevailing rates charged by U.S. Bancorp Fund Services, LLC, the Funds’ transfer agent. If you request that a redemption be made by wire transfer, currently the Funds’ transfer agent charges a $15.00 fee. The Example does not reflect transactional costs, such as redemption fees. You may use the information in the first line below, together with the amount you invested, to estimate the expenses that you paid over the period. Simply divide your account value by $1,000 (for example, an $8,600 account value divided by $1,000 = 8.6), then multiply the result by the number in the first line under the heading entitled “Expenses Paid During the Period” to estimate the expenses you paid on your account during this period.
Hypothetical Example for Comparison Purposes
The second line of the table below provides information about hypothetical account values based on a hypothetical return and hypothetical expenses based on a Fund’s actual expense ratio and an assumed rate of return of 5% per year before expenses, which is not a Fund’s actual return. The hypothetical account values and expenses may not be used to estimate the actual ending account balance or expenses you paid for the period. You may use this information to compare the ongoing costs of investing in the Funds and other funds. To do so, compare this 5% hypothetical example with the 5% hypothetical examples that appear in the shareholder reports of the other funds. Please note that the expenses shown in the table are meant to highlight your ongoing costs only and do not reflect transactional costs, such as redemption fees. Therefore, the second line of the table is useful in comparing ongoing costs only, and will not help you determine the relative total costs of owning different funds. In addition, if the transactional costs were included, your costs would have been higher.
JACOB FUNDS INC.
ADDITIONAL INFORMATION ON FUND EXPENSES (Unaudited) (Continued)
Internet Fund – Institutional Class
| | Beginning Account | Ending Account | Expenses Paid |
| | Value | Value 2/28/22 | During the Period |
| Actual* | $1,000.00 | $ 812.40 | $3.88 |
| Hypothetical (5% annual return before expenses)** | $1,000.00 | $1,003.80 | $4.29 |
_______________
| * | | Actual expenses are equal to the Institutional Class’s annualized expense ratio of 2.65% multiplied by the average account value over the period, multiplied by 59/365 to reflect the most recent fiscal period end since the Class commenced operations on December 31, 2021. |
| ** | | Hypothetical expenses are equal to the Institutional Class’s annualized expense ratio of 2.65% multiplied by the average account value over the period commencing September 1, 2021, multiplied by 181/365 to reflect information had the Class been in operation for the entire fiscal half year. |
Internet Fund – Investor Class
| | | | Expenses Paid |
| | Beginning Account | Ending Account | During the Period |
| | Value 9/1/21 | Value 2/28/22 | 9/1/21 – 2/28/22* |
| Actual | $1,000.00 | $ 746.50 | $8.37 |
| Hypothetical (5% annual return before expenses) | $1,000.00 | $1,015.20 | $9.66 |
_______________
| * | | Expenses are equal to the Internet Fund’s annualized expense ratio of 1.93% multiplied by the average account value over the period multiplied by 181/365 (to reflect the one-half year period). |
Small Cap Growth Fund – Institutional Class
| | | | Expenses Paid |
| | Beginning Account | Ending Account | During the Period |
| | Value 9/1/21 | Value 2/28/22 | 9/1/21 – 2/28/22* |
| Actual | $1,000.00 | $ 709.30 | $8.26 |
| Hypothetical (5% annual return before expenses) | $1,000.00 | $1,015.12 | $9.74 |
_______________
| * | | Expenses are equal to the Institutional Class’s annualized expense ratio of 1.95% multiplied by the average account value over the period multiplied by 181/365 (to reflect the one-half year period). |
Small Cap Growth Fund – Investor Class
| | | | Expenses Paid |
| | Beginning Account | Ending Account | During the Period |
| | Value 9/1/21 | Value 2/28/22 | 9/1/21 – 2/28/22* |
| Actual | $1,000.00 | $ 707.80 | $ 9.41 |
| Hypothetical (5% annual return before expenses) | $1,000.00 | $1,013.77 | $11.10 |
_______________
| * | | Expenses are equal to the Investor Class’s annualized expense ratio of 2.22% multiplied by the average account value over the period multiplied by 181/365 (to reflect the one-half year period). |
JACOB FUNDS INC.
ADDITIONAL INFORMATION ON FUND EXPENSES (Unaudited) (Continued)
Discovery Fund – Institutional Class
| | | | Expenses Paid |
| | Beginning Account | Ending Account | During the Period |
| | Value 9/1/21 | Value 2/28/22 | 9/1/21 – 2/28/22* |
| Actual | $1,000.00 | $ 752.80 | $7.15 |
| Hypothetical (5% annual return before expenses) | $1,000.00 | $1,016.64 | $8.22 |
_______________
| * | | Expenses are equal to the Institutional Class’s annualized expense ratio of 1.64% multiplied by the average account value over the period multiplied by 181/365 (to reflect the one-half year period). |
Discovery Fund – Investor Class
| | | | Expenses Paid |
| | Beginning Account | Ending Account | During the Period |
| | Value 9/1/21 | Value 2/28/22 | 9/1/21 – 2/28/22* |
| Actual | $1,000.00 | $ 751.70 | $8.19 |
| Hypothetical (5% annual return before expenses) | $1,000.00 | $1,015.45 | $9.42 |
_______________
| * | | Expenses are equal to the Investor Class’s annualized expense ratio of 1.88% multiplied by the average account value over the period multiplied by 181/365 (to reflect the one-half year period). |
Forward ETF
| | | | Expenses Paid |
| | Beginning Account | Ending Account | During the Period |
| | Value 9/1/21 | Value 2/28/22 | 9/1/21 – 2/28/22* |
| Actual* | $1,000.00 | $ 686.90 | $3.14 |
| Hypothetical (5% annual return before expenses) | $1,000.00 | $1,021.08 | $3.76 |
_______________
| * | | Actual expenses are equal to the Forward ETF’s annualized expense ratio of 0.75% multiplied by the average account value over the period, multiplied by 181/365 (to reflect the one-half year period). |
JACOB FUNDS INC.
ADDITIONAL INFORMATION (Unaudited)
Approval of the Investment Advisory Agreements
During the fiscal quarter ended November 30, 2021, the Board of Directors (the “Board”), including all of the Independent Directors, considered and approved the renewal of the Investment Advisory Agreements between Jacob Funds Inc. (the “Company”), on behalf of the Jacob Internet Fund (the “Internet Fund”), Jacob Small Cap Growth Fund (the “Small Cap Fund”) and Jacob Discovery Fund (the “Discovery Fund” and, together with the Internet Fund and the Small Cap Fund, the “Funds”), and Jacob Asset Management of New York LLC (the “Adviser”) (collectively, the “Investment Advisory Agreements”) for an additional year. The Board also considered the continuation of the Fee Waiver Agreements between the Adviser and the Company, on behalf of the Internet Fund, Small Cap Fund and Discovery Fund (collectively, the “Fee Waiver Agreements”), which the Adviser offered to continue for an additional year. While the Investment Advisory Agreements for the Funds were considered at the same Board meeting, the Board dealt with each Fund separately.
In reaching its decision to renew the Investment Advisory Agreements, the Board took into account a combination of factors, such as: (i) the nature, extent and quality of the services to be provided by the Adviser; (ii) each Fund’s performance; (iii) each Fund’s fees and expenses; (iv) the costs of the services provided and the profits realized by the Adviser; (v) whether economies of scale would be realized by the Adviser with respect to each Fund as it grows larger and the extent to which this is reflected in the level of the management fee charged, specifically the Adviser’s continued monitoring of the appropriateness of existing fee breakpoints in the management fees for each Fund. The Board did not identify any single factor as all-important or controlling, and each Director may have weighed a particular piece of information or factor differently than another Director. This summary does not detail all of the matters considered by the Board.
The materials provided to, and discussed by, the Board in connection with the renewal of the Investment Advisory Agreements included, among other things: (i) a description of the Adviser’s business, operations and qualifications; (ii) a description of personnel, including responsibilities, changes since the last renewal of the Investment Advisory Agreements (the “last renewal”) and compensation policies; (iii) a description of the advisory services provided to the Funds, including a discussion of how investment decisions are made and executed; (iv) a description of any services other than investment advice provided to the Funds by the Adviser; (v) a copy of the Adviser’s most recent Form ADV; (vi) a balance sheet and profit and loss statement for the Adviser; (vii) a description of the management fees and a peer group comparison along with a discussion of the appropriateness of the fees; (viii) a description of any issues or recommendations with respect to the Company’s compliance program since the last renewal; (ix) a description of the Company’s expenses, including expense ratios and comparative expense ratios, costs incurred by the Adviser and brokerage expenses; (x) a description of errors and omission insurance coverage that is currently in place; (xi) a copy of the Investment Advisory Agreements with the Adviser, which, among other things, described the services provided to the Funds and the compensation to be paid for such services; (xii) a copy of the Fee Waiver Agreements with the Adviser; (xiii) Morningstar Inc. (“Morningstar”) comparative industry peer group data for the Funds’ performance for various periods ended August 31, 2021; and (xiv) Morningstar comparative industry peer group data regarding the investment advisory fees and net expense ratios of the Funds (less Rule 12b-1 fees) for the period ended August 31, 2021.
When considering the nature and quality of the services provided by the Adviser to the Funds, the Board reviewed: (a) the scope and depth of the Adviser’s organization; (b) the experience and expertise of the Adviser’s investment professionals that provide management services to the Funds; and (c) the Adviser’s investment advisory capabilities. The Board evaluated the Adviser’s portfolio management process and investment approach. The Board also considered
JACOB FUNDS INC.
ADDITIONAL INFORMATION (Unaudited) (Continued)
the nature and character of non-investment management services that are provided by the Adviser, including certain administrative services and the Adviser’s marketing strategy for the Funds. After analyzing the caliber of services provided by the Adviser to the Funds, both quantitatively and qualitatively, the Board concluded that the nature, extent and quality of services provided to the Funds were consistent with the terms of the Investment Advisory Agreements and the Funds’ operational requirements.
The Board reviewed the investment performance of each Fund. While consideration was given to performance reports and discussions throughout the year, attention in assessing performance was given to the comparative data furnished in connection with the renewal of the Investment Advisory Agreements. In particular, the Board noted the performance of each Fund relative to its Morningstar peer group and benchmark indices over various periods ended August 31, 2021.
With respect to the Internet Fund, the Board considered that the Fund’s performance results were above the median and average performance of its Morningstar peer group (US Fund Technology Funds Category) for the year-to-date, one-, three-, five- and ten-year periods ended August 31, 2021. The Board considered that the Internet Fund was ranked first among Morningstar peer group and it had also outperformed its benchmark index (the Nasdaq Composite Index) for the same periods.
With respect to the Small Cap Fund, the Board considered that the Fund’s performance results were above the median performance of its Morningstar peer group (US Fund Small Growth Fund Category) for the one-, three- and five-year periods, and overperformed comparatively with the average performance of the Morningstar category for the same periods, as well as the year-to-date period ended August 31, 2021. The Board considered that the Small Cap Fund had also outperformed its benchmark index (the Russell 2000 Growth Index) for the year-to-date, one-, three-, and five-year periods.
With respect to the Discovery Fund, the Board considered that the Fund’s performance results were above the median and average performance of its Morningstar peer group (US Fund Small Growth Fund Category) for the year-to-date and one-, three-, and five-year periods. The Board considered that the Discovery Fund’s Morningstar net expense ratio versus three-year return among peer group percentile ranking was 4%. The Board noted that the Discovery Fund significantly outperformed its benchmark indices (Russell Microcap Growth Index and Russell 2000 Growth Index) for the one-, three- and five-year performance periods as of August 31, 2021.
The Board reviewed the advisory fees and overall expenses of each Fund and discussed the difference in fees and expenses compared to other funds within each Fund’s Morningstar peer group. The Board discussed the allocation of expenses among the Funds and the manner in which each Fund bears its appropriate share of the expenses, noting the relatively small size of the Small Cap Fund. Mr. Jacob discussed the Adviser’s ongoing effort to increase economies of scales to reduce fund expenses, and the plan to continue waiving the right to recoupment in an effort to achieve lower expense ratios for the Funds. The Board also noted its intention to continue to maintain the 12b-1 fees payable under the distribution and service plans of the Funds at 25 basis points, which went into effect on September 1, 2016 (Investor Class shares only), through at least January 5, 2023.
With respect to the advisory fees and overall expenses of the Internet Fund, the Board considered that the Internet Fund’s advisory fees and net expense ratio (excluding 12b-1 fees) were above the median and average of its Morningstar peer group. The Board also considered the Fee Waiver Agreement and reduction in 12b-1 fees payable under the distribution and service plan of the Internet Fund, each to be continued through at least January 5, 2023. The Board discussed the competitiveness of the Fund’s advisory fees and net expense ratio (excluding 12b-1 fees) in light of the
JACOB FUNDS INC.
ADDITIONAL INFORMATION (Unaudited) (Continued)
size of the Internet Fund and noted that the Internet Fund’s expenses had been subsidized by an advisory fee waiver over various periods. While noting the Internet Fund’s advisory fees and overall expenses compared to the Morningstar peer group, including percentile rankings, the Board was satisfied overall that the Adviser has taken actions in an effort to improve the Internet Fund’s comparative expenses.
With respect to the advisory fees and overall expenses of the Small Cap Fund, the Board considered that the Small Cap Fund’s net expense ratio (excluding 12b-1 fees) for Investor Class shares was above the median and average of its Morningstar peer group, however, the Small Cap Fund’s advisory fees were below the median and average of its Morningstar peer group. The Board also considered the Fee Waiver Agreement and reduction in 12b-1 fees payable under the distribution and service plan of the Fund, each to be continued through at least January 5, 2023. The Board discussed the competitiveness of the Small Cap Fund’s advisory fees and net expense ratio (excluding 12b-1 fees) in light of the size of the Small Cap Fund and noted that the Fund’s expenses were subsidized by an advisory fee waiver (where the Adviser will waive a portion of its advisory fees above certain expense levels) over a period of time during the fiscal year ended August 31, 2021. The Board was satisfied that the Adviser has taken actions to improve the Small Cap Fund’s comparative expenses.
With respect to the advisory fees and overall expenses of the Discovery Fund, the Board considered that the Discovery Fund’s advisory fees and net expense ratio (excluding 12b-1 fees) for Investor Class shares were above the median and average of its Morningstar peer groups. The Board also considered the Fee Waiver Agreement and reduction in 12b-1 fees payable under the distribution and service plan of the Discovery Fund, each to be continued through at least January 5, 2023. The Board discussed the competitiveness of the Discovery Fund’s advisory fees and net expense ratio (excluding 12b-1 fees) in light of the size of the Discovery Fund and noted that the Discovery Fund’s expenses were subsidized by an advisory fee waiver (where the Adviser will waive a portion of its advisory fees above certain expense levels) over a period of time during the fiscal year ended August 31, 2021. The Board was satisfied that the Adviser has taken actions to improve the Discovery Fund’s comparative expenses.
The Board discussed the profitability, projected revenue growth and financial viability of the Adviser; other benefits received by the Adviser in connection with the management of the Funds; the extent to which there are economies of scale in the provision of advisory services; and whether the Adviser may realize additional economies of scale in the future. In considering the various factors, the Board’s fiduciary duties to the Funds’ shareholders, and the body of law governing the approval of investment advisory agreements, the Independent Directors received assistance and advice from independent legal counsel and counsel to the Company.
Based on all of the above-mentioned factors and their related conclusions, with no single factor or conclusion being determinative, and with each Independent Director not necessarily attributing the same weight to each factor, the Independent Directors concluded that (i) the Adviser demonstrated that it possessed the capability and resources to perform the duties required of it under the Investment Advisory Agreements; (ii) the compensation payable to the Adviser under the Investment Advisory Agreements was fair and reasonable; and (iii) the compensation and other terms of the Investment Advisory Agreements were appropriate and in the best interests of each of the Funds and its shareholders.
JACOB FUNDS INC.
ADDITIONAL INFORMATION (Unaudited) (Continued)
Statement Regarding Liquidity Risk Management Program
In compliance with Rule 22e-4 under the Investment Company Act of 1940, as amended (the “Liquidity Rule”), Jacob Funds Inc. (the “Trust”) has adopted and implemented a written liquidity risk management program (the “Program”) on behalf of each of its series (each, a “Fund” and collectively, the “Funds”). The Jacob Forward ETF series is referred to herein as the “Forward ETF” and the other series of the Trust are referred to collectively as the “Mutual Funds.”
The Board of Trustees of the Trust (the “Board”) previously approved the designation of Jacob Asset Management of New York LLC (“JAM”) as the program administrator for the Program. As required by the Liquidity Rule, JAM provided the Board with a report that addressed the operation of the Program and assessed its adequacy and effectiveness of implementation, including the operation of any Highly Liquid Investment Minimum (“HLIM”), as applicable, and any material changes to the Program (the “Report”). The Report covered the period from September 1, 2020 through August 31, 2021 (the “Review Period”).
The Report reviewed notable liquidity events during the Review period, including the ongoing impact of the coronavirus outbreak on the Funds and the overall market. The Report also discussed the Program’s liquidity classification process, as applicable to the Mutual Funds, which includes input from a third-party liquidity data vendor, and reviewed the process for reporting the Funds’ liquidity classifications on Form N-PORT. In addition, the Report discussed JAM’s annual review of each Fund’s liquidity risk and key conclusions from the review.
The Report noted that each Mutual Fund primarily holds highly liquid investments and, accordingly, no Fund (including the Forward ETF that operates as an in-kind exchange-traded fund under the Liquidity Rule) established or was required to implement an HLIM during the Review Period. The Report also stated that no Fund exceeded the 15% limitation on illiquid investments during the Review Period.
In addition, the Report stated that material changes were made to the Program during the Review Period to include the Forward ETF. The Report further stated that JAM concluded the Program operated and was effectively implemented in accordance with the requirements of the Liquidity Rule during the Review Period, and is reasonably designed to assess and manage the Funds’ liquidity risks.
JACOB FUNDS INC.
ADDITIONAL INFORMATION (Unaudited) (Continued)
Proxy Voting
A description of the policies and procedures that the Funds use to determine how to vote proxies relating to portfolio securities is available without charge by calling toll-free 1-888-JACOB-FX (522-6239) or on the SEC website at http://www.sec.gov.
Proxy Voting Record
Information regarding how the Funds voted proxies relating to portfolio securities during the most recent 12-month period ended June 30 is available without charge by calling 1-888-JACOB-FX (522-6239) or on the SEC website at http://www.sec.gov.
Holdings Disclosure
The Funds’ Semi-Annual and Annual Reports include a complete schedule of portfolio holdings for the second and fourth quarters of each fiscal year.
The Funds file their complete schedule of portfolio investments with the SEC for the first and third quarters of each fiscal year on Form N-PORT, and for periods prior to March 31, 2020, on Form N-Q. The Funds’ Form N-Q or Form N-PORT is available on the SEC website at http://www.sec.gov and may be reviewed and copied at the SEC’s Public Reference Room in Washington D.C. Information on the operation of the Public Reference Room may be obtained by calling 1-800-SEC-0330.
ADDITIONAL TAX INFORMATION (Unaudited)
For the year ended August 31, 2021, certain dividends paid by the Funds may be subject to a maximum tax rate of 20%. The percentage of dividends declared from net investment income designated as qualified income is as follows:
| Small Cap Growth Fund | | | 2.83 | % | |
| Discovery Fund | | | 11.32 | % | |
For corporate shareholders, the percent of ordinary income distributions qualifying for the corporate dividends received deduction for the year ended August 31, 2021 is as follows:
| Small Cap Growth Fund | | | 1.89 | % | |
| Discovery Fund | | | 11.32 | % | |
The percentage of taxable ordinary income distributions that are designated as short-term capital gain distributions under Internal Revenue Code Section 871(k)(2)(C) is as follows:
| Small Cap Growth Fund | | | 100.00 | % | |
| Discovery Fund | | | 100.00 | % | |
The Funds designated as long-term capital gain dividend, pursuant to Internal Revenue Service Section 852(b)(3)(C), the amount necessary to reduce the earnings and profits of the Fund related to net capital gain to zero for the tax year ended August 31, 2021:
| Internet Fund | | $ | 14,962,201 | | |
| Small Cap Growth Fund | | $ | 1,805,168 | | |
| Discovery Fund | | $ | 4,296,951 | | |
(This Page Intentionally Left Blank.)
Semi-Annual Report
February 28, 2022
JACOB INTERNET FUND
JACOB SMALL CAP GROWTH FUND
JACOB DISCOVERY FUND
JACOB FORWARD ETF
Jacob Asset Management of New York LLC
1-888-JACOB-FX (522-6239)
www.jacobmutualfunds.com
Investment Adviser
Jacob Asset Management of New York LLC
Administrator and Transfer Agent
and Dividend Agent
U.S. Bancorp Fund Services, LLC
Underwriter and Distributor
Quasar Distributors, LLC
Custodian
U.S. Bank, N.A.
Legal Counsel
Stradley Ronon Stevens & Young, LLP
Independent Registered Public
Accounting Firm
BBD, LLP
This report has been prepared for the information of shareholders of the Jacob Internet Fund, the Jacob Small Cap Growth Fund , the Jacob Discovery Fund and the Jacob Forward ETF and is not authorized for distribution to prospective investors unless preceded or accompanied by an effective prospectus that includes information regarding the Funds’ objectives, policies, management, records and other information.
Item 2. Code of Ethics.
Not applicable for semi-annual reports.
Item 3. Audit Committee Financial Expert.
Not applicable for semi-annual reports.
Item 4. Principal Accountant Fees and Services.
Not applicable for semi-annual reports.
Item 5. Audit Committee of Listed Registrants.
Not applicable for semi-annual reports.
Item 6. Investments.
(a) The Schedule of Investments is included as part of the report to shareholders filed under Item 1 of this Form.
(b) Not applicable.
Item 7. Disclosure of Proxy Voting Policies and Procedures for Closed-End Management Investment Companies.
Not applicable to open-end investment companies.
Item 8. Portfolio Managers of Closed-End Management Investment Companies.
Not applicable to open-end investment companies.
Item 9. Purchases of Equity Securities by Closed‑End Management Investment Company and Affiliated Purchasers.
Not applicable to open-end investment companies.
Item 10. Submission of Matters to a Vote of Security Holders.
Not applicable.
Item 11. Controls and Procedures.
(a) | The Registrant’s President/Principal Executive Officer and Treasurer/Principal Financial Officer have reviewed the Registrant's disclosure controls and procedures (as defined in Rule 30a-3(c) under the Investment Company Act of 1940 (the “Act”)) as of a date within 90 days of the filing of this report, as required by Rule 30a-3(b) under the Act and Rules 13a-15(b) or 15d‑15(b) under the Securities Exchange Act of 1934. Based on their review, such officers have concluded that the disclosure controls and procedures are effective in ensuring that information required to be disclosed in this report is appropriately recorded, processed, summarized and reported and made known to them by others within the Registrant and by the Registrant’s service provider. |
(b) | There were no changes in the Registrant's internal control over financial reporting (as defined in Rule 30a-3(d) under the Act) that occurred during the period covered by this report that have materially affected, or are reasonably likely to materially affect, the Registrant's internal control over financial reporting. |
Item 12. Disclosure of Securities Lending Activities for Closed-End Management Investment Companies
Not applicable to open-end investment companies.
Item 13. Exhibits.
| (a) | (1) Any code of ethics or amendment thereto, that is the subject of the disclosure required by Item 2, to the extent that the registrant intends to satisfy Item 2 requirements through filing an exhibit. Incorporated by reference to previous Form N-CSR filing. |
(3) Any written solicitation to purchase securities under Rule 23c‑1 under the Act sent or given during the period covered by the report by or on behalf of the registrant to 10 or more persons. Not applicable to open-end investment companies.
(4) Change in the registrant’s independent public accountant. There was no change in the registrant’s independent public accountant for the period covered by this report.
SIGNATURES
Pursuant to the requirements of the Securities Exchange Act of 1934 and the Investment Company Act of 1940, the registrant has duly caused this report to be signed on its behalf by the undersigned, thereunto duly authorized.
(Registrant) Jacob Funds Inc.
By (Signature and Title)* /s/Ryan Jacob
Ryan Jacob, President/Principal Executive Officer
Date April 22, 2022
Pursuant to the requirements of the Securities Exchange Act of 1934 and the Investment Company Act of 1940, this report has been signed below by the following persons on behalf of the registrant and in the capacities and on the dates indicated.
By (Signature and Title)* /s/Ryan Jacob
Ryan Jacob, President/Principal Executive Officer
Date April 22, 2022
By (Signature and Title)* /s/Alenoush Terzian
Alenoush Terzian, Treasurer/Principal Financial Officer
Date April 22, 2022