As filed with the Securities and Exchange Commission on May 6, 2011
UNITED STATES
SECURITIES AND EXCHANGE COMMISSION
Washington, D.C. 20549
FORM N-CSR
CERTIFIED SHAREHOLDER REPORT OF REGISTERED
MANAGEMENT INVESTMENT COMPANIES
Investment Company Act file number 811-09447
Jacob Funds Inc.
(Exact name of Registrant as specified in charter)
C/O Jacob Asset Management of New York LLC
653 Manhattan Beach Blvd. # J
Manhattan Beach, CA 90266
(Address of principal executive offices) (Zip code)
Ryan Jacob
C/O Jacob Asset Management of New York LLC
653 Manhattan Beach Blvd. # J
Manhattan Beach, CA 90266
(Name and address of agent for service)
(424)237-2164
Registrant’s telephone number, including area code
Date of fiscal year end: August 31
Date of reporting period: February 28, 2011
TABLE OF CONTENTS
Item 1. Report to Stockholders.
Jacob Internet Fund
Jacob Small Cap Growth Fund
Jacob Wisdom Fund
Semi-Annual Report
February 28, 2011
The Jacob Internet Fund and Jacob Small Cap Growth Fund are mutual funds with the primary investment objective of long-term growth of capital.
The Jacob Wisdom Fund is a mutual fund with the primary investment objective to maximize total investment return consisting of a combination of income and capital appreciation.
The Jacob Internet Fund has current income as a secondary objective.
Jacob Asset Management of New York LLC
TABLE OF CONTENTS
| | | |
| Letter From the Manager | | 1 |
| Industry Breakdown | | 4 |
| Schedule of Investments | | 7 |
| Statement of Assets and Liabilities | | 15 |
| Statement of Operations | | 16 |
| Statement of Changes in Net Assets | | 17 |
| Financial Highlights | | 20 |
| Notes to the Financial Statements | | 23 |
| Additional Information on Fund Expenses | | 38 |
| Additional Information | | 40 |
Dear Fellow Investors,
Despite major challenges around the world, it’s becoming clearer that a global recovery is well underway. Importantly, employment figures have finally shown improvement in the past few months. The stock market has been volatile, but it is heartening that market averages have continued to post significant gains—in spite of the disaster in Japan, unrest in the Middle East, and sharply rising commodity prices.
The recent upward movement in stock prices may have some investors wondering whether the market is getting a bit ahead of itself. We at Jacob Funds feel confident that current levels are justified, noting that valuations remain well within historic norms. The key is that corporate earnings and cash flow are improving in lockstep with stock prices. As stock-pickers, this makes us optimistic about the current opportunities to invest in strong companies that are positioned for fast growth and high returns on invested capital, even if the economic recovery continues to be a bumpy ride.
Jacob Internet Fund
Jacob Internet Fund returned 36.84% in the past six months ending February 28, 2011, compared to the benchmark NASDAQ Composite Index which rose 31.61%.
Among the top drivers of our performance were two chip companies, both of which have nearly doubled since August—TriQuint Semiconductor and Cypress Semiconductor. TriQuint is a supplier of components to Apple for use in its iPhone and iPad products. Cypress’s touchscreen technology is used in mobile devices of many of the major players. With growth in the computer industry coming mainly from mobile devices, these manufacturers have seen their sales and backlogs go up significantly.
Also contributing to our outperformance were our two top Chinese holdings, SINA Corp. and Baidu.com. SINA has seen its growth explode after internally developing a service that is a hybrid of Twitter and Facebook. Meanwhile Baidu, the largest Chinese language internet search provider, continues to increase its margins and marketshare in the wake of Google’s exit from China. Baidu’s revenue growth has accelerated to over 90% annually and the positive impact on profitability has been even greater than we anticipated.
Another top performer is photo site Shutterfly, which is expanding its margins as its product mix moves away from photo prints toward consumer items such as photo books, calendars and mugs.
We added a new name in NetSpend, a fast-growing prepaid debit card company serving customers who lack established credit or are underserved by traditional banks. We also exited a few value names, including EarthLink, Global Solutions and TheStreet.com. While we still believe their prospects are good, we felt that there were better investment opportunities elsewhere.
Jacob Small Cap Fund
Jacob Small Cap fund enjoyed extremely strong performance for the six month period ending February 28, 2011, up 49.27%, while the Russell 2000 Growth Index was up 40.76%. The majority of our investments in this portfolio are in the technology, healthcare and energy sectors. Our favorite technology holdings in this fund include TriQuint and Cypress (see above).
Our performance was boosted by a name that is new to the portfolio, and which has become our largest holding. Amarin Corp. is a clinical stage biopharmaceutical company developing a prescription strength
omega-3 fish oil drug for treating patients with high triglyceride levels. The existing FDA approved drug in this billion-dollar market, Lovaza, is reported to have an undesirable side effect of raising LDL (bad) cholesterol. Amarin’s drug is expected to have almost the same effectiveness without this side effect. Our confidence in this stock is high, due to the fact that the product has already received approval in Japan, which has very stringent safety standards.
Another top performer was Achillion, a biopharmaceutical company which has three new drugs in development to treat hepatitis C infection, a multi-billion dollar market with few good treatment options.
Our energy company holdings also did well, not surprisingly in a period when oil prices rose to over $100 a barrel—though we believe our companies would have performed well even if oil prices were stable. Brigham Exploration uses advanced seismic imaging techniques in the oil-rich Bakken region of North Dakota. A new name, Rosetta Resources, has significant acreage in Texas as well as in the newer Alberta Bakken region in Canada, where exploratory drilling has yielded promising data. We also bought three smaller speculative positions in the Alberta Bakken.
We have exited a couple of alternative energy names over the period, EnerNOC and American Semiconductor. While alternative energy is a hot investment area and these are interesting companies, we decided to step away from the risks of dealing in these heavily regulated industries where the economics are still too uncertain.
Jacob Wisdom Fund
Our conservatively-run Jacob Wisdom Fund rose 13.96% in the six month period ending February 28, 2011, though it underperformed the S&P 500 Index, which was up 26.48%.
This fund is designed to preserve capital in down markets, so not surprisingly its performance did not keep pace in such an exuberant market. Generally speaking, when more speculative sectors lead the market, it is more difficult for the fund to match most major indices. That being said, we are still pleased with the high returns for the fund over the last six months and believe we are well positioned for future growth. Many of our mid-sized holdings of stalwart companies—such as Wal-Mart Stores, McDonald’s, Anheuser-Busch InBev and Visa—showed solid returns of between 1% and 5%. Our mortgage REITs were also up slightly, while continuing to pay high dividends.
We made just a few changes to this low turnover portfolio during the period. We added a position in Unilever, while cutting back on competitor Procter & Gamble. While both companies sell home care and personal care products, Unilever also derives approximately half of its sales from food products, and has greater exposure to emerging markets (about 50%) than Procter & Gamble (about 30%). Unilever manufactures close to 400 brands and enjoys a higher return on invested capital—and sports a higher dividend yield—than Procter & Gamble.
We’ve also added significantly to our position in Wal-Mart Stores, a company which has consistently demonstrated excellent return on invested capital even while it has grown tremendously in the past 11 years. When the stock price dipped recently, we felt it was an attractive opportunity to add aggressively to the position. It is now a top five holding of ours.
2
Once again, we thank you for entrusting us with your investments, and we look forward to a bright future together.
Ryan Jacob
Chairman and Chief Investment Officer
Frank Alexander
Portfolio Manager
Past performance is not a guarantee of future results.
Must be accompanied or preceded by a prospectus.
The opinions expressed above are those of the portfolio manager and are subject to change. Forecasts cannot be guaranteed.
Mutual fund investing involves risk; loss of principal is possible. The Funds invest in foreign securities which involve greater volatility and political, economic and currency risks and differences in accounting methods. Growth stocks typically are more volatile than value stocks; however, value stocks have a lower expected growth rate in earnings and sales. There are specific risks inherent in investing in the Internet area, particularly with respect to smaller capitalized companies and the high volatility of Internet stocks.
The Funds’ can invest in small-and mid-cap securities which involve additional risks such as limited liquidity and greater volatility. Investments in debt securities typically decrease in value when interest rates rise. This risk is usually greater for longer-term debt securities.
Fund holdings are subject to change and should not be construed as a recommendation to buy or sell any security. Please refer to the schedule of investments for complete fund holdings information.
The S&P 500 Index is a broad based unmanaged index of 500 stocks, which is widely recognized as representative of the equity market in general. The NASDAQ Composite Index is a market capitalization weighted index that is designed to represent the performance of the National Market System which includes over 5,000 stocks traded only over-the-counter and not on an exchange. The Russell 2000 Growth Index measures the performance of the small-cap growth segment of the U.S. equity universe. It includes those Russell 2000 companies with higher price-to-book ratios and higher forecasted growth values. It is not possible to invest directly in an index.
Performance data reflects fee waivers and in the absence of these waivers performance would be reduced.
The Funds are distributed by Quasar Distributors, LLC.
3
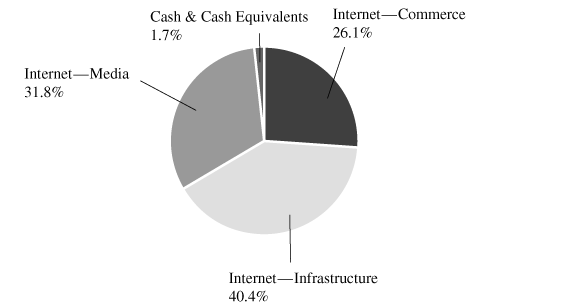
Jacob Internet Fund
INDUSTRY BREAKDOWN AS OF FEBRUARY 28, 2011
(as a percentage of total investments)
4
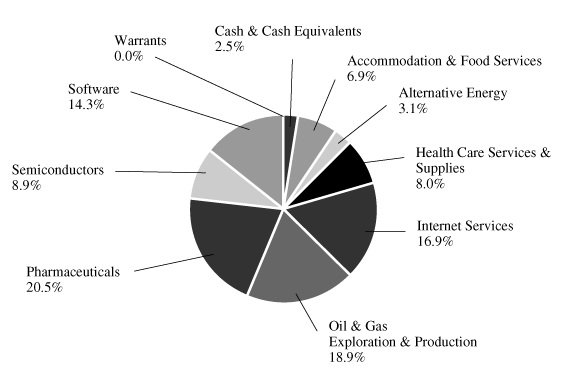
Jacob Small Cap Growth Fund
INDUSTRY BREAKDOWN AS OF FEBRUARY 28, 2011
(as a percentage of total investments)
5
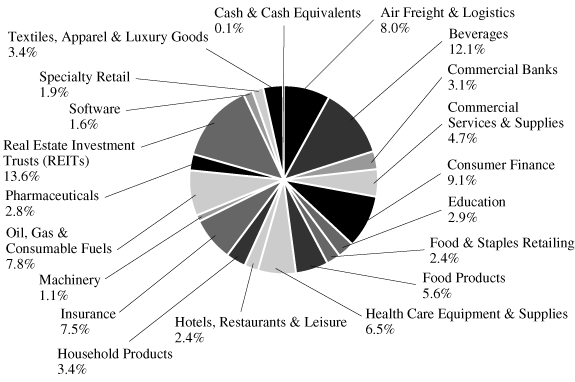
Jacob Wisdom Fund
INDUSTRY BREAKDOWN AS OF FEBRUARY 28, 2011
(as a percentage of total investments)
6
JACOB INTERNET FUND
SCHEDULE OF INVESTMENTS
February 28, 2011 (Unaudited)
| | | | | | | | | | | | | | | | | |
Shares | | | | | | | | | | | Value | |
| |
| | | | | COMMON STOCKS | | | | | | | 98.1 | % | | | | |
| |
| |
| | | | | Internet—Commerce | | | 26.0 | % | | | | | | | | |
| | 68,100 | | | Bottomline Technologies, Inc.* | | | | | | | | | | $ | 1,505,691 | |
| | 40,000 | | | Ctrip.com International Ltd.—ADR*^ | | | | | | | | | | | 1,550,800 | |
| | 32,121 | | | Digital River, Inc.* | | | | | | | | | | | 1,078,623 | |
| | 40,000 | | | eBay Inc.* | | | | | | | | | | | 1,340,200 | |
| | 104,000 | | | Expedia, Inc. | | | | | | | | | | | 2,065,440 | |
| | 4,500 | | | Netflix, Inc.*(a) | | | | | | | | | | | 930,015 | |
| | 113,410 | | | Netspend Holdings, Inc.*(a) | | | | | | | | | | | 1,486,805 | |
| | 10,000 | | | New Oriental Education & Technology Group, Inc.—ADR*^ | | | | | | | | | | | 966,100 | |
| | 28,794 | | | Shutterfly, Inc.* | | | | | | | | | | | 1,229,504 | |
| | | | | | | | | | | | | | | | | |
| | | | | | | | | | | | | | | | 12,153,178 | |
| |
| |
| | | | | Internet—Infrastructure | | | 40.3 | % | | | | | | | | |
| | 7,000 | | | Apple Computer, Inc.* | | | | | | | | | | | 2,472,470 | |
| | 14,700 | | | athenahealth Inc.*(a) | | | | | | | | | | | 666,498 | |
| | 34,000 | | | Broadcom Corporation—Class A | | | | | | | | | | | 1,401,480 | |
| | 45,050 | | | Cypress Semiconductor Corp.* | | | | | | | | | | | 944,248 | |
| | 51,250 | | | LogMeIn, Inc.* | | | | | | | | | | | 1,839,362 | |
| | 25,500 | | | Netlogic Microsystems Inc.* | | | | | | | | | | | 1,055,445 | |
| | 54,800 | | | NetScout Systems, Inc.* | | | | | | | | | | | 1,369,452 | |
| | 600,558 | | | Openwave Systems Inc.* | | | | | | | | | | | 1,333,239 | |
| | 20,000 | | | Red Hat, Inc.* | | | | | | | | | | | 825,600 | |
| | 6,000 | | | Salesforce.com, Inc.* | | | | | | | | | | | 793,620 | |
| | 39,596 | | | SanDisk Corporation* | | | | | | | | | | | 1,963,961 | |
| | 67,447 | | | Sourcefire Inc.* | | | | | | | | | | | 1,827,814 | |
| | 26,500 | | | SuccessFactors, Inc.* | | | | | | | | | | | 951,615 | |
| | 100,000 | | | TriQuint Semiconductor, Inc.* | | | | | | | | | | | 1,425,000 | |
| | | | | | | | | | | | | | | | | |
| | | | | | | | | | | | | | | | 18,869,804 | |
| |
| |
| | | | | Internet—Media | | | 31.8 | % | | | | | | | | |
| | 20,000 | | | Baidu.com, Inc.—ADR*^ | | | | | | | | | | | 2,423,200 | |
| | 65,757 | | | Geeknet, Inc.* | | | | | | | | | | | 1,841,202 | |
| | 4,000 | | | Google Inc.* | | | | | | | | | | | 2,453,600 | |
| | 491,951 | | | Hollywood Media Corp.* | | | | | | | | | | | 811,719 | |
| | 50,000 | | | IAC/InterActiveCorp.* | | | | | | | | | | | 1,553,500 | |
| | 25,500 | | | SINA Corporation*^ | | | | | | | | | | | 2,082,585 | |
The accompanying notes are an integral part of these financial statements.
7
JACOB INTERNET FUND
SCHEDULE OF INVESTMENTS
February 28, 2011 (Unaudited)
| | | | | | | | | | | | | | | | | |
Shares | | | | | | | | | | | Value | |
| |
| | | | | COMMON STOCKS—(continued) | | | | | | | 98.1 | % | | | | |
| |
| |
| | | | | Internet—Media—(continued) | | | 31.8 | % | | | | | | | | |
| | 60,000 | | | Tencent Holdings Limited (HK) | | | | | | | | | | $ | 1,595,472 | |
| | 127,874 | | | Yahoo! Inc.* | | | | | | | | | | | 2,097,134 | |
| | | | | | | | | | | | | | | | | |
| | | | | | | | | | | | | | | | 14,858,412 | |
| | | | | | | | | | | | | | | | | |
| | | | | TOTAL COMMON STOCKS (Cost $28,141,790) | | | | | | | | | | | 45,881,394 | |
| | | | | | | | | | | | | | | | | |
Principal
| | | | | | | | | | | | |
Amount | | | | | | | | | | | | |
| |
| | | | | SHORT TERM INVESTMENTS | | | | | | | 1.7 | % | | | | |
| |
| |
| | | | | U.S. Treasury Bills | | | 1.7 | % | | | | | | | | |
| $ | 200,000 | | | 0.05%, 03/10/2011 | | | | | | | | | | | 199,997 | |
| | 200,000 | | | 0.05%, 03/31/2011 | | | | | | | | | | | 199,992 | |
| | 200,000 | | | 0.13%, 06/30/2011 | | | | | | | | | | | 199,911 | |
| | 200,000 | | | 0.16%, 08/25/2011 | | | | | | | | | | | 199,843 | |
| | | | | | | | | | | | | | | | | |
| | | | | TOTAL SHORT TERM INVESTMENTS (Cost $799,833) | | | | | | | | | | | 799,743 | |
| | | | | | | | | | | | | | | | | |
| | | | | INVESTMENTS PURCHASED WITH CASH PROCEEDS FROM SECURITIES LENDING | | | | | | | 0.4 | % | | | | |
| |
| |
| | | | | Commercial Paper | | | 0.4 | % | | | | | | | | |
| | 718,910 | | | Ottimo Funding LLC, 4.71%, Due 10/27/11(b) | | | | | | | | | | | 192,320 | |
| | | | | | | | | | | | | | | | | |
| | | | | TOTAL INVESTMENTS PURCHASED WITH CASH PROCEEDS FROM SECURITIES LENDING (Cost $718,910) | | | | | | | | | | | 192,320 | |
| | | | | | | | | | | | | | | | | |
| | | | | TOTAL INVESTMENTS (Cost $29,660,533) | | | | | | | 100.2 | % | | | 46,873,457 | |
| | | | | LIABILITIES IN EXCESS OF OTHER ASSETS | | | | | | | (0.2 | )% | | | (116,880 | ) |
| | | | | | | | | | | | | | | | | |
| | | | | TOTAL NET ASSETS | | | | | | | 100.0 | % | | $ | 46,756,577 | |
| | | | | | | | | | | | | | | | | |
| | |
| * | | Non Income Producing. |
| ^ | | U.S. Dollar-denominated foreign security. |
| (a) | | All or portion of shares are on loan. |
| (b) | | Illiquid security fair valued by Valuation Committee as delegated by the Jacob Funds’ Board of Directors. |
| ADR | | American Depositary Receipt. |
| HK | | Security denominated in Hong Kong dollars. Value translated into U.S. dollars. |
The accompanying notes are an integral part of these financial statements.
8
JACOB SMALL CAP GROWTH FUND
SCHEDULE OF INVESTMENTS
February 28, 2011 (Unaudited)
| | | | | | | | | | | | | | | | | |
Shares | | | | | | | | | | | Value | |
| |
| | | | | COMMON STOCKS | | | | | | | 92.1 | % | | | | |
| |
| |
| | | | | Accommodation & Food Services | | | 6.5 | % | | | | | | | | |
| | 6,000 | | | Home Inns & Hotels Management, Inc—ADR*^ | | | | | | | | | | $ | 202,860 | |
| | 11,000 | | | 7 Days Group Holdings Ltd.—ADR*^ | | | | | | | | | | | 208,010 | |
| | | | | | | | | | | | | | | | | |
| | | | | | | | | | | | | | | | 410,870 | |
| |
| |
| | | | | Alternative Energy | | | 3.0 | % | | | | | | | | |
| | 7,000 | | | American Superconductor Corporation* | | | | | | | | | | | 185,640 | |
| |
| |
| | | | | Health Care Services & Supplies | | | 7.6 | % | | | | | | | | |
| | 9,000 | | | Bio-Reference Laboratories, Inc.* | | | | | | | | | | | 188,280 | |
| | 22,000 | | | Delcath Systems Inc.* | | | | | | | | | | | 144,100 | |
| | 3,500 | | | IPC The Hospitalist Co* | | | | | | | | | | | 142,800 | |
| | | | | | | | | | | | | | | | | |
| | | | | | | | | | | | | | | | 475,180 | |
| |
| |
| | | | | Internet Services | | | 16.0 | % | | | | | | | | |
| | 4,100 | | | Digital River, Inc.* | | | | | | | | | | | 137,678 | |
| | 6,750 | | | LogMeIn, Inc.* | | | | | | | | | | | 242,258 | |
| | 14,058 | | | Netspend Holdings, Inc.* | | | | | | | | | | | 184,300 | |
| | 3,600 | | | Shutterfly, Inc.* | | | | | | | | | | | 153,720 | |
| | 3,500 | | | SINA Corporation*^ | | | | | | | | | | | 285,845 | |
| | | | | | | | | | | | | | | | | |
| | | | | | | | | | | | | | | | 1,003,801 | |
| |
| |
| | | | | Oil & Gas—Exploration & Production | | | 17.8 | % | | | | | | | | |
| | 120,000 | | | Bowood Energy Inc.* ^ | | | | | | | | | | | 65,462 | |
| | 9,000 | | | Brigham Exploration Company* | | | | | | | | | | | 329,220 | |
| | 20,000 | | | DeeThree Exploration Ltd.* ^ | | | | | | | | | | | 96,753 | |
| | 8,000 | | | Northern Oil and Gas, Inc.* | | | | | | | | | | | 254,160 | |
| | 100,000 | | | Primary Petroleum Corp.* ^ | | | | | | | | | | | 77,196 | |
| | 6,500 | | | Rosetta Resources, Inc.* | | | | | | | | | | | 294,840 | |
| | | | | | | | | | | | | | | | | |
| | | | | | | | | | | | | | | | 1,117,631 | |
| |
| |
| | | | | Pharmaceuticals | | | 19.3 | % | | | | | | | | |
| | 31,089 | | | Achillion Pharmaceuticals Inc.* | | | | | | | | | | | 180,627 | |
| | 50,000 | | | AEterna Zentaris Inc.*^ | | | | | | | | | | | 91,000 | |
| | 50,000 | | | Amarin Corporation PLC—ADR*^ | | | | | | | | | | | 386,500 | |
| | 20,000 | | | Keryx Biopharmaceuticals, Inc.* | | | | | | | | | | | 79,000 | |
| | 10,000 | | | MAP Pharmaceuticals Inc.* | | | | | | | | | | | 161,300 | |
The accompanying notes are an integral part of these financial statements.
9
JACOB SMALL CAP GROWTH FUND
SCHEDULE OF INVESTMENTS
February 28, 2011 (Unaudited)
| | | | | | | | | | | | | | | | | |
Shares | | | | | | | | | | | Value | |
| |
| | | | | COMMON STOCKS—(continued) | | | | | | | 92.1 | % | | | | |
| |
| |
| | | | | Pharmaceuticals—(continued) | | | 19.3 | % | | | | | | | | |
| | 20,000 | | | Rigel Pharmaceuticals, Inc.* | | | | | | | | | | $ | 139,800 | |
| | 26,000 | | | Trius Therapeutics, Inc.* | | | | | | | | | | | 174,980 | |
| | | | | | | | | | | | | | | | | |
| | | | | | | | | | | | | | | | 1,213,207 | |
| |
| |
| | | | | Semiconductors | | | 8.4 | % | | | | | | | | |
| | 6,000 | | | Cypress Semiconductor Corporation* | | | | | | | | | | | 125,760 | |
| | 3,500 | | | Netlogic Microsystems Inc.* | | | | | | | | | | | 144,865 | |
| | 18,000 | | | TriQuint Semiconductor, Inc.* | | | | | | | | | | | 256,500 | |
| | | | | | | | | | | | | | | | | |
| | | | | | | | | | | | | | | | 527,125 | |
| |
| |
| | | | | Software | | | 13.5 | % | | | | | | | | |
| | 1,900 | | | athenahealth Inc.* | | | | | | | | | | | 86,146 | |
| | 9,000 | | | Bottomline Technologies, Inc.* | | | | | | | | | | | 198,990 | |
| | 7,200 | | | Netscout Systems, Inc.* | | | | | | | | | | | 179,928 | |
| | 9,700 | | | Sourcefire Inc.* | | | | | | | | | | | 262,870 | |
| | 3,400 | | | SuccessFactors, Inc.* | | | | | | | | | | | 122,094 | |
| | | | | | | | | | | | | | | | | |
| | | | | | | | | | | | | | | | 850,028 | |
| | | | | | | | | | | | | | | | | |
| | | | | TOTAL COMMON STOCKS (Cost $4,111,181) | | | | | | | | | | | 5,783,482 | |
| | | | | | | | | | | | | | | | | |
Shares/
| | | | | | | | | | | | |
Principal
| | | | | | | | | | | | |
Amount | | | | | | | | | | | | |
| |
| |
| |
| | | | | Warrants | | | 0.0 | % | | | | | | | | |
| | 2,030 | | | GreenHunter Energy, Inc.*(a) | | | | | | | | | | | 203 | |
| | | | | | | | | | | | | | | | | |
| | | | | Total Warrants (Cost $0) | | | | | | | | | | | 203 | |
| | | | | | | | | | | | | | | | | |
| | | | | SHORT TERM INVESTMENTS | | | | | | | 2.4 | % | | | | |
| |
| |
| | | | | U.S. Treasury Bills | | | 2.4 | % | | | | | | | | |
| $ | 50,000 | | | 0.05%, 03/31/2011 | | | | | | | | | | | 49,998 | |
| | 50,000 | | | 0.13%, 06/30/2011 | | | | | | | | | | | 49,978 | |
| | 50,000 | | | 0.16%, 08/25/2011 | | | | | | | | | | | 49,961 | |
| | | | | | | | | | | | | | | | | |
| | | | | TOTAL SHORT TERM INVESTMENTS (Cost $149,959) | | | | | | | | | | | 149,937 | |
| | | | | | | | | | | | | | | | | |
| | | | | TOTAL INVESTMENTS (Cost $4,261,140) | | | | | | | 94.5 | % | | | 5,933,622 | |
| | | | | OTHER ASSETS IN EXCESS OF LIABILITIES | | | | | | | 5.5 | % | | | 343,843 | |
| | | | | | | | | | | | | | | | | |
| | | | | TOTAL NET ASSETS | | | | | | | 100.0 | % | | $ | 6,277,465 | |
| | | | | | | | | | | | | | | | | |
The accompanying notes are an integral part of these financial statements.
10
JACOB SMALL CAP GROWTH FUND
SCHEDULE OF INVESTMENTS
February 28, 2011 (Unaudited)
| | |
| * | | Non Income Producing. |
| ^ | | U.S. Dollar-denominated foreign security. |
| (a) | | Illiquid security — acquired through private placement. |
| ADR | | American Depositary Receipt. |
The accompanying notes are an integral part of these financial statements.
11
JACOB WISDOM FUND
SCHEDULE OF INVESTMENTS
February 28, 2011 (Unaudited)
| | | | | | | | | | | | | | | | | |
Shares | | | | | | | | | | | Value | |
| |
| | | | | COMMON STOCKS | | | | | | | 99.2 | % | | | | |
| |
| |
| | | | | Air Freight & Logistics | | | 7.9 | % | | | | | | | | |
| | 3,000 | | | C.H. Robinson Worldwide, Inc. | | | | | | | | | | $ | 217,170 | |
| | 4,500 | | | Expeditors International of Washington, Inc. | | | | | | | | | | | 215,100 | |
| | 6,000 | | | United Parcel Service, Inc. (UPS)—Class B | | | | | | | | | | | 442,800 | |
| | | | | | | | | | | | | | | | | |
| | | | | | | | | | | | | | | | 875,070 | |
| |
| |
| | | | | Beverages | | | 12.0 | % | | | | | | | | |
| | 5,000 | | | Anheuser-Busch InBev NV—ADR^ | | | | | | | | | | | 280,150 | |
| | 7,800 | | | The Coca-Cola Company | | | | | | | | | | | 498,576 | |
| | 3,000 | | | Diageo plc—ADR^ | | | | | | | | | | | 234,780 | |
| | 5,000 | | | PepsiCo, Inc. | | | | | | | | | | | 317,100 | |
| | | | | | | | | | | | | | | | | |
| | | | | | | | | | | | | | | | 1,330,606 | |
| |
| |
| | | | | Commercial Banks | | | 3.0 | % | | | | | | | | |
| | 20,000 | | | Banco Latinoamericano de Comercio Exterior SA^ | | | | | | | | | | | 336,000 | |
| |
| |
| | | | | Commercial Services & Supplies | | | 4.7 | % | | | | | | | | |
| | 2,400 | | | The Sherwin-Williams Company | | | | | | | | | | | 197,088 | |
| | 10,000 | | | Verisk Analytics, Inc.—Class A* | | | | | | | | | | | 323,500 | |
| | | | | | | | | | | | | | | | | |
| | | | | | | | | | | | | | | | 520,588 | |
| |
| |
| | | | | Consumer Finance | | | 9.0 | % | | | | | | | | |
| | 6,000 | | | American Express Company | | | | | | | | | | | 261,420 | |
| | 12,000 | | | Lender Processing Services, Inc. | | | | | | | | | | | 408,840 | |
| | 4,500 | | | Visa Inc.—Class A | | | | | | | | | | | 328,725 | |
| | | | | | | | | | | | | | | | | |
| | | | | | | | | | | | | | | | 998,985 | |
| |
| |
| | | | | Education | | | 2.9 | % | | | | | | | | |
| | 3,300 | | | New Oriental Education & Technology Group, Inc.—ADR*^ | | | | | | | | | | | 318,813 | |
| |
| |
| | | | | Food & Staples Retailing | | | 2.4 | % | | | | | | | | |
| | 3,500 | | | Costco Wholesale Corporation | | | | | | | | | | | 261,765 | |
| |
| |
| | | | | Food Products | | | 5.5 | % | | | | | | | | |
| | 6,000 | | | Mead Johnson Nutrition Company | | | | | | | | | | | 359,100 | |
| | 8,400 | | | Unilever NV—NY Shares^ | | | | | | | | | | | 254,016 | |
| | | | | | | | | | | | | | | | | |
| | | | | | | | | | | | | | | | 613,116 | |
| |
| |
| | | | | Health Care Equipment & Supplies | | | 6.5 | % | | | | | | | | |
| | 3,000 | | | Becton Dickinson & Company | | | | | | | | | | | 240,000 | |
The accompanying notes are an integral part of these financial statements.
12
JACOB WISDOM FUND
SCHEDULE OF INVESTMENTS
February 28, 2011 (Unaudited)
| | | | | | | | | | | | | | | | | |
Shares | | | | | | | | | | | Value | |
| |
| | | | | COMMON STOCKS—(continued) | | | | | | | 99.2 | % | | | | |
| |
| |
| | | | | Health Care Equipment & Supplies—(continued) | | | 6.5 | % | | | | | | | | |
| | 3,600 | | | C. R. Bard, Inc. | | | | | | | | | | $ | 351,936 | |
| | 2,000 | | | Johnson & Johnson | | | | | | | | | | | 122,880 | |
| | | | | | | | | | | | | | | | | |
| | | | | | | | | | | | | | | | 714,816 | |
| |
| |
| | | | | Hotels, Restaurants & Leisure | | | 2.4 | % | | | | | | | | |
| | 3,500 | | | McDonald’s Corporation | | | | | | | | | | | 264,880 | |
| |
| |
| | | | | Household Products | | | 3.4 | % | | | | | | | | |
| | 6,000 | | | The Procter & Gamble Company | | | | | | | | | | | 378,300 | |
| |
| |
| | | | | Insurance | | | 7.4 | % | | | | | | | | |
| | 2 | | | Berkshire Hathaway Inc.—Class A* | | | | | | | | | | | 262,600 | |
| | 6,000 | | | The Chubb Corporation | | | | | | | | | | | 364,080 | |
| | 3,000 | | | Torchmark Corporation | | | | | | | | | | | 195,750 | |
| | | | | | | | | | | | | | | | | |
| | | | | | | | | | | | | | | | 822,430 | |
| |
| |
| | | | | Machinery | | | 1.1 | % | | | | | | | | |
| | 2,063 | | | WABCO Holdings Inc.* | | | | | | | | | | | 120,541 | |
| |
| |
| | | | | Oil, Gas & Consumable Fuels | | | 7.8 | % | | | | | | | | |
| | 4,500 | | | Exxon Mobil Corporation | | | | | | | | | | | 384,885 | |
| | 12,000 | | | Southwestern Energy Company* | | | | | | | | | | | 473,760 | |
| | | | | | | | | | | | | | | | | |
| | | | | | | | | | | | | | | | 858,645 | |
| |
| |
| | | | | Pharmaceuticals | | | 2.8 | % | | | | | | | | |
| | 9,000 | | | Sanofi-Aventis—ADR^ | | | | | | | | | | | 311,220 | |
| |
| |
| | | | | Real Estate Investment Trusts (REITs) | | | 13.5 | % | | | | | | | | |
| | 22,800 | | | Annaly Capital Management Inc. | | | | | | | | | | | 408,804 | |
| | 78,000 | | | Anworth Mortgage Asset Corporation | | | | | | | | | | | 556,920 | |
| | 15,000 | | | Cypress Sharpridge Investments, Inc | | | | | | | | | | | 186,900 | |
| | 40,000 | | | MFA Financial, Inc. | | | | | | | | | | | 338,800 | |
| | | | | | | | | | | | | | | | | |
| | | | | | | | | | | | | | | | 1,491,424 | |
| |
| |
| | | | | Software | | | 1.6 | % | | | | | | | | |
| | 5,000 | | | MSCI Inc.—Class A* | | | | | | | | | | | 177,500 | |
| |
| |
| | | | | Specialty Retail | | | 1.9 | % | | | | | | | | |
| | 4,000 | | | Wal-Mart Stores, Inc. | | | | | | | | | | | 207,920 | |
| |
| |
| | | | | | | | | | | | | | | | | |
The accompanying notes are an integral part of these financial statements.
13
JACOB WISDOM FUND
SCHEDULE OF INVESTMENTS
February 28, 2011 (Unaudited)
| | | | | | | | | | | | | | | | | |
Shares/
| | | | | | | | | | | | |
Principal
| | | | | | | | | | | | |
Amount | | | | | | | | | | | Value | |
| |
| | | | | COMMON STOCKS—(continued) | | | | | | | 99.2 | % | | | | |
| |
| |
| | | | | Textiles, Apparel & Luxury Goods | | | 3.4 | % | | | | | | | | |
| | 4,200 | | | Nike, Inc.—Class B | | | | | | | | | | $ | 373,926 | |
| | | | | | | | | | | | | | | | | |
| | | | | TOTAL COMMON STOCKS (Cost $9,357,344) | | | | | | | | | | | 10,976,545 | |
| | | | | | | | | | | | | | | | | |
| | | | | SHORT TERM INVESTMENTS | | | | | | | 0.1 | % | | | | |
| |
| |
| | | | | U.S. Treasury Bills | | | 0.1 | % | | | | | | | | |
| $ | 15,000 | | | 0.16%, 08/25/2011 | | | | | | | | | | | 14,988 | |
| | | | | | | | | | | | | | | | | |
| | | | | TOTAL SHORT TERM INVESTMENTS (Cost $14,993) | | | | | | | | | | | 14,988 | |
| | | | | | | | | | | | | | | | | |
| | | | | TOTAL INVESTMENTS (Cost $9,372,337) | | | | | | | 99.3 | % | | | 10,991,533 | |
| | | | | OTHER ASSETS IN EXCESS OF LIABILITIES | | | | | | | 0.7 | % | | | 79,134 | |
| | | | | | | | | | | | | | | | | |
| | | | | TOTAL NET ASSETS | | | | | | | 100.0 | % | | $ | 11,070,667 | |
| | | | | | | | | | | | | | | | | |
| | |
| * | | Non Income Producing. |
| ^ | | U.S. Dollar-denominated foreign security. |
| ADR | | American Depository Receipt. |
The accompanying notes are an integral part of these financial statements.
14
JACOB FUNDS INC.
STATEMENT OF ASSETS AND LIABILITIES
February 28, 2011 (Unaudited)
| | | | | | | | | | | | | |
| | | | | | Jacob
| | | | |
| | | Jacob
| | | Small Cap
| | | Jacob
| |
| | | Internet Fund | | | Growth Fund | | | Wisdom Fund | |
Assets: | | | | | | | | | | | | |
| Investments, at value (cost $29,660,533, $4,261,140 and $9,372,337, respectively) | | $ | 46,873,457 | (1) | | $ | 5,933,622 | | | $ | 10,991,533 | |
| Cash | | | 921,882 | | | | 372,276 | | | | 130,344 | |
| Cash from securities lending broker (See Note 6) | | | 100,815 | | | | — | | | | — | |
| Receivable for capital shares sold | | | 26,419 | | | | — | | | | 300 | |
| Receivable for investments sold | | | 640,043 | | | | 62,344 | | | | — | |
| Dividend Receivable | | | 1,980 | | | | — | | | | 11,909 | |
| Other assets | | | 19,625 | | | | 25,224 | | | | 19,656 | |
| | | | | | | | | | | | | |
| Total Assets | | | 48,584,221 | | | | 6,393,466 | | | | 11,153,742 | |
| | | | | | | | | | | | | |
Liabilities: | | | | | | | | | | | | |
| Payable for collateral received for securities loaned | | | 819,726 | | | | — | | | | — | |
| Payable for securities purchased | | | 582,928 | | | | 53,062 | | | | — | |
| Payable for capital shares repurchased | | | 191,777 | | | | — | | | | 2,000 | |
| Payable to Adviser | | | 59,824 | | | | — | | | | — | |
| Payable to Custodian | | | 2,895 | | | | 2,533 | | | | 2,829 | |
| Payable for distribution expenses (See Note 7) | | | 20,324 | | | | 2,155 | | | | 16,671 | |
| Accrued printing and mailing fees | | | 21,607 | | | | 3,208 | | | | 1,278 | |
| Accrued transfer agent fees | | | 54,782 | | | | 11,973 | | | | 19,569 | |
| Accrued expenses and other liabilities | | | 73,781 | | | | 43,070 | | | | 40,728 | |
| | | | | | | | | | | | | |
| Total Liabilities | | | 1,827,644 | | | | 116,001 | | | | 83,075 | |
| | | | | | | | | | | | | |
Net Assets | | $ | 46,756,577 | | | $ | 6,277,465 | | | $ | 11,070,667 | |
| | | | | | | | | | | | | |
Net Assets Consist Of: | | | | | | | | | | | | |
| Capital Stock | | $ | 44,940,361 | | | $ | 21,316,990 | | | $ | 11,058,017 | |
| Undistributed net investment income | | | — | | | | — | | | | 54,482 | |
| Accumulated net realized loss on investments | | | (15,396,708 | ) | | | (16,712,007 | ) | | | (1,661,028 | ) |
| Net unrealized appreciation on investments | | | 17,212,924 | | | | 1,672,482 | | | | 1,619,196 | |
| | | | | | | | | | | | | |
| Total Net Assets | | $ | 46,756,577 | | | $ | 6,277,465 | | | $ | 11,070,667 | |
| | | | | | | | | | | | | |
| Shares outstanding (20 billion shares of $0.001 par value authorized) | | | 14,939,030 | | | | 385,539 | | | | 1,274,467 | |
| | | | | | | | | | | | | |
| Net asset value, redemption price and offering price per share | | $ | 3.13 | | | $ | 16.28 | | | $ | 8.69 | |
| | | | | | | | | | | | | |
| | |
| (1) | | Includes securities out on loan to brokers with a market value of $786,827. |
The accompanying notes are an integral part of these financial statements.
15
JACOB FUNDS INC.
STATEMENT OF OPERATIONS
For the Six Months Ended February 28, 2011 (Unaudited)
| | | | | | | | | | | | | |
| | | | | | Jacob
| | | | |
| | | Jacob
| | | Small Cap
| | | Jacob
| |
| | | Internet Fund | | | Growth Fund | | | Wisdom Fund | |
| |
Investment Income | | | | | | | | | | | | |
| Dividend income | | $ | 38,616 | | | $ | — | | | $ | 189,878 | (1) |
| Interest income | | | 191 | | | | 43 | | | | — | |
| Securities lending income | | | 8,269 | | | | ��� | | | | — | |
| | | | | | | | | | | | | |
| Total Investment Income | | | 47,076 | | | | 43 | | | | 189,878 | |
| | | | | | | | | | | | | |
Expenses | | | | | | | | | | | | |
| Investment advisory fee | | | 270,391 | | | | 24,452 | | | | 28,385 | |
| Distribution expenses (See Note 7) | | | 75,710 | | | | 9,509 | | | | 19,870 | |
| Administration fee | | | 23,642 | | | | 19,200 | | | | 20,462 | |
| Fund accounting fees | | | 14,837 | | | | 13,837 | | | | 14,540 | |
| Transfer agent fees | | | 86,604 | | | | 15,996 | | | | 20,586 | |
| Custody fees | | | 3,801 | | | | 3,065 | | | | 3,271 | |
| Federal and state registration | | | 15,885 | | | | 14,154 | | | | 16,316 | |
| Insurance expense | | | 9,300 | | | | 6,890 | | | | 3,006 | |
| Audit fees | | | 7,471 | | | | 7,371 | | | | 7,355 | |
| Legal fees | | | 42,397 | | | | 12,894 | | | | 14,484 | |
| Reports to shareholders | | | 28,884 | | | | 3,089 | | | | 6,873 | |
| Directors’ fees and expenses | | | 34,373 | | | | 3,961 | | | | 8,588 | |
| Other | | | 181 | | | | 255 | | | | 45 | |
| | | | | | | | | | | | | |
| Total Expenses | | | 613,476 | | | | 134,673 | | | | 163,781 | |
| Expense Waiver (See Note 5) | | | — | | | | (24,452 | ) | | | (28,385 | ) |
| Expense Recoupment (See Note 5) | | | 24,647 | | | | — | | | | — | |
| | | | | | | | | | | | | |
| Net expenses | | | 638,123 | | | | 110,221 | | | | 135,396 | |
| | | | | | | | | | | | | |
Net Investment Income (Loss) | | | (591,047 | ) | | | (110,178 | ) | | | 54,482 | |
| | | | | | | | | | | | | |
Realized and Unrealized Gain on Investments | | | | | | | | | | | | |
| Net realized gain on investments | | | 3,015,106 | | | | 588,895 | | | | 78,971 | |
| Change in net unrealized appreciation/depreciation on investments | | | 10,460,729 | | | | 1,523,880 | | | | 1,353,865 | |
| | | | | | | | | | | | | |
| Net realized and unrealized gain on investments | | | 13,475,835 | | | | 2,112,775 | | | | 1,432,836 | |
| | | | | | | | | | | | | |
Net Increase in Net Assets Resulting from Operations | | $ | 12,884,788 | | | $ | 2,002,597 | | | $ | 1,487,318 | |
| | | | | | | | | | | | | |
| | |
| (1) | | Net of foreign tax withheld of $728 for Wisdom Fund. |
The accompanying notes are an integral part of these financial statements.
16
JACOB FUNDS INC.
JACOB INTERNET FUND
STATEMENTS OF CHANGES IN NET ASSETS
| | | | | | | | | |
| | | Six Months Ended
| | | Year Ended
| |
| | | February 28, 2011 | | | August 31, 2010 | |
| | | (Unaudited) | | | | |
| |
Operations: | | | | | | | | |
| Net investment loss | | $ | (591,047 | ) | | $ | (892,853 | ) |
| Net realized gain on investments | | | 3,015,106 | | | | 374,166 | |
| Change in net unrealized appreciation/depreciation on investments | | | 10,460,729 | | | | 5,557,792 | |
| | | | | | | | | |
| Net increase in net assets resulting from operations | | | 12,884,788 | | | | 5,039,105 | |
| | | | | | | | | |
Capital Share Transactions: (Note 3) | | | | | | | | |
| Proceeds from shares sold | | | 4,263,961 | | | | 2,607,596 | |
| Cost of shares redeemed | | | (5,452,101 | ) | | | (9,504,225 | ) |
| Redemption fees | | | 1,512 | | | | 2,907 | |
| | | | | | | | | |
| Net decrease in net assets resulting from capital share transactions | | | (1,186,628 | ) | | | (6,893,722 | ) |
| | | | | | | | | |
Net Increase (Decrease) in Net Assets | | | 11,698,160 | | | | (1,854,617 | ) |
Net Assets: | | | | | | | | |
| Beginning of period | | | 35,058,417 | | | | 36,913,034 | |
| | | | | | | | | |
| End of period | | $ | 46,756,577 | | | $ | 35,058,417 | |
| | | | | | | | | |
The accompanying notes are an integral part of these financial statements.
17
JACOB FUNDS INC.
JACOB SMALL CAP GROWTH FUND
STATEMENTS OF CHANGES IN NET ASSETS
| | | | | | | | | |
| | | Six Months Ended
| | | Period Ended
| |
| | | February 28, 2011 | | | August 31, 2010* | |
| | | (Unaudited) | | | | |
| |
Operations: | | | | | | | | |
| Net investment loss | | $ | (110,178 | ) | | $ | (234,241 | ) |
| Net realized gain on investments | | | 588,895 | | | | 1,514,092 | |
| Change in net unrealized appreciation/depreciation on investments | | | 1,523,880 | | | | (1,331,963 | ) |
| | | | | | | | | |
| Net increase (decrease) in net assets resulting from operations | | | 2,002,597 | | | | (52,112 | ) |
| | | | | | | | | |
Capital Share Transactions: (Note 3) | | | | | | | | |
| Proceeds from shares sold | | | 734,764 | | | | 551,595 | |
| Cost of shares redeemed | | | (533,449 | ) | | | (4,747,889 | ) |
| Redemption fees | | | 527 | | | | 61 | |
| | | | | | | | | |
| Net increase (decrease) in net assets resulting from capital share transactions | | | 201,842 | | | | (4,196,233 | ) |
| | | | | | | | | |
Net Increase (Decrease) in Net Assets | | | 2,204,439 | | | | (4,248,345 | ) |
Net Assets: | | | | | | | | |
| Beginning of period | | | 4,073,026 | | | | 8,321,371 | |
| | | | | | | | | |
| End of period | | $ | 6,277,465 | | | $ | 4,073,026 | |
| | | | | | | | | |
| | |
| * | | The Jacob Small Cap Growth Fund’s predecessor Fund had a fiscal year end of September 30, so the activity began on October 1, 2009 and the numbers shown above were for the eleven month period. |
The accompanying notes are an integral part of these financial statements.
18
JACOB FUNDS INC.
JACOB WISDOM FUND
STATEMENTS OF CHANGES IN NET ASSETS
| | | | | | | | | |
| | | Six Months Ended
| | | Period Ended
| |
| | | February 28, 2011 | | | August 31, 2010* | |
| | | (Unaudited) | | | | |
Operations: | | | | | | | | |
| Net investment income | | $ | 54,482 | | | $ | 23,502 | |
| Net realized gain (loss) on investments | | | 78,971 | | | | (186,905 | ) |
| Change in net unrealized appreciation/depreciation on investments | | | 1,353,865 | | | | 168,807 | |
| | | | | | | | | |
| Net increase in net assets resulting from operations | | | 1,487,318 | | | | 5,404 | |
| | | | | | | | | |
Distributions to Shareholders: | | | | | | | | |
| From net realized gain | | | (23,502 | ) | | | — | |
| | | | | | | | | |
| Total distributions to shareholders | | | (23,502 | ) | | | — | |
| | | | | | | | | |
Capital Share Transactions: (Note 3) | | | | | | | | |
| Proceeds from shares sold | | | 22,790 | | | | 168,755 | |
| Proceeds from reinvestment of distribution | | | 18,963 | | | | — | |
| Cost of shares redeemed | | | (1,619,940 | ) | | | (751,818 | ) |
| Redemption fees | | | 4 | | | | — | |
| | | | | | | | | |
| Net decrease in net assets resulting from capital share transactions | | | (1,578,183 | ) | | | (583,063 | ) |
| | | | | | | | | |
Net Decrease in Net Assets | | | (114,367 | ) | | | (577,659 | ) |
Net Assets: | | | | | | | | |
| Beginning of period | | | 11,185,034 | | | | 11,762,693 | |
| | | | | | | | | |
| End of period** | | $ | 11,070,667 | | | $ | 11,185,034 | |
| | | | | | | | | |
** Includes undistributed net investment income of: | | $ | 54,482 | | | $ | 23,502 | |
| | | | | | | | | |
| | |
| * | | The Jacob Wisdom Fund’s predecessor Fund had a fiscal year end of May 31, so the activity began on June 1, 2010 and the numbers shown above were for the three month period. |
The accompanying notes are an integral part of these financial statements.
19
| | | | | | | | | | | | | | | | | | | | | | | | | |
| | | Six Months Ended
| | | Year Ended
| | | Year Ended
| | | Year Ended
| | | Year Ended
| | | Year Ended
| |
| | | February 28, 2011 | | | August 31, 2010 | | | August 31, 2009 | | | August 31, 2008 | | | August 31, 2007 | | | August 31, 2006 | |
| | | (Unaudited) | | | | | | | | | | | | | | | | |
| |
Per Share Data: | | | | | | | | | | | | | | | | | | | | | | | | |
| Net asset value, beginning of period | | $ | 2.28 | | | $ | 1.99 | | | $ | 2.07 | | | $ | 2.71 | | | $ | 2.47 | | | $ | 2.06 | |
| | | | | | | | | | | | | | | | | | | | | | | | | |
Income (loss) from investment operations: | | | | | | | | | | | | | | | | | | | | | | | | |
| Net investment income (loss) | | | (0.04 | )(1) | | | (0.06 | )(1) | | | (0.06 | )(1) | | | 0.02 | (2) | | | (0.01 | )(1) | | | (0.03 | ) |
| Net realized and unrealized gains (losses) on investments | | | 0.89 | | | | 0.35 | | | | (0.02 | ) | | | (0.59 | ) | | | 0.28 | | | | 0.44 | |
| | | | | | | | | | | | | | | | | | | | | | | | | |
| Total from investment operations | | | 0.85 | | | | 0.29 | | | | (0.08 | ) | | | (0.57 | ) | | | 0.27 | | | | 0.41 | |
| | | | | | | | | | | | | | | | | | | | | | | | | |
| Less distributions from net investment income | | | — | | | | — | | | | — | | | | (0.07 | ) | | | (0.03 | ) | | | — | |
| | | | | | | | | | | | | | | | | | | | | | | | | |
| Net asset value, end of period | | $ | 3.13 | | | $ | 2.28 | | | $ | 1.99 | | | $ | 2.07 | | | $ | 2.71 | | | $ | 2.47 | |
| | | | | | | | | | | | | | | | | | | | | | | | | |
| Total return | | | 36.84% | (5) | | | 14.57% | | | | (3.86)% | | | | (21.63)% | | | | 11.06% | | | | 19.90% | |
Supplemental data and ratios: | | | | | | | | | | | | | | | | | | | | | | | | |
| Net assets, end of period (in thousands) | | $ | 46,757 | | | $ | 35,058 | | | $ | 36,913 | | | $ | 44,516 | | | $ | 77,518 | | | $ | 73,106 | |
| Ratio of gross operating expenses (prior to waiver or recoupment) to average net assets | | | 2.84% | (4)(6) | | | 3.06% | | | | 3.71% | | | | 2.69% | | | | 2.36% | | | | 2.42% | |
| Ratio of net operating expenses (after waiver or recoupment) to average net assets | | | 2.95% | (6) | | | 2.96% | (4) | | | 3.64% | (4) | | | 2.65% | (3) | | | 2.26% | (3) | | | 2.35% | (3) |
| Ratio of net investment income (loss) (prior to waiver or recoupment) to average net assets | | | (2.62)% | (4)(6) | | | (2.49)% | | | | (3.54)% | | | | 0.86% | | | | (0.26)% | | | | (1.65)% | |
| Ratio of net investment income (loss) (after waiver or recoupment) to average net assets | | | (2.73)% | (6) | | | (2.39)% | (4) | | | (3.47)% | (4) | | | 0.90% | (3) | | | (0.16)% | (3) | | | (1.58)% | (3) |
| Portfolio turnover rate | | | 26.74% | (5) | | | 52.09% | | | | 106.98% | | | | 80.46% | | | | 91.44% | | | | 125.99% | |
| | |
| (1) | | Net investment loss per share is calculated using ending balances prior to consideration of adjustments for permanent book and tax differences. |
| (2) | | Net investment income per share represents net investment income divided by the average shares outstanding throughout the period. |
| (3) | | Reflects Adviser’s waiver of 0.10% of the shareholder servicing fee beginning December 29, 2005 and ending December 31, 2007. |
| (4) | | For the period January 1, 2009 through January 2, 2012, the Adviser has contractually agreed to waive its advisory fees in an amount up to an annual rate of 0.10% of the Fund’s average daily net assets, to the extent that the Fund’s expense ratio exceeds 2.95%. |
| (5) | | Not Annualized. |
| (6) | | Annualized. |
The accompanying notes are an integral part of these financial statements.
20
JACOB FUNDS INC.
JACOB SMALL CAP GROWTH FUND
FINANCIAL HIGHLIGHTS
| | | | | | | | | | | | | | | | | | | | | | | | | |
| | | | | | October 1, 2009
| | | | | | | | | | | | | |
| | | Six Months Ended
| | | Through
| | | Year Ended
| | | Year Ended
| | | Year Ended
| | | Year Ended
| |
| | | February 28, 2011 | | | August 31, 2010(1) | | | September 30, 2009 | | | September 30, 2008 | | | September 30, 2007 | | | September 30, 2006 | |
| | | (Unaudited) | | | | | | | | | | | | | | | | |
| |
Per Share Data: | | | | | | | | | | | | | | | | | | | | | | | | |
| Net asset value, beginning of period | | $ | 10.90 | | | $ | 11.16 | | | $ | 13.82 | | | $ | 21.94 | | | $ | 15.81 | | | $ | 16.16 | |
| | | | | | | | | | | | | | | | | | | | | | | | | |
Income (loss) from investment operations: | | | | | | | | | | | | | | | | | | | | | | | | |
| Net investment loss | | | (0.29 | )(3) | | | (0.48 | )(2) | | | (0.17 | )(2) | | | (0.29 | )(3) | | | (0.31 | )(2) | | | (0.27 | )(2) |
| Net realized and unrealized gain (loss) on investments | | | 5.67 | | | | 0.22 | | | | (2.49 | ) | | | (7.83 | ) | | | 6.44 | | | | (0.08 | ) |
| | | | | | | | | | | | | | | | | | | | | | | | | |
| Total from investment operations | | | 5.38 | | | | (0.26 | ) | | | (2.66 | ) | | | (8.12 | ) | | | 6.13 | | | | (0.35 | ) |
| | | | | | | | | | | | | | | | | | | | | | | | | |
| Net asset value, end of period | | $ | 16.28 | | | $ | 10.90 | | | $ | 11.16 | | | $ | 13.82 | | | $ | 21.94 | | | $ | 15.81 | |
| | | | | | | | | | | | | | | | | | | | | | | | | |
| Total return | | | 49.27% | (7) | | | (2.33)% | (7) | | | (19.25)% | | | | (37.01)% | | | | 38.77% | | | | (2.17)% | |
Supplemental data and ratios: | | | | | | | | | | | | | | | | | | | | | | | | |
Net assets, end of period
(in thousands) | | $ | 6,277 | | | $ | 4,073 | | | $ | 8,321 | | | $ | 31,907 | | | $ | 50,378 | | | $ | 40,627 | |
| Ratio of gross operating expenses (prior to waiver or reimbursements) to average net assets | | | 4.96% | (8) | | | 5.43% | (4)(5)(8) | | | 2.64% | (4)(5) | | | 1.86% | (4) | | | 1.83% | (4) | | | 1.73% | (4) |
| Ratio of net operating expenses (after waiver or reimbursements) to average net assets | | | 4.06% | (6)(8) | | | 4.82% | (4)(5)(6)(8) | | | 2.64% | (4)(5) | | | 1.86% | (4) | | | 1.83% | (4) | | | 1.73% | (4) |
| Ratio of net investment loss (prior to waiver or reimbursements) to average net assets | | | (4.96)% | (8) | | | (5.21)% | (8) | | | (1.87)% | | | | (1.56)% | | | | (1.72)% | | | | (1.61)% | |
| Ratio of net investment loss (after waiver or reimbursements) to average net assets | | | (4.06)% | (6)(8) | | | (4.60)% | (5)(6)(8) | | | (1.87)% | (5) | | | (1.56)% | | | | (1.72)% | | | | (1.61)% | |
| Portfolio turnover rate | | | 54.08% | (7) | | | 228.16% | (7) | | | 307.06% | | | | 246.41% | | | | 231.96% | | | | 246.66% | |
| | |
| (1) | | The financial highlights set forth herein include the historical financial highlights of the Rockland Small Cap Growth Fund. The assets of the Rockland Small Cap Growth Fund were acquired by the Jacob Small Cap Growth Fund on February 1, 2010. At the time of the reorganization, the adviser changed from Gould Investment Partners, LLC to Jacob Asset Management of New York LLC. The Fund’s fiscal year was changed to August 31 to align with the other Jacob Funds. |
| (2) | | Net investment loss per share represents net investment loss divided by the average shares outstanding throughout the year. |
| (3) | | Net investment loss per share is calculated using ending balances prior to consideration of adjustments for permanent book and tax differences. |
| (4) | | The expense ratio includes interest expense paid to the custodian on overdrafts to cover shareholder redemptions. The expense ratio for interest expense paid to the custodian for the period ended August 31, 2010 and the years ended September 30, 2009, 2008, 2007, 2006 and 2005 was 0.02%, 0.01%, 0.01%, 0.01%, 0.01% and 0.02%, respectively. |
| (5) | | Effective September 1, 2009, Gould Investment Partners, LLC agreed to voluntarily waive 0.25% of its advisory fee indefinitely. The impact on the net expense ratio was (0.01)% for the fiscal year ended September 30, 2009 and (0.25)% for the period October 1, 2009 through January 31, 2010. |
| (6) | | Effective February 1, 2010 (date of reorganization) and for a period of two years following the reorganization, the Adviser has contractually agreed to waive its advisory fees in an amount up to an annual rate of 0.90% of the average daily net assets, to the extent that the Fund’s operating expenses exceed 2.45% of average daily net assets. |
| (7) | | Not annualized. |
| (8) | | Annualized. |
The accompanying notes are an integral part of these financial statements.
21
JACOB FUNDS INC.
JACOB WISDOM FUND
FINANCIAL HIGHLIGHTS
| | | | | | | | | | | | | | | | | | | | | | | | | | | | | |
| | | | | | June 1, 2010
| | | | | | | | | | | | | | | | |
| | | Six Months Ended
| | | Through
| | | Year Ended
| | | Year Ended
| | | Year Ended
| | | Year Ended
| | | Year Ended
| |
| | | February 28, 2011 | | | August 31, 2010(1) | | | May 31, 2010(2) | | | May 31, 2009 | | | May 31, 2008 | | | May 31, 2007 | | | May 31, 2006 | |
| | | (Unaudited) | | | | | | | | | | | | | | | | | | | |
| |
| Net asset value, beginning of period | | $ | 7.65 | | | $ | 7.65 | | | $ | 6.48 | | | $ | 10.34 | | | $ | 13.28 | | | $ | 12.16 | | | $ | 12.72 | |
| | | | | | | | | | | | | | | | | | | | | | | | | | | | | |
Income (loss) from investment operations: | | | | | | | | | | | | | | | | | | | | | | | | | | | | |
| Net investment income (loss) | | | 0.03 | | | | 0.02 | | | | 0.00 | | | | (0.02 | ) | | | (0.11 | ) | | | (0.10 | ) | | | 0.00 | (4) |
| Net realized and unrealized gain (loss) on securities | | | 1.03 | | | | (0.02 | ) | | | 1.18 | | | | (3.23 | ) | | | (1.13 | ) | | | 2.29 | | | | 0.22 | |
| | | | | | | | | | | | | | | | | | | | | | | | | | | | | |
| Total from investment operations | | | 1.06 | | | | 0.00 | | | | 1.18 | | | | (3.25 | ) | | | (1.24 | ) | | | 2.19 | | | | 0.22 | |
| | | | | | | | | | | | | | | | | | | | | | | | | | | | | |
| Less distributions: | | | | | | | | | | | | | | | | | | | | | | | | | | | | |
| Dividends from net investment income | | | — | | | | — | | | | — | | | | — | | | | — | | | | — | | | | (0.06 | ) |
| Distributions from capital gains | | | (0.02) | | | | — | | | | (0.01 | ) | | | (0.61 | ) | | | (1.70 | ) | | | (1.07 | ) | | | (0.72 | ) |
| | | | | | | | | | | | | | | | | | | | | | | | | | | | | |
| Total distributions | | | (0.02) | | | | — | | | | (0.01 | ) | | | (0.61 | ) | | | (1.70 | ) | | | (1.07 | ) | | | (0.78 | ) |
| | | | | | | | | | | | | | | | | | | | | | | | | | | | | |
| Net asset value, end of period | | $ | 8.69 | | | $ | 7.65 | | | $ | 7.65 | | | $ | 6.48 | | | $ | 10.34 | | | $ | 13.28 | | | $ | 12.16 | |
| | | | | | | | | | | | | | | | | | | | | | | | | | | | | |
| Total return | | | 13.96% | (5) | | | 0.00% | (5) | | | 18.24% | | | | (31.46)% | | | | (9.77)% | | | | 18.59% | | | | 1.66% | |
| Net assets, end of period (in thousands) | | $ | 11,071 | | | $ | 11,185 | | | $ | 11,763 | | | $ | 4,315 | | | $ | 8,539 | | | $ | 12,154 | | | $ | 12,842 | |
Ratios of: | | | | | | | | | | | | | | | | | | | | | | | | | | | | |
Gross operating expenses (prior to waiver or reimbursements) to average net assets(3) | | | 2.88% | (6) | | | 3.22% | (6) | | | 4.24% | | | | 3.44% | | | | 2.72% | | | | 2.48% | | | | 2.28% | |
Net operating expenses (after waiver or reimbursements) to average net assets(3) | | | 2.38% | (3)(6) | | | 2.72% | (6) | | | 3.14% | | | | 2.75% | | | | 2.71% | | | | 2.48% | | | | 2.28% | |
| Net investment income (loss) (prior to waiver or reimbursements) to average net assets | | | 0.46% | (6) | | | 0.30% | (6) | | | (0.80)% | | | | (0.86)% | | | | (0.90)% | | | | (0.76)% | | | | 0.07% | |
| Net investment income (loss) (after waiver or reimbursements) to average net assets | | | 0.96% | (3)(6) | | | 0.80% | (6) | | | 0.30% | | | | (0.17)% | | | | (0.89)% | | | | (0.76)% | | | | 0.07% | |
| Portfolio turnover rate | | | 5.05% | (5) | | | 6.50% | (5) | | | 60.69% | | | | 37.12% | | | | 30.89% | | | | 10.72% | | | | 19.03% | |
| | |
| (1) | | The Fund’s fiscal year was changed to August 31 to align with the other Jacob Funds. |
| (2) | | The financial highlights set forth herein include the historical financial highlights of the Wisdom Fund. The Wisdom Fund was reorganized into Jacob Wisdom Fund on February 18, 2010. On December 1, 2009, the adviser changed from Atlanta Investment Counsel, LLC to Jacob Asset Management of New York LLC. Information prior to February 18, 2010 reflects the performance of the Wisdom Fund’s Class B shares. The return of capital listed in Note 4 was paid out of the Wisdom Fund’s Institutional Class and Investor Class. |
| (3) | | Effective February 18, 2010 (date of reorganization) and for a period of two years following the reorganization, the Adviser has contractually agreed to waive its advisory fees in an amount up to an annual rate of 0.50% of the average daily net assets, to the extent that the Fund’s operating expenses exceed 1.95% of average daily net assets. Prior to November 30, 2009, the previous adviser agreed to waive operating expenses over 1.75% of the Fund’s average daily net assets, exclusive of interest, taxes, brokerage fees and 12b-1 fees. |
| (4) | | No effect to net investment income due to reimbursement of $10,752 by the previous adviser for certain trade errors. |
| (5) | | Not annualized. |
| (6) | | Annualized. |
The accompanying notes are an integral part of these financial statements.
22
NOTE 1—DESCRIPTION OF FUND
Jacob Funds Inc. (the “Corporation”) was organized as a Maryland corporation on July 13, 1999 and is registered under the Investment Company Act of 1940, as amended (the “1940 Act”), as an open-end management investment company issuing its shares in series. The Corporation currently consists of three “diversified” series, the Jacob Internet Fund (the “Internet Fund”), the Jacob Small Cap Growth Fund (the “Small Cap Growth Fund”) and the Jacob Wisdom Fund (the “Wisdom Fund”), collectively the “Funds” and the authorized capital stock of the Corporation consists of twenty billion shares of stock having a par value of one-tenth of one cent ($0.001) per share. The primary investment objective of the Internet Fund is long-term growth of capital with current income as a secondary objective. The primary investment objective of the Small Cap Growth Fund is long-term growth of capital. The primary investment objective of the Wisdom Fund is to maximize total investment return consisting of a combination of income and capital appreciation. The Internet Fund commenced operations on December 14, 1999. The Small Cap Growth Fund commenced operations on February 1, 2010 when it acquired the assets and liabilities of the Rockland Small Cap Growth Fund in a reorganization transaction (the Small Cap Growth Fund is the successor fund to the Rockland Small Cap Growth Fund), and the Jacob Wisdom Fund commenced operations when it acquired the assets and liabilities of the Wisdom Fund on February 18, 2010 in a reorganization transaction (the Jacob Wisdom Fund is the successor fund to the Wisdom Fund).
NOTE 2—SIGNIFICANT ACCOUNTING POLICIES
The following is a summary of significant accounting policies consistently followed by the Funds.
(a) Investment Valuation—Investment securities traded on a national securities exchange are valued at their market value determined by their last sales price in the principal market in which these securities are normally traded (except those traded on the NASDAQ National Market and Capital Market exchanges which are valued at the NASDAQ Official Closing Price (“NOCP”)), unless there are no transactions on the valuation date, in which case they are valued at the mean between the closing bid and ask prices. Securities traded over-the-counter are valued at the last reported sales price unless there is no reported sales price, in which case the mean between the closing bid and ask prices is used. Foreign securities, currencies and other assets denominated in foreign currencies are translated into U.S. dollars at the exchange rate of such currencies. Foreign equity securities are valued at the last sale price at the close of the exchange on which the security is principally traded. Debt securities with maturities of 60 days or less are valued at amortized cost, which approximates market value. Short-term securities with 60 days or less remaining to maturity are, unless conditions indicate otherwise, amortized to maturity based on their cost to a Fund if acquired within 60 days of maturity or, if already held by a Fund on the 60th day, based on the value determined on the 61st day. If amortized cost does not approximate fair value, short-term securities are reported at fair value. Where market quotations are not readily available, are unreliable or when values have been materially affected by events occurring before the close of U.S. markets but after the close of the securities’ primary markets, securities are valued at fair value using procedures approved by the Board of Directors that are designed to determine a security’s fair value.
23
JACOB FUNDS INC.
NOTES TO THE FINANCIAL STATEMENTS (Continued)
February 28, 2011 (Unaudited)
The Funds adopted fair valuation accounting standards which establish an authoritative definition of fair value and set out a hierarchy for measuring fair value. These standards require additional disclosures about the various inputs and valuation techniques used to develop the measurements of fair value and a discussion in changes in valuation techniques and related inputs during the period. These standards define fair value as the price that would be received to sell an asset or paid to transfer a liability in an orderly transaction between market participants at the measurement date. The fair value hierarchy is organized into three levels based upon the assumptions (referred to as “inputs”) used in pricing the asset or liability. These standards state that “observable inputs” reflect the assumptions market participants would use in pricing the asset or liability based on market data obtained from independent sources and “unobservable inputs” reflect an entity’s own assumptions about the assumptions market participants would use in pricing the asset or liability.
Summary of Fair Value Exposure
Various inputs are used in determining the value of the Funds’ investments. These inputs are summarized in the three broad levels listed below:
Level 1—Unadjusted quoted prices in active markets for identical assets or liabilities that the Corporation has the ability to access.
Level 2—Observable inputs other than quoted prices included in Level 1 that are observable for the asset or liability, either directly or indirectly. These inputs may include quoted prices for the identical instrument on an inactive market, prices for similar instruments, interest rates, prepayment speeds, credit risk, yield curves, default rates and similar data.
Level 3—Unobservable inputs for the asset or liability, to the extent relevant observable inputs are not available, representing the Corporation’s own assumptions about the assumptions a market participant would use in valuing the asset or liability, and based on the best information available.
The inputs or methodology used for valuing securities are not necessarily an indication of the risk associated with investing in those securities.
24
JACOB FUNDS INC.
NOTES TO THE FINANCIAL STATEMENTS (Continued)
February 28, 2011 (Unaudited)
The following is a summary of the inputs used to value the Internet Fund’s investments as of February 28, 2011:
| | | | | | | | | | | | | | | | | |
| | | Level 1 | | | Level 2 | | | Level 3 | | | Total | |
| |
Common Stock | | | | | | | | | | | | | | | | |
| Internet—Commerce | | $ | 12,153,178 | | | $ | — | | | $ | — | | | $ | 12,153,178 | |
| Internet—Infrastructure | | | 18,869,804 | | | | — | | | | — | | | | 18,869,804 | |
| Internet—Media | | | 14,858,412 | | | | — | | | | — | | | | 14,858,412 | |
| | | | | | | | | | | | | | | | | |
Total Common Stock | | | 45,881,394 | | | | — | | | | — | | | | 45,881,394 | |
| | | | | | | | | | | | | | | | | |
Short Term Investments | | | | | | | | | | | | | | | | |
| U.S. Treasury Bills | | | — | | | | 799,743 | | | | — | | | | 799,743 | |
| | | | | | | | | | | | | | | | | |
Total Short Term Investments | | | — | | | | 799,743 | | | | — | | | | 799,743 | |
Investments Purchased With Cash Proceeds From Securities Lending | | | | | | | | | | | | | | | | |
| Commercial Paper | | | — | | | | — | | | | 192,320 | | | | 192,320 | |
| | | | | | | | | | | | | | | | | |
Total Investments Purchased With Cash Proceeds From Securities Lending | | | — | | | | — | | | | 192,320 | | | | 192,320 | |
| | | | | | | | | | | | | | | | | |
Total Investments in Securities | | $ | 45,881,394 | | | $ | 799,743 | | | $ | 192,320 | | | $ | 46,873,457 | |
| | | | | | | | | | | | | | | | | |
| | |
| | * | There were no significant transfers into or out of Level 1 and Level 2 fair value measurements during the reporting period, as compared to their classification from the most recent annual report. |
Level 3 Reconciliation Disclosure
Following is a reconciliation of Level 3 assets for which significant unobservable inputs were used to determine fair value.
| | | | | |
| | | Investments
| |
Description | | in Securities | |
| |
| Balance as of August 31, 2010 | | $ | 193,118 | |
| Accrued discounts/premiums | | | — | |
| Realized gain (loss) | | | (694 | ) |
| Change in unrealized appreciation (depreciation) | | | 19,528 | |
| Net purchases (sales) | | | (19,632 | ) |
| Transfers in and/or out of Level 3* | | | — | |
| | | | | |
| Balance as of February 28, 2011 | | $ | 192,320 | |
| | | | | |
25
JACOB FUNDS INC.
NOTES TO THE FINANCIAL STATEMENTS (Continued)
February 28, 2011 (Unaudited)
| | |
| | * | The information used in the above reconciliation represents fiscal year to date activity for any investments identified as using Level 3 inputs at either the beginning or end of the current fiscal period. Transfers in or out of Level 3 represents either the beginning value (for transfers in) or ending value (for transfers out) of any security or instrument where a change in the pricing level occurred from the beginning to the end of the period. |
The following is a summary of the inputs used to value the Small Cap Growth Fund’s investments as of February 28, 2011:
| | | | | | | | | | | | | | | | | |
| | | Level 1 | | | Level 2 | | | Level 3 | | | Total | |
| |
Common Stock | | | | | | | | | | | | | | | | |
| Accommodation & Food Services | | $ | 410,870 | | | $ | — | | | $ | — | | | $ | 410,870 | |
| Alternative Energy | | | 185,640 | | | | — | | | | — | | | | 185,640 | |
| Health Care Services and Supplies | | | 475,180 | | | | — | | | | — | | | | 475,180 | |
| Internet Services | | | 1,003,801 | | | | — | | | | — | | | | 1,003,801 | |
| Oil & Gas-Exploration & Production | | | 1,117,631 | | | | — | | | | — | | | | 1,117,631 | |
| Pharmaceuticals | | | 1,213,207 | | | | — | | | | — | | | | 1,213,207 | |
| Semiconductors | | | 527,125 | | | | — | | | | — | | | | 527,125 | |
| Software | | | 850,028 | | | | — | | | | — | | | | 850,028 | |
| | | | | | | | | | | | | | | | | |
Total Common Stock | | | 5,783,482 | | | | — | | | | — | | | | 5,783,482 | |
| | | | | | | | | | | | | | | | | |
Warrants | | | — | | | | 203 | | | | — | | | | 203 | |
| | | | | | | | | | | | | | | | | |
Short Term Investments | | | | | | | | | | | | | | | | |
| U.S. Treasury Bills | | | — | | | | 149,937 | | | | — | | | | 149,937 | |
| | | | | | | | | | | | | | | | | |
Total Short Term Investments | | | — | | | | 149,937 | | | | — | | | | 149,937 | |
| | | | | | | | | | | | | | | | | |
Total Investments in Securities | | $ | 5,783,482 | | | $ | 150,140 | | | $ | — | | | $ | 5,933,622 | |
| | | | | | | | | | | | | | | | | |
| | |
| | * | There were no significant transfers into or out of Level 1 and Level 2 fair value measurements during the reporting period, as compared to their classification from the most recent annual report. |
26
JACOB FUNDS INC.
NOTES TO THE FINANCIAL STATEMENTS (Continued)
February 28, 2011 (Unaudited)
The following is a summary of the inputs used to value the Wisdom Fund’s investments as of February 28, 2011:
| | | | | | | | | | | | | | | | | |
| | | Level 1 | | | Level 2 | | | Level 3 | | | Total | |
| |
Common Stock | | | | | | | | | | | | | | | | |
| Air Freight & Logistics | | $ | 875,070 | | | $ | — | | | $ | — | | | $ | 875,070 | |
| Beverages | | | 1,330,606 | | | | — | | | | — | | | | 1,330,606 | |
| Commercial Banks | | | 336,000 | | | | — | | | | — | | | | 336,000 | |
| Commercial Services & Supplies | | | 520,588 | | | | — | | | | — | | | | 520,588 | |
| Consumer Finance | | | 998,985 | | | | — | | | | — | | | | 998,985 | |
| Education | | | 318,813 | | | | — | | | | — | | | | 318,813 | |
| Food & Staples Retailing | | | 261,765 | | | | — | | | | — | | | | 261,765 | |
| Food Products | | | 613,116 | | | | — | | | | — | | | | 613,116 | |
| Health Care Equipment & Supplies | | | 714,816 | | | | — | | | | — | | | | 714,816 | |
| Hotels, Restaurants & Leisure | | | 264,880 | | | | — | | | | — | | | | 264,880 | |
| Household Products | | | 378,300 | | | | — | | | | — | | | | 378,300 | |
| Insurance | | | 822,430 | | | | — | | | | — | | | | 822,430 | |
| Machinery | | | 120,541 | | | | — | | | | — | | | | 120,541 | |
| Oil, Gas & Consumable Fuels | | | 858,645 | | | | — | | | | — | | | | 858,645 | |
| Pharmaceuticals | | | 311,220 | | | | — | | | | — | | | | 311,220 | |
| Real Estate Investment Trusts | | | 1,491,424 | | | | — | | | | — | | | | 1,491,424 | |
| Software | | | 177,500 | | | | — | | | | — | | | | 177,500 | |
| Specialty Retail | | | 207,920 | | | | — | | | | — | | | | 207,920 | |
| Textiles, Apparel & Luxury Goods | | | 373,926 | | | | — | | | | — | | | | 373,926 | |
| | | | | | | | | | | | | | | | | |
Total Common Stock | | | 10,976,545 | | | | — | | | | — | | | | 10,976,545 | |
Short Term Investments | | | | | | | | | | | | | | | | |
| U.S. Treasury Bills | | | — | | | | 14,988 | | | | — | | | | 14,988 | |
| | | | | | | | | | | | | | | | | |
Total Short Term Investments | | | — | | | | 14,988 | | | | — | | | | 14,988 | |
| | | | | | | | | | | | | | | | | |
Total Investments in Securities | | $ | 10,976,545 | | | $ | 14,988 | | | $ | — | | | $ | 10,991,533 | |
| | | | | | | | | | | | | | | | | |
| | |
| | * | There were no significant transfers into or out of Level 1 and Level 2 fair value measurements during the reporting period, as compared to their classification from the most recent annual report. |
In March 2008, accounting standards regarding disclosures about derivative instruments and hedging activity standards were issued. These standards were intended to improve financial reporting for derivative instruments by requiring enhanced disclosure that enables investors to understand how and why an entity uses derivatives, how derivatives are accounted for, and how derivative instruments affect an entity’s results of operations and financial position. These standards do not have any impact on the
27
JACOB FUNDS INC.
NOTES TO THE FINANCIAL STATEMENTS (Continued)
February 28, 2011 (Unaudited)
Funds’ financial statement disclosures because the Funds have not maintained any positions in derivative instruments or engaged in hedging activities.
In May 2009, the Financial Accounting Standards Board (“FASB”) issued subsequent event standards. The Funds adopted these standards which require an entity to recognize in the financial statements the effects of all subsequent events that provide additional evidence about conditions that existed at the date of the balance sheet. For non-recognized subsequent events that must be disclosed to keep the financial statements from being misleading, an entity is required to disclose the nature of the event as well as an estimate of its financial effect, or a statement that such an estimate cannot be made.
(b) Repurchase Agreements—The Funds may enter into repurchase agreements with member banks of the Federal Reserve System and with broker-dealers who are recognized as primary dealers in U.S. government securities by the Federal Reserve Bank of New York. Repurchase agreements involve an agreement to purchase a security and to sell that security back to the original seller at an agreed-upon price and an agreed-upon time. Because the security purchased constitutes collateral for the repurchase obligation, a repurchase agreement may be considered a loan that is collateralized by the security purchased. Although the securities subject to the repurchase agreement might bear maturities exceeding one year, settlement for the repurchase would never be more than 397 days after the Funds’ acquisition of the securities and normally would be within a shorter period of time. The resale price of the security back to the original seller will be in excess of the purchase price, reflecting an agreed upon market rate effective for the period of time the Funds’ money will be invested in the security, and will not be related to the coupon rate of the purchased security. In the event that the repurchase agreement is held for more than one day, the security serving as collateral for the repurchase agreement will be marked-to-market daily to ensure that the value of the collateral does not decrease below the purchase price, plus accrued interest. If a decrease occurs, the seller will provide additional collateral to add to the account to maintain appropriate collateralization.
The use of repurchase agreements involves certain risks. One risk is the seller’s ability to pay the agreed upon repurchase price on the repurchase date. If the seller defaults, the Funds may incur costs in disposing of the collateral, which would reduce the amount realized thereon. If the seller seeks relief under the bankruptcy laws, the disposition of the collateral may be delayed or limited. Delays may result in possible decline in the value of the underlying security while the Funds seek their rights thereto, possible lack of access to income on the underlying security during the delayed period, and expenses in enforcing the Funds’ rights.
(c) Income Recognition—Interest income is accrued as earned. Dividend income is recorded on the ex-dividend date. All discounts and premiums are amortized using the effective interest method for tax and financial reporting purposes.
(d) Securities Transactions—Security transactions are accounted for on trade date. Realized gains and losses on securities sold are determined using specific identification.
28
JACOB FUNDS INC.
NOTES TO THE FINANCIAL STATEMENTS (Continued)
February 28, 2011 (Unaudited)
(e) Foreign Currency Transactions—The books and records are maintained in U.S. dollars. Foreign currency denominated transactions (i.e., market value of investment securities, assets and liabilities, purchases and sales of investment securities, and income and expenses) are translated into U.S. dollars at the current rate of exchange.
The Funds do not isolate that portion of the results of operations resulting from changes in foreign exchange rates on investments from the fluctuations arising from changes in market prices of securities held. Such fluctuations are included with the net realized and unrealized gain or loss from investments.
(f) Distributions to Shareholders—The Funds record distributions to shareholders on the ex-dividend date. Dividends from net investment income, if any, are declared and paid annually. Distributions of net realized capital gains, if any, will be declared and distributed at least annually. The amounts of distributions from net investment income and net realized capital gains are determined in accordance with federal income tax regulations, which may differ from those amounts determined under U.S. generally accepted accounting principles. These book/tax differences are either temporary or permanent in nature. To the extent these differences are permanent, reclassifications are made in the capital accounts in the period that the differences arise. The reclassifications have no effect on net assets or net asset value per share.
(g) Federal Income Taxes—The Funds comply with provisions of Subchapter M of the Internal Revenue Code applicable to regulated investment companies, including the distribution of substantially all of the Funds’ taxable income. Accordingly, no provision for federal income taxes is considered necessary in the financial statements.
The Funds adopted accounting standards regarding recognition and measurement of tax positions taken on a tax return. No material uncertain tax positions existed as of February 28, 2011. As a result, the Funds have not recorded any liabilities for uncertain tax positions as of February 28, 2011. The standards require the Funds to analyze all open tax years, as defined by the Statute of Limitations, for all major jurisdictions. Open tax years are those that are open for examinations by taxing authorities. Major jurisdictions for the Funds only relate to federal tax years. As of February 28, 2011, open federal tax years include the tax years ended August 31, 2007 through August 31, 2010 for the Internet Fund, the tax years ended September 30, 2007 through September 2010 and period ended August 31, 2010 for the Small Cap Growth Fund and the tax years ended May 31, 2007 through May 31, 2010 and period ended August 31, 2010 for the Wisdom Fund.
(h) Use of Estimates—The preparation of financial statements in conformity with accounting principles generally accepted in the United States requires management to make estimates and assumptions that affect the reported amount of assets and liabilities and disclosure of contingent assets and liabilities at the date of the financial statements and the reported amounts of revenues and expenses during the reporting period. Actual results could differ from those estimates.
29
JACOB FUNDS INC.
NOTES TO THE FINANCIAL STATEMENTS (Continued)
February 28, 2011 (Unaudited)
(i) Contingencies and Commitments—The Funds indemnify the Corporation’s officers and Directors for certain liabilities that might arise from their performance of their duties to the Funds. Additionally, in the normal course of business, the Funds enter into contracts that contain a variety of representations and warranties and which provide general indemnifications. Each Fund’s maximum exposure under these arrangements is unknown, as this would involve future claims that may be made against the Funds that have not yet occurred. However, based on experience, the Corporation expects the risk of loss to be remote.
NOTE 3—CAPITAL SHARE TRANSACTIONS
At February 28, 2011 there were twenty billion shares, $0.001 par value, authorized. Transactions in shares of the Internet Fund were as follows:
| | | | | | | | | |
| | | Six Months Ended
| |
| | | February 28, 2011 | |
| | | Shares | | | Amount | |
| |
| Sales | | | 1,437,076 | | | $ | 4,263,961 | |
| Redemptions | | | (1,892,623 | ) | | | (5,452,101 | ) |
| Redemption Fees | | | — | | | | 1,512 | |
| | | | | | | | | |
| Net Decrease | | | (455,547 | ) | | $ | (1,186,628 | ) |
| | | | | | | | | |
Shares Outstanding: | | | | | | | | |
| Beginning of period | | | 15,394,577 | | | | | |
| | | | | | | | | |
| End of period | | | 14,939,030 | | | | | |
| | | | | | | | | |
| | | | | | | | | |
| | | Year Ended
| |
| | | August 31, 2010 | |
| | | Shares | | | Amount | |
| |
| Sales | | | 1,163,307 | | | $ | 2,607,596 | |
| Redemptions | | | (4,295,385 | ) | | | (9,504,225 | ) |
| Redemption Fees | | | — | | | | 2,907 | |
| | | | | | | | | |
| Net Decrease | | | (3,132,078 | ) | | $ | (6,893,722 | ) |
| | | | | | | | | |
Shares Outstanding: | | | | | | | | |
| Beginning of period | | | 18,526,655 | | | | | |
| | | | | | | | | |
| End of period | | | 15,394,577 | | | | | |
| | | | | | | | | |
30
JACOB FUNDS INC.
NOTES TO THE FINANCIAL STATEMENTS (Continued)
February 28, 2011 (Unaudited)
Transactions in shares of the Small Cap Growth Fund were as follows:
| | | | | | | | | |
| | | Six Months Ended
| |
| | | February 28, 2011 | |
| | | Shares | | | Amount | |
| Sales | | | 47,763 | | | $ | 734,764 | |
| Redemptions | | | (35,960 | ) | | | (533,449 | ) |
| Redemption Fees | | | — | | | | 527 | |
| | | | | | | | | |
| Net Increase | | | 11,803 | | | $ | 201,842 | |
| | | | | | | | | |
Shares Outstanding | | | | | | | | |
| Beginning of period | | | 373,736 | | | | | |
| | | | | | | | | |
| End of period | | | 385,539 | | | | | |
| | | | | | | | | |
| | | | | | | | | |
| | | October 1, 2009*
| |
| | | Through
| |
| | | August 31, 2010 | |
| | | Shares | | | Amount | |
| Sales | | | 46,886 | | | $ | 551,595 | |
| Redemptions | | | (418,856 | ) | | | (4,747,889 | ) |
| Redemption Fees | | | — | | | | 61 | |
| | | | | | | | | |
| Net Decrease | | | (371,970 | ) | | $ | (4,196,233 | ) |
| | | | | | | | | |
Shares Outstanding | | | | | | | | |
| Beginning of period | | | 745,706 | | | | | |
| | | | | | | | | |
| End of period | | | 373,736 | | | | | |
| | | | | | | | | |
| | | | | | | | | |
| | | Year Ended
| |
| | | September 30, 2009 | |
| | | Shares | | | Amount | |
| Sales | | | 396,759 | | | $ | 3,717,444 | |
| Redemptions | | | (1,959,349 | ) | | | (18,909,229 | ) |
| Redemption Fees | | | — | | | | 14,509 | |
| | | | | | | | | |
| Net Decrease | | | (1,562,590 | ) | | $ | (15,177,276 | ) |
| | | | | | | | | |
Shares Outstanding | | | | | | | | |
| Beginning of period | | | 2,308,296 | | | | | |
| | | | | | | | | |
| End of period | | | 745,706 | | | | | |
| | | | | | | | | |
| | |
| | * | The Small Cap Growth Fund’s predecessor Fund had a fiscal year end of September 30, so the activity began on October 1, 2009. |
31
JACOB FUNDS INC.
NOTES TO THE FINANCIAL STATEMENTS (Continued)
February 28, 2011 (Unaudited)
Transactions in shares of the Wisdom Fund were as follows:
| | | | | | | | | |
| | | Six Months Ended
| |
| | | February 28, 2011 | |
| | | Shares | | | Amount | |
| Sales | | | 2,645 | | | $ | 22,790 | |
| Reinvestments | | | 2,184 | | | | 18,963 | |
| Redemptions | | | (192,925 | ) | | | (1,619,940 | ) |
| Redemption Fees | | | — | | | | 4 | |
| | | | | | | | | |
| Net Decrease | | | (188,096 | ) | | $ | (1,578,183 | ) |
| | | | | | | | | |
Shares Outstanding | | | | | | | | |
| Beginning of period | | | 1,462,563 | | | | | |
| | | | | | | | | |
| End of period | | | 1,274,467 | | | | | |
| | | | | | | | | |
| | | | | | | | | |
| | | June 1, 2010*
| |
| | | Through
| |
| | | August 31, 2010 | |
| | | Shares | | | Amount | |
| Sales | | | 21,685 | | | $ | 168,755 | |
| Reinvestments | | | — | | | | — | |
| Redemptions | | | (97,107 | ) | | | (751,818 | ) |
| | | | | | | | | |
| Net Decrease | | | (75,422 | ) | | $ | (583,063 | ) |
| | | | | | | | | |
Shares Outstanding | | | | | | | | |
| Beginning of period | | | 1,537,985 | | | | | |
| | | | | | | | | |
| End of period | | | 1,462,563 | | | | | |
| | | | | | | | | |
| | | | | | | | | |
| | | Year Ended
| |
| | | May 31, 2010 | |
| | | Shares | | | Amount | |
| Sales | | | 174,779 | | | $ | 1,402,974 | |
| Net shares issued as part of Reorganization | | | 62,778 | | | | — | |
| Reinvestments | | | 4,561 | | | | 37,169 | |
| Redemptions | | | (466,437 | ) | | | (3,563,889 | ) |
| Redemption Fees | | | — | | | | 39 | |
| | | | | | | | | |
| Net Decrease | | | (224,319 | ) | | $ | (2,123,707 | ) |
| | | | | | | | | |
Shares Outstanding | | | | | | | | |
| Beginning of period | | | 1,762,304 | | | | | |
| | | | | | | | | |
| End of period | | | 1,537,985 | | | | | |
| | | | | | | | | |
32
JACOB FUNDS INC.
NOTES TO THE FINANCIAL STATEMENTS (Continued)
February 28, 2011 (Unaudited)
| | |
| | * | The Wisdom Fund’s had a fiscal year end of May 31, which was the Predecessor Fund’s year end, so the activity began on June 1, 2010. The fiscal year end was changed to August 31 to align with the other Jacob Funds. |
From time to time, the Funds may have a concentration of shareholders holding a significant percentage of shares outstanding. Investment activities of these shareholders could have a material impact on the Funds. As of February 28, 2011, two shareholders own greater than 10% of the Wisdom Fund’s outstanding shares.
NOTE 4—INVESTMENT TRANSACTIONS
During the six months ended February 28, 2011 for the Internet Fund, the Small Cap Growth Fund and the Wisdom Fund, purchases and sales of investment securities (excluding short-term investments) were as follows:
| | | | | | | | | |
Fund | | Purchases | | | Sales | |
| |
| Jacob Internet Fund | | $ | 11,041,615 | | | $ | 13,592,363 | |
| Jacob Small Cap Growth Fund | | | 2,681,987 | | | | 2,959,021 | |
| Jacob Wisdom Fund | | | 563,015 | | | | 2,268,858 | |
The Funds did not purchase long-term U.S. Government securities as a part of their investment strategies during the six months ended February 28, 2011.
At August 31, 2010, the components of accumulated earnings/(losses) on a tax basis for the Funds were as follows:
| | | | | | | | | | | | | |
| | | Internet
| | | Small Cap
| | | Wisdom
| |
| | | Fund | | | Growth Fund | | | Fund | |
| Cost of Investments | | $ | 30,172,192 | | | $ | 3,874,939 | | | $ | 10,984,202 | |
| | | | | | | | | | | | | |
| Gross unrealized appreciation | | | 11,869,845 | | | | 478,810 | | | | 938,731 | |
| Gross unrealized depreciation | | | (6,873,866 | ) | | | (366,085 | ) | | | (673,400 | ) |
| | | | | | | | | | | | | |
| Net unrealized appreciation | | $ | 4,995,979 | | | $ | 112,725 | | | $ | 265,331 | |
| | | | | | | | | | | | | |
| Undistributed ordinary income | | | — | | | | — | | | | 23,502 | |
| Undistributed long-term capital gain | | | — | | | | — | | | | — | |
| | | | | | | | | | | | | |
| Total distributable earnings | | $ | — | | | | — | | | $ | 23,502 | |
| | | | | | | | | | | | | |
| Other accumulated losses | | $ | (16,655,598 | ) | | $ | (17,265,025 | ) | | $ | (1,739,999 | ) |
| | | | | | | | | | | | | |
| Total accumulated losses | | $ | (11,659,619 | ) | | $ | (17,152,300 | ) | | $ | (1,451,166 | ) |
| | | | | | | | | | | | | |
33
JACOB FUNDS INC.
NOTES TO THE FINANCIAL STATEMENTS (Continued)
February 28, 2011 (Unaudited)
The differences between cost amounts for book purposes and tax purposes are primarily due to the tax deferral of losses on wash sales. At August 31, 2010, the Funds had accumulated net realized capital loss carryovers as follows:
| | | | | | | | | | | | | | | |
Internet
| | | Small Cap
| | | Wisdom
| | | | |
| Fund | | | Growth Fund | | | Fund | | | Expiration | |
| |
| $ | — | | | $ | 2,765,334 | | | $ | — | | | | 8/31/2011 | |
| | 9,281,045 | | | | 8,454,402 | | | | 1,304,999 | | | | 8/31/2017 | |
| | 6,513,248 | | | | 6,045,289 | | | | 435,000 | | | | 8/31/2018 | |
| | | | | | | | | | | | | | | |
| $ | 15,794,293 | | | $ | 17,265,025 | | | $ | 1,739,999 | | | | | |
| | | | | | | | | | | | | | | |
To the extent the Funds realize future net capital gains, taxable distributions to its shareholders will be offset by any unused capital loss carryover. For the year ended August 31, 2010, the Internet Fund and Small Cap Growth Fund had $89,876,360 and $87,076 in capital loss carryover expire, respectively. At August 31, 2010, the Internet Fund had net realized losses from transactions between November 1, 2009 and August 31, 2010 of $861,305, which were deferred for tax purposes and were recognized on September 1, 2010.
The Internet Fund made no distributions during the six months ended February 28, 2011 and during the fiscal year ended August 31, 2010. The Small Cap Growth Fund made no distributions during the six months ended February 28, 2011, during the period from October 1, 2009 through August 31, 2010 and during the fiscal year ended September 30, 2009. The Wisdom Fund paid $23,502 out of capital gains during the six months ended February 28, 2011. The Wisdom Fund made no distributions during the period from June 1, 2010 through August 31, 2010 and paid $20,060 as a return of capital and paid $18,597 out of capital gains during the year ended May 31, 2010.
NOTE 5—INVESTMENT ADVISORY AND OTHER AGREEMENTS
The Corporation has Investment Advisory Agreements (the “Advisory Agreements”) with Jacob Asset Management of New York LLC (the “Adviser”), with whom certain officers and Directors of the Board are affiliated, to furnish investment advisory services to the Funds. Under the terms of the Advisory Agreements, the Corporation, on behalf of the Funds, compensates the Adviser for its management services based on an annual rate of 1.25% of the Internet Fund’s average daily net assets, 0.90% of the Small Cap Growth Fund’s average daily net assets and 0.50% of the Wisdom Fund’s average daily net assets.
Effective January 1, 2009, the Adviser has contractually agreed to waive up to 0.10% of the average daily net assets from its advisory fee to the extent the Internet Fund’s total annual operating expenses exceed 2.95% of the average daily net assets through January 2, 2012. The Adviser has the ability to recoup amounts waived for a period of three years following such fee waivers to the extent that such recoupment by the Adviser will not
34
JACOB FUNDS INC.
NOTES TO THE FINANCIAL STATEMENTS (Continued)
February 28, 2011 (Unaudited)
cause the Internet Fund to exceed any applicable expense limitation in place when the fee was waived. For the six months ended February 28, 2011, fees of $24,647 were recouped by the Adviser.
Effective February 1, 2010 (date of reorganization of the Small Cap Growth Fund), the Adviser has contractually agreed for a period of two years to waive its advisory fees in an amount up to an annual rate of 0.90% of the Small Cap Growth Fund’s average daily net assets, to the extent that the Fund’s total annual operating expenses exceed 2.45% of average daily net assets. The Adviser has the ability to recoup amounts waived for a period of three years following such fee waivers to the extent that such recoupment by the Adviser will not cause the Small Cap Growth Fund’s expenses to exceed 2.45%. For the six months ended February 28, 2011, fees of $24,452 were waived by the Adviser.
Effective February 18, 2010 (date of reorganization of the Wisdom Fund), the Adviser has contractually agreed for a period of two years to waive its advisory fees in an amount up to an annual rate of 0.50% of the Fund’s average daily net assets, to the extent that the Wisdom Fund’s total annual operating expenses exceed 1.95% of average daily net assets. The Adviser has the ability to recoup amounts waived for a period of three years following such fee waivers to the extent that such recoupment by the Adviser will not cause the Wisdom Fund’s expenses to exceed 1.95%. For the six months ended February 28, 2011, fees of $28,385 were waived by the Adviser.
Following is a schedule of when fees may be recouped:
| | | | | | | | | | | | | | | |
Internet
| | | Small Cap
| | | Wisdom
| | | | |
| Fund | | | Growth Fund | | | Fund | | | Expiration | |
| |
| $ | — | | | $ | — | | | $ | 17,306 | | | | May 31, 2013 | |
| | 32,645 | | | | 25,607 | | | | 14,645 | | | | August 31, 2013 | |
| | — | | | | 24,452 | | | | 28,385 | | | | August 31, 2014 | |
| | | | | | | | | | | | | | | |
| $ | 32,645 | | | $ | 50,059 | | | $ | 60,336 | | | | | |
| | | | | | | | | | | | | | | |
The Rockland Small Cap Growth Fund was the predecessor fund of the Small Cap Growth Fund. All performance and operations reported for the period prior to February 1, 2010 represent the activity of the Rockland Small Cap Growth Fund.
The Wisdom Fund was the predecessor fund of the Jacob Wisdom Fund. All performance and operations reported for the periods prior to February 18, 2010 represent the activity of the Wisdom Fund.
Gould Investment Partners, LLC (“Gould”) was the adviser of the Rockland Small Cap Growth Fund (prior to February 1, 2010). Under terms of the former advisory agreement, Gould received a monthly fee at the annual rate of 1.00% of the Fund’s average daily net assets. Effective September 1, 2009, Gould agreed to voluntarily waive 0.25% of its advisory fee until the reorganization of the Rockland Small Cap Growth Fund into the Small Cap Growth Fund. For the period from October 1, 2009 through January 31, 2010, fees of $5,612 were waived by Gould.
35
JACOB FUNDS INC.
NOTES TO THE FINANCIAL STATEMENTS (Continued)
February 28, 2011 (Unaudited)
Atlanta Investment Counsel, LLC (“AIC”) was the adviser of the Wisdom Fund (prior to December 1, 2009). Under terms of the former advisory agreement, AIC received a monthly fee at the annual rate of 0.50% of the Fund’s average daily net assets. AIC agreed to voluntarily waive all or a portion of its advisory fee and to reimburse fees and expense to the extent the Wisdom Fund’s total annual operating expenses exceeded 1.75% of the average daily net assets, exclusive of interest, taxes, brokerage fees and 12b-1 fees.
U.S. Bancorp Fund Services, LLC serves as transfer agent, administrator and accounting services agent for the Funds. U.S. Bank, N.A. serves as custodian for the Funds. U.S. Bancorp Asset Management, Inc. (formerly known as FAF Advisors, Inc.) serves as the securities lending agent.
NOTE 6—SECURITIES LENDING
The Funds may lend portfolio securities equal in value to up to 33% of their total assets (including such loans) to borrowers under terms of participation in a securities lending program administered by U.S. Bancorp Asset Management, Inc. The Agreement requires that loans are collateralized at all times in an amount equal to at least 102% of the market value of any loaned securities at the time of the loan, plus accrued interest.
The Funds receive compensation in the form of fees and earns interest on the cash collateral. The amount of fees depends on a number of factors including the types of security, length of the loan and credit standing of the borrower. The Funds continue to receive interest or dividends on the securities loaned during the borrowing period. The Funds have the right under the terms of the securities lending agreement to recover the securities from the borrower on demand. U.S. Bancorp Asset Management, Inc. received no income from the Internet Fund for its securities lending administrative services during the six months ended February 28, 2011. The Small Cap Growth Fund and Wisdom Fund did not participate in securities lending during the six months ended February 28, 2011.
As of February 28, 2011, the Internet Fund had loaned securities that were collateralized by cash proceeds that the borrower paid to the Internet Fund. The cash collateral is invested by the custodian with the approval of the Adviser. Although risk is mitigated by the collateral and by an indemnification by the securities lending agent, the Internet Fund could experience a delay in recovering its securities and possible loss of income or value if the borrower fails to return the borrowed securities. The Internet Fund is also exposed to market risk on the investments it purchases with the proceeds of the cash collateral. As of February 28, 2011, the value of the Internet Fund’s securities on loan was $786,827. The cost of the related collateral was $718,910 and the fair value of the investments purchased was $192,320. An amount of $100,815 of the collateral was not invested and held in cash. As of February 28, 2011, the Internet Fund had experienced $526,590 of unrealized depreciation and $694 of realized loss on the investments it purchased with proceeds of the cash collateral.
NOTE 7—DISTRIBUTION AND SERVICE PLAN
The Corporation, on behalf of the Internet Fund, has adopted a distribution and service plan (the “Internet Fund Plan”), pursuant to Rule 12b-1 under the 1940 Act. The Internet Fund Plan provides that the Internet
36
JACOB FUNDS INC.
NOTES TO THE FINANCIAL STATEMENTS (Continued)
February 28, 2011 (Unaudited)
Fund will compensate the Adviser up to 0.25% per annum of the Internet Fund’s average daily net assets for certain expenses and costs incurred in connection with providing shareholder servicing and maintaining shareholder accounts and to compensate parties with which it has written agreements and whose clients own shares of the Internet Fund for providing servicing to their clients (“Shareholder Servicing Fee”). The Internet Fund Plan also provides for a distribution fee equal to 0.10% of the Internet Fund’s average daily net assets on an annual basis (“Asset Based Sales Charge”). The fee is used to compensate Quasar Distributors, LLC, the Funds’ distributor (the “Distributor”), for basic distribution services, out of pocket expenses incurred in connection with activities to sell Internet Fund shares, advertising, compliance reviews, and licensing of the Adviser’s staff. The Distributor may make payments from time to time from the Asset Based Sales Charge to broker-dealers and other financial professionals whose clients are Internet Fund shareholders for providing distribution assistance and promotional support to the Internet Fund. Remaining amounts of the Asset Based Sales Charge may be used to satisfy distribution costs as directed by the Adviser. The Internet Fund incurred $75,710 in expenses pursuant to the 12b-1 Plan for the six months ended February 28, 2011. At February 28, 2011, $20,324 of the Shareholder Servicing Fee was available for eligible 12b-1 expenses for the Internet Fund.
The Corporation, on behalf of the Small Cap Growth Fund and Wisdom Fund, has adopted a distribution and service plan (the “Plan”) pursuant to Rule 12b-1 under the 1940 Act. Rule 12b-1 provides that an investment company that bears any direct or indirect expense of distributing its shares must do so only in accordance with the Plan permitted by Rule 12b-1. Pursuant to the Plan, the Small Cap Growth Fund and Wisdom Fund make payments to the Distributor, the Adviser, financial intermediaries or others to reimburse such parties for distribution and/or shareholder servicing activity in an amount not to exceed 0.35% of the average daily net assets on an annual basis. The distribution fees are “asset based” sales charges and, therefore, long-term shareholders may pay more in total sales charges than the economic equivalent of the maximum front-end sales charge permitted by the Financial Industry Regulatory Authority (FINRA). The Small Cap Growth Fund incurred $9,509 and the Wisdom Fund incurred $19,870 in expenses pursuant to the 12b-1 Plan for the six months ended February 28, 2011. At February 28, 2011, $2,155 and $16,671 of the Shareholder Servicing Fee was available for eligible 12b-1 expenses for the Small Cap Growth Fund and Wisdom Fund, respectively.
In connection with the preparation of the Funds’ financial statements, management has evaluated subsequent events after February 28, 2011. There have been no significant subsequent events since February 28, 2011 that would require adjustment to or additional disclosure in these financial statements.
37
JACOB FUNDS INC.
ADDITIONAL INFORMATION ON FUND EXPENSES (Unaudited)
For the Six Months Ended February 28, 2011 for the Internet Fund, Small Cap Growth Fund and Wisdom Fund
As a shareholder of a mutual fund, you may incur two types of costs: (1) transaction costs, including sales charges (loads) on purchase payments, reinvested dividends, or other distributions; redemption fees; and exchange fees; and (2) ongoing costs, including management fees; distribution and/or service (12b-1) fees; and other fund expenses. The Funds do not currently charge sales charges (loads) or exchange fees. The Funds assess a redemption fee of 2% on shares sold within 30 days for the Internet Fund and 90 days for the Small Cap Growth Fund and Wisdom Fund following their purchase date. In addition, you will be assessed fees for outgoing wire transfers, returned checks and stop payment orders. The Funds charge management fees and distribution and/or service (12b-1) fees. The Expense Example is intended to help you understand your ongoing costs (in dollars) of investing in the Funds and to compare these costs with the ongoing costs of investing in other mutual funds. The Example is based on an investment of $1,000 invested at the beginning of the period and held for the entire period (9/1/10–2/28/11) for the Internet Fund, Small Cap Growth Fund and Wisdom Fund.
Actual Expenses
The first line of the table below provides information about account values based on actual returns and actual expenses. Although the Funds charge no sales load, the Funds charge a redemption fee of 2% on shares sold within 30 days for the Internet Fund and 90 days for the Small Cap Growth Fund and Wisdom Fund following the purchase date. In addition, you will be assessed fees for outgoing wire transfers, returned checks and stop payment orders at prevailing rates charged by U.S. Bancorp Fund Services, LLC, the Funds’ transfer agent. If you request that a redemption be made by wire transfer, currently the Funds’ transfer agent charges a $15.00 fee. The Example does not reflect transactional costs, such as redemption fees. You may use the information in the first line below, together with the amount you invested, to estimate the expenses that you paid over the period. Simply divide your account value by $1,000 (for example, an $8,600 account value divided by $1,000 = 8.6), then multiply the result by the number in the first line under the heading entitled “Expenses Paid During the Period” to estimate the expenses you paid on your account during this period.
Hypothetical Example for Comparison Purposes
The second line of the table below provides information about hypothetical account values based on a hypothetical return and hypothetical expenses based on a Fund’s actual expense ratio and an assumed rate of return of 5% per year before expenses, which is not a Fund’s actual return. The hypothetical account values and expenses may not be used to estimate the actual ending account balance or expenses you paid for the period. You may use this information to compare the ongoing costs of investing in the Funds and other funds. To do so, compare this 5% hypothetical example with the 5% hypothetical examples that appear in the shareholder reports of the other funds. Please note that the expenses shown in the table are meant to highlight your ongoing costs only and do not reflect transactional costs, such as redemption fees. Therefore, the second line of the table is useful in comparing ongoing costs only, and will not help you determine the relative total costs of
38
JACOB FUNDS INC.
ADDITIONAL INFORMATION ON FUND EXPENSES (Unaudited) (Continued)
owning different funds. In addition, if the transactional costs were included, your costs would have been higher.
Internet Fund
| | | | | | | | | | | | | |
| | | | | | | Expenses Paid
|
| | | Beginning Account
| | Ending Account
| | During the Period
|
| | | Value 9/1/10 | | Value 2/28/11 | | 9/1/10–2/28/11* |
| |
| Actual | | $ | 1,000.00 | | | $ | 1,368.40 | | | $ | 17.32 | |
| Hypothetical (5% annual return before expenses) | | $ | 1,000.00 | | | $ | 997.67 | | | $ | 14.61 | |
| | |
| * | | Expenses are equal to the Internet Fund’s annualized expense ratio of 2.95% multiplied by the average account value over the period multiplied by 181/365 (to reflect the one-half year period). |
Small Cap Growth Fund
| | | | | | | | | | | | | |
| | | | | | | Expenses Paid
|
| | | Beginning Account
| | Ending Account
| | During the Period
|
| | | Value 9/1/10 | | Value 2/28/11 | | 9/1/10–2/28/11* |
| |
| Actual | | $ | 1,000.00 | | | $ | 1,492.70 | | | $ | 25.09 | |
| Hypothetical (5% annual return before expenses) | | $ | 1,000.00 | | | $ | 992.16 | | | $ | 20.05 | |
| | |
| * | | Expenses are equal to the Small Cap Growth Fund’s annualized expense ratio of 4.06% multiplied by the average account value over the period multiplied by 181/365 (to reflect the one-half year period). |
Wisdom Fund
| | | | | | | | | | | | | |
| | | | | | | Expenses Paid
|
| | | Beginning Account
| | Ending Account
| | During the Period
|
| | | Value 9/1/10 | | Value 2/28/11 | | 9/1/10–2/28/11* |
| |
| Actual | | $ | 1,000.00 | | | $ | 1,139.60 | | | $ | 12.63 | |
| Hypothetical (5% annual return before expenses) | | $ | 1,000.00 | | | $ | 1,000.49 | | | $ | 11.81 | |
| | |
| * | | Expenses are equal to the Wisdom Fund’s annualized expense ratio of 2.38% multiplied by the average account value over the period multiplied by 181/365 (to reflect the one-half year period). |
39
JACOB FUNDS INC.
ADDITIONAL INFORMATION
Approval of the Investment Advisory Agreement
During the fiscal quarter ended November 30, 2010, the Board of Directors, including all of the independent Directors, approved the renewal of the Investment Advisory Agreement between Jacob Funds Inc., on behalf of the Jacob Internet Fund (the “Internet Fund”), and Jacob Asset Management of New York LLC for an additional year. In reaching this decision, the Board took into account a combination of factors, including the nature, extent and quality of services provided by the Adviser; the Internet Fund’s performance; the Internet Fund’s fees and expenses; the costs of the services to be provided and the profits realized by the Adviser and the extent to which economies of scale would be realized as the Internet Fund grows. The Board did not identify any single factor as all-important or controlling, and this summary does not detail all of the matters considered.
In evaluating the nature, extent and quality of services provided by the Adviser, the Board concluded that the experience and capabilities of the portfolio managers and research team dedicated to the continued management of the Internet Fund were sufficient and beneficial to the Internet Fund, as evidenced by the Internet Fund’s performance record over varying periods. The Board also concluded that the Adviser had sufficient resources dedicated to the operation and management of the Internet Fund.
The Board considered the Adviser’s ability to manage the Internet Fund while also managing the Jacob Small Cap Growth Fund and Jacob Wisdom Fund. The Board reviewed the Adviser’s financial condition and considered the economics associated with the advisory fees and waivers for all of the Funds. The Board concluded that the Adviser had appropriate resources to continue managing the Internet Fund. The Board also concluded that the Adviser was not experiencing economies of scale at the Internet Fund’s current asset levels.
The Board reviewed the advisory fees and overall expenses of the Internet Fund and discussed the difference in fees and expenses compared to the Small Cap Growth Fund and Wisdom Fund, as well as other funds within the Internet Fund’s peer group. The Board discussed the allocation of expenses among the three Funds and the manner in which each Fund bears its appropriate share of the expenses.
In considering the various factors, the Board’s fiduciary duties to the Internet Fund’s shareholders and the body of law governing the approval of investment advisory agreements, the independent Directors received assistance and advice from independent counsel. Based upon its review of such material and information together with such other information as it deemed relevant, the Board, including a majority of the independent Directors, concluded that the Adviser had demonstrated the capability and resources to perform the duties required under the Investment Advisory Agreement, the compensation payable to the Adviser was fair and reasonable, and the compensation and other terms were in the best interests of the Internet Fund and its shareholders.
40
JACOB FUNDS INC.
ADDITIONAL INFORMATION (Unaudited)
Proxy Voting
A description of the policies and procedures that the Funds use to determine how to vote proxies relating to portfolio securities is available without charge by calling toll-free 1-888-Jacob-fx (522-6239) or on the SEC website at http://www.sec.gov.
Proxy Voting Record
Information regarding how the Funds voted proxies relating to portfolio securities during the most recent 12-month period ended June 30 is available without charge by calling 1-888-Jacob-fx (522-6239) or on the SEC website at http://www.sec.gov.
Holdings Disclosure
The Funds’ Semi-Annual and Annual Reports include a complete schedule of portfolio holdings for the second and fourth quarters of each fiscal year.
The Funds file their complete schedule of portfolio holdings with the SEC for the first and third quarters of each fiscal year on Form N-Q. The Funds’ Forms N-Q are available on the SEC website at http://www.sec.gov and may be reviewed and copied at the SEC’s Public Reference Room in Washington, D.C. Information on the operation of the Public Reference Room may be obtained by calling 1-800-SEC-0330.
41
Investment Advisor
Jacob Asset Management of New York LLC
Administrator and Transfer Agent
and Dividend Agent
U.S. Bancorp Fund Services, LLC
Underwriter and Distributor
Quasar Distributors, LLC
Custodian
U.S. Bank, N.A.
Legal Counsel
Stradley Ronon Stevens & Young, LLP
Independent Registered Public
Accounting Firm
BBD, LLP
This report has been prepared for the information of shareholders of the Jacob Internet Fund, the Jacob Small Cap Growth Fund and the Jacob Wisdom Fund is not authorized for distribution to prospective investors unless preceded or accompanied by an effective prospectus that includes information regarding the Funds’ objectives, policies, management, records and other information.
Jacob Asset Management of New York LLC
1-888-Jacob-fx (522-6239)
www.Jacobmutualfunds.com
Semi-Annual
Report
February 28, 2011
Item 2. Code of Ethics.
Not applicable for semi-annual reports.
Item 3. Audit Committee Financial Expert.
Not applicable for semi-annual reports.
Item 4. Principal Accountant Fees and Services.
Not applicable for semi-annual reports.
Item 5. Audit Committee of Listed Registrants.
Not applicable to Registrants who are not listed issuers (as defined in Rule 10A-3 under the Securities Exchange Act of 1934).
Item 6. Investments.
The Schedule of Investments is included as part of the report to shareholders filed under Item 1 of this Form.
Item 7. Disclosure of Proxy Voting Policies and Procedures for Closed-End Management Investment Companies.
Not applicable to open-end investment companies.
Item 8. Portfolio Managers of Closed-End Management Investment Companies.
Not applicable to open-end investment companies.
Item 9. Purchases of Equity Securities by Closed-End Management Investment Company and Affiliated Purchasers.
Not applicable to open-end investment companies.
Item 10. Submission of Matters to a Vote of Security Holders.
Not Applicable.
Item 11. Controls and Procedures.
| (a) | | The Registrant’s principal executive officer/President and principal financial officer/Treasurer have reviewed the Registrant’s disclosure controls and procedures (as defined in Rule 30a-3(c) under the Investment Company Act of 1940 (the “Act”)) as of a date within 90 days of the filing of this report, as required by Rule 30a-3(b) under the Act and Rules 13a-15(b) or 15d-15(b) under the Securities Exchange Act of 1934. Based on their review, such officers have concluded that the disclosure controls and procedures are effective in ensuring that information required to be disclosed in this report is appropriately recorded, processed, summarized and reported and made known to them by others within the Registrant and by the Registrant’s service provider. |
| |
| (b) | | There were no changes in the Registrant’s internal control over financial reporting (as defined in Rule 30a-3(d) under the Act) that occurred during the second fiscal quarter of the period covered by this report that has materially affected, or is reasonably likely to materially affect, the Registrant’s internal control over financial reporting. |
Item 12. Exhibits.
| (a) | | (1) Any code of ethics or amendment thereto, that is the subject of the disclosure required by Item 2, to the extent that the Registrant intends to satisfy Item 2 requirements through filing an exhibit. The Registrant has posted its Code of Ethics on its website at www.jacobmutualfunds.com |
| |
| | (2) A separate certification for each principal executive and principal financial officer pursuant to Section 302 of the Sarbanes-Oxley Act of 2002. Filed herewith. |
| |
| | (3) Any written solicitation to purchase securities under Rule 23c-1 under the Act sent or given during the period covered by the report by or on behalf of the Registrant to 10 or more persons. Not applicable to open-end investment companies. |
| |
| (b) | | Certifications pursuant to Section 906 of the Sarbanes-Oxley Act of 2002. Furnished herewith. |
2
SIGNATURES
Pursuant to the requirements of the Securities Exchange Act of 1934 and the Investment Company Act of 1940, the Registrant has duly caused this report to be signed on its behalf by the undersigned, thereunto duly authorized.
| | | | | | | |
|
| | | (Registrant) Jacob Funds Inc. | | |
| | | | | |
| | | | | | | |
| | | By (Signature and Title) | | /s/ Ryan Jacob | | |
| | | | | Ryan Jacob, President | | |
| | | | | | | |
| | | Date | | 5/4/11 | | |
| | | | | |
Pursuant to the requirements of the Securities Exchange Act of 1934 and the Investment Company Act of 1940, this report has been signed below by the following persons on behalf of the Registrant and in the capacities and on the dates indicated.
| | | | | | | |
|
| | | By (Signature and Title) | | /s/ Ryan Jacob | | |
| | | | | Ryan Jacob, President | | |
| | | | | | | |
| | | Date | | 5/4/11 | | |
| | | | | |
| | | | | | | |
| | | By (Signature and Title) | | /s/ Francis Alexander | | |
| | | | | Francis Alexander, Treasurer | | |
| | | | | | | |
| | | Date | | 5/4/11 | | |
| | | | | |
3