As filed with the Securities and Exchange Commission on May 8, 2014
UNITED STATES
SECURITIES AND EXCHANGE COMMISSION
Washington, D.C. 20549
FORM N-CSR
CERTIFIED SHAREHOLDER REPORT OF REGISTERED
MANAGEMENT INVESTMENT COMPANIES
Investment Company Act file number 811-09447
Jacob Funds Inc.
(Exact name of Registrant as specified in charter)
C/O Jacob Asset Management of New York LLC
653 Manhattan Beach Blvd. # J
Manhattan Beach, CA 90266
(Address of principal executive offices) (Zip code)
Ryan Jacob
C/O Jacob Asset Management of New York LLC
653 Manhattan Beach Blvd. # J
Manhattan Beach, CA 90266
(Name and address of agent for service)
(424)-237-2164
Registrant's telephone number, including area code
Date of fiscal year end: August 31
Date of reporting period: February 28, 2014
Item 1. Reports to Stockholders.
Jacob Internet Fund
Jacob Small Cap Growth Fund
Jacob Micro Cap Growth Fund
Jacob Wisdom Fund
Semi-Annual Report
February 28, 2014
The Jacob Internet Fund, Jacob Small Cap Growth Fund and
Jacob Micro Cap Growth Fund are mutual funds with the
primary investment objective of long-term growth of capital.
The Jacob Wisdom Fund is a mutual fund with the primary investment
objective to maximize total investment return consisting of a
combination of income and capital appreciation.
The Jacob Internet Fund has current income as a secondary objective.
Investment Adviser
Jacob Asset Management of New York LLC
TABLE OF CONTENTS
| | Letter From the Manager | | | 1 | |
| | | | | | |
| | Industry Breakdown | | | 4 | |
| | | | | | |
| | Schedules of Investments | | | 8 | |
| | | | | | |
| | Statements of Assets and Liabilities | | | 20 | |
| | | | | | |
| | Statements of Operations | | | 22 | |
| | | | | | |
| | Statements of Changes in Net Assets | | | 24 | |
| | | | | | |
| | Financial Highlights | | | 28 | |
| | | | | | |
| | Notes to the Financial Statements | | | 37 | |
| | | | | | |
| | Additional Information on Fund Expenses | | | 51 | |
| | | | | | |
| | Additional Information | | | 54 | |
Dear Fellow Investors,
Stocks performed surprisingly well over the past six months, despite a range of difficult fiscal and political issues—from the Fed’s bond tapering, to extreme weather patterns in the U.S., and conflicts in Syria and Ukraine. Seemingly shrugging off worldwide turmoil, the markets continued to grind higher, exhibiting impressive resiliency.
Though the U.S. economy is still underperforming compared to past recoveries, the stock market has been buoyed by continued low interest rates and modest earnings growth. Companies have been improving their financial positions by rationalizing expenses and remaining tentative with new spending and hiring. As such, we are cautious about investing in companies for which growth is tied to a robust U.S. economy. We continue to focus our sights on secular growth stories, particularly in tech, healthcare, and to some extent, energy.
Jacob Internet Fund
The Jacob Internet Fund returned 19.95% for the six months ended February 28, 2014, relatively in line with the Nasdaq Composite Index, which returned 20.78%. Our best performers were our core holdings of Internet leaders: Expedia, Facebook, Google, Tencent and Yahoo; all of which returned more than 40% during the period. LogMeIn, TripAdvisor and Yelp also performed well during the period.
Although core holdings performed well, overall fund returns were held back by newer portfolio additions. One example is LinkedIn, a company that we’ve admired for some time—the business-focused social website enjoys a huge network effect and strong subscription revenue base—and which we started adding to the portfolio on recent weakness. We also bought Rally Software, a provider of cloud-based solutions for managing software development. With an increasingly broader range of products incorporating software, this market has been growing far beyond solely technology companies.
Our Chinese digital media stock Sina Corp performed weakly during the period, but we held on to a large position in anticipation of an Initial Public Offering (IPO) filing from the company for its very valuable Twitter-like micro blogging service, Weibo. After the close of the fiscal period, Sina did indeed file to take Weibo public.
Jacob Small Cap Growth Fund
The Jacob Small Cap Growth Fund Institutional Class returned 15.00%, versus the Russell 2000 Growth Index which returned 19.20% for the six month period ended February 28, 2014. It was a strong period for the benchmark, and many of our stocks performed well. However, overall performance was hampered by three biotech holdings: Amarin Corp, Coronado Biosciences, and Achillion Pharmaceuticals, each of which suffered poorer than expected drug development results.
In particular, Amarin’s prospects took a turn for the worse after the FDA appeared to change its criteria midway through the process for granting approval of its promising fish oil-based drug for high triglycerides. Achillion faced clinical holds on its Hepatitis C product, while Coronado had unfortunate results with its Crohn’s disease treatment. We sold each of these positions during the fourth quarter.
We also sold our Yelp position after a strong run up caused it to outgrow our small cap mandate. Similarly, Liberty Ventures appreciated to such an extent that we took profits as well.
As far as new additions to the portfolio, we purchased three promising new biotech stocks: Merrimack Pharmaceuticals, Omeros Corp and Tetraphase Pharmaceuticals. (See Jacob Micro Cap Growth Fund for details.) We also added Penn Virginia, an independent oil and gas company with valuable assets in Texas.
Jacob Micro Cap Growth Fund
The Jacob Micro Cap Growth Fund Institutional Class was up 12.69% for the six month period ended February 28, 2014, compared to 26.17% for the Russell Microcap Growth Index. The underperformance was due in part to significant weightings in the same three biotech stocks held in the Small Cap Growth Fund—Amarin, Coronado and Achillion (see above for details).
We took positions in biotech stocks Merrimack, Omeros, and Tetraphase (also held in Jacob Small Cap Growth Fund). To counter the volatility that naturally accompanies this sector, our biotech strategy takes smaller positions in a
diversified range of names that have a broad pipeline of products in development and the financial resources (either internally or through partnerships) to fund clinical trials.
Merrimack is developing oncology drugs, including two compounds in late-stage trials for pancreatic and ovarian/breast cancer (with partner Sanofi), around the theme of interrupting the signaling between cancer cells that allows them to communicate with each other and grow.
Omeros has a drug discovery program that is focused on GPCRs (G protein-coupled receptors), proteins that are associated with specific diseases, and which are the basis for approximately half of the commercialized drugs available today. In addition, they are close to receiving FDA approval on a drug for reducing complications from cataract surgery, and have early-stage candidates for Huntington’s disease and Alzheimer’s disease.
Tetraphase is a clinical-stage biopharma company developing new antibiotics to fight drug-resistant bacteria. The FDA has started to fast-track new antibiotics in light of urgent global need, due to increasing antibiotic resistance and the emergence of ‘superbugs’, while Congress has provided enticing financial incentives for developing such drugs. Tetraphase has proprietary chemistry technology for creating synthetic tetracyclines, a common class of antibiotics, and has thousands of compounds in various stages of development. Its lead drug candidate, a treatment for complicated abdominal and urinary tract infections, is in Phase 3 trials.
Aside from biotech, we achieved a quick success with our new position in Coastal Contacts, a Canadian online purveyor of contact lenses and eyeglasses. A European company quickly acquired them at a premium. (Jacob Internet Fund also held a small position.)
Jacob Wisdom Fund
The Jacob Wisdom Fund returned 10.52% for the six month period ended February 28, 2014, about two-thirds of the performance of the S&P 500 Index, which was up 15.07%. We attempt to be conservative when executing our investment strategy and are always mindful of risk with an eye toward capital preservation.
We culled some positions to make room for six new stocks: Panera Bread, Eli-Lilly, Union Pacific, Viacom, DaVita HealthCare Partners, and Direct TV.
Panera is a growth stock that we were able to purchase at bargain prices in October 2013, after the company stumbled on earnings. We bought it for its strong return on invested capital and share buyback program. Eli-Lilly was attractively priced in early 2014, due to some major drugs coming off patent. We believe the company will bring valuable new products to market in the near future that can help offset that revenue loss.
To highlight a few others, Union Pacific is an extremely well managed company with the best operating profit margins in its industry, at 33%, and appears to be poised to profit from the new domestic energy boom. Viacom is a media company in the catbird seat with its varied mix of entertainment assets—ranging from Nickelodeon and VH1 to Paramount Pictures. Demand for quality content has been exploding across multiple distribution channels, including cable and internet.
Going forward, looking at our entire Fund family, we anticipate a continuing gradual economic recovery, likely accompanied by a rising interest rate environment. For this reason, we seek to invest in companies that can lead their industries and grow their market shares regardless of the strength or weakness of the broader economic picture.
As always, thank you for entrusting us with your investments.
Ryan Jacob
Chairman and Chief Investment Officer
Darren Chervitz
Portfolio Manager
Frank Alexander
Portfolio Manager
Past performance is not a guarantee of future results.
Must be accompanied or preceded by a prospectus.
The opinions expressed above are those of the portfolio manager and are subject to change. Forecasts cannot be guaranteed.
Mutual fund investing involves risk; loss of principal is possible. The Funds invest in foreign securities which involve greater volatility and political, economic and currency risks and differences in accounting methods. These risks are greater in emerging markets. Growth stocks typically are more volatile than value stocks; however, value stocks have a lower expected growth rate in earnings and sales. There are more specific risks inherent in investing in the Internet area, particularly with respect to smaller capitalized companies and the high volatility of Internet stocks. The Funds can invest in small-and mid-cap securities which involve additional risks such as limited liquidity and greater volatility. Investments in micro capitalization companies may involve greater risks, as these companies tend to have limited product lines, markets and financial or managerial resources. Micro cap stocks often also have a more limited trading market, such that the Adviser may not be able to sell stocks at an optimal time or price. In addition, less frequently-traded securities may be subject to more abrupt price movements than securities of larger capitalized companies. Investments in debt securities typically decrease in value when interest rates rise. This risk is usually greater for longer term debt securities. Investments in real estate related instruments may be affected by economic, legal, cultural, environmental or technological factors that affect property values, rents or occupancies of real estate related to the Fund’s holdings. The performance of REITs depends on how well the REIT manages the properties it owns. Diversification does not assure a profit or protect against loss in a declining market.
Fund holdings are subject to change and should not be construed as a recommendation to buy or sell any security. Current and future portfolio holdings are subject to risk.
Please refer to the schedule of investments for complete Fund holdings information.
The S&P 500 Index is a broad based unmanaged index of 500 stocks, which is widely recognized as representative of the equity market in general. The NASDAQ Composite Index is a market capitalization weighted index that is designed to represent performance of the National Market System which includes over 5,000 stocks traded only over-the-counter and not on an exchange. The Russell 2000 Growth Index measures the performance of the small cap growth segment of the U.S. equity universe. It includes those Russell 2000 companies with higher price-to-book ratios and higher forecasted growth values. The Russell Microcap Growth Index measures the performance of the microcap growth segment of the U.S. equity market. It includes those Russell Microcap Index companies with higher price-to-book ratios and higher forecasted growth values. It is not possible to invest directly in an index.
Performance data reflects fee waivers and in the absence of these waivers performance would be reduced.
The Funds are distributed by Quasar Distributors, LLC.
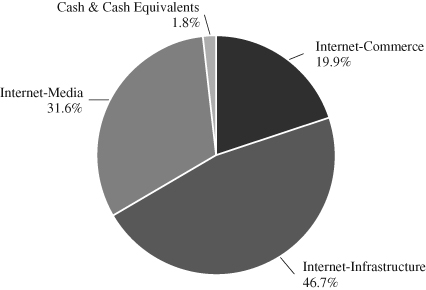
INDUSTRY BREAKDOWN AS OF FEBRUARY 28, 2014
(as a percentage of total investments)
(Unaudited)
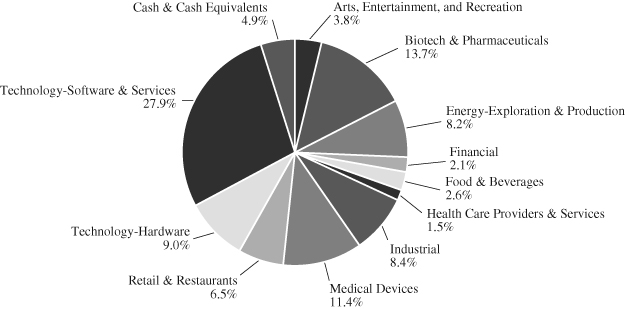
JACOB SMALL CAP GROWTH FUND
INDUSTRY BREAKDOWN AS OF FEBRUARY 28, 2014
(as a percentage of total investments)
(Unaudited)
JACOB MICRO CAP GROWTH FUND INDUSTRY BREAKDOWN AS OF FEBRUARY 28, 2014
(as a percentage of total investments)
(Unaudited)
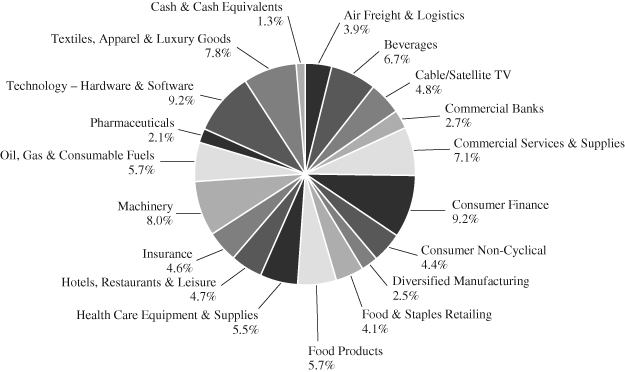
JACOB WISDOM FUND
INDUSTRY BREAKDOWN AS OF FEBRUARY 28, 2014
(as a percentage of total investments)
(Unaudited)
JACOB INTERNET FUND
SCHEDULE OF INVESTMENTS
February 28, 2014 (Unaudited)
| Shares | | | | | | | | | | Value | |
| | | COMMON STOCKS | | | | | | 98.3 | % | | | |
| | | | | | | | | | | | | | |
| | | Internet-Commerce | | | 19.9 | % | | | | | | | |
| | 15,250 | | Bottomline Technologies, Inc.* | | | | | | | | | | $ | 544,273 | |
| | 155,856 | | Coastal Contacts Inc.*^ | | | | | | | | | | | 1,756,497 | |
| | 16,000 | | Ctrip.com International Ltd.—ADR*^ | | | | | | | | | | | 864,160 | |
| | 20,000 | | eBay Inc.* | | | | | | | | | | | 1,175,400 | |
| | 104,000 | | E-House (China) Holdings Ltd.—ADR^ | | | | | | | | | | | 1,302,080 | |
| | 14,600 | | Expedia, Inc. | | | | | | | | | | | 1,146,538 | |
| | 29,826 | | Shutterfly, Inc.* | | | | | | | | | | | 1,627,307 | |
| | 218,341 | | ZipRealty, Inc.* | | | | | | | | | | | 1,034,936 | |
| | | | | | | | | | | | | | | 9,451,191 | |
| | | | | | | | | | | | | | | | |
| | | | Internet-Infrastructure | | | 46.8 | % | | | | | | | | |
| | 5,000 | | Apple Computer, Inc. | | | | | | | | | | | 2,631,200 | |
| | 27,000 | | Applied Optoelectronics, Inc.* | | | | | | | | | | | 638,820 | |
| | 3,200 | | athenahealth Inc.* | | | | | | | | | | | 620,384 | |
| | 38,000 | | Broadcom Corp.—Class A | | | | | | | | | | | 1,129,360 | |
| | 65,900 | | CEVA, Inc.* | | | | | | | | | | | 1,191,472 | |
| | 60,000 | | Cisco Systems, Inc. | | | | | | | | | | | 1,308,000 | |
| | 55,000 | | Ellie Mae, Inc.* | | | | | | | | | | | 1,705,000 | |
| | 121,700 | | Immersion Corp.* | | | | | | | | | | | 1,454,315 | |
| | 32,000 | | InvenSense, Inc.* | | | | | | | | | | | 644,800 | |
| | 675,451 | | iPass Inc.* | | | | | | | | | | | 1,046,949 | |
| | 63,806 | | LogMeIn, Inc.* | | | | | | | | | | | 2,670,281 | |
| | 206,000 | | Mitek Systems, Inc.* | | | | | | | | | | | 1,093,860 | |
| | 62,000 | | Numerex Corp.* | | | | | | | | | | | 920,080 | |
| | 60,800 | | Rally Software Development Corp.* | | | | | | | | | | | 1,209,312 | |
| | 20,000 | | Red Hat, Inc.* | | | | | | | | | | | 1,179,800 | |
| | 14,600 | | Salesforce.com, Inc.* | | | | | | | | | | | 910,602 | |
| | 12,496 | | SanDisk Corp. | | | | | | | | | | | 928,453 | |
| | 156,500 | | Silicon Image, Inc.* | | | | | | | | | | | 946,825 | |
| | | | | | | | | | | | | | | 22,229,513 | |
| | | | | | | | | | | | | | | | |
| | | | Internet-Media | | | 31.6 | % | | | | | | | | |
| | 18,000 | | Facebook, Inc.* | | | | | | | | | | | 1,232,280 | |
| | 1,900 | | Google Inc.* | | | | | | | | | | | 2,309,735 | |
| | 176,084 | | Jiayuan.com International Ltd.—ADR^ | | | | | | | | | | | 1,295,978 | |
| | 7,200 | | LinkedIn Corp.* | | | | | | | | | | | 1,469,088 | |
| | 30,000 | | SINA Corp.*^ | | | | | | | | | | | 2,049,900 | |
| | 30,000 | | Tencent Holdings Ltd. (HK) | | | | | | | | | | | 2,408,881 | |
| | 11,900 | | TripAdvisor Inc.* | | | | | | | | | | | 1,192,856 | |
The accompanying notes are an integral part of these financial statements.
JACOB INTERNET FUND
SCHEDULE OF INVESTMENTS (Continued)
February 28, 2014 (Unaudited)
| Shares | | | | | | | | | | Value | |
| | | COMMON STOCKS—(CONTINUED) | | | | | | 98.3 | % | | | |
| | | | | | | | | | | | | | |
| | | Internet-Media—(Continued) | | | 31.6 | % | | | | | | | |
| | 54,874 | | Yahoo! Inc.* | | | | | | | | | | $ | 2,121,978 | |
| | 9,900 | | Yelp! Inc.* | | | | | | | | | | | 934,758 | |
| | | | | | | | | | | | | | | 15,015,454 | |
| | | | TOTAL COMMON STOCKS (Cost $25,277,832) | | | | | | | | | | | 46,696,158 | |
| | | | | | | | | | | | | | | | |
| | | | SHORT TERM INVESTMENT | | | | | | | 1.9 | % | | | | |
| | | | | | | | | | | | | | | | |
| | | | Money Market Fund | | | 1.9 | % | | | | | | | | |
| | 871,450 | | Fidelity Government Portfolio-Class I, 0.01%(a) | | | | | | | | | | | 871,450 | |
| | | | TOTAL SHORT TERM INVESTMENT (Cost $871,450) | | | | | | | | | | | 871,450 | |
| | | | TOTAL INVESTMENTS (Cost $26,149,282) | | | | | | | 100.2 | % | | | 47,567,608 | |
| | | | LIABILITIES IN EXCESS OF OTHER ASSETS | | | | | | | (0.2 | )% | | | (78,669 | ) |
| | | | TOTAL NET ASSETS | | | | | | | 100.0 | % | | $ | 47,488,939 | |
| | | | | | | | | | | | | | | | |
| ^ | U.S. Dollar-denominated foreign security. |
ADRAmerican Depositary Receipt.
HKSecurity denominated in Hong Kong dollars. Value translated into U.S. dollars.
The accompanying notes are an integral part of these financial statements.
JACOB SMALL CAP GROWTH FUND
SCHEDULE OF INVESTMENTS
February 28, 2014 (Unaudited)
| Shares | | | | | | | | | | Value | |
| | | COMMON STOCKS | | | | | | 93.0 | % | | | |
| | | | | | | | | | | | | | |
| | | Arts, Entertainment, and Recreation | | | 4.6 | % | | | | | | | |
| | 86,900 | | DHX Media Ltd.^ | | | | | | | | | | $ | 374,346 | |
| | 14,900 | | Multimedia Games Holding Co., Inc.* | | | | | | | | | | | 492,072 | |
| | | | | | | | | | | | | | | 866,418 | |
| | | | | | | | | | | | | | | | |
| | | | Biotech & Pharmaceuticals | | | 10.1 | % | | | | | | | | |
| | 33,000 | | Array BioPharma Inc.* | | | | | | | | | | | 159,060 | |
| | 8,000 | | Celldex Therapeutics, Inc.* | | | | | | | | | | | 233,760 | |
| | 28,651 | | Cempra, Inc.* | | | | | | | | | | | 326,335 | |
| | 108,125 | | Curis, Inc.* | | | | | | | | | | | 329,781 | |
| | 38,000 | | Merrimack Pharmaceuticals, Inc.* | | | | | | | | | | | 189,240 | |
| | 21,800 | | Omeros Corp.* | | | | | | | | | | | 291,248 | |
| | 28,000 | | Tetraphase Pharmaceuticals, Inc.* | | | | | | | | | | | 380,800 | |
| | | | | | | | | | | | | | | 1,910,224 | |
| | | | | | | | | | | | | | | | |
| | | | Energy-Exploration & Production | | | 14.1 | % | | | | | | | | |
| | 12,500 | | Carrizo Oil & Gas, Inc.* | | | | | | | | | | | 621,750 | |
| | 26,600 | | Matador Resources Co.* | | | | | | | | | | | 645,316 | |
| | 52,000 | | Penn Virginia Corp.* | | | | | | | | | | | 787,800 | |
| | 66,750 | | Triangle Petroleum Corp.* | | | | | | | | | | | 598,080 | |
| | | | | | | | | | | | | | | 2,652,946 | |
| | | | | | | | | | | | | | | | |
| | | | Energy-Infrastructure & Services | | | 2.1 | % | | | | | | | | |
| | 4,800 | | Chart Industries, Inc.* | | | | | | | | | | | 401,088 | |
| | | | | | | | | | | | | | | | |
| | | | Financial | | | 2.7 | % | | | | | | | | |
| | 32,050 | | HomeTrust Bancshares, Inc.* | | | | | | | | | | | 502,224 | |
| | | | | | | | | | | | | | | | |
| | | | Health Care Providers & Services | | | 1.4 | % | | | | | | | | |
| | 10,700 | | Capital Senior Living Corp.* | | | | | | | | | | | 271,994 | |
| | | | | | | | | | | | | | | | |
| | | | Industrial | | | 8.2 | % | | | | | | | | |
| | 7,022 | | Advanced Emissions Solutions, Inc.* | | | | | | | | | | | 378,486 | |
| | 12,700 | | MasTec, Inc.* | | | | | | | | | | | 519,938 | |
| | 10,600 | | Mistras Group, Inc.* | | | | | | | | | | | 233,624 | |
| | 13,300 | | XPO Logistics, Inc.* | | | | | | | | | | | 418,152 | |
| | | | | | | | | | | | | | | 1,550,200 | |
| | | | | | | | | | | | | | | | |
| | | | Medical Devices | | | 10.3 | % | | | | | | | | |
| | 22,456 | | Derma Sciences, Inc.* | | | | | | | | | | | 329,879 | |
| | 8,000 | | DexCom, Inc.* | | | | | | | | | | | 360,800 | |
| | 14,500 | | Endologix, Inc.* | | | | | | | | | | | 195,750 | |
The accompanying notes are an integral part of these financial statements.
JACOB SMALL CAP GROWTH FUND
SCHEDULE OF INVESTMENTS (Continued)
February 28, 2014 (Unaudited)
| Shares | | | | | | | | | | Value | |
| | | COMMON STOCKS—(CONTINUED) | | | | | | 93.0 | % | | | |
| | | Medical Devices—(Continued) | | | 10.3 | % | | | | | | | |
| | 9,800 | | Foundation Medicine, Inc.* | | | | | | | | | | $ | 349,174 | |
| | 14,835 | | STAAR Surgical Co.* | | | | | | | | | | | 210,063 | |
| | 62,200 | | TearLab Corp.* | | | | | | | | | | | 500,710 | |
| | | | | | | | | | | | | | | 1,946,376 | |
| | | | | | | | | | | | | | | | |
| | | | Retail & Restaurants | | | 7.7 | % | | | | | | | | |
| | 15,800 | | Kate Spade & Co.* | | | | | | | | | | | 540,676 | |
| | 18,200 | | Steven Madden, Ltd.* | | | | | | | | | | | 663,390 | |
| | 21,100 | | Tilly’s Inc.—Class A* | | | | | | | | | | | 252,356 | |
| | | | | | | | | | | | | | | 1,456,422 | |
| | | | | | | | | | | | | | | | |
| | | | Technology-Hardware | | | 7.5 | % | | | | | | | | |
| | 11,000 | | Applied Optoelectronics, Inc.* | | | | | | | | | | | 260,260 | |
| | 8,300 | | Cardtronics, Inc.* | | | | | | | | | | | 336,316 | |
| | 26,303 | | CEVA, Inc.* | | | | | | | | | | | 475,558 | |
| | 16,900 | | InvenSense, Inc.* | | | | | | | | | | | 340,535 | |
| | | | | | | | | | | | | | | 1,412,669 | |
| | | | | | | | | | | | | | | | |
| | | | Technology-Software & Services | | | 24.3 | % | | | | | | | | |
| | 6,600 | | Bottomline Technologies, Inc.* | | | | | | | | | | | 235,554 | |
| | 52,000 | | E-House (China) Holdings Ltd.—ADR^ | | | | | | | | | | | 651,040 | |
| | 21,800 | | Ellie Mae, Inc.* | | | | | | | | | | | 675,800 | |
| | 38,000 | | Immersion Corp.* | | | | | | | | | | | 454,100 | |
| | 25,000 | | LogMeIn, Inc.* | | | | | | | | | | | 1,046,250 | |
| | 25,000 | | Numerex Corp.* | | | | | | | | | | | 371,000 | |
| | 24,400 | | Rally Software Development Corp.* | | | | | | | | | | | 485,316 | |
| | 12,183 | | Shutterfly, Inc.* | | | | | | | | | | | 664,705 | |
| | | | | | | | | | | | | | | 4,583,765 | |
| | | | TOTAL COMMON STOCKS (Cost $12,577,599) | | | | | | | | | | | 17,554,326 | |
The accompanying notes are an integral part of these financial statements.
JACOB SMALL CAP GROWTH FUND SCHEDULE OF INVESTMENTS (Continued)
February 28, 2014 (Unaudited)
| Shares | | | | | | | | | | Value | |
| | | SHORT TERM INVESTMENT | | | | | | 2.2 | % | | | |
| | | Money Market Fund | | | 2.2 | % | | | | | | | |
| | 405,090 | | Fidelity Government Portfolio-Class I, 0.01%(a) | | | | | | | | | | $ | 405,090 | |
| | | | TOTAL SHORT TERM INVESTMENT (Cost $405,090) | | | | | | | | | | | 405,090 | |
| | | | TOTAL INVESTMENTS (Cost $12,982,689) | | | | | | | 95.2 | % | | | 17,959,416 | |
| | | | OTHER ASSETS IN EXCESS OF LIABILITIES | | | | | | | 4.8 | % | | | 908,494 | |
| | | | TOTAL NET ASSETS | | | | | | | 100.0 | % | | $ | 18,867,910 | |
| | | | | | | | | | | | | | | | |
| ^ | U.S. Dollar-denominated foreign security. |
ADRAmerican Depositary Receipt.
The accompanying notes are an integral part of these financial statements.
JACOB MICRO CAP GROWTH FUND
SCHEDULE OF INVESTMENTS
February 28, 2014 (Unaudited)
| Shares | | | | | | | | | | Value | |
| | | COMMON STOCKS | | | | | | 94.9 | % | | | |
| | | | | | | | | | | | | | |
| | | Arts, Entertainment, and Recreation | | | 3.8 | % | | | | | | | |
| | 58,600 | | DHX Media Ltd.^ | | | | | | | | | | $ | 252,436 | |
| | 10,100 | | Multimedia Games Holding Co., Inc.* | | | | | | | | | | | 333,552 | |
| | | | | | | | | | | | | | | 585,988 | |
| | | | | | | | | | | | | | | | |
| | | | Biotech & Pharmaceuticals | | | 13.6 | % | | | | | | | | |
| | 43,000 | | Array BioPharma Inc.* | | | | | | | | | | | 207,260 | |
| | 11,954 | | Cancer Genetics, Inc.* | | | | | | | | | | | 225,453 | |
| | 23,921 | | Cempra, Inc.* | | | | | | | | | | | 272,460 | |
| | 104,739 | | Curis, Inc.* | | | | | | | | | | | 319,454 | |
| | 44,000 | | Merrimack Pharmaceuticals, Inc.* | | | | | | | | | | | 219,120 | |
| | 166,100 | | NovaBay Pharmaceuticals, Inc.* | | | | | | | | | | | 209,286 | |
| | 25,000 | | Omeros Corp.* | | | | | | | | | | | 334,000 | |
| | 21,900 | | Tetraphase Pharmaceuticals, Inc.* | | | | | | | | | | | 297,840 | |
| | | | | | | | | | | | | | | 2,084,873 | |
| | | | | | | | | | | | | | | | |
| | | | Energy-Exploration & Production | | | 8.2 | % | | | | | | | | |
| | 44,000 | | Penn Virginia Corp.* | | | | | | | | | | | 666,600 | |
| | 65,388 | | Triangle Petroleum Corp.* | | | | | | | | | | | 585,876 | |
| | | | | | | | | | | | | | | 1,252,476 | |
| | | | | | | | | | | | | | | | |
| | | | Financial | | | 2.1 | % | | | | | | | | |
| | 20,000 | | HomeTrust Bancshares, Inc.* | | | | | | | | | | | 313,400 | |
| | | | | | | | | | | | | | | | |
| | | | Food & Beverages | | | 2.6 | % | | | | | | | | |
| | 52,413 | | Reed’s, Inc.* | | | | | | | | | | | 403,580 | |
| | | | | | | | | | | | | | | | |
| | | | Health Care Providers & Services | | | 1.5 | % | | | | | | | | |
| | 9,000 | | Capital Senior Living Corp.* | | | | | | | | | | | 228,780 | |
| | | | | | | | | | | | | | | | |
| | | | Industrial | | | 8.4 | % | | | | | | | | |
| | 5,860 | | Advanced Emissions Solutions, Inc.* | | | | | | | | | | | 15,854 | |
| | 24,478 | | CECO Environmental Corp. | | | | | | | | | | | 395,320 | |
| | 55,000 | | Energy Recovery, Inc.* | | | | | | | | | | | 246,400 | |
| | 14,900 | | Mistras Group, Inc.* | | | | | | | | | | | 328,396 | |
| | | | | | | | | | | | | | | 1,285,970 | |
| | | | | | | | | | | | | | | | |
| | | | Medical Devices | | | 11.3 | % | | | | | | | | |
| | 25,671 | | Derma Sciences, Inc.* | | | | | | | | | | | 377,107 | |
| | 5,600 | | Foundation Medicine, Inc.* | | | | | | | | | | | 199,528 | |
| | 48,000 | | iCAD, Inc.* | | | | | | | | | | | 559,200 | |
| | 12,350 | | STAAR Surgical Co.* | | | | | | | | | | | 174,876 | |
The accompanying notes are an integral part of these financial statements.
JACOB MICRO CAP GROWTH FUND
SCHEDULE OF INVESTMENTS (Continued)
February 28, 2014 (Unaudited)
| Shares | | | | | | | | | | Value | |
| | | COMMON STOCKS—(CONTINUED) | | | | | | 94.9 | % | | | |
| | | | | | | | | | | | | | |
| | | Medical Devices—(Continued) | | | 11.3 | % | | | | | | | |
| | 52,400 | | TearLab Corp.* | | | | | | | | | | $ | 421,820 | |
| | | | | | | | | | | | | | | 1,732,531 | |
| | | | | | | | | | | | | | | | |
| | | | Retail & Restaurants | | | 6.5 | % | | | | | | | | |
| | 60,144 | | Coastal Contacts Inc.*^ | | | | | | | | | | | 677,823 | |
| | 26,400 | | Tilly’s Inc.—Class A* | | | | | | | | | | | 315,744 | |
| | | | | | | | | | | | | | | 993,567 | |
| | | | | | | | | | | | | | | | |
| | | | Technology-Hardware | | | 9.0 | % | | | | | | | | |
| | 9,000 | | Applied Optoelectronics, Inc.* | | | | | | | | | | | 212,940 | |
| | 22,840 | | CEVA, Inc.* | | | | | | | | | | | 412,947 | |
| | 67,800 | | Lantronix, Inc.* | | | | | | | | | | | 172,890 | |
| | 130,000 | | Netlist, Inc.* | | | | | | | | | | | 248,950 | |
| | 54,119 | | Silicon Image, Inc.* | | | | | | | | | | | 327,420 | |
| | | | | | | | | | | | | | | 1,375,147 | |
| | | | | | | | | | | | | | | | |
| | | | Technology-Software & Services | | | 27.9 | % | | | | | | | | |
| | 15,900 | | Ellie Mae, Inc.* | | | | | | | | | | | 492,900 | |
| | 32,160 | | Immersion Corp.* | | | | | | | | | | | 384,312 | |
| | 231,681 | | iPass Inc.* | | | | | | | | | | | 359,106 | |
| | 85,232 | | Jiayuan.com International Ltd.—ADR^ | | | | | | | | | | | 627,308 | |
| | 19,164 | | LogMeIn, Inc.* | | | | | | | | | | | 802,013 | |
| | 66,000 | | Mitek Systems, Inc.* | | | | | | | | | | | 350,460 | |
| | 21,000 | | Numerex Corp.* | | | | | | | | | | | 311,640 | |
| | 13,700 | | Rally Software Development Corp.* | | | | | | | | | | | 272,493 | |
| | 50,000 | | Vringo, Inc.* | | | | | | | | | | | 202,500 | |
| | 96,545 | | ZipRealty, Inc.* | | | | | | | | | | | 457,623 | |
| | | | | | | | | | | | | | | 4,260,355 | |
| | | | TOTAL COMMON STOCKS (Cost $11,304,575) | | | | | | | | | | | 14,516,667 | |
The accompanying notes are an integral part of these financial statements.
JACOB MICRO CAP GROWTH FUND
SCHEDULE OF INVESTMENTS (Continued)
February 28, 2014 (Unaudited)
| Shares | | | | | | | | | | Value | |
| | | SHORT TERM INVESTMENT | | | | | | 4.9 | % | | | |
| | | | | | | | | | | | | | |
| | | Money Market Fund | | | 4.9 | % | | | | | | | |
| | 749,639 | | Fidelity Government Portfolio-Class I, 0.01%(a) | | | | | | | | | | $ | 749,639 | |
| | | | TOTAL SHORT TERM INVESTMENT (Cost $749,639) | | | | | | | | | | | 749,639 | |
| | | | TOTAL INVESTMENTS (Cost $12,054,214) | | | | | | | 99.8 | % | | | 15,266,306 | |
| | | | OTHER ASSETS IN EXCESS OF LIABILITIES | | | | | | | 0.2 | % | | | 23,957 | |
| | | | TOTAL NET ASSETS | | | | | | | 100.0 | % | | $ | 15,290,263 | |
| ^ | U.S. Dollar-denominated foreign security. |
ADRAmerican Depositary Receipt.
The accompanying notes are an integral part of these financial statements.
JACOB WISDOM FUND
SCHEDULE OF INVESTMENTS
February 28, 2014 (Unaudited)
| Shares | | | | | | | | | | Value | |
| | | COMMON STOCKS | | | | | | 98.9 | % | | | |
| | | | | | | | | | | | | | |
| | | Air Freight & Logistics | | | 3.9 | % | | | | | | | |
| | 1,200 | | Union Pacific Corp. | | | | | | | | | | $ | 216,456 | |
| | 2,400 | | United Parcel Service, Inc. (UPS)—Class B | | | | | | | | | | | 229,848 | |
| | | | | | | | | | | | | | | 446,304 | |
| | | | | | | | | | | | | | | | |
| | | | Beverages | | | 6.7 | % | | | | | | | | |
| | 2,400 | | Anheuser-Busch InBev NV—ADR^ | | | | | | | | | | | 251,064 | |
| | 7,500 | | The Coca-Cola Co. | | | | | | | | | | | 286,500 | |
| | 1,800 | | Diageo plc—ADR^ | | | | | | | | | | | 226,278 | |
| | | | | | | | | | | | | | | 763,842 | |
| | | | | | | | | | | | | | | | |
| | | | Cable/Satellite TV | | | 4.8 | % | | | | | | | | |
| | 4,000 | | DIRECTV* | | | | | | | | | | | 310,400 | |
| | 2,700 | | Viacom Inc. | | | | | | | | | | | 236,871 | |
| | | | | | | | | | | | | | | 547,271 | |
| | | | | | | | | | | | | | | | |
| | | | Commercial Banks | | | 2.7 | % | | | | | | | | |
| | 12,000 | | Banco Latinoamericano de Comercio Exterior SA^ | | | | | | | | | | | 305,880 | |
| | | | | | | | | | | | | | | | |
| | | | Commercial Services & Supplies | | | 7.2 | % | | | | | | | | |
| | 600 | | AutoZone, Inc.* | | | | | | | | | | | 323,064 | |
| | 1,200 | | The Sherwin-Williams Co. | | | | | | | | | | | 240,576 | |
| | 4,000 | | Verisk Analytics, Inc.—Class A* | | | | | | | | | | | 254,860 | |
| | | | | | | | | | | | | | | 818,500 | |
| | | | | | | | | | | | | | | | |
| | | | Consumer Finance | | | 9.2 | % | | | | | | | | |
| | 3,600 | | American Express Co. | | | | | | | | | | | 328,608 | |
| | 5,000 | | MasterCard, Inc.—Class A | | | | | | | | | | | 388,600 | |
| | 1,500 | | Visa Inc.—Class A | | | | | | | | | | | 338,910 | |
| | | | | | | | | | | | | | | 1,056,118 | |
| | | | | | | | | | | | | | | | |
| | | | Consumer Non-Cyclical | | | 4.4 | % | | | | | | | | |
| | 5,400 | | Lorillard, Inc. | | | | | | | | | | | 264,924 | |
| | 3,000 | | Philip Morris International Inc. | | | | | | | | | | | 242,730 | |
| | | | | | | | | | | | | | | 507,654 | |
| | | | | | | | | | | | | | | | |
| | | | Diversified Manufacturing | | | 2.5 | % | | | | | | | | |
| | 3,000 | | Dover Corp. | | | | | | | | | | | 282,900 | |
| | | | | | | | | | | | | | | | |
| | | | Food & Staples Retailing | | | 4.1 | % | | | | | | | | |
| | 1,500 | | Costco Wholesale Corp. | | | | | | | | | | | 175,200 | |
| | 4,000 | | Wal-Mart Stores, Inc. | | | | | | | | | | | 298,800 | |
| | | | | | | | | | | | | | | 474,000 | |
The accompanying notes are an integral part of these financial statements.
JACOB WISDOM FUND
SCHEDULE OF INVESTMENTS (Continued)
February 28, 2014 (Unaudited)
| Shares | | | | | | | | | | Value | |
| | | COMMON STOCKS—(CONTINUED) | | | | | | 98.9 | % | | | |
| | | | | | | | | | | | | | |
| | | Food Products | | | 5.7 | % | | | | | | | |
| | 5,000 | | Campbell Soup Co. | | | | | | | | | | $ | 216,550 | |
| | 3,000 | | Mead Johnson Nutrition Co. | | | | | | | | | | | 244,650 | |
| | 4,800 | | Unilever NV—NY Shares—ADR^ | | | | | | | | | | | 189,888 | |
| | | | | | | | | | | | | | | 651,088 | |
| | | | | | | | | | | | | | | | |
| | | | Health Care Equipment & Supplies | | | 5.6 | % | | | | | | | | |
| | 2,700 | | C.R. Bard, Inc. | | | | | | | | | | | 389,232 | |
| | 3,600 | | DaVita HealthCare Partners Inc.* | | | | | | | | | | | 247,428 | |
| | | | | | | | | | | | | | | 636,660 | |
| | | | | | | | | | | | | | | | |
| | | | Hotels, Restaurants & Leisure | | | 4.7 | % | | | | | | | | |
| | 3,000 | | McDonald’s Corp. | | | | | | | | | | | 285,450 | |
| | 1,400 | | Panera Bread Co.* | | | | | | | | | | | 253,848 | |
| | | | | | | | | | | | | | | 539,298 | |
| | | | | | | | | | | | | | | | |
| | | | Insurance | | | 4.6 | % | | | | | | | | |
| | 2 | | Berkshire Hathaway Inc.—Class A* | | | | | | | | | | | 347,416 | |
| | 2,000 | | The Chubb Corp. | | | | | | | | | | | 174,960 | |
| | | | | | | | | | | | | | | 522,376 | |
| | | | | | | | | | | | | | | | |
| | | | Machinery | | | 8.0 | % | | | | | | | | |
| | 2,000 | | Cummins Inc. | | | | | | | | | | | 291,840 | |
| | 4,800 | | The Toro Co. | | | | | | | | | | | 317,904 | |
| | 3,000 | | WABCO Holdings Inc.* | | | | | | | | | | | 307,350 | |
| | | | | | | | | | | | | | | 917,094 | |
| | | | | | | | | | | | | | | | |
| | | | Oil, Gas & Consumable Fuels | | | 5.7 | % | | | | | | | | |
| | 3,000 | | Exxon Mobil Corp. | | | | | | | | | | | 288,810 | |
| | 5,000 | | Southwestern Energy Co.* | | | | | | | | | | | 206,700 | |
| | 9,000 | | WPX Energy Inc.* | | | | | | | | | | | 158,580 | |
| | | | | | | | | | | | | | | 654,090 | |
| | | | | | | | | | | | | | | | |
| | | | Pharmaceuticals | | | 2.1 | % | | | | | | | | |
| | 4,000 | | Eli Lilly & Co. | | | | | | | | | | | 238,440 | |
| | | | | | | | | | | | | | | | |
| | | | Technology-Hardware & Software | | | 9.2 | % | | | | | | | | |
| | 1,300 | | Apple Computer, Inc. | | | | | | | | | | | 684,112 | |
| | 2,000 | | International Business Machines Corp. (IBM) | | | | | | | | | | | 370,340 | |
| | | | | | | | | | | | | | | 1,054,452 | |
The accompanying notes are an integral part of these financial statements.
JACOB WISDOM FUND
SCHEDULE OF INVESTMENTS (Continued)
February 28, 2014 (Unaudited)
| Shares | | | | | | | | | | Value | |
| | | COMMON STOCKS—(CONTINUED) | | | | | | 98.9 | % | | | |
| | | | | | | | | | | | | | |
| | | Textiles, Apparel & Luxury Goods | | | 7.8 | % | | | | | | | |
| | 5,000 | | Coach, Inc. | | | | | | | | | | $ | 244,050 | |
| | 6,000 | | Kohl’s Corp. | | | | | | | | | | | 337,140 | |
| | 4,000 | | Nike, Inc.—Class B | | | | | | | | | | | 313,200 | |
| | | | | | | | | | | | | | | 894,390 | |
| | | | TOTAL COMMON STOCKS (Cost $7,758,965) | | | | | | | | | | | 11,310,357 | |
| | | | | | | | | | | | | | | | |
| | | | SHORT TERM INVESTMENT | | | | | | | 1.3 | % | | | | |
| | | | | | | | | | | | | | | | |
| | | | Money Market Fund | | | 1.3 | % | | | | | | | | |
| | 151,768 | | Fidelity Government Portfolio-Class I, 0.01%(a) | | | | | | | | | | | 151,768 | |
| | | | TOTAL SHORT TERM INVESTMENT (Cost $151,768) | | | | | | | | | | | 151,768 | |
| | | | TOTAL INVESTMENTS (Cost $7,910,733) | | | | | | | 100.2 | % | | | 11,462,125 | |
| | | | LIABILITIES IN EXCESS OF OTHER ASSETS | | | | | | | (0.2 | )% | | | (17,822 | ) |
| | | | TOTAL NET ASSETS | | | | | | | 100.0 | % | | $ | 11,444,303 | |
| ^ | U.S. Dollar-denominated foreign security. |
ADRAmerican Depositary Receipt.
The accompanying notes are an integral part of these financial statements.
(This Page Intentionally Left Blank.)
JACOB FUNDS INC.
STATEMENTS OF ASSETS AND LIABILITIES
February 28, 2014 (Unaudited)
| | | | | | Jacob | |
| | | Jacob | | | Small Cap | |
| | | Internet Fund | | | Growth Fund | |
| Assets: | | | | | | |
| Investments, at value (cost $26,149,282 and $12,982,689, respectively) | | $ | 47,567,608 | | | $ | 17,959,416 | |
| Cash | | | — | | | | 2,000 | |
| Receivable for capital shares sold | | | 49,513 | | | | 14,650 | |
| Receivable for investments sold | | | 344,044 | | | | 945,739 | |
| Dividend receivable | | | 4,566 | | | | 807 | |
| Other assets | | | 14,951 | | | | 20,000 | |
| Total Assets | | | 47,980,682 | | | | 18,942,612 | |
| | | | | | | | | |
| Liabilities: | | | | | | | | |
| Payable for securities purchased | | | 155,064 | | | | — | |
| Payable to adviser | | | 43,292 | | | | 4,856 | |
| Payable for distribution expenses (see Note 8) | | | 91,722 | | | | 665 | |
| Payable for capital shares repurchased | | | 119,340 | | | | 21,123 | |
| Accrued printing and mailing fees | | | 5,428 | | | | 2,738 | |
| Accrued transfer agent fees | | | 22,707 | | | | 10,652 | |
| Accrued expenses and other liabilities | | | 54,190 | | | | 34,668 | |
| Total Liabilities | | | 491,743 | | | | 74,702 | |
| Net Assets | | $ | 47,488,939 | | | $ | 18,867,910 | |
| | | | | | | | | |
| | | | | | | | | |
| Net Assets Consist Of: | | | | | | | | |
| Capital Stock | | $ | 29,443,344 | | | $ | 22,144,731 | |
| Accumulated net investment loss | | | (962,187 | ) | | | (750,630 | ) |
| Accumulated net realized loss on investment transactions | | | (2,410,544 | ) | | | (7,502,918 | ) |
| Net unrealized appreciation on investments | | | 21,418,326 | | | | 4,976,727 | |
| Total Net Assets | | $ | 47,488,939 | | | $ | 18,867,910 | |
| | | | | | | | | |
Institutional Class(2) | | | | | | | | |
| Net Assets | | $ | — | | | $ | 11,162,736 | |
| Shares outstanding (20 billion shares of $0.001 par value authorized) | | | — | | | | 549,429 | |
| Net asset value, redemption price and offering price per share | | $ | — | | | $ | 20.32 | |
| | | | | | | | | |
| Investor Class | | | | | | | | |
| Net Assets | | $ | 47,488,939 | | | $ | 7,705,174 | |
| Shares outstanding (20 billion shares of $0.001 par value authorized) | | | 10,399,563 | | | | 380,745 | |
Net asset value, redemption price and offering price per share(1) | | $ | 4.57 | | | $ | 20.24 | |
_______________
| (1) | Redemption of shares held less than 30 days (Internet Fund and Small Cap Growth Fund, Investor Class only) may be charged a 2% redemption fee. See Note 3. |
| (2) | The Internet Fund currently offers Investor Class shares only. See Note 1. |
The accompanying notes are an integral part of these financial statements.
JACOB FUNDS INC.
STATEMENTS OF ASSETS AND LIABILITIES
February 28, 2014 (Unaudited)
| | | Jacob | | | | |
| | | Micro Cap | | | Jacob | |
| | | Growth Fund | | | Wisdom Fund | |
| Assets: | | | | | | |
| Investments, at value (cost $12,054,214 and $7,910,733, respectively) | | $ | 15,266,306 | | | $ | 11,462,125 | |
| Receivable for capital shares sold | | | 71 | | | | 100 | |
| Receivable for investments sold | | | 177,828 | | | | — | |
| Dividend receivable | | | 543 | | | | 21,871 | |
| Other assets | | | 27,599 | | | | 11,885 | |
| Total Assets | | | 15,472,347 | | | | 11,495,981 | |
| | | | | | | | | |
| Liabilities: | | | | | | | | |
| Payable for securities purchased | | | 91,190 | | | | — | |
| Payable to adviser | | | 12,241 | | | | 426 | |
| Payable for distribution expenses (see Note 8) | | | — | | | | 9,640 | |
| Payable for capital shares repurchased | | | 22,655 | | | | 3,370 | |
| Accrued printing and mailing fees | | | 3,467 | | | | 1,433 | |
| Accrued transfer agent fees | | | 12,998 | | | | 6,455 | |
| Accrued expenses and other liabilities | | | 39,533 | | | | 30,354 | |
| Total Liabilities | | | 182,084 | | | | 51,678 | |
| Net Assets | | $ | 15,290,263 | | | $ | 11,444,303 | |
| | | | | | | | | |
| Net Assets Consist Of: | | | | | | | | |
| Capital Stock | | $ | 12,130,605 | | | $ | 8,348,334 | |
| Undistributed net investment loss | | | (157,191 | ) | | | (7,103 | ) |
| Accumulated net realized gain (loss) on investment transactions | | | 104,757 | | | | (448,320 | ) |
| Net unrealized appreciation on investments | | | 3,212,092 | | | | 3,551,392 | |
| Total Net Assets | | $ | 15,290,263 | | | $ | 11,444,303 | |
| | | | | | | | | |
Institutional Class(2) | | | | | | | | |
| Net Assets | | $ | 11,571,960 | | | $ | — | |
| Shares outstanding (20 billion shares of $0.001 par value authorized) | | | 496,418 | | | | — | |
| Net asset value, redemption price and offering price per share | | $ | 23.31 | | | $ | — | |
| | | | | | | | | |
| Investor Class | | | | | | | | |
| Net Assets | | $ | 3,718,303 | | | $ | 11,444,303 | |
| Shares outstanding (20 billion shares of $0.001 par value authorized) | | | 166,694 | | | | 991,073 | |
Net asset value, redemption price and offering price per share(1) | | $ | 22.31 | | | $ | 11.55 | |
_______________
| (1) | Redemption of shares held less than 30 days (Micro Cap Growth Fund, Investor Class only and Wisdom Fund) may be charged a 2% redemption fee. See Note 3. |
| (2) | The Wisdom Fund currently offers Investor Class shares only. See Note 1. |
The accompanying notes are an integral part of these financial statements.
JACOB FUNDS INC.
STATEMENTS OF OPERATIONS
For the Six Months Ended February 28, 2014 (Unaudited)
| | | | | | Jacob | |
| | | Jacob | | | Small Cap | |
| | | Internet Fund | | | Growth Fund | |
| Investment Income: | | | | | | |
| Dividend income | | $ | 53,509 | | | $ | 2,583 | (1) |
| Interest income | | | 86 | | | | 60 | |
| Securities lending income (See Note 7) | | | 5,197 | | | | — | |
| Total Investment Income | | | 58,792 | | | | 2,643 | |
| | | | | | | | | |
| Expenses: | | | | | | | | |
| Investment advisory fees | | | 268,625 | | | | 79,182 | |
| Distribution expenses—Investor Class (See Note 8) | | | 75,215 | | | | 12,708 | |
| Administration fees | | | 24,085 | | | | 20,557 | |
| Fund accounting fees | | | 13,958 | | | | 16,434 | |
| Transfer agent fees | | | 59,305 | | | | 29,717 | |
| Custody fees | | | 3,545 | | | | 2,895 | |
| Federal and state registration | | | 10,221 | | | | 20,034 | |
| Insurance expense | | | 4,915 | | | | 2,382 | |
| Audit fees | | | 7,296 | | | | 6,920 | |
| Legal fees | | | 23,160 | | | | 7,120 | |
| Reports to shareholders | | | 10,673 | | | | 4,362 | |
| Directors’ fees and expenses | | | 21,096 | | | | 8,369 | |
| Other | | | 121 | | | | 45 | |
| Total Expenses | | | 522,215 | | | | 210,725 | |
| Expense Waiver (See Note 6) | | | — | | | | (28,272 | ) |
| Net expenses | | | 522,215 | | | | 182,453 | |
| Net Investment Loss | | | (463,423 | ) | | | (179,810 | ) |
| | | | | | | | | |
| Realized and Unrealized Gain on Investments: | | | | | | | | |
| Net realized gain on investment transactions | | | 2,907,480 | | | | 1,752,190 | |
| Change in net unrealized appreciation/depreciation on investments | | | 5,469,368 | | | | 921,777 | |
| Net realized and unrealized gain on investments | | | 8,376,848 | | | | 2,673,967 | |
| Net Increase in Net Assets Resulting from Operations | | $ | 7,913,425 | | | $ | 2,494,157 | |
_______________
| (1) | Net of foreign tax withheld of $456 for the Small Cap Growth Fund. |
The accompanying notes are an integral part of these financial statements.
JACOB FUNDS INC.
STATEMENTS OF OPERATIONS
For the Six Months Ended February 28, 2014 (Unaudited)
| | | Jacob | | | | |
| | | Micro Cap | | | Jacob | |
| | | Growth Fund | | | Wisdom Fund | |
| Investment Income: | | | | | | |
| Dividend income | | $ | 4,939 | (1) | | $ | 94,224 | (1) |
| Interest income | | | 34 | | | | 25 | |
| Total Investment Income | | | 4,973 | | | | 94,249 | |
| | | | | | | | | |
| Expenses: | | | | | | | | |
| Investment advisory fees | | | 87,530 | | | | 27,917 | |
| Distribution expenses—Investor Class (See Note 8) | | | 6,230 | | | | 19,542 | |
| Administration fees | | | 20,265 | | | | 21,333 | |
| Fund accounting fees | | | 16,495 | | | | 13,747 | |
| Transfer agent fees | | | 28,897 | | | | 15,981 | |
| Custody fees | | | 2,914 | | | | 2,479 | |
| Federal and state registration | | | 18,757 | | | | 9,939 | |
| Insurance expense | | | 2,384 | | | | 1,673 | |
| Audit fees | | | 7,146 | | | | 7,296 | |
| Legal fees | | | 7,200 | | | | 6,615 | |
| Reports to shareholders | | | 3,815 | | | | 2,729 | |
| Directors’ fees and expenses | | | 7,040 | | | | 5,397 | |
| Other | | | 66 | | | | 30 | |
| Total Expenses | | | 208,739 | | | | 134,678 | |
| Expense Waiver (See Note 6) | | | (46,575 | ) | | | (25,760 | ) |
| Net expenses | | | 162,164 | | | | 108,918 | |
| Net Investment Loss | | | (157,191 | ) | | | (14,669 | ) |
| | | | | | | | | |
| Realized and Unrealized Gain on Investments: | | | | | | | | |
| Net realized gain on investment transactions | | | 1,843,200 | | | | 374,936 | |
| Change in net unrealized appreciation/depreciation on investments | | | 103,987 | | | | 754,988 | |
| Net realized and unrealized gain on investments | | | 1,947,187 | | | | 1,129,924 | |
| Net Increase in Net Assets Resulting from Operations | | $ | 1,789,996 | | | $ | 1,115,255 | |
_______________
(1)Net of foreign tax withheld of $440 for the Micro Cap Growth Fund and $1,013 for the Wisdom Fund.
The accompanying notes are an integral part of these financial statements.
JACOB FUNDS INC.
JACOB INTERNET FUND
STATEMENTS OF CHANGES IN NET ASSETS
| | | Six Months Ended | | | Year Ended | |
| | | February 28, 2014 | | | August 31, 2013 | |
| | | (Unaudited) | | | | |
| Operations: | | | | | | |
| Net investment loss | | $ | (463,423 | ) | | $ | (766,055 | ) |
| Net realized gain on investment transactions | | | 2,907,480 | | | | 3,707,701 | |
| Change in net unrealized appreciation/depreciation on investments | | | 5,469,368 | | | | 5,339,874 | |
| Net increase in net assets resulting from operations | | | 7,913,425 | | | | 8,281,520 | |
| | | | | | | | | |
| Capital Share Transactions: (Note 3) | | | | | | | | |
| Proceeds from shares sold | | | 2,689,314 | | | | 1,586,863 | |
| Cost of shares redeemed | | | (3,151,276 | ) | | | (9,820,679 | ) |
| Redemption fees | | | 4,625 | | | | 1,711 | |
| Net decrease in net assets resulting from capital share transactions | | | (457,337 | ) | | | (8,232,105 | ) |
| | | | | | | | | |
| Net Increase in Net Assets | | | 7,456,088 | | | | 49,415 | |
| Net Assets: | | | | | | | | |
| Beginning of period | | | 40,032,851 | | | | 39,983,436 | |
| End of period* | | $ | 47,488,939 | | | $ | 40,032,851 | |
| *Includes accumulated net investment loss of: | | $ | (962,187 | ) | | $ | (498,764 | ) |
The accompanying notes are an integral part of these financial statements.
JACOB FUNDS INC.
JACOB SMALL CAP GROWTH FUND
STATEMENTS OF CHANGES IN NET ASSETS
| | | Six Months Ended | | | Year Ended | |
| | | February 28, 2014 | | | August 31, 2013 | |
| | | (Unaudited) | | | | |
| Operations: | | | | | | |
| Net investment loss | | $ | (179,810 | ) | | $ | (286,016 | ) |
| Net realized gain on investment transactions | | | 1,752,190 | | | | 1,658,627 | |
| Change in net unrealized appreciation/depreciation on investments | | | | | | | | |
| and foreign currency translations | | | 921,777 | | | | 3,225,508 | |
| Net increase in net assets resulting from operations | | | 2,494,157 | | | | 4,598,119 | |
| | | | | | | | | |
| Capital Share Transactions: (Note 3) | | | | | | | | |
| Proceeds from shares sold | | | 491,689 | | | | 343,645 | |
Proceeds from reorganization(1) | | | — | | | | 10,729,289 | |
| Cost of shares redeemed | | | (1,485,014 | ) | | | (3,687,836 | ) |
| Redemption fees | | | — | | | | 50 | |
| Net increase (decrease) in net assets resulting from capital share transactions | | | (993,325 | ) | | | 7,385,148 | |
| | | | | | | | | |
| Net Increase in Net Assets | | | 1,500,832 | | | | 11,983,267 | |
| Net Assets: | | | | | | | | |
| Beginning of period | | | 17,367,078 | | | | 5,383,811 | |
| End of period* | | $ | 18,867,910 | | | $ | 17,367,078 | |
| *Includes accumulated net investment loss of: | | $ | (750,630 | ) | | $ | (570,820 | ) |
_______________
(1)Represents the amount acquired as a result of the reorganization of the Jacob Small Cap Growth Fund II Series of Jacob Funds II into the Fund on November 12, 2012.
The accompanying notes are an integral part of these financial statements.
JACOB FUNDS INC.
JACOB MICRO CAP GROWTH FUND
STATEMENTS OF CHANGES IN NET ASSETS
| | | Six Months Ended | | | Period Ended | | | Year Ended | |
| �� | | February 28, 2014 | | | August 31, 2013** | | | November 30, 2012 | |
| | | (Unaudited) | | | | | | | |
| Operations: | | | | | | | | | |
| Net investment loss | | $ | (157,191 | ) | | $ | (245,413 | ) | | $ | (915,324 | ) |
| Net realized gain on investment transactions | | | 1,843,200 | | | | 4,155,641 | | | | 4,877,091 | |
| Change in net unrealized | | | | | | | | | | | | |
| appreciation/depreciation on investments | | | 103,987 | | | | 385,044 | | | | (594,088 | ) |
| Net increase in net assets resulting from operations | | | 1,789,996 | | | | 4,295,272 | | | | 3,367,679 | |
| | | | | | | | | | | | | |
| Distributions to Shareholders: | | | | | | | | | | | | |
| From net realized gain | | | (2,768,226 | ) | | | — | | | | — | |
| | | | | | | | | | | | | |
| Capital Share Transactions: (Note 3) | | | | | | | | | | | | |
| Proceeds from shares sold | | | 213,113 | | | | 181,622 | | | | 10,321,021 | |
| Proceeds from reinvestment of distribution | | | 2,574,766 | | | | — | | | | — | |
| Cost of shares redeemed | | | (892,013 | ) | | | (35,126,662 | ) | | | (28,069,923 | ) |
| Redemption fees | | | — | | | | 8 | | | | — | |
| Net increase (decrease) in net assets resulting from | | | | | | | | | | | | |
| capital share transactions | | | 1,895,866 | | | | (34,945,032 | ) | | | (17,748,902 | ) |
| | | | | | | | | | | | | |
| Net Increase (Decrease) in Net Assets | | | 917,636 | | | | (30,649,760 | ) | | | (14,381,223 | ) |
| Net Assets: | | | | | | | | | | | | |
| Beginning of period | | | 14,372,627 | | | | 45,022,387 | | | | 59,403,610 | |
| End of period* | | $ | 15,290,263 | | | $ | 14,372,627 | | | $ | 45,022,387 | |
| *Includes accumulated net investment loss of: | | $ | (157,191 | ) | | $ | — | | | $ | — | |
| ** | The Micro Cap Growth Fund’s predecessor fund had a fiscal year end of November 30, so the current activity began on December 1, 2012 and the numbers shown above were for the nine month period ended August 31, 2013. The fiscal year end was changed to August 31 to align with the other Jacob Funds. |
The accompanying notes are an integral part of these financial statements.
JACOB FUNDS INC.
JACOB WISDOM FUND
STATEMENTS OF CHANGES IN NET ASSETS
| | | Six Months Ended | | | Year Ended | |
| | | February 28, 2014 | | | August 31, 2013 | |
| | | (Unaudited) | | | | |
| Operations: | | | | | | |
| Net investment income (loss) | | $ | (14,669 | ) | | $ | 198,123 | |
| Net realized gain on investment transactions | | | 374,936 | | | | 440,853 | |
| Change in net unrealized appreciation/depreciation on investments | | | 754,988 | | | | 229,380 | |
| Net increase in net assets resulting from operations | | | 1,115,255 | | | | 868,356 | |
| | | | | | | | | |
| Distributions to Shareholders: | | | | | | | | |
| From net investment income | | | (185,925 | ) | | | (169,237 | ) |
| | | | | | | | | |
| Capital Share Transactions: (Note 3) | | | | | | | | |
| Proceeds from shares sold | | | 27,338 | | | | 153,427 | |
| Proceeds from reinvestment of distribution | | | 155,981 | | | | 138,611 | |
| Cost of shares redeemed | | | (360,533 | ) | | | (941,399 | ) |
| Net decrease in net assets resulting from capital share transactions | | | (177,214 | ) | | | (649,361 | ) |
| | | | | | | | | |
| Net Increase in Net Assets | | | 752,116 | | | | 49,758 | |
| Net Assets: | | | | | | | | |
| Beginning of period | | | 10,692,187 | | | | 10,642,429 | |
| End of period* | | $ | 11,444,303 | | | $ | 10,692,187 | |
| *Includes undistributed net investment income (loss) of: | | $ | (7,103 | ) | | $ | 193,491 | |
| | | | | | | | | |
The accompanying notes are an integral part of these financial statements.
JACOB FUNDS INC.
JACOB INTERNET FUND
The table below sets forth financial data for a share of the Fund outstanding throughout each period presented.
| | | Six Months | | | | | | | | | | | | | | | | |
| | | Ended | | | | | | | | | | | | | | | | |
| | | February 28, | | | Year Ended August 31, | |
| | | 2014 | | | 2013 | | | 2012 | | | 2011 | | | 2010 | | | 2009 | |
| Investor Class | | (Unaudited) | | | | | | | | | | | | | | | | |
| | | | | | | | | | | | | | | | | | | |
| Per Share Data: | | | | | | | | | | | | | | | | | | |
| Net asset value, beginning of period | | $ | 3.81 | | | $ | 3.03 | | | $ | 2.95 | | | $ | 2.28 | | | $ | 1.99 | | | $ | 2.07 | |
| | | | | | | | | | | | | | | | | | | | | | | | | |
| Income (loss) from investment operations: | | | | | | | | | | | | | | | | | | | | | | | | |
Net investment loss(1) | | | (0.04 | ) | | | (0.07 | ) | | | (0.06 | ) | | | (0.08 | ) | | | (0.06 | ) | | | (0.06 | ) |
| Net realized and unrealized gain (loss) | | | | | | | | | | | | | | | | | | | | | | | | |
| on investment transactions | | | 0.80 | | | | 0.85 | | | | 0.14 | | | | 0.75 | | | | 0.35 | | | | (0.02 | ) |
| Total from investment operations | | | 0.76 | | | | 0.78 | | | | 0.08 | | | | 0.67 | | | | 0.29 | | | | (0.08 | ) |
| Net asset value, end of period | | $ | 4.57 | | | $ | 3.81 | | | $ | 3.03 | | | $ | 2.95 | | | $ | 2.28 | | | $ | 1.99 | |
| | | | | | | | | | | | | | | | | | | | | | | | | |
| Total return | | | 19.95 | %(3) | | | 25.74 | % | | | 2.71 | % | | | 29.39 | % | | | 14.57 | % | | | (3.86 | )% |
| | | | | | | | | | | | | | | | | | | | | | | | | |
| Supplemental data and ratios: | | | | | | | | | | | | | | | | | | | | | | | | |
| Net assets, end of period (in thousands) | | $ | 47,489 | | | $ | 40,033 | | | $ | 39,983 | | | $ | 41,266 | | | $ | 35,058 | | | $ | 36,913 | |
| Ratio of gross operating expenses | | | | | | | | | | | | | | | | | | | | | | | | |
| (prior to waiver or recoupments) to average net assets | | | 2.43 | %(4) | | | 2.66 | % | | | 2.87 | % | | | 2.69 | % | | | 3.06 | % | | | 3.71 | % |
| Ratio of net operating expenses | | | | | | | | | | | | | | | | | | | | | | | | |
| (after waiver or recoupments) to average net assets | | | 2.43 | %(2)(4) | | | 2.66 | %(2) | | | 2.87 | %(2) | | | 2.82 | %(2) | | | 2.96 | %(2) | | | 3.64 | %(2) |
| Ratio of net investment loss | | | | | | | | | | | | | | | | | | | | | | | | |
| (prior to waiver or recoupments) to average net assets | | | (2.16 | )%(4) | | | (2.05 | )% | | | (1.99 | )% | | | (2.53 | )% | | | (2.49 | )% | | | (3.54 | )% |
| Ratio of net investment loss | | | | | | | | | | | | | | | | | | | | | | | | |
| (after waiver or recoupments) to average net assets | | | (2.16 | )%(2)(4) | | | (2.05 | )%(2) | | | (1.99 | )%(2) | | | (2.66 | )%(2) | | | (2.39 | )%(2) | | | (3.47 | )%(2) |
| Portfolio turnover rate | | | 27.67 | %(3) | | | 44.10 | % | | | 55.61 | % | | | 52.39 | % | | | 52.09 | % | | | 106.98 | % |
| (1) | Net investment loss per share is calculated using ending balances prior to consideration of adjustments for permanent book and tax differences. |
| (2) | For the period January 1, 2009 through January 2, 2015, the Adviser has contractually agreed to waive its advisory fees in an amount up to an annual rate of 0.10% of the Fund’s average daily net assets, to the extent that the Fund’s expense ratio exceeds 2.95%, excluding any taxes, interest, brokerage fees, acquired fund fees and expenses, and extraordinary expenses. All eligible previously waived expenses under this agreement were recouped by the Adviser during the year ended August 31, 2011. |
The accompanying notes are an integral part of these financial statements.
JACOB FUNDS INC.
JACOB SMALL CAP GROWTH FUND
The table below sets forth financial data for a share of the Fund outstanding throughout each period presented.
| | | | | | November 12, 2012(1) | |
| | | Six Months Ended | | | through | |
| | | February 28, 2014 | | | August 31, 2013 | |
| | | (Unaudited) | | | | |
| Institutional Class | | | | | | |
| | | | | | | |
| Per Share Data: | | | | | | |
| Net asset value, beginning of period | | $ | 17.67 | | | $ | 12.94 | |
| | | | | | | | | |
| Income (loss) from investment operations: | | | | | | | | |
Net investment loss(3) | | | (0.18 | ) | | | (0.22 | ) |
| Net realized and unrealized gain on investment transactions | | | 2.83 | | | | 4.95 | |
| Total from investment operations | | | 2.65 | | | | 4.73 | |
| Net asset value, end of period | | $ | 20.32 | | | $ | 17.67 | |
| | | | | | | | | |
| Total return | | | 15.00 | %(4) | | | 36.55 | %(4) |
| | | | | | | | | |
| Supplemental data and ratios: | | | | | | | | |
| Net assets, end of period (in thousands) | | $ | 11,163 | | | $ | 10,131 | |
| Ratio of gross operating expenses | | | | | | | | |
| (prior to waiver or reimbursements) to average net assets | | | 2.25 | %(5) | | | 2.32 | %(5) |
| Ratio of net operating expenses | | | | | | | | |
(after waiver or reimbursements) to average net assets(2) | | | 1.95 | %(5) | | | 1.95 | %(5) |
| Ratio of net investment loss | | | | | | | | |
| (prior to waiver or reimbursements) to average net assets | | | (2.22 | )%(5) | | | (2.20 | )%(5) |
| Ratio of net investment loss | | | | | | | | |
(after waiver or reimbursements) to average net assets(2) | | | (1.92 | )%(5) | | | (1.83 | )%(5) |
| Portfolio turnover rate | | | 51.29 | %(4) | | | 80.91 | %(4) |
_______________
| (1) | Commencement of operations of the Small Cap Growth Fund Institutional Class. The Class I shares of the Jacob Small Cap Growth Fund II, (formerly, PineBridge US Small Cap Growth Fund) series of Jacob Funds II (formerly, PineBridge Mutual Funds) was reorganized into Institutional Class shares of the Small Cap Growth Fund on November 12, 2012. On July 9, 2012, before the reorganization, the adviser of the Jacob Small Cap Growth Fund II changed from PineBridge Investments, LLC to Jacob Asset Management of New York LLC (the “Adviser”). |
| (2) | The Adviser has contractually agreed, effective November 12, 2012 (date of reorganization) through January 2, 2015, to waive up to 100% of its advisory fee of 0.90% to the extent that the Fund’s operating expense ratio exceeds 1.95%, excluding any taxes, interest, brokerage fees, acquired fund fees and expenses, and extraordinary expenses. |
| (3) | Net investment loss per share represents net investment loss divided by the average shares outstanding throughout the period. |
The accompanying notes are an integral part of these financial statements.
JACOB FUNDS INC.
JACOB SMALL CAP GROWTH FUND
The table below sets forth financial data for a share of the Fund outstanding throughout each period presented.
| | | | | | | | | | | | | | | | | | | | | | |
| | | Months | | | | | | | | | | | | | | | | | | | |
| | | Ended | | | | | | | | | | | | Through | | | Year Ended | |
| | | February 28, | | | Year Ended August 31, | | | August 31, | | | September 30, | |
| | | 2014 | | | 2013(7) | | | 2012 | | | 2011 | | | 2010(1) | | | 2009 | | | 2008 | |
| Investor Class | | (Unaudited) | | | | | | | | | | | | | | | | | | | |
| | | | | | | | | | | | | | | | | | | | | | |
| Per Share Data: | | | | | | | | | | | | | | | | | | | | | |
| Net asset value, beginning of period | | $ | 17.63 | | | $ | 13.87 | | | $ | 15.12 | | | $ | 10.90 | | | $ | 11.16 | | | $ | 13.82 | | | $ | 21.94 | |
| | | | | | | | | | | | | | | | | | | | | | | | | | | | | |
| Income (loss) from investment operations: | | | | | | | | | | | | | | | | | | | | | | | | | | | | |
| Net investment loss | | | (0.20 | )(2) | | | (0.35 | )(2) | | | (0.47 | )(2) | | | (0.55 | )(2) | | | (0.48 | )(2) | | | (0.17 | )(2) | | | (0.29 | )(3) |
| Net realized and unrealized gain (loss) on | | | | | | | | | | | | | | | | | | | | | | | | | | | | |
| investment transactions | | | 2.81 | | | | 4.11 | | | | (0.15 | ) | | | 4.75 | | | | 0.22 | | | | (2.49 | ) | | | (7.83 | ) |
| Total from investment operations | | | 2.61 | | | | 3.76 | | | | (0.62 | ) | | | 4.20 | | | | (0.26 | ) | | | (2.66 | ) | | | (8.12 | ) |
| Less distributions from net | | | | | | | | | | | | | | | | | | | | | | | | | | | | |
| investment income | | | — | | | | — | | | | (0.63 | ) | | | — | | | | — | | | | — | | | | — | |
| Paid in capital from redemption fees | | | — | | | | 0.00 | (11) | | | 0.00 | (11) | | | 0.02 | | | | 0.00 | (11) | | | 0.00 | (11) | | | 0.00 | (11) |
| Net asset value, end of period | | $ | 20.24 | | | $ | 17.63 | | | $ | 13.87 | | | $ | 15.12 | | | $ | 10.90 | | | $ | 11.16 | | | $ | 13.82 | |
| | | | | | | | | | | | | | | | | | | | | | | | | | | | | |
| Total return | | | 14.80 | %(9) | | | 27.11 | % | | | (3.75 | )% | | | 38.72 | % | | | (2.33 | )%(9) | | | (19.25 | )% | | | (37.01 | )% |
| | | | | | | | | | | | | | | | | | | | | | | | | | | | | |
| Supplemental data and ratios: | | | | | | | | | | | | | | | | | | | | | | | | | | | | |
| Net assets, end of period (in thousands) | | $ | 7,705 | | | $ | 7,236 | | | $ | 5,384 | | | $ | 7,013 | | | $ | 4,073 | | | $ | 8,321 | | | $ | 31,907 | |
| Ratio of gross operating expenses | | | | | | | | | | | | | | | | | | | | | | | | | | | | |
| (prior to waiver or reimbursements) | | | | | | | | | | | | | | | | | | | | | | | | | | | | |
| to average net assets | | | 2.60 | %(10) | | | 2.97 | % | | | 4.28 | % | | | 4.45 | % | | | 5.43 | %(4)(10) | | | 2.64 | %(4) | | | 1.86 | %(4) |
| Ratio of net operating expenses | | | | | | | | | | | | | | | | | | | | | | | | | | | | |
| (after waiver or reimbursements) | | | | | | | | | | | | | | | | | | | | | | | | | | | | |
| to average net assets | | | 2.25 | %(8)(10) | | | 2.47 | %(6)(8) | | | 3.38 | %(6) | | | 3.55 | %(6) | | | 4.82 | %(4)(5)(6)(10) | | | 2.64 | %(4)(5) | | | 1.86 | %(4) |
| Ratio of net investment loss | | | | | | | | | | | | | | | | | | | | | | | | | | | | |
| (prior to waiver or reimbursements) | | | | | | | | | | | | | | | | | | | | | | | | | | | | |
| to average net assets | | | (2.57 | )%(10) | | | (2.86 | )% | | | (4.27 | )% | | | (4.44 | )% | | | (5.21 | )%(10) | | | (1.87 | )% | | | (1.56 | )% |
| Ratio of net investment loss | | | | | | | | | | | | | | | | | | | | | | | | | | | | |
| (after waiver or reimbursements) | | | | | | | | | | | | | | | | | | | | | | | | | | | | |
| to average net assets | | | (2.22 | )%(8)(10) | | | (2.36 | )%(6)(8) | | | (3.37 | )%(6) | | | (3.54 | )%(6) | | | (4.60 | )%(5)(6)(10) | | | (1.87 | )%(5) | | | (1.56 | )% |
| Portfolio turnover rate | | | 51.29 | %(9) | | | 80.91 | % | | | 77.65 | % | | | 102.80 | % | | | 228.16 | %(9) | | | 307.06 | % | | | 246.41 | % |
_______________
| (1) | The financial highlights set forth herein include the historical financial highlights of the Rockland Small Cap Growth Fund. The assets of the Rockland Small Cap Growth Fund were acquired by the Fund on February 1, 2010. At the time of the reorganization, the adviser changed from Gould Investment Partners, LLC to Jacob Asset Management of New York LLC. The Fund’s fiscal year was changed to August 31 to align with the other Jacob Funds. |
| (2) | Net investment loss per share represents net investment loss divided by the average shares outstanding throughout the period. |
| (3) | Net investment loss per share is calculated using ending balances prior to consideration of adjustments for permanent book and tax differences. |
| (4) | The expense ratio includes interest expense paid to the custodian on overdrafts to cover shareholder redemptions. The expense ratio for interest expense paid to the custodian for the period ended August 31, 2010 and the years ended September 30, 2009 and 2008 was 0.02%, 0.01% and 0.01%, respectively. |
| (5) | Effective September 1, 2009, Gould Investment Partners, LLC agreed to voluntarily waive 0.25% of its advisory fee indefinitely. The impact on the net operating expense ratio was (0.01)% for the fiscal year ended September 30, 2009 and (0.25)% for the period October 1, 2009 through January 31, 2010. |
The accompanying notes are an integral part of these financial statements.
JACOB FUNDS INC.
JACOB SMALL CAP GROWTH FUND (Continued)
| (6) | The Adviser contractually agreed, through November 11, 2012, to waive its advisory fees in an amount up to an annual rate of 0.90% of the Fund’s average daily net assets, to the extent that the Fund’s operating expense ratio exceeds 2.45%. |
| (7) | On November 12, 2012, Class R shares of the Jacob Small Cap Growth Fund II (formerly, PineBridge US Small Cap Growth Fund) series of Jacob Funds II (formerly, PineBridge Mutual Funds) were reorganized into Investor Class shares of the Small Cap Growth Fund. Activity after November 12, 2012 reflects the Funds’ combined operations. |
| (8) | The Adviser has contractually agreed, effective November 12, 2012 (date of reorganization) through January 2, 2015, to waive its advisory fees in an amount up to an annual rate of 0.90% of the Fund’s average daily net assets, to the extent that the Fund’s operating expense ratio exceeds 2.25% excluding any taxes, interest, brokerage fees, acquired fund fees and expenses, and extraordinary expenses. |
| (11) | Amount is less than $0.01. |
The accompanying notes are an integral part of these financial statements.
JACOB FUNDS INC.
JACOB MICRO CAP GROWTH FUND
The table below sets forth financial data for a share of the Fund outstanding throughout each period presented.
| | | Six Months | | Nine Months | | | | | | | | | | | | | | | |
| | | Ended | | Ended | | | | | | | | | | | | | | | |
| | | February 28, | | August 31, | | Year Ended November 30, | |
| | | 2014 | | | 2013* | | | 2012(1) | | | 2011(1) | | | 2010(1) | | | 2009(1) | | | 2008(1) |
| | | (Unaudited) | | | | | | | | | | | | | | | | | | | | | | | | |
| Institutional Class | | | | | | | | | | | | | | | | | | | | | | | | | | | |
| | | | | | | | | | | | | | | | | | | | | | | | | | | | |
| Per Share Data: | | | | | | | | | | | | | | | | | | | | | | | | | | | |
| Net asset value, beginning of period | | $ | 25.31 | | | $ | 19.11 | | | $ | 18.19 | | | $ | 17.82 | | | $ | 13.18 | | | $ | 10.42 | | | $ | 24.88 | |
| | | | | | | | | | | | | | | | | | | | | | | | | | | | | |
| Income (loss) from | | | | | | | | | | | | | | | | | | | | | | | | | | | | |
| investment operations: | | | | | | | | | | | | | | | | | | | | | | | | | | | | |
Net investment loss(4) | | | (0.25 | ) | | | (0.27 | ) | | | (0.31 | ) | | | (0.30 | ) | | | (0.20 | ) | | | (0.15 | ) | | | (0.10 | ) |
| Net realized and | | | | | | | | | | | | | | | | | | | | | | | | | | | | |
| unrealized gain (loss) | | | | | | | | | | | | | | | | | | | | | | | | | | | | |
| on investment transactions | | | 3.21 | | | | 6.47 | | | | 1.23 | | | | 0.67 | | | | 4.84 | | | | 2.91 | | | | (10.40 | ) |
| Total from investment operations | | | 2.96 | | | | 6.20 | | | | 0.92 | | | | 0.37 | | | | 4.64 | | | | 2.76 | | | | (10.50 | ) |
| Less distributions: | | | | | | | | | | | | | | | | | | | | | | | | | | | | |
| From net realized gain | | | (4.96 | ) | | | — | | | | — | | | | — | | | | — | | | | — | | | | (3.96 | ) |
| Net asset value, end of period | | $ | 23.31 | | | $ | 25.31 | | | $ | 19.11 | | | $ | 18.19 | | | $ | 17.82 | | | $ | 13.18 | | | $ | 10.42 | |
| | | | | | | | | | | | | | | | | | | | | | | | | | | | | |
| Total return | | | 12.69 | %(6) | | | 32.44 | %(6) | | | 5.06 | % | | | 2.08 | % | | | 35.20 | % | | | 26.49 | % | | | (50.02 | )% |
| | | | | | | | | | | | | | | | | | | | | | | | | | | | | |
| Supplemental data and ratios: | | | | | | | | | | | | | | | | | | | | | | | | | | | | |
| Net assets, end of period | | | | | | | | | | | | | | | | | | | | | | | | | | | | |
| (in thousands) | | $ | 11,572 | | | $ | 10,800 | | | $ | 40,666 | | | $ | 50,065 | | | $ | 51,300 | | | $ | 40,122 | | | $ | 41,582 | |
| Ratio of gross operating expenses | | | | | | | | | | | | | | | | | | | | | | | | | | | | |
| (prior to waiver or reimbursements) | | | | | | | | | | | | | | | | | | | | | | | | | | | | |
| to average net assets | | | 2.78 | %(7) | | | 3.01 | %(7) | | | 2.12 | % | | | 1.79 | % | | | 1.89 | % | | | 2.00 | % | | | 1.73 | % |
| Ratio of net operating expenses | | | | | | | | | | | | | | | | | | | | | | | | | | | | |
| (after waiver or reimbursements) | | | | | | | | | | | | | | | | | | | | | | | | | | | | |
| to average net assets | | | 2.15 | %(2)(7) | | | 2.28 | %(2)(7) | | | 1.72 | %(2)(3) | | | 1.60 | %(3) | | | 1.60 | %(3) | | | 1.60 | %(3) | | | 1.60 | %(3) |
| Ratio of net investment loss | | | | | | | | | | | | | | | | | | | | | | | | | | | | |
| (prior to waiver or reimbursements) | | | | | | | | | | | | | | | | | | | | | | | | | | | | |
| to average net assets | | | (2.71 | )%(7) | | | (2.46 | )%(7) | | | (1.95 | )% | | | (1.72 | )%(5) | | | (1.64 | )%(5) | | | (1.76 | )%(5) | | | (0.71 | )%(5) |
| Ratio of net investment loss | | | | | | | | | | | | | | | | | | | | | | | | | | | | |
| (after waiver or reimbursements) | | | | | | | | | | | | | | | | | | | | | | | | | | | | |
| to average net assets | | | (2.08 | )%(2)(7) | | | (1.73 | )%(2)(7) | | | (1.55 | )%(2)(3) | | | (1.53 | )%(3) | | | (1.35 | )%(3) | | | (1.36 | )%(3) | | | (0.58 | )%(3) |
| Portfolio turnover rate | | | 39.93 | %(6) | | | 40.19 | %(6) | | | 115 | % | | | 165 | % | | | 216 | % | | | 209 | % | | | 250 | % |
_______________
| (1) | The financial highlights set forth herein include the historical financial highlights of the Jacob Micro Cap Growth Fund (formerly, PineBridge US Micro Cap Growth Fund) series of Jacob Funds II (formerly, PineBridge Mutual Funds) (the “Predecessor Fund”). The Predecessor Fund was reorganized into the Micro Cap Growth Fund on November 12, 2012. On July 9, 2012, before the reorganization, the adviser changed from PineBridge Investments, LLC to Jacob Asset Management of New York LLC (the “Adviser”). Information prior to November 12, 2012 reflects the performance of the Predecessor Fund’s Class I shares. |
| (2) | The Adviser has contractually agreed, effective November 12, 2012 (date of reorganization) through January 2, 2015, to waive up to 100% of its advisory fee of 1.20% to the extent that the Fund’s operating expense ratio exceeds 2.15%, excluding any taxes, interest, brokerage fees, acquired fund fees and expenses, and extraordinary expenses. |
| (3) | Prior to November 12, 2012, the previous adviser and the Adviser agreed to waive operating expenses over 1.60% of the Fund’s average daily net assets. |
The accompanying notes are an integral part of these financial statements.
JACOB FUNDS INC.
JACOB MICRO CAP GROWTH FUND (Continued)
FINANCIAL HIGHLIGHTS
| (4) | Net investment loss per share represents net investment loss divided by the average shares outstanding throughout the period. |
| * | The Micro Cap Growth Fund’s predecessor fund had a fiscal year end of November 30, so the current activity begins on December 1, 2012 and the numbers shown are for the nine month period. The fiscal year was changed to August 31 to align with the other Jacob Funds. |
The accompanying notes are an integral part of these financial statements.
JACOB FUNDS INC.
JACOB MICRO CAP GROWTH FUND
The table below sets forth financial data for a share of the Fund outstanding throughout each period presented.
| | | Six Months | | Nine Months | | | | | | | | | | | | | | | |
| | | Ended | | Ended | | | | | | | | | | | | | | | |
| | | February 28, | | August 31, | | Year Ended November 30, | |
| | | 2014 | | | 2013* | | | 2012(1) | | | 2011(1) | | | 2010(1) | | | 2009(1) | | | 2008(1) |
| | | (Unaudited) | | | | | | | | | | | | | | | | | | | | | | | | |
| | | | | | | | | | | | | | | | | | | | | | | | | | | | |
| Investor Class | | | | | | | | | | | | | | | | | | | | | | | | | | | |
| | | | | | | | | | | | | | | | | | | | | | | | | | | | |
| Per Share Data: | | | | | | | | | | | | | | | | | | | | | | | | | | | |
| Net asset value, | | | | | | | | | | | | | | | | | | | | | | | | | | | |
| beginning of period | | $ | 24.47 | | | $ | 18.51 | | | $ | 17.68 | | | $ | 17.36 | | | $ | 12.88 | | | $ | 10.21 | | | $ | 24.51 | |
| | | | | | | | | | | | | | | | | | | | | | | | | | | | | |
| Income (loss) from | | | | | | | | | | | | | | | | | | | | | | | | | | | | |
| investment operations: | | | | | | | | | | | | | | | | | | | | | | | | | | | | |
Net investment loss(4) | | | (0.28 | ) | | | (0.37 | ) | | | (0.37 | ) | | | (0.35 | ) | | | (0.25 | ) | | | (0.18 | ) | | | (0.14 | ) |
| Net realized and unrealized gain | | | | | | | | | | | | | | | | | | | | | | | | | | | | |
| (loss) on investment transactions | | | 3.08 | | | | 6.33 | | | | 1.20 | | | | 0.67 | | | | 4.73 | | | | 2.85 | | | | (10.20 | ) |
| Total from investment operations | | | 2.80 | | | | 5.96 | | | | 0.83 | | | | 0.32 | | | | 4.48 | | | | 2.67 | | | | (10.34 | ) |
| Less distributions: | | | | | | | | | | | | | | | | | | | | | | | | | | | | |
| From net realized gain | | | (4.96 | ) | | | — | | | | — | | | | — | | | | — | | | | — | | | | (3.96 | ) |
| Net asset value, end of period | | $ | 22.31 | | | $ | 24.47 | | | $ | 18.51 | | | $ | 17.68 | | | $ | 17.36 | | | $ | 12.88 | | | $ | 10.21 | |
| | | | | | | | | | | | | | | | | | | | | | | | | | | | | |
| Total return | | | 12.61 | %(6) | | | 32.20 | %(6) | | | 4.69 | % | | | 1.84 | % | | | 34.78 | % | | | 26.15 | % | | | (50.14 | )% |
| | | | | | | | | | | | | | | | | | | | | | | | | | | | | |
| Supplemental data and ratios: | | | | | | | | | | | | | | | | | | | | | | | | | | | | |
| Net assets, end of period | | | | | | | | | | | | | | | | | | | | | | | | | | | | |
| (in thousands) | | $ | 3,718 | | | $ | 3,573 | | | $ | 4,356 | | | $ | 9,339 | | | $ | 9,282 | | | $ | 4,198 | | | $ | 4,458 | |
| Ratio of gross operating expenses | | | | | | | | | | | | | | | | | | | | | | | | | | | | |
| (prior to waiver or reimbursements) | | | | | | | | | | | | | | | | | | | | | | | | | | | | |
| to average net assets | | | 3.13 | %(7) | | | 3.65 | %(7) | | | 2.47 | % | | | 2.12 | % | | | 2.24 | % | | | 2.35 | % | | | 2.03 | % |
| Ratio of net operating expenses | | | | | | | | | | | | | | | | | | | | | | | | | | | | |
| (after waiver or reimbursements) | | | | | | | | | | | | | | | | | | | | | | | | | | | | |
| to average net assets | | | 2.45 | %(2)(7) | | | 2.63 | %(2)(7) | | | 2.07 | %(2)(3) | | | 1.88 | %(3) | | | 1.90 | %(3) | | | 1.90 | %(3) | | | 1.85 | %(3) |
| Ratio of net investment loss | | | | | | | | | | | | | | | | | | | | | | | | | | | | |
| (prior to waiver or reimbursements) | | | | | | | | | | | | | | | | | | | | | | | | | | | | |
| to average net assets | | | (3.06 | )%(7) | | | (3.34 | )%(7) | | | (2.30 | )% | | | (2.05 | )%(5) | | | (2.01 | )%(5) | | | (2.11 | )%(5) | | | (1.00 | )%(5) |
| Ratio of net investment loss | | | | | | | | | | | | | | | | | | | | | | | | | | | | |
| (after waiver or reimbursements) | | | | | | | | | | | | | | | | | | | | | | | | | | | | |
| to average net assets | | | (2.38 | )%(2)(7) | | | (2.32 | )%(2)(7) | | | (1.90 | )%(2)(3) | | | (1.81 | )%(3) | | | (1.67 | )%(3) | | | (1.66 | )%(3) | | | (0.82 | )%(3) |
| Portfolio turnover rate | | | 39.93 | %(6) | | | 40.19 | %(6) | | | 115 | % | | | 165 | % | | | 216 | % | | | 209 | % | | | 250 | % |
_______________
| (1) | The financial highlights set forth herein include the historical financial highlights of the Jacob Micro Cap Growth Fund (formerly, PineBridge US Micro Cap Growth Fund) series of Jacob Funds II (formerly, PineBridge Mutual Funds) (the “Predecessor Fund”). The Predecessor Fund was reorganized into the Micro Cap Growth Fund on November 12, 2012. On July 9, 2012, before the reorganization, the adviser changed from PineBridge Investments, LLC to Jacob Asset Management of New York LLC (the “Adviser”). Information prior to November 12, 2012 reflects the performance of the Predecessor Fund’s Class R shares. |
| (2) | The Adviser has contractually agreed, effective November 12, 2012 (date of reorganization) through January 2, 2015, to waive up to 100% of its advisory fee of 1.20% to the extent that the Fund’s operating expense ratio exceeds 2.45%, excluding any taxes, interest, brokerage fees, acquired fund fees and expenses, and extraordinary expenses. |
| (3) | Prior to November 12, 2012, the previous adviser and the Adviser agreed to waive operating expenses over 1.90% of the Fund’s average daily net assets. |
The accompanying notes are an integral part of these financial statements.
JACOB FUNDS INC.
JACOB MICRO CAP GROWTH FUND (Continued)
| (4) | Net investment loss per share represents net investment loss divided by the average shares outstanding throughout the period. |
| * | The Micro Cap Growth Fund’s predecessor fund had a fiscal year end of November 30, so the current activity begins on December 1, 2012 and the numbers shown are for the nine month period. The fiscal year was changed to August 31 to align with the other Jacob Funds. |
The accompanying notes are an integral part of these financial statements.
JACOB FUNDS INC.
JACOB WISDOM FUND
The table below sets forth financial data for a share of the Fund outstanding throughout each period presented.
| | | Six Months | | | | | | | | | | | June 1, 2010 | | | | |
| | | Ended | | | | | | | | | | | | | | Year Ended | |
| | | February 28, | | Year Ended August 31, | | | August 31, | | | May 31, | |
| | | 2014 | | 2013 | | | 2012 | | | 2011 | | | 2010(1) | | | 2010(2) | | | 2009 | |
| | | (Unaudited) | | | | | | | | | | | | | | | | | | |
| Investor Class | | | | | | | | | | | | | | | | | | | | | |
| | | | | | | | | | | | | | | | | | | | | | |
| Per Share Data: | | | | | | | | | | | | | | | | | | | | | |
| Net asset value, beginning of period | | $ | 10.62 | | | $ | 9.96 | | | $ | 8.81 | | | $ | 7.65 | | | $ | 7.65 | | | $ | 6.48 | | | $ | 10.34 | |
| | | | | | | | | | | | | | | | | | | | | | | | | | | | | |
| Income (loss) from investment operations: | | | | | | | | | | | | | | | | | | | | | | | | | | | | |
| Net investment income (loss) | | | (0.01 | ) | | | 0.20 | | | | 0.16 | | | | 0.08 | | | | 0.02 | | | | 0.00 | | | | (0.02 | ) |
| Net realized and unrealized gain (loss) | | | | | | | | | | | | | | | | | | | | | | | | | | | | |
| on investment transactions | | | 1.13 | | | | 0.62 | | | | 1.08 | | | | 1.10 | | | | (0.02 | ) | | | 1.18 | | | | (3.23 | ) |
| Total from investment operations | | | 1.12 | | | | 0.82 | | | | 1.24 | | | | 1.18 | | | | 0.00 | | | | 1.18 | | | | (3.25 | ) |
| Less distributions: | | | | | | | | | | | | | | | | | | | | | | | | | | | | |
| From net investment income | | | (0.19 | ) | | | (0.16 | ) | | | (0.09 | ) | | | — | | | | — | | | | — | | | | — | |
| From net realized gain | | | — | | | | — | | | | — | | | | (0.02 | ) | | | — | | | | (0.01 | ) | | | (0.61 | ) |
| Total distributions | | | (0.19 | ) | | | (0.16 | ) | | | (0.09 | ) | | | (0.02 | ) | | | — | | | | (0.01 | ) | | | (0.61 | ) |
| Net asset value, end of period | | $ | 11.55 | | | $ | 10.62 | | | $ | 9.96 | | | $ | 8.81 | | | $ | 7.65 | | | $ | 7.65 | | | $ | 6.48 | |
| | | | | | | | | | | | | | | | | | | | | | | | | | | | | |
| Total return | | | 10.52 | %(4) | | | 8.40 | % | | | 14.08 | % | | | 15.40 | % | | | 0.00 | %(4) | | | 18.24 | % | | | (31.46 | )% |
| | | | | | | | | | | | | | | | | | | | | | | | | | | | | |
| Supplemental data and ratios: | | | | | | | | | | | | | | | | | | | | | | | | | | | | |
| Net assets, end of period (in thousands) | | $ | 11,444 | | | $ | 10,692 | | | $ | 10,642 | | | $ | 10,415 | | | $ | 11,185 | | | $ | 11,763 | | | $ | 4,315 | |
| Ratio of gross operating expenses (prior to | | | | | | | | | | | | | | | | | | | | | | | | | | | | |
| waiver or reimbursements) to average net assets | | | 2.41 | %(5) | | | 2.45 | % | | | 2.84 | % | | | 2.82 | % | | | 3.22 | %(5) | | | 4.24 | % | | | 3.44 | % |
| Ratio of net operating expenses (after waiver | | | | | | | | | | | | | | | | | | | | | | | | | | | | |
or reimbursements) to average net assets(3) | | | 1.95 | %(5) | | | 1.95 | % | | | 2.34 | % | | | 2.32 | % | | | 2.72 | %(5) | | | 3.14 | % | | | 2.75 | % |
| Ratio of net investment income (loss) (prior to | | | | | | | | | | | | | | | | | | | | | | | | | | | | |
| waiver or reimbursements) to average net assets | | | (0.72 | )%(5) | | | 1.33 | % | | | 1.07 | % | | | 0.54 | % | | | 0.30 | %(5) | | | (0.80 | )% | | | (0.86 | )% |
| Ratio of net investment income (loss) | | | | | | | | | | | | | | | | | | | | | | | | | | | | |
| (after waiver or reimbursements) to | | | | | | | | | | | | | | | | | | | | | | | | | | | | |
average net assets(3) | | | (0.26 | )%(5) | | | 1.83 | % | | | 1.57 | % | | | 1.04 | % | | | 0.80 | %(5) | | | 0.30 | % | | | (0.17 | )% |
| Portfolio turnover rate | | | 11.46 | %(4) | | | 28.10 | % | | | 19.62 | % | | | 13.60 | % | | | 6.50 | %(4) | | | 60.69 | % | | | 37.12 | % |
_______________
| (1) | The Fund’s fiscal year was changed to August 31 to align with the other Jacob Funds. |
| (2) | The financial highlights set forth herein include the historical financial highlights of the Wisdom Fund series of New Providence Investment Trust (the “Predecessor Fund”). The Predecessor Fund was reorganized into the Wisdom Fund on February 18, 2010. On December 1, 2009, before the reorganization, the adviser changed from Atlanta Investment Counsel, LLC to Jacob Asset Management of New York LLC. Information prior to February 18, 2010 reflects the performance of the Predecessor Fund’s Class B shares. |
| (3) | The Adviser has contractually agreed, effective February 18, 2010 through January 2, 2015 to waive up to 100% of its advisory fee of 0.50% of the Fund’s average daily net assets, to the extent that the Fund’s operating expense ratio exceeds 1.95%. Prior to November 30, 2009, the previous adviser agreed to waive operating expenses over 1.75% of the Fund’s average daily net assets, exclusive of interest, taxes, brokerage fees and 12b-1 fees. |
The accompanying notes are an integral part of these financial statements.
JACOB FUNDS INC.
NOTES TO THE FINANCIAL STATEMENTS
February 28, 2014 (Unaudited)
NOTE 1—DESCRIPTION OF ORGANIZATION
Jacob Funds Inc. (the “Corporation”) was organized as a Maryland corporation on July 13, 1999 and is registered under the Investment Company Act of 1940, as amended (the “1940 Act”), as an open-end management investment company issuing its shares in series. The Corporation currently consists of four “diversified” series, the Jacob Internet Fund (the “Internet Fund”), the Jacob Small Cap Growth Fund (the “Small Cap Growth Fund”), the Jacob Micro Cap Growth Fund (the “Micro Cap Growth Fund”) and the Jacob Wisdom Fund (the “Wisdom Fund”), each a “Fund”, collectively the “Funds”, and the authorized capital stock of the Corporation consists of twenty billion shares of stock having a par value of one-tenth of one cent ($0.001) per share. The primary investment objective of the Internet Fund is long-term growth of capital with current income as a secondary objective. The primary investment objective of the Small Cap Growth Fund and Micro Cap Growth Fund is long-term growth of capital. The primary investment objective of the Wisdom Fund is to maximize total investment return consisting of a combination of income and capital appreciation.
The Internet Fund commenced operations on December 14, 1999. The Small Cap Growth Fund commenced operations on February 1, 2010 when it acquired the assets and liabilities of the Rockland Small Cap Growth Fund series of Rockland Funds Trust in a reorganization transaction (the Small Cap Growth Fund is the successor fund to the Rockland Small Cap Growth Fund). The Small Cap Growth Fund acquired the Class I and Class R shares of the Jacob Small Cap Growth Fund II (formerly, PineBridge US Small Cap Growth Fund) series of Jacob Funds II (formerly, the PineBridge Mutual Funds) (the “Predecessor Small Cap Growth Fund”) on November 12, 2012. The Micro Cap Growth Fund commenced operations on November 12, 2012 when it acquired the assets and liabilities of the Jacob Micro Cap Growth Fund (formerly, PineBridge US Micro Cap Growth Fund) series of Jacob Funds II (the “Predecessor Micro Cap Growth Fund”) in a reorganization transaction (the Micro Cap Growth Fund is the successor fund to the Predecessor Micro Cap Growth Fund). The Wisdom Fund commenced operations on February 18, 2010 when it acquired the assets and liabilities of the Wisdom Fund series of New Providence Investment Trust (the “Predecessor Wisdom Fund”) in a reorganization transaction (the Wisdom Fund is the successor fund to the Predecessor Wisdom Fund).
The Internet Fund and Wisdom Fund currently offer Investor Class shares. The Small Cap Growth Fund and Micro Cap Growth Fund currently offer Investor Class and Institutional Class shares. Each share of each class of a Fund represents an equal pro rata interest in such Fund and provides the shareholder the same voting, dividend, and other rights, except that shareholders of each class of a Fund have exclusive voting rights regarding any matter relating solely to that particular class. Investor Class shareholders may be charged a redemption fee of 2% if the shares are redeemed within 30 days of initial investment.
NOTE 2—SIGNIFICANT ACCOUNTING POLICIES
The following is a summary of significant accounting policies consistently followed by the Funds. These policies are in conformity with accounting principles generally accepted in the United States of America (“GAAP”).
(a) Investment Valuation—Investment securities traded on a national securities exchange are valued at their market value determined by their last sales price in the principal market in which these securities are normally traded (except those traded on the NASDAQ National Market and Capital Market exchanges which are valued at the NASDAQ Official Closing Price (“NOCP”)), unless there are no transactions on the valuation date, in which case they are valued at the mean between the closing bid and ask prices. Securities traded over-the-counter are valued at the last reported sales price unless there is no reported sales price, in which case the mean between the closing bid and ask prices is used. Foreign securities, currencies and other assets denominated in foreign currencies are
JACOB FUNDS INC.
NOTES TO THE FINANCIAL STATEMENTS (Continued)
February 28, 2014 (Unaudited)
translated into U.S. dollars at the exchange rate of such currencies. Foreign equity securities are valued at the last sale price at the close of the exchange on which the security is principally traded. Debt securities with maturities of 60 days or less are valued at amortized cost, which approximates market value. Short-term securities with 60 days or less remaining to maturity are, unless conditions indicate otherwise, amortized to maturity based on their cost to a Fund if acquired within 60 days of maturity or, if already held by a Fund on the 60th day, based on the value determined on the 61st day. If amortized cost does not approximate fair value, short-term securities are reported at fair value. Where market quotations are not readily available, are unreliable or when values have been materially affected by events occurring before the close of U.S. markets but after the close of the securities’ primary markets, securities are valued at fair value using procedures approved by the Board of Directors that are designed to determine a security’s fair value.
The Funds adhere to fair valuation accounting standards which provide an authoritative definition of fair value and set out a hierarchy for measuring fair value. These standards require disclosures about the various inputs and valuation techniques used to develop the measurements of fair value and a discussion in changes in valuation techniques and related inputs during the period. These standards define fair value as the price that would be received to sell an asset or paid to transfer a liability in an orderly transaction between market participants at the measurement date. The fair value hierarchy is organized into three levels based upon the assumptions (referred to as “inputs”) used in pricing the asset or liability. These standards state that “observable inputs” reflect the assumptions market participants would use in pricing the asset or liability based on market data obtained from independent sources and “unobservable inputs” reflect an entity’s own assumptions about the assumptions market participants would use in pricing the asset or liability.
Summary of Fair Value Exposure
Various inputs are used in determining the value of the Funds’ investments. These inputs are summarized in the three broad levels listed below:
Level 1— Unadjusted quoted prices in active markets for identical assets or liabilities that the Funds have the ability to access. |
| |
Level 2— Observable inputs other than quoted prices included in Level 1 that are observable for the asset or liability, either directly or indirectly. These inputs may include quoted prices for the identical instrument in an inactive market, prices for similar instruments, interest rates, prepayment speeds, credit risk, yield curves, default rates and similar data. |
| |
Level 3— Unobservable inputs for the asset or liability, to the extent relevant observable inputs are not available, representing the Funds’ own assumptions about the assumptions a market participant would use in valuing the asset or liability, and based on the best information available. |
The inputs or methodology used for valuing securities are not necessarily an indication of the risk associated with investing in those securities.
JACOB FUNDS INC.
NOTES TO THE FINANCIAL STATEMENTS (Continued)
February 28, 2014 (Unaudited)
The following is a summary of the inputs used to value the Internet Fund’s investments as of February 28, 2014:
| | | Level 1 | | | Level 2 | | | Level 3 | | | Total | |
| Common Stock | | | | | | | | | | | | |
| Internet—Commerce | | $ | 9,451,191 | | | $ | — | | | $ | — | | | $ | 9,451,191 | |
| Internet—Infrastructure | | | 22,229,513 | | | | — | | | | — | | | | 22,229,513 | |
| Internet—Media | | | 12,606,573 | | | | 2,408,881 | | | | — | | | | 15,015,454 | |
| Total Common Stock | | | 44,287,277 | | | | 2,408,881 | | | | — | | | | 46,696,158 | |
| Short Term Investment | | | | | | | | | | | | | | | | |
| Money Market Fund | | | 871,450 | | | | — | | | | — | | | | 871,450 | |
| Total Investments in Securities | | $ | 45,158,727 | | | $ | 2,408,881 | | | $ | — | | | $ | 47,567,608 | |
There were no transfers into or out of Level 1, Level 2 and Level 3 during the reporting period, as compared to their classification from the most recent annual report.
Level 3 Reconciliation Disclosure
Following is a reconciliation of Level 3 assets for which significant unobservable inputs were used to determine fair value.
| | | Investments | |
| Description | | in Securities | |
| Balance as of August 31, 2013 | | $ | 145,193 | |
| Change in unrealized appreciation (depreciation) | | | 2,152 | |
| Sales | | | (147,345 | ) |
| Transfers in and/or out of Level 3* | | | — | |
| Balance as of February 28, 2014 | | $ | — | |
_______________
| * | The information used in the above reconciliation represents fiscal year to date activity for any investments identified as using Level 3 inputs at either the beginning or end of the current fiscal period. Transfers in or out of Level 3 represents either the beginning value (for transfers in) or ending value (for transfers out) of any security or instrument where a change in the pricing level occurred from the beginning to the end of the period. |
NOTES TO THE FINANCIAL STATEMENTS (Continued)
February 28, 2014 (Unaudited)
The following is a summary of the inputs used to value the Small Cap Growth Fund’s investments as of February 28, 2014:
| | | Level 1 | | | Level 2 | | | Level 3 | | | Total | |
| Common Stock | | | | | | | | | | | | |
| Arts, Entertainment, and Recreation | | $ | 866,418 | | | $ | — | | | $ | — | | | $ | 866,418 | |
| Biotech & Pharmaceuticals | | | 1,910,224 | | | | — | | | | — | | | | 1,910,224 | |
| Energy—Exploration & Production | | | 2,652,946 | | | | — | | | | — | | | | 2,652,946 | |
| Energy—Infrastructure & Services | | | 401,088 | | | | — | | | | — | | | | 401,088 | |
| Financial | | | 502,224 | | | | — | | | | — | | | | 502,224 | |
| Health Care Providers & Services | | | 271,994 | | | | — | | | | — | | | | 271,994 | |
| Industrial | | | 1,550,200 | | | | — | | | | — | | | | 1,550,200 | |
| Medical Devices | | | 1,946,376 | | | | — | | | | — | | | | 1,946,376 | |
| Retail & Restaurants | | | 1,456,422 | | | | — | | | | — | | | | 1,456,422 | |
| Technology—Hardware | | | 1,412,669 | | | | — | | | | — | | | | 1,412,669 | |
| Technology—Software & Services | | | 4,583,765 | | | | — | | | | — | | | | 4,583,765 | |
| Total Common Stock | | | 17,554,326 | | | | — | | | | — | | | | 17,554,326 | |
| Short Term Investment | | | | | | | | | | | | | | | | |
| Money Market Fund | | | 405,090 | | | | — | | | | — | | | | 405,090 | |
| Total Investments in Securities | | $ | 17,959,416 | | | $ | — | | | $ | — | | | $ | 17,959,416 | |
There were no transfers into or out of Level 1, Level 2 and Level 3 during the reporting period, as compared to their classification from the most recent annual report.
The following is a summary of the inputs used to value the Micro Cap Growth Fund’s investments as of February 28, 2014:
| | | Level 1 | | | Level 2 | | | Level 3 | | | Total | |
| Common Stock | | | | | | | | | | | | |
| Arts, Entertainment, and Recreation | | $ | 585,988 | | | $ | — | | | $ | — | | | $ | 585,988 | |
| Biotech & Pharmaceuticals | | | 2,084,873 | | | | — | | | | — | | | | 2,084,873 | |
| Energy—Exploration & Production | | | 1,252,476 | | | | — | | | | — | | | | 1,252,476 | |
| Financial | | | 313,400 | | | | — | | | | — | | | | 313,400 | |
| Food & Beverages | | | 403,580 | | | | — | | | | — | | | | 403,580 | |
| Health Care Providers & Services | | | 228,780 | | | | — | | | | — | | | | 228,780 | |
| Industrial | | | 1,285,970 | | | | — | | | | — | | | | 1,285,970 | |
| Medical Devices | | | 1,732,531 | | | | — | | | | — | | | | 1,732,531 | |
| Retail & Restaurants | | | 993,567 | | | | — | | | | — | | | | 993,567 | |
| Technology—Hardware | | | 1,375,147 | | | | — | | | | — | | | | 1,375,147 | |
| Technology—Software & Services | | | 4,260,355 | | | | — | | | | — | | | | 4,260,355 | |
| Total Common Stock | | | 14,516,667 | | | | — | | | | — | | | | 14,516,667 | |
| Short Term Investment | | | | | | | | | | | | | | | | |
| Money Market Fund | | | 749,639 | | | | — | | | | — | | | | 749,639 | |
| Total Investments in Securities | | $ | 15,266,306 | | | $ | — | | | $ | — | | | $ | 15,266,306 | |
There were no transfers into or out of Level 1, Level 2 and Level 3 during the reporting period, as compared to their classification from the most recent annual report.
JACOB FUNDS INC.
NOTES TO THE FINANCIAL STATEMENTS (Continued)
February 28, 2014 (Unaudited)
The following is a summary of the inputs used to value the Wisdom Fund’s investments as of February 28, 2014:
| | | Level 1 | | | Level 2 | | | Level 3 | | | Total | |
| Common Stock | | | | | | | | | | | | |
| Air Freight & Logistics | | $ | 446,304 | | | $ | — | | | $ | — | | | $ | 446,304 | |
| Beverages | | | 763,842 | | | | — | | | | — | | | | 763,842 | |
| Cable/Satellite TV | | | 547,271 | | | | — | | | | — | | | | 547,271 | |
| Commercial Banks | | | 305,880 | | | | — | | | | — | | | | 305,880 | |
| Commercial Services & Supplies | | | 818,500 | | | | — | | | | — | | | | 818,500 | |
| Consumer Finance | | | 1,056,118 | | | | — | | | | — | | | | 1,056,118 | |
| Consumer Non—Cyclical | | | 507,654 | | | | — | | | | — | | | | 507,654 | |
| Diversified Manufacturing | | | 282,900 | | | | — | | | | — | | | | 282,900 | |
| Food & Staples Retailing | | | 474,000 | | | | — | | | | — | | | | 474,000 | |
| Food Products | | | 651,088 | | | | — | | | | — | | | | 651,088 | |
| Health Care Equipment & Supplies | | | 636,660 | | | | — | | | | — | | | | 636,660 | |
| Hotels, Restaurants & Leisure | | | 539,298 | | | | — | | | | — | | | | 539,298 | |
| Insurance | | | 522,376 | | | | — | | | | — | | | | 522,376 | |
| Machinery | | | 917,094 | | | | — | | | | — | | | | 917,094 | |
| Oil, Gas & Consumable Fuels | | | 654,090 | | | | — | | | | — | | | | 654,090 | |
| Pharmaceuticals | | | 238,440 | | | | — | | | | — | | | | 238,440 | |
| Technology—Hardware & Software | | | 1,054,452 | | | | — | | | | — | | | | 1,054,452 | |
| Textiles, Apparel & Luxury Goods | | | 894,390 | | | | — | | | | — | | | | 894,390 | |
| Total Common Stock | | | 11,310,357 | | | | — | | | | — | | | | 11,310,357 | |
| Short Term Investment | | | | | | | | | | | | | | | | |
| Money Market Fund | | | 151,768 | | | | — | | | | — | | | | 151,768 | |
| Total Investments in Securities | | $ | 11,462,125 | | | $ | — | | | $ | — | | | $ | 11,462,125 | |
There were no transfers into or out of Level 1, Level 2 and Level 3 during the reporting period, as compared to their classification from the most recent annual report.
In December 2011, the Financial Accounting Standards Board (“FASB”) issued Accounting Standards Update (“ASU”) No. 2011-11 “Disclosures about Offsetting Assets and Liabilities.” ASU No. 2011-11 requires disclosures to make financial statements that are prepared under U.S. GAAP more comparable to those prepared under IFRS. The new disclosure requirements mandate that entities disclose both gross and net information about instruments and transactions eligible for offset in the Statement of Assets and Liabilities as well as instruments and transactions subject to an agreement similar to a master netting arrangement. In addition, ASU No. 2011-11 requires disclosure of collateral received and posted in connection with netting agreements or similar arrangements. New disclosures are required for annual reporting periods beginning on or after January 1, 2013 and interim periods within those annual periods.
In January 2013, the FASB issued ASU No. 2013-01 “Clarifying the Scope of Disclosures about Offsetting Assets and Liabilities.” ASU No. 2013-01 clarifies that ordinary trade receivables and payables are not included in the scope of ASU No. 2011-11. ASU No. 2011-11 applies only to derivatives, repurchase agreements and reverse repurchase agreements, and securities borrowing and lending that are offset in accordance with specific criteria contained in the FASB Accounting Standards Codification.
JACOB FUNDS INC.
NOTES TO THE FINANCIAL STATEMENTS (Continued)
February 28, 2014 (Unaudited)
The Funds have determined that ASU No. 2011-11 and ASU No. 2013-01 have no impact on the Fund’s financial statements since none of the Funds directly invest in derivatives or financial instruments applicable to these standards.
(b) Income Recognition—Interest income is accrued as earned. Dividend income is recorded on the ex-dividend date. All discounts and premiums are amortized using the effective interest method for tax and financial reporting purposes.
(c) Expenses—Expenses that are not attributable to a particular Fund are typically allocated in proportion to each Fund’s respective net assets. Expenses are allocated to a particular share class in proportion to each class’s respective net assets. Expenses are recorded on an accrual basis.
(d) Securities Transactions—Security transactions are accounted for on trade date. Realized gains and losses on securities sold are determined using specific identification.
(e) Foreign Currency Transactions—The books and records are maintained in U.S. dollars. Foreign currency denominated transactions (i.e., market value of investment securities, assets and liabilities, purchases and sales of investment securities, and income and expenses) are translated into U.S. dollars at the current rate of exchange.
The Funds do not isolate that portion of the results of operations resulting from changes in foreign exchange rates on investments from the fluctuations arising from changes in market prices of securities held. Such fluctuations are included with the net realized and unrealized gain or loss from investments.
(f) Distributions to Shareholders—The Funds record distributions to shareholders on the ex-dividend date. Dividends from net investment income, if any, are declared and paid annually. Distributions of net realized capital gains, if any, will be declared and distributed annually. The amounts of distributions from net investment income and net realized capital gains are determined in accordance with federal income tax regulations, which may differ from those amounts determined under GAAP. These book/tax differences are either temporary or permanent in nature. To the extent these differences are permanent, reclassifications are made in the capital accounts in the period that the differences arise. The reclassifications have no effect on net assets or net asset value per share.
(g) Federal Income Taxes—The Funds comply with provisions of Subchapter M of the Internal Revenue Code applicable to regulated investment companies, including the distribution of substantially all of the Funds’ taxable income. Accordingly, no provision for federal income taxes is considered necessary in the financial statements.
The Funds follow accounting standards regarding recognition and measurement of tax positions taken on a tax return. No material uncertain tax positions existed as of February 28, 2014. As a result, the Funds have not recorded any liabilities for uncertain tax positions as of February 28, 2014. The standards require the Funds to analyze all open tax years, as defined by the Statute of Limitations, for all major jurisdictions. Open tax years are those that are open for examinations by taxing authorities. Major jurisdictions for the Funds only relate to federal tax years. As of February 28, 2014, open federal tax years include the tax years ended August 31, 2010 through August 31, 2013 for the Internet Fund, the period ended August 31, 2010, and tax years ended August 31, 2011 through August 31, 2013 for the Small Cap Growth Fund, the tax years ended November 30, 2010 through November 30, 2012, and the period ended August 31, 2013 for the Micro Cap Growth Fund, and the tax year ended May 31, 2010, the period ended August 31, 2010, and the tax years ended August 31, 2011 through August 31, 2013 for the Wisdom Fund.
(h) Use of Estimates—The preparation of financial statements in conformity with GAAP requires management to make estimates and assumptions that affect the reported amount of assets and liabilities and disclosure of contingent assets and liabilities at the date of the financial statements and the reported amounts of revenues and expenses during the reporting period. Actual results could differ from those estimates.
JACOB FUNDS INC.
NOTES TO THE FINANCIAL STATEMENTS (Continued)
February 28, 2014 (Unaudited)
(i) Contingencies and Commitments—The Funds indemnify the Corporation’s Officers and Directors for certain liabilities that might arise from their performance of their duties to the Funds. Additionally, in the normal course of business, the Funds enter into contracts that contain a variety of representations and warranties and which provide general indemnifications. Each Fund’s maximum exposure under these arrangements is unknown, as this would involve future claims that may be made against the Funds that have not yet occurred. However, based on experience, the Corporation expects the risk of loss to be remote.
NOTE 3—CAPITAL SHARE TRANSACTIONS
At February 28, 2014 there were twenty billion shares, $0.001 par value, authorized for the Corporation. Transactions in shares of the Internet Fund were as follows:
| | | Six Months Ended | | | Year Ended | |
| | | February 28, 2014 | | | August 31, 2013 | |
| | | Shares | | | Amount | | | Shares | | | Amount | |
| Sales | | | 648,885 | | | $ | 2,689,314 | | | | 485,385 | | | $ | 1,586,863 | |
| Redemptions | | | (758,978 | ) | | | (3,151,276 | ) | | | (3,149,980 | ) | | | (9,820,679 | ) |
| Redemption fees | | | — | | | | 4,625 | | | | — | | | | 1,711 | |
| Net decrease | | | (110,093 | ) | | $ | (457,337 | ) | | | (2,664,595 | ) | | $ | (8,232,105 | ) |
| | | | | | | | | | | | | | | | | |
| Shares Outstanding: | | | | | | | | | | | | | | | | |
| Beginning of period | | | 10,509,656 | | | | | | | | 13,174,251 | | | | | |
| End of period | | | 10,399,563 | | | | | | | | 10,509,656 | | | | | |
Transactions in shares of the Small Cap Growth Fund were as follows:
Institutional Class
| | | Six Months Ended | | | Period Ended | |
| | | February 28, 2014 | | | August 31, 2013* | |
| | | Shares | | | Amount | | | Shares | | | Amount | |
| Sales | | | 3,905 | | | $ | 66,921 | | | | 3,852 | | | $ | 57,647 | |
| Sales in connection | | | | | | | | | | | | | | | | |
with reorganization(1) | | | — | | | | — | | | | 682,698 | | | | 8,828,597 | |
| Redemptions | | | (27,802 | ) | | | (512,055 | ) | | | (113,224 | ) | | | (1,564,048 | ) |
| Redemption fees | | | — | | | | — | | | | — | | | | — | |
| Net increase (decrease) | | | (23,897 | ) | | $ | (445,134 | ) | | | 573,326 | | | $ | 7,322,196 | |
| | | | | | | | | | | | | | | | | |
| Shares Outstanding: | | | | | | | | | | | | | | | | |
| Beginning of period | | | 573,326 | | | | | | | | — | | | | | |
| End of period | | | 549,429 | | | | | | | | 573,326 | | | | | |
_______________
| * | The Small Cap Growth Fund Institutional Class shares commenced operations on November 12, 2012. |
| | (1) | The shares and amounts represent activity as a result of the Small Cap Growth Fund’s acquisition of the Predecessor Small Cap Growth Fund on November 12, 2012. |
NOTES TO THE FINANCIAL STATEMENTS (Continued)
February 28, 2014 (Unaudited)
Investor Class
| | | Six Months Ended | | | Year Ended | |
| | | February 28, 2014 | | | August 31, 2013 | |
| | | Shares | | | Amount | | | Shares | | | Amount | |
| Sales | | | 23,156 | | | $ | 424,768 | | | | 18,612 | | | $ | 285,998 | |
| Sales in connection | | | | | | | | | | | | | | | | |
with reorganization(1) | | | — | | | | — | | | | 146,977 | | | | 1,900,692 | |
| Redemptions | | | (52,955 | ) | | | (972,959 | ) | | | (143,303 | ) | | | (2,123,788 | ) |
| Redemption fees | | | — | | | | — | | | | — | | | | 50 | |
| Net increase (decrease) | | | (29,799 | ) | | $ | (548,191 | ) | | | 22,286 | | | $ | 62,952 | |
| Shares Outstanding: | | | | | | | | | | | | | | | | |
| Beginning of period | | | 410,544 | | | | | | | | 388,258 | | | | | |
| End of period | | | 380,745 | | | | | | | | 410,544 | | | | | |
| Total increase (decrease) | | | | | | | | | | | | | | | | |
| for the Fund | | | | | | $ | (993,325 | ) | | | | | | $ | 7,385,148 | |
| | (1) | The shares and amounts represent activity as a result of the Small Cap Growth Fund’s acquisition of the Predecessor Small Cap Growth Fund on November 12, 2012. |
Transactions in shares of the Micro Cap Growth Fund were as follows:
Institutional Class
| | | Six Months Ended | | | Nine Months Ended | | | Year Ended | |
| | | February 28, 2014 | | | August 31, 2013* | | | November 30, 2012** | |
| | | Shares | | | Amount | | | Shares | | | Amount | | | Shares | | | Amount | |
| Sales | | | 2,211 | | | $ | 60,428 | | | | 3,876 | | | $ | 82,890 | | | | 482,067 | | | $ | 9,741,286 | |
| Reinvestments | | | 88,514 | | | | 1,932,252 | | | | — | | | | — | | | | — | | | | — | |
| Redemptions | | | (20,938 | ) | | | (498,173 | ) | | | (1,705,004 | ) | | | (33,189,009 | ) | | | (1,106,233 | ) | | | (21,879,008 | ) |
| Net increase (decrease) | | | 69,787 | | | $ | 1,494,507 | | | | (1,701,128 | ) | | $ | (33,106,119 | ) | | | (624,166 | ) | | $ | (12,137,722 | ) |
| Shares Outstanding: | | | | | | | | | | | | | | | | | | | | | | | | |
| Beginning of period | | | 426,631 | | | | | | | | 2,127,759 | | | | | | | | 2,751,925 | | | | | |
| End of period | | | 496,418 | | | | | | | | 426,631 | | | | | | | | 2,127,759 | | | | | |
_______________
| | * | The Predecessor Micro Cap Growth Fund had a fiscal year end of November 30, so the current activity begins on December 1, 2012. The fiscal year was changed to August 31 to align with the other Jacob Funds. |
| | ** | On November 12, 2012, Class I shares of the Predecessor Micro Cap Growth Fund were reorganized into Institutional Class shares of the Fund. |
JACOB FUNDS INC.
NOTES TO THE FINANCIAL STATEMENTS (Continued)
February 28, 2014 (Unaudited)
Investor Class
| | | Six Months Ended | | | Nine Months Ended | | | Year Ended | |
| | | February 28, 2014 | | | August 31, 2013* | | | November 30, 2012** | |
| | | Shares | | | Amount | | | Shares | | | Amount | | | Shares | | | Amount | |
| Sales | | | 6,080 | | | $ | 152,685 | | | | 4,462 | | | $ | 98,732 | | | | 29,469 | | | $ | 579,735 | |
| Reinvestments | | | 30,742 | | | | 642,514 | | | | — | | | | — | | | | — | | | | — | |
| Redemptions | | | (16,134 | ) | | | (393,840 | ) | | | (93,757 | ) | | | (1,937,653 | ) | | | (322,495 | ) | | | (6,190,915 | ) |
| Redemption fees | | | — | | | | — | | | | — | | | | 8 | | | | — | | | | — | |
| Net increase (decrease) | | | 20,688 | | | $ | 401,359 | | | | (89,295 | ) | | $ | (1,838,913 | ) | | | (293,026 | ) | | $ | (5,611,180 | ) |
| Shares Outstanding: | | | | | | | | | | | | | | | | | | | | | | | | |
| Beginning of period | | | 146,006 | | | | | | | | 235,301 | | | | | | | | 528,327 | | | | | |
| End of period | | | 166,694 | | | | | | | | 146,006 | | | | | | | | 235,301 | | | | | |
| Total increase (decrease) | | | | | | | | | | | | | | | | | | | | | | | | |
| for the Fund | | | | | | $ | 1,895,866 | | | | | | | $ | (34,945,032 | ) | | | | | | $ | (17,748,902 | ) |
| | * | The Predecessor Micro Cap Growth Fund had a fiscal year end of November 30, so the current activity begins on December 1, 2012. The fiscal year end was changed to August 31 to align with the other Jacob Funds. |
| | ** | On November 12, 2012, Class R shares of the Predecessor Micro Cap Growth Fund were reorganized into Investor Class shares of the Fund. |
Transactions in shares of the Wisdom Fund were as follows:
| | | Six Months Ended | | | Year Ended | |
| | | February 28, 2014 | | | August 31, 2013 | |
| | | Shares | | | Amount | | | Shares | | | Amount | |
| Sales | | | 2,734 | | | $ | 27,338 | | | | 14,963 | | | $ | 153,427 | |
| Reinvestments | | | 13,354 | | | | 155,981 | | | | 14,364 | | | | 138,611 | |
| Redemptions | | | (31,514 | ) | | | (360,533 | ) | | | (91,367 | ) | | | (941,399 | ) |
| Net decrease | | | (15,426 | ) | | $ | (177,214 | ) | | | (62,040 | ) | | $ | (649,361 | ) |
| | | | | | | | | | | | | | | | | |
| Shares Outstanding: | | | | | | | | | | | | | | | | |
| Beginning of period | | | 1,006,499 | | | | | | | | 1,068,539 | | | | | |
| End of period | | | 991,073 | | | | | | | | 1,006,499 | | | | | |
A 2% redemption fee is assessed on any Investor Class shares of the Funds, except those received from reinvested distributions, that are sold within 30 days following their purchase date.
From time to time, the Funds may have a concentration of shareholders holding a significant percentage of shares outstanding. Investment activities of these shareholders could have a material impact on the Funds. The following table shows the number of shareholders owning greater than 10% of the outstanding shares in each of the Funds at February 28, 2014:
JACOB FUNDS INC.
NOTES TO THE FINANCIAL STATEMENTS (Continued)
February 28, 2014 (Unaudited)
| | Number of shareholders owning greater |
| Fund | than 10% of outstanding Fund shares |
| Small Cap Growth Fund Institutional Class | 1 |
| Micro Cap Growth Fund Institutional Class | 2 |
| Wisdom Fund | 2 |
NOTE 4—INVESTMENT TRANSACTIONS
During the six months ended February 28, 2014, purchases and sales of investment securities (excluding short-term investments) for the Funds were as follows:
| Fund | | Purchases | | | Sales | |
| Internet Fund | | $ | 12,733,654 | | | $ | 11,658,069 | |
| Small Cap Growth Fund | | | 8,513,408 | | | | 9,914,376 | |
| Micro Cap Growth Fund | | | 5,642,830 | | | | 7,058,009 | |
| Wisdom Fund | | | 1,623,031 | | | | 1,232,890 | |
The Funds did not purchase long-term U.S. Government securities as a part of their investment strategies during the six months ended February 28, 2014.
NOTE 5—TAX INFORMATION
At August 31, 2013, the components of accumulated earnings/(losses) on a tax basis for the Funds were as follows:
| | | Internet | | | Small Cap | | | Micro Cap | | | Wisdom | |
| | | Fund | | | Growth Fund | | | Growth Fund | | | Fund | |
| Cost of Investments | | $ | 25,529,504 | | | $ | 13,506,180 | | | $ | 11,157,554 | | | $ | 7,987,639 | |
| Gross unrealized appreciation | | | 16,718,861 | | | | 4,544,603 | | | | 3,401,605 | | | | 2,926,677 | |
| Gross unrealized depreciation | | | (1,237,535 | ) | | | (599,399 | ) | | | (337,786 | ) | | | (130,273 | ) |
| Net unrealized appreciation | | $ | 15,481,326 | | | $ | 3,945,204 | | | $ | 3,063,819 | | | $ | 2,796,404 | |
| Undistributed ordinary income | | | — | | | | — | | | | 2,054,062 | | | | 185,925 | |
| Undistributed long-term capital gains | | | — | | | | — | | | | 714,156 | | | | — | |
| Total distributable earnings | | $ | — | | | $ | — | | | $ | 2,768,218 | | | $ | 185,925 | |
| Other accumulated losses | | $ | (5,349,156 | ) | | $ | (9,716,182 | ) | | $ | (1,694,149 | ) | | $ | (815,690 | ) |
| Total accumulated earnings/(losses) | | $ | 10,132,170 | | | $ | (5,770,978 | ) | | $ | 4,137,888 | | | $ | 2,166,639 | |
At August 31, 2013 the Internet Fund deferred, on a tax basis, post October losses of $665,030 and the Internet Fund and Small Cap Growth Fund deferred, on a tax basis, post December ordinary losses of $498,764 and $487,345, respectively.
The differences between cost amounts for book purposes and tax purposes are primarily due to the tax deferral of losses on wash sales, passive foreign investment companies (“PFICs”) and real estate investment trusts (“REITs”). At August 31, 2013, the Funds had accumulated net realized capital loss carryovers as follows:
NOTES TO THE FINANCIAL STATEMENTS (Continued)
February 28, 2014 (Unaudited)
| | Internet | | | Small Cap | | | Micro Cap | | | Wisdom | | |
| | Fund | | | Growth Fund | | | Growth Fund | | | Fund | | Expiration |
| | $ | — | | | $ | 6,919,217 | | | $ | — | | | $ | — | | 8/31/2016 |
| | | — | | | | 1,515,745 | | | | 1,694,149 | | | | 380,690 | | 8/31/2017 |
| | | 4,185,362 | | | | 793,875 | | | | — | | | | 435,000 | | 8/31/2018 |
| | $ | 4,185,362 | | | $ | 9,228,837 | | | $ | 1,694,149 | | | $ | 815,690 | | |
To the extent the Funds realize future net capital gains, taxable distributions to its shareholders will be offset by any unused capital loss carryover. For the periods ended August 31, 2013, the Internet Fund, Small Cap Growth Fund, Micro Cap Growth Fund and Wisdom Fund utilized capital loss carryforwards of $1,998,454, $1,369,699, $286,613 and $449,194, respectively.
Due to the rule under section 382 of the Internal Revenue Code, the Micro Cap Growth Fund’s capital loss carryforward of $1,694,149 is subject to annual limitations over the next 4 years. The Fund will only be able to utilize $423,537 each year for the next 4 years.
As a result of a significant shareholder redemption during the period, limitations were placed on the allowable capital loss carryover pursuant to Internal Revenue Code Section 382. The amount of capital loss carryover written off in the fiscal period ended August 31, 2013 was $10,905,355.
The Internet Fund made no distributions during the six months ended February 28, 2014 and during the fiscal year ended August 31, 2013. The Small Cap Growth Fund made no distributions during the six months ended February 28, 2014 and during the fiscal year ended August 31, 2013. The Micro Cap Growth Fund paid $714,160 out of long-term capital gains and $2,054,066 out of short-term capital gains during the six months ended February 28, 2014. The Micro Cap Growth Fund made no distributions during the nine months ended August 31, 2013 and fiscal year ended November 30, 2012. The Wisdom Fund paid $185,925 out of ordinary income during the six months ended February 28, 2014 and paid $169,237 out of ordinary income during the fiscal year ended August 31, 2013.
NOTE 6—INVESTMENT ADVISORY AND OTHER AGREEMENTS
The Corporation has entered into Investment Advisory Agreements (the “Advisory Agreements”) with Jacob Asset Management of New York LLC (the “Adviser”), with whom certain Officers and a Director of the Board are affiliated, to furnish investment advisory services to the Funds. Under the terms of the Advisory Agreements, the Corporation, on behalf of the Funds, compensates the Adviser for its management services based on an annual rate of 1.25% of the Internet Fund’s average daily net assets; 0.90% of the Small Cap Growth Fund’s average daily net assets; 1.20% of the Micro Cap Growth Fund’s average daily net assets; and 0.50% of the Wisdom Fund’s average daily net assets up to $500 million and 0.40% of annual average daily net assets over $500 million.
The Adviser has contractually agreed to waive its advisory fees in an amount up to an annual rate of 0.10% of the Internet Fund’s average daily net assets to the extent the Internet Fund’s total annual operating expenses (excluding any taxes, interest, brokerage fees, acquired fund fees and expenses and extraordinary expenses) exceed 2.95% of the average daily net assets through January 2, 2015. The Adviser has the ability to recoup amounts waived for a period of three years following such fee waivers to the extent that such recoupment by the Adviser will not cause the Internet Fund to exceed any applicable expense limitation in place when the fee was waived. For the six months ended February 28, 2014, the Adviser did not waive any fees with respect to the Internet Fund.
JACOB FUNDS INC.
NOTES TO THE FINANCIAL STATEMENTS (Continued)
February 28, 2014 (Unaudited)
The Adviser contractually agreed to waive its advisory fees in an amount up to an annual rate of 0.90% of the Small Cap Growth Fund’s average daily net assets, to the extent that the Fund’s total annual operating expenses (excluding any taxes, interest, brokerage fees, acquired fund fees and expenses and extraordinary expenses) exceed 2.45% of average daily net assets through November 11, 2012. The Adviser has the ability to recoup amounts waived for a period of three years following such fee waivers to the extent that such recoupment by the Adviser will not cause the Small Cap Growth Fund’s expenses to exceed 2.45%. For the period from September 1, 2012 through November 11, 2012, fees of $9,202 were waived by the Adviser with respect to the Small Cap Growth Fund.
Effective November 12, 2012 (date of reorganization of the Predecessor Small Cap Growth Fund into the Small Cap Growth Fund) the Adviser contractually agreed to waive up to 100% of its advisory fee of 0.90% to the extent the Fund’s total annual operating expenses (excluding any taxes, interest, brokerage fees, acquired fund fees and expenses and extraordinary expenses) exceed 2.25% or 1.95% for Investor Class and Institutional Class Shares, respectively, of each class’ average daily net assets through January 2, 2015. The Adviser has the ability to recoup amounts waived for a period of three years following such fee waivers to the extent that such recoupment by the Adviser will not cause the Fund to exceed any applicable expense limitation in place when the fee is waived. For the six months ended February 28, 2014, fees of $28,272 were waived by the Adviser with respect to the Small Cap Growth Fund.
Effective November 12, 2012 (date of reorganization of the Predecessor Micro Cap Growth Fund into the Micro Cap Growth Fund) the Adviser contractually agreed to waive up to 100% of its advisory fee of 1.20% to the extent the Micro Cap Growth Fund’s total annual operating expenses (excluding any taxes, interest, brokerage fees, acquired fund fees and expenses and extraordinary expenses) exceed 2.45% or 2.15% for Investor Class and Institutional Class Shares, respectively, of each class’ average daily net assets through January 2, 2015. The Adviser has the ability to recoup amounts waived for a period of three years following such fee waivers to the extent that such recoupment by the Adviser will not cause the Fund to exceed any applicable expense limitation in place when the fee is waived. For the six months ended February 28, 2014, fees of $46,575 were waived by the Adviser with respect to the Micro Cap Growth Fund.
The Adviser has contractually agreed to waive up to 100% of its advisory fee of 0.50% of the Wisdom Fund’s average daily net assets, to the extent that the Fund’s total annual operating expenses (excluding any taxes, interest brokerage fees, acquired fund fees and expenses and extraordinary expenses) exceed 1.95% of average daily net assets through January 2, 2015. The Adviser has the ability to recoup amounts waived for a period of three years following such fee waivers to the extent that such recoupment by the Adviser will not cause the Wisdom Fund’s expenses to exceed 1.95%. For the six months ended February 28, 2014, fees of $25,760 were waived by the Adviser with respect to the Wisdom Fund.
Following is a schedule of when fees may be recouped:
| | Small Cap | | | Micro Cap | | | Wisdom | | |
| | Growth Fund | | | Growth Fund | | | Fund | | Expiration |
| | $ | 57,146 | | | $ | — | | | $ | 56,022 | | August 31, 2014 |
| | | 53,238 | | | | — | | | | 52,573 | | August 31, 2015 |
| | | — | | | | 19,566 | | | | — | | November 30, 2015 |
| | | 59,468 | | | | 104,217 | | | | 53,874 | | August 31, 2016 |
| | | 28,272 | | | | 46,575 | | | | 25,760 | | August 31, 2017 |
| | $ | 198,124 | | | $ | 170,358 | | | $ | 188,229 | | |
NOTES TO THE FINANCIAL STATEMENTS (Continued)
February 28, 2014 (Unaudited)
U.S. Bancorp Fund Services, LLC serves as transfer agent, administrator and accounting services agent for the Funds. U.S. Bank, N.A. serves as custodian for the Funds. U.S. Bancorp Asset Management, Inc. serves as the securities lending agent. All providers receive customary fees for services rendered.
NOTE 7—SECURITIES LENDING
The Funds may lend portfolio securities equal in value to up to 33% of their total assets (including such loans) to borrowers under terms of participation in a securities lending program administered by U.S. Bancorp Asset Management, Inc. The Agreement requires that loans are collateralized at all times in an amount equal to at least 102% of the market value of any loaned securities at the time of the loan, plus accrued interest.
The Funds receive compensation in the form of fees and earn interest on the cash collateral. The amount of fees depends on a number of factors including the types of security, length of the loan and credit standing of the borrower. The Funds continue to receive interest or dividends on the securities loaned during the borrowing period. The Funds have the right under the terms of the securities lending agreement to recover the securities from the borrower on demand. U.S. Bancorp Asset Management, Inc. received no income from the Internet Fund for its securities lending administrative services during the six months ended February 28, 2014. The Small Cap Growth Fund, Micro Cap Growth Fund and Wisdom Fund did not participate in securities lending during the six months ended February 28, 2014.
For the period September 1, 2013 through November 29, 2013, the Internet Fund had loaned securities that were collateralized by cash proceeds that the borrower paid to the Internet Fund. The cash collateral was invested by the custodian with the approval of the Adviser. Although risk was mitigated by the collateral and by an indemnification by the securities lending agent, the Internet Fund could have experienced a delay in recovering its securities and possible loss of income or value if the borrower failed to return the borrowed securities. The Internet Fund exited the securities lending program on November 29, 2013, realizing a loss of $480,029.
NOTE 8—DISTRIBUTION AND SERVICE PLAN
The Corporation, on behalf of the Internet Fund, has adopted a distribution and service plan (the “Internet Fund Plan”), pursuant to Rule 12b-1 under the 1940 Act. The Internet Fund Plan provides that the Internet Fund will compensate the Adviser 0.25% per annum of the Internet Fund’s average daily net assets for certain expenses and costs incurred in connection with providing shareholder servicing and maintaining shareholder accounts and to compensate parties with which it has written agreements and whose clients own shares of the Internet Fund for providing servicing to their clients (“Shareholder Servicing Fee”). The Internet Fund Plan also provides for a distribution fee equal to 0.10% of the Internet Fund’s average daily net assets on an annual basis (“Asset Based Sales Charge”). The fee is used to compensate Quasar Distributors, LLC, the Funds’ distributor (the “Distributor”), for basic distribution services, out of pocket expenses incurred in connection with activities to sell Internet Fund shares, advertising, compliance reviews, and licensing of the Adviser’s staff. The Distributor may make payments from time to time from the Asset Based Sales Charge to broker-dealers and other financial professionals whose clients are Internet Fund shareholders for providing distribution assistance and promotional support to the Internet Fund. Remaining amounts of the Asset Based Sales Charge may be used to satisfy distribution costs as directed by the Adviser. The Internet Fund incurred $75,215 in expenses pursuant to the 12b-1 Plan for the six months ended February 28, 2014.
The Corporation, on behalf of the Small Cap Growth Fund, Micro Cap Growth Fund and Wisdom Fund, has adopted a distribution and service plan (the “Plan”) pursuant to Rule 12b-1 under the 1940 Act. Rule 12b-1 provides that an
JACOB FUNDS INC.
NOTES TO THE FINANCIAL STATEMENTS (Continued)
February 28, 2014 (Unaudited)
investment company that bears any direct or indirect expense of distributing its shares must do so only in accordance with the Plan permitted by Rule 12b-1. Pursuant to the Plan, the Small Cap Growth Fund, Micro Cap Growth Fund and Wisdom Fund make payments to the Distributor, the Adviser, financial intermediaries or others to reimburse such parties for distribution and/or shareholder servicing activity in an amount not to exceed 0.35% of the average daily net assets on an annual basis. The distribution fees are “asset based” sales charges and, therefore, long-term shareholders may pay more in total sales charges than the economic equivalent of the maximum front-end sales charge permitted by the Financial Industry Regulatory Authority (FINRA). The Small Cap Growth Fund incurred $12,708, the Micro Cap Growth Fund incurred $6,230 and the Wisdom Fund incurred $19,542 in expenses pursuant to the 12b-1 Plan for the six months ended February 28, 2014.
NOTE 9—SUBSEQUENT EVENTS
In preparing these financial statements, the Corporation has evaluated events after February 28, 2014 and determined that there were no significant subsequent events that would require adjustment to or additional disclosure in these financial statements.
ADDITIONAL INFORMATION ON FUND EXPENSES (Unaudited)
For the Six Months Ended February 28, 2014 for the Internet Fund, Small Cap Growth Fund, Micro Cap Growth Fund and Wisdom Fund
As a shareholder of a mutual fund, you may incur two types of costs: (1) transaction costs, including sales charges (loads) on purchase payments, reinvested dividends, or other distributions; redemption fees; and exchange fees; and (2) ongoing costs, including management fees; distribution and/or service (12b-1) fees; and other fund expenses. The Funds do not currently charge sales charges (loads) or exchange fees. The Funds assess a redemption fee of 2% on Investor Class shares sold within 30 days following their purchase date. In addition, you will be assessed fees for outgoing wire transfers, returned checks and stop payment orders. The Funds charge management fees and distribution and/or service (12b-1) fees. The Expense Example is intended to help you understand your ongoing costs (in dollars) of investing in the Funds and to compare these costs with the ongoing costs of investing in other mutual funds. The Example is based on an investment of $1,000 invested at the beginning of the period and held for the entire period (9/1/2013–2/28/2014) for the Internet Fund, Small Cap Growth Fund, Micro Cap Growth Fund and Wisdom Fund.
Actual Expenses
The first line of the table below provides information about account values based on actual returns and actual expenses. Although the Funds charge no sales load, the Funds charge a redemption fee of 2% on shares sold within 30 days following the purchase date. In addition, you will be assessed fees for outgoing wire transfers, returned checks and stop payment orders at prevailing rates charged by U.S. Bancorp Fund Services, LLC, the Funds’ transfer agent. If you request that a redemption be made by wire transfer, currently the Funds’ transfer agent charges a $15.00 fee. The Example does not reflect transactional costs, such as redemption fees. You may use the information in the first line below, together with the amount you invested, to estimate the expenses that you paid over the period. Simply divide your account value by $1,000 (for example, an $8,600 account value divided by $1,000 = 8.6), then multiply the result by the number in the first line under the heading entitled “Expenses Paid During the Period” to estimate the expenses you paid on your account during this period.
Hypothetical Example for Comparison Purposes
The second line of the table below provides information about hypothetical account values based on a hypothetical return and hypothetical expenses based on a Fund’s actual expense ratio and an assumed rate of return of 5% per year before expenses, which is not a Fund’s actual return. The hypothetical account values and expenses may not be used to estimate the actual ending account balance or expenses you paid for the period. You may use this information to compare the ongoing costs of investing in the Funds and other funds. To do so, compare this 5% hypothetical example with the 5% hypothetical examples that appear in the shareholder reports of the other funds. Please note that the expenses shown in the table are meant to highlight your ongoing costs only and do not reflect transactional costs, such as redemption fees. Therefore, the second line of the table is useful in comparing ongoing costs only, and will not help you determine the relative total costs of owning different funds. In addition, if the transactional costs were included, your costs would have been higher.
ADDITIONAL INFORMATION ON FUND EXPENSES (Unaudited) (Continued)
Internet Fund – Investor Class
| | | | Expenses Paid |
| | Beginning Account | Ending Account | During the Period |
| | Value 9/1/13 | Value 2/28/14 | 9/1/13–2/28/14* |
| Actual | $1,000.00 | $1,199.50 | $13.25 |
| Hypothetical (5% annual return before expenses) | $1,000.00 | $1,000.25 | $12.05 |
_______________
| * | Expenses are equal to the Internet Fund’s annualized expense ratio of 2.43% multiplied by the average account value over the period multiplied by 181/365 (to reflect the one-half year period). |
Small Cap Growth Fund – Institutional Class
| | | | Expenses Paid |
| | Beginning Account | Ending Account | During the Period |
| | Value 9/1/13 | Value 2/28/14 | 9/1/13–2/28/14* |
| Actual | $1,000.00 | $1,150.00 | $10.40 |
| Hypothetical (5% annual return before expenses) | $1,000.00 | $1,002.63 | $ 9.68 |
_______________
| * | Expenses are equal to the Institutional Class’s annualized expense ratio of 1.95% multiplied by the average account value over the period multiplied by 181/365 (to reflect the one-half year period). |
Small Cap Growth Fund – Investor Class
| | | | Expenses Paid |
| | Beginning Account | Ending Account | During the Period |
| | Value 9/1/13 | Value 2/28/14 | 9/1/13–2/28/14* |
| Actual | $1,000.00 | $1,148.00 | $11.98 |
| Hypothetical (5% annual return before expenses) | $1,000.00 | $1,001.14 | $11.16 |
_______________
| * | Expenses are equal to the Investor Class’s annualized expense ratio of 2.25% multiplied by the average account value over the period multiplied by 181/365 (to reflect the one-half year period). |
Micro Cap Growth Fund – Institutional Class
| | | | Expenses Paid |
| | Beginning Account | Ending Account | During the Period |
| | Value 9/1/13 | Value 2/28/14 | 9/1/13– 2/28/14* |
| Actual | $1,000.00 | $1,126.90 | $11.34 |
| Hypothetical (5% annual return before expenses) | $1,000.00 | $1,001.63 | $10.67 |
_______________
| * | Expenses are equal to the Institutional Class’s annualized expense ratio of 2.15% multiplied by the average account value over the period multiplied by 181/365 (to reflect the one-half year period). |
JACOB FUNDS INC.
ADDITIONAL INFORMATION ON FUND EXPENSES (Unaudited) (Continued)
Micro Cap Growth Fund – Investor Class
| | | | Expenses Paid |
| | Beginning Account | Ending Account | During the Period |
| | Value 9/1/13 | Value 2/28/14 | 9/1/13– 2/28/14* |
| Actual | $1,000.00 | $1,126.10 | $12.92 |
| Hypothetical (5% annual return before expenses) | $1,000.00 | $1,000.15 | $12.15 |
_______________
| * | Expenses are equal to the Investor Class’s annualized expense ratio of 2.45% multiplied by the average account value over the period multiplied by 181/365 (to reflect the one-half year period). |
Wisdom Fund – Investor Class
| | | | Expenses Paid |
| | Beginning Account | Ending Account | During the Period |
| | Value 9/1/13 | Value 2/28/14 | 9/1/13– 2/28/14* |
| Actual | $1,000.00 | $1,105.20 | $10.18 |
| Hypothetical (5% annual return before expenses) | $1,000.00 | $1,002.63 | $9.68 |
| _______________ | | | |
| * | Expenses are equal to the Wisdom Fund’s annualized expense ratio of 1.95% multiplied by the average account value over the period multiplied by 181/365 (to reflect the one-half year period). |
ADDITIONAL INFORMATION (Unaudited)
APPROVAL OF THE INVESTMENT ADVISORY AGREEMENTS
During the fiscal quarter ended November 30, 2013, the Board of Directors, including all of the independent Directors, considered and approved the renewal of the Investment Advisory Agreements between Jacob Funds Inc., on behalf of the Jacob Internet Fund, Jacob Small Cap Growth Fund and Jacob Wisdom Fund (for purposes of this section only, the “Funds”), and Jacob Asset Management of New York LLC (the “Adviser”) for an additional year. In reaching this decision, the Board took into account a combination of factors, including the nature, extent and quality of the services to be provided by the Adviser; each Fund’s performance; each Fund’s fees and expenses; the costs of the services to be provided and the profits realized by the Adviser; and the extent to which there are economies of sale in the provision of advisory services and whether the Adviser may realize additional economies of scale in the future. The Board noted that at its July 2012 meeting it had reviewed the advisory functions performed by the Adviser for the Jacob Micro Cap Growth Fund and approved an Investment Advisory Agreement on behalf of the Jacob Micro Cap Growth Fund for a period of two years beginning on the date of reorganization (November 12, 2012) and ending November 11, 2014. The Board did not identify any single factor as all-important or controlling, and each Director may have weighed a particular piece of information or factor differently than another Director. This summary does not detail all of the matters considered by the Board.
In evaluating the nature and quality of the services provided by the Adviser, the Board considered the experience and capabilities of the portfolio managers and research team dedicated to the continued management of the Funds. The Board concluded that the services provided by the Adviser were sufficient and beneficial to the Funds, as evidenced by the Funds’ performance records over varying periods, and consistent with the terms of the Investment Advisory Agreements.
The Board also reviewed the Adviser’s financial condition and the economics associated with the advisory fees, as well as the Adviser’s contractual fee waiver commitment for the Funds. The Board concluded that the Adviser had the appropriate resources to continue managing the Funds and was dedicating sufficient resources to the operation and management of the Funds. The Board discussed possible economies of scale that could benefit shareholders, including the Adviser providing contractual breakpoints in the advisory fee schedules for certain Funds. The Board also noted the relatively small size of the Funds and the ongoing subsidies of operating expenses by the Adviser.
The Board reviewed the advisory fees and overall expenses of each Fund and discussed the difference in fees and expenses compared to other funds within each Fund’s peer group. The Board discussed the allocation of expenses among the Funds and the Jacob Micro Cap Growth Fund and the manner in which each Fund bears its appropriate share of the expenses.
In considering the various factors, the Board’s fiduciary duties to the Funds’ shareholders, and the body of law governing the approval of investment advisory agreements; the independent Directors received assistance and advice from independent counsel. Based upon its review of such material and information, together with such other information as it deemed relevant, the Board, including a majority of the independent Directors, concluded that the Adviser had demonstrated the capability and resources to perform the duties required under the Investment Advisory Agreements, the compensation proposed to be payable to the Adviser was fair and reasonable, and approval of the Investment Advisory Agreements were appropriate and in the best interest of the Funds and their shareholders.
JACOB FUNDS INC.
ADDITIONAL INFORMATION (Unaudited)
Proxy Voting
A description of the policies and procedures that the Funds use to determine how to vote proxies relating to portfolio securities is available without charge by calling toll-free 1-888-JACOB-FX (522-6239) or on the SEC website at http://www.sec.gov.
Proxy Voting Record
Information regarding how the Funds voted proxies relating to portfolio securities during the most recent 12-month period ended June 30 is available without charge by calling 1-888-JACOB-FX (522-6239) or on the SEC website at http://www.sec.gov.
Holdings Disclosure
The Funds’ Semi-Annual and Annual Reports include a complete schedule of portfolio holdings for the second and fourth quarters of each fiscal year.
The Funds file their complete schedule of portfolio holdings with the SEC for the first and third quarters of each fiscal year on Form N-Q. The Funds’ Forms N-Q are available on the SEC website at http://www.sec.gov and may be reviewed and copied at the SEC’s Public Reference Room in Washington, D.C. Information on the operation of the Public Reference Room may be obtained by calling 1-800-SEC-0330.
(This Page Intentionally Left Blank.)
February 28, 2014
JACOB INTERNET FUND
JACOB SMALL CAP GROWTH FUND
JACOB MICRO CAP GROWTH FUND
JACOB WISDOM FUND
Jacob Asset Management of New York LLC
1-888-JACOB-FX (522-6239)
www.jacobmutualfunds.com
Investment Adviser
Jacob Asset Management of New York LLC
Administrator and Transfer Agent
and Dividend Agent
U.S. Bancorp Fund Services, LLC
Underwriter and Distributor
Quasar Distributors, LLC
Custodian
U.S. Bank, N.A.
Legal Counsel
Stradley Ronon Stevens & Young, LLP
Independent Registered Public
Accounting Firm
BBD, LLP
This report has been prepared for the information of shareholders of the Jacob Internet Fund, the Jacob Small Cap Growth Fund, the Jacob Micro Cap Growth Fund and the Jacob Wisdom Fund and is not authorized for distribution to prospective investors unless preceded or accompanied by an effective prospectus that includes information regarding the Funds’ objectives, policies, management, records and other information.
Item 2. Code of Ethics.
Not applicable for semi-annual reports.
Item 3. Audit Committee Financial Expert.
Not applicable for semi-annual reports.
Item 4. Principal Accountant Fees and Services.
Not applicable for semi-annual reports.
Item 5. Audit Committee of Listed Registrants.
Not applicable to Registrants who are not listed issuers (as defined in Rule 10A-3 under the Securities Exchange Act of 1934).
Item 6. Investments.
The Schedule of Investments is included as part of the report to shareholders filed under Item 1 of this Form.
Item 7. Disclosure of Proxy Voting Policies and Procedures for Closed-End Management Investment Companies.
Not applicable to open-end investment companies.
Item 8. Portfolio Managers of Closed-End Management Investment Companies.
Not applicable to open-end investment companies.
Item 9. Purchases of Equity Securities by Closed-End Management Investment Company and Affiliated Purchasers.
Not applicable to open-end investment companies.
Item 10. Submission of Matters to a Vote of Security Holders.
Not Applicable.
Item 11. Controls and Procedures.
| (a) | The Registrant’s principal executive officer/President and principal financial officer/Treasurer have reviewed the Registrant's disclosure controls and procedures (as defined in Rule 30a-3(c) under the Investment Company Act of 1940 (the “Act”)) as of a date within 90 days of the filing of this report, as required by Rule 30a-3(b) under the Act and Rules 13a-15(b) or 15d-15(b) under the Securities Exchange Act of 1934. Based on their review, such officers have concluded that the disclosure controls and procedures are effective in ensuring that information required to be disclosed in this report is appropriately recorded, processed, summarized and reported and made known to them by others within the Registrant and by the Registrant’s service provider. |
| (b) | There were no changes in the Registrant's internal control over financial reporting (as defined in Rule 30a-3(d) under the Act) that occurred during the second fiscal quarter of the period covered by this report that has materially affected, or is reasonably likely to materially affect, the Registrant's internal control over financial reporting. |
Item 12. Exhibits.
| (a) | (1) Any code of ethics or amendment thereto, that is the subject of the disclosure required by Item 2, to the extent that the Registrant intends to satisfy Item 2 requirements through filing an exhibit. The Registrant has posted its Code of Ethics on its website at www.jacobmutualfunds.com. |
(2) A separate certification for each principal executive and principal financial officer pursuant to Section 302 of the Sarbanes-Oxley Act of 2002. Filed herewith.
(3) Any written solicitation to purchase securities under Rule 23c-1 under the Act sent or given during the period covered by the report by or on behalf of the registrant to 10 or more persons. Not applicable to open-end investment companies.
| (b) | Certifications pursuant to Section 906 of the Sarbanes-Oxley Act of 2002. Furnished herewith. |
SIGNATURES
Pursuant to the requirements of the Securities Exchange Act of 1934 and the Investment Company Act of 1940, the Registrant has duly caused this report to be signed on its behalf by the undersigned, thereunto duly authorized.
(Registrant) Jacob Funds Inc.
By (Signature and Title) /s/ Ryan Jacob
Ryan Jacob, President
Date 5/7/2014
Pursuant to the requirements of the Securities Exchange Act of 1934 and the Investment Company Act of 1940, this report has been signed below by the following persons on behalf of the Registrant and in the capacities and on the dates indicated.
By (Signature and Title) /s/ Ryan Jacob
Ryan Jacob, President
Date 5/7/2014
By (Signature and Title) /s/ Francis Alexander
Francis Alexander, Treasurer
Date 5/7/2014