UNITED STATES
SECURITIES AND EXCHANGE COMMISSION
Washington, D.C. 20549
FORM N-CSR
CERTIFIED SHAREHOLDER REPORT OF REGISTERED
MANAGEMENT INVESTMENT COMPANIES
Investment Company Act file number 811-09447
Jacob Funds Inc.
(Exact name of Registrant as specified in charter)
C/O Jacob Asset Management of New York LLC
653 Manhattan Beach Blvd. # J
Manhattan Beach, CA 90266
(Address of principal executive offices) (Zip code)
Ryan Jacob
C/O Jacob Asset Management of New York LLC
653 Manhattan Beach Blvd. # J
Manhattan Beach, CA 90266
(Name and address of agent for service)
(424)-237-2164
Registrant's telephone number, including area code
Date of fiscal year end: August 31
Date of reporting period: February 29, 2016
Item 1. Reports to Stockholders.
Jacob Internet Fund
Jacob Small Cap Growth Fund
Jacob Micro Cap Growth Fund
Jacob Wisdom Fund
Semi-Annual Report
February 29, 2016
The Jacob Internet Fund, Jacob Small Cap Growth Fund and
Jacob Micro Cap Growth Fund are mutual funds with the
primary investment objective of long-term growth of capital.
The Jacob Wisdom Fund is a mutual fund with the primary investment
objective to maximize total investment return consisting of a
combination of income and capital appreciation.
The Jacob Internet Fund has current income as a secondary objective.
Investment Adviser
Jacob Asset Management of New York LLC
TABLE OF CONTENTS
| Letter From the Manager | 1 | | Statements of Changes in Net Assets | 22 |
| Industry Breakdowns | 5 | | Financial Highlights | 26 |
| Schedules of Investments | 9 | | Notes to the Financial Statements | 32 |
| Statements of Assets and Liabilities | 18 | | Additional Information on Fund Expenses | 45 |
| Statements of Operations | 20 | | Additional Information | 48 |
Dear Fellow Investors,
Although we ended last calendar year with U.S. economy still inching forward, the beginning of 2016 started off inauspiciously with a severe correction in stock prices. Many of the same investor worries that permeated 2015 were cited as the cause, including weaker manufacturing at home, slowing growth in China, and increasing uncertainty about other emerging markets. The fact the Fed had finally embarked on its plan to slowly raise interest rates – for the first time in almost a decade – was just another brick in the market’s wall of worry. Our belief, however, is that not only have stock prices overplayed these concerns, but we have now gotten to valuation levels where the risk/reward in equites provides maybe the best opportunity we have seen since the 2008 financial panic. We would argue that an overall improvement in business activity – spurred by a more benign U.S. dollar – coupled with lower energy prices, should have a magnified ripple effect across our economy and help us finally break out of the subpar growth we have become accustomed to in recent years. For this reason, we have been more aggressive in increasing position sizes, adding new holdings, and even buying back some previous names that have fallen to very attractive levels. We believe that this latest downturn, like many over the past several years, will prove to be transitory and potentially lead to outsized gains as the year progresses.
Jacob Internet Fund
The Jacob Internet Fund was down -4.13% for the six month period ended February 29, 2016, while the NASDAQ Composite Index returned -3.95%. Most large capitalization technology companies performed admirably in the period, with our larger holdings in Internet leaders helping us stay close to our sector benchmarks. Generally speaking, weakness in small-capitalization names continues to be a drag on the portfolio, but we expect that this two-year plus trend is likely to end soon. The Fund continues to believe that its strategy of owning more small- and mid-capitalization holdings than our peers and the major indexes should be a key component in our ability to outperform over the long-term.
One of the best-performing stocks recently was also one of our largest holdings: Mitek. A provider of document imaging services, its lead product enabling mobile check deposit for leading financial institutions has now become a standard in the industry. Its stock was up over 56% in this fiscal period, a notable increase given recent market conditions. Ellie Mae, a provider of online mortgage software, and a name we have frequently cited in the past, was also a positive contributor, up over 16% for the six months ended February 29, 2016. Many other Internet leaders, including Facebook, Alphabet (the parent company of Google) and Amazon produced positive returns for the Fund. Luckily, most of our worst performers during the period were relatively small positions, but the fact that many of them were down more than 30% still negatively affected our results. Two in particular, Linked In and Twitter, struggled in their latest quarterly results, but we believe that both are now trading at levels that unfairly discount their dominant positions on the Internet today.
We added a number of new positions over the period ended February 29, 2016. These included Hortonworks, an open-source software and service provider for big data applications and Bazaarvoice, which provides third-party review services for e-commerce companies. Also, we took advantage of the market’s most recent decline to re-initiate a position in Zillow, the online real estate portal whose stock we owned years ago.
Jacob Small Cap Growth Fund
The Jacob Small Cap Growth Fund faced some unusually difficult headwinds. For the six month period ended February 29, 2016 the Fund’s Investor Class was down -29.46% while the Russell 2000 Growth Index was down -13.47%. The Fund’s heavy technology and healthcare exposure, typically a positive contributor to outperformance during more bullish markets, was just too much to overcome in that steep of a downturn.
Some of the poorest performers were in healthcare, and included names like Tearlab, Esperion Therapeutics, Array Biopharma and Cempra, all down in excess of 50% in the period ended February 29, 2016. While some company-specific issues contributed to each of these declines, the underperformance was mainly a result of the difficult market environment and investors’ lack of appetite for riskier, unprofitable names.
Despite one of the worst markets for small-capitalization companies in our recent memory, a handful of our positions posted strong gains. Leading the way were long-time favorites Ellie Mae, Shutterfly and Sina, all of which have been in the Fund for many years and performed well in a tough environment.
Aside from the three names that were also added to the Internet Fund, the Small Cap Fund added three additional new positions. Intercept Pharmaceuticals, a name we have been researching for well over a year, is developing a drug to treat various liver diseases that has shown remarkable success in reversing liver fibrosis in early trials. Its drop this year finally gave us what we believe to be a good entry point for a position. The other names we added in the period were Codexis, which has successfully developed protein enzymes that help drug and food companies reduce manufacturing costs; and First Northwest Bancorp, a small regional bank serving the upper- northwest corner of Washington state and trading at a substantial discount to its peers.
Jacob Micro Cap Growth Fund
The Jacob Micro Cap Growth Fund endured a particularly tough market environment given its focus on micro-capitalization companies and the Investor Class posted a return of -22.23% for the six month period ended February 29, 2016, while the Russell Microcap Growth Index was down -18.56%. Some of the worst performers mirrored some of the above-mentioned companies, but the fund also had a larger number of its names down more than 50% in the period. Again, like the Small Cap Fund, our overweighted positions in technology and healthcare bore the brunt of this most recent downturn.
The Micro Cap Fund did have some standouts, including Energy Recovery and Netlist, which were both up more than 150% in the period. A leader in energy-efficient pumps and pressure exchangers for the water desalination industry, Energy Recovery received a large contract from oilfield equipment behemoth Schlumberger, which could result in a doubling or tripling of revenues over the next several years as the company targets an entirely new end market. Netlist, a company whose innovations in high-performance storage and memory technologies are being increasingly adopted (and arguably co-opted) by other players in the computer industry, signed a major deal with Samsung that validates its intellectual property and gives them the resources to continue fighting its battles in the markets and the courts.
Two other holdings, Mitek and USA Technology, continue to execute well and have now risen to become two of our top holdings based on performance.
Besides some of the names mentioned earlier (Bazaarvoice, HortonWorks, First Northwest Bancorp), a few other names were added exclusively to Micro Cap. Imprimis Pharmaceuticals, a fast-growing compound pharmacy, has created an exciting new drug applied during cataract surgery that often alleviates the need for post-op eye-drop therapy. The other new name, Sajan, provides translation services and software products for large corporations, helping solve an increasingly big challenge for these companies as they start selling into more and more international markets.
Jacob Wisdom Fund
Both the Wisdom Fund and the S&P 500 Index also posted negative returns over the six month period ended February, 29, 2016 with the Fund down -3.98% and the S&P down -0.92%.
Perhaps unsurprisingly, given the continued steep drop in oil prices, all of our energy and energy-related names hurt our results the most over the period. Names like Southwestern Energy, CF Industries, Methanex and Union Pacific all underperformed, with most down more than 20% and some down as much as 50%. Due to heightened risks with these smaller names, we subsequently exited these positions, and now only hold larger, integrated energy companies in the portfolio. Finally, two of our largest positions in the portfolio, Apple and Gilead, also dragged down the portfolio as they were down over 10% in the period.
We did have a few bright spots in the period. Campbell Soup and McDonalds were two of our larger weightings, and both were up more than 20%. McDonalds benefitted greatly from its well-publicized all-day breakfast which had a significant ripple effect across the fast food industry. Meanwhile, Campbell Soup also posted solid operating results over the last few quarters and its stock was also boosted by continued takeover speculation and industry consolidation.
There were two new additions in the period and both contributed positively in the period. Ross Stores had some outstanding results recently, which is especially impressive given the lackluster retailing environment, and it was up over 15% from our purchase price. Our other new name, Michael Kors, finally turned around its operations and is now actually showing accelerating same-store sales, which has caused the stock to rise from its overly distressed valuation. While we bought our position after the first signs of progress, we still made close to 10% in just a few short months.
Besides the smaller energy-related names, we sold several other positions from the portfolio in the period. Long-time holdings Wal-Mart and Costco were replaced with some of our more recently added discount retailing names. American Express has been having some operational difficulties that made us more uncomfortable with the name. Meanwhile, we sold Eli Lilly – a name that we have done very well with – mostly on valuation concerns. Finally the insurance company Chubb was acquired for a significant premium and we chose not to hold on to the newly combined entity.
Although we have now dealt with trying market conditions for an extended period of time, we believe staying true to our investment philosophies is still key to obtaining the best possible investment performance for our shareholders. Thank you again for your continued confidence and trust.
Ryan Jacob
Chairman and Chief Investment Officer
Portfolio Manager
Frank Alexander
Portfolio Manager
Darren Chervitz
Portfolio Manager
Past performance is not a guarantee of future results.
Performance data reflects fee waivers and in the absence of these waivers performance would be reduced.
Must be accompanied or preceded by a prospectus.
The opinions expressed above are those of the portfolio manager and are subject to change at any time. Forecasts cannot be guaranteed and should not be considered investment advice.
Mutual fund investing involves risk; loss of principal is possible. The Funds invest in foreign securities which involve greater volatility and political, economic and currency risks and differences in accounting methods. These risks are greater in emerging markets. Growth stocks typically are more volatile than value stocks; however, value stocks have a lower expected growth rate in earnings and sales. There are more specific risks inherent in investing in the Internet area, particularly with respect to smaller capitalized companies and the high volatility of Internet stocks. The Funds can invest in small-and mid-cap securities which involve additional risks such as limited liquidity and greater volatility. Investments in micro capitalization companies may involve greater risks, as these companies tend to have limited product lines, markets and financial or managerial resources. Micro cap stocks often also have a more limited trading market, such that the Adviser may not be able to sell stocks at an optimal time or price. In addition, less frequently-traded securities may be subject to more abrupt price movements than securities of larger capitalized companies. Investments in debt securities typically decrease in value when interest rates rise. This risk is usually greater for longer term debt securities. Investments in real estate related instruments may be affected by economic, legal, cultural, environmental or technological factors that affect property values, rents or occupancies of real estate related to the Fund’s holdings. The performance of REITs depends on how well the REIT manages the properties it owns.
Fund holdings are subject to change and should not be construed as a recommendation to buy or sell any security.
Current and future portfolio holdings are subject to risk.
Please refer to the schedule of investments for complete Fund holdings information.
The S&P 500 Index is a broad based unmanaged index of 500 stocks, which is widely recognized as representative of the equity market in general. The NASDAQ Composite Index is a market capitalization weighted index that is designed to represent performance of the National Market System which includes over 5,000 stocks traded only over-the-counter and not on an exchange. The Russell 2000 Growth Index measures the performance of the small cap growth segment of the U.S. equity universe. It includes those Russell 2000 companies with higher price-to-book ratios and higher forecasted growth values. The Russell Microcap Growth Index measures the performance of the microcap growth segment of the U.S. equity market. It includes those Russell Microcap Index companies with higher price-to-book ratios and higher forecasted growth values. It is not possible to invest directly in an index.
The Funds are distributed by Quasar Distributors, LLC.
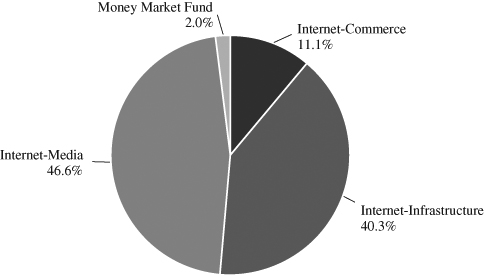
JACOB INTERNET FUND
INDUSTRY BREAKDOWN AS OF FEBRUARY 29, 2016
(as a percentage of total investments)
(Unaudited)
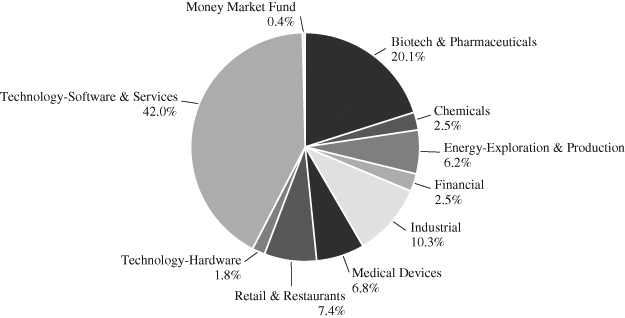
JACOB SMALL CAP GROWTH FUND
INDUSTRY BREAKDOWN AS OF FEBRUARY 29, 2016
(as a percentage of total investments)
(Unaudited)
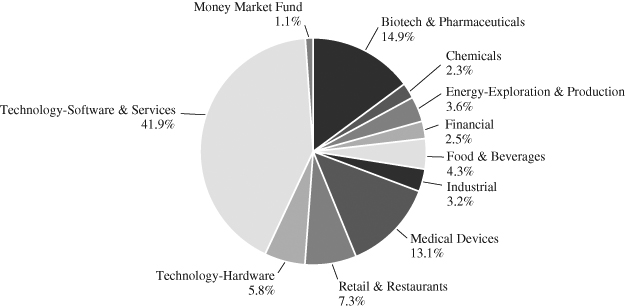
JACOB MICRO CAP GROWTH FUND
INDUSTRY BREAKDOWN AS OF FEBRUARY 29, 2016
(as a percentage of total investments)
(Unaudited)
JACOB WISDOM FUND
INDUSTRY BREAKDOWN AS OF FEBRUARY 29, 2016
(as a percentage of total investments)
(Unaudited)
JACOB INTERNET FUND
SCHEDULE OF INVESTMENTS
February 29, 2016 (Unaudited)
| Shares | | | | | | | | | | Value | |
| | | COMMON STOCKS | | | | | | 98.5 | % | | | |
| | | Internet-Commerce | | | 11.1 | % | | | | | | | |
| | 2,600 | | Amazon.com, Inc.* | | | | | | | | | | $ | 1,436,552 | |
| | 25,426 | | Shutterfly, Inc.* | | | | | | | | | | | 1,129,932 | |
| | 58,500 | | Zillow Group, Inc.* | | | | | | | | | | | 1,263,600 | |
| | | | | | | | | | | | | | | 3,830,084 | |
| | | | Internet-Infrastructure | | | 40.6 | % | | | | | | | | |
| | 16,200 | | Apple Computer, Inc. | | | | | | | | | | | 1,566,378 | |
| | 182,000 | | Bazaarvoice Inc.* | | | | | | | | | | | 571,480 | |
| | 135,000 | | Castlight Health, Inc.—Class B* | | | | | | | | | | | 448,200 | |
| | 31,500 | | CEVA, Inc.* | | | | | | | | | | | 617,715 | |
| | 25,000 | | Cvent, Inc.* | | | | | | | | | | | 488,250 | |
| | 421,000 | | Digital Turbine Inc.* | | | | | | | | | | | 475,730 | |
| | 12,600 | | Ellie Mae, Inc.* | | | | | | | | | | | 1,060,038 | |
| | 55,000 | | Hortonworks Inc.* | | | | | | | | | | | 635,250 | |
| | 138,446 | | Immersion Corp.* | | | | | | | | | | | 1,247,398 | |
| | 32,281 | | LogMeIn, Inc.* | | | | | | | | | | | 1,643,103 | |
| | 386,009 | | Mitek Systems, Inc.* | | | | | | | | | | | 1,995,667 | |
| | 189,163 | | Numerex Corp.* | | | | | | | | | | | 1,110,387 | |
| | 15,000 | | Red Hat, Inc.* | | | | | | | | | | | 980,250 | |
| | 16,200 | | Salesforce.com, Inc.* | | | | | | | | | | | 1,097,550 | |
| | | | | | | | | | | | | | | 13,937,396 | |
| | | | Internet-Media | | | 46.8 | % | | | | | | | | |
| | 2,660 | | Alphabet, Inc.* | | | | | | | | | | | 1,856,068 | |
| | 17,000 | | Facebook, Inc.* | | | | | | | | | | | 1,817,640 | |
| | 13,700 | | LinkedIn Corp.* | | | | | | | | | | | 1,605,503 | |
| | 126,600 | | Pandora Media, Inc.* | | | | | | | | | | | 1,293,852 | |
| | 26,460 | | SINA Corp.*^ | | | | | | | | | | | 1,130,371 | |
| | 85,000 | | Tencent Holdings Ltd. (HK)(a) | | | | | | | | | | | 1,555,290 | |
| | 21,600 | | TripAdvisor, Inc.* | | | | | | | | | | | 1,352,160 | |
| | 98,000 | | Twitter, Inc.* | | | | | | | | | | | 1,775,760 | |
| | 57,274 | | Yahoo! Inc.* | | | | | | | | | | | 1,820,740 | |
| | 92,650 | | Yelp Inc.* | | | | | | | | | | | 1,875,236 | |
| | | | | | | | | | | | | | | 16,082,620 | |
| | | | TOTAL COMMON STOCKS (Cost $27,681,981) | | | | | | | | | | | 33,850,100 | |
The accompanying notes are an integral part of these financial statements.
JACOB INTERNET FUND
SCHEDULE OF INVESTMENTS (Continued)
February 29, 2016 (Unaudited)
| Shares | | | | | | | | | | Value | |
| | | SHORT TERM INVESTMENT | | | | | | 2.0 | % | | | |
| | | Money Market Fund | | | 2.0 | % | | | | | | | |
| | 694,011 | | Fidelity Government Portfolio-Class I, 0.21%(b) | | | | | | | | | | $ | 694,011 | |
| | | | TOTAL SHORT TERM INVESTMENT (Cost $694,011) | | | | | | | | | | | 694,011 | |
| | | | TOTAL INVESTMENTS (Cost $28,375,992) | | | | | | | 100.5 | % | | | 34,544,111 | |
| | | | LIABILITIES IN EXCESS OF OTHER ASSETS | | | | | | | (0.5 | )% | | | (168,045 | ) |
| | | | TOTAL NET ASSETS | | | | | | | 100.0 | % | | $ | 34,376,066 | |
| * | Non Income Producing. |
| ^ | U.S. Dollar-denominated foreign security. |
(a) | Level 2 Security. See Note 2. |
(b) | 7-day yield. |
| HK | Security denominated in Hong Kong dollars. Value translated into U.S. dollars. |
The accompanying notes are an integral part of these financial statements.
JACOB SMALL CAP GROWTH FUND
SCHEDULE OF INVESTMENTS
February 29, 2016 (Unaudited)
| Shares | | | | | | | | | | Value | |
| | | COMMON STOCKS | | | | | | 98.9 | % | | | |
| | | Biotech & Pharmaceuticals | | | 19.9 | % | | | | | | | |
| | 81,000 | | Array BioPharma Inc.* | | | | | | | | | | $ | 203,310 | |
| | 15,700 | | Celldex Therapeutics, Inc.* | | | | | | | | | | | 106,760 | |
| | 14,851 | | Cempra, Inc.* | | | | | | | | | | | 249,942 | |
| | 72,000 | | Codexis, Inc.* | | | | | | | | | | | 292,320 | |
| | 18,000 | | Esperion Therapeutics, Inc.* | | | | | | | | | | | 268,020 | |
| | 3,600 | | Intercept Pharmaceuticals, Inc.* | | | | | | | | | | | 400,968 | |
| | 22,800 | | Omeros Corp.* | | | | | | | | | | | 231,192 | |
| | 3,000 | | Pacira Pharmaceuticals, Inc.* | | | | | | | | | | | 156,030 | |
| | 15,200 | | Theravance Biopharma, Inc.*^ | | | | | | | | | | | 238,944 | |
| | | | | | | | | | | | | | | 2,147,486 | |
| | | | Chemicals | | | 2.4 | % | | | | | | | | |
| | 74,806 | | BioAmber Inc.* | | | | | | | | | | | 261,821 | |
| | | | | | | | | | | | | | | | |
| | | | Energy-Exploration & Production | | | 6.2 | % | | | | | | | | |
| | 11,800 | | Carrizo Oil & Gas, Inc.* | | | | | | | | | | | 253,700 | |
| | 45,324 | | Energy Recovery Inc.* | | | | | | | | | | | 329,052 | |
| | 259,250 | | Triangle Petroleum Corp.* | | | | | | | | | | | 82,960 | |
| | | | | | | | | | | | | | | 665,712 | |
| | | | Financial | | | 2.5 | % | | | | | | | | |
| | 21,594 | | First Northwest Bancorp* | | | | | | | | | | | 271,653 | |
| | | | | | | | | | | | | | | | |
| | | | Industrial | | | 10.2 | % | | | | | | | | |
| | 55,230 | | CECO Environmental Corp. | | | | | | | | | | | 342,978 | |
| | 25,000 | | MasTec, Inc.* | | | | | | | | | | | 424,500 | |
| | 13,400 | | XPO Logistics, Inc.* | | | | | | | | | | | 331,784 | |
| | | | | | | | | | | | | | | 1,099,262 | |
| | | | Medical Devices | | | 6.8 | % | | | | | | | | |
| | 26,000 | | Intersect ENT, Inc.* | | | | | | | | | | | 470,080 | |
| | 310,600 | | TearLab Corp.* | | | | | | | | | | | 260,904 | |
| | | | | | | | | | | | | | | 730,984 | |
| | | | Retail & Restaurants | | | 7.4 | % | | | | | | | | |
| | 98,590 | | Pacific Sunwear of California, Inc.* | | | | | | | | | | | 19,028 | |
| | 54,200 | | Rave Restaurant Group, Inc.* | | | | | | | | | | | 281,840 | |
| | 69,000 | | Tilly’s Inc.—Class A* | | | | | | | | | | | 496,110 | |
| | | | | | | | | | | | | | | 796,978 | |
The accompanying notes are an integral part of these financial statements.
JACOB SMALL CAP GROWTH FUND
SCHEDULE OF INVESTMENTS (Continued)
February 29, 2016 (Unaudited)
| Shares | | | | | | | | | | Value | |
| | | COMMON STOCKS—(Continued) | | | | | | 98.9 | % | | | |
| | | Technology-Hardware | | | 1.8 | % | | | | | | | |
| | 10,000 | | CEVA, Inc.* | | | | | | | | | | $ | 196,100 | |
| | | | | | | | | | | | | | | | |
| | | | Technology-Software & Services | | | 41.7 | % | | | | | | | | |
| | 60,000 | | Bazaarvoice Inc.* | | | | | | | | | | | 188,400 | |
| | 51,500 | | Castlight Health, Inc.—Class B* | | | | | | | | | | | 170,980 | |
| | 8,000 | | Cvent, Inc.* | | | | | | | | | | | 156,240 | |
| | 4,000 | | Ellie Mae, Inc.* | | | | | | | | | | | 336,520 | |
| | 18,000 | | Hortonworks Inc.* | | | | | | | | | | | 207,900 | |
| | 44,329 | | Immersion Corp.* | | | | | | | | | | | 399,404 | |
| | 10,075 | | LogMeIn, Inc.* | | | | | | | | | | | 512,818 | |
| | 62,161 | | Numerex Corp.* | | | | | | | | | | | 364,885 | |
| | 40,700 | | Pandora Media, Inc.* | | | | | | | | | | | 415,954 | |
| | 8,033 | | Shutterfly, Inc.* | | | | | | | | | | | 356,987 | |
| | 8,460 | | SINA Corp.*^ | | | | | | | | | | | 361,411 | |
| | 29,850 | | Yelp Inc.* | | | | | | | | | | | 604,164 | |
| | 19,500 | | Zillow Group, Inc.* | | | | | | | | | | | 421,200 | |
| | | | | | | | | | | | | | | 4,496,863 | |
| | | | TOTAL COMMON STOCKS (Cost $14,470,151) | | | | | | | | | | | 10,666,859 | |
| | | | | | | | | | | | | | | | |
| | | | SHORT TERM INVESTMENT | | | | | | | 0.4 | % | | | | |
| | | | Money Market Fund | | | 0.4 | % | | | | | | | | |
| | 42,057 | | Fidelity Government Portfolio-Class I, 0.21%(a) | | | | | | | | | | | 42,057 | |
| | | | TOTAL SHORT TERM INVESTMENT (Cost $42,057) | | | | | | | | | | | 42,057 | |
| | | | TOTAL INVESTMENTS (Cost $14,512,208) | | | | | | | 99.3 | % | | | 10,708,916 | |
| | | | OTHER ASSETS IN EXCESS OF LIABILITIES | | | | | | | 0.7 | % | | | 76,917 | |
| | | | TOTAL NET ASSETS | | | | | | | 100.0 | % | | $ | 10,785,833 | |
| * | Non Income Producing. |
| ^ | U.S. Dollar-denominated foreign security. |
(a) | 7-day yield. |
The accompanying notes are an integral part of these financial statements.
JACOB MICRO CAP GROWTH FUND
SCHEDULE OF INVESTMENTS
February 29, 2016 (Unaudited)
| Shares | | | | | | | | | | Value | |
| | | COMMON STOCKS | | | | | | 99.4 | % | | | |
| | | Biotech & Pharmaceuticals | | | 15.0 | % | | | | | | | |
| | 54,000 | | Array BioPharma Inc.* | | | | | | | | | | $ | 135,540 | |
| | 14,954 | | Cancer Genetics, Inc.* | | | | | | | | | | | 32,899 | |
| | 5,121 | | Cempra, Inc.* | | | | | | | | | | | 86,187 | |
| | 45,006 | | Codexis, Inc.* | | | | | | | | | | | 182,724 | |
| | 9,000 | | Esperion Therapeutics, Inc.* | | | | | | | | | | | 134,010 | |
| | 30,000 | | Imprimis Pharmaceuticals, Inc.* | | | | | | | | | | | 122,400 | |
| | 15,000 | | Omeros Corp.* | | | | | | | | | | | 152,100 | |
| | 80,000 | | pSivida Corp.* | | | | | | | | | | | 216,800 | |
| | 10,400 | | Theravance Biopharma, Inc.*^ | | | | | | | | | | | 163,488 | |
| | | | | | | | | | | | | | | 1,226,148 | |
| | | | Chemicals | | | 2.3 | % | | | | | | | | |
| | 53,110 | | BioAmber Inc.* | | | | | | | | | | | 185,885 | |
| | | | | | | | | | | | | | | | |
| | | | Energy-Exploration & Production | | | 3.6 | % | | | | | | | | |
| | 35,000 | | Energy Recovery Inc.* | | | | | | | | | | | 254,100 | |
| | 125,888 | | Triangle Petroleum Corp.* | | | | | | | | | | | 40,284 | |
| | | | | | | | | | | | | | | 294,384 | |
| | | | Financial | | | 2.5 | % | | | | | | | | |
| | 16,112 | | First Northwest Bancorp* | | | | | | | | | | | 202,689 | |
| | | | | | | | | | | | | | | | |
| | | | Food & Beverages | | | 4.3 | % | | | | | | | | |
| | 43,013 | | Reed’s, Inc.* | | | | | | | | | | | 217,216 | |
| | 40,000 | | Senomyx, Inc.* | | | | | | | | | | | 132,800 | |
| | | | | | | | | | | | | | | 350,016 | |
| | | | Industrial | | | 3.2 | % | | | | | | | | |
| | 41,848 | | CECO Environmental Corp. | | | | | | | | | | | 259,876 | |
| | | | | | | | | | | | | | | | |
| | | | Medical Devices | | | 13.1 | % | | | | | | | | |
| | 55,671 | | Derma Sciences, Inc.* | | | | | | | | | | | 183,714 | |
| | 68,660 | | iCAD, Inc.* | | | | | | | | | | | 306,910 | |
| | 9,000 | | Intersect ENT, Inc.* | | | | | | | | | | | 162,720 | |
| | 100,000 | | Nanosphere, Inc.* | | | | | | | | | | | 71,000 | |
| | 27,350 | | STAAR Surgical Co.* | | | | | | | | | | | 170,391 | |
| | 214,000 | | TearLab Corp.* | | | | | | | | | | | 179,760 | |
| | | | | | | | | | | | | | | 1,074,495 | |
| | | | Retail & Restaurants | | | 7.4 | % | | | | | | | | |
| | 13,000 | | Jamba, Inc.* | | | | | | | | | | | 172,510 | |
| | 61,644 | | Pacific Sunwear of California, Inc.* | | | | | | | | | | | 11,897 | |
| | 32,300 | | Rave Restaurant Group, Inc.* | | | | | | | | | | | 167,960 | |
The accompanying notes are an integral part of these financial statements.
JACOB MICRO CAP GROWTH FUND
SCHEDULE OF INVESTMENTS (Continued)
February 29, 2016 (Unaudited)
| Shares | | | | | | | | | | Value | |
| | | COMMON STOCKS—(Continued) | | | | | | 99.4 | % | | | |
| | | Retail & Restaurants—(Continued) | | | 7.4 | % | | | | | | | |
| | 35,000 | | Tilly’s Inc.—Class A* | | | | | | | | | | $ | 251,650 | |
| | | | | | | | | | | | | | | 604,017 | |
| | | | Technology-Hardware | | | 5.9 | % | | | | | | | | |
| | 7,540 | | CEVA, Inc.* | | | | | | | | | | | 147,859 | |
| | 168,200 | | Lantronix, Inc.* | | | | | | | | | | | 139,606 | |
| | 149,700 | | Netlist, Inc.* | | | | | | | | | | | 193,113 | |
| | | | | | | | | | | | | | | 480,578 | |
| | | | Technology-Software & Services | | | 42.1 | % | | | | | | | | |
| | 46,000 | | Bazaarvoice Inc.* | | | | | | | | | | | 144,440 | |
| | 31,000 | | Castlight Health, Inc.—Class B* | | | | | | | | | | | 102,920 | |
| | 150,000 | | Digital Turbine Inc.* | | | | | | | | | | | 169,500 | |
| | 47,800 | | E-House (China) Holdings Ltd.—ADR^ | | | | | | | | | | | 277,718 | |
| | 14,000 | | Hortonworks Inc.* | | | | | | | | | | | 161,700 | |
| | 55,599 | | I.D. Systems, Inc.* | | | | | | | | | | | 241,300 | |
| | 33,393 | | Immersion Corp.* | | | | | | | | | | | 300,871 | |
| | 56,909 | | Jiayuan.com International Ltd.—ADR*^ | | | | | | | | | | | 413,159 | |
| | 90,826 | | Mitek Systems, Inc.* | | | | | | | | | | | 469,571 | |
| | 48,776 | | Numerex Corp.* | | | | | | | | | | | 286,315 | |
| | 41,029 | | Sajan Inc.* | | | | | | | | | | | 124,728 | |
| | 150,000 | | Sysorex Global* | | | | | | | | | | | 81,060 | |
| | 112,021 | | Top Image Systems Ltd.*^ | | | | | | | | | | | 271,091 | |
| | 100,000 | | USA Technologies, Inc.* | | | | | | | | | | | 397,000 | |
| | | | | | | | | | | | | | | 3,441,373 | |
| | | | TOTAL COMMON STOCKS (Cost $11,815,743) | | | | | | | | | | | 8,119,461 | |
| | | | | | | | | | | | | | | | |
| | | | SHORT TERM INVESTMENT | | | | | | | 1.1 | % | | | | |
| | | | Money Market Fund | | | 1.1 | % | | | | | | | | |
| | 91,134 | | Fidelity Government Portfolio-Class I, 0.21%(a) | | | | | | | | | | | 91,134 | |
| | | | TOTAL SHORT TERM INVESTMENT (Cost $91,134) | | | | | | | | | | | 91,134 | |
| | | | TOTAL INVESTMENTS (Cost $11,906,877) | | | | | | | 100.5 | % | | | 8,210,595 | |
| | | | LIABILITIES IN EXCESS OF OTHER ASSETS | | | | | | | (0.5 | )% | | | (39,269 | ) |
| | | | TOTAL NET ASSETS | | | | | | | 100.0 | % | | $ | 8,171,326 | |
| * | Non Income Producing. |
| ^ | U.S. Dollar-denominated foreign security. |
(a) | 7-day yield. |
| ADR | American Depositary Receipt. |
The accompanying notes are an integral part of these financial statements.
JACOB WISDOM FUND
SCHEDULE OF INVESTMENTS
February 29, 2016 (Unaudited)
| Shares | | | | | | | | | | Value | |
| | | COMMON STOCKS | | | | | | 84.6 | % | | | |
| | | Beverages | | | 8.1 | % | | | | | | | |
| | 1,800 | | Anheuser-Busch InBev NV—ADR^ | | | | | | | | | | $ | 200,700 | |
| | 4,800 | | The Coca-Cola Co. | | | | | | | | | | | 207,024 | |
| | 1,800 | | Diageo plc—ADR^ | | | | | | | | | | | 184,680 | |
| | | | | | | | | | | | | | | 592,404 | |
| | | | Cable/Satellite TV | | | 2.4 | % | | | | | | | | |
| | 4,800 | | Liberty Global plc*^ | | | | | | | | | | | 172,608 | |
| | | | | | | | | | | | | | | | |
| | | | Commercial Banks | | | 1.3 | % | | | | | | | | |
| | 4,500 | | Banco Latinoamericano de Comercio Exterior SA^ | | | | | | | | | | | 96,165 | |
| | | | | | | | | | | | | | | | |
| | | | Commercial Services & Supplies | | | 9.6 | % | | | | | | | | |
| | 300 | | AutoZone, Inc.* | | | | | | | | | | | 232,371 | |
| | 900 | | The Sherwin-Williams Co. | | | | | | | | | | | 243,450 | |
| | 3,000 | | Verisk Analytics, Inc.—Class A* | | | | | | | | | | | 218,520 | |
| | | | | | | | | | | | | | | 694,341 | |
| | | | Consumer Finance | | | 5.9 | % | | | | | | | | |
| | 2,400 | | MasterCard, Inc.—Class A | | | | | | | | | | | 208,608 | |
| | 3,000 | | Visa Inc.—Class A | | | | | | | | | | | 217,170 | |
| | | | | | | | | | | | | | | 425,778 | |
| | | | Consumer Non-Cyclical | | | 3.0 | % | | | | | | | | |
| | 2,400 | | Philip Morris International Inc. | | | | | | | | | | | 218,472 | |
| | | | | | | | | | | | | | | | |
| | | | Food Products | | | 9.4 | % | | | | | | | | |
| | 4,500 | | Campbell Soup Co. | | | | | | | | | | | 277,875 | |
| | 3,000 | | Kraft Heinz Co. | | | | | | | | | | | 231,060 | |
| | 2,400 | | Mead Johnson Nutrition Co. | | | | | | | | | | | 177,024 | |
| | | | | | | | | | | | | | | 685,959 | |
| | | | Health Care Equipment & Supplies | | | 6.7 | % | | | | | | | | |
| | 1,700 | | C.R. Bard, Inc. | | | | | | | | | | | 327,046 | |
| | 2,400 | | DaVita HealthCare Partners Inc.* | | | | | | | | | | | 158,328 | |
| | | | | | | | | | | | | | | 485,374 | |
| | | | Hotels, Restaurants & Leisure | | | 3.9 | % | | | | | | | | |
| | 2,400 | | McDonald’s Corp. | | | | | | | | | | | 281,256 | |
| | | | | | | | | | | | | | | | |
| | | | Insurance | | | 1.1 | % | | | | | | | | |
| | 600 | | Berkshire Hathaway Inc.—Class B* | | | | | | | | | | | 80,502 | |
The accompanying notes are an integral part of these financial statements.
JACOB WISDOM FUND
SCHEDULE OF INVESTMENTS (Continued)
February 29, 2016 (Unaudited)
| Shares | | | | | | | | | | Value | |
| | | COMMON STOCKS—(Continued) | | | | | | 84.6 | % | | | |
| | | Machinery | | | 4.7 | % | | | | | | | |
| | 900 | | Cummins Inc. | | | | | | | | | | $ | 87,813 | |
| | 1,800 | | The Toro Co. | | | | | | | | | | | 143,460 | |
| | 1,200 | | WABCO Holdings Inc.* | | | | | | | | | | | 113,160 | |
| | | | | | | | | | | | | | | 344,433 | |
| | | | Oil, Gas & Consumable Fuels | | | 3.7 | % | | | | | | | | |
| | 1,500 | | Chevron Corp. | | | | | | | | | | | 125,160 | |
| | 1,800 | | Exxon Mobil Corp. | | | | | | | | | | | 144,270 | |
| | | | | | | | | | | | | | | 269,430 | |
| | | | Pharmaceuticals | | | 5.4 | % | | | | | | | | |
| | 4,500 | | Gilead Sciences, Inc. | | | | | | | | | | | 392,625 | |
| | | | | | | | | | | | | | | | |
| | | | Technology-Hardware & Software | | | 6.4 | % | | | | | | | | |
| | 4,800 | | Apple Computer, Inc. | | | | | | | | | | | 464,112 | |
| | | | | | | | | | | | | | | | |
| | | | Textiles, Apparel & Luxury Goods | | | 13.0 | % | | | | | | | | |
| | 4,800 | | Kohl’s Corp. | | | | | | | | | | | 224,016 | |
| | 4,200 | | Michael Kors Holdings Limited*^ | | | | | | | | | | | 237,930 | |
| | 3,000 | | Nike, Inc.—Class B | | | | | | | | | | | 184,770 | |
| | 5,400 | | Ross Stores, Inc. | | | | | | | | | | | 296,892 | |
| | | | | | | | | | | | | | | 943,608 | |
| | | | TOTAL COMMON STOCKS (Cost $4,018,000) | | | | | | | | | | | 6,147,067 | |
| | | | | | | | | | | | | | | | |
| | | | SHORT TERM INVESTMENT | | | | | | | 16.8 | % | | | | |
| | | | Money Market Fund | | | 16.8 | % | | | | | | | | |
| | 1,226,425 | | Fidelity Government Portfolio-Class I, 0.21%(a) | | | | | | | | | | | 1,226,425 | |
| | | | TOTAL SHORT TERM INVESTMENT (Cost $1,226,425) | | | | | | | | | | | 1,226,425 | |
| | | | TOTAL INVESTMENTS (Cost $5,244,425) | | | | | | | 101.4 | % | | | 7,373,492 | |
| | | | LIABILITIES IN EXCESS OF OTHER ASSETS | | | | | | | (1.4 | )% | | | (105,326 | ) |
| | | | TOTAL NET ASSETS | | | | | | | 100.0 | % | | $ | 7,268,166 | |
| * | Non Income Producing. |
| ^ | U.S. Dollar-denominated foreign security. |
(a) | 7-day yield. |
| ADR | American Depositary Receipt. |
The accompanying notes are an integral part of these financial statements.
(This Page Intentionally Left Blank.)
JACOB FUNDS INC.
STATEMENTS OF ASSETS AND LIABILITIES
February 29, 2016 (Unaudited)
| | | | | | Jacob | |
| | | Jacob | | | Small Cap | |
| | | Internet Fund | | | Growth Fund | |
| Assets: | | | | | | |
| Investments, at value (cost $28,375,992 and $14,512,208, respectively) | | $ | 34,544,111 | | | $ | 10,708,916 | |
| Receivable for capital shares sold | | | 5,540 | | | | — | |
| Receivable for investments sold | | | — | | | | 80,865 | |
| Dividend and interest receivable | | | 54 | | | | 5 | |
| Receivable from Adviser | | | — | | | | 7,645 | |
| Other assets | | | 16,791 | | | | 21,343 | |
| Total Assets | | | 34,566,496 | | | | 10,818,774 | |
| | | | | | | | | |
| Liabilities: | | | | | | | | |
| Payable to Adviser | | | 32,598 | | | | — | |
| Payable for distribution and shareholder servicing expenses—Investor Class (see Note 7) | | | 103,395 | | | | — | |
| Payable for capital shares repurchased | | | 3,288 | | | | 3 | |
| Accrued printing and mailing fees | | | 6,948 | | | | 1,596 | |
| Accrued transfer agent fees | | | 15,151 | | | | 10,280 | |
| Accrued expenses and other liabilities | | | 29,050 | | | | 21,062 | |
| Total Liabilities | | | 190,430 | | | | 32,941 | |
| Net Assets | | $ | 34,376,066 | | | $ | 10,785,833 | |
| | | | | | | | | |
| Net Assets Consist Of: | | | | | | | | |
| Capital Stock | | $ | 27,890,295 | | | $ | 19,993,289 | |
| Accumulated net investment loss | | | (1,028,375 | ) | | | (508,822 | ) |
| Accumulated net realized gain (loss) on investment transactions | | | 1,346,027 | | | | (4,895,342 | ) |
| Net unrealized appreciation (depreciation) on investments | | | 6,168,119 | | | | (3,803,292 | ) |
| Total Net Assets | | $ | 34,376,066 | | | $ | 10,785,833 | |
| | | | | | | | | |
Institutional Class(1) | | | | | | | | |
| Net Assets | | $ | — | | | $ | 6,310,832 | |
| Shares outstanding (20 billion shares of $0.001 par value authorized) | | | — | | | | 474,704 | |
Net asset value, redemption price and offering price per share(2) | | $ | — | | | $ | 13.29 | |
| Investor Class | | | | | | | | |
| Net Assets | | $ | 34,376,066 | | | $ | 4,475,001 | |
| Shares outstanding (20 billion shares of $0.001 par value authorized) | | | 10,268,708 | | | | 339,367 | |
Net asset value, redemption price and offering price per share(2) | | $ | 3.35 | | | $ | 13.19 | |
_______________
(1) | The Internet Fund currently offers Investor Class shares only. See Note 1. |
(2) | Redemption of shares held less than 30 days may be charged a 2% redemption fee. See Note 3. |
The accompanying notes are an integral part of these financial statements.
JACOB FUNDS INC.
STATEMENTS OF ASSETS AND LIABILITIES
February 29, 2016 (Unaudited)
| | | Jacob | | | | |
| | | Micro Cap | | | Jacob | |
| | | Growth Fund | | | Wisdom Fund | |
| Assets: | | | | | | |
| Investments, at value (cost $11,906,877 and $5,244,425, respectively) | | $ | 8,210,595 | | | $ | 7,373,492 | |
| Cash | | | — | | | | 1 | |
| Receivable for capital shares sold | | | 75 | | | | 100 | |
| Receivable for investments sold | | | 9,754 | | | | — | |
| Dividend and interest receivable | | | 17 | | | | 10,111 | |
| Other assets | | | 21,171 | | | | 11,150 | |
| Total Assets | | | 8,241,612 | | | | 7,394,854 | |
| | | | | | | | | |
| Liabilities: | | | | | | | | |
| Payable for securities purchased | | | 35,374 | | | | 77,831 | |
| Payable for distribution and shareholder servicing expenses—Investor Class (see Note 7) | | | — | | | | 19,776 | |
| Payable for capital shares repurchased | | | — | | | | 50 | |
| Accrued printing and mailing fees | | | 3,002 | | | | 1,671 | |
| Accrued transfer agent fees | | | 3,954 | | | | 4,183 | |
| Accrued expenses and other liabilities | | | 27,956 | | | | 23,177 | |
| Total Liabilities | | | 70,286 | | | | 126,688 | |
| Net Assets | | $ | 8,171,326 | | | $ | 7,268,166 | |
| | | | | | | | | |
| Net Assets Consist Of: | | | | | | | | |
| Capital Stock | | $ | 13,497,209 | | | $ | 5,228,370 | |
| Accumulated net investment loss | | | (120,739 | ) | | | (53,319 | ) |
| Accumulated net realized loss on investment transactions | | | (1,508,862 | ) | | | (35,952 | ) |
| Net unrealized appreciation (depreciation) on investments | | | (3,696,282 | ) | | | 2,129,067 | |
| Total Net Assets | | $ | 8,171,326 | | | $ | 7,268,166 | |
| | | | | | | | | |
Institutional Class(1) | | | | | | | | |
| Net Assets | | $ | 6,273,677 | | | $ | — | |
| Shares outstanding (20 billion shares of $0.001 par value authorized) | | | 613,445 | | | | — | |
Net asset value, redemption price and offering price per share(2) | | $ | 10.23 | | | $ | — | |
| Investor Class | | | | | | | | |
| Net Assets | | $ | 1,897,649 | | | $ | 7,268,166 | |
| Shares outstanding (20 billion shares of $0.001 par value authorized) | | | 201,109 | | | | 761,778 | |
Net asset value, redemption price and offering price per share(2) | | $ | 9.44 | | | $ | 9.54 | |
_______________
(1) | The Wisdom Fund currently offers Investor Class shares only. See Note 1. |
(2) | Redemption of shares held less than 30 days may be charged a 2% redemption fee. See Note 3. |
The accompanying notes are an integral part of these financial statements.
JACOB FUNDS INC.
STATEMENTS OF OPERATIONS
For the Six Months Ended February 29, 2016 (Unaudited)
| | | | | | Jacob | |
| | | Jacob | | | Small Cap | |
| | | Internet Fund | | | Growth Fund | |
| Investment Income: | | | | | | |
| Dividend Income | | $ | 8,463 | | | $ | 7,211 | |
| Interest income | | | 346 | | | | 12 | |
| Total Investment Income | | | 8,809 | | | | 7,223 | |
| | | | | | | | | |
| Expenses: | | | | | | | | |
| Investment advisor fees | | | 240,002 | | | | 62,988 | |
| Distribution and shareholder servicing expenses—Investor Class (See Note 7) | | | 67,201 | | | | 11,166 | |
| Administration fees | | | 23,390 | | | | 20,901 | |
| Fund accounting fees | | | 13,727 | | | | 16,940 | |
| Transfer agent fees | | | 61,285 | | | | 34,534 | |
| Custody fees | | | 3,542 | | | | 4,614 | |
| Federal and state registration | | | 10,641 | | | | 15,374 | |
| Insurance expense | | | 5,279 | | | | 2,357 | |
| Audit fees | | | 7,628 | | | | 7,703 | |
| Legal fees | | | 27,930 | | | | 12,025 | |
| Printing and mailing of reports to shareholders | | | 11,382 | | | | 4,268 | |
| Directors’ fees and expenses | | | 22,929 | | | | 8,866 | |
| Other | | | 122 | | | | 45 | |
| Total Expenses | | | 495,058 | | | | 201,781 | |
| Expense Waiver (See Note 6) | | | — | | | | (47,997 | ) |
| Net expenses | | | 495,058 | | | | 153,784 | |
| Net Investment Loss | | | (486,249 | ) | | | (146,561 | ) |
| | | | | | | | | |
| Realized and Unrealized Gain (Loss) on Investments: | | | | | | | | |
| Net realized gain (loss) on investments | | | 1,667,544 | | | | (1,970,314 | ) |
| Change in net unrealized appreciation (depreciation) on investments | | | (2,751,249 | ) | | | (2,830,257 | ) |
| Net realized and unrealized loss on investments | | | (1,083,705 | ) | | | (4,800,571 | ) |
| Net Decrease in Net Assets Resulting from Operations | | $ | (1,569,954 | ) | | $ | (4,947,132 | ) |
The accompanying notes are an integral part of these financial statements.
JACOB FUNDS INC.
STATEMENTS OF OPERATIONS
For the Six Months Ended February 29, 2016 (Unaudited)
| | | Jacob | | | | |
| | | Micro Cap | | | Jacob | |
| | | Growth Fund | | | Wisdom Fund | |
| Investment Income: | | | | | | |
| Dividend Income | | $ | 4,298 | | | $ | 66,175 | (1) |
| Interest income | | | 115 | | | | 360 | |
| Total Investment Income | | | 4,413 | | | | 66,535 | |
| | | | | | | | | |
| Expenses: | | | | | | | | |
| Investment advisor fees | | | 57,121 | | | | 19,652 | |
| Distribution and shareholder servicing expenses—Investor Class (See Note 7) | | | 3,839 | | | | 11,337 | |
| Administration fees | | | 20,841 | | | | 20,330 | |
| Fund accounting fees | | | 17,290 | | | | 13,869 | |
| Transfer agent fees | | | 33,026 | | | | 17,567 | |
| Custody fees | | | 3,372 | | | | 2,871 | |
| Federal and state registration | | | 15,033 | | | | 9,674 | |
| Insurance expense | | | 1,608 | | | | 1,441 | |
| Audit fees | | | 7,628 | | | | 7,653 | |
| Legal fees | | | 8,937 | | | | 7,798 | |
| Printing and mailing of reports to shareholders | | | 3,272 | | | | 2,802 | |
| Directors’ fees and expenses | | | 5,878 | | | | 4,778 | |
| Other | | | 14 | | | | 70 | |
| Total Expenses | | | 177,859 | | | | 119,842 | |
| Expense Waiver (See Note 6) | | | (57,121 | ) | | | (19,652 | ) |
| Net expenses | | | 120,738 | | | | 100,190 | |
| Net Investment Loss | | | (116,325 | ) | | | (33,655 | ) |
| | | | | | | | | |
| Realized and Unrealized Gain (Loss) on Investments: | | | | | | | | |
| Net realized gain (loss) on investments | | | (525,374 | ) | | | 64,032 | |
| Change in net unrealized appreciation (depreciation) on investments | | | (1,779,860 | ) | | | (361,368 | ) |
| Net realized and unrealized loss on investments | | | (2,305,234 | ) | | | (297,336 | ) |
| Net Decrease in Net Assets Resulting from Operations | | $ | (2,421,559 | ) | | $ | (330,991 | ) |
_______________
(1) | Net of foreign tax withheld of $684 for the Wisdom Fund. |
The accompanying notes are an integral part of these financial statements.
JACOB FUNDS INC.
JACOB INTERNET FUND
STATEMENTS OF CHANGES IN NET ASSETS
| | | Six Months Ended | | | Year Ended | |
| | | February 29, 2016 | | | August 31, 2015 | |
| | | (Unaudited) | | | | |
| Operations: | | | | | | |
| Net investment loss | | $ | (486,249 | ) | | $ | (813,729 | ) |
| Net realized gain on investment transactions | | | 1,667,544 | | | | 6,387,262 | |
| Change in net unrealized depreciation on investments | | | (2,751,249 | ) | | | (6,674,010 | ) |
| Net decrease in net assets resulting from operations | | | (1,569,954 | ) | | | (1,100,477 | ) |
| | | | | | | | | |
| Distributions to Shareholders: | | | | | | | | |
| From net realized gain | | | (4,682,043 | ) | | | (4,292,552 | ) |
| | | | | | | | | |
| Capital Share Transactions (See Note 3): | | | | | | | | |
| Proceeds from shares sold | | | 1,297,518 | | | | 2,483,271 | |
| Proceeds from reinvestment of distribution | | | 4,560,019 | | | | 4,102,934 | |
| Cost of shares redeemed | | | (4,089,372 | ) | | | (7,882,988 | ) |
| Redemption fees | | | 304 | | | | 3,453 | |
| Net increase (decrease) in net assets resulting from capital share transactions | | | 1,768,469 | | | | (1,293,330 | ) |
| | | | | | | | | |
| Net Decrease in Net Assets | | | (4,483,528 | ) | | | (6,686,359 | ) |
| Net Assets: | | | | | | | | |
| Beginning of period | | | 38,859,594 | | | | 45,545,953 | |
| End of period* | | $ | 34,376,066 | | | $ | 38,859,594 | |
| * Includes accumulated net investment loss of: | | $ | (1,028,375 | ) | | $ | (542,126 | ) |
The accompanying notes are an integral part of these financial statements.
JACOB FUNDS INC.
JACOB SMALL CAP GROWTH FUND
STATEMENTS OF CHANGES IN NET ASSETS
| | | Six Months Ended | | | Year Ended | |
| | | February 29, 2016 | | | August 31, 2015 | |
| | | (Unaudited) | | | | |
| Operations: | | | | | | |
| Net investment loss | | $ | (146,561 | ) | | $ | (372,196 | ) |
| Net realized gain (loss) on investment transactions | | | (1,970,314 | ) | | | 2,565,776 | |
| Change in net unrealized depreciation on investments | | | (2,830,257 | ) | | | (2,845,946 | ) |
| Net decrease in net assets resulting from operations | | | (4,947,132 | ) | | | (652,366 | ) |
| | | | | | | | | |
| Distributions to Shareholders: | | | | | | | | |
| From net investment income | | | (86,651 | ) | | | — | |
| | | | | | | | | |
| Capital Share Transactions (See Note 3): | | | | | | | | |
| Proceeds from shares sold | | | 138,265 | | | | 8,304,124 | |
| Proceeds from reinvestment of distribution | | | 79,101 | | | | — | |
| Cost of shares redeemed | | | (3,010,901 | ) | | | (5,693,760 | ) |
| Redemption fees | | | 6 | | | | 11,182 | |
| Net increase (decrease) in net assets resulting from capital share transactions | | | (2,793,529 | ) | | | 2,621,546 | |
| | | | | | | | | |
| Net Increase (Decrease) in Net Assets | | | (7,827,312 | ) | | | 1,969,180 | |
| Net Assets: | | | | | | | | |
| Beginning of period | | | 18,613,145 | | | | 16,643,965 | |
| End of period* | | $ | 10,785,833 | | | $ | 18,613,145 | |
| * Includes accumulated net investment loss of: | | $ | (508,822 | ) | | $ | (275,610 | ) |
The accompanying notes are an integral part of these financial statements.
JACOB FUNDS INC.
JACOB MICRO CAP GROWTH FUND
STATEMENTS OF CHANGES IN NET ASSETS
| | | Six Months Ended | | | Year Ended | |
| | | February 29, 2016 | | | August 31, 2015 | |
| | | (Unaudited) | | | | |
| Operations: | | | | | | |
| Net investment loss | | $ | (116,325 | ) | | $ | (219,035 | ) |
| Net realized gain (loss) on investment transactions | | | (525,374 | ) | | | 2,814,448 | |
| Change in net unrealized depreciation on investments | | | (1,779,860 | ) | | | (2,274,756 | ) |
| Net increase (decrease) in net assets resulting from operations | | | (2,421,559 | ) | | | 320,657 | |
| | | | | | | | | |
| Distributions to Shareholders: | | | | | | | | |
| From net realized gain | | | (2,158,976 | ) | | | (2,473,500 | ) |
| | | | | | | | | |
| Capital Share Transactions (See Note 3): | | | | | | | | |
| Proceeds from shares sold | | | 84,839 | | | | 822,626 | |
| Proceeds from reinvestment of distribution | | | 1,996,946 | | | | 2,259,190 | |
| Cost of shares redeemed | | | (584,804 | ) | | | (2,611,413 | ) |
| Redemption fees | | | 2 | | | | 498 | |
| Net increase in net assets resulting from capital share transactions | | | 1,496,983 | | | | 470,901 | |
| | | | | | | | | |
| Net Decrease in Net Assets | | | (3,083,552 | ) | | | (1,681,942 | ) |
| Net Assets: | | | | | | | | |
| Beginning of period | | | 11,254,878 | | | | 12,936,820 | |
| End of period* | | $ | 8,171,326 | | | $ | 11,254,878 | |
| * Includes accumulated net investment loss of: | | $ | (120,739 | ) | | $ | (4,414 | ) |
The accompanying notes are an integral part of these financial statements.
JACOB FUNDS INC.
JACOB WISDOM FUND
STATEMENTS OF CHANGES IN NET ASSETS
| | | Six Months Ended | | | Year Ended | |
| | | February 29, 2016 | | | August 31, 2015 | |
| | | (Unaudited) | | | | |
| Operations: | | | | | | |
| Net investment loss | | $ | (33,655 | ) | | $ | (28,854 | ) |
| Net realized gain on investment transactions | | | 64,032 | | | | 1,488,311 | |
| Change in net unrealized appreciation on investments | | | (361,368 | ) | | | (1,480,779 | ) |
| Net decrease in net assets resulting from operations | | | (330,991 | ) | | | (21,322 | ) |
| | | | | | | | | |
| Distributions to Shareholders: | | | | | | | | |
| From net realized gain | | | (1,441,098 | ) | | | — | |
| | | | | | | | | |
| Capital Share Transactions (See Note 3): | | | | | | | | |
| Proceeds from shares sold | | | 206,540 | | | | 162,144 | |
| Proceeds from reinvestment of distribution | | | 1,215,172 | | | | — | |
| Cost of shares redeemed | | | (2,850,619 | ) | | | (949,943 | ) |
| Redemption fees | | | 4 | | | | 21 | |
| Net decrease in net assets resulting from capital share transactions | | | (1,428,903 | ) | | | (787,778 | ) |
| | | | | | | | | |
| Net Decrease in Net Assets | | | (3,200,992 | ) | | | (809,100 | ) |
| Net Assets: | | | | | | | | |
| Beginning of period | | | 10,469,158 | | | | 11,278,258 | |
| End of period* | | $ | 7,268,166 | | | $ | 10,469,158 | |
| * Includes accumulated net investment loss of: | | $ | (53,319 | ) | | $ | (19,664 | ) |
The accompanying notes are an integral part of these financial statements.
JACOB FUNDS INC.
JACOB INTERNET FUND – INVESTOR CLASS
FINANCIAL HIGHLIGHTS
The table below sets forth financial data for a share of the Fund outstanding throughout each period presented.
| | | Six Months | | | | | | | | | | | | | | | | |
| | | Ended | | | | | | | | | | | | | | | | |
| | | February 29, | | | Year Ended August 31, | |
| | | 2016 | | | 2015 | | | 2014 | | | 2013 | | | 2012 | | | 2011 | |
| | | (Unaudited) | | | | | | | | | | | | | | | | |
| | | | | | | | | | | | | | | | | | | |
| Per Share Data: | | | | | | | | | | | | | | | | | | |
| Net asset value, beginning of period | | $ | 3.96 | | | $ | 4.51 | | | $ | 3.81 | | | $ | 3.03 | | | $ | 2.95 | | | $ | 2.28 | |
| | | | | | | | | | | | | | | | | | | | | | | | | |
| Income (loss) from investment operations: | | | | | | | | | | | | | | | | | | | | | | | | |
Net investment loss(1) | | | (0.05 | ) | | | (0.08 | ) | | | (0.09 | ) | | | (0.07 | ) | | | (0.06 | ) | | | (0.08 | ) |
| Net realized and unrealized gain (loss) | | | | | | | | | | | | | | | | | | | | | | | | |
| on investment transactions | | | (0.07 | ) | | | (0.03 | ) | | | 0.79 | | | | 0.85 | | | | 0.14 | | | | 0.75 | |
| Total from investment operations | | | (0.12 | ) | | | (0.11 | ) | | | 0.70 | | | | 0.78 | | | | 0.08 | | | | 0.67 | |
| Less distributions from net realized gain | | | (0.49 | ) | | | (0.44 | ) | | | — | | | | — | | | | — | | | | — | |
Paid in capital from redemption fees(2) | | | 0.00 | | | | 0.00 | | | | 0.00 | | | | 0.00 | | | | 0.00 | | | | 0.00 | |
| Net asset value, end of period | | $ | 3.35 | | | $ | 3.96 | | | $ | 4.51 | | | $ | 3.81 | | | $ | 3.03 | | | $ | 2.95 | |
| Total return | | | (4.13 | )%(3) | | | (2.14 | )% | | | 18.37 | % | | | 25.74 | % | | | 2.71 | % | | | 29.39 | % |
| | | | | | | | | | | | | | | | | | | | | | | | | |
| Supplemental data and ratios: | | | | | | | | | | | | | | | | | | | | | | | | |
| Net assets, end of period (in thousands) | | $ | 34,376 | | | $ | 38,860 | | | $ | 45,546 | | | $ | 40,033 | | | $ | 39,983 | | | $ | 41,266 | |
| Ratio of gross operating expenses | | | | | | | | | | | | | | | | | | | | | | | | |
| (prior to waiver or reimbursements) to average net assets | 2.58 | %(4) | | | 2.46 | % | | | 2.42 | % | | | 2.66 | % | | | 2.87 | % | | | 2.69 | % |
| Ratio of net operating expenses | | | | | | | | | | | | | | | | | | | | | | | | |
(after waiver or recoupments) to average net assets(5) | 2.58 | %(4) | | | 2.46 | % | | | 2.42 | % | | | 2.66 | % | | | 2.87 | % | | | 2.82 | % |
| Ratio of net investment loss | | | | | | | | | | | | | | | | | | | | | | | | |
| (prior to waiver or reimbursements) to average net assets | (2.53 | )%(4) | | | (1.93 | )% | | | (2.00 | )% | | | (2.05 | )% | | | (1.99 | )% | | | (2.53 | )% |
| Ratio of net investment loss | | | | | | | | | | | | | | | | | | | | | | | | |
(after waiver or recoupments) to average net assets(5) | (2.53 | )%(4) | | | (1.93 | )% | | | (2.00 | )% | | | (2.05 | )% | | | (1.99 | )% | | | (2.66 | )% |
| Portfolio turnover rate | | | 28 | %(3) | | | 50 | % | | | 56 | % | | | 44 | % | | | 56 | % | | | 52 | % |
_______________
(1) | Net investment loss per share is calculated using ending balances prior to consideration of adjustments for permanent book and tax differences. |
(2) | Less than $0.01 per share. |
(3) | Not annualized. |
(4) | Annualized. |
(5) | For the period January 1, 2010 through January 2, 2017, the Adviser has contractually agreed to waive its advisory fee in an amount up to an annual rate of 0.10% of the Fund’s average daily net assets, to the extent that the Fund’s gross operating expense ratio exceeds 2.95%, excluding any taxes, interest, brokerage fees, acquired fund fees and expenses, and extraordinary expenses. All eligible previously waived expenses under this agreement were recouped by the Adviser during the year ended August 31, 2011. |
The accompanying notes are an integral part of these financial statements.
JACOB FUNDS INC.
JACOB SMALL CAP GROWTH FUND – INSTITUTIONAL CLASS
FINANCIAL HIGHLIGHTS
The table below sets forth financial data for a share of the Fund outstanding throughout each period presented.
| | | | | | | | | | | | November 12, | |
| | | Six Months | | | | | | | | | 2012(1) | |
| | | Ended | | | | | | | | | through | |
| | | February 29, | | | Year Ended August 31, | | | August 31, | |
| | | 2016 | | | 2015 | | | 2014 | | | 2013 | |
| | | (Unaudited) | | | | | | | | | | |
| Per Share Data: | | | | | | | | | | | | |
| Net asset value, beginning of period | | $ | 18.95 | | | $ | 19.01 | | | $ | 17.67 | | | $ | 12.94 | |
| | | | | | | | | | | | | | | | | |
| Income (loss) from investment operations: | | | | | | | | | | | | | | | | |
Net investment loss(2) | | | (0.15 | ) | | | (0.36 | ) | | | (0.35 | ) | | | (0.22 | ) |
| Net realized and unrealized gain (loss) on investment transactions | | | (5.40 | ) | | | 0.30 | | | | 1.69 | | | | 4.95 | |
| Total from investment operations | | | (5.55 | ) | | | (0.06 | ) | | | 1.34 | | | | 4.73 | |
| Less distributions from net investment income | | | (0.11 | ) | | | — | | | | — | | | | — | |
| Net asset value, end of period | | $ | 13.29 | | | $ | 18.95 | | | $ | 19.01 | | | $ | 17.67 | |
| Total return | | | (29.34 | )%(3) | | | (0.32 | )% | | | 7.58 | % | | | 36.55 | %(3) |
| | | | | | | | | | | | | | | | | |
| Supplemental data and ratios: | | | | | | | | | | | | | | | | |
| Net assets, end of period (in thousands) | | $ | 6,311 | | | $ | 9,367 | | | $ | 10,164 | | | $ | 10,131 | |
| Ratio of gross operating expenses | | | | | | | | | | | | | | | | |
| (prior to waiver or reimbursements) to average net assets | | | 2.75 | %(4) | | | 2.17 | % | | | 2.25 | % | | | 2.32 | %(4) |
| Ratio of net operating expenses | | | | | | | | | | | | | | | | |
(after waiver or reimbursements) to average net assets(5) | | | 2.07 | %(4) | | | 1.95 | % | | | 1.95 | % | | | 1.95 | %(4) |
| Ratio of net investment loss | | | | | | | | | | | | | | | | |
| (prior to waiver or reimbursements) to average net assets | | | (2.64 | )%(4) | | | (2.00 | )% | | | (2.16 | )% | | | (2.20 | )%(4) |
| Ratio of net investment loss | | | | | | | | | | | | | | | | |
(after waiver or reimbursements) to average net assets(5) | | | (1.96 | )%(4) | | | (1.78 | )% | | | (1.86 | )% | | | (1.83 | )%(4) |
| Portfolio turnover rate | | | 34 | %(3) | | | 84 | % | | | 86 | % | | | 81 | %(3) |
_______________
(1) | Commencement of operations of the Small Cap Growth Fund Institutional Class. The Class I shares of the Jacob Small Cap Growth Fund II, (formerly, PineBridge US Small Cap Growth Fund) series of Jacob Funds II (formerly, PineBridge Mutual Funds) was reorganized into Institutional Class shares of the Small Cap Growth Fund on November 12, 2012. On July 9, 2012, before the reorganization, the adviser of the Jacob Small Cap Growth Fund II changed from PineBridge Investments, LLC to Jacob Asset Management of New York LLC (the “Adviser”). |
(2) | Net investment loss per share represents net investment loss divided by average shares outstanding throughout the period. |
(3) | Not annualized. |
(4) | Annualized. |
(5) | The Adviser has contractually agreed, effective November 12, 2012 (date of reorganization) through January 2, 2017, to waive up to 100% of its advisory fee to the extent that the Fund’s gross operating expense ratio exceeds 1.95%, excluding any taxes, interest, brokerage fees, acquired fund fees and expenses, and extraordinary expenses. |
The accompanying notes are an integral part of these financial statements.
JACOB FUNDS INC.
JACOB SMALL CAP GROWTH FUND – INVESTOR CLASS
FINANCIAL HIGHLIGHTS
The table below sets forth financial data for a share of the Fund outstanding throughout each period presented.
| | | Six Months | | | | | | | | | | | | | | | | |
| | | Ended | | | | | | | | | | | | | | | | |
| | | February 29, | | | Year Ended August 31, | |
| | | 2016 | | | 2015 | | | 2014 | | | 2013(1) | | | 2012 | | | 2011 | |
| | | (Unaudited) | | | | | | | | | | | | | | | | |
| | | | | | | | | | | | | | | | | | | |
| Per Share Data: | | | | | | | | | | | | | | | | | | |
| Net asset value, beginning of period | | $ | 18.81 | | | $ | 18.91 | | | $ | 17.63 | | | $ | 13.87 | | | $ | 15.12 | | | $ | 10.90 | |
| | | | | | | | | | | | | | | | | | | | | | | | | |
| Income (loss) from investment operations: | | | | | | | | | | | | | | | | | | | | | | | | |
Net investment loss(2) | | | (0.18 | ) | | | (0.43 | ) | | | (0.40 | ) | | | (0.35 | ) | | | (0.47 | ) | | | (0.55 | ) |
| Net realized and unrealized gain (loss) | | | | | | | | | | | | | | | | | | | | | | | | |
| on investment transactions | | | (5.34 | ) | | | 0.30 | | | | 1.68 | | | | 4.11 | | | | (0.15 | ) | | | 4.75 | |
| Total from investment operations | | | (5.52 | ) | | | (0.13 | ) | | | 1.28 | | | | 3.76 | | | | (0.62 | ) | | | 4.20 | |
Less distributions from net investment income | | | (0.10 | ) | | | — | | | | — | | | | — | | | | (0.63 | ) | | | — | |
| Paid in capital from redemption fees | | | 0.00 | (3) | | | 0.03 | | | | 0.00 | (3) | | | 0.00 | (3) | | | 0.00 | (3) | | | 0.02 | |
| Net asset value, end of period | | $ | 13.19 | | | $ | 18.81 | | | $ | 18.91 | | | $ | 17.63 | | | $ | 13.87 | | | $ | 15.12 | |
| Total return | | | (29.46 | )%(4) | | | (0.53 | )% | | | 7.26 | % | | | 27.11 | % | | | (3.75 | )% | | | 38.72 | % |
| | | | | | | | | | | | | | | | | | | | | | | | | |
| Supplemental data and ratios: | | | | | | | | | | | | | | | | | | | | | | | | |
| Net assets, end of period (in thousands) | | $ | 4,475 | | | $ | 9,246 | | | $ | 6,480 | | | $ | 7,236 | | | $ | 5,384 | | | $ | 7,013 | |
| Ratio of gross operating expenses | | | | | | | | | | | | | | | | | | | | | | | | |
(prior to waiver or reimbursements) to average net assets | | | 3.04 | %(5) | | | 2.48 | % | | | 2.59 | % | | | 2.97 | % | | | 4.28 | % | | | 4.45 | % |
| Ratio of net operating expenses | | | | | | | | | | | | | | | | | | | | | | | | |
(after waiver or reimbursements) to average net assets | | | 2.35 | %(5)(6) | | | 2.25 | %(6) | | | 2.25 | %(6) | | | 2.47 | %(6)(7) | | | 3.38 | %(7) | | | 3.55 | %(7) |
| Ratio of net investment loss | | | | | | | | | | | | | | | | | | | | | | | | |
(prior to waiver or reimbursements) to average net assets | | | (2.94 | )%(5) | | | (2.31 | )% | | | (2.51 | )% | | | (2.86 | )% | | | (4.27 | )% | | | (4.44 | )% |
| Ratio of net investment loss | | | | | | | | | | | | | | | | | | | | | | | | |
(after waiver or reimbursements) to average net assets(6) | | | (2.25% | )(5) | | | (2.08 | )%(6) | | | (2.17 | )%(6) | | | (2.36 | )%(6)(7) | | | (3.37 | )%(7) | | | (3.54 | )%(7) |
| Portfolio turnover rate | | | 34 | %(4) | | | 84 | % | | | 86 | % | | | 81 | % | | | 78 | % | | | 103 | % |
_______________
(1) | On November 12, 2012, Class R shares of the Jacob Small Cap Growth Fund II (formerly, PineBridge US Small Cap Growth Fund) series of Jacob Funds II (formerly, PineBridgeMutual Funds) were reorganized into Investor Class shares of the Small Cap Growth Fund. Activity after November 12, 2012 reflects the Funds’ combined operations. |
(2) | Net investment loss per share represents net investment loss divided by the average shares outstanding throughout the period. |
(3) | Amount is less than $0.01. |
(4) | Not annualized. |
(5) | Annualized. |
(6) | The Adviser has contractually agreed, effective November 12, 2012 (date of reorganization) through January 2, 2017, to waive up to 100% of its advisory fee to the extent that the Fund’s gross operating expense ratio exceeds 2.25%, excluding any taxes, interest, brokerage fees, acquired fund fees and expenses, and extraordinary expenses. |
(7) | The Adviser contractually agreed, through November 11, 2012, to waive its advisory fees in an amount up to an annual rate of 0.90% of the Fund’s average daily net assets, to the extent that the Fund’s operating expense ratio exceeds 2.45%. |
The accompanying notes are an integral part of these financial statements.
JACOB FUNDS INC.
JACOB MICRO CAP GROWTH FUND – INSTITUTIONAL CLASS
FINANCIAL HIGHLIGHTS
The table below sets forth financial data for a share of the Fund outstanding throughout each period presented.
| | | Six Months | | | | | | | | | Nine Months | | | | | | | | | | |
| | | Ended | | | Year Ended | | | Ended | | | | | | | | | | |
| | | February 29, | | | August 31, | | | August 31, | | | Year Ended November 30, | |
| | | 2016 | | | 2015 | | | 2014 | | | 2013* | | | 2012(1) | | | 2011(1) | | | 2010(1) | |
| | | (Unaudited) | | | | | | | | | | | | | | | | | | | | | | | |
| Per Share Data: | | | | | | | | | | | | | | | | | | | | | | | | | |
Net asset value, beginning of period | | $ | 16.86 | | | $ | 20.65 | | | $ | 25.31 | | | $ | 19.11 | | | $ | 18.19 | | | $ | 17.82 | | | $ | 13.18 | |
| | | | | | | | | | | | | | | | | | | | | | | | | | | | | |
Income (loss) from investment operations: | | | | | | | | | | | | | | | | | | | | | | | | | | | | |
Net investment loss(2) | | | (0.16 | ) | | | (0.32 | ) | | | (0.45 | ) | | | (0.27 | ) | | | (0.31 | ) | | | (0.30 | ) | | | (0.20 | ) |
Net realized and unrealized gain (loss) on | | | | | | | | | | | | | | | | | | | | | | | | | | | | |
| investment transactions | | (3.18 | ) | | | 0.67 | | | | 0.75 | | | | 6.47 | | | | 1.23 | | | | 0.67 | | | | 4.84 | |
Total from investment operations | | | (3.34 | ) | | | 0.35 | | | | 0.30 | | | | 6.20 | | | | 0.92 | | | | 0.37 | | | | 4.64 | |
Less distributions from net realized gain | | | (3.29 | ) | | | (4.14 | ) | | | (4.96 | ) | | | — | | | | — | | | | — | | | | — | |
Net asset value, end of period | | $ | 10.23 | | | $ | 16.86 | | | $ | 20.65 | | | $ | 25.31 | | | $ | 19.11 | | | $ | 18.19 | | | $ | 17.82 | |
| Total return | | | (22.11 | )%(3) | | | 2.23 | % | | | 0.11 | % | | | 32.44 | %(3) | | | 5.06 | % | | | 2.08 | % | | | 35.20 | % |
| | | | | | | | | | | | | | | | | | | | | | | | | | | | | |
| Supplemental data and ratios: | | | | | | | | | | | | | | | | | | | | | | | | | |
Net assets, end of period (in thousands) | $ | 6,274 | | | $ | 8,651 | | | $ | 9,979 | | | $ | 10,800 | | | $ | 40,666 | | | $ | 50,065 | | | $ | 51,300 | |
| Ratio of gross operating expenses | | | | | | | | | | | | | | | | | | | | | | | | | |
| (prior to waiver or reimbursements) | | | | | | | | | | | | | | | | | | | | | | | | | |
| to average net assets | | | 3.66 | %(4) | | | 2.97 | % | | | 2.79 | % | | | 3.01 | %(4) | | | 2.12 | % | | | 1.79 | % | | | 1.89 | % |
| Ratio of net operating expenses | | | | | | | | | | | | | | | | | | | | | | | | | |
| (after waiver or reimbursements) | | | | | | | | | | | | | | | | | | | | | | | | | |
| to average net assets | | | 2.46 | %(4)(5) | | | 2.15 | %(5) | | | 2.15 | %(5) | | | 2.28 | %(4)(5) | | | 1.72 | %(5)(6) | | | 1.60 | %(6) | | | 1.60 | %(6) |
| Ratio of net investment loss | | | | | | | | | | | | | | | | | | | | | | | | | |
| (prior to waiver or reimbursements) | | | | | | | | | | | | | | | | | | | | | | | | | |
| to average net assets | | | (3.56 | )%(4) | | | (2.51 | )% | | | (2.61 | )% | | | (2.46 | )%(4) | | | (1.95 | )% | | | (1.72 | )%(7) | | | (1.64 | )%(7) |
| Ratio of net investment loss | | | | | | | | | | | | | | | | | | | | | | | | | |
| (after waiver or reimbursements) | | | | | | | | | | | | | | | | | | | | | | | | | |
| to average net assets | | | (2.36 | )%(4)(5) | | | (1.69 | )%(5) | | | (1.97 | )%(5) | | | (1.73 | )%(4)(5) | | | (1.55 | )%(5)(6) | | | (1.53 | )%(6) | | | (1.35 | )%(6) |
| Portfolio turnover rate | | | 21 | %(3) | | | 84 | % | | | 66 | % | | | 40 | %(3) | | | 115 | % | | | 165 | % | | | 216 | % |
_______________
| * | The Micro Cap Growth Fund’s predecessor fund had a fiscal year end of November 30, so the activity begins on December 1, 2012 and the numbers shown are for the nine month period. The fiscal year was changed to August 31 to align with the other Jacob Funds. |
(1) | The financial highlights set forth herein include the historical financial highlights of the Jacob Micro Cap Growth Fund (formerly, PineBridge US Micro Cap Growth Fund) series of Jacob Funds II (formerly, PineBridge Mutual Funds) (the “Predecessor Fund”). The Predecessor Fund was reorganized into the Micro Cap Growth Fund on November 12, 2012. On July 9, 2012, before the reorganization, the adviser changed from PineBridge Investments, LLC to Jacob Asset Management of New York LLC (the “Adviser”). Information prior to November 12, 2012 reflects the performance of the Predecessor Fund’s Class I shares. |
(2) | Net investment loss per share represents net investment loss divided by the average shares outstanding throughout the period. |
(3) | Not annualized. |
(4) | Annualized. |
(5) | The Adviser has contractually agreed, effective November 12, 2012 (date of reorganization) through January 2, 2017, to waive up to 100% of its advisory fee to the extent that the Fund’s gross operating expense ratio exceeds 2.15%, excluding any taxes, interest, brokerage fees, acquired fund fees and expenses, and extraordinary expenses. |
(6) | Prior to November 12, 2012, the previous adviser and the Adviser agreed to waive operating expenses over 1.60% of the Fund’s average daily net assets. |
(7) | Unaudited. |
The accompanying notes are an integral part of these financial statements.
JACOB FUNDS INC.
JACOB MICRO CAP GROWTH FUND – INVESTOR CLASS
FINANCIAL HIGHLIGHTS
The table below sets forth financial data for a share of the Fund outstanding throughout each period presented.
| | | Six Months | | | | | | | | | Nine Months | | | | | | | | | | |
| | | Ended | | | Year Ended | | | Ended | | | | | | | | | | |
| | | February 29, | | | August 31, | | | August 31, | | | Year Ended November 30, | |
| | | 2016 | | | 2015 | | | 2014 | | | 2013* | | | 2012(1) | | | 2011(1) | | | 2010(1) | |
| | | (Unaudited) | | | | | | | | | | | | | | | | | | | | | | | |
| Per Share Data: | | | | | | | | | | | | | | | | | | | | | | | | | |
Net asset value, beginning of period | | $ | 15.87 | | | $ | 19.73 | | | $ | 24.47 | | | $ | 18.51 | | | $ | 17.68 | | | $ | 17.36 | | | $ | 12.88 | |
| | | | | | | | | | | | | | | | | | | | | | | | | | | | | |
Income (loss) from investment operations: | | | | | | | | | | | | | | | | | | | | | | | | | | | | |
Net investment loss(2) | | | (0.17 | ) | | | (0.35 | ) | | | (0.49 | ) | | | (0.37 | ) | | | (0.37 | ) | | | (0.35 | ) | | | (0.25 | ) |
Net realized and unrealized gain (loss) on | | | | | | | | | | | | | | | | | | | | | | | | | | | | |
| investment transactions | | (2.97 | ) | | | 0.63 | | | | 0.71 | | | | 6.33 | | | | 1.20 | | | | 0.67 | | | | 4.73 | |
Total from investment operations | | | (3.14 | ) | | | 0.28 | | | | 0.22 | | | | 5.96 | | | | 0.83 | | | | 0.32 | | | | 4.48 | |
Less distributions from net realized gain | | | (3.29 | ) | | | (4.14 | ) | | | (4.96 | ) | | | — | | | | — | | | | — | | | | — | |
Paid in capital from redemption fees(3) | | | 0.00 | | | | 0.00 | | | | 0.00 | | | | 0.00 | | | | 0.00 | | | | 0.00 | | | | 0.00 | |
Net asset value, end of period | | $ | 9.44 | | | $ | 15.87 | �� | | $ | 19.73 | | | $ | 24.47 | | | $ | 18.51 | | | $ | 17.68 | | | $ | 17.36 | |
| Total return | | | (22.23 | )%(4) | | | 1.93 | % | | | (0.25 | )% | | | 32.20 | %(4) | | | 4.69 | % | | | 1.84 | % | | | 34.78 | % |
| | | | | | | | | | | | | | | | | | | | | | | | | | | | | |
| Supplemental data and ratios: | | | | | | | | | | | | | | | | | | | | | | | | | |
Net assets, end of period (in thousands) | | $ | 1,898 | | | $ | 2,603 | | | $ | 2,958 | | | $ | 3,573 | | | $ | 4,356 | | | $ | 9,339 | | | $ | 9,282 | |
| Ratio of gross operating expenses | | | | | | | | | | | | | | | | | | | | | | | | | |
| (prior to waiver or reimbursements) | | | | | | | | | | | | | | | | | | | | | | | | | |
| to average net assets | | | 4.01 | %(5) | | | 3.32 | % | | | 3.14 | % | | | 3.65 | %(5) | | | 2.47 | % | | | 2.12 | % | | | 2.24 | % |
| Ratio of net operating expenses | | | | | | | | | | | | | | | | | | | | | | | | | |
| (after waiver or reimbursements) | | | | | | | | | | | | | | | | | | | | | | | | | |
| to average net assets | | | 2.81 | %(5)(6) | | | 2.45 | %(6) | | | 2.45 | %(6) | | | 2.63 | %(5)(6) | | | 2.07 | %(6)(7) | | | 1.88 | %(7) | | | 1.90 | %(7) |
| Ratio of net investment loss | | | | | | | | | | | | | | | | | | | | | | | | | |
| (prior to waiver or reimbursements) | | | | | | | | | | | | | | | | | | | | | | | | | |
| to average net assets | | | (3.91 | )%(5) | | | (2.86 | )% | | | (2.96 | )% | | | (3.34 | )%(5) | | | (2.30 | )% | | | (2.05 | )%(8) | | | (2.01 | )%(8) |
| Ratio of net investment loss | | | | | | | | | | | | | | | | | | | | | | | | | |
| (after waiver or reimbursements) | | | | | | | | | | | | | | | | | | | | | | | | | |
| to average net assets | | | (2.71 | )%(5)(6) | | | (1.99 | )%(6) | | | (2.27 | )%(6) | | | (2.32 | )%(5)(6) | | | (1.90 | )%(6)(7) | | | (1.81 | )%(7) | | | (1.67 | )%(7) |
| Portfolio turnover rate | | | 21 | %(4) | | | 84 | % | | | 66 | % | | | 40 | %(4) | | | 115 | % | | | 165 | % | | | 216 | % |
_______________
| * | The Micro Cap Growth Fund’s predecessor fund had a fiscal year end of November 30, so the activity begins on December 1, 2012 and the numbers shown are for the nine month period. The fiscal year was changed to August 31 to align with the other Jacob Funds. |
(1) | The financial highlights set forth herein include the historical financial highlights of the Jacob Micro Cap Growth Fund (formerly, PineBridge US Micro Cap Growth Fund) series of Jacob Funds II (formerly, PineBridge Mutual Funds) (the “Predecessor Fund”). The Predecessor Fund was reorganized into the Micro Cap Growth Fund on November 12, 2012. On July 9, 2012, before the reorganization, the adviser changed from PineBridge Investments, LLC to Jacob Asset Management of New York LLC (the “Adviser”). Information prior to November 12, 2012 reflects the performance of the Predecessor Fund’s Class R shares. |
(2) | Net investment loss per share represents net investment loss divided by the average shares outstanding throughout the period. |
(3) | Less than $0.01 per share. |
(4) | Not annualized. |
(5) | Annualized. |
(6) | The Adviser has contractually agreed, effective November 12, 2012 (date of reorganization) through January 2, 2017, to waive up to 100% of its advisory fee to the extent that the Fund’s gross operating expense ratio exceeds 2.45%, excluding any taxes, interest, brokerage fees, acquired fund fees and expenses, and extraordinary expenses. |
(7) | Prior to November 12, 2012, the previous adviser and the Adviser agreed to waive operating expenses over 1.90% of the Fund’s average daily net assets. |
(8) | Unaudited. |
The accompanying notes are an integral part of these financial statements.
JACOB FUNDS INC.
JACOB WISDOM FUND – INVESTOR CLASS
FINANCIAL HIGHLIGHTS
The table below sets forth financial data for a share of the Fund outstanding throughout each period presented.
| | | Six Months | | | | | | | | | | | | | | | | |
| | | Ended | | | | | | | | | | | | | | | | |
| | | February 29, | | | Year Ended August 31, | |
| | | 2016 | | | 2015 | | | 2014 | | | 2013 | | | 2012 | | | 2011 | |
| | | (Unaudited) | | | | | | | | | | | | | | | | |
| | | | | | | | | | | | | | | | | | | |
| Per Share Data: | | | | | | | | | | | | | | | | | | |
| Net asset value, beginning of period | | $ | 12.24 | | | $ | 12.29 | | | $ | 10.62 | | | $ | 9.96 | | | $ | 8.81 | | | $ | 7.65 | |
| | | | | | | | | | | | | | | | | | | | | | | | | |
| Income (loss) from investment operations: | | | | | | | | | | | | | | | | | | | | | | | | |
| Net investment income (loss) | | | (0.05 | )(2) | | | (0.03 | )(1) | | | (0.02 | )(2) | | | 0.20 | (2) | | | 0.16 | (2) | | | 0.08 | (2) |
| Net realized and unrealized gain (loss) | | | | | | | | | | | | | | | | | | | | | | | | |
| on investment transactions | | | (0.39 | ) | | | (0.02 | ) | | | 1.88 | | | | 0.62 | | | | 1.08 | | | | 1.10 | |
| Total from investment operations | | | (0.44 | ) | | | (0.05 | ) | | | 1.86 | | | | 0.82 | | | | 1.24 | | | | 1.18 | |
| Less distributions from net investment income | | | — | | | | — | | | | (0.19 | ) | | | (0.16 | ) | | | (0.09 | ) | | | — | |
| Less distributions from net realized gain | | | (2.26 | ) | | | — | | | | — | | | | — | | | | — | | | | (0.02 | ) |
| Total distributions | | | (2.26 | ) | | | — | | | | (0.19 | ) | | | (0.16 | ) | | | (0.09 | ) | | | (0.02 | ) |
| Net asset value, end of period | | $ | 9.54 | | | $ | 12.24 | | | $ | 12.29 | | | $ | 10.62 | | | $ | 9.96 | | | $ | 8.81 | |
| Total return | | | (3.98 | )%(3) | | | (0.41 | )% | | | 17.60 | % | | | 8.40 | % | | | 14.08 | % | | | 15.40 | % |
| | | | | | | | | | | | | | | | | | | | | | | | | |
| Supplemental data and ratios: | | | | | | | | | | | | | | | | | | | | | | | | |
| Net assets, end of period (in thousands) | | $ | 7,268 | | | $ | 10,469 | | | $ | 11,278 | | | $ | 10,692 | | | $ | 10,642 | | | $ | 10,415 | |
| Ratio of gross operating expenses | | | | | | | | | | | | | | | | | | | | | | | | |
(prior to waiver or reimbursements) to average net assets | | | 3.05 | %(4) | | | 2.36 | % | | | 2.39 | % | | | 2.45 | % | | | 2.84 | % | | | 2.82 | % |
| Ratio of net operating expenses | | | | | | | | | | | | | | | | | | | | | | | | |
(after waiver or reimbursements) to average net assets(5) | | | 2.55 | %(4) | | | 1.95 | % | | | 1.95 | % | | | 1.95 | % | | | 2.34 | % | | | 2.32 | % |
| Ratio of net investment income (loss) | | | | | | | | | | | | | | | | | | | | | | | | |
(prior to waiver or reimbursements) to average net assets | | | (1.36 | )%(4) | | | (0.66 | )% | | | (0.67 | )% | | | 1.33 | % | | | 1.07 | % | | | 0.54 | % |
| Ratio of net investment income (loss) | | | | | | | | | | | | | | | | | | | | | | | | |
(after waiver or reimbursements) to average net assets(5) | | | (0.86 | )%(4) | | | (0.25 | )% | | | (0.23 | )% | | | 1.83 | % | | | 1.57 | % | | | 1.04 | % |
| Portfolio turnover rate | | | 14 | %(3) | | | 22 | % | | | 23 | % | | | 28 | % | | | 20 | % | | | 14 | % |
_______________
(1) | Net investment loss per share represents net investment loss divided by average shares outstanding throughout the period. |
(2) | Net investment income (loss) per share is calculated using ending balances prior to consideration of adjustments for permanent book and tax differences. |
(3) | Not annualized. |
(4) | Annualized. |
(5) | The Adviser has contractually agreed, effective February 18, 2010 through January 2, 2017 to waive up to 100% of its advisory fee to the extent that the Fund’s operating expense ratio exceeds 1.95%, excluding interest, taxes, brokerage fees, acquired fund fees and expenses, and extraordinary expenses. |
The accompanying notes are an integral part of these financial statements.
JACOB FUNDS INC.
NOTES TO THE FINANCIAL STATEMENTS
February 29, 2016 (Unaudited)
NOTE 1—DESCRIPTION OF ORGANIZATION
Jacob Funds Inc. (the “Corporation”) was organized as a Maryland corporation on July 13, 1999 and is registered under the Investment Company Act of 1940, as amended (the “1940 Act”), as an open-end management investment company issuing its shares in series. The Corporation currently consists of four “diversified” series, the Jacob Internet Fund (the “Internet Fund”), the Jacob Small Cap Growth Fund (the “Small Cap Growth Fund”), the Jacob Micro Cap Growth Fund (the “Micro Cap Growth Fund”) and the Jacob Wisdom Fund (the “Wisdom Fund”), each a “Fund”, collectively the “Funds”, and the authorized capital stock of the Corporation consists of twenty billion shares of stock having a par value of one-tenth of one cent ($0.001) per share. The primary investment objective of the Internet Fund is long-term growth of capital with current income as a secondary objective. The primary investment objective of the Small Cap Growth Fund and Micro Cap Growth Fund is long-term growth of capital. The primary investment objective of the Wisdom Fund is to maximize total investment return consisting of a combination of income and capital appreciation.
The Internet Fund commenced operations on December 14, 1999. The Small Cap Growth Fund commenced operations on February 1, 2010 when it acquired the assets and liabilities of the Rockland Small Cap Growth Fund series of Rockland Funds Trust in a reorganization transaction (the Small Cap Growth Fund is the successor fund to the Rockland Small Cap Growth Fund). The Small Cap Growth Fund acquired the Class I and Class R shares of the Jacob Small Cap Growth Fund II (formerly, PineBridge US Small Cap Growth Fund) series of Jacob Funds II (formerly, the PineBridge Mutual Funds) (the “Predecessor Small Cap Growth Fund”) on November 12, 2012. The Micro Cap Growth Fund commenced operations on November 12, 2012 when it acquired the assets and liabilities of the Jacob Micro Cap Growth Fund (formerly, PineBridge US Micro Cap Growth Fund) series of Jacob Funds II (the “Predecessor Micro Cap Growth Fund”) in a reorganization transaction (the Micro Cap Growth Fund is the successor fund to the Predecessor Micro Cap Growth Fund). The Wisdom Fund commenced operations on February 18, 2010 when it acquired the assets and liabilities of the Wisdom Fund series of New Providence Investment Trust (the “Predecessor Wisdom Fund”) in a reorganization transaction (the Wisdom Fund is the successor fund to the Predecessor Wisdom Fund).
The Internet Fund and Wisdom Fund currently offer Investor Class shares. The Small Cap Growth Fund and Micro Cap Growth Fund currently offer Investor Class and Institutional Class shares. Each share of each class of a Fund represents an equal pro rata interest in such Fund and provides the shareholder the same voting, dividend, and other rights, except that shareholders of each class of a Fund have exclusive voting rights regarding any matter relating solely to that particular class. Shareholders may be charged a redemption fee of 2% if the shares are redeemed within 30 days of initial investment.
NOTE 2—SIGNIFICANT ACCOUNTING POLICIES
The following is a summary of significant accounting policies consistently followed by the Funds. These policies are in conformity with accounting principles generally accepted in the United States of America (“GAAP”).
| | (a) Investment Valuation—Investment securities traded on a national securities exchange are valued at their market value determined by their last sales price in the principal market in which these securities are normally traded (except those traded on the NASDAQ National Market and Capital Market exchanges which are valued at the NASDAQ Official Closing Price (“NOCP”)), unless there are no transactions on the valuation date, in which case they are valued at the mean between the closing bid and ask prices. Securities traded over-the-counter are valued at the last reported sales price unless there is no reported sales price, in which case the mean between the closing bid and ask prices is used. Foreign securities, currencies and other assets denominated in foreign currencies are |
JACOB FUNDS INC.
NOTES TO THE FINANCIAL STATEMENTS (Continued)
February 29, 2016 (Unaudited)
| | translated into U.S. dollars at the exchange rate of such currencies. Foreign equity securities are valued at the last sale price at the close of the exchange on which the security is principally traded. Debt securities with maturities of 60 days or less are valued at amortized cost, which approximates market value. Short-term securities with 60 days or less remaining to maturity are, unless conditions indicate otherwise, amortized to maturity based on their cost to a Fund if acquired within 60 days of maturity or, if already held by a Fund on the 60th day, based on the value determined on the 61st day. If amortized cost does not approximate fair value, short-term securities are reported at fair value. Where market quotations are not readily available, are unreliable or when values have been materially affected by events occurring before the close of U.S. markets but after the close of the securities’ primary markets, securities are valued at fair value using procedures approved by the Board of Directors that are designed to determine a security’s fair value. |
| | The Funds adhere to fair valuation accounting standards which provide an authoritative definition of fair value and set out a hierarchy for measuring fair value. These standards require disclosures about the various inputs and valuation techniques used to develop the measurements of fair value and a discussion in changes in valuation techniques and related inputs during the period. These standards define fair value as the price that would be received to sell an asset or paid to transfer a liability in an orderly transaction between market participants at the measurement date. The fair value hierarchy is organized into three levels based upon the assumptions (referred to as “inputs”) used in pricing the asset or liability. These standards state that “observable inputs” reflect the assumptions market participants would use in pricing the asset or liability based on market data obtained from independent sources and “unobservable inputs” reflect an entity’s own assumptions about the assumptions market participants would use in pricing the asset or liability. |
| | Summary of Fair Value Exposure |
| | Various inputs are used in determining the value of the Funds’ investments. These inputs are summarized in the three broad levels listed below: |
| | Level 1— | Unadjusted quoted prices in active markets for identical assets or liabilities that the Funds have the ability to access. |
| | Level 2— | Observable inputs other than quoted prices included in Level 1 that are observable for the asset or liability, either directly or indirectly. These inputs may include quoted prices for the identical instrument in an inactive market, prices for similar instruments, interest rates, prepayment speeds, credit risk, yield curves, default rates and similar data. |
| | Level 3— | Unobservable inputs for the asset or liability, to the extent relevant observable inputs are not available, representing the Funds’ own assumptions about the assumptions a market participant would use in valuing the asset or liability, and based on the best information available. |
| | The inputs or methodology used for valuing securities are not necessarily an indication of the risk associated with investing in those securities. |
JACOB FUNDS INC.
NOTES TO THE FINANCIAL STATEMENTS (Continued)
February 29, 2016 (Unaudited)
| | The following is a summary of the inputs used to value the Internet Fund’s investments as of February 29, 2016: |
| | | | Level 1 | | | Level 2 | | | Level 3 | | | Total | |
| | Common Stock | | | | | | | | | | | | |
| | Internet—Commerce | | $ | 3,830,084 | | | $ | — | | | $ | — | | | $ | 3,830,084 | |
| | Internet—Infrastructure | | | 13,937,396 | | | | — | | | | — | | | | 13,365,916 | |
| | Internet—Media | | | 14,527,330 | | | | 1,555,290 | | | | — | | | | 16,654,100 | |
| | Total Common Stock | | | 32,294,810 | | | | 1,555,290 | | | | — | | | | 33,850,100 | |
| | Short Term Investment | | | | | | | | | | | | | | | | |
| | Money Market Fund | | | 694,011 | | | | — | | | | — | | | | 694,011 | |
| | Total Investments in Securities | | $ | 32,988,821 | | | $ | 1,555,290 | | | $ | — | | | $ | 34,544,111 | |
| | There were no transfers into or out of Level 1, Level 2 or Level 3 fair value measurements during the reporting period, as compared to their classification from the most recent annual report. |
| | The following is a summary of the inputs used to value the Small Cap Growth Fund’s investments as of February 29, 2016: |
| | | | Level 1 | | | Level 2 | | | Level 3 | | | Total | |
| | Common Stock | | | | | | | | | | | | |
| | Biotech & Pharmaceuticals | | $ | 2,147,486 | | | $ | — | | | $ | — | | | $ | 2,147,486 | |
| | Chemicals | | | 261,821 | | | | — | | | | — | | | | 261,821 | |
| | Energy—Exploration & Production | | | 665,712 | | | | — | | | | — | | | | 665,712 | |
| | Financial | | | 271,653 | | | | — | | | | — | | | | 271,653 | |
| | Industrial | | | 1,099,262 | | | | — | | | | — | | | | 1,099,262 | |
| | Medical Devices | | | 730,984 | | | | — | | | | — | | | | 730,984 | |
| | Retail & Restaurants | | | 796,978 | | | | — | | | | — | | | | 796,978 | |
| | Technology—Hardware | | | 196,100 | | | | — | | | | — | | | | 196,100 | |
| | Technology—Software & Services | | | 4,496,863 | | | | — | | | | — | | | | 4,496,863 | |
| | Total Common Stock | | | 10,666,859 | | | | — | | | | — | | | | 10,666,859 | |
| | Short Term Investment | | | | | | | | | | | | | | | | |
| | Money Market Fund | | | 42,057 | | | | — | | | | — | | | | 42,057 | |
| | Total Investments in Securities | | $ | 10,708,916 | | | $ | — | | | $ | — | | | $ | 10,708,916 | |
| | There were no transfers into or out of Level 1, Level 2 or Level 3 fair value measurements during the reporting period, as compared to their classification from the most recent annual report. |
JACOB FUNDS INC.
NOTES TO THE FINANCIAL STATEMENTS (Continued)
February 29, 2016 (Unaudited)
| | The following is a summary of the inputs used to value the Micro Cap Growth Fund’s investments as of February 29, 2016: |
| | | | Level 1 | | | Level 2 | | | Level 3 | | | Total | |
| | Common Stock | | | | | | | | | | | | |
| | Biotech & Pharmaceuticals | | $ | 1,226,148 | | | $ | — | | | $ | — | | | $ | 1,226,148 | |
| | Chemicals | | | 185,885 | | | | — | | | | — | | | | 185,885 | |
| | Energy—Exploration & Production | | | 294,384 | | | | — | | | | — | | | | 294,384 | |
| | Financial | | | 202,689 | | | | — | | | | — | | | | 202,689 | |
| | Food & Beverages | | | 350,016 | | | | — | | | | — | | | | 350,016 | |
| | Industrial | | | 259,876 | | | | — | | | | — | | | | 259,876 | |
| | Medical Devices | | | 1,074,495 | | | | — | | | | — | | | | 1,074,495 | |
| | Retail & Restaurants | | | 604,017 | | | | — | | | | — | | | | 604,017 | |
| | Technology—Hardware | | | 480,578 | | | | — | | | | — | | | | 480,578 | |
| | Technology—Software & Services | | | 3,441,373 | | | | — | | | | — | | | | 3,441,373 | |
| | Total Common Stock | | | 8,119,461 | | | | — | | | | — | | | | 8,119,461 | |
| | Short Term Investment | | | | | | | | | | | | | | | | |
| | Money Market Fund | | | 91,134 | | | | — | | | | — | | | | 91,134 | |
| | Total Investments in Securities | | $ | 8,210,595 | | | $ | — | | | $ | — | | | $ | 8,210,595 | |
| | There were no transfers into or out of Level 1, Level 2 or Level 3 fair value measurements during the reporting period, as compared to their classification from the most recent annual report. |
JACOB FUNDS INC.
NOTES TO THE FINANCIAL STATEMENTS (Continued)
February 29, 2016 (Unaudited)
| | The following is a summary of the inputs used to value the Wisdom Fund’s investments as of February 29, 2016: |
| | | | | | | | | | | | | | |
| | | | Level 1 | | | Level 2 | | | Level 3 | | | Total | |
| | Common Stock | | | | | | | | | | | | |
| | Beverages | | $ | 592,404 | | | $ | — | | | $ | — | | | $ | 592,404 | |
| | Cable/Satellite TV | | | 172,608 | | | | — | | | | — | | | | 172,608 | |
| | Commercial Banks | | | 96,165 | | | | — | | | | — | | | | 96,165 | |
| | Commercial Services & Supplies | | | 694,341 | | | | — | | | | — | | | | 694,341 | |
| | Consumer Finance | | | 425,778 | | | | — | | | | — | | | | 425,778 | |
| | Consumer Non—Cyclical | | | 218,472 | | | | — | | | | — | | | | 218,472 | |
| | Food Products | | | 685,959 | | | | — | | | | — | | | | 685,959 | |
| | Health Care Equipment & Supplies | | | 485,374 | | | | — | | | | — | | | | 485,374 | |
| | Hotels, Restaurants & Leisure | | | 281,256 | | | | — | | | | — | | | | 281,256 | |
| | Insurance | | | 80,502 | | | | — | | | | — | | | | 80,502 | |
| | Machinery | | | 344,433 | | | | — | | | | — | | | | 344,433 | |
| | Oil, Gas & Consumable Fuels | | | 269,430 | | | | — | | | | — | | | | 269,430 | |
| | Pharmaceuticals | | | 392,625 | | | | — | | | | — | | | | 392,625 | |
| | Technology—Hardware & Software | | | 464,112 | | | | — | | | | — | | | | 464,112 | |
| | Textiles, Apparel & Luxury Goods | | | 943,608 | | | | — | | | | — | | | | 943,608 | |
| | Total Common Stock | | | 6,147,067 | | | | — | | | | — | | | | 6,147,067 | |
| | Short Term Investment | | | | | | | | | | | | | | | | |
| | Money Market Fund | | | 1,226,425 | | | | — | | | | — | | | | 1,226,425 | |
| | Total Investments in Securities | | $ | 7,373,492 | | | $ | — | | | $ | — | | | $ | 7,373,492 | |
| | There were no transfers into or out of Level 1, Level 2 or Level 3 fair value measurements during the reporting period, as compared to their classification from the most recent annual report. |
| | (b) Income Recognition—Interest income is accrued as earned. Dividend income is recorded on the ex-dividend date. All discounts and premiums are amortized using the effective interest method for tax and financial reporting purposes. |
| | (c) Expenses—Expenses that are not attributable to a particular Fund are typically allocated in proportion to each Fund’s respective net assets. Expenses are allocated to a particular share class in proportion to each class’s respective net assets. Expenses are recorded on an accrual basis. |
| | (d) Securities Transactions—Security transactions are accounted for on trade date. Realized gains and losses on securities sold are determined using specific identification. |
| | (e) Foreign Currency Transactions—The books and records are maintained in U.S. dollars. Foreign currency denominated transactions (i.e., market value of investment securities, assets and liabilities, purchases and sales of investment securities, and income and expenses) are translated into U.S. dollars at the current rate of exchange. |
| | The Funds do not isolate that portion of the results of operations resulting from changes in foreign exchange rates on investments from the fluctuations arising from changes in market prices of securities held. Such fluctuations are included with the net realized and unrealized gain or loss from investments. |
| | (f) Distributions to Shareholders—The Funds record distributions to shareholders on the ex-dividend date. Dividends from net investment income, if any, are declared and paid annually. Distributions of net realized capital |
JACOB FUNDS INC.
NOTES TO THE FINANCIAL STATEMENTS (Continued)
February 29, 2016 (Unaudited)
| | gains, if any, will be declared and distributed annually. The amounts of distributions from net investment income and net realized capital gains are determined in accordance with federal income tax regulations, which may differ from those amounts determined under GAAP. These book/tax differences are either temporary or permanent in nature. To the extent these differences are permanent, reclassifications are made in the capital accounts in the period that the differences arise. The reclassifications have no effect on net assets or net asset value per share. |
| | (g) Federal Income Taxes—The Funds comply with provisions of Subchapter M of the Internal Revenue Code applicable to regulated investment companies, including the distribution of substantially all of the Funds’ taxable income. Accordingly, no provision for federal income taxes is considered necessary in the financial statements. |
| | The Funds follow accounting standards regarding recognition and measurement of tax positions taken on a tax return. No material uncertain tax positions existed as of February 29, 2016. As a result, the Funds have not recorded any liabilities for uncertain tax positions as of February 29, 2016. The standards require the Funds to analyze all open tax years, as defined by the Statute of Limitations, for all major jurisdictions. Open tax years are those that are open for examinations by taxing authorities. As of February 29, 2016, open federal tax years include the tax years ended August 31, 2012 through August 31, 2015 for the Internet Fund, the tax years ended August 31, 2012 through August 31, 2015 for the Small Cap Growth Fund, the tax year ended November 30, 2012, and the tax years ended August 31, 2013 through August 31, 2015 for the Micro Cap Growth Fund, and the tax years ended August 31, 2012 through August 31, 2015 for the Wisdom Fund. |
| | (h) Use of Estimates—The preparation of financial statements in conformity with GAAP requires management to make estimates and assumptions that affect the reported amount of assets and liabilities and disclosure of contingent assets and liabilities at the date of the financial statements and the reported amounts of revenues and expenses during the reporting period. Actual results could differ from those estimates. |
| | (i) Contingencies and Commitments—The Funds indemnify the Corporation’s Officers and Directors for certain liabilities that might arise from their performance of their duties to the Funds. Additionally, in the normal course of business, the Funds enter into contracts that contain a variety of representations and warranties and which provide general indemnifications. Each Fund’s maximum exposure under these arrangements is unknown, as this would involve future claims that may be made against the Funds that have not yet occurred. However, based on experience, the Corporation expects the risk of loss to be remote. |
JACOB FUNDS INC.
NOTES TO THE FINANCIAL STATEMENTS (Continued)
February 29, 2016 (Unaudited)
NOTE 3—CAPITAL SHARE TRANSACTIONS
At February 29, 2016, there were twenty billion shares, $0.001 par value, authorized for the Corporation. Transactions in shares of the Internet Fund were as follows:
| | | | Six Months Ended | | | Year Ended | |
| | | | February 29, 2016 | | | August 31, 2015 | |
| | | | Shares | | | Amount | | | Shares | | | Amount | |
| | Sales | | | 316,201 | | | $ | 1,297,518 | | | | 584,434 | | | $ | 2,483,271 | |
| | Reinvestments | | | 1,216,005 | | | | 4,560,019 | | | | 1,060,190 | | | | 4,102,934 | |
| | Redemptions | | | (1,088,090 | ) | | | (4,089,372 | ) | | | (1,919,819 | ) | | | (7,882,988 | ) |
| | Redemption fees | | | — | | | | 304 | | | | — | | | | 3,453 | |
| | Net increase (decrease) | | | 444,116 | | | $ | 1,768,469 | | | | (275,195 | ) | | $ | (1,293,330 | ) |
| | Shares Outstanding: | | | | | | | | | | | | | | | | |
| | Beginning of period | | | 9,824,592 | | | | | | | | 10,099,787 | | | | | |
| | End of period | | | 10,268,708 | | | | | | | | 9,824,592 | | | | | |
Transactions in shares of the Small Cap Growth Fund were as follows:
| Institutional Class | | | | | | |
| | | | Six Months Ended | | | Year Ended | |
| | | | February 29, 2016 | | | August 31, 2015 | |
| | | | Shares | | | Amount | | | Shares | | | Amount | |
| | Sales | | | 1,336 | | | $ | 21,432 | | | | 6,729 | | | $ | 144,622 | |
| | Reinvestments | | | 2,940 | | | | 47,242 | | | | — | | | | — | |
| | Redemptions | | | (23,974 | ) | | | (393,178 | ) | | | (47,037 | ) | | | (947,131 | ) |
| | Net decrease | | | (19,698 | ) | | $ | (324,504 | ) | | | (40,308 | ) | | $ | (802,509 | ) |
| | Shares Outstanding: | | | | | | | | | | | | | | | | |
| | Beginning of period | | | 494,402 | | | | | | | | 534,710 | | | | | |
| | End of period | | | 474,704 | | | | | | | | 494,402 | | | | | |
Investor Class
| | | | Six Months Ended | | | Year Ended | |
| | | | February 29, 2016 | | | August 31, 2015 | |
| | | | Shares | | | Amount | | | Shares | | | Amount | |
| | Sales | | | 7,759 | | | $ | 116,833 | | | | 375,263 | | | $ | 8,159,502 | |
| | Reinvestments | | | 1,997 | | | | 31,859 | | | | — | | | | — | |
| | Redemptions | | | (162,039 | ) | | | (2,617,723 | ) | | | (226,370 | ) | | | (4,746,629 | ) |
| | Redemption fees | | | — | | | | 6 | | | | — | | | | 11,182 | |
| | Net increase (decrease) | | | (152,283 | ) | | $ | (2,469,025 | ) | | | 148,893 | | | $ | 3,424,055 | |
| | Shares Outstanding: | | | | | | | | | | | | | | | | |
| | Beginning of period | | | 491,650 | | | | | | | | 342,757 | | | | | |
| | End of period | | | 339,367 | | | | | | | | 491,650 | | | | | |
| | Total increase (decrease) | | | | | | | | | | | | | | | | |
| | for the Fund | | | | | | $ | (2,793,529 | ) | | | | | | $ | 2,621,546 | |
JACOB FUNDS INC.
NOTES TO THE FINANCIAL STATEMENTS (Continued)
February 29, 2016 (Unaudited)
Transactions in shares of the Micro Cap Growth Fund were as follows:
Institutional Class
| | | | Six Months Ended | | | Year Ended | |
| | | | February 29, 2016 | | | August 31, 2015 | |
| | | | Shares | | | Amount | | | Shares | | | Amount | |
| | Sales | | | 1,791 | | | $ | 28,200 | | | | 24,649 | | | $ | 498,357 | |
| | Reinvestments | | | 130,331 | | | | 1,510,537 | | | | 104,310 | | | | 1,711,733 | |
| | Redemptions | | | (31,894 | ) | | | (409,536 | ) | | | (99,029 | ) | | | (1,921,202 | ) |
| | Net increase | | | 100,228 | | | $ | 1,129,201 | | | | 29,930 | | | $ | 288,888 | |
| | Shares Outstanding: | | | | | | | | | | | | | | | | |
| | Beginning of period | | | 513,217 | | | | | | | | 483,287 | | | | | |
| | End of period | | | 613,445 | | | | | | | | 513,217 | | | | | |
Investor Class
| | | | Six Months Ended | | | Year Ended | |
| | | | February 29, 2016 | | | August 31, 2015 | |
| | | | Shares | | | Amount | | | Shares | | | Amount | |
| | Sales | | | 4,868 | | | $ | 56,639 | | | | 18,187 | | | $ | 324,269 | |
| | Reinvestments | | | 45,459 | | | | 486,409 | | | | 35,365 | | | | 547,457 | |
| | Redemptions | | | (13,286 | ) | | | (175,268 | ) | | | (39,414 | ) | | | (690,211 | ) |
| | Redemption fees | | | — | | | | 2 | | | | — | | | | 498 | |
| | Net increase | | | 37,041 | | | $ | 367,782 | | | | 14,138 | | | $ | 182,013 | |
| | Shares Outstanding: | | | | | | | | | | | | | | | | |
| | Beginning of period | | | 164,068 | | | | | | | | 149,930 | | | | | |
| | End of period | | | 201,109 | | | | | | | | 164,068 | | | | | |
| | | | | | | | | | | | | | | | | | |
| | Total increase | | | | | | | | | | | | | | | | |
| | for the Fund | | | | | | $ | 1,496,983 | | | | | | | $ | 470,901 | |
| Transactions in shares of the Wisdom Fund were as follows: |
| | | | Six Months Ended | | | Year Ended | |
| | | | February 29, 2016 | | | August 31, 2015 | |
| | | | Shares | | | Amount | | | Shares | | | Amount | |
| | Sales | | | 20,655 | | | $ | 206,540 | | | | 12,956 | | | $ | 162,144 | |
| | Reinvestments | | | 125,018 | | | | 1,215,172 | | | | — | | | | — | |
| | Redemptions | | | (239,334 | ) | | | (2,850,619 | ) | | | (75,560 | ) | | | (949,943 | ) |
| | Redemption fees | | | — | | | | 4 | | | | — | | | | 21 | |
| | Net decrease | | | (93,661 | ) | | $ | (1,428,903 | ) | | | (62,604 | ) | | $ | (787,778 | ) |
| | Shares Outstanding: | | | | | | | | | | | | | | | | |
| | Beginning of period | | | 855,439 | | | | | | | | 918,043 | | | | | |
| | End of period | | | 761,778 | | | | | | | | 855,439 | | | | | |
JACOB FUNDS INC.
NOTES TO THE FINANCIAL STATEMENTS (Continued)
February 29, 2016 (Unaudited)
A 2% redemption fee is assessed on any shares of the Funds, except those received from reinvested distributions, that are sold within 30 days following their purchase date.
From time to time, the Funds may have a concentration of shareholders holding a significant percentage of shares outstanding. Investment activities of these shareholders could have a material impact on the Funds. The following table shows the number of shareholders owning greater than 10% of the outstanding shares in each of the Funds at February 29, 2016:
| | | Number of shareholders owning greater |
| | Fund | than 10% of outstanding Fund shares |
| | Internet Fund | 2 |
| | Small Cap Growth Fund Institutional Class | 2 |
| | Small Cap Growth Fund Investor Class | 1 |
| | Micro Cap Growth Fund Institutional Class | 2 |
| | Wisdom Fund | 2 |
NOTE 4—INVESTMENT TRANSACTIONS
During the six months ended February 29, 2016, purchases and sales of investment securities (excluding short-term investments) for the Funds were as follows:
| | Fund | | Purchases | | | Sales | |
| | Internet Fund | | $ | 10,537,527 | | | $ | 13,463,454 | |
| | Small Cap Growth Fund | | | 4,829,458 | | | | 7,898,867 | |
| | Micro Cap Growth Fund | | | 1,936,348 | | | | 1,915,436 | |
| | Wisdom Fund | | | 1,039,762 | | | | 3,156,069 | |
The Funds did not purchase long-term U.S. Government securities as a part of their investment strategies during the six months ended February 29, 2016.
NOTE 5—TAX INFORMATION
At August 31, 2015, the components of accumulated earnings/(losses) on a tax basis for the Funds were as follows:
| | | | Internet | | | Small Cap | | | Micro Cap | | | Wisdom | |
| | | | Fund | | | Growth Fund | | | Growth Fund | | | Fund | |
| | Cost of Investments | | $ | 30,508,742 | | | $ | 19,753,156 | | | $ | 13,527,085 | | | $ | 8,014,045 | |
| | Gross unrealized appreciation | | | 12,966,202 | | | | 3,501,919 | | | | 915,166 | | | | 2,911,641 | |
| | Gross unrealized depreciation | | | (4,368,318 | ) | | | (4,661,274 | ) | | | (2,978,842 | ) | | | (421,206 | ) |
| | Net unrealized appreciation (depreciation) | | $ | 8,597,884 | | | $ | (1,159,355 | ) | | $ | (2,063,676 | ) | | $ | 2,490,435 | |
| | Undistributed ordinary income | | | — | | | | — | | | | 850,202 | | | | — | |
| | Undistributed long-term capital gains | | | 4,682,010 | | | | — | | | | 1,315,201 | | | | 1,341,114 | |
| | Total distributable earnings | | $ | 4,682,010 | | | $ | — | | | $ | 2,165,403 | | | $ | 1,341,114 | |
| | Other accumulated losses | | $ | (542,126 | ) | | $ | (3,014,318 | ) | | $ | (847,075 | ) | | $ | (19,664 | ) |
| | Total accumulated earnings/(losses) | | $ | 12,737,768 | | | $ | (4,173,673 | ) | | $ | (745,348 | ) | | $ | 3,811,885 | |
JACOB FUNDS INC.
NOTES TO THE FINANCIAL STATEMENTS (Continued)
February 29, 2016 (Unaudited)
At August 31, 2015, the Internet Fund, Small Cap Growth Fund and Wisdom Fund deferred, on a tax basis, post December ordinary losses of $542,126, $267,559 and $19,664, respectively.
The differences between cost amounts for book purposes and tax purposes are primarily due to the tax deferral of losses on wash sales and PFICs. At August 31, 2015, the Funds had accumulated net realized capital loss carryovers as follows:
| | Small Cap | | | Micro Cap | | | |
| | Growth Fund | | | Growth Fund | | Expiration | |
| | $ | 437,139 | | | $ | 423,537 | | 8/31/2016 | |
| | | 1,515,745 | | | | 423,537 | | 8/31/2017 | |
| | | 793,875 | | | | — | | 8/31/2018 | |
| | $ | 2,746,759 | | | $ | 847,074 | | | |
To the extent the Funds realize future net capital gains, taxable distributions to its shareholders will be offset by any unused capital loss carryover. For the year ended August 31, 2015, the Small Cap Growth Fund, Micro Cap Growth Fund and Wisdom Fund utilized capital loss carryforwards of $2,723,083, $423,537 and $147,197, respectively.
Due to the rule under Section 382 of the Internal Revenue Code, the Micro Cap Growth Fund’s capital loss carryforward of $847,074 is subject to annual limitations over the next two years. The Fund will only be able to utilize $423,537 each year for the next 2 years.
The Internet Fund paid $4,682,043 out of long-term capital gains for the six months ended February 29, 2016 and paid $4,292,552 out of long-term capital gains during the fiscal year ended August 31, 2015. The Small Cap Growth Fund paid $86,651 out of ordinary income and made no distributions during the fiscal year ended August 31, 2015. The Micro Cap Growth Fund paid $1,214,024 out of long-term capital gains and $944,952 out of short-term capital gains (ordinary income) during the six months ended February 29, 2016. The Micro Cap Growth Fund paid $2,402,191 out of long-term capital gains and $71,309 out of short-term capital gains (ordinary income) during the fiscal year ended August 31, 2015. The Wisdom Fund paid $1,441,098 out of long-term capital gains during the six months ended February 29, 2016 and made no distributions during the fiscal year ended August 31, 2015.
NOTE 6—INVESTMENT ADVISORY AND OTHER AGREEMENTS
The Corporation has entered into Investment Advisory Agreements (the “Advisory Agreements”) with Jacob Asset Management of New York LLC (the “Adviser”), with whom certain Officers and a Director of the Board are affiliated, to furnish investment advisory services to the Funds. Under the terms of the Advisory Agreements, the Corporation, on behalf of the Funds, compensates the Adviser for its management services based on an annual rate of 1.25% of the Internet Fund’s average daily net assets up to $500 million and 1.00% of annual average net assets over $500 million; 0.90% of the Small Cap Growth Fund’s average daily net assets up to $500 million and 0.75% of annual average daily net assets over $500 million; 1.20% of the Micro Cap Growth Fund’s average daily net assets up to $500 million and 0.95% of annual average daily net assets over $500 million; and 0.50% of the Wisdom Fund’s average daily net assets up to $500 million and 0.40% of annual average daily net assets over $500 million.
The Adviser has contractually agreed to waive its advisory fees in an amount up to an annual rate of 0.10% of the Internet Fund’s average daily net assets to the extent the Internet Fund’s total annual operating expenses (excluding
JACOB FUNDS INC.
NOTES TO THE FINANCIAL STATEMENTS (Continued)
February 29, 2016 (Unaudited)
any taxes, interest, brokerage fees, acquired fund fees and expenses and extraordinary expenses) exceed 2.95% of the average daily net assets through January 2, 2017. The Adviser has the ability to recoup amounts waived for a period of three years following such fee waivers to the extent that such recoupment by the Adviser will not cause the Internet Fund to exceed any applicable expense limitation in place when the fee was waived. For the six months ended February 29, 2016, the Adviser did not waive any fees with respect to the Internet Fund.
The Adviser contractually agreed to waive its advisory fees in an amount up to an annual rate of 0.90% of the Small Cap Growth Fund’s average daily net assets, to the extent that the Fund’s total annual operating expenses (excluding any taxes, interest, brokerage fees, acquired fund fees and expenses and extraordinary expenses) exceed 2.45% of average daily net assets through November 11, 2012. The Adviser has the ability to recoup amounts waived for a period of three years following such fee waivers to the extent that such recoupment by the Adviser will not cause the Small Cap Growth Fund’s expenses to exceed 2.45%.
Effective November 12, 2012 (date of reorganization of the Predecessor Small Cap Growth Fund into the Small Cap Growth Fund) the Adviser contractually agreed to waive up to 100% of its advisory fee to the extent the Fund’s total annual operating expenses (excluding any taxes, interest, brokerage fees, acquired fund fees and expenses and extraordinary expenses) exceed 2.25% and 1.95% for Investor Class and Institutional Class Shares, respectively, of each class’ average daily net assets through January 2, 2017. The Adviser has the ability to recoup amounts waived for a period of three years following such fee waivers to the extent that such recoupment by the Adviser will not cause the Fund to exceed any applicable expense limitation in place when the fee was waived. For the six months ended February 29, 2016, fees of $47,997 were waived by the Adviser with respect to the Small Cap Growth Fund.
Effective November 12, 2012 (date of reorganization of the Predecessor Micro Cap Growth Fund into the Micro Cap Growth Fund) the Adviser contractually agreed to waive up to 100% of its advisory fee to the extent the Micro Cap Growth Fund’s total annual operating expenses (excluding any taxes, interest, brokerage fees, acquired fund fees and expenses and extraordinary expenses) exceed 2.45% and 2.15% for Investor Class and Institutional Class Shares, respectively, of each class’ average daily net assets through January 2, 2017. The Adviser has the ability to recoup amounts waived for a period of three years following such fee waivers to the extent that such recoupment by the Adviser will not cause the Fund to exceed any applicable expense limitation in place when the fee was waived. For the six months ended February 29, 2016, fees of $57,121 were waived by the Adviser with respect to the Micro Cap Growth Fund.
The Adviser has contractually agreed to waive up to 100% of its advisory fee to the extent that the Wisdom Fund’s total annual operating expenses (excluding any taxes, interest brokerage fees, acquired fund fees and expenses and extraordinary expenses) exceed 1.95% of average daily net assets through January 2, 2017. The Adviser has the ability to recoup amounts waived for a period of three years following such fee waivers to the extent that such recoupment by the Adviser will not cause the Fund to exceed any applicable expense limitation in place when the fee was waived. For the six months ended February 29, 2016, fees of $19,652 were waived by the Adviser with respect to the Wisdom Fund.
JACOB FUNDS INC.
NOTES TO THE FINANCIAL STATEMENTS (Continued)
February 29, 2016 (Unaudited)
Following is a schedule of when fees may be recouped:
| | Small Cap | | | Micro Cap | | | Wisdom | | | |
| | Growth Fund | | | Growth Fund | | | Fund | | Expiration | |
| | $ | 59,468 | | | $ | 104,217 | | | $ | 53,874 | | August 31, 2016 | |
| | | 54,689 | | | | 92,043 | | | | 50,192 | | August 31, 2017 | |
| | | 43,660 | | | | 103,627 | | | | 46,774 | | August 31, 2018 | |
| | | 47,997 | | | | 57,121 | | | | 19,652 | | August 31, 2019 | |
| | $ | 205,814 | | | $ | 357,008 | | | $ | 170,492 | | | |
U.S. Bancorp Fund Services, LLC serves as transfer agent, administrator and accounting services agent for the Funds. U.S. Bank, N.A. serves as custodian for the Funds. All providers receive customary fees for services rendered.
NOTE 7—DISTRIBUTION AND SERVICE PLAN
The Corporation, on behalf of the Internet Fund, has adopted a distribution and service plan (the “Internet Fund Plan”), pursuant to Rule 12b-1 under the 1940 Act. The Internet Fund Plan provides that the Internet Fund will compensate the Adviser 0.25% per annum of the Internet Fund’s average daily net assets for certain expenses and costs incurred in connection with providing shareholder servicing and maintaining shareholder accounts and to compensate parties with which it has written agreements and whose clients own shares of the Internet Fund for providing servicing to their clients (“Shareholder Servicing Fee”). The Internet Fund Plan also provides for a distribution fee equal to 0.10% of the Internet Fund’s average daily net assets on an annual basis (“Asset Based Sales Charge”). The fee is used to compensate Quasar Distributors, LLC, the Funds’ distributor (the “Distributor”), for basic distribution services, out of pocket expenses incurred in connection with activities to sell Internet Fund shares, advertising, compliance reviews, and licensing of the Adviser’s staff. The Distributor may make payments from time to time from the Asset Based Sales Charge to broker-dealers and other financial professionals whose clients are Internet Fund shareholders for providing distribution assistance and promotional support to the Internet Fund. Remaining amounts of the Asset Based Sales Charge may be used to satisfy distribution costs as directed by the Adviser. The Internet Fund incurred $67,201 in expenses pursuant to the 12b-1 Plan for the six months ended February 29, 2016.
The Corporation, on behalf of the Small Cap Growth Fund, Micro Cap Growth Fund and Wisdom Fund, has adopted a distribution and service plan (the “Plan”) pursuant to Rule 12b-1 under the 1940 Act. Rule 12b-1 provides that an investment company that bears any direct or indirect expense of distributing its shares must do so only in accordance with the Plan as permitted by Rule 12b-1. Pursuant to the Plan, the Small Cap Growth Fund, Micro Cap Growth Fund and Wisdom Fund make payments to the Distributor, the Adviser, financial intermediaries or others to reimburse such parties for distribution and/or shareholder servicing activity in an amount not to exceed 0.35% of the average daily net assets on an annual basis. The distribution fees are “asset based” sales charges and, therefore, long-term shareholders may pay more in total sales charges than the economic equivalent of the maximum front-end sales charge permitted by the Financial Industry Regulatory Authority (FINRA). The Small Cap Growth Fund incurred $11,166, the Micro Cap Growth Fund incurred $3,839 and the Wisdom Fund incurred $11,337 in expenses pursuant to the Plan for the six months ended February 29, 2016.
Effective January 4, 2016, the Board approved the reduction of fees payable under the distribution and service plan of the Wisdom Fund from 0.35% to 0.15% per annum of the Wisdom Fund’s average daily net assets through at least January 2, 2017.
JACOB FUNDS INC.
NOTES TO THE FINANCIAL STATEMENTS (Continued)
February 29, 2016 (Unaudited)
NOTE 8—NEW ACCOUNTING PRONOUNCEMENTS
In June 2014, the Financial Accounting Standard Board issued ASU No. 2014-11 “Repurchase-to-Maturity Transactions, Repurchase Financings, and Disclosures.” ASU No. 2014-11 makes limited changes to the accounting for repurchase agreements, clarifies when repurchase agreements and securities lending transactions should be accounted for as secured borrowings, and requires additional disclosures regarding these types of transactions. The effective date of this ASU is for fiscal years beginning on or after December 15, 2014, and for interim periods within those fiscal years. Management currently believes these changes will not have a material impact on the Funds’ financial statement disclosures.
NOTE 9—SUBSEQUENT EVENTS
In preparing these financial statements, the Corporation has evaluated events after February 29, 2016 and determined that there were no significant subsequent events that would require adjustment to or additional disclosure in these financial statements. On April 25, 2016, $2,204,006 was redeemed from the Wisdom Fund. No adjustments to these financial statements were required as a result of this event.
JACOB FUNDS INC.
ADDITIONAL INFORMATION ON FUND EXPENSES (Unaudited)
For the Six Months Ended February 29, 2016 for the Internet Fund, Small Cap Growth Fund, Micro Cap Growth Fund and Wisdom Fund
As a shareholder of a mutual fund, you may incur two types of costs: (1) transaction costs, including sales charges (loads) on purchase payments, reinvested dividends, or other distributions; redemption fees; and exchange fees; and (2) ongoing costs, including management fees; distribution and/or service (12b-1) fees; and other fund expenses. The Funds do not currently charge sales charges (loads) or exchange fees. The Funds assess a redemption fee of 2% on shares sold within 30 days following their purchase date. In addition, you will be assessed fees for outgoing wire transfers, returned checks and stop payment orders. The Funds charge management fees and distribution and/or service (12b-1) fees. The Expense Example is intended to help you understand your ongoing costs (in dollars) of investing in the Funds and to compare these costs with the ongoing costs of investing in other mutual funds. The Example is based on an investment of $1,000 invested at the beginning of the period and held for the entire period (9/1/2015–2/29/2016) for the Internet Fund, Small Cap Growth Fund, Micro Cap Growth Fund and Wisdom Fund.
Actual Expenses
The first line of the table below provides information about account values based on actual returns and actual expenses. Although the Funds charge no sales load, the Funds charge a redemption fee of 2% on shares sold within 30 days following the purchase date. In addition, you will be assessed fees for outgoing wire transfers, returned checks and stop payment orders at prevailing rates charged by U.S. Bancorp Fund Services, LLC, the Funds’ transfer agent. If you request that a redemption be made by wire transfer, currently the Funds’ transfer agent charges a $15.00 fee. The Example does not reflect transactional costs, such as redemption fees. You may use the information in the first line below, together with the amount you invested, to estimate the expenses that you paid over the period. Simply divide your account value by $1,000 (for example, an $8,600 account value divided by $1,000 = 8.6), then multiply the result by the number in the first line under the heading entitled “Expenses Paid During the Period” to estimate the expenses you paid on your account during this period.
Hypothetical Example for Comparison Purposes
The second line of the table below provides information about hypothetical account values based on a hypothetical return and hypothetical expenses based on a Fund’s actual expense ratio and an assumed rate of return of 5% per year before expenses, which is not a Fund’s actual return. The hypothetical account values and expenses may not be used to estimate the actual ending account balance or expenses you paid for the period. You may use this information to compare the ongoing costs of investing in the Funds and other funds. To do so, compare this 5% hypothetical example with the 5% hypothetical examples that appear in the shareholder reports of the other funds. Please note that the expenses shown in the table are meant to highlight your ongoing costs only and do not reflect transactional costs, such as redemption fees. Therefore, the second line of the table is useful in comparing ongoing costs only, and will not help you determine the relative total costs of owning different funds. In addition, if the transactional costs were included, your costs would have been higher.
JACOB FUNDS INC.
ADDITIONAL INFORMATION ON FUND EXPENSES (Unaudited) (Continued)
Internet Fund – Investor Class
| | | | Expenses Paid |
| | Beginning Account | Ending Account | During the Period |
| | Value 9/1/15 | Value 2/29/2016 | 9/1/15–2/29/2016* |
| Actual | $1,000.00 | $ 958.70 | $12.56 |
| Hypothetical (5% annual return before expenses) | $1,000.00 | $1,012.03 | $12.91 |
_______________
| * | Expenses are equal to the Internet Fund’s annualized expense ratio of 2.58% multiplied by the average account value over the period multiplied by 182/366 (to reflect the one-half year period). |
Small Cap Growth Fund – Institutional Class
| | | | Expenses Paid |
| | Beginning Account | Ending Account | During the Period |
| | Value 9/1/15 | Value 2/29/2016 | 9/1/15–2/29/2016* |
| Actual | $1,000.00 | $ 706.10 | $ 8.78 |
| Hypothetical (5% annual return before expenses) | $1,000.00 | $1,014.57 | $10.37 |
_______________
| * | Expenses are equal to the Institutional Class’s annualized expense ratio of 2.07% multiplied by the average account value over the period multiplied by 182/366 (to reflect the one-half year period). |
Small Cap Growth Fund – Investor Class
| | | | Expenses Paid |
| | Beginning Account | Ending Account | During the Period |
| | Value 9/1/15 | Value 2/29/2016 | 9/1/15–2/29/2016* |
| Actual | $1,000.00 | $ 705.40 | $ 9.96 |
| Hypothetical (5% annual return before expenses) | $1,000.00 | $1,013.18 | $11.76 |
_______________
| * | Expenses are equal to the Investor Class’s annualized expense ratio of 2.35% multiplied by the average account value over the period multiplied by 182/366 (to reflect the one-half year period). |
Micro Cap Growth Fund – Institutional Class
| | | | Expenses Paid |
| | Beginning Account | Ending Account | During the Period |
| | Value 9/1/15 | Value 2/29/2016 | 9/1/15–2/29/2016* |
| Actual | $1,000.00 | $ 778.90 | $10.88 |
| Hypothetical (5% annual return before expenses) | $1,000.00 | $1,012.63 | $12.31 |
_______________
| * | Expenses are equal to the Institutional Class’s annualized expense ratio of 2.46% multiplied by the average account value over the period multiplied by 182/366 (to reflect the one-half year period). |
JACOB FUNDS INC.
ADDITIONAL INFORMATION ON FUND EXPENSES (Unaudited) (Continued)
Micro Cap Growth Fund – Investor Class
| | | | Expenses Paid |
| | Beginning Account | Ending Account | During the Period |
| | Value 9/1/15 | Value 2/29/2016 | 9/1/15–2/29/2016* |
| Actual | $1,000.00 | $ 777.70 | $12.42 |
| Hypothetical (5% annual return before expenses) | $1,000.00 | $1,010.89 | $14.05 |
_______________
| * | Expenses are equal to the Investor Class’s annualized expense ratio of 2.81% multiplied by the average account value over the period multiplied by 182/366 (to reflect the one-half year period). |
Wisdom Fund – Investor Class
| | | | Expenses Paid |
| | Beginning Account | Ending Account | During the Period |
| | Value 9/1/15 | Value 2/29/2016 | 9/1/15–2/29/2016* |
| Actual | $1,000.00 | $ 960.20 | $12.43 |
| Hypothetical (5% annual return before expenses) | $1,000.00 | $1,012.18 | $12.76 |
_______________
| * | Expenses are equal to the Wisdom Fund’s annualized expense ratio of 2.55% multiplied by the average account value over the period multiplied by 182/366 (to reflect the one-half year period). |
JACOB FUNDS INC.
ADDITIONAL INFORMATION (Unaudited)
Approval of the Investment Advisory Agreements
During the six months ended November 30, 2015, the Board of Directors (the “Board”), including all of the independent Directors, considered and approved the renewal of the Investment Advisory Agreements between Jacob Funds Inc. (the “Company”), on behalf of the Jacob Internet Fund (the “Internet Fund”), Jacob Small Cap Growth Fund (the “Small Cap Fund”), Jacob Micro Cap Growth Fund (the “Micro Cap Fund”) and Jacob Wisdom Fund (the “Wisdom Fund”) and collectively (the “Funds”), and Jacob Asset Management of New York LLC (the “Adviser”) for an additional year. The Board also considered the continuation of the Fee Waiver Agreements between the Adviser and the Company on behalf of the Internet Fund, Small Cap Fund, Micro Cap Fund and Wisdom Fund, which the Adviser offered to continue for an additional year. While the Investment Advisory Agreements for all of the Funds were considered at the same Board meeting, the Board dealt with each Fund separately.
In reaching its decision to renew the Investment Advisory Agreements, the Board took into account a combination of factors, including the nature, extent and quality of the services to be provided by the Adviser; each Fund’s performance; each Fund’s fees and expenses; the costs of the services to be provided and the profits realized by the Adviser; and the extent to which there are economies of scale in the provision of advisory services and whether the Adviser may realize additional economies of scale in the future. The Board did not identify any single factor as all-important or controlling, and each Director may have weighed a particular piece of information or factor differently than another Director. This summary does not detail all of the matters considered by the Board.
The materials provided to, and discussed by, the Board in connection with the renewal of the Investment Advisory Agreements included written responses from the Adviser that provided, among other things: (i) a description of the Adviser’s business, operations and qualifications; (ii) a description of personnel, including responsibilities, changes since the last renewal of the Investment Advisory Agreements (the “last renewal”) and compensation policies; (iii) a description of the advisory services provided to the Funds, including a discussion of how investment decisions are made and executed; (iv) a description of any services other than investment advice provided to the Funds by the Adviser; (v) a copy of the Adviser’s most recent Form ADV; (vi) a balance sheet and profit and loss statement for the Adviser; (vii) a description of the advisory fees and a peer group comparison along with a discussion of the appropriateness of the fees; (viii) a description of any issues or recommendations with respect to the Company’s compliance program since the last renewal; (ix) a description of the Company’s expenses, including expense ratios and comparative expense ratios, costs incurred by the Adviser and brokerage expenses; and (x) a description of errors and omission insurance coverage that is currently in place.
Additional materials that were provided to, and discussed by, the Board in connection with the renewal of the Investment Advisory Agreements included, among other things: (i) a copy of the Investment Advisory Agreements with the Adviser, which, among other things, described the services provided to the Funds and the compensation to be paid for such services; (ii) a copy of the Fee Waiver Agreements with the Adviser; (iii) Morningstar comparative industry peer group and peer fund data for the Funds’ performance; and (iv) Morningstar comparative industry peer group data regarding the investment advisory fees and total expense ratios of the Funds along with other industry peer group comparisons of fund expenses and expense reimbursements.
The Board discussed the nature, extent and quality of services provided by the Adviser to each Fund, including the Adviser’s resources comparative to other advisory firms and developments since the last renewal. They concluded that the experienced portfolio management and research team dedicated to the continued management of the Funds were
JACOB FUNDS INC.
ADDITIONAL INFORMATION (Unaudited) (Continued)
sufficient and beneficial to the Funds, as evidenced by each Fund’s performance record over varying periods, and that the services provided were consistent with the terms of the Investment Advisory Agreements.
The Board reviewed the investment performance of each Fund. While consideration was given to performance reports and discussions throughout the year, attention in assessing performance was given to the comparative data furnished in connection with the renewal of the Investment Advisory Agreements. The Board found such overall comparative results to be satisfactory with respect to each Fund.
The Board reviewed the advisory fees and overall expenses of each Fund and discussed the difference in fees and expenses compared to other funds within each Fund’s peer group. The Board discussed the allocation of expenses among the Funds and the manner in which each Fund bears its appropriate share of the expenses. The Board noted the relatively small size of the Funds and the ongoing subsidies of operating expenses by the Adviser pursuant to the Fee Waiver Agreements.
The Board discussed the profitability of the Adviser, other benefits received by the Adviser in connection with the management of the Funds, the extent to which there are economies of scale in the provision of advisory services, and whether the Adviser may realize additional economies of scale in the future.
In considering the various factors, the Board’s fiduciary duties to the Funds’ shareholders, and the body of law governing the approval of investment advisory agreements, the independent Directors received assistance and advice from independent legal counsel.
Based on all of the above-mentioned factors and their related conclusions, with no single factor or conclusion being determinative, and with each Director not necessarily attributing the same weight to each factor, the Directors concluded that (i) the Adviser demonstrated that it possessed the capability and resources to perform the duties required of it under the Investment Advisory Agreements; (ii) the compensation payable to the Adviser under the Investment Advisory Agreements was fair and reasonable; and (iii) the compensation and other terms of the Investment Advisory Agreements were appropriate and in the best interests of each of the Funds and its shareholders.
JACOB FUNDS INC.
ADDITIONAL INFORMATION (Unaudited) (Continued)
Proxy Voting
A description of the policies and procedures that the Funds use to determine how to vote proxies relating to portfolio securities is available without charge by calling toll-free 1-888-JACOB-FX (522-6239) or on the SEC website at http://www.sec.gov.
Proxy Voting Record
Information regarding how the Funds voted proxies relating to portfolio securities during the most recent 12-month period ended June 30 is available without charge by calling 1-888-JACOB-FX (522-6239) or on the SEC website at http://www.sec.gov.
Holdings Disclosure
The Funds’ Semi-Annual and Annual Reports include a complete schedule of portfolio holdings for the second and fourth quarters of each fiscal year.
The Funds file their complete schedule of portfolio holdings with the SEC for the first and third quarters of each fiscal year on Form N-Q. The Funds’ Forms N-Q are available on the SEC website at http://www.sec.gov and may be reviewed and copied at the SEC’s Public Reference Room in Washington, D.C. Information on the operation of the Public Reference Room may be obtained by calling 1-800-SEC-0330.
(This Page Intentionally Left Blank.)
Semi-Annual Report
February 29, 2016
JACOB INTERNET FUND
JACOB SMALL CAP GROWTH FUND
JACOB MICRO CAP GROWTH FUND
JACOB WISDOM FUND
Jacob Asset Management of New York LLC
1-888-JACOB-FX (522-6239)
www.jacobmutualfunds.com
| Investment Adviser | Custodian |
| Jacob Asset Management of New York LLC | U.S. Bank, N.A. |
| | |
| Administrator and Transfer Agent | Legal Counsel |
| and Dividend Agent | Stradley Ronon Stevens & Young, LLP |
| U.S. Bancorp Fund Services, LLC | |
| | Independent Registered Public |
| Underwriter and Distributor | Accounting Firm |
| Quasar Distributors, LLC | BBD, LLP |
This report has been prepared for the information of shareholders of the Jacob Internet Fund, the Jacob Small Cap Growth Fund, the Jacob Micro Cap Growth Fund and the Jacob Wisdom Fund and is not authorized for distribution to prospective investors unless preceded or accompanied by an effective prospectus that includes information regarding the Funds’ objectives, policies, management, records and other information.
Item 2. Code of Ethics.
Not applicable for semi-annual reports.
Item 3. Audit Committee Financial Expert.
Not applicable for semi-annual reports.
Item 4. Principal Accountant Fees and Services.
Not applicable for semi-annual reports.
Item 5. Audit Committee of Listed Registrants.
Not applicable to Registrants who are not listed issuers (as defined in Rule 10A-3 under the Securities Exchange Act of 1934).
Item 6. Investments.
(a) The Schedule of Investments is included as part of the report to shareholders filed under Item 1 of this Form.
(b) Not applicable.
Item 7. Disclosure of Proxy Voting Policies and Procedures for Closed-End Management Investment Companies.
Not applicable to open-end investment companies.
Item 8. Portfolio Managers of Closed-End Management Investment Companies.
Not applicable to open-end investment companies.
Item 9. Purchases of Equity Securities by Closed‑End Management Investment Company and Affiliated Purchasers.
Not applicable to open-end investment companies.
Item 10. Submission of Matters to a Vote of Security Holders.
Not Applicable.
Item 11. Controls and Procedures.
| (a) | The Registrant’s principal executive officer/President and principal financial officer/Treasurer have reviewed the Registrant's disclosure controls and procedures (as defined in Rule 30a-3(c) under the Investment Company Act of 1940 (the “Act”)) as of a date within 90 days of the filing of this report, as required by Rule 30a-3(b) under the Act and Rules 13a-15(b) or 15d‑15(b) under the Securities Exchange Act of 1934. Based on their review, such officers have concluded that the disclosure controls and procedures are effective in ensuring that information required to be disclosed in this report is appropriately recorded, processed, summarized and reported and made known to them by others within the Registrant and by the Registrant’s service provider. |
| (b) | There were no changes in the Registrant's internal control over financial reporting (as defined in Rule 30a-3(d) under the Act) that occurred during the second fiscal quarter of the period covered by this report that has materially affected, or is reasonably likely to materially affect, the Registrant's internal control over financial reporting. |
Item 12. Exhibits.
| (a) | (1) Any code of ethics or amendment thereto, that is the subject of the disclosure required by Item 2, to the extent that the Registrant intends to satisfy Item 2 requirements through filing an exhibit. Incorporated by reference to previous Form N-CSR filing. |
(2) A separate certification for each principal executive and principal financial officer pursuant to Section 302 of the Sarbanes-Oxley Act of 2002. Filed herewith.
(3) Any written solicitation to purchase securities under Rule 23c‑1 under the Act sent or given during the period covered by the report by or on behalf of the Registrant to 10 or more persons. Not applicable to open-end investment companies.
| (b) | Certifications pursuant to Section 906 of the Sarbanes‑Oxley Act of 2002. Furnished herewith. |
SIGNATURES
Pursuant to the requirements of the Securities Exchange Act of 1934 and the Investment Company Act of 1940, the Registrant has duly caused this report to be signed on its behalf by the undersigned, thereunto duly authorized.
(Registrant) Jacob Funds Inc.
By (Signature and Title) /s/Ryan Jacob
Ryan Jacob, President
Date May 5, 2016
Pursuant to the requirements of the Securities Exchange Act of 1934 and the Investment Company Act of 1940, this report has been signed below by the following persons on behalf of the Registrant and in the capacities and on the dates indicated.
By (Signature and Title) /s/Ryan Jacob
Ryan Jacob, President
Date May 5, 2016
By (Signature and Title) /s/Francis Alexander
Francis Alexander, Treasurer
Date May 5, 2016