UNITED STATES
SECURITIES AND EXCHANGE COMMISSION
Washington, D.C. 20549
FORM N-CSR
CERTIFIED SHAREHOLDER REPORT OF REGISTERED
MANAGEMENT INVESTMENT COMPANIES
Investment Company Act file number 811-09447
Jacob Funds Inc.
(Exact name of Registrant as specified in charter)
C/O Jacob Asset Management of New York LLC
727 2nd Street #106
Hermosa Beach, CA 90254
(Address of principal executive offices) (Zip code)
Ryan Jacob
C/O Jacob Asset Management of New York LLC
727 2nd Street #106
Hermosa Beach, CA 90254
(Name and address of agent for service)
(424) 237-2164
Registrant's telephone number, including area code
Date of fiscal year end: August 31
Date of reporting period: February 28, 2019
Item 1. Reports to Stockholders.
Jacob Internet Fund
Jacob Small Cap Growth Fund
Jacob Micro Cap Growth Fund
Semi-Annual Report
February 28, 2019
The Jacob Internet Fund, Jacob Small Cap Growth Fund and
Jacob Micro Cap Growth Fund are mutual funds with the
primary investment objective of long-term growth of capital.
The Jacob Internet Fund has current income as a secondary objective.
Beginning on January 1, 2021, as permitted by regulations adopted by the Securities and Exchange Commission, paper copies of the Funds’ shareholder reports will no longer be sent by mail, unless you specifically request paper copies of the reports from the Funds (if you invest directly with a Fund) or from your financial intermediary, such as a broker-dealer or bank. Instead, the reports will be made available on a website, and you will be notified by mail each time a report is posted and provided with a website link to access the report.
If you already elected to receive shareholder reports electronically, you will not be affected by this change and you need not take any action. You may elect to receive shareholder reports and other communications electronically from the Funds by calling 1-888-522-6239 or by contacting your financial intermediary (such as a broker-dealer or bank).
You may elect to receive all future reports in paper free of charge. You can request to continue receiving paper copies of your shareholder reports by contacting your financial intermediary or, if you invest directly with a Fund, calling 1-888-522-6239 to let the Fund know of your request. Your election to receive in paper will apply to all Funds held in your account.
Investment Adviser
Jacob Asset Management of New York LLC
TABLE OF CONTENTS
| Letter From the Manager | | | 1 |
| Industry Breakdowns | | | 4 |
| Schedules of Investments | | | 7 |
| Statements of Assets and Liabilities | | | 15 |
| Statements of Operations | | | 16 |
| Statements of Changes in Net Assets | | | 17 |
| Financial Highlights | | | 20 |
| Notes to the Financial Statements | | | 25 |
| Additional Information on Fund Expenses | | | 38 |
| Additional Information | | | 40 |
Dear Fellow Investors,
After concerns of a weakening global economy led to a late 2018 stock market rout, we have seen an equally strong resurgence in equity prices over just the last few months. An about-face by the Board of Governors of the Federal Reserve System (the Fed) was probably the biggest contributor to this recovery, but increased optimism that a US trade deal with China could be finalized soon also likely boosted investors’ spirits. With the Fed now clearly on hold in regards to interest rates, we have recently seen longer-term rates fall below short-term rates and to levels we haven’t seen since 2017. The inverted yield curve is often a harbinger for future economic weakness, and clearly fear of a recession is rising. Given the troubles in Europe (political & economic) and lethargic growth in most of Asia, this feeling is understandable. While we acknowledge this viewpoint, we remain confident in the underlying economic trends here in the US, and still believe that rising interest rates over the next several years will likely be the main risk to monitor. In the meantime, we have been using any lingering weakness in our holdings to increase select position sizes to take advantage of what we believe to be a continuation of a mostly positive economic environment for the balance of 2019.
Jacob Internet Fund
The Jacob Internet Fund returned 0.00% for the fiscal period ended February 28, 2019, while the NASDAQ declined -6.58%. In what ended up being a volatile period, the Fund performed admirably, with many holdings even posting sizable gains. Many of the best performers were small- to mid-sized holdings that have the platform type attributes that we favor. A key part of the Fund’s strategy has always been to seek out early-stage businesses that have the potential for a more meaningful impact on the Fund’s performance. We believe this more diverse mix of market caps compared to our peers and the major indices continue to provide us the opportunity to significantly outperform over the long term.
As for individual stocks, by far our best-performing name over the period was Digital Turbine, a long-time holding that finally showed the promise of their app delivery model across cell phone networks throughout the globe. Up over 127% during the period, we still believe that they will exhibit enough positive operating leverage to justify further gains. A relative newcomer to the Fund, digital communication enabler Twilio, was up over 50% in the period and has impressively grown their customer base while also expanding into new markets. Specifically, their SendGrid acquisition provides them e-mail messaging capabilities and their new Flex product has the potential to disrupt the traditional call/contact center model in a meaningful way. Mitek, up close to 50% in the period as well, benefitted from a buyout offer, with multiple parties interested in purchasing part or the whole company. Although it’s difficult to know whether a transaction will be consummated, we are still comfortable with the fundamentals of both their mobile deposit and security ID businesses.
By far our worst performer in the period was USA Technologies, down -76% in the period. An accounting restatement and the resignation of their auditors led to an investor exodus, and we actually stepped aside for a brief period as well. Once it became more likely that this was more of a revenue recognition issue, and not something fundamentally wrong with their model and/or market, we slowly increased our position size again. While it may be several quarters before the restatements are finalized with the new auditors, we believe that the valuation is at too severe a discount to what is still an attractive opportunity. Some of our holdings sensitive to lower interest rates, such as E*Trade and First Internet Bancorp, were also down 17% and 31%, respectively, in the period. Finally, Apple was down close to 24% in the period, as they pre-announced their fourth quarter results due to weakening sales in China. Although Apple has not been a top position in the Fund for a while, we still believe that investors are underestimating the ecosystem they have built and the robustness of their financial model.
Jacob Small Cap Growth Fund
The Jacob Small Cap Growth Fund was down -10.55% through February 28, 2019 while the Russell 2000 Growth Index declined -9.17%. The Fund’s performance was most hurt by its position in USA Technologies, but had several other holdings down more than 40% for the period as well. Energy-related names were hit the hardest due to cratering oil prices, with Ring Energy, Carrizo and Rosehill Resources down 48%, 55% and 62%, respectively. Some names in the consumer sector, such as Red Lion Hotels and Tilly’s were especially weak, down 42% and 44%, respectively. On a more positive note, all of the above-mentioned names are now well above their intra-period lows, and we are optimistic that they will recover further as confidence in the economy improves.
The Fund did have a number of strong performers in the period. Besides Mitek, which we referenced above, the standout performer in the period was Harrow Health, up over 128% in the period. The old Imprimis Pharmaceuticals, a long-time holding in the Micro Cap fund, embarked on an ambitious strategy to monetize existing assets through launching new companies with Harrow retaining an economic interest. This has proved to be very successful so far with multiple financing rounds leading to an IPO with a couple more possible stock debuts over the next 12-24 months. Most of the other top performers in the period were in the health care space as well, with CareDx and Codexis leading the way, up 29% and 26% respectively.
Jacob Micro Cap Growth Fund
The Jacob Micro Cap Growth Fund fared better and was down -3.60% for the fiscal period ended February 28, 2019, while the Russell Micro Cap Growth Index declined -14.83%. While we had our share of poor performers – most notably the USA Technologies position discussed above – the fund definitely benefitted from a lack of energy exposure vs. the benchmark, and also had large positions in a number of names that posted extremely solid gains despite the overall market turbulence. We already discussed a number of the strong performers, such as Harrow Health, Digital Turbine and Mitek, but two other names worth noting in the quarter were iCad and Krystal Biotech. ICad, a provider of radiation technology and cancer diagnostic services, has been a long-term holding of the fund, and we have been very pleased with recent developments. The company hired a much-needed new management team, most notably the former CEO of a subsidiary that iCad bought a while back, and we have been impressed with his recent decisions, which hopefully bodes well for the sales of their latest MRI software product ProFound AI, just launched within the past few months. Krystal Biotech, meanwhile, is an early-stage drug development firm that has a very intriguing gene therapy platform, specifically designed for skin diseases. Their first product in the clinic, targeting a rare but incredibly debilitating, often fatal, skin blistering disease called dystrophic epidermolysis bullosa (DEB), has shown very promising results, albeit only in animal studies and with a very limited number of human patients. We are incredibly excited to see updates from its ongoing FDA trials in DEB as well as from the fairly deep pipeline of products the company is developing, but like with any early-stage biotech, we maintain a relatively modest position in the name due to what we believe are heightened risks associated with these investments.
As always, we believe that staying true to our investment philosophy and process is still key to obtaining the best possible long-term investment performance for our shareholders. Thank you again for your continued confidence and trust.
Ryan Jacob
Chairman and Chief Investment Officer
Portfolio Manager
Frank Alexander
Portfolio Manager
Darren Chervitz
Portfolio Manager
Past performance is not a guarantee of future results.
Performance data reflects fee waivers and in the absence of these waivers performance would be reduced.
Diversification does not assure a profit or protect against a loss in a declining market.
Must be accompanied or preceded by a prospectus.
The opinions expressed above are those of the portfolio manager and are subject to change at any time. Forecasts cannot be guaranteed and should not be considered investment advice.
Mutual fund investing involves risk; loss of principal is possible. The Funds invest in foreign securities which involve greater volatility and political, economic and currency risks and differences in accounting methods. These risks are greater in emerging markets. Growth stocks typically are more volatile than value stocks; however, value stocks have a lower expected growth rate in earnings and sales. There are more specific risks inherent in investing in the Internet area, particularly with respect to smaller capitalized companies and the high volatility of Internet stocks. The Funds can invest in small-and mid-cap securities which involve additional risks such as limited liquidity and greater volatility. Investments in micro capitalization companies may involve greater risks, as these companies tend to have limited product lines, markets and financial or managerial resources. Micro cap stocks often also have a more limited trading market, such that the Adviser may not be able to sell stocks at an optimal time or price. In addition, less frequently-traded securities may be subject to more abrupt price movements than securities of larger capitalized companies. Investments in debt securities typically decrease in value when interest rates rise. This risk is usually greater for longer term debt securities.
Fund holdings are subject to change and should not be construed as a recommendation to buy or sell any security. Current and future portfolio holdings are subject to risk.
Please refer to the schedule of investments for complete Fund holdings information.
The NASDAQ Composite Index is a market capitalization weighted index that is designed to represent performance of the National Market System which includes over 5,000 stocks traded only over-the-counter and not on an exchange. The Russell 2000 Growth Index measures the performance of the small cap growth segment of the U.S. equity universe. It includes those Russell 2000 companies with higher price-to-book ratios and higher forecasted growth values. The Russell Microcap Growth Index measures the performance of the microcap growth segment of the U.S. equity market. It includes those Russell Microcap Index companies with higher price-to-book ratios and higher forecasted growth values. The S&P 500 is a market capitalization-weighted index of 500 large-capitalization stocks commonly used to represent the U.S. equity market. It is not possible to invest directly in an index.
The Funds are distributed by Quasar Distributors, LLC.
JACOB INTERNET FUND
INDUSTRY BREAKDOWN AS OF FEBRUARY 28, 2019
(as a percentage of total investments)
(Unaudited)
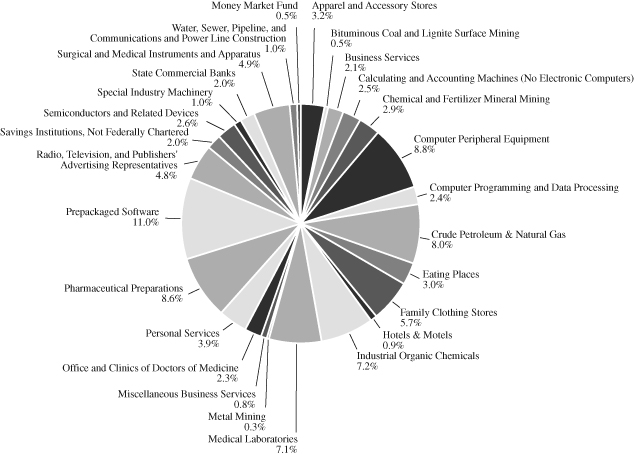
JACOB SMALL CAP GROWTH FUND
INDUSTRY BREAKDOWN AS OF FEBRUARY 28, 2019
(as a percentage of total investments)
(Unaudited)
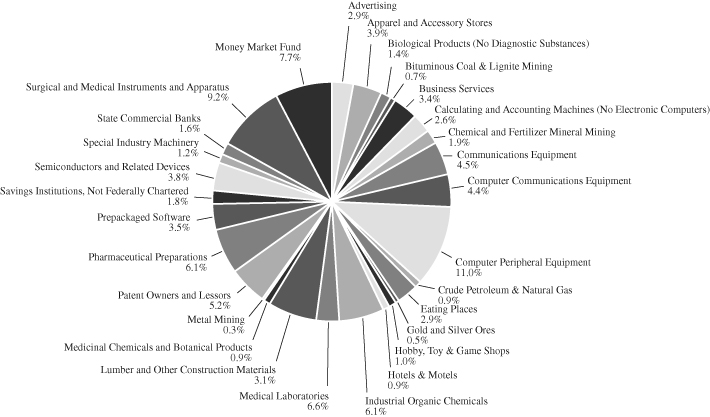
JACOB MICRO CAP GROWTH FUND
INDUSTRY BREAKDOWN AS OF FEBRUARY 28, 2019
(as a percentage of total investments)
(Unaudited)
JACOB INTERNET FUND
SCHEDULE OF INVESTMENTS(+)
February 28, 2019 (Unaudited)
| | | | | | | | | | | | |
| Shares | | | | | | | | | | Value | |
| | | COMMON STOCKS | | | | | | 99.6 | % | | | |
| | | Business Services | | 13.3 | %
| | | | | | |
|
|
| | 63,174 | | OptimizeRx Corp.* | | | | | | | | | $ | 907,179 | |
| | 26,200 | | PayPal Holdings, Inc.* | | | | | | | | | | 2,569,434 | |
| | 15,300 | | YY, Inc.—Class A—ADR*^ | | | | | | | | | | 1,078,650 | |
| | 51,975 | | Zillow Group, Inc.—Class C* | | | | | | | | | | 2,172,555 | |
| | | | | | | | | | | | | | 6,727,818 | |
| | | | Calculating and Accounting | | | | | | | | | | | |
| | | | Machines (No Electronic Computers) | | | 2.6 | % | | | | | | | | |
| | 330,000 | | USA Technologies, Inc.* | | | | | | | | | | | 1,306,800 | |
| | | | Communications Equipment | | | 3.1 | % | | | | | | | | |
| | 217,740 | | I.D. Systems, Inc.* | | | | | | | | | | | 1,556,841 | |
| | | | Computer Peripheral Equipment | | | 8.7 | % | | | | | | | | |
| | 210,611 | | Immersion Corp.* | | | | | | | | | | | 1,891,287 | |
| | 45,000 | | Impinj, Inc.* | | | | | | | | | | | 752,850 | |
| | 161,809 | | Mitek Systems, Inc.* | | | | | | | | | | | 1,749,155 | |
| | | | | | | | | | | | | | | 4,393,292 | |
| | | | Computer Programing and Data Processing | | | 16.7 | % | | | | | | | | |
| | 1,700 | | Alphabet, Inc.—Class C* | | | | | | | | | | | 1,903,864 | |
| | 10,000 | | Facebook, Inc.—Class A* | | | | | | | | | | | 1,614,500 | |
| | 12,000 | | MongoDB, Inc.—Class A* | | | | | | | | | | | 1,218,720 | |
| | 30,000 | | Tencent Holdings Ltd. (HK)(a) | | | | | | | | | | | 1,284,698 | |
| | 79,200 | | Twitter, Inc.* | | | | | | | | | | | 2,437,776 | |
| | | | | | | | | | | | | | | 8,459,558 | |
| | | | Electronic Computers | | | 2.5 | % | | | | | | | | |
| | 7,200 | | Apple, Inc. | | | | | | | | | | | 1,246,680 | |
| | | | Offices & Clinics of Doctors of Medicine | | | 2.3 | % | | | | | | | | |
| | 18,200 | | Teladoc Health, Inc.* | | | | | | | | | | | 1,171,352 | |
| | | | Patent Owners and Lessors | | | 4.6 | % | | | | | | | | |
| | 737,096 | | Digital Turbine, Inc.* | | | | | | | | | | | 2,343,965 | |
| | | | Personal Services | | | 4.0 | % | | | | | | | | |
| | 54,000 | | Yelp, Inc.—Class A* | | | | | | | | | | | 2,012,040 | |
| | | | Prepackaged Software | | | 27.2 | % | | | | | | | | |
| | 103,155 | | Cloudera, Inc.* | | | | | | | | | | | 1,502,968 | |
| | 80,399 | | Inspired Entertainment, Inc.* | | | | | | | | | | | 548,321 | |
| | 11,900 | | Instructure, Inc.* | | | | | | | | | | | 556,087 | |
| | 5,756 | | LogMeIn, Inc. | | | | | | | | | | | 457,257 | |
The accompanying notes are an integral part of these financial statements.
JACOB INTERNET FUND
SCHEDULE OF INVESTMENTS(+) (Continued)
February 28, 2019 (Unaudited)
| Shares | | | | | | | | | | Value | |
| | | COMMON STOCKS—(Continued) | | | | | | 99.6 | % | | | |
| | | Prepackaged Software—(Continued) | | | 27.2 | % | | | | | | | |
| | 14,100 | | Paylocity Holding Corp.* | | | | | | | | | | $ | 1,234,737 | |
| | 3,600 | | salesforce.com, Inc.* | | | | | | | | | | | 589,140 | |
| | 17,260 | | SINA Corp.*^ | | | | | | | | | | | 1,162,806 | |
| | 15,200 | | Square, Inc.—Class A* | | | | | | | | | | | 1,234,848 | |
| | 20,000 | | Tabula Rasa HealthCare, Inc.* | | | | | | | | | | | 1,102,200 | |
| | 44,400 | | Twilio, Inc.—Class A* | | | | | | | | | | | 5,403,036 | |
| | | | | | | | | | | | | | | 13,791,400 | |
| | | | Radio, Television, and Publishers’ | | | | | | | | | | | | |
| | | | Advertising Representatives | | | 4.6 | % | | | | | | | | |
| | 126,000 | | Yext, Inc.* | | | | | | | | | | | 2,341,080 | |
| | | | Savings Institutions, Federally Chartered | | | 4.3 | % | | | | | | | | |
| | 45,000 | | E*TRADE Financial Corp. | | | | | | | | | | | 2,204,550 | |
| | | | Semiconductors and Related Devices | | | 2.5 | % | | | | | | | | |
| | 46,600 | | CEVA, Inc.* | | | | | | | | | | | 1,296,412 | |
| | | | State Commercial Banks | | | 1.9 | % | | | | | | | | |
| | 44,256 | | First Internet Bancorp | | | | | | | | | | | 955,930 | |
| | | | Transportation Services | | | 1.3 | % | | | | | | | | |
| | 5,400 | | Expedia Group, Inc. | | | | | | | | | | | 665,874 | |
| | | | TOTAL COMMON STOCKS (Cost $29,234,397) | | | | | | | | | | | 50,473,592 | |
| | | | | | | | | | | | | | | | |
| | | | MONEY MARKET FUND | | | | | | | 1.7 | % | | | | |
| | | | Money Market Fund | | | 1.7 | % | | | | | | | | |
| | 855,731 | | First American Government Obligations Fund—Class X, 2.33%(b) | | | | | | |
| | | | 855,731
| |
| | | | TOTAL MONEY MARKET FUND (Cost $855,731) | | | | | | |
| | | | 855.731 | |
| | | | TOTAL INVESTMENTS (Cost $30,090,128) | | | | | | | 101.3 | % | | | 51,329,323 | |
| | | | LIABILITIES IN EXCESS OF OTHER ASSETS | | | | | | | (1.3 | )% | | | (633,996 | ) |
| | | | TOTAL NET ASSETS | | | | | | | 100.0 | % | | $ | 50,695,327 | |
| * | Non Income Producing. |
| ^ | U.S. Dollar-denominated foreign security. |
| (a) | Level 2 Security. See Note 2. |
| (b) | 7-day yield. |
| ADR | American Depository Receipt. |
| (HK) | Security denominated in Hong Kong dollars. Value translated into U.S. dollars. |
| (+) | Schedule of Investments is classified using the U.S. Securities and Exchange Commission’s Standard Industrial Classification (SIC) Code List. |
The accompanying notes are an integral part of these financial statements.
JACOB SMALL CAP GROWTH FUND
SCHEDULE OF INVESTMENTS(+)
February 28, 2019 (Unaudited)
| Shares | | | | | | | | | | | Value | |
| | | COMMON STOCKS | | | | | | | 100.0 | % | | | |
| | | Apparel and Accessory Stores | | | | 3.2 | % | | | | | | | |
| | 113,000 | | RTW RetailWinds, Inc.* | | | | | | | | | | | $ | 343,520 | |
| | 18,400 | | Tilly’s, Inc.—Class A | | | | | | | | | | | | 223,192 | |
| | | | | | | | | | | | | | | | 566,712 | |
| | | | Bituminous Coal and Lignite Surface Mining | | | | 0.5 | % | | | | | | | | |
| | 1,000 | | Arch Coal, Inc.—Class A | | | | | | | | | | | | 93,160 | |
| | | | Business Services | | | | 2.1 | % | | | | | | | | |
| | 5,300 | | YY, Inc.—Class A—ADR*^ | | | | | | | | | | | | 373,650 | |
| | | | Calculating and Accounting Machines (No Electric Computers) | | | | 2.5 | % | | | | | | | | |
| | 112,000 | | USA Technologies, Inc.* | | | | | | | | | | | | 443,520 | |
| | | | Chemical and Fertilizer Mineral Mining | | | | 2.9 | % | | | | | | | | |
| | 46,100 | | Lithium Americas Corp.*^ | | | | | | | | | | | | 170,570 | |
| | 16,600 | | Nexa Resources SA^ | | | | | | | | | | | | 178,948 | |
| | 57,000 | | Orocobre Ltd.*^ | | | | | | | | | | | | 154,755 | |
| | | | | | | | | | | | | | | | 504,273 | |
| | | | Computer Peripheral Equipment | | | | 8.9 | % | | | | | | | | |
| | 72,883 | | Immersion Corp.* | | | | | | | | | | | | 654,489 | |
| | 15,600 | | Impinj, Inc.* | | | | | | | | | | | | 260,988 | |
| | 60,000 | | Mitek Systems, Inc.* | | | | | | | | | | | | 648,600 | |
| | | | | | | | | | | | | | | | 1,564,077 | |
| | | | Computer Programming and Data Processing | | | | 2.4 | % | | | | | | | | |
| | 4,200 | | MongoDB, Inc.—Class A* | | | | | | | | | | | | 426,552 | |
| | | | Crude Petroleum and Natural Gas | | | | 8.1 | % | | | | | | | | |
| | 53,300 | | Carrizo Oil & Gas, Inc.* | | | | | | | | | | | | 585,234 | |
| | 72,400 | | Ring Energy, Inc.* | | | | | | | | | | | | 446,708 | |
| | 128,447 | | Rosehill Resources, Inc.—Class A* | | | | | | | | | | | | 389,194 | |
| | | | | | | | | | | | | | | | 1,421,136
| |
| | | | Eating Places | | | | 3.0 | % | | | | | | | | |
| | 7,000 | | BJ’s Restaurants, Inc. | | | | | | | | | | | | 334,880 | |
| | 8,800 | | Chuy’s Holdings, Inc.* | | | | | | | | | | | | 196,856 | |
| | | | | | | | | | | | | | | | 531,736 | |
| | | | Family Clothing Stores | | | | 5.8 | % | | | | | | | | |
| | 18,400 | | Abercrombie & Fitch Co.—Class A | | | | | | | | | | | | 403,880 | |
| | 30,000 | | American Eagle Outfitters, Inc. | | | | | | | | | | | | 612,000 | |
| | | | | | | | | | | | | | | | 1,015,880 | |
The accompanying notes are an integral part of these financial statements.
JACOB SMALL CAP GROWTH FUND
SCHEDULE OF INVESTMENTS(+) (Continued)
February 28, 2019 (Unaudited)
| Shares | | | | | | | | | | Value | |
| | | COMMON STOCKS—(Continued) | | | | | | 100.0 | % | | | |
| | | Hotels & Motels | | | 0.9 | % | | | | | | | |
| | 20,900 | | Red Lion Hotels Corp.* | | | | | | | | | | $ | 166,782 | |
| | | | Industrial Organic Chemicals | | | 7.2 | % | | | | | | | | |
| | 59,046 | | Codexis, Inc.* | | | | | | | | | | | 1,276,575 | |
| | | | Medical Laboratories | | | 7.1 | % | | | | | | | | |
| | 40,467 | | CareDx, Inc.* | | | | | | | | | | | 1,259,333 | |
| | | | Metal Mining | | | 0.3 | % | | | | | | | | |
| | 160,000 | | Nemaska Lithium, Inc.*^ | | | | | | | | | | | 45,344 | |
| | | | Miscellaneous Business Services | | | 0.8 | % | | | | | | | | |
| | 1,700 | | NV5 Global, Inc.* | | | | | | | | | | | 134,742 | |
| | | | Offices & Clinics of Doctors of Medicine | | | 2.3 | % | | | | | | | | |
| | 6,300 | | Teladoc Health, Inc.* | | | | | | | | | | | 405,468 | |
| | | | Personal Services | | | 3.9 | % | | | | | | | | |
| | 18,500 | | Yelp, Inc.—Class A* | | | | | | | | | | | 689,310 | |
| | | | Pharmaceutical Preparations | | | 8.7 | % | | | | | | | | |
| | 21,500 | | ChemoCentryx, Inc.* | | | | | | | | | | | 231,125 | |
| | 12,434 | | Esperion Therapeutics, Inc.* | | | | | | | | | | | 573,207 | |
| | 104,000 | | Harrow Health, Inc.* | | | | | | | | | | | 721,760 | |
| | | |
| | | | | | | | | | | 1,526,092
| |
| | | | Prepackaged Software | | | 11.0 | % | | | | | | | | |
| | 36,679 | | Cloudera, Inc.* | | | | | | | | | | | 534,413 | |
| | 4,300 | | Instructure, Inc.* | | | | | | | | | | | 200,939 | |
| | 4,900 | | Paylocity Holding Corp.* | | | | | | | | | | | 429,093 | |
| | 5,800 | | SINA Corp.*^ | | | | | | | | | | | 390,746 | |
| | 7,000 | | Tabula Rasa HealthCare, Inc.* | | | | | | | | | | | 385,770 | |
| | | |
| | | | | | | | | | | 1,940,961
| |
| | | | Radio, Television, and Publishers’ Advertising Representatives | | | 4.8 | % | | | | | | | | |
| | 45,600 | | Yext, Inc.* | | | | | | | | | | | 847,248 | |
| | | | Savings Institutions, Not Federally Chartered | | | 2.0 | % | | | | | | | | |
| | 21,670 | | First Northwest Bancorp | | | | | | | | | | | 349,321 | |
| | | | Semiconductors and Related Devices | | | 2.6 | % | | | | | | | | |
| | 16,800 | | CEVA, Inc.* | | | | | | | | | | | 467,376 | |
| | | | Special Industry Machinery | | | 1.0 | % | | | | | | | | |
| | 22,124 | | Energy Recovery, Inc.* | | | | | | | | | | | 177,435 | |
The accompanying notes are an integral part of these financial statements.
JACOB SMALL CAP GROWTH FUND
SCHEDULE OF INVESTMENTS(+) (Continued)
February 28, 2019 (Unaudited)
| Shares | | | | | | | | | | Value | |
| | | COMMON STOCKS—(Continued) | | | | | | 100.0 | % | | | |
| | | State Commercial Banks | | | 2.0 | % | | | | | | | |
| | 16,075 | | First Internet Bancorp | | | | | | | | | | $ | 347,220 | |
| | | | Surgical and Medical Instruments and Apparatus | | | 5.0 | % | | | | | | | | |
| | 464,700 | | Alphatec Holdings, Inc.* | | | | | | | | | | | 738,873 | |
| | 4,000 | | Intersect ENT, Inc.* | | | | | | | | | | | 135,960 | |
| | | | | | | | | | | | | | | 874,833 | |
| | | | Water, Sewer, Pipeline, and Communications | | | | | | | | | | | | |
| | | | and Power Line Construction | | | 1.0 | % | | | | | | | | |
| | 4,000 | | MasTec, Inc.* | | | | | | | | | | | 172,720 | |
| | | | TOTAL COMMON STOCKS (Cost $15,043,708) | | | | | | | | | | | 17,621,456 | |
| | | | | | | | | | | | | | | | |
| | | | WARRANTS | | | 0.0 | % | | | | | | | | |
| | 12,750 | | TearLab Corp.*(a) | | | | | | | | | | | — | |
| | | | TOTAL WARRANTS (Cost $0) | | | | | | | | | | | — | |
| | | | | | | | | | | | | | | | |
| | | | MONEY MARKET FUND | | | | | | | 0.5 | % | | | | |
| | | | Money Market Fund | | | 0.5 | % | | | | | | | | |
| | 83,714 | | First American Government Obligations Fund—Class X, 2.33%(b) | | | | | | | | | | | 83,714 | |
| | | | TOTAL MONEY MARKET FUND (Cost $83,714) | | | | | | | | | | | 83,714 | |
| | | | TOTAL INVESTMENTS (Cost $15,127,422) | | | | | | | 100.5 | % | | | 17,705,170 | |
| | | | LIABILITIES IN EXCESS OF OTHER ASSETS | | | | | | | (0.5 | )% | | | (85,837 | ) |
| | | | TOTAL NET ASSETS | | | | | | | 100.0 | % | | $ | 17,619,333 | |
| * | Non Income Producing. |
| ^ | U.S. Dollar-denominated foreign security. |
| (a) | Level 3 Security. See Note 2. |
| (b) | 7-day yield. |
| (+) | Schedule of Investments is classified using the U.S. Securities and Exchange Commission’s Standard Industrial Classification (SIC) Code List. |
The accompanying notes are an integral part of these financial statements.
JACOB MICRO CAP GROWTH FUND
SCHEDULE OF INVESTMENTS(+)
February 28, 2019 (Unaudited)
| Shares | | | | | | | | | | Value | |
| | | COMMON STOCKS | | | | | | 92.9 | % | | | |
| | | Advertising | | | 3.0 | % | | | | | | | |
| | 232,428 | | IZEA Worldwide, Inc.* | | | | | | | | | | $ | 355,615 | |
| | | | Apparel and Accessory Stores | | | 3.9 | % | | | | | | | | |
| | 70,000 | | RTW RetailWinds, Inc.* | | | | | | | | | | | 212,800 | |
| | 21,800 | | Tilly’s, Inc.—Class A | | | | | | | | | | | 264,434 | |
| | | |
| | | | | | | | | | | 477,234 | |
| | | | Biological Products (No Diagnostic Substances) | | | 1.4 | % | | | | | | | | |
| | 7,800 | | Krystal Biotech, Inc.* | | | | | | | | | | | 174,408 | |
| | | | Bituminous Coal & Lignite Mining | | | 0.7 | % | | | | | | | | |
| | 16,000 | | Ramaco Resources, Inc.* | | | | | | | | | | | 85,280 | |
| | | | Business Services | | | 3.5 | % | | | | | | | | |
| | 20,793 | | OptimizeRx Corp.* | | | | | | | | | | | 298,587 | |
| | 430,000 | | theScore, Inc.—Class A*^ | | | | | | | | | | | 117,634 | |
| | | | | | | | | | | | | | | 416,221 | |
| | | | Calculating and Accounting Machines | | | | | | | | | | | | |
| | | | (No Electronic Computers) | | | 2.6 | % | | | | | | | | |
| | 80,000 | | USA Technologies, Inc.* | | | | | | | | | | | 316,800 | |
| | | | Chemical and Fertilizer Mineral Mining | | | 1.9 | % | | | | | | | | |
| | 77,000 | | Advantage Lithium Corp.*^ | | | | | | | | | | | 30,654 | |
| | 26,400 | | Lithium Americas Corp.*^ | | | | | | | | | | | 97,680 | |
| | 39,000 | | Orocobre Ltd.*^ | | | | | | | | | | | 105,885 | |
| | | |
| | | | | | | | | | | 234,219 | |
| | | | Communications Equipment | | | 4.5 | % | | | | | | | | |
| | 75,599 | | I.D. Systems, Inc.* | | | | | | | | | | | 540,533 | |
| | | | Computer Communications Equipment | | | 4.4 | % | | | | | | | | |
| | 192,879 | | Lantronix, Inc.* | | | | | | | | | | | 526,560 | |
| | | | Computer Peripheral Equipment | | | 11.1 | % | | | | | | | | |
| | 50,674 | | Immersion Corp.* | | | | | | | | | | | 455,052 | |
| | 11,600 | | Impinj, Inc.* | | | | | | | | | | | 194,068 | |
| | 40,425 | | Mitek Systems, Inc.* | | | | | | | | | | | 436,994 | |
| | 298,021 | | Top Image Systems Ltd.*^ | | | | | | | | | | | 248,460 | |
| | | |
| | | | | | | | | | | 1,334,574 | |
| | | | Crude Petroleum & Natural Gas | | | 0.9 | % | | | | | | | | |
| | 17,800 | | Ring Energy, Inc.* | | | | | | | | | | | 109,826 | |
The accompanying notes are an integral part of these financial statements.
JACOB MICRO CAP GROWTH FUND
SCHEDULE OF INVESTMENTS(+) (Continued)
February 28, 2019 (Unaudited)
| Shares | | | | | | | | | | Value | |
| | | COMMON STOCKS—(Continued) | | | | | | 92.9 | % | | | |
| | | Eating Places | | | 2.9 | % | | | | | | | |
| | 4,800 | | BJ’s Restaurants, Inc. | | | | | | | | | | $ | 229,632 | |
| | 5,400 | | Chuy’s Holdings, Inc.* | | | | | | | | | | | 120,798 | |
| | | | | | | | | | | | | | | 350,430 | |
| | | | Gold and Silver Ores | | | 0.5 | % | | | | | | | | |
| | 220,000 | | Solitario Zinc Corp.* | | | | | | | | | | | 63,800 | |
| | | | Hobby, Toy & Game Shops | | | 1.0 | % | | | | | | | | |
| | 24,000 | | Build-A-Bear Workshop, Inc.* | | | | | | | | | | | 123,600 | |
| | | | Hotels & Motels | | | 0.9 | % | | | | | | | | |
| | 14,200 | | Red Lion Hotels Corp.* | | | | | | | | | | | 113,316 | |
| | | | Industrial Organic Chemicals | | | 6.1 | % | | | | | | | | |
| | 34,006 | | Codexis, Inc.* | | | | | | | | | | | 735,210 | |
| | | | Lumber and Other Construction Materials | | | 3.2 | % | | | | | | | | |
| | 110,000 | | Aspen Aerogels, Inc.* | | | | | | | | | | | 380,600 | |
| | | | Medical Laboratories | | | 6.6 | % | | | | | | | | |
| | 25,633 | | CareDx, Inc.* | | | | | | | | | | | 797,699 | |
| | | | Medicinal Chemicals and Botanical Products | | | 0.9 | % | | | | | | | | |
| | 30,000 | | ChromaDex Corp.* | | | | | | | | | | | 104,700 | |
| | | | Metal Mining | | | 0.3 | % | | | | | | | | |
| | 135,000 | | Nemaska Lithium, Inc.*^ | | | | | | | | | | | 38,259 | |
| | | | Patent Owners and Lessors | | | 5.2 | % | | | | | | | | |
| | 197,300 | | Digital Turbine, Inc.* | | | | | | | | | | | 627,414 | |
| | | | Pharmaceutical Preparations | | | 6.1 | % | | | | | | | | |
| | 12,700 | | ChemoCentryx, Inc.* | | | | | | | | | | | 136,525 | |
| | 68,389 | | Harrow Health, Inc.* | | | | | | | | | | | 474,620 | |
| | 9,000 | | Omeros Corp.* | | | | | | | | | | | 129,780 | |
| | | | | | | | | | | | | | | 740,925 | |
| | | | Prepackaged Software | | | 3.5 | % | | | | | | | | |
| | 23,800 | | Inspired Entertainment, Inc.* | | | | | | | | | | | 162,316 | |
| | 3,100 | | Instructure, Inc.* | | | | | | | | | | | 144,863 | |
| | 2,100 | | Tabula Rasa HealthCare, Inc.* | | | | | | | | | | | 115,731 | |
| | | | | | | | | | | | | | | 422,910 | |
| | | | Savings Institutions, Not Federally Chartered | | | 1.8 | % | | | | | | | | |
| | 13,438 | | First Northwest Bancorp | | | | | | | | | | | 216,620 | |
The accompanying notes are an integral part of these financial statements.
JACOB MICRO CAP GROWTH FUND
SCHEDULE OF INVESTMENTS(+) (Continued)
February 28, 2019 (Unaudited)
| Shares | | | | | | | | | | Value | |
| | | COMMON STOCKS—(Continued) | | | | | | 92.9 | % | | | |
| | | Semiconductors and Related Devices | | | 3.8 | % | | | | | | | |
| | 11,440 | | CEVA, Inc.* | | | | | | | | | | $ | 318,261 | |
| | 245,000 | | Netlist, Inc.* | | | | | | | | | | | 139,527 | |
| | | | | | | | | | | | | | | 457,788 | |
| | | | Special Industry Machinery | | | 1.2 | % | | | | | | | | |
| | 18,000 | | Energy Recovery, Inc.* | | | | | | | | | | | 144,360 | |
| | | | State Commercial Banks | | | 1.7 | % | | | | | | | | |
| | 9,215 | | First Internet Bancorp | | | | | | | | | | | 199,044 | |
| | | | Surgical and Medical Instruments and Apparatus | | | 9.3 | % | | | | | | | | |
| | 305,700 | | Alphatec Holdings, Inc.* | | | | | | | | | | | 486,063 | |
| | 104,160 | | iCAD, Inc.* | | | | | | | | | | | 534,341 | |
| | 3,000 | | Intersect ENT, Inc.* | | | | | | | | | | | 101,970 | |
| | | | | | | | | | | | | | | 1,122,374 | |
| | | | TOTAL COMMON STOCKS (Cost $9,201,973) | | | | | | | | | | | 11,210,319 | |
| | | | | | | | | | | | | | | | |
| | | | WARRANTS | | | 0.0 | % | | | | | | | | |
| | 9,750 | | TearLab Corps.*(a) | | | | | | | | | | | — | |
| | | | TOTAL WARRANTS (Cost $0) | | | | | | | | | | | — | |
| | | | MONEY MARKET FUND | | | | | | | 7.7 | % | | | | |
| | | | Money Market Fund | | | 7.7 | % | | | | | | | | |
| | 934,548 | | First American Government Obligations Fund—Class X, 2.33%(b) | | | | | | | | | | | 934,548 | |
| | | | TOTAL MONEY MARKET FUND (Cost $934,548) | | | | | | | | | | | 934,548 | |
| | | | TOTAL INVESTMENTS (Cost $10,136,521) | | | | | | | 100.6 | % | | | 12,144,867 | |
| | | | LIABILITIES IN EXCESS OF OTHER ASSETS | | |
|
| | | (0.6 | )%
| | | (69,949 | )
|
| | | | TOTAL NET ASSETS | | | | | | | 100.0 | % | | $ | 12,074,918 | |
| * | Non Income Producing. |
| ^ | U.S. Dollar-denominated foreign security. |
| (a) | Level 3 Security. See Note 2. |
| (b) | 7-day yield. |
| (+) | Schedule of Investments is classified using the U.S. Securities and Exchange Commission’s Standard Industrial Classification (SIC) Code List. |
The accompanying notes are an integral part of these financial statements.
JACOB FUNDS INC.
STATEMENTS OF ASSETS AND LIABILITIES
February 28, 2019 (Unaudited)
| | | | | | Jacob | | | Jacob | |
| | | Jacob | | | Small Cap | | | Micro Cap | |
| | | Internet Fund | | | Growth Fund | | | Growth Fund | |
| Assets: | | | | | | | | | |
| Investments, at value (cost $30,090,128, $15,127,422 and | | | | | | | | | |
| $10,136,521, respectively) | | $ | 51,329,323 | | | $ | 17,705,170 | | | $ | 12,144,867 | |
| Receivable for capital shares sold | | | 2,693 | | | | — | | | | 783 | |
| Receivable for investments sold | | | 278,048 | | | | 429,351 | | | | 122,229 | |
| Dividend and interest receivable | | | 3,232 | | | | 81 | | | | 1,849 | |
| Prepaid expenses and other assets | | | 17,259 | | | | 21,488 | | | | 22,638 | |
| Total Assets | | | 51,630,555 | | | | 18,156,090 | | | | 12,292,366 | |
| | | | | | | | | | | | | |
| Liabilities: | | | | | | | | | | | | |
| Payable for securities purchased | | | 756,378 | | | | 479,879 | | | | 180,090 | |
| Payable for capital shares repurchased | | | 2,708 | | | | 4,064 | | | | — | |
| Payable for investment adviser fees | | | 46,895 | | | | 6,403 | | | | 1,924 | |
| Payable for distribution and shareholder | | | | | | | | | | | | |
| servicing expenses – Investor Class (see Note 7) | | | 58,278 | | | | 6,066 | | | | 2,042 | |
| Accrued audit fees | | | 7,687 | | | | 7,687 | | | | 7,687 | |
| Accrued directors fees | | | 13,401 | | | | 4,889 | | | | 3,102 | |
| Accrued expenses and other liabilities | | | 49,881 | | | | 27,769 | | | | 22,603 | |
| Total Liabilities | | | 935,228 | | | | 536,757 | | | | 217,448 | |
| Net Assets | | $ | 50,695,327 | | | $ | 17,619,333 | | | $ | 12,074,918 | |
| | | | | | | | | | | | | |
| Net Assets Consist Of: | | | | | | | | | | | | |
| Capital Stock | | $ | 28,046,813 | | | $ | 14,390,130 | | | $ | 11,312,284 | |
| Total distributable earnings | | | 22,648,514 | | | | 3,229,203 | | | | 762,634 | |
| Total Net Assets | | $ | 50,695,327 | | | $ | 17,619,333 | | | $ | 12,074,918 | |
| | | | | | | | | | | | | |
Institutional Class(1) | | | | | | | | | | | | |
| Net Assets | | $ | — | | | $ | 11,805,712 | | | $ | 8,873,486 | |
| Shares outstanding (20 billion shares of $0.001 par value authorized) | | | — | | | | 462,143 | | | | 497,089 | |
Net asset value, redemption price and offering price per share(2) | | $ | — | | | $ | 25.55 | | | $ | 17.85 | |
| Investor Class | | | | | | | | | | | | |
| Net Assets | | $ | 50,695,327 | | | $ | 5,813,621 | | | $ | 3,201,432 | |
| Shares outstanding (20 billion shares of $0.001 par value authorized) | | | 10,158,039 | | | | 231,503 | | | | 195,788 | |
Net asset value, redemption price and offering price per share(2) | | $ | 4.99 | | | $ | 25.11 | | | $ | 16.35 | |
_______________
(1) | The Internet Fund currently offers Investor Class shares only. See Note 1. |
(2) | Redemption of shares held less than 30 days may be charged a 2% redemption fee. See Note 3. |
The accompanying notes are an integral part of these financial statements.
JACOB FUNDS INC.
STATEMENTS OF OPERATIONS
For the Six Months Ended February 28, 2019 (Unaudited)
| | | | | | Jacob | | | Jacob | |
| | | Jacob | | | Small Cap | | | Micro Cap | |
| | | Internet Fund | | | Growth Fund | | | Growth Fund | |
| Investment Income: | | | | | | | | | |
| Dividend income | | $ | 47,592 | | | $ | 39,854 | | | $ | 25,610 | |
| Interest income | | | 14,592 | | | | 920 | | | | 11,511 | |
| Total Investment Income | | | 62,184 | | | | 40,774 | | | | 37,121 | |
| | | | | | | | | | | | | |
| Expenses: | | | | | | | | | | | | |
| Investment advisor fees | | | 281,290 | | | | 72,625 | | | | 60,647 | |
| Distribution and shareholder servicing expenses-Investor Class (See Note 7) | | | 56,258 | | | | 7,301 | | | | 3,553 | |
| Administration fees | | | 28,364 | | | | 21,121 | | | | 19,527 | |
| Fund accounting fees | | | 14,316 | | | | 17,306 | | | | 17,397 | |
| Transfer agent fees | | | 55,147 | | | | 30,914 | | | | 25,137 | |
| Custody fees | | | 3,388 | | | | 3,912 | | | | 3,419 | |
| Federal and state registration | | | 10,888 | | | | 16,570 | | | | 15,385 | |
| Insurance expense | | | 5,581 | | | | 1,923 | | | | 1,027 | |
| Audit fees | | | 7,687 | | | | 7,687 | | | | 7,687 | |
| Legal fees | | | 22,397 | | | | 8,859 | | | | 5,080 | |
| Printing and mailing of reports to shareholders | | | 9,962 | | | | 2,953 | | | | 1,911 | |
| Directors’ fees | | | 23,388 | | | | 10,038 | | | | 6,205 | |
| Miscellaneous expenses | | | 6,329 | | | | 3,035 | | | | 1,724 | |
| Total Expenses | | | 524,995 | | | | 204,244 | | | | 168,699 | |
| Expense Waiver (See Note 6) | | | — | | | | (18,455 | ) | | | (53,985 | ) |
| Net Expenses | | | 524,995 | | | | 185,789 | | | | 114,714 | |
| Net Investment Loss | | | (462,811 | ) | | | (145,015 | ) | | | (77,593 | ) |
| | | | | | | | | | | | | |
| Realized and Unrealized Gain on Investments: | | | | | | | | | | | | |
| Net realized gain on investments | | | 5,028,697 | | | | 2,692,620 | | | | 902,122 | |
| Change in net unrealized appreciation/depreciation on investments | | | (4,782,137 | ) | | | (4,914,496 | ) | | | (1,254,816 | ) |
| Net realized and unrealized gain (loss) on investments | | | 246,560 | | | | (2,221,876 | ) | | | (352,694 | ) |
| Net Decrease in Net Assets Resulting from Operations | | $ | (216,251 | ) | | $ | (2,366,891 | ) | | $ | (430,287 | ) |
The accompanying notes are an integral part of these financial statements.
JACOB FUNDS INC.
JACOB INTERNET FUND
STATEMENTS OF CHANGES IN NET ASSETS
| | | Six Months Ended | | | | |
| | | February 28, 2019 | | | Year Ended | |
| | | (Unaudited) | | | August 31, 2018 | |
| Operations: | | | | | | |
| Net investment loss | | $ | (462,811 | ) | | $ | (1,009,374 | ) |
| Net realized gain on investment transactions | | | 5,028,697 | | | | 4,454,227 | |
| Change in net unrealized appreciation/depreciation on investments | | | (4,782,137 | ) | | | 8,240,717 | |
| Net increase (decrease) in net assets resulting from operations | | | (216,251 | ) | | | 11,685,570 | |
| | | | | | | | | |
| Distributions to Shareholders: | | | | | | | | |
| Net dividends and distributions to shareholders | | | (3,389,843 | ) | | | (5,003,092 | )* |
| | | | | | | | | |
| Capital Share Transactions: (Note 3) | | | | | | | | |
| Proceeds from shares sold | | | 2,052,159 | | | | 1,785,588 | |
| Proceeds from reinvestment of distribution | | | 3,286,016 | | | | 4,841,338 | |
| Cost of shares redeemed | | | (2,278,384 | ) | | | (5,675,451 | ) |
| Redemption fees | | | 1,166 | | | | 465 | |
| Net increase in net assets resulting from capital share transactions | | | 3,060,957 | | | | 951,940 | |
| | | | | | | | | |
| Net Increase (Decrease) in Net Assets | | | (545,137 | ) | | | 7,634,418 | |
| Net Assets: | | | | | | | | |
| Beginning of period/year | | | 51,240,464 | | | | 43,606,046 | |
| End of period/year | | $ | 50,695,327 | | | $ | 51,240,464 | ** |
_______________
| * | | Includes long-term capital gain distribution of $5,003,092. |
| ** | | Includes accumulated net investment loss of $1,506,580. |
The accompanying notes are an integral part of these financial statements.
JACOB FUNDS INC.
JACOB SMALL CAP GROWTH FUND
STATEMENTS OF CHANGES IN NET ASSETS
| | | Six Months Ended | | | | |
| | | February 28, 2019 | | | Year Ended | |
| | | (Unaudited) | | | August 31, 2018 | |
| Operations: | | | | | | |
| Net investment loss | | $ | (145,015 | ) | | $ | (263,602 | ) |
| Net realized gain on investment transactions | | | 2,692,620 | | | | 1,994,513 | |
| Change in net unrealized appreciation/depreciation on investments | | | (4,914,496 | ) | | | 5,690,609 | |
| Net increase (decrease) in net assets resulting from operations | | | (2,366,891 | ) | | | 7,421,520 | |
| | | | | | | | | |
| Distributions to Shareholders: | | | | | | | | |
| Net dividends and distributions to shareholders | | | (185,341 | ) | | | — | |
| | | | | | | | | |
| Capital Share Transactions: (Note 3) | | | | | | | | |
| Proceeds from shares sold | | | 1,573,143 | | | | 1,731,395 | |
| Proceeds from reinvestment of distribution | | | 180,320 | | | | — | |
| Cost of shares redeemed | | | (2,619,434 | ) | | | (2,923,267 | ) |
| Redemption fees | | | 916 | | | | 716 | |
| Net decrease in net assets resulting from capital share transactions | | | (865,055 | ) | | | (1,191,156 | ) |
| | | | | | | | | |
| Net Increase (Decrease) in Net Assets | | | (3,417,287 | ) | | | 6,230,364 | |
| Net Assets: | | | | | | | | |
| Beginning of period/year | | | 21,036,620 | | | | 14,806,256 | |
| End of period/year | | $ | 17,619,333 | | | $ | 21,036,620 | * |
_______________
| * | Includes accumulated net investment loss of $196,949. |
The accompanying notes are an integral part of these financial statements.
JACOB FUNDS INC.
JACOB MICRO CAP GROWTH FUND
STATEMENTS OF CHANGES IN NET ASSETS
| | | Six Months Ended | | | | |
| | | February 28, 2019 | | | Year Ended | |
| | | (Unaudited) | | | August 31, 2018 | |
| Operations: | | | | | | |
| Net investment loss | | $ | (77,593 | ) | | $ | (186,644 | ) |
| Net realized gain on investment transactions | | | 902,122 | | | | 731,995 | |
| Change in net unrealized appreciation/depreciation on investments | | | (1,254,816 | ) | | | 3,913,796 | |
| Net increase (decrease) in net assets resulting from operations | | | (430,287 | ) | | | 4,459,147 | |
| | | | | | | | | |
| Capital Share Transactions: (Note 3) | | | | | | | | |
| Proceeds from shares sold | | | 1,753,843 | | | | 1,609,290 | |
| Cost of shares redeemed | | | (1,203,117 | ) | | | (1,500,576 | ) |
| Redemption fees | | | 2,142 | | | | 667 | |
| Net increase in net assets resulting from capital share transactions | | | 552,868 | | | | 109,381 | |
| | | | | | | | | |
| Net Increase in Net Assets | | | 122,581 | | | | 4,568,528 | |
| Net Assets: | | | | | | | | |
| Beginning of period/year | | | 11,952,337 | | | | 7,383,809 | |
| End of period/year | | $ | 12,074,918 | | | $ | 11,952,337 | * |
_______________
| * | Includes accumulated net investment loss of $125,655. |
The accompanying notes are an integral part of these financial statements.
JACOB FUNDS INC.
JACOB INTERNET FUND – INVESTOR CLASS
FINANCIAL HIGHLIGHTS
The table below sets forth financial data for a share of the Fund outstanding throughout each period/year presented.
| | | Six Months Ended | | | Year Ended August 31, | |
| | | February 28, 2019 | | | 2018 | | | 2017 | | | 2016 | | | 2015 | | | 2014 | |
| | | (Unaudited) | | | | | | | | | | | | | | | | |
| Per Share Data: | | | | | | | | | | | | | | | | | | |
| Net asset value, beginning of period/year | | $ | 5.40 | | | $ | 4.76 | | | $ | 4.39 | | | $ | 3.96 | | | $ | 4.51 | | | $ | 3.81 | |
| | |
| Income (loss) from investment operations: | |
| Net investment loss | | | (0.05 | )(4) | | | (0.11 | )(4) | | | (0.10 | )(4) | | | (0.10 | )(1) | | | (0.08 | )(1) | | | (0.09 | )(1) |
| Net realized and unrealized gain (loss) | |
| on investment transactions | | | 0.00 | (2) | | | 1.31 | | | | 0.67 | | | | 1.02 | | | | (0.03 | ) | | | 0.79 | |
| Total from investment operations | | | (0.05 | ) | | | 1.20 | | | | 0.57 | | | | 0.92 | | | | (0.11 | ) | | | 0.70 | |
| Less distributions from net realized gains | | | (0.36 | ) | | | (0.56 | ) | | | (0.20 | ) | | | (0.49 | ) | | | (0.44 | ) | | | — | |
Paid in capital from redemption fees(2) | | | 0.00 | | | | 0.00 | | | | 0.00 | | | | 0.00 | | | | 0.00 | | | | 0.00 | |
| Net asset value, end of period/year | | $ | 4.99 | | | $ | 5.40 | | | $ | 4.76 | | | $ | 4.39 | | | $ | 3.96 | | | $ | 4.51 | |
| Total return | | | 0.00 | %(5) | | | 28.12 | % | | | 13.65 | % | | | 25.31 | % | | | -2.14 | % | | | 18.37 | % |
| | |
| Supplemental data and ratios: | |
| Net assets, end of period/year (in thousands) | | $ | 50,695 | | | $ | 51,240 | | | $ | 43,606 | | | $ | 43,518 | | | $ | 38,860 | | | $ | 45,546 | |
| Ratio of operating expenses | |
to average net assets(3) | | | 2.33 | %(6) | | | 2.42 | % | | | 2.38 | % | | | 2.60 | % | | | 2.46 | % | | | 2.42 | % |
| Ratio of net investment loss | |
to average net assets(3) | | | (2.06 | )%(6) | | | (2.16 | )% | | | (2.15 | )% | | | (2.47 | )% | | | (1.93 | )% | | | (2.00 | )% |
| Portfolio turnover rate | | | 29 | %(5) | | | 46 | % | | | 46 | % | | | 43 | % | | | 50 | % | | | 56 | % |
_______________
(1) | Net investment loss per share is calculated using ending balances prior to consideration of adjustments for permanent book and tax differences. |
(2) | Less than $0.01 per share. |
(3) | For the period September 1, 2011 through January 2, 2020, the Adviser has contractually agreed to waive its advisory fee in an amount up to an annual rate of 0.10% of the Fund’s average daily net assets, to the extent that the Fund’s gross operating expense ratio exceeds 2.95%, excluding any taxes, interest, brokerage fees, acquired fund fees and expenses, and extraordinary expenses. |
(4) | Net investment loss per share represents net investment loss divided by the average shares outstanding throughout the period/year. |
(5) | Not annualized. |
(6) | Annualized. |
The accompanying notes are an integral part of these financial statements.
JACOB FUNDS INC.
JACOB SMALL CAP GROWTH FUND – INSTITUTIONAL CLASS
FINANCIAL HIGHLIGHTS
The table below sets forth financial data for a share of the Fund outstanding throughout each period/year presented.
| | | Six Months Ended | | | Year Ended August 31, | |
| | | February 28, 2019 | | | 2018 | | | 2017 | | | 2016(1) | | | 2015 | | | 2014 | |
| | | (Unaudited) | | | | | | | | | | | | | | | | |
| Per Share Data: | | | | | | | | | | | | | | | | | | |
| Net asset value, beginning of period/year | | $ | 28.81 | | | $ | 18.52 | | | $ | 16.82 | | | $ | 18.95 | | | $ | 19.01 | | | $ | 17.67 | |
| | |
| Income (loss) from investment operations: | |
Net investment loss(2) | | | (0.19 | ) | | | (0.34 | ) | | | (0.27 | ) | | | (0.29 | ) | | | (0.36 | ) | | | (0.35 | ) |
| Net realized and unrealized gain (loss) | |
| on investment transactions | | | (2.82 | )(3) | | | 10.63 | | | | 1.97 | | | | (1.73 | ) | | | (0.30 | )(3) | | | 1.69 | |
| Total from investment operations | | | (3.01 | ) | | | 10.29 | | | | 1.70 | | | | (2.02 | ) | | | (0.06 | ) | | | 1.34 | |
| Less distributions from return on capital | | | (0.25 | ) | | | — | | | | — | | | | (0.11 | ) | | | — | | | | — | |
| Paid in capital from redemption fees | | | — | | | | 0.00 | (9) | | | — | | | | — | | | | — | | | | — | |
| Net asset value, end of period/year | | $ | 25.55 | | | $ | 28.81 | | | $ | 18.52 | | | $ | 16.82 | | | $ | 18.95 | | | $ | 19.01 | |
| Total return | | | -10.42 | %(5) | | | 55.56 | % | | | 10.11 | %(4) | | | -10.64 | %(4) | | | -0.32 | % | | | 7.58 | % |
| | |
| Supplemental data and ratios: | |
| Net assets, end of period/year (in thousands) | | $ | 11,806 | (6) | | $ | 14,621 | | | $ | 10,480 | | | $ | 12,012 | | | $ | 9,367 | | | $ | 10,164 | |
| Ratio of gross operating expenses | |
| (prior to waiver) to average net assets | | | 2.17 | %(6) | | | 2.46 | % | | | 2.59 | % | | | 2.94 | % | | | 2.17 | % | | | 2.25 | % |
| Ratio of net operating expenses | |
(after waiver) to average net assets(7) | | | 1.95 | %(6) | | | 1.95 | % | | | 1.95 | % | | | 2.04 | % | | | 1.95 | % | | | 1.95 | % |
| Ratio of net investment loss | |
| (prior to waiver) to average net assets | | | (1.72 | )%(6) | | | (2.04 | )% | | | (2.19 | )% | | | (2.80 | )% | | | (2.00 | )% | | | (2.16 | )% |
| Ratio of net investment loss | |
(after waiver) to average net assets(7) | | | (1.50 | )%(6) | | | (1.53 | )% | | | (1.55 | )% | | | (1.90 | )% | | | (1.78 | )% | | | (1.86 | )% |
Portfolio turnover rate(8) | | | 45 | %(5) | | | 81 | % | | | 60 | % | | | 58 | % | | | 84 | % | | | 86 | % |
_______________
(1) | On August 29, 2016, Investor Class shares of the Jacob Wisdom Fund series of Jacob Funds Inc. were reorganized into Institutional Class Shares of the Small Cap Growth Fund. See Note 8. |
(2) | Net investment loss per share represents net investment loss divided by the average shares outstanding throughout the period/year. |
(3) | Due to timing of capital share transactions, the per share amount of net realized and unrealized gain on investment transactions varies from the amount shown in the statement of changes in net assets. |
(4) | Includes adjustments in accordance with GAAP and, consequently, the net asset values used for financial reporting purposes and the returns based upon those net asset values may differ from the net asset values and returns for the shareholder transactions. |
(5) | Not annualized. |
(6) | Annualized. |
(7) | The Adviser has contractually agreed, effective November 12, 2012 (date of reorganization) through January 2, 2020, to waive up to 100% of its advisory fee to the extent that the Fund’s gross operating expense ratio exceeds 1.95%, excluding any taxes, interest, brokerage fees, acquired fund fees and expenses, and extraordinary expenses. |
(8) | Portfolio turnover is calculated on the basis of the Fund as a whole without distinguishing between classes of shares issued. |
(9) | Less than $0.01 per share. |
The accompanying notes are an integral part of these financial statements.
JACOB FUNDS INC.
JACOB SMALL CAP GROWTH FUND – INVESTOR CLASS
FINANCIAL HIGHLIGHTS
The table below sets forth financial data for a share of the Fund outstanding throughout each period/year presented.
| | | Six Months Ended | | | Year Ended August 31, | |
| | | February 28, 2019 | | | 2018 | | | 2017 | | | 2016 | | | 2015 | | | 2014 | |
| | | (Unaudited) | | | | | | | | | | | | | | | | |
| Per Share Data: | |
| Net asset value, beginning of period/year | | $ | 28.36 | | | $ | 18.28 | | | $ | 16.66 | | | $ | 18.81 | | | $ | 18.91 | | | $ | 17.63 | |
| | |
| Income (loss) from investment operations: | |
Net investment loss(1) | | | (0.22 | ) | | | (0.40 | ) | | | (0.32 | ) | | | (0.34 | ) | | | (0.43 | ) | | | (0.40 | ) |
| Net realized and unrealized gain (loss) | | | | | | | | | | | | | | | | | | | | | | | | |
| on investment transactions | | | (2.78 | )(5) | | | 10.48 | | | | 1.94 | | | | (1.71 | ) | | | 0.30 | (5) | | | 1.68 | |
| Total from investment operations | | | (3.00 | ) | | | 10.08 | | | | 1.62 | | | | (2.05 | ) | | | (0.13 | ) | | | 1.28 | |
| Less distributions from net investment income | | | (0.25 | ) | | | — | | | | — | | | | (0.10 | ) | | | — | | | | — | |
| Paid in capital from redemption fees | | | 0.00 | (2) | | | 0.00 | (2) | | | 0.00 | (2) | | | 0.00 | (2) | | | 0.03 | | | | 0.00 | (2) |
| Net asset value, end of period/year | | $ | 25.11 | | | $ | 28.36 | | | $ | 18.28 | | | $ | 16.66 | | | $ | 18.81 | | | $ | 18.91 | |
| Total return | | | -10.55 | %(7) | | | 55.14 | % | | | 9.72 | %(3) | | | -10.64 | %(3) | | | -0.53 | % | | | 7.26 | % |
| | |
| Supplemental data and ratios: | |
| Net assets, end of period/year (in thousands) | | $ | 5,814 | (8) | | $ | 6,415 | | | $ | 4,326 | | | $ | 4,988 | | | $ | 9,246 | | | $ | 6,480 | |
| Ratio of gross operating expenses | |
| (prior to waiver) to average net assets | | | 2.42 | %(8) | | | 2.71 | % | | | 2.84 | % | | | 3.23 | % | | | 2.48 | % | | | 2.59 | % |
| Ratio of net operating expenses | |
(after waiver) to average net assets(4) | | | 2.25 | %(8) | | | 2.25 | % | | | 2.25 | % | | | 2.33 | % | | | 2.25 | % | | | 2.25 | % |
| Ratio of net investment loss | |
| (prior to waiver) to average net assets | | | (1.97 | )%(8) | | | (2.29 | )% | | | (2.44 | )% | | | (3.10 | )% | | | (2.31 | )% | | | (2.51 | )% |
| Ratio of net investment loss | | | | | |
(after waiver) to average net assets(4) | | | (1.80 | )%(8) | | | (1.83 | )% | | | (1.85 | )% | | | (2.20 | )% | | | (2.08 | )% | | | (2.17 | )% |
Portfolio turnover rate(6) | | | 45 | %(7) | | | 81 | % | | | 60 | % | | | 58 | % | | | 84 | % | | | 86 | % |
_______________
(1) | Net investment loss per share represents net investment loss divided by the average shares outstanding throughout the period/year. |
(2) | Amount is less than $0.01. |
(3) | Includes adjustments in accordance with GAAP and, consequently, the net asset values used for financial reporting purposes and the returns based upon those net asset values may differ from the net asset values and returns for the shareholder transactions. |
(4) | The Adviser has contractually agreed, effective November 12, 2012 (date of reorganization) through January 2, 2020, to waive up to 100% of its advisory fee to the extent that the Fund’s gross operating expense ratio exceeds 2.25%, excluding any taxes, interest, brokerage fees, acquired fund fees and expenses, and extraordinary expenses. |
(5) | Due to timing of capital share transactions, the per share amount of net realized and unrealized gain on investment transactions varies from the amount shown in the statement of changes in net assets. |
(6) | Portfolio turnover is calculated on the basis of the Fund as a whole without distinguishing between classes of shares issued. |
(7) | Not annualized. |
(8) | Annualized. |
The accompanying notes are an integral part of these financial statements.
JACOB FUNDS INC.
JACOB MICRO CAP GROWTH FUND – INSTITUTIONAL CLASS
FINANCIAL HIGHLIGHTS
The table below sets forth financial data for a share of the Fund outstanding throughout each period/year presented.
| | | Six Months Ended | | | Year Ended August 31, | |
| | | February 28, 2019 | | | 2018 | | | 2017 | | | 2016 | | | 2015 | | | 2014 | |
| | | (Unaudited) | | | | | | | | | | | | | | | | |
| Per Share Data: | | | | | | | | | | | | | | | | | | |
| Net asset value, beginning of period/year | | $ | 18.50 | | | $ | 11.32 | | | $ | 12.11 | | | $ | 16.86 | | | $ | 20.65 | | | $ | 25.31 | |
| | |
| Income (loss) from investment operations: | |
Net investment loss(1) | | | (0.11 | ) | | | (0.29 | ) | | | (0.28 | ) | | | (0.31 | ) | | | (0.32 | ) | | | (0.45 | ) |
| Net realized and unrealized gain (loss) | | | | | | | | | | | | | | | | | | | | | | | | |
| on investment transactions | | | (0.54 | )(7) | | | 7.47 | | | | (0.51 | ) | | | (1.15 | ) | | | 0.67 | | | | 0.75 | |
| Total from investment operations | | | (0.65 | ) | | | 7.18 | | | | (0.79 | ) | | | (1.46 | ) | | | 0.35 | | | | 0.30 | |
| Less distributions from net realized gains | | — | | | | — | | | | — | | | | (3.29 | ) | | | (4.14 | ) | | | (4.96 | ) |
| Net asset value, end of period/year | | $ | 17.85 | | | $ | 18.50 | | | $ | 11.32 | | | $ | 12.11 | | | $ | 16.86 | | | $ | 20.65 | |
| Total return | | | -3.51 | %(5) | | | 63.43 | % | | | -6.52 | % | | | -7.79 | % | | | 2.23 | % | | | 0.11 | % |
| | |
| Supplemental data and ratios: | |
| Net assets, end of period/year (in thousands) | | $ | 8,873 | | | $ | 9,098 | | | $ | 5,870 | | | $ | 6,782 | | | $ | 8,651 | | | $ | 9,979 | |
| Ratio of gross operating expenses | | | | | | | | | | | | | | | | | | | | | | | | |
| (prior to waiver) to average net assets | | | 2.99 | %(6) | | | 3.50 | % | | | 3.86 | % | | | 3.81 | % | | | 2.97 | % | | | 2.79 | % |
| Ratio of net operating expenses | | | | | | | | | | | | | | | | | | | | | | | | |
| (after waiver) to average net assets | | | 2.00 | %(6)(2) | | | 2.40 | %(2) | | | 2.66 | %(2)(3) | | | 2.61 | %(3) | | | 2.15 | %(3) | | | 2.15 | %(3) |
| Ratio of net investment loss | | | | | | | | | | | | | | | | | | | | | | | | |
| (prior to waiver) to average net assets | | | (2.33 | )%(6) | | | (3.15 | )% | | | (3.65 | )% | | | (3.74 | )% | | | (2.51 | )% | | | (2.61 | )% |
| Ratio of net investment loss | |
| (after waiver) to average net assets | | | (1.34 | )%(6)(2) | | | (2.05 | )%(2) | | | (2.45 | )%(2)(3) | | | (2.54 | )%(3) | | | (1.69 | )%(3) | | | (1.97 | )%(3) |
Portfolio turnover rate(4)
| | | 38 | %(5)
| | | 63 | %
| | | 48 | %
| | | 43 | %
| | | 84
| %
| | | 66 | %
|
_______________
(1) | Net investment loss per share represents net investment loss divided by the average shares outstanding throughout the period/year. |
(2) | The Adviser has contractually agreed, effective December 29, 2016 through at least January 2, 2020, to waive up to 100% of its advisory fee to the extent that the Fund’s gross operating expense ratio exceeds 2.00%, excluding any taxes, interest, brokerage fees, acquired fund fees and expenses, and extraordinary expenses. |
(3) | The Adviser has contractually agreed, effective November 12, 2012 (date of reorganization) through December 28, 2016, to waive up to 100% of its advisory fee to the extent that the Fund’s gross operating expense ratio exceeds 2.15%, excluding any taxes, interest, brokerage fees, acquired fund fees and expenses, and extraordinary expenses. |
(4) | Portfolio turnover is calculated on the basis of the Fund as a whole without distinguishing between classes of shares issued. |
(5) | Not annualized. |
(6) | Annualized. |
(7) | Due to timing of capital share transactions, the per share amount of net realized and unrealized gain on investment transactions varies from the amount shown in the statement of changes in net assets. |
The accompanying notes are an integral part of these financial statements.
JACOB FUNDS INC.
JACOB MICRO CAP GROWTH FUND – INVESTOR CLASS
FINANCIAL HIGHLIGHTS
The table below sets forth financial data for a share of the Fund outstanding throughout each period/year presented.
| | | Six Months Ended | | | Year Ended August 31, | |
| | | February 28, 2019 | | | 2018 | | | 2017 | | | 2016 | | | 2015 | | | 2014 | |
| | | (Unaudited) | | | | | | | | | | | | | | | | |
| Per Share Data: | | | | | | | | | | | | | | | | | | |
| Net asset value, beginning of period/year | | $ | 16.96 | | | $ | 10.40 | | | $ | 11.16 | | | $ | 15.87 | | | $ | 19.73 | | | $ | 24.47 | |
| | | | | | | | | | | | | | | | | | | | | | | | | |
| Income (loss) from investment operations: | | | | | | | | | | | | | | | | | | | | | | | | |
Net investment loss(1) | | | (0.12 | ) | | | (0.30 | ) | | | (0.28 | ) | | | (0.32 | ) | | | (0.35 | ) | | | (0.49 | ) |
| Net realized and unrealized gain (loss) | | | | | | | | | | | | | | | | | | | | | | | | |
| on investment transactions | | | (0.50 | )(8) | | | 6.86 | | | | (0.48 | ) | | | (1.10 | ) | | | 0.63 | | | | 0.71 | |
| Total from investment operations | | | (0.62 | ) | | | 6.56 | | | | (0.76 | ) | | | (1.42 | ) | | | 0.28 | | | | 0.22 | |
| Less distributions from net realized gains | | | — | | | | — | | | | — | | | | (3.29 | ) | | | (4.14 | ) | | | (4.96 | ) |
| Paid in capital from redemption fees | | | 0.01 | | | | — | | | | — | | | | 0.00 | (2) | | | 0.00 | (2) | | | 0.00 | (2) |
| Net asset value, end of period/year | | $ | 16.35 | | | $ | 16.96 | | | $ | 10.40 | | | $ | 11.16 | | | $ | 15.87 | | | $ | 19.73 | |
| Total return | | | -3.60 | %(7) | | | 63.08 | % | | | -6.81 | % | | | -8.06 | % | | | 1.93 | % | | | -0.25 | % |
| | | | | | | | | | | | | | | | | | | | | | | | | |
| Supplemental data and ratios: | | | | | | | | | | | | | | | | | | | | | | | | |
| Net assets, end of period/year (in thousands) | | $ | 3,201 | | | $ | 2,854 | | | $ | 1,514 | | | $ | 2,037 | | | $ | 2,603 | | | $ | 2,958 | |
| Ratio of gross operating expenses | | | | | | | | | | | | | | | | | | | | | | | | |
| (prior to waiver or reimbursements) | | | 3.25 | %(6) | | | 3.74 | % | | | 4.11 | % | | | 4.16 | % | | | 3.32 | % | | | 314 | % |
| Ratio of net operating expenses | | | | | | | | | | | | | | | | | | | | | | | | |
| (after waiver or reimbursements) | | | 2.30 | %(6)(3) | | | 2.64 | %(3) | | | 2.91 | %(3)(4) | | | 2.96 | %(4) | | | 2.45 | %(4) | | | 2.45 | %(4) |
| Ratio of net investment loss | | | | | | | | | | | | | | | | | | | | | | | | |
| (prior to waiver or reimbursements) | | | (2.55 | )%(6) | | | (3.41 | )% | | | (3.90 | )% | | | (4.09 | )% | | | (2.86 | )% | | | (2.96 | )% |
| Ratio of net investment loss | | | | | | | | | | | | | | | | | | | | | | | | |
| (after waiver or reimbursements) | | | (1.60 | )%(6)(3) | | | (2.31 | )%(3) | | | (2.70 | )%(3)(4) | | | (2.89 | )%(4) | | | (1.99 | )%(4) | | | (2.27 | )%(4) |
Portfolio turnover rate(5) | | | 38 | %(7) | | | 63 | % | | | 48 | % | | | 43 | % | | | 84 | % | | | 66 | % |
_______________
(1) | Net investment loss per share represents net investment loss divided by the average shares outstanding throughout the period/year. |
(2) | Less than $0.01 per share. |
(3) | The Adviser has contractually agreed, effective December 29, 2016 through at least January 2, 2020, to waive up to 100% of its advisory fee to the extent that the Fund’s gross operating expense ratio exceeds 2.30%, excluding any taxes, interest, brokerage fees, acquired fund fees and expenses, and extraordinary expenses. |
(4) | The Adviser has contractually agreed, effective November 12, 2012 (date of reorganization) through December 28, 2016, to waive up to 100% of its advisory fee to the extent that the Fund’s gross operating expense ratio exceeds 2.45%, excluding any taxes, interest, brokerage fees, acquired fund fees and expenses, and extraordinary expenses. |
(5) | Portfolio turnover is calculated on the basis of the Fund as a whole without distinguishing between classes of shares issued. |
(6) | Not annualized. |
(7) | Annualized. |
(8) | Due to timing of capital share transactions, the per share amount of net realized and unrealized gain on investment transactions varies from the amount shown in the statement of changes in net assets. |
The accompanying notes are an integral part of these financial statements.
JACOB FUNDS INC.
NOTES TO THE FINANCIAL STATEMENTS
February 28, 2019 (Unaudited)
NOTE 1—DESCRIPTION OF ORGANIZATION
Jacob Funds Inc. (the “Corporation”) was organized as a Maryland corporation on July 13, 1999 and is registered under the Investment Company Act of 1940, as amended (the “1940 Act”), as an open-end management investment company issuing its shares in series. The Corporation currently consists of three “diversified” series, the Jacob Internet Fund (the “Internet Fund”), the Jacob Small Cap Growth Fund (the “Small Cap Growth Fund”) and the Jacob Micro Cap Growth Fund (the “Micro Cap Growth Fund”), each a “Fund”, collectively the “Funds”, and the authorized capital stock of the Corporation consists of twenty billion shares of stock having a par value of one-tenth of one cent ($0.001) per share. The primary investment objective of the Internet Fund is long-term growth of capital with current income as a secondary objective. The primary investment objective of the Small Cap Growth Fund and Micro Cap Growth Fund is long-term growth of capital.
The Internet Fund commenced operations on December 14, 1999. The Small Cap Growth Fund commenced operations on February 1, 2010 when it acquired the assets and liabilities of the Rockland Small Cap Growth Fund series of Rockland Funds Trust in a reorganization transaction (the Small Cap Growth Fund is the successor fund to the Rockland Small Cap Growth Fund). The Small Cap Growth Fund acquired the Class I and Class R shares of the Jacob Small Cap Growth Fund II (formerly, PineBridge US Small Cap Growth Fund) series of Jacob Funds II (formerly, the PineBridge Mutual Funds) (the “Predecessor Small Cap Growth Fund”) on November 12, 2012. The Small Cap Growth Fund acquired the Investor Class shares of the Jacob Wisdom Fund series of the Corporation on August 26, 2016. The Micro Cap Growth Fund commenced operations on November 12, 2012 when it acquired the assets and liabilities of the Jacob Micro Cap Growth Fund (formerly, PineBridge US Micro Cap Growth Fund) series of Jacob Funds II (the “Predecessor Micro Cap Growth Fund”) in a reorganization transaction (the Micro Cap Growth Fund is the successor fund to the Predecessor Micro Cap Growth Fund).
The Internet Fund currently offers Investor Class shares. The Small Cap Growth Fund and Micro Cap Growth Fund currently offer Investor Class and Institutional Class shares. Each share of each class of a Fund represents an equal pro rata interest in such Fund and provides the shareholder the same voting, dividend, and other rights, except that shareholders of each class of a Fund have exclusive voting rights regarding any matter relating solely to that particular class. Shareholders may be charged a redemption fee of 2% if the shares are redeemed within 30 days of initial investment.
NOTE 2—SIGNIFICANT ACCOUNTING POLICIES
The following is a summary of significant accounting policies consistently followed by the Funds. These policies are in conformity with accounting principles generally accepted in the United States of America (“GAAP”). The Funds are investment companies and follow accounting and reporting guidance under the Financial Accounting Standards Board (“FASB”) Accounting Standards Codification (“ASC”) Topic 946, “Financial Services – Investment Companies”.
| | (a) Investment Valuation—Investment securities traded on a national securities exchange are valued at their market value determined by their last sales price in the principal market in which these securities are normally traded (except those traded on the NASDAQ National Market and Capital Market exchanges which are valued at the NASDAQ Official Closing Price (“NOCP”)), unless there are no transactions on the valuation date, in which case they are valued at the mean between the closing bid and ask prices. Securities traded over-the-counter are valued at the last reported sales price unless there is no reported sales price, in which case the mean between the closing bid and ask prices is used. Foreign securities, currencies and other assets denominated in foreign currencies are translated into U.S. dollars at the exchange rate of such currencies. Foreign equity securities are valued at the last |
JACOB FUNDS INC.
NOTES TO THE FINANCIAL STATEMENTS (Continued)
February 28, 2019 (Unaudited)
| | sale price at the close of the exchange on which the security is principally traded. The Funds values foreign securities at fair value, using fair valuation procedures approved by the Board of Directors, taking into account the occurrence of events after the close of foreign markets in calculating the NAV. In such cases, use of fair valuation can reduce an investor’s ability to seek profit by estimating the fund’s NAV in advance of the time the NAV is calculated. The Board of Directors have retained an independent fair value pricing service to assist in valuing foreign securities held by the Funds. Debt securities with maturities of 60 days or less are valued at amortized cost, which approximates market value. Short-term securities with 60 days or less remaining to maturity are, unless conditions indicate otherwise, amortized to maturity based on their cost to a Fund if acquired within 60 days of maturity or, if already held by a Fund on the 60th day, based on the value determined on the 61st day. If amortized cost does not approximate fair value, short-term securities are reported at fair value. Where market quotations are not readily available, are unreliable or when values have been materially affected by events occurring before the close of U.S. markets but after the close of the securities’ primary markets, securities are valued at fair value using procedures approved by the Board of Directors that are designed to determine a security’s fair value. |
| | |
| | The Funds adhere to fair valuation accounting standards which provide an authoritative definition of fair value and set out a hierarchy for measuring fair value. These standards require disclosures about the various inputs and valuation techniques used to develop the measurements of fair value and a discussion in changes in valuation techniques and related inputs during the period. These standards define fair value as the price that would be received to sell an asset or paid to transfer a liability in an orderly transaction between market participants at the measurement date. The fair value hierarchy is organized into three levels based upon the assumptions (referred to as “inputs”) used in pricing the asset or liability. These standards state that “observable inputs” reflect the assumptions market participants would use in pricing the asset or liability based on market data obtained from independent sources and “unobservable inputs” reflect an entity’s own assumptions about the assumptions market participants would use in pricing the asset or liability. |
| | |
| | Summary of Fair Value Exposure |
| | |
| | Various inputs are used in determining the value of the Funds’ investments. These inputs are summarized in the three broad levels listed below:
|
| | | |
|
| | | Level 1—Unadjusted quoted prices in active markets for identical assets or liabilities that the Funds have the ability to access. |
| | | |
|
| | | Level 2—Observable inputs other than quoted prices included in Level 1 that are observable for the asset or liability, either directly or indirectly. These inputs may include quoted prices for the identical instrument in an inactive market, prices for similar instruments, interest rates, prepayment speeds, credit risk, yield curves, default rates and similar data. |
| | | |
|
| | | Level 3—Unobservable inputs for the asset or liability, to the extent relevant observable inputs are not available, representing the Funds’ own assumptions about the assumptions a market participant would use in valuing the asset or liability, and based on the best information available. |
| | The inputs or methodology used for valuing securities are not necessarily an indication of the risk associated with investing in those securities. |
JACOB FUNDS INC.
NOTES TO THE FINANCIAL STATEMENTS (Continued)
February 28, 2019 (Unaudited)
| | The following is a summary of the inputs used to value the Internet Fund’s investments as of February 28, 2019: |
| | | | Level 1 | | | Level 2 | | | Level 3 | | | Total | |
| | Common Stocks | | | | | | | | | | | | |
| | Prepackaged Software | | $ | 13,791,400 | | | $ | — | | | $ | — | | | $ | 13,791,400 | |
| | Computer Programing and Data Processing | | | 7,174,860 | | | | 1,284,698 | (a) | | | — | | | | 8,459,558 | |
| | Business Services | | | 6,727,818 | | | | — | | | | — | | | | 6,727,818 | |
| | Computer Peripheral Equipment | | | 4,393,292 | | | | — | | | | — | | | | 4,393,292 | |
| | Patent Owners and Lessors | | | 2,343,965 | | | | — | | | | — | | | | 2,343,965 | |
| | Radio, Television, and Publishers’ | | | | | | | | | | | | | | | | |
| | Advertising Representatives | | | 2,341,080 | | | | — | | | | — | | | | 2,341,080 | |
| | Savings Institutions, Federally Chartered | | | 2,204,550 | | | | — | | | | — | | | | 2,204,550 | |
| | Personal Services | | | 2,012,040 | | | | — | | | | — | | | | 2,012,040 | |
| | Communications Equipment | | | 1,556,841 | | | | — | | | | — | | | | 1,556,841 | |
| | Calculating and Accounting Machines | | | | | | | | | | | | | | | | |
| | (No Electronic Computers) | | | 1,306,800 | | | | — | | | | — | | | | 1,306,800 | |
| | Semiconductors and Related Devices | | | 1,296,412 | | | | — | | | | — | | | | 1,296,412 | |
| | Electronic Computers | | | 1,246,680 | | | | — | | | | — | | | | 1,246,680 | |
| | Offices & Clinics of Doctors of Medicine | | | 1,171,352 | | | | — | | | | — | | | | 1,171,352 | |
| | State Commercial Banks | | | 955,930 | | | | — | | | | — | | | | 955,930 | |
| | Transportation Services | | | 665,874 | | | | — | | | | — | | | | 665,874 | |
| | Total Common Stocks | | | 49,188,894 | | | | 1,284,698 | | | | — | | | | 50,473,592 | |
| | Short Term Investment | | | | | | | | | | | | | | | | |
| | Money Market Fund | | | 855,731 | | | | — | | | | — | | | | 855,731 | |
| | Total Investments in Securities | | $ | 50,044,625 | | | $ | 1,284,698 | | | $ | — | | | $ | 51,329,323 | |
| | (a) | Certain non-U.S. dollar denominated securities use systematic fair valuation. |
JACOB FUNDS INC.
NOTES TO THE FINANCIAL STATEMENTS (Continued)
February 28, 2019 (Unaudited)
| | The following is a summary of the inputs used to value the Small Cap Growth Fund’s investments as of February 28, 2019: |
| | | | Level 1 | | | Level 2 | | | Level 3 | | | Total | |
| | Common Stocks | | | | | | | | | | | | |
| | Prepackaged Software | | $ | 1,940,961 | | | $ | — | | | $ | — | | | $ | 1,940,961 | |
| | Computer Peripheral Equipment | | | 1,564,077 | | | | — | | | | — | | | | 1,564,077 | |
| | Pharmaceutical Preparations | | | 1,526,092 | | | | — | | | | — | | | | 1,526,092 | |
| | Crude Petroleum & Natural Gas | | | 1,421,136 | | | | — | | | | — | | | | 1,421,136 | |
| | Industrial Organic Chemicals | | | 1,276,575 | | | | — | | | | — | | | | 1,276,575 | |
| | Medical Laboratories | | | 1,259,333 | | | | — | | | | — | | | | 1,259,333 | |
| | Family Clothing Stores | | | 1,015,880 | | | | — | | | | — | | | | 1,015,880 | |
| | Surgical and Medical Instruments and Apparatus | | | 874,833 | | | | — | | | | — | | | | 874,833 | |
| | Radio, Television, and Publishers’ | | | | | | | | | | | | | | | | |
| | Advertising Representatives | | | 847,248 | | | | — | | | | — | | | | 847,248 | |
| | Personal Services | | | 689,310 | | | | — | | | | — | | | | 689,310 | |
| | Apparel and Accessory Stores | | | 566,712 | | | | — | | | | — | | | | 566,712 | |
| | Eating Places | | | 531,736 | | | | — | | | | — | | | | 531,736 | |
| | Chemical and Fertilizer Mineral Mining | | | 504,273 | | | | — | | | | — | | | | 504,273 | |
| | Semiconductors and Related Devices | | | 467,376 | | | | — | | | | — | | | | 467,376 | |
| | Calculating and Accounting Machines | | | | | | | | | | | | | | | | |
| | (No Electronic Computers) | | | 443,520 | | | | — | | | | — | | | | 443,520 | |
| | Computer Programming and Data Processing | | | 426,552 | | | | — | | | | — | | | | 426,552 | |
| | Office and Clinics of Doctors of Medicine | | | 405,468 | | | | — | | | | — | | | | 405,468 | |
| | Business Services | | | 373,650 | | | | — | | | | — | | | | 373,650 | |
| | Savings Institutions, Not Federally Chartered | | | 349,321 | | | | — | | | | — | | | | 349,321 | |
| | State Commercial Banks | | | 347,220 | | | | — | | | | — | | | | 347,220 | |
| | Special Industry Machinery | | | 177,435 | | | | — | | | | — | | | | 177,435 | |
| | Water, Sewer, Pipeline, and Communications | | | | | | | | | | | | | | | | |
| | and Power Line Construction | | | 172,720 | | | | — | | | | — | | | | 172,720 | |
| | Hotels & Motels | | | 166,782 | | | | — | | | | — | | | | 166,782 | |
| | Miscellaneous Business Services | | | 134,742 | | | | — | | | | — | | | | 134,742 | |
| | Bituminous Coal and Lignite Surface Mining | | | 93,160 | | | | — | | | | — | | | | 93,160 | |
| | Metal Mining | | | 45,344 | | | | — | | | | — | | | | 45,344 | |
| | Total Common Stocks | | | 17,621,456 | | | | — | | | | — | | | | 17,621,456 | |
| | Warrants | | | — | | | | — | | | | — | (a) | | | — | |
| | Short Term Investment | | | | | | | | | | | | | | | | |
| | Money Market Fund | | | 83,714 | | | | — | | | | — | | | | 83,714 | |
| | Total Investments in Securities | | $ | 17,705,170 | | | $ | — | | | $ | — | | | $ | 17,705,170 | |
| | (a) | These warrants have a value of $0. Due to immateriality, no Level 3 rollforward has been presented. |
JACOB FUNDS INC.NOTES TO THE FINANCIAL STATEMENTS (Continued)
February 28, 2019 (Unaudited)
| | The following is a summary of the inputs used to value the Micro Cap Growth Fund’s investments as of February 28, 2019: |
| | | | Level 1 | | | Level 2 | | | Level 3 | | | Total | |
| | Common Stocks | | | | | | | | | | | | |
| | Computer Peripheral Equipment | | $ | 1,334,574 | | | $ | — | | | $ | — | | | $ | 1,334,574 | |
| | Surgical and Medical Instruments and Apparatus | | | 1,122,374 | | | | — | | | | — | | | | 1,122,374 | |
| | Medical Laboratories | | | 797,699 | | | | — | | | | — | | | | 797,699 | |
| | Pharmaceutical Preparations | | | 740,925 | | | | — | | | | — | | | | 740,925 | |
| | Industrial Organic Chemicals | | | 735,210 | | | | — | | | | — | | | | 735,210 | |
| | Patent Owners and Lessors | | | 627,414 | | | | — | | | | — | | | | 627,414 | |
| | Communications Equipment | | | 540,533 | | | | — | | | | — | | | | 540,533 | |
| | Computer Communications Equipment | | | 526,560 | | | | — | | | | — | | | | 526,560 | |
| | Apparel and Accessory Stores | | | 477,234 | | | | — | | | | — | | | | 477,234 | |
| | Semiconductors and Related Devices | | | 457,788 | | | | — | | | | — | | | | 457,788 | |
| | Prepackaged Software | | | 422,910 | | | | — | | | | — | | | | 422,910 | |
| | Business Services | | | 416,221 | | | | — | | | | — | | | | 416,221 | |
| | Lumber and Other Construction Materials | | | 380,600 | | | | — | | | | — | | | | 380,600 | |
| | Advertising | | | 355,615 | | | | — | | | | — | | | | 355,615 | |
| | Eating Places | | | 350,430 | | | | — | | | | — | | | | 350,430 | |
| | Calculating and Accounting Machines | | | | | | | | | | | | | | | | |
| | (No Electronic Computers) | | | 316,800 | | | | — | | | | — | | | | 316,800 | |
| | Chemical and Fertilizer Mineral Mining | | | 234,219 | | | | — | | | | — | | | | 234,219 | |
| | Savings Institutions, Not Federally Chartered | | | 216,620 | | | | — | | | | — | | | | 216,620 | |
| | State Commercial Banks | | | 199,044 | | | | — | | | | — | | | | 199,044 | |
| | Biological Products (No Diagnostic Substances) | | | 174,408 | | | | — | | | | — | | | | 174,408 | |
| | Special Industry Machinery | | | 144,360 | | | | — | | | | — | | | | 144,360 | |
| | Hobby, Toy & Game Shops | | | 123,600 | | | | — | | | | — | | | | 123,600 | |
| | Hotels & Motels | | | 113,316 | | | | — | | | | — | | | | 113,316 | |
| | Crude Petroleum & Natural Gas | | | 109,826 | | | | — | | | | — | | | | 109,826 | |
| | Medicinal Chemicals and Botanical Products | | | 104,700 | | | | — | | | | — | | | | 104,700 | |
| | Bituminous Coal & Lignite Mining | | | 85,280 | | | | — | | | | — | | | | 85,280 | |
| | Gold and Silver Ores | | | 63,800 | | | | — | | | | — | | | | 63,800 | |
| | Metal Mining | | | 38,259 | | | | — | | | | — | | | | 38,259 | |
| | Total Common Stocks | | | 11,210,319 | | | | — | | | | — | | | | 11,210,319 | |
| | Warrants | | | — | | | | — | | | | — | (a) | | | — | |
| | Short Term Investment | | | | | | | | | | | | | | | | |
| | Money Market Fund | | | 934,548 | | | | — | | | | — | | | | 934,548 | |
| | Total Investments in Securities | | $ | 12,144,867 | | | $ | — | | | $ | — | | | $ | 12,144,867 | |
| | (a) | These warrants have a value of $0. Due to immateriality, no Level 3 rollforward has been presented. |
JACOB FUNDS INC.
NOTES TO THE FINANCIAL STATEMENTS (Continued)
February 28, 2019 (Unaudited)
| | (b) Income Recognition—Interest income is accrued as earned. Dividend income is recorded on the ex-dividend date. |
| | |
| | (c) Expenses—Expenses that are not attributable to a particular Fund are typically allocated in proportion to each Fund’s respective net assets. Expenses are allocated to a particular share class in proportion to each class’s respective net assets. Expenses are recorded on an accrual basis. |
| | |
| | (d) Securities Transactions—Security transactions are accounted for on trade date. Realized gains and losses on securities sold are determined using specific identification. |
| | |
| | (e) Foreign Currency Transactions—The books and records are maintained in U.S. dollars. Foreign currency denominated transactions (i.e., market value of investment securities, assets and liabilities, purchases and sales of investment securities, and income and expenses) are translated into U.S. dollars at the current rate of exchange. |
| | |
| | The Funds do not isolate that portion of the results of operations resulting from changes in foreign exchange rates on investments from the fluctuations arising from changes in market prices of securities held. Such fluctuations are included with the net realized and unrealized gain or loss from investments. |
| | |
| | (f) Distributions to Shareholders—The Funds record distributions to shareholders on the ex-dividend date. Dividends from net investment income, if any, are declared and paid annually. Distributions of net realized capital gains, if any, will be declared and distributed annually. The amounts of distributions from net investment income and net realized capital gains are determined in accordance with federal income tax regulations, which may differ from those amounts determined under GAAP. These book/tax differences are either temporary or permanent in nature. To the extent these differences are permanent, reclassifications are made in the capital accounts in the period that the differences arise. The reclassifications have no effect on net assets or net asset value per share. |
| | |
| | (g) Federal Income Taxes—The Funds comply with provisions of Subchapter M of the Internal Revenue Code applicable to regulated investment companies, including the distribution of substantially all of the Funds’ taxable income. Accordingly, no provision for federal income taxes is considered necessary in the financial statements. |
| | |
| | The Funds follow accounting standards regarding recognition and measurement of tax positions taken on a tax return. No material uncertain tax positions existed as of August 31, 2018. As a result, the Funds have not recorded any liabilities for uncertain tax positions as of August 31, 2018. The standards require the Funds to analyze all open tax years, as defined by the Statute of Limitations, for all major jurisdictions. Open tax years are those that are open for examinations by taxing authorities. As of August 31, 2018, open federal tax years include the tax years ended August 31, 2015 through August 31, 2017 and expected to be taken for tax years ended August 31, 2018, for each of the Funds. |
| | |
| | (h) Use of Estimates—The preparation of financial statements in conformity with GAAP requires management to make estimates and assumptions that affect the reported amount of assets and liabilities and disclosure of contingent assets and liabilities at the date of the financial statements and the reported amounts of revenues and expenses during the reporting period. Actual results could differ from those estimates. |
| | |
| | (i) Contingencies and Commitments—The Funds indemnify the Corporation’s Officers and Directors for certain liabilities that might arise from their performance of their duties to the Funds. Additionally, in the normal course of business, the Funds enter into contracts that contain a variety of representations and warranties and which provide general indemnifications. Each Fund’s maximum exposure under these arrangements is unknown, as this would involve future claims that may be made against the Funds that have not yet occurred. However, based on experience, the Corporation expects the risk of loss to be remote. |
JACOB FUNDS INC.
NOTES TO THE FINANCIAL STATEMENTS (Continued)
February 28, 2019 (Unaudited)
NOTE 3—CAPITAL SHARE TRANSACTIONS
At February 28, 2019, there were twenty billion shares, $0.001 par value, authorized for the Corporation. Transactions in shares of the Internet Fund were as follows:
| | | | Six Months Ended | | | Year Ended | |
| | | | February 28, 2019 | | | August 31, 2018 | |
| | | | Shares | | | Amount | | | Shares | | | Amount | |
| | Sales | | | 423,900 | | | $ | 2,052,159 | | | | 353,296 | | | $ | 1,785,588 | |
| | Reinvestments | | | 738,431 | | | | 3,286,016 | | | | 1,125,893 | | | | 4,841,338 | |
| | Redemptions | | | (484,616 | ) | | | (2,278,384 | ) | | | (1,168,180 | ) | | | (5,675,451 | ) |
| | Redemption fees | | | — | | | | 1,166 | | | | — | | | | 465 | |
| | Net increase | | | 677,715 | | | $ | 3,060,957 | | | | 311,009 | | | $ | 951,940 | |
| | Shares Outstanding: | | | | | | | | | | | | | | | | |
| | Beginning of period/year | | | 9,480,324 | | | | | | | | 9,169,315 | | | | | |
| | End of period/year | | | 10,158,039 | | | | | | | | 9,480,324 | | | | | |
Transactions in shares of the Small Cap Growth Fund were as follows:
Institutional Class
| | | | Six Months Ended | | | Year Ended | |
| | | | February 28, 2019 | | | August 31, 2018 | |
| | | | Shares | | | Amount | | | Shares | | | Amount | |
| | Sales | | | 10,811 | | | $ | 276,096 | | | | 33,533 | | | $ | 813,745 | |
| | Reinvestments | | | 4,905 | | | | 121,788 | | | | — | | | | — | |
| | Redemptions | | | (61,114 | ) | | | (1,487,214 | ) | | | (91,853 | ) | | | (1,901,400 | ) |
| | Redemption fees | | | — | | | | — | | | | — | | | | 3 | |
| | Net decrease | | | (45,398 | ) | | $ | (1,089,330 | ) | | | (58,320 | ) | | $ | (1,087,652 | ) |
| | Shares Outstanding: | | | | | | | | | | | | | | | | |
| | Beginning of period/year | | | 507,541 | | | | | | | | 565,861 | | | | | |
| | End of period/year | | | 462,143 | | | | | | | | 507,541 | | | | | |
JACOB FUNDS INC.
NOTES TO THE FINANCIAL STATEMENTS (Continued)
February 28, 2019 (Unaudited)
Investor Class
| | | | Six Months Ended | | | Year Ended | |
| | | | February 28, 2019 | | | August 31, 2018 | |
| | | | Shares | | | Amount | | | Shares | | | Amount | |
| | Sales | | | 49,726 | | | $ | 1,297,047 | | | | 35,388 | | | $ | 917,650 | |
| | Reinvestments | | | 2,396 | | | | 58,532 | | | | — | | | | — | |
| | Redemptions | | | (46,838 | ) | | | (1,132,220 | ) | | | (45,760 | ) | | | (1,021,867 | ) |
| | Redemption fees | | | — | | | | 916 | | | | — | | | | 713 | |
| | Net increase (decrease) | | | 5,284 | | | $ | 224,275 | | | | (10,372 | ) | | $ | (103,504 | ) |
| | Shares Outstanding: | | | | | | | | | | | | | | | | |
| | Beginning of period/year | | | 226,219 | | | | | | | | 236,591 | | | | | |
| | End of period/year | | | 231,503 | | | | | | | | 226,219 | | | | | |
| | Total decrease for the Fund | | | | | | $ | (865,055 | ) | | | | | | $ | (1,191,156 | ) |
Transactions in shares of the Micro Cap Growth Fund were as follows:
Institutional Class
| | | | Six Months Ended | | | Year Ended | |
| | | | February 28, 2019 | | | August 31, 2018 | |
| | | | Shares | | | Amount | | | Shares | | | Amount | |
| | Sales | | | 22,372 | | | $ | 373,770 | | | | 45,741 | | | $ | 651,270 | |
| | Redemptions | | | (17,074 | ) | | | (272,054 | ) | | | (72,349 | ) | | | (947,002 | ) |
| | Net increase (decrease) | | | 5,298 | | | $ | 101,716 | | | | (26,608 | ) | | $ | (295,732 | ) |
| | Shares Outstanding: | | | | | | | | | | | | | | | | |
| | Beginning of period/year | | | 491,791 | | | | | | | | 518,399 | | | | | |
| | End of period/year | | | 497,089 | | | | | | | | 491,791 | | | | | |
Investor Class
| | | | Six Months Ended | | | Year Ended | |
| | | | February 28, 2019 | | | August 31, 2018 | |
| | | | Shares | | | Amount | | | Shares | | | Amount | |
| | Sales | | | 88,145 | | | $ | 1,380,073 | | | | 66,299 | | | $ | 958,020 | |
| | Redemptions | | | (60,633 | ) | | | (931,063 | ) | | | (43,500 | ) | | | (553,574 | ) |
| | Redemption fees | | | — | | | | 2,142 | | | | — | | | | 667 | |
| | Net increase | | | 27,512 | | | $ | 451,152 | | | | 22,799 | | | $ | 405,113 | |
| | Shares Outstanding: | | | | | | | | | | | | | | | | |
| | Beginning of period/year | | | 168,276 | | | | | | | | 145,477 | | | | | |
| | End of period/year | | | 195,788 | | | | | | | | 168,276 | | | | | |
| | Total increase for the Fund | | | | | | $ | 552,868 | | | | | | | $ | 109,381 | |
JACOB FUNDS INC.NOTES TO THE FINANCIAL STATEMENTS (Continued)
February 28, 2019 (Unaudited)
A 2% redemption fee is assessed on any shares of the Funds, except those received from reinvested distributions, that are sold within 30 days following their purchase date.
From time to time, the Funds may have a concentration of shareholders holding a significant percentage of shares outstanding. Investment activities of these shareholders could have a material impact on the Funds. The following table shows the number of shareholders owning greater than 10% of the outstanding shares in each of the Funds at February 28, 2019:
| | | Number of shareholders owning greater |
| | Fund | than 10% of outstanding Fund shares |
| | Internet Fund | 1 |
| | Small Cap Growth Fund Institutional Class | 2 |
| | Small Cap Growth Fund Investor Class | 1 |
| | Micro Cap Growth Fund Institutional Class | 2 |
| | Micro Cap Growth Fund Investor Class | 1 |
NOTE 4—INVESTMENT TRANSACTIONS
During the six months ended February 28, 2019, purchases and sales of investment securities (excluding short-term investments) for the Funds were as follows:
| | Fund | | Purchases | | | Sales | |
| | Internet Fund | | $ | 14,266,150 | | | $ | 13,327,915 | |
| | Small Cap Growth Fund | | | 8,405,410 | | | | 9,465,415 | |
| | Micro Cap Growth Fund | | | 4,886,429 | | | | 3,959,371 | |
The Funds did not purchase long-term U.S. Government securities as a part of their investment strategies during the six months ended February 28, 2019.
NOTE 5—TAX INFORMATION
At August 31, 2018, the components of accumulated earnings/(losses) on a tax basis for the Funds were as follows:
| | | Internet | | | Small Cap | | | Micro Cap | |
| | | Fund | | | Growth Fund | | | Growth Fund | |
| Cost of Investments | | $ | 26,732,750 | | | $ | 13,690,457 | | | $ | 8,688,961 | |
| Gross unrealized appreciation | | | 26,333,921 | | | | 8,110,040 | | | | 4,044,320 | |
| Gross unrealized depreciation | | | (1,530,632 | ) | | | (682,400 | ) | | | (810,961 | ) |
| Net unrealized appreciation (depreciation) | | $ | 24,803,289 | | | $ | 7,427,640 | | | $ | 3,233,359 | |
| Undistributed long-term capital gains | | | 2,221,052 | | | | — | | | | — | |
| Total distributable earnings | | $ | 2,221,052 | | | $ | — | | | $ | — | |
| Other accumulated losses | | $ | (769,733 | ) | | $ | (1,646,205 | ) | | $ | (2,040,438 | ) |
| Total accumulated earnings | | $ | 26,254,608 | | | $ | 5,781,435 | | | $ | 1,192,921 | |
JACOB FUNDS INC.
NOTES TO THE FINANCIAL STATEMENTS (Continued)
February 28, 2019 (Unaudited)
The differences between cost amounts for book purposes and tax purposes are primarily due to the tax deferral of losses on wash sales and Passive Foreign Investment Companies (“PFICs”). At August 31, 2018, the Small Cap Growth Fund had $1,013,587 in short-term capital loss carryovers and $435,669 in long-term capital loss carryovers which are non-expiring and the Micro Cap Fund had $1,914,783 in long-term capital loss carryovers which are non-expiring. To the extent the Funds realize future net capital gains, taxable distributions to its shareholders will be offset by any unused capital loss carryover.
For the fiscal year ended August 31, 2018, the following funds deferred late year losses in the following amounts:
| | Internet | Small Cap | Micro Cap | |
| | Fund | Growth Fund | Growth Fund | |
| | $740,093 | $196,949 | $125,655 | |
The Internet Fund paid $3,389,843 out of long-term capital gains during the six months ended February 28, 2019 and paid $3,957,876 out of long-term capital gains and $1,045,216 out of short-term capital gains (ordinary income) for the fiscal year ended August 31, 2018. The Small Cap Growth Fund paid $185,341 out of short-term capital gains (ordinary income) during the six months ended February 28, 2019, and made no distributions during the fiscal year ended August 31, 2018. The Micro Cap Growth Fund made no distributions during the six months ended February 28, 2019 and the fiscal year ended August 31, 2018.
Reclassification Adjustments: Capital stock and distributable earnings (consisting of accumulated net investment income (loss) and accumulated net realized gain (loss)) have been adjusted in the Statements of Assets and Liabilities for permanent book-tax differences for the Funds. Differences primarily relate to the tax treatment of net operating losses, foreign currency gains and losses, equalization, REIT reclassifications, and short-term gains treated as ordinary income for tax purposes. To the extent these book and tax differences are permanent in nature, such amounts are reclassified at the end of the fiscal year among capital stock, accumulated net investment income (loss) and accumulated net realized gain (loss) on investments. Accordingly, at August 31, 2018 reclassifications were recorded as follows:
| | | | Internet | | | Small Cap | | | Micro Cap | |
| | | | Fund | | | Growth Fund | | | Growth Fund | |
| | Distributable Earnings | | $ | 42,284 | | | $ | 860,528 | | | $ | 60,989 | |
| | Capital Stock | | | (42,284 | ) | | | (860,528 | ) | | | (60,989 | ) |
NOTE 6—INVESTMENT ADVISORY AND OTHER AGREEMENTS
The Corporation has entered into Investment Advisory Agreements (the “Advisory Agreements”) with Jacob Asset Management of New York LLC (the “Adviser”), with whom certain Officers and a Director of the Board are affiliated, to furnish investment advisory services to the Funds. Under the terms of the Advisory Agreements, the Corporation, on behalf of the Funds, compensates the Adviser for its management services based on an annual rate of 1.25% of the Internet Fund’s average daily net assets up to $250 million and 1.00% of annual average net assets over $250 million; 0.80% of the Small Cap Growth Fund’s average daily net assets up to $250 million and 0.70% of annual average daily net assets over $250 million and 1.10% of the Micro Cap Growth Fund’s average daily net assets up to $250 million and 0.90% of annual average daily net assets over $250 million.
JACOB FUNDS INC.
NOTES TO THE FINANCIAL STATEMENTS (Continued)
February 28, 2019 (Unaudited)
The Adviser has contractually agreed to waive its advisory fees in an amount up to an annual rate of 0.10% of the Internet Fund’s average daily net assets to the extent the Internet Fund’s total annual operating expenses (excluding any taxes, interest, brokerage fees, acquired fund fees and expenses and extraordinary expenses) exceed 2.95% of the average daily net assets through at least January 2, 2020. The Adviser has the ability to recoup amounts waived for a period of thirty six months following such fee waivers to the extent that such recoupment by the Adviser will not cause the Internet Fund to exceed any applicable expense limitation in place when the fee was waived. For the six months ended February 28, 2019, the Adviser did not waive any fees with respect to the Internet Fund.
Effective November 12, 2012 (date of reorganization of the Predecessor Small Cap Growth Fund into the Small Cap Growth Fund) the Adviser contractually agreed to waive up to 100% of its advisory fee to the extent the Fund’s total annual operating expenses (excluding any taxes, interest, brokerage fees, acquired fund fees and expenses and extraordinary expenses) exceed 2.25% and 1.95% for Investor Class and Institutional Class Shares, respectively, of each class’ average daily net assets through at least January 2, 2020. The Adviser has the ability to recoup amounts waived for a period of thirty six months following such fee waivers to the extent that such recoupment by the Adviser will not cause the Fund to exceed any applicable expense limitation in place when the fee was waived. For the six months ended February 28, 2019, fees of $18,455 were waived by the Adviser with respect to the Small Cap Growth Fund.
Effective November 12, 2012 (date of reorganization of the Predecessor Micro Cap Growth Fund into the Micro Cap Growth Fund) the Adviser contractually agreed to waive up to 100% of its advisory fee to the extent the Micro Cap Growth Fund’s total annual operating expenses (excluding any taxes, interest, brokerage fees, acquired fund fees and expenses and extraordinary expenses) exceed 2.45% and 2.15% for Investor Class and Institutional Class Shares, respectively, of each class’ average daily net assets through December 28, 2016. Effective December 29, 2016, the Adviser contractually agreed to waive up to 100% of its advisory fee to the extent the Micro Cap Growth Fund’s total annual operating expenses (excluding any taxes, interest, brokerage fees, acquired fund fees and expenses and extraordinary expenses) exceed 2.30% and 2.00% for Investor Class and Institutional Class shares, respectively, of each class’ average daily net assets through at least January 2, 2020. The Adviser has the ability to recoup amounts waived for a period of thirty six months following such fee waivers to the extent that such recoupment by the Adviser will not cause the Fund to exceed any applicable expense limitation in place when the fee was waived. For the six months ended February 28, 2019, fees of $53,985 were waived by the Adviser with respect to the Micro Cap Growth Fund.
Following is a schedule of when fees may be recouped:
| | Small Cap | | | Micro Cap | | |
| | Growth Fund | | | Growth Fund | | Expiration |
| | $ | 53,195 | | | $ | 50,963 | | August 31, 2019 |
| | | 98,037 | | | | 93,322 | | August 31, 2020 |
| | | 80,287 | | | | 97,552 | | August 31, 2021 |
| | | 18,455 | | | | 53,985 | | August 31, 2022 |
| | $ | 249,974 | | | $ | 295,822 | | |
U.S. Bancorp Fund Services, LLC, doing business as U.S. Bank Global Fund Services (“Fund Services”) an indirect wholly owned subsidiary of U.S. Bancorp serves as transfer agent, administrator and accounting services agent for the Funds. U.S. Bank, N.A. serves as custodian for the Funds. All providers receive customary fees for services rendered.
JACOB FUNDS INC.
NOTES TO THE FINANCIAL STATEMENTS (Continued)
February 28, 2019 (Unaudited)
NOTE 7—DISTRIBUTION AND SERVICE PLAN
The Corporation, on behalf of the Internet Fund, has adopted a distribution and service plan (the “Internet Fund Plan”), pursuant to Rule 12b-1 under the 1940 Act. The Internet Fund Plan provides that the Internet Fund will compensate the Adviser 0.25% per annum of the Internet Fund’s average daily net assets for certain expenses and costs incurred in connection with providing shareholder servicing and maintaining shareholder accounts and to compensate parties with which it has written agreements and whose clients own shares of the Internet Fund for providing servicing to their clients (“Shareholder Servicing Fee”). The Internet Fund Plan also provides for a distribution fee equal to 0.10% of the Internet Fund’s average daily net assets on an annual basis (“Asset Based Sales Charge”). The fee is used to compensate Quasar Distributors, LLC, the Funds’ distributor (the “Distributor”), for basic distribution services, out of pocket expenses incurred in connection with activities to sell Internet Fund shares, advertising, compliance reviews, and licensing of the Adviser’s staff. The Distributor may make payments from time to time from the Asset Based Sales Charge to broker-dealers and other financial professionals whose clients are Internet Fund shareholders for providing distribution assistance and promotional support to the Internet Fund. Remaining amounts of the Asset Based Sales Charge may be used to satisfy distribution costs as directed by the Adviser. Effective September 1, 2016 through at least January 2, 2020, the Board determined to reduce such fees payable under the Internet Fund Plan from 0.35% to 0.25% of the Internet Fund’s average daily net assets on an annual basis. The Internet Fund incurred $56,258 in expenses pursuant to the Internet Fund Plan for the six months ended February 28, 2019.
The Corporation, on behalf of the Small Cap Growth Fund and Micro Cap Growth Fund, has adopted a distribution and service plan (the “Plan”) pursuant to Rule 12b-1 under the 1940 Act. Rule 12b-1 provides that an investment company that bears any direct or indirect expense of distributing its shares must do so only in accordance with the Plan as permitted by Rule 12b-1. Pursuant to the Plan, the Small Cap Growth Fund and Micro Cap Growth Fund make payments to the Distributor, the Adviser, financial intermediaries or others to reimburse such parties for distribution and/or shareholder servicing activity in an amount not to exceed 0.35% of the average daily net assets of the Investor Class shares of the Small Cap Growth and Micro Cap Growth Funds on an annual basis. Effective September 1, 2016 through at least January 2, 2020, the Board determined to reduce such fees payable under the Plan from 0.35% to 0.25% of the average daily net assets of the Investor Class shares of the Small Cap Growth and Micro Cap Growth Funds. The distribution fees are “asset based” sales charges and, therefore, long-term shareholders may pay more in total sales charges than the economic equivalent of the maximum front-end sales charge permitted by the Financial Industry Regulatory Authority (FINRA). The Small Cap Growth Fund incurred $7,301 and the Micro Cap Growth Fund incurred $3,553 in expenses pursuant to the Plan for the six months ended February 28, 2019.
NOTE 8—INDUSTRY CONCENTRATION RISK
Internet and Internet-Related Industries Risk: The Internet Fund invests a significant portion of its assets in Internet and Internet-related industries and thus the value of the Fund’s shares may be susceptible to factors affecting such industries, including factors affecting the computer/Internet technology area generally, and may be susceptible to greater risk and market fluctuation than an investment in a fund that invests in a broader range of portfolio securities not concentrated in any particular area or industry. Companies in Internet and Internet-related industries face special risks associated with the rapidly changing field of computer/Internet technology. For example, their products or services may not prove commercially successful or may become obsolete quickly. The computer/Internet technology area may be subject to greater governmental regulation than many other areas and changes in governmental policies and the
JACOB FUNDS INC.
NOTES TO THE FINANCIAL STATEMENTS (Continued)
February 28, 2019 (Unaudited)
need for regulatory approvals may have a material adverse effect on these areas. Additionally, companies in these areas may be subject to risks of developing technologies, competitive pressures and other factors and are dependent upon consumer and business acceptance as new technologies evolve. Many Internet and Internet-related companies incur large losses in the hope of capturing market share and generating future revenues, but may never be profitable.
Science and Technology Risk: The Fund’s investments in science and technology companies expose the Small Cap Growth Fund and Micro Cap Growth Fund to special risks. For example, rapid advances in science and technology might cause existing products to become obsolete, and the Fund’s returns could suffer to the extent it holds an affected company’s shares. Companies in a number of science and technology industries are also subject to more government regulations and approval processes than many other industries. This fact may affect a company’s overall profitability and cause its stock price to be more volatile. Additionally, science and technology companies are dependent upon consumer and business acceptance as new technologies evolve.
NOTE 9—NEW ACCOUNTING PRONOUNCEMENT
In August 2018, FASB issued ASU 2018-13, Fair Value Measurement (Topic 820): Disclosure Framework – Changes to the Disclosure Requirements for Fair Value Measurement (“ASU 2018-13”). The primary focus of ASU 2018-13 is to improve the effectiveness of the disclosure requirements for fair value measurements. The changes affect all companies that are required to include fair value measurement disclosures. In general, the amendments in ASU 2018-13 are effective for all entities for fiscal years and interim periods within those fiscal years, beginning after December 15, 2019. An entity is permitted to early adopt the removed or modified disclosures upon the issuance of ASU 2018-13 and may delay adoption of the additional disclosures, which are required for public companies only, until their effective date.
Also in August 2018, the Securities and Exchange Commission issued Final Rule Release No. 33-10532, Disclosure Update and Simplification, which in part amends certain disclosure requirements of Regulation S-X that have become redundant, duplicative, overlapping, outdated, or superseded, in light of other Commission disclosure requirements, U.S. Generally Accepted Accounting Principles, or changes in the information environment. The amendments are intended to facilitate the disclosure of information to investors and simplify compliance without significantly altering the total mix of information provided to investors. The Funds have adopted these changes into the financial statements.
NOTE 10—SUBSEQUENT EVENTS
In preparing these financial statements, the Corporation has evaluated events after February 28, 2019 and determined that there were no significant subsequent events that would require adjustment to or additional disclosure in these financial statements.
JACOB FUNDS INC.
ADDITIONAL INFORMATION ON FUND EXPENSES (Unaudited)
For the Six Months Ended February 28, 2019 for the Internet Fund, Small Cap Growth Fund and Micro Cap Growth Fund
As a shareholder of a mutual fund, you may incur two types of costs: (1) transaction costs, including sales charges (loads) on purchase payments, reinvested dividends, or other distributions; redemption fees; and exchange fees; and (2) ongoing costs, including management fees; distribution and/or service (12b-1) fees; and other fund expenses. The Funds do not currently charge sales charges (loads) or exchange fees. The Funds assess a redemption fee of 2% on shares sold within 30 days following their purchase date. In addition, you will be assessed fees for outgoing wire transfers, returned checks and stop payment orders. The Funds charge management fees and distribution and/or service (12b-1) fees. The Expense Example is intended to help you understand your ongoing costs (in dollars) of investing in the Funds and to compare these costs with the ongoing costs of investing in other mutual funds. The Example is based on an investment of $1,000 invested at the beginning of the period and held for the entire period (9/1/2018–2/28/2019) for the Internet Fund, Small Cap Growth Fund and Micro Cap Growth Fund.
Actual Expenses
The first line of the table below provides information about account values based on actual returns and actual expenses. Although the Funds charge no sales load, the Funds charge a redemption fee of 2% on shares sold within 30 days following the purchase date. In addition, you will be assessed fees for outgoing wire transfers, returned checks and stop payment orders at prevailing rates charged by U.S. Bancorp Fund Services, LLC, the Funds’ transfer agent. If you request that a redemption be made by wire transfer, currently the Funds’ transfer agent charges a $15.00 fee. The Example does not reflect transactional costs, such as redemption fees. You may use the information in the first line below, together with the amount you invested, to estimate the expenses that you paid over the period. Simply divide your account value by $1,000 (for example, an $8,600 account value divided by $1,000 = 8.6), then multiply the result by the number in the first line under the heading entitled “Expenses Paid During the Period” to estimate the expenses you paid on your account during this period.
Hypothetical Example for Comparison Purposes
The second line of the table below provides information about hypothetical account values based on a hypothetical return and hypothetical expenses based on a Fund’s actual expense ratio and an assumed rate of return of 5% per year before expenses, which is not a Fund’s actual return. The hypothetical account values and expenses may not be used to estimate the actual ending account balance or expenses you paid for the period. You may use this information to compare the ongoing costs of investing in the Funds and other funds. To do so, compare this 5% hypothetical example with the 5% hypothetical examples that appear in the shareholder reports of the other funds. Please note that the expenses shown in the table are meant to highlight your ongoing costs only and do not reflect transactional costs, such as redemption fees. Therefore, the second line of the table is useful in comparing ongoing costs only, and will not help you determine the relative total costs of owning different funds. In addition, if the transactional costs were included, your costs would have been higher.
JACOB FUNDS INC.
ADDITIONAL INFORMATION ON FUND EXPENSES (Unaudited) (Continued)
Internet Fund – Investor Class
| | |
| Expenses Paid |
| | Beginning Account | Ending Account | During the Period |
| | Value 9/1/18 | Value 2/28/19 | 9/1/18–2/28/19* |
| Actual | $1,000.00 | $1,000.00 | $11.57 |
| Hypothetical (5% annual return before expenses) | $1,000.00 | $1,013.23 | $11.65 |
_______________
| * | Expenses are equal to the Internet Fund’s annualized expense ratio of 2.33% multiplied by the average account value over the period multiplied by 181/365 (to reflect the one-half year period). |
Small Cap Growth Fund – Institutional Class
| | |
| Expenses Paid |
| | Beginning Account | Ending Account | During the Period |
| | Value 9/1/18 | Value 2/28/19 | 9/1/18–2/28/19* |
| Actual | $1,000.00 | $ 895.80 | $9.17 |
| Hypothetical (5% annual return before expenses) | $1,000.00 | $1,015.12 | $9.74 |
_______________
| * | Expenses are equal to the Institutional Class’s annualized expense ratio of 1.95% multiplied by the average account value over the period multiplied by 181/365 (to reflect the one-half year period). |
Small Cap Growth Fund – Investor Class
| | |
| Expenses Paid |
| | Beginning Account | Ending Account | During the Period |
| | Value 9/1/18 | Value 2/28/19 | 9/1/18–2/28/19* |
| Actual | $1,000.00 | $ 894.50 | $10.57 |
| Hypothetical (5% annual return before expenses) | $1,000.00 | $1,013.64 | $11.23 |
_______________
| * | Expenses are equal to the Investor Class’s annualized expense ratio of 2.25% multiplied by the average account value over the period multiplied by 181/365 (to reflect the one-half year period). |
Micro Cap Growth Fund – Institutional Class
| | |
| Expenses Paid |
| | Beginning Account | Ending Account | During the Period |
| | Value 9/1/18 | Value 2/28/19 | 9/1/18–2/28/19* |
| Actual | $1,000.00 | $ 964.90 | $9.77 |
| Hypothetical (5% annual return before expenses) | $1,000.00 | $1,014.85 | $10.01 |
_______________
| * | Expenses are equal to the Institutional Class’s annualized expense ratio of 2.00% multiplied by the average account value over the period multiplied by 181/365 (to reflect the one-half year period). |
Micro Cap Growth Fund – Investor Class
| | |
| Expenses Paid |
| | Beginning Account | Ending Account | During the Period |
| | Value 9/1/18 | Value 2/28/19 | 9/1/18–2/28/19* |
| Actual | $1,000.00 | $ 964.00 | $11.20 |
| Hypothetical (5% annual return before expenses) | $1,000.00 | $1,013.39 | $11.48 |
_______________
| * | Expenses are equal to the Investor Class’s annualized expense ratio of 2.30% multiplied by the average account value over the period multiplied by 181/365 (to reflect the one-half year period). |
JACOB FUNDS INC.
ADDITIONAL INFORMATION (Unaudited)
Approval of the Investment Advisory Agreements
During the fiscal quarter ended November 30, 2018, the Board of Directors (the “Board”), including all of the Independent Directors, considered and approved the renewal of the Investment Advisory Agreements between Jacob Funds Inc. (the “Company”), on behalf of the Jacob Internet Fund (the “Internet Fund”), Jacob Small Cap Growth Fund (the “Small Cap Fund”) and Jacob Micro Cap Growth Fund (the “Micro Cap Fund” and, together with the Internet Fund and the Small Cap Fund, the “Funds”), and Jacob Asset Management of New York LLC (the “Adviser”) (collectively, the “Investment Advisory Agreements”) for an additional year. The Board also considered the continuation of the Fee Waiver Agreements between the Adviser and the Company, on behalf of the Internet Fund, Small Cap Fund and Micro Cap Fund (collectively, the “Fee Waiver Agreements”), which the Adviser offered to continue for an additional year. While the Investment Advisory Agreements for all of the Funds were considered at the same Board meeting, the Board dealt with each Fund separately.
In reaching its decision to renew the Investment Advisory Agreements, the Board took into account a combination of factors, including the nature, extent and quality of the services to be provided by the Adviser; each Fund’s performance; each Fund’s fees and expenses; the costs of the services to be provided and the profits realized by the Adviser; and the extent to which there are economies of scale in the provision of advisory services and whether the Adviser may realize additional economies of scale in the future. The Board did not identify any single factor as all-important or controlling, and each Director may have weighed a particular piece of information or factor differently than another Director. This summary does not detail all of the matters considered by the Board.
The materials provided to, and discussed by, the Board in connection with the renewal of the Investment Advisory Agreements included, among other things: (i) a description of the Adviser’s business, operations and qualifications; (ii) a description of personnel, including responsibilities, changes since the last renewal of the Investment Advisory Agreements (the “last renewal”) and compensation policies; (iii) a description of the advisory services provided to the Funds, including a discussion of how investment decisions are made and executed; (iv) a description of any services other than investment advice provided to the Funds by the Adviser; (v) a copy of the Adviser’s most recent Form ADV; (vi) a balance sheet and profit and loss statement for the Adviser; (vii) a description of the advisory fees and a peer group comparison along with a discussion of the appropriateness of the fees; (viii) a description of any issues or recommendations with respect to the Company’s compliance program since the last renewal; (ix) a description of the Company’s expenses, including expense ratios and comparative expense ratios, costs incurred by the Adviser and brokerage expenses; (x) a description of errors and omission insurance coverage that is currently in place; (xi) a copy of the Investment Advisory Agreements with the Adviser, which, among other things, described the services provided to the Funds and the compensation to be paid for such services; (xii) a copy of the Fee Waiver Agreements with the Adviser; (xiii) Morningstar comparative industry peer group and peer fund data for the Funds’ performance for various periods ended August 31, 2018; and (xiv) Morningstar comparative industry peer group data regarding the investment advisory fees and total expense ratios of the Funds along with other industry peer group comparisons of fund expenses and expense reimbursements for the period ended August 31, 2018.
The Board discussed the nature, extent and quality of services provided by the Adviser to each Fund, including the Adviser’s resources comparative to other advisory firms and developments since the last renewal. They concluded that the experienced portfolio management and research team dedicated to the continued management of the Funds were sufficient and beneficial to the Funds, as evidenced by each Fund’s performance record over varying periods, and that the services provided were consistent with the terms of the Investment Advisory Agreements.
JACOB FUNDS INC.
ADDITIONAL INFORMATION (Unaudited) (Continued)
The Board reviewed the investment performance of each Fund. While consideration was given to performance reports and discussions throughout the year, attention in assessing performance was given to the comparative data furnished in connection with the renewal of the Investment Advisory Agreements. In particular, the Board noted the performance of each Fund relative to its Morningstar peer group and benchmark indices over various periods ended August 31, 2018.
With respect to the Internet Fund, the Board considered that the Fund’s performance results were above the median and average performance of its Morningstar peer group (US Fund Technology Funds Category) for the year-to-date and ten-year periods, and below the median and average performance of such peer group for the one-, three- and five-year periods. The Board also considered that the Internet Fund’s performance results were above the average performance of its Morningstar peer group for the fifteen-year period. The Board noted that the Internet Fund outperformed its benchmark index (the Nasdaq Composite Index) for the one-year period.
With respect to the Small Cap Fund, the Board considered that the Fund’s performance results were significantly above the median and average performance of its Morningstar peer group (US Fund Small Growth Fund Category) for the year-to-date and one-year periods, and below the median and average performance of such peer group for the three- and five-year periods. The Board considered that the Small Cap Fund’s Morningstar peer group percentile ranking for Institutional Class and Investor Class shares for the year-to-date period was 1% and 4%, respectively (with the first percentile as the percentile with the best performance); and 4% and 6%, respectively, for the one-year period. The Board noted that the Small Cap Fund significantly outperformed its benchmark index (Russell 2000 Growth Index) for the one-year period.
With respect to the Micro Cap Fund, the Board considered that the Fund’s performance results were significantly above the median and average performance of its Morningstar peer group (US Fund Small Growth Fund Category) for the year-to-date and one-year periods, and below the median and average performance of such peer group for the three- and five-year periods. The Board considered that the Micro Cap Fund’s Morningstar peer group percentile ranking for the year-to-date and one-year periods was 6% and 0%, respectively. The Board noted that the Micro Cap Fund significantly outperformed its benchmark indices (Russell Microcap Growth Index and Russell 2000 Growth Index) for the one-year period.
The Board considered that the Funds, particularly the Small Cap Fund and Micro Cap Fund, had seen a recent improvement in comparative performance. The Board found the overall performance results of the Funds to be satisfactory.
The Board reviewed the advisory fees and overall expenses of each Fund and discussed the difference in fees and expenses compared to other funds within each Fund’s Morningstar peer group. The Board discussed the allocation of expenses among the Funds and the manner in which each Fund bears its appropriate share of the expenses. The Board noted the relatively small size of the Funds, as well as the ongoing subsidies of operating expenses by the Adviser pursuant to the Fee Waiver Agreements for the Small Cap Fund and Micro Cap Fund. The Board also noted its determination to continue to reduce the 12b-1 fees payable under the distribution and service plans of the Funds, which went into effect on September 1, 2016 (Investor Class shares only), through at least January 2, 2020. The Board also recognized the fact that expense ratios generally increase as assets decline and decrease as assets grow and specifically noted the decreased net expenses of the Micro Cap Fund during the fiscal year. The Board also considered the Adviser’s recent actions in an effort to reduce the Funds’ regular, ongoing expenses, such as the reduction in the contractual advisory fee payable by the Small Cap and Micro Cap Funds at current asset levels by ten basis points, respectively, in the beginning of the fiscal year; the transition of certain services with respect to the preparation of SEC filings; and fully transitioning to electronic board materials for the quarterly Board meetings.
JACOB FUNDS INC.
ADDITIONAL INFORMATION (Unaudited) (Continued)
With respect to the advisory fees and overall expenses of the Internet Fund, the Board considered that the Fund’s advisory fees and net expense ratio (excluding 12b-1 fees) were above the median and average of its Morningstar peer group. The Board also considered the Fee Waiver Agreement and reduction in 12b-1 fees payable under the distribution and service plan of the Fund, each continued through at least January 2, 2020. The Board discussed the competitiveness of the Fund’s advisory fees and net expense ratio (excluding 12b-1 fees) in light of the size of the Fund and noted that the Fund’s expenses had been subsidized by an advisory fee waiver over various periods. While noting the Internet Fund’s advisory fees and overall expenses compared to the Morningstar peer group, including percentile rankings, the Board was satisfied overall that the Adviser has taken actions to improve the Fund’s comparative expenses.
With respect to the advisory fees and overall expenses of the Small Cap Fund, the Board considered that the Fund’s net expense ratio (excluding 12b-1 fees) for Investor Class shares was above the median and average of its Morningstar peer group, however, the Fund’s advisory fees were below the median and average of its Morningstar peer group. The Board also considered the Fee Waiver Agreement and reduction in 12b-1 fees payable under the distribution and service plan of the Fund, each continued through at least January 2, 2020. The Board discussed the competitiveness of the Fund’s advisory fees and net expense ratio (excluding 12b-1 fees) in light of the size of the Fund and noted that the Fund’s expenses are currently subsidized by an advisory fee waiver (where the Adviser will waive a portion of its advisory fees when the Fund’s expense ratio is above certain expense levels). The Board was satisfied that the Adviser has taken actions to improve the Fund’s comparative expenses.
With respect to the advisory fees and overall expenses of the Micro Cap Fund, the Board considered that the Fund’s advisory fees and net expense ratio (excluding 12b-1 fees) for Investor Class shares were above the median and average of its Morningstar peer group, while noting that the overall net expense ratio of the Fund had decreased since the last fiscal year. The Board also considered the Fee Waiver Agreement (under which the Adviser was waiving all of its advisory fees for the fiscal year ended August 31, 2018) and reduction in 12b-1 fees payable under the distribution and service plan of the Fund, each continued through at least January 2, 2020. The Board discussed the competitiveness of the Fund’s advisory fees and net expense ratio (excluding 12b-1 fees) in light of the size of the Fund and noted that the Fund’s expenses are currently subsidized by an advisory fee waiver (where the Adviser will waive a portion of its advisory fees when the Fund’s expense ratio is above certain expense levels). The Board was satisfied that the Adviser has taken actions to improve the Fund’s comparative expenses.
The Board discussed the profitability, projected revenue growth and financial viability of the Adviser; other benefits received by the Adviser in connection with the management of the Funds; the extent to which there are economies of scale in the provision of advisory services; and whether the Adviser may realize additional economies of scale in the future. In considering the various factors, the Board’s fiduciary duties to the Funds’ shareholders, and the body of law governing the approval of investment advisory agreements, the Independent Directors received assistance and advice from independent legal counsel and counsel to the Company.
Based on all of the above-mentioned factors and their related conclusions, with no single factor or conclusion being determinative, and with each Independent Director not necessarily attributing the same weight to each factor, the Independent Directors concluded that (i) the Adviser demonstrated that it possessed the capability and resources to perform the duties required of it under the Investment Advisory Agreements; (ii) the compensation payable to the Adviser under the Investment Advisory Agreements was fair and reasonable; and (iii) the compensation and other terms of the Investment Advisory Agreements were appropriate and in the best interests of each of the Funds and its shareholders.
JACOB FUNDS INC.
ADDITIONAL INFORMATION (Unaudited)
Proxy Voting
A description of the policies and procedures that the Funds use to determine how to vote proxies relating to portfolio securities is available without charge by calling toll-free 1-888-JACOB-FX (522-6239) or on the SEC website at http://www.sec.gov.
Proxy Voting Record
Information regarding how the Funds voted proxies relating to portfolio securities during the most recent 12-month period ended June 30 is available without charge by calling 1-888-JACOB-FX (522-6239) or on the SEC website at http://www.sec.gov.
Holdings Disclosure
The Funds’ Semi-Annual and Annual Reports include a complete schedule of portfolio holdings for the second and fourth quarters of each fiscal year.
The Funds file their complete schedule of portfolio holdings with the SEC for the first and third quarters of each fiscal year on Form N-Q. The Funds’ Forms N-Q are available on the SEC website at http://www.sec.gov and may be reviewed and copied at the SEC’s Public Reference Room in Washington, D.C. Information on the operation of the Public Reference Room may be obtained by calling 1-800-SEC-0330.
ADDITIONAL TAX INFORMATION (Unaudited)
For the year ended August 31, 2018, certain dividends paid by the Funds may be subject to a maximum tax rate of 20%. The percentage of dividends declared from net investment income designated as qualified income is as follows:
For corporate shareholders, the percent of ordinary income distributions qualifying for the corporate dividends received deduction for the year ended August 31, 2018 is as follows:
The percentage of taxable ordinary income distributions that are designated as short-term capital gain distributions under Internal Revenue Code Section 871(k)(2)(C) is as follows: