UNITED STATES
SECURITIES AND EXCHANGE COMMISSION
Washington, D.C. 20549
FORM N-CSR
CERTIFIED SHAREHOLDER REPORT OF REGISTERED
MANAGEMENT INVESTMENT COMPANIES
Investment Company Act file number 811-09447
Jacob Funds Inc.
(Exact name of Registrant as specified in charter)
C/O Jacob Asset Management of New York LLC
727 2nd Street #106
Hermosa Beach, CA 90254
(Address of principal executive offices) (Zip code)
Ryan Jacob
C/O Jacob Asset Management of New York LLC
727 2nd Street #106
Hermosa Beach, CA 90254
(Name and address of agent for service)
(424) 237-2164
Registrant's telephone number, including area code
Date of fiscal year end: August 31
Date of reporting period: February 28, 2018
Item 1. Reports to Stockholders.
Jacob Internet Fund
Jacob Small Cap Growth Fund
Jacob Micro Cap Growth Fund
Semi-Annual Report
February 28, 2018
The Jacob Internet Fund, Jacob Small Cap Growth Fund and
Jacob Micro Cap Growth Fund are mutual funds with the
primary investment objective of long-term growth of capital.
The Jacob Internet Fund has current income as a secondary objective.
Investment Adviser
Jacob Asset Management of New York LLC
TABLE OF CONTENTS
| Letter From the Manager | 1 |
| Industry Breakdowns | 4 |
| Schedules of Investments | 7 |
| Statements of Assets and Liabilities | 17 |
| Statements of Operations | 18 |
| Statements of Changes in Net Assets | 19 |
| Financial Highlights | 22 |
| Notes to the Financial Statements | 27 |
| Additional Information on Fund Expenses | 40 |
| Additional Information | 42 |
Dear Fellow Investors,
For most of the fiscal period (six month period ended February 28, 2018), the equity markets had a quite impressive run, with most indices rising between 10-15% through January. Starting in February, however, we experienced a notable pick up in volatility around higher short- and long-term interest rates and which subsequently was exacerbated by privacy issues among large tech companies and concerns regarding a possible trade war. Considering the market strength for much of 2017, and the corresponding rise in valuations, it is not surprising that the markets would be in a more vulnerable position. While we believe that this market turbulence will be short lived given the underlying strength of the US and global economies, one byproduct of this shift in market character has been the underperformance of larger cap names. This is something we have been anticipating for quite some time and we believe will likely continue if interest rates move higher. Accordingly, we continue to increase small company exposure for all of the Jacob Funds to seek to better take advantage of these trends.
Jacob Internet Fund
The Jacob Internet Fund was up 11.51% for the fiscal period ended February 28, 2018, while the NASDAQ returned 13.72%. While the Fund performed well on an absolute basis, it was another difficult period to be compared to other indices, such as the NASDAQ and the S&P 500. Additionally, we did reduce some of our larger positions during the period, including Apple, Facebook and Google to reflect growing concerns regarding their ability to continue expanding their valuations. We maintained a significant portion of the Fund’s portfolio in small and mid-sized companies that, while contributing to our positive returns, could not match the recent gains of the larger index components. A key part of the Fund’s strategy has always been to seek out early-stage businesses that have the potential for a more meaningful impact on the Fund’s performance. We believe this more diverse mix of market caps will provide us the opportunity to significantly outperform over the long term.
As for individual stocks, one of our best-performing names over the period was a controversial name that we had been adding to through some difficult times: Twitter. Though not regarded as a top-tier technology player, Twitter has regained stability after recent operating difficulties and concerns about user experience. Now generating substantial profits and showing improving user growth trends, Twitter has been reembraced by investors, and was up over 88% in this fiscal period. Smaller positions that are also owned in the Jacob Micro Cap Growth Fund, Digital Turbine and USA Technologies, were up 94% and 50%, respectively in the period. We also had two of our newer cloud-based software names Instructure (education market) and Tabula Rasa (drug delivery) both contribute over 40% during the period.
Thankfully, most of the worst performers in the period were also some of our smallest size positions. Pandora’s performance continued to be weak following the acquisition of a large portion of the company’s equity by satellite radio service provider SiriusXM, contributing to a 48% loss in the period. We have subsequently reduced the position size further and will consider exiting completely following the upcoming Spotify initial public offering (IPO). Expedia, down 29% for the period, has recently guided to more spending in 2018 which was negatively interpreted by investors. As we believe this investment period will be temporary, we are comfortable keeping Expedia as a modest holding and would consider adding to the position on further weakness. Additional small company positions, such as Mitek Systems, Radisys and Netlist, down 25%, 45% and 58%, respectively also had a negative impact on performance and will be discussed in more detail in the Jacob Micro Cap Growth Fund section.
Jacob Small Cap Growth Fund
The Jacob Small Cap Growth Fund was up 13.79% for the fiscal period ended February 28, 2018 while the Russell 2000 Growth Index was up 11.32%. The Fund’s performance was fairly broad based, with the top 10 performers all up over 40% for the period. Healthcare and Consumer names stood out, with small cap tech names having a more difficult time keeping up. The top performing stock was Ignyta, up over 134%, as it received a takeover proposal from Roche. Two of the Fund’s larger healthcare holdings, Codexis and Esperion, were up 72% and 63%, respectively during the
period. Another long time holding, XPO Logistics, was up over 60% over the period and was recently sold by the Fund as it exceeded our market capitalization guidelines. Two of the Fund’s restaurant holdings, BJ’s and Chuy’s rebounded strongly in the period up over 40%.
Besides names like Pandora and Mitek that we mentioned above, a couple of pharmaceutical names were some of the worst performers. Omeros, which lost reimbursement for its major product, was down over 50% for the period. In the last month, that reimbursement has been restated, and given the excitement we have about the company’s pipeline, we have recently added back to the position. Intercept Pharmaceuticals, down over 48%, has suffered from a lack of near-term catalysts and concerns regarding increased competition. In both cases, these were some of the Fund’s smallest positions and had limited impact on performance in the period.
Jacob Micro Cap Growth Fund
The Jacob Micro Cap Growth Fund rebounded even more strongly, posting a 18.56% return for the fiscal period ended February 28, 2018, while the Russell Micro Cap Growth Index was up 8.21%.
It is nearly impossible to discern industry- or theme-specific trends by looking at the performance of individual sectors or market cap categories, and we believe going forward that bottoms-up stock picking will be even more crucial in delivering relative outperformance. All of our top 10 performing positions were up 60% or more in the period, and several of those were top holdings of the Fund. The Fund’s biggest position, Codexis, was up 69% and we remain bullish on the prospects for the developer of proprietary protein enzymes. The company has done a remarkable job signing up partnerships with most of the big pharmaceutical names and has recently had success expanding their business in new areas, such as food, biotech and even spearheading their own drug development programs. Another top performer was Senomyx, a company that has had its share of issues in the past but saw some excitement over the continued development of its natural monk fruit-based sweetener called siratose. While an expected partnership to help fund siratose failed to materialize, we still believe in the value of the company’s assets in a world where sugar is increasingly being villainized. Senomyx has currently engaged investment bankers to explore ways to realize value, including a possible sale of the company, and we expect that they will have a number of interested bidders.
Among the worst performers were two names that had to deal with severe stress due to balance sheet concerns: BioAmber and Real Industry, both down more than 95% during the period. Fortunately, both positions were rather small given our increased focus over the past two years on limiting exposure to overleveraged companies. We completely sold out of our position in BioAmber given that we do not believe there is a realistic path for the company to be able to sell enough of their bio-based succinic acid to pay back their still high debt load. Meanwhile, we have actually added to our position in Real Industry, which filed for bankruptcy last year. The company’s issues were almost entirely due to their high debt levels as the aluminum scrap market has been getting healthier for quite some time, and it appears that the most likely settlement arising from the bankruptcy process will give enough of a stake in the new company to leave room for a fair amount of upside.
As always, we believe that staying true to our investment philosophy and process is still key to obtaining the best possible long-term investment performance for our shareholders. Thank you again for your continued confidence and trust.
Ryan Jacob
Chairman and Chief Investment Officer
Portfolio Manager
Frank Alexander
Portfolio Manager
Darren Chervitz
Portfolio Manager
Past performance is not a guarantee of future results.
Performance data reflects fee waivers and in the absence of these waivers performance would be reduced.
Diversification does not assure a profit or protect against a loss in a declining market.
Must be accompanied or preceded by a prospectus.
The opinions expressed above are those of the portfolio manager and are subject to change at any time. Forecasts cannot be guaranteed and should not be considered investment advice.
Mutual fund investing involves risk; loss of principal is possible. The Funds invest in foreign securities which involve greater volatility and political, economic and currency risks and differences in accounting methods. These risks are greater in emerging markets. Growth stocks typically are more volatile than value stocks; however, value stocks have a lower expected growth rate in earnings and sales. There are more specific risks inherent in investing in the Internet area, particularly with respect to smaller capitalized companies and the high volatility of Internet stocks. The Funds can invest in small-and mid-cap securities which involve additional risks such as limited liquidity and greater volatility. Investments in micro capitalization companies may involve greater risks, as these companies tend to have limited product lines, markets and financial or managerial resources. Micro cap stocks often also have a more limited trading market, such that the Adviser may not be able to sell stocks at an optimal time or price. In addition, less frequently-traded securities may be subject to more abrupt price movements than securities of larger capitalized companies. Investments in debt securities typically decrease in value when interest rates rise. This risk is usually greater for longer term debt securities.
Fund holdings are subject to change and should not be construed as a recommendation to buy or sell any security. Current and future portfolio holdings are subject to risk.
Please refer to the schedule of investments for complete Fund holdings information.
The NASDAQ Composite Index is a market capitalization weighted index that is designed to represent performance of the National Market System which includes over 5,000 stocks traded only over-the-counter and not on an exchange. The Russell 2000 Growth Index measures the performance of the small cap growth segment of the U.S. equity universe. It includes those Russell 2000 companies with higher price-to-book ratios and higher forecasted growth values. The Russell Microcap Growth Index measures the performance of the microcap growth segment of the U.S. equity market. It includes those Russell Microcap Index companies with higher price-to-book ratios and higher forecasted growth values. The S&P 500 is a market capitalization-weighted index of 500 large-capitalization stocks commonly used to represent the U.S. equity market. It is not possible to invest directly in an index.
The Funds are distributed by Quasar Distributors, LLC.
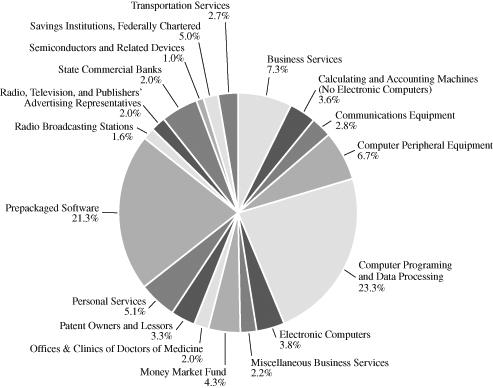
JACOB INTERNET FUND
INDUSTRY BREAKDOWN AS OF FEBRUARY 28, 2018
(as a percentage of total investments)
(Unaudited)
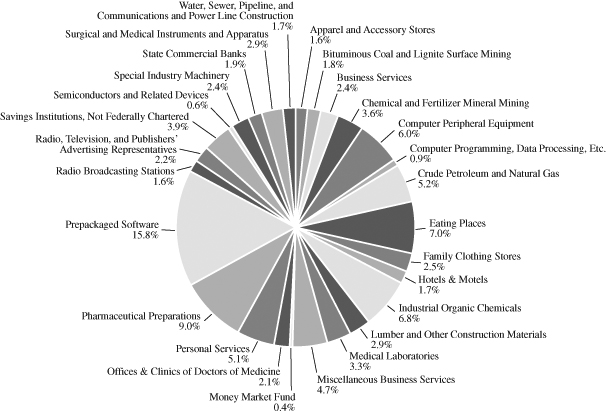
JACOB SMALL CAP GROWTH FUND
INDUSTRY BREAKDOWN AS OF FEBRUARY 28, 2018
(as a percentage of total investments)
(Unaudited)
JACOB MICRO CAP GROWTH FUND
INDUSTRY BREAKDOWN AS OF FEBRUARY 28, 2018
(as a percentage of total investments)
(Unaudited)
JACOB INTERNET FUND
SCHEDULE OF INVESTMENTS(+)
February 28, 2018 (Unaudited)
| Shares | | | | | | | Value | |
| | | COMMON STOCKS | | | 97.7 | % | | | |
| | | Business Services | | | 7.4% | | | |
| | 10,000 | | PayPal Holdings, Inc.* | | | | | | $ | 794,100 | |
| | 56,049 | | Reis, Inc. | | | | | | | 1,078,943 | |
| | 31,975 | | Zillow Group, Inc.—Class C* | | | | | | | 1,524,248 | |
| | | | | | | | | | | 3,397,291 | |
| | | | Calculating and Accounting | | | | | | | | |
| | | | Machines (No Electronic Computers) | | | 3.7% | | | | |
| | 206,000 | | USA Technologies, Inc.* | | | | | | | 1,678,900 | |
| | | | Communications Equipment | | | 2.8% | | | | |
| | 176,740 | | I.D. Systems, Inc.* | | | | | | | 1,291,969 | |
| | | | Computer Peripheral Equipment | | | 6.9% | | | | |
| | 107,411 | | Immersion Corp.* | | | | | | | 1,244,893 | |
| | 203,409 | | Mitek Systems, Inc.* | | | | | | | 1,556,079 | |
| | 400,000 | | Radisys Corp.* | | | | | | | 344,000 | |
| | | | | | | | | | | 3,144,972 | |
| | | | Computer Programing and Data Processing | | | 23.8% | | | | |
| | 2,200 | | Alphabet, Inc.—Class C* | | | | | | | 2,430,406 | |
| | 11,600 | | Facebook, Inc.—Class A* | | | | | | | 2,068,512 | |
| | 7,000 | | Red Hat, Inc.* | | | | | | | 1,031,800 | |
| | 30,000 | | Tencent Holdings Ltd. (HK)(a) | | | | | | | 1,641,256 | |
| | 10,800 | | TripAdvisor, Inc.* | | | | | | | 432,864 | |
| | 103,200 | | Twitter, Inc.* | | | | | | | 3,287,952 | |
| | | | | | | | | | | 10,892,790 | |
| | | | Electronic Computers | | | 3.9% | | | | |
| | 10,000 | | Apple, Inc. | | | | | | | 1,781,200 | |
| | | | Miscellaneous Business Services | | | 2.3% | | | | |
| | 220,000 | | Helios & Matheson Analytics, Inc.* | | | | | | | 1,047,200 | |
| | | | Offices & Clinics of Doctors of Medicine | | | 2.0% | | | | |
| | 23,400 | | Teladoc, Inc.* | | | | | | | 938,340 | |
| | | | Patent Owners and Lessors | | | 3.4% | | | | |
| | 694,596 | | Digital Turbine, Inc.* | | | | | | | 1,562,841 | |
| | | | Personal Services | | | 5.2% | | | | |
| | 55,000 | | Yelp, Inc.—Class A* | | | | | | | 2,395,800 | |
The accompanying notes are an integral part of these financial statements.
JACOB INTERNET FUND
SCHEDULE OF INVESTMENTS(+) (Continued)
February 28, 2018 (Unaudited)
| Shares | | | | | | | Value | |
| | | COMMON STOCKS—(Continued) | | | 97.7 | % | | | |
| | | Prepackaged Software | | | 21.8% | | | |
| | 128,100 | | Hortonworks, Inc.* | | | | | | $ | 2,303,238 | |
| | 20,600 | | Instructure, Inc.* | | | | | | | 894,040 | |
| | 8,556 | | LogMeIn, Inc. | | | | | | | 988,646 | |
| | 18,000 | | Paylocity Holding Corp.* | | | | | | | 841,860 | |
| | 8,300 | | salesforce.com, Inc.* | | | | | | | 964,875 | |
| | 11,260 | | SINA Corp.*^ | | | | | | | 1,316,632 | |
| | 25,400 | | Tabula Rasa HealthCare, Inc.* | | | | | | | 820,674 | |
| | 54,000 | | Twilio Inc.—Class A* | | | | | | | 1,844,640 | |
| | | | | | | | | | | 9,974,605 | |
| | | | Radio Broadcasting Stations | | | 1.6% | | | | |
| | 165,400 | | Pandora Media, Inc.* | | | | | | | 729,414 | |
| | | | Radio, Television, and Publishers’ | | | | | | | | |
| | | | Advertising Representatives | | | 2.1% | | | | |
| | 76,000 | | Yext, Inc.* | | | | | | | 965,200 | |
| | | | Savings Institutions, Federally Chartered | | | 5.1% | | | | |
| | 45,000 | | E*TRADE Financial Corp.* | | | | | | | 2,350,350 | |
| | | | Semiconductors and Related Devices | | | 1.0% | | | | |
| | 7,600 | | CEVA, Inc.* | | | | | | | 279,300 | |
| | 594,000 | | Netlist, Inc.* | | | | | | | 175,527 | |
| | | | | | | | | | | 454,827 | |
| | | | State Commercial Banks | | | 2.0% | | | | |
| | 24,356 | | First Internet Bancorp | | | | | | | 921,875 | |
| | | | Transportation Services | | | 2.7% | | | | |
| | 11,900 | | Expedia, Inc. | | | | | | | 1,251,523 | |
| | | | TOTAL COMMON STOCKS (Cost $26,146,954) | | | | | | | 44,779,097 | |
The accompanying notes are an integral part of these financial statements.
JACOB INTERNET FUND
SCHEDULE OF INVESTMENTS(+) (Continued)
February 28, 2018 (Unaudited)
| Shares | | | | | | | Value | |
| | | SHORT TERM INVESTMENT | | | 4.4 | % | | | |
| | | Money Market Fund | | | 4.4% | | | |
| | 1,993,255 | | Fidelity Government Portfolio-Class I, 1.26%(b) | | | | | | $ | 1,993,255 | |
| | | | TOTAL SHORT TERM INVESTMENT (Cost $1,993,255) | | | | | | | 1,993,255 | |
| | | | TOTAL INVESTMENTS (Cost $28,140,209) | | | 102.1 | % | | | 46,772,352 | |
| | | | LIABILITIES IN EXCESS OF OTHER ASSETS | | | (2.1 | )% | | | (943,465 | ) |
| | | | TOTAL NET ASSETS | | | 100.0 | % | | $ | 45,828,887 | |
| * | Non Income Producing. |
| ^ | U.S. Dollar-denominated foreign security. |
| HK | Security denominated in Hong Kong dollars. Value translated into U.S. dollars. |
| (a) | Level 2 Security. See Note 2. |
| (b) | 7-day yield. |
| (+) | Schedule of Investments is classified using the U.S. Securities and Exchange Commission’s Standard Industrial Classification (SIC) Code List. |
The accompanying notes are an integral part of these financial statements.
JACOB SMALL CAP GROWTH FUND
SCHEDULE OF INVESTMENTS(+)
February 28, 2018 (Unaudited)
| Shares | | | | | | | Value | |
| | | COMMON STOCKS | | | 100.6 | % | | | |
| | | Apparel and Accessory Stores | | | 1.6% | | | |
| | 18,000 | | Tilly’s, Inc.—Class A | | | | | | $ | 234,900 | |
| | | | Bituminous Coal and Lignite Surface Mining | | | 1.8% | | | | |
| | 2,800 | | Arch Coal, Inc.—Class A | | | | | | | 267,988 | |
| | | | Business Services | | | 2.4% | | | | |
| | 18,721 | | Reis, Inc. | | | | | | | 360,379 | |
| | | | Chemical and Fertilizer Mineral Mining | | | 3.6% | | | | |
| | 11,000 | | Lithium Americas Corp.*^ | | | | | | | 68,970 | |
| | 16,000 | | Nexa Resources SA*^ | | | | | | | 328,000 | |
| | 30,000 | | Orocobre Ltd.*^ | | | | | | | 145,260 | |
| | | | | | | | | | | 542,230 | |
| | | | Computer Peripheral Equipment | | | 6.1% | | | | |
| | 36,483 | | Immersion Corp.* | | | | | | | 422,838 | |
| | 64,000 | | Mitek Systems, Inc.* | | | | | | | 489,600 | |
| | | | | | | | | | | 912,438 | |
| | | | Computer Programming, Data Processing, Etc. | | | 0.9% | | | | |
| | 3,500 | | TripAdvisor, Inc.* | | | | | | | 140,280 | |
| | | | Crude Petroleum and Natural Gas | | | 5.3% | | | | |
| | 26,600 | | Carrizo Oil & Gas, Inc.* | | | | | | | 373,730 | |
| | 30,000 | | Oasis Petroleum, Inc.* | | | | | | | 236,400 | |
| | 12,400 | | Ring Energy, Inc.* | | | | | | | 168,268 | |
| | 2,100 | | Rosehill Resources, Inc.—Class A* | | | | | | | 12,978 | |
| | | | | | | | | | | 791,376 | |
| | | | Eating Places | | | 7.0% | | | | |
| | 8,000 | | BJ’s Restaurants, Inc. | | | | | | | 348,000 | |
| | 14,800 | | Chuy’s Holdings, Inc.* | | | | | �� | | 399,600 | |
| | 31,900 | | El Pollo Loco Holdings, Inc.* | | | | | | | 311,025 | |
| | | | | | | | | | | 1,058,625 | |
| | | | Family Clothing Stores | | | 2.5% | | | | |
| | 20,000 | | American Eagle Outfitters, Inc. | | | | | | | 385,400 | |
| | | | Hotels & Motels | | | 1.7% | | | | |
| | 27,000 | | Red Lion Hotels Corp.* | | | | | | | 261,900 | |
| | | | Industrial Organic Chemicals | | | 6.9% | | | | |
| | 108,046 | | Codexis, Inc.* | | | | | | | 1,031,839 | |
The accompanying notes are an integral part of these financial statements.
JACOB SMALL CAP GROWTH FUND
SCHEDULE OF INVESTMENTS(+) (Continued)
February 28, 2018 (Unaudited)
| Shares | | | | | | | Value | |
| | | COMMON STOCKS—(Continued) | | | 100.6 | % | | | |
| | | Lumber and Other Construction Materials | | | 2.9% | | | |
| | 94,000 | | Aspen Aerogels, Inc.* | | | | | | $ | 432,400 | |
| | | | Medical Laboratories | | | 3.3% | | | | |
| | 84,867 | | CareDx, Inc.* | | | | | | | 493,926 | |
| | | | Miscellaneous Business Services | | | 4.8% | | | | |
| | 73,000 | | Helios & Matheson Analytics, Inc.* | | | | | | | 347,480 | |
| | 8,600 | | NV5 Global, Inc.* | | | | | | | 371,950 | |
| | | | | | | | | | | 719,430 | |
| | | | Offices & Clinics of Doctors of Medicine | | | 2.1% | | | | |
| | 8,000 | | Teladoc, Inc.* | | | | | | | 320,800 | |
| | | | Personal Services | | | 5.2% | | | | |
| | 17,850 | | Yelp, Inc.—Class A* | | | | | | | 777,546 | |
| | | | Pharmaceutical Preparations | | | 9.1% | | | | |
| | 20,800 | | ChemoCentryx, Inc.* | | | | | | | 202,176 | |
| | 8,800 | | Esperion Therapeutics, Inc.* | | | | | | | 707,608 | |
| | 2,600 | | Intercept Pharmaceuticals, Inc.* | | | | | | | 155,298 | |
| | 16,000 | | Mersana Therapeutics, Inc.* | | | | | | | 276,960 | |
| | 2,975 | | Omeros Corp.* | | | | | | | 30,047 | |
| | | | | | | | | | | 1,372,089 | |
| | | | Prepackaged Software | | | 15.9% | | | | |
| | 42,100 | | Hortonworks, Inc.* | | | | | | | 756,958 | |
| | 7,100 | | Instructure, Inc.* | | | | | | | 308,140 | |
| | 1,200 | | LogMeIn, Inc. | | | | | | | 138,660 | |
| | 6,150 | | Paylocity Holding Corp.* | | | | | | | 287,636 | |
| | 8,800 | | Tabula Rasa HealthCare, Inc.* | | | | | | | 284,328 | |
| | 18,000 | | Twilio, Inc.—Class A* | | | | | | | 614,880 | |
| | | | | | | | | | | 2,390,602 | |
| | | | Radio Broadcasting Stations | | | 1.6% | | | | |
| | 55,700 | | Pandora Media, Inc.* | | | | | | | 245,637 | |
| | | | Radio, Television, and Publishers’ Advertising Representatives | | | 2.2% | | | | |
| | 26,000 | | Yext, Inc.* | | | | | | | 330,200 | |
| | | | Savings Institutions, Not Federally Chartered | | | 4.0% | | | | |
| | 9,500 | | Entegra Financial Corp.* | | | | | | | 266,950 | |
| | 20,686 | | First Northwest Bancorp* | | | | | | | 330,976 | |
| | | | | | | | | | | 597,926 | |
The accompanying notes are an integral part of these financial statements.
JACOB SMALL CAP GROWTH FUND
SCHEDULE OF INVESTMENTS(+) (Continued)
February 28, 2018 (Unaudited)
| Shares | | | | | | | Value | |
| | | COMMON STOCKS—(Continued) | | | 100.6 | % | | | |
| | | Semiconductors and Related Devices | | | 0.6% | | | |
| | 2,600 | | CEVA, Inc.* | | | | | | $ | 95,550 | |
| | | | Special Industry Machinery | | | 2.4% | | | | |
| | 53,124 | | Energy Recovery, Inc.* | | | | | | | 364,431 | |
| | | | State Commercial Banks | | | 2.0% | | | | |
| | 7,775 | | First Internet Bancorp | | | | | | | 294,284 | |
| | | | Surgical and Medical Instruments and Apparatus | | | 3.0% | | | | |
| | 94,000 | | Alphatec Holdings, Inc.* | | | | | | | 299,860 | |
| | 4,000 | | Intersect ENT, Inc.* | | | | | | | 147,400 | |
| | | | | | | | | | | 447,260 | |
| | | | Water, Sewer, Pipeline, and Communications | | | | | | | | |
| | | | and Power Line Construction | | | 1.7% | | | | |
| | 5,000 | | MasTec, Inc.* | | | | | | | 254,750 | |
| | | | TOTAL COMMON STOCKS (Cost $12,372,434) | | | | | | | 15,124,186 | |
| | | | | | | | | | | | |
| | | | WARRANTS | | | 0.0% | | | | |
| | 12,750 | | TearLab Corp.*(a) | | | | | | | — | |
| | | | TOTAL WARRANTS (Cost $0) | | | | | | | — | |
| | | | | | | | | | | | |
| | | | SHORT TERM INVESTMENT | | | 0.4 | % | | | | |
| | | | Money Market Fund | | | 0.4% | | | | |
| | 66,004 | | Fidelity Government Portfolio-Class I, 1.26%(b) | | | | | | | 66,004 | |
| | | | TOTAL SHORT TERM INVESTMENT (Cost $66,004) | | | | | | | 66,004 | |
| | | | TOTAL INVESTMENTS (Cost $12,438,438) | | | 101.0 | % | | | 15,190,190 | |
| | | | LIABILITIES IN EXCESS OF OTHER ASSETS | | | (1.0 | )% | | | (153,356 | ) |
| | | | TOTAL NET ASSETS | | | 100.0 | % | | $ | 15,036,834 | |
| * | Non Income Producing. |
| ^ | U.S. Dollar-denominated foreign security. |
| (a) | Level 3 Security. See Note 2. |
| (b) | 7-day yield. |
| (+) | Schedule of Investments is classified using the U.S. Securities and Exchange Commission’s Standard Industrial Classification (SIC) Code List. |
The accompanying notes are an integral part of these financial statements.
JACOB MICRO CAP GROWTH FUND
SCHEDULE OF INVESTMENTS(+)
February 28, 2018 (Unaudited)
| Shares | | | | | | | Value | |
| | | COMMON STOCKS | | | 96.9 | % | | | |
| | | Advertising | | | 1.2% | | | |
| | 28,428 | | IZEA, Inc.* | | | | | | $ | 101,772 | |
| | | | Apparel and Accessory Stores | | | 2.2% | | | | |
| | 14,000 | | Tilly’s, Inc.—Class A | | | | | | | 182,700 | |
| | | | Bituminous Coal & Lignite Mining | | | 1.1% | | | | |
| | 13,000 | | Ramaco Resources, Inc.* | | | | | | | 89,050 | |
| | | | Business Services | | | 2.4% | | | | |
| | 10,249 | | Reis, Inc. | | | | | | | 197,293 | |
| | | | Calculating and Accounting Machines | | | | | | | | |
| | | | (No Electronic Computers) | | | 6.6% | | | | |
| | 67,000 | | USA Technologies, Inc.* | | | | | | | 546,050 | |
| | | | Chemical and Fertilizer Mineral Mining | | | 0.9% | | | | |
| | 42,000 | | Advantage Lithium Corp.*^ | | | | | | | 36,511 | |
| | 6,000 | | Lithium Americas Corp.*^ | | | | | | | 37,620 | |
| | | | | | | | | | | 74,131 | |
| | | | Commercial Physical and Biological Research | | | 2.2% | | | | |
| | 155,000 | | Senomyx, Inc.* | | | | | | 184,450 | |
| | | | Communications Equipment | | | 4.1% | | | | |
| | 46,599 | | I.D. Systems, Inc.* | | | | | | | 340,639 | |
| | | | Computer Communications Equipment | | | 3.1% | | | | |
| | 110,200 | | Lantronix, Inc.* | | | | | | | 257,868 | |
| | | | Computer Peripheral Equipment | | | 8.9% | | | | |
| | 17,274 | | Immersion Corp.* | | | | | | | 200,206 | |
| | 30,425 | | Mitek Systems, Inc.* | | | | | | | 232,751 | |
| | 142,000 | | Radisys Corp.* | | | | | | | 122,120 | |
| | 168,021 | | Top Image Systems Ltd.*^ | | | | | | | 176,422 | |
| | | | | | | | | | | 731,499 | |
| | | | Eating and Drinking Places | | | 1.5% | | | | |
| | 14,000 | | Jamba, Inc.* | | | | | | | 120,680 | |
| | | | Eating Places | | | 7.1% | | | | |
| | 4,600 | | BJ’s Restaurants, Inc. | | | | | | | 200,100 | |
| | 7,900 | | Chuy’s Holdings, Inc.* | | | | | | | 213,300 | |
| | 17,500 | | El Pollo Loco Holdings, Inc.* | | | | | | | 170,625 | |
| | | | | | | | | | | 584,025 | |
The accompanying notes are an integral part of these financial statements.
JACOB MICRO CAP GROWTH FUND
SCHEDULE OF INVESTMENTS(+) (Continued)
February 28, 2018 (Unaudited)
| Shares | | | | | | | Value | |
| | | COMMON STOCKS—(Continued) | | | 96.9 | % | | | |
| | | Electrical Apparatus and Equipment Wiring Supplies | | | 0.3% | | | |
| | 120,000 | | Real Industry, Inc.* | | | | | | $ | 28,200 | |
| | | | Gold and Silver Ores | | | 1.0% | | | | |
| | 150,000 | | Solitario Zinc Corp.* | | | | | | | 79,500 | |
| | | | Help Supply Services | | | 0.9% | | | | |
| | 22,000 | | Staffing 360 Solutions, Inc.* | | | | | | | 69,740 | |
| | | | Hotels & Motels | | | 1.8% | | | | |
| | 15,000 | | Red Lion Hotels Corp.* | | | | | | | 145,500 | |
| | | | Industrial Organic Chemicals | | | 6.7% | | | | |
| | 57,506 | | Codexis, Inc.* | | | | | | | 549,182 | |
| | | | Laboratory Analytical Instruments | | | 1.0% | | | | |
| | 80,000 | | pSivida Corp.* | | | | | | | 84,000 | |
| | | | Lumber and Other Construction Materials | | | 2.8% | | | | |
| | 51,000 | | Aspen Aerogels, Inc.* | | | | | | | 234,600 | |
| | | | Medical Laboratories | | | 3.3% | | | | |
| | 46,333 | | CareDx, Inc.* | | | | | | | 269,658 | |
| | | | Medicinal Chemicals and Botanical Products | | | 1.7% | | | | |
| | 25,000 | | ChromaDex Corp.* | | | | | | | 136,250 | |
| | | | Metal Mining | | | 0.4% | | | | |
| | 38,000 | | Wealth Minerals Ltd.*^ | | | | | | | 37,103 | |
| | | | Miscellaneous Business Services | | | 2.0% | | | | |
| | 16,750 | | Helios & Matheson Analytics, Inc.* | | | | | | | 79,730 | |
| | 1,900 | | NV5 Global, Inc.* | | | | | | | 82,175 | |
| | | | | | | | | | | 161,905 | |
| | | | Ophthalmic Goods | | | 1.2% | | | | |
| | 6,350 | | STAAR Surgical Co.* | | | | | | | 99,695 | |
| | | | Patent Owners and Lessors | | | 4.7% | | | | |
| | 172,300 | | Digital Turbine, Inc.* | | | | | | | 387,675 | |
| | | | Pharmaceutical Preparations | | | 5.0% | | | | |
| | 11,000 | | ChemoCentryx, Inc.* | | | | | | | 106,920 | |
| | 71,389 | | Imprimis Pharmaceuticals, Inc.* | | | | | | | 129,928 | |
| | 9,000 | | Mersana Therapeutics, Inc.* | | | | | | | 155,790 | |
| | 1,625 | | Omeros Corp.* | | | | | | | 16,412 | |
| | | | | | | | | | | 409,050 | |
The accompanying notes are an integral part of these financial statements.
JACOB MICRO CAP GROWTH FUND
SCHEDULE OF INVESTMENTS(+) (Continued)
February 28, 2018 (Unaudited)
| Shares | | | | | | | Value | |
| | | COMMON STOCKS—(Continued) | | | 96.9 | % | | | |
| | | Prepackaged Software | | | 6.4% | | | |
| | 13,000 | | Hortonworks, Inc.* | | | | | | $ | 233,740 | |
| | 3,600 | | Instructure, Inc.* | | | | | | | 156,240 | |
| | 4,400 | | Tabula Rasa HealthCare, Inc.* | | | | | | | 142,164 | |
| | | | | | | | | | | 532,144 | |
| | | | Radio, Television, and Publishers’ | | | | | | | | |
| | | | Advertising Representatives | | | 2.1% | | | | |
| | 14,000 | | Yext, Inc.* | | | | | | | 177,800 | |
| | | | Savings Institutions, Not Federally Chartered | | | 3.6% | | | | |
| | 4,500 | | Entegra Financial Corp.* | | | | | | | 126,450 | |
| | 10,522 | | First Northwest Bancorp* | | | | | | | 168,352 | |
| | | | | | | | | | | 294,802 | |
| | | | Semiconductors and Related Devices | | | 1.0% | | | | |
| | 1,340 | | CEVA, Inc.* | | | | | | | 49,245 | |
| | 120,700 | | Netlist, Inc.* | | | | | | | 35,667 | |
| | | | | | | | | | | 84,912 | |
| | | | Special Industry Machinery | | | 2.3% | | | | |
| | 28,000 | | Energy Recovery, Inc.* | | | | | | | 192,080 | |
| | | | State Commercial Banks | | | 1.9% | | | | |
| | 4,215 | | First Internet Bancorp | | | | | | | 159,538 | |
| | | | Surgical and Medical Instruments and Apparatus | | | 5.5% | | | | |
| | 50,000 | | Alphatec Holdings, Inc.* | | | | | | | 159,500 | |
| | 61,160 | | iCAD, Inc.* | | | | | | | 209,779 | |
| | 2,300 | | Intersect ENT, Inc.* | | | | | | | 84,755 | |
| | | | | | | | | | | 454,034 | |
| | | | TOTAL COMMON STOCKS (Cost $7,288,793) | | | | | | | 7,997,525 | |
| | | | | | | | | | | | |
| | | | WARRANTS | | | 0.0% | | | | |
| | 9,750 | | TearLab Corp.*(a) | | | | | | | — | |
| | | | TOTAL WARRANTS (Cost $0) | | | | | | | — | |
The accompanying notes are an integral part of these financial statements.
JACOB MICRO CAP GROWTH FUND
SCHEDULE OF INVESTMENTS(+) (Continued)
February 28, 2018 (Unaudited)
| Shares | | | | | | | Value | |
| | | SHORT TERM INVESTMENT | | | 3.4 | % | | | |
| | | Money Market Fund | | | 3.4% | | | |
| | 276,957 | | Fidelity Government Portfolio-Class I, 1.26%(b) | | | | | | $ | 276,957 | |
| | | | TOTAL SHORT TERM INVESTMENT (Cost $276,957) | | | | | | | 276,957 | |
| | | | TOTAL INVESTMENTS (Cost $7,565,750) | | | 100.3 | % | | | 8,274,482 | |
| | | | LIABILITIES IN EXCESS OF OTHER ASSETS | | | (0.3 | )% | | | (23,059 | ) |
| | | | TOTAL NET ASSETS | | | 100.0 | % | | $ | 8,251,423 | |
| * | Non Income Producing. |
| ^ | U.S. Dollar-denominated foreign security. |
| (a) | Level 3 Security. See Note 2. |
| (b) | 7-day yield. |
| (+) | Schedule of Investments is classified using the U.S. Securities and Exchange Commission’s Standard Industrial Classification (SIC) Code List. |
The accompanying notes are an integral part of these financial statements.
JACOB FUNDS INC.
STATEMENTS OF ASSETS AND LIABILITIES
February 28, 2018 (Unaudited)
| | | | | | Jacob | | | Jacob | |
| | | Jacob | | | Small Cap | | | Micro Cap | |
| | | Internet Fund | | | Growth Fund | | | Growth Fund | |
| Assets: | | | | | | | | | |
| Investments, at value (cost $28,140,209, | | | | | | | | | |
| $12,438,438 and $7,565,750, respectively) | | $ | 46,772,352 | | | $ | 15,190,190 | | | $ | 8,274,482 | |
| Receivable for capital shares sold | | | 7,130 | | | | — | | | | — | |
| Receivable for investments sold | | | — | | | | 207,134 | | | | 114,603 | |
| Dividend and interest receivable | | | 1,678 | | | | 1,164 | | | | 502 | |
| Prepaid expenses and other assets | | | 17,811 | | | | 22,533 | | | | 24,026 | |
| Total Assets | | | 46,798,971 | | | | 15,421,021 | | | | 8,413,613 | |
| | | | | | | | | | | | | |
| Liabilities: | | | | | | | | | | | | |
| Payable for securities purchased | | | 749,242 | | | | 239,209 | | | | 129,694 | |
| Payable to adviser | | | 43,774 | | | | 2,237 | | | | — | |
| Payable for distribution and shareholder | | | | | | | | | | | | |
| servicing expenses—Investor Class (see Note 7) | | | 84,442 | | | | — | | | | — | |
| Payable for capital shares repurchased | | | — | | | | 105,267 | | | | 24 | |
| Accrued audit fees | | | 7,687 | | | | 7,687 | | | | 7,687 | |
| Accrued directors fees | | | 13,922 | | | | 4,991 | | | | 2,759 | |
| Accrued expenses and other liabilities | | | 71,017 | | | | 24,796 | | | | 22,026 | |
| Total Liabilities | | | 970,084 | | | | 384,187 | | | | 162,190 | |
| Net Assets | | $ | 45,828,887 | | | $ | 15,036,834 | | | $ | 8,251,423 | |
| | | | | | | | | | | | | |
| Net Assets Consist Of: | | | | | | | | | | | | |
| Capital Stock | | $ | 26,413,766 | | | $ | 15,588,341 | | | $ | 10,232,197 | |
| Accumulated net investment loss | | | (1,348,669 | ) | | | (426,466 | ) | | | (84,128 | ) |
| Accumulated net realized gain (loss) on investment transactions | | | 2,131,647 | | | | (2,876,793 | ) | | | (2,605,378 | ) |
| Net unrealized appreciation on investments | | | 18,632,143 | | | | 2,751,752 | | | | 708,732 | |
| Total Net Assets | | $ | 45,828,887 | | | $ | 15,036,834 | | | $ | 8,251,423 | |
| | | | | | | | | | | | | |
Institutional Class(1) | | | | | | | | | | | | |
| Net Assets | | $ | — | | | $ | 10,552,424 | | | $ | 6,637,970 | |
| Shares outstanding (20 billion shares of $0.001 par value authorized) | | | — | | | | 500,211 | | | | 493,897 | |
Net asset value, redemption price and offering price per share(2) | | $ | — | | | $ | 21.10 | | | $ | 13.44 | |
| | | | | | | | | | | | | |
| Investor Class | | | | | | | | | | | | |
| Net Assets | | $ | 45,828,887 | | | $ | 4,484,410 | | | $ | 1,613,453 | |
| Shares outstanding (20 billion shares of $0.001 par value authorized) | | | 9,758,933 | | | | 215,639 | | | | 130,827 | |
Net asset value, redemption price and offering price per share(2) | | $ | 4.70 | | | $ | 20.80 | | | $ | 12.33 | |
_______________
(1) | The Internet Fund currently offers Investor Class shares only. See Note 1. |
(2) | Redemption of shares held less than 30 days may be charged a 2% redemption fee. See Note 3. |
The accompanying notes are an integral part of these financial statements.
JACOB FUNDS INC.
STATEMENTS OF OPERATIONS
For the Six Months Ended February 28, 2018 (Unaudited)
| | | | | | Jacob | | | Jacob | |
| | | Jacob | | | Small Cap | | | Micro Cap | |
| | | Internet Fund | | | Growth Fund | | | Growth Fund | |
| Investment Income: | | | | | | | | | |
| Dividend income | | $ | 40,484 | | | $ | 36,112 | | | $ | 18,079 | |
| Interest income | | | 10,076 | | | | 823 | | | | 3,142 | |
| Total Investment Income | | | 50,560 | | | | 36,935 | | | | 21,221 | |
| | | | | | | | | | | | | |
| Expenses: | | | | | | | | | | | | |
| Investment advisor fees | | | 278,773 | | | | 60,607 | | | | 45,347 | |
| Distribution and shareholder servicing expenses—Investor Class (See Note 7) | | | 55,755 | | | | 5,698 | | | | 2,094 | |
| Administration fees | | | 30,785 | | | | 19,819 | | | | 18,774 | |
| Fund accounting fees | | | 14,341 | | | | 17,239 | | | | 17,239 | |
| Transfer agent fees | | | 57,751 | | | | 33,312 | | | | 27,563 | |
| Custody fees | | | 3,781 | | | | 3,562 | | | | 3,310 | |
| Federal and state registration | | | 10,702 | | | | 18,745 | | | | 15,938 | |
| Insurance expense | | | 6,401 | | | | 2,368 | | | | 1,180 | |
| Audit fees | | | 7,687 | | | | 7,687 | | | | 7,687 | |
| Legal fees | | | 59,900 | | | | 14,830 | | | | 3,251 | |
| Printing and mailing of reports to shareholders | | | 7,909 | | | | 3,807 | | | | 1,480 | |
| Directors’ fees and expenses | | | 28,008 | | | | 9,027 | | | | 5,204 | |
| Miscellaneous expenses | | | 5,703 | | | | 2,496 | | | | 1,629 | |
| Total Expenses | | | 567,496 | | | | 199,197 | | | | 150,696 | |
| Expense Waiver (See Note 6) | | | — | | | | (44,530 | ) | | | (45,347 | ) |
| Net Expenses | | | 567,496 | | | | 154,667 | | | | 105,349 | |
| Net Investment Loss | | | (516,936 | ) | | | (117,732 | ) | | | (84,128 | ) |
| | | | | | | | | | | | | |
| Realized and Unrealized Gain on Investments: | | | | | | | | | | | | |
| Net realized gain on investments | | | 4,553,775 | | | | 1,116,721 | | | | 71,203 | |
| Change in net unrealized appreciation on investments | | | 851,528 | | | | 950,117 | | | | 1,359,366 | |
| Net realized and unrealized gain on investments | | | 5,405,303 | | | | 2,066,838 | | | | 1,430,569 | |
| Net Increase in Net Assets Resulting from Operations | | $ | 4,888,367 | | | $ | 1,949,106 | | | $ | 1,346,441 | |
The accompanying notes are an integral part of these financial statements.
JACOB FUNDS INC.
JACOB INTERNET FUND
STATEMENTS OF CHANGES IN NET ASSETS
| | | Six Months Ended | | | | |
| | | February 28, 2018 | | | Year Ended | |
| | | (Unaudited) | | | August 31, 2017 | |
| Operations: | | | | | | |
| Net investment loss | | $ | (516,936 | ) | | $ | (912,041 | ) |
| Net realized gain on investment transactions | | | 4,553,775 | | | | 4,727,164 | |
| Change in net unrealized appreciation on investments | | | 851,528 | | | | 1,429,836 | |
| Net increase in net assets resulting from operations | | | 4,888,367 | | | | 5,244,959 | |
| | | | | | | | | |
| Distributions to Shareholders: | | | | | | | | |
| From net realized gain: | | | (5,003,092 | ) | | | (1,931,879 | ) |
| | | | | | | | | |
| Capital Share Transactions: (Note 3) | | | | | | | | |
| Proceeds from shares sold | | | 450,122 | | | | 2,727,085 | |
| Proceeds from reinvestment of distribution | | | 4,841,339 | | | | 1,892,600 | |
| Cost of shares redeemed | | | (2,953,982 | ) | | | (7,858,648 | ) |
| Redemption fees | | | 87 | | | | 13,627 | |
| Net increase (decrease) in net assets resulting from capital share transactions | | | 2,337,566 | | | | (3,225,336 | ) |
| | | | | | | | | |
| Net Increase in Net Assets | | | 2,222,841 | | | | 87,744 | |
| Net Assets: | | | | | | | | |
| Beginning of period | | | 43,606,046 | | | | 43,518,302 | |
| End of period* | | $ | 45,828,887 | | | $ | 43,606,046 | |
| * Includes accumulated net investment loss of: | | $ | (1,348,669 | ) | | $ | (831,733 | ) |
The accompanying notes are an integral part of these financial statements.
JACOB FUNDS INC.
JACOB SMALL CAP GROWTH FUND
STATEMENTS OF CHANGES IN NET ASSETS
| | | Six Months Ended | | | | |
| | | February 28, 2018 | | | Year Ended | |
| | | (Unaudited) | | | August 31, 2017 | |
| Operations: | | | | | | |
| Net investment loss | | $ | (117,732 | ) | | $ | (258,741 | ) |
| Net realized gain on investment transactions | | | 1,116,721 | | | | 510,017 | |
| Change in net unrealized appreciation on investments | | | 950,117 | | | | 1,241,947 | |
| Net increase in net assets resulting from operations | | | 1,949,106 | | | | 1,493,223 | |
| | | | | | | | | |
| Capital Share Transactions: (Note 3) | | | | | | | | |
| Proceeds from shares sold | | | 213,868 | | | | 199,143 | |
| Cost of shares redeemed | | | (1,932,493 | ) | | | (3,891,298 | ) |
| Redemption fees | | | 97 | | | | 231 | |
Other transactions(1) | | | — | | | | 4,846 | |
| Net decrease in net assets resulting from capital share transactions | | | (1,718,528 | ) | | | (3,687,078 | ) |
| | | | | | | | | |
| Net Increase (Decrease) in Net Assets | | | 230,578 | | | | (2,193,855 | ) |
| Net Assets: | | | | | | | | |
| Beginning of period | | | 14,806,256 | | | | 17,000,111 | |
| End of period* | | $ | 15,036,834 | | | $ | 14,806,256 | |
| * Includes accumulated net investment loss of: | | $ | (426,466 | ) | | $ | (308,734 | ) |
_______________
(1) | Reimbursement from U.S. Bancorp Fund Services, LLC due to NAV Error. |
The accompanying notes are an integral part of these financial statements.
JACOB FUNDS INC.
JACOB MICRO CAP GROWTH FUND
STATEMENTS OF CHANGES IN NET ASSETS
| | | Six Months Ended | | | | |
| | | February 28, 2018 | | | Year Ended | |
| | | (Unaudited) | | | August 31, 2017 | |
Operations: | | | | | | |
| Net investment loss | | $ | (84,128 | ) | | $ | (194,849 | ) |
| Net realized gain (loss) on investment transactions | | | 71,203 | | | | (1,259,469 | ) |
| Change in net unrealized appreciation on investments | | | 1,359,366 | | | | 851,584 | |
| Net increase (decrease) in net assets resulting from operations | | | 1,346,441 | | | | (602,734 | ) |
| | | | | | | | | |
| Capital Share Transactions: (Note 3) | | | | | | | | |
| Proceeds from shares sold | | | 550,511 | | | | 149,937 | |
| Cost of shares redeemed | | | (1,029,338 | ) | | | (982,732 | ) |
| Net decrease in net assets resulting from capital share transactions | | | (478,827 | ) | | | (832,795 | ) |
| | | | | | | | | |
| Net Increase (Decrease) in Net Assets | | | 867,614 | | | | (1,435,529 | ) |
| Net Assets: | | | | | | | | |
| Beginning of period | | | 7,383,809 | | | | 8,819,338 | |
| End of period* | | $ | 8,251,423 | | | $ | 7,383,809 | |
| * Includes accumulated net investment loss of: | | $ | (84,128 | ) | | $ | — | |
The accompanying notes are an integral part of these financial statements.
JACOB FUNDS INC.
JACOB INTERNET FUND – INVESTOR CLASS
FINANCIAL HIGHLIGHTS
The table below sets forth financial data for a share of the Fund outstanding throughout each period presented.
| | | Six Months | | | | | | | | | | | | | | | | |
| | | Ended | | | | | | | | | | | | | | | | |
| | | February 28, | | | Year Ended August 31, | |
| | | 2018 | | | 2017 | | | 2016 | | | 2015 | | | 2014 | | | 2013 | |
| | | (Unaudited) | | | | | | | | | | | | | | | | |
| Per Share Data: | | | | | | | | | | | | | | | | | | |
| Net asset value, beginning of period | | $ | 4.76 | | | $ | 4.39 | | | $ | 3.96 | | | $ | 4.51 | | | $ | 3.81 | | | $ | 3.03 | |
| | | | | | | | | | | | | | | | | | | | | | | | | |
| Income (loss) from investment operations: | | | | | | | | | | | | | | | | | | | | | | | | |
| Net investment loss | | | (0.05 | )(4) | | | (0.10 | )(4) | | | (0.10 | )(1) | | | (0.08 | )(1) | | | (0.09 | )(1) | | | (0.07 | )(1) |
| Net realized and unrealized gain (loss) | | | | | | | | | | | | | | | | | | | | | | | | |
| on investment transactions | | | 0.55 | | | | 0.67 | | | | 1.02 | | | | (0.03 | ) | | | 0.79 | | | | 0.85 | |
| Total from investment operations | | | 0.50 | | | | 0.57 | | | | 0.92 | | | | (0.11 | ) | | | 0.70 | | | | 0.78 | |
| Less distributions from net realized gains | | | (0.56 | ) | | | (0.20 | ) | | | (0.49 | ) | | | (0.44 | ) | | | — | | | | — | |
Paid in capital from redemption fees(2) | | | 0.00 | | | | 0.00 | | | | 0.00 | | | | 0.00 | | | | 0.00 | | | | 0.00 | |
| Net asset value, end of period | | $ | 4.70 | | | $ | 4.76 | | | $ | 4.39 | | | $ | 3.96 | | | $ | 4.51 | | | $ | 3.81 | |
| Total return | | | 11.51 | %(5) | | | 13.65 | % | | | 25.31 | % | | | (2.14 | )% | | | 18.37 | % | | | 25.74 | % |
| | | | | | | | | | | | | | | | | | | | | | | | | |
| Supplemental data and ratios: | | | | | | | | | | | | | | | | | | | | | | | | |
| Net assets, end of period (in thousands) | | $ | 45,829 | | | $ | 43,606 | | | $ | 43,518 | | | $ | 38,860 | | | $ | 45,546 | | | $ | 40,033 | |
| Ratio of gross operating expenses | | | | | | | | | | | | | | | | | | | | | | | | |
| (prior to waiver) to average net assets | | | 2.54 | %(6) | | | 2.38 | % | | | 2.60 | % | | | 2.46 | % | | | 2.42 | % | | | 2.66 | % |
| Ratio of net operating expenses | | | | | | | | | | | | | | | | | | | | | | | | |
(after waiver) to average net assets(3) | | | 2.54 | %(6) | | | 2.38 | % | | | 2.60 | % | | | 2.46 | % | | | 2.42 | % | | | 2.66 | % |
| Ratio of net investment loss | | | | | | | | | | | | | | | | | | | | | | | | |
| (prior to waiver) to average net assets | | | (2.32 | )%(6) | | | (2.15 | )% | | | (2.47 | )% | | | (1.93 | )% | | | (2.00 | )% | | | (2.05 | )% |
| Ratio of net investment loss | | | | | | | | | | | | | | | | | | | | | | | | |
(after waiver) to average net assets(3) | | | (2.32 | )%(6) | | | (2.15 | )% | | | (2.47 | )% | | | (1.93 | )% | | | (2.00 | )% | | | (2.05 | )% |
| Portfolio turnover rate | | | 30 | %(5) | | | 46 | % | | | 43 | % | | | 50 | % | | | 56 | % | | | 44 | % |
_______________
(1) | Net investment loss per share is calculated using ending balances prior to consideration of adjustments for permanent book and tax differences. |
(2) | Less than $0.01 per share. |
(3) | For the period September 1, 2011 through January 2, 2019, the Adviser has contractually agreed to waive its advisory fee in an amount up to an annual rate of 0.10% of the Fund’s average daily net assets, to the extent that the Fund’s gross operating expense ratio exceeds 2.95%, excluding any taxes, interest, brokerage fees, acquired fund fees and expenses, and extraordinary expenses. |
(4) | Net investment loss per share represents net investment loss divided by the average shares outstanding throughout the period. |
(5) | Not annualized |
(6) | Annualized. |
The accompanying notes are an integral part of these financial statements.
JACOB FUNDS INC.
JACOB SMALL CAP GROWTH FUND – INSTITUTIONAL CLASS
FINANCIAL HIGHLIGHTS
The table below sets forth financial data for a share of the Fund outstanding throughout each period presented.
| | | | | | | | | | | | | | | | | | November 12, | |
| | | Six Months | | | | | | | | | | | | | | | 2012(2) | |
| | | Ended | | | | | | | | | | | | | | | through | |
| | | February 28, | | | Year Ended August 31, | | | August 31, | |
| | | 2018 | | | 2017 | | | 2016(1) | | | 2015 | | | 2014 | | | 2013 | |
| | | (Unaudited) | | | | | | | | | | | | | | | | |
| Per Share Data: | | | | | | | | | | | | | | | | | | |
| Net asset value, beginning of period | | $ | 18.52 | | | $ | 16.82 | | | $ | 18.95 | | | $ | 19.01 | | | $ | 17.67 | | | $ | 12.94 | |
| | | | | | | | | | | | | | | | | | | | | | | | | |
| Income (loss) from investment operations: | | | | | | | | | | | | | | | | | | | | | | | | |
Net investment loss(3) | | | (0.15 | ) | | | (0.27 | ) | | | (0.29 | ) | | | (0.36 | ) | | | (0.35 | ) | | | (0.22 | ) |
| Net realized and unrealized gain (loss) | | | | | | | | | | | | | | | | | | | | | | | | |
| on investment transactions | | | 2.73 | | | | 1.97 | | | | (1.73 | ) | | | (0.30 | )(4) | | | 1.69 | | | | 4.95 | |
| Total from investment operations | | | 2.58 | | | | 1.70 | | | | (2.02 | ) | | | (0.06 | ) | | | 1.34 | | | | 4.73 | |
| Less distributions from return on capital | | | — | | | | — | | | | (0.11 | ) | | | — | | | | — | | | | — | |
| Paid in capital from redemption fees | | | 0.00 | (10) | | | — | | | | — | | | | — | | | | — | | | | — | |
| Net asset value, end of period | | $ | 21.10 | | | $ | 18.52 | | | $ | 16.82 | | | $ | 18.95 | | | $ | 19.01 | | | $ | 17.67 | |
| Total return | | | 13.91 | %(5)(6) | | | 10.11 | %(5) | | | (10.64 | )%(5) | | | (0.32 | )% | | | 7.58 | % | | | 36.55 | %(6) |
| | | | | | | | | | | | | | | | | | | | | | | | | |
| Supplemental data and ratios: | | | | | | | | | | | | | | | | | | | | | | | | |
| Net assets, end of period (in thousands) | | $ | 10,552 | (7) | | $ | 10,480 | | | $ | 12,012 | | | $ | 9,367 | | | $ | 10,164 | | | $ | 10,131 | |
| Ratio of gross operating expenses | | | | | | | | | | | | | | | | | | | | | | | | |
| (prior to waiver) to average net assets | | | 2.55 | %(7) | | | 2.59 | % | | | 2.94 | % | | | 2.17 | % | | | 2.25 | % | | | 2.32 | %(7) |
| Ratio of net operating expenses | | | | | | | | | | | | | | | | | | | | | | | | |
(after waiver) to average net assets(8) | | | 1.95 | %(7) | | | 1.95 | % | | | 2.04 | % | | | 1.95 | % | | | 1.95 | % | | | 1.95 | %(7) |
| Ratio of net investment loss | | | | | | | | | | | | | | | | | | | | | | | | |
| (prior to waiver) to average net assets | | | (2.06 | )%(7) | | | (2.19 | )% | | | (2.80 | )% | | | (2.00 | )% | | | (2.16 | )% | | | (2.20 | )%(7) |
| Ratio of net investment loss | | | | | | | | | | | | | | | | | | | | | | | | |
(after waiver) to average net assets(8) | | | (1.46 | )%(7) | | | (1.55 | )% | | | (1.90 | )% | | | (1.78 | )% | | | (1.86 | )% | | | (1.83 | )%(7) |
Portfolio turnover rate(9) | | | 43 | %(6) | | | 60 | % | | | 58 | % | | | 84 | % | | | 86 | % | | | 81 | %(6) |
_______________
(1) | On August 29, 2016, Investor Class shares of the Jacob Wisdom Fund series of Jacob Funds Inc. were reorganized into Institutional Class Shares of the Small Cap Growth Fund. See Note 8. |
(2) | Commencement of operations of the Small Cap Growth Fund Institutional Class. The Class I shares of the Jacob Small Cap Growth Fund II, (formerly, PineBridge US Small Cap Growth Fund) series of Jacob Funds II (formerly, PineBridge Mutual Funds) was reorganized into Institutional Class shares of the Small Cap Growth Fund on November 12, 2012. On July 9, 2012, before the reorganization, the adviser of the Jacob Small Cap Growth Fund II changed from PineBridge Investments, LLC to Jacob Asset Management of New York LLC (the “Adviser”). |
(3) | Net investment loss per share represents net investment loss divided by the average shares outstanding throughout the period. |
(4) | Due to timing of capital share transactions, the per share amount of net realized and unrealized gain on investment transactions varies from the amount shown in the statement of changes in net assets. |
(5) | Includes adjustments in accordance with GAAP and, consequently, the net asset values used for financial reporting purposes and the returns based upon those net asset values may differ from the net asset values and returns for the shareholder transactions. |
(6) | Not annualized. |
(7) | Annualized. |
(8) | The Adviser has contractually agreed, effective November 12, 2012 (date of reorganization) through January 2, 2019, to waive up to 100% of its advisory fee to the extent that the Fund’s gross operating expense ratio exceeds 1.95%, excluding any taxes, interest, brokerage fees, acquired fund fees and expenses, and extraordinary expenses. |
(9) | Portfolio turnover is calculated on the basis of the Fund as a whole without distinguishing between classes of shares issued. |
(10) | Less than $0.01 per share. |
The accompanying notes are an integral part of these financial statements.
JACOB FUNDS INC.
JACOB SMALL CAP GROWTH FUND – INVESTOR CLASS
FINANCIAL HIGHLIGHTS
The table below sets forth financial data for a share of the Fund outstanding throughout each period presented.
| | | Six Months | | | | | | | | | | | | | | | | |
| | | Ended | | | | | | | | | | | | | | | | |
| | | February 28, | | | Year Ended August 31, | |
| | | 2018 | | | 2017 | | | 2016 | | | 2015 | | | 2014 | | | 2013(1) | |
| | | (Unaudited) | | | | | | | | | | | | | | | | |
| Per Share Data: | | | | | | | | | | | | | | | | | | |
| Net asset value, beginning of period | | $ | 18.28 | | | $ | 16.66 | | | $ | 18.81 | | | $ | 18.91 | | | $ | 17.63 | | | $ | 13.87 | |
| | | | | | | | | | | | | | | | | | | | | | | | | |
| Income (loss) from investment operations: | | | | | | | | | | | | | | | | | | | | | | | | |
Net investment loss(2) | | | (0.17 | ) | | | (0.32 | ) | | | (0.34 | ) | | | (0.43 | ) | | | (0.40 | ) | | | (0.35 | ) |
| Net realized and unrealized gain (loss) | | | | | | | | | | | | | | | | | | | | | | | | |
| on investment transactions | | | 2.69 | | | | 1.94 | | | | (1.71 | ) | | | 0.30 | (8) | | | 1.68 | | | | 4.11 | |
| Total from investment operations | | | 2.52 | | | | 1.62 | | | | (2.05 | ) | | | (0.13 | ) | | | 1.28 | | | | 3.76 | |
Less distributions from net investment income | | | — | | | | — | | | | (0.10 | ) | | | — | | | | — | | | | — | |
| Paid in capital from redemption fees | | | 0.00 | (3) | | | 0.00 | (3) | | | 0.00 | (3) | | | 0.03 | | | | 0.00 | (3) | | | 0.00 | (3) |
| Net asset value, end of period | | $ | 20.80 | | | $ | 18.28 | | | $ | 16.66 | | | $ | 18.81 | | | $ | 18.91 | | | $ | 17.63 | |
| Total return | | | 13.76 | %(9)(4) | | | 9.72 | %(4) | | | (10.90 | )%(4) | | | (0.53 | )% | | | 7.26 | % | | | 27.11 | % |
| | | | | | | | | | | | | | | | | | | | | | | | | |
| Supplemental data and ratios: | | | | | | | | | | | | | | | | | | | | | | | | |
| Net assets, end of period (in thousands) | | $ | 4,484 | (10) | | $ | 4,326 | | | $ | 4,988 | | | $ | 9,246 | | | $ | 6,480 | | | $ | 7,236 | |
| Ratio of gross operating expenses | | | | | | | | | | | | | | | | | | | | | | | | |
| (prior to waiver) to average net assets | | | 2.80 | %(10) | | | 2.84 | % | | | 3.23 | % | | | 2.48 | % | | | 2.59 | % | | | 2.97 | % |
| Ratio of net operating expenses | | | | | | | | | | | | | | | | | | | | | | | | |
(after waiver) to average net assets(5) | | | 2.25 | %(10) | | | 2.25 | % | | | 2.33 | % | | | 2.25 | % | | | 2.25 | % | | | 2.47 | %(6) |
| Ratio of net investment loss | | | | | | | | | | | | | | | | | | | | | | | | |
| (prior to waiver) to average net assets | | | (2.31 | )%(10) | | | (2.44 | )% | | | (3.10 | )% | | | (2.31 | )% | | | (2.51 | )% | | | (2.86 | )% |
| Ratio of net investment loss | | | | | | | | | | | | | | | | | | | | | | | | |
(after waiver) to average net assets(5) | | | (1.76 | )%(10) | | | (1.85 | )% | | | (2.20 | )% | | | (2.08 | )% | | | (2.17 | )% | | | (2.36 | )%(6) |
Portfolio turnover rate(8) | | | 43 | %(9) | | | 60 | % | | | 58 | % | | | 84 | % | | | 86 | % | | | 81 | % |
_______________
(1) | On November 12, 2012, Class R shares of the Jacob Small Cap Growth Fund II (formerly, PineBridge US Small Cap Growth Fund) series of Jacob Funds II (formerly, PineBridge Mutual Funds) were reorganized into Investor Class shares of the Small Cap Growth Fund. Activity after November 12, 2012 reflects the Funds’ combined operations. |
(2) | Net investment loss per share represents net investment loss divided by the average shares outstanding throughout the period. |
(3) | Amount is less than $0.01. |
(4) | Includes adjustments in accordance with GAAP and, consequently, the net asset values used for financial reporting purposes and the returns based upon those net asset values may differ from the net asset values and returns for the shareholder transactions. |
(5) | The Adviser has contractually agreed, effective November 12, 2012 (date of reorganization) through January 2, 2019, to waive up to 100% of its advisory fee to the extent that the Fund’s gross operating expense ratio exceeds 2.25%, excluding any taxes, interest, brokerage fees, acquired fund fees and expenses, and extraordinary expenses. |
(6) | The Adviser contractually agreed, through November 11, 2012, to waive its advisory fees in an amount up to an annual rate of 0.90% of the Fund’s average daily net assets, to the extent that the Fund’s operating expense ratio exceeds 2.45%. |
(7) | Due to timing of capital share transactions, the per share amount of net realized and unrealized gain on investment transactions varies from the amount shown in the statement of changes in net assets. |
(8) | Portfolio turnover is calculated on the basis of the Fund as a whole without distinguishing between classes of shares issued. |
(9) | Not annualized. |
(10) | Annualized. |
The accompanying notes are an integral part of these financial statements.
JACOB FUNDS INC.
JACOB MICRO CAP GROWTH FUND – INSTITUTIONAL CLASS
FINANCIAL HIGHLIGHTS
The table below sets forth financial data for a share of the Fund outstanding throughout each period presented.
| | | | | | | | | | | | | | | | | | Nine | | | | |
| | | Six Months | | | | | | | | | | | | | | | Months | | | | |
| | | Ended | | | | | | | | | | | | | | | Ended | | | Year Ended | |
| | | February 28, | | | Year Ended August 31, | | | August 31, | | | November 30, | |
| | | 2018 | | | 2017 | | | 2016 | | | 2015 | | | 2014 | | | 2013* | | | 2012(1) | |
| | | (Unaudited) | | | | | | | | | | | | | | | | | | | | | |
| Per Share Data: | | | | | | | | | | | | | | | | | | | | | | | |
| Net asset value, beginning of period | | $ | 11.32 | | | $ | 12.11 | | | $ | 16.86 | | | $ | 20.65 | | | $ | 25.31 | | | $ | 19.11 | | | $ | 18.19 | |
| | | | | | | | | | | | | | | | | | | | | | | | | | | | | |
Income (loss) from investment operations: | | | | | | | | | | | | | | | | | | | | | | | | | | | | |
Net investment loss(2) | | | (0.13 | ) | | | (0.28 | ) | | | (0.31 | ) | | | (0.32 | ) | | | (0.45 | ) | | | (0.27 | ) | | | (0.31 | ) |
Net realized and unrealized gain (loss) on investment transactions | | | | | | | | | | | | | | | | | | | | | | | | | | | | |
| | | 2.25 | | | | (0.51 | ) | | | (1.15 | ) | | | 0.67 | | | | 0.75 | | | | 6.47 | | | | 1.23 | |
| Total from investment operations | | | 2.12 | | | | (0.79 | ) | | | (1.46 | ) | | | 0.35 | | | | 0.30 | | | | 6.20 | | | | 0.92 | |
Less distributions from net realized gains | | | — | | | | — | | | | (3.29 | ) | | | (4.14 | ) | | | (4.96 | ) | | | — | | | | — | |
| Net asset value, end of period | | $ | 13.44 | | | $ | 11.32 | | | $ | 12.11 | | | $ | 16.86 | | | $ | 20.65 | | | $ | 25.31 | | | $ | 19.11 | |
| Total return | | | 18.73 | %(3) | | | (6.52 | )% | | | (7.79 | )% | | | 2.23 | % | | | 0.11 | % | | | 32.44 | %(3) | | | 5.06 | % |
| | | | | | | | | | | | | | | | | | | | | | | | | | | | | |
| Supplemental data and ratios: | | | | | | | | | | | | | | | | | | | | | | | | | | | | |
Net assets, end of period (in thousands) | | $ | 6,638 | | | $ | 5,870 | | | $ | 6,782 | | | $ | 8,651 | | | $ | 9,979 | | | $ | 10,800 | | | $ | 40,666 | |
Ratio of gross operating expenses (prior to waiver) to average net assets | | | | | | | | | | | | | | | | | | | | | | | | | | | | |
| | | 3.60 | %(4)(5) | | | 3.86 | % | | | 3.81 | % | | | 2.97 | % | | | 2.79 | % | | | 3.01 | %(4) | | | 2.12 | % |
| Ratio of net operating expenses | | | | | | | | | | | | | | | | | | | | | | | | | | | | |
| (after waiver) to average net assets | 2.50 | %(4)(5) | | | 2.66 | %(5)(6) | | | 2.61 | %(6) | | | 2.15 | %(6) | | | 2.15 | %(6) | | | 2.28 | %(4)(6) | | | 1.72 | %(6)(7) |
Ratio of net investment loss (prior to waiver) to average net assets | | | | | | | | | | | | | | | | | | | | | | | | | | | | |
| | | (3.08 | )%(4) | | | (3.65 | )% | | | (3.74 | )% | | | (2.51 | )% | | | (2.61 | )% | | | (2.46 | )%(4) | | | (1.95 | )% |
| Ratio of net investment loss | | | | | | | | | | | | | | | | | | | | | | | | | | | | |
| (after waiver) to average net assets | (1.98 | )%(4)(5) | | | (2.45 | )%(5)(6) | | | (2.54 | )%(6) | | | (1.69 | )%(6) | | | (1.97 | )%(6) | | | (1.73 | )%(4)(6) | | | (1.55 | )%(6)(7) |
Portfolio turnover rate(8) | | | 34 | %(3) | | | 48 | % | | | 43 | % | | | 84 | % | | | 66 | % | | | 40 | %(3) | | | 115 | % |
_______________
| * | The Micro Cap Growth Fund’s Predecessor Fund had a fiscal year end of November 30, so the activity begins on December 1, 2012 and the numbers shown are for the nine month period. The fiscal year was changed to August 31 to align with the other Jacob Funds. |
(1) | The financial highlights set forth herein include the historical financial highlights of the Jacob Micro Cap Growth Fund (formerly, PineBridge US Micro Cap Growth Fund) series of Jacob Funds II (formerly, PineBridge Mutual Funds) (the “Predecessor Fund”). The Predecessor Fund was reorganized into the Micro Cap Growth Fund on November 12, 2012. On July 9, 2012 before the reorganization, the adviser changed from PineBridge Investments, LLC to Jacob Asset Management of New York LLC (the “Adviser”). Information prior to November 12, 2012 reflects the performance of the Predecessor Fund’s Class I shares. |
(2) | Net investment loss per share represents net investment loss divided by the average shares outstanding throughout the period. |
(3) | Not annualized. |
(4) | Annualized. |
(5) | The Adviser has contractually agreed, effective December 29, 2016 through at least January 2, 2019, to waive up to 100% of its advisory fee to the extent that the Fund’s gross operating expense ratio exceeds 2.00%, excluding any taxes, interest, brokerage fees, acquired fund fees and expenses, and extraordinary expenses. |
(6) | The Adviser has contractually agreed, effective November 12, 2012 (date of reorganization) through December 28, 2016, to waive up to 100% of its advisory fee to the extent that the Fund’s gross operating expense ratio exceeds 2.15%, excluding any taxes, interest, brokerage fees, acquired fund fees and expenses, and extraordinary expenses. |
(7) | Prior to November 12, 2012, the previous adviser and the Adviser agreed to waive operating expenses over 1.60% of the Fund’s average daily net assets. |
(8) | Portfolio turnover is calculated on the basis of the Fund as a whole without distinguishing between classes of shares issued. |
The accompanying notes are an integral part of these financial statements.
JACOB FUNDS INC.
JACOB MICRO CAP GROWTH FUND – INVESTOR CLASS
FINANCIAL HIGHLIGHTS
The table below sets forth financial data for a share of the Fund outstanding throughout each period presented.
| | | | | | | | | | | | | | | | | | Nine | | | | |
| | | Six Months | | | | | | | | | | | | | | | Months | | | | |
| | | Ended | | | | | | | | | | | | | | | Ended | | | Year Ended | |
| | | February 28, | | | Year Ended August 31, | | | August 31, | | | November 30, | |
| | | 2018 | | | 2017 | | | 2016 | | | 2015 | | | 2014 | | | 2013* | | | 2012(1) | |
| | | (Unaudited) | | | | | | | | | | | | | | | | | | | | | |
| Per Share Data: | | | | | | | | | | | | | | | | | | | | | | | |
| Net asset value, beginning of period | | $ | 10.40 | | | $ | 11.16 | | | $ | 15.87 | | | $ | 19.73 | | | $ | 24.47 | | | $ | 18.51 | | | $ | 17.68 | |
| | | | | | | | | | | | | | | | | | | | | | | | | | | | | |
Income (loss) from investment operations: | | | | | | | | | | | | | | | | | | | | | | | | | | | | |
Net investment loss(2) | | | (0.13 | ) | | | (0.28 | ) | | | (0.32 | ) | | | (0.35 | ) | | | (0.49 | ) | | | (0.37 | ) | | | (0.37 | ) |
Net realized and unrealized gain (loss) on investment transactions | | | | | | | | | | | | | | | | | | | | | | | | | | | | |
| | | 2.06 | | | | (0.48 | ) | | | (1.10 | ) | | | 0.63 | | | | 0.71 | | | | 6.33 | | | | 1.20 | |
| Total from investment operations | | | 1.93 | | | | (0.76 | ) | | | (1.42 | ) | | | 0.28 | | | | 0.22 | | | | 5.96 | | | | 0.83 | |
Less distributions from net realized gains | | | — | | | | — | | | | (3.29 | ) | | | (4.14 | ) | | | (4.96 | ) | | | — | | | | — | |
| Paid in capital from redemption fees | | — | | | | — | | | | 0.00 | (3) | | | 0.00 | (3) | | | 0.00 | (3) | | | 0.00 | (3) | | | 0.00 | (3) |
| Net asset value, end of period | | $ | 12.33 | | | $ | 10.40 | | | $ | 11.16 | | | $ | 15.87 | | | $ | 19.73 | | | $ | 24.47 | | | $ | 18.51 | |
| Total return | | | 18.56 | %(4) | | | (6.81 | )% | | | (8.06 | )% | | | 1.93 | % | | | (0.25 | )% | | | 32.20 | %(4) | | | 4.69 | % |
| | | | | | | | | | | | | | | | | | | | | | | | | | | | | |
| Supplemental data and ratios: | | | | | | | | | | | | | | | | | | | | | | | | | | | | |
Net assets, end of period (in thousands) | | $ | 1,613 | | | $ | 1,514 | | | $ | 2,037 | | | $ | 2,603 | | | $ | 2,958 | | | $ | 3,573 | | | $ | 4,356 | |
Ratio of gross operating expenses (prior to waiver or reimbursements) to average net assets | | | | | | | | | | | | | | | | | | | | | | | | | | | | |
| | | 3.86 | %(5) | | | 4.11 | % | | | 4.16 | % | | | 3.32 | % | | | 3.14 | % | | | 3.65 | %(5) | | | 2.47 | % |
Ratio of net operating expenses (after waiver or reimbursements) to average net assets | | | | | | | | | | | | | | | | | | | | | | | | | | | | |
| | | 2.76 | %(5)(6) | | | 2.91 | %(6)(7) | | | 2.96 | %(7) | | | 2.45 | %(7) | | | 2.45 | %(7) | | | 2.63 | %(5)(7) | | | 2.07 | %(7)(8) |
Ratio of net investment loss (prior to waiver or reimbursements) to average net assets | | | | | | | | | | | | | | | | | | | | | | | | | | | | |
| | | (3.36 | )%(5) | | | (3.90 | )% | | | (4.09 | )% | | | (2.86 | )% | | | (2.96 | )% | | | (3.34 | )%(5) | | | (2.30 | )% |
Ratio of net investment loss (after waiver or reimbursements) to average net assets | | | | | | | | | | | | | | | | | | | | | | | | | | | | |
| | | (2.26 | )%(5)(6) | | | (2.70 | )%(6)(7) | | | (2.89 | )%(7) | | | (1.99 | )%(7) | | | (2.27 | )%(7) | | | (2.32 | )%(5)(7) | | | (1.90 | )%(7)(8) |
Portfolio turnover rate(9) | | | 34 | %(4) | | | 48 | % | | | 43 | % | | | 84 | % | | | 66 | % | | | 40 | %(4) | | | 115 | % |
_______________
| * | The Micro Cap Growth Fund’s Predecessor Fund had a fiscal year end of November 30, so the activity begins on December 1, 2012 and the numbers shown are for the nine month period. The fiscal year was changed to August 31 to align with the other Jacob Funds. |
(1) | The financial highlights set forth herein include the historical financial highlights of the Jacob Micro Cap Growth Fund (formerly, PineBridge US Micro Cap Growth Fund) series of Jacob Funds II (formerly, PineBridge Mutual Funds) (the “Predecessor Fund”). The Predecessor Fund was reorganized into the Micro Cap Growth Fund on November 12, 2012. On July 9, 2012 before the reorganization, the adviser changed from PineBridge Investments, LLC to Jacob Asset Management of New York LLC (the “Adviser”). Information prior to November 12, 2012 reflects the performance of the Predecessor Fund’s Class R shares. |
(2) | Net investment loss per share represents net investment loss divided by the average shares outstanding throughout the period. |
(3) | Less than $0.01 per share. |
(4) | Not annualized. |
(5) | Annualized. |
(6) | The Adviser has contractually agreed, effective December 29, 2016 through at least January 2, 2019, to waive up to 100% of its advisory fee to the extent that the Fund’s gross operating expense ratio exceeds 2.30%, excluding any taxes, interest, brokerage fees, acquired fund fees and expenses, and extraordinary expenses. |
(7) | The Adviser has contractually agreed, effective November 12, 2012 (date of reorganization) through December 28, 2016, to waive up to 100% of its advisory fee to the extent that the Fund’s gross operating expense ratio exceeds 2.45%, excluding any taxes, interest, brokerage fees, acquired fund fees and expenses, and extraordinary expenses. |
(8) | Prior to November 12, 2012, the previous adviser and the Adviser agreed to waive operating expenses over 1.90% of the Fund’s average daily net assets. |
(9) | Portfolio turnover is calculated on the basis of the Fund as a whole without distinguishing between classes of shares issued. |
The accompanying notes are an integral part of these financial statements.
JACOB FUNDS INC.
NOTES TO THE FINANCIAL STATEMENTS
February 28, 2018 (Unaudited)
NOTE 1—DESCRIPTION OF ORGANIZATION
Jacob Funds Inc. (the “Corporation”) was organized as a Maryland corporation on July 13, 1999 and is registered under the Investment Company Act of 1940, as amended (the “1940 Act”), as an open-end management investment company issuing its shares in series. The Corporation currently consists of three “diversified” series, the Jacob Internet Fund (the “Internet Fund”), the Jacob Small Cap Growth Fund (the “Small Cap Growth Fund”) and the Jacob Micro Cap Growth Fund (the “Micro Cap Growth Fund”), each a “Fund”, collectively the “Funds”, and the authorized capital stock of the Corporation consists of twenty billion shares of stock having a par value of one-tenth of one cent ($0.001) per share. The primary investment objective of the Internet Fund is long-term growth of capital with current income as a secondary objective. The primary investment objective of the Small Cap Growth Fund and Micro Cap Growth Fund is long-term growth of capital.
The Internet Fund commenced operations on December 14, 1999. The Small Cap Growth Fund commenced operations on February 1, 2010 when it acquired the assets and liabilities of the Rockland Small Cap Growth Fund series of Rockland Funds Trust in a reorganization transaction (the Small Cap Growth Fund is the successor fund to the Rockland Small Cap Growth Fund). The Small Cap Growth Fund acquired the Class I and Class R shares of the Jacob Small Cap Growth Fund II (formerly, PineBridge US Small Cap Growth Fund) series of Jacob Funds II (formerly, the PineBridge Mutual Funds) (the “Predecessor Small Cap Growth Fund”) on November 12, 2012. The Small Cap Growth Fund acquired the Investor Class shares of the Jacob Wisdom Fund series of the Corporation on August 26, 2016. The Micro Cap Growth Fund commenced operations on November 12, 2012 when it acquired the assets and liabilities of the Jacob Micro Cap Growth Fund (formerly, PineBridge US Micro Cap Growth Fund) series of Jacob Funds II (the “Predecessor Micro Cap Growth Fund”) in a reorganization transaction (the Micro Cap Growth Fund is the successor fund to the Predecessor Micro Cap Growth Fund).
The Internet Fund currently offers Investor Class shares. The Small Cap Growth Fund and Micro Cap Growth Fund currently offer Investor Class and Institutional Class shares. Each share of each class of a Fund represents an equal pro rata interest in such Fund and provides the shareholder the same voting, dividend, and other rights, except that shareholders of each class of a Fund have exclusive voting rights regarding any matter relating solely to that particular class. Shareholders may be charged a redemption fee of 2% if the shares are redeemed within 30 days of initial investment.
NOTE 2—SIGNIFICANT ACCOUNTING POLICIES
The following is a summary of significant accounting policies consistently followed by the Funds. These policies are in conformity with accounting principles generally accepted in the United States of America (“GAAP”). The Funds are investment companies and follow accounting and reporting guidance under the Financial Accounting Standards Board (“FASB”) Accounting Standards Codification (“ASC”) Topic 946, “Financial Services – Investment Companies”.
| | (a) Investment Valuation—Investment securities traded on a national securities exchange are valued at their market value determined by their last sales price in the principal market in which these securities are normally traded (except those traded on the NASDAQ National Market and Capital Market exchanges which are valued at the NASDAQ Official Closing Price (“NOCP”)), unless there are no transactions on the valuation date, in which case they are valued at the mean between the closing bid and ask prices. Securities traded over-the-counter are valued at the last reported sales price unless there is no reported sales price, in which case the mean between the closing bid and ask prices is used. Foreign securities, currencies and other assets denominated in foreign currencies are translated into U.S. dollars at the exchange rate of such currencies. Foreign equity securities are valued at the last |
JACOB FUNDS INC.
NOTES TO THE FINANCIAL STATEMENTS (Continued)
February 28, 2018 (Unaudited)
| | sale price at the close of the exchange on which the security is principally traded. Debt securities with maturities of 60 days or less are valued at amortized cost, which approximates market value. Short-term securities with 60 days or less remaining to maturity are, unless conditions indicate otherwise, amortized to maturity based on their cost to a Fund if acquired within 60 days of maturity or, if already held by a Fund on the 60th day, based on the value determined on the 61st day. If amortized cost does not approximate fair value, short-term securities are reported at fair value. Where market quotations are not readily available, are unreliable or when values have been materially affected by events occurring before the close of U.S. markets but after the close of the securities’ primary markets, securities are valued at fair value using procedures approved by the Board of Directors that are designed to determine a security’s fair value. |
| | |
| | The Funds adhere to fair valuation accounting standards which provide an authoritative definition of fair value and set out a hierarchy for measuring fair value. These standards require disclosures about the various inputs and valuation techniques used to develop the measurements of fair value and a discussion in changes in valuation techniques and related inputs during the period. These standards define fair value as the price that would be received to sell an asset or paid to transfer a liability in an orderly transaction between market participants at the measurement date. The fair value hierarchy is organized into three levels based upon the assumptions (referred to as “inputs”) used in pricing the asset or liability. These standards state that “observable inputs” reflect the assumptions market participants would use in pricing the asset or liability based on market data obtained from independent sources and “unobservable inputs” reflect an entity’s own assumptions about the assumptions market participants would use in pricing the asset or liability. |
| | |
| | Summary of Fair Value Exposure |
| | |
| | Various inputs are used in determining the value of the Funds’ investments. These inputs are summarized in the three broad levels listed below: |
| | Level 1—Unadjusted quoted prices in active markets for identical assets or liabilities that the Funds have the ability to access. |
| | | |
| | Level 2—Observable inputs other than quoted prices included in Level 1 that are observable for the asset or liability, either directly or indirectly. These inputs may include quoted prices for the identical instrument in an inactive market, prices for similar instruments, interest rates, prepayment speeds, credit risk, yield curves, default rates and similar data. |
| | | |
| | Level 3—Unobservable inputs for the asset or liability, to the extent relevant observable inputs are not available, representing the Funds’ own assumptions about the assumptions a market participant would use in valuing the asset or liability, and based on the best information available. |
| | The inputs or methodology used for valuing securities are not necessarily an indication of the risk associated with investing in those securities. |
JACOB FUNDS INC.
NOTES TO THE FINANCIAL STATEMENTS (Continued)
February 28, 2018 (Unaudited)
| | The following is a summary of the inputs used to value the Internet Fund’s investments as of February 28, 2018: |
| | | | Level 1 | | | Level 2 | | | Level 3 | | | Total | |
| | Common Stocks | | | | | | | | | | | | |
| | Computer Programing and Data Processing | | $ | 9,251,534 | | | $ | 1,641,256 | (a) | | $ | — | | | $ | 10,892,790 | |
| | Prepackaged Software | | | 9,974,605 | | | | — | | | | — | | | | 9,974,605 | |
| | Business Services | | | 3,397,291 | | | | — | | | | — | | | | 3,397,291 | |
| | Computer Peripheral Equipment | | | 3,144,972 | | | | — | | | | — | | | | 3,144,972 | |
| | Personal Services | | | 2,395,800 | | | | — | | | | — | | | | 2,395,800 | |
| | Savings Institutions, Federally Chartered | | | 2,350,350 | | | | — | | | | — | | | | 2,350,350 | |
| | Electronic Computers | | | 1,781,200 | | | | — | | | | — | | | | 1,781,200 | |
| | Calculating and Accounting Machines | | | | | | | | | | | | | | | | |
| | (No Electronic Computers) | | | 1,678,900 | | | | — | | | | — | | | | 1,678,900 | |
| | Patent Owners and Lessors | | | 1,562,841 | | | | — | | | | — | | | | 1,562,841 | |
| | Communications Equipment | | | 1,291,969 | | | | — | | | | — | | | | 1,291,969 | |
| | Transportation Services | | | 1,251,523 | | | | — | | | | — | | | | 1,251,523 | |
| | Miscellaneous Business Services | | | 1,047,200 | | | | — | | | | — | | | | 1,047,200 | |
| | Radio, Television, and Publishers’ | | | | | | | | | | | | | | | | |
| | Advertising Representatives | | | 965,200 | | | | — | | | | — | | | | 965,200 | |
| | Offices & Clinics of Doctors of Medicine | | | 938,340 | | | | — | | | | — | | | | 938,340 | |
| | State Commercial Banks | | | 921,875 | | | | — | | | | — | | | | 921,875 | |
| | Radio Broadcasting Stations | | | 729,414 | | | | — | | | | — | | | | 729,414 | |
| | Semiconductors and Related Devices | | | 454,827 | | | | — | | | | — | | | | 454,827 | |
| | Total Common Stocks | | | 43,137,841 | | | | 1,641,256 | | | | — | | | | 44,779,097 | |
| | Short Term Investment | | | | | | | | | | | | | | | | |
| | Money Market Fund | | | 1,993,255 | | | | — | | | | — | | | | 1,993,255 | |
| | Total Investments in Securities | | $ | 45,131,096 | | | $ | 1,641,256 | | | $ | — | | | $ | 46,772,352 | |
| | (a) Certain non-U.S. dollar denominated securities use systematic fair valuation. |
| | |
| | There were no transfers into or out of Level 1, Level 2 or Level 3 fair value measurements during the reporting period, as compared to their classification from the most recent annual report. |
JACOB FUNDS INC.
NOTES TO THE FINANCIAL STATEMENTS (Continued)
February 28, 2018 (Unaudited)
| | The following is a summary of the inputs used to value the Small Cap Growth Fund’s investments as of February 28, 2018: |
| | | | Level 1 | | | Level 2 | | | Level 3 | | | Total | |
| | Common Stocks | | | | | | | | | | | | |
| | Prepackaged Software | | $ | 2,390,602 | | | $ | — | | | $ | — | | | $ | 2,390,602 | |
| | Pharmaceutical Preparations | | | 1,372,089 | | | | — | | | | — | | | | 1,372,089 | |
| | Eating Places | | | 1,058,625 | | | | — | | | | — | | | | 1,058,625 | |
| | Industrial Organic Chemicals | | | 1,031,839 | | | | — | | | | — | | | | 1,031,839 | |
| | Computer Peripheral Equipment | | | 912,438 | | | | — | | | | — | | | | 912,438 | |
| | Crude Petroleum and Natural Gas | | | 791,376 | | | | — | | | | — | | | | 791,376 | |
| | Personal Services | | | 777,546 | | | | — | | | | — | | | | 777,546 | |
| | Miscellaneous Business Services | | | 719,430 | | | | — | | | | — | | | | 719,430 | |
| | Savings Institutions, Not Federally Chartered | | | 597,926 | | | | — | | | | — | | | | 597,926 | |
| | Chemical and Fertilizer Mineral Mining | | | 542,230 | | | | — | | | | — | | | | 542,230 | |
| | Medical Laboratories | | | 493,926 | | | | — | | | | — | | | | 493,926 | |
| | Surgical and Medical Instruments and Apparatus | | | 447,260 | | | | — | | | | — | | | | 447,260 | |
| | Lumber and Other Construction Materials | | | 432,400 | | | | — | | | | — | | | | 432,400 | |
| | Family Clothing Stores | | | 385,400 | | | | — | | | | — | | | | 385,400 | |
| | Special Industry Machinery | | | 364,431 | | | | — | | | | — | | | | 364,431 | |
| | Business Services | | | 360,379 | | | | — | | | | — | | | | 360,379 | |
| | Radio, Television, and Publishers’ | | | | | | | | | | | | | | | | |
| | Advertising Representatives | | | 330,200 | | | | — | | | | — | | | | 330,200 | |
| | Offices & Clinics of Doctors of Medicine | | | 320,800 | | | | — | | | | — | | | | 320,800 | |
| | State Commercial Banks | | | 294,284 | | | | — | | | | — | | | | 294,284 | |
| | Bituminous Coal and Lignite Surface Mining | | | 267,988 | | | | — | | | | — | | | | 267,988 | |
| | Hotels & Motels | | | 261,900 | | | | — | | | | — | | | | 261,900 | |
| | Water, Sewer, Pipeline, and Communications | | | | | | | | | | | | | | | | |
| | and Power Line Construction | | | 254,750 | | | | — | | | | — | | | | 254,750 | |
| | Radio Broadcasting Stations | | | 245,637 | | | | — | | | | — | | | | 245,637 | |
| | Apparel and Accessory Stores | | | 234,900 | | | | — | | | | — | | | | 234,900 | |
| | Computer Programming, Data Processing, Etc. | | | 140,280 | | | | — | | | | — | | | | 140,280 | |
| | Semiconductors and Related Devices | | | 95,550 | | | | — | | | | — | | | | 95,550 | |
| | Total Common Stocks | | | 15,124,186 | | | | — | | | | — | | | | 15,124,186 | |
| | Warrants | | | — | | | | — | | | | — | (a) | | | — | |
| | Short Term Investment | | | | | | | | | | | | | | | | |
| | Money Market Fund | | | 66,004 | | | | — | | | | — | | | | 66,004 | |
| | Total Investments in Securities | | $ | 15,190,190 | | | $ | — | | | $ | — | | | $ | 15,190,190 | |
| | (a) These warrants have a value of $0. Due to immateriality, no Level 3 rollforward has been presented. |
| | |
| | There were no transfers into or out of Level 1, Level 2 or Level 3 fair value measurements during the reporting period, as compared to their classification from the most recent annual report. |
JACOB FUNDS INC.
NOTES TO THE FINANCIAL STATEMENTS (Continued)
February 28, 2018 (Unaudited)
| | The following is a summary of the inputs used to value the Micro Cap Growth Fund’s investments as of February 28, 2018: |
| | | | Level 1 | | | Level 2 | | | Level 3 | | | Total | |
| | Common Stocks | | | | | | | | | | | | |
| | Computer Peripheral Equipment | | $ | 731,499 | | | $ | — | | | $ | — | | | $ | 731,499 | |
| | Eating Places | | | 584,025 | | | | — | | | | — | | | | 584,025 | |
| | Industrial Organic Chemicals | | | 549,182 | | | | — | | | | — | | | | 549,182 | |
| | Calculating and Accounting Machines | | | | | | | | | | | | | | | | |
| | (No Electronic Computers) | | | 546,050 | | | | — | | | | — | | | | 546,050 | |
| | Prepackaged Software | | | 532,144 | | | | — | | | | — | | | | 532,144 | |
| | Surgical and Medical Instruments and Apparatus | | | 454,034 | | | | — | | | | — | | | | 454,034 | |
| | Pharmaceutical Preparations | | | 409,050 | | | | — | | | | — | | | | 409,050 | |
| | Patent Owners and Lessors | | | 387,675 | | | | — | | | | — | | | | 387,675 | |
| | Communications Equipment | | | 340,639 | | | | — | | | | — | | | | 340,639 | |
| | Savings Institutions, Not Federally Chartered | | | 294,802 | | | | — | | | | — | | | | 294,802 | |
| | Medical Laboratories | | | 269,658 | | | | — | | | | — | | | | 269,658 | |
| | Computer Communications Equipment | | | 257,868 | | | | — | | | | — | | | | 257,868 | |
| | Lumber and Other Construction Materials | | | 234,600 | | | | — | | | | — | | | | 234,600 | |
| | Business Services | | | 197,293 | | | | — | | | | — | | | | 197,293 | |
| | Special Industry Machinery | | | 192,080 | | | | — | | | | — | | | | 192,080 | |
| | Commercial Physical and Biological Research | | | 184,450 | | | | — | | | | — | | | | 184,450 | |
| | Apparel and Accessory Stores | | | 182,700 | | | | — | | | | — | | | | 182,700 | |
| | Radio, Television, and Publishers’ | | | | | | | | | | | | | | | | |
| | Advertising Representatives | | | 177,800 | | | | — | | | | — | | | | 177,800 | |
| | Miscellaneous Business Services | | | 161,905 | | | | — | | | | — | | | | 161,905 | |
| | State Commercial Banks | | | 159,538 | | | | — | | | | — | | | | 159,538 | |
| | Hotels & Motels | | | 145,500 | | | | — | | | | — | | | | 145,500 | |
| | Medicinal Chemicals and Botanical Products | | | 136,250 | | | | — | | | | — | | | | 136,250 | |
| | Eating and Drinking Places | | | 120,680 | | | | — | | | | — | | | | 120,680 | |
| | Advertising | | | 101,772 | | | | — | | | | — | | | | 101,772 | |
| | Ophthalmic Goods | | | 99,695 | | | | — | | | | — | | | | 99,695 | |
| | Bituminous Coal & Lignite Mining | | | 89,050 | | | | — | | | | — | | | | 89,050 | |
| | Semiconductors and Related Devices | | | 84,912 | | | | — | | | | — | | | | 84,912 | |
| | Laboratory Analytical Instruments | | | 84,000 | | | | — | | | | — | | | | 84,000 | |
| | Gold and Silver Ores | | | 79,500 | | | | — | | | | — | | | | 79,500 | |
| | Chemical and Fertilizer Mineral Mining | | | 74,131 | | | | — | | | | — | | | | 74,131 | |
| | Help Supply Services | | | 69,740 | | | | — | | | | — | | | | 69,740 | |
| | Metal Mining | | | 37,103 | | | | — | | | | — | | | | 37,103 | |
| | Electrical Apparatus and Equipment Wiring Supplies | | | 28,200 | | | | — | | | | — | | | | 28,200 | |
| | Total Common Stocks | | | 7,997,525 | | | | — | | | | — | | | | 7,997,525 | |
| | Warrants | | | — | | | | — | | | | — | (a) | | | — | |
| | Short Term Investment | | | | | | | | | | | | | | | | |
| | Money Market Fund | | | 276,957 | | | | — | | | | — | | | | 276,957 | |
| | Total Investments in Securities | | $ | 8,274,482 | | | $ | — | | | $ | — | | | $ | 8,274,482 | |
| | (a) These warrants have a value of $0. Due to immateriality, no Level 3 rollforward has been presented. |
JACOB FUNDS INC.
NOTES TO THE FINANCIAL STATEMENTS (Continued)
February 28, 2018 (Unaudited)
| | There were no transfers into or out of Level 1, Level 2 or Level 3 fair value measurements during the reporting period, as compared to their classification from the most recent annual report. |
| | |
| | (b) Income Recognition—Interest income is accrued as earned. Dividend income is recorded on the ex-dividend date. All discounts and premiums are amortized using the effective interest method for tax and financial reporting purposes. |
| | |
| | (c) Expenses—Expenses that are not attributable to a particular Fund are typically allocated in proportion to each Fund’s respective net assets. Expenses are allocated to a particular share class in proportion to each class’s respective net assets. Expenses are recorded on an accrual basis. |
| | |
| | (d) Securities Transactions—Security transactions are accounted for on trade date. Realized gains and losses on securities sold are determined using specific identification. |
| | |
| | (e) Foreign Currency Transactions—The books and records are maintained in U.S. dollars. Foreign currency denominated transactions (i.e., market value of investment securities, assets and liabilities, purchases and sales of investment securities, and income and expenses) are translated into U.S. dollars at the current rate of exchange. |
| | |
| | The Funds do not isolate that portion of the results of operations resulting from changes in foreign exchange rates on investments from the fluctuations arising from changes in market prices of securities held. Such fluctuations are included with the net realized and unrealized gain or loss from investments. |
| | |
| | (f) Distributions to Shareholders—The Funds record distributions to shareholders on the ex-dividend date. Dividends from net investment income, if any, are declared and paid annually. Distributions of net realized capital gains, if any, will be declared and distributed annually. The amounts of distributions from net investment income and net realized capital gains are determined in accordance with federal income tax regulations, which may differ from those amounts determined under GAAP. These book/tax differences are either temporary or permanent in nature. To the extent these differences are permanent, reclassifications are made in the capital accounts in the period that the differences arise. The reclassifications have no effect on net assets or net asset value per share. |
| | |
| | (g) Federal Income Taxes—The Funds comply with provisions of Subchapter M of the Internal Revenue Code applicable to regulated investment companies, including the distribution of substantially all of the Funds’ taxable income. Accordingly, no provision for federal income taxes is considered necessary in the financial statements. |
| | |
| | The Funds follow accounting standards regarding recognition and measurement of tax positions taken on a tax return. No material uncertain tax positions existed as of August 31, 2017. As a result, the Funds have not recorded any liabilities for uncertain tax positions as of August 31, 2017. The standards require the Funds to analyze all open tax years, as defined by the Statute of Limitations, for all major jurisdictions. Open tax years are those that are open for examinations by taxing authorities. As of August 31, 2017, open federal tax years include the tax years ended August 31, 2014 through August 31, 2016 and expected to be taken for tax years ended August 31, 2017, for each of the Funds. |
| | |
| | (h) Use of Estimates—The preparation of financial statements in conformity with GAAP requires management to make estimates and assumptions that affect the reported amount of assets and liabilities and disclosure of contingent assets and liabilities at the date of the financial statements and the reported amounts of revenues and expenses during the reporting period. Actual results could differ from those estimates. |
| | |
| | (i) Contingencies and Commitments—The Funds indemnify the Corporation’s Officers and Directors for certain liabilities that might arise from their performance of their duties to the Funds. Additionally, in the normal course of business, the Funds enter into contracts that contain a variety of representations and warranties and which |
JACOB FUNDS INC.
NOTES TO THE FINANCIAL STATEMENTS (Continued)
February 28, 2018 (Unaudited)
| | provide general indemnifications. Each Fund’s maximum exposure under these arrangements is unknown, as this would involve future claims that may be made against the Funds that have not yet occurred. However, based on experience, the Corporation expects the risk of loss to be remote. |
NOTE 3—CAPITAL SHARE TRANSACTIONS
At February 28, 2018, there were twenty billion shares, $0.001 par value, authorized for the Corporation. Transactions in shares of the Internet Fund were as follows:
| | | | Six Months Ended | | | Year Ended | |
| | | | February 28, 2018 | | | August 31, 2017 | |
| | | | Shares | | | Amount | | | Shares | | | Amount | |
| | Sales | | | 97,711 | | | $ | 450,122 | | | | 612,471 | | | $ | 2,727,085 | |
| | Reinvestments | | | 1,125,893 | | | | 4,841,339 | | | | 457,150 | | | | 1,892,600 | |
| | Redemptions | | | (633,986 | ) | | | (2,953,982 | ) | | | (1,808,021 | ) | | | (7,858,648 | ) |
| | Redemption fees | | | — | | | | 87 | | | | — | | | | 13,627 | |
| | Net increase (decrease) | | | 589,618 | | | $ | 2,337,566 | | | | (738,400 | ) | | $ | (3,225,336 | ) |
| | Shares Outstanding: | | | | | | | | | | | | | | | | |
| | Beginning of period | | | 9,169,315 | | | | | | | | 9,907,715 | | | | | |
| | End of period | | | 9,758,933 | | | | | | | | 9,169,315 | | | | | |
Transactions in shares of the Small Cap Growth Fund were as follows:
Institutional Class
| | | | Six Months Ended | | | Year Ended | |
| | | | February 28, 2018 | | | August 31, 2017 | |
| | | | Shares | | | Amount | | | Shares | | | Amount | |
| | Sales | | | 8,430 | | | $ | 173,361 | | | | 5,121 | | | $ | 91,613 | |
| | Redemptions | | | (74,080 | ) | | | (1,467,216 | ) | | | (153,444 | ) | | | (2,695,134 | ) |
| | Redemption fees | | | — | | | | 3 | | | | — | | | | — | |
| | Other transactions(1) | | | — | | | | — | | | | — | | | | 4,846 | |
| | Net decrease | | | (65,650 | ) | | $ | (1,293,852 | ) | | | (148,323 | ) | | $ | (2,598,675 | ) |
| | Shares Outstanding: | | | | | | | | | | | | | | | | |
| | Beginning of period | | | 565,861 | | | | | | | | 714,184 | | | | | |
| | End of period | | | 500,211 | | | | | | | | 565,861 | | | | | |
JACOB FUNDS INC.
NOTES TO THE FINANCIAL STATEMENTS (Continued)
February 28, 2018 (Unaudited)
Investor Class
| | | | Six Months Ended | | | Year Ended | |
| | | | February 28, 2018 | | | August 31, 2017 | |
| | | | Shares | | | Amount | | | Shares | | | Amount | |
| | Sales | | | 1,971 | | | $ | 40,507 | | | | 6,101 | | | $ | 107,530 | |
| | Redemptions | | | (22,923 | ) | | | (465,277 | ) | | | (68,810 | ) | | | (1,196,164 | ) |
| | Redemption fees | | | — | | | | 94 | | | | — | | | | 231 | |
| | Net decrease | | | (20,952 | ) | | $ | (424,676 | ) | | | (62,709 | ) | | $ | (1,088,403 | ) |
| | Shares Outstanding: | | | | | | | | | | | | | | | | |
| | Beginning of period | | | 236,591 | | | | | | | | 299,300 | | | | | |
| | End of period | | | 215,639 | | | | | | | | 236,591 | | | | | |
| | Total decrease for the Fund | | | | | | $ | (1,718,528 | ) | | | | | | $ | (3,687,078 | ) |
(1) | Reimbursement from U.S. Bancorp Fund Services, LLC due to NAV Error. |
Transactions in shares of the Micro Cap Growth Fund were as follows:
Institutional Class
| | | | | Six Months Ended | | | Year Ended | |
| | | | | February 28, 2018 | | | August 31, 2017 | |
| | | | | Shares | | | Amount | | | Shares | | | Amount | |
| | | Sales | | | 29,876 | | | $ | 390,248 | | | | 9,107 | | | $ | 107,232 | |
| | | Redemptions | | | (54,378 | ) | | | (689,059 | ) | | | (50,546 | ) | | | (553,721 | ) |
| | | Net decrease | | | (24,502 | ) | | $ | (298,811 | ) | | | (41,439 | ) | | $ | (446,489 | ) |
| | | Shares Outstanding: | | | | | | | | | | | | | | | | |
| | | Beginning of period | | | 518,399 | | | | | | | | 559,838 | | | | | |
| | | End of period | | | 493,897 | | | | | | | | 518,399 | | | | | |
| | | | | | | | | | | | | | | | | | |
| Investor Class | | | | | | | | | | | | | | | | |
| | | | | Six Months Ended | | | Year Ended | |
| | | | | February 28, 2018 | | | August 31, 2017 | |
| | | | | Shares | | | Amount | | | Shares | | | Amount | |
| | | Sales | | | 13,479 | | | $ | 160,263 | | | | 3,971 | | | $ | 42,705 | |
| | | Redemptions | | | (28,129 | ) | | | (340,279 | ) | | | (41,086 | ) | | | (429,011 | ) |
| | | Net decrease | | | (14,650 | ) | | $ | (180,016 | ) | | | (37,115 | ) | | $ | (386,306 | ) |
| | | Shares Outstanding: | | | | | | | | | | | | | | | | |
| | | Beginning of period | | | 145,477 | | | | | | | | 182,592 | | | | | |
| | | End of period | | | 130,827 | | | | | | | | 145,477 | | | | | |
| | | Total decrease for the Fund | | | | | | $ | (478,827 | ) | | | | | | $ | (832,795 | ) |
JACOB FUNDS INC.
NOTES TO THE FINANCIAL STATEMENTS (Continued)
February 28, 2018 (Unaudited)
A 2% redemption fee is assessed on any shares of the Funds, except those received from reinvested distributions, that are sold within 30 days following their purchase date.
From time to time, the Funds may have a concentration of shareholders holding a significant percentage of shares outstanding. Investment activities of these shareholders could have a material impact on the Funds. The following table shows the number of shareholders owning greater than 10% of the outstanding shares in each of the Funds at February 28, 2018:
| | | Number of shareholders owning greater |
| | Fund | than 10% of outstanding Fund shares |
| | Internet Fund | 2 |
| | Small Cap Growth Fund Institutional Class | 2 |
| | Small Cap Growth Fund Investor Class | 1 |
| | Micro Cap Growth Fund Institutional Class | 2 |
NOTE 4—INVESTMENT TRANSACTIONS
During the six months ended February 28, 2018, purchases and sales of investment securities (excluding short-term investments) for the Funds were as follows:
| | Fund | | Purchases | | | Sales | |
| | Internet Fund | | $ | 12,899,628 | | | $ | 14,399,597 | |
| | Small Cap Growth Fund | | | 6,508,649 | | | | 7,619,554 | |
| | Micro Cap Growth Fund | | | 2,589,814 | | | | 2,841,533 | |
The Funds did not purchase long-term U.S. Government securities as a part of their investment strategies during the six months ended February 28, 2018.
NOTE 5—TAX INFORMATION
At August 31, 2017, the components of accumulated earnings/(losses) on a tax basis for the Funds were as follows:
| | | | Internet | | | Small Cap | | | Micro Cap | |
| | | | Fund | | | Growth Fund | | | Growth Fund | |
| | Cost of Investments | | $ | 26,458,590 | | | $ | 13,455,927 | | | $ | 8,139,555 | |
| | Gross unrealized appreciation | | | 19,094,384 | | | | 3,813,929 | | | | 1,727,383 | |
| | Gross unrealized depreciation | | | (2,806,384 | ) | | | (2,560,772 | ) | | | (2,541,556 | ) |
| | Net unrealized appreciation (depreciation) | | $ | 16,288,000 | | | $ | 1,253,157 | | | $ | (814,173 | ) |
| | Undistributed ordinary income | | | 1,045,216 | | | | — | | | | — | |
| | Undistributed long-term capital gains | | | 2,196,630 | | | | — | | | | — | |
| | Total distributable earnings | | $ | 3,241,846 | | | $ | — | | | $ | — | |
| | Other accumulated losses | | $ | — | | | $ | (3,753,770 | ) | | $ | (2,513,042 | ) |
| | Total accumulated earnings/(losses) | | $ | 19,529,846 | | | $ | (2,500,613 | ) | | $ | (3,327,215 | ) |
JACOB FUNDS INC.
NOTES TO THE FINANCIAL STATEMENTS (Continued)
February 28, 2018 (Unaudited)
The differences between cost amounts for book purposes and tax purposes are primarily due to the tax deferral of losses on wash sales and Passive Foreign Investment Companies (“PFICs”). At August 31, 2017, the Funds had accumulated net realized capital loss carryovers as follows:
| Small Cap | | |
Growth Fund | Expiration | |
$793,875 | 8/31/2018 | |
$793,875 | | |
At August 31, 2017, the Small Cap Growth Fund had an additional $1,567,749 in short-term capital loss carryovers and $1,392,146 in long-term capital loss carryovers which are non-expiring and the Micro Cap Fund had $593,187 in short-term capital loss carryovers and $1,919,855 in long-term capital loss carryovers which are non-expiring. To the extent the Funds realize future net capital gains, taxable distributions to its shareholders will be offset by any unused capital loss carryover.
The Internet Fund paid $1,045,268 out of long-term capital gains and $3,957,824 out of short-term capital gains (ordinary income) during the six months ended February 28, 2018 and paid $1,669,234 out of long-term capital gains and $262,645 out of short-term capital gains (ordinary income) for the fiscal year ended August 31, 2017. The Small Cap Growth Fund and the Micro Cap Growth Fund made no distributions during the six months ended February 28, 2018 and the fiscal year ended August 31, 2017.
Reclassification Adjustments: Capital stock, accumulated net investment income (loss), and accumulated net realized gain (loss) have been adjusted in the Statements of Assets and Liabilities for permanent book-tax differences for the Funds. Differences primarily relate to the tax treatment of net operating losses, foreign currency gains and losses, REIT reclassifications, and short-term gains treated as ordinary income for tax purposes. To the extent these book and tax differences are permanent in nature, such amounts are reclassified at the end of the fiscal year among capital stock, accumulated net investment income (loss) and accumulated net realized gain (loss) on investments. Accordingly, at August 31, 2017 reclassifications were recorded as follows:
| | | | Internet | | | Small Cap | | | Micro Cap | |
| | | | Fund | | | Growth Fund | | | Growth Fund | |
| | Accumulated net investment income (loss) | | $ | 1,149,924 | | | $ | 298,638 | | | $ | 357,320 | |
| | Accumulated net realized gain (loss) on investments | | | (1,890,851 | ) | | | 1,235,579 | | | | 742,626 | |
| | Capital Stock | | | 740,927 | | | | (1,534,217 | ) | | | (1,099,946 | ) |
NOTE 6—INVESTMENT ADVISORY AND OTHER AGREEMENTS
The Corporation has entered into Investment Advisory Agreements (the “Advisory Agreements”) with Jacob Asset Management of New York LLC (the “Adviser”), with whom certain Officers and a Director of the Board are affiliated, to furnish investment advisory services to the Funds. Under the terms of the Advisory Agreements, the Corporation, on behalf of the Funds, compensates the Adviser for its management services based on an annual rate of 1.25% of the Internet Fund’s average daily net assets up to $250 million and 1.00% of annual average net assets over $250 million; 0.80% of the Small Cap Growth Fund’s average daily net assets up to $250 million and 0.70% of annual average daily net assets over $250 million and 1.10% of the Micro Cap Growth Fund’s average daily net assets up to $250 million and 0.90% of annual average daily net assets over $250 million.
JACOB FUNDS INC.
NOTES TO THE FINANCIAL STATEMENTS (Continued)
February 28, 2018 (Unaudited)
The Adviser has contractually agreed to waive its advisory fees in an amount up to an annual rate of 0.10% of the Internet Fund’s average daily net assets to the extent the Internet Fund’s total annual operating expenses (excluding any taxes, interest, brokerage fees, acquired fund fees and expenses and extraordinary expenses) exceed 2.95% of the average daily net assets through at least January 2, 2019. The Adviser has the ability to recoup amounts waived for a period of thirty six months following such fee waivers to the extent that such recoupment by the Adviser will not cause the Internet Fund to exceed any applicable expense limitation in place when the fee was waived. For the six months ended February 28, 2018, the Adviser did not waive any fees with respect to the Internet Fund.
Effective November 12, 2012 (date of reorganization of the Predecessor Small Cap Growth Fund into the Small Cap Growth Fund) the Adviser contractually agreed to waive up to 100% of its advisory fee to the extent the Fund’s total annual operating expenses (excluding any taxes, interest, brokerage fees, acquired fund fees and expenses and extraordinary expenses) exceed 2.25% and 1.95% for Investor Class and Institutional Class Shares, respectively, of each class’ average daily net assets through at least January 2, 2019. The Adviser has the ability to recoup amounts waived for a period of thirty six months following such fee waivers to the extent that such recoupment by the Adviser will not cause the Fund to exceed any applicable expense limitation in place when the fee was waived. For the six months ended February 28, 2018, fees of $44,530 were waived by the Adviser with respect to the Small Cap Growth Fund.
Effective November 12, 2012 (date of reorganization of the Predecessor Micro Cap Growth Fund into the Micro Cap Growth Fund) the Adviser contractually agreed to waive up to 100% of its advisory fee to the extent the Micro Cap Growth Fund’s total annual operating expenses (excluding any taxes, interest, brokerage fees, acquired fund fees and expenses and extraordinary expenses) exceed 2.45% and 2.15% for Investor Class and Institutional Class Shares, respectively, of each class’ average daily net assets through December 28, 2016. Effective December 29, 2016, the Adviser contractually agreed to waive up to 100% of its advisory fee to the extent the Micro Cap Growth Fund’s total annual operating expenses (excluding any taxes, interest, brokerage fees, acquired fund fees and expenses and extraordinary expenses) exceed 2.30% and 2.00% for Investor Class and Institutional Class shares, respectively, of each class’ average daily net assets through at least January 2, 2019. The Adviser has the ability to recoup amounts waived for a period of thirty six months following such fee waivers to the extent that such recoupment by the Adviser will not cause the Fund to exceed any applicable expense limitation in place when the fee was waived. For the six months ended February 28, 2018, fees of $45,347 were waived by the Adviser with respect to the Micro Cap Growth Fund.
Following is a schedule of when fees may be recouped:
| | Small Cap | | | Micro Cap | | |
| | Growth Fund | | | Growth Fund | | Expiration |
| | $ | 10,532 | | | $ | 55,462 | | August 31, 2018 |
| | | 116,183 | | | | 108,084 | | August 31, 2019 |
| | | 98,037 | | | | 93,322 | | August 31, 2020 |
| | | 44,530 | | | | 45,347 | | August 31, 2021 |
| | $ | 269,282 | | | $ | 302,215 | | |
U.S. Bancorp Fund Services, LLC serves as transfer agent, administrator and accounting services agent for the Funds. U.S. Bank, N.A. serves as custodian for the Funds. All providers receive customary fees for services rendered.
JACOB FUNDS INC.
NOTES TO THE FINANCIAL STATEMENTS (Continued)
February 28, 2018 (Unaudited)
NOTE 7—DISTRIBUTION AND SERVICE PLAN
The Corporation, on behalf of the Internet Fund, has adopted a distribution and service plan (the “Internet Fund Plan”), pursuant to Rule 12b-1 under the 1940 Act. The Internet Fund Plan provides that the Internet Fund will compensate the Adviser 0.25% per annum of the Internet Fund’s average daily net assets for certain expenses and costs incurred in connection with providing shareholder servicing and maintaining shareholder accounts and to compensate parties with which it has written agreements and whose clients own shares of the Internet Fund for providing servicing to their clients (“Shareholder Servicing Fee”). The Internet Fund Plan also provides for a distribution fee equal to 0.10% of the Internet Fund’s average daily net assets on an annual basis (“Asset Based Sales Charge”). The fee is used to compensate Quasar Distributors, LLC, the Funds’ distributor (the “Distributor”), for basic distribution services, out of pocket expenses incurred in connection with activities to sell Internet Fund shares, advertising, compliance reviews, and licensing of the Adviser’s staff. The Distributor may make payments from time to time from the Asset Based Sales Charge to broker-dealers and other financial professionals whose clients are Internet Fund shareholders for providing distribution assistance and promotional support to the Internet Fund. Remaining amounts of the Asset Based Sales Charge may be used to satisfy distribution costs as directed by the Adviser. Effective September 1, 2016 through at least January 2, 2019, the Board determined to reduce such fees payable under the Internet Fund Plan from 0.35% to 0.25% of the Internet Fund’s average daily net assets on an annual basis. The Internet Fund incurred $55,755 in expenses pursuant to the 12b-1 Plan for the six months ended February 28, 2018.
The Corporation, on behalf of the Small Cap Growth Fund and Micro Cap Growth Fund, has adopted a distribution and service plan (the “Plan”) pursuant to Rule 12b-1 under the 1940 Act. Rule 12b-1 provides that an investment company that bears any direct or indirect expense of distributing its shares must do so only in accordance with the Plan as permitted by Rule 12b-1. Pursuant to the Plan, the Small Cap Growth Fund and Micro Cap Growth Fund make payments to the Distributor, the Adviser, financial intermediaries or others to reimburse such parties for distribution and/or shareholder servicing activity in an amount not to exceed 0.35% of the average daily net assets of the Investor Class shares of the Small Cap Growth and Micro Cap Growth Funds on an annual basis. Effective September 1, 2016 through at least January 2, 2019, the Board determined to reduce such fees payable under the Plan from 0.35% to 0.25% of the average daily net assets of the Investor Class shares of the Small Cap Growth and Micro Cap Growth Funds. The distribution fees are “asset based” sales charges and, therefore, long-term shareholders may pay more in total sales charges than the economic equivalent of the maximum front-end sales charge permitted by the Financial Industry Regulatory Authority (FINRA). The Small Cap Growth Fund incurred $5,698 and the Micro Cap Growth Fund incurred $2,094 in expenses pursuant to the Plan for the six months ended February 28, 2018.
NOTE 8—INDUSTRY CONCENTRATION RISK
Internet Company Risk: Many Internet-related companies have incurred large losses since their inception and will continue to incur large losses in the hope of capturing market share and generating future revenues. Accordingly, many such companies expect to incur significant operating losses for the foreseeable future, and may never be profitable.
Computer/Internet Technology Risk: Companies in the rapidly changing field of computer/Internet technology face special risks. For example, their products or services may not prove commercially successful or may become obsolete quickly. The value of the Fund’s shares may be susceptible to factors affecting the computer/Internet technology area and to greater risk and market fluctuation than an investment in a fund that invests in a broader range of portfolio securities not concentrated in any particular area or industry. The computer/Internet technology area may be subject
JACOB FUNDS INC.
NOTES TO THE FINANCIAL STATEMENTS (Continued)
February 28, 2018 (Unaudited)
to greater governmental regulation than many other areas and changes in governmental policies and the need for regulatory approvals may have a material adverse effect on these areas. Additionally, companies in these areas may be subject to risks of developing technologies, competitive pressures and other factors and are dependent upon consumer and business acceptance as new technologies evolve.
NOTE 9—SUBSEQUENT EVENTS
In preparing these financial statements, the Corporation has evaluated events after February 28, 2018 and determined that there were no significant subsequent events that would require adjustment to or additional disclosure in these financial statements.
JACOB FUNDS INC.
ADDITIONAL INFORMATION ON FUND EXPENSES (Unaudited)
For the Six Months Ended February 28, 2018 for the Internet Fund, Small Cap Growth Fund and Micro Cap Growth Fund
As a shareholder of a mutual fund, you may incur two types of costs: (1) transaction costs, including sales charges (loads) on purchase payments, reinvested dividends, or other distributions; redemption fees; and exchange fees; and (2) ongoing costs, including management fees; distribution and/or service (12b-1) fees; and other fund expenses. The Funds do not currently charge sales charges (loads) or exchange fees. The Funds assess a redemption fee of 2% on shares sold within 30 days following their purchase date. In addition, you will be assessed fees for outgoing wire transfers, returned checks and stop payment orders. The Funds charge management fees and distribution and/or service (12b-1) fees. The Expense Example is intended to help you understand your ongoing costs (in dollars) of investing in the Funds and to compare these costs with the ongoing costs of investing in other mutual funds. The Example is based on an investment of $1,000 invested at the beginning of the period and held for the entire period (9/1/2017–2/28/2018) for the Internet Fund, Small Cap Growth Fund and Micro Cap Growth Fund.
Actual Expenses
The first line of the table below provides information about account values based on actual returns and actual expenses. Although the Funds charge no sales load, the Funds charge a redemption fee of 2% on shares sold within 30 days following the purchase date. In addition, you will be assessed fees for outgoing wire transfers, returned checks and stop payment orders at prevailing rates charged by U.S. Bancorp Fund Services, LLC, the Funds’ transfer agent. If you request that a redemption be made by wire transfer, currently the Funds’ transfer agent charges a $15.00 fee. The Example does not reflect transactional costs, such as redemption fees. You may use the information in the first line below, together with the amount you invested, to estimate the expenses that you paid over the period. Simply divide your account value by $1,000 (for example, an $8,600 account value divided by $1,000 = 8.6), then multiply the result by the number in the first line under the heading entitled “Expenses Paid During the Period” to estimate the expenses you paid on your account during this period.
Hypothetical Example for Comparison Purposes
The second line of the table below provides information about hypothetical account values based on a hypothetical return and hypothetical expenses based on a Fund’s actual expense ratio and an assumed rate of return of 5% per year before expenses, which is not a Fund’s actual return. The hypothetical account values and expenses may not be used to estimate the actual ending account balance or expenses you paid for the period. You may use this information to compare the ongoing costs of investing in the Funds and other funds. To do so, compare this 5% hypothetical example with the 5% hypothetical examples that appear in the shareholder reports of the other funds. Please note that the expenses shown in the table are meant to highlight your ongoing costs only and do not reflect transactional costs, such as redemption fees. Therefore, the second line of the table is useful in comparing ongoing costs only, and will not help you determine the relative total costs of owning different funds. In addition, if the transactional costs were included, your costs would have been higher.
JACOB FUNDS INC.
ADDITIONAL INFORMATION ON FUND EXPENSES (Unaudited) (Continued)
Internet Fund – Investor Class
| | | | Expenses Paid |
| | Beginning Account | Ending Account | During the Period |
| | Value 9/1/17 | Value 2/28/18 | 9/1/17–2/28/18* |
| Actual | $1,000.00 | $1,115.10 | $13.34 |
| Hypothetical (5% annual return before expenses) | $1,000.00 | $1,012.18 | $12.70 |
____________
| * | Expenses are equal to the Internet Fund’s annualized expense ratio of 2.54% multiplied by the average account value over the period multiplied by 181/365 (to reflect the one-half year period). |
Small Cap Growth Fund – Institutional Class
| | | | Expenses Paid |
| | Beginning Account | Ending Account | During the Period |
| | Value 9/1/17 | Value 2/28/18 | 9/1/17–2/28/18* |
| Actual | $1,000.00 | $1,139.30 | $10.34 |
| Hypothetical (5% annual return before expenses) | $1,000.00 | $1,059.41 | $ 9.96 |
____________
| * | Expenses are equal to the Institutional Class’s annualized expense ratio of 1.95% multiplied by the average account value over the period multiplied by 181/365 (to reflect the one-half year period). |
Small Cap Growth Fund – Investor Class
| | | | Expenses Paid |
| | Beginning Account | Ending Account | During the Period |
| | Value 9/1/17 | Value 2/28/18 | 9/1/17–2/28/18* |
| Actual | $1,000.00 | $1,137.90 | $11.93 |
| Hypothetical (5% annual return before expenses) | $1,000.00 | $1,013.64 | $11.23 |
____________
| * | Expenses are equal to the Investor Class’s annualized expense ratio of 2.25% multiplied by the average account value over the period multiplied by 181/365 (to reflect the one-half year period). |
Micro Cap Growth Fund – Institutional Class
| | | | Expenses Paid |
| | Beginning Account | Ending Account | During the Period |
| | Value 9/1/17 | Value 2/28/18 | 9/1/17–2/28/18* |
| Actual | $1,000.00 | $1,187.30 | $13.58 |
| Hypothetical (5% annual return before expenses) | $1,000.00 | $1,012.38 | $12.49 |
____________
| * | Expenses are equal to the Institutional Class’s annualized expense ratio of 2.50% multiplied by the average account value over the period multiplied by 181/365 (to reflect the one-half year period). |
Micro Cap Growth Fund – Investor Class
| | | | Expenses Paid |
| | Beginning Account | Ending Account | During the Period |
| | Value 9/1/17 | Value 2/28/18 | 9/1/17–2/28/18* |
| Actual | $1,000.00 | $1,185.60 | $14.95 |
| Hypothetical (5% annual return before expenses) | $1,000.00 | $1,011.11 | $13.76 |
____________
| * | Expenses are equal to the Investor Class’s annualized expense ratio of 2.76% multiplied by the average account value over the period multiplied by 181/365 (to reflect the one-half year period). |
JACOB FUNDS INC.
ADDITIONAL INFORMATION (Unaudited)
Approval of the Investment Advisory Agreements
During the fiscal quarter ended November 30, 2017, the Board of Directors (the “Board”), including all of the Independent Directors, considered and approved the renewal of the Investment Advisory Agreements between Jacob Funds Inc. (the “Company”), on behalf of the Jacob Internet Fund (the “Internet Fund”), Jacob Small Cap Growth Fund (the “Small Cap Fund”) and Jacob Micro Cap Growth Fund (the “Micro Cap Fund” and, together with the Internet Fund and the Small Cap Fund, the “Funds”), and Jacob Asset Management of New York LLC (the “Adviser”) (collectively, the “Investment Advisory Agreements”) for an additional year, including an amendment effecting a 10 basis point reduction at current asset levels in the contractual advisory fees payable by the Small Cap Fund and the Micro Cap Fund . The Board also considered the continuation of the Fee Waiver Agreements between the Adviser and the Company, on behalf of the Internet Fund, Small Cap Fund and Micro Cap Fund (collectively, the “Fee Waiver Agreements”), which the Adviser offered to continue for an additional year. While the Investment Advisory Agreements for all of the Funds were considered at the same Board meeting, the Board dealt with each Fund separately.
In reaching its decision to renew the Investment Advisory Agreements, the Board took into account a combination of factors, including the nature, extent and quality of the services to be provided by the Adviser; each Fund’s performance; each Fund’s fees and expenses; the costs of the services to be provided and the profits realized by the Adviser; and the extent to which there are economies of scale in the provision of advisory services and whether the Adviser may realize additional economies of scale in the future. The Board did not identify any single factor as all-important or controlling, and each Director may have weighed a particular piece of information or factor differently than another Director. This summary does not detail all of the matters considered by the Board.
The materials provided to, and discussed by, the Board in connection with the renewal of the Investment Advisory Agreements included written responses from the Adviser that provided, among other things: (i) a description of the Adviser’s business, operations and qualifications; (ii) a description of personnel, including responsibilities, changes since the last renewal of the Investment Advisory Agreements (the “last renewal”) and compensation policies; (iii) a description of the advisory services provided to the Funds, including a discussion of how investment decisions are made and executed; (iv) a description of any services other than investment advice provided to the Funds by the Adviser; (v) a copy of the Adviser’s most recent Form ADV; (vi) a balance sheet and profit and loss statement for the Adviser; (vii) a description of the advisory fees and a peer group comparison along with a discussion of the appropriateness of the fees; (viii) a description of any issues or recommendations with respect to the Company’s compliance program since the last renewal; (ix) a description of the Company’s expenses, including expense ratios and comparative expense ratios, costs incurred by the Adviser and brokerage expenses; and (x) a description of errors and omission insurance coverage that is currently in place.
Additional materials that were provided to, and discussed by, the Board in connection with the renewal of the Investment Advisory Agreements included, among other things: (i) a copy of the Investment Advisory Agreements with the Adviser, which, among other things, described the services provided to the Funds and the compensation to be paid for such services; (ii) a copy of the Fee Waiver Agreements with the Adviser; (iii) Morningstar comparative industry peer group and peer fund data for the Funds’ performance for various periods ended August 31, 2017; and (iv) Morningstar comparative industry peer group data regarding the investment advisory fees and total expense ratios of the Funds along with other industry peer group comparisons of fund expenses and expense reimbursements for the period ended August 31, 2017.
JACOB FUNDS INC.
ADDITIONAL INFORMATION (Unaudited) (Continued)
The Board discussed the nature, extent and quality of services provided by the Adviser to each Fund, including the Adviser’s resources comparative to other advisory firms and developments since the last renewal. They concluded that the experienced portfolio management and research team dedicated to the continued management of the Funds were sufficient and beneficial to the Funds, as evidenced by each Fund’s performance record over varying periods, and that the services provided were consistent with the terms of the Investment Advisory Agreements.
The Board reviewed the investment performance of each Fund. While consideration was given to performance reports and discussions throughout the year, attention in assessing performance was given to the comparative data furnished in connection with the renewal of the Investment Advisory Agreements.
With respect to the performance results of the Internet Fund, the Small Cap Fund, and the Micro Cap Fund, the Board considered that each Fund’s performance results was below the median and average performance of its Morningstar peer groups (US OE Technology Funds for the Internet Fund and US OE Small Growth Funds for the Small Cap and Micro Cap Funds, respectively) for the year-to-date, one-, three- and five-year periods ended August 31, 2017, as well as the ten-year period ended August 31, 2017 for the Internet Fund. The Board also considered that the Internet Fund outperformed the average performance of its Morningstar peer group for the fifteen-year period ended August 31, 2017. The Board observed that, while the Funds underperformed their respective peer groups over various periods, the Board was satisfied with the Adviser’s services and continued attention to the Funds’ long-term performance. The Board further noted that the comparable long-term total return performance record for all Funds indicates the potential benefit of the Advisor’s management strategy and the Advisor’s proven ability to provide value for shareholders. The Board expressed its intention to continue to closely monitor the performance results of the Funds.
The Board reviewed the advisory fees and overall expenses of each Fund and discussed the difference in fees and expenses compared to other funds within each Fund’s peer group. The Board discussed the allocation of expenses among the Funds and the manner in which each Fund bears its appropriate share of the expenses. The Board noted the relatively small size of the Funds, as well as the ongoing subsidies of operating expenses by the Adviser pursuant to the Fee Waiver Agreements for the Small Cap Fund and Micro Cap Fund. The Board considered the proposed reduction in the contractual advisory fee for the Small Cap and Micro Cap Funds at current asset levels, as well as an amendment effecting a lower breakpoint in the advisory fee schedule for each of the Funds, including the Internet Fund. The Board noted its continued determination to reduce the 12b-1 fees payable under the distribution and service plans of the Funds, effective September 1, 2016 (Investor Class shares only). The Board also recognized the fact that expense ratios generally increase as assets decline and decrease as assets grow. The Board considered the Advisor’s actions to reduce the Funds’ regular, ongoing expenses by transitioning certain services with respect to the preparation of SEC filings and website maintenance.
With respect to the advisory fees and overall expenses of the Internet Fund, the Board considered that the Fund’s advisory fees and net expense ratio (excluding 12b-1 fees) were above the median and average of its Morningstar peer group (US OE Technology Funds). The Board also considered the Fee Waiver Agreement and reduction in 12b-1 fees payable under the distribution and service plan of the Fund, each in place through January 2, 2019. The Board discussed the competitiveness of the Fund’s advisory fees and net expense ratio (excluding 12b-1 fees) in light of the size of the Fund and noted that the Fund’s expenses had been subsidized by an advisory fee waiver over various periods. The Board was satisfied that the Adviser has taken actions in an effort to improve the Fund’s comparative expenses.
JACOB FUNDS INC.
ADDITIONAL INFORMATION (Unaudited) (Continued)
With respect to the advisory fees and overall expenses of the Small Cap Fund, the Board considered that the Fund’s advisory fees and net expense ratio (excluding 12b-1 fees) for Investor Class shares were above the median and average of its Morningstar peer group (US OE Small Growth Funds). The Board also considered the Fee Waiver Agreement and reduction in 12b-1 fees payable under the distribution and service plan of the Fund, each in place through January 2, 2019. The Board noted the reduction in the contractual advisory fee payable by the Small Cap Fund at current asset levels by ten basis points. The Board considered that such reduction had no effect on net expense ratios at current asset levels in light of advisory fee waivers, but that the Small Cap Fund could realize the benefit of the reduction as asset levels grow. The Board discussed the competitiveness of the Fund’s advisory fees and net expense ratio (excluding 12b-1 fees) in light of the size of the Fund and noted that the Fund’s expenses are currently subsidized by an advisory fee waiver. The Board was satisfied that the Adviser has taken actions in an effort to improve the Fund’s comparative expenses.
With respect to the advisory fees and overall expenses of the Micro Cap Fund, the Board considered that the Fund’s advisory fees and net expense ratio (excluding 12b-1 fees) for Investor Class shares were above the median and average of its Morningstar peer group (US OE Small Growth Funds). The Board also considered the Fee Waiver Agreement (under which the Adviser was waiving all of its advisory fees for the year ended August 31, 2017) and reduction in 12b-1 fees payable under the distribution and service plan of the Fund, each in place through January 2, 2019. The Board noted the reduction in the contractual advisory fee payable by the Micro Cap Fund at current asset levels by ten basis points. The Board considered that such reduction had no effect on net expense ratios at current asset levels in light of advisory fee waivers, but that the Micro Cap Fund could realize the benefit of the reduction as asset levels grow. The Board discussed the competitiveness of the Fund’s advisory fees and net expense ratio (excluding 12b-1 fees) in light of the size of the Fund and noted that the Fund’s expenses are currently subsidized by an advisory fee waiver (including a reduction in the expense level above which the Adviser will waive a portion of its advisory fees put in place during the previous year). The Board was satisfied that the Adviser has taken actions in an effort to improve the Fund’s comparative expenses.
The Board discussed the profitability, projected revenue growth and financial viability of the Adviser; other benefits received by the Adviser in connection with the management of the Funds; the extent to which there are economies of scale in the provision of advisory services; and whether the Adviser may realize additional economies of scale in the future. In considering the various factors, the Board’s fiduciary duties to the Funds’ shareholders, and the body of law governing the approval of investment advisory agreements, the Independent Directors received written materials, assistance, and advice from independent legal counsel and counsel to the Company.
Based on all of the above-mentioned factors and their related conclusions, with no single factor or conclusion being determinative, and with each Independent Director not necessarily attributing the same weight to each factor, the Independent Directors concluded that (i) the Adviser demonstrated that it possessed the capability and resources to perform the duties required of it under the Investment Advisory Agreements; (ii) the compensation payable to the Adviser under the Investment Advisory Agreements was fair and reasonable; and (iii) the compensation and other terms of the Investment Advisory Agreements were appropriate and in the best interests of each of the Funds and its shareholders.
JACOB FUNDS INC.
ADDITIONAL INFORMATION (Unaudited)
Proxy Voting
A description of the policies and procedures that the Funds use to determine how to vote proxies relating to portfolio securities is available without charge by calling toll-free 1-888-JACOB-FX (522-6239) or on the SEC website at http://www.sec.gov.
Proxy Voting Record
Information regarding how the Funds voted proxies relating to portfolio securities during the most recent 12-month period ended June 30 is available without charge by calling 1-888-JACOB-FX (522-6239) or on the SEC website at http://www.sec.gov.
Holdings Disclosure
The Funds’ Semi-Annual and Annual Reports include a complete schedule of portfolio holdings for the second and fourth quarters of each fiscal year.
The Funds file their complete schedule of portfolio holdings with the SEC for the first and third quarters of each fiscal year on Form N-Q. The Funds’ Forms N-Q are available on the SEC website at http://www.sec.gov and may be reviewed and copied at the SEC’s Public Reference Room in Washington, D.C. Information on the operation of the Public Reference Room may be obtained by calling 1-800-SEC-0330.
ADDITIONAL TAX INFORMATION (Unaudited)
For the year ended August 31, 2017, certain dividends paid by the Funds may be subject to a maximum tax rate of 20%. The percentage of dividends declared from net investment income designated as qualified income is as follows:
For corporate shareholders, the percent of ordinary income distributions qualifying for the corporate dividends received deduction for the year ended August 31, 2017 is as follows:
The percentage of taxable ordinary income distributions that are designated as short-term capital gain distributions under Internal Revenue Code Section 871(k)(2)(C) is as follows:
Semi-Annual Report
February 28, 2018
JACOB INTERNET FUND
JACOB SMALL CAP GROWTH FUND
JACOB MICRO CAP GROWTH FUND
Jacob Asset Management of New York LLC
1-888-JACOB-FX (522-6239)
www.jacobmutualfunds.com
Investment Adviser
Jacob Asset Management of New York LLC
Administrator and Transfer Agent
and Dividend Agent
U.S. Bancorp Fund Services, LLC
Underwriter and Distributor
Quasar Distributors, LLC
Custodian
U.S. Bank, N.A.
Legal Counsel
Stradley Ronon Stevens & Young, LLP
Independent Registered Public
Accounting Firm
BBD, LLP
This report has been prepared for the information of shareholders of the Jacob Internet Fund, the Jacob Small Cap Growth Fund and the Jacob Micro Cap Growth Fund and is not authorized for distribution to prospective investors unless preceded or accompanied by an effective prospectus that includes information regarding the Funds’ objectives, policies, management, records and other information.
Item 2. Code of Ethics.
Not applicable for semi-annual reports.
Item 3. Audit Committee Financial Expert.
Not applicable for semi-annual reports.
Item 4. Principal Accountant Fees and Services.
Not applicable for semi-annual reports.
Item 5. Audit Committee of Listed Registrants.
Not applicable to Registrants who are not listed issuers (as defined in Rule 10A-3 under the Securities Exchange Act of 1934).
Item 6. Investments.
(a) The Schedule of Investments is included as part of the report to shareholders filed under Item 1 of this Form.
(b) Not applicable.
Item 7. Disclosure of Proxy Voting Policies and Procedures for Closed-End Management Investment Companies.
Not applicable to open-end investment companies.
Item 8. Portfolio Managers of Closed-End Management Investment Companies.
Not applicable to open-end investment companies.
Item 9. Purchases of Equity Securities by Closed‑End Management Investment Company and Affiliated Purchasers.
Not applicable to open-end investment companies.
Item 10. Submission of Matters to a Vote of Security Holders.
Not Applicable.
Item 11. Controls and Procedures.
| (a) | The Registrant’s principal executive officer/President and principal financial officer/Treasurer have reviewed the Registrant's disclosure controls and procedures (as defined in Rule 30a-3(c) under the Investment Company Act of 1940 (the “Act”)) as of a date within 90 days of the filing of this report, as required by Rule 30a-3(b) under the Act and Rules 13a-15(b) or 15d‑15(b) under the Securities Exchange Act of 1934. Based on their review, such officers have concluded that the disclosure controls and procedures are effective in ensuring that information required to be disclosed in this report is appropriately recorded, processed, summarized and reported and made known to them by others within the Registrant and by the Registrant’s service provider. |
| (b) | There were no changes in the Registrant's internal control over financial reporting (as defined in Rule 30a-3(d) under the Act) that occurred during the second fiscal quarter of the period covered by this report that has materially affected, or is reasonably likely to materially affect, the Registrant's internal control over financial reporting. |
Item 12. Disclosure of Securities Lending Activities for Closed-End Management Investment Companies
Not applicable to open-end investment companies.
Item 13. Exhibits.
| (a) | (1) Any code of ethics or amendment thereto, that is the subject of the disclosure required by Item 2, to the extent that the Registrant intends to satisfy Item 2 requirements through filing an exhibit. Incorporated by reference to previous Form N-CSR filing. |
(2) A separate certification for each principal executive and principal financial officer pursuant to Section 302 of the Sarbanes-Oxley Act of 2002. Furnished herewith.
(3) Any written solicitation to purchase securities under Rule 23c‑1 under the Act sent or given during the period covered by the report by or on behalf of the Registrant to 10 or more persons. Not applicable to open-end investment companies.
(4) Change in the registrant’s independent public accountant. There was no change in the registrant’s independent public accountant for the period covered by this report.
| (b) | Certifications pursuant to Section 906 of the Sarbanes‑Oxley Act of 2002. Furnished herewith. |
SIGNATURES
Pursuant to the requirements of the Securities Exchange Act of 1934 and the Investment Company Act of 1940, the Registrant has duly caused this report to be signed on its behalf by the undersigned, thereunto duly authorized.
(Registrant) Jacob Funds Inc.
By (Signature and Title) /s/Ryan Jacob
Ryan Jacob, President/Principal Executive Officer
Date April 25, 2018
Pursuant to the requirements of the Securities Exchange Act of 1934 and the Investment Company Act of 1940, this report has been signed below by the following persons on behalf of the Registrant and in the capacities and on the dates indicated.
By (Signature and Title) /s/Ryan Jacob
Ryan Jacob, President/Principal Executive Officer
Date April 25, 2018
By (Signature and Title) /s/Francis Alexander
Francis Alexander, Treasurer/Principal Financial Officer
Date April 26, 2018