| | |
OMB APPROVAL |
OMB Number: | | 3235-0570 |
Expires: | | August 31, 2011 |
Estimated average burden |
hours per response: | | 18.9 |
UNITED STATES
SECURITIES AND EXCHANGE COMMISSION
Washington, D.C. 20549
FORM N-CSR
CERTIFIED SHAREHOLDER REPORT OF
REGISTERED MANAGEMENT INVESTMENT COMPANIES
Investment Company Act file number: 811-09477
ING Variable Insurance Trust
|
| (Exact name of registrant as specified in charter) |
| | |
| 7337 E. Doubletree Ranch Rd., Scottsdale, AZ | | 85258 |
| (Address of principal executive offices) | | (Zip code) |
The Corporation Trust Company, 1209 Orange Street, Wilmington, DE 19801
|
| (Name and address of agent for service) |
Registrant’s telephone number, including area code: 1-800-992-0180
Date of fiscal year end: December 31
Date of reporting period: January 1, 2010 to December 31, 2010
| Item 1. | Reports to Stockholders. |
The following is a copy of the report transmitted to stockholders pursuant to Rule 30e-1 under the Act (17 CFR 270.30e-1):

Annual Report
December 31, 2010
ING GET U.S. Core Portfolio
This report is submitted for general information to shareholders of the ING Funds. It is not authorized for distribution to prospective shareholders unless accompanied or preceded by a prospectus which includes details regarding the funds’ investment objectives, risks, charges, expenses and other information. This information should be read carefully.
MUTUAL FUNDS 
| |
TABLE OF CONTENTS
PROXY VOTING INFORMATION
A description of the policies and procedures that the Series use to determine how to vote proxies related to portfolio securities is available: (1) without charge, upon request by calling Shareholder Services toll-free at (800) 992-0180; (2) on the ING Funds’ website at www.ingfunds.com; and (3) on the U.S. Securities and Exchange Commission’s (“SEC”) website at www.sec.gov. Information regarding how the Series voted proxies related to portfolio securities during the most recent 12-month period ended June 30 is available without charge on the ING Funds’ website at www.ingfunds.com and on the SEC’s website at www.sec.gov.
QUARTERLY PORTFOLIO HOLDINGS
The Series files their complete schedule of portfolio holdings with the SEC for the first and third quarters of each fiscal year on Form N-Q. The Series’ Forms N-Q are available on the SEC’s website at www.sec.gov. The Series’ Forms N-Q may be reviewed and copied at the SEC’s Public Reference Room in Washington, DC, and information on the operation of the Public Reference Room may be obtained by calling (800) SEC-0330; and is available upon request from the Series by calling Shareholder Services toll-free at (800) 992-0180.
PRESIDENT’S LETTER

Big Picture vs. Details
Dear Shareholder,
On January 25, 2011, President Obama delivered his second State of the Union address. He called on Americans to put aside partisan differences and harness the nation’s creativity to adapt and thrive in a rapidly changing global economy. The president’s challenge is timely: the United States is approaching a nexus of intermediate- and long-term concerns, and the choices we make over the next two years could determine the nation’s competitiveness in the global economy for decades to come.
There are reasons to be optimistic — the International Monetary Fund (“IMF”) predicts the U.S. economy will grow about 3% in 2011. China and India are expected to grow at about 9% and even the euro zone appears to be recovering from crisis; this growth, however, is being accompanied by mounting inflation pressures in certain regions,
suggesting that many economies are expanding at unsustainable rates.
As I write this, the World Economic Forum is getting underway in Davos, Switzerland, and there are numerous concerns to deal with. Chief among them are the still-present risk of sovereign debt defaults in the euro zone; high unemployment and banking problems in the advanced economies; and inflationary pressures in emerging markets, especially with regard to food, fuel and commodities.
As we’ve noted before, uncertainty is a defining characteristic of our age and, in our opinion, is likely to remain so beyond this year. How should you respond within your investment portfolio? Remember that the most important consideration is your long-term goals, not the outlook for 2011. With investment hazards and opportunities everywhere, we believe it makes sense to cast as broad a net as possible around the globe. In our opinion, you want your portfolio to be well diversified so that it is not harmed too much by the trouble spots, and has some exposure to positive trends.
As always, we believe the best approach is a well-diversified portfolio and a well-defined investment plan. As we’ve noted many times before, it’s important to discuss any proposed changes thoroughly with your advisor before taking any action. Thank you for your continued confidence in ING Funds. We look forward to serving your investment needs in the future.
Sincerely,

Shaun Mathews
President and Chief Executive Officer
ING Funds
January 26, 2011
The views expressed in the President’s Letter reflect those of the President as of the date of the letter. Any such views are subject to change at any time based upon market or other conditions and ING Funds disclaim any responsibility to update such views. These views may not be relied on as investment advice and because investment decisions for an ING Fund are based on numerous factors, may not be relied on as an indication of investment intent on behalf of any ING Fund. Reference to specific company securities should not be construed as recommendations or investment advice. Consider the fund’s investment objectives, risks, and charges and expenses carefully before investing. The prospectus contains this information and other information about the fund.
International investing poses special risks including currency fluctuation, economic and political risks not found in investments that are solely domestic.
1
MARKET PERSPECTIVE: YEAR ENDED DECEMBER 31, 2010
In our semi-annual report we described how, after a 13-month advance through mid-April, a confluence of local and world issues sent global equities, in the form of the MSCI World IndexSM measured in local currencies, including net reinvested dividends (“MSCI” for regions discussed below), reeling to a loss for the first half of the fiscal year. In the second half of the year, the MSCI World IndexSM bounced back and for 2010 returned 10.01%. (The MSCI World IndexSM returned 11.76% for the one year ended December 31, 2010, measured in U.S. dollars.) By year end, investor sentiment had turned distinctly positive, despite the grave concerns that remained.
It was a bumpy ride. Markets from stocks to bonds to currencies were continually buffeted by news and events relating to three main themes: the stuttering U.S. economic recovery, the sovereign debt crisis in the Eurozone and growth dynamics in China.
In the U.S., quarterly gross domestic product (“GDP”) growth decelerated from 2.7% (annualized) in the first quarter of 2010 to 1.7% in the second, before recovering to 2.6% in the third. But attention was focused more on employment and housing. The 18-month recession which ended in June of 2009 had cost some 8.7 million jobs. But since then, the unemployment rate had been stuck between 9.4% and 10.1%, barely dented by private sector new jobs averaging 107,000 per month as 2010 ended.
The other weakening link was housing. Sales of new and existing homes collapsed after the expiry in April of a program of tax credits for home buyers and languished thereafter. House prices (based on the S&P/Case-Shiller 20-City Composite Home Price Index), having shown annual increases from February, resumed a downward trend in October with the index still 30% below the peak recorded in April 2006.
To be sure, there were some grounds for optimism as 2010 drew to a close. Consumer spending had risen for five straight months. Investment in equipment and software was growing at double-digit annual percentage rates. On December 30, new unemployment claims were reported below 400,000 for the first time since July 2008. The Federal Reserve in November announced a second round of quantitative easing and would buy $600 billion in Treasury notes and bonds. The mixed mid-term election results forced a “compromise” stimulus package worth an estimated $858 billion for 2011. In combination, these two measures increased the attractiveness of riskier asset classes like equities at the expense of high grade bonds, which sold off.
In the Eurozone, after default was narrowly averted on Greece’s maturing bonds, the creation in May of a European Financial Stabilization “mechanism”, funded with up to €750 billion seemed to calm nerves for a while. But in October, attention turned to Ireland, where the Irish government had injected huge sums into local banks, rendering its own fiscal position untenable. The November 29, 2010 European Union/International Monetary Fund bail-out worth €67.5 billion left markets unimpressed. Suddenly it was May again with downgrades, soaring yields on peripheral Eurozone bonds, fears of contagion, falling stock markets and doubts about the viability of the euro itself. The European Central Bank aggressively bought sovereign bonds and the mood settled. But with Spain’s banks needing to refinance €85 billion of debt in 2011, the issue remains unresolved.
Investors watched nervously as China, the source of much of the world’s growth, wrestled with inflation, which reached 5.1% in
November, and a housing bubble. The authorities tightened mortgage requirements, raised banks’ reserve ratio requirements six times in 2010 and interest rates twice in the last quarter. More interest rate increases seem inevitable.
In U.S. fixed income markets, the Barclays Capital U.S. Aggregate Bond Index of investment grade bonds returned 6.54% in 2010. A slight balance towards risk aversion in the first half gave way to improved risk appetite in the second. For the whole year, the Barclays Capital U.S. Treasury index returned 5.87%, underperforming the Barclays Capital Corporate Investment Grade Bond Index with a return of 9.00%, but both fell well short of the Barclays Capital High Yield Bond – 2% Issuer Constrained Composite Index which gained 14.94% for the one year period.
U.S. equities, represented by the S&P 500® Index including dividends, rose 15.06% in 2010, including its best September, a return of 8.92%, since 1939 and best December, a return of 6.68%, since 1991. Prices were supported by strong earnings reports, with operating earnings per share for S&P 500® companies recording four straight quarters of annual growth. Equities also benefited from improved risk appetite through the quantitative easing initiative and stimulus package referred to above.
In currencies, the worst of the gloom about the Eurozone in early June was replaced by renewed pessimism about the dollar in a stalling economy, before markets were seized by another bout of Eurozone angst. For the year, the dollar gained 8.15% against the euro and 2.95% against the pound, but lost 11.59% to the yen, which was sold in the market by the Bank of Japan after breaching 15-year high levels.
In international markets, the MSCI Japan® Index returned just 0.57% for the year after a strong last quarter, as quarterly GDP growth bounced back to 1.1% and the yen retreated from multi-year peaks. The tone of the market was generally poor with household spending fragile and consumer prices down for 21 months. The MSCI Europe ex UK® Index returned 4.84%, with Germany up 15.97% and Portugal, Italy, Ireland, Greece and Spain all falling. This broadly reflected the two-tier economy that has developed, with economic statistics favoring more soundly based countries at the expense of the peripherals. The MSCI UK® Index advanced 12.18%, despite the prospect of severe public spending cuts intended to eliminate an 11% budget deficit. Supporting sentiment was resilient, if perhaps temporary, quarterly GDP growth averaging 0.9% in the second half of the year.
Parentheses denote a negative number.
Past performance does not guarantee future results. The performance quoted represents past performance. Investment return and principal value of an investment will fluctuate, and shares, when redeemed, may be worth more or less than their original cost. The Series’ performance is subject to change since the period’s end and may be lower or higher than the performance data shown. Please call (800) 992-0180 or log on to www.ingfunds.com to obtain performance data current to the most recent month end.
Market Perspective reflects the views of ING’s Chief Investment Risk Officer only through the end of the period, and is subject to change based on market and other conditions.
2
Benchmark Descriptions
| | |
| Index | | Description |
| MSCI World IndexSM | | An unmanaged index that measures the performance of over 1,400 securities listed on exchanges in the U.S., Europe, Canada, Australia, New Zealand and the Far East. |
| S&P/Case-Shiller 20-City Composite Home Price Index | | A composite index of the home price index for the top 20 Metropolitan Statistical Areas in the United States. The index is published monthly by Standard & Poor’s. |
| Barclays Capital U.S. Aggregate Bond Index | | An unmanaged index of publicly issued investment grade U.S. Government, mortgage-backed, asset-backed and corporate debt securities. |
| Barclays Capital U.S. Treasury Index | | An unmanaged index that includes public obligations of the U.S. Treasury. Treasury bills, certain special issues, such as state and local government series bonds (SLGs), as well as U.S. Treasury TIPS and STRIPS, are excluded. |
| Barclays Capital Corporate Investment Grade Bond Index | | The corporate component of the Barclays Capital U.S. Credit Index. The U.S. Credit Index includes publicly-issued U.S. corporate and specified foreign debentures and secured notes that meet the specified maturity, liquidity, and quality requirements. The index includes both corporate and non-corporate sectors. The corporate sectors are industrial, utility and finance, which includes both U.S. and non-U.S. corporations. |
| Barclays Capital High Yield Bond—2% Issuer Constrained Composite Index | | An unmanaged index that includes all fixed income securities having a maximum quality rating of Ba1, a minimum amount outstanding of $150 million, and at least one year to maturity. |
| S&P 500® Index | | An unmanaged index that measures the performance of securities of approximately 500 large-capitalization companies whose securities are traded on major U.S. stock markets. |
| MSCI Japan® Index | | A free float-adjusted market capitalization index that is designed to measure developed market equity performance in Japan. |
| MSCI Europe ex UK® Index | | A free float-adjusted market capitalization index that is designed to measure developed market equity performance in Europe, excluding the UK. |
| MSCI UK® Index | | A free float-adjusted market capitalization index that is designed to measure developed market equity performance in the UK. |
| Barclays Capital 1-5 Year Government Bond Index | | An unmanaged index of securities issued by the U.S. Government with a maturity from 1 up to (but not including) 5 years |
3
| | |
| ING GET U.S. CORE PORTFOLIO SERIES 5-14 | | PORTFOLIO MANAGERS’ REPORT |
During the Guarantee Period, the ING GET U.S. Core Portfolio — Series 5, 6, 7, 8, 9, 10, 11, 12, 13, and 14 (each, a “Series” and collectively, “Series”) seek to achieve maximum total return and minimal exposure of the Series’ assets to a market value loss by participating, to the extent possible, in favorable equity market performance during the Guarantee Period. The Series are managed by the following Portfolio Management Team with ING Investment Management Co. — the Sub-Adviser.
Asset Allocation: Paul Zemsky, serves as strategist for the Series and is responsible for overseeing the Series, strategy and the allocation of Series Assets between the Equity and Fixed components.
Equity Component: Vincent Costa, Portfolio Manager — the Equity Component.
Fixed Component: Michael Hyman and Christine Hurtsellers, Portfolio Managers — the Fixed Component.
Note: The Series are closed to new investments.
Performance:
Total returns for the year ended December 31, 2010 for Series 5 to 14 are detailed below, along with the S&P 500® Index, and the Barclays Capital U.S. 1-5 Year Government Bond (“Barclays Capital 1-5 Year”) Index.
| | | | |
Series 5 | | | 2.00% | |
Series 6 | | | 2.05% | |
Series 7 | | | 2.52% | |
Series 8 | | | 2.42% | |
Series 9 | | | 3.76% | |
Series 10 | | | 4.10% | |
Series 11 | | | 4.85% | |
Series 12 | | | 5.78% | |
Series 13 | | | 6.59% | |
Series 14 | | | 6.88% | |
S&P 500® Index | | | 15.06% | |
Barclays Capital 1-5 Year Index | | | 3.57% | |
An investor cannot invest directly in an index.
Portfolio Specifics: Series performance results from a combination of returns on the equity and bond portfolios, and the asset allocation blend between the two components. The asset allocation process seeks to participate in rising equity markets and protect principal on the downside. Historically, stocks have proven to be more volatile than bonds, which was an important consideration in the asset allocation process. Other factors, such as the current level of interest rates, time remaining to maturity date and the ratio of
current assets to the underlying guarantee amount are also important. The allocation to equities and fixed income depends on these factors and the paths they take over the guarantee period.
In general, when the time left to maturity is short, or the ratio of assets to the guarantee amount is low, asset allocation will tend to be conservative in order to protect principal from losses. All other factors being equal, a Series generally buys equities (and sells bonds) when the equity market rises and sells equities (and buys bonds) as the equity market declines. The use of fixed income reduces the Series’ ability to fully participate in rising equity markets. Series 10, 11, 13 and 14 have become and will remain all fixed income.
While we expect our statements to be accurate for each of the individual funds within a series, this may not always be the case due to cash flow differences from fund to fund. Allocations between equities and fixed income are dependent on our quantitative asset allocation model, which uses the factors mentioned in the second paragraph and not on a qualitative evaluation of the bond versus the equity markets. Please note that after several declines in equities markets, the allocation to equities may be eliminated for the remaining duration of the guarantee period.
Asset Allocation
as of December 31, 2010
(as a percentage of net assets)
| | | | | | | | | | | | |
| | | Fixed Income | | | Equities | | | Other Assets and Liabilities | |
Series 5 | | | 89.8 | % | | | 8.9 | % | | | 1.3% | |
Series 6 | | | 91.4 | % | | | 8.0 | % | | | 0.6% | |
Series 7 | | | 93.3 | % | | | 5.9 | % | | | 0.8% | |
Series 8 | | | 94.2 | % | | | 4.7 | % | | | 1.1% | |
Series 9 | | | 92.0 | % | | | 6.8 | % | | | 1.2% | |
Series 10 | | | 98.2 | % | | | 0.0 | % | | | 1.8% | |
Series 11 | | | 99.3 | % | | | 0.0 | % | | | 0.7% | |
Series 12 | | | 93.9 | % | | | 4.8 | % | | | 1.3% | |
Series 13 | | | 99.4 | % | | | 0.0 | % | | | 0.6% | |
Series 14 | | | 99.3 | % | | | 0.0 | % | | | 0.7% | |
ING GET U.S. Core Portfolios
The equity component of each of the Series (except GET Core 10, 11, 13 and 14) are exchange-traded funds (“ETFs”) that closely track the stock market as measured by the S&P 500® Index. Therefore, the Equity component’s performance was in line with the index. By design, the mix of investments will change as the market changes. Due to the economic downturn that
4
| | |
| PORTFOLIO MANAGERS’ REPORT | | ING GET U.S. CORE PORTFOLIO SERIES 5-14 |
troughed in March 2009, the equity level in each of the Series remains low. The majority of the assets are in fixed income. The Fixed component of each of the Series invests in a mix of U.S. Treasury and U.S. agency Separate Trading of Registered Interest and Principal Securities (“STRIPs”).
Current Strategy and Outlook: Allocations between equities and fixed income are dependent on our quantitative asset allocation model, which uses the factors mentioned in the first paragraph and not on a qualitative evaluation of the bond versus the equity markets.
5
| | |
| ING GET U.S. CORE PORTFOLIO SERIES 5 | | PORTFOLIO MANAGERS’ REPORT |
| | | | | | | | | | | | | | | | | | | | |
| | | |
| | | | | Average Annual Total Returns for the Periods Ended December 31, 2010 | | | | | |
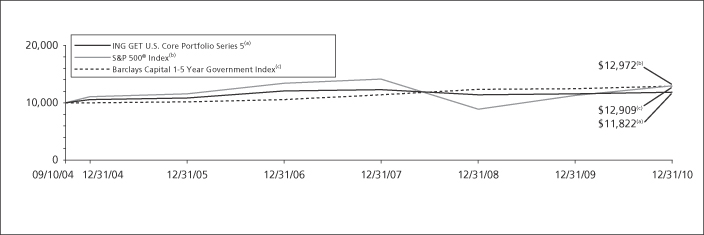
| | | | | | 1 Year | | | 5 Year | | | Since Inception
of Guarantee Period
September 10, 2004 | | | | |
| | | | | | |
| | | | | | | | | | | | | | | | | | | | | |
| | | | | ING GET U.S. Core Portfolio Series 5 | | | 2.00 | % | | | 1.76 | % | | | 2.69 | % | | | | |
| | | | | S&P 500® Index | | | 15.06 | % | | | 2.29 | % | | | 4.19 | %(1) | | | | |
| | | | | Barclays Capital 1-5 Year Government Index | | | 3.57 | % | | | 4.92 | % | | | 4.11 | %(1) | | | | |
Based on a $10,000 initial investment, the graph and table above illustrate the total return of ING GET U.S. Core Portfolio Series 5 against the indices indicated. An index is unmanaged and has no cash in its portfolio, imposes no sales charges and incurs no operating expenses. An investor cannot invest directly in an index. The Series’ performance is shown without the imposition of any expenses or charges which are, or may be, imposed under your annuity contract. Total returns would have been lower if such expenses or charges were included.
The performance graph and table do not reflect the deduction of taxes that a shareholder will pay on Series distributions or the redemption of Series shares.
The performance shown may include the effect of fee waivers and/or expense reimbursements by the Investment Adviser and/or other service providers, which have the effect of increasing total return. Had all fees and expenses been considered, the total returns would have been lower.
The performance update illustrates performance for a variable investment option available through a variable annuity contract. The performance shown indicates past performance and is not a projection or prediction of future results. Actual investment returns and principal value will fluctuate so that shares and/or units, at redemption, may be worth more or less than their original cost. Please call (800) 992-0180 to get performance through the most recent month end.
This report contains statements that may be “forward-looking” statements. Actual results may differ materially from those projected in the “forward-looking” statements.
The views expressed in this report reflect those of the Portfolio Managers, only through the end of the period as stated on the cover. The Portfolio Managers’ views are subject to change at any time based on market and other conditions.
Portfolio holdings are subject to change daily.
| (1) | | Since inception performance for the index is shown from September 1, 2004. |
6
| | |
| PORTFOLIO MANAGERS’ REPORT | | ING GET U.S. CORE PORTFOLIO SERIES 6 |
| | | | | | | | | | | | | | | | | | | | |
| | | |
| | | | | Average Annual Total Returns for the Periods Ended December 31, 2010 | | | | | |
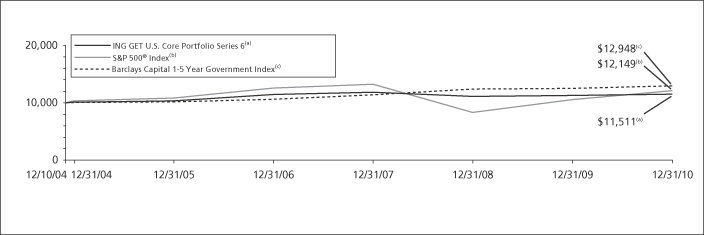
| | | | | | 1 Year | | | 5 Year | | | Since Inception of Guarantee Period December 10, 2004 | | | | |
| | | | | ING GET U.S. Core Portfolio Series 6 | | | 2.05 | % | | | 2.13 | % | | | 2.35 | % | | | | |
| | | | | S&P 500® Index | | | 15.06 | % | | | 2.29 | % | | | 3.25 | %(1) | | | | |
| | | | | Barclays Capital 1-5 Year Government Index | | | 3.57 | % | | | 4.92 | % | | | 4.34 | %(1) | | | | |
Based on a $10,000 initial investment, the graph and table above illustrate the total return of ING GET U.S. Core Portfolio Series 6 against the indices indicated. An index is unmanaged and has no cash in its portfolio, imposes no sales charges and incurs no operating expenses. An investor cannot invest directly in an index. The Series’ performance is shown without the imposition of any expenses or charges which are, or may be, imposed under your annuity contract. Total returns would have been lower if such expenses or charges were included.
The performance graph and table do not reflect the deduction of taxes that a shareholder will pay on Series distributions or the redemption of Series shares.
The performance shown may include the effect of fee waivers and/or expense reimbursements by the Investment Adviser and/or other service providers, which have the effect of increasing total return. Had all fees and expenses been considered, the total returns would have been lower.
The performance update illustrates performance for a variable investment option available through a variable annuity contract. The performance shown indicates past performance and is not a projection or prediction of future results. Actual investment returns and principal value will fluctuate so that shares and/or units, at redemption, may be worth more or less than their original cost. Please call (800) 992-0180 to get performance through the most recent month end.
This report contains statements that may be “forward-looking” statements. Actual results may differ materially from those projected in the “forward-looking” statements.
The views expressed in this report reflect those of the Portfolio Managers, only through the end of the period as stated on the cover. The Portfolio Managers’ views are subject to change at any time based on market and other conditions.
Portfolio holdings are subject to change daily.
| (1) | | Since inception performance for the index is shown from December 1, 2004. |
7
| | |
| ING GET U.S. CORE PORTFOLIO SERIES 7 | | PORTFOLIO MANAGERS’ REPORT |
| | | | | | | | | | | | | | | | | | | | |
| | | |
| | | | | Average Annual Total Returns for the Periods Ended December 31, 2010 | | | | | |
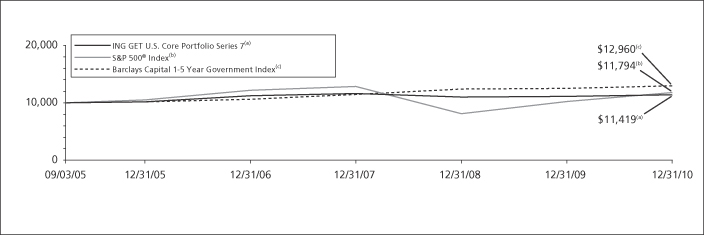
| | | | | | 1 Year | | | 5 Year | | | Since Inception of Guarantee Period March 9, 2005 | | | | |
| | | | | ING GET U.S. Core Portfolio Series 7 | | | 2.52 | % | | | 2.29 | % | | | 2.31 | % | | | | |
| | | | | S&P 500® Index | | | 15.06 | % | | | 2.29 | % | | | 2.87 | %(1) | | | | |
| | | | | Barclays Capital 1-5 Year Government Index | | | 3.57 | % | | | 4.92 | % | | | 4.55 | %(1) | | | | |
Based on a $10,000 initial investment, the graph and table above illustrate the total return of ING GET U.S. Core Portfolio Series 7 against the indices indicated. An index is unmanaged and has no cash in its portfolio, imposes no sales charges and incurs no operating expenses. An investor cannot invest directly in an index. The Series’ performance is shown without the imposition of any expenses or charges which are, or may be, imposed under your annuity contract. Total returns would have been lower if such expenses or charges were included.
The performance graph and table do not reflect the deduction of taxes that a shareholder will pay on Series distributions or the redemption of Series shares.
The performance shown may include the effect of fee waivers and/or expense reimbursements by the Investment Adviser and/or other service providers, which have the effect of increasing total return. Had all fees and expenses been considered, the total returns would have been lower.
The performance update illustrates performance for a variable investment option available through a variable annuity contract. The performance shown indicates past performance and is not a projection or prediction of future results. Actual investment returns and principal value will fluctuate so that shares and/or units, at redemption, may be worth more or less than their original cost. Please call (800) 992-0180 to get performance through the most recent month end.
This report contains statements that may be “forward-looking” statements. Actual results may differ materially from those projected in the “forward-looking” statements.
The views expressed in this report reflect those of the Portfolio Managers, only through the end of the period as stated on the cover. The Portfolio Managers’ views are subject to change at any time based on market and other conditions.
Portfolio holdings are subject to change daily.
| (1) | | Since inception performance for the index is shown from March 1, 2005. |
8
| | |
| PORTFOLIO MANAGERS’ REPORT | | ING GET U.S. CORE PORTFOLIO SERIES 8 |
| | | | | | | | | | | | | | | | | | | | |
| | | |
| | | | | Average Annual Total Returns for the Periods Ended December 31, 2010 | | | | | |
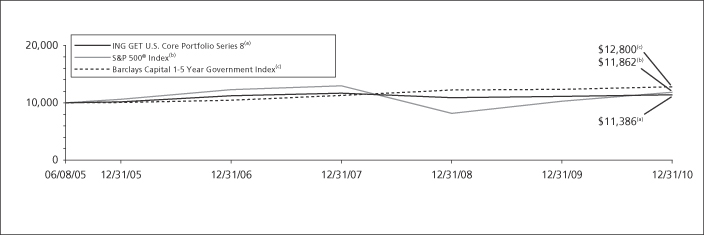
| | | | | | 1 Year | | | 5 year | | | Since Inception of Guarantee Period June 8, 2005 | | | | |
| | | | | ING GET U.S. Core Portfolio Series 8 | | | 2.42 | % | | | 2.29 | % | | | 2.36 | % | | | | |
| | | | | S&P 500® Index | | | 15.06 | % | | | 2.29 | % | | | 3.10 | %(1) | | | | |
| | | | | Barclays Capital 1-5 Year Government Index | | | 3.57 | % | | | 4.92 | % | | | 4.52 | %(1) | | | | |
Based on a $10,000 initial investment, the graph and table above illustrate the total return of ING GET U.S. Core Portfolio Series 8 against the indices indicated. An index is unmanaged and has no cash in its portfolio, imposes no sales charges and incurs no operating expenses. An investor cannot invest directly in an index. The Series’ performance is shown without the imposition of any expenses or charges which are, or may be, imposed under your annuity contract. Total returns would have been lower if such expenses or charges were included.
The performance graph and table do not reflect the deduction of taxes that a shareholder will pay on Series distributions or the redemption of Series shares.
The performance shown may include the effect of fee waivers and/or expense reimbursements by the Investment Adviser and/or other service providers, which have the effect of increasing total return. Had all fees and expenses been considered, the total returns would have been lower.
The performance update illustrates performance for a variable investment option available through a variable annuity contract. The performance shown indicates past performance and is not a projection or prediction of future results. Actual investment returns and principal value will fluctuate so that shares and/or units, at redemption, may be worth more or less than their original cost. Please call (800) 992-0180 to get performance through the most recent month end.
This report contains statements that may be “forward-looking” statements. Actual results may differ materially from those projected in the “forward-looking” statements.
The views expressed in this report reflect those of the Portfolio Managers, only through the end of the period as stated on the cover. The Portfolio Managers’ views are subject to change at any time based on market and other conditions.
Portfolio holdings are subject to change daily.
| (1) | | Since inception performance for the index is shown from June 1, 2005. |
9
| | |
| ING GET U.S. CORE PORTFOLIO SERIES 9 | | PORTFOLIO MANAGERS’ REPORT |
| | | | | | | | | | | | | | | | | | | | |
| | | |
| | | | | Average Annual Total Returns for the Periods Ended December 31, 2010 | | | | | |
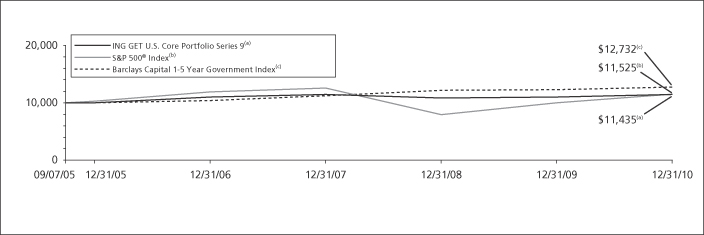
| | | | | | 1 Year | | | 5 Year | | | Since Inception of Guarantee Period September 7, 2005 | | | | |
| | | | | ING GET U.S. Core Portfolio Series 9 | | | 3.76 | % | | | 2.72 | % | | | 2.56 | % | | | | |
| | | | | S&P 500® Index | | | 15.06 | % | | | 2.29 | % | | | 2.70 | %(1) | | | | |
| | | | | Barclays Capital 1-5 Year Government Index | | | 3.57 | % | | | 4.92 | % | | | 4.63 | %(1) | | | | |
Based on a $10,000 initial investment, the graph and table above illustrate the total return of ING GET U.S. Core Portfolio Series 9 against the indices indicated. An index is unmanaged and has no cash in its portfolio, imposes no sales charges and incurs no operating expenses. An investor cannot invest directly in an index. The Series’ performance is shown without the imposition of any expenses or charges which are, or may be, imposed under your annuity contract. Total returns would have been lower if such expenses or charges were included.
The performance graph and table do not reflect the deduction of taxes that a shareholder will pay on Series distributions or the redemption of Series shares.
The performance shown may include the effect of fee waivers and/or expense reimbursements by the Investment Adviser and/or other service providers, which have the effect of increasing total return. Had all fees and expenses been considered, the total returns would have been lower.
The performance update illustrates performance for a variable investment option available through a variable annuity contract. The performance shown indicates past performance and is not a projection or prediction of future results. Actual investment returns and principal value will fluctuate so that shares and/or units, at redemption, may be worth more or less than their original cost. Please call (800) 992-0180 to get performance through the most recent month end.
This report contains statements that may be “forward-looking” statements. Actual results may differ materially from those projected in the “forward-looking” statements.
The views expressed in this report reflect those of the Portfolio Managers, only through the end of the period as stated on the cover. The Portfolio Managers’ views are subject to change at any time based on market and other conditions.
Portfolio holdings are subject to change daily.
| (1) | | Since inception performance for the index is shown from September 1, 2005. |
10
| | |
| PORTFOLIO MANAGERS’ REPORT | | ING GET U.S. CORE PORTFOLIO SERIES 10 |

| | | | | | | | | | | | | | | | | | | | |
| | | |
| | | | | Average Annual Total Returns for the Periods Ended December 31, 2010 | | | | | |
| | | | | | 1 Year | | | 5 Year | | | Since Inception of Guarantee Period December 6, 2005 | | | | |
| | | | | ING GET U.S. Core Portfolio Series 10 | | | 4.10 | % | | | 2.43 | % | | | 2.28 | % | | | | |
| | | | | S&P 500® Index | | | 15.06 | % | | | 2.29 | % | | | 2.26 | %(1) | | | | |
| | | | | Barclays Capital 1-5 Year Government Index | | | 3.57 | % | | | 4.92 | % | | | 4.93 | %(1) | | | | |
Based on a $10,000 initial investment, the graph and table above illustrate the total return of ING GET U.S. Core Portfolio Series 10 against the indices indicated. An index is unmanaged and has no cash in its portfolio, imposes no sales charges and incurs no operating expenses. An investor cannot invest directly in an index. The Series’ performance is shown without the imposition of any expenses or charges which are, or may be, imposed under your annuity contract. Total returns would have been lower if such expenses or charges were included.
The performance graph and table do not reflect the deduction of taxes that a shareholder will pay on Series distributions or the redemption of Series shares.
The performance shown may include the effect of fee waivers and/or expense reimbursements by the Investment Adviser and/or other service providers, which have the effect of increasing total return. Had all fees and expenses been considered, the total returns would have been lower.
The performance update illustrates performance for a variable investment option available through a variable annuity contract. The performance shown indicates past performance and is not a projection or prediction of future results. Actual investment returns and principal value will fluctuate so that shares and/or units, at redemption, may be worth more or less than their original cost. Please call (800) 992-0180 to get performance through the most recent month end.
This report contains statements that may be “forward-looking” statements. Actual results may differ materially from those projected in the “forward-looking” statements.
The views expressed in this report reflect those of the Portfolio Managers, only through the end of the period as stated on the cover. The Portfolio Managers’ views are subject to change at any time based on market and other conditions.
Portfolio holdings are subject to change daily.
| (1) | | Since inception performance for the index is shown from December 1, 2005. |
11
| | |
| ING GET U.S. CORE PORTFOLIO SERIES 11 | | PORTFOLIO MANAGERS’ REPORT |

| | | | | | | | | | | | | | | | |
| | | |
| | | | | Average Annual Total Returns for the Periods Ended December 31, 2010 | | | | | |
| | | | | | 1 Year | | | Since Inception of Guarantee Period March 2, 2006 | | | | |
| | | | | ING GET U.S. Core Portfolio Series 11 | | | 4.85 | % | | | 2.80 | % | | | | |
| | | | | S&P 500® Index | | | 15.06 | % | | | 1.76 | %(1) | | | | |
| | | | | Barclays Capital 1-5 Year Government Index | | | 3.57 | % | | | 5.06 | %(1) | | | | |
Based on a $10,000 initial investment, the graph and table above illustrate the total return of ING GET U.S. Core Portfolio Series 11 against the indices indicated. An index is unmanaged and has no cash in its portfolio, imposes no sales charges and incurs no operating expenses. An investor cannot invest directly in an index. The Series’ performance is shown without the imposition of any expenses or charges which are, or may be, imposed under your annuity contract. Total returns would have been lower if such expenses or charges were included.
The performance graph and table do not reflect the deduction of taxes that a shareholder will pay on Series distributions or the redemption of Series shares.
The performance shown may include the effect of fee waivers and/or expense reimbursements by the Investment Adviser and/or other service providers, which have the effect of increasing total return. Had all fees and expenses been considered, the total returns would have been lower.
The performance update illustrates performance for a variable investment option available through a variable annuity contract. The performance shown indicates past performance and is not a projection or prediction of future results. Actual investment returns and principal value will fluctuate so that shares and/or units, at redemption, may be worth more or less than their original cost. Please call (800) 992-0180 to get performance through the most recent month end.
This report contains statements that may be “forward-looking” statements. Actual results may differ materially from those projected in the “forward-looking” statements.
The views expressed in this report reflect those of the Portfolio Managers, only through the end of the period as stated on the cover. The Portfolio Managers’ views are subject to change at any time based on market and other conditions.
Portfolio holdings are subject to change daily.
| (1) | | Since inception performance for the index is shown from March 1, 2006. |
12
| | |
| PORTFOLIO MANAGERS’ REPORT | | ING GET U.S. CORE PORTFOLIO SERIES 12 |
| | | | | | | | | | | | | | | | |
| | | |
| | | | | Average Annual Total Returns for the Periods Ended December 31, 2010 | | | | | |
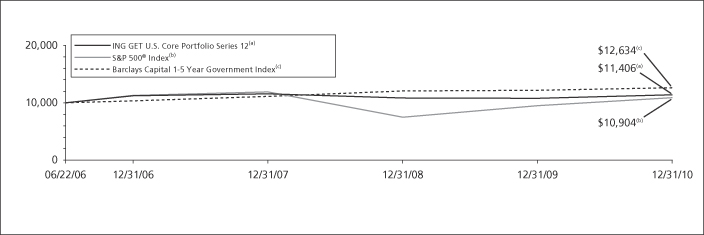
| | | | | | 1 Year | | | Since Inception of Guarantee Period June 22, 2006 | | | | |
| | | | | ING GET U.S. Core Portfolio Series 12 | | | 5.78 | % | | | 2.95 | % | | | | |
| | | | | S&P 500® Index | | | 15.06 | % | | | 1.94 | %(1) | | | | |
| | | | | Barclays Capital 1-5 Year Government Index | | | 3.57 | % | | | 5.33 | %(1) | | | | |
Based on a $10,000 initial investment, the graph and table above illustrate the total return of ING GET U.S. Core Portfolio Series 12 against the indices indicated. An index is unmanaged and has no cash in its portfolio, imposes no sales charges and incurs no operating expenses. An investor cannot invest directly in an index. The Series’ performance is shown without the imposition of any expenses or charges which are, or may be, imposed under your annuity contract. Total returns would have been lower if such expenses or charges were included.
The performance graph and table do not reflect the deduction of taxes that a shareholder will pay on Series distributions or the redemption of Series shares.
The performance shown may include the effect of fee waivers and/or expense reimbursements by the Investment Adviser and/or other service providers, which have the effect of increasing total return. Had all fees and expenses been considered, the total returns would have been lower.
The performance update illustrates performance for a variable investment option available through a variable annuity contract. The performance shown indicates past performance and is not a projection or prediction of future results. Actual investment returns and principal value will fluctuate so that shares and/or units, at redemption, may be worth more or less than their original cost. Please call (800) 992-0180 to get performance through the most recent month end.
This report contains statements that may be “forward-looking” statements. Actual results may differ materially from those projected in the “forward-looking” statements.
The views expressed in this report reflect those of the Portfolio Managers, only through the end of the period as stated on the cover. The Portfolio Managers’ views are subject to change at any time based on market and other conditions.
Portfolio holdings are subject to change daily.
| (1) | | Since inception performance for the index is shown from July 1, 2006. |
13
| | |
| ING GET U.S. CORE PORTFOLIO SERIES 13 | | PORTFOLIO MANAGERS’ REPORT |
| | | | | | | | | | | | | | | | |
| | | |
| | | | | Average Annual Total Returns for the Periods Ended December 31, 2010 | | | | | |
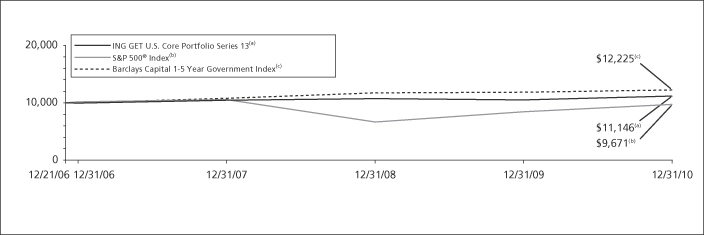
| | | | | | 1 Year | | | Since Inception of Guarantee Period December 21, 2006 | | | | |
| | | | | ING GET U.S. Core Portfolio Series 13 | | | 6.59 | % | | | 2.73 | % | | | | |
| | | | | S&P 500® Index | | | 15.06 | % | | | (0.83 | )%(1) | | | | |
| | | | | Barclays Capital 1-5 Year Government Index | | | 3.57 | % | | | 5.15 | %(1) | | | | |
Based on a $10,000 initial investment, the graph and table above illustrate the total return of ING GET U.S. Core Portfolio Series 13 against the indices indicated. An index is unmanaged and has no cash in its portfolio, imposes no sales charges and incurs no operating expenses. An investor cannot invest directly in an index. The Series’ performance is shown without the imposition of any expenses or charges which are, or may be, imposed under your annuity contract. Total returns would have been lower if such expenses or charges were included.
The performance graph and table do not reflect the deduction of taxes that a shareholder will pay on Series distributions or the redemption of Series shares.
The performance shown may include the effect of fee waivers and/or expense reimbursements by the Investment Adviser and/or other service providers, which have the effect of increasing total return. Had all fees and expenses been considered, the total returns would have been lower.
The performance update illustrates performance for a variable investment option available through a variable annuity contract. The performance shown indicates past performance and is not a projection or prediction of future results. Actual investment returns and principal value will fluctuate so that shares and/or units, at redemption, may be worth more or less than their original cost. Please call (800) 992-0180 to get performance through the most recent month end.
This report contains statements that may be “forward-looking” statements. Actual results may differ materially from those projected in the “forward-looking” statements.
The views expressed in this report reflect those of the Portfolio Managers, only through the end of the period as stated on the cover. The Portfolio Managers’ views are subject to change at any time based on market and other conditions.
Portfolio holdings are subject to change daily.
| (1) | | Since inception performance for the indices is shown from January 1, 2007. |
14
| | |
| PORTFOLIO MANAGERS’ REPORT | | ING GET U.S. CORE PORTFOLIO SERIES 14 |
| | | | | | | | | | | | | | | | |
| | |
| | | | | Average Annual Total Returns for the Periods Ended December 31, 2010 | |
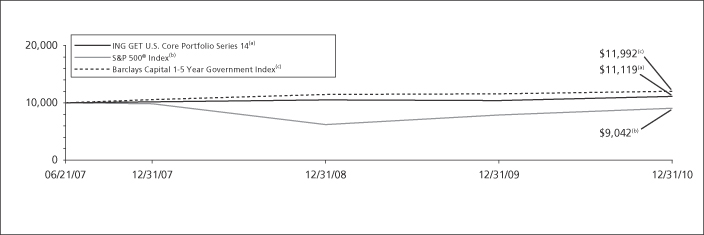
| | | | | | 1 Year | | | Since Inception of Guarantee Period June 21, 2007 | | | | |
| | | | | ING GET U.S. Core Portfolio Series 14 | | | 6.88 | % | | | 3.06 | % | | | | |
| | | | | S&P 500® Index | | | 15.06 | % | | | (2.84 | )%(1) | | | | |
| | | | | Barclays Capital 1-5 Year Government Index | | | 3.57 | % | | | 5.33 | %(1) | | | | |
Based on a $10,000 initial investment, the graph and table above illustrate the total return of ING GET U.S. Core Portfolio Series 14 against the indices indicated. An index is unmanaged and has no cash in its portfolio, imposes no sales charges and incurs no operating expenses. An investor cannot invest directly in an index. The Series’ performance is shown without the imposition of any expenses or charges which are, or may be, imposed under your annuity contract. Total returns would have been lower if such expenses or charges were included.
The performance graph and table do not reflect the deduction of taxes that a shareholder will pay on Series distributions or the redemption of Series shares.
The performance shown may include the effect of fee waivers and/or expense reimbursements by the Investment Adviser and/or other service providers, which have the effect of increasing total return. Had all fees and expenses been considered, the total returns would have been lower.
The performance update illustrates performance for a variable investment option available through a variable annuity contract. The performance shown indicates past performance and is not a
projection or prediction of future results. Actual investment returns and principal value will fluctuate so that shares and/or units, at redemption, may be worth more or less than their original cost. Please call (800) 992-0180 to get performance through the most recent month end.
It is important to note that the Portfolio has a limited operating history. Performance over a longer period of time may be more meaningful than short-term performance.
This report contains statements that may be “forward-looking” statements. Actual results may differ materially from those projected in the “forward-looking” statements.
The views expressed in this report reflect those of the Portfolio Managers, only through the end of the period as stated on the cover. The Portfolio Managers’ views are subject to change at any time based on market and other conditions.
Portfolio holdings are subject to change daily.
| (1) | | Since inception performance for the indices is shown from July 1, 2007. |
15
| | |
| ING GET U.S. CORE PORTFOLIO | | INVESTMENT STRATEGY AND PRINCIPAL RISKS |
What is the Investment Strategy During the Guarantee Period?
ING GET U.S. Core Portfolio — Series 5, 6, 7, 8, 9, 10, 11, 12, 13, 14 (“Series”) invest at least 80% of their net assets in equities and fixed-income securities issued by U.S. companies or the U.S. government or its agencies. The Series do not implement an “investment strategy” in a conventional sense. Rather, the Series’ asset allocation strategy seeks to optimize the exposure of the Series to the equity component (“Equity Component”) while protecting Series assets. Assets allocated to the Equity Component may be reduced or eliminated in order to conserve assets at a level equal to or above the present value of the guarantee (“Guarantee”). The Series allocate their assets among the following asset classes:
During the Guarantee Period, the Series’ assets are allocated between the:
| | • | | Equity Component, consisting of common stocks included in the S&P 500® Index futures contracts on the S&P 500® Index, and when the Equity Component’s market value is $5 million or less, investments in exchange traded funds (“ETFs”) that can reasonably be expected to have at least a 95% correlation ratio with the S&P 500® Index, in S&P 500® Index futures, or in a combination of S&P 500® Index futures and ETFs, subject to any limitation on the Series’ investments in such securities; and the |
| | • | | Fixed component (“Fixed Component”) consisting primarily of short-to-intermediate-duration U.S. government securities. |
The Series’ asset allocation strategy is implemented by allocating assets appropriately to the Equity Component and to the Fixed Component to optimize exposure to the Equity Component while controlling the risk that an insurance company may be required to make payment under the Guarantee. Consequently, there can be no assurance as to the percentage of assets, if any, allocated to the Equity Component, even when the equity market is doing well, or to any investment returns generated by the Series.
How does the Series’ Asset Allocation work?
ING Investment Management Co. (“ING IM” or “Sub-Adviser”), the Sub-Adviser to the Series, uses a proprietary computer model to determine on a daily basis the percentage of assets allocated to the Equity Component and to the Fixed Component. The model evaluates a number of factors, including the then current market value of the Series, the then prevailing level of interest rates, equity market volatility, the Series’ total annual expenses, insurance company separate account expenses, and the maturity date (“Maturity Date”). The model determines the initial allocation between the Equity Component and the Fixed Component on the first day of the Guarantee Period and provides direction for any reallocations on a daily basis thereafter. Generally, as the value of the Equity Component rises, more assets are allocated to the Equity Component; as the value of the Equity Component declines, more assets are allocated to the Fixed Component. The amount directed to the Equity Component is always restricted so that even if it were to experience a “material decline” in value on a given day and before being redirected to the Fixed Component, the remaining assets would still be sufficient to meet the Guarantee. At the commencement of the Guarantee Period, the Series defined a “material decline” in value as a decline in the value of the Equity Component of at least 20% but no more than 30%. If a Series defined the “material decline” at 20%, fewer assets will likely be allocated to the Equity Component than if the “material decline” was defined at 30%. The allocation to the Equity Component or the Fixed Component may be zero under certain circumstances.
Equity Component: ING IM manages the Equity Component by overweighting those stocks in the S&P 500® Index that it believes will outperform the S&P 500® Index and underweighting (or avoiding altogether) those stocks it believes will underperform the S&P 500® Index (“Enhanced Index Strategy”). Stocks ING IM believes are likely to match the performance of the S&P 500® Index are invested in proportion to their representation in the S&P 500® Index. To determine which stocks to weight more or less heavily, ING IM uses internally developed quantitative computer models to evaluate various criteria, such as the financial strength of each company and its potential for strong, sustained earnings growth. ING IM expects that there will be a close correlation between the performance of the Equity Component and that of the S&P 500® Index in both rising and falling markets.
Under normal market conditions, up to 20% of the Equity Component’s net assets may be invested in futures contracts for hedging purposes or to maintain liquidity to meet shareholder redemptions and minimize trading costs. Futures contracts provide for the future sale by one party and purchase by another party of a specified amount of a
16
| | |
| INVESTMENT STRATEGY AND PRINCIPAL RISKS | | ING GET U.S. CORE PORTFOLIO |
financial instrument or a specific stock market index for a specified price on a designated date. During the Guarantee Period, the Series may only invest in futures contracts on the S&P 500® Index and futures contracts on U.S. Treasury securities.
If the Equity Component’s market value is $5 million or less, in order to replicate an investment in stocks listed in the S&P 500® Index, ING IM may invest the entire amount of the Equity Component’s assets in S&P 500® Index futures, in ETFs, or in a combination of S&P 500® Index futures and ETFs, subject to any limitation on the Series’ investment in such securities (subject to the rules, regulations and exemptive orders imposed by the Investment Company Act of 1940, as amended “1940 Act”). ETFs are passively managed investment companies traded on a securities exchange whose goal is to track or replicate a desired index. ING IM will not employ an Enhanced Index Strategy when it invests in S&P 500® Index futures and ETFs.
Fixed Component: ING IM seeks to select investments for the Fixed Component with financial characteristics that will, at any point in time, closely resemble those of a portfolio of zero coupon bonds which mature within three months of the Maturity Date. Generally, at least 55% of the Fixed Component will consist of securities issued or guaranteed by the U.S. government, its agencies or instrumentalities, including Separate Trading of Registered Interest and Principal of Securities (“STRIPS”). Although the Series invest in securities insured or guaranteed by the U.S. government, the Series shares are not themselves issued or guaranteed by the U.S. government. STRIPS are created by the Federal Reserve Bank by separating the interest and principal components of an outstanding U.S. Treasury or agency bond and selling them as individual securities. The Fixed Component may also consist of mortgage-backed securities (including commercial mortgage-backed securities) which are rated AAA or Aaa at the time of purchase by Standard & Poor’s (“S&P®“) or Moody’s Investors Service, Inc. (“Moody’s®“), respectively, and corporate obligations which are rated at the time of purchase A- or higher by S&P® and/or Aa3 or higher by Moody’s®. The Fixed Component may also include U.S. Treasury futures and money market instruments. The Series may also invest in other investment companies to the extent permitted under the 1940 Act.
What are the Principal Guarantee Period Risks?
Allocation Risk: If, at the inception of, or any time during, the Guarantee Period interest rates are low, the Series’ assets may be largely invested in the Fixed Component in order to decrease the likelihood that an insurance company would be required to make any payment under the Guarantee. The effect of low interest rates on the Series would likely be more pronounced at the inception of the Guarantee Period, as the initial allocation of assets would include more fixed-income securities. In addition, if during the Guarantee Period the equity markets experienced a material decline, the Series’ assets may become largely invested in the Fixed Component. In fact, if the value of the Equity Component were to decline by a significant amount, a complete reallocation to the Fixed Component would likely occur. In the event of a reallocation of 100% of the assets to the Fixed Component, the Series would not reallocate any assets into the Equity Component prior to the Maturity Date. Use of the Fixed Component reduces the Series’ ability to participate as fully in upward equity market movements, and therefore represents some loss of opportunity, or opportunity cost, compared to a portfolio that is fully invested in equities.
Active Asset Allocation May Underperform Static Strategies: The asset allocation process results in transaction costs. Volatile periods in the market may increase these costs. This process can have an adverse effect on the performance of the Series during periods of increased equity market volatility. In addition, a high portfolio turnover rate, which may also have an adverse effect on the performance of the Series, may increase the Series’ transaction costs.
Opportunity Costs: There are substantial opportunity costs associated with an investment in the Series. The Series may allocate a substantial portion, and under certain circumstances all, of the Series’ assets to the Fixed Component in order to conserve Series assets to a level equal to or above the present value of the Guarantee.
Initially, if interest rates are low, the allocation to the Fixed Component may be over 70% of the Series’ assets. If the market value of the Equity Component rises, the percentage of the Series’ assets allocated to the Equity Component generally will also rise. However, the relative volatility of these two Components as well as the past performance of the Series will affect these allocations. For example, if the Series incurs early losses, the Series may allocate 100% of the Series’ assets to the Fixed Component for the entire Guarantee Period, irrespective of the subsequent upward movements in the equity markets and/or the Equity Component.
17
| | |
| ING GET U.S. CORE PORTFOLIO | | INVESTMENT STRATEGY AND PRINCIPAL RISKS |
The extent to which the Series participates in upward movements in the Equity Component during the Guarantee Period will depend on the performance of the Series, the performance and volatility of the Fixed and Equity Components, interest rates, expenses of the Series and the separate account under the variable annuity contract, and other factors. The Series might capture a material portion, very little or none of any Equity Component increase.
It is possible that on the Maturity Date, a contract- holder or participant could receive only the guaranteed amount even though the equity markets, as well as the Equity Component, has had significant positive performance during the Guarantee Period.
When you hold your investment until the end of the 5-year or 7-year Guarantee Period, on the Maturity Date your account will be worth no less than your investment at the inception of the Guarantee Period, less any redemptions and distributions you have received in cash, and certain Series expenses, such as interest, taxes and extraordinary expenses. If you sell shares during the Guarantee Period, shares are redeemed at the current net asset value (“NAV”) which may be worth more or less than your original investment and/or the NAV at the inception of the Guarantee Period. The guarantee is based on the beginning NAV on the first day of the Guarantee Period, not the public offering price, and does not apply to any earnings realized during the Guarantee Period. The guarantee is backed by insurance companies offering the Series. As with the sale of any securities, a taxable event may occur if the Series liquidates fixed-income securities at the end of the Guarantee Period.
Company: The price of a given company’s stock could decline or underperform for many reasons including, among others, poor management, financial problems, or business challenges. If a company declares bankruptcy or becomes insolvent, its stock could become worthless.
Credit: Prices of bonds and other debt securities can fall if the issuer’s actual or perceived financial health deteriorates, whether because of broad economic or issuer-specific reasons. In severe cases, the issuer could be late in paying interest or principal, or could fail to pay altogether.
Interest Rate: With bonds and other debt securities, a rise in interest rates generally causes values to fall; conversely, values generally rise as interest rates fall. The higher the credit quality of the security, and the longer its maturity or duration, the more sensitive it is likely to be to interest rate risk.
Investment Model: The Sub-Adviser’s proprietary model may not adequately allow for existing or unforeseen market factors or the interplay between such factors. The proprietary models used by a sub-adviser to evaluate securities or securities markets are based on the Sub-Adviser’s understanding of the interplay of market factors and do not assure successful investment. The markets, or the price of individual securities, may be affected by factors not foreseen in developing the models.
Liquidity: If a security is illiquid, the adviser or Sub-Adviser might be unable to sell the security at a time when the Series’ Sub-Adviser might wish to sell, and the security could have the effect of decreasing the overall level of the Series’ liquidity. Further, the lack of an established secondary market may make it more difficult to value illiquid securities, which could vary from the amount a Series could realize upon disposition. A Series may make investments that become less liquid in response to market developments or adverse investor perception. A Series could lose money if it cannot sell a security at the time and price that would be most beneficial to the Series.
Other Investment Companies: The main risk of investing in other investment companies, including exchange-traded funds, is the risk that the value of the securities underlying an investment company might decrease. Because a Series may invest in other investment companies, you will pay a proportionate share of the expenses of that other investment company (including management fees, administration fees and custodial fees) in addition to the expenses of the Series. Other investment companies include exchange-traded funds (“ETFs”) and Holding Company Depositary Receipts (“HOLDRs”), among others. ETFs are exchange-traded investment companies that are, in many cases, designed to provide investment results corresponding to an equity index. The main risk of investing in other investment companies is that the value of the underlying securities held by the investment company might decrease. The value of the underlying securities can fluctuate in response to activities of individual companies or in response to general market and/or economic conditions. Additional risks of investments in ETFs include: (i) the market price of an ETF’s shares may trade at a discount to its net asset value; (ii) an active trading market for an ETF’s shares may not develop or be maintained; or (iii) trading may be halted if the listing exchanges’ officials deem such action
18
| | |
| INVESTMENT STRATEGY AND PRINCIPAL RISKS | | ING GET U.S. CORE PORTFOLIO |
appropriate, the shares are delisted from the exchange, or the activation of market-wide “circuit breakers” (which are tied to large decreases in stock prices) halts trading generally. Because HOLDRs concentrate in the stock of a particular industry, trends in that industry may have a dramatic impact on their value.
U.S. Government Securities and Obligations: U.S. government securities are obligations of, or guaranteed by, the U.S. government, its agencies or government-sponsored enterprises. U.S. government securities are subject to market and interest rate risk, and may be subject to varying degrees of credit risk. Some U.S. government securities are backed by the full faith and credit of the U.S. government and are guaranteed as to both principal and interest by the U.S. Treasury. These include direct obligations of the U.S. Treasury such as U.S. Treasury notes, bills and bonds, as well as indirect obligations including certain securities of the Government National Mortgage Association, the Small Business Administration and the Farmers Home Administration, among others. Other U.S. government securities are not direct obligations of the U.S. Treasury, but rather are backed by the ability to borrow directly from the U.S. Treasury, including certain securities of the Federal Financing Bank, the Federal Home Loan Bank and the U.S. Postal Service. Still other agencies and instrumentalities are supported solely by the credit of the agency or instrumentality itself and are neither guaranteed nor insured by the U.S. government. These include securities issued by the Federal Home Loan Bank and the Federal Farm Credit Bank, among others. Consequently, the investor must look principally to the agency issuing or guaranteeing the obligation for ultimate repayment. No assurance can be given that the U.S. government would provide financial support to such agencies if it is not obligated to do so by law. U.S. government securities may be subject to varying degrees of credit risk and all U.S. government securities may be subject to price declines due to changing interest rates. Securities directly supported by the full faith and credit of the U.S. government have less credit risk. The discussion below includes risks that are not described in the Series’ summary but which, nevertheless, are a risk to the Series.
Counterparty: The entity with whom a Series conducts Series-related business (such as trading or securities lending), or that underwrites, distributes or guarantees investments or agreements that the Series owns or is otherwise exposed to, may refuse or may become unable to honor its obligations under the terms of a transaction or agreement. As a result, that Series may sustain losses and be less likely to achieve its investment objective. These risks may be greater when engaging in over-the-counter transactions.
Futures Contracts: The Series may invest in futures contracts, which provide for the future sale by one party and purchase by another party of a specified amount of a financial instrument or a specific stock market index for a specified price on a designated date. The Series uses futures for hedging purposes or to temporarily increase or limit exposure to a particular asset class. The main risk with futures contracts is that they can amplify a gain or loss, potentially earning or losing substantially more money than the actual investment made in the futures contract.
Risks of Using Derivatives: Certain securities in which the Series may invest, including futures contracts, are derivative instruments. In general terms, a derivative instrument is a financial contract whose value is derived, at least in part, from the performance of an underlying asset, interest rate, or index. If the issuer of a derivative does not pay the amount owed on the contract when due, the Series can lose money on the investment. The underlying investment on which the derivative is based, and the derivative itself, might not perform in the manner the Sub-Adviser expected, which could cause the Series’ share price to decline. Markets underlying securities may move in a direction not anticipated by the Sub-Adviser, which may result in the Series realizing a lower return than expected on an investment. Some derivatives are also subject to the risk that counterparties will not perform their duties.
19
SHAREHOLDER EXPENSE EXAMPLES (UNAUDITED)
As a shareholder of a Series, you incur two types of costs: (1) transaction costs, including redemption fees and exchange fees (if applicable); and (2) ongoing costs, including management fees, distribution and/or service (12b-1) fees, and other Series expenses. These Examples are intended to help you understand your ongoing costs (in dollars) of investing in a Series and to compare these costs with the ongoing costs of investing in other mutual funds.
The Examples are based on an investment of $1,000 invested at the beginning of the period and held for the entire period from July 1, 2010 to December 31, 2010, unless otherwise indicated. The Series’ expenses are shown without the imposition of any charges which are, or may be, imposed under your variable annuity contract, variable life insurance policy, qualified pension or retirement plan. Expenses would have been higher if such charges were included.
Actual Expenses
The left section of the table shown below, “Actual Series Return,” provides information about actual account values and actual expenses. You may use the information in this section, together with the amount you invested, to estimate the expenses that you paid over the period. Simply divide your account value by $1,000 (for example, an $8,600 account value divided by $1,000 = 8.6), then multiply the result by the number in the first section under the heading entitled “Expenses Paid During the Period” to estimate the expenses you paid on your account during this period.
Hypothetical Example for Comparison Purposes
The right section of the table shown below, “Hypothetical (5% return before expenses)”, provides information about hypothetical account values and hypothetical expenses based on a Series’ actual expense ratio and an assumed rate of return of 5% per year before expenses, which is not a Series’ actual return. The hypothetical account values and expenses may not be used to estimate the actual ending account balance or expenses you paid for the period. You may use this information to compare the ongoing costs of investing in a Series and other mutual funds. To do so, compare this 5% hypothetical example with the 5% hypothetical examples that appear in the shareholder reports of the other funds.
Please note that the expenses shown in the table are meant to highlight your ongoing costs only and do not reflect any transactional costs, redemption fees or exchange fees. Therefore, the hypothetical lines of the table are useful in comparing ongoing costs only, and will not help you determine the relative total costs of owning different mutual funds. In addition, if these transactional costs were included, your costs would have been higher.
| | | | | | | | | | | | | | | | | | | | | | | | | | | | | | | | |
| | | Actual Series Return | | | Hypothetical (5% return before expenses) | |
ING GET U.S. Core Portfolio | | Beginning Account Value July 1, 2010 | | | Ending Account Value December 31, 2010 | | | Annualized Expense Ratio | | | Expenses Paid During the Period Ended December 31, 2010* | | | Beginning Account Value July 1, 2010 | | | Ending Account Value December 31, 2010 | | | Annualized Expense Ratio | | | Expenses Paid During the Period Ended December 31, 2010* | |
Series 5 | | $ | 1,000.00 | | | $ | 1,018.30 | | | | 1.00 | % | | $ | 5.09 | | | $ | 1,000.00 | | | $ | 1,020.16 | | | | 1.00 | % | | $ | 5.09 | |
Series 6 | | $ | 1,000.00 | | | $ | 1,013.80 | | | | 1.00 | % | | $ | 5.08 | | | $ | 1,000.00 | | | $ | 1,020.16 | | | | 1.00 | % | | $ | 5.09 | |
Series 7 | | $ | 1,000.00 | | | $ | 1,011.50 | | | | 1.00 | % | | $ | 5.07 | | | $ | 1,000.00 | | | $ | 1,020.16 | | | | 1.00 | % | | $ | 5.09 | |
Series 8 | | $ | 1,000.00 | | | $ | 1,011.50 | | | | 1.00 | % | | $ | 5.07 | | | $ | 1,000.00 | | | $ | 1,020.16 | | | | 1.00 | % | | $ | 5.09 | |
Series 9 | | $ | 1,000.00 | | | $ | 1,016.50 | | | | 1.00 | % | | $ | 5.08 | | | $ | 1,000.00 | | | $ | 1,020.16 | | | | 1.00 | % | | $ | 5.09 | |
Series 10 | | $ | 1,000.00 | | | $ | 1,008.70 | | | | 1.00 | % | | $ | 5.06 | | | $ | 1,000.00 | | | $ | 1,020.16 | | | | 1.00 | % | | $ | 5.09 | |
Series 11 | | $ | 1,000.00 | | | $ | 1,010.10 | | | | 1.00 | % | | $ | 5.07 | | | $ | 1,000.00 | | | $ | 1,020.16 | | | | 1.00 | % | | $ | 5.09 | |
Series 12 | | $ | 1,000.00 | | | $ | 1,020.60 | | | | 1.00 | % | | $ | 5.09 | | | $ | 1,000.00 | | | $ | 1,020.16 | | | | 1.00 | % | | $ | 5.09 | |
Series 13 | | $ | 1,000.00 | | | $ | 1,015.50 | | | | 1.00 | % | | $ | 5.08 | | | $ | 1,000.00 | | | $ | 1,020.16 | | | | 1.00 | % | | $ | 5.09 | |
Series 14 | | $ | 1,000.00 | | | $ | 1,014.90 | | | | 1.00 | % | | $ | 5.08 | | | $ | 1,000.00 | | | $ | 1,020.16 | | | | 1.00 | % | | $ | 5.09 | |
| * | | Expenses are equal to each Series' respective annualized expense ratios multiplied by the average account value over the period, multiplied by 184/365 to reflect the most recent fiscal half-year. |
20
REPORT OF INDEPENDENT REGISTERED PUBLIC ACCOUNTING FIRM
The Shareholders and Board of Trustees
ING Variable Insurance Trust
We have audited the accompanying statements of assets and liabilities, including the portfolios of investments, of ING GET U.S. Core Portfolio — Series 5, 6, 7, 8, 9, 10, 11, 12, 13, and 14 (the Series), each a series of ING Variable Insurance Trust, as of December 31, 2010, and the related statements of operations for the year then ended, the statements of changes in net assets for each of the years in the two-year period then ended, and the financial highlights for each of the years or periods in the five-year period then ended. These financial statements and financial highlights are the responsibility of management. Our responsibility is to express an opinion on these financial statements and financial highlights based on our audits.
We conducted our audits in accordance with the standards of the Public Company Accounting Oversight Board (United States). Those standards require that we plan and perform the audit to obtain reasonable assurance about whether the financial statements and financial highlights are free of material misstatement. An audit includes examining, on a test basis, evidence supporting the amounts and disclosures in the financial statements. Our procedures included confirmation of securities owned as of December 31, 2010, by correspondence with the custodian, transfer agent, and brokers. An audit also includes assessing the accounting principles used and significant estimates made by management, as well as evaluating the overall financial statement presentation. We believe that our audits provide a reasonable basis for our opinion.
In our opinion, the financial statements and financial highlights referred to above present fairly, in all material respects, the financial position of each Series as of December 31, 2010, and the results of their operations, the changes in their net assets, and the financial highlights for the periods specified in the first paragraph above, in conformity with U.S. generally accepted accounting principles.
Boston, Massachusetts
February 18, 2011
21
STATEMENTS OF ASSETS AND LIABILITIESASOF DECEMBER 31, 2010
| | | | | | | | | | | | | | | | |
| | | ING
GET U.S. Core
Portfolio
Series 5 | | | ING
GET U.S. Core
Portfolio
Series 6 | | | ING
GET U.S. Core
Portfolio
Series 7 | | | ING
GET U.S. Core
Portfolio
Series 8 | |
ASSETS: | | | | | | | | | | | | | | | | |
Investments in securities at value* | | $ | 14,734,474 | | | $ | 28,529,100 | | | $ | 19,756,545 | | | $ | 12,269,863 | |
Short-term investments** | | | 202,000 | | | | 255,000 | | | | 203,000 | | | | 198,000 | |
Cash | | | 533 | | | | 30 | | | | 222 | | | | 215 | |
Cash collateral for futures | | | 22,126 | | | | — | | | | — | | | | — | |
Receivables: | | | | | | | | | | | | | | | | |
Dividends and interest | | | 6,870 | | | | 11,961 | | | | 6,153 | | | | 3,015 | |
Prepaid expenses | | | 151 | | | | 294 | | | | 203 | | | | 125 | |
Reimbursement due from manager | | | — | | | | 1,473 | | | | 214 | | | | 985 | |
| | | | | | | | | | | | | | | | |
Total assets | | | 14,966,154 | | | | 28,797,858 | | | | 19,966,337 | | | | 12,472,203 | |
| | | | | | | | | | | | | | | | |
LIABILITIES: | | | | | | | | | | | | | | | | |
Payable for fund shares redeemed | | | 792 | | | | 45,464 | | | | 1,072 | | | | 31,663 | |
Payable to affiliates | | | 12,964 | | | | 22,213 | | | | 15,431 | | | | 9,587 | |
Payable for directors fees | | | 333 | | | | 1,354 | | | | 1,397 | | | | 848 | |
Other accrued expenses and liabilities | | | 23,997 | | | | 34,301 | | | | 28,394 | | | | 18,142 | |
| | | | | | | | | | | | | | | | |
Total liabilities | | | 38,086 | | | | 103,332 | | | | 46,294 | | | | 60,240 | |
| | | | | | | | | | | | | | | | |
NET ASSETS | | $ | 14,928,068 | | | $ | 28,694,526 | | | $ | 19,920,043 | | | $ | 12,411,963 | |
| | | | | | | | | | | | | | | | |
NET ASSETS WERE COMPRISED OF: | | | | | | | | | | | | | | | | |
Paid-in capital | | $ | 18,719,954 | | | $ | 34,408,166 | | | $ | 23,570,554 | | | $ | 14,989,926 | |
Undistributed net investment income | | | 243,407 | | | | 524,650 | | | | 387,462 | | | | 175,672 | |
Accumulated net realized loss | | | (4,656,577 | ) | | | (7,541,400 | ) | | | (4,927,426 | ) | | | (3,183,517 | ) |
Net unrealized appreciation | | | 621,284 | | | | 1,303,110 | | | | 889,453 | | | | 429,882 | |
| | | | | | | | | | | | | | | | |
NET ASSETS | | $ | 14,928,068 | | | $ | 28,694,526 | | | $ | 19,920,043 | | | $ | 12,411,963 | |
| | | | | | | | | | | | | | | | |
| | | | | | | | | | | | | | | | |
* Cost of investments in securities | | $ | 14,123,203 | | | $ | 27,225,990 | | | $ | 18,867,092 | | | $ | 11,839,981 | |
** Cost of short-term investments | | $ | 202,000 | | | $ | 255,000 | | | $ | 203,000 | | | $ | 198,000 | |
| | | | | | | | | | | | | | | | |
Shares authorized | | | unlimited | | | | unlimited | | | | unlimited | | | | unlimited | |
Par value | | $ | 0.001 | | | $ | 0.001 | | | $ | 0.001 | | | $ | 0.001 | |
Shares outstanding | | | 1,920,784 | | | | 3,540,561 | | | | 2,512,146 | | | | 1,561,603 | |
Net asset value and redemption price per share | | $ | 7.77 | | | $ | 8.10 | | | $ | 7.93 | | | $ | 7.95 | |
See Accompanying Notes to Financial Statements
22
STATEMENTS OF ASSETS AND LIABILITIESASOF DECEMBER 31, 2010
| | | | | | | | | | | | |
| | | ING
GET U.S. Core
Portfolio Series 9 | | | ING
GET U.S. Core
Portfolio Series 10 | | | ING
GET U.S. Core
Portfolio Series 11 | |
ASSETS: | | | | | | | | | | | | |
Investments in securities at value* | | $ | 10,422,556 | | | $ | 7,484,599 | | | $ | 10,006,334 | |
Short-term investments** | | | 143,000 | | | | 155,000 | | | | 88,000 | |
Cash | | | 982 | | | | 383 | | | | 405 | |
Receivables: | | | | | | | | | | | | |
Dividends and interest | | | 3,729 | | | | 10 | | | | 6 | |
Prepaid expenses | | | 108 | | | | 79 | | | | 104 | |
Reimbursement due from manager | | | 344 | | | | 708 | | | | 694 | |
| | | | | | | | | | | | |
Total assets | | | 10,570,719 | | | | 7,640,779 | | | | 10,095,543 | |
| | | | | | | | | | | | |
LIABILITIES: | | | | | | | | | | | | |
Payable for fund shares redeemed | | | 499 | | | | 391 | | | | 518 | |
Payable to affiliates | | | 8,403 | | | | 5,884 | | | | 8,257 | |
Payable for directors fees | | | 354 | | | | 769 | | | | 1,142 | |
Other accrued expenses and liabilities | | | 16,198 | | | | 12,050 | | | | 13,941 | |
| | | | | | | | | | | | |
Total liabilities | | | 25,454 | | | | 19,094 | | | | 23,858 | |
| | | | | | | | | | | | |
NET ASSETS | | $ | 10,545,265 | | | $ | 7,621,685 | | | $ | 10,071,685 | |
| | | | | | | | | | | | |
NET ASSETS WERE COMPRISED OF: | | | | | | | | | | | | |
Paid-in capital | | $ | 12,224,853 | | | $ | 9,140,528 | | | $ | 11,840,452 | |
Undistributed net investment income | | | 190,317 | | | | 169,572 | | | | 196,759 | |
Accumulated net realized loss | | | (2,405,229 | ) | | | (2,002,078 | ) | | | (2,342,334 | ) |
Net unrealized appreciation | | | 535,324 | | | | 313,663 | | | | 376,808 | |
| | | | | | | | | | | | |
NET ASSETS | | $ | 10,545,265 | | | $ | 7,621,685 | | | $ | 10,071,685 | |
| | | | | | | | | | | | |
| | | | | | | | | | | | |
* Cost of investments in securities | | $ | 9,887,232 | | | $ | 7,170,936 | | | $ | 9,629,526 | |
** Cost of short-term investments | | $ | 143,000 | | | $ | 155,000 | | | $ | 88,000 | |
| | | | | | | | | | | | |
Shares authorized | | | unlimited | | | | unlimited | | | | unlimited | |
Par value | | $ | 0.001 | | | $ | 0.001 | | | $ | 0.001 | |
Shares outstanding | | | 1,317,590 | | | | 937,901 | | | | 1,255,670 | |
Net asset value and redemption price per share | | $ | 8.00 | | | $ | 8.13 | | | $ | 8.02 | |
See Accompanying Notes to Financial Statements
23
STATEMENTS OF ASSETS AND LIABILITIESASOF DECEMBER 31, 2010
| | | | | | | | | | | | |
| | | ING
GET U.S. Core
Portfolio
Series 12 | | | ING
GET U.S. Core
Portfolio
Series 13 | | | ING
GET U.S. Core
Portfolio
Series 14 | |
ASSETS: | | | | | | | | | | | | |
Investments in securities at value* | | $ | 14,603,653 | | | $ | 26,038,712 | | | $ | 54,174,170 | |
Short-term investments** | | | 221,000 | | | | 221,000 | | | | — | |
Cash | | | 471 | | | | 673 | | | | 580,214 | |
Receivables: | | | | | | | | | | | | |
Dividends and interest | | | 3,736 | | | | 17 | | | | — | |
Prepaid expenses | | | 151 | | | | 267 | | | | 566 | |
Reimbursement due from manager | | | 551 | | | | 548 | | | | 1,054 | |
| | | | | | | | | | | | |
Total assets | | | 14,829,562 | | | | 26,261,217 | | | | 54,756,004 | |
| | | | | | | | | | | | |
LIABILITIES: | | | | | | | | | | | | |
Payable for fund shares redeemed | | | 700 | | | | 3,914 | | | | 97,179 | |
Payable to affiliates | | | 11,420 | | | | 20,350 | | | | 42,415 | |
Payable for directors fees | | | 357 | | | | 1,207 | | | | 1,539 | |
Other accrued expenses and liabilities | | | 19,293 | | | | 32,194 | | | | 66,461 | |
| | | | | | | | | | | | |
Total liabilities | | | 31,770 | | | | 57,665 | | | | 207,594 | |
| | | | | | | | | | | | |
NET ASSETS | | $ | 14,797,792 | | | $ | 26,203,552 | | | $ | 54,548,410 | |
| | | | | | | | | | | | |
NET ASSETS WERE COMPRISED OF: | | | | | | | | | | | | |
Paid-in capital | | $ | 19,576,207 | | | $ | 27,506,603 | | | $ | 54,176,593 | |
Undistributed net investment income | | | 330,079 | | | | 504,810 | | | | 1,505,148 | |
Accumulated net realized loss | | | (5,971,253 | ) | | | (3,600,036 | ) | | | (4,279,643 | ) |
Net unrealized appreciation | | | 862,759 | | | | 1,792,175 | | | | 3,146,312 | |
| | | | | | | | | | | | |
NET ASSETS | | $ | 14,797,792 | | | $ | 26,203,552 | | | $ | 54,548,410 | |
| | | | | | | | | | | | |
| | | | | | | | | | | | |
* Cost of investments in securities | | $ | 13,740,894 | | | $ | 24,246,537 | | | $ | 51,027,858 | |
** Cost of short-term investments | | $ | 221,000 | | | $ | 221,000 | | | $ | — | |
| | | | | | | | | | | | |
Shares authorized | | | unlimited | | | | unlimited | | | | unlimited | |
Par value | | $ | 0.001 | | | $ | 0.001 | | | $ | 0.001 | |
Shares outstanding | | | 1,871,497 | | | | 2,671,520 | | | | 5,350,479 | |
Net asset value and redemption price per share | | $ | 7.91 | | | $ | 9.81 | | | $ | 10.20 | |
See Accompanying Notes to Financial Statements
24
STATEMENTS OF OPERATIONSFORTHE YEAR ENDED DECEMBER 31, 2010
| | | | | | | | | | | | | | | | |
| | | ING GET U.S. Core
Portfolio
Series 5 | | | ING GET U.S. Core
Portfolio
Series 6 | | | ING GET U.S. Core
Portfolio
Series 7 | | | ING GET U.S. Core
Portfolio
Series 8 | |
INVESTMENT INCOME: | | | | | | | | | | | | | | | | |
Dividends(1) | | $ | 23,963 | | | $ | 41,781 | | | $ | 21,540 | | | $ | 16,021 | |
Interest | | | 387,727 | | | | 805,003 | | | | 590,542 | | | | 294,273 | |
| | | | | | | | | | | | | | | | |
Total investment income | | | 411,690 | | | | 846,784 | | | | 612,082 | | | | 310,294 | |
| | | | | | | | | | | | | | | | |
EXPENSES: | | | | | | | | | | | | | | | | |
Investment management fees | | | 100,810 | | | | 192,874 | | | | 134,468 | | | | 80,508 | |
Distribution and service fees | | | 42,004 | | | | 80,364 | | | | 56,028 | | | | 33,545 | |
Transfer agent fees | | | 101 | | | | 88 | | | | 86 | | | | 72 | |
Administrative service fees | | | 9,241 | | | | 17,680 | | | | 12,326 | | | | 7,380 | |
Shareholder reporting expense | | | 2,331 | | | | 756 | | | | 4,475 | | | | 2,937 | |
Professional fees | | | 20,262 | | | | 39,405 | | | | 26,181 | | | | 18,309 | |
Custody and accounting expense | | | 3,064 | | | | 2,894 | | | | 2,654 | | | | 422 | |
Directors fees | | | 466 | | | | 1,874 | | | | 384 | | | | 321 | |
Miscellaneous expense | | | 3,622 | | | | 4,612 | | | | 3,408 | | | | 2,591 | |
| | | | | | | | | | | | | | | | |
Total expenses | | | 181,901 | | | | 340,547 | | | | 240,010 | | | | 146,085 | |
Net waived and reimbursed fees | | | (13,593 | ) | | | (18,535 | ) | | | (15,572 | ) | | | (11,525 | ) |
| | | | | | | | | | | | | | | | |
Net expenses | | | 168,308 | | | | 322,012 | | | | 224,438 | | | | 134,560 | |
| | | | | | | | | | | | | | | | |
Net investment income | | | 243,382 | | | | 524,772 | | | | 387,644 | | | | 175,734 | |
| | | | | | | | | | | | | | | | |
REALIZED AND UNREALIZED GAIN (LOSS): | | | | | | | | | | | | | | | | |
Net realized gain on: | | | | | | | | | | | | | | | | |
Investments | | | 90,678 | | | | 230,408 | | | | 188,968 | | | | 189,761 | |
Futures | | | 30,719 | | | | — | | | | — | | | | — | |
| | | | | | | | | | | | | | | | |
Net realized gain | | | 121,397 | | | | 230,408 | | | | 188,968 | | | | 189,761 | |
| | | | | | | | | | | | | | | | |
Net change in unrealized appreciation or depreciation on: | | | | | | | | | | | | | | | | |
Investments | | | (36,690 | ) | | | (63,075 | ) | | | 1,011 | | | | (37,357 | ) |
Futures | | | 9,511 | | | | — | | | | — | | | | — | |
| | | | | | | | | | | | | | | | |
Net change in unrealized appreciation or depreciation | | | (27,179 | ) | | | (63,075 | ) | | | 1,011 | | | | (37,357 | ) |
| | | | | | | | | | | | | | | | |
Net realized and unrealized gain | | | 94,218 | | | | 167,333 | | | | 189,979 | | | | 152,404 | |
| | | | | | | | | | | | | | | | |
Increase in net assets resulting from operations | | $ | 337,600 | | | $ | 692,105 | | | $ | 577,623 | | | $ | 328,138 | |
| | | | | | | | | | | | | | | | |
(1) Dividends from affiliates | | $ | 149 | | | $ | 287 | | | $ | 219 | | | $ | 120 | |
See Accompanying Notes to Financial Statements
25
STATEMENTS OF OPERATIONSFORTHE YEAR ENDED DECEMBER 31, 2010
| | | | | | | | | | | | |
| | | ING GET U.S. Core
Portfolio
Series 9 | | | ING GET U.S. Core
Portfolio
Series 10 | | | ING GET U.S. Core
Portfolio
Series 11 | |
| | | |
INVESTMENT INCOME: | | | | | | | | | | | | |
Dividends(1) | | $ | 13,035 | | | $ | 87 | | | $ | 112 | |
Interest | | | 294,484 | | | | 254,703 | | | | 305,110 | |
| | | | | | | | | | | | |
Total investment income | | | 307,519 | | | | 254,790 | | | | 305,222 | |
| | | | | | | | | | | | |
EXPENSES: | | | | | | | | | | | | |
Investment management fees | | | 70,162 | | | | 50,881 | | | | 65,047 | |
Distribution and service fees | | | 29,234 | | | | 21,200 | | | | 27,103 | |
Transfer agent fees | | | 73 | | | | 52 | | | | 33 | |
Administrative service fees | | | 6,431 | | | | 4,664 | | | | 5,962 | |
Shareholder reporting expense | | | 1,931 | | | | 1,148 | | | | 1,851 | |
Professional fees | | | 16,293 | | | | 10,365 | | | | 13,249 | |
Custody and accounting expense | | | 365 | | | | 1,220 | | | | 649 | |
Directors fees | | | 365 | | | | 110 | | | | 156 | |
Miscellaneous expense | | | 1,991 | | | | 2,314 | | | | 1,872 | |
| | | | | | | | | | | | |
Total expenses | | | 126,845 | | | | 91,954 | | | | 115,922 | |
Net waived and reimbursed fees | | | (9,694 | ) | | | (6,742 | ) | | | (7,522 | ) |
| | | | | | | | | | | | |
Net expenses | | | 117,151 | | | | 85,212 | | | | 108,400 | |
| | | | | | | | | | | | |
Net investment income | | | 190,368 | | | | 169,578 | | | | 196,822 | |
| | | | | | | | | | | | |
REALIZED AND UNREALIZED GAIN (LOSS): | | | | | | | | | | | | |
Net realized gain | | | 77,030 | | | | 86,527 | | | | 109,003 | |
| | | | | | | | | | | | |
Net change in unrealized appreciation or depreciation | | | 182,082 | | | | 91,591 | | | | 215,721 | |
| | | | | | | | | | | | |
Net realized and unrealized gain | | | 259,112 | | | | 178,118 | | | | 324,724 | |
| | | | | | | | | | | | |
Increase in net assets resulting from operations | | $ | 449,480 | | | $ | 347,696 | | | $ | 521,546 | |
| | | | | | | | | | | | |
(1) Dividends from affiliates | | $ | 108 | | | $ | 77 | | | $ | 106 | |
See Accompanying Notes to Financial Statements
26
STATEMENTS OF OPERATIONSFORTHE YEAR ENDED DECEMBER 31, 2010
| | | | | | | | | | | | |
| | | ING GET U.S. Core
Portfolio
Series 12 | | | ING GET U.S. Core
Portfolio
Series 13 | | | ING GET U.S. Core
Portfolio
Series 14 | |
INVESTMENT INCOME: | | | | | | | | | | | | |
Dividends(1) | | $ | 13,077 | | | $ | 275 | | | $ | — | |
Interest | | | 480,927 | | | | 790,578 | | | | 2,113,288 | |
| | | | | | | | | | | | |
Total investment income | | | 494,004 | | | | 790,853 | | | | 2,113,288 | |
| | | | | | | | | | | | |
EXPENSES: | | | | | | | | | | | | |
Investment management fees | | | 98,077 | | | | 171,323 | | | | 364,002 | |
Distribution and service fees | | | 40,865 | | | | 71,384 | | | | 151,667 | |
Transfer agent fees | | | 33 | | | | 33 | | | | 101 | |
Administrative service fees | | | 8,990 | | | | 15,704 | | | | 33,366 | |
Shareholder reporting expense | | | 2,143 | | | | 4,515 | | | | 9,204 | |
Professional fees | | | 16,367 | | | | 24,523 | | | | 57,310 | |
Custody and accounting expense | | | 410 | | | | 365 | | | | 2,932 | |
Directors fees | | | 206 | | | | 345 | | | | 1,393 | |
Miscellaneous expense | | | 2,271 | | | | 3,053 | | | | 6,052 | |
| | | | | | | | | | | | |
Total expenses | | | 169,362 | | | | 291,245 | | | | 626,027 | |
Net waived and reimbursed fees | | | (5,496 | ) | | | (5,276 | ) | | | (17,990 | ) |
| | | | | | | | | | | | |
Net expenses | | | 163,866 | | | | 285,969 | | | | 608,037 | |
| | | | | | | | | | | | |
Net investment income | | | 330,138 | | | | 504,884 | | | | 1,505,251 | |
| | | | | | | | | | | | |
REALIZED AND UNREALIZED GAIN (LOSS): | | | | | | | | | | | | |
Net realized gain | | | 172,529 | | | | 368,802 | | | | 981,987 | |
| | | | | | | | | | | | |
Net change in unrealized appreciation or depreciation | | | 442,488 | | | | 994,502 | | | | 1,641,352 | |
| | | | | | | | | | | | |
Net realized and unrealized gain | | | 615,017 | | | | 1,363,304 | | | | 2,623,339 | |
| | | | | | | | | | | | |
Increase in net assets resulting from operations | | $ | 945,155 | | | $ | 1,868,188 | | | $ | 4,128,590 | |
| | | | | | | | | | | | |
(1) Dividends from affiliates | | $ | 143 | | | $ | 259 | | | $ | — | |
See Accompanying Notes to Financial Statements
27
STATEMENTS OF CHANGES IN NET ASSETS
| | | | | | | | | | | | | | | | |
| | | ING GET U.S. Core Portfolio Series 5 | | | ING GET U.S. Core Portfolio Series 6 | |
| | | Year Ended
December 31,
2010 | | | Year Ended December 31,
2009 | | | Year Ended
December 31,
2010 | | | Year Ended
December 31,
2009 | |
FROM OPERATIONS: | | | | | | | | | | | | | | | | |
Net investment income | | $ | 243,382 | | | $ | 297,936 | | | $ | 524,772 | | | $ | 689,200 | |
Net realized gain (loss) | | | 121,397 | | | | (341,908 | ) | | | 230,408 | | | | (312,386 | ) |
Net change in unrealized appreciation or depreciation | | | (27,179 | ) | | | 324,102 | | | | (63,075 | ) | | | 184,959 | |
| | | | | | | | | | | | | | | | |
Increase in net assets resulting from operations | | | 337,600 | | | | 280,130 | | | | 692,105 | | | | 561,773 | |
| | | | | | | | | | | | | | | | |
FROM DISTRIBUTIONS TO SHAREHOLDERS: | | | | | | | | | | | | | | | | |
Net investment income | | | (297,246 | ) | | | (727,338 | ) | | | (689,409 | ) | | | (853,639 | ) |
| | | | | | | | | | | | | | | | |
Total distributions | | | (297,246 | ) | | | (727,338 | ) | | | (689,409 | ) | | | (853,639 | ) |
| | | | | | | | | | | | | | | | |
FROM CAPITAL SHARE TRANSACTIONS: | | | | | | | | | | | | | | | | |
Reinvestment of distributions | | | 297,246 | | | | 727,338 | | | | 689,409 | | | | 853,639 | |
Cost of shares redeemed | | | (4,077,415 | ) | | | (3,785,219 | ) | | | (8,027,665 | ) | | | (9,286,163 | ) |
| | | | | | | | | | | | | | | | |
Net decrease in net assets resulting from capital share transactions | | | (3,780,169 | ) | | | (3,057,881 | ) | | | (7,338,256 | ) | | | (8,432,524 | ) |
| | | | | | | | | | | | | | | | |
Net decrease in net assets | | | (3,739,815 | ) | | | (3,505,089 | ) | | | (7,335,560 | ) | | | (8,724,390 | ) |
| | | | | | | | | | | | | | | | |
NET ASSETS: | | | | | | | | | | | | | | | | |
Beginning of year | | | 18,667,883 | | | | 22,172,972 | | | | 36,030,086 | | | | 44,754,476 | |
| | | | | | | | | | | | | | | | |
End of year | | $ | 14,928,068 | | | $ | 18,667,883 | | | $ | 28,694,526 | | | $ | 36,030,086 | |
| | | | | | | | | | | | | | | | |
Undistributed net investment income at end of year | | $ | 243,407 | | | $ | 297,241 | | | $ | 524,650 | | | $ | 689,270 | |
| | | | | | | | | | | | | | | | |
See Accompanying Notes to Financial Statements
28
STATEMENTS OF CHANGES IN NET ASSETS
| | | | | | | | | | | | | | | | |
| | | ING GET U.S. Core Portfolio Series 7 | | | ING GET U.S. Core Portfolio Series 8 | |
| | | Year Ended
December 31,
2010 | | | Year Ended
December 31,
2009 | | | Year Ended
December 31,
2010 | | | Year Ended
December 31,
2009 | |
FROM OPERATIONS: | | | | | | | | | | | | | | | | |
Net investment income | | $ | 387,644 | | | $ | 482,395 | | | $ | 175,734 | | | $ | 302,862 | |
Net realized gain (loss) | | | 188,968 | | | | (171,268 | ) | | | 189,761 | | | | (59,944 | ) |
Net change in unrealized appreciation or depreciation | | | 1,011 | | | | (118,488 | ) | | | (37,357 | ) | | | 22,374 | |
| | | | | | | | | | | | | | | | |
Increase in net assets resulting from operations | | | 577,623 | | | | 192,639 | | | | 328,138 | | | | 265,292 | |
| | | | | | | | | | | | | | | | |
FROM DISTRIBUTIONS TO SHAREHOLDERS: | | | | | | | | | | | | | | | | |
Net investment income | | | (481,929 | ) | | | (618,472 | ) | | | (301,849 | ) | | | (388,714 | ) |
| | | | | | | | | | | | | | | | |
Total distributions | | | (481,929 | ) | | | (618,472 | ) | | | (301,849 | ) | | | (388,714 | ) |
| | | | | | | | | | | | | | | | |
FROM CAPITAL SHARE TRANSACTIONS: | | | | | | | | | | | | | | | | |
Reinvestment of distributions | | | 481,929 | | | | 618,472 | | | | 301,849 | | | | 388,714 | |
Cost of shares redeemed | | | (5,826,781 | ) | | | (4,276,808 | ) | | | (2,876,613 | ) | | | (4,788,091 | ) |
| | | | | | | | | | | | | | | | |
Net decrease in net assets resulting from capital share transactions | | | (5,344,852 | ) | | | (3,658,336 | ) | | | (2,574,764 | ) | | | (4,399,377 | ) |
| | | | | | | | | | | | | | | | |
Net decrease in net assets | | | (5,249,158 | ) | | | (4,084,169 | ) | | | (2,548,475 | ) | | | (4,522,799 | ) |
| | | | | | | | | | | | | | | | |
NET ASSETS: | | | | | | | | | | | | | | | | |
Beginning of year | | | 25,169,201 | | | | 29,253,370 | | | | 14,960,438 | | | | 19,483,237 | |
| | | | | | | | | | | | | | | | |
End of year | | $ | 19,920,043 | | | $ | 25,169,201 | | | $ | 12,411,963 | | | $ | 14,960,438 | |
| | | | | | | | | | | | | | | | |
Undistributed net investment income at end of year | | $ | 387,462 | | | $ | 481,708 | | | $ | 175,672 | | | $ | 301,773 | |
| | | | | | | | | | | | | | | | |
See Accompanying Notes to Financial Statements
29
STATEMENTS OF CHANGES IN NET ASSETS
| | | | | | | | | | | | | | | | |
| | | ING GET U.S. Core Portfolio Series 9 | | | ING GET U.S. Core Portfolio Series 10 | |
| | | Year Ended
December 31,
2010 | | | Year Ended
December 31,
2009 | | | Year Ended
December 31,
2010 | | | Year Ended
December 31,
2009 | |
FROM OPERATIONS: | | | | | | | | | | | | | | | | |
Net investment income | | $ | 190,368 | | | $ | 241,944 | | | $ | 169,578 | | | $ | 224,347 | |
Net realized gain (loss) | | | 77,030 | | | | (73,167 | ) | | | 86,527 | | | | (70,560 | ) |
Net change in unrealized appreciation or depreciation | | | 182,082 | | | | 7,602 | | | | 91,591 | | | | (289,331 | ) |
| | | | | | | | | | | | | | | | |
Increase (decrease) in net assets resulting from operations | | | 449,480 | | | | 176,379 | | | | 347,696 | | | | (135,544 | ) |
| | | | | | | | | | | | | | | | |
FROM DISTRIBUTIONS TO SHAREHOLDERS: | | | | | | | | | | | | | | | | |
Net investment income | | | (241,112 | ) | | | (303,230 | ) | | | (223,531 | ) | | | (306,136 | ) |
| | | | | | | | | | | | | | | | |
Total distributions | | | (241,112 | ) | | | (303,230 | ) | | | (223,531 | ) | | | (306,136 | ) |
| | | | | | | | | | | | | | | | |
FROM CAPITAL SHARE TRANSACTIONS: | | | | | | | | | | | | | | | | |
Reinvestment of distributions | | | 241,112 | | | | 303,230 | | | | 223,531 | | | | 306,136 | |
Cost of shares redeemed | | | (2,456,982 | ) | | | (2,205,691 | ) | | | (1,854,324 | ) | | | (3,381,284 | ) |
| | | | | | | | | | | | | | | | |
Net decrease in net assets resulting from capital share transactions | | | (2,215,870 | ) | | | (1,902,461 | ) | | | (1,630,793 | ) | | | (3,075,148 | ) |
| | | | | | | | | | | | | | | | |
Net decrease in net assets | | | (2,007,502 | ) | | | (2,029,312 | ) | | | (1,506,628 | ) | | | (3,516,828 | ) |
| | | | | | | | | | | | | | | | |
NET ASSETS: | | | | | | | | | | | | | | | | |
Beginning of year | | | 12,552,767 | | | | 14,582,079 | | | | 9,128,313 | | | | 12,645,141 | |
| | | | | | | | | | | | | | | | |
End of year | | $ | 10,545,265 | | | $ | 12,552,767 | | | $ | 7,621,685 | | | $ | 9,128,313 | |
| | | | | | | | | | | | | | | | |
Undistributed net investment income at end of year | | $ | 190,317 | | | $ | 241,037 | | | $ | 169,572 | | | $ | 223,519 | |
| | | | | | | | | | | | | | | | |
See Accompanying Notes to Financial Statements
30
STATEMENTS OF CHANGES IN NET ASSETS
| | | | | | | | | | | | | | | | |
| | | ING GET U.S. Core Portfolio Series 11 | | | ING GET U.S. Core Portfolio Series 12 | |
| | | Year Ended December 31, 2010 | | | Year Ended
December 31, 2009 | | | Year Ended
December 31,
2010 | | | Year Ended
December 31,
2009 | |
FROM OPERATIONS: | | | | | | | | | | | | | | | | |
Net investment income | | $ | 196,822 | | | $ | 274,936 | | | $ | 330,138 | | | $ | 456,752 | |
Net realized gain (loss) | | | 109,003 | | | | 89,722 | | | | 172,529 | | | | (74,095 | ) |
Net change in unrealized appreciation or depreciation | | | 215,721 | | | | (523,840 | ) | | | 442,488 | | | | (643,387 | ) |
| | | | | | | | | | | | | | | | |
Increase (decrease) in net assets resulting from operations | | | 521,546 | | | | (159,182 | ) | | | 945,155 | | | | (260,730 | ) |
| | | | | | | | | | | | | | | | |
FROM DISTRIBUTIONS TO SHAREHOLDERS: | | | | | | | | | | | | | | | | |
Net investment income | | | (273,966 | ) | | | (553,167 | ) | | | (455,837 | ) | | | (639,636 | ) |
| | | | | | | | | | | | | | | | |
Total distributions | | | (273,966 | ) | | | (553,167 | ) | | | (455,837 | ) | | | (639,636 | ) |
| | | | | | | | | | | | | | | | |
FROM CAPITAL SHARE TRANSACTIONS: | | | | | | | | | | | | | | | | |
Reinvestment of distributions | | | 273,966 | | | | 553,167 | | | | 455,837 | | | | 639,636 | |
Cost of shares redeemed | | | (2,458,558 | ) | | | (3,951,200 | ) | | | (4,009,472 | ) | | | (5,122,404 | ) |
| | | | | | | | | | | | | | | | |
Net decrease in net assets resulting from capital share transactions | | | (2,184,592 | ) | | | (3,398,033 | ) | | | (3,553,635 | ) | | | (4,482,768 | ) |
| | | | | | | | | | | | | | | | |
Net decrease in net assets | | | (1,937,012 | ) | | | (4,110,382 | ) | | | (3,064,317 | ) | | | (5,383,134 | ) |
| | | | | | | | | | | | | | | | |
NET ASSETS: | | | | | | | | | | | | | | | | |
Beginning of year | | | 12,008,697 | | | | 16,119,079 | | | | 17,862,109 | | | | 23,245,243 | |
| | | | | | | | | | | | | | | | |
End of year | | $ | 10,071,685 | | | $ | 12,008,697 | | | $ | 14,797,792 | | | $ | 17,862,109 | |
| | | | | | | | | | | | | | | | |
Undistributed net investment income at end of year | | $ | 196,759 | | | $ | 273,886 | | | $ | 330,079 | | | $ | 455,758 | |
| | | | | | | | | | | | | | | | |
See Accompanying Notes to Financial Statements
31
STATEMENTS OF CHANGES IN NET ASSETS
| | | | | | | | | | | | | | | | |
| | | ING GET U.S. Core Portfolio Series 13 | | | ING GET U.S. Core Portfolio Series 14 | |
| | | Year Ended
December 31,
2010 | | | Year Ended
December 31,
2009 | | | Year Ended
December 31,
2010 | | | Year Ended
December 31,
2009 | |
FROM OPERATIONS: | | | | | | | | | | | | | | | | |
Net investment income | | $ | 504,884 | | | $ | 717,419 | | | $ | 1,505,251 | | | $ | 2,346,571 | |
Net realized gain (loss) | | | 368,802 | | | | (34,507 | ) | | | 981,987 | | | | 1,383,199 | |
Net change in unrealized appreciation or depreciation | | | 994,502 | | | | (1,665,316 | ) | | | 1,641,352 | | | | (5,088,786 | ) |
| | | | | | | | | | | | | | | | |
Increase (decrease) in net assets resulting from operations | | | 1,868,188 | | | | (982,404 | ) | | | 4,128,590 | | | | (1,359,016 | ) |
| | | | | | | | | | | | | | | | |
FROM DISTRIBUTIONS TO SHAREHOLDERS: | | | | | | | | | | | | | | | | |
Net investment income | | | (716,888 | ) | | | (1,298,259 | ) | | | (2,345,501 | ) | | | (3,453,643 | ) |
| | | | | | | | | | | | | | | | |
Total distributions | | | (716,888 | ) | | | (1,298,259 | ) | | | (2,345,501 | ) | | | (3,453,643 | ) |
| | | | | | | | | | | | | | | | |
FROM CAPITAL SHARE TRANSACTIONS: | | | | | | | | | | | | | | | | |
Reinvestment of distributions | | | 716,888 | | | | 1,298,259 | | | | 2,345,501 | | | | 3,453,643 | |
Cost of shares redeemed | | | (6,566,410 | ) | | | (11,355,877 | ) | | | (16,454,198 | ) | | | (38,809,854 | ) |
| | | | | | | | | | | | | | | | |
Net decrease in net assets resulting from capital share transactions | | | (5,849,522 | ) | | | (10,057,618 | ) | | | (14,108,697 | ) | | | (35,356,211 | ) |
| | | | | | | | | | | | | | | | |
Net decrease in net assets | | | (4,698,222 | ) | | | (12,338,281 | ) | | | (12,325,608 | ) | | | (40,168,870 | ) |
| | | | | | | | | | | | | | | | |
NET ASSETS: | | | | | | | | | | | | | | | | |
Beginning of year | | | 30,901,774 | | | | 43,240,055 | | | | 66,874,018 | | | | 107,042,888 | |
| | | | | | | | | | | | | | | | |
End of year | | $ | 26,203,552 | | | $ | 30,901,774 | | | $ | 54,548,410 | | | $ | 66,874,018 | |
| | | | | | | | | | | | | | | | |
Undistributed net investment income at end of year | | $ | 504,810 | | | $ | 716,764 | | | $ | 1,505,148 | | | $ | 2,345,398 | |
| | | | | | | | | | | | | | | | |
See Accompanying Notes to Financial Statements
32
FINANCIAL HIGHLIGHTS
Selected data for a share of beneficial interest outstanding throughout each year or period.
| | | | | | | | | | | | | | | | | | | | | | | | | | | | | | | | | | | | | | | | | | | | | | | | | | | | | | | | | | | | | | | | |
| | | | | | Income (loss)
from
investment
operations | | | | | | Less distributions | | | | | | | | | | | | Ratios to average net assets | | | Supplemental
data | |
| | | | | | | | | | | | | | | | | | | | | | | | | | | | | | | | | | | | | | | | | | | | | | | | | |
| | | Net asset value, beginning of year or period | | | Net investment income (loss) | | | Net realized and unrealized gain (loss) | | | Total from investment operations | | | From net investment income | | | From net realized gains | | | From return of capital | | | Total distributions | | | Net asset value, end of year or period | | | Total Return (1) | | | Expenses before reductions/ additions(2) | | | Expenses net of fee waivers and/or recoupments, if any (2)(3) | | | Expenses net of all reductions/ additions(2)(3) | | | Net investment income (loss)(2)(3) | | | Net assets, end of year or period | | | Portfolio turnover rate | |
| | | | | | | | | | | | | | | | | | | | | | | | | | | | | | | | | | | | | | | | | | | | | | | | | | | | | | | | | | | | | | | | |
Year or period ended | | ($) | | | ($) | | | ($) | | | ($) | | | ($) | | | ($) | | | ($) | | | ($) | | | ($) | | | (%) | | | (%) | | | (%) | | | (%) | | | (%) | | | ($000's) | | | (%) | |
ING GET U.S. Core
Portfolio | | | | | | | | | | | | | | | | | | | | | | | | | | | | | | | | | | | | | | | | | | | | | | | | | | | | | | | | | | | | | | | | |
Series 5 | | | | | | | | | | | | | | | | | | | | | | | | | | | | | | | | | | | | | | | | | | | | | | | | | | | | | | | | | | | | | | | | |
12-31-10 | | | 7.75 | | | | 0.11 | • | | | 0.04 | | | | 0.15 | | | | 0.13 | | | | — | | | | — | | | | 0.13 | | | | 7.77 | | | | 2.00 | | | | 1.08 | | | | 1.00 | † | | | 1.00 | † | | | 1.48 | † | | | 14,928 | | | | — | |
12-31-09 | | | 7.90 | | | | 0.11 | • | | | 0.01 | | | | 0.12 | | | | 0.27 | | | | — | | | | — | | | | 0.27 | | | | 7.75 | | | | 1.65 | | | | 1.04 | | | | 1.00 | † | | | 1.00 | † | | | 1.47 | † | | | 18,668 | | | | 5 | |
12-31-08 | | | 10.59 | | | | 0.15 | | | | (0.89 | ) | | | (0.74 | ) | | | 0.15 | | | | 1.80 | | | | — | | | | 1.95 | | | | 7.90 | | | | (7.36 | )†† | | | 1.12 | | | | 1.00 | † | | | 1.00 | † | | | 1.52 | † | | | 22,173 | | | | 240 | |
12-31-07 | | | 11.01 | | | | 0.13 | • | | | 0.14 | | | | 0.27 | | | | 0.19 | | | | 0.50 | | | | — | | | | 0.69 | | | | 10.59 | | | | 2.15 | | | | 0.97 | | | | 1.00 | † | | | 1.00 | † | | | 1.16 | † | | | 30,056 | | | | 230 | |
12-30-06 | | | 10.56 | | | | 0.16 | • | | | 0.96 | | | | 1.12 | | | | 0.22 | | | | 0.45 | | | | — | | | | 0.67 | | | | 11.01 | | | | 11.23 | | | | 1.01 | | | | 1.00 | | | | 1.00 | | | | 1.51 | | | | 36,518 | | | | 90 | |
Series 6 | | | | | | | | | | | | | | | | | | | | | | | | | | | | | | | | | | | | | | | | | | | | | | | | | | | | | | | | | | | | | | | | |
12-31-10 | | | 8.11 | | | | 0.12 | • | | | 0.04 | | | | 0.16 | | | | 0.17 | | | | — | | | | — | | | | 0.17 | | | | 8.10 | | | | 2.05 | | | | 1.06 | | | | 1.00 | † | | | 1.00 | † | | | 1.63 | † | | | 28,695 | | | | — | |
12-31-09 | | | 8.15 | | | | 0.14 | • | | | (0.01 | ) | | | 0.13 | | | | 0.17 | | | | — | | | | — | | | | 0.17 | | | | 8.11 | | | | 1.66 | | | | 1.01 | | | | 1.00 | † | | | 1.00 | † | | | 1.73 | † | | | 36,030 | | | | 4 | |
12-31-08 | | | 10.60 | | | | 0.18 | | | | (0.79 | ) | | | (0.61 | ) | | | 0.19 | | | | 1.65 | | | | — | | | | 1.84 | | | | 8.15 | | | | (6.16 | ) | | | 1.06 | | | | 1.00 | † | | | 1.00 | † | | | 1.69 | † | | | 44,754 | | | | 224 | |
12-31-07 | | | 11.08 | | | | 0.16 | • | | | 0.23 | | | | 0.39 | | | | 0.27 | | | | 0.60 | | | | — | | | | 0.87 | | | | 10.60 | | | | 3.30 | | | | 1.00 | | | | 1.00 | † | | | 1.00 | † | | | 1.44 | † | | | 60,574 | | | | 191 | |
12-31-06 | | | 10.35 | | | | 0.18 | • | | | 0.87 | | | | 1.05 | | | | 0.25 | | | | 0.07 | | | | — | | | | 0.32 | | | | 11.08 | | | | 10.48 | | | | 0.99 | | | | 0.99 | | | | 0.99 | | | | 1.71 | | | | 78,729 | | | | 84 | |
Series 7 | | | | | | | | | | | | | | | | | | | | | | | | | | | | | | | | | | | | | | | | | | | | | | | | | | | | | | | | | | | | | | | | |
12-31-10 | | | 7.90 | | | | 0.14 | • | | | 0.06 | | | | 0.20 | | | | 0.17 | | | | — | | | | — | | | | 0.17 | | | | 7.93 | | | | 2.52 | | | | 1.07 | | | | 1.00 | † | | | 1.00 | † | | | 1.73 | † | | | 19,920 | | | | — | |
12-31-09 | | | 8.01 | | | | 0.14 | • | | | (0.07 | ) | | | 0.07 | | | | 0.18 | | | | — | | | | — | | | | 0.18 | | | | 7.90 | | | | 0.97 | | | | 1.02 | | | | 1.00 | † | | | 1.00 | † | | | 1.80 | † | | | 25,169 | | | | 3 | |
12-31-08 | | | 10.74 | | | | 0.20 | | | | (0.70 | ) | | | (0.50 | ) | | | 0.21 | | | | 2.02 | | | | — | | | | 2.23 | | | | 8.01 | | | | (4.99 | ) | | | 1.07 | | | | 1.00 | † | | | 1.00 | † | | | 1.84 | † | | | 29,253 | | | | 219 | |
12-31-07 | | | 11.01 | | | | 0.16 | • | | | 0.22 | | | | 0.38 | | | | 0.28 | | | | 0.37 | | | | — | | | | 0.65 | | | | 10.74 | | | | 3.29 | | | | 1.03 | | | | 1.00 | † | | | 1.00 | † | | | 1.41 | † | | | 41,286 | | | | 208 | |
12-31-06 | | | 10.23 | | | | 0.18 | • | | | 0.85 | | | | 1.03 | | | | 0.25 | | | | — | | | | — | | | | 0.25 | | | | 11.01 | | | | 10.26 | | | | 1.01 | | | | 1.00 | | | | 1.00 | | | | 1.71 | | | | 59,054 | | | | 78 | |
Series 8 | | | | | | | | | | | | | | | | | | | | | | | | | | | | | | | | | | | | | | | | | | | | | | | | | | | | | | | | | | | | | | | | |
12-31-10 | | | 7.94 | | | | 0.10 | • | | | 0.09 | | | | 0.19 | | | | 0.18 | | | | — | | | | — | | | | 0.18 | | | | 7.95 | | | | 2.42 | | | | 1.09 | | | | 1.00 | † | | | 1.00 | † | | | 1.31 | † | | | 12,412 | | | | 4 | |
12-31-09 | | | 7.97 | | | | 0.14 | • | | | 0.01 | | | | 0.15 | | | | 0.18 | | | | — | | | | — | | | | 0.18 | | | | 7.94 | | | | 1.91 | | | | 1.04 | | | | 1.00 | † | | | 1.00 | † | | | 1.77 | † | | | 14,960 | | | | 16 | |
12-31-08 | | | 10.74 | | | | 0.18 | | | | (0.82 | ) | | | (0.64 | ) | | | 0.20 | | | | 1.93 | | | | — | | | | 2.13 | | | | 7.97 | | | | (6.47 | ) | | | 1.08 | | | | 1.00 | † | | | 1.00 | † | | | 1.77 | † | | | 19,483 | | | | 235 | |
12-31-07 | | | 11.06 | | | | 0.15 | • | | | 0.27 | | | | 0.42 | | | | 0.25 | | | | 0.49 | | | | — | | | | 0.74 | | | | 10.74 | | | | 3.64 | | | | 1.05 | | | | 1.00 | † | | | 1.00 | † | | | 1.36 | † | | | 26,821 | | | | 215 | |
12-31-06 | | | 10.23 | | | | 0.17 | • | | | 0.90 | | | | 1.07 | | | | 0.20 | | | | 0.04 | | | | — | | | | 0.24 | | | | 11.06 | | | | 10.70 | | | | 1.04 | | | | 1.00 | | | | 1.00 | | | | 1.60 | | | | 41,172 | | | | 101 | |
Series 9 | | | | | | | | | | | | | | | | | | | | | | | | | | | | | | | | | | | | | | | | | | | | | | | | | | | | | | | | | | | | | | | | |
12-31-10 | | | 7.87 | | | | 0.13 | • | | | 0.16 | | | | 0.29 | | | | 0.16 | | | | — | | | | — | | | | 0.16 | | | | 8.00 | | | | 3.76 | | | | 1.08 | | | | 1.00 | † | | | 1.00 | † | | | 1.63 | † | | | 10,545 | | | | — | |
12-31-09 | | | 7.93 | | | | 0.14 | • | | | (0.02 | ) | | | 0.12 | | | | 0.18 | | | | — | | | | — | | | | 0.18 | | | | 7.87 | | | | 1.56 | | | | 1.06 | | | | 1.00 | † | | | 1.00 | † | | | 1.81 | † | | | 12,553 | | | | 4 | |
12-31-08 | | | 10.81 | | | | 0.19 | | | | (0.71 | ) | | | (0.52 | ) | | | 0.23 | | | | 2.13 | | | | — | | | | 2.36 | | | | 7.93 | | | | (5.16 | ) | | | 1.12 | | | | 1.00 | † | | | 1.00 | † | | | 1.86 | † | | | 14,582 | | | | 301 | |
12-31-07 | | | 10.93 | | | | 0.16 | • | | | 0.29 | | | | 0.45 | | | | 0.28 | | | | 0.29 | | | | — | | | | 0.57 | | | | 10.81 | | | | 3.93 | | | | 1.06 | | | | 1.00 | † | | | 1.00 | † | | | 1.45 | † | | | 19,806 | | | | 233 | |
12-31-06 | | | 10.06 | | | | 0.18 | • | | | 0.82 | | | | 1.00 | | | | 0.13 | | | | — | | | | — | | | | 0.13 | | | | 10.93 | | | | 10.11 | | | | 1.09 | | | | 1.00 | | | | 1.00 | | | | 1.79 | | | | 30,694 | | | | 89 | |
Series 10 | | | | | | | | | | | | | | | | | | | | | | | | | | | | | | | | | | | | | | | | | | | | | | | | | | | | | | | | | | | | | | | | |
12-31-10 | | | 8.02 | | | | 0.16 | • | | | 0.17 | | | | 0.33 | | | | 0.22 | | | | — | | | | — | | | | 0.22 | | | | 8.13 | | | | 4.10 | | | | 1.08 | | | | 1.00 | † | | | 1.00 | † | | | 2.00 | † | | | 7,622 | | | | — | |
12-31-09 | | | 8.32 | | | | 0.16 | • | | | (0.24 | ) | | | (0.08 | ) | | | 0.22 | | | | — | | | | — | | | | 0.22 | | | | 8.02 | | | | (0.89 | ) | | | 1.06 | | | | 1.00 | † | | | 1.00 | † | | | 2.03 | † | | | 9,128 | | | | 31 | |
12-31-08 | | | 10.89 | | | | 0.23 | | | | (0.63 | ) | | | (0.40 | ) | | | 0.27 | | | | 1.90 | | | | — | | | | 2.17 | | | | 8.32 | | | | (3.91 | ) | | | 1.12 | | | | 1.00 | † | | | 1.00 | † | | | 2.13 | † | | | 12,645 | | | | 302 | |
12-31-07 | | | 10.91 | | | | 0.18 | • | | | 0.23 | | | | 0.41 | | | | 0.21 | | | | 0.22 | | | | — | | | | 0.43 | | | | 10.89 | | | | 3.63 | | | | 1.07 | | | | 1.00 | † | | | 1.00 | † | | | 1.62 | † | | | 17,127 | | | | 194 | |
12-31-06 | | | 10.02 | | | | 0.16 | • | | | 0.81 | | | | 0.97 | | | | 0.07 | | | | 0.01 | | | | — | | | | 0.08 | | | | 10.91 | | | | 9.78 | | | | 1.14 | | | | 1.00 | | | | 1.00 | | | | 1.54 | | | | 27,694 | | | | 93 | |
See Accompanying Notes to Financial Statements
33
FINANCIAL HIGHLIGHTS (CONTINUED)
Selected data for a share of beneficial interest outstanding throughout each year or period.
| | | | | | | | | | | | | | | | | | | | | | | | | | | | | | | | | | | | | | | | | | | | | | | | | | | | | | | | | | | | | | | | |
| | | | | | Income (loss)
from
investment
operations | | | | | | Less distributions | | | | | | | | | | | | Ratios to average net assets | | | Supplemental
data | |
| | | | | | | | | | | | | | | | | | | | | | | | | | | | | | | | | | | | | | | | | | | | | | | | | |
| | | Net asset value, beginning of year or period | | | Net investment income (loss) | | | Net realized and unrealized gain (loss) | | | Total from investment operations | | | From net investment income | | | From net realized gains | | | From return of capital | | | Total distributions | | | Net asset value, end of year or period | | | Total Return (1) | | | Expenses before reductions/ additions(2)(3) | | | Expenses net of fee waivers and/or recoupments, if any (2)(3) | | | Expenses net of all reductions/ additions(2)(3) | | | Net investment income (loss)(2)(3) | | | Net assets, end of year or period | | | Portfolio turnover rate | |
| | | | | | | | | | | | | | | | | | | | | | | | | | | | | | | | | | | | | | | | | | | | | | | | | | | | | | | | | | | | | | | | |
Year or period ended | | ($) | | | ($) | | | ($) | | | ($) | | | ($) | | | ($) | | | ($) | | | ($) | | | ($) | | | (%) | | | (%) | | | (%) | | | (%) | | | (%) | | | ($000's) | | | (%) | |
ING GET U.S. Core
Portfolio (Continued) | | | | | | | | | | | | | | | | | | | | | | | | | | | | | | | | | | | | | | | | | | | | | | | | | | | | | | | | | | | | | | | | |
Series 11 | | | | | | | | | | | | | | | | | | | | | | | | | | | | | | | | | | | | | | | | | | | | | | | | | | | | | | | | | | | | | | | | |
12-31-10 | | | 7.85 | | | | 0.15 | • | | | 0.23 | | | | 0.38 | | | | 0.21 | | | | — | | | | — | | | | 0.21 | | | | 8.02 | | | | 4.85 | | | | 1.07 | | | | 1.00 | † | | | 1.00 | † | | | 1.82 | † | | | 10,072 | | | | 4 | |
12-31-09 | | | 8.23 | | | | 0.17 | | | | (0.24 | ) | | | (0.07 | ) | | | 0.31 | | | | — | | | | — | | | | 0.31 | | | | 7.85 | | | | (0.78 | ) | | | 1.04 | | | | 1.00 | † | | | 1.00 | † | | | 1.97 | † | | | 12,009 | | | | — | |
12-31-08 | | | 10.47 | | | | 0.20 | | | | (0.27 | ) | | | (0.07 | ) | | | 0.25 | | | | 1.92 | | | | — | | | | 2.17 | | | | 8.23 | | | | 0.53 | †† | | | 1.06 | | | | 1.01 | † | | | 1.01 | † | | | 1.92 | † | | | 16,119 | | | | 198 | |
12-31-07 | | | 10.79 | | | | 0.16 | • | | | 0.08 | | | | 0.24 | | | | 0.36 | | | | 0.20 | | | | — | | | | 0.56 | | | | 10.47 | | | | 2.05 | | | | 1.10 | | | | 1.00 | † | | | 1.00 | † | | | 1.49 | † | | | 20,564 | | | | 267 | |
12-31-06 | | | 10.02 | | | | 0.23 | • | | | 0.55 | | | | 0.78 | | | | 0.01 | | | | — | | | | — | | | | 0.01 | | | | 10.79 | | | | 7.06 | (b) | | | 1.03 | | | | 0.96 | | | | 0.96 | | | | 2.22 | | | | 35,473 | | | | 114 | |
Series 12 | | | | | | | | | | | | | | | | | | | | | | | | | | | | | | | | | | | | | | | | | | | | | | | | | | | | | | | | | | | | | | | | |
12-31-10 | | | 7.69 | | | | 0.16 | • | | | 0.28 | | | | 0.44 | | | | 0.22 | | | | — | | | | — | | | | 0.22 | | | | 7.91 | | | | 5.78 | | | | 1.04 | | | | 1.00 | † | | | 1.00 | † | | | 2.02 | † | | | 14,798 | | | | — | |
12-31-09 | | | 7.99 | | | | 0.18 | • | | | (0.24 | ) | | | (0.06 | ) | | | 0.24 | | | | — | | | | — | | | | 0.24 | | | | 7.69 | | | | (0.59 | ) | | | 1.03 | | | | 1.00 | † | | | 1.00 | † | | | 2.29 | † | | | 17,862 | | | | 13 | |
12-31-08 | | | 11.29 | | | | 0.26 | | | | (0.90 | ) | | | (0.64 | ) | | | 0.18 | | | | 2.48 | | | | — | | | | 2.66 | | | | 7.99 | | | | (6.20 | ) | | | 1.12 | | | | 1.00 | † | | | 1.00 | † | | | 1.99 | † | | | 23,245 | | | | 280 | |
12-31-07 | | | 11.36 | | | | 0.13 | • | | | 0.23 | | | | 0.36 | | | | 0.15 | | | | 0.28 | | | | — | | | | 0.43 | | | | 11.29 | | | | 3.02 | | | | 1.09 | | | | 1.00 | † | | | 1.00 | † | | | 1.11 | † | | | 46,154 | | | | 231 | |
03-02-06(4) -
12-31-06 | | | 10.00 | | | | 0.13 | | | | 1.23 | | | | 1.36 | | | | — | | | | — | | | | — | | | | — | | | | 11.36 | | | | 12.25 | (b) | | | 0.94 | | | | 0.85 | | | | 0.85 | | | | 1.72 | | | | 54,893 | | | | 57 | |
Series 13 | | | | | | | | | | | | | | | | | | | | | | | | | | | | | | | | | | | | | | | | | | | | | | | | | | | | | | | | | | | | | | | | |
12-31-10 | | | 9.44 | | | | 0.17 | • | | | 0.45 | | | | 0.62 | | | | 0.25 | | | | — | | | | — | | | | 0.25 | | | | 9.81 | | | | 6.59 | | | | 1.02 | | | | 1.00 | † | | | 1.00 | † | | | 1.77 | † | | | 26,204 | | | | — | |
12-31-09 | | | 10.00 | | | | 0.19 | • | | | (0.41 | ) | | | (0.22 | ) | | | 0.34 | | | | — | | | | — | | | | 0.34 | | | | 9.44 | | | | (2.06 | ) | | | 1.03 | | | | 1.00 | † | | | 1.00 | † | | | 2.00 | † | | | 30,902 | | | | 13 | |
12-31-08 | | | 10.60 | | | | 0.21 | • | | | (0.00 | )* | | | 0.21 | | | | 0.20 | | | | 0.61 | | | | — | | | | 0.81 | | | | 10.00 | | | | 2.33 | | | | 1.05 | | | | 1.00 | † | | | 1.00 | † | | | 2.14 | † | | | 43,240 | | | | 386 | |
12-31-07 | | | 10.16 | | | | 0.15 | • | | | 0.35 | | | | 0.50 | | | | 0.06 | | | | 0.00 | * | | | — | | | | 0.06 | | | | 10.60 | | | | 4.95 | | | | 1.00 | | | | 1.00 | † | | | 1.00 | † | | | 1.44 | † | | | 70,238 | | | | 168 | |
06-22-06(4) -
12-31-06 | | | 10.00 | | | | 0.22 | • | | | (0.06 | ) | | | 0.16 | | | | — | | | | — | | | | — | | | | — | | | | 10.16 | | | | (0.59 | )(b) | | | 1.02 | | | | 0.73 | | | | 0.73 | | | | 4.15 | | | | 107,215 | | | | — | |
Series 14 | | | | | | | | | | | | | | | | | | | | | | | | | | | | | | | | | | | | | | | | | | | | | | | | | | | | | | | | | | | | | | | | |
12-31-10 | | | 9.93 | | | | 0.25 | • | | | 0.42 | | | | 0.67 | | | | 0.40 | | | | — | | | | — | | | | 0.40 | | | | 10.20 | | | | 6.88 | | | | 1.03 | | | | 1.00 | | | | 1.00 | | | | 2.48 | | | | 54,548 | | | | — | |
12-31-09 | | | 10.46 | | | | 0.29 | • | | | (0.39 | ) | | | (0.10 | ) | | | 0.43 | | | | — | | | | — | | | | 0.43 | | | | 9.93 | | | | (0.83 | ) | | | 1.03 | | | | 1.00 | | | | 1.00 | | | | 2.85 | | | | 66,874 | | | | 12 | |
12-31-08 | | | 10.41 | | | | 0.31 | • | | | (0.01 | ) | | | 0.30 | | | | 0.19 | | | | 0.06 | | | | — | | | | 0.25 | | | | 10.46 | | | | 3.04 | | | | 1.02 | | | | 1.00 | | | | 1.00 | | | | 3.05 | | | | 107,043 | | | | 293 | |
12-31-07 | | | 10.00 | | | | 0.26 | • | | | 0.15 | | | | 0.41 | | | | — | | | | — | | | | — | | | | — | | | | 10.41 | | | | 1.86 | (b) | | | 0.95 | | | | 0.93 | | | | 0.93 | | | | 2.52 | | | | 124,490 | | | | 120 | |
12-21-06(4) -
12-31-06 | | | 10.00 | | | | (0.00 | )• | | | — | | | | (0.00 | )* | | | — | | | | — | | | | — | | | | — | | | | 10.00 | | | | — | (a) | | | — | | | | 0.58 | | | | 0.58 | | | | (0.58 | ) | | | 85 | | | | — | |
| (1) | | Total return is calculated assuming reinvestment of all dividends, capital gain distributions and return of capital distributions, if any, at net asset value and does not reflect the effect of insurance contract charges. Total return for periods less than one year is not annualized. |
| (2) | | Annualized for periods less than one year. |
| (3) | | Expense ratios reflect operating expenses of a Series. Expenses before reductions/additions do not reflect amounts reimbursed by the Investment Adviser and/or Distributor or reductions from brokerage commission recapture arrangements or other expense offset arrangements and do not represent the amount paid by a Series during periods when reimbursements or reductions occur. Expenses net of fee waivers reflect expenses after reimbursement by the Investment Adviser and/or Distributor but prior to reductions from brokerage commission recapture arrangements or other expense offset arrangements. Expenses net of all reductions/additions represent the net expenses paid by a Series. Net investment income (loss) is net of all such additions or reductions. |
| (4) | | Commencement of operations. |
| * | | Amount is less than $0.005 or more than $(0.005). |
| · | | Calculated using average number of shares outstanding throughout the period. |
| † | | Impact of waiving the advisory fee for the ING Institutional Prime Money Market Fund holding has less than 0.005% impact on the expense ratio and net investment income or less ratio (Note 4). |
See Accompanying Notes to Financial Statements
34
FINANCIAL HIGHLIGHTS (CONTINUED)
| †† | | In August 2008, an affiliate of the Investment adviser and ING IM fully reimbursed ING GET U.S. Core Portfolio Series 5 and ING GET U.S. Core Portfolio Series 11 for a loss on certain investment transactions, which otherwise would have had a 1.46% and 1.39% impact on the Portfolios’ respective total returns. Excluding the reimbursement, total return would have been (8.82)% and (0.86)%, respectively. |
| (a) | | As of December 31, 2006, ING GET U.S. Core Portfolio Series 14 was in its Offering Period. Total return calculation began on the commencement date of the Guarantee Period (June 21, 2007.) Total return from commencement of operations was 0.00%. |
| (b) | | For ING GET U.S. Core Portfolio Series 11, ING GET U.S. Core Portfolio Series 12, ING GET U.S. Core Portfolio Series 13, and ING GET U.S. Core Portfolio Series 14 — total return calculation began on March 2, 2006, June 22, 2006, December 21, 2006 and June 21, 2007, respectively, the first day of each Guarantee Period. |
| | | For ING GET U.S. Core Portfolio Series 11 total return for the year ended December 31, 2006 was 7.81% and for ING GET U.S. Core Portfolio Series 14 total return for the year ended December 31, 2007 was 4.10%. For ING GET U.S. Core Portfolio Series 12 and ING GET U.S. Core Portfolio Series 13 — total return from each commencement of operations was 13.60% and 1.60%, respectively. |
See Accompanying Notes to Financial Statements
35
NOTES TO FINANCIAL STATEMENTSASOF DECEMBER 31, 2010
NOTE 1 — ORGANIZATION
Organization. ING Variable Insurance Trust (the “Trust”) was organized as a Delaware statutory trust on July 15, 1999 and is registered with the SEC under the Investment Company Act of 1940, as amended (“1940 Act” or “Act”) as a diversified open-end management investment company. There are ten separate investment Series which comprise the Trust. The ten that are in this report are as follows: ING GET U.S. Core Portfolio Series 5 (“Series 5”), ING GET U.S. Core Portfolio Series 6 (“Series 6”), ING GET U.S. Core Portfolio Series 7 (“Series 7”), ING GET U.S. Core Portfolio Series 8 (“Series 8”), ING GET U.S. Core Portfolio Series 9 (“Series 9”), ING GET U.S. Core Portfolio Series 10 (“Series 10”), ING GET U.S. Core Portfolio Series 11 (“Series 11”), ING GET U.S. Core Portfolio Series 12 (“Series 12”), ING GET U.S. Core Portfolio Series 13 (“Series 13”) and ING GET U.S. Core Portfolio Series 14 (“Series 14”) (each, a “Series” and collectively, “Series”).
During the Guarantee Period, each Series seeks to achieve maximum total return and minimal exposure of the Series’ assets to a market value loss by participating, to the extent possible, in favorable equity market performance.
If during the Guarantee Period the equity markets experience a major decline, the Series’ assets may become largely or entirely invested in the Fixed Component. Use of the Fixed Component reduces the Series’ ability to participate as fully in upward equity market movements, and therefore represents some loss of opportunity, or opportunity cost, compared to a portfolio that is more heavily invested in equities. The insurance companies offering these Series currently are ING Life Insurance & Annuity Company (“ILIAC”) and ING USA Annuity and Life Insurance Company (“ING USA”). The insurance companies offering these Series guarantee Contract holders and Participants that on the Maturity Date they will receive no less than the value of their separate account investment directed to the Series as of the last day of the Offering Period, adjusted for certain charges. The value of dividends and distributions made by the Series throughout the Guarantee Period is included in determining whether, for purposes of the Guarantee, the value of a shareholder’s investment on the Maturity Date is no less than the value of their investment as of the last day of the Offering Period. Amounts withdrawn prior to
the Maturity Date do not get the benefit of the Guarantee. The following information is related to the Series:
| | | | | | | | | | | | |
| | | Offering Period | | | Guarantee Period | | | Maturity Date | |
Series 5* | | | 06/11/04 — 09/09/04 | | | | 09/10/04 — 09/09/11 | | | | 09/09/11 | |
Series 6* | | | 09/10/04 — 12/09/04 | | | | 12/10/04 — 12/09/11 | | | | 12/09/11 | |
Series 7* | | | 12/10/04 — 03/08/05 | | | | 03/09/05 — 03/08/12 | | | | 03/08/12 | |
Series 8* | | | 03/09/05 — 06/07/05 | | | | 06/08/05 — 06/07/12 | | | | 06/07/12 | |
Series 9* | | | 06/08/05 — 09/06/05 | | | | 09/07/05 — 09/06/12 | | | | 09/06/12 | |
Series 10* | | | 09/07/05 — 12/05/05 | | | | 12/06/05 — 12/05/12 | | | | 12/05/12 | |
Series 11* | | | 12/06/05 — 03/01/06 | | | | 03/02/06 — 02/28/13 | | | | 02/28/13 | |
Series 12* | | | 03/02/06 — 06/21/06 | | | | 06/22/06 — 06/20/13 | | | | 06/20/13 | |
Series 13* | | | 06/22/06 — 12/20/06 | | | | 12/21/06 — 12/19/13 | | | | 12/19/13 | |
Series 14* | | | 12/21/06 — 06/20/07 | | | | 06/21/07 — 06/19/14 | | | | 06/19/14 | |
| * | Closed to new investors. |
Shares of the Series are offered to insurance company separate accounts that fund both annuity and life insurance contracts and certain tax-qualified retirement plans. At December 31, 2010 separate accounts of ILIAC and ING USA and their affiliates held all the shares outstanding of the Series.
ING Investments, LLC serves as the investment adviser (“ING Investments” or the “Investment Adviser”) to the Series. ING Investment Management Co. serves as the sub-adviser (“IIM” or the “Sub-Adviser”) to the Series. ING Funds Services, LLC serves as the administrator (“IFS” or the “Administrator”) for the Portfolios. ING Investments Distributor, LLC (“IID” or the “Distributor”) serves as the principal underwriter to the Series.
The Investment Adviser, the Sub-Adviser, IFS and IID are indirect, wholly-owned subsidiaries of ING Groep N.V. (“ING Groep”). ING Groep is a global financial institution of Dutch origin offering banking, investments, life insurance and retirement services.
ING Groep has adopted a formal restructuring plan that was approved by the European Commission in November 2009 under which the ING life insurance businesses, including the retirement services and investment management businesses, which include the Investment Adviser and its affiliates, would be divested by ING Groep by the end of 2013. While there can be no assurance that it will be carried out, the restructuring plan presents certain risks, including uncertainty about the effect on the businesses of the ING entities that service the Series and potential termination of the Series’ existing advisory agreement, which may trigger the need for shareholder approval of new agreements.
36
NOTES TO FINANCIAL STATEMENTSASOF DECEMBER 31, 2010 (CONTINUED)
NOTE 2 — SIGNIFICANT ACCOUNTING POLICIES
The following significant accounting policies are consistently followed by the Series in the preparation of their financial statements, and such policies are in conformity with U.S. generally accepted accounting principles (“GAAP”) for investment companies.
A. Security Valuation. All investments in securities are recorded at their estimated fair value, as described below. Investments in equity securities traded on a national securities exchange are valued at the last reported sale price. Securities reported by NASDAQ are valued at the NASDAQ official closing prices. Securities traded on an exchange or NASDAQ for which there has been no sale and securities traded in the over-the-counter-market are valued at the mean between the last reported bid and ask prices. All investments quoted in foreign currencies will be valued daily in U.S. dollars on the basis of the foreign currency exchange rates prevailing at that time. Debt securities with more than 60 days to maturity are valued using matrix pricing methods determined by an independent pricing service which takes into consideration such factors as yields, maturities, liquidity, ratings and traded prices in similar or identical securities. Investments of sufficient credit quality maturing in 60 days or less are valued at amortized cost which approximates fair value.
Securities for which valuations are not readily available from an independent pricing service may be valued by brokers which use prices provided by market makers or estimates of fair market value obtained from yield data relating to investments or securities with similar characteristics. U.S. government obligations are valued by using market quotations or independent pricing services that use prices provided by market-makers or estimates of market values obtained from yield data relating to instruments or securities with similar characteristics. Investments in open-end mutual funds are valued at net asset value.
Securities and assets for which market quotations are not readily available (which may include certain restricted securities which are subject to limitations as to their sale) are valued at their fair values, as defined by the 1940 Act, and as determined in good faith by or under the supervision of the Series’ Board of Trustees (the “Board”), in accordance with methods that are specifically authorized by the Board. Securities traded on exchanges, including foreign exchanges, which close earlier than the time that a Series calculates its NAV may also be valued at their fair values as defined by the 1940 Act, and as
determined in good faith by or under the supervision of the Board, in accordance with methods that are specifically authorized by the Board. All such fair valuations are made in accordance with valuation procedures of the Series (the “Valuation Procedures”) which have been approved by the Board. The valuation techniques applied in any specific instance are set forth in the Valuation Procedures and may vary from case to case. With respect to a restricted security, for example, consideration is generally given to the cost of the investment, the market value of any unrestricted securities of the same class at the time of valuation, the potential expiration of restrictions on the security, the existence of any registration rights, the costs to the Series related to registration of the security, as well as factors relevant to the issuer itself. Consideration may also be given to the price and extent of any public trading in similar securities of the issuer or comparable companies’ securities. The value of a foreign security traded on an exchange outside the United States is generally based on the price of a foreign security on the principal foreign exchange where it trades as of the time the Series determines its NAV or if the foreign exchange closes prior to the time the Series determines its NAV, the most recent closing price of the foreign security on its principal exchange. Trading in certain non-U.S. securities may not take place on all days on which the New York Stock Exchange (“NYSE”) is open. Further, trading takes place in various foreign markets on days on which the NYSE is not open. Consequently, the calculation of the Series’ NAV may not take place contemporaneously with the determination of the prices of securities held by a Series in foreign securities markets. Further, the value of the Series’ assets may be significantly affected by foreign trading on days when a shareholder cannot purchase or redeem shares of the Series. In calculating the Series’ NAV, foreign securities in foreign currency are converted to U.S. dollar equivalents. If an event occurs after the time at which the market for foreign securities held by the Series closes but before the time that the Series’ NAV in calculated, such event may cause the closing price on the foreign exchange to not represent a readily available reliable market value quotation for such securities at the time the Series determines its NAV. In such a case, the Series will use the fair value of such securities as determined under the Series’ valuation procedures. Events after the close of trading on a foreign market that could require the Series to fair value some or all of its foreign securities include, among others, securities
37
NOTES TO FINANCIAL STATEMENTSASOF DECEMBER 31, 2010 (CONTINUED)
NOTE 2 — SIGNIFICANT ACCOUNTING POLICIES (continued)
trading in the U.S. and other markets, corporate announcements, natural and other disasters, and political and other events. Among other elements of analysis in the determination of a security’s fair value, the Board has authorized the use of one or more independent research services to assist with such determinations. An independent research service may use statistical analyses and quantitative models to help determine fair value as of the time a Series calculates its NAV. There can be no assurance that such models accurately reflect the behavior of the applicable markets or the effect of the behavior of such markets on the fair value of securities, or that such markets will continue to behave in a fashion that is consistent with such models. Unlike the closing price of a security on an exchange, fair value determinations employ elements of judgment. Consequently, the fair value assigned to a security may not represent the actual value that a Series could obtain if it were to sell the security at the time of the close of the NYSE. Pursuant to procedures adopted by the Board, a Series is not obligated to use the fair valuations suggested by any research service, and valuation recommendations provided by such research services may be overridden if other events have occurred or if other fair valuations are determined in good faith to be more accurate. Unless an event is such that it causes a Series to determine that the closing prices for one or more securities do not represent readily available reliable market value quotations at the time a Series determines its NAV, events that occur between the time of the close of the foreign market on which they are traded and the close of regular trading on the NYSE will not be reflected in a Series’ NAV.
Fair value is defined as the price that the Series would receive to sell an asset or pay to transfer a liability in an orderly transaction between market participants at the measurement date. Each investment asset or liability of the Series is assigned a level at measurement date based on the significance and source of the inputs to its valuation. Quoted prices in active markets for identical securities are classified as “Level 1,” inputs other than quoted prices for an asset or liability that are observable are classified as “Level 2” and unobservable inputs, including the adviser’s or sub-adviser’s judgment about the assumptions that a market participant would use in pricing an asset or liability are classified as “Level 3.”
The inputs used for valuing securities are not necessarily an indication of the risks associated with investing in those securities. Short-term securities of sufficient credit quality which are valued at amortized cost, which approximates fair value, are generally considered to be Level 2 securities under applicable accounting rules. A table summarizing each Series’ investments under these levels of classification is included following the Portfolios of Investments.
For the year ended December 31, 2010, there have been no significant changes to the fair valuation methodologies.
B. Security Transactions and Revenue Recognition. Security transactions are recorded on the trade date. Realized gains or losses on sales of investments are calculated on the identified cost basis. Interest income is recorded on the accrual basis. Premium amortization and discount accretion are determined using the effective yield method. Dividend income is recorded on the ex-dividend date.
C. Foreign Currency Translation. The books and records of the Series are maintained in U.S. dollars. Any foreign currency amounts are translated into U.S. dollars on the following basis:
| (1) | Market value of investment securities, other assets and liabilities — at the exchange rates prevailing at the end of the day. |
| (2) | Purchases and sales of investment securities, income and expenses — at the rates of exchange prevailing on the respective dates of such transactions. |
Although the net assets and the market values are presented at the foreign exchange rates at the end of the day, the Series do not isolate the portion of the results of operations resulting from changes in foreign exchange rates on investments from the fluctuations arising from changes in market prices of securities held. Such fluctuations are included with the net realized and unrealized gains or losses from investments. For securities which are subject to foreign withholding tax upon disposition, liabilities are recorded on the Statements of Assets and Liabilities for the estimated tax withholding based on the securities current market value. Upon disposition, realized gains or losses on such securities are recorded net of foreign withholding tax.
Reported net realized foreign exchange gains or losses arise from sales of foreign currencies, currency
38
NOTES TO FINANCIAL STATEMENTSASOF DECEMBER 31, 2010 (CONTINUED)
NOTE 2 — SIGNIFICANT ACCOUNTING POLICIES (continued)
gains or losses realized between the trade and settlement dates on securities transactions, the difference between the amounts of dividends, interest, and foreign withholding taxes recorded on the Series’ books and the U.S. dollar equivalent of the amounts actually received or paid. Net unrealized foreign exchange gains and losses arise from changes in the value of assets and liabilities other than investments in securities at fiscal year end, resulting from changes in the exchange rate. Foreign security and currency transactions may involve certain considerations and risks not typically associated with investing in U.S. companies and U.S. government securities. These risks include, but are not limited to, revaluation of currencies and future adverse political and economic developments which could cause securities and their markets to be less liquid and prices more volatile than those of comparable U.S. companies and U.S. government securities.
D. Distributions to Shareholders. Dividends from net investment income and net realized gains, if any, are declared and paid annually by the Series. Distributions are determined annually in accordance with federal tax principles, which may differ from U.S. generally accepted accounting principles for investment companies. The Series may make distributions on a more frequent basis to comply with the distribution requirements of the Internal Revenue Code. Distributions are recorded on the ex-dividend date. The characteristics of income and gains are determined in accordance with income tax regulations, which may differ from accounting principles generally accepted in the United States for investment companies.
E. Federal Income Taxes. It is the Series’ policy to comply with subchapter M of the Internal Revenue Code and related excise tax provisions applicable to regulated investment companies and to distribute substantially all of their net investment income and any net realized capital gains to their shareholders. Therefore, no federal income tax provision is required. Management has considered the sustainability of the Series’ tax positions taken on federal income tax returns for all open tax years in making this determination. No capital gain distributions shall be made until any capital loss carryforwards have been fully utilized or expired.
F. Use of Estimates. The preparation of financial statements in conformity with U.S. generally accepted
accounting principles requires management to make estimates and assumptions that affect the reported amounts of assets and liabilities and disclosure of contingent assets and liabilities at the date of the financial statements and the reported amounts of increases and decreases in net assets from operations during the reporting period. Actual results could differ from those estimates.
G. Risk Exposures and the use of Derivative Instruments. Each Series’ investment strategies permit them to enter into futures contracts. In doing so, the Series will employ strategies in differing combinations to permit it to increase or decrease the level of risk, or change the level or types of exposure to market risk factors. This may allow the Series to pursue its objectives more quickly, and efficiently than if it were to make direct purchases or sales of securities capable of affecting a similar response to market factors.
Market Risk Factors. In pursuit of its investment objectives, a Series may seek to use derivatives to increase or decrease its exposure to the following market risk factors:
Credit Risk. Credit risk relates to the ability of the issuer to meet interest and principal payments, or both, as they come due.
Equity Risk. Equity risk relates to the change in value of equity securities as they relate to increases or decreases in the general market.
Interest Rate Risk. Interest rate risk refers to the fluctuations in value of fixed-income securities resulting from the inverse relationship between price and yield. For example, an increase in general interest rates will tend to reduce the market value of already issued fixed-income investments, and a decline in general interest rates will tend to increase their value. In addition, debt securities with longer durations, which tend to have higher yields, are subject to potentially greater fluctuations in value from changes in interest rates than obligations with shorter durations.
Risks of Investing in Derivatives. Each Series’ use of derivatives can result in losses due to unanticipated changes in the market risk factors and the overall market. In instances where a Series is using derivatives to decrease, or hedge, exposures to market risk factors for securities held by a Series, there are also risks that those derivatives may not perform as expected resulting in losses for the combined or hedged positions.
39
NOTES TO FINANCIAL STATEMENTSASOF DECEMBER 31, 2010 (CONTINUED)
NOTE 2 — SIGNIFICANT ACCOUNTING POLICIES (continued)
The use of these strategies involves certain special risks, including a possible imperfect correlation, or even no correlation, between price movements of derivative instruments and price movements of related investments. While some strategies involving derivative instruments can reduce the risk of loss, they can also reduce the opportunity for gain or even result in losses by offsetting favorable price movements in related investments or otherwise, due to the possible inability of a Series to purchase or sell a portfolio security at a time that otherwise would be favorable or the possible need to sell a portfolio security at a disadvantageous time because the Series is required to maintain asset coverage or offsetting positions in connection with transactions in derivative instruments. Additional associated risks from investing in derivatives also exist and potentially could have significant effects on the valuation of the derivative and a Series. Associated risks are not the risks that a Series is attempting to increase or decrease exposure to, per their investment objectives, but are the additional risks from investing in derivatives. Examples of these associated risks are liquidity risk, which is the risk that a Series will not be able to sell the derivative in the open market in a timely manner, and counterparty credit risk, which is the risk that the counterparty will not fulfill its obligation to a Series. Associated risks can be different for each type of derivative and are discussed by each derivative type in the following notes.
H. Futures Contracts. Each Series may enter into futures contracts involving foreign currency, interest rates, securities and security indices. A futures contract is a commitment to buy or sell a specific amount of a financial instrument at a negotiated price on a stipulated future date. Each Series may buy and sell futures contracts. Futures contracts traded on a commodities or futures exchange will be valued at the final settlement price or official closing price on the principal exchange as reported by such principal exchange at its trading session ending at, or most recently prior to, the time when the Series assets are valued.
Upon entering into a futures contract, each Series is required to deposit either cash or securities (initial margin) in an amount equal to a certain percentage of the contract value. Subsequent payments (variation
margin) are made or received by the Series each day. The variation margin payments are equal to the daily changes in the contract value and are recorded as unrealized gains and losses. Open futures contracts are reported on a table following each Portfolio of Investments. Securities held in collateralized accounts to cover initial margin requirements on open futures contracts are footnoted in the Portfolio of Investments. Cash collateral held by the broker to cover initial margin requirements on open futures contracts are noted in each Series’ Statement of Assets and Liabilities. The net change in unrealized appreciation and depreciation is reported in each Series’ Statement of Operations. Realized gains (losses) are reported in each Series’ Statement of Operations at the closing or expiration of futures contracts.
Futures contracts are exposed to the market risk factor of the underlying financial instrument. During the year ended December 31, 2010, Series 5 purchased futures contracts on various equity indices to “equitize” cash. Futures contracts are purchased to provide immediate market exposure proportionate to the size of the Series’ respective cash flows and residual cash balances in order to decrease potential tracking error if the cash remained uninvested in the market. Additional associated risks of entering into futures contracts include the possibility that there may be an illiquid market where the Series’ are unable to liquidate the contract or enter into an offsetting position and, if used for hedging purposes, the risk that the price of the contract will correlate imperfectly with the prices of the Series securities. With futures, there is minimal counterparty credit risk to the Series’ since futures are exchange traded and the exchange’s clearinghouse, as counterparty to all exchange traded futures, guarantees the futures against default. During the year ended December 31, 2010, Series 5 had an average notional value of $284,610 on futures contracts purchased.
I. Indemnifications. In the normal course of business, the Trust may enter into contracts that provide certain indemnifications. The Trust’s maximum exposure under these arrangements is dependent on future claims that may be made against the Series and, therefore, cannot be estimated; however, based on experience, management considers risk of loss from such claims remote.
40
NOTES TO FINANCIAL STATEMENTSASOF DECEMBER 31, 2010 (CONTINUED)
NOTE 3 — INVESTMENT TRANSACTIONS
For the year ended December 31, 2010, the cost of purchases and the proceeds from the sales of securities, excluding U.S. government and short-term securities, were as follows:
| | | | | | | | |
| | | Purchases | | | Sales | |
Series 5 | | $ | — | | | $ | — | |
Series 6 | | | — | | | | — | |
Series 7 | | | — | | | | — | |
Series 8 | | | — | | | | 556,245 | |
Series 9 | | | — | | | | — | |
Series 10 | | | — | | | | — | |
Series 11 | | | — | | | | — | |
Series 12 | | | — | | | | — | |
Series 13 | | | — | | | | 2,389,377 | |
Series 14 | | | — | | | | — | |
Purchases and sales of long-term U.S. government securities not included above were as follows:
| | | | | | | | |
| | | Purchases | | | Sales | |
Series 5 | | $ | — | | | $ | 4,214,365 | |
Series 6 | | | — | | | | 8,147,442 | |
Series 7 | | | — | | | | 6,041,547 | |
Series 8 | | | 555,540 | | | | 3,005,998 | |
Series 9 | | | — | | | | 2,623,280 | |
Series 10 | | | — | | | | 2,016,701 | |
Series 11 | | | 479,915 | | | | 3,017,304 | |
Series 12 | | | — | | | | 4,207,030 | |
Series 13 | | | — | | | | 4,378,579 | |
Series 14 | | | — | | | | 17,000,577 | |
NOTE 4 — INVESTMENT MANAGEMENT AND ADMINISTRATION FEES
Each Series has entered into an investment management agreement (“Investment Management Agreement”) with ING Investments. The Investment Management Agreement compensates the Investment Adviser with a fee, computed daily and payable monthly, based on the average daily net assets of each Series. The fee for each Series was 0.25% during its Offering Period and is 0.60% during its Guarantee Period.
During the period, ING Funds were permitted to invest end-of-day cash balances into ING Institutional Prime Money Market Fund. Investment Management fees paid by the Series were reduced by an amount equal to the management fees paid indirectly to ING Institutional Prime Money Market with respect to assets invested by the Series.
Effective December 20, 2010, ING Institutional Prime Money Market Fund was liquidated. As a result of this liquidation, the Series will no longer invest end-of-day cash balances into ING Institutional Prime Money Market Fund. For the year ended December 31, 2010, the Series waived the following amounts, which are not subject to recoupment:
| | | | |
Series 5 | | $ | 77 | |
Series 6 | | | 139 | |
Series 7 | | | 100 | |
Series 8 | | | 61 | |
Series 9 | | | 53 | |
Series 10 | | | 38 | |
Series 11 | | | 49 | |
Series 12 | | | 69 | |
Series 13 | | | 128 | |
The Investment Adviser has engaged ING IM, to serve as sub-adviser to each Series. ING IM is responsible for managing the assets of each Series in accordance with its investment objective and policies, subject to such policies as the Board or the Investment Adviser may determine.
IFS acts as the administrator and provides certain administrative and shareholder services necessary for each Series’ operations and is responsible for the supervision of other service providers. For its services, the Administrator is entitled to receive from each Series a fee at an annual rate of 0.055% on the first $5 billion of average daily net assets and 0.030% thereafter.
NOTE 5 — DISTRIBUTION FEES
The Series have adopted a Distribution Plan pursuant to Rule 12b-1 under the 1940 Act (the “12b-1 Plan”), whereby IID is compensated by the Series for expenses incurred in the distribution of each Series’ shares (“Distribution Fees”). Pursuant to the 12b-1 Plan, the Distributor is entitled to a payment each month to compensate for expenses incurred in the distribution and promotion of the Series’ shares, including expenses incurred in printing prospectuses and reports used for sales purposes, expenses incurred in preparing and printing sales literature and other such distribution related expenses, including distribution or shareholder servicing fees (“Servicing Fees”) paid to securities dealers who have executed a distribution agreement with the Distributor. Under the 12b-1 Plan, the Series pays the Distributor a Distribution Fee rate of 0.25% based on average daily net assets.
41
NOTES TO FINANCIAL STATEMENTSASOF DECEMBER 31, 2010 (CONTINUED)
NOTE 6 — OTHER TRANSACTIONS WITH AFFILIATED AND RELATED PARTIES
At December 31, 2010, the Series had the following amounts recorded as payable to affiliates on the accompanying Statements of Assets and Liabilities:
| | | | | | | | | | | | | | | | |
Series | | Accrued Investment Management Fees | | | Accrued Administrative Fees | | | Accrued Shareholder Service and Distribution Fees | | | Total | |
Series 5 | | $ | 9,075 | | | $ | 701 | | | $ | 3,188 | | | $ | 12,964 | |
Series 6 | | | 14,726 | | | | 1,350 | | | | 6,137 | | | | 22,213 | |
Series 7 | | | 10,229 | | | | 938 | | | | 4,264 | | | | 15,431 | |
Series 8 | | | 6,355 | | | | 583 | | | | 2,649 | | | | 9,587 | |
Series 9 | | | 5,570 | | | | 511 | | | | 2,322 | | | | 8,403 | |
Series 10 | | | 3,900 | | | | 358 | | | | 1,629 | | | | 5,884 | |
Series 11 | | | 5,629 | | | | 474 | | | | 2,154 | | | | 8,257 | |
Series 12 | | | 7,571 | | | | 694 | | | | 3,155 | | | | 11,420 | |
Series 13 | | | 13,490 | | | | 1,237 | | | | 5,623 | | | | 20,350 | |
Series 14 | | | 28,120 | | | | 2,578 | | | | 11,717 | | | | 42,415 | |
The Trust has adopted a Deferred Compensation Plan (the “Plan”), which allows eligible non-affiliated trustees as described in the Plan to defer the receipt of all or a portion of the trustees’ fees payable. Amounts deferred are treated as though invested in various “notional” funds advised by ING Investments until distribution in accordance with the Plan.
At December 31, 2010, the following indirect, wholly owned subsidiaries of ING Groep owned the following Series:
ING Life Insurance and Annuity Company — Series 5 (10.47%); Series 6 (59.42%); Series 7 (51.28%); Series 8 (63.92%); Series 9 (59.77%); Series 10 (57.75%); Series 11 (49.41%); Series 12 (86.38%); Series 13 (48.49%); and Series 14 (17.71%)
ING USA Annuity and Life Insurance Company — Series 5 (76.07%); Series 6 (37.38%); Series 7 (37.48%); Series 8 (33.07%); Series 9 (38.30%); Series 10 (42.17%); Series 11 (48.24%); Series 12 (13.25%); Series 13 (49.05%); and Series 14 (66.34%)
Reliastar Life Insurance Company of New York — Series 5 (13.46%); Series 7 (11.24%); and Series 14 (15.94%)
Control is defined by the 1940 Act as the beneficial ownership, either directly or through one or more controlled companies, of more than 25% of the voting securities of a company. The 1940 Act defines affiliates as companies that are under common control. Therefore, because the Series have a common owner that owns over 25% of the outstanding securities of the Series, they may be deemed to be affiliates of each
other. Investment activities of these shareholders could have a material impact on the Series.
NOTE 7 — OTHER ACCRUED EXPENSES AND LIABILITIES
At December 31, 2010, each applicable Series had the following payables included in Other Accrued Expenses and Liabilities on the Statements of Assets and Liabilities that exceeded 5% of total liabilities.
| | | | | | |
Series | | Accrued Expenses | | Amount | |
Series 5 | | Professional | | $ | 14,441 | |
| | Shareholder Reporting | | | 4,232 | |
| | Postage | | | 2,722 | |
Series 6 | | Professional | | | 24,914 | |
Series 7 | | Professional | | | 17,210 | |
| | Postage | | | 5,470 | |
Series 8 | | Professional | | | 11,151 | |
Series 9 | | Custody | | | 1,414 | |
| | Professional | | | 8,944 | |
| | Legal | | | 1,955 | |
| | Postage | | | 2,545 | |
Series 10 | | Professional | | | 7,278 | |
| | Legal | | | 978 | |
| | Shareholding Reporting | | | 1,034 | |
| | Postage | | | 2,116 | |
Series 11 | | Professional | | | 8,805 | |
| | Postage | | | 2,560 | |
Series 12 | | Professional | | | 12,615 | |
| | Postage | | | 3,383 | |
Series 13 | | Professional | | | 22,196 | |
| | Postage | | | 5,674 | |
Series 14 | | Professional | | | 47,774 | |
| | Postage | | | 10,541 | |
NOTE 8 — EXPENSE LIMITATION AGREEMENT
ING Investments has entered into a written expense limitation agreement (“Expense Limitation Agreement”) with each Series whereby the Investment Adviser has agreed to limit expenses, excluding interest, taxes, brokerage commissions and extraordinary expenses (and acquired fund fees and expenses stemming from investments in other investment companies) to 0.65% during the Offering Period and 1.00% during the Guarantee Period.
The Investment Adviser may at a later date recoup from a Series for management fees waived and other expenses assumed by the Investment Adviser during the previous 36 months, but only if, after such recoupment, the Series’ expense ratio does not exceed the percentage described above. Waived and reimbursed fees net of any recoupment by the Investment Adviser of such waived and reimbursed fees, are reflected on the accompanying Statements of Operations for each Series. Amounts payable by the Investment Adviser are reflected in the Statements of Assets and Liabilities for each Series.
42
NOTES TO FINANCIAL STATEMENTSASOF DECEMBER 31, 2010 (CONTINUED)
NOTE 8 — EXPENSE LIMITATION AGREEMENT (continued)
As of December 31, 2010, the amounts of waived and reimbursed fees that are subject to possible recoupment by the Investment Adviser and the related expiration dates are as follows:
| | | | | | | | | | | | | | | | |
| | | December 31, | | | | |
| | | 2011 | | | 2012 | | | 2013 | | | Total | |
Series 5 | | $ | 28,154 | | | $ | 6,874 | | | $ | 13,516 | | | $ | 48,544 | |
Series 6 | | | 27,610 | | | | 3,482 | | | | 18,396 | | | | 49,488 | |
Series 7 | | | 21,768 | | | | 5,426 | | | | 15,472 | | | | 42,666 | |
Series 8 | | | 18,051 | | | | 6,928 | | | | 11,464 | | | | 36,443 | |
Series 9 | | | 20,281 | | | | 8,055 | | | | 9,641 | | | | 37,977 | |
Series 10 | | | 17,306 | | | | 6,857 | | | | 6,704 | | | | 30,867 | |
Series 11 | | | 8,444 | | | | 5,972 | | | | 7,473 | | | | 21,889 | |
Series 12 | | | 36,948 | | | | 5,821 | | | | 5,427 | | | | 48,196 | |
Series 13 | | | 31,120 | | | | 9,006 | | | | 5,149 | | | | 45,275 | |
Series 14 | | | 25,049 | | | | 24,404 | | | | 17,990 | | | | 67,443 | |
The Expense Limitation Agreement is contractual and shall renew automatically for one-year terms unless ING Investments provides written notice of the termination of the Expense Limitation Agreement within 90 days of the end of the then current term.
NOTE 9 — CAPITAL SHARES
Transactions in capital shares and dollars were as follows:
| | | | | | | | | | | | | | | | | | | | | | | | | | | | |
| | | Reinvestment
of distributions | | | Shares
redeemed | | | Net increase
(decrease) in
shares
outstanding | | | | | | Reinvestment
of
distributions | | | Shares
redeemed | | | Net
increase
(decrease) | |
Year or period ended | | # | | | # | | | # | | | | | | ($) | | | ($) | | | ($) | |
Series 5 | | | | | | | | | | | | | | | | | | | | | | | | | | | | |
12-31-10 | | | 38,907 | | | | (527,790 | ) | | | (488,883 | ) | | | | | | | 297,246 | | | | (4,077,415 | ) | | | (3,780,169 | ) |
12-31-09 | | | 96,209 | | | | (492,794 | ) | | | (396,585 | ) | | | | | | | 727,338 | | | | (3,785,219 | ) | | | (3,057,881 | ) |
Series 6 | | | | | | | | | | | | | | | | | | | | | | | | | | | | |
12-31-10 | | | 86,284 | | | | (990,347 | ) | | | (904,063 | ) | | | | | | | 689,409 | | | | (8,027,665 | ) | | | (7,338,256 | ) |
12-31-09 | | | 107,783 | | | | (1,156,904 | ) | | | (1,049,121 | ) | | | | | | | 853,639 | | | | (9,286,163 | ) | | | (8,432,524 | ) |
Series 7 | | | | | | | | | | | | | | | | | | | | | | | | | | | | |
12-31-10 | | | 61,628 | | | | (736,718 | ) | | | (675,090 | ) | | | | | | | 481,929 | | | | (5,826,781 | ) | | | (5,344,852 | ) |
12-31-09 | | | 80,113 | | | | (544,683 | ) | | | (464,570 | ) | | | | | | | 618,472 | | | | (4,276,808 | ) | | | (3,658,336 | ) |
Series 8 | | | | | | | | | | | | | | | | | | | | | | | | | | | | |
12-31-10 | | | 38,452 | | | | (360,947 | ) | | | (322,495 | ) | | | | | | | 301,849 | | | | (2,876,613 | ) | | | (2,574,764 | ) |
12-31-09 | | | 50,417 | | | | (610,137 | ) | | | (559,720 | ) | | | | | | | 388,714 | | | | (4,788,091 | ) | | | (4,399,377 | ) |
Series 9 | | | | | | | | | | | | | | | | | | | | | | | | | | | | |
12-31-10 | | | 30,754 | | | | (309,105 | ) | | | (278,351 | ) | | | | | | | 241,112 | | | | (2,456,982 | ) | | | (2,215,870 | ) |
12-31-09 | | | 39,899 | | | | (283,349 | ) | | | (243,450 | ) | | | | | | | 303,230 | | | | (2,205,691 | ) | | | (1,902,461 | ) |
Series 10 | | | | | | | | | | | | | | | | | | | | | | | | | | | | |
12-31-10 | | | 27,907 | | | | (227,814 | ) | | | (199,907 | ) | | | | | | | 223,531 | | | | (1,854,324 | ) | | | (1,630,793 | ) |
12-31-09 | | | 39,199 | | | | (420,520 | ) | | | (381,321 | ) | | | | | | | 306,136 | | | | (3,381,284 | ) | | | (3,075,148 | ) |
Series 11 | | | | | | | | | | | | | | | | | | | | | | | | | | | | |
12-31-10 | | | 34,767 | | | | (308,138 | ) | | | (273,371 | ) | | | | | | | 273,966 | | | | (2,458,558 | ) | | | (2,184,592 | ) |
12-31-09 | | | 72,594 | | | | (502,269 | ) | | | (429,675 | ) | | | | | | | 553,167 | | | | (3,951,200 | ) | | | (3,398,033 | ) |
Series 12 | | | | | | | | | | | | | | | | | | | | | | | | | | | | |
12-31-10 | | | 59,277 | | | | (511,874 | ) | | | (452,597 | ) | | | | | | | 455,837 | | | | (4,009,472 | ) | | | (3,553,635 | ) |
12-31-09 | | | 86,204 | | | | (670,554 | ) | | | (584,350 | ) | | | | | | | 639,636 | | | | (5,122,404 | ) | | | (4,482,768 | ) |
Series 13 | | | | | | | | | | | | | | | | | | | | | | | | | | | | |
12-31-10 | | | 75,067 | | | | (676,070 | ) | | | (601,003 | ) | | | | | | | 716,888 | | | | (6,566,410 | ) | | | (5,849,522 | ) |
12-31-09 | | | 142,041 | | | | (1,192,867 | ) | | | (1,050,826 | ) | | | | | | | 1,298,259 | | | | (11,355,877 | ) | | | (10,057,618 | ) |
Series 14 | | | | | | | | | | | | | | | | | | | | | | | | | | | | |
12-31-10 | | | 236,680 | | | | (1,619,762 | ) | | | (1,383,082 | ) | | | | | | | 2,345,501 | | | | (16,454,198 | ) | | | (14,108,697 | ) |
12-31-09 | | | 359,380 | | | | (3,855,199 | ) | | | (3,495,819 | ) | | | | | | | 3,453,643 | | | | (38,809,854 | ) | | | (35,356,211 | ) |
43
NOTES TO FINANCIAL STATEMENTSASOF DECEMBER 31, 2010 (CONTINUED)
NOTE 10 — LINE OF CREDIT
The Series, in addition to certain other funds managed by the Investment Adviser, have entered into an unsecured committed revolving line of credit agreement (the “Credit Agreement”) with The Bank of New York Mellon (“BNYM”) for an aggregate amount of 125,000,000. The proceeds may be used to: (1) temporarily finance the purchase or sale of securities; and (2) finance the redemption of shares of an investor in the funds. The funds to which the line of credit is available pay a commitment fee equal to 0.15% per annum on the daily unused portion of the committed line amount payable quarterly in arrears.
Generally, borrowings under the Credit Agreement accrue interest at the federal funds rate plus a specified margin. Repayments generally must be made within 60 days after the date of a revolving credit advance.
The Series did not utilize the line of credit during the year ended December 31, 2010.
NOTE 11 — FEDERAL INCOME TAXES
The amount of distributions from net investment income and net realized capital gains are determined in accordance with federal income tax regulations, which may differ from U.S. generally accepted accounting principles for investment companies. These book/tax differences may be either temporary or permanent. Permanent differences are reclassified within the capital accounts based on their federal tax-basis treatment; temporary differences are not reclassified. Key differences include the treatment of short-term capital gains, foreign currency transactions, and wash sale deferrals. Distributions in excess of net investment income and/or net realized capital gains for tax purposes are reported as return of capital.
The following permanent tax differences have been reclassified as of December 31, 2010:
| | | | | | | | |
| | | Undistributed Net Investment Income | | | Accumulated Net Realized Gains / (Losses) | |
Series 5 | | $ | 30 | | | $ | (30 | ) |
Series 6 | | | 17 | | | | (17 | ) |
Series 7 | | | 39 | | | | (39 | ) |
Series 8 | | | 14 | | | | (14 | ) |
Series 9 | | | 24 | | | | (24 | ) |
Series 10 | | | 6 | | | | (6 | ) |
Series 11 | | | 17 | | | | (17 | ) |
Series 12 | | | 20 | | | | (20 | ) |
Series 13 | | | 50 | | | | (50 | ) |
Dividends paid by the Portfolios from net investment income and distributions of net realized short-term capital gains are, for federal income tax purposes, taxable as ordinary income to shareholders.
The tax composition of dividends and distributions to shareholders was as follows:
| | | | | | | | |
| | | Year Ended December 31, 2010 | | | Year Ended December 31, 2009 | |
| | | Ordinary Income | | | Ordinary Income | |
Series 5 | | $ | 297,246 | | | $ | 727,338 | |
Series 6 | | | 689,409 | | | | 853,639 | |
Series 7 | | | 481,929 | | | | 618,472 | |
Series 8 | | | 301,849 | | | | 388,714 | |
Series 9 | | | 241,112 | | | | 303,230 | |
Series 10 | | | 223,531 | | | | 306,136 | |
Series 11 | | | 273,966 | | | | 553,167 | |
Series 12 | | | 455,837 | | | | 639,636 | |
Series 13 | | | 716,888 | | | | 1,298,259 | |
Series 14 | | | 2,345,501 | | | | 3,453,643 | |
The tax-basis components of distributable earnings and the expiration dates of the capital loss carryforwards which may be used to offset future realized capital gains for federal income tax purposes as of December 31, 2009 were:
| | | | | | | | | | | | | | | | | | | | |
| | | Undistributed Ordinary Income | | | Unrealized Appreciation/ (Depreciation) | | | Post-October Capital Loss Deferred | | | Capital Loss Carryforwards | | | Expiration Dates | |
Series 5 | | $ | 243,407 | | | $ | 611,271 | | | $ | — | | | $ | (3,549,159 | ) | | | 2016 | |
| | | | | | | | | | | | | | | (1,097,405 | ) | | | 2017 | |
| | | | | | | | | | | | | | | | | | | | |
| | | | | | | | | | | | | | $ | (4,646,564 | ) | | | | |
| | | | | | | | | | | | | | | | | | | | |
Series 6 | | | 524,650 | | | | 1,303,110 | | | | — | | | | (6,583,334 | ) | | | 2016 | |
| | | | | | | | | | | | | | | (958,066 | ) | | | 2017 | |
| | | | | | | | | | | | | | | | | | | | |
| | | | | | | | | | | | | | $ | (7,541,400 | ) | | | | |
| | | | | | | | | | | | | | | | | | | | |
Series 7 | | | 387,462 | | | | 889,453 | | | | — | | | | (4,425,407 | ) | | | 2016 | |
| | | | | | | | | | | | | | | (502,019 | ) | | | 2017 | |
| | | | | | | | | | | | | | | | | | | | |
| | | | | | | | | | | | | | $ | (4,927,426 | ) | | | | |
| | | | | | | | | | | | | | | | | | | | |
Series 8 | | | 175,672 | | | | 429,882 | | | | — | | | | (2,837,443 | ) | | | 2016 | |
| | | | | | | | | | | | | | | (346,074 | ) | | | 2017 | |
| | | | | | | | | | | | | | | | | | | | |
| | | | | | | | | | | | | | $ | (3,183,517 | ) | | | | |
| | | | | | | | | | | | | | | | | | | | |
Series 9 | | | 190,317 | | | | 531,948 | | | | — | | | | (2,155,268 | ) | | | 2016 | |
| | | | | | | | | | | | | | | (246,585 | ) | | | 2017 | |
| | | | | | | | | | | | | | | | | | | | |
| | | | | | | | | | | | | | $ | (2,401,853 | ) | | | | |
| | | | | | | | | | | | | | | | | | | | |
Series 10 | | | 169,572 | | | | 313,663 | | | | — | | | | (1,781,536 | ) | | | 2016 | |
| | | | | | | | | | | | | | | (220,542 | ) | | | 2017 | |
| | | | | | | | | | | | | | | | | | | | |
| | | | | | | | | | | | | | $ | (2,002,078 | ) | | | | |
| | | | | | | | | | | | | | | | | | | | |
Series 11 | | | 196,759 | | | | 373,992 | | | | — | | | | (2,287,431 | ) | | | 2016 | |
| | | | | | | | | | | | | | | (52,087 | ) | | | 2017 | |
| | | | | | | | | | | | | | | | | | | | |
| | | | | | | | | | | | | | $ | (2,339,518 | ) | | | | |
| | | | | | | | | | | | | | | | | | | | |
Series 12 | | | 330,079 | | | | 862,759 | | | | — | | | | (5,334,016 | ) | | | 2016 | |
| | | | | | | | | | | | | | | (637,237 | ) | | | 2017 | |
| | | | | | | | | | | | | | | | | | | | |
| | | | | | | | | | | | | | $ | (5,971,253 | ) | | | | |
| | | | | | | | | | | | | | | | | | | | |
Series 13 | | | 504,810 | | | | 1,750,739 | | | | — | | | | (3,534,081 | ) | | | 2016 | |
| | | | | | | | | | | | | | | (24,519 | ) | | | 2017 | |
| | | | | | | | | | | | | | | | | | | | |
| | | | | | | | | | | | | | $ | (3,558,600 | ) | | | | |
| | | | | | | | | | | | | | | | | | | | |
Series 14 | | | 1,505,148 | | | | 3,146,312 | | | | — | | | | (4,279,643 | ) | | | 2016 | |
The Regulated Investment Company Modernization Act of 2010 (the “Act”) was enacted on December 22, 2010. The Act makes changes to several tax rules impacting
44
NOTES TO FINANCIAL STATEMENTSASOF DECEMBER 31, 2010 (CONTINUED)
NOTE 11 — FEDERAL INCOME TAXES (continued)
the Series. In general, the provisions of the Act will be effective for the Series’ fiscal year ending December 31, 2011. Although the Act provides several benefits, including the unlimited carryforward of future capital losses, there may be a greater likelihood that all or a portion of each Series’ pre-enactment capital loss carryforwards may expire without being utilized due to the fact that post-enactment capital losses get utilized before pre-enactment capital loss carryforwards. Relevant information regarding the impact of the Act on the Series if any, will be contained within the Federal Income Taxes section of the notes to financial statements for the fiscal year ending December 31, 2011.
The Portfolios’ major tax jurisdictions are federal and Arizona. The earliest tax year that remains subject to examination by these jurisdictions is 2006.
As of December 31, 2010, no provisions for income tax would be required in the Portfolios' financial statements as a result of tax positions taken on federal and state income tax returns for open tax years. The Portfolios' federal and state income and federal excise tax returns for tax years for which the applicable statutes of limitations have not expired are subject to examination by the Internal Revenue Service and state department of revenue.
NOTE 12 — SUBSEQUENT EVENTS
The Series have evaluated events occurring after the Statements of Assets and Liabilities date (subsequent events) to determine whether any subsequent events necessitated adjustment to or disclosure in the financial statements. No such subsequent events were identified.
45
| | |
| ING GET U.S. CORE PORTFOLIO SERIES 5 | | PORTFOLIO OF INVESTMENTS ASOF DECEMBER 31, 2010 |
| | | | | | | | | | | | | | |
| Shares | | | | | | | Value | | | Percent
of Net
Assets | |
| | |
| | EXCHANGE-TRADED FUNDS: 8.9% | | | | | | | | |
| | | | | | Exchange-Traded Funds: 8.9% | | | | | |
| | 10,500 | | | | | SPDR Trust Series 1 | | $ | 1,320,690 | | | | 8.9 | |
| | | | | | Total Exchange - Traded Funds (Cost $ 862,999) | | | 1,320,690 | | | | 8.9 | |
| | | | | | | | | | | | | | |
Principal
Amount | | | | | | | Value | | | Percent
of Net
Assets | |
| |
| | U.S. GOVERNMENT AGENCY OBLIGATIONS: 71.6% | | | | | |
| | | | | | Federal Home Loan Mortgage Corporation##: 15.8% | | | | | |
| $ | 2,366,000 | | | S, ^, Z | | 0.710%, due 09/15/11 | | $ | 2,353,948 | | | | 15.8 | |
| | | | | | Federal National Mortgage Association##: 18.6% | | | | | |
| | 2,783,000 | | | ^, Z | | 0.660%, due 05/15/11 | | | 2,776,145 | | | | 18.6 | |
| | | | | | Other U.S. Agency Obligations: 37.2% | | | | | |
| | 2,589,000 | | | ^, Z | | Financing Corp., 0.620%, due 10/06/11 | | | 2,576,555 | | | | 37.2 | |
| | 3,000,000 | | | ^, Z | | Tennessee Valley Authority, 0.820%, due 07/15/11 | | | 2,986,710 | | | | | |
| | | | | | | | | 5,563,265 | | | | 37.2 | |
| | | | | | Total U.S. Government Agency Obligations (Cost $10,571,182) | | | 10,693,358 | | | | 71.6 | |
| | | | | | | | | | | | | | |
| | |
| | U.S. TREASURY OBLIGATIONS: 18.2% | | | | | | | | |
| | | | | | U.S. Treasury STRIP COUPON: 18.2% | | | | | |
| | 2,724,000 | | | Z | | 0.210%, due 08/15/11 | | | 2,720,426 | | | | 18.2 | |
| | | | | | Total U.S. Treasury Obligations (Cost $2,689,022) | | | 2,720,426 | | | | 18.2 | |
| | | | | | | | | | | | | | |
| | | | | | Total Long-Term Investments (Cost $14,123,203) | | | 14,734,474 | | | | 98.7 | |
| | | | | | | | | | | | | | |
| | | | | | | | | | | | | | |
| | | | | | | | | | | | | | |
| Shares | | | | | | | Value | | | Percent
of Net
Assets | |
| | |
| | SHORT-TERM INVESTMENTS: 1.4% | | | | | | | | |
| | | | | | Mutual Funds: 1.4% | | | | | | | | |
| | 202,000 | | | | | Blackrock Liquidity Funds TempFund Portfolio - Class I | | $ | 202,000 | | | | 1.4 | |
| | | | | | Total Short-Term Investments (Cost $ 202,000) | | | 202,000 | | | | 1.4 | |
| | | | | | | | | | | | | | |
| | | | | | | | | | | | | | |
| | | | | | Total Investments in Securities (Cost $ 14,325,203) * | | $ | 14,936,474 | | | | 100.1 | |
| | | | | | Other Assets and Liabilities - Net | | | (8,406 | ) | | | (0.1 | ) |
| | | | | | | | | | | | | | |
| | | | | | Net Assets | | $ | 14,928,068 | | | | 100.0 | |
| | | | | | | | | | | | | | |
| STRIP | Separate Trading of Registered Interest and Principal of Securities |
| ## | On September 7, 2008, the Federal Housing Finance Agency placed the Federal National Mortgage Association and the Federal Home Loan Mortgage Corporation into conservatorship and the U.S. Treasury guaranteed the debt issued by those organizations. |
| S | All or a portion of this security has been identified by the Fund to cover future collateral requirements for applicable futures, options, swaps, foreign currency contracts and/or when-issued or delayed-delivery securities. |
| ^ | Interest only securities represent the right to receive the monthly interest payments on an underlying pool of mortgage loans. Principal amount shown represents the notional amount on which current interest is calculated. Payments of principal on the pool reduce the value of the interest only security. |
See Accompanying Notes to Financial Statements
46
| | |
| ING GET U.S. CORE PORTFOLIO SERIES 5 | | PORTFOLIO OF INVESTMENTS ASOF DECEMBER 31, 2010 (CONTINUED) |
| Z | Indicates Zero Coupon Bond; rate shown reflects current effective yield. |
| * | Cost for federal income tax purposes is $14,235,203. |
| | | | |
Net unrealized appreciation consists of: | | | | |
Gross Unrealized Appreciation | | $ | 611,271 | |
Gross Unrealized Depreciation | | | — | |
| | | | |
Net Unrealized Appreciation | | $ | 611,271 | |
| | | | |
Fair Value Measurements^
The following is a summary of the fair valuations according to the inputs used as of December 31, 2010 in valuing the Portfolio's assets and liabilities:
| | | | | | | | | | | | | | | | |
| | | Quoted Prices
in Active Markets for
Identical Investments
(Level 1) | | | Other
Observable
Inputs (Level 2) | | | Significant
Unobservable
Inputs (Level 3) | | | Fair Value at 12/31/2010 | |
Asset Table | | | | | | | | | | | | | | | | |
Investments, at value | | | | | | | | | | | | | | | | |
Exchange-Traded Funds | | $ | 1,320,690 | | | $ | — | | | $ | — | | | $ | 1,320,690 | |
U.S. Government Agency Obligations | | | — | | | | 10,693,358 | | | | — | | | | 10,693,358 | |
U.S. Treasury Obligations | | | — | | | | 2,720,426 | | | | — | | | | 2,720,426 | |
Short-Term Investments | | | 202,000 | | | | — | | | | — | | | | 202,000 | |
| | | | | | | | | | | | | | | | |
Total Investments, at value | | $ | 1,522,690 | | | $ | 13,413,784 | | | $ | — | | | $ | 14,936,474 | |
| | | | | | | | | | | | | | | | |
Other Financial Instruments+: | | | | | | | | | | | | | | | | |
Futures | | | 10,013 | | | | — | | | | — | | | | 10,013 | |
| | | | | | | | | | | | | | | | |
Total Assets | | $ | 1,532,703 | | | $ | 13,413,784 | | | $ | — | | | $ | 14,946,487 | |
| | | | | | | | | | | | | | | | |
| ^ | See Note 2, "Significant Accounting Policies" in the Notes to Financial Statements for additional information. |
| + | Other Financial Instruments are derivatives not reflected in the Summary Portfolio of Investments and may include open forward foreign currency contracts, futures, swaps, and written options. Forward foreign currency contracts and futures are reported at their unrealized gain/loss at measurement date which represents the amount due to/from the Portfolio. Swaps and written options are reported at their market value at measurement date. |
ING GET U.S. Core Portfolio Series 5 Open Futures Contracts on December 31, 2010:
| | | | | | | | | | | | | | | | |
| Contract Description | | Number
of Contracts | | | Expiration Date | | | Notional Value | | | Unrealized
Appreciation | |
Long Contracts | | | | | | | | | | | | | | | | |
S&P 500 E-Mini | | | 5 | | | | 03/18/11 | | | $ | 313,250 | | | $ | 10,013 | |
| | | | | | | | | | | | | | | | |
| | | | | | | | | | $ | 313,250 | | | $ | 10,013 | |
| | | | | | | | | | | | | | | | |
A summary of derivative instruments by primary risk exposure is outlined in the following tables.
The fair value of derivative instruments as of December 31, 2010 was as follows:
| | | | | | | | |
Derivatives not accounted for as hedging
instruments | | Location on Statement of Assets and Liabilities | | | Fair Value | |
Asset Derivatives | | | | | | | | |
Equity contracts | | | Net Assets-Unrealized appreciation* | | | $ | 10,013 | |
| | | | | | | | |
Total Asset Derivatives | | | | | | $ | 10,013 | |
| | | | | | | | |
| * | Includes cumulative appreciation/depreciation of futures contracts as reported in the table following the Portfolio of Investments. |
See Accompanying Notes to Financial Statements
47
| | |
| ING GET U.S. CORE PORTFOLIO SERIES 5 | | PORTFOLIO OF INVESTMENTS ASOF DECEMBER 31, 2010 (CONTINUED) |
The effect of derivative instruments on the Portfolio's Statement of Operations for the year ended December 31, 2010 was as follows:
| | | | |
| | | Amount of Realized Gain or (Loss) on Derivatives Recognized in Income | |
| |
Derivatives not accounted for as hedging instruments | | Futures | |
Equity contracts | | | $30,719 | |
| | | | |
Total | | | $30,719 | |
| | | | |
| |
| | | Change in Unrealized Appreciation or (Depreciation) on Derivatives Recognized in Income | |
Derivatives not accounted for as hedging instruments | | Futures | |
Equity contracts | | $ | 9,511 | |
| | | | |
Total | | $ | 9,511 | |
| | | | |
See Accompanying Notes to Financial Statements
48
| | |
| ING GET U.S. CORE PORTFOLIO SERIES 6 | | PORTFOLIO OF INVESTMENTS ASOF DECEMBER 31, 2010 |
| | | | | | | | | | | | | | | | |
| Shares | | | | | | | | Value | | | Percent
of Net
Assets | |
| | | | | | | | | | | | | | | | |
| | |
| | EXCHANGE-TRADED FUNDS: 8.0% | | | | | | | | |
| | | | | | | | Exchange-Traded Funds: 8.0% | |
| | 18,300 | | | | | | | SPDR Trust Series 1 | | $ | 2,301,774 | | | | 8.0 | |
| | | | | | | | Total Exchange-Traded Funds (Cost $1,504,084) | | | 2,301,774 | | | | 8.0 | |
| | | | | | | | | | | | | | | | |
| | | | | | | | | | | | | | | | |
Principal
Amount | | | | | | | | Value | | | Percent
of Net
Assets | |
| | | | | | | | | | | | | | | | |
| |
| | U.S. GOVERNMENT AGENCY OBLIGATIONS: 71.0% | | | | | |
| | | | | | | | Federal Home Loan Mortgage Corporation##: 19.6% | |
| $ | 5,664,000 | | | | ^^, Z | | | 0.730%, due 09/15/11 | | $ | 5,634,983 | | | | 19.6 | |
| | | | | | | | | | | | | | | | |
| | | | | | | | Federal National Mortgage Association##: 18.5% | |
| | 2,500,000 | | | | ^, Z | | | 0.720%, due 11/15/11 | | | 2,484,105 | | | | 18.5 | |
| | 2,840,000 | | | | ^, Z | | | 0.850%, due 02/12/12 | | | 2,812,818 | | | | | |
| | | | | | | | | | | 5,296,923 | | | | 18.5 | |
| | | | | | | | Other U.S. Agency Obligations: 32.9% | |
| | 2,638,000 | | | | ^, Z | | | Financing Corp., 0.640%, due 12/06/11 | | | 2,622,202 | | | | 32.9 | |
| | 1,666,000 | | | | ^, Z | | | Financing Corp., 0.650%, due 11/30/11 | | | 1,656,044 | | | | | |
| | 5,169,000 | | | | ^, Z | | | Resolution Funding Corp., 0.360%, due 10/15/11 | | | 5,154,377 | | | | | |
| | | | | | | | | | | 9,432,623 | | | | 32.9 | |
| | | | | | | | Total U.S. Government Agency Obligations (Cost $20,000,649) | | | 20,364,529 | | | | 71.0 | |
| | | | | | | | | | | | | | | | |
| | |
| | U.S. TREASURY OBLIGATIONS: 20.4% | | | | | | | | |
| | | | | | | | U.S. Treasury STRIP COUPON: 20.4% | |
| | 5,886,000 | | | | Z | | | 0.350%, due 02/15/12 | | | 5,862,797 | | | | 20.4 | |
| | | | | | | | Total U.S. Treasury Obligations (Cost $5,721,257) | | | 5,862,797 | | | | 20.4 | |
| | | | | | | | | | | | | | | | |
| | | | | | | | Total Long-Term Investments (Cost $27,225,990) | | | 28,529,100 | | | | 99.4 | |
| | | | | | | | | | | | | | | | |
| | | | | | | | | | | | | | | | |
| | | | | | | | | | | | | | | | |
Shares | | | | | | | | Value | | | Percent
of Net
Assets | |
| | | | | | | | | | | | | | | | |
| |
| | SHORT-TERM INVESTMENTS: 0.9% | | | | | |
| | | | | | | | Mutual Funds: 0.9% | | | | | |
| | 255,000 | | | | | | | Blackrock Liquidity Funds TempFund Portfolio - Class I | | $ | 255,000 | | | | 0.9 | |
| | | | | | | | Total Short-Term Investments
(Cost $255,000) | | | 255,000 | | | | 0.9 | |
| | | | | | | | | | | | | | | | |
| | | | | | | | Total Investments in Securities
(Cost $27,480,990) * | | $ | 28,784,100 | | | | 100.3 | |
| | | | | | | | Other Assets and Liabilities - Net | | | (89,574 | ) | | | (0.3 | ) |
| | | | | | | | | | | | | | | | |
| | | | | | | | Net Assets | | $ | 28,694,526 | | | | 100.0 | |
| | | | | | | | | | | | | | | | |
| STRIP | Separate Trading of Registered Interest and Principal of Securities |
| ## | On September 7, 2008, the Federal Housing Finance Agency placed the Federal National Mortgage Association and the Federal Home Loan Mortgage Corporation into conservatorship and the U.S. Treasury guaranteed the debt issued by those organizations. |
| ^ | Interest only securities represent the right to receive the monthly interest payments on an underlying pool of mortgage loans. Principal amount shown represents the notional amount on which current interest is calculated. Payments of principal on the pool reduce the value of the interest only security. |
See Accompanying Notes to Financial Statements
49
| | |
| ING GET U.S. CORE PORTFOLIO SERIES 6 | | PORTFOLIO OF INVESTMENTS ASOF DECEMBER 31, 2010 (CONTINUED) |
| ^^ | Principal only securities represent the right to receive the monthly principal payments on an underlying pool of mortgage loans. No payments of interest on the pool are passed through the principal only security. |
| Z | Indicates Zero Coupon Bond; rate shown reflects current effective yield. |
| * | Cost for federal income tax purposes is $27,480,990. |
| | | | |
Net unrealized appreciation consists of: | | | | |
Gross Unrealized Appreciation | | $ | 1,303,110 | |
Gross Unrealized Depreciation | | | — | |
| | | | |
Net Unrealized Appreciation | | $ | 1,303,110 | |
| | | | |
Fair Value Measurements^
The following is a summary of the fair valuations according to the inputs used as of December 31, 2010 in valuing the Portfolio's assets and liabilities:
| | | | | | | | | | | | | | | | |
| | | Quoted Prices
in Active Markets
for Identical Investments
(Level 1) | | | Other
Observable
Inputs
(Level 2) | | | Significant
Unobservable
Inputs
(Level 3) | | | Fair Value
at
12/31/2010 | |
Asset Table | | | | | | | | | | | | | | | | |
Investments, at value | | | | | | | | | | | | | | | | |
Exchange-Traded Funds | | $ | 2,301,774 | | | $ | — | | | $ | — | | | $ | 2,301,774 | |
U.S. Government Agency Obligations | | | — | | | | 20,364,529 | | | | — | | | | 20,364,529 | |
U.S. Treasury Obligations | | | — | | | | 5,862,797 | | | | — | | | | 5,862,797 | |
Short-Term Investments | | | 255,000 | | | | — | | | | — | | | | 255,000 | |
| | | | | | | | | | | | | | | | |
Total Investments, at value | | $ | 2,556,774 | | | $ | 26,227,326 | | | $ | — | | | $ | 28,784,100 | |
| | | | | | | | | | | | | | | | |
| ^ | See Note 2, "Significant Accounting Policies" in the Notes to Financial Statements for additional information. |
See Accompanying Notes to Financial Statements
50
| | |
| ING GET U.S. CORE PORTFOLIO SERIES 7 | | PORTFOLIO OF INVESTMENTS ASOF DECEMBER 31, 2010 |
| | | | | | | | | | | | | | | | |
| Shares | | | | | | | | Value | | | Percent
of Net
Assets | |
| | | | | | | | | | | | | | | | |
| | | | | | | | | | | | | | | | |
| |
| | EXCHANGE-TRADED FUNDS: 5.9% | | | | | |
| | | | | | | | Exchange-Traded Funds: 5.9% | | | | | |
| | 9,400 | | | | | | | SPDR Trust Series 1 | | $ | 1,182,332 | | | | 5.9 | |
| | | | | | | | Total Exchange-Traded Funds
(Cost $772,590) | | | 1,182,332 | | | | 5.9 | |
| | | | | | | | | | | | | | | | |
| | | | | | | | | | | | | | | | |
Principal
Amount | | | | | | | | Value | | | Percent
of Net
Assets | |
| | | | | | | | | | | | | | | | |
| | | | | | | | | | | | | | | | |
| |
| | U.S. GOVERNMENT AGENCY OBLIGATIONS: 53.9% | | | | | |
| | | | | | | | Federal Home Loan Mortgage Corporation##: 14.9% | | | | | |
| $ | 3,000,000 | | | | ^, Z | | | 0.970%, due 07/15/12 | | $ | 2,955,063 | | | | 14.9 | |
| | | | | | | | | | | | | | | | |
| | | | | | | | Federal National Mortgage Association##: 24.0% | | | | | |
| | 4,838,000 | | | | Z | | | 0.870%, due 03/15/12 | | | 4,786,935 | | | | 24.0 | |
| | | | | | | | | | | | | | | | |
| | | | | | | | Other U.S. Agency Obligations: 15.0% | | | | | |
| | 3,000,000 | | | | ^, Z | | | Resolution Funding Corp., 0.360%, due 10/15/11 | | | 2,991,513 | | | | 15.0 | |
| | | | | | | | Total U.S. Government Agency Obligations (Cost $10,532,290) | | | 10,733,511 | | | | 53.9 | |
| | | | | | | | | | | | | | | | |
| |
| | U.S. TREASURY OBLIGATIONS: 23.0% | | | | | |
| | | | | | | | U.S. Treasury STRIP COUPON: 23.0% | | | | | |
| | 4,589,000 | | | | Z | | | 0.350%, due 02/15/12 | | | 4,570,910 | | | | 23.0 | |
| | | | | | | | Total U.S. Treasury Obligations
(Cost $4,457,696) | | | 4,570,910 | | | | 23.0 | |
| | | | | | | | | | | | | | | | |
| | |
| | OTHER BONDS: 16.4% | | | | | | | | |
| | | | | | | | Foreign Government Bonds: 16.4% | | | | | |
| | 3,300,000 | | | | Z | | | Israel Government International Bond, 0.670%, due 05/15/12 | | | 3,269,792 | | | | 16.4 | |
| | | | | | | | Total Other Bonds (Cost $3,104,516 ) | | | 3,269,792 | | | | 16.4 | |
| | | | | | | | | | | | | | | | |
| | | | | | | | | | | | | | | | |
| | | | | | | | Total Long-Term Investments
(Cost $18,867,092) | | | 19,756,545 | | | | 99.2 | |
| | | | | | | | | | | | | | | | |
See Accompanying Notes to Financial Statements
51
| | |
| ING GET U.S. CORE PORTFOLIO SERIES 7 | | PORTFOLIO OF INVESTMENTS ASOF DECEMBER 31, 2010 (CONTINUED) |
| | | | | | | | | | | | | | | | |
| Shares | | | | | | | | Value | | | Percent
of Net
Assets | |
| | | | | | | | | | | | | | | | |
| | | | | | | | | | | | | | | | |
| | |
| | SHORT-TERM INVESTMENTS: 1.0% | | | | | | | | |
| | | | | | | | Mutual Funds: 1.0% | | | | | |
| | 203,000 | | | | | | | Blackrock Liquidity Funds TempFund Portfolio - Class I | | $ | 203,000 | | | | 1.0 | |
| | | | | | | | Total Short-Term Investments (Cost $203,000) | | | 203,000 | | | | 1.0 | |
| | | | | | | | | | | | | | | | |
| | | | | | | | | | | | | | | | |
| | | | | | | | Total Investments in Securities (Cost $19,070,092) * | | $ | 19,959,545 | | | | 100.2 | |
| | | | | | | | Other Assets and Liabilities - Net | | | (39,502 | ) | | | (0.2 | ) |
| | | | | | | | | | | | | | | | |
| | | | | | | | Net Assets | | $ | 19,920,043 | | | | 100.0 | |
| | | | | | | | | | | | | | | | |
| STRIP | Separate Trading of Registered Interest and Principal of Securities |
| ## | On September 7, 2008, the Federal Housing Finance Agency placed the Federal National Mortgage Association and the Federal Home Loan Mortgage Corporation into conservatorship and the U.S. Treasury guaranteed the debt issued by those organizations. |
| ^ | Interest only securities represent the right to receive the monthly interest payments on an underlying pool of mortgage loans. Principal amount shown represents the notional amount on which current interest is calculated. Payments of principal on the pool reduce the value of the interest only security. |
| Z | Indicates Zero Coupon Bond; rate shown reflects current effective yield. |
| * | Cost for federal income tax purposes is $19,070,092. |
| | | | |
| Net unrealized appreciation consists of: | | | | |
Gross Unrealized Appreciation | | $ | 889,453 | |
Gross Unrealized Depreciation | | | — | |
| | | | |
Net Unrealized Appreciation | | $ | 889,453 | |
| | | | |
Fair Value Measurements^
The following is a summary of the fair valuations according to the inputs used as of December 31, 2010 in valuing the Portfolio's assets and liabilities:
| | | | | | | | | | | | | | | | |
| | | Quoted Prices
in Active Markets for Identical Investments
(Level 1) | | | Other
Observable
Inputs (Level 2) | | | Significant
Unobservable
Inputs (Level 3) | | | Fair Value at 12/31/2010 | |
Asset Table | | | | | | | | | | | | | | | | |
Investments, at value | | | | | | | | | | | | | | | | |
Exchange-Traded Funds | | $ | 1,182,332 | | | $ | — | | | $ | — | | | $ | 1,182,332 | |
U.S. Government Agency Obligations | | | — | | | | 10,733,511 | | | | — | | | | 10,733,511 | |
U.S. Treasury Obligations | | | — | | | | 4,570,910 | | | | — | | | | 4,570,910 | |
Other Bonds | | | — | | | | 3,269,792 | | | | — | | | | 3,269,792 | |
Short-Term Investments | | | 203,000 | | | | — | | | | — | | | | 203,000 | |
| | | | | | | | | | | | | | | | |
Total Investments, at value | | $ | 1,385,332 | | | $ | 18,574,213 | | | $ | — | | | $ | 19,959,545 | |
| | | | | | | | | | | | | | | | |
| ^ | See Note 2, "Significant Accounting Policies" in the Notes to Financial Statements for additional information. |
See Accompanying Notes to Financial Statements
52
| | |
| ING GET U.S. CORE PORTFOLIO SERIES 8 | | PORTFOLIO OF INVESTMENTS ASOF DECEMBER 31, 2010 |
| | | | | | | | | | | | | | | | |
| Shares | | | | | | | | Value | | | Percent of Net Assets | |
| | | | | | | | | | | | | | | | |
| | |
| | EXCHANGE-TRADED FUNDS: 4.7% | | | | | | | | |
| | | | | | | | Exchange-Traded Funds: 4.7% | | | | | |
| | 4,600 | | | | | | | SPDR Trust Series 1 | | $ | 578,588 | | | | 4.7 | |
| | | | | | | | Total Exchange-Traded Funds
(Cost $378,076) | | | 578,588 | | | | 4.7 | |
| | | | | | | | | | | | | | | | |
| | | | | | | | | | | | | | | | |
Principal
Amount | | | | | | | | Value | | | Percent
of Net
Assets | |
| |
| | U.S. GOVERNMENT AGENCY OBLIGATIONS: 76.2% | | | | | |
| | | | | | | | Federal Home Loan Mortgage Corporation##: 18.6% | | | | | |
| $ | 2,325,000 | | | | ^, Z | | | 0.860%, due 03/15/12 | | $ | 2,300,873 | | | | 18.6 | |
| | | | | | | | Federal National Mortgage Association##: 19.1% | | | | | |
| | 2,400,000 | | | | Z | | | 0.870%, due 03/15/12 | | | 2,374,668 | | | | 19.1 | |
| | | | | | | | Other U.S. Agency Obligations: 38.5% | | | | | |
| | 2,368,000 | | | | ^, Z | | | Financing Corp., 0.680%, due 03/26/12 | | | 2,348,136 | | | | 38.5 | |
| | 2,455,000 | | | | Z | | | Resolution Funding Corp., 0.670%, due 04/15/12 | | | 2,433,580 | | | | | |
| | | | | | | | | | | 4,781,716 | | | | 38.5 | |
| | | | | | | | Total U.S. Government Agency Obligations
(Cost $9,241,743) | | | 9,457,257 | | | | 76.2 | |
| | | | | | | | | | | | | | | | |
| | | | | | | | | | | | | | | | |
| |
| | U.S. TREASURY OBLIGATIONS: 18.0% | | | | | |
| | | | | | | | U.S. Treasury STRIP COUPON: 18.0% | | | | | |
| | 2,253,000 | | | | Z | | | 0.520%, due 08/15/12 | | | 2,234,018 | | | | 18.0 | |
| | | | | | | | Total U.S. Treasury Obligations
(Cost $2,220,162) | | | 2,234,018 | | | | 18.0 | |
| | | | | | | | | | | | | | | | |
| | | | | | | | Total Long-Term Investments
(Cost $11,839,981) | | | 12,269,863 | | | | 98.9 | |
| | | | | | | | | | | | | | | | |
| | | | | | | | | | | | | | | | |
| | | | | | | | | | | | | | | | |
| Shares | | | | | | | | Value | | | Percent
of Net
Assets | |
| | | | | | | | | | | | | | | | |
| |
| | SHORT-TERM INVESTMENTS: 1.6% | | | | | |
| | | | | | | | Mutual Funds: 1.6% | | | | | |
| | 198,000 | | | | | | | Blackrock Liquidity Funds TempFund Portfolio - Class I | | $ | 198,000 | | | | 1.6 | |
| | | | | | | | Total Short-Term Investments
(Cost $198,000) | | | 198,000 | | | | 1.6 | |
| | | | | | | | | | | | | | | | |
| | | | | | | | Total Investments in Securities
(Cost $12,037,981)* | | $ | 12,467,863 | | | | 100.5 | |
| | | | | | | | Other Assets and Liabilities - Net | | | (55,900 | ) | | | (0.5 | ) |
| | | | | | | | | | | | | | | | |
| | | | | | | | Net Assets | | $ | 12,411,963 | | | | 100.0 | |
| | | | | | | | | | | | | | | | |
| STRIP | Separate Trading of Registered Interest and Principal of Securities |
| ## | On September 7, 2008, the Federal Housing Finance Agency placed the Federal National Mortgage Association and the Federal Home Loan Mortgage Corporation into conservatorship and the U.S. Treasury guaranteed the debt issued by those organizations. |
See Accompanying Notes to Financial Statements
53
| | |
| ING GET U.S. CORE PORTFOLIO SERIES 8 | | PORTFOLIO OF INVESTMENTS ASOF DECEMBER 31, 2010 (CONTINUED) |
| ^ | Interest only securities represent the right to receive the monthly interest payments on an underlying pool of mortgage loans. Principal amount shown represents the notional amount on which current interest is calculated. Payments of principal on the pool reduce the value of the interest only security. |
| Z | Indicates Zero Coupon Bond; rate shown reflects current effective yield. |
| * | Cost for federal income tax purposes is $12,037,981. |
| | | | |
Net unrealized appreciation consists of: | | | | |
Gross Unrealized Appreciation | | $ | 429,882 | |
Gross Unrealized Depreciation | | | — | |
| | | | |
Net Unrealized Appreciation | | $ | 429,882 | |
| | | | |
Fair Value Measurements^
The following is a summary of the fair valuations according to the inputs used as of December 31, 2010 in valuing the Portfolio's assets and liabilities:
| | | | | | | | | | | | | | | | |
| | | Quoted Prices
in Active Markets for
Identical Investments
(Level 1) | | | Other
Observable
Inputs
(Level 2) | | | Significant
Unobservable
Inputs
(Level 3) | | | Fair Value
at
12/31/2010 | |
Asset Table | | | | | | | | | | | | | | | | |
Investments, at value | | | | | | | | | | | | | | | | |
Exchange-Traded Funds | | $ | 578,588 | | | $ | — | | | $ | — | | | $ | 578,588 | |
U.S. Government Agency Obligations | | | — | | | | 9,457,257 | | | | — | | | | 9,457,257 | |
U.S. Treasury Obligations | | | — | | | | 2,234,018 | | | | — | | | | 2,234,018 | |
Short-Term Investments | | | 198,000 | | | | — | | | | — | | | | 198,000 | |
| | | | | | | | | | | | | | | | |
Total Investments, at value | | $ | 776,588 | | | $ | 11,691,275 | | | $ | — | | | $ | 12,467,863 | |
| | | | | | | | | | | | | | | | |
| ^ | See Note 2, "Significant Accounting Policies" in the Notes to Financial Statements for additional information. |
See Accompanying Notes to Financial Statements
54
| | |
| ING GET U.S. CORE PORTFOLIO SERIES 9 | | PORTFOLIO OF INVESTMENTS ASOF DECEMBER 31, 2010 |
| | | | | | | | | | | | | | | | |
| Shares | | | | | | | | Value | | | Percent
of Net
Assets | |
| | | | | | | | | | | | | | | | |
|
| | EXCHANGE-TRADED FUNDS: 6.8% | |
| | | | | | | | Exchange-Traded Funds: 6.8% | |
| | 5,700 | | | | | | | SPDR Trust Series 1 | | $ | 716,946 | | | | 6.8 | |
| | | | | | | | Total Exchange -Traded Funds
(Cost $468,485) | | | 716,946 | | | | 6.8 | |
| | | | | | | | | | | | | | | | |
| | | | | | | | | | | | | | | | |
Principal
Amount | | | | | | | | Value | | | Percent
of Net
Assets | |
|
| | U.S. GOVERNMENT AGENCY OBLIGATIONS: 79.3% | |
| | | | | | | | Federal Home Loan Mortgage Corporation##: 20.5% | |
| $ | 2,205,000 | | | | Z | | | 1.050%, due 09/15/12 | | $ | 2,165,707 | | | | 20.5 | |
| | | | | | | | Federal National Mortgage Association##: 20.7% | |
| | 2,212,000 | | | | ^,Z | | | 0.970%, due 07/15/12 | | | 2,178,882 | | | | 20.7 | |
| | | | | | | | Other U.S. Agency Obligations: 38.1% | |
| | 2,200,000 | | | | ^,Z | | | Financing Corp., 0.900%, due 10/06/12 | | | 2,165,158 | | | | 38.1 | |
| | 1,875,000 | | | | ^,Z | | | Resolution Funding Corp.,
0.800%, due 07/15/12 | | | 1,852,279 | | | | | |
| | | | | | | | | | | 4,017,437 | | | | 38.1 | |
| | | | | | | | Total U.S. Government Agency Obligations (Cost $8,122,429) | | | 8,362,026 | | | | 79.3 | |
| | | | | | | | | | | | | | | | |
| | | | | | | | | | | | | | | | |
|
| | U.S. TREASURY OBLIGATIONS: 12.7% | |
| | | | | | | | U.S. Treasury STRIP COUPON: 12.7% | |
| | 1,355,000 | | | | Z | | | 0.520%, due 08/15/12 | | | 1,343,584 | | | | 12.7 | |
| | | | | | | | Total U.S. Treasury Obligations
(Cost $1,296,318) | | | 1,343,584 | | | | 12.7 | |
| | | | | | | | | | | | | | | | |
| | | | | | | | | | | | | | | | |
| | | | | | | | Total Long-Term Investments
(Cost $9,887,232) | | | 10,422,556 | | | | 98.8 | |
| | | | | | | | | | | | | | | | |
| | | | | | | | | | | | | | |
Shares | | | | | | | Value | | | Percent
of Net
Assets | |
|
| | SHORT-TERM INVESTMENTS: 1.4% | |
| | | | | | Mutual Funds: 1. 4% | | | | | | | | |
| | 143,000 | | | | | Blackrock Liquidity Funds TempFund Portfolio - Class I | | $ | 143,000 | | | | 1.4 | |
| | | | | | Total Short-Term Investments (Cost $143,000) | | | 143,000 | | | | 1.4 | |
| | | | | | | | | | | | | | |
| | | | | | Total Investments in Securities (Cost $10,030,232)* | | $ | 10,565,556 | | | | 100.2 | |
| | | | | | Other Assets and Liabilities - Net | | | (20,291 | ) | | | (0.2 | ) |
| | | | | | | | | | | | | | |
| | | | | | Net Assets | | $ | 10,545,265 | | | | 100.0 | |
| | | | | | | | | | | | | | |
| STRIP | Separate Trading of Registered Interest and Principal of Securities |
| ## | On September 7, 2008, the Federal Housing Finance Agency placed the Federal National Mortgage Association and the Federal Home Loan Mortgage Corporation into conservatorship and the U.S. Treasury guaranteed the debt issued by those organizations. |
| ^ | Interest only securities represent the right to receive the monthly interest payments on an underlying pool of mortgage loans. Principal amount shown represents the notional amount on which current interest is calculated. Payments of principal on the pool reduce the value of the interest only security. |
| Z | Indicates Zero Coupon Bond; rate shown reflects current effective yield. |
See Accompanying Notes to Financial Statements
55
| | |
| ING GET U.S. CORE PORTFOLIO SERIES 9 | | PORTFOLIO OF INVESTMENTS ASOF DECEMBER 31, 2010 (CONTINUED) |
| * | Cost for federal income tax purposes is $10,033,608. |
| | | | |
Net unrealized appreciation consists of: | | | | |
Gross Unrealized Appreciation | | $ | 531,948 | |
Gross Unrealized Depreciation | | | — | |
| | | | |
Net Unrealized Appreciation | | $ | 531,948 | |
| | | | |
Fair Value Measurements^
The following is a summary of the fair valuations according to the inputs used as of December 31, 2010 in valuing the Portfolio's assets and liabilities:
| | | | | | | | | | | | | | | | |
| | | Quoted Prices in Active Markets
for Identical Investments
(Level 1) | | | Other
Observable
Inputs
(Level 2) | | | Significant
Unobservable
Inputs
(Level 3) | | | Fair Value at
12/31/2010 | |
Asset Table | | | | | | | | | | | | | | | | |
Investments, at value | | | | | | | | | | | | | | | | |
Exchange-Traded Funds | | $ | 716,946 | | | $ | — | | | $ | — | | | $ | 716,946 | |
U.S. Government Agency Obligations | | | — | | | | 8,362,026 | | | | — | | | | 8,362,026 | |
U.S. Treasury Obligations | | | — | | | | 1,343,584 | | | | — | | | | 1,343,584 | |
Short-Term Investments | | | 143,000 | | | | — | | | | — | | | | 143,000 | |
| | | | | | | | | | | | | | | | |
Total Investments, at value | | $ | 859,946 | | | $ | 9,705,610 | | | $ | — | | | $ | 10,565,556 | |
| | | | | | | | | | | | | | | | |
| ^ | See Note 2, "Significant Accounting Policies" in the Notes to Financial Statements for additional information. |
See Accompanying Notes to Financial Statements
56
| | |
| ING GET U.S. CORE PORTFOLIO SERIES 10 | | PORTFOLIO OF INVESTMENTS ASOF DECEMBER 31, 2010 |
| | | | | | | | | | | | | | | | |
Principal
Amount | | | | | | | | Value | | | Percent
of Net
Assets | |
| | | | | | | | | | | | | | | | |
|
| | U.S. GOVERNMENT AGENCY OBLIGATIONS: 79.6% | |
| | | | | | | | Federal Home Loan Mortgage Corporation##: 21.5% | |
| $ | 1,681,000 | | | | ^, Z | | | 1.190%, due 01/15/13 | | $ | 1,640,915 | | | | 21.5 | |
| | | | | | | | | | | | | | | | |
| | | | | | | | Federal National Mortgage Association##: 22.4% | |
| | 1,747,000 | | | | ^, Z | | | 1.190%, due 01/15/13 | | | 1,705,357 | | | | 22.4 | |
| | | | | | | | | | | | | | | | |
| | | | | | | | Other U.S. Agency Obligations: 35.7% | |
| | 1,100,000 | | | | ^, Z | | | Financing Corp., 0.900%, due 10/06/12 | | | 1,082,579 | | | | 35.7 | |
| | 1,675,000 | | | | Z | | | Resolution Funding Corp., 0.990%, due 01/15/13 | | | 1,641,353 | | | | | |
| | | | | | | | | | | 2,723,932 | | | | 35.7 | |
| | | | | | | | Total U.S. Government Agency Obligations (Cost $ 5,780,787) | | | 6,070,204 | | | | 79.6 | |
| | | | | | | | | | | | | | | | |
| | | | | | | | | | | | | | | | |
| |
| | U.S. TREASURY OBLIGATIONS: 18.6% | | | | | |
| | | | | | | | U.S. Treasury STRIP PRINCIPAL: 18.6% | |
| | 1,428,000 | | | | ^^, Z | | | 0.510%, due 11/15/12 | | | 1,414,395 | | | | 18.6 | |
| | | | | | | | | | | | | | | | |
| | | | | | | | Total U.S. Treasury Obligations (Cost $ 1,390,149) | | | 1,414,395 | | | | 18.6 | |
| | | | | | | | | | | | | | | | |
| | | | | | | | Total Long-Term Investments (Cost $ 7,170,936) | | | 7,484,599 | | | | 98.2 | |
| | | | | | | | | | | | | | | | |
| | | | | | | | | | | | | | | | |
| | | | | | | | | | | | | | | | |
| Shares | | | | | | | | Value | | | Percent
of Net
Assets | |
| | | | | | | | | | | | | | | | |
| | |
| | SHORT-TERM INVESTMENTS: 2.0% | | | | | | | | |
| | | | | | | | Mutual Funds: 2.0% | | | | | | | | |
| | 155,000 | | | | | | | Blackrock Liquidity Funds TempFund Portfolio - Class I | | $ | 155,000 | | | | 2.0 | |
| | | | | | | | Total Short-Term Investments (Cost $155,000) | | | 155,000 | | | | 2.0 | |
| | | | | | | | | | | | | | | | |
| | | | | | | | Total Investments in Securities (Cost $7,325,936)* | | $ | 7,639,599 | | | | 100.2 | |
| | | | | | | | Other Assets and Liabilities - Net | | | (17,914 | ) | | | (0.2 | ) |
| | | | | | | | | | | | | | | | |
| | | | | | | | Net Assets | | $ | 7,621,685 | | | | 100.0 | |
| | | | | | | | | | | | | | | | |
| STRIP | Separate Trading of Registered Interest and Principal of Securities |
| ## | On September 7, 2008, the Federal Housing Finance Agency placed the Federal National Mortgage Association and the Federal Home Loan Mortgage Corporation into conservatorship and the U.S. Treasury guaranteed the debt issued by those organizations. |
| ^ | Interest only securities represent the right to receive the monthly interest payments on an underlying pool of mortgage loans. Principal amount shown represents the notional amount on which current interest is calculated. Payments of principal on the pool reduce the value of the interest only security. |
| ^^ | Principal only securities represent the right to receive the monthly principal payments on an underlying pool of mortgage loans. No payments of interest on the pool are passed through the principal only security. |
| Z | Indicates Zero Coupon Bond; rate shown reflects current effective yield. |
See Accompanying Notes to Financial Statements
57
| | |
| ING GET U.S. CORE PORTFOLIO SERIES 10 | | PORTFOLIO OF INVESTMENTS ASOF DECEMBER 31, 2010 (CONTINUED) |
| * | Cost for federal income tax purposes is $7,325,936. |
| | | | |
Net unrealized appreciation consists of: | | | | |
Gross Unrealized Appreciation | | $ | 313,663 | |
Gross Unrealized Depreciation | | | — | |
| | | | |
Net Unrealized Appreciation | | $ | 313,663 | |
| | | | |
Fair Value Measurements^
The following is a summary of the fair valuations according to the inputs used as of December 31, 2010 in valuing the Portfolio's assets and liabilities:
| | | | | | | | | | | | | | | | |
| | | Quoted Prices
in Active Markets
for Identical Investments (Level 1) | | | Other
Observable
Inputs
(Level 2) | | | Significant
Unobservable
Inputs (Level 3) | | | Fair Value
at
12/31/2010 | |
Asset Table | | | | | | | | | | | | | | | | |
Investments, at value | | | | | | | | | | | | | | | | |
U.S. Government Agency Obligations | | $ | — | | | $ | 6,070,204 | | | $ | — | | | $ | 6,070,204 | |
U.S. Treasury Obligations | | | — | | | | 1,414,395 | | | | — | | | | 1,414,395 | |
Short-Term Investments | | | 155,000 | | | | — | | | | — | | | | 155,000 | |
| | | | | | | | | | | | | | | | |
Total Investments, at value | | $ | 155,000 | | | $ | 7,484,599 | | | $ | — | | | $ | 7,639,599 | |
| | | | | | | | | | | | | | | | |
| ^ | See Note 2, "Significant Accounting Policies" in the Notes to Financial Statements for additional information. |
See Accompanying Notes to Financial Statements
58
| | |
| ING GET U.S. CORE PORTFOLIO SERIES 11 | | PORTFOLIO OF INVESTMENTS ASOF DECEMBER 31, 2010 |
| | | | | | | | | | | | | | | | |
Principal
Amount | | | | | | | | Value | | | Percent
of Net
Assets | |
| | | | | | | | | | | | | | | | |
| |
| | U.S. GOVERNMENT AGENCY OBLIGATIONS: 84.5% | | | | | |
| | | | | | | | Federal Home Loan Mortgage Corporation##: 21.4% | |
| | $2,206,000 | | | | ^, Z | | | 1.190%, due 01/15/13 | | $ | 2,153,396 | | | | 21.4 | |
| | | | | | | | | | | | | | | | |
| | | | | | | | Federal National Mortgage Association##: 21.3% | |
| | 2,200,000 | | | | ^^, Z | | | 1.140%, due 02/21/13 | | | 2,147,308 | | | | 21.3 | |
| | | | | | | | | | | | | | | | |
| | | | | | | | Other U.S. Agency Obligations: 41.8% | |
| | 603,000 | | | | Z | | | Financing Corp., 1.150%, due 05/11/13 | | | 586,832 | | | | 41.8 | |
| | 1,533,000 | | | | ^, Z | | | Financing Corp., 1.270%, due 09/26/13 | | | 1,480,735 | | | | | |
| | 1,773,000 | | | | Z | | | Resolution Funding Corp., 0.990%, due 01/15/13 | | | 1,737,384 | | | | | |
| | 419,000 | | | | ^, Z | | | Resolution Funding Corp., 1.100%, due 04/15/13 | | | 408,552 | | | | | |
| | | | | | | | | | | 4,213,503 | | | | 41.8 | |
| | | | | | | | Total U.S. Government Agency Obligations (Cost $8,184,903) | | | 8,514,207 | | | | 84.5 | |
| | | | | | | | | | | | | | | | |
| |
| | U.S. TREASURY OBLIGATIONS: 14.8% | | | | | |
| | | | | | | | U.S. Treasury STRIP COUPON: 14.8% | |
| | 1,515,000 | | | | Z | | | 0.720%, due 02/15/13 | | | 1,492,127 | | | | 14.8 | |
| | | | | | | | Total U.S. Treasury Obligations
(Cost $1,444,623) | | | 1,492,127 | | | | 14.8 | |
| | | | | | | | | | | | | | | | |
| | | | | | | | Total Long-Term Investments
(Cost $9,629,526) | | | 10,006,334 | | | | 99.3 | |
| | | | | | | | | | | | | | | | |
| | | | | | | | | | | | | | | | |
| | | | | | | | | | | | | | | | |
| Shares | | | | | | | | Value | | | Percent
of Net
Assets | |
| | | | | | | | | | | | | | | | |
| | |
| | SHORT-TERM INVESTMENTS: 0.9% | | | | | | | | |
| | | | | | | | Mutual Funds: 0.9% | | | | | |
| | 88,000 | | | | | | | Blackrock Liquidity Funds TempFund Portfolio - Class I | | $ | 88,000 | | | | 0.9 | |
| | | | | | | | Total Short-Term Investments (Cost $88,000) | | | 88,000 | | | | 0.9 | |
| | | | | | | | | | | | | | | | |
| | | | | | | | | | | | | | | | |
| | | | | | | | Total Investments in Securities (Cost $9,717,526)* | | $ | 10,094,334 | | | | 100.2 | |
| | | | | | | | Other Assets and Liabilities - Net | | | (22,649 | ) | | | (0.2 | ) |
| | | | | | | | | | | | | | | | |
| | | | | | | | Net Assets | | $ | 10,071,685 | | | | 100.0 | |
| | | | | | | | | | | | | | | | |
| STRIP | Separate Trading of Registered Interest and Principal of Securities |
| ## | On September 7, 2008, the Federal Housing Finance Agency placed the Federal National Mortgage Association and the Federal Home Loan Mortgage Corporation into conservatorship and the U.S. Treasury guaranteed the debt issued by those organizations. |
| ^ | Interest only securities represent the right to receive the monthly interest payments on an underlying pool of mortgage loans. Principal amount shown represents the notional amount on which current interest is calculated. Payments of principal on the pool reduce the value of the interest only security. |
| ^^ | Principal only securities represent the right to receive the monthly principal payments on an underlying pool of mortgage loans. No payments of interest on the pool are passed through the principal only security. |
| Z | Indicates Zero Coupon Bond; rate shown reflects current effective yield. |
| * | Cost for federal income tax purposes is $9,720,342. |
| | | | |
Net unrealized appreciation consists of: | | | | |
Gross Unrealized Appreciation | | $ | 373,992 | |
Gross Unrealized Depreciation | | | — | |
| | | | |
Net Unrealized Appreciation | | $ | 373,992 | |
| | | | |
See Accompanying Notes to Financial Statements
59
| | |
| ING GET U.S. CORE PORTFOLIO SERIES 11 | | PORTFOLIO OF INVESTMENTS ASOF DECEMBER 31, 2010 (CONTINUED) |
Fair Value Measurements^
The following is a summary of the fair valuations according to the inputs used as of December 31, 2010 in valuing the Portfolio's assets and liabilities:
| | | | | | | | | | | | | | | | |
| | | Quoted Prices
in Active Markets
for Identical Investments
(Level 1) | | | Other
Observable
Inputs
(Level 2) | | | Significant
Unobservable
Inputs
(Level 3) | | | Fair Value
at
12/31/2010 | |
Asset Table | | | | | | | | | | | | | | | | |
Investments, at value | | | | | | | | | | | | | | | | |
U.S. Government Agency Obligations | | $ | — | | | $ | 8,514,207 | | | $ | — | | | $ | 8,514,207 | |
U.S. Treasury Obligations | | | — | | | | 1,492,127 | | | | — | | | | 1,492,127 | |
Short-Term Investments | | | 88,000 | | | | — | | | | — | | | | 88,000 | |
| | | | | | | | | | | | | | | | |
Total Investments, at value | | $ | 88,000 | | | $ | 10,006,334 | | | $ | — | | | $ | 10,094,334 | |
| | | | | | | | | | | | | | | | |
| ^ | See Note 2, “Significant Accounting Policies” in the Notes to Financial Statements for additional information. |
See Accompanying Notes to Financial Statements
60
| | |
| ING GET U.S. CORE PORTFOLIO SERIES 12 | | PORTFOLIO OF INVESTMENTS ASOF DECEMBER 31, 2010 |
| | | | | | | | | | | | | | | | |
| Shares | | | | | | | | Value | | | Percent
of Net
Assets | |
| | | | | | | | | | | | | | | | |
| | |
| | EXCHANGE-TRADED FUNDS: 4.8% | | | | | | | | |
| | | | | | | | Exchange-Traded Funds: 4.8% | |
| | 5,700 | | | | | | | SPDR Trust Series 1 | | $ | 716,946 | | | | 4.8 | |
| | | | | | | | Total Exchange-Traded Funds (Cost $468,485) | | | 716,946 | | | | 4.8 | |
| | | | | | | | | | | | | | | | |
| | | | | | | | | | | | | | | | |
Principal
Amount | | | | | | | | Value | | | Percent
of Net
Assets | |
| |
| | U.S. GOVERNMENT AGENCY OBLIGATIONS: 83.8% | | | | | |
| | | | | | | | Federal Home Loan Mortgage Corporation##: 14.9% | |
| $ | 2,291,000 | | | | Z | | | 1.450%, due 09/15/13 | | $ | 2,203,417 | | | | 14.9 | |
| | | | | | | | Federal National Mortgage Association##: 22.3% | |
| | 3,415,000 | | | | ^, Z | | | 1.390%, due 07/15/13 | | | 3,297,220 | | | | 22.3 | |
| | | | | | | | Other U.S. Agency Obligations: 46.6% | |
| | 3,400,000 | | | | ^, Z | | | Financing Corp., 1.170%, due 06/06/13 | | | 3,304,389 | | | | 46.6 | |
| | 3,681,000 | | | | ^, Z | | | Resolution Funding Corp., 1.100%, due 04/15/13 | | | 3,589,211 | | | | | |
| | | | | | | | | | | 6,893,600 | | | | 46.6 | |
| | | | | | | | Total U.S. Government Agency Obligations (Cost $11,811,235) | | | 12,394,237 | | | | 83.8 | |
| | | | | | | | | | | | | | | | |
| | |
| | U.S. TREASURY OBLIGATIONS: 10.1% | | | | | | | | |
| | | | | | | | U.S. Treasury STRIP PRINCIPAL: 10.1% | |
| | 1,517,000 | | | | ^^, Z | | | 0.680%, due 05/15/13 | | | 1,492,470 | | | | 10.1 | |
| | | | | | | | Total U.S. Treasury Obligations (Cost $1,461,174) | | | 1,492,470 | | | | 10.1 | |
| | | | | | | | | | | | | | | | |
| | | | | | | | Total Long-Term Investments (Cost $13,740,894) | | | 14,603,653 | | | | 98.7 | |
| | | | | | | | | | | | | | | | |
| | | | | | | | | | | | | | | | |
| Shares | | | | | | | | Value | | | Percent
of Net
Assets | |
| | | | | | | | | | | | | | | | |
| | |
| | SHORT-TERM INVESTMENTS: 1.5% | | | | | | | | |
| | | | | | | | Mutual Funds: 1.5% | | | | | | | | |
| | 221,000 | | | | | | | Blackrock Liquidity Funds TempFund Portfolio - Class I | | $ | 221,000 | | | | 1.5 | |
| | | | | | | | Total Short-Term Investments (Cost $221,000) | | | 221,000 | | | | 1.5 | |
| | | | | | | | | | | | | | | | |
| | | | | | | | Total Investments in Securities (Cost $13,961,894)* | | $ | 14,824,653 | | | | 100.2 | |
| | | | | | | | Other Assets and Liabilities - Net | | | (26,861 | ) | | | (0.2 | ) |
| | | | | | | | | | | | | | | | |
| | | | | | | | Net Assets | | $ | 14,797,792 | | | | 100.0 | |
| | | | | | | | | | | | | | | | |
| STRIP | Separate Trading of Registered Interest and Principal of Securities |
| ## | On September 7, 2008, the Federal Housing Finance Agency placed the Federal National Mortgage Association and the Federal Home Loan Mortgage Corporation into conservatorship and the U.S. Treasury guaranteed the debt issued by those organizations. |
| ^ | Interest only securities represent the right to receive the monthly interest payments on an underlying pool of mortgage loans. Principal amount shown represents the notional amount on which current interest is calculated. Payments of principal on the pool reduce the value of the interest only security. |
| ^^ | Principal only securities represent the right to receive the monthly principal payments on an underlying pool of mortgage loans. No payments of interest on the pool are passed through the principal only security. |
See Accompanying Notes to Financial Statements
61
| | |
| ING GET U.S. CORE PORTFOLIO SERIES 12 | | PORTFOLIO OF INVESTMENTS ASOF DECEMBER 31, 2010 (CONTINUED) |
| Z | Indicates Zero Coupon Bond; rate shown reflects current effective yield. |
| * | Cost for federal income tax purposes is $13,961,894. |
| | | | |
Net unrealized appreciation consists of: | | | | |
Gross Unrealized Appreciation | | $ | 862,759 | |
Gross Unrealized Depreciation | | | — | |
| | | | |
Net Unrealized Appreciation | | $ | 862,759 | |
| | | | |
Fair Value Measurements^
The following is a summary of the fair valuations according to the inputs used as of December 31, 2010 in valuing the Portfolio's assets and liabilities:
| | | | | | | | | | | | | | | | |
| | | Quoted Prices
in Active Markets
for Identical Investments (Level 1) | | | Other Observable Inputs (Level 2) | | | Significant Unobservable Inputs (Level 3) | | | Fair Value at 12/31/2010 | |
Asset Table | | | | | | | | | | | | | | | | |
Investments, at value | | | | | | | | | | | | | | | | |
Exchange-Traded Funds | | $ | 716,946 | | | $ | — | | | $ | — | | | $ | 716,946 | |
U.S. Government Agency Obligations | | | — | | | | 12,394,237 | | | | — | | | | 12,394,237 | |
U.S. Treasury Obligations | | | — | | | | 1,492,470 | | | | — | | | | 1,492,470 | |
Short-Term Investments | | | 221,000 | | | | — | | | | — | | | | 221,000 | |
| | | | | | | | | | | | | | | | |
Total Investments, at value | | $ | 937,946 | | | $ | 13,886,707 | | | $ | — | | | $ | 14,824,653 | |
| | | | | | | | | | | | | | | | |
| ^ | See Note 2, "Significant Accounting Policies" in the Notes to Financial Statements for additional information. |
See Accompanying Notes to Financial Statements
62
| | |
| ING GET U.S. CORE PORTFOLIO SERIES 13 | | PORTFOLIO OF INVESTMENTS ASOF DECEMBER 31, 2010 |
| | | | | | | | | | | | | | | | |
Principal
Amount | | | | | | | | Value | | | Percent
of Net
Assets | |
| | | | | | | | | | | | | | | | |
| | | | | | | | | | | | | | | | |
| |
| | U.S. GOVERNMENT AGENCY OBLIGATIONS: 81.2% | | | | | |
| | | | | | | | Federal Home Loan Mortgage Corporation##: 20.3% | | | | | |
| $ | 5,561,000 | | | | ^^, Z | | | 1.510%, due 11/15/13 | | $ | 5,326,587 | | | | 20.3 | |
| | | | | | | | | | | | | | | | |
| | | | | | | | Federal National Mortgage Association##: 20.3% | | | | | |
| | 5,578,000 | | | | ^, Z | | | 1.377%, due 01/15/14 | | | 5,313,430 | | | | 20.3 | |
| | | | | | | | | | | | | | | | |
| | | | | | | | Other U.S. Agency Obligations: 40.6% | | | | | |
| | 5,250,000 | | | | ^, Z | | | Financing Corp., 1.310%, due 11/11/13 | | | 5,057,692 | | | | 40.6 | |
| | 5,814,000 | | | | ^, Z | | | Resolution Funding Corp., 1.420%, due 01/15/14 | | | 5,570,702 | | | | | |
| | | | | | | | | | | 10,628,394 | | | | 40.6 | |
| | | | | | | | Total U.S. Government Agency Obligations
(Cost $19,704,722 ) | | | 21,268,411 | | | | 81.2 | |
| | | | | | | | | | | | | | | | |
| |
| | U.S. TREASURY OBLIGATIONS: 18.2% | | | | | |
| | | | | | | | U.S. Treasury STRIP COUPON: 18.2% | | | | | |
| | 4,907,000 | | | | Z | | | 1.000%, due 11/15/13 | | | 4,770,301 | | | | 18.2 | |
| | | | | | | | Total U.S. Treasury Obligations
(Cost $4,541,815) | | | 4,770,301 | | | | 18.2 | |
| | | | | | | | | | | | | | | | |
| | | | | | | | Total Long-Term Investments
(Cost $24,246,537) | | | 26,038,712 | | | | 99.4 | |
| | | | | | | | | | | | | | | | |
| | | | | | | | | | | | | | | | |
| Shares | | | | | | | | Value | | | Percent
of Net
Assets | |
| | | | | | | | | | | | | | | | |
| | | | | | | | | | | | | | | | |
| | | | | | | | | | | | | | | | |
| | | | | | | | | | | | | | | | |
| | | | | | | | | | | | | | | | |
| | | | | | | | | | | | | | | | |
| | | | | | | | | | | | | | | | |
| | |
| | SHORT-TERM INVESTMENTS: 0.8% | | | | | | | | |
| | | | | | | | Mutual Funds: 0.8% | | | | | |
| | 221,000 | | | | | | | Blackrock Liquidity Funds TempFund Portfolio -Class I | | $ | 221,000 | | | | 0.8 | |
| | | | | | | | Total Short-Term Investments
(Cost $221,000) | | | 221,000 | | | | 0.8 | |
| | | | | | | | | | | | | | | | |
| | | | |
| | | | | | | | Total Investments in Securities (Cost $24,467,537)* | | | $26,259,712 | | | | 100.2 | |
| | | | | | | | Other Assets and Liabilities - Net | | | (56,160 | ) | | | (0.2 | ) |
| | | | | | | | | | | | | | | | |
| | | | | | | | Net Assets | | $ | 26,203,552 | | | | 100.0 | |
| | | | | | | | | | | | | | | | |
| STRIP | Separate Trading of Registered Interest and Principal of Securities |
| ## | On September 7, 2008, the Federal Housing Finance Agency placed the Federal National Mortgage Association and the Federal Home Loan Mortgage Corporation into conservatorship and the U.S. Treasury guaranteed the debt issued by those organizations. |
| ^ | Interest only securities represent the right to receive the monthly interest payments on an underlying pool of mortgage loans. Principal amount shown represents the notional amount on which current interest is calculated. Payments of principal on the pool reduce the value of the interest only security. |
| ^^ | Principal only securities represent the right to receive the monthly principal payments on an underlying pool of mortgage loans. No payments of interest on the pool are passed through the principal only security. |
| Z | Indicates Zero Coupon Bond; rate shown reflects current effective yield. |
| * | Cost for federal income tax purposes is $24,508,973. |
| | | | |
Net unrealized appreciation consists of: | | | | |
Gross Unrealized Appreciation | | $ | 1,750,739 | |
Gross Unrealized Depreciation | | | — | |
| | | | |
Net Unrealized Appreciation | | $ | 1,750,739 | |
| | | | |
See Accompanying Notes to Financial Statements
63
| | |
| ING GET U.S. CORE PORTFOLIO SERIES 13 | | PORTFOLIO OF INVESTMENTS ASOF DECEMBER 31, 2010 (CONTINUED) |
Fair Value Measurements^
The following is a summary of the fair valuations according to the inputs used as of December 31, 2010 in valuing the Portfolio's assets and liabilities:
| | | | | | | | | | | | | | | | |
| | | Quoted Prices
in Active Markets for
Identical Investments
(Level 1) | | | Other
Observable
Inputs (Level 2) | | | Significant
Unobservable
Inputs (Level 3) | | | Fair Value at 12/31/2010 | |
Asset Table | | | | | | | | | | | | | | | | |
Investments, at value | | | | | | | | | | | | | | | | |
U.S. Government Agency Obligations | | $ | — | | | $ | 21,268,411 | | | $ | — | | | $ | 21,268,411 | |
U.S. Treasury Obligations | | | — | | | | 4,770,301 | | | | — | | | | 4,770,301 | |
Short-Term Investments | | | 221,000 | | | | — | | | | — | | | | 221,000 | |
| | | | | | | | | | | | | | | | |
Total Investments, at value | | $ | 221,000 | | | $ | 26,038,712 | | | $ | — | | | $ | 26,259,712 | |
| | | | | | | | | | | | | | | | |
| ^ | See Note 2, "Significant Accounting Policies" in the Notes to Financial Statements for additional information. |
See Accompanying Notes to Financial Statements
64
| | |
| ING GET U.S. CORE PORTFOLIO SERIES 14 | | PORTFOLIO OF INVESTMENTS ASOF DECEMBER 31, 2010 |
| | | | | | | | | | | | | | |
Principal
Amount | | | | | | | Value | | | Percent
of Net
Assets | |
| |
| | U.S. GOVERNMENT AGENCY OBLIGATIONS: 60.1% | | | | | |
| | | | | | Federal Home Loan Mortgage Corporation##: 19.6% | | | | | |
| $ | 11,413,000 | | | ^^, Z | | 1.920%, due 07/15/14 | | $ | 10,677,364 | | | | 19.6 | |
| | | | | | | | | | | | | | |
| | | Federal National Mortgage Association##: 20.1% | | | | | | | | |
| | 11,675,000 | | | ^, Z | | 1.840%, due 05/15/14 | | | 10,985,650 | | | | 20.1 | |
| | | | | | | | | | | | | | |
| | | | | | Other U.S. Agency Obligations: 20.4% | | | | | |
| | 11,801,000 | | | ^, Z | | Resolution Funding Corp., 1.660%, due 07/15/14 | | | 11,137,087 | | | | 20.4 | |
| | | | | | Total U.S. Government Agency Obligations (Cost $30,522,643) | | | 32,800,101 | | | | 60.1 | |
| | | | | | | | | | | | | | |
| | |
| | U.S. TREASURY OBLIGATIONS: 19.2% | | | | | | | | |
| | | | | | U.S. Treasury STRIP COUPON: 19.2% | | | | | |
| | 10,909,000 | | | Z | | 1.300%, due 05/15/14 | | | 10,444,375 | | | | 19.2 | |
| | | | | | Total U.S. Treasury Obligations (Cost $10,034,594) | | | 10,444,375 | | | | 19.2 | |
| | | | | | | | | | | | | | |
| | |
| | OTHER BONDS: 20.0% | | | | | | | | |
| | | | | | Foreign Government Bonds: 20.0% | | | | | |
| | 2,466,000 | | | Z | | Israel Government International Bond, 1.500%, due 03/15/14 | | | 2,351,346 | | | | 20.0 | |
| | 9,124,000 | | | Z | | Israel Government International Bond, 1.730%, due 08/15/14 | | | 8,578,348 | | | | 20.0 | |
| | | | | | Total Other Bonds (Cost $10,470,621) | | | 10,929,694 | | | | 20.0 | |
| | | | | | | | | | | | | | |
| | | | | | Total Investments in Securities (Cost $51,027,858)* | | $ | 54,174,170 | | | | 99.3 | |
| | | | | | Other Assets and Liabilities - Net | | | 374,240 | | | | 0.7 | |
| | | | | | | | | | | | | | |
| | | | | | Net Assets | | $ | 54,548,410 | | | | 100.0 | |
| | | | | | | | | | | | | | |
| STRIP | Separate Trading of Registered Interest and Principal of Securities |
| ## | On September 7, 2008, the Federal Housing Finance Agency placed the Federal National Mortgage Association and the Federal Home Loan Mortgage Corporation into conservatorship and the U.S. Treasury guaranteed the debt issued by those organizations. |
| ^ | Interest only securities represent the right to receive the monthly interest payments on an underlying pool of mortgage loans. Principal amount shown represents the notional amount on which current interest is calculated. Payments of principal on the pool reduce the value of the interest only security. |
| ^^ | Principal only securities represent the right to receive the monthly principal payments on an underlying pool of mortgage loans. No payments of interest on the pool are passed through the principal only security. |
| Z | Indicates Zero Coupon Bond; rate shown reflects current effective yield. |
| * | Cost for federal income tax purposes is $51,027,858. |
| | | | |
Net unrealized appreciation consists of: | | | | |
Gross Unrealized Appreciation | | $ | 3,146,312 | |
Gross Unrealized Depreciation | | | — | |
| | | | |
Net Unrealized Appreciation | | $ | 3,146,312 | |
| | | | |
See Accompanying Notes to Financial Statements
65
| | |
| ING GET U.S. CORE PORTFOLIO SERIES 14 | | PORTFOLIO OF INVESTMENTS ASOF DECEMBER 31, 2010 (CONTINUED) |
Fair Value Measurements^
The following is a summary of the fair valuations according to the inputs used as of December 31, 2010 in valuing the Portfolio's assets and liabilities:
| | | | | | | | | | | | | | | | |
| | | Quoted Prices
in Active Markets for
Identical Investments
(Level 1) | | | Other
Observable
Inputs (Level 2) | | | Significant
Unobservable
Inputs (Level 3) | | | Fair Value at 12/31/2010 | |
Asset Table | | | | | | | | | | | | | | | | |
Investments, at value | | | | | | | | | | | | | | | | |
U.S. Government Agency Obligations | | $ | — | | | $ | 32,800,101 | | | $ | — | | | $ | 32,800,101 | |
U.S. Treasury Obligations | | | — | | | | 10,444,375 | | | | — | | | | 10,444,375 | |
Other Bonds | | | — | | | | 10,929,694 | | | | — | | | | 10,929,694 | |
| | | | | | | | | | | | | | | | |
Total Investments, at value | | $ | — | | | $ | 54,174,170 | | | $ | — | | | $ | 54,174,170 | |
| | | | | | | | | | | | | | | | |
| ^ | See Note 2, "Significant Accounting Policies" in the Notes to Financial Statements for additional information. |
See Accompanying Notes to Financial Statements
66
TAX INFORMATION (UNAUDITED)
Dividends paid during the year ended December 31, 2010 were as follows:
| | | | | | |
Portfolio Name | | Type | | Per Share Amount | |
| | |
ING GET U.S. Core Portfolio — Series 5 | | NII | | $ | 0.1331 | |
| | |
ING GET U.S. Core Portfolio — Series 6 | | NII | | $ | 0.1736 | |
| | |
ING GET U.S. Core Portfolio — Series 7 | | NII | | $ | 0.1665 | |
| | |
ING GET U.S. Core Portfolio — Series 8 | | NII | | $ | 0.1800 | |
| | |
ING GET U.S. Core Portfolio — Series 9 | | NII | | $ | 0.1625 | |
| | |
ING GET U.S. Core Portfolio — Series 10 | | NII | | $ | 0.2154 | |
| | |
ING GET U.S. Core Portfolio — Series 11 | | NII | | $ | 0.2069 | |
| | |
ING GET U.S. Core Portfolio — Series 12 | | NII | | $ | 0.2181 | |
| | |
ING GET U.S. Core Portfolio — Series 13 | | NII | | $ | 0.2458 | |
| | |
ING GET U.S. Core Portfolio — Series 14 | | NII | | $ | 0.4011 | |
NII - Net investment income
Of the ordinary distributions made during the year ended December 31, 2010, the following percentages qualify for the dividends received deduction (DRD) available to corporate shareholders:
| | | | |
| |
ING GET U.S. Core Portfolio — Series 5 | | | 0.54 | % |
| |
ING GET U.S. Core Portfolio — Series 6 | | | 0.28 | % |
| |
ING GET U.S. Core Portfolio — Series 7 | | | 4.45 | % |
| |
ING GET U.S. Core Portfolio — Series 8 | | | 0.35 | % |
| |
ING GET U.S. Core Portfolio — Series 9 | | | 0.25 | % |
| |
ING GET U.S. Core Portfolio — Series 10 | | | 0.22 | % |
| |
ING GET U.S. Core Portfolio — Series 12 | | | 2.85 | % |
| |
ING GET U.S. Core Portfolio — Series 13 | | | 0.05 | % |
Above figures may differ from those cited elsewhere in this report due to differences in the calculation of income and gains under U.S. generally accepted accounting principles (book) purposes and Internal Revenue Service (tax) purposes.
Shareholders are strongly advised to consult their own tax advisers with respect to the tax consequences of their investments in the Portfolios. In January, shareholders, excluding corporate shareholders, receive an IRS 1099-DIV regarding the federal tax status of the dividends and distributions they received in the calendar year.
67
TRUSTEE AND OFFICER INFORMATION (UNAUDITED)
The business and affairs of the Trust are managed under the direction of the Board. A Trustee who is not an interested person of the Registrants, as defined in the 1940 Act, is an independent trustee (“Independent Trustee”). The Trustees and Officers of the Trust are listed below. The Statement of Additional Information includes additional information about trustees of the Trust and is available, without charge, upon request at (800) 992-0180.
| | | | | | | | | | |
Name, Address and Age | | Position(s)
Held with the
Trust | | Term of Office
and Length of
Time Served(1) | | Principal Occupation(s) - During the Past 5 Years | | Number of
Funds
in Fund
Complex
Overseen
by Trustee(2) | | Other Board Positions
Held by Trustee |
| | | | | |
Colleen D. Baldwin 7337 E. Doubletree Ranch Rd. Suite 100 Scottsdale, Arizona 85258 Age: 50 | | Trustee | | November 2007 -Present | | President, Glantuam Partners, LLC (January 2009 - Present); and Consultant (January 2005 - Present). | | 138 | | None. |
| | | | | |
John V. Boyer(4) 7337 E. Doubletree Ranch Rd. Suite 100 Scottsdale, Arizona 85258 Age: 57 | | Trustee | | January 2005 - Present | | President and Chief Executive Officer, Bechtler Arts Foundation, an arts and education foundation, (January 2008 - Present). Formerly, Consultant (July
2007 - February 2008); President and Chief Executive Officer, Franklin and Eleanor Roosevelt Institute, a public policy foundation, (March 2006 - July 2007); and Executive Director, The Mark Twain House & Museum (September 1989 - March 2006). | | 138 | | None. |
| | | | | |
Patricia W. Chadwick
7337 E. Doubletree Ranch Rd. Suite 100 Scottsdale, Arizona 85258 Age: 62 | | Trustee | | January 2006 - Present | | Consultant and President, Ravengate Partners LLC, a consulting firm that provides advice regarding financial markets and the global economy (January 2000 - Present). | | 138 | | Wisconsin Energy Corporation (June 2006 - Present) and The Royce Fund (December 2009 - Present). |
| | | | | |
Peter S. Drotch 7337 E. Doubletree Ranch Rd. Suite 100 Scottsdale, Arizona 85258 Age: 68 | | Trustee | | November 2007 - Present | | Retired. Formerly, Partner, PricewaterhouseCoopers LLP, an accounting firm, until July 2000. | | 138 | | First Marblehead Corporation (September 2003 - Present)
. |
| | | | | |
J. Michael Earley 7337 E. Doubletree Ranch Rd. Suite 100 Scottsdale, Arizona 85258 Age: 65 | | Trustee | | February 2002 - Present | | Retired. Formerly, Banking President and Chief Executive Officer, Bankers Trust Company, N.A., Des Moines (June 1992 - December 2008). | | 138 | | None. |
| | | | | |
Patrick W. Kenny 7337 E. Doubletree Ranch Rd. Suite 100 Scottsdale, Arizona 85258 Age: 67 | | Trustee | | January 2005 - Present | | Retired. Formerly, President and Chief Executive Officer, International Insurance Society (June 2001 - June 2009). | | 138 | | Assured Guaranty Ltd. (April 2004 - Present). |
| | | | | |
Sheryl K. Pressler 7337 E. Doubletree Ranch Rd. Suite 100 Scottsdale, Arizona 85258 Age: 60 | | Trustee | | January 2006 - Present | | Consultant (May 2001 - Present). | | 138 | | Stillwater Mining Company
(May 2002 - Present). |
| | | | | |
Roger B. Vincent 7337 E. Doubletree Ranch Rd. Suite 100 Scottsdale, Arizona 85258 Age: 65 | | Chairman and Trustee | | February 2002 -Present | | President, Springwell Corporation, a corporate finance firm (March 1989 - Present). | | 138 | | UGI Corporation (February 2006 - Present) and UGI Utilities, Inc. (February 2006 - Present). |
68
TRUSTEE AND OFFICER INFORMATION (UNAUDITED) (CONTINUED)
| | | | | | | | | | | | |
Name, Address and Age | | Position(s)
Held with the
Trust | | Term of Office
and Length of
Time Served(1) | | Principal Occupation(s) - During the Past 5 Years | | Number of
Funds
in Fund
Complex
Overseen
by Trustee(2) | | | Other Board Positions
Held by Trustee |
| | | | | |
Interested Directors/Trustees | | | | | | | | | | | | |
| | | | | |
Robert W. Crispin(5) 7337 E. Doubletree Ranch Rd. Suite 100 Scottsdale, Arizona 85258 Age: 64 | | Trustee | | November 2007 - Present | | Retired. Chairman and Chief Executive Officer, ING Investment Management Co. (July 2001 - December 2007). | | | 138 | | | Intact Financial Corporation (December 2004 - Present) and PFM Group (November 2010 - Present). |
| | | | | |
Shaun P. Mathews(3)(5) 7337 E. Doubletree Ranch Rd. Suite 100 Scottsdale, Arizona 85258 Age: 55 | | Trustee | | November 2007 - Present | | President and Chief Executive Officer, ING Investments, LLC (November 2006 - Present). Formerly, Head of ING Mutual Funds and Investment Products (November 2004 - November 2006). | | | 175 | | | ING Retirement Holdings, Inc. (September 1998 - Present); ING Services Holding Company, Inc. (May 2000 - Present); ING Financial Advisers, LLC (April 2002 - Present); Southland Life Insurance Company (June 2002 - Present); ING Capital Corporation, LLC and ING Investments Distributor, LLC(7) (December 2005 - Present); ING Funds Services, LLC(8), ING Investments, LLC and ING Pilgrim Funding, Inc. (March 2006 - Present); and Directed Services LLC (December 2006 - Present)(9). |
| (1) | The tenure of each Trustee is subject to the Board’s retirement policy, which states that each Independent Trustee shall retire from service as a Trustee at the conclusion of the first regularly scheduled meeting of the Board that is held after the Trustee reaches the age of 72. A unanimous vote of the Board may extend the retirement date of a Trustee for up to one year. An extension may be permitted if the retirement would trigger a requirement to hold a meeting of shareholders of the Fund under applicable law, whether for purposes of appointing a successor to the Trustee or if otherwise necessary under applicable law, in which case the extension would apply until such time as the shareholder meeting can be held or is no longer needed. |
| (2) | For the purposes of this table (except for Mr. Mathews), ”Fund Complex” means the following investment companies: ING Asia Pacific High Dividend Equity Income Fund, ING Emerging Markets High Dividend Equity Fund; ING Emerging Markets Local Bond Fund; ING Equity Trust; ING Funds Trust; ING Global Equity Dividend and Premium Opportunity Fund; ING Global Advantage and Premium Opportunity Fund; ING Infrastructure, Industrials, and Materials Fund; ING International High Dividend Equity Income Fund; ING Investors Trust; ING Mayflower Trust; ING Mutual Funds; ING Prime Rate Trust; ING Risk Managed Natural Resources Fund; ING Senior Income Fund; ING Separate Portfolios Trust; ING Variable Insurance Trust; ING Variable Products Trust; and ING Partners, Inc. |
| (3) | For Mr. Mathews, the Fund Complex also includes the following investment companies: ING Series Fund, Inc.; ING Strategic Allocation Portfolios, Inc.; ING Variable Funds; ING Variable Portfolios, Inc.; ING Balanced Portfolio, Inc.; ING Intermediate Bond Portfolio; and ING Money Market Portfolio. |
| (4) | Mr. Boyer held a seat on the Board of Directors of The Mark Twain House & Museum from September 1989 to November 2005. ING Groep N.V. makes non-material, charitable contributions to The Mark Twain House & Museum. |
| (5) | Messrs. Mathews and Crispin are deemed to be “interested persons” of the Fund as defined in the 1940 Act because of their relationship with ING Groep, N.V., the parent corporation of the Investment Adviser, ING Investments, LLC and the Distributor, ING Investments Distributor, LLC. |
| (6) | ING Investments, LLC was previously named ING Pilgrim Investments, LLC. ING Pilgrim Investments, LLC is the successor in interest to ING Pilgrim Investments, Inc., which was previously known as Pilgrim Investments, Inc. and before it was known as Pilgrim America Investments, Inc. |
| (7) | ING Investments Distributor, LLC was previously named ING Funds Distributor, LLC. ING Funds Distributor, LLC is the successor in interest to ING Funds Distributor, Inc., which was previously known as ING Pilgrim Securities, Inc., and before that, was known as Pilgrim Securities, Inc., and before that was known as Pilgrim America Securities, Inc. |
| (8) | ING Funds Services, LLC was previously named ING Pilgrim Group, LLC. ING Pilgrim Group, LLC is the successor in interest to ING Pilgrim Group, Inc., which was previously known as Pilgrim Group, Inc. and before that, was known as Pilgrim America Group, Inc. |
| (9) | Directed Services LLC is the successor in interest to Directed Services, Inc. |
69
TRUSTEE AND OFFICER INFORMATION (UNAUDITED) (CONTINUED)
| | | | | | |
Name, Address and Age | | Position(s) Held
With Trust | | Term of Office
and Length of
Time Served (1) | | Principal Occupation(s) -
During the Past 5 Years |
| | | |
Shaun P. Mathews(5)
7337 East Doubletree Ranch Rd.
Suite 100
Scottsdale, Arizona 85258
Age: 55 | | President and Chief Executive Officer | | November 2006 - Present | | President and Chief Executive Officer, ING Investments, LLC (November 2006 - Present). Formerly, Head of ING Mutual Funds and Investment Products (November 2004 - November 2006). |
| | | |
Michael J. Roland
7337 East Doubletree Ranch Rd.
Suite 100 Scottsdale, Arizona 85258
Age: 52 | | Executive Vice President | | February 2002 - Present | | Executive Vice President and Chief Operating Officer, ING Investments, LLC(2) and ING Funds Services, LLC(3) (January 207 - Present). Formerly, Executive Vice President, Head of Product Management (January 2005 - January 2007). |
| | | |
Stanley D. Vyner
230 Park Avenue
New York, New York 10169
Age: 60 | | Executive Vice President and Chief Investment Risk Officer | | October 2000 - Present September 2009 - Present | | Executive Vice President, ING Investments, LLC(2) (July 2000 - Present) and Chief Investment Risk Officer, ING Investments, LLC(2) (January 2003 - Present). |
| | | |
Joseph M. O’Donnell
7337 East Doubletree Ranch Rd.
Suite 100
Scottsdale, Arizona 85258
Age: 56 | | Executive Vice President and
Chief Compliance Officer | | March 2006 - Present November 2004 - Present | | Chief Compliance Officer of the ING Funds (November 2004 - Present); Executive Vice President of the ING Funds (March 2006 - Present); Chief Compliance Officer of ING Investments, LLC(2) (March 2006 - July 2008 and October 2009- Present); and Investment Advisor Chief Compliance Officer, Directed Services LLC(6) (March 2006 - July 2008 and October 2009 - Present). Formerly, Investment Advisor Chief Compliance Officer, ING Life Insurance and Annuity Company (March 2006 - December 2006). |
| | | |
Todd Modic
7337 East Doubletree Ranch Rd.
Suite 100
Scottsdale, Arizona 85258
Age: 43 | | Senior Vice President,
Chief/Principal Financial
Officer and Assistant
Secretary | | March 2005 - Present | | Senior Vice President, ING Funds Services, LLC(3) (March 2005 - Present). |
| | | |
Kimberly A. Anderson
7337 East Doubletree Ranch Rd.
Suite 100
Scottsdale, Arizona 85258
Age: 46 | | Senior Vice President | | November 2003 - Present | | Senior Vice President, ING Investments, LLC(2) (October 2003 - Present). |
| | | |
Robert Terris
7337 East Doubletree Ranch Rd.
Suite 100
Scottsdale, Arizona 85258
Age: 40 | | Senior Vice President | | May 2006 - Present | | Senior Vice President, Head of Division Operations, ING Funds Services, LLC(3) (May 2006 - Present). Formerly, Vice President of Administration, ING Funds Services, LLC(3) (October 2001 - May 2006). |
| | | |
Robyn L. Ichilov
7337 East Doubletree Ranch Rd.
Suite 100
Scottsdale, Arizona 85258
Age: 43 | | Vice President and Treasurer | | October 2000 - Present March 2001 - Present | | Vice President and Treasurer, ING Funds Services, LLC(3) (November 1995 - Present) and ING Investments, LLC(2) (August 1997 - Present). |
| | | |
Lauren D. Bensinger
7337 East Doubletree Ranch Rd.
Suite 100
Scottsdale, Arizona 85258
Age: 56 | | Vice President | | February 2003 - Present | | Vice President, ING Investments, LLC(2) and ING Funds Services, LLC (3) (February 1996 - Present); Director of Compliance, ING Investments, LLC(2) (October 2004 - Present); and Vice President and Money Laundering Reporting Officer, ING Investments Distributor, LLC(4)
(April 2010 - Present). Formerly, Chief Compliance Officer, ING Investments Distributor, LLC (4) (August 1995 - April 2010). |
| | | |
William Evans
10 State House Square
Hartford, Connecticut 06103
Age: 38 | | Vice President | | September 2007 - Present | | Senior Vice President (March 2010 - Present) and Head of Manager Research and Selection Group (April 2007 - Present). Formerly, Vice President, U.S. Mutual Funds and Investment Products (May 2005 - April 2007). |
| | | |
Maria M. Anderson
7337 East Doubletree Ranch Rd.
Suite 100
Scottsdale, Arizona 85258
Age: 52 | | Vice President | | September 2004 - Present | | Vice President, ING Funds Services, LLC(3) (September 2004 - Present). |
| | | |
Denise Lewis
7337 East Doubletree Ranch Rd.
Suite 100
Scottsdale, Arizona 85258
Age: 47 | | Vice President | | January 2007 - Present | | Vice President, ING Funds Services, LLC (December 2006 - Present). Formerly, Senior Vice President, UMB Investment Services Group, LLC (November 2003 - December 2006). |
70
TRUSTEE AND OFFICER INFORMATION (UNAUDITED) (CONTINUED)
| | | | | | |
Name, Address and Age | | Position(s) Held
With Trust | | Term of Office
and Length of
Time Served(1) | | Principal Occupation(s) -
During the Past 5 Years |
| | | |
Kimberly K. Springer
7337 East Doubletree Ranch Rd.
Suite 100
Scottsdale, Arizona 85258
Age: 53 | | Vice President | | March 2006 - Present | | Vice President, ING Investment Management - ING Funds (March 2010 - Present); Vice President, ING Funds Services, LLC(3) (March 2006 - Present) and Managing Paralegal, Registration Statements (June 2003 - Present). Formerly, Assistant Vice President, ING Funds Services, LLC(3) (August 2004 - March 2006). |
| | | |
Craig Wheeler
7337 East Doubletree Ranch Rd.
Suite 100
Scottsdale, Arizona 85258
Age: 41 | | Assistant Vice President | | May 2008 - Present | | Assistant Vice President - Director of Tax, ING Funds Services (March 2008 - Present). Formerly, Tax Manager, ING Funds Services (March 2005 - March 2008). |
| | | |
Huey P. Falgout, Jr.
7337 East Doubletree Ranch Rd.
Suite 100
Scottsdale, Arizona 85258
Age: 47 | | Secretary | | August 2003 - Present | | Senior Vice President and Chief Counsel, ING Investment Management - ING Funds (March 2010 - Present). Formerly, Chief Counsel, ING Americas, U.S. Legal Services (October 2003 - March 2010). |
| | | |
Theresa K. Kelety
7337 East Doubletree Ranch Rd.
Suite 100
Scottsdale, Arizona 85258
Age: 47 | | Assistant Secretary | | August 2003 - Present | | Vice President and Senior Counsel, ING Investment Management - ING Funds (March 2010 - Present). Formerly, Senior Counsel, ING Americas, U.S. Legal Services (April 2008 - March 2010) and Counsel, ING Americas, U.S. Legal Services (April 2003 - April 2008). |
| | | |
Kathleen Nichols
7337 East Doubletree Ranch Rd.
Suite 100
Scottsdale, Arizona 85258
Age: 35 | | Assistant Secretary | | May 2008 - Present | | Vice President and Counsel, ING Investment Management - ING Funds (March 2010 - Present). Formerly, Counsel, ING Americas, U.S. Legal Services (February 2008 - March 2010) and Associate, Ropes & Gray LLP (September 2005 - February 2008) |
| | | |
Paul Caldarelli
7337 East Doubletree Ranch Rd.
Suite 100
Scottsdale, Arizona 85258
Age: 59 | | Assistant Secretary | | June 2010 - Present | | Vice President and Senior Counsel, ING Investment Management -ING Funds (March 2010 - Present). Formerly, Senior Counsel, ING Americas, U.S. Legal Services (April 2008 - March 2010) and Counsel, ING Americas, U.S. Legal Services (May 2005 - April 2008). |
| (1) | | The officers hold office until the next annual meeting of the Trustees and until their successors shall have been elected and qualified. |
| (2) | | ING Investments, LLC was previously named ING Pilgrim Investments, LLC. ING Pilgrim Investments, LLC is the successor in interest to ING Pilgrim Investments, Inc., which was previously known as Pilgrim Investments, Inc. and before that was known as Pilgrim America Investments, Inc. |
| (3) | | ING Funds Services, LLC was previously named ING Pilgrim Group, LLC. ING Pilgrim Group, LLC is the successor in interest to ING Pilgrim Group, Inc., which was previously known as Pilgrim Group, Inc. and before that was known as Pilgrim America Group, Inc. |
| (4) | | ING Investments Distributor, LLC was previously named ING Funds Distributor, LLC. ING Funds Distributor, LLC is the successor in interest to ING Funds Distributor, Inc., which was previously known as ING Pilgrim Securities, Inc., and before that, was known as Pilgrim Securities, Inc., and before that was known as Pilgrim America Securities, Inc. |
| (5) | | Mr. Mathews commenced services as CEO and President of the ING Funds on November 11, 2006. |
| (6) | | Directed Services LLC is the successor in interest to Directed Services, Inc. |
71
ADVISORY CONTRACT APPROVAL DISCUSSION (UNAUDITED)
BOARD CONSIDERATION AND RE-APPROVAL OF INVESTMENT ADVISORY AND SUB-ADVISORY CONTRACTS
Section 15(c) of the Investment Company Act of 1940, as amended (the “1940 Act”) provides that, after an initial period, the existing investment advisory and sub-advisory contracts of the ING GET Series (the “Portfolios”) will remain in effect only if the Board of Trustees (the “Board”) of ING Variable Insurance Trust (the “Trust”), including a majority of Board members who have no direct or indirect interest in the advisory and sub-advisory contracts, and who are not “interested persons” of the Portfolios, as such term is defined under the 1940 Act (the “Independent Trustees”), annually review and approve them. Thus, at a meeting held on November 18, 2010, the Board, including a majority of the Independent Trustees, considered whether to renew the investment advisory contracts (the “Advisory Contracts”) between ING Investments, LLC (the “Adviser”) and the Portfolios and the sub-advisory contracts (“Sub-Advisory Contracts”) with ING Investment Management, Co., the sub-adviser to each Portfolio (the “Sub-Adviser”).
The Independent Trustees also held separate meetings on October 21 and November 16, 2010 to consider the renewal of the Advisory Contracts and Sub-Advisory Contracts. As a result, subsequent references herein to factors considered and determinations made by the Independent Trustees include, as applicable, factors considered and determinations made on those earlier dates by the Independent Trustees.
At its November 18, 2010 meeting, the Board voted to renew the Advisory and Sub-Advisory Contracts for the Portfolios. In reaching these decisions, the Board took into account information furnished to it throughout the year at regular meetings of the Board and the Board’s committees, as well as information prepared specifically in connection with the annual renewal process. Determinations by the Independent Trustees also took into account various factors that they believed, in light of the legal advice furnished to them by K&L Gates LLP (“K&L Gates”), their independent legal counsel, and their own business judgment, to be relevant. Further, while the Advisory Contracts and Sub-Advisory Contracts for all the Portfolios were considered at the same Board meeting, the Trustees considered each Portfolio’s advisory and sub-advisory relationships separately.
Provided below is an overview of the Board’s contract approval process in general, as well as a discussion of
certain specific factors that the Board considered at its renewal meeting. While the Board gave its attention to the information furnished, at its request, that was most relevant to its considerations, discussed below are a number of the primary factors relevant to the Board’s consideration as to whether to renew the Advisory and Sub-Advisory Contracts for the one-year period ending November 30, 2011. Each Board member may have accorded different weight to the various factors in reaching his or her conclusions with respect to each Portfolio’s advisory and sub-advisory arrangements.
Overview of the Contract Renewal and Approval Process
Several years ago, the Independent Trustees instituted a revised process by which they seek and consider relevant information when they decide whether to approve new or existing advisory and sub-advisory arrangements for the investment companies in the ING Funds complex under their jurisdiction, including the Portfolios’ existing Advisory and Sub-Advisory Contracts. Among other actions, the Independent Trustees: retained the services of independent consultants with experience in the mutual fund industry to assist the Independent Trustees in working with the personnel employed by the Adviser or its affiliates who administer the Portfolios (“Management”) to identify the types of information presented to the Board to inform its deliberations with respect to advisory and sub-advisory relationships and to help evaluate that information; established a specific format in which certain requested information is provided to the Board; and determined the process for reviewing such information in connection with Advisory and Sub-Advisory Contract renewals and approvals. The end result was an enhanced process which is currently employed by the Independent Trustees to review and analyze information in connection with their annual renewal of the ING Funds’ advisory and sub-advisory contracts, as well as their review and approval of new advisory relationships.
Since the current renewal and approval process was first implemented, the Board’s membership has changed substantially through periodic retirements of some Trustees and the appointment and election of new Trustees. In addition, throughout this period the Independent Trustees have reviewed and refined the renewal and approval process at least annually. The Board also established a Contracts Committee and two Investment Review Committees, including the International/Balanced/Fixed Income Funds Investment
72
ADVISORY CONTRACT APPROVAL DISCUSSION (UNAUDITED) (CONTINUED)
Review Committee (the “I/B/F IRC”). Among other matters, the Contracts Committee provides oversight with respect to the contracts renewal and approval process, and each Portfolio is assigned to the I/B/F IRC, which provides oversight regarding, among other matters, investment performance. The Investment Review Committees may apply a heightened level of scrutiny in cases where performance has lagged an ING Fund’s relevant benchmark and/or selected peer group of investment companies (“Selected Peer Group”).
The type and format of the information provided to the Board or to legal counsel for the Independent Trustees in connection with the contract approval and renewal process has been codified in the ING Funds’ 15(c) Methodology Guide. This Guide was developed under the direction of the Independent Trustees and sets out a blueprint pursuant to which the Independent Trustees request certain information that they deem important to facilitate an informed review in connection with initial and annual approvals of advisory and sub-advisory contracts.
Management provides certain of the information requested by the 15(c) Methodology Guide in Fund Analysis and Comparison Tables (“FACT sheets”) prior to the Independent Trustees’ review of advisory and sub-advisory arrangements (including the Portfolios’ Advisory and Sub-Advisory Contracts). The Independent Trustees previously retained an independent firm to verify and test the accuracy of certain FACT sheet data for a representative sample of funds in the ING Funds complex. In addition, in recent years the Contracts Committee employed the services of an independent consultant to assist in its review and analysis of, among other matters, the 15(c) Methodology Guide, the content and format of the FACT sheets, and proposed Selected Peer Groups to be used by the Portfolios for certain comparison purposes during the renewal process. As part of an ongoing process, the Contracts Committee recommends or considers recommendations from Management for refinements to the 15(c) Methodology Guide and other aspects of the review process, and the Board’s I/B/F IRC reviews benchmarks used to assess the performance of funds in the ING Funds complex.
The Board employed its process for reviewing contracts when considering the renewals of the Portfolios’ Advisory and Sub-Advisory Contracts that would be effective through November 30, 2011. Set forth below is a discussion of many of the Board’s primary considerations and conclusions resulting from this process.
Nature, Extent and Quality of Service
In determining whether to approve the Advisory and Sub-Advisory Contracts for the Portfolios for the year ending November 30, 2011, the Independent Trustees received and evaluated such information as they deemed necessary regarding the nature, extent and quality of services provided to the Portfolios by the Adviser and Sub-Adviser. This included information regarding the Adviser and Sub-Adviser provided throughout the year at regular meetings of the Board and its committees, as well as information furnished in connection with the contract renewal meetings.
The materials requested by and provided to the Board and/or to K&L Gates prior to the November 18, 2010 Board meeting included, among other information, the following items for each Portfolio: (1) FACT sheets that provided information regarding the performance and expenses of the Portfolio and other similarly managed funds in its Selected Peer Group, as well as information regarding the Portfolio’s investment portfolio, objective and strategies; (2) reports providing risk and attribution analyses of the Portfolio; (3) the 15(c) Methodology Guide, which describes how the FACT sheets were prepared, including the manner in which each Portfolio’s benchmark and Selected Peer Group were selected and how profitability was determined; (4) responses from the Adviser and Sub-Adviser to a series of questions posed by K&L Gates on behalf of the Independent Trustees; (5) copies of the forms of Advisory and Sub-Advisory Contracts; (6) copies of the Forms ADV for the Adviser and Sub-Adviser; (7) financial statements for the Adviser and Sub-Adviser; (8) a draft of a narrative summary addressing key factors the Board customarily considers in evaluating the renewals of the ING Funds’ (including the Portfolio’s) advisory contracts and sub-advisory contracts, including a written analysis for the Portfolio of how performance, fees and expenses compare to its Selected Peer Group and/or designated benchmark; (9) independent analyses of Portfolio performance by the Trust’s Chief Investment Risk Officer; (10) information regarding net asset flows into and out of the Portfolio; and (11) other information relevant to the Board’s evaluations.
Each Portfolio currently has only one class of shares, which was compared to the analogous class of shares for each fund in its Selected Peer Group. The mutual funds included in the Portfolios’ Selected Peer Groups were selected based upon criteria designed to mirror the Portfolio’s share class being compared to the Selected Peer Group.
73
ADVISORY CONTRACT APPROVAL DISCUSSION (UNAUDITED) (CONTINUED)
In arriving at its conclusions with respect to the Advisory Contracts, the Board was mindful of the “manager-of-managers” platform of the ING Funds that has been developed by Management. The Board also considered the techniques that the Adviser has developed, at the Board’s direction, to screen and perform due diligence on the Sub- Adviser that are recommended to the Board to manage the investment portfolios of the funds in the ING Funds complex. The Board noted the resources that the Adviser has committed to the Board and the I/B/F IRC to assist the Board and the I/B/F IRC with their assessment of the investment performance of the Portfolios on an on-going basis throughout the year. This includes the appointment of a Chief Investment Risk Officer and his staff, who report directly to the Board and who have developed attribution analyses and other metrics used by the Board’s Investment Review Committees to analyze the key factors underlying investment performance for the funds in the ING Funds complex.
The Board also noted the techniques used by the Adviser to monitor the performance of the Sub-Adviser and the proactive approach that the Adviser, working in cooperation with the I/B/F IRC, has taken to advocate or recommend, when it believed appropriate, changes designed to assist in improving the Portfolios’ performance.
In considering the Portfolios’ Advisory Contracts, the Board also considered the extent of benefits provided to the Portfolios’ shareholders, beyond advisory services, from being part of the ING family of funds. This includes, in most cases, the right to exchange or transfer investments, without a sales charge, between the same class of shares of such funds or among ING Funds available on a product platform, and the wide range of ING Funds available for exchange or transfer. The Board also took into account the Adviser’s efforts in recent years to reduce the expenses of the ING Funds through renegotiated arrangements with the ING Funds’ service providers. In addition, the Board considered the efforts of the Adviser and the expenses that it incurred in recent years to help make the ING Funds complex more efficient by combinations of similar funds.
Further, the Board received periodic reports showing that the investment policies and restrictions for each Portfolio were consistently complied with and other periodic reports covering matters such as compliance by Adviser and Sub-Adviser personnel with codes of ethics. The Board considered reports from the Trust’s Chief Compliance Officer (“CCO”) evaluating whether the
regulatory compliance systems and procedures of the Adviser and each Sub-Adviser are reasonably designed to assure compliance with the federal securities laws, including those related to, among others, late trading and market timing, best execution, fair value pricing, proxy voting and trade allocation practices. The Board also took into account the CCO’s annual and periodic reports and recommendations with respect to service provider compliance programs. In this regard, the Board also considered the policies and procedures developed by the CCO in consultation with the Board’s Compliance Committee that guide the CCO’s compliance oversight function.
The Board reviewed the level of staffing, quality and experience of each Portfolio’s portfolio management team. The Board took into account the respective resources and reputations of the Adviser and Sub-Adviser, and evaluated the ability of the Adviser and the Sub-Adviser to attract and retain qualified investment advisory personnel. The Board also considered the adequacy of the resources committed to the Portfolios (and other relevant funds in the ING Funds complex) by the Adviser and Sub-Adviser, and whether those resources are commensurate with the needs of the Portfolios and are sufficient to sustain appropriate levels of performance and compliance needs. In this regard, the Board considered the financial stability of the Adviser and the Sub-Adviser.
Based on their deliberations and the materials presented to them, the Board concluded that the advisory and related services provided by the Adviser and each Sub-Adviser are appropriate in light of the Portfolios’ operations, the competitive landscape of the investment company business, and investor needs, and that the nature and quality of the overall services provided by the Adviser and the Sub-Adviser were appropriate.
Portfolio Performance
In assessing advisory and sub-advisory relationships, the Board placed emphasis on the net investment returns of each Portfolio. While the Board considered the performance reports and discussions with portfolio managers at Board and committee meetings during the year, particular attention in assessing performance was given to the FACT sheets furnished in connection with the renewal process. The FACT sheet prepared for each Portfolio included the Portfolio’s fixed-income benchmark and equity benchmark, each a broad-based securities market index that appears in the Portfolio’s prospectus. The FACT sheet performance data was as of
74
ADVISORY CONTRACT APPROVAL DISCUSSION (UNAUDITED) (CONTINUED)
June 30, 2010. In addition, the Board also considered at its November 18, 2010 meeting certain additional data regarding performance and Portfolio asset levels as of September 30, 2010. The Board’s findings specific to each Portfolio’s performance are discussed under “Portfolio-by-Portfolio Analysis” below.
Economies of Scale
When evaluating the reasonableness of advisory fee rates, the Board also considered whether economies of scale will be realized by the Adviser and Sub-Adviser as a Portfolio grows larger and the extent to which any such economies are reflected in contractual fee rates. In this regard, the Board noted any breakpoints in advisory fee schedules that will result in a lower advisory fee rate when a Portfolio achieves sufficient asset levels to receive a breakpoint discount. In the case of sub-advisory fees, the Board considered that breakpoints would inure to the benefit of the Adviser, except to the extent that there are corresponding advisory fee breakpoints or waivers. The Board also considered that some of the Portfolios that do not have advisory fee breakpoints do have fee waiver or expense reimbursement arrangements. In this connection, the Board considered the extent to which economies of scale could be realized through such waivers, reimbursements or expense reductions. In evaluating fee breakpoint arrangements and economies of scale, the Independent Trustees also considered prior periodic management reports and industry information on this topic.
The Board considered that in recent years many of the Portfolios experienced material declines in assets due to general market declines precipitated by the credit crises and other generally adverse market developments. As a result of these asset declines, the Board considered that there were fewer opportunities for certain of the Portfolios to realize economies of scale.
Information Regarding Services to Other Clients
The Board requested and considered information regarding the nature of services and fee rates offered by the Adviser and Sub-Adviser to other clients, including other registered investment companies and institutional accounts. When fee rates offered to other clients differed materially from those charged to the Portfolios, the Board considered any underlying rationale provided by the Adviser or a Sub-Adviser for these differences. The Board also noted that the fee rates charged to the Portfolios and other institutional clients of the Adviser or Sub-Adviser (including other
investment companies) may differ materially due to, among other reasons: differences in services; different regulatory requirements associated with registered investment companies, such as the Portfolios, as compared to non-registered investment company clients; market differences in fee rates that existed when a Portfolio first was organized; differences in the original sponsors of Portfolios that now are managed by the Adviser; investment capacity constraints that existed when certain contracts were first agreed upon or that might exist at present; and different pricing structures that are necessary to be competitive in different marketing channels.
Fee Rates and Profitability
The Board reviewed and considered each contractual investment advisory fee rate, combined with the administrative fee rate, payable by each Portfolio to the Adviser. The Board also considered the contractual sub-advisory fee rate payable by the Adviser to each Sub-Adviser for sub-advisory services for each Portfolio. In addition, the Board considered fee waivers and expense limitations applicable to the fees payable by the Portfolios.
The Board considered: (1) the fee structure of each Portfolio as it relates to the services provided under the contracts; and (2) the potential fall-out benefits to the Adviser and the Sub-Adviser and their respective affiliates from their association with the Portfolios. For each Portfolio, the Board determined that the fees payable to the Adviser and the Sub-Adviser are reasonable for the services that each performs, which were considered in light of the nature and quality of the services that each has performed and is expected to perform.
For each Portfolio, the Board considered information on revenues, costs and profits realized by the Adviser and each affiliated Sub-Adviser, which was prepared by Management in accordance with the allocation methodology (including related assumptions) specified in the 15(c) Methodology Guide. In analyzing the profitability of the Adviser in connection with its services to a Portfolio, the Board took into account the sub-advisory fee rate payable by the Adviser to each Sub-Adviser. The Board also considered that there has not yet been a full recovery for many Portfolios from the substantial decline in assets caused by adverse economic conditions in recent years, which, in many cases, has adversely impacted profits realized by the Adviser and Sub-Adviser affiliated with the Adviser. In addition, the Board considered information that it
75
ADVISORY CONTRACT APPROVAL DISCUSSION (UNAUDITED) (CONTINUED)
requested and was provided by Management with respect to the profitability of service providers affiliated with the Adviser.
The Board recognized that profitability analysis is not an exact science and there is no uniform methodology for determining profitability for this purpose. In this context, the Board realized that Management’s calculations regarding its costs incurred in establishing the infrastructure necessary for the Portfolios’ operations may not be fully reflected in the expenses allocated to each Portfolio in determining profitability, and that the information presented may not portray all of the costs borne by Management or capture Management’s entrepreneurial risk associated with offering and managing a mutual fund complex in the current regulatory and market environment. In addition, the Board recognized that the use of different methodologies for purposes of calculating profit data can give rise to dramatically different profit and loss results.
In making its determinations, the Board based its conclusions on the reasonableness of the advisory and sub-advisory fees of the Adviser and affiliated Sub-Adviser primarily on the factors described for each Portfolio below.
Portfolio-by-Portfolio Analysis
The following paragraphs outline certain of the specific factors that the Board considered, and the conclusions reached, at its November 18, 2010 meeting in relation to renewing each Portfolio’s current Advisory and Sub-Advisory Contracts. These specific factors are in addition to those considerations discussed above. In each case, the Portfolio’s performance was compared to its fixed-income benchmark and equity benchmark, each a broad-based securities market index that appears in the Portfolio’s prospectus. Each Portfolio’s management fee and expense ratio were compared to the fees and expense ratios of the funds in its Selected Peer Group.
ING Get U.S. Core Portfolio Series 5
In considering whether to approve the renewal of the Advisory and Sub-Advisory Contracts for ING GET U.S. Core Portfolio—Series 5, the Board considered that, based on performance data for the periods ended June 30, 2010: (1) the Portfolio’s fixed-income component underperformed its fixed-income benchmark for all periods presented; and (2) the Portfolio’s equity component outperformed its equity
benchmark for all periods presented, with the exception of the one-year period, during which it underperformed.
In analyzing the Portfolio’s performance, the Board noted Management’s representations that, unlike more conventional mutual funds, during its Guarantee Period the Portfolio’s primary focus is preserving at least the principal amount of the Portfolio at the inception of the Guarantee Period, while at the same time participating in equity markets to the extent consistent with that focus, and this can cause its performance to differ from the performance it may have attained had the Portfolio invested solely in equities or solely in fixed income instruments without regard to principal protection. The Board also considered that the extent to which the Portfolio is able to participate in upward movements of the equity markets is affected by a number of factors, including interest rates and the performance of its equity component.
In considering the fees payable under the Advisory and Sub-Advisory Contracts for the Portfolio, the Board took into account the factors described above and also considered: (1) the fairness of the compensation under an Advisory Contract with a level fee rate that does not include breakpoints; and (2) the pricing structure (including the expense ratio to be borne by shareholders) of the Portfolio, as compared to its Selected Peer Group, including that: (a) the management fee (inclusive of a 0.055% administration fee) for the Portfolio is above the median and the average management fees of the funds in its Selected Peer Group; and (b) the expense ratio for the Portfolio is below the median and above the average expense ratios of the funds in its Selected Peer Group.
In analyzing the Portfolio’s management fee and expense ratio, the Board took into account Management’s representations that the ING-affiliated insurance companies offering the Portfolio have undertaken the expense of providing a Guarantee, at the variable contract level, that the contract holder will receive no less than the amount invested at the end of the Offering Period, less certain expenses, and the fees paid to those insurance companies for the Guarantee are attractive. The Board also considered that the Adviser bears the risk of reduced fee revenue resulting from redemptions during the Guarantee Period, a period of time during which there are no sales of Portfolio shares.
After its deliberation, the Board reached the following conclusions: (1) the Portfolio’s management fee rate is
76
ADVISORY CONTRACT APPROVAL DISCUSSION (UNAUDITED) (CONTINUED)
reasonable in the context of all factors considered by the Board; (2) the Portfolio’s expense ratio is reasonable in the context of all factors considered by the Board; (3) the Portfolio’s performance is reasonable in the context of all factors considered by the Board; and (4) the sub-advisory fee rate payable by the Adviser to the Sub-Adviser is reasonable in the context of all factors considered by the Board. Based on these conclusions and other factors, the Board voted to renew the Advisory and Sub-Advisory Contracts for the Portfolio for the year ending November 30, 2011. During this renewal process, different Board members may have given different weight to different individual factors and related conclusions.
ING Get U.S. Core Portfolio Series 6
In considering whether to approve the renewal of the Advisory and Sub-Advisory Contracts for ING GET U.S. Core Portfolio—Series 6, the Board considered that, based on performance data for the periods ended June 30, 2010: (1) the Portfolio’s fixed-income component underperformed its fixed-income benchmark for all periods presented; and (2) the Portfolio’s equity component outperformed its equity benchmark for all periods presented, with the exception of the one-year period, during which it underperformed.
In analyzing the Portfolio’s performance, the Board noted Management’s representations that, unlike more conventional mutual funds, during its Guarantee Period the Portfolio’s primary focus is preserving at least the principal amount of the Portfolio at the inception of the Guarantee Period, while at the same time participating in equity markets to the extent consistent with that focus, and this can cause its performance to differ from the performance it may have attained had the Portfolio invested solely in equities or solely in fixed income instruments without regard to principal protection. The Board also considered that the extent to which the Portfolio is able to participate in upward movements of the equity markets is affected by a number of factors, including interest rates and the performance of its equity component.
In considering the fees payable under the Advisory and Sub-Advisory Contracts for the Portfolio, the Board took into account the factors described above and also considered: (1) the fairness of the compensation under an Advisory Contract with a level fee rate that does not include breakpoints; and (2) the pricing structure (including the expense ratio to be borne by shareholders) of the Portfolio, as compared to its
Selected Peer Group, including that: (a) the management fee (inclusive of a 0.055% administration fee) for the Portfolio is above the median and the average management fees of the funds in its Selected Peer Group; and (b) the expense ratio for the Portfolio is below the median and above the average expense ratios of the funds in its Selected Peer Group.
In analyzing the Portfolio’s management fee and expense ratio, the Board took into account Management’s representations that the ING-affiliated insurance companies offering the Portfolio have undertaken the expense of providing a Guarantee, at the variable contract level, that the contract holder will receive no less than the amount invested at the end of the Offering Period, less certain expenses, and the fees paid to those insurance companies for the Guarantee are attractive. The Board also considered that the Adviser bears the risk of reduced fee revenue resulting from redemptions during the Guarantee Period, a period of time during which there are no sales of Portfolio shares.
After its deliberation, the Board reached the following conclusions: (1) the Portfolio’s management fee rate is reasonable in the context of all factors considered by the Board; (2) the Portfolio’s expense ratio is reasonable in the context of all factors considered by the Board; (3) the Portfolio’s performance is reasonable in the context of all factors considered by the Board; and (4) the sub-advisory fee rate payable by the Adviser to the Sub-Adviser is reasonable in the context of all factors considered by the Board. Based on these conclusions and other factors, the Board voted to renew the Advisory and Sub-Advisory Contracts for the Portfolio for the year ending November 30, 2011. During this renewal process, different Board members may have given different weight to different individual factors and related conclusions.
ING Get U.S. Core Portfolio Series 7
In considering whether to approve the renewal of the Advisory and Sub-Advisory Contracts for ING GET U.S. Core Portfolio—Series 7, the Board considered that, based on performance data for the periods ended June 30, 2010: (1) the Portfolio’s fixed-income component underperformed its fixed-income benchmark for all periods presented; and (2) the Portfolio’s equity component outperformed its equity benchmark for all periods presented, with the exception of the one-year period, during which it underperformed.
77
ADVISORY CONTRACT APPROVAL DISCUSSION (UNAUDITED) (CONTINUED)
In analyzing the Portfolio’s performance, the Board noted Management’s representations that, unlike more conventional mutual funds, during its Guarantee Period the Portfolio’s primary focus is preserving at least the principal amount of the Portfolio at the inception of the Guarantee Period while at the same time participating in equity markets to the extent consistent with that focus, and this can cause its performance to differ from the performance it may have attained had the Portfolio invested solely in equities or solely in fixed income instruments without regard to principal protection. The Board also considered that the extent to which the Portfolio is able to participate in upward movements of the equity markets is affected by a number of factors, including interest rates and the performance of its equity component.
In considering the fees payable under the Advisory and Sub-Advisory Contracts for the Portfolio, the Board took into account the factors described above and also considered: (1) the fairness of the compensation under an Advisory Contract with a level fee rate that does not include breakpoints; and (2) the pricing structure (including the expense ratio to be borne by shareholders) of the Portfolio, as compared to its Selected Peer Group, including that: (a) the management fee (inclusive of a 0.055% administration fee) for the Portfolio is above the median and the average management fees of the funds in its Selected Peer Group; and (b) the expense ratio for the Portfolio is below the median and above the average expense ratios of the funds in its Selected Peer Group.
In analyzing the Portfolio’s management fee and expense ratio, the Board took into account Management’s representations that the ING-affiliated insurance companies offering the Portfolio have undertaken the expense of providing a Guarantee, at the variable contract level, that the contract holder will receive no less than the amount invested at the end of the Offering Period, less certain expenses, and the fees paid to those insurance companies for the Guarantee are attractive. The Board also considered that the Adviser bears the risk of reduced fee revenue resulting from redemptions during the Guarantee Period, a period of time during which there are no sales of Portfolio shares.
After its deliberation, the Board reached the following conclusions: (1) the Portfolio’s management fee rate is reasonable in the context of all factors considered by the Board; (2) the Portfolio’s expense ratio is reasonable in the context of all factors considered by the Board; (3) the Portfolio’s performance is reasonable
in the context of all factors considered by the Board; and (4) the sub-advisory fee rate payable by the Adviser to the Sub-Adviser is reasonable in the context of all factors considered by the Board. Based on these conclusions and other factors, the Board voted to renew the Advisory and Sub-Advisory Contracts for the Portfolio for the year ending November 30, 2011. During this renewal process, different Board members may have given different weight to different individual factors and related conclusions.
ING Get U.S. Core Portfolio Series 8
In considering whether to approve the renewal of the Advisory and Sub-Advisory Contracts for ING GET U.S. Core Portfolio—Series 8, the Board considered that, based on performance data for the periods ended June 30, 2010: (1) the Portfolio’s fixed-income component underperformed its fixed-income benchmark for all periods presented, with the exception of the one-year period, during which it outperformed; and (2) the Portfolio’s equity component outperformed its equity benchmark for all periods presented, with the exception of the one-year period, during which it underperformed.
In analyzing the Portfolio’s performance, the Board noted Management’s representations that, unlike more conventional mutual funds, during its Guarantee Period the Portfolio’s primary focus is preserving at least the principal amount of the Portfolio at the inception of the Guarantee Period while at the, same time participating in equity markets to the extent consistent with that focus, and this can cause its performance to differ from the performance it may have attained had the Portfolio invested solely in equities or solely in fixed income instruments without regard to principal protection. The Board also considered that the extent to which the Portfolio is able to participate in upward movements of the equity markets is affected by a number of factors, including interest rates and the performance of its equity component.
In considering the fees payable under the Advisory and Sub-Advisory Contracts for the Portfolio, the Board took into account the factors described above and also considered: (1) the fairness of the compensation under an Advisory Contract with a level fee rate that does not include breakpoints; and (2) the pricing structure (including the expense ratio to be borne by shareholders) of the Portfolio, as compared to its Selected Peer Group, including that: (a) the management fee (inclusive of a 0.055% administration fee) for the Portfolio is above the median and the
78
ADVISORY CONTRACT APPROVAL DISCUSSION (UNAUDITED) (CONTINUED)
average management fees of the funds in its Selected Peer Group; and (b) the expense ratio for the Portfolio is below the median and above the average expense ratios of the funds in its Selected Peer Group.
In analyzing the Portfolio’s management fee and expense ratio, the Board took into account Management’s representations that the ING-affiliated insurance companies offering the Portfolio have undertaken the expense of providing a Guarantee, at the variable contract level, that the contract holder will receive no less than the amount invested at the end of the Offering Period, less certain expenses, and the fees paid to those insurance companies for the Guarantee are attractive. The Board also considered that the Adviser bears the risk of reduced fee revenue resulting from redemptions during the Guarantee Period, a period of time during which there are no sales of Portfolio shares.
After its deliberation, the Board reached the following conclusions: (1) the Portfolio’s management fee rate is reasonable in the context of all factors considered by the Board; (2) the Portfolio’s expense ratio is reasonable in the context of all factors considered by the Board; (3) the Portfolio’s performance is reasonable in the context of all factors considered by the Board; and (4) the sub-advisory fee rate payable by the Adviser to the Sub-Adviser is reasonable in the context of all factors considered by the Board. Based on these conclusions and other factors, the Board voted to renew the Advisory and Sub-Advisory Contracts for the Portfolio for the year ending November 30, 2011. During this renewal process, different Board members may have given different weight to different individual factors and related conclusions.
ING Get U.S. Core Portfolio Series 9
In considering whether to approve the renewal of the Advisory and Sub-Advisory Contracts for ING GET U.S. Core Portfolio—Series 9, the Board considered that, based on performance data for the periods ended June 30, 2010: (1) the Portfolio’s fixed-income component underperformed its fixed-income benchmark for all periods presented, with the exception of the one-year period, during which it outperformed; and (2) the Portfolio’s equity component outperformed its equity benchmark for all periods presented, with the exception of the one-year period, during which it underperformed.
In analyzing the Portfolio’s performance, the Board noted Management’s representations that, unlike more
conventional mutual funds, during its Guarantee Period the Portfolio’s primary focus is preserving at least the principal amount of the Portfolio at the inception of the Guarantee Period, while at the same time participating in equity markets to the extent consistent with that focus, and this can cause its performance to differ from the performance it may have attained had the Portfolio invested solely in equities or solely in fixed income instruments without regard to principal protection. The Board also considered that the extent to which the Portfolio is able to participate in upward movements of the equity markets is affected by a number of factors, including interest rates and the performance of its equity component.
In considering the fees payable under the Advisory and Sub-Advisory Contracts for the, the Board took into account the factors described above and also considered: (1) the fairness of the compensation under an Advisory Contract with a level fee rate that does not include breakpoints; and (2) the pricing structure (including the expense ratio to be borne by shareholders) of the Portfolio, as compared to its Selected Peer Group, including that: (a) the management fee (inclusive of a 0.055% administration fee) for the Portfolio is above the median and the average management fees of the funds in its Selected Peer Group; and (b) the expense ratio for the Portfolio is below the median and above the average expense ratios of the funds in its Selected Peer Group.
In analyzing the Portfolio’s management fee and expense ratio, the Board took into account Management’s representations that the ING-affiliated insurance companies offering the Portfolio have undertaken the expense of providing a Guarantee, at the variable contract level, that the contract holder will receive no less than the amount invested at the end of the Offering Period, less certain expenses, and the fees paid to those insurance companies for the Guarantee are attractive. The Board also considered that the Adviser bears the risk of reduced fee revenue resulting from redemptions during the Guarantee Period, a period of time during which there are no sales of Portfolio shares.
After its deliberation, the Board reached the following conclusions: (1) the Portfolio’s management fee rate is reasonable in the context of all factors considered by the Board; (2) the Portfolio’s expense ratio is reasonable in the context of all factors considered by the Board; (3) the Portfolio’s performance is reasonable in the context of all factors considered by the Board; and (4) the sub-advisory fee rate payable by the Adviser
79
ADVISORY CONTRACT APPROVAL DISCUSSION (UNAUDITED) (CONTINUED)
to the Sub-Adviser is reasonable in the context of all factors considered by the Board. Based on these conclusions and other factors, the Board voted to renew the Advisory and Sub-Advisory Contracts for the Portfolio for the year ending November 30, 2011. During this renewal process, different Board members may have given different weight to different individual factors and related conclusions.
ING Get U.S. Core Portfolio Series 10
In considering whether to approve the renewal of the Advisory and Sub-Advisory Contracts for ING GET U.S. Core Portfolio—Series 10, the Board considered that, based on performance data for the periods ended June 30, 2010, the Portfolio’s fixed-income component outperformed its fixed-income benchmark for the year-to-date and one-year periods, but underperformed for the most recent calendar quarter and three-year period.
In analyzing this performance data, the Board noted Management’s representations that, unlike more conventional mutual funds, during its Guarantee Period the Portfolio’s primary focus is preserving at least the principal amount of the Portfolio at the inception of the Guarantee Period, while at the same time participating in equity markets to the extent consistent with that focus, and this can cause its performance to differ from the performance it may have attained had the Portfolio invested solely in equities or solely in fixed income instruments without regard to principal protection. The Board also considered that the extent to which the Portfolio is able to participate in upward movements of the equity markets is affected by a number of factors, including interest rates and the performance of its equity component.
In considering the fees payable under the Advisory and Sub-Advisory Contracts for the Portfolio, the Board took into account the factors described above and also considered: (1) the fairness of the compensation under an Advisory Contract with a level fee rate that does not include breakpoints; and (2) the pricing structure (including the expense ratio to be borne by shareholders) of the Portfolio, as compared to its Selected Peer Group, including that: (a) the management fee (inclusive of a 0.055% administration fee) for the Portfolio is above the median and the average management fees of the funds in its Selected Peer Group; and (b) the expense ratio for the Portfolio is below the median and above the average expense ratios of the funds in its Selected Peer Group.
In analyzing the Portfolio’s management fee and expense ratio, the Board took into account Management’s representations that the ING-affiliated insurance companies offering the Portfolio have undertaken the expense of providing a Guarantee, at the variable contract level, that the contract holder will receive no less than the amount invested at the end of the Offering Period, less certain expenses, and the fees paid to those insurance companies for the Guarantee are attractive. The Board also considered that the Adviser bears the risk of reduced fee revenue resulting from redemptions during the Guarantee Period, a period of time during which there are no sales of Portfolio shares.
After its deliberation, the Board reached the following conclusions: (1) the Portfolio’s management fee rate is reasonable in the context of all factors considered by the Board; (2) the Portfolio’s expense ratio is reasonable in the context of all factors considered by the Board; (3) the Portfolio’s performance is reasonable in the context of all factors considered by the Board; and (4) the sub-advisory fee rate payable by the Adviser to the Sub-Adviser is reasonable in the context of all factors considered by the Board. Based on these conclusions and other factors, the Board voted to renew the Advisory and Sub-Advisory Contracts for the Portfolio for the year ending November 30, 2011. During this renewal process, different Board members may have given different weight to different individual factors and related conclusions.
ING Get U.S. Core Portfolio Series 11
In considering whether to approve the renewal of the Advisory and Sub-Advisory Contracts for ING GET U.S. Core Portfolio—Series 11, the Board considered that, based on performance data for the periods ended June 30, 2010, the Portfolio’s fixed-income component outperformed its fixed-income benchmark for all periods presented, with the exception of the three-year period, during which it underperformed.
In analyzing this performance data, the Board noted Management’s representations that, unlike more conventional mutual funds, during its Guarantee Period the Portfolio’s primary focus is preserving at least the principal amount of the Portfolio at the inception of the Guarantee Period, while at the same time participating in equity markets to the extent consistent with that focus, and this can cause its performance to differ from the performance it may have attained had the Portfolio invested solely in equities or solely in fixed
80
ADVISORY CONTRACT APPROVAL DISCUSSION (UNAUDITED) (CONTINUED)
income instruments without regard to principal protection. The Board also considered that the extent to which the Portfolio is able to participate in upward movements of the equity markets is affected by a number of factors, including interest rates and the performance of its equity component.
In considering the fees payable under the Advisory and Sub-Advisory Contracts for the Portfolio, the Board took into account the factors described above and also considered: (1) the fairness of the compensation under an Advisory Contract with a level fee rate that does not include breakpoints; and (2) the pricing structure (including the expense ratio to be borne by shareholders) of the Portfolio, as compared to its Selected Peer Group, including that: (a) the management fee (inclusive of a 0.055% administration fee) for the Portfolio is above the median and the average management fees of the funds in its Selected Peer Group; and (b) the expense ratio for the Portfolio is below the median and above the average expense ratios of the funds in its Selected Peer Group.
In analyzing the Portfolio’s management fee and expense ratio, the Board took into account Management’s representations that the ING-affiliated insurance companies offering the Portfolio have undertaken the expense of providing a Guarantee, at the variable contract level, that the contract holder will receive no less than the amount invested at the end of the Offering Period, less certain expenses, and the fees paid to those insurance companies for the Guarantee are attractive. The Board also considered that the Adviser bears the risk of reduced fee revenue resulting from redemptions during the Guarantee Period, a period of time during which there are no sales of Portfolio shares.
After its deliberation, the Board reached the following conclusions: (1) the Portfolio’s management fee rate is reasonable in the context of all factors considered by the Board; (2) the Portfolio’s expense ratio is reasonable in the context of all factors considered by the Board; (3) the Portfolio’s performance is reasonable in the context of all factors considered by the Board; and (4) the sub-advisory fee rate payable by the Adviser to the Sub-Adviser is reasonable in the context of all factors considered by the Board. Based on these conclusions and other factors, the Board voted to renew the Advisory and Sub-Advisory Contracts for the Portfolio for the year ending November 30, 2011. During this renewal process, different Board members may have given different weight to different individual factors and related conclusions.
ING Get U.S. Core Portfolio Series 12
In considering whether to approve the renewal of the Advisory and Sub-Advisory Contracts for ING GET U.S. Core Portfolio—Series 12, the Board considered that, based on performance data for the periods ended June 30, 2010: (1) the Portfolio’s fixed-income component outperformed its fixed-income benchmark for all periods presented, with the exception of the three-year period, during which it underperformed; and (2) the Portfolio’s equity component outperformed its equity benchmark for all periods presented, with the exception of the one-year period, during which it underperformed.
In analyzing the Portfolio’s performance, the Board noted Management’s representations that, unlike more conventional mutual funds, during its Guarantee Period the Portfolio’s primary focus is preserving at least the principal amount of the Portfolio at the inception of the Guarantee Period, while at the same time participating in equity markets to the extent consistent with that focus, and this can cause its performance to differ from the performance it may have attained had the Portfolio invested solely in equities or solely in fixed income instruments without regard to principal protection. The Board also considered that the extent to which the Portfolio is able to participate in upward movements of the equity markets is affected by a number of factors, including interest rates and the performance of its equity component.
In considering the fees payable under the Advisory and Sub-Advisory Contracts for the Portfolio, the Board took into account the factors described above and also considered: (1) the fairness of the compensation under an Advisory Contract with a level fee rate that does not include breakpoints; and (2) the pricing structure (including the expense ratio to be borne by shareholders) of the Portfolio, as compared to its Selected Peer Group, including that: (a) the management fee (inclusive of a 0.055% administration fee) for the Portfolio is above the median and the average management fees of the funds in its Selected Peer Group; and (b) the expense ratio for the Portfolio is below the median and above the average expense ratios of the funds in its Selected Peer Group.
In analyzing the Portfolio’s management fee and expense ratio, the Board took into account Management’s representations that the ING-affiliated insurance companies offering the Portfolio have undertaken the expense of providing a Guarantee, at the variable contract level, that the contract holder will
81
ADVISORY CONTRACT APPROVAL DISCUSSION (UNAUDITED) (CONTINUED)
receive no less than the amount invested at the end of the Offering Period, less certain expenses, and the fees paid to those insurance companies for the Guarantee are attractive. The Board also considered that the Adviser bears the risk of reduced fee revenue resulting from redemptions during the Guarantee Period, a period of time during which there are no sales of Portfolio shares.
After its deliberation, the Board reached the following conclusions: (1) the Portfolio’s management fee rate is reasonable in the context of all factors considered by the Board; (2) the Portfolio’s expense ratio is reasonable in the context of all factors considered by the Board; (3) the Portfolio’s performance is reasonable in the context of all factors considered by the Board; and (4) the sub-advisory fee rate payable by the Adviser to the Sub-Adviser is reasonable in the context of all factors considered by the Board. Based on these conclusions and other factors, the Board voted to renew the Advisory and Sub-Advisory Contracts for the Portfolio for the year ending November 30, 2011. During this renewal process, different Board members may have given different weight to different individual factors and related conclusions.
ING Get U.S. Core Portfolio Series 13
In considering whether to approve the renewal of the Advisory and Sub-Advisory Contracts for ING GET U.S. Core Portfolio—Series 13, the Board considered that, based on performance data for the periods ended June 30, 2010, the Portfolio’s fixed-income component outperformed its fixed-income benchmark for all periods presented, with the exception of the three-year period, during which it underperformed.
In analyzing this performance data, the Board noted Management’s representations that, unlike more conventional mutual funds, during its Guarantee Period the Portfolio’s primary focus is preserving at least the principal amount of the Portfolio at the inception of the Guarantee Period, while at the same time participating in equity markets to the extent consistent with that focus, and this can cause its performance to differ from the performance it may have attained had the Portfolio invested solely in equities or solely in fixed income instruments without regard to principal protection. The Board also considered that the extent to which the Portfolio is able to participate in upward movements of the equity markets is affected by a number of factors, including interest rates and the performance of its equity component.
In considering the fees payable under the Advisory and Sub-Advisory Contracts for the Portfolio, the Board took into account the factors described above and also considered: (1) the fairness of the compensation under an Advisory Contract with a level fee rate that does not include breakpoints; and (2) the pricing structure (including the expense ratio to be borne by shareholders) of the Portfolio, as compared to its Selected Peer Group, including that: (a) the management fee (inclusive of a 0.055% administration fee) for the Portfolio is above the median and the average management fees of the funds in its Selected Peer Group; and (b) the expense ratio for the Portfolio is below the median and above the average expense ratios of the funds in its Selected Peer Group.
In analyzing the Portfolio’s management fee and expense ratio, the Board took into account Management’s representations that the ING-affiliated insurance companies offering the Portfolio have undertaken the expense of providing a Guarantee, at the variable contract level, that the contract holder will receive no less than the amount invested at the end of the Offering Period, less certain expenses, and the fees paid to those insurance companies for the Guarantee are attractive. The Board also considered that the Adviser bears the risk of reduced fee revenue resulting from redemptions during the Guarantee Period, a period of time during which there are no sales of Portfolio shares.
After its deliberation, the Board reached the following conclusions: (1) the Portfolio’s management fee rate is reasonable in the context of all factors considered by the Board; (2) the Portfolio’s expense ratio is reasonable in the context of all factors considered by the Board; (3) the Portfolio’s performance is reasonable in the context of all factors considered by the Board; and (4) the sub-advisory fee rate payable by the Adviser to the Sub-Adviser is reasonable in the context of all factors considered by the Board. Based on these conclusions and other factors, the Board voted to renew the Advisory and Sub-Advisory Contracts for the Portfolio for the year ending November 30, 2011. During this renewal process, different Board members may have given different weight to different individual factors and related conclusions.
ING Get U.S. Core Portfolio Series 14
In considering whether to approve the renewal of the Advisory and Sub-Advisory Contracts for ING GET U.S. Core Portfolio—Series 14, the Board considered that, based on performance data for the periods ended
82
ADVISORY CONTRACT APPROVAL DISCUSSION (UNAUDITED) (CONTINUED)
June 30, 2010, the Portfolio’s fixed-income component outperformed its fixed-income benchmark for all periods presented, with the exception of the one-year period, during which it underperformed.
In analyzing this performance data, the Board noted Management’s representations that, unlike more conventional mutual funds, during its Guarantee Period the Portfolio’s primary focus is preserving at least the principal amount of the Portfolio at the inception of the Guarantee Period, while at the same time participating in equity markets to the extent consistent with that focus, and this can cause its performance to differ from the performance it may have attained had the Portfolio invested solely in equities or solely in fixed income instruments without regard to principal protection. The Board also considered that the extent to which the Portfolio is able to participate in upward movements of the equity markets is affected by a number of factors, including interest rates and the performance of its equity component.
In considering the fees payable under the Advisory and Sub-Advisory Contracts for the Portfolio, the Board took into account the factors described above and also considered: (1) the fairness of the compensation under an Advisory Contract with a level fee rate that does not include breakpoints; and (2) the pricing structure (including the expense ratio to be borne by shareholders) of the Portfolio, as compared to its Selected Peer Group, including that: (a) the management fee (inclusive of a 0.055% administration fee) for the Portfolio is above the median and the average management fees of the funds in its Selected
Peer Group; and (b) the expense ratio for the Portfolio
is below the median and above the average expense ratios of the funds in its Selected Peer Group.
In analyzing the Portfolio’s management fee and expense ratio, the Board took into account Management’s representations that the ING-affiliated insurance companies offering the Portfolio have undertaken the expense of providing a Guarantee, at the variable contract level, that the contract holder will receive no less than the amount invested at the end of the Offering Period, less certain expenses, and the fees paid to those insurance companies for the Guarantee are attractive. The Board also considered that the Adviser bears the risk of reduced fee revenue resulting from redemptions during the Guarantee Period, a period of time during which there are no sales of Portfolio shares.
After its deliberation, the Board reached the following conclusions: (1) the Portfolio’s management fee rate is reasonable in the context of all factors considered by the Board; (2) the Portfolio’s expense ratio is reasonable in the context of all factors considered by the Board; (3) the Portfolio’s performance is reasonable in the context of all factors considered by the Board; and (4) the sub-advisory fee rate payable by the Adviser to the Sub-Adviser is reasonable in the context of all factors considered by the Board. Based on these conclusions and other factors, the Board voted to renew the Advisory and Sub-Advisory Contracts for the Portfolio for the year ending November 30, 2011. During this renewal process, different Board members may have given different weight to different individual factors and related conclusions.
83
Investment Adviser
ING Investments, LLC
7337 East Doubletree Ranch Road, Suite 100
Scottsdale, Arizona 85258
Administrator
ING Funds Services, LLC
7337 East Doubletree Ranch Road, Suite 100
Scottsdale, Arizona 85258
Distributor
ING Investments Distributor, LLC
7337 East Doubletree Ranch Road, Suite 100
Scottsdale, Arizona 85258
Transfer Agent
BNY Mellon Investment Servicing (U.S.) Inc.
(formerly, PNC Global Investment Servicing (U.S.) Inc.)
301 Bellevue Parkway
Wilmington, Delaware 19809
Independent Registered Public Accounting Firm
KPMG LLP
Two Financial Center
60 South Street
Boston, Massachusetts 02111
Custodian
The Bank of New York Mellon
One Wall Street
New York, New York 10286
Legal Counsel
Dechert LLP
1775 I Street, N.W.
Washington, D.C. 20006
Before investing, carefully consider the investment objectives, risks, charges and expenses of the variable annuity contract and the underlying variable investment options. This and other information is contained in the prospectus for the variable annuity contract and the underlying variable investment options. Obtain these prospectuses from your agent/registered representative and read them carefully before investing.
| | | | |
 | | VPAR-UGCORE | | (1210-021711) |
As of the end of the period covered by this report, Registrant had adopted a code of ethics, as defined in Item 2 of Form N-CSR, that applies to the Registrant’s principal executive officer and principal financial officer. There were no amendments to the Code during the period covered by the report. The Registrant did not grant any waivers, including implicit waivers, from any provisions of the Code during the period covered by this report. The code of ethics is filed herewith pursuant to Item 10(a)(1), Exhibit 99.CODE ETH.
| Item 3. | Audit Committee Financial Expert. |
The Board of Trustees has determined that J. Michael Earley and Peter Drotch are audit committee financial experts, as defined in Item 3 of Form N-CSR. Mr. Earley and Mr. Drotch are “independent” for purposes of Item 3 of Form N-CSR.
| Item 4. | Principal Accountant Fees and Services. |
| (a) | Audit Fees: The aggregate fees billed for each of the last two fiscal years for professional services rendered by KPMG LLP (“KPMG”), the principal accountant for the audit of the registrant’s annual financial statements, for services that are normally provided by the accountant in connection with statutory and regulatory filings or engagements for those fiscal years were $189,000 for year ended December 31, 2010 and $170,000 for year ended December 31, 2009. |
| (b) | Audit-Related Fees: The aggregate fees billed in each of the last two fiscal years for assurance and related services by KPMG that are reasonably related to the performance of the audit of the registrant’s financial statements and are not reported under paragraph (a) of this Item were $21,500 for year ended December 31, 2010 and $21,500 for year ended December 31, 2009. |
| (c) | Tax Fees: The aggregate fees billed in each of the last two fiscal years for professional services rendered by KPMG for tax compliance, tax advice, and tax planning were $37,965 in the year ended December 31, 2010 and $37,500 in the year ended December 31, 2009. Such services included review of excise distribution calculations (if applicable), preparation of the Funds’ federal, state and excise tax returns, tax services related to mergers and routine consulting. |
| (d) | All Other Fees: The aggregate fees billed in each of the last two fiscal years for products and services provided by KPMG, other than the services reported in paragraphs (a) through (c) of this Item. |
None
| | |
| (e)(1) | | Audit Committee Pre-Approval Policies and Procedures |
1
AUDIT AND NON-AUDIT SERVICES
PRE-APPROVAL POLICY
| I. | Statement of Principles |
Under the Sarbanes-Oxley Act of 2002 (the “Act”), the Audit Committee of the Board of Directors or Trustees (the “Committee”) of the ING Funds (each a “Fund,” collectively, the “Funds”) set out on Exhibit A to this Audit and Non-Audit Services Pre-Approval Policy (“Policy”) is responsible for the oversight of the work of the Funds’ independent auditors. As part of its responsibilities, the Committee must pre-approve the audit and non-audit services performed by the auditors in order to assure that the provision of these services does not impair the auditors’ independence from the Funds. The Committee has adopted, and the Board has ratified, this Policy, which sets out the procedures and conditions under which the services of the independent auditors may be pre-approved.
Under Securities and Exchange Commission (“SEC”) rules promulgated in accordance with the Act, the Funds may establish two different approaches to pre-approving audit and non-audit services. The Committee may approve services without consideration of specific case-by-case services (“general pre-approval”) or it may pre-approve specific services (“specific pre-approval”). The Committee believes that the combination of these approaches contemplated in this Policy results in an effective and efficient method for pre-approving audit and non-audit services to be performed by the Funds’ independent auditors. Under this Policy, services that are not of a type that may receive general pre-approval require specific pre-approval by the Committee. Any proposed services that exceed pre-approved cost levels or budgeted amounts will also require the Committee’s specific pre-approval.
For both types of approval, the Committee considers whether the subject services are consistent with the SEC’s rules on auditor independence and that such services are compatible with maintaining the auditors independence. The Committee also considers whether a particular audit firm is in the best position to provide effective and efficient services to the Funds. Reasons that the auditors are in the best position include the auditors’ familiarity with the Funds’ business, personnel, culture, accounting systems, risk profile, and other factors, and whether the services will enhance the Funds’ ability to manage and control risk or improve audit quality. Such factors will be considered as a whole, with no one factor being determinative.
The appendices attached to this Policy describe the audit, audit-related, tax-related, and other services that have the Committee’s general pre-approval. For any service that has been approved through general pre-approval, the general pre-approval will remain in place for a period 12 months from the date of pre-approval, unless the Committee determines that a different period is appropriate. The Committee will annually review and pre-approve the services that may be provided by the independent auditors without specific pre-approval. The Committee will revise the list of services subject to general pre-approval as appropriate. This Policy does not serve as a delegation to Fund management of the Committee’s duty to pre-approve services performed by the Funds’ independent auditors.
2
The annual audit services engagement terms and fees are subject to the Committee’s specific pre-approval. Audit services are those services that are normally provided by auditors in connection with statutory and regulatory filings or engagements or those that generally only independent auditors can reasonably provide. They include the Funds’ annual financial statement audit and procedures that the independent auditors must perform in order to form an opinion on the Funds’ financial statements (e.g., information systems and procedural reviews and testing). The Committee will monitor the audit services engagement and approve any changes in terms, conditions or fees deemed by the Committee to be necessary or appropriate.
The Committee may grant general pre-approval to other audit services, such as statutory audits and services associated with SEC registration statements, periodic reports and other documents filed with the SEC or issued in connection with securities offerings.
The Committee has pre-approved the audit services listed on Appendix A. The Committee must specifically approve all audit services not listed on Appendix A.
| III. | Audit-related Services |
Audit-related services are assurance and related services that are reasonably related to the performance of the audit or the review of the Funds’ financial statements or are traditionally performed by the independent auditors. The Committee believes that the provision of audit-related services will not impair the independent auditors’ independence, and therefore may grant pre-approval to audit-related services. Audit-related services include accounting consultations related to accounting, financial reporting or disclosure matters not classified as “audit services;” assistance with understanding and implementing new accounting and financial reporting guidance from rulemaking authorities; agreed-upon or expanded audit procedures relating to accounting and/or billing records required to respond to or comply with financial, accounting or regulatory reporting matters; and assistance with internal control reporting requirements under Form N-SAR or Form N-CSR.
The Committee has pre-approved the audit-related services listed on Appendix B. The Committee must specifically approve all audit-related services not listed on Appendix B.
The Committee believes the independent auditors can provide tax services to the Funds, including tax compliance, tax planning, and tax advice, without compromising the auditors’ independence. Therefore, the Committee may grant general pre-approval with respect to tax services historically provided by the Funds’ independent auditors that do not, in the Committee’s view, impair auditor independence and that are consistent with the SEC’s rules on auditor independence.
The Committee will not grant pre-approval if the independent auditors initially recommends a transaction the sole business purpose of which is tax avoidance and the tax treatment of which may not be supported in the Internal Revenue Code and related regulations. The Committee may consult
3
outside counsel to determine that tax planning and reporting positions are consistent with this Policy.
The Committee has pre-approved the tax-related services listed on Appendix C. The Committee must specifically approve all tax-related services not listed on Appendix C.
The Committee believes it may grant approval of non-audit services that are permissible services for independent auditors to a Fund. The Committee has determined to grant general pre-approval to other services that it believes are routine and recurring, do not impair auditor independence, and are consistent with SEC rules on auditor independence.
The Committee has pre-approved the non-audit services listed on Appendix D. The Committee must specifically approve all non-audit services not listed on Appendix D.
A list of the SEC’s prohibited non-audit services is attached to this Policy as Appendix E. The SEC’s rules and relevant guidance should be consulted to determine the precise definitions of these impermissible services and the applicability of exceptions to certain of the SEC’s prohibitions.
| VI. | Pre-approval of Fee levels and Budgeted Amounts |
The Committee will annually establish pre-approval fee levels or budgeted amounts for audit, audit-related, tax and non-audit services to be provided to the Funds by the independent auditors. Any proposed services exceeding these levels or amounts require the Committee’s specific pre-approval. The Committee considers fees for audit and non-audit services when deciding whether to pre-approve services. The Committee may determine, for a pre-approval period of 12 months, the appropriate ratio between the total amount of fees for the Fund’s audit, audit-related, and tax services (including fees for services provided to Fund affiliates that are subject to pre-approval), and the total amount of fees for certain permissible non-audit services for the Fund classified as other services (including any such services provided to Fund affiliates that are subject to pre-approval).
Requests or applications for services to be provided by the independent auditors will be submitted to management. If management determines that the services do not fall within those services generally pre-approved by the Committee and set out in the appendices to these procedures, management will submit the services to the Committee or its delagee. Any such submission will include a detailed description of the services to be rendered. Notwithstanding this paragraph, the Committee will, on a quarterly basis, receive from the independent auditors a list of services provided for the previous calendar quarter on a cumulative basis by the auditors during the Pre-Approval Period.
4
The Committee may delegate pre-approval authority to one or more of the Committee’s members. Any member or members to whom such pre-approval authority is delegated must report any pre-approval decisions, including any pre-approved services, to the Committee at its next scheduled meeting. The Committee will identify any member to whom pre-approval authority is delegated in writing. The member will retain such authority for a period of 12 months from the date of pre-approval unless the Committee determines that a different period is appropriate. The period of delegated authority may be terminated by the Committee or at the option of the member.
| IX. | Additional Requirements |
The Committee will take any measures the Committee deems necessary or appropriate to oversee the work of the independent auditors and to assure the auditors’ independence from the Funds. This may include reviewing a formal written statement from the independent auditors delineating all relationships between the auditors and the Funds, consistent with Independence Standards Board No. 1, and discussing with the auditors their methods and procedures for ensuring independence.
Effective April 23, 2008, the KPMG LLP (“KPMG”) audit team for the ING Funds accepted the global responsibility for monitoring the auditor independence for KPMG relative to the ING Funds. Using a proprietary system called Sentinel, the audit team is able to identify and manage potential conflicts of interest across the member firms of the KPMG International Network and prevent the provision of prohibited services to the ING entities that would impair KPMG independence with the respect to the ING Funds. In addition to receiving pre-approval from the ING Funds Audit Committee for services provided to the ING Funds and for services for ING entities in the Investment Company Complex, the audit team has developed a process for periodic notification via email to the ING Funds’ Audit Committee Chairpersons regarding requests to provide services to ING Groep NV and its affiliates from KPMG offices worldwide. Additionally, KPMG provides a quarterly summary of the fees for services that have commenced for ING Groep NV and Affiliates at each Audit Committee Meeting.
Last Approved: September 29, 2010
5
Appendix A
Pre-Approved Audit Services for the Pre-Approval Period September 29, 2010 through December 31, 2011
| | | | |
Service | | The Fund (s) | | Fee Range |
| Statutory audits or financial audits (including tax services associated with audit services) | | ü | | As presented to Audit Committee1 |
| | |
| Services associated with SEC registration statements, periodic reports and other documents filed with the SEC or other documents issued in connection with securities offerings (e.g., consents), and assistance in responding to SEC comment letters. | | ü | | Not to exceed $9,750 per filing |
| | |
| Consultations by Fund management with respect to accounting or disclosure treatment of transactions or events and/or the actual or potential effect of final or proposed rules, standards or interpretations by the SEC, Financial Accounting Standards Board, or other regulatory or standard setting bodies. | | ü | | Not to exceed $8,000
during the Pre-
Approval Period |
| | |
| Seed capital audit and related review and issuance of consent on the N-2 registration statement | | ü | | Not to exceed $13,000 per audit |
| 1 | For new Funds launched during the Pre-Approval Period, the fee ranges pre-approved will be the same as those for existing Funds, pro-rated in accordance with inception dates as provided in the auditors’ Proposal or any Engagement Letter covering the period at issue. Fees in the Engagement Letter will be controlling. |
6
Appendix B
Pre-Approved Audit-Related Services for the Pre-Approval Period September 29, 2010 through December 31, 2011
| | | | | | |
Service | | The Fund(s) | | Fund Affiliates | | Fee Range |
| Services related to Fund mergers (Excludes tax services - See Appendix C for tax services associated with Fund mergers) | | ü | | ü | | Not to exceed $10,000 per merger |
| Consultations by Fund management with respect to accounting or disclosure treatment of transactions or events and/or the actual or potential effect of final or proposed rules, standards or interpretations by the SEC, Financial Accounting Standards Board, or other regulatory or standard setting bodies. [Note: Under SEC rules some consultations may be “audit” services and others may be “audit-related” services.] | | ü | | | | Not to exceed $5,000 per occurrence during the Pre-Approval Period |
| | | |
| Review of the Funds’ semi-annual and quarterly financial statements | | ü | | | | Not to exceed $2,400 per set of financial statements per fund |
| | | |
| Reports to regulatory or government agencies related to the annual engagement | | ü | | | | Up to $5,000 per occurrence during the Pre-Approval Period |
| | | |
| Regulatory compliance assistance | | ü | | ü | | Not to exceed $5,000 per quarter |
| | | |
| Training courses | | | | ü | | Not to exceed $2,000 per course |
| | | |
| For Prime Rate Trust, agreed upon procedures for quarterly reports to rating agencies | | ü | | | | Not to exceed $9,450 per quarter |
7
Appendix C
Pre-Approved Tax Services for the Pre-Approval Period September 29, 2010 through December 31, 2011
| | | | | | |
Service | | The Fund(s) | | Fund Affiliates | | Fee Range |
| Preparation of federal and state income tax returns and federal excise tax returns for the Funds including assistance and review with excise tax distributions | | ü | | | | As presented to Audit Committee1 |
| | | |
| Review of IRC Sections 851(b) and 817(h) diversification testing on a real-time basis | | ü | | | | As presented to Audit Committee2 |
| | | |
| Assistance and advice regarding year-end reporting for 1099’s | | ü | | | | As presented to Audit Committee2 |
| | | |
| Tax assistance and advice regarding statutory, regulatory or administrative developments | | ü | | ü | | Not to exceed $5,000 for the Funds or for the Funds’ investment adviser during the Pre-Approval Period |
| 2 | For new Funds launched during the Pre-Approval Period, the fee ranges pre-approved will be the same as those for existing Funds, pro-rated in accordance with inception dates as provided in the auditors’ Proposal or any Engagement Letter covering the period at issue. Fees in the Engagement Letter will be controlling. |
8
Appendix C, continued
| | | | | | |
Service | | The Fund(s) | | Fund Affiliates | | Fee Range |
| Tax training courses | | | | ü | | Not to exceed $2,000 per course during the Pre-Approval Period |
| | | |
| Tax services associated with Fund mergers | | ü | | ü | | Not to exceed $4,000 per fund per merger during the Pre-Approval Period |
| | | |
| Other tax-related assistance and consultation, including, without limitation, assistance in evaluating derivative financial instruments and international tax issues, qualification and distribution issues, and similar routine tax consultations. | | ü | | | | Not to exceed $120,000 during the Pre-Approval Period |
9
Appendix D
Pre-Approved Other Services for the Pre-Approval Period September 29 , 2010 through December 31, 2011
| | | | | | |
Service | | The Fund(s) | | Fund Affiliates | | Fee Range |
| Agreed-upon procedures for Class B share 12b-1 programs | | | | ü | | Not to exceed $60,000 during the Pre-Approval Period |
| | | |
Security counts performed pursuant to Rule 17f-2 of the 1940 Act (i.e., counts for Funds holding securities with affiliated sub-custodians) Cost to be borne 50% by the Funds and 50% by ING Investments, LLC. | | ü | | ü | | Not to exceed $5,000 per Fund during the Pre-Approval Period |
| | | |
| Agreed upon procedures for 15 (c) FACT Books | | ü | | | | Not to exceed $35,000 during the Pre-Approval Period |
10
Appendix E
Prohibited Non-Audit Services
Dated: September 29. 2010 to December 31, 2011
| | • | | Bookkeeping or other services related to the accounting records or financial statements of the Funds |
| | • | | Financial information systems design and implementation |
| | • | | Appraisal or valuation services, fairness opinions, or contribution-in-kind reports |
| | • | | Internal audit outsourcing services |
| | • | | Broker-dealer, investment adviser, or investment banking services |
| | • | | Expert services unrelated to the audit |
| | • | | Any other service that the Public Company Accounting Oversight Board determines, by regulation, is impermissible |
11
EXHIBIT A
ING EQUITY TRUST
ING FUNDS TRUST
ING ASIA PACIFIC HIGH DIVIDEND EQUITY INCOME FUND
ING GLOBAL ADVANTAGE AND PREMIUM OPPORTUNITY FUND
ING GLOBAL EQUITY DIVIDEND AND PREMIUM OPPORTUNITY FUND
ING INTERNATIONAL HIGH DIVIDEND EQUITY INCOME FUND
ING INFRASTRUCTURE, INDUSTRIALS, AND MATERIALS FUND
ING RISK MANAGED NATURAL RESOURCES FUNDING INVESTORS TRUST
ING MAYFLOWER TRUST
ING MUTUAL FUNDS
ING PARTNERS, INC.
ING PRIME RATE TRUST
ING SENIOR INCOME FUND
ING SEPARATE PORTFOLIOS TRUST
ING VARIABLE INSURANCE TRUST
ING VARIABLE PRODUCTS TRUST
12
| (e) (2) | Percentage of services referred to in 4(b) — (4)(d) that were approved by the audit committee |
100% of the services were approved by the audit committee.
| (f) | Percentage of hours expended attributable to work performed by other than full time employees of KPMG if greater than 50%. |
Not applicable.
| (g) | Non-Audit Fees: The non-audit fees billed by the registrant’s accountant for services rendered to the registrant, and rendered to the registrant’s investment adviser, and any entity controlling, controlled by, or under common control with the adviser that provides ongoing services to the registrant for each of the last two fiscal years of the registrant were $1,220,728 for year ended December 31, 2010 and $2,106,219 for year ended December 31, 2009. |
| (h) | Principal Accountants Independence: The Registrant’s Audit committee has considered whether the provision of non-audit services that were rendered to the registrant’s investment adviser and any entity controlling, controlled by, or under common control with the investment adviser that provides ongoing services to the registrant that were not pre-approved pursuant to Rule 2-01(c)(7)(ii) of Regulation S-X is compatible with maintaining KPMG’s independence. |
13
| Item 5. | Audit Committee of Listed Registrants. |
Not applicable.
14
| Item 6. | Schedule of Investments |
Summary schedule is included as part of the report to shareholders filed under Item 1 of this Form, if applicable.
15
PORTFOLIO OF INVESTMENTS
| | |
| ING GET U.S. Core Portfolio Series 5 | | as of December 31, 2010 |
| | | | | | | | | | | | | | | | | | | | |
| Shares | | | | | | | | Value | |
| EXCHANGE-TRADED FUNDS: | | | 8.9 | % | | | | | | | | |
| | | | | | | | Exchange-Traded Funds: | | | | | | | 8.9 | % | | | | |
| | 10,500 | | | | | | | SPDR Trust Series 1 | | | | | | | | | | $ | 1,320,690 | |
| | | | | | | | | | | | | | | | | | | | |
| | | | | | | | Total Exchange-Traded Funds | | | | | | | | | | | | |
| | | | | | | | (Cost $862,999) | | | | | | | | | | | 1,320,690 | |
| | | | | | | | | | | | | | | | | | | | |
| | | |
| Principal Amount | | | | | | | | Value | |
| U.S. GOVERNMENT AGENCY OBLIGATIONS: | | | 71.6 | % | | | | | | | | |
| | | | | | | | Federal Home Loan Mortgage Corporation##: | | | | | | | 15.8 | % | | | | |
| | $2,366,000 | | | | S, ^, Z | | | 0.710%, due 09/15/11 | | | | | | | | | | $ | 2,353,948 | |
| | | | | | | | | | | | | | | | | | | | |
| | | | | | | | | | | | | | | | | | | 2,353,948 | |
| | | | | | | | | | | | | | | | | | | | |
| | | | | | | | Federal National Mortgage Association##: | | | | | | | 18.6 | % | | | | |
| | 2,783,000 | | | | ^, Z | | | 0.660%, due 05/15/11 | | | | | | | | | | | 2,776,145 | |
| | | | | | | | | | | | | | | | | | | | |
| | | | | | | | | | | | | | | | | | | 2,776,145 | |
| | | | | | | | | | | | | | | | | | | | |
| | | | | | | | Other U.S. Agency Obligations: | | | | | | | 37.2 | % | | | | |
| | 2,589,000 | | | | ^, Z | | | Financing Corp., 0.620%, due 10/06/11 | | | | | | | | | | | 2,576,555 | |
| | 3,000,000 | | | | ^, Z | | | Tennessee Valley Authority, 0.820%, due 07/15/11 | | | | | | | | | | | 2,986,710 | |
| | | | | | | | | | | | | | | | | | | | |
| | | | | | | | | | | | | | | | | | | 5,563,265 | |
| | | | | | | | | | | | | | | | | | | | |
| | | | | | | | Total U.S. Government Agency Obligations | | | | | | | | | | | | |
| | | | | | | | (Cost $10,571,182) | | | | | | | | | | | 10,693,358 | |
| | | | | | | | | | | | | | | | | | | | |
| U.S. TREASURY OBLIGATIONS: | | | 18.2 | % | | | | | | | | |
| | | | | | | | U.S. Treasury STRIP COUPON: | | | | | | | 18.2 | % | | | | |
| | 2,724,000 | | | | Z | | | 0.210%, due 08/15/11 | | | | | | | | | | | 2,720,426 | |
| | | | | | | | | | | | | | | | | | | | |
| | | | | | | | Total U.S. Treasury Obligations | | | | | | | | | | | | |
| | | | | | | | (Cost $2,689,022) | | | | | | | | | | | 2,720,426 | |
| | | | | | | | | | | | | | | | | | | | |
| | | | | | | | Total Long-Term Investments | | | | | | | | | | | | |
| | | | | | | | (Cost $14,123,203) | | | | | | | | | | | 14,734,474 | |
| | | | | | | | | | | | | | | | | | | | |
| | | |
| Shares | | | | | | | | Value | |
| SHORT-TERM INVESTMENTS: | | | 1.4 | % | | | | | | | | |
| | | | | | | | Mutual Funds: | | | | | | | 1.4 | % | | | | |
| | 202,000 | | | | | | | Blackrock Liquidity Funds TempFund Portfolio - Class I | | | | | | | | | | $ | 202,000 | |
| | | | | | | | | | | | | | | | | | | | |
| | | | | | | | Total Short-Term Investments | | | | | | | | | | | | |
| | | | | | | | (Cost $202,000) | | | | | | | | | | | 202,000 | |
| | | | | | | | | | | | | | | | | | | | |
| | | | | | | | Total Investments in Securities | | | | | | | | | | | | |
| | | | | | | | (Cost $14,325,203) * | | | 100.1 | % | | | | | | $ | 14,936,474 | |
| | | | | | | | Other Assets and Liabilities - Net | | | (0.1 | ) | | | | | | | (8,406 | ) |
| | | | | | | | | | | | | | | | | | | | |
| | | | | | | | Net Assets | | | 100.0 | % | | | | | | $ | 14,928,068 | |
| | | | | | | | | | | | | | | | | | | | |
| | |
STRIP | | Separate Trading of Registered Interest and Principal of Securities |
## | | On September 7, 2008, the Federal Housing Finance Agency placed the Federal National Mortgage Association and the Federal Home Loan Mortgage Corporation into conservatorship and the U.S. Treasury guaranteed the debt issued by those organizations. |
S | | All or a portion of this security has been identified by the Fund to cover future collateral requirements for applicable futures, options, swaps, foreign currency contracts and/or when-issued or delayed-delivery securities. |
^ | | Interest only securities represent the right to receive the monthly interest payments on an underlying pool of mortgage loans. Principal amount shown represents the notional amount on which current interest is calculated. Payments of principal on the pool reduce the value of the interest only security. |
Z | | Indicates Zero Coupon Bond; rate shown reflects current effective yield. |
S | | All or a portion of this security has been identified by the Fund to cover future collateral requirements for applicable futures, options, swaps, foreign currency contracts and/or when-issued or delayed-delivery securities. |
16
PORTFOLIO OF INVESTMENTS
| | |
| ING GET U.S. Core Portfolio Series 6 | | as of December 31, 2010 |
| | | | | | | | | | | | | | | | | | | | |
| Shares | | | | | | | | Value | |
| EXCHANGE-TRADED FUNDS: | | | 8.0 | % | | | | | | | | |
| | | | | | | | Exchange-Traded Funds: | | | | | | | 8.0 | % | | | | |
| | 18,300 | | | | | | | SPDR Trust Series 1 | | | | | | | | | | $ | 2,301,774 | |
| | | | | | | | | | | | | | | | | | | | |
| | | | | | | | Total Exchange-Traded Funds | | | | | | | | | | | | |
| | | | | | | | (Cost $1,504,084) | | | | | | | | | | | 2,301,774 | |
| | | | | | | | | | | | | | | | | | | | |
| | | |
| Principal Amount | | | | | | | | Value | |
| U.S. GOVERNMENT AGENCY OBLIGATIONS: | | | 71.0 | % | | | | | | | | |
| | | | | | | | Federal Home Loan Mortgage Corporation##: | | | | | | | 19.6 | % | | | | |
| | $5,664,000 | | | | ^^, Z | | | 0.730%, due 09/15/11 | | | | | | | | | | $ | 5,634,983 | |
| | | | | | | | | | | | | | | | | | | | |
| | | | | | | | | | | | | | | | | | | 5,634,983 | |
| | | | | | | | | | | | | | | | | | | | |
| | | | | | | | Federal National Mortgage Association##: | | | | | | | 18.5 | % | | | | |
| | 2,500,000 | | | | ^, Z | | | 0.720%, due 11/15/11 | | | | | | | | | | | 2,484,105 | |
| | 2,840,000 | | | | ^, Z | | | 0.850%, due 02/12/12 | | | | | | | | | | | 2,812,818 | |
| | | | | | | | | | | | | | | | | | | | |
| | | | | | | | | | | | | | | | | | | 5,296,923 | |
| | | | | | | | | | | | | | | | | | | | |
| | | | | | | | Other U.S. Agency Obligations: | | | | | | | 32.9 | % | | | | |
| | 2,638,000 | | | | ^, Z | | | Financing Corp., 0.640%, due 12/06/11 | | | | | | | | | | | 2,622,202 | |
| | 1,666,000 | | | | ^, Z | | | Financing Corp., 0.650%, due 11/30/11 | | | | | | | | | | | 1,656,044 | |
| | 5,169,000 | | | | ^, Z | | | Resolution Funding Corp., 0.360%, due 10/15/11 | | | | | | | | | | | 5,154,377 | |
| | | | | | | | | | | | | | | | | | | | |
| | | | | | | | | | | | | | | | | | | 9,432,623 | |
| | | | | | | | | | | | | | | | | | | | |
| | | | | | | | Total U.S. Government Agency Obligations | | | | | | | | | | | | |
| | | | | | | | (Cost $20,000,649) | | | | | | | | | | | 20,364,529 | |
| | | | | | | | | | | | | | | | | | | | |
| U.S. TREASURY OBLIGATIONS: | | | 20.4 | % | | | | | | | | |
| | | | | | | | U.S. Treasury STRIP COUPON: | | | | | | | 20.4 | % | | | | |
| | 5,886,000 | | | | Z | | | 0.350%, due 02/15/12 | | | | | | | | | | | 5,862,797 | |
| | | | | | | | | | | | | | | | | | | | |
| | | | | | | | Total U.S. Treasury Obligations | | | | | | | | | | | | |
| | | | | | | | (Cost $5,721,257) | | | | | | | | | | | 5,862,797 | |
| | | | | | | | | | | | | | | | | | | | |
| | | | | | | | Total Long-Term Investments | | | | | | | | | | | | |
| | | | | | | | (Cost $27,225,990) | | | | | | | | | | | 28,529,100 | |
| | | | | | | | | | | | | | | | | | | | |
| | | |
| Shares | | | | | | | | Value | |
| SHORT-TERM INVESTMENTS: | | | 0.9 | % | | | | | | | | |
| | | | | | | | Mutual Funds: | | | | | | | 0.9 | % | | | | |
| | 255,000 | | | | | | | Blackrock Liquidity Funds TempFund Portfolio - Class I | | | | | | | | | | $ | 255,000 | |
| | | | | | | | | | | | | | | | | | | | |
| | | | | | | | Total Short-Term Investments | | | | | | | | | | | | |
| | | | | | | | (Cost $255,000) | | | | | | | | | | | 255,000 | |
| | | | | | | | | | | | | | | | | | | | |
| | | | | | | | Total Investments in Securities | | | | | | | | | | | | |
| | | | | | | | (Cost $27,480,990) * | | | 100.3 | % | | | | | | $ | 28,784,100 | |
| | | | | | | | Other Assets and Liabilities - Net | | | (0.3 | ) | | | | | | | (89,574 | ) |
| | | | | | | | | | | | | | | | | | | | |
| | | | | | | | Net Assets | | | 100.0 | % | | | | | | $ | 28,694,526 | |
| | | | | | | | | | | | | | | | | | | | |
| | |
| STRIP | | Separate Trading of Registered Interest and Principal of Securities |
| ## | | On September 7, 2008, the Federal Housing Finance Agency placed the Federal National Mortgage Association and the Federal Home Loan Mortgage Corporation into conservatorship and the U.S. Treasury guaranteed the debt issued by those organizations. |
| ^ | | Interest only securities represent the right to receive the monthly interest payments on an underlying pool of mortgage loans. Principal amount shown represents the notional amount on which current interest is calculated. Payments of principal on the pool reduce the value of the interest only security. |
| ^^ | | Principal only securities represent the right to receive the monthly principal payments on an underlying pool of mortgage loans. No payments of interest on the pool are passed through the principal only security. |
| Z | | Indicates Zero Coupon Bond; rate shown reflects current effective yield. |
17
PORTFOLIO OF INVESTMENTS
| | |
| ING GET U.S. Core Portfolio Series 7 | | as of December 31, 2010 |
| | | | | | | | | | | | | | | | | | | | |
| Shares | | | | | | | | Value | |
| EXCHANGE-TRADED FUNDS: | | | 5.9 | % | | | | | | | | |
| | | | | | | | Exchange-Traded Funds: | | | | | | | 5.9 | % | | | | |
| | 9,400 | | | | | | | SPDR Trust Series 1 | | | | | | | | | | $ | 1,182,332 | |
| | | | | | | | | | | | | | | | | | | | |
| | | | | | | | Total Exchange-Traded Funds | | | | | | | | | | | | |
| | | | | | | | (Cost $772,590) | | | | | | | | | | | 1,182,332 | |
| | | | | | | | | | | | | | | | | | | | |
| | | |
| Principal Amount | | | | | | | | Value | |
| U.S. GOVERNMENT AGENCY OBLIGATIONS: | | | 53.9 | % | | | | | | | | |
| | | | | | | | Federal Home Loan Mortgage Corporation##: | | | | | | | 14.9 | % | | | | |
| | $3,000,000 | | | | ^,��Z | | | 0.970%, due 07/15/12 | | | | | | | | | | $ | 2,955,063 | |
| | | | | | | | | | | | | | | | | | | | |
| | | | | | | | | | | | | | | | | | | 2,955,063 | |
| | | | | | | | | | | | | | | | | | | | |
| | | | | | | | Federal National Mortgage Association##: | | | | | | | 24.0 | % | | | | |
| | 4,838,000 | | | | Z | | | 0.870%, due 03/15/12 | | | | | | | | | | | 4,786,935 | |
| | | | | | | | | | | | | | | | | | | | |
| | | | | | | | | | | | | | | | | | | 4,786,935 | |
| | | | | | | | | | | | | | | | | | | | |
| | | | | | | | Other U.S. Agency Obligations: | | | | | | | 15.0 | % | | | | |
| | 3,000,000 | | | | ^, Z | | | Resolution Funding Corp., 0.360%, due 10/15/11 | | | | | | | | | | | 2,991,513 | |
| | | | | | | | | | | | | | | | | | | | |
| | | | | | | | | | | | | | | | | | | 2,991,513 | |
| | | | | | | | | | | | | | | | | | | | |
| | | | | | | | Total U.S. Government Agency Obligations | | | | | | | | | | | | |
| | | | | | | | (Cost $10,532,290) | | | | | | | | | | | 10,733,511 | |
| | | | | | | | | | | | | | | | | | | | |
| U.S. TREASURY OBLIGATIONS: | | | 23.0 | % | | | | | | | | |
| | | | | | | | U.S. Treasury STRIP COUPON: | | | | | | | 23.0 | % | | | | |
| | 4,589,000 | | | | Z | | | 0.350%, due 02/15/12 | | | | | | | | | | | 4,570,910 | |
| | | | | | | | | | | | | | | | | | | | |
| | | | | | | | Total U.S. Treasury Obligations | | | | | | | | | | | | |
| | | | | | | | (Cost $4,457,696) | | | | | | | | | | | 4,570,910 | |
| | | | | | | | | | | | | | | | | | | | |
| OTHER BONDS: | | | 16.4 | % | | | | | | | | |
| | | | | | | | Foreign Government Bonds: | | | | | | | 16.4 | % | | | | |
| | 3,300,000 | | | | Z | | | Israel Government International Bond, 0.670%, due 05/15/12 | | | | | | | | | | | 3,269,792 | |
| | | | | | | | | | | | | | | | | | | | |
| | | | | | | | Total Other Bonds | | | | | | | | | | | | |
| | | | | | | | (Cost $3,104,516) | | | | | | | | | | | 3,269,792 | |
| | | | | | | | | | | | | | | | | | | | |
| | | | | | | | Total Long-Term Investments | | | | | | | | | | | | |
| | | | | | | | (Cost $18,867,092) | | | | | | | | | | | 19,756,545 | |
| | | | | | | | | | | | | | | | | | | | |
| | | | | | | | | | | | | | | | | | | | |
| | | |
| Shares | | | | | | | | Value | |
| SHORT-TERM INVESTMENTS: | | | 1.0 | % | | | | | | | | |
| | | | | | | | Mutual Funds: | | | | | | | 1.0 | % | | | | |
| | 203,000 | | | | | | | Blackrock Liquidity Funds TempFund Portfolio - Class I | | | | | | | | | | $ | 203,000 | |
| | | | | | | | | | | | | | | | | | | | |
| | | | | | | | Total Short-Term Investments | | | | | | | | | | | | |
| | | | | | | | (Cost $203,000) | | | | | | | | | | | 203,000 | |
| | | | | | | | | | | | | | | | | | | | |
| | | | | | | | Total Investments in Securities | | | | | | | | | | | | |
| | | | | | | | (Cost $19,070,092) * | | | 100.2 | % | | | | | | $ | 19,959,545 | |
| | | | | | | | Other Assets and Liabilities - Net | | | (0.2 | ) | | | | | | | (39,502 | ) |
| | | | | | | | | | | | | | | | | | | | |
| | | | | | | | Net Assets | | | 100.0 | % | | | | | | $ | 19,920,043 | |
| | | | | | | | | | | | | | | | | | | | |
| | |
| STRIP | | Separate Trading of Registered Interest and Principal of Securities |
## | | On September 7, 2008, the Federal Housing Finance Agency placed the Federal National Mortgage Association and the Federal Home Loan Mortgage Corporation into conservatorship and the U.S. Treasury guaranteed the debt issued by those organizations. |
^ | | Interest only securities represent the right to receive the monthly interest payments on an underlying pool of mortgage loans. Principal amount shown represents the notional amount on which current interest is calculated. Payments of principal on the pool reduce the value of the interest only security. |
Z | | Indicates Zero Coupon Bond; rate shown reflects current effective yield. |
18
PORTFOLIO OF INVESTMENTS
| | |
| ING GET U.S. Core Portfolio Series 8 | | as of December 31, 2010 |
| | | | | | | | | | | | | | | | | | | | |
| Shares | | | | | | | | Value | |
| EXCHANGE-TRADED FUNDS: | | | 4.7 | % | | | | | | | | |
| | | | | | | | Exchange-Traded Funds: | | | | | | | 4.7 | % | | | | |
| | 4,600 | | | | | | | SPDR Trust Series 1 | | | | | | | | | | $ | 578,588 | |
| | | | | | | | | | | | | | | | | | | | |
| | | | | | | | Total Exchange-Traded Funds | | | | | | | | | | | | |
| | | | | | | | (Cost $378,076) | | | | | | | | | | | 578,588 | |
| | | | | | | | | | | | | | | | | | | | |
| | | |
| Principal Amount | | | | | | | | Value | |
| U.S. GOVERNMENT AGENCY OBLIGATIONS: | | | 76.2 | % | | | | | | | | |
| | | | | | | | Federal Home Loan Mortgage Corporation##: | | | | | | | 18.6 | % | | | | |
| | $2,325,000 | | | | ^, Z | | | 0.860%, due 03/15/12 | | | | | | | | | | $ | 2,300,873 | |
| | | | | | | | | | | | | | | | | | | | |
| | | | | | | | | | | | | | | | | | | 2,300,873 | |
| | | | | | | | | | | | | | | | | | | | |
| | | | | | | | Federal National Mortgage Association##: | | | | | | | 19.1 | % | | | | |
| | 2,400,000 | | | | Z | | | 0.870%, due 03/15/12 | | | | | | | | | | | 2,374,668 | |
| | | | | | | | | | | | | | | | | | | | |
| | | | | | | | | | | | | | | | | | | 2,374,668 | |
| | | | | | | | | | | | | | | | | | | | |
| | | | | | | | Other U.S. Agency Obligations: | | | | | | | 38.5 | % | | | | |
| | 2,368,000 | | | | ^, Z | | | Financing Corp., 0.680%, due 03/26/12 | | | | | | | | | | | 2,348,136 | |
| | 2,455,000 | | | | Z | | | Resolution Funding Corp., 0.670%, due 04/15/12 | | | | | | | | | | | 2,433,580 | |
| | | | | | | | | | | | | | | | | | | | |
| | | | | | | | | | | | | | | | | | | 4,781,716 | |
| | | | | | | | | | | | | | | | | | | | |
| | | | | | | | Total U.S. Government Agency Obligations | | | | | | | | | | | | |
| | | | | | | | (Cost $9,241,743) | | | | | | | | | | | 9,457,257 | |
| | | | | | | | | | | | | | | | | | | | |
| U.S. TREASURY OBLIGATIONS: | | | 18.0 | % | | | | | | | | |
| | | | | | | | U.S. Treasury STRIP COUPON: | | | | | | | 18.0 | % | | | | |
| | 2,253,000 | | | | Z | | | 0.520%, due 08/15/12 | | | | | | | | | | | 2,234,018 | |
| | | | | | | | | | | | | | | | | | | | |
| | | | | | | | Total U.S. Treasury Obligations | | | | | | | | | | | | |
| | | | | | | | (Cost $2,220,162) | | | | | | | | | | | 2,234,018 | |
| | | | | | | | | | | | | | | | | | | | |
| | | | | | | | Total Long-Term Investments | | | | | | | | | | | | |
| | | | | | | | (Cost $11,839,981) | | | | | | | | | | | 12,269,863 | |
| | | | | | | | | | | | | | | | | | | | |
| | | |
| Shares | | | | | | | | Value | |
| SHORT-TERM INVESTMENTS: | | | 1.6 | % | | | | | | | | |
| | | | | | | | Mutual Funds: | | | | | | | 1.6 | % | | | | |
| | 198,000 | | | | | | | Blackrock Liquidity Funds TempFund Portfolio - Class I | | | | | | | | | | $ | 198,000 | |
| | | | | | | | | | | | | | | | | | | | |
| | | | | | | | Total Short-Term Investments | | | | | | | | | | | | |
| | | | | | | | (Cost $198,000) | | | | | | | | | | | 198,000 | |
| | | | | | | | | | | | | | | | | | | | |
| | | | | | | | Total Investments in Securities | | | | | | | | | | | | |
| | | | | | | | (Cost $12,037,981) * | | | 100.5 | % | | | | | | $ | 12,467,863 | |
| | | | | | | | Other Assets and Liabilities - Net | | | (0.5 | ) | | | | | | | (55,900 | ) |
| | | | | | | | | | | | | | | | | | | | |
| | | | | | | | Net Assets | | | 100.0 | % | | | | | | $ | 12,411,963 | |
| | | | | | | | | | | | | | | | | | | | |
| | |
STRIP | | Separate Trading of Registered Interest and Principal of Securities |
## | | On September 7, 2008, the Federal Housing Finance Agency placed the Federal National Mortgage Association and the Federal Home Loan Mortgage Corporation into conservatorship and the U.S. Treasury guaranteed the debt issued by those organizations. |
^ | | Interest only securities represent the right to receive the monthly interest payments on an underlying pool of mortgage loans. Principal amount shown represents the notional amount on which current interest is calculated. Payments of principal on the pool reduce the value of the interest only security. |
Z | | Indicates Zero Coupon Bond; rate shown reflects current effective yield. |
19
PORTFOLIO OF INVESTMENTS
| | |
| ING GET U.S. Core Portfolio Series 9 | | as of December 31, 2010 |
| | | | | | | | | | | | | | | | | | | | |
| Shares | | | | | | | | Value | |
| EXCHANGE-TRADED FUNDS: | | | 6.8 | % | | | | | | | | |
| | | | | | | | Exchange-Traded Funds: | | | | | | | 6.8 | % | | | | |
| | 5,700 | | | | | | | SPDR Trust Series 1 | | | | | | | | | | $ | 716,946 | |
| | | | | | | | | | | | | | | | | | | | |
| | | | | | | | Total Exchange-Traded Funds | | | | | | | | | | | | |
| | | | | | | | (Cost $468,485) | | | | | | | | | | | 716,946 | |
| | | | | | | | | | | | | | | | | | | | |
| | | |
| Principal Amount | | | | | | | | Value | |
| U.S. GOVERNMENT AGENCY OBLIGATIONS: | | | 79.3 | % | | | | | | | | |
| | | | | | | | Federal Home Loan Mortgage Corporation##: | | | | | | | 20.5 | % | | | | |
| | $2,205,000 | | | | Z | | | 1.050%, due 09/15/12 | | | | | | | | | | $ | 2,165,707 | |
| | | | | | | | | | | | | | | | | | | | |
| | | | | | | | | | | | | | | | | | | 2,165,707 | |
| | | | | | | | | | | | | | | | | | | | |
| | | | | | | | Federal National Mortgage Association##: | | | | | | | 20.7 | % | | | | |
| | 2,212,000 | | | | ^, Z | | | 0.970%, due 07/15/12 | | | | | | | | | | | 2,178,882 | |
| | | | | | | | | | | | | | | | | | | | |
| | | | | | | | | | | | | | | | | | | 2,178,882 | |
| | | | | | | | | | | | | | | | | | | | |
| | | | | | | | Other U.S. Agency Obligations: | | | | | | | 38.1 | % | | | | |
| | 2,200,000 | | | | ^, Z | | | Financing Corp., 0.900%, due 10/06/12 | | | | | | | | | | | 2,165,158 | |
| | 1,875,000 | | | | ^, Z | | | Resolution Funding Corp., 0.800%, due 07/15/12 | | | | | | | | | | | 1,852,279 | |
| | | | | | | | | | | | | | | | | | | | |
| | | | | | | | | | | | | | | | | | | 4,017,437 | |
| | | | | | | | | | | | | | | | | | | | |
| | | | | | | | Total U.S. Government Agency Obligations | | | | | | | | | | | | |
| | | | | | | | (Cost $8,122,429) | | | | | | | | | | | 8,362,026 | |
| | | | | | | | | | | | | | | | | | | | |
| U.S. TREASURY OBLIGATIONS: | | | 12.7 | % | | | | | | | | |
| | | | | | | | U.S. Treasury STRIP COUPON: | | | | | | | 12.7 | % | | | | |
| | 1,355,000 | | | | Z | | | 0.520%, due 08/15/12 | | | | | | | | | | | 1,343,584 | |
| | | | | | | | | | | | | | | | | | | | |
| | | | | | | | Total U.S. Treasury Obligations | | | | | | | | | | | | |
| | | | | | | | (Cost $1,296,318) | | | | | | | | | | | 1,343,584 | |
| | | | | | | | | | | | | | | | | | | | |
| | | | | | | | Total Long-Term Investments | | | | | | | | | | | | |
| | | | | | | | (Cost $9,887,232) | | | | | | | | | | | 10,422,556 | |
| | | | | | | | | | | | | | | | | | | | |
| | | |
| Shares | | | | | | | | Value | |
| SHORT-TERM INVESTMENTS: | | | 1.4 | % | | | | | | | | |
| | | | | | | | Mutual Funds: | | | | | | | 1.4 | % | | | | |
| | 143,000 | | | | | | | Blackrock Liquidity Funds TempFund Portfolio - Class I | | | | | | | | | | $ | 143,000 | |
| | | | | | | | | | | | | | | | | | | | |
| | | | | | | | Total Short-Term Investments | | | | | | | | | | | | |
| | | | | | | | (Cost $143,000) | | | | | | | | | | | 143,000 | |
| | | | | | | | | | | | | | | | | | | | |
| | | | | | | | Total Investments in Securities | | | | | | | | | | | | |
| | | | | | | | (Cost $10,030,232) * | | | 100.2 | % | | | | | | $ | 10,565,556 | |
| | | | | | | | Other Assets and Liabilities - Net | | | (0.2 | ) | | | | | | | (20,291 | ) |
| | | | | | | | | | | | | | | | | | | | |
| | | | | | | | Net Assets | | | 100.0 | % | | | | | | $ | 10,545,265 | |
| | | | | | | | | | | | | | | | | | | | |
| | |
STRIP | | Separate Trading of Registered Interest and Principal of Securities |
## | | On September 7, 2008, the Federal Housing Finance Agency placed the Federal National Mortgage Association and the Federal Home Loan Mortgage Corporation into conservatorship and the U.S. Treasury guaranteed the debt issued by those organizations. |
^ | | Interest only securities represent the right to receive the monthly interest payments on an underlying pool of mortgage loans. Principal amount shown represents the notional amount on which current interest is calculated. Payments of principal on the pool reduce the value of the interest only security. |
Z | | Indicates Zero Coupon Bond; rate shown reflects current effective yield. |
20
PORTFOLIO OF INVESTMENTS
| | |
| ING GET U.S. Core Portfolio Series 10 | | as of December 31, 2010 |
| | | | | | | | | | | | | | | | | | | | |
| Principal Amount | | | | | | | | Value | |
| U.S. GOVERNMENT AGENCY OBLIGATIONS: | | | 79.6 | % | | | | | | | | |
| | | | | | | | Federal Home Loan Mortgage Corporation##: | | | | | | | 21.5 | % | | | | |
| | $1,681,000 | | | | ^, Z | | | 1.190%, due 01/15/13 | | | | | | | | | | $ | 1,640,915 | |
| | | | | | | | | | | | | | | | | | | | |
| | | | | | | | | | | | | | | | | | | 1,640,915 | |
| | | | | | | | | | | | | | | | | | | | |
| | | | | | | | Federal National Mortgage Association##: | | | | | | | 22.4 | % | | | | |
| | 1,747,000 | | | | ^, Z | | | 1.190%, due 01/15/13 | | | | | | | | | | | 1,705,357 | |
| | | | | | | | | | | | | | | | | | | | |
| | | | | | | | | | | | | | | | | �� | | 1,705,357 | |
| | | | | | | | | | | | | | | | | | | | |
| | | | | | | | Other U.S. Agency Obligations: | | | | | | | 35.7 | % | | | | |
| | 1,100,000 | | | | ^, Z | | | Financing Corp., 0.900%, due 10/06/12 | | | | | | | | | | | 1,082,579 | |
| | 1,675,000 | | | | Z | | | Resolution Funding Corp., 0.990%, due 01/15/13 | | | | | | | | | | | 1,641,353 | |
| | | | | | | | | | | | | | | | | | | | |
| | | | | | | | | | | | | | | | | | | 2,723,932 | |
| | | | | | | | | | | | | | | | | | | | |
| | | | | | | | Total U.S. Government Agency Obligations | | | | | | | | | | | | |
| | | | | | | | (Cost $5,780,787) | | | | | | | | | | | 6,070,204 | |
| | | | | | | | | | | | | | | | | | | | |
| U.S. TREASURY OBLIGATIONS: | | | 18.6 | % | | | | | | | | |
| | | | | | | | U.S. Treasury STRIP: | | | | | | | 18.6 | % | | | | |
| | 1,428,000 | | | | ^^, Z | | | 0.510%, due 11/15/12 | | | | | | | | | | | 1,414,395 | |
| | | | | | | | | | | | | | | | | | | | |
| | | | | | | | Total U.S. Treasury Obligations | | | | | | | | | | | | |
| | | | | | | | (Cost $1,390,149) | | | | | | | | | | | 1,414,395 | |
| | | | | | | | | | | | | | | | | | | | |
| | | | | | | | Total Long-Term Investments | | | | | | | | | | | | |
| | | | | | | | (Cost $7,170,936) | | | | | | | | | | | 7,484,599 | |
| | | | | | | | | | | | | | | | | | | | |
| SHORT-TERM INVESTMENTS: | | | 2.0 | % | | | | | | | | |
| | | | | | | | Mutual Funds: | | | | | | | 2.0 | % | | | | |
| | 155,000 | | | | | | | Blackrock Liquidity Funds TempFund Portfolio - Class I | | | | | | | | | | | 155,000 | |
| | | | | | | | | | | | | | | | | | | | |
| | | | | | | | Total Short-Term Investments | | | | | | | | | | | | |
| | | | | | | | (Cost $155,000) | | | | | | | | | | | 155,000 | |
| | | | | | | | | | | | | | | | | | | | |
| | | | | | | | Total Investments in Securities | | | | | | | | | | | | |
| | | | | | | | (Cost $7,325,936) * | | | 100.2 | % | | | | | | $ | 7,639,599 | |
| | | | | | | | Other Assets and Liabilities - Net | | | (0.2 | ) | | | | | | | (17,914 | ) |
| | | | | | | | | | | | | | | | | | | | |
| | | | | | | | Net Assets | | | 100.0 | % | | | | | | $ | 7,621,685 | |
| | | | | | | | | | | | | | | | | | | | |
| | |
STRIP | | Separate Trading of Registered Interest and Principal of Securities |
## | | On September 7, 2008, the Federal Housing Finance Agency placed the Federal National Mortgage Association and the Federal Home Loan Mortgage Corporation into conservatorship and the U.S. Treasury guaranteed the debt issued by those organizations. |
^ | | Interest only securities represent the right to receive the monthly interest payments on an underlying pool of mortgage loans. Principal amount shown represents the notional amount on which current interest is calculated. Payments of principal on the pool reduce the value of the interest only security. |
^^ | | Principal only securities represent the right to receive the monthly principal payments on an underlying pool of mortgage loans. No payments of interest on the pool are passed through the principal only security. |
Z | | Indicates Zero Coupon Bond; rate shown reflects current effective yield. |
21
PORTFOLIO OF INVESTMENTS
| | |
| ING GET U.S. Core Portfolio Series 11 | | as of December 31, 2010 |
| | | | | | | | | | | | | | | | | | | | |
| Principal Amount | | | | | | | | Value | |
| U.S. GOVERNMENT AGENCY OBLIGATIONS: | | | 84.5 | % | | | | | | | | |
| | | | | | | | Federal Home Loan Mortgage Corporation##: | | | | | | | 21.4 | % | | | | |
| $ | 2,206,000 | | | | ^, Z | | | 1.190%, due 01/15/13 | | | | | | | | | | $ | 2,153,396 | |
| | | | | | | | | | | | | | | | | | | | |
| | | | | | | | | | | | | | | | | | | 2,153,396 | |
| | | | | | | | | | | | | | | | | | | | |
| | | | | | | | Federal National Mortgage Association##: | | | | | | | 21.3 | % | | | | |
| | 2,200,000 | | | | ^^, Z | | | 1.140%, due 02/21/13 | | | | | | | | | | | 2,147,308 | |
| | | | | | | | | | | | | | | | | | | | |
| | | | | | | | | | | | | | | | | | | 2,147,308 | |
| | | | | | | | | | | | | | | | | | | | |
| | | | | | | | Other U.S. Agency Obligations: | | | | | | | 41.8 | % | | | | |
| | 603,000 | | | | Z | | | Financing Corp., 1.150%, due 05/11/13 | | | | | | | | | | | 586,832 | |
| | 1,533,000 | | | | ^, Z | | | Financing Corp., 1.270%, due 09/26/13 | | | | | | | | | | | 1,480,735 | |
| | 1,773,000 | | | | Z | | | Resolution Funding Corp., 0.990%, due 01/15/13 | | | | | | | | | | | 1,737,384 | |
| | 419,000 | | | | ^, Z | | | Resolution Funding Corp., 1.100%, due 04/15/13 | | | | | | | | | | | 408,552 | |
| | | | | | | | | | | | | | | | | | | | |
| | | | | | | | | | | | | | | | | | | 4,213,503 | |
| | | | | | | | | | | | | | | | | | | | |
| | | | | | | | Total U.S. Government Agency Obligations | | | | | | | | | | | | |
| | | | | | | | (Cost $8,184,903) | | | | | | | | | | | 8,514,207 | |
| | | | | | | | | | | | | | | | | | | | |
| U.S. TREASURY OBLIGATIONS: | | | 14.8 | % | | | | | | | | |
| | | | | | | | U.S. Treasury STRIP COUPON: | | | | | | | 14.8 | % | | | | |
| | 1,515,000 | | | | Z | | | 0.720%, due 02/15/13 | | | | | | | | | | | 1,492,127 | |
| | | | | | | | | | | | | | | | | | | | |
| | | | | | | | Total U.S. Treasury Obligations | | | | | | | | | | | | |
| | | | | | | | (Cost $1,444,623) | | | | | | | | | | | 1,492,127 | |
| | | | | | | | | | | | | | | | | | | | |
| | | | | | | | Total Long-Term Investments | | | | | | | | | | | | |
| | | | | | | | (Cost $9,629,526) | | | | | | | | | | | 10,006,334 | |
| | | |
| Shares | | | | | | | | Value | |
| SHORT-TERM INVESTMENTS: | | | 0.9 | % | | | | | | | | |
| | | | | | | | Mutual Funds: | | | | | | | 0.9 | % | | | | |
| | 88,000 | | | | | | | Blackrock Liquidity Funds TempFund Portfolio - Class I | | | | | | | | | | $ | 88,000 | |
| | | | | | | | | | | | | | | | | | | | |
| | | | | | | | Total Short-Term Investments | | | | | | | | | | | | |
| | | | | | | | (Cost $88,000) | | | | | | | | | | | 88,000 | |
| | | | | | | | | | | | | | | | | | | | |
| | | | | | | | Total Investments in Securities | | | | | | | | | | | | |
| | | | | | | | (Cost $9,717,526) * | | | 100.2 | % | | | | | | $ | 10,094,334 | |
| | | | | | | | Other Assets and Liabilities - Net | | | (0.2 | ) | | | | | | | (22,649 | ) |
| | | | | | | | | | | | | | | | | | | | |
| | | | | | | | Net Assets | | | 100.0 | % | | | | | | $ | 10,071,685 | |
| | | | | | | | | | | | | | | | | | | | |
| | |
| STRIP | | Separate Trading of Registered Interest and Principal of Securities |
| ## | | On September 7, 2008, the Federal Housing Finance Agency placed the Federal National Mortgage Association and the Federal Home Loan Mortgage Corporation into conservatorship and the U.S. Treasury guaranteed the debt issued by those organizations. |
| ^ | | Interest only securities represent the right to receive the monthly interest payments on an underlying pool of mortgage loans. Principal amount shown represents the notional amount on which current interest is calculated. Payments of principal on the pool reduce the value of the interest only security. |
| ^^ | | Principal only securities represent the right to receive the monthly principal payments on an underlying pool of mortgage loans. No payments of interest on the pool are passed through the principal only security. |
| Z | | Indicates Zero Coupon Bond; rate shown reflects current effective yield. |
22
PORTFOLIO OF INVESTMENTS
| | |
| ING GET U.S. Core Portfolio Series 12 | | as of December 31, 2010 |
| | | | | | | | | | | | | | | | | | | | |
| Shares | | | | | | | | Value | |
| EXCHANGE-TRADED FUNDS: | | | 4.8 | % | | | | | | | | |
| | | | | | | | Exchange-Traded Funds: | | | | | | | 4.8 | % | | | | |
| | 5,700 | | | | | | | SPDR Trust Series 1 | | | | | | | | | | $ | 716,946 | |
| | | | | | | | | | | | | | | | | | | | |
| | | | | | | | Total Exchange-Traded Funds | | | | | | | | | | | | |
| | | | | | | | (Cost $468,485) | | | | | | | | | | | 716,946 | |
| | | | | | | | | | | | | | | | | | | | |
| | | |
| Principal Amount | | | | | | | | Value | |
| U.S. GOVERNMENT AGENCY OBLIGATIONS: | | | 83.8 | % | | | | | | | | |
| | | | | | | | Federal Home Loan Mortgage Corporation##: | | | | | | | 14.9 | % | | | | |
| $ | 2,291,000 | | | | Z | | | 1.450%, due 09/15/13 | | | | | | | | | | $ | 2,203,417 | |
| | | | | | | | | | | | | | | | | | | | |
| | | | | | | | | | | | | | | | | | | 2,203,417 | |
| | | | | | | | | | | | | | | | | | | | |
| | | | | | | | Federal National Mortgage Association##: | | | | | | | 22.3 | % | | | | |
| | 3,415,000 | | | | ^, Z | | | 1.390%, due 07/15/13 | | | | | | | | | | | 3,297,220 | |
| | | | | | | | | | | | | | | | | | | | |
| | | | | | | | | | | | | | | | | | | 3,297,220 | |
| | | | | | | | | | | | | | | | | | | | |
| | | | | | | | Other U.S. Agency Obligations: | | | | | | | 46.6 | % | | | | |
| | 3,400,000 | | | | ^, Z | | | Financing Corp., 1.170%, due 06/06/13 | | | | | | | | | | | 3,304,389 | |
| | 3,681,000 | | | | ^, Z | | | Resolution Funding Corp., 1.100%, due 04/15/13 | | | | | | | | | | | 3,589,211 | |
| | | | | | | | | | | | | | | | | | | | |
| | | | | | | | | | | | | | | | | | | 6,893,600 | |
| | | | | | | | | | | | | | | | | | | | |
| | | | | | | | Total U.S. Government Agency Obligations | | | | | | | | | | | | |
| | | | | | | | (Cost $11,811,235) | | | | | | | | | | | 12,394,237 | |
| | | | | | | | | | | | | | | | | | | | |
| U.S. TREASURY OBLIGATIONS: | | | 10.1 | % | | | | | | | | |
| | | | | | | | U.S. Treasury STRIP: | | | | | | | 10.1 | % | | | | |
| | 1,517,000 | | | | ^^, Z | | | 0.680%, due 05/15/13 | | | | | | | | | | | 1,492,470 | |
| | | | | | | | | | | | | | | | | | | | |
| | | | | | | | Total U.S. Treasury Obligations | | | | | | | | | | | | |
| | | | | | | | (Cost $1,461,174) | | | | | | | | | | | 1,492,470 | |
| | | | | | | | | | | | | | | | | | | | |
| | | | | | | | Total Long-Term Investments | | | | | | | | | | | | |
| | | | | | | | (Cost $13,740,894) | | | | | | | | | | | 14,603,653 | |
| | | | | | | | | | | | | | | | | | | | |
| SHORT-TERM INVESTMENTS: | | | 1.5 | % | | | | | | | | |
| | | | | | | | Mutual Funds: | | | | | | | 1.5 | % | | | | |
| | 221,000 | | | | | | | Blackrock Liquidity Funds TempFund Portfolio - Class I | | | | | | | | | | | 221,000 | |
| | | | | | | | | | | | | | | | | | | | |
| | | | | | | | Total Short-Term Investments | | | | | | | | | | | | |
| | | | | | | | (Cost $221,000) | | | | | | | | | | | 221,000 | |
| | | | | | | | | | | | | | | | | | | | |
| | | | | | | | Total Investments in Securities | | | | | | | | | | | | |
| | | | | | | | (Cost $13,961,894) * | | | 100.2 | % | | | | | | $ | 14,824,653 | |
| | | | | | | | Other Assets and Liabilities - Net | | | (0.2 | ) | | | | | | | (26,861 | ) |
| | | | | | | | | | | | | | | | | | | | |
| | | | | | | | Net Assets | | | 100.0 | % | | | | | | $ | 14,797,792 | |
| | | | | | | | | | | | | | | | | | | | |
| | |
| STRIP | | Separate Trading of Registered Interest and Principal of Securities |
| ## | | On September 7, 2008, the Federal Housing Finance Agency placed the Federal National Mortgage Association and the Federal Home Loan Mortgage Corporation into conservatorship and the U.S. Treasury guaranteed the debt issued by those organizations. |
| ^ | | Interest only securities represent the right to receive the monthly interest payments on an underlying pool of mortgage loans. Principal amount shown represents the notional amount on which current interest is calculated. Payments of principal on the pool reduce the value of the interest only security. |
| ^^ | | Principal only securities represent the right to receive the monthly principal payments on an underlying pool of mortgage loans. No payments of interest on the pool are passed through the principal only security. |
| Z | | Indicates Zero Coupon Bond; rate shown reflects current effective yield. |
23
PORTFOLIO OF INVESTMENTS
| | |
| ING GET U.S. Core Portfolio Series 13 | | as of December 31, 2010 |
| | | | | | | | | | | | | | | | | | | | |
| Principal Amount | | | | | | | | Value | |
| U.S. GOVERNMENT AGENCY OBLIGATIONS: | | | 81.2 | % | | | | | | | | |
| | | | | | | | Federal Home Loan Mortgage Corporation##: | | | | | | | 20.3 | % | | | | |
| $ | 5,561,000 | | | | ^^, Z | | | 1.510%, due 11/15/13 | | | | | | | | | | $ | 5,326,587 | |
| | | | | | | | | | | | | | | | | | | | |
| | | | | | | | | | | | | | | | | | | 5,326,587 | |
| | | | | | | | | | | | | | | | | | | | |
| | | | | | | | Federal National Mortgage Association##: | | | | | | | 20.3 | % | | | | |
| | 5,578,000 | | | | ^, Z | | | 1.377%, due 01/15/14 | | | | | | | | | | | 5,313,430 | |
| | | | | | | | | | | | | | | | | | | | |
| | | | | | | | | | | | | | | | | | | 5,313,430 | |
| | | | | | | | | | | | | | | | | | | | |
| | | | | | | | Other U.S. Agency Obligations: | | | | | | | 40.6 | % | | | | |
| | 5,250,000 | | | | ^, Z | | | Financing Corp., 1.310%, due 11/11/13 | | | | | | | | | | | 5,057,692 | |
| | 5,814,000 | | | | ^, Z | | | Resolution Funding Corp., 1.420%, due 01/15/14 | | | | | | | | | | | 5,570,702 | |
| | | | | | | | | | | | | | | | | | | | |
| | | | | | | | | | | | | | | | | | | 10,628,394 | |
| | | | | | | | | | | | | | | | | | | | |
| | | | | | | | Total U.S. Government Agency Obligations | | | | | | | | | | | | |
| | | | | | | | (Cost $19,704,722) | | | | | | | | | | | 21,268,411 | |
| | | | | | | | | | | | | | | | | | | | |
| U.S. TREASURY OBLIGATIONS: | | | 18.2 | % | | | | | | | | |
| | | | | | | | U.S. Treasury STRIP COUPON: | | | | | | | 18.2 | % | | | | |
| | 4,907,000 | | | | Z | | | 1.000%, due 11/15/13 | | | | | | | | | | | 4,770,301 | |
| | | | | | | | | | | | | | | | | | | | |
| | | | | | | | Total U.S. Treasury Obligations | | | | | | | | | | | | |
| | | | | | | | (Cost $4,541,815) | | | | | | | | | | | 4,770,301 | |
| | | | | | | | | | | | | | | | | | | | |
| | | | | | | | Total Long-Term Investments | | | | | | | | | | | | |
| | | | | | | | (Cost $24,246,537) | | | | | | | | | | | 26,038,712 | |
| | | | | | | | | | | | | | | | | | | | |
| | | |
| Shares | | | | | | | | Value | |
| SHORT-TERM INVESTMENTS: | | | 0.8 | % | | | | | | | | |
| | | | | | | | Mutual Funds: | | | | | | | 0.8 | % | | | | |
| | 221,000 | | | | | | | Blackrock Liquidity Funds TempFund Portfolio - Class I | | | | | | | | | | $ | 221,000 | |
| | | | | | | | | | | | | | | | | | | | |
| | | | | | | | Total Short-Term Investments | | | | | | | | | | | | |
| | | | | | | | (Cost $221,000) | | | | | | | | | | | 221,000 | |
| | | | | | | | | | | | | | | | | | | | |
| | | | | | | | Total Investments in Securities | | | | | | | | | | | | |
| | | | | | | | (Cost $24,467,537) * | | | 100.2 | % | | | | | | $ | 26,259,712 | |
| | | | | | | | Other Assets and Liabilities - Net | | | (0.2 | ) | | | | | | | (56,160 | ) |
| | | | | | | | | | | | | | | | | | | | |
| | | | | | | | Net Assets | | | 100.0 | % | | | | | | $ | 26,203,552 | |
| | | | | | | | | | | | | | | | | | | | |
| | |
| STRIP | | Separate Trading of Registered Interest and Principal of Securities |
| ## | | On September 7, 2008, the Federal Housing Finance Agency placed the Federal National Mortgage Association and the Federal Home Loan Mortgage Corporation into conservatorship and the U.S. Treasury guaranteed the debt issued by those organizations. |
| ^ | | Interest only securities represent the right to receive the monthly interest payments on an underlying pool of mortgage loans. Principal amount shown represents the notional amount on which current interest is calculated. Payments of principal on the pool reduce the value of the interest only security. |
| ^^ | | Principal only securities represent the right to receive the monthly principal payments on an underlying pool of mortgage loans. No payments of interest on the pool are passed through the principal only security. |
| Z | | Indicates Zero Coupon Bond; rate shown reflects current effective yield. |
24
PORTFOLIO OF INVESTMENTS
| | |
| ING GET U.S. Core Portfolio Series 14 | | as of December 31, 2010 |
| | | | | | | | | | | | | | | | | | | | |
| Principal Amount | | | | | | | | Value | |
| U.S. GOVERNMENT AGENCY OBLIGATIONS: | | | 60.1 | % | | | | | | | | |
| | | | | | | | Federal Home Loan Mortgage Corporation##: | | | | | | | 19.6 | % | | | | |
| $ | 11,413,000 | | | | ^^, Z | | | 1.920%, due 07/15/14 | | | | | | | | | | $ | 10,677,364 | |
| | | | | | | | | | | | | | | | | | | | |
| | | | | | | | | | | | | | | | | | | 10,677,364 | |
| | | | | | | | | | | | | | | | | | | | |
| | | | | | | | Federal National Mortgage Association##: | | | | | | | 20.1 | % | | | | |
| | 11,675,000 | | | | ^, Z | | | 1.840%, due 05/15/14 | | | | | | | | | | | 10,985,650 | |
| | | | | | | | | | | | | | | | | | | | |
| | | | | | | | | | | | | | | | | | | 10,985,650 | |
| | | | | | | | | | | | | | | | | | | | |
| | | | | | | | Other U.S. Agency Obligations: | | | | | | | 20.4 | % | | | | |
| | 11,801,000 | | | | ^, Z | | | Resolution Funding Corp., 1.660%, due 07/15/14 | | | | | | | | | | | 11,137,087 | |
| | | | | | | | | | | | | | | | | | | | |
| | | | | | | | | | | | | | | | | | | 11,137,087 | |
| | | | | | | | | | | | | | | | | | | | |
| | | | | | | | Total U.S. Government Agency Obligations | | | | | | | | | | | | |
| | | | | | | | (Cost $30,522,643) | | | | | | | | | | | 32,800,101 | |
| | | | | | | | | | | | | | | | | | | | |
| U.S. TREASURY OBLIGATIONS: | | | 19.2 | % | | | | | | | | |
| | | | | | | | U.S. Treasury STRIP COUPON: | | | | | | | 19.2 | % | | | | |
| | 10,909,000 | | | | Z | | | 1.300%, due 05/15/14 | | | | | | | | | | | 10,444,375 | |
| | | | | | | | | | | | | | | | | | | | |
| | | | | | | | Total U.S. Treasury Obligations | | | | | | | | | | | | |
| | | | | | | | (Cost $10,034,594) | | | | | | | | | | | 10,444,375 | |
| | | | | | | | | | | | | | | | | | | | |
| OTHER BONDS: | | | 20.0 | % | | | | | | | | |
| | | | | | | | Foreign Government Bonds: | | | | | | | 20.0 | % | | | | |
| | 2,466,000 | | | | Z | | | Israel Government International Bond, 1.500%, due 03/15/14 | | | | | | | | | | | 2,351,346 | |
| | 9,124,000 | | | | Z | | | Israel Government International Bond, 1.730%, due 08/15/14 | | | | | | | | | | | 8,578,348 | |
| | | | | | | | | | | | | | | | | | | | |
| | | | | | | | Total Other Bonds | | | | | | | | | | | | |
| | | | | | | | (Cost $10,470,621) | | | | | | | | | | | 10,929,694 | |
| | | | | | | | | | | | | | | | | | | | |
| | | | | | | | Total Investments in Securities | | | | | | | | | | | | |
| | | | | | | | (Cost $51,027,858) * | | | 99.3 | % | | | | | | $ | 54,174,170 | |
| | | | | | | | Other Assets and Liabilities - Net | | | 0.7 | | | | | | | | 374,240 | |
| | | | | | | | | | | | | | | | | | | | |
| | | | | | | | Net Assets | | | 100.0 | % | | | | | | $ | 54,548,410 | |
| | | | | | | | | | | | | | | | | | | | |
| | |
| STRIP | | Separate Trading of Registered Interest and Principal of Securities |
| ## | | On September 7, 2008, the Federal Housing Finance Agency placed the Federal National Mortgage Association and the Federal Home Loan Mortgage Corporation into conservatorship and the U.S. Treasury guaranteed the debt issued by those organizations. |
| ^ | | Interest only securities represent the right to receive the monthly interest payments on an underlying pool of mortgage loans. Principal amount shown represents the notional amount on which current interest is calculated. Payments of principal on the pool reduce the value of the interest only security. |
| ^^ | | Principal only securities represent the right to receive the monthly principal payments on an underlying pool of mortgage loans. No payments of interest on the pool are passed through the principal only security. |
| Z | | Indicates Zero Coupon Bond; rate shown reflects current effective yield. |
25
| Item 7. | Disclosure of Proxy Voting Policies and Procedures for Closed-End Management Investment Companies. |
Not applicable.
| Item 8. | Portfolio Managers of Closed-End Management Investment Companies. |
Not applicable.
| Item 9. | Purchases of Equity Securities by Closed-End Management Investment Company and Affiliated Purchasers |
Not applicable.
| Item 10. | Submission of Matters to a Vote of Security Holders. |
The Board has a Nominating Committee for the purpose of considering and presenting to the Board candidates it proposes for nomination to fill Independent Trustee vacancies on the Board. The Committee currently consists of all Independent Trustees of the Board (6 individuals). The Nominating Committee operates pursuant to a Charter approved by the Board. The primary purpose of the Nominating Committee is to consider and present to the Board the candidates it proposes for nomination to fill vacancies on the Board. In evaluating candidates, the Nominating Committee may consider a variety of factors, but it has not at this time set any specific minimum qualifications that must be met. Specific qualifications of candidates for Board membership will be based on the needs of the Board at the time of nomination.
The Nominating Committee is willing to consider nominations received from shareholders and shall assess shareholder nominees in the same manner as it reviews its own nominees. A shareholder nominee for director should be submitted in writing to the Fund’s Secretary. Any such shareholder nomination should include at a minimum the following information as to each individual proposed for nomination as trustee: such individual’s written consent to be named in the proxy statement as a nominee (if nominated) and to serve as a trustee (if elected), and all information relating to such individual that is required to be disclosed in the solicitation of proxies for election of trustees, or is otherwise required, in each case under applicable federal securities laws, rules and regulations.
The Secretary shall submit all nominations received in a timely manner to the Nominating Committee. To be timely, any such submission must be delivered to the Fund’s Secretary not earlier than the 90th day prior to such meeting and not later than the close of business on the later of the 60th day prior to such meeting or the 10th day following the day on which public announcement of the date of the meeting is first made, by either disclosure in a press release or in a document publicly filed by the Fund with the Securities and Exchange Commission.
| Item 11. | Controls and Procedures. |
| (a) | Based on our evaluation conducted within 90 days of the filing date, hereof, the design and operation of the registrant’s disclosure controls and procedures are effective to ensure that material information relating to the registrant is made known to the certifying officers by others within the appropriate entities, particularly during the period in which Forms N-CSR are being prepared, and the registrant’s disclosure controls and procedures allow timely preparation and review of the information for the registrant’s Form N-CSR and the officer certifications of such Form N-CSR. |
| (b) | There were no significant changes in the registrant’s internal controls that occurred during the second fiscal quarter of the period covered by this report that has materially affected, or is reasonably likely to materially affect, the registrant’s internal control over financial reporting. |
| (a)(1) | Code of Ethics pursuant to Item 2 of Form N-CSR is filed and attached hereto as EX-99.CODE ETH. |
26
| (a)(2) | A separate certification for each principal executive officer and principal financial officer of the registrant as required by Rule 30a-2 under the Act (17 CFR 270.30a-2) is attached hereto as EX-99.CERT. |
| (b) | The officer certifications required by Section 906 of the Sarbanes-Oxley Act of 2002 are attached hereto as EX-99.906CERT. |
27
SIGNATURES
Pursuant to the requirements of the Securities Exchange Act of 1934 and the Investment Company Act of 1940, the registrant has duly caused this report to be signed on its behalf by the undersigned, thereunto duly authorized.
| | |
| (Registrant): ING Variable Insurance Trust |
| |
| By | | /s/ Shaun P. Mathews |
| | Shaun P. Mathews |
| | President and Chief Executive Officer |
| |
| Date: | | March 3, 2011 |
Pursuant to the requirements of the Securities Exchange Act of 1934 and the Investment Company Act of 1940, this report has been signed below by the following persons on behalf of the registrant and in the capacities and on the dates indicated.
| | |
| |
| By | | /s/ Shaun P. Mathews |
| | Shaun P. Mathews |
| | President and Chief Executive Officer |
| |
| Date: | | March 3, 2011 |
| | |
| |
| By | | /s/ Todd Modic |
| | Todd Modic |
| | Senior Vice President and Chief Financial Officer |
| |
| Date: | | March 3, 2011 |