SECURITIES AND EXCHANGE COMMISSION
WASHINGTON, D.C. 20549
FORM 10-Q
(Mark One)
x QUARTERLY REPORT PURSUANT TO SECTION 13 OR 15(d) OF THE SECURITIES EXCHANGE ACT OF 1934 |
For the quarterly period ended September 30, 2013
or
o TRANSITION REPORT PURSUANT TO SECTION 13 OR 15(d) OF THE SECURITIES EXCHANGE ACT OF 1934 |
For the transition period from ______to______
Commission File Number: 001-34567
CHINA YIDA HOLDING, CO.
(Exact name of registrant as specified in its charter)
| | 50-0027826 |
(State or other jurisdiction of incorporation or organization) | | (I.R.S. Employer Identification No.) |
| | | |
28/F Yifa Building, No. 111 Wusi Road Fuzhou, Fujian, P. R. China | | 350003 |
| (Address of principal executive offices) | | (Zip Code) |
+ 86 (591) 28082230
(Registrant's telephone number, including area code)
Indicate by check mark whether the registrant (1) has filed all reports required to be filed by Section 13 or 15(d) of the Exchange Act of 1934 during the preceding 12 months (or for such shorter period that the registrant was required to file such reports), and (2) has been subject to such filing requirements for the past 90 days.
Yes x No o
Indicate by check mark whether the registrant has submitted electronically and posted on its corporate Web site, if any, every Interactive Data File required to be submitted and posted pursuant to Rule 405 of Regulation S-T (§232.405 of this chapter) during the preceding 12 months (or for such shorter period that the registrant was required to submit and post such files).
Yes x No o
Indicate by check mark whether the registrant is a large accelerated filer, an accelerated filer, a non-accelerated filer, or a smaller reporting company. See definitions of “large accelerated filer,” “accelerated filer” and “smaller reporting company” in Rule 12b-2 of the Exchange Act.
| Large accelerated filer | | o | | Accelerated filer | | o |
| Non-accelerated filer | | o (Do not check if a smaller reporting company) | | Smaller reporting company | | x |
Indicate by check mark whether the registrant is a shell company (as defined in Rule 12b-2 of the Exchange Act).
Yes o No x
Indicate the number of shares outstanding of each of the issuer’s classes of common stock as of the latest practicable date.
| Class | | Shares outstanding as of November 14, 2013 |
Common stock, $.001 par value | | 3,914,580 |
INDEX
| PART I – FINANCIAL INFORMATION | |
| | | |
| Item 1. | Financial Statements (Unaudited). | F-1 |
| | | |
| Item 2. | Management’s Discussion and Analysis of Financial Condition and Results of Operations. | 1 |
| | | |
| Item 3. | Quantitative and Qualitative Disclosures About Market Risk. | 17 |
| | | |
| Item 4. | Controls and Procedures. | 17 |
| | | |
| PART II – OTHER INFORMATION | 18 |
| | | |
| Item 1. | Legal Proceedings. | 18 |
| | | |
| Item 1A. | Risk Factors. | 18 |
| | | |
| Item 2. | Unregistered Sales of Equity Securities and Use of Proceeds. | 18 |
| | | |
| Item 3. | Defaults Upon Senior Securities. | 18 |
| | | |
| Item 4. | Mine Safety Disclosures. | 18 |
| | | |
| Item 5. | Other Information. | 18 |
| | | |
| Item 6. | Exhibits. | 18 |
| | | |
| SIGNATURES | 19 |
CAUTIONARY STATEMENT ON FORWARD-LOOKING INFORMATION
This Quarterly Report on Form 10-Q contains “forward-looking statements” within the meaning of the Private Securities Litigation Reform Act of 1995, Section 27A of the Securities Act of 1933, as amended, or the Securities Act, and Section 21E of the Securities Exchange Act of 1934, as amended (the “Exchange Act”). Forward-looking statements discuss matters that are not historical facts. Because they discuss future events or conditions, forward-looking statements may include words such as “anticipate,” “believe,” “estimate,” “intend,” “could,” “should,” “would,” “may,” “seek,” “plan,” “might,” “will,” “expect,” “anticipate,” “predict,” “project,” “forecast,” “potential,” “continue” negatives thereof or similar expressions. Forward-looking statements speak only as of the date they are made, are based on various underlying assumptions and current expectations about the future and are not guarantees. Such statements involve known and unknown risks, uncertainties and other factors that may cause our actual results, level of activity, performance or achievement to be materially different from the results of operations or plans expressed or implied by such forward-looking statements.
We cannot predict all of the risks and uncertainties. Accordingly, such information should not be regarded as representations that the results or conditions described in such statements or that our objectives and plans will be achieved and we do not assume any responsibility for the accuracy or completeness of any of these forward-looking statements. These forward-looking statements are found at various places throughout this Quarterly Report on Form 10-Q and include information concerning possible or assumed future results of our operations, including statements about potential acquisition or merger targets; business strategies; future cash flows; financing plans; plans and objectives of management; any other statements regarding future acquisitions, future cash needs, future operations, business plans and future financial results, and any other statements that are not historical facts.
These forward-looking statements represent our intentions, plans, expectations, assumptions and beliefs about future events and are subject to risks, uncertainties and other factors. Many of those factors are outside of our control and could cause actual results to differ materially from the results expressed or implied by those forward-looking statements. In light of these risks, uncertainties and assumptions, the events described in the forward-looking statements might not occur or might occur to a different extent or at a different time than we have described. You are cautioned not to place undue reliance on these forward-looking statements, which speak only as of the date of the Quarterly Report on Form 10-Q. All subsequent written and oral forward-looking statements concerning other matters addressed in this Quarterly Report on Form 10-Q and attributable to us or any person acting on our behalf are expressly qualified in their entirety by the cautionary statements contained or referred to in this Quarterly Report on Form 10-Q.
Except to the extent required by law, we undertake no obligation to update or revise any forward-looking statements, whether as a result of new information, future events, a change in events, conditions, circumstances or assumptions underlying such statements, or otherwise.
USE OF CERTAIN DEFINED TERMS
Except as otherwise indicated by the context, references in this report to “we,” “us,” “our,” “our Company,” or “the Company” are to the combined business of China Yida Holding, Co. and its subsidiaries.
PART 1 - FINANCIAL INFORMATION
Item 1. Financial Statements.
CHINA YIDA HOLDING, CO. AND SUBSIDIARIES
CONSOLIDATED FINANCIAL STATEMENTS
(UNAUDITED)
Index to consolidated financial statements
| | Page |
| | |
| Consolidated Balance Sheets as of September 30, 2013 and December 31, 2012 | F-2 |
| | |
| Consolidated Statements of Income and Comprehensive Income for the nine months and three months ended September 30, 2013 and 2012 | F-3 |
| | |
| Consolidated Statements of Cash Flows for the six months and three months ended September 30, 2013 and 2012 | F-4 |
| | |
| Notes to the Consolidated Financial Statements | F-5 - F-25 |
CHINA YIDA HOLDING CO. AND SUBSIDIARIES
CONSOLIDATED BALANCE SHEETS
| | | September 30, | | | December 31, | |
| | | 2013 | | | 2012 | |
| | | (UNAUDITED) | | | (AUDITED) | |
| ASSETS | | | | | | |
| Current assets | | | | | | |
| Cash and cash equivalents | | $ | 1,995,082 | | | $ | 5,658,319 | |
| Accounts receivable | | | 587,345 | | | | 179,699 | |
| Other receivables, net | | | 2,601,518 | | | | 154,657 | |
| Advances and prepayments | | | 5,462,704 | | | | 1,821,279 | |
| Prepayment - current portion | | | 349,058 | | | | 397,690 | |
| Current assets of discontinued operations | | | - | | | | 939,708 | |
| Total current assets | | | 10,995,707 | | | | 9,151,352 | |
| | | | | | | | | |
| Property and equipment, net | | | 214,661,412 | | | | 142,847,661 | |
| Intangible assets, net | | | 51,275,351 | | | | 51,448,730 | |
| Long-term prepayments | | | 3,294,190 | | | | 3,052,731 | |
| Non-current assets of discontinued operations | | | - | | | | 12,279,263 | |
| Total assets | | $ | 280,226,660 | | | $ | 218,779,737 | |
| | | | | | | | | |
| LIABILITIES AND STOCKHOLDERS' EQUITY | | | | | | | | |
| Current liabilities | | | | | | | | |
| Short-term loans | | $ | 4,069,077 | | | $ | 1,586,294 | |
| Long-term debt, current portion | | | 7,555,462 | | | | 6,808,376 | |
| Accounts payable | | | 150,015 | | | | 48,798 | |
| Current obligation under airtime rights commitment | | | - | | | | 1,545,582 | |
| Accrued expenses and other payables | | | 4,239,620 | | | | 766,816 | |
| Due to related parties | | | 27,391,411 | | | | - | |
| Taxes payable | | | - | | | | 311,306 | |
| Current liabilities of discontinued operations | | | - | | | | 335,570 | |
| Total current liabilities | | | 43,405,585 | | | | 11,402,742 | |
| | | | | | | | | |
| Long-term debt | | | 89,672,218 | | | | 48,643,945 | |
| Total liabilities | | | 133,077,803 | | | | 60,046,687 | |
| | | | | | | | | |
| Commitments and contingencies | | | | | | | | |
| | | | | | | | | |
| Equity | | | | | | | | |
| Preferred stock ($0.0001 par value, 10,000,000 shares authorized, none issued and outstanding) | | | - | | | | - | |
Common stock ($0.001 par value, 100,000,000 shares authorized, 3,914,580 and 3,914,580 shares issued and outstanding as of September 30, 2013 and December 31, 2012, respectively) | | | 3,915 | | | | 3,915 | |
| Additional paid in capital | | | 49,163,705 | | | | 49,163,705 | |
| Accumulated other comprehensive income | | | 17,653,238 | | | | 13,791,374 | |
| Retained earnings | | | 77,778,669 | | | | 87,435,678 | |
| Statutory reserve | | | 2,549,330 | | | | 2,549,330 | |
| Total China Yida Holding, Co. Stockholders’ equity | | | 147,148,857 | | | | 152,944,002 | |
| Non-controlling interest | | | - | | | | 5,789,048 | |
| Total equity | | | 147,148,857 | | | | 158,733,050 | |
| Total liabilities and equity | | $ | 280,226,660 | | | $ | 218,779,737 | |
The accompanying notes are an integral part of these unaudited consolidated financial statements.
CHINA YIDA HOLDING CO. AND SUBSIDIARIES
CONSOLIDATED STATEMENTS OF INCOME AND COMPREHENSIVE INCOME
(UNAUDITED)
| | | Nine Months Ended September 30, | | | Three Months Ended September 30, | |
| | | 2013 | | | 2012 | | | 2013 | | | 2012 | |
| Net revenue | | | | | | | | | | | | |
| Advertisement | | $ | 2,899,844 | | | $ | 14,126,023 | | | $ | 318,434 | | | $ | 3,168,963 | |
| Tourism | | | 10,498,161 | | | | 7,340,957 | | | | 4,357,597 | | | | 3,152,618 | |
| | | | | | | | | | | | | | | | | |
| Total net revenue | | | 13,398,005 | | | | 21,466,980 | | | | 4,676,031 | | | | 6,321,581 | |
| | | | | | | | | | | | | | | | | |
| Cost of revenue | | | | | | | | | | | | | | | | |
| Advertisement | | | 2,038,196 | | | | 4,227,122 | | | | 271,213 | | | | 1,236,714 | |
| Tourism | | | 5,045,873 | | | | 4,377,807 | | | | 1,893,844 | | | | 1,618,473 | |
| | | | | | | | | | | | | | | | | |
| Total cost of revenue | | | 7,084,069 | | | | 8,604,929 | | | | 2,165,057 | | | | 2,855,187 | |
| | | | | | | | | | | | | | | | | |
| Gross profit | | | 6,313,936 | | | | 12,862,051 | | | | 2,510,974 | | | | 3,466,394 | |
| | | | | | | | | | | | | | | | | |
| Operating expenses | | | | | | | | | | | | | | | | |
| Selling expenses | | | 7,721,371 | | | | 4,751,736 | | | | 2,755,654 | | | | 2,104,616 | |
| General and administrative expenses | | | 4,917,226 | | | | 2,931,207 | | | | 1,905,852 | | | | 839,923 | |
| | | | | | | | | | | | | | | | | |
| Total operating expenses | | | 12,638,597 | | | | 7,682,943 | | | | 4,661,506 | | | | 2,944,539 | |
| | | | | | | | | | | | | | | | | |
| (Loss) Income from operations | | | (6,324,661 | ) | | | 5,179,108 | | | | (2,150,532 | ) | | | 521,855 | |
| | | | | | | | | | | | | | | | | |
| Other income (expense) | | | | | | | | | | | | | | | | |
| Other expense, net | | | (640,274 | ) | | | (190,006 | ) | | | (554,364 | ) | | | (77,124 | ) |
| Interest income | | | 82,687 | | | | 25,036 | | | | 6,999 | | | | 8,686 | |
| Interest expense | | | (3,487,742 | ) | | | (990,189 | ) | | | (929,319 | ) | | | (870,698 | ) |
| | | | | | | | | | | | | | | | | |
| Total other expenses | | | (4,045,329 | ) | | | (1,155,159 | ) | | | (1,476,684 | ) | | | (939,136 | ) |
| | | | | | | | | | | | | | | | | |
| (Loss) Income from continuing operations before income tax and non-controlling interest | | | (10,369,990 | ) | | | 4,023,949 | | | | (3,627,216 | ) | | | (417,281 | ) |
| | | | | | | | | | | | | | | | | |
| Less: Provision for income tax | | | 132,830 | | | | 2,457,792 | | | | 961 | | | | 451,471 | |
| | | | | | | | | | | | | | | | | |
| Net (loss) income from continuing operations | | | (10,502,820 | ) | | | 1,566,157 | | | | (3,628,177 | ) | | | (868,752 | ) |
| | | | | | | | | | | | | | | | | |
| Discontinued Operation | | | | | | | | | | | | | | | | |
| | | | | | | | | | | | | | | | | |
| Loss from discontinued operations, net of income taxes | | | (255,536 | ) | | | (507,136 | ) | | | - | | | | (177,058 | ) |
| Gain on Disposal of Subsidiary | | | 999,133 | | | | - | | | | - | | | | - | |
| | | | | | | | | | | | | | | | | |
| Net income (loss) from discontinued operations, net of income taxes | | | 743,597 | | | | (507,136 | ) | | | - | | | | (177,058 | ) |
| | | | | | | | | | | | | | | | | |
| Net (loss) Income | | | (9,759,223 | ) | | | 1,059,021 | | | | (3,628,177 | ) | | | (1,045,810 | ) |
| | | | | | | | | | | | | | | | | |
| Net loss attributed to non-controlling interest: | | | | | | | | | | | | | | | | |
| Net loss from discontinued operation | | | 102,215 | | | | 201,613 | | | | - | | | | 70,399 | |
| | | | | | | | | | | | | | | | | |
| Net (loss) income attributable to China Yida Holding Co. | | $ | (9,657,008 | ) | | $ | 1,260,634 | | | $ | (3,628,177 | ) | | $ | (975,411 | ) |
| | | | | | | | | | | | | | | | | |
| Net (loss) income | | $ | (9,759,223 | ) | | $ | 1,059,021 | | | $ | (3,628,177 | ) | | $ | (1,045,810 | ) |
| | | | | | | | | | | | | | | | | |
| Other comprehensive income | | | | | | | | | | | | | | | | |
Foreign currency translation gain (loss) | | | 3,573,349 | | | | 980,614 | | | | 681,539 | | | | (253,430 | ) |
| | | | | | | | | | | | | | | | | |
| Comprehensive (loss) income | | | (6,185,874 | ) | | | 2,039,635 | | | | (2,946,638 | ) | | | (1,299,240 | ) |
| | | | | | | | | | | | | | | | | |
| Comprehensive loss attributable to non-controlling interest | | | 390,730 | | | | 163,371 | | | | - | | | | 79,962 | |
| | | | | | | | | | | | | | | | | |
| Comprehensive (loss) income attributable to China Yida Holding Co. | | $ | (5,795,144 | ) | | $ | 2,203,006 | | | $ | (2,946,638 | ) | | $ | (1,219,278 | ) |
| | | | | | | | | | | | | | | | | |
| Amounts attributable to common stockholders: | | | | | | | | | | | | | | | | |
| Net loss (income) from continuing operations, net of income taxes | | | (10,502,820 | ) | | | 1,566,157 | | | | (3,628,177 | ) | | | (868,752 | ) |
| Net loss (income) from discontinued operations, net of income taxes | | | 845,812 | | | | (305,523 | ) | | | - | | | | (106,659 | ) |
| Net loss (income) attributable to common stockholders | | | (9,657,008 | ) | | | 1,260,634 | | | | (3,628,177 | ) | | | (975,411 | ) |
| | | | | | | | | | | | | | | | | |
| Net loss (income) attributable to common stockholders per share - basic and diluted: | | | | | | | | | | | | | |
| - Basic & diluted earnings/(loss) per share from continuing operations | | $ | (2.68 | ) | | $ | 0.40 | | | $ | (0.93 | ) | | $ | (0.22 | ) |
| - Basic & diluted earnings/(loss) per share from discontinued operations | | $ | 0.22 | | | $ | (0.08 | ) | | $ | (0.00 | ) | | $ | (0.03 | ) |
| - Basic & diluted earnings/(loss) per share attributable to common stockholders | | $ | (2.46 | ) | | $ | 0.32 | | | $ | (0.93 | ) | | $ | (0.25 | ) |
| | | | | | | | | | | | | | | | | |
| Weighted average shares outstanding | | | | | | | | | | | | | | | | |
| - Basic | | | 3,914,580 | | | | 3,912,248 | | | | 3,914,580 | | | | 3,914,357 | |
| - Diluted | | | 3,914,580 | | | | 3,912,248 | | | | 3,914,580 | | | | 3,914,357 | |
The accompanying notes are an integral part of these unaudited consolidated financial statements.
CHINA YIDA HOLDING CO. AND SUBSIDIARIES
CONSOLIDATED STATEMENTS OF CASH FLOWS
(UNAUDITED)
| | | For The Nine Months Ended September 30, | |
| | | 2013 | | | 2012 | |
| | | | | | | |
| CASH FLOWS FROM OPERATING ACTIVITIES | | | | | | |
| Net (loss) income | | $ | (9,759,223 | ) | | $ | 1,059,021 | |
| Loss on discontinued operations attributable to China Yida Holding Co. | | | 255,536 | | | | 507,136 | |
| Adjustments to reconcile net income to net cash provided by operating activities: | | | | | | | | |
| Gain on disposal of discontinued operation | | | (999,133 | ) | | | - | |
| Depreciation | | | 4,366,630 | | | | 3,033,626 | |
| Amortization | | | 1,496,175 | | | | 1,845,015 | |
| Stock based compensation | | | - | | | | 36,500 | |
| Deferred tax expense | | | - | | | | 36,434 | |
| Amortization of financing costs | | | 111,976 | | | | 180,597 | |
| Changes in operating assets and liabilities: | | | | | | | | |
| Accounts receivable | | | (398,206 | ) | | | (97,174 | ) |
| Other receivables, net | | | (2,298,129 | ) | | | (458,807 | ) |
| Advances and prepayments | | | (3,554,220 | ) | | | 254,323 | |
| Accounts payable | | | 98,765 | | | | (58,993 | ) |
| Accrued expenses and other payables | | | 3,413,373 | | | | 1,346,432 | |
| Taxes payable | | | (436,094 | ) | | | (836,599 | ) |
| Net cash used in (provided by) continued operations | | | (7,702,550 | ) | | | 6,847,512 | |
| Net cash used in (provided by) discontinued operations | | | (1,910,479 | ) | | | 3,772,464 | |
| Net cash used in (provided by) operating activities | | | (9,613,029 | ) | | | 10,619,976 | |
| | | | | | | | | |
| CASH FLOWS FROM INVESTING ACTIVITIES | | | | | | | | |
| Additions to property and equipment | | | (71,654,206 | ) | | | (9,085,049 | ) |
| Additions to construction in progress | | | - | | | | (416,744 | ) |
| Additions to intangible asset | | | - | | | | (4,639,247 | ) |
| Change in long-term prepayments for acquisition of property,equipment and land use rights | | | (212,378 | ) | | | 304,148 | |
| Net cash used in continued operations | | | (71,866,584 | ) | | | (13,836,892 | ) |
| Net cash used in discontinued operations | | | (569,859 | ) | | | (1,507,793 | ) |
| Net cash used in investing activities | | | (72,436,443 | ) | | | (15,344,685 | ) |
| | | | | | | | | |
| CASH FLOWS FROM FINANCING ACTIVITIES | | | | | | | | |
| Repayment of obligation under airtime rights commitment | | | (1,567,134 | ) | | | (1,729,368 | ) |
| Proceeds from disposal of discontinued entity | | | 9,616,155 | | | | - | |
| Proceeds from Anhui Yida | | | 2,235,756 | | | | - | |
| Repayment to Anhui Yida | | | (3,838,409 | ) | | | 1,764,000 | |
| Payment of deferred financing costs | | | - | | | | (674,645 | ) |
| Proceeds from short-term loans | | | 4,021,038 | | | | 3,170,326 | |
| Repayment of short-term loans | | | (1,608,415 | ) | | | - | |
| Proceeds from long-term loans | | | 53,077,703 | | | | 9,510,977 | |
| Repayment of long-term loans | | | (13,223,471 | ) | | | (2,847,632 | ) |
| Proceeds from loans from related parties | | | 27,117,207 | | | | - | |
| Net cash provided by continued operations | | | 75,830,430 | | | | 9,193,658 | |
| Net cash provided by (used in) discontinued operations | | | 1,602,653 | | | | (1,764,000 | ) |
| Net cash provided by financing activities | | | 77,433,083 | | | | 7,429,658 | |
| | | | | | | | | |
| EFFECT OF EXCHANGE RATE CHANGES ON CASH | | | 88,662 | | | | 26,457 | |
| | | | | | | | | |
| NET INCREASE (DECREASE) IN CASH AND CASH EQUIVALENTS | | | (4,527,728 | ) | | | 2,731,406 | |
| NET INCREASE IN CASH & CASH EQUIVALENTS FROM DISCONTINUED OPERATIONS | | | (864,491 | ) | | | 503,234 | |
| NET INCREASE IN CASH & CASH EQUIVALENTS FROM CONTINUING OPERATIONS | | | (3,663,237 | ) | | | 2,228,172 | |
| | | | | | | | | |
| CASH AND CASH EQUIVALENTS, BEGINNING OF PERIOD | | | 5,658,319 | | | | 5,141,855 | |
| CASH AND CASH EQUIVALENTS, ENDING OF PERIOD | | $ | 1,995,082 | | | $ | 7,370,027 | |
| | | | | | | | | |
| SUPPLEMENTAL DISCLOSURES: | | | | | | | | |
| Non-cash investing activities: | | | | | | | | |
| Transfer from construction in progress to property and equipment | | $ | 70,772,638 | | | $ | 23,165,538 | |
| Transfer from advances and prepayments to intangible assets | | $ | - | | | $ | 9,556,747 | |
| | | | | | | | | |
| Cash paid during the period for: | | | | | | | | |
| Income tax | | $ | 525,184 | | | $ | 3,199,743 | |
| Interest | | $ | 5,870,390 | | | $ | 2,303,355 | |
The accompanying notes are an integral part of these consolidated financial statements.
CHINA YIDA HOLDING, CO. AND SUBSIDIARIES NOTES TO CONSOLIDATED FINANCIAL STATEMENTS (UNAUDITED)
| 1. | ORGANIZATION AND DESCRIPTION OF BUSINESS |
China Yida Holding Co. (“China Yida”) and its subsidiaries (collectively the "Company”, “we”, “us”, or “our”) engage in tourism and advertisement businesses in the People’s Republic of China.
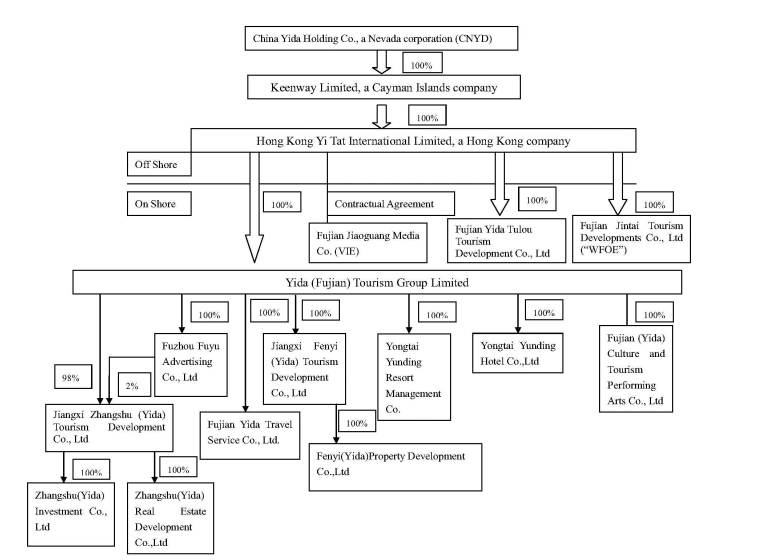
Keenway Limited was incorporated under the laws of the Cayman Islands on May 9, 2007 for the purpose of functioning as an off-shore holding company to obtain ownership interests in Hong Kong Yi Tat International Investment Co., Ltd (“Hong Kong Yi Tat”), a company incorporated under the laws of Hong Kong. Immediately prior to the Merger (defined below), Mr. Chen Minhua and his wife, Ms. Fan Yanling, were the majority shareholders of Keenway Limited.
On November 19, 2007, we entered into a share exchange and stock purchase agreement with Keenway Limited, Hong Kong Yi Tat, and with the shareholders of Keenway Limited at that time, including Chen Minhua, Fan Yanling, Zhang Xinchen, Extra Profit International Limited, and Lucky Glory International Limited (collectively, the “Keenway Limited Shareholders”), pursuant to which in exchange for all of their shares of Keenway Limited common stock, the Keenway Limited Shareholders received 18,180,649 newly issued shares (or 90,903,246 shares prior to the reverse stock split on November 16, 2012) of our common stock and 728,359 shares (or 3,641,796 shares prior to the reverse stock split on November 16, 2012) of our common stock which was transferred from some of our then existing shareholders (the “Merger”). As a result of the closing of the Merger, the Keenway Limited Shareholders owned approximately 94.5% of our then issued and outstanding shares on a fully diluted basis and Keenway Limited became our wholly owned subsidiary.
Hong Kong Yi Tat was incorporated as the holding company of our operating entities, Fujian Jintai Tourism Development Co., Ltd., and Fujian Jiaoguang Media Co., Ltd., Yida (Fujian) Tourism Group Limited, and Fujian Yida Tulou Tourism Development Co., Ltd. (“Tulou”). Hong Kong Yi Tat does not have any other operation.
Fujian Jintai Tourism Development Co., Ltd. (“Fujian Jintai”) has a wholly owned subsidiary, Fuzhou Hongda Commercial Services Co., Ltd., (“Hongda”). The operation of Fujian Jintai is to develop the Great Golden Lake, one of our tourism destinations.
Hongda does not have any operation except for owning 100% of the ownership interest in Fuzhou Fuyu Advertising Co., Ltd. (“Fuyu”) which is engaged in the operations of our media business. On March 15, 2010, Hongda entered into an equity transfer agreement with Fujian Yunding Tourism Industrial Co., Ltd, (currently known as Yida (Fujian) Tourism Group Limited, “Fujian Yunding”), pursuant to which Fujian Yunding acquired 100% of the issued and outstanding shares of Fuyu from Hongda at the aggregate purchase price of RMB 3,000,000. As a result, Fujian Yunding became the 100% holding company of Fuyu. Hongda ceased business and deregistered on December 2, 2011.
Fujian Jintai originally also owned 100% of the ownership interest in Fujian Yintai Tourism Co., Ltd. (“Yintai”). On March 15, 2010, Fujian Jintai entered into an equity transfer agreement with Fujian Yunding, pursuant to which Fujian Yunding acquired 100% of the issued and outstanding common stock of Yintai from Fujian Jintai at the aggregate purchase price of RMB 5,000,000. As a result, Yintai became a wholly owned subsidiary of Fujian Yunding. Yintai was deregistered on November 18, 2010.
Fujian Yida Tulou Tourism Development Co., Ltd.’s (“Tulou”) primary business relates to the operation of the Hua’An Tulou cluster, one of our tourism destinations.
On April 12, 2010, our operating subsidiary “Fujian Yunding Tourism Industrial Co., Ltd.” changed its name to “Yida (Fujian) Tourism Group Limited” for our expanding business in operations of domestic tourism destinations in China by acquiring new tourism destinations. Yida (Fujian) Tourism Group Limited’s (“Fujian Yida”) primary business relates to the operations of our Yunding tourism destination and all of our newly engaged tourism destinations, and the management of our media business.
On March 16, 2010, Fujian Yida formed a wholly owned subsidiary, Yongtai Yunding Resort Management Co., Ltd. (“Yongtai Yunding”) which currently has no material business operations. We plan to develop Yongtai Yunding into a business entity primarily focusing on the operations of our Yunding tourism destination.
Fujian Jiaoguang Media Co., Ltd. (“Fujian Jiaoguang”) and the Company’s contractual relationship comply with the requirements of the Accounting Standard Codification ("ASC") 810, to consolidate Fujian Jiaoguang’s financial statements as a Variable Interest Entity. During the current period, Fujian Jiaoguang had no material business operations.
Fuzhou Fuyu Advertising Co., Ltd. (“Fuyu”) concentrates on the mass media segment of our business. Its primary business is focused on advertisements, including media publishing, television, cultural and artistic communication activities, and performance operation and management activities.
CHINA YIDA HOLDING, CO. AND SUBSIDIARIES
NOTES TO CONSOLIDATED FINANCIAL STATEMENTS
(UNAUDITED)
| 1. | ORGANIZATION AND DESCRIPTION OF BUSINESS (CONTINUED) |
On April 15, 2010, we entered into agreement with Anhui Xingguang Group to set up a new subsidiary – Anhui Yida Tourism Development Co., Ltd. ("Anhui Yida") by investing 60% of the equity interest, and Anhui Xingguang Group owns 40% of the equity interest of Anhui Yida. The total paid-in capital of Anhui Yida was $14,687,307 (equals RMB 100 million). Anhui Yida's primary business relates to the operation of our tourism destinations, specifically, Ming dynasty culture tourist destination.
On July 6, 2010, Fujian Yida formed a wholly owned subsidiary, Jiangxi Zhangshu (Yida) Tourism Development Co., Ltd. (“Jiangxi Zhangshu”) which currently has no material business operations. The initial paid-in capital of Jiangxi Zhangshu was $2,937,461 (RMB 20 million). On July 5, 2011, Fujian Yida and Fuyu further injected capital amounted to RMB 49 million and RMB1 million, respectively, to Jiangxi Zhangshu. On March 20, 2012, Fujian Yida and Fuyu further injected capital amounted to RMB 29.4 million and RMB 0.6 million, respectively, to Jiangxi Zhangshu, and the total paid-in capital increased to $15,842,337 (RMB100 million). We plan to develop Jiangxi Zhangshu into a business entity primarily focusing on the operations of a new tourist destination.
On July 7, 2010, Fujian Yida formed a wholly owned subsidiary, Jiangxi Fenyi (Yida) Tourism Development Co., Ltd. (“Jiangxi Fenyi”) which currently has no material business operations. The initial paid-in capital of Jiangxi Fenyi was $1,762,477 (RMB 12 million). On July 7, 2011, Fujian Yida further injected capital amounted to RMB 48 million to Jiangxi Fenyi and the total paid-in capital increased to $9,391,876 (RMB 60 million). We plan to develop Jiangxi Fenyi into a business entity primarily focusing on the operations of a new tourist destination.
On June 24, 2011, Fujian Yida formed a wholly owned subsidiary, Fujian Yida Travel Service Co., Ltd (the “Yida Travel”). The total paid-in capital of Yida Travel was $1,546,670 (RMB 10 million). Its primary business is to conduct domestic and international traveling services in China, including operating the direct sales of travel services for our current tourist destinations at the Great Golden Lake, Yunding Recreational Park, and Hua’An Tulou Cluster, and our three tourist destinations currently under construction, Ming Dynasty Entertainment World, China Yang-sheng (Nourishing Life) Paradise, and the City of Caves.
On May 11, 2012, Jiangxi Zhangshu formed a wholly owned subsidiary, Zhangshu (Yida) Real Estate Development Co., Ltd. (“Zhangshu Development”). The total paid-in capital of Zhangshu Development was $792,532 (RMB 5 million). Its primary business is to conduct business of real estate development and sales in China.
On May 16, 2012, Anhui Yida formed a wholly owned subsidiary, Bengbu (Yida) Real Estate Development Co., Ltd. (the “Bengbu Yida”). The total paid-in capital of Fenyi Development was $1,268,050 (RMB 8 million). Its primary business is to conduct business of real estate development in China.
On May 22, 2012, Jiangxi Zhangshu formed a wholly owned subsidiary, Zhangshu (Yida) Investment Co., Ltd. (the “Zhangshu Investment”). The total paid-in capital of Zhangshu Investment was $792,532 (RMB 5 million). Its primary business is to conduct real estate investment, project management and consulting in China.
On June 6, 2012, Jiangxi Fenyi formed a wholly owned subsidiary, Fenyi (Yida) Property Development Co., Ltd. (“Fenyi Development”). The total paid-in capital of Fenyi Development was $792,532 (RMB 5 million). Its primary business is to conduct business of real estate development and sales in China.
On July 20, 2012, Anhui Yida formed a wholly owned subsidiary, Bengbu (Yida) Investment Co., Ltd. (“Bengbu Investment”). The total paid-in capital of Fenyi Development was $792,532 (RMB 5 million). Its primary business is to conduct real estate investment, project management and consulting in China.
On July 30, 2012, Fujian Yida formed a wholly owned subsidiary, Fujian (Yida) Culture and Tourism Performing Arts Co., Ltd. (“Yida Arts”). The total paid-in capital of Fenyi Development was $792,532 (RMB 5 million). Its primary business is to operate performance and show events at Yunding Park.
On June 3, 2013, Fujian Yida entered into a stock transfer agreement with Anhui Xingguang Investment Group Ltd (“Purchaser”), pursuant to which Fujian Yida agreed to transfer its 60% interest in Anhui Yida to the Purchaser for 60 million RMB, or $9.72 million and assume all the assets and liabilities of Anhui Yida.
On June 26, 2013, Fujian Yida formed a wholly owned subsidiary, Yunding Hotel Management Co., Ltd. (“Yunding Hotel”). The total paid-in capital of Fenyi Development was $4,860,000 (RMB 30 million). Its primary business is to operate and manage the hotel and its facilities at Yunding Park.
CHINA YIDA HOLDING, CO. AND SUBSIDIARIES
NOTES TO CONSOLIDATED FINANCIAL STATEMENTS
(UNAUDITED)
| 2. | BASIS OF PRESENTATION AND SUMMARY OF SIGNIFICANT ACCOUNTING POLICIES |
The unaudited consolidated financial statements of China Yida Holding, Co. and Subsidiaries have been prepared in accordance with U.S. generally accepted accounting principles for interim financial information and pursuant to the requirements for reporting on Form 10-Q. Accordingly, they do not include all the information and footnotes required by accounting principles generally accepted in the United States of America for annual financial statements. However, the information included in these interim financial statements reflects all adjustments (consisting solely of normal recurring adjustments) which are, in the opinion of management, necessary for the fair presentation of the consolidated financial position and the consolidated results of operations. Results shown for interim periods are not necessarily indicative of the results to be obtained for a full year. The consolidated balance sheet information as of December 31, 2012 was derived from the audited consolidated financial statements included in the Company’s Annual Report on Form 10-K. These interim financial statements should be read in conjunction with that report. Certain comparative amounts have been reclassified to conform to the current period's presentation.
a. Basis of presentation
The accompanying consolidated financial statements have been prepared in conformity with accounting principles generally accepted in the United States of America. The functional currency is the Chinese Renminbi, however the accompanying consolidated financial statements have been translated and presented in United States Dollars ($).
b. Principles of consolidation
The accompanying consolidated financial statements include the accounts of China Yida and its wholly-owned subsidiaries Keenway Limited, Hong Kong Yi Tat, Fujian Jintai, Fuyu, Fujian Yida, Tulou, Yongtai Yunding, Jiangxi Zhangshu, Jiangxi Fenyi, Yida Travel, Fenyi Development, Zhangshu Development, Zhangshu Investment, Yida Arts, Yunding hotel and the accounts of its variable interest entity, Fujian Jiaoguang. All significant inter-company accounts and transactions have been eliminated in consolidation
Consolidation of Variable Interest Entities
According to the requirements of ASC 810, an Interpretation of Accounting Research Bulletin No. 51 that requires a Variable Interest Entity ("VIE"), the Company has evaluated the economic relationships of Fujian Jiaoguang which signed an exclusive right agreement with the Company. Therefore, Fujian Jiaoguang is considered to be a VIE, as defined by ASC Topic 810-10, of which the Company is the primary beneficiary.
The carrying amount and classification of Fujian Jiaoguang’s assets and liabilities included in the Consolidated Balance Sheets are as follows:
| | | September 30, 2013 | | | December 31, 2012 | |
| Total current assets * | | $ | 12,205,265 | | | $ | 12,317,151 | |
| Total assets | | $ | 12,212,916 | | | $ | 12,324,608 | |
| Total current liabilities # | | $ | 11,077,825 | | | $ | 10,829,647 | |
| Total liabilities | | $ | 11,077,825 | | | $ | 10,829,647 | |
* Including intercompany receivables of $12,187,373 and $12,312,288 as at September 30, 2013 and December 31, 2012, respectively, to be eliminated in consolidation.
# Including intercompany payables of $11,031,669 and $10,785,266 as at September 30, 2013 and December 31, 2012, respectively, to be eliminated in consolidation.
Although Fujian Jiaoguang no longer had revenues, its bank account still has to be maintained active with certain cash flows to support its expenses. As such, Fujian Jiaoguang transferred funds from and to the Company’s directly-owned subsidiaries, which resulted in part of the intercompany receivables and payables. Another significant portion of the intercompany receivable recorded at Fujian Jiaoguang represented payments that Fujian Jiaoguang paid on behalf of Jintai previously, which remained due from Jintai. Nonetheless, since Fujian Jiaoguang is a variable interest entity subject to consolidation, the balances of its intercompany receivables and payables are eliminated against the corresponding account balances at the Company’s directly-owned subsidiaries at the consolidation level.
CHINA YIDA HOLDING, CO. AND SUBSIDIARIES
NOTES TO CONSOLIDATED FINANCIAL STATEMENTS
(UNAUDITED)
| 2. | BASIS OF PRESENTATION AND SUMMARY OF SIGNIFICANT ACCOUNTING POLICIES (CONTINUED) |
c. Use of estimates and assumptions
The preparation of the consolidated financial statements in conformity with accounting principles generally accepted in the United States of America requires management to make estimates and assumptions that affect the reported amounts of assets and liabilities and disclosure of contingent assets and liabilities at the date of the consolidated financial statements and the amount of revenues and expenses during the reporting periods. Management makes these estimates using the best information available at the time the estimates are made. However, actual results could differ materially from those results. The most significant estimates reflected in the consolidated financial statements include depreciation, useful lives of property and equipment, deferred income taxes, useful life of intangible assets and contingencies. Estimates and assumptions are periodically reviewed and the effects of revisions are reflected in the consolidated financial statements in the period they are determined to be necessary.
d. Cash and cash equivalents
The Company considers all cash on hand and in banks, certificates of deposit and other highly-liquid investments with original maturities of three months or less, when purchased, to be cash and cash equivalents. As of September 30, 2013 and December 31, 2012, the Company has uninsured deposits in banks of approximately $1,989,000 and $6,501,000.
e. Accounts receivable
The Company maintains reserves for potential credit losses on accounts receivable. Management reviews the composition of accounts receivable and analyzes historical bad debts, customer concentrations, customer credit worthiness, current economic trends and changes in customer payment patterns to evaluate the adequacy of these reserves. Based on the management’s judgment, no allowance for doubtful accounts is required at the balance sheet dates.
f. Advances and prepayments
The Company advances funds to certain vendors for purchase of its construction materials and necessary services. Based on the management’s judgment, no allowance for advances and prepayments is required at the balance sheet dates.
g. Property and equipment
Property and equipment are recorded at cost less accumulated depreciation. Gains or losses on disposals are reflected as gain or loss in the year of disposal. The cost of improvements that extends the life of property, and equipment are capitalized. These capitalized costs may include structural improvements, equipment, and fixtures. All ordinary repair and maintenance costs are expensed as incurred.
Depreciation for financial reporting purposes is provided using the straight-line method over the estimated useful lives of the assets or lease term as follows:
| Building | 20 years |
| Electronic Equipment | 5 to 8 years |
| Transportation Equipment | 8 years |
| Office Furniture | 5 to 8 years |
| Leasehold Improvement and Attractions | Lesser of term of the lease or the estimated useful lives of the assets |
h. Intangible assets
Intangible assets consist of acquisition of management right of tourist resort, commercial airtime rights and land use rights for tourism resorts. They are amortized on the straight line basis over their respective lease periods. The lease period of management right, commercial airtime rights, and land use rights is 30 years, 3 years, and 40 years, respectively.
i. Impairment
The Company reviews long-lived assets for impairment whenever events or changes in circumstances indicate that the carrying amount of an asset may not be recoverable through the estimated undiscounted cash flows expected to result from the use and eventual disposition of the assets. Whenever any such impairment exists, an impairment loss will be recognized for the amount by which the carrying value exceeds the fair value.
CHINA YIDA HOLDING, CO. AND SUBSIDIARIES
NOTES TO CONSOLIDATED FINANCIAL STATEMENTS
(UNAUDITED)
| 2. | BASIS OF PRESENTATION AND SUMMARY OF SIGNIFICANT ACCOUNTING POLICIES (CONTINUED) |
Assets are grouped and evaluated at the lowest level for their identifiable cash flows that are largely independent of the cash flows of other groups of assets. The Company considers historical performance and future estimated results in its evaluation of potential impairment and then compares the carrying amount of the asset to the future estimated cash flows expected to result from the use of the asset. If the carrying amount of the asset exceeds estimated expected undiscounted future cash flows, the Company measures the amount of impairment by comparing the carrying amount of the asset to its fair value. The estimation of fair value is generally measured by discounting expected future cash flows as the rate the Company utilizes to evaluate potential investments. The Company estimates fair value based on the information available, judgments and projections are considered necessary. There was no impairment of long-lived assets as of September 30, 2013 and December 31, 2012.
j. Revenue recognition
Revenue is recognized at the date of service rendered to customers when a formal arrangement exists, the price is fixed or determinable, the services rendered, no other significant obligations of the Company exist and collectability is reasonably assured. Payments received before satisfaction of all of the relevant criteria for revenue recognition are recorded as unearned revenue.
Revenues from advance resort ticket sales are recognized when the tickets are used. Revenues from our contractors who have tourism contracts with us are generally recognized over the period of the applicable agreements commencing with the tourists visiting the resort. The Company also sells admission and activities tickets for a resort which the Company has the management right.
The Company sells the television airtime to third parties. The Company records advertising sales when advertisements are aired.
The Company has no allowance for product returns or sales discounts because services that are rendered and accepted by the customers are normally not refundable and discounts are normally not granted after service has been rendered.
Profit sharing costs are recorded as cost of revenue. Profit sharing arrangements with the local governments for the management rights (see Note 14):
| For the nine months ended September 30, 2013 | | | | | | |
| | | Fujian Jintai | | | Tulou | |
| | | | | | | |
| Gross receipts | | $ | 3,606,706 | | | $ | 512,986 | |
| | | | | | | | | |
| Profit sharing costs | | | 512,852 | | | | - | |
| Nature resource compensation expenses | | | 298,853 | | | | 45,953 | |
| Total paid to the local governments | | | 811,705 | | | | 45,953 | |
| | | | | | | | | |
| Net receipts | | $ | 2,795,001 | | | $ | 467,033 | |
| For the nine months ended September 30, 2012 | | | | | | |
| | | Fujian Jintai | | | Tulou | |
| | | | | | | |
| Gross receipts | | $ | 3,926,123 | | | $ | 1,033,337 | |
| | | | | | | | | |
| Profit sharing costs | | | 556,418 | | | | - | |
| Nature resource compensation expenses | | | 325,749 | | | | 107,296 | |
| Total paid to the local governments | | | 882,167 | | | | 107,296 | |
| | | | | | | | | |
| Net receipts | | $ | 3,043,956 | | | $ | 926,041 | |
| For the three months ended September 30, 2013 | | | | | | |
| | | Fujian Jintai | | | Tulou | |
| | | | | | | |
| Gross receipts | | $ | 1,741,215 | | | $ | 177,774 | |
| | | | | | | | | |
| Profit sharing costs | | | 244,159 | | | | - | |
| Nature resource compensation expenses | | | 145,072 | | | | 15,638 | |
| Total paid to the local governments | | | 389,231 | | | | 15,638 | |
| | | | | | | | | |
| Net receipts | | $ | 1,351,984 | | | $ | 162,136 | |
| For the three months ended September, 2012 | | | | | | |
| | | Fujian Jintai | | | Tulou | |
| | | | | | | |
| Gross receipts | | $ | 2,028,011 | | | $ | 245,453 | |
| | | | | | | | | |
| Profit sharing costs | | | 283,430 | | | | - | |
| Nature resource compensation expenses | | | 169,186 | | | | 22,813 | |
| Total paid to the local governments | | | 452,616 | | | | 22,813 | |
| | | | | | | | | |
| Net receipts | | $ | 1,575,395 | | | $ | 222,640 | |
CHINA YIDA HOLDING, CO. AND SUBSIDIARIES
NOTES TO CONSOLIDATED FINANCIAL STATEMENTS
(UNAUDITED)
| 2. | BASIS OF PRESENTATION AND SUMMARY OF SIGNIFICANT ACCOUNTING POLICIES (CONTINUED) |
k. Advertising costs
The Company expenses the cost of advertising as incurred or, as appropriate, the first time the advertising takes place. Advertising costs for the nine months ended September 30, 2013 and 2012 were $1,105,970 and $676,920, respectively. Advertising costs for the three months ended September 30, 2013 and 2012 were $298,460 and $310,986, respectively.
l. Post-retirement and post-employment benefits
Full time employees of subsidiaries of the Company participate in a government mandated multi-employer defined contribution plan pursuant to which certain pension benefits, medical care, employee housing, and other welfare benefits are provided to employees. Chinese labor regulations require that the subsidiaries of the Company make contributions to the government for these benefits based on a certain percentages of employees’ salaries. The Company has no legal obligation for the benefits beyond the contributions made. The total amounts for such employee benefits, which were expensed as incurred, were $210,370 and $182,125 for the nine months ended September 30, 2013 and 2012, respectively, and were $67,660 and $57,282 for the three months ended September 30, 2013 and 2012 respectively. Other than the above, neither the Company nor its subsidiary provides any other post-retirement or post-employment benefits.
m. Foreign currency translation
The Company uses the United States dollar ("U.S. dollars") for financial reporting purposes. The Company’s subsidiaries maintain their books and records in their functional currency, being the primary currency of the economic environment in which their operations are conducted. In general, for consolidation purposes, the Company translates the subsidiaries' assets and liabilities into U.S. dollars using the applicable exchange rates prevailing at the balance sheet dates, and the statements of income are translated at average exchange rates during the reporting periods. Gain or loss on foreign currency transactions are reflected on the income statement. Gain or loss on financial statement translation from foreign currency are recorded as a separate component in the equity section of the balance sheet and is included as part of accumulated other comprehensive income. The functional currency of the Company and its subsidiaries in China is the Chinese Renminbi.
n. Income taxes
Income taxes are accounted for under the asset and liability method. Deferred tax assets and liabilities are recognized for the future tax consequences attributable to differences between the financial statement carrying amounts of existing assets and liabilities and their respective tax bases and operating loss and tax credit carry forwards. Deferred tax assets and liabilities are measured using enacted tax rates expected to apply to taxable income in the years in which those temporary differences are expected to be recovered or settled. The effect on deferred tax assets and liabilities of a change in tax rates is recognized in income in the period that includes the enactment date. A valuation allowance is recognized if it is more likely than not that some portion, or all, of a deferred tax asset will not be realized. There were no deferred income tax assets as of September 30, 2013 and December 31, 2012.
The Company applied the provisions of ASC 740-10-50, “Accounting For Uncertainty In Income Taxes”, which provides clarification related to the process associated with accounting for uncertain tax positions recognized in our financial statements. Audit periods remain open for review until the statute of limitations has passed. The completion of review or the expiration of the statute of limitations for a given audit period could result in an adjustment to the Company’s liability for income taxes. Any such adjustment could be material to the Company’s results of operations for any given quarterly or annual period based, in part, upon the results of operations for the given period. At September 30, 2013, management considered that the Company had no uncertain tax positions, and will continue to evaluate for uncertain positions in the future.
China Yida is subject to U.S. Federal and California state examination by tax authorities for years after 2007, and the PRC tax authority for years after 2006.
o. Fair values of financial instruments
The carrying amounts reported in the consolidated financial statements for current assets and currently liabilities approximate fair value due to the short-term nature of these financial instruments. The carrying amount of long-term loans approximates fair value since the interest rates associated with the debts approximate the current market interest rates.
The Company adopted ASC 820-10, “Fair Value Measurements and Disclosures”, which establishes a single authoritative definition of fair value and a framework for measuring fair value and expands disclosure of fair value measurements for both financial and nonfinancial assets and liabilities. This standard defines fair value, provides guidance for measuring fair value and requires certain disclosures. This standard does not require any new fair value measurements, but discusses valuation techniques, such as the market approach (comparable market prices), the income approach (present value of future income or cash flows) and the cost approach (cost to replace the service capacity of an asset or replacement cost). For purposes of ASC 820-10-15, nonfinancial assets and nonfinancial liabilities would include all assets and liabilities other than those meeting the definition of a financial asset or financial liability as defined in ASC-820-10-15-15-1A.
CHINA YIDA HOLDING, CO. AND SUBSIDIARIES
NOTES TO CONSOLIDATED FINANCIAL STATEMENTS
(UNAUDITED)
| 2. | BASIS OF PRESENTATION AND SUMMARY OF SIGNIFICANT ACCOUNTING POLICIES (CONTINUED) |
p. Stock-based compensation
The Company records stock-based compensation expense pursuant to ASC 718-10, "Share Based Payment Arrangement ,” which requires companies to measure compensation cost for stock-based employee compensation plans at fair value at the grant date and recognize the expense over the employee's requisite service period. The Company’s expected volatility assumption is based on the historical volatility of Company’s stock or the expected volatility of similar entities. The expected life assumption is primarily based on historical exercise patterns and employee post-vesting termination behavior. The risk-free interest rate for the expected term of the option is based on the U.S. Treasury yield curve in effect at the time of grant.
Stock-based compensation expense is recognized based on awards expected to vest, and there were no estimated forfeitures as the Company has a short history of issuing options. ASC 718-10 requires forfeitures to be estimated at the time of grant and revised in subsequent periods, if necessary, if actual forfeitures differ from those estimates.
q. Earnings per share (EPS)
Earnings per share is calculated in accordance with ASC 260. Basic earnings per share is based upon the weighted average number of common shares outstanding. Diluted earnings per share is based on the assumption that all dilutive convertible shares and stock instruments were converted or exercised. Options and warrants are assumed to be exercised at the beginning of the period if the average stock price for the period is greater than the exercise price of the warrants and options.
r. Statutory Reserves
In accordance with the relevant laws and regulations of the PRC and the articles of association of the Company, the Company is required to allocate 10% of their net income reported in the PRC statutory accounts, after offsetting any prior years’ losses, to the statutory surplus reserve, on an annual basis. When the balance of such reserve reaches 50% of the respective registered capital of the subsidiaries, any further allocation is optional.
As of September 30, 2013, the statutory reserve of the subsidiaries already reached 50% of the registered capital of the subsidiaries and the Company did not have any further allocation on it.
The statutory surplus reserves can be used to offset prior years’ losses, if any, and may be converted into registered capital, provided that the remaining balances of the reserve after such conversion is not less than 25% of registered capital. The statutory surplus reserve is non-distributable.
s. Segment reporting
ASC 250, "Disclosure About Segments of an Enterprise and Related Information" requires use of the "management approach" model for segment reporting. The management approach model is based on the way a company’s management organizes segments within the company for making operating decisions and assessing performance. Reportable segments are based on products and services, geography, legal structure, management structure, or any other manner in which management disaggregates a company. The Company has two reportable segments: advertisement and tourism.
t. Dividend Policy
Under the laws governing foreign invested enterprises in China, dividend distribution and liquidation are allowed but subject to special procedures under the relevant laws and rules. Any dividend payments will be subject to the decision of the Board of Directors and subject to foreign exchange rules governing such repatriation. Any liquidation is subject to both the relevant government agency’s approval and supervision as well as the foreign exchange control.
u. Discontinued operations
Certain prior period amounts have been reclassified in these consolidated financial statements to conform to the 2011 presentation of discontinued operations of the VIE Group for the deep processed grain business. See Note 1 and 3 for additional information.
v. Reclassifications
Except for the classification for discontinued operations, certain classifications have been made to the prior year financial statements to conform to the current year presentation. The reclassifications have no impact on the Company’s 2012 Consolidated Statements of Income and Comprehensive Income and Consolidated Statements of Cash Flows.
CHINA YIDA HOLDING, CO. AND SUBSIDIARIES
NOTES TO CONSOLIDATED FINANCIAL STATEMENTS
(UNAUDITED)
| 2. | BASIS OF PRESENTATION AND SUMMARY OF SIGNIFICANT ACCOUNTING POLICIES (CONTINUED) |
w. Recent accounting pronouncements
In February 2013, the FASB issued ASU 2013-02, “Comprehensive Income (Topic 220): Reporting of Amounts Reclassified Out of Accumulated Other Comprehensive Income.” This ASU does not change the current requirements for reporting net income or other comprehensive income in financial statements. However, this guidance requires an entity to provide information about the amounts reclassified out of accumulated other comprehensive income by component. In addition, an entity is required to present, either on the face of the statement where net income is presented or in the notes, significant amounts reclassified out of accumulated other comprehensive income by the respective line items of net income but only if the amount reclassified is required under U.S. GAAP to be reclassified to net income in its entirety in the same reporting period. For other amounts that are not required under U.S. GAAP to be reclassified in their entirety to net income, an entity is required to cross-reference to other disclosures required under U.S. GAAP that provide additional detail about those amounts. For public entities, the guidance is effective prospectively for reporting periods beginning after December 15, 2012. For nonpublic entities, the guidance is effective prospectively for reporting periods beginning after December 15, 2013. Early adoption is permitted. The adoption of this standard is not expected to have a material impact on the Company’s consolidated financial position and results of operations.
In July 2012, FASB issued an amendment (ASU No. 2012-02) to Intangibles–Goodwill and Other (ASC Topic 350). In accordance with the amendments in this Update, an entity has the option first to assess qualitative factors to determine whether the existence of events and circumstances indicates that it is more likely than not that the indefinite-lived intangible asset is impaired. If, after assessing the totality of events and circumstances, an entity concludes that it is not more likely than not that the indefinite-lived intangible asset is impaired, then the entity is not required to take further action. However, if an entity concludes otherwise, then it is required to determine the fair value of the indefinite-lived intangible asset and perform the quantitative impairment test by comparing the fair value with the carrying amount in accordance with Subtopic 350-30. An entity also has the option to bypass the qualitative assessment for any indefinite-lived intangible asset in any period and proceed directly to performing the quantitative impairment test. An entity will be able to resume performing the qualitative assessment in any subsequent period. The amendments are effective for annual and interim impairment tests performed for fiscal years beginning after September 15, 2012, with early adoption permitted. The adoption of this guidance had no impact on our consolidated financial position or results of operations.
The Company does not believe any other recently issued but not yet effective accounting standards from ASU 2013-03 to ASU 2013-05 , if currently adopted, would have a material effect of the consolidated financial position, results of operation and cash flows.
CHINA YIDA HOLDING, CO. AND SUBSIDIARIES
NOTES TO CONSOLIDATED FINANCIAL STATEMENTS
(UNAUDITED)
Other receivables consist of the following:
| | | September 30, 2013 | | | December 31, 2012 | |
| | | | | | | |
| Refundable deposits – Tulou and Zhangshu | | $ | 2,006,869 | | | $ | 79,315 | |
| Ticket revenue deposited in special treasury account assigned by government | | | 247,902 | | | | - | |
| Other | | | 368,165 | | | | 96,216 | |
| | | | 2,622,936 | | | | 175,531 | |
| Less: Allowance | | | (21,418 | ) | | | (20,874 | ) |
| | | $ | 2,601,518 | | | $ | 154,657 | |
As of September 30, 2013 and December 31, 2012, the ticket revenue collected by Fujian Jintai of $247,902 and $0 were deposited in the special treasury account assigned by government according to the tourism management revenue sharing agreement between Fujian Jintai and Fujian Taining Great Golden Lake Tourism Economic Development Zone Management Committee (“Taining government”) in 2001 (See Note 14) and usually they are collectible within 30 days after profit sharing process is completed by the government.
| 4. | ADVANCES AND PREPAYMENTS |
Advances and prepayments consist of the following:
| | | September 30, 2013 | | | December 31, 2012 | |
| Advance payments related to facilities of Yang-Sheng Paradise | | $ | 3,063,085 | | | $ | - | |
| Advance payments related to hotel facilities of Yunding resort | | | 1,317,961 | | | | 793,492 | |
| Advance payments related to land use rights | | | 916,541 | | | | 829,812 | |
| Advance payments related to construction cost of Great Golden Lake | | | 56,918 | | | | 55,473 | |
| Other | | | 111,405 | | | | 145,627 | |
| | | | 5,465,910 | | | | 1,824,404 | |
| Less: Allowance | | | (3,206 | ) | | | (3,125 | ) |
| | | $ | 5,462,704 | | | $ | 1,821,279 | |
As of September 30, 2013, advance payments related to land use rights represents the payment made by Fuijian Yida and Fenyi Yida. Fuijian Yida made advance payments to the local government of Yongtai province of $801,771 (RMB 4.9 million) for the acquisition of land use rights. Fenyi Yida made advance payment of $114,770 (RMB 0.7 million) on behalf of the local government to the existing user of the land to compensate for the acquisition of land for the development of the tourism destinations in Fenyi province.
As of December 31, 2012, advance payments related to land use rights represents the payment made by Fuijian Yida and Fenyi Yida. Fuijian Yida made advance payments to the local government of Yongtai province of $717,957 (RMB 4.5 million) for the acquisition of land use rights. Fenyi Yida made advance payment of $111,855 (RMB 0.7 million) on behalf of the local government to the existing user of the land to compensate for the acquisition of land for the development of the tourism destinations in Fenyi province.
As of September 30, 2013 and December 31, 2012, Advance payments related to hotel facilities of Yunding resort were $1,317,961 and $793,492.
As of September 30, 2013 and December 31, 2012, Advance payments related to facilities of Yang-Sheng Paradise were $3,063,085 and $0.
| 5. | PROPERTY AND EQUIPMENT, NET |
Property and equipment consist of the following:
| | | September 30, 2013 | | | December 31, 2012 | |
| | | | | | | |
| Buildings, Improvements and Attractions | | $ | 228,161,455 | | | $ | 152,459,176 | |
| Transportation Equipment | | | 2,631,587 | | | | 2,520,946 | |
| Electronic Equipment | | | 1,428,638 | | | | 712,422 | |
| Office Furniture | | | 98,820 | | | | 59,191 | |
| | | | 232,320,500 | | | | 155,751,735 | |
| Less: Accumulated Depreciation | | | (17,659,088 | ) | | | (12,904,074 | ) |
| Property and equipment, net | | $ | 214,661,412 | | | $ | 142,847,661 | |
Depreciation expense for the nine months ended September 30, 2013 and 2012 were $4,366,630 and $3,033,626, respectively.
Depreciation expense for the three months ended September 30, 2013 and 2012 were $1,500,461 and $1,012,444, respectively.
CHINA YIDA HOLDING, CO. AND SUBSIDIARIES
NOTES TO CONSOLIDATED FINANCIAL STATEMENTS
(UNAUDITED)
Intangible assets consist of the following:
| | | September 30, 2013 | | | December 31, 2012 | |
| | | | | | | |
| Land use right | | $ | 48,049,977 | | | $ | 46,829,673 | |
| Commercial airtime rights | | | 6,847,104 | | | | 6,673,210 | |
| Management right of tourist resort | | | 5,696,707 | | | | 5,552,030 | |
| | | | 60,593,788 | | | | 59,054,914 | |
| Accumulated amortization | | | (9,318,437 | ) | | | (7,606,183 | ) |
| Intangible assets, net | | $ | 51,275,351 | | | $ | 51,448,730 | |
Commercial airtime rights
On August 1, 2010, the Company entered into a commercial airtime rights agreement with a television station. Under the terms of the agreement, the Company can obtain commercial airtime and resell to advertisers from August 1, 2010 to July 31, 2013 for a monthly fee of $162,763 (RMB 1,000,000) for the period from August 1, 2010 to July 31, 2011. The fee is increased by 20% annually on every August 1. From August 1, 2011 to July 31, 2012, the monthly fee is $195,316 (RMB1,200,000). From August 31, 2012 to July 30, 2013, the monthly fee will be $234,379 (RMB1,440,000) for the period. The agreement can be renewed for two additional years, with mutual agreement between the parties. Since the Company is reselling the commercial airtime to advertisers, the Company has present-valued the monthly payments, including the 20% annual increase, using the market borrowing rate of 7% for three years and recorded $6,847,104 (RMB42,067,917) as commercial airtime rights as an intangible asset, $7,109,491 (RMB43,680,000) as an obligation under airtime rights commitment, and $262,388 (RMB1,612,083) as deferred interest at inception.
At inception, the Company had made an initial assessment that there is no assurance the Company will exercise the option for two additional years and therefore, the Company has only considered the present value of the monthly fee for the first three years under the terms of the agreement.
As of September 30, 2013, the commercial airtime rights have been fully amortized.
Amortization expense for the nine months ended September 30, 2013 and 2012 amounted to $1,496,175 and $1,845,015, respectively.
Amortization expense for the three months ended September 30, 2013 and 2012 amounted to $252,563 and $613,873, respectively.
Estimated amortization for the next five years and thereafter is as follows:
| As of September 30, | | Amounts | |
| 2014 | | $ | 240,684 | |
| 2015 | | | 240,684 | |
| 2016 | | | 240,684 | |
| 2017 | | | 240,684 | |
| 2018 | | | 240,684 | |
| Thereafter | | | 50,071,931 | |
| | | $ | 51,275,351 | |
CHINA YIDA HOLDING, CO. AND SUBSIDIARIES
NOTES TO CONSOLIDATED FINANCIAL STATEMENTS
(UNAUDITED)
Long-term prepayments consist of the following:
| | | September 30, 2013 | | | December 31, 2012 | |
| | | | | | | |
| Prepayments for project planning, assessments and consultation fees | | $ | 2,040,209 | | | $ | 1,585,897 | |
| Deferred financing costs | | | 424,355 | | | | 927,540 | |
| Others | | | 829,626 | | | | 539,294 | |
| | | $ | 3,294,190 | | | $ | 3,052,731 | |
Prepayments for project planning, assessments and consultation fees represent advances relating to the planning, assessment and consultation for the development of other tourism destinations in Jiangxi province.
For the nine months ended September 30, 2013, the Company paid approximately $325,526 (RMB 2.0 million) of fees to Yongtai County People’s Government based on the Tourist Destination Cooperative Development Agreement with Yongtai County Government with respect to the development of Yunding Park (see Note 15), and amortize this prepayment over the remaining life of the cooperative development.
For the nine months ended September 30, 2013 and 2012, the Company paid $0 and approximately $674,645 (RMB 4.3 million) of fees in order to obtain additional debt used to construct various resort projects. These fees were deferred and amortized on a straight line basis over the life of the debt.
Estimated amortization of the deferred financing costs for the next five years and thereafter is as follows:
| As of September 30, | | Amounts | |
| 2014 | | $ | 103,924 | |
| 2015 | | | 103,924 | |
| 2016 | | | 103,924 | |
| 2017 | | | 103,924 | |
| 2018 | | | 112,583 | |
| Total minimum payments | | | 528,279 | |
| Current portion recorded under prepayments – current portion | | | (103,924 | ) |
| | | | | |
| Long term portion | | $ | 424,355 | |
CHINA YIDA HOLDING, CO. AND SUBSIDIARIES
NOTES TO CONSOLIDATED FINANCIAL STATEMENTS
(UNAUDITED)
Short-term loans
Short-term loans represent borrowings from commercial banks that are due within one year. These loans consisted of the following:
| | | September 30, 2013 | | | December 31, 2012 | |
| | | | | | | |
| Loan from Fujian Haixia Bank (formerly known as Merchant bank of Fuzhou), interest rate at 8.4% per annum, due August 16, 2013, guaranteed by Fujian Jintai Tourism Development Co., Ltd. and Yida Travel Service Co. Ltd. | | $ | - | | | $ | 1,586,294 | |
| | | | | | | |
| Loan from China Minsheng Banking Corp, Ltd., interest rate at 10% per annum, due July 22, 2014, | | | 2,034,538 | | | | - | |
| | | | | | | |
| Loan from China Minsheng Banking Corp, Ltd., interest rate at 10% per annum, due July 25, 2014, | | | 2,034,539 | | | | | - |
| Total | | $ | 4,069,077 | | | $ | 1,586,294 | |
The Company borrowed the loan of $1,586,294 (RMB 10 million) in August 2012 from Fujian Haixia Bank and the due date to be August 16, 2013, with the interest rate at 8.4%, and the Company repaid in full in August 2013.
In July 2013 the Company borrowed two loans of $2,034,538 (RMB 12.5 million) due July 22, 2014 and $2,034,539 (RMB 12.5 million) due July 25, 2014 from China Minsheng Banking Corp, Ltd with the interest rate at 10%.
Interest expense for the nine months ended September 30, 2013 and 2012 amounted to $173,713 and $134,882, respectively. Interest expense for the three months ended September 30, 2013 and 2012 amounted to $105,652 and $26,036, respectively. The interest expense for the nine months ended September 30, 2013 and 2012 of $62,675 and $108,745, respectively was capitalized as part of construction in progress. The interest expense for the three months ended September 30, 2013 and 2012 that amounted to $29,018 and $0, was capitalized as part of construction in progress.
Long-term debt
Long term debt consists of the following:
| | | September 30, 2013 | | | December 31, 2012 | |
| | | | | | | |
| Loan from China Minsheng Banking Corp, Ltd., interest rate at 9% per annum, final installment due November 30, 2019, secured by the land use right of Jiangxi Zhangshu, collateralized by the personal guarantees by two of the Company’s directors. (Note (a)) | | $ | 53,711,812 | | | $ | 23,794,416 | |
| | | | | | | | | |
| Loan from Industrial and Commercial Bank of China Limited, interest rate at 7.76% per annum, final installment due October 25, 2018, collateralized by the right to collect resort ticket sales at the Great Golden Lake. (Note (b)) | | | 11,126,018 | | | | 11,829,224 | |
| | | | | | | | | |
| Loan from Industrial and Commercial Bank of China Limited, interest rate at 6.40% per annum, final installment due December 15, 2017, secured by credit guarantee of Fujian Jintai and the right to collect resort ticket sales at Yunding resort as additional collateral. (Note (c)) | | | - | | | | 9,676,396 | |
| | | | | | | | | |
| Loan from China Minsheng Banking Corp, Ltd , interest rate at 12.50 % per annum, final installment due March 6, 2015, secured by the land use rights of Fujian Yida and the right to collect resort ticket sales at Yunding resort as additional collateral. (Note (d)) | | | 24,414,460 | | | | - | |
| | | | | | | | | |
| Loan from China Minsheng Banking Corp, Ltd., interest rate at 11.97% per annum, final installment due November 20, 2014, secured by credit guarantee of Fujian Jintai, collateralized by the fixed assets of Fujian Yida and personal guarantees by two of the Company’s directors as additional collateral. (Note (e)) | | | 7,975,390 | | | | 10,152,285 | |
| | | | 97,227,680 | | | | 55,452,321 | |
| Less: current portion | | | (7,555,462 | ) | | | (6,808,376 | ) |
| Total | | $ | 89,672,218 | | | $ | 48,643,945 | |
CHINA YIDA HOLDING, CO. AND SUBSIDIARIES
NOTES TO CONSOLIDATED FINANCIAL STATEMENTS
(UNAUDITED)
Note:
| (a) | $8,138,153 (RMB 50,000,000), $8,138,153 (RMB 50,000,000), $13,021,046 (RMB 80,000,000) and $24,414,460 (RMB 150,000,000) will be due in each twelve-month period as of September 30, 2017, 2018, 2019 and 2020 respectively. |
| | |
| (b) | $2,021,517 (RMB 12,420,000) will be due in each twelve-month period as of September 30, 2014, 2015, 2016, 2017 and 2018 respectively, and $1,018,432 (RMB 6,270,000) will be due in the twelve-month period as of September 30, 2019. In November 2011 and in March 2012, $478,728 and $223,327 of financing costs were paid in connection with this loan and subject to amortization, with $284,835 and $139,519 recorded in Long-Term Prepayments as of September 30, 2013, respectively. |
| | |
| (c) | For the nine months ended September 30, 2013, the Company repaid the loan of $9,881,423 (RMB 61 million). |
| | |
| (d) | $24,414,460 (RMB 150,000,000) will be due in twelve-month period as of September 30, 2015. |
| | |
| (e) | $5,533,944 (RMB 34,000,000) and $2,441,446 (RMB15,000,000) will be due in each twelve-month period as of September 30, 2014 and 2015, respectively. |
Interest expense for the nine months ended September 30, 2013 and 2012 amounted to $6,607,691 and $2,168,472 respectively. Interest expense for the three months ended September 30, 2013 and 2012 amounted to $2,518,195 and $797,471, respectively. The interest expense for the nine months ended September 30, 2013 and 2012 of $3,275,991 and $1,369,740, respectively was capitalized as part of construction in progress. The interest expense for the three months ended September 30, 2013 and 2012 that amounted to $1,674,807 and $0, was capitalized as part of construction in progress.
| 9. | ACCRUED EXPENSES AND OTHER PAYABLES |
Accrued expenses and other payables consist of the following:
| | | September 30, 2013 | | | December 31, 2012 | |
| | | | | | | |
| Security deposits payable | | $ | 2,040,107 | | | $ | - | |
| Accrued interest | | | 921,898 | | | | - | |
| Accrued payroll | | | 561,050 | | | | 358,585 | |
| Unearned revenue | | | 120,805 | | | | 24,795 | |
| Welfare payable | | | 13,222 | | | | 12,886 | |
| Other | | | 582,538 | | | | 370,550 | |
| | | $ | 4,239,620 | | | $ | 766,816 | |
CHINA YIDA HOLDING, CO. AND SUBSIDIARIES
NOTES TO CONSOLIDATED FINANCIAL STATEMENTS
(UNAUDITED)
The Company is subject to Hong Kong (“HK”) and People’s Republic of China (“PRC”) profit tax. For certain operations in HK and PRC, the Company has incurred net accumulated operating losses for income tax purposes.
United States
The Company is incorporated in the United States of America and is subject to United States federal taxation. No provisions for income taxes have been made as the Company has no taxable income for the year. The applicable income tax rate for the Company was 35% for the each of the nine months ended September 30, 2013 and 2012. Net operating loss at September 30, 2013, which can be used to offset future taxable income, was approximately $3,576,000. No tax benefit has been realized since a valuation allowance has offset the deferred tax asset resulting from the net operating losses.
Cayman Islands
Keenway Limited, a wholly owned subsidiary of the Company, is incorporated in the Cayman Islands and, under the current laws of the Cayman Islands, is not subject to income taxes.
Hong Kong
Hong Kong Yi Tat, a wholly owned subsidiary of the Company, is incorporated in Hong Kong. Hong Kong Yi Tat is subject to Hong Kong taxation on its activities conducted in Hong Kong and income arising in or derived from Hong Kong. No provisions for income taxes have been made as Hong Kong Yi Tat has no taxable income for the period. The applicable statutory tax rate for the subsidiary was 16.5% for each of the nine months ended September 30, 2013 and 2012.
PRC
Effective on January 1, 2008, the PRC Enterprise Income Tax Law, EIT Law, and Implementing Rules impose an unified enterprise income tax rate of 25% on all domestic-invested enterprises and foreign investment enterprises in PRC, unless they qualify under certain limited exceptions. As such, starting from January 1, 2008, the Company’s subsidiaries in PRC are subject to an enterprise income tax rate of 25%.
Provision for income tax consists of the following:
| | | For The Nine Months Ended September 30, | | | For The Three Months Ended September 30, | |
| | | 2013 | | | 2012 | | | 2013 | | | 2012 | |
| | | | | | | | | | | | | |
| Current | | | | | | | | | | | | |
| USA | | $ | - | | | $ | - | | | $ | - | | | $ | - | |
| China | | | 132,830 | | | | 2,421,358 | | | | 961 | | | | 451,471 | |
| | | | 132,830 | | | | 2,421,358 | | | | 961 | | | | 451,471 | |
| Deferred | | | | | | | | | | | | | | | | |
| USA | | | | | | | | | | | | | | | | |
| Deferred tax asset for NOL carry forwards | | | 80,682 | | | | 150,907 | | | | 13,741 | | | | 22,024 | |
| Valuation allowance | | | (80,682 | ) | | | (150,907 | ) | | | (13,741 | ) | | | (22,024 | ) |
| | | | - | | | | - | | | | - | | | | - | |
| China | | | | | | | | | | | | | | | | |
| Current portion | | | | | | | | | | | | | | | | |
| Temporary difference from general and administrative expenses | | | - | | | | - | | | | - | | | | - | |
| Net changes in deferred income tax under current portion | | | - | | | | - | | | | - | | | | - | |
| | | | | | | | | | | | | | | | | |
| Non current portion | | | | | | | | | | | | | | | | |
| Deferred tax asset for NOL carry forwards | | | 2,828,063 | | | | 1,414,498 | | | | 918,770 | | | | 549,437 | |
| Temporary difference from airtime rights expenses | | | - | | | | 104,078 | | | | - | | | | - | |
| Temporary difference from capitalized interest | | | - | | | | (67,644 | ) | | | - | | | | | |
| Valuation allowance | | | (2,828,063 | ) | | | (1,414,498 | ) | | | (918,770 | ) | | | (549,437 | ) |
| Net changes in deferred income tax under non-current portion | | | - | | | | 36,434 | | | | - | | | | - | |
| | | | | | | | | | | | | | | | | |
| Net deferred income tax expenses (benefit) | | | - | | | | 36,434 | | | | - | | | | - | |
| | | | | | | | | | | | | | | | | |
| Total provision for income tax | | $ | 132,830 | | | $ | 2,457,792 | | | $ | 961 | | | $ | 451,471 | |
In assessing the realizability of deferred tax assets, management considers whether it is more likely than not that some portion or all of the deferred tax assets will not be realized. The ultimate realization of deferred tax assets is dependent upon the generation of future taxable income during the periods in which the net operating losses and temporary differences become deductible. Management considered projected future taxable income and tax planning strategies in making this assessment.
The change in total allowance for the nine months ended September 30, 2013 and 2012 was an increase of $2,908,745 and $1,565,405 respectively.
The change in total allowance for the three months ended September 30, 2013 and 2012 was an increase of $932,511 and $571,461 respectively.
CHINA YIDA HOLDING, CO. AND SUBSIDIARIES
NOTES TO CONSOLIDATED FINANCIAL STATEMENTS
(UNAUDITED)
(1) REVERSE SPLIT
Effective November 19, 2012, the Company conducted a 1-for-5 Reverse Stock Split of all issued and outstanding shares of its common stock. Upon the effect of the Reverse Stock Split, the Company’s issued and outstanding shares reduced from 19,571,785 to 3,914,580. Except as otherwise specified, all information in these consolidated financial statements and notes and all share and per share information has been retroactively adjusted for all periods presented to reflect the reverse stock split, as if the Reverse Stock Split had occurred at the beginning of the earliest period presented.
(2) WARRANTS
The remaining 773,812 Class A Warrants expired on September 6, 2011.
(3) STOCK-BASED COMPENSATION
On June 10, 2009 (the “Grant Date”), the Company entered into a Non-qualified Stock Option Agreement with one of the Company’s directors, pursuant to which, the Company issued the director non-qualified stock options (the “Stock Options”) to purchase a total of 6,000 shares of the Company’s common stock as compensation for his services to be rendered as the Company’s director. One half of the Stock Options shall vest on the sixth month anniversary of the Grant Date (the “First Vesting Date”) and become exercisable at an exercise price equal to the market price of the Company’s common stock on the First Vesting Date and the second half of Stock Options shall vest on the twelfth month anniversary of the Grant Date (the “Second Vesting Date”) and become exercisable at an exercise price equal to the market price of the Company’s common stock on the Second Vesting Date.
On January 21, 2011 (the “CFO Stock Option Grant Date”), the Company entered into a Non-qualified Stock Option Agreement with the Company’s former Chief Financial Officer, pursuant to which, the Company issued non-qualified stock options (the “CFO Stock Options”) to purchase a total of 15,000 shares of the Company’s common stock as compensation for his services to be rendered as the Company’s Chief Financial Officer. 3,000 CFO Stock Options vested on the CFO Stock Option Grant Date; 4,000 CFO Stock Options shall vest on the one-year anniversary of the CFO Grant Date; 4,000 CFO Stock Options shall vest on the second-year anniversary of the CFO Grant Date; and 4,000 CFO Stock Options shall vest on the third-year anniversary of the CFO Grant Date. The exercise price for all of the shares was determined as the fair value of our common stock using the closing price on the grant date.
On November 5, 2011, our former CFO submitted a letter of resignation resigning from his position. The resignation was effective as of December 31, 2011. Under the Non-qualified Stock Option Agreement, if CFO is removed from office for cause prior to the 21 st day of January, 2012, any outstanding stock options held by him which are not vested and exercisable by him immediately prior to resignation shall terminate as of the date of removal, and any outstanding stock options held by CFO which is vested and exercisable immediately prior to removal shall be exercisable at any time prior to the expiration date of such stock option or within one-year after the date of removal, whichever is shorter. As a result, 12,000 CFO Stock Options were forfeited as of December 31, 2011. On January 6, 2012, our former CFO transferred options to purchase 3,000 shares to Mr. Minhua Chen, our Chief Executive Officer, as a gift.
CHINA YIDA HOLDING, CO. AND SUBSIDIARIES
NOTES TO CONSOLIDATED FINANCIAL STATEMENTS
(UNAUDITED)
On January 21, 2011 (the “VPIR Stock Option Grant Date”), the Company entered into a Non-qualified Stock Option Agreement with the Company’s former Corporate Secretary and VP of Investor Relation (“VPIR”), pursuant to which, the Company issued non-qualified stock options (the “VPIR Stock Options”) to purchase a total of 15,000 shares of the Company’s common stock as compensation for his services to be rendered as the Company’s VP of Investor Relation. 3,000 VPIR Stock Options shall vest on the VPIR Stock Option Grant Date; 4,000 VPIR Stock Options shall vest on the one-year anniversary of the VPIR Grant Date; 4,000 VPIR Stock Options shall vest on the second-year anniversary of the VPIR Grant Date; and 4,000 VPIR Stock Options shall vest on the third-year anniversary of the VPIR Grant Date. The exercise price for all of the shares was determined as the fair value of our common stock using the closing price on the grant date.
On November 5, 2011, our former VPIR submitted a letter of resignation resigning from his position. The resignation was effective as of December 31, 2011. Under the Non-qualified Stock Option Agreement, if VPIR is removed from office for cause prior to the 21 st day of January, 2012, any outstanding stock option held by him which is not vested and exercisable by him immediately prior to resignation shall terminate as of the date of removal, and any outstanding stock options held by VPIR which is vested and exercisable immediately prior to removal shall be exercisable at any time prior to the expiration date of such stock option or within one-year after the date of removal, whichever is shorter. As a result, 12,000 VPIR Stock Options were forfeited as of December 31, 2011. On January 6, 2012, our former VPIR transferred options to purchase 3,000 shares to Mr. Minhua Chen, our Chief Executive Officer, as a gift.
On March 17, 2011 (the “ID Stock Option Grant Date”), the Company entered into a Non-qualified Stock Option Agreement with the Company’s Independent Director, pursuant to which, the Company issued non-qualified stock options (the “ID Stock Options”) to purchase a total of 6,000 shares of the Company’s common stock as compensation for his services to be rendered as the Company’s Independent Director. One half of the ID Stock Options vested on the ID Grant Date and the second half of ID Stock Options vested on June 10, 2011. The exercise price for all of the shares was determined as the fair value of our common stock using the closing price on the grant date.
On July 27, 2011, the Company entered into an agreement with the Company’s Independent Director, pursuant to which, the Company granted 4,000 restricted shares of the Company’s common stock as compensation for his services to be rendered as the Company’s Independent Director from June 10, 2011 to June 9, 2012. The estimated value of the 4,000 shares was $73,000 on June 10, 2011. The unrecognized share based compensation expense as of September 30, 2013 and December 31, 2012 was approximately $0 and $18,250, respectively. On May 24, 2012, the 4,000 restricted shares were issued.
The Company valued the stock options using the Black-Scholes model with the following assumptions:
Type of Stock Option | | Number of Options | | | Expected Term | | | Expected Volatility | | | Dividend Yield | | | Risk Free Interest Rate | |
| Options to Independent Director, June 10, 2009 | | | 6,000 | | | | 5.25 | | | | 356 | % | | | 0 | % | | | 3.11 | % |
| Options to Chief Financial Officer, January 21, 2011 | | | 15,000 | | | | 6.25 | | | | 60 | % | | | 0 | % | | | 3.44 | % |
| Options to VP of Investor Relation, January 21, 2011 | | | 15,000 | | | | 6.25 | | | | 60 | % | | | 0 | % | | | 3.44 | % |
| Options to Independent Director, March 17, 2011 | | | 6,000 | | | | 6.25 | | | | 60 | % | | | 0 | % | | | 3.25 | % |
The following is a summary of the option activity:
| | | Number of Options | |
| | | | |
| Outstanding as of December 31, 2012 | | | 18,000 | |
| Granted | | | - | |
| Exercised | | | - | |
| Forfeited | | | - | |
| Outstanding As of September 30, 2013 | | | 18,000 | |
For the nine months ended September 30, 2013 and 2012, the Company recognized approximately $0 and $36,500, respectively, as stock-based compensation expense for its stock option plan, which is included in general and administrative expenses.
For the three months ended September 30, 2013 and 2012, the Company recognized approximately $0 and $0, respectively, as stock-based compensation expense for its stock option plan, which is included in general and administrative expenses.
CHINA YIDA HOLDING, CO. AND SUBSIDIARIES
NOTES TO CONSOLIDATED FINANCIAL STATEMENTS
(UNAUDITED)
| 12. | DISCONTINUED OPERATIONS |
On June 3, 2013, Fujian Yida entered into a stock transfer agreement with Anhui Xingguang Investment Group Ltd (“Purchaser”), pursuant to which Fujian Yida agreed to transfer its 60% interest in Anhui Yida to the Purchaser for 60 million RMB, or $9.72 million and assume all the assets and liabilities of Anhui Yida.
The Company has reclassified the assets and liabilities of the discontinued entity in the accompanied financial statements.
Following table summarizes the classification of assets and liabilities of the discontinued entity as at December 31, 2012.
Anhui Yida Tourism Development Co., Ltd. ("Anhui Yida")
| Current assets | | | |
| Cash | | $ | 914,676 | |
| Other receivable | | | 21,891 | |
| Others | | | 3,141 | |
| Current assets of discontinued operations | | | 939,708 | |
| Add back: Intercompany receivable elimination | | | 2,525,133 | |
| Current assets of discontinued operations before intercompany elimination | | | 3,464,841 | |
| | | | | |
| Non-current asset | | | | |
| Property, plant & equipment | | | 80,630 | |
| Long-term prepayments | | | 2,009,003 | |
| Intangible assets | | | 10,189,630 | |
| Non-current assets of discontinued | | | 12,279,263 | |
| Add back: Long term investment elimination | | | 2,062,183 | |
| Non-current assets of discontinued operations before intercompany elimination | | | 14,341,446 | |
| | | | | |
| Current liabilities | | | | |
| Accrued expenses | | | 334,412 | |
| Tax payable | | | 1,158 | |
| Current liabilities of discontinued operations | | | 335,570 | |
| Add back: Intercompany receivable elimination | | | 2,998,096 | |
| Current liabilities of discontinued operations before intercompany elimination | | $ | 3,333,666 | |
At the date of disposal of June 3, 2013, the Company recorded $255,536 as loss from operations of discontinued entity and $999,133 as gain on disposal of discontinued entity.
Following is the Gain/Loss Calculation for disposal of Anhui Yida Tourism Development Co., Ltd. ("Anhui Yida") & its subsidiaries at the date of disposal of June 3, 2013:
| Anhui Yida Gain/Loss calculation | |
| | | | |
| Net assets of the Company as of December 31, 2012 | | $ | 14,472,621 | |
| | | | | |
| Loss from discontinued operations through June 3, 2013 | | | (255,536 | ) |
| Other Comprehensive income through June 3, 2013 | | | 311,611 | |
| Net assets of the Company As of June 3, 2013 | | | 14,528,696 | |
| Less: Non-controlling interest | | | (5,808,396 | ) |
| Proceeds from disposal | | | 9,719,432 | |
| | | | | |
| Gain on Disposal of 60% interest of Anhui Yida & its subsidiaries | | $ | 999,133 | |
| | | | | |
| Total Gain on Discontinued Operations | | $ | 743,597 | |
CHINA YIDA HOLDING, CO. AND SUBSIDIARIES
NOTES TO CONSOLIDATED FINANCIAL STATEMENTS
(UNAUDITED)
| 13. | NON-CONTROLLING INTEREST |
On April 15, 2010, the Company established a new subsidiary, Anhui Yida. The Company has a 60% interest and Anhui Xingguang Group, an unrelated entity, holds a 40% interest. Anhui Yida had not commenced operations as of December 31, 2012. Non-controlling interest consisted of the following:
On June 3, 2013, Fujian Yida entered into a stock transfer agreement with Anhui Xingguang Investment Group Ltd (“Purchaser”), pursuant to which Fujian Yida agreed to transfer its 60% interest in Anhui Yida to the Purchaser for 60 million RMB, or $9.72 million and assume all the assets and liabilities of Anhui Yida.
| | | September 30, 2013 | | | December 31, 2012 | |
| | | | | | | |
| Beginning balance | | $ | 5,789,048 | | | $ | 6,064,267 | |
| Net loss attributed to non-controlling interest | | | (102,215 | ) | | | (327,683 | ) |
| Other comprehensive income attributable to non-controlling interest | | | (288,515 | ) | | | 52,464 | |
| | | | 5,398,318 | | | | 5,789,048 | |
| Deconsolidation of Anhui Yida (Transfer 60% interest to Anhui Xinguang) | | | (5,398,318) | | | | - | |
| Ending balance | | $ | - | | | $ | 5,789,048 | |
| 14. | COMMITMENTS AND CONTINGENCIES |
(1) Operating commitments
Operating commitments consist of leases for office space under various operating lease agreements which expire in April 2021.
Operating lease agreements generally contain renewal options that may be exercised at the Company’s discretion after the completion of the terms. The Company’s obligations under various operating leases are as follows:
| As of September 30, | | Amounts | |
| 2014 | | $ | 82,051 | |
| 2015 | | | 64,933 | |
| 2016 | | | 64,287 | |
| 2017 | | | 65,775 | |
| 2018 | | | 67,352 | |
| Thereafter | | | 1,153,522 | |
| Total minimum payments | | $ | 1,497,920 | |
The Company incurred rental expenses of $220,354 and $291,181 for the nine months ended September 30, 2013 and 2012, respectively and which included $7,238 and $7,133, respectively, paid to Xin Hengji Holding Company Limited, a related party.
The Company incurred rental expenses of $53,437 and $113,761 for the three months ended September 30, 2013 and 2012, respectively and which included $2,430 and $2,369, respectively, paid to Xin Hengji Holding Company Limited, a related party.
CHINA YIDA HOLDING, CO. AND SUBSIDIARIES
NOTES TO CONSOLIDATED FINANCIAL STATEMENTS
(UNAUDITED)
| 14. | COMMITMENTS AND CONTINGENCIES (CONTINUED) |
(2) Capital commitments
China Yang-sheng Paradise
As of September 30, 2013, the total estimated contract costs to complete China Yang-sheng Paradise are approximately $69,603,997 (RMB 427.64 million excluding interest to be capitalized)) of which the Company has completed and paid for approximately $68,239,592 (RMB 419.26 million). As of September 30, 2013, China Yang-sheng Paradise had been completed.
(3) Management rights commitments
In 2001, Fujian Jintai entered into a tourism management revenue sharing agreement which is related to the management rights with Fujian Taining Great Golden Lake Tourism Economic Development Zone Management Committee (“Taining government”) to operate and to manage the Great Golden Lake resort from 2001 through 2032. The Company agreed to pay (1) 8% of the revenue from 2001 to 2005; (2) 10% of the revenue from 2006 to 2010; (3)12% of the revenue from 2011 to 2015; (4) 14% of the revenue from 2016 to 2020; (5) 16% of the revenue from 2021 to 2025; 18% from 2026 to 2032 to the Taining government.
The Company paid approximately $512,852 and $556,418 to the Taining government for the nine months ended September 30, 2013 and 2012, respectively, and recorded as cost of revenue.
The Company paid approximately $244,159 and $283,430 to the Taining government for the three months ended September 30, 2013 and 2012, respectively, and recorded as cost of revenue.
(4) Compensation for using nature resources commitments
In 2007, Fujiang Jintai entered into an agreement with Taining government which is related to compensation fees for using nature resources in the Great Golden Lake resort. The Company agreed to pay 10% of the revenue from sale of resort tickets after deduction of the profit sharing with Taining government (see above).
The Company paid approximately $298,853 and $325,749 to the Taining government for the nine months ended September 30, 2013 and 2012, respectively, and recorded as selling expenses.
The Company paid approximately $145,072 and $169,186 to the Taining government for the three months ended September 30, 2013 and 2012, respectively, and recorded as selling expenses.
In December 2008, Tulou entered into a Tourist Resources Development Agreement with Hua’an County Government (“Hua’an government”) which is related to pay compensation fees for using nature resources in Tulou. The Company agreed to pay (1) 16% of gross ticket sales in the first five years; (2) 20% of gross ticket sales in the second five years; (3) 23% of gross ticket sales in the third five years; (4) 25% of gross ticket sales in the fourth five years; (5) 28% of gross ticket sales in the fifth five years; (6) 30% in twenty six years and thereafter when the ticket price of the Clusters is RMB60 ($9.50 USD) or above per person.
The Company paid approximately $45,953 and $107,296 to the Hua’an government for the nine months ended September 30, 2013 and 2012, respectively, and recorded as selling expenses.
The Company paid approximately $15,638 and $22,813 to the Hua’an government for the three months ended September 30, 2013 and 2012, respectively, and recorded as selling expenses.
In 2008, Hong Kong Yi Tat entered into a Tourist Destination Cooperative Development Agreement with Yongtai County Government with respect to the development of Yunding Park pursuant to which Fujian Yida is obligated to pay 5 million RMB, or approximately $0.80 million, to the Yongtai County People’s Government over the course of the first 10 years of the Agreement. As of September 30, 2013, the Company has paid to the Yongtai County local government 5 million RMB, or $0.80 million.
(5) Litigation
The Company’s management does not expect the legal matters involving the Company would have a material impact on the Company’s consolidated financial position or results of operations.
CHINA YIDA HOLDING, CO. AND SUBSIDIARIES
NOTES TO CONSOLIDATED FINANCIAL STATEMENTS
(UNAUDITED)
| 15. | RELATED PARTY TRANSACTIONS |
Due to related parties
As of September 30, 2013, the Company had $23,226,289 (or RMB 142,700,000) and $4,165,122 due to Fujian Xinhengji Advertisement Co., Ltd and Mr. Minhua Chen, respectively. Mr. Minhua Chen, the Chief Executive Officer and Chairman of the Company, is the Chairman of Fujian Xinhengji Advitisement Co., Ltd. Those loans are unsecured, bear no interest and no due date is specified.
As of December 31, 2012, the Company had zero due to related parties.
Basic earnings per share is computed by dividing net income attributable to common shareholders by the weighted average number of common shares outstanding during the period. Diluted earnings per share reflects the potential dilution of securities by including other potential common stock, including convertible preferred stock, stock options and warrants, in the weighted average number of common shares outstanding for the period, if dilutive. The numerators and denominators used in the computations of basic and dilutive earnings per share are presented in the following table:
Basic and diluted:
| | | For The Nine Months Ended September 30, | | | For The Three Months Ended September 30, | |
| | | 2013 | | | 2012 | | | 2013 | | | 2012 | |
| Amounts attributable to common stockholders: | | | | | | | | | | | | |
| Net loss (income) from continuing operations, net of income taxes | | $ | (10,502,820 | ) | | $ | 1,566,157 | | | $ | (3,628,177 | ) | | $ | (868,752 | ) |
| Net loss (income) from discontinued operations, net of income taxes | | | 845,812 | | | | (305,523 | ) | | | - | | | | (106,659 | ) |
| Net loss (income) attributable to common stockholders | | $ | (9,657,008 | ) | | $ | 1,260,634 | | | $ | (3,628,177 | ) | | $ | (975,411 | ) |
| Net loss (income) attributable to common stockholders per share - basic and diluted: | | | | | | | | | | | | | | | | |
| - Basic & diluted earnings/(loss) per share from continued operations | | $ | (2.68 | ) | | $ | 0.40 | | | $ | (0.93 | ) | | $ | (0.22 | ) |
| - Basic & diluted earnings/(loss) per share from discontinued operations | | | 0.22 | | | | (0.08 | ) | | | - | | | | (0.03 | ) |
| - Basic & diluted earnings/(loss) per share attributable to common stockholders | | $ | (2.46 | ) | | $ | 0.32 | | | $ | (0.93 | ) | | $ | (0.25 | ) |
| Basic and Diluted weighted average outstanding shares of common stock | | | 3,914,580 | | | | 3,912,248 | | | | 3,914,580 | | | | 3,914,357 | |
| Potential common shares outstanding As of September 30, 2013: | | | | | | | | | | | | | | | | |
| Warrants outstanding | | | - | | | | - | | | | - | | | | - | |
| Options outstanding | | | 18,000 | | | | 18,000 | | | | 18,000 | | | | 18,000 | |
For the three months and nine months ended September 30, 2013 and 2012, 18,000 options were not included in the diluted earnings per share because the average stock price was lower than the strike price of these options.
CHINA YIDA HOLDING, CO. AND SUBSIDIARIES
NOTES TO CONSOLIDATED FINANCIAL STATEMENTS
(UNAUDITED)
During the nine months ended September 30, 2013 and 2012, the Company is organized into two main business segments: advertisement and tourism. The primary business relates to tourism at the Great Golden Lake, Yunding resort and Tulou resort. The Company offers bamboo rafting, parking lot service, photography services, hotel lodging and ethnic cultural communications. The primary business related to advertisement is focused on advertisements, including media publishing, television, cultural and artistic communication activities, and performance operation and management activities. The following table presents a summary of operating information and certain balance sheet information for the two segments for the years ended:
| | | For The Nine Months Ended September 30, | | | For The Three Months Ended September 30, | |
| | | 2013 | | | 2012 | | | 2013 | | | 2012 | |
| Revenues: | | | | | | | | | | | | |
| Advertisement | | $ | 2,899,844 | | | $ | 14,126,023 | | | $ | 318,434 | | | $ | 3,168,963 | |
| Tourism | | | 10,498,161 | | | | 7,340,957 | | | | 4,357,597 | | | | 3,152,618 | |
| Total | | $ | 13,398,005 | | | $ | 21,466,980 | | | $ | 4,676,031 | | | $ | 6,321,581 | |
| | | | | | | | | | | | | | | | | |
| Operating income(loss): | | | | | | | | | | | | | | | | |
| Advertisement | | $ | 432,016 | | | $ | 9,384,135 | | | $ | (70,506) | | | $ | 1,783,656 | |
| Tourism | | | (6,527,588 | ) | | | (3,774,947 | ) | | | (2,041,134 | ) | | | (1,199,223 | ) |
| Other | | | (229,089 | ) | | | (430,080 | ) | | | (38,892 | ) | | | (62,578 | ) |
| Total | | $ | (6,324,661 | ) | | $ | 5,179,108 | | | $ | (2,150,532 | ) | | $ | 521,855 | |
| | | | | | | | | | | | | | | | | |
| Net income (loss): | | | | | | | | | | | | | | | | |
| Advertisement | | $ | 255,844 | | | $ | 6,777,264 | | | $ | (79,865) | | | $ | 1,270,471 | |
| Tourism | | | (10,528,106 | ) | | | (4,779,944 | ) | | | (3,509,015 | ) | | | (2,076,299 | ) |
| Other | | | (230,558) | | | | (431,163 | ) | | | (39,297 | ) | | | (62,924 | ) |
| Net (loss) income from continuing operations | | | (10,502,820 | ) | | | 1,566,157 | | | | (3,628,177 | ) | | | (868,752 | ) |
| Net (loss) income from discontinued operations | | | 743,597 | | | | (507,136) | | | | - | | | | (177,058) | |
| Total | | $ | (9,759,223 | ) | | $ | 1,059,021 | | | $ | (3,628,177) | | | $ | (1,045,810 | ) |
| | | | | | | | | | | | | | | | | |
| Capital expenditure: | | | | | | | | | | | | | | | | |
| Advertisement | | $ | - | | | $ | - | | | $ | - | | | $ | - | |
| Tourism | | | 71,654,206 | | | | 9,501,793 | | | | 25,693,791 | | | | 4,158,961 | |
| Total | | $ | 71,654,206 | | | $ | 9,501,793 | | | $ | 25,693,791 | | | $ | 4,158,961 | |
Intangible assets: | | September 30, 2013 | | | December 31, 2012 | |
| Advertisement | | $ | - | | | $ | 1,297,569 | |
| Tourism | | | 51,275,351 | | | | 50,151,161 | |
| Total | | $ | 51,275,351 | | | $ | 51,448,730 | |
| | | | | | | | | |
| Identifiable assets: | | | | | | | | |
| Advertisement | | $ | 121,105 | | | $ | 1,692,232 | |
| Tourism | | | 280,099,189 | | | | 203,796,633 | |
| Others | | | 6,366 | | | | 71,901 | |
| Asset of continuing operations | | $ | 280,226,660 | | | $ | 205,560,766 | |
| Asset of discontinued operations | | | - | | | | 13,218,971 | |
| Total | | $ | 280,226,660 | | | $ | 218,779,737 | |
Others represent reconciling amounts including certain assets which are excluded from segments and adjustments to eliminate inter-company transactions.
Item 2. Management’s Discussion and Analysis of Financial Condition and Results of Operations.
The following discussion should be read in conjunction with the information contained in our unaudited consolidated financial statements and the notes thereto appearing elsewhere herein. The unaudited interim consolidated financial statements furnished in this report reflect all adjustments (consisting of normal recurring accruals) which are, in the opinion of management, necessary to a fair statement of the results for the interim periods presented. Interim results are not necessarily indicative of the results for the full year. These unaudited interim consolidated financial statements should be read in conjunction with the consolidated financial statements of the Company for the year ended December 31, 2012 and notes thereto and the Management’s Discussion and Analysis set forth in our Annual Report on Form 10-K for the year ended December 31, 2012 (the “Annual Report”).
Certain statements in this section contain “forward-looking statements.” All statements contained in this report and not clearly historical in nature are forward-looking, and the words “may,” “will,” “should,” “could,” “would,” “expects,” “plans,” “anticipates,” “believes,” “estimates,” “projects,” “predicts,” “intends,” “potential,” and similar expressions (as well as other words or expressions referencing future events, conditions or circumstances) generally are intended to identify forward-looking statements. Any statements in this report that are not historical facts are forward-looking statements. Actual results may differ materially from those projected or implied in any forward-looking statements. Such statements involve risks and uncertainties, including but not limited to those relating to product and customer demand, market acceptance of our products, the ability to create new products, the ability to achieve a sustainable profitable business, the effect of economic conditions, the ability to protect our intellectual property rights, competition from other providers and products, risks in product development, our ability to raise capital to fund continuing operations, and other factors discussed from time to time in the Company's Securities and Exchange Commission filings. The Company undertakes no obligation to update or revise any forward-looking statement for events or circumstances after the date on which such statement is made except as required by law.
Overview
We were formed on June 4, 1999 to serve as a vehicle to effect a merger, capital stock exchange, asset acquisition or other similar business combination with a company having its primary operations in the PRC. On November 19, 2007, we consummated the acquisition of Keenway Limited, Hong Kong Yi Tat International Investment Co., Ltd (“Hong Kong Yi Tat”), and the then shareholders of Keenway Limited, including Minhua Chen, Yanling Fan, Xinchen Zhang, Extra Profit International Limited, and Lucky Glory International Limited, received shares of our common stock.
We currently operate the Great Golden Lake tourist destination (Global Geo-park, World Nature Heritage), Hua’An Tulou cluster (“Hua’An Tulou” or the “Earth Buildings”) tourist destination (World Culture Heritage), and Yunding Recreational Park (Large-scale National Recreational Park), covering over 300 square kilometers in total. Our media business provides media management service, including channel and advertisement management for the FETV since 2004 and the “Journey through China on the Train” on-board railway program (“Railway Media”). As of September 30, 2013, through our wholly owned subsidiaries in China, we have entered into three additional cooperation agreements respectively with the local Chinese government agents, namely, (i) the Jiangxi Province Zhangshu Municipal Government, (ii) the Fenyi County, Xinyu City, Jiangxi Province Government, and (iii) the Fujian Education Media Limited Company, a wholly state-owned company organized by the Fujian Education Television Station (“FETV”). Under these agreements, we have obtained:
| | (i) | the right to construction and development of the Royal Hot Spring World project, |
| | (ii) | the right to invest in construction and development of China Yang-sheng (Nourishing Life) Paradise Project (“Yang-sheng Paradise”) (including the projects: (a) Salt Water Hot Spring SPA & Health Center, (b) Yang-sheng Holiday Resort, (c) World Yang-sheng Cultural Museum, (d) International Camphor Tree Garden, (e) Chinese Medicine and Herb Museum, (f) Yang-sheng Sports Club, (g) Old Town of Chinese Traditional Medicine, and (h) various other Yang-sheng related projects and tourism real estate projects) with a forty (40) year exclusive right to develop, operate and manage a variety of caves, hot springs and other natural and cultural tourist resources identified in the Meng Mountain area, and various caves and tourist resources of the Dagang Mountain located in Fenyi County, Xinyu City, Jiangxi Province (“City of Caves”), and |
| | (iii) | the five years (three year agreement with two year renewal) of exclusive management rights for the operation of the FETV channel (“FETV”). |
Advertising business had been our primary source of revenue for the last two years before January 2013 because the tourism business has experienced serious disruptions from flooding and severe weather while the new advertisement regulatory restriction was not enforced by the local government. Our tourism business has become the primary source of our revenue since first quarter of 2013. The revenue from advertising has decreased as the new advertisement regulatory restriction is enforced and the revenue from tourism has been increased. However, any increase in revenue will depend on the recovery of Great Golden Lake from flooding and the progress we make in developing our existing and new projects in our other tourist destinations. Our advertising and tourism businesses are not seasonal. We have visitors to our parks throughout the year. In 2013, we do not anticipate significant new construction as we are focusing on maintaining and restoring our existing operations at Great Golden Lake and at Hua’an Tulou. We do not expect any construction or restoration to affect our existing operations.
We are subject to risks common to companies operating in China, including risks inherent in our commercialization efforts, uncertainty of regulatory approvals and laws, the need for future capital, and retention of key employees. We cannot provide assurance that we will generate revenues or achieve and sustain profitability in the future.
Factors Affecting Our Performance
Advertising Business
For the advertising business, our revenue is driven by the popularity of our television programs and the number of viewers of our television station. The more people tune into our station, the more advertisers we will be able to attract and the higher we can charge for each advertising spot. We strive to keep a high audience rating in order to be able to sell our advertising air time.
We generate our advertising revenue by selling air time to sponsors and companies that are interested in marketing their products to our television viewers. We incur administrative fees, business traveling fees, salaries, depreciation, automobile, and interest costs in operating the advertising business.
The new PRC regulations set forth by the State Administration for Radio, Film and Television, which bans certain television and radio advertisements, has had a negative effect on our revenues and certain clients have chosen to discontinue their advertisement with us. As a result of the new regulations, our revenues from the advertising business have declined significantly and the agreement with FETV expired in July 2013. We expect the advertising business will continue to decline and eventually discontinue as we will focus on the tourism business only as discussed below.
Tourism Business
For the tourism business, our revenue is driven by the reputation of our tourist destinations. We strive to present quality tourist attractions that offer our visitors diverse entertainment, including catering, hotel, transportation, and shopping. We generate our revenue from our visitors and tourists. We incur many costs associated with operating the tourist business, including, administration fees, business traveling fees, land use rights fees, and revenue sharing fees.
We entered into tourism management revenue sharing agreement with the Taining government with respect to the Great Golden Lake resort. We have contracted to share the revenue over the course of the agreement as follows: (i) from 2001 to 2006 we received 92% of the revenue and the Taining government received 8% of the revenue; (ii) from 2006 to 2012 we received 90% of the revenue and the Taining government received 10% of the revenue; (iii) from 2012 to 2016 we will receive 88% of the revenue and the Taining government will receive 12% of the revenue; (iv) from 2016 to 2022 we will receive 86% of the revenue and the Taining government will receive 14% of the revenue; (v) from 2022 to 2026 we will receive 84% of the revenue and the Taining government will receive 16% of the revenue; and (vi) from 2026 to 2032 we will receive 82% of the revenue and the Taining government will receive 18% of the revenue. Due to our decreasing revenue share in the Great Golden Lake resort, combing with the fact that the resort has not been fully recovered to the state before the flood, we may not be able to maintain our revenues from Great Golden Lake at the same level as comparable periods.
However, as the Great Golden Lake resort continues to recover and we begin to generate revenue after the grand openings of three new tourism projects in the future, we believe that we will be able to maintain the high gross profit margins in the tourism segment.
Our tourism business has become the primary source of our revenue since first quarter of 2013. Yang-Sheng Paradise had grand opening and trial operation in October 2013 and we expect to open City of Caves by the second quarter of 2014. Also, we expect Yunding to continue to grow and Great Golden Lake to recover completely from the flooding.
Discontinued Operation
On June 3, 2013, Fujian Yunding Tourism Industrial Co., Ltd. (“Fujian Yida”), our subsidiary, entered into a stock transfer agreement with Anhui Xingguang Investment Group Ltd (“Anhui Xingguang”), pursuant to which Fujian Yida agreed to transfer its 60% interest in Anhui Yida Tourism Development Co. Ltd. (“Anhui Yida”) to Anhui Xingguang for RMB 60 million, or $9.72 million. Anhui Xingguang also assumed all the assets and liabilities of Anhui Yida.
Net income from discontinued operation was $743,597 for the nine months ended September 30, 2013. During the same period in 2012, net loss from discontinued operation was $507,136.
Net loss from discontinued operation was $0 and $177,058 for the three months ended September 30, 2013 and 2012.
As a result of the share transfer described above, the Results of Operation set forth below does not reflect the operations for Anhui Yida and its wholly owned subsidiaries: Bengbu (Yida) Real Estate Development Co., Ltd. (“Bengbu Yida”) and Bengbu (Yida) Investment Co., Ltd. (“Bengbu Investment”). The results of operations of Anhui Yida and its subsidiaries have been presented as discontinued operations. Therefore, management’s discussion and analysis set forth herein below are based on the results of continuing operations.
Our corporate structure chart has changed to the following:
Results of Operations
Results of Operations for the three months ended September 30, 2013 as compared to the three months ended September 30, 2012
During the three months ended September 30, 2013 and 2012, we have two main business segments – tourism and advertisement. The following table presents a summary of operating information for the three months ended September 30, 2013 and 2012:
| | | | | | | | Increase/ | |
| (All amounts, other than | For The Three Months Ended September 30, | | Increase/ | | (Decrease) | |
| percentage, in U.S. | (Decrease) | | Percentage | |
| Dollar) | 2013 | | 2012 | | U.S. Dollar ($) | | (%) | |
| Net revenue | | | | | | | | |
| Advertisement | | $ | 318,434 | | | $ | 3,168,963 | | | $ | (2,850,529 | ) | | | (89.95 | ) |
| Tourism | | | 4,357,597 | | | | 3,152,618 | | | | 1,204,979 | | | | 38.22 | |
| Total net revenue | | | 4,676,031 | | | | 6,321,581 | | | | (1,645,550 | ) | | | (26.03 | ) |
| | | | | | | | | | | | | | | | | |
| Cost of revenue | | | | | | | | | | | | | | | | |
| Advertisement | | | 271,213 | | | | 1,236,714 | | | | (965,501 | ) | | | (78.07 | ) |
| Tourism | | | 1,893,844 | | | | 1,618,473 | | | | 275,371 | | | | 17.01 | |
| Total cost of revenue | | | 2,165,057 | | | | 2,855,187 | | | | (690,130 | ) | | | (24.17 | ) |
| | | | | | | | | | | | | | | | | |
| Gross profit | | | 2,510,974 | | | | 3,466,394 | | | | (955,420 | ) | | | (27.56 | ) |
| | | | | | | | | | | | | | | | | |
| Selling expenses | | | 2,755,654 | | | | 2,104,616 | | | | 651,038 | | | | 30.93 | |
| General and administrative expenses | | | 1,905,852 | | | | 839,923 | | | | 1,065,928 | | | | 126.91 | |
| Loss (Income) from operations | | | (2,150,532 | ) | | | 521,855 | | | | (2,672,387 | ) | | | (512.09 | ) |
| Other expense, net | | | (554,364 | ) | | | (77,124 | ) | | | (477,240 | ) | | | (618.80 | ) |
| Interest income | | | 6,999 | | | | 8,686 | | | | (1,687 | ) | | | (19.42 | ) |
| Interest expense | | | (929,319 | ) | | | (870,698 | ) | | | (58,621 | ) | | | (6.73 | ) |
| Less: Provision for income tax | | | 961 | | | | 451,471 | | | | (450,510 | ) | | | (99.79 | ) |
| Net (loss) income from continuing operations | | | (3,628,177 | ) | | | (868,752 | ) | | | ( 2,759,425 | ) | | | 317.63 | |
| Gain(loss) on Discontinued Operations | | | - | | | | (177,058 | ) | | | 177,058 | | | | (100.00 | ) |
| | | | | | | | | | | | | | | | | |
| Net (loss) Income | | | (3,628,177 | ) | | | (1,045,810 | ) | | | (2,582,367 | ) | | | 246.93 | |
| Net loss attributed to non-controlling interest: | | | - | | | | 70,399 | | | | (70,399 | ) | | | (100.00 | ) |
| Net (loss) income attributable to China Yida Holding Co. | | $ | (3,628,177 | ) | | $ | (975,411 | ) | | $ | (2,652,766 | ) | | | 271.96 | |
Net Revenue
Net revenue decreased by approximately $1.65 million or approximately 26.03%, from approximately $6.32 million for the three months ended September 30, 2012 to approximately $4.67 million for the three months ended September 30, 2013. The decrease in net revenue was primarily due to the decrease in the revenue from advertisement and partially offset by increase in net revenue from tourism.
Advertisement
Advertisement revenue decreased by approximately $2.85 million or approximately 89.95%, from approximately $3.17 million for the three months ended September 30, 2012 to approximately $0.32 million for the three months ended September 30, 2013.
This decrease was primarily due to the instability of the railway media broadcast revenue. The program is broadcasted manually by the train attendant, and therefore we cannot monitor whether he/she has inserted the program tape or not and how he/she broadcasts the tape. Railway program is a 20 minute infomercial program with the content of tourism news and information. Advertising clients choose the length of the advertisement during the program, and the period of time they want the advertisement to be broadcasted. Due to the instability of the railway program, recently all the clients decided not to purchase advertisement from the company, and they are considering discontinuing the railway promotion and terminating the cooperation with the Company. The advertisers were concerned with our lack of control over the frequency of program broadcast and therefore the company has lost all the clients which resulted in the decrease of revenue from railway media broadcast. We expect our revenue from railway media broadcast will continue to decline.
We generate revenue from the “Journey through China on the Train” program which is the only railway media broadcast we produced so far. In February 2009, our wholly-owned subsidiary, Fuzhou Fuyu Advertising Co., Ltd., entered into a six-year exclusive agreement with China’s Railway Media Center to create an infomercial program named “Journey through China on the Train”, pursuant to which we produce 20-minute monthly episodes focusing on tourist destinations around China and travel ideas and tips with product placement advertisements. The infomercial program is broadcasted on all high speed motor trains in China with TV panels made available by the Ministry of Railways of PRC and cable TV channels. We agreed to pay an annual fee of approximately $47,873 or RMB 300,000 to Railway Media Center for the first three years and approximately $55,852 or RMB 350,000 for the second three years. We generate revenue from selling product placement advertisements. However, since the program is broadcasted manually by train attendants, we have no control over the frequency of program broadcasting, which results in the substantial instability of our railway media revenue. We did not generate income from the “Journey through China on the Train” program for the three months ended September 30, 2013 as compared to approximately $0.11 million for the three months ended September 30, 2012.
During this period, advertisement revenue from FETV also has experienced a decrease of 89.92% from $3.06 million to $0.31 million due to actions taken by domestic media authorities to regulate the broadcasting manner and content of TV advertising. Under the new regulatory measures, shopping programs, mini ads and certain medical advertisements have become restricted. On August 1, 2010, Fuyu, our wholly-owned subsidiary, entered into Fujian Education Television Channel Project Management Agreement (the “Agreement”), with Fujian Education Media Limited Company, a wholly state-owned company organized by the Fujian Education TV Station under the laws of the People’s Republic of China (“Fujian Education Media”), pursuant to which, Fujian Education Media granted to us five years (three year agreement with two year renewal) of exclusive management rights for the FETV channel from August 1, 2010 to July 31, 2015. Under the management contract, we obtained the full rights to provide programming and content management services and re-sell all advertising airtime of FETV. We have leveraged the FETV assets to produce high quality TV programming focusing on tourism, successfully promote our own tourist attractions, improve the image of the FETV station around the tourism theme, and create a network of potential partners for our tourism business, including hotels, travel agents, and entertainment resorts. The three-year management contract expired on July 31, 2013, and we did not renew the management contract with Fujian Education Media for the following two years.
Tourism
Tourism revenue increased by approximately $1.21 million or approximately 38.22% from approximately $3.15 million for the three months ended September 30, 2012 to approximately $4.36 million for the three months ended September 30, 2013, including approximately $1.74 million from Great Golden Lake resort, a decrease of $0.29 million or 14.29%, $2.44 million from Yunding Park, an increase of $1.57 million or 180.46%, and $0.18 million from Hua’an Tulou, a decrease of $0.07 million or 28%, as compared to the same period in 2012. The primary resources of the revenues are entrance fees, tour shuttle bus fees, and restaurants. The increase in tourism business was primarily due to the revenue increase at Yunding Park due to effective marketing promotion activities and advertisement in China that led to an increase in number of tourists, partially offset by the decrease in revenue from Great Golden Lake resort and Hua’an Tulou. The revenue from Great Golden Lake resort decreased because we are still recovering from the severe flooding in 2011 and storm in 2012. The decrease in revenue from Hua’an Tulou was due to strong competition among the homogeneous tourism destinations, including Nanjing Tulou Cluster and Yongding Tulou Cluster. We have to provide deeper ticket discount among the strong completion and the tourist consumption was also decreased. We expect this trend to continue in the future.
Cost of Revenue
Cost of revenues decreased by approximately $0.69 million or approximately 24.17%, from approximately $2.86 million for the three months ended September 30, 2012 to approximately $2.17 million for the three months ended September 30, 2013. The decrease in cost of revenue was primarily due to a decrease in cost of revenue from advertisement, partially offset by an increase in cost of revenue of tourism.
Advertisement
Cost of revenue from advertisement decreased by approximately $0.97 million or approximately 78.07%, from approximately $1.24 million for the three months ended September 30, 2012 to approximately $0.27 million for the three months ended September 30, 2013. The decrease in cost of media businesses was primarily due to the decrease of railway program productions, because the Railway media clients have chosen to use less broadcast programs due to the instability associated with the railway broadcasting. Also the business tax decreased along with the decrease in the Company’s advertising revenue.
Tourism
Cost of revenue from tourism increased by approximately $0.27 million or approximately 17.01%, from approximately $1.62 million for the three months ended September 30, 2012 to approximately $1.89 million for the three months ended September 30, 2013. The increase was primarily due to the increase in depreciation cost for the new construction completed for tourism destinations.
Gross profit
Gross profit decreased approximately $0.96 million, or approximately 27.56%, from approximately $3.47 million for the three months ended September 30, 2012 to approximately $2.51 million for the three months ended September 30, 2013. Our gross profit margin was approximately 53.7% for the three months ended September 30, 2013, compared to approximately 54.83% for the three months ended September 30, 2012, representing a decrease of approximately 1%.
Advertisement
Gross profit from advertisement decreased by approximately $1.89 million, or approximately 97.56%, from approximately $1.93 million for the three months ended September 30, 2012 to approximately $0.04 million for the three months ended September 30, 2013. Gross profit margin from advertisement was approximately 14.83% for the three months ended September 30, 2013, compared to approximately 60.97% for the three months ended September 30, 2012. This decrease was primarily attributable to the decrease in revenue during the three months ended September 30, 2013 due to the instability of the railway media broadcasts while the fixed costs associated with FETV’s commercial airtime stayed the same.
Tourism
Gross profit from tourism increased by approximately $0.93 million, or approximately 60.59%, from approximately $1.53 million for the three months ended September 30, 2012 to approximately $2.46 million for the three months ended September 30, 2013. Gross profit margin from tourism was approximately 56.54% for the three months ended September 30, 2013, compared to approximately 48.66% for the three months ended September 30, 2012. The increase of gross profit was primarily attributable to the significant revenue increase from Yunding Park which offset the decrease of the revenue of Hua’an Tulou.
Selling Expenses
Selling expenses were approximately $2.76 million for the three months ended September 30, 2013, compared to approximately $2.11 million for the three months ended September 30, 2012, which represents an increase of approximately $0.65 million, or approximately 30.93%. The increase in selling expense was primarily due to the increase in various costs associated with the expansions at Yunding Park during the three months ended September 30, 2013.
General and Administrative Expenses
General and administrative expenses were approximately $1.91 million for the three months ended September 30, 2013, compared to approximately $0.84 million for the three months ended September 30, 2012, which represents an increase of approximately $1.07 million, or approximately 126.91%. This increase was due to the increase of administrative expenses for the operation of new tourism destinations.
Interest Expense
Interest expense was approximately $0.93 million for the three months ended September 30, 2013, representing an increase of approximately $0.06 million or approximately 6.73%, compared to approximately $0.87 million interest expense for the three months ended September 30, 2012. The increase in interest expense was primarily due to increase in the total amount of loans.
Income Tax
Income tax was approximately $0.001 million for the three months ended September 30, 2013, representing a decrease of approximately $0.45 million or approximately 99.87%, compared to the approximately $0.45 million income tax for the three months ended September 30, 2012. The decrease was primarily attributable to the decrease in revenue generated from Hua’an Tulou, as well as the decrease in the railway media revenue for the three months ended September 30, 2013 as compared with the three months ended September 30, 2012. The provision for income tax for the three months ended September 30, 2013 was mainly derived from the net income before tax of the advertisement segment.
Net Loss
As a result of the above factors, we have net loss of approximately $3.63 million for the three months ended September 30, 2013 as compared to approximately $1.05 million for the three months ended September 30, 2012, representing a decrease of approximately $ 2.58 million or approximately 246.93 %. The decrease was primarily attributable to the lower revenue generated from Hua’an Tulou, as well as the decrease of the railway media revenue for the three months ended September 30, 2013 as compared with the three months ended September 30, 2012.
Results of Operations for the Nine months ended September 30, 2013 as compared to the Nine months ended September 30, 2012
The following table presents a summary of operating information for the nine months ended September 30, 2013 and 2012:
| | | | | | | | Increase/ | |
| (All amounts, other than | For The Nine Months Ended September 30, | | Increase/ | | (Decrease) | |
| percentage, in U.S. | (Decrease) | | Percentage | |
| Dollar) | 2013 | | 2012 | | U.S. Dollar ($) | | (%) | |
| Net revenue | | | | | | | | |
| Advertisement | | $ | 2,899,844 | | | $ | 14,126,023 | | | $ | (11,226,179 | ) | | | (79.47 | ) |
| Tourism | | | 10,498,161 | | | | 7,340,957 | | | | 3,157,204 | | | | 43.01 | |
| Total net revenue | | | 13,398,005 | | | | 21,466,980 | | | | (8,068,975 | ) | | | (37.59 | ) |
| | | | | | | | | | | | | | | | | |
| Cost of revenue | | | | | | | | | | | | | | | | |
| Advertisement | | | 2,038,196 | | | | 4,227,122 | | | | (2,188,926 | ) | | | (51.78 | ) |
| Tourism | | | 5,045,873 | | | | 4,377,807 | | | | 668,066 | | | | 15.26 | |
| Total cost of revenue | | | 7,084,069 | | | | 8,604,929 | | | | (1,520,860 | ) | | | (17.67 | ) |
| | | | | | | | | | | | | | | | | |
| Gross profit | | | 6,313,936 | | | | 12,862,051 | | | | (6,548,115 | ) | | | (50.91 | ) |
| | | | | | | | | | | | | | | | | |
| Selling expenses | | | 7,721,371 | | | | 4,751,736 | | | | 2,969,635 | | | | 62.50 | |
| General and administrative expenses | | | 4,917,226 | | | | 2,931,207 | | | | 1,986,019 | | | | 67.75 | |
| Loss (Income) from operations | | | (6,324,661 | ) | | | 5,179,108 | | | | (11,503,769 | ) | | | (222.12 | ) |
| Other expense, net | | | (640,274 | ) | | | (190,006 | ) | | | (450,268 | ) | | | 236.98 | |
| Interest income | | | 82,687 | | | | 25,036 | | | | 57,651 | | | | 230.27 | |
| Interest expense | | | (3,487,742 | ) | | | (990,189 | ) | | | (2,497,553 | ) | | | 252.23 | |
| Less: Provision for income tax | | | 132,830 | | | | 2,457,792 | | | | (2,324,962 | ) | | | (94.60 | ) |
| Net (loss) income from continuing operations | | | (10,502,820 | ) | | | 1,566,157 | | | | (12,068,977 | ) | | | (770.61 | ) |
| Gain(loss) on Discontinued Operations | | | 743,597 | | | | (507,136 | ) | | | 1,250,733 | | | | (246.63 | ) |
| | | | | | | | | | | | | | | | | |
| Net (loss) Income | | | (9,759,223 | ) | | | 1,059,021 | | | | (10,818,244 | ) | | | (1021.53 | ) |
| Net loss attributed to non-controlling interest: | | | 102,215 | | | | 201,613 | | | | (99,398 | ) | | | (49.30 | ) |
| Net (loss) income attributable to China Yida Holding Co. | | $ | (9,657,008 | ) | | $ | 1,260,634 | | | $ | (10,917,642 | ) | | | (866.04 | ) |
Net Revenue
Net revenue decreased by approximately $8.07 million or approximately 37.59%, from approximately $21.47 million for the nine months ended September 30, 2012 to approximately $13.40 million for the nine months ended September 30, 2013. The decrease in net revenue was primarily due to the decrease in the revenue from advertisement, partially offset by increase in net revenue from tourism.
Advertisement
Advertisement revenue decreased by approximately $11.23 million or approximately 79.47%, from approximately $14.13 million for the nine months ended September 30, 2012 to approximately $2.90 million for the nine months ended September 30, 2013.
This decrease was primarily due to the instability of the railway media broadcast revenue. The program is broadcasted manually by the train attendant, and therefore we cannot monitor or whether he/she has inserted the program tape or not and how he/she broadcasts the tape. Railway program is a 20 minute infomercial program with the content of tourism news and information. Advertising clients choose the length of the advertisement during the program, and the period of time they want the advertisement to be broadcasted. Due to the instability of the railway program, recently all the clients decided not to purchase advertisement from the company, and they are considering discontinuing the railway promotion and terminating the cooperation with the company. The advertisers were concerned with our lack of control over the frequency of program broadcast and therefore the company has lost all the clients have purchased fewer advertising spots from us which resulted in the decrease of revenue from railway media broadcast. We expect our revenue from railway media broadcast will continue to decline.
We generate revenue from the “Journey through China on the Train” program which is the only railway media broadcast we produce so far. In February 2009, our wholly-owned subsidiary, Fuzhou Fuyu Advertising Co., Ltd., entered into a six-year exclusive agreement with China’s Railway Media Center to create an infomercial program named “Journey through China on the Train”, pursuant to which we produce 20-minute monthly episodes focusing on tourist destinations around China and travel ideas and tips with product placement advertisements. The infomercial program is broadcasted on all high speed motor trains in China with TV panels made available by the Ministry of Railways of PRC and cable TV channels. We agreed to pay an annual fee of approximately $47,873 or RMB 300,000 to Railway Media Center for the first three years and approximately $55,852 or RMB 350,000 for the second three years. We generate revenue from selling product placement advertisements. However, since the program is broadcasted manually by train attendants, we have no control over the frequency of program broadcasting, which results in the substantial instability of our railway media revenue. We generated approximately $0.06 million income from the “Journey through China on the Train” program for the nine months ended September 30, 2013 as compared to we generated approximately $0.38 million for the nine months ended September 30, 2012.
During this period, advertisement revenue from FETV experienced a decrease of 79.35% from $13.75 million to $2.84 million due to actions taken by domestic media authorities to regulate the broadcasting manner and content of TV advertising. Under the new regulatory measures, shopping programs, mini ads and certain medical advertisements have become restricted. On August 1, 2010, Fuyu, our wholly-owned subsidiary, entered into Fujian Education Television Channel Project Management Agreement (the “Agreement”), with Fujian Education Media Limited Company, a wholly state-owned company organized by the Fujian Education TV Station under the laws of the People’s Republic of China (“Fujian Education Media”), pursuant to which, Fujian Education Media granted to us five years (three year agreement with two year renewal) of exclusive management rights for the FETV channel from August 1, 2010 to July 31, 2015. Under the management contract, we obtained the full rights to provide programming and content management services and re-sell all advertising airtime of FETV. We have leveraged the FETV assets to produce high quality TV programming focusing on tourism, successfully promote our own tourist attractions, improve the image of the FETV station around the tourism theme, and create a network of potential partners for our tourism business, including hotels, travel agents, and entertainment resorts. The three-year management contract expired on July 31, 2013, and we did not renew the management contract with Fujian Education Media for the following two years.
Tourism
Tourism revenue increased by approximately $3.16 million or approximately 43.01% from approximately $7.34 million for the nine months ended September 30, 2012 to approximately $10.50 million for the nine months ended September 30, 2013, including approximately $3.61 million from Great Golden Lake resort, a decrease of $0.32 million or 8.14%, $6.37 million from Yunding Park, an increase of $3.99 million or 167.65%, and $0.52 million from Hua’an Tulou, a decrease of $0.51 million or 49.51%, as compared to the same period in 2012. The primary resources of the revenues are entrance fees, tour shuttle bus fees, and restaurants. The increase in tourism business was primarily due to the revenue increase at Yunding Park benefiting from effective marketing promotion activities and advertisement in China that led to an increase in number of tourists, partially offset by revenue decrease in Great Golden Lake resort and Hua’an Tulou. The revenue from Great Golden Lake resort decreased because we are still recovering from the severe flooding in 2011 and storm in 2012. The decrease in revenue from Hua’an Tulou was due to strong competition among the homogeneous tourism destinations, including Nanjing Tulou Cluster and Yongding Tulou Cluster. We have to provide deeper ticket discount among the strong completion and the tourist consumption was also decreased. We expect this trend to continue in the future.
Cost of Revenue
Cost of revenues decreased by approximately $1.52 million or approximately 17.67%, from approximately $8.60 million for the nine months ended September 30, 2012 to approximately $7.08 million for the nine months ended September 30, 2013. The decrease in cost of revenue was primarily due to a decrease in cost of revenue from advertisement, partially offset by an increase in cost of revenue of tourism.
Advertisement
Cost of revenue from advertisement decreased by approximately $2.19 million or approximately 51.78%, from approximately $4.23 million for the nine months ended September 30, 2012 to approximately $2.04 million for the nine months ended September 30, 2013. The Railway media clients demanded less broadcast programs due to the instability of the railway broadcasting, so the decrease in cost of media businesses was primarily due to the decrease of railway program productions. Also the business tax decreased along with the decrease in the Company’s advertising revenue.
Tourism
Cost of revenue from tourism increased by approximately $0.67 million or approximately 15.26%, from approximately $4.38 million for the nine months ended September 30, 2012 to approximately $5.05 million for the nine months ended September 30, 2013. The increase was primarily due to the increase in depreciation cost for the new construction completed for tourism destinations.
Gross profit
Gross profit decreased approximately $6.55 million, or approximately 50.91%, from approximately $12.86 million for the nine months ended September 30, 2012 to approximately $6.31 million for the nine months ended September 30, 2013. Our gross profit margin was approximately 47.13% for the nine months ended September 30, 2013, compared to approximately 59.92% for the nine months ended September 30, 2012, representing a decrease of approximately 13%.
Advertisement
Gross profit from advertisement decreased by approximately $9.04 million, or approximately 91.3%, from approximately $9.9 million for the nine months ended September 30, 2012 to approximately $0.86 million for the nine months ended September 30, 2013. Gross profit margin from advertisement was approximately 29.71% for the nine months ended September 30, 2013, compared to approximately 70.08% for the nine months ended September 30, 2012. This decrease was primarily attributable to the decrease in revenue during the nine months ended September 30, 2013 due to the instability of the railway media broadcasts while the fixed costs associated with FETV’s commercial airtime stayed the same.
Tourism
Gross profit from tourism increased by approximately $2.49 million, or approximately 84%, from approximately $2.96 million for the nine months ended September 30, 2012 to approximately $5.45 million for the nine months ended September 30, 2013. Gross profit margin from tourism was approximately 51.94% for the nine months ended September 30, 2013, compared to approximately 40.36% for the nine months ended September 30, 2012. The increase of gross profit was primarily attributable to the significant revenue increase from Yunding Park which offset the decrease of the revenue of Hua’an Tulou.
Selling Expenses
Selling expenses were approximately $7.72 million for the nine months ended September 30, 2013, compared to approximately $4.75 million for the nine months ended September 30, 2012, which represents an increase of approximately $2.97 million, or approximately 62.5%. The increase in selling expense was primarily due to the increase in various costs associated with the expansions at Yunding Park during the nine months ended September 30, 2013.
General and Administrative Expenses
General and administrative expenses were approximately $4.92 million for the nine months ended September 30, 2013, compared to approximately $2.93 million for the nine months ended September 30, 2012, which represents an increase of approximately $1.99 million, or approximately 68%. This increase was due to the increase of administrative expenses for the operation of new tourism destinations.
Interest Expense
Interest expense was approximately $3.49 million for the nine months ended September 30, 2013, representing an increase of approximately $2.50 million or approximately 252.23%, compared to approximately $0.99 million interest expense for the nine months ended September 30, 2012. The increase in interest expense was primarily due to increase in the total amount of loans
Income Tax
Income tax was approximately $0.13 million for the nine months ended September 30, 2013, representing a decrease of approximately $2.32 million or approximately 94.6%, compared to the approximately 2.46 million income tax for the nine months ended September 30, 2012. The decrease was primarily attributable to the lower revenue generated from Hua’an Tulou, as well as the decrease in the railway media revenue for the nine months ended September 30, 2013 as compared with the nine months ended September 30, 2012. The provision for income tax for the nine months ended September 30, 2013 was mainly derived from the net income before tax of the advertisement segment.
Net Income (Loss)
As a result of the above factors, we have net loss of approximately $9.76 million for the nine months ended September 30, 2013 as compared to net income of approximately $1.06 million for the nine months ended September 30, 2012, representing a decrease of approximately $10.82 million or approximately 1,021.53%. The decrease was primarily attributable to the lower revenue generated from Hua’an Tulou, as well as the decrease of the railway media revenue for the nine months ended September 30, 2013 as compared with the nine months ended September 30, 2012.
Liquidity and Capital Resources
Our principal sources of liquidity for the nine months ended September 30, 2013 were primarily the proceeds from long-term loans.
As of September 30, 2013, we had cash and cash equivalents of approximately $2 million as compared to approximately $5.66 million as of December 31, 2012, representing a decrease of $3.66 million. Our principal sources of liquidity during the nine months ended September 30, 2013 were primarily the proceeds from loans. Net proceeds from bank loans for the nine months ended September 30, 2013 was approximately $42.27 million.
As of September 30, 2013, our working capital deficit was approximately $32.41 million, compared to the working capital deficit of approximately $2.25 million as of December 31, 2012.
The following table sets forth a summary of our cash flows for the years indicated:
| | | For the Nine Months Ended September 30, | |
| | | 2013 | | | 2012 | |
| | | | | | | |
| Net cash used in (provided by) operating activities in of continuing operations | | $ | (7,702,550 | ) | | $ | 6,847,512 | |
| Net cash used in investing activities of continuing operations | | $ | (71,866,584 | ) | | $ | (13,836,892 | ) |
| Net cash provided by financing activities of continuing operations | | $ | 75,830,430 | | | $ | 9,193,658 | |
| Net cash used in (provided by) discontinued operations | | $ | (864,491 | ) | | $ | 503,234 | |
Net cash used in operating activities of continuing operations was approximately $7.7 million for the nine months ended September 30, 2013, compared to net cash provided by operating activities of continuing operations of approximately $6.85 million for the nine months ended September 30, 2012. The decrease of $14.55 million was primarily due to the net loss of $9.76 million for the nine months ended September 30, 2013 as compared to the net income of $1.06 million for the nine months ended September 30, 2012.
Net cash used in investing activities of continuing operations was approximately $71.87 million for the nine months ended September 30, 2013, compared to approximately $13.84 million for the nine months ended September 30, 2012. The increase of $58.03 million in net cash used in investing activities was primarily due to the increase of $70.77 million in the construction cost related to China Yang-sheng Paradise, which has been transferred to property and equipment during the nine months ended September 30, 2013. As of September 30, 2013, the total estimated contract costs to complete China Yang-sheng Paradise are approximately $69,603,997 (RMB 427.64 million excluding interest to be capitalized)) of which the Company has completed and paid for approximately $68,239,592 (RMB 419.26 million).
Net cash provided by financing activities of continuing operations amounted to approximately $75.83 million for the nine months ended September 30, 2013, compared to approximately $9.19 million for the nine months ended September 30, 2012, representing an increase of approximately $66.64 million. The increase in net cash provided by financing activities was mainly because of the higher amount of bank loans obtained during the nine months ended September 30, 2013 as compared to the nine months ended September 30, 2012.
Net cash used in discontinued operations was approximately $0.86 million for the nine months ended September 30, 2013, compared to net cash provided by discontinued operations of approximately $0.5 million for the nine months ended September 30, 2012.
Bank loans
As of September 30, 2013, the Company had six bank loans from three institutional lenders for the development of the tourism destinations.
| 1. | A loan for approximately $2.03 million from China Minsheng Banking Corp, Ltd. pursuant to the loan agreement dated July 22, 2013. The loan bears interest at 10% per annum, and is due July 22, 2014. |
| | |
| 2. | A loan for approximately $2.03 million from China Minsheng Banking Corp, Ltd. pursuant to the loan agreement dated July 25, 2013. The loan bears interest at 10% per annum, and is due July 25, 2014. |
| | |
| 3. | A loan for approximately $53.71 million from China Minsheng Banking Corp, Ltd. pursuant to the loan agreement dated November 23, 2012. It bears interest rate at 9% per annum. $8,138,153 (RMB 50,000,000), $8,138,153 (RMB 50,000,000), $13,021,046 (RMB 80,000,000) and $24,414,460 (RMB 150,000,000) will be due in each twelve-month period as of September 30, 2017, 2018, 2019 and 2020 respectively. It is secured by the land use right of Jiangxi Zhangshu, collateralized by the personal guarantees by two of the Company’s directors. |
| | |
| 4. | A loan for approximately $11.13 million from Industrial and Commercial Bank of China Limited pursuant to the loan agreement dated January 26, 2011. The loan bears interest at 7.76% per annum. $2,021,517 (RMB 12,420,000) will be due in each twelve-month period as of September 30, 2014, 2015, 2016, 2017 and 2018 respectively, and $1,018,432 (RMB 6,270,000) will be due in the twelve-month period as of September 30, 2019. It is collateralized by the right to collect ticket sales at the Great Golden Lake. |
| 5. | A Loan for approximately $24.41 million from China Minsheng Banking Corp, Ltd. pursuant to the loan agreement dated March 6, 2013. The loan bears interest rate at 12.50% per annum. $24,414,460 (RMB 150,000,000) will be due in twelve-month period as of September 30, 2015. It is secured by secured by the land use rights of Fujian Yida and the right to collect resort ticket sales at Yunding resort as additional collateral. |
| | |
| 6. | A loan for approximately $7.98 million from China Minsheng Banking Corp, Ltd. pursuant to the loan agreement dated February 20, 2012. The loan bears interest at 11.97% per annum. $5,533,944 (RMB 34,000,000) and $2,441,446 (RMB15,000,000) will be due in each twelve-month period as of September 30, 2014 and 2015 respectively. It is secured by credit guarantee of Fujian Jintai, collateralized by the fixed assets of Fujian Yida and personal guarantees by two of the Company’s directors as additional collateral. |
In the next 12 months, we have approximately $11.62 million in bank loans that will mature. We plan to replace these loans with new bank loans in approximately the same aggregate amounts. There is no assurance that we will be able to do this.
We believe that we can manage our capital need for construction projects based on the actual cash flow expenditures, which means we can accelerate the construction when we have more cash flows and we can slow down the construction when we are lack of funds.
Obligations Under Material Contracts
Below is a table setting forth the Company’s material contractual obligations. As of September 30, 2013:
| | | | Payment due by period | |
| Contractual Obligations | Total | | 1 year | | 1-3 years | | 3-5 years | | More than 5 years | |
| | | | | | | | | | | |
| Bank Loans | | $ | 101,296,757 | | | $ | 11,624,538 | | | $ | 30,898,941 | | | $ | 20,319,341 | | | $ | 38,453,937 | |
| Operating Lease Obligations | | | 1,497,920 | | | | 82,051 | | | | 129,220 | | | | 133,127 | | | | 1,153,522 | |
| Total | | $ | 102,794,677 | | | $ | 11,706,589 | | | $ | 31,028,161 | | | $ | 20,452,468 | | | $ | 39,607,459 | |
Capital commitments
China Yang-sheng Paradise
As of September 30, 2013, the total estimated contract costs to complete China Yang-sheng Paradise are approximately $69,603,997 (RMB 427.64 million excluding interest to be capitalized)) of which the Company has completed and paid for approximately $68,239,592 (RMB 419.26 million). As of September 30, 2013, the initial construction of China Yang-sheng Paradise project had been completed. In the future, we will continue constructing and improving the project which may include parking lot expansion, hotels and restaurants, and additional SPA services.
Management Rights Commitments
In 2001, Fujian Jintai entered into a tourism management revenue sharing agreement which is related to the management rights with Fujian Taining Great Golden Lake Tourism Economic Development Zone Management Committee (“Taining government”) to operate and to manage the Great Golden Lake resort from 2001 through 2032. The Company agreed to pay (1) 8% of the revenue from 2001 to 2005; (2) 10% of the revenue from 2006 to 2010; (3)12% of the revenue from 2011 to 2015; (4) 14% of the revenue from 2016 to 2020; (5) 16% of the revenue from 2021 to 2025; 18% from 2026 to 2032 to the Taining government.
The Company paid approximately $512,852 and $556,418 to the Taining government for the nine months ended September 30, 2013 and 2012, respectively, and recorded as cost of revenue.
The Company paid approximately $244,159 and $283,430 to the Taining government for the three months ended September 30, 2013 and 2012, respectively, and recorded as cost of revenue.
Compensation For Using Nature Resources Commitments
In 2007, Fujiang Jintai entered into an agreement with Taining government which is related to compensation fees for using nature resources in the Great Golden Lake resort. The Company agreed to pay 10% of the revenue from sale of resort tickets after deduction of the profit sharing with Taining government (see above).
The Company paid approximately $298,853 and $325,749 to the Taining government for the nine months ended September 30, 2013 and 2012, respectively, and recorded as selling expenses.
The Company paid approximately $145,072 and $169,186 to the Taining government for the three months ended September 30, 2013 and 2012, respectively, and recorded as selling expenses.
In December 2008, we entered into a Tourist Resources Development Agreement with Hua’an County Government (“Hua’an government”) which is related to pay compensation fees for using nature resources in Hua’an Tulou. The Company agreed to pay (1) 16% of gross ticket sales in the first five years; (2) 20% of gross ticket sales in the second five years; (3) 23% of gross ticket sales in the third five years; (4) 25% of gross ticket sales in the fourth five years; (5) 28% of gross ticket sales in the fifth five years; (6) 30% in twenty six years and thereafter when the ticket price of the Clusters is RMB60 ($9.50 USD) or above per person.
The Company paid approximately $45,953 and $107,296 to the Hua’an government for the nine months ended September 30, 2013 and 2012, respectively, and recorded as selling expenses.
The Company paid approximately $15,638 and $22,813 to the Hua’an government for the three months ended September 30, 2013 and 2012, respectively, and recorded as selling expenses.
In 2008, Hong Kong Yi Tat entered into a Tourist Destination Cooperative Development Agreement with Yongtai County Government with respect to the development of Yunding Park pursuant to which Fujian Yida is obligated to pay 5 million RMB, or approximately $0.80 million, to the Yongtai County People’s Government over the course of the first 10 years of the Agreement. As of September 30, 2013, the Company has paid to the Yongtai County local government 5 million RMB, or $0.80 million.
2013-2014 Outlook
In 2013, the Company will continue constructing and developing two new tourism projects, the Yang-sheng Paradise in Zhangshu City, Jiangxi province, and the City of Caves in Fenyi City, Jiangxi province, which represent our commitment to expanding our business operations by applying our current business model to the development of other valuable tourist destinations outside Fujian province and throughout China. The constructions were in line with our schedule. Yang-sheng Paradise had trial open to the public in October 2013, and we expect to open City of Caves to the public by the second quarter of 2014. In 2012, we had completed Yunding Park’s second phase of construction. In addition, in June 2011, we announced the establishment of our new subsidiary, Fujian Yida Travel Service Co., Ltd. From May to July 2012, we further established five new wholly-owned subsidiaries, including Zhangshu (Yida) Real Estate Development Co., Ltd., Zhangshu (Yida) Investment Co., Ltd., Fenyi (Yida) Property Development Co., Ltd., the primary business focus of which will be in tourism-related real estate investment, project management, and consulting in China. On July 30, 2012, we established Fujian (Yida) Culture and Tourism Performing Arts Co., Ltd., the primary business focus of which will be to operate Yunding performance and show events. On June 26, 2013, we formed a wholly owned subsidiary, Yunding Hotel Management Co., Ltd. (“Yunding Hotel”), the primary business of which is to operate and manage the hotel and its facilities at Yunding Park. Over the next few years, we will focus on developing our five tourist destinations.
On June 3, 2013, Fujian Yida entered into a stock transfer agreement with Anhui Xingguang, pursuant to which Fujian Yida agreed to transfer its 60% interest in Anhui Yida to Anhui Xingguang for 60 million RMB, or $9.72 million and assume all the assets and liabilities of Anhui Yida. The primary business of Anhui Yida focuses on developing the Ming Dynasty Entertainment World. All the rights and ownership interest of Bengbu (Yida) Real Estate Development Co., Ltd. and Bengbu (Yida) Investment Co., Ltd., the wholly owned subsidiaries of Anhui Yida, shall also be transferred to the Anhui Xingguang. We no longer engage in the construction and development of Ming Dynasty Entertainment World.
Critical Accounting Policies
The preparation of consolidated financial statements in conformity with accounting principles generally accepted in the United States requires our management to make assumptions, estimates, and judgments that affect the amounts reported, including the notes thereto, and related disclosures of commitments and contingencies, if any. We have identified certain accounting policies that are significant to the preparation of our consolidated financial statements. These accounting policies are important for an understanding of our financial condition and results of operations. Critical accounting policies are those that are most important to the portrayal of our financial condition and results of operations and require management’s difficult, subjective, or complex judgment, often as a result of the need to make estimates about the effect of matters that are inherently uncertain and may change in subsequent periods. Certain accounting estimates are particularly sensitive because of their significance to financial statements and because of the possibility that future events affecting the estimate may differ significantly from management’s current judgments. We believe the following critical accounting policies involve the most significant estimates and judgments used in the preparation of our consolidated financial statements.
Basis of presentation
The accompanying consolidated financial statements have been prepared in conformity with accounting principles generally accepted in the United States of America. The functional currency is the Chinese Renminbi, however the accompanying consolidated financial statements have been translated and presented in United States Dollars ($).
In the opinion of the Company’s management, the unaudited consolidated financial statements include all adjustments necessary to present fairly the consolidated financial position, results of operations and cash flows of the Company for the periods presented. The results of operations for the nine and three months ended September 30, 2013 are not necessarily indicative of operating results expected for the full year or future interim periods. These unaudited consolidated financial statements should be read in conjunction with the audited financial statements and notes thereto included in the Annual Report.
Principles of consolidation
The accompanying consolidated financial statements include the accounts of China Yida and its wholly-owned subsidiaries Keenway Limited, Hong Kong Yi Tat, Fujian Jintai, Fuyu, Fujian Yida, Tulou, Yongtai Yunding, Jiangxi Zhangshu, Jiangxi Fenyi, Yida Travel, Fenyi Development, Zhangshu Development, Zhangshu Investment, Yida Arts, Yunding hotel and the accounts of its variable interest entity, Fujian Jiaoguang. All significant inter-company accounts and transactions have been eliminated in consolidation.
Consolidation of Variable Interest Entities
According to the requirements of ASC 810, an Interpretation of Accounting Research Bulletin No. 51 that requires a Variable Interest Entity ("VIE"), the Company has evaluated the economic relationships of Fujian Jiaoguang which signed an exclusive right agreement with the Company. Therefore, Fujian Jiaoguang is considered to be a VIE, as defined by ASC Topic 810-10, of which the Company is the primary beneficiary.
The carrying amount and classification of Fujian Jiaoguang’s assets and liabilities included in the Consolidated Balance Sheets are as follows:
| | | September 30, 2013 | | | December 31, 2012 | |
| Total current assets * | | $ | 12,205,265 | | | $ | 12,317,151 | |
| Total assets | | $ | 12,212,916 | | | $ | 12,324,608 | |
| Total current liabilities # | | $ | 11,077,825 | | | $ | 10,829,647 | |
| Total liabilities | | $ | 11,077,825 | | | $ | 10,829,647 | |
* Including intercompany receivables of $12,187,373 and $12,312,288 as at September 30, 2013 and December 31, 2012, respectively, to be eliminated in consolidation.
# Including intercompany payables of $11,031,669 and $10,785,266 as at September 30, 2013 and December 31, 2012, respectively, to be eliminated in consolidation.
Although Fujian Jiaoguang no longer had revenues, its bank account still has to be maintained active with certain cash flows to support its expenses. As such, Fujian Jiaoguang transferred funds from and to the Company’s directly-owned subsidiaries, which resulted in part of the intercompany receivables and payables. Another significant portion of the intercompany receivable recorded at Fujian Jiaoguang represented payments that Fujian Jiaoguang paid on behalf of Jintai previously, which remained due from Jintai. Nonetheless, since Fujian Jiaoguang is a variable interest entity subject to consolidation, the balances of its intercompany receivables and payables are eliminated against the corresponding account balances at the Company’s directly-owned subsidiaries at the consolidation level.
Use of estimates and assumptions
The preparation of the consolidated financial statements in conformity with accounting principles generally accepted in the United States of America requires management to make estimates and assumptions that affect the reported amounts of assets and liabilities and disclosure of contingent assets and liabilities at the date of the consolidated financial statements and the amount of revenues and expenses during the reporting periods. Management makes these estimates using the best information available at the time the estimates are made. However, actual results could differ materially from those results. The most significant estimates reflected in the consolidated financial statements include depreciation, useful lives of property and equipment, deferred income taxes, useful life of intangible assets and contingencies. Estimates and assumptions are periodically reviewed and the effects of revisions are reflected in the consolidated financial statements in the period they are determined to be necessary.
Property and equipment
Property and equipment are recorded at cost less accumulated depreciation. Gains or losses on disposals are reflected as gain or loss in the year of disposal. The cost of improvements that extends the life of property, and equipment are capitalized. These capitalized costs may include structural improvements, equipment, and fixtures. All ordinary repair and maintenance costs are expensed as incurred.
Depreciation for financial reporting purposes is provided using the straight-line method over the estimated useful lives of the assets or lease term as follows:
| Building | 20 years |
| Electronic Equipment | 5 to 8 years |
| Transportation Equipment | 8 years |
| Office Furniture | 5 to 8 years |
| Leasehold Improvement and Attractions | Lesser of term of the lease or the estimated useful lives of the assets |
Intangible assets
Intangible assets consist of acquisition of management right of tourism destinations, commercial airtime rights and land use rights for tourism destinations. They are amortized on the straight line basis over their respective lease periods. The lease period of management right, commercial airtime rights and land use rights is 30 years, 3 years and 40 years, respectively.
Impairment
The Company reviews long-lived assets for impairment whenever events or changes in circumstances indicate that the carrying amount of an asset may not be recoverable through the estimated undiscounted cash flows expected to result from the use and eventual disposition of the assets. Whenever any such impairment exists, an impairment loss will be recognized for the amount by which the carrying value exceeds the fair value.
Assets are grouped and evaluated at the lowest level for their identifiable cash flows that are largely independent of the cash flows of other groups of assets. The Company considers historical performance and future estimated results in its evaluation of potential impairment and then compares the carrying amount of the asset to the future estimated cash flows expected to result from the use of the asset. If the carrying amount of the asset exceeds estimated expected undiscounted future cash flows, the Company measures the amount of impairment by comparing the carrying amount of the asset to its fair value. The estimation of fair value is generally measured by discounting expected future cash flows as the rate the Company utilizes to evaluate potential investments. The Company estimates fair value based on the information available, judgments and projections are considered necessary. There was no impairment of long-lived assets as of September 30, 2013 and December 31, 2012.
Revenue recognition
Revenue is recognized at the date of service rendered to customers when a formal arrangement exists, the price is fixed or determinable, the services rendered, no other significant obligations of the Company exist and collectability is reasonably assured. Payments received before satisfaction of all of the relevant criteria for revenue recognition are recorded as unearned revenue.
Revenues from advance tourism destinations ticket sales are recognized when the tickets are used. Revenues from our contractors who have tourism contracts with us are generally recognized over the period of the applicable agreements commencing with the tourists visiting the tourism destinations. The Company also sells admission and activities tickets for a tourism destination which the Company has the management right.
The Company sells the television airtime to third parties. The Company records advertising sales when advertisements are aired.
The Company has no allowance for product returns or sales discounts because services that are rendered and accepted by the customers are normally not refundable and discounts are normally not granted after service has been rendered.
Profit sharing costs are recorded as cost of revenue. Profit sharing arrangements with the local governments for the management rights:
| For the nine months ended September 30, 2013 | | | | | | |
| | | Fujian Jintai | | | Tulou | |
| | | | | | | |
| Gross receipts | | $ | 3,606,706 | | | $ | 512,986 | |
| | | | | | | | | |
| Profit sharing costs | | | 512,852 | | | | - | |
| Nature resource compensation expenses | | | 298,853 | | | | 45,953 | |
| Total paid to the local governments | | | 811,705 | | | | 45,953 | |
| | | | | | | | | |
| Net receipts | | $ | 2,795,001 | | | $ | 467,033 | |
| For the nine months ended September 30, 2012 | | | | | | |
| | | Fujian Jintai | | | Tulou | |
| | | | | | | |
| Gross receipts | | $ | 3,926,123 | | | $ | 1,033,337 | |
| | | | | | | | | |
| Profit sharing costs | | | 556,418 | | | | - | |
| Nature resource compensation expenses | | | 325,749 | | | | 107,296 | |
| Total paid to the local governments | | | 882,167 | | | | 107,296 | |
| | | | | | | | | |
| Net receipts | | $ | 3,043,956 | | | $ | 926,041 | |
| For the three months ended September 30, 2013 | | | | | | |
| | | Fujian Jintai | | | Tulou | |
| | | | | | | |
| Gross receipts | | $ | 1,741,215 | | | $ | 177,774 | |
| | | | | | | | | |
| Profit sharing costs | | | 244,159 | | | | - | |
| Nature resource compensation expenses | | | 145,072 | | | | 15,638 | |
| Total paid to the local governments | | | 389,231 | | | | 15,638 | |
| | | | | | | | | |
| Net receipts | | $ | 1,351,984 | | | $ | 162,136 | |
| For the three months ended September 30, 2012 | | | | | | |
| | | Fujian Jintai | | | Tulou | |
| | | | | | | |
| Gross receipts | | $ | 2,028,011 | | | $ | 245,453 | |
| | | | | | | | | |
| Profit sharing costs | | | 283,430 | | | | - | |
| Nature resource compensation expenses | | | 169,186 | | | | 22,813 | |
| Total paid to the local governments | | | 452,616 | | | | 22,813 | |
| | | | | | | | | |
| Net receipts | | $ | 1,575,395 | | | $ | 222,640 | |
Foreign currency translation
The Company uses the United States dollar ("U.S. dollars") for financial reporting purposes. The Company's subsidiaries maintain their books and records in their functional currency, being the primary currency of the economic environment in which their operations are conducted. In general, for consolidation purposes, the Company translates the subsidiaries' assets and liabilities into U.S. dollars using the applicable exchange rates prevailing at the balance sheet dates, and the statements of income are translated at average exchange rates during the reporting periods. Gain or loss on foreign currency transactions are reflected on the income statement. Gain or loss on financial statement translation from foreign currency are recorded as a separate component in the equity section of the balance sheet and is included as part of accumulated other comprehensive income. The functional currency of the Company and its subsidiaries in China is the Chinese Renminbi.
Income taxes
Income taxes are accounted for under the asset and liability method. Deferred tax assets and liabilities are recognized for the future tax consequences attributable to differences between the financial statement carrying amounts of existing assets and liabilities and their respective tax bases and operating loss and tax credit carry forwards. Deferred tax assets and liabilities are measured using enacted tax rates expected to apply to taxable income in the years in which those temporary differences are expected to be recovered or settled. The effect on deferred tax assets and liabilities of a change in tax rates is recognized in income in the period that includes the enactment date. A valuation allowance is recognized if it is more likely than not that some portion, or all, of a deferred tax asset will not be realized. There were no deferred income tax assets as of September 30, 2013 and December 31, 2012.
The Company applied the provisions of ASC 740-10-50, “Accounting For Uncertainty In Income Taxes”, which provides clarification related to the process associated with accounting for uncertain tax positions recognized in our financial statements. Audit periods remain open for review until the statute of limitations has passed. The completion of review or the expiration of the statute of limitations for a given audit period could result in an adjustment to the Company’s liability for income taxes. Any such adjustment could be material to the Company’s results of operations for any given quarterly or annual period based, in part, upon the results of operations for the given period. At June 30, 2013, management considered that the Company had no uncertain tax positions, and will continue to evaluate for uncertain positions in the future.
China Yida is subject to U.S. Federal and California state examination by tax authorities for years after 2007, and the PRC tax authority for years after 2006.
Fair values of financial instruments
The carrying amounts reported in the consolidated financial statements for current assets and currently liabilities approximate fair value due to the short-term nature of these financial instruments. The carrying amount of long-term loans approximates fair value since the interest rates associated with the debts approximate the current market interest rates.
The Company adopted ASC 820-10, “Fair Value Measurements and Disclosures”, which establishes a single authoritative definition of fair value and a framework for measuring fair value and expands disclosure of fair value measurements for both financial and nonfinancial assets and liabilities. This standard defines fair value, provides guidance for measuring fair value and requires certain disclosures. This standard does not require any new fair value measurements, but discusses valuation techniques, such as the market approach (comparable market prices), the income approach (present value of future income or cash flows) and the cost approach (cost to replace the service capacity of an asset or replacement cost). For purposes of ASC 820-10-15, nonfinancial assets and nonfinancial liabilities would include all assets and liabilities other than those meeting the definition of a financial asset or financial liability as defined in ASC-820-10-15-15-1A.
Stock-based compensation
The Company records stock-based compensation expense pursuant to ASC 718-10, "Share Based Payment Arrangement,” which requires companies to measure compensation cost for stock-based employee compensation plans at fair value at the grant date and recognize the expense over the employee's requisite service period. The Company’s expected volatility assumption is based on the historical volatility of Company’s stock or the expected volatility of similar entities. The expected life assumption is primarily based on historical exercise patterns and employee post-vesting termination behavior. The risk-free interest rate for the expected term of the option is based on the U.S. Treasury yield curve in effect at the time of grant.
Stock-based compensation expense is recognized based on awards expected to vest, and there were no estimated forfeitures as the Company has a short history of issuing options. ASC 718-10 requires forfeitures to be estimated at the time of grant and revised in subsequent periods, if necessary, if actual forfeitures differ from those estimates.
Recent accounting pronouncements
In February 2013, the FASB issued ASU 2013-02, “Comprehensive Income (Topic 220): Reporting of Amounts Reclassified Out of Accumulated Other Comprehensive Income.” This ASU does not change the current requirements for reporting net income or other comprehensive income in financial statements. However, this guidance requires an entity to provide information about the amounts reclassified out of accumulated other comprehensive income by component. In addition, an entity is required to present, either on the face of the statement where net income is presented or in the notes, significant amounts reclassified out of accumulated other comprehensive income by the respective line items of net income but only if the amount reclassified is required under U.S. GAAP to be reclassified to net income in its entirety in the same reporting period. For other amounts that are not required under U.S. GAAP to be reclassified in their entirety to net income, an entity is required to cross-reference to other disclosures required under U.S. GAAP that provide additional detail about those amounts. For public entities, the guidance is effective prospectively for reporting periods beginning after December 15, 2012. For nonpublic entities, the guidance is effective prospectively for reporting periods beginning after December 15, 2013. Early adoption is permitted. The adoption of this standard is not expected to have a material impact on the Company’s consolidated financial position and results of operations.
In July 2012, FASB issued an amendment (ASU No. 2012-02) to Intangibles–Goodwill and Other (ASC Topic 350). In accordance with the amendments in this Update, an entity has the option first to assess qualitative factors to determine whether the existence of events and circumstances indicates that it is more likely than not that the indefinite-lived intangible asset is impaired. If, after assessing the totality of events and circumstances, an entity concludes that it is not more likely than not that the indefinite-lived intangible asset is impaired, then the entity is not required to take further action. However, if an entity concludes otherwise, then it is required to determine the fair value of the indefinite-lived intangible asset and perform the quantitative impairment test by comparing the fair value with the carrying amount in accordance with Subtopic 350-30. An entity also has the option to bypass the qualitative assessment for any indefinite-lived intangible asset in any period and proceed directly to performing the quantitative impairment test. An entity will be able to resume performing the qualitative assessment in any subsequent period. The amendments are effective for annual and interim impairment tests performed for fiscal years beginning after September 15, 2012, with early adoption permitted. The adoption of this guidance had no impact on our consolidated financial position or results of operations.
The Company does not believe any other recently issued but not yet effective accounting standards from ASU 2013-03 to ASU 2013-05 , if currently adopted, would have a material effect of the consolidated financial position, results of operation and cash flows.
Inflation and Seasonality
Our operating results and operating cash flows historically have not been materially affected by inflation or seasonality.
Off Balance Sheet Arrangements
We do not have any off balance sheet arrangements that have or are reasonably likely to have a current or future effect on our financial condition, changes in financial condition, sales or expenses, results of operations, liquidity or capital expenditures, or capital resources that are material to an investment in our securities.
Item 3. Quantitative and Qualitative Disclosures About Market Risk.
We are a smaller reporting company and therefore, we are not required to provide information required by this Item of Form 10-Q.
Item 4. Controls and Procedures.
Evaluation of disclosure controls and procedures. Our disclosure controls and procedures are designed to ensure (i) that information required to be disclosed by us in the reports we file or submit under the Exchange Act are recorded, processed, summarized, and reported within the time periods specified in the SEC’s rules and forms; and (ii) that information required to be disclosed by us in the reports it files or submits under the Exchange Act is accumulated and communicated to our management, including our principal executive and principal financial officer, or persons performing similar functions, as appropriate to allow timely decisions regarding required disclosure. As of September 30, 2013, we carried out an evaluation, under the supervision and with the participation of our management, including our Chief Executive Officer and Chief Financial Officer, of the effectiveness of the design and operation of our disclosure controls and procedures (as such term is defined in Rules 13a-15(e) and 15d-15(e) under the Securities Exchange Act of 1934 (the “Exchange Act”)). Based upon that evaluation, our Chief Executive Officer and Chief Financial Officer concluded that as of the end of the period covered by this report, our disclosure controls and procedures were not effective at the reasonable assurance level due to the following reason: |
| |
| We did not have sufficient skilled accounting personnel that are either qualified as Certified Public Accountants in the U.S. or that have received education from U.S. institutions or other educational programs that would provide enough relevant education relating to U.S. GAAP. The Company’s CFO and Financial Manager have limited experience with U.S. GAAP and are not U.S. Certified Public Accountants. Further, our operating subsidiaries are based in China and in accordance with PRC laws and regulations, are required to comply with PRC GAAP, rather than U.S. GAAP. Thus, the accounting skills and understanding necessary to fulfill the requirements of U.S. GAAP-based reporting, including the preparation of financial statements and consolidation, are inadequate, and determined to be a material weakness. |
In an effort to remedy this material weakness in the future, we plan to: |
| ● | develop a comprehensive training and development plan, for our finance, accounting and internal audit personnel, including our Chief Financial Officer, Financial Manager, and others, in the principles and rules of U.S. GAAP, SEC reporting requirements and the application thereof. |
| ● | design and implement a program to provide ongoing company-wide training regarding the Company’s internal controls, with particular emphasis on our finance and accounting staff. |
| ● | implement an internal review process over financial reporting to review all recent accounting pronouncements and to verify that the accounting treatment identified in such report have been fully implemented and confirmed by our internal control department. In the future, we intend to continue to improve our ongoing review and supervision of our internal control over financial reporting. |
| We believe that the foregoing steps will remediate the significant deficiencies identified above, and we will continue to monitor the effectiveness of these steps and make any changes that our management deems appropriate. |
| |
| Because of its inherent limitations, internal control over financial reporting may not prevent or detect misstatements. Projections of any evaluation of effectiveness to future periods are subject to the risk that controls may become inadequate because changes in conditions, or that the degree of compliance with the policies or procedures may deteriorate. All internal control systems, no matter how well designed, have inherent limitations. Therefore, even those systems determined to be effective can provide only reasonable assurance with respect to financial statement preparation and presentation. |
| |
Changes in internal control over financial reporting. During the period covered by this report, there was no change in our internal control over financial reporting (as such term is defined in Rules 13a-15(f) and 15d-15(f) under the Exchange Act) that has materially affected, or is reasonably likely to materially affect our internal control over financial reporting. |
PART II - OTHER INFORMATION
Item 1. Legal Proceedings.
None.
Item 1A. Risk Factors.
There has been no material change to our risk factors from those presented in our Form 10-K for the fiscal year ended December 31, 2012.
Item 2. Unregistered Sales of Equity Securities and Use of Proceeds.
None.
Item 3. Defaults Upon Senior Securities.
None.
Item 4. Mine Safety Disclosures.
Not applicable.
Item 5. Other Information.
None.
Item 6. Exhibits.
| No. | | Description |
| 10.1 | | Loan agreement among Jiangxi Zhangshu Yida Tourism and Development Co., Ltd., Wang Qiaoqia and China Minsheng Banking Corp., Ltd., Fuzhou Branch, dated July 22, 2013 |
| 10.2 | | Loan agreement among Jiangxi Zhangshu Yida Tourism and Development Co., Ltd., Wang Qiaoqia and China Minsheng Banking Corp., Ltd., Fuzhou Branch, dated July 25, 2013 |
| 31.1 | | Certification of Chief Executive Officer Required by Rule 13a-14(a) (17 CFR 240.13a-14(a)) |
| 31.2 | | Certification of Chief Financial Officer Required by Rule 13a-14(a) (17 CFR 240.13a-14(a)) |
| 32.1 | | Certification of Chief Executive Officer Pursuant to 18 U.S.C. Section 1350, as adopted pursuant to Section 906 of the Sarbanes-Oxley Act of 2002 * |
| 32.2 | | Certification of Chief Financial Officer Pursuant to 18 U.S.C. Section 1350, as adopted pursuant to Section 906 of the Sarbanes-Oxley Act of 2002 * |
| 101.INS | | XBRL Instance Document † |
| 101.SCH | | XBRL Taxonomy Extension Schema Document † |
| 101.CAL | | XBRL Taxonomy Extension Calculation Linkbase Document † |
| 101.DEF | | XBRL Taxonomy Extension Definition Linkbase Document † |
| 101.LAB | | XBRL Taxonomy Extension Label Linkbase Document † |
| 101.PRE | | XBRL Taxonomy Extension Presentation Linkbase Document † |
| | | |
| * | | In accordance with SEC Release 33-8238, Exhibits 32.1 and 32.2 are furnished and not filed. |
| † | | Furnished herewith. XBRL (eXtensible Business Reporting Language) information is furnished and not filed or a part of a registration statement or prospectus for purposes of Sections 11 or 12 of the Securities Act of 1933, as amended, is deemed not filed for purposes of Section 18 of the Securities Exchange Act of 1934, as amended, and otherwise is not subject to liability under these sections. |
SIGNATURES
Pursuant to the requirements of the Securities Exchange Act of 1934, the registrant has duly caused this report to be signed on its behalf by the undersigned thereunto duly authorized.
| | CHINA YIDA HOLDING, CO. |
| | | |
| Date: November 14, 2013 | By: | /s/ Minhua Chen |
| | | Minhua Chen Chief Executive Officer (Principal Executive Officer) |
| | | |
| Date: November 14, 2013 | By: | /s/ Yongxi Lin |
| | | Yongxi Lin Chief Financial Officer (Principal Financial Officer) |