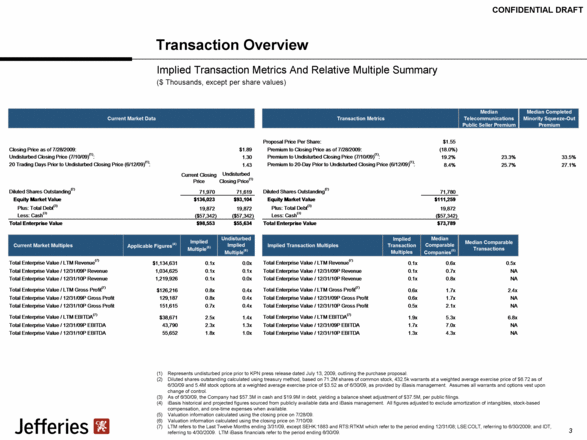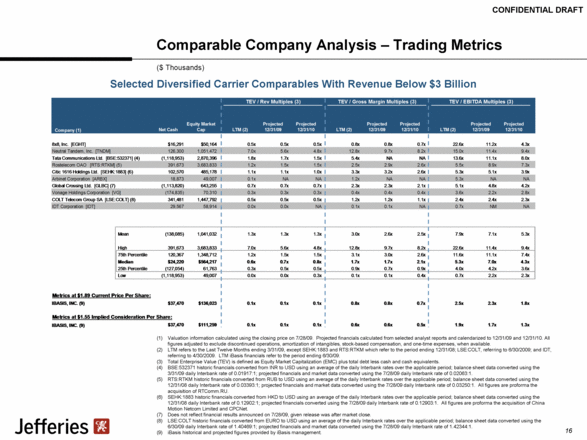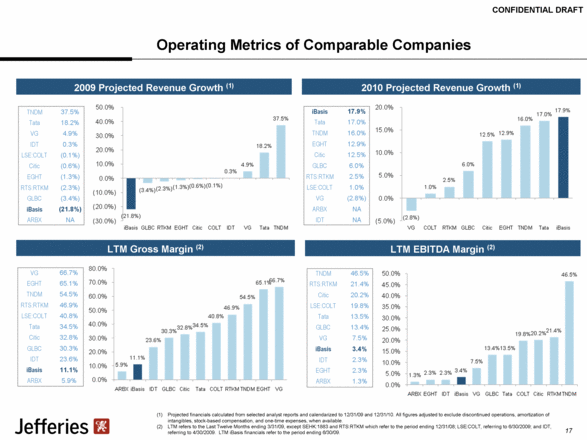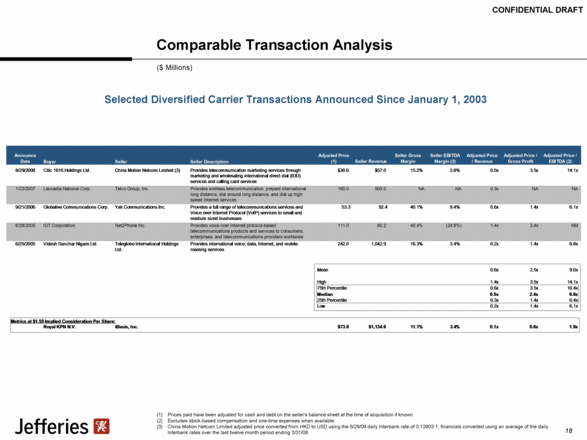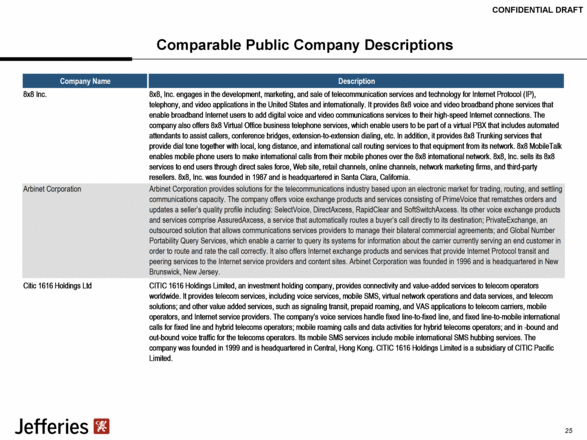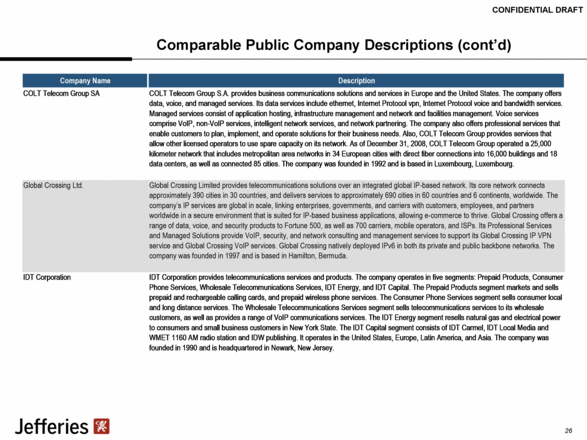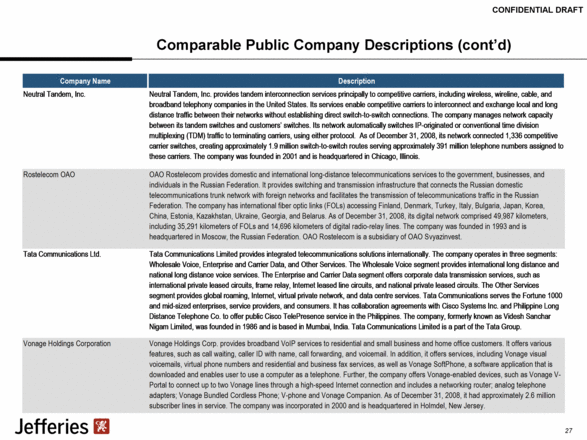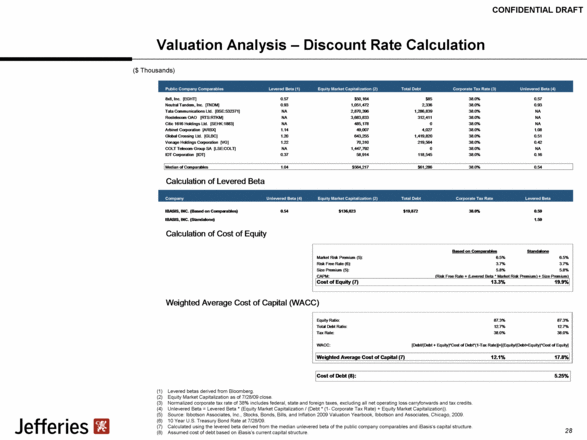
| Comparable Company Analysis – Operating Metrics ($ Thousands) Selected Diversified Carrier Comparables With Revenue Below $3 Billion Valuation information calculated using the closing price on 7/28/09. Projected financials calculated from selected analyst reports and calendarized to 12/31/09 and 12/31/10. All figures adjusted to exclude discontinued operations, amortization of intangibles, stock-based compensation, and one-time expenses, when available. LTM refers to the Last Twelve Months ending 3/31/09, except SEHK:1883 and RTS:RTKM which refer to the period ending 12/31/08; LSE:COLT, referring to 6/30/2009; and IDT, referring to 4/30/2009. LTM iBasis financials refer to the period ending 6/30/09. BSE:532371 historic financials converted from INR to USD using an average of the daily Interbank rates over the applicable period; balance sheet data converted using the 3/31/09 daily Interbank rate of 0.01917:1; projected financials and market data converted using the 7/28/09 daily Interbank rate of 0.02063:1. RTS:RTKM historic financials converted from RUB to USD using an average of the daily Interbank rates over the applicable period; balance sheet data converted using the 12/31/08 daily Interbank rate of 0.03393:1; projected financials and market data converted using the 7/28/09 daily Interbank rate of 0.03250:1. All figures are proforma the acquisition of RTComm.RU. SEHK:1883 historic financials converted from HKD to USD using an average of the daily Interbank rates over the applicable period; balance sheet data converted using the 12/31/08 daily Interbank rate of 0.12902:1; projected financials converted using the 7/28/09 daily Interbank rate of 0.12903:1. All figures are proforma the acquisition of China Motion Netcom Limited and CPCNet. Does not reflect financial results announced on 7/28/09, given release was after market close. LSE:COLT historic financials converted from EURO to USD using an average of the daily Interbank rates over the applicable period; balance sheet data converted using the 6/30/09 daily Interbank rate of 1.40469:1; projected financials and market data converted using the 7/28/09 daily Interbank rate of 1.42344:1. iBasis historical and projected figures provided by iBasis management. 15 LTM (2) Projected 12/31/2009 Projected 12/31/2010 Revenue Revenue Growth Gross Margin EBITDA Margin Revenue Revenue Growth Gross Margin EBITDA Margin Revenue Revenue Growth Gross Margin EBITDA Margin 8x8, Inc. [EGHT] $64,674 4.9% 65.1% 2.3% $64,393 (1.3%) 65.3% 4.7% $72,688 12.9% 66.4% 10.8% Neutral Tandem, Inc. [TNDM] 132,925 41.2% 54.5% 46.5% 166,300 37.5% 57.1% 49.0% 192,900 16.0% 58.8% 51.0% Tata Communications Ltd. [BSE:532371] (3) 2,160,824 20.1% 34.5% 13.5% 2,327,837 18.2% NA 15.5% 2,723,609 17.0% NA 18.3% Rostelecom OAO [RTS:RTKM] (4) 2,780,157 3.0% 46.9% 21.4% 2,187,868 (2.3%) 52.0% 17.0% 2,242,370 2.5% 56.9% 20.2% Citic 1616 Holdings Ltd. [SEHK:1883] (5) 354,456 21.6% 32.8% 20.2% 354,058 (0.6%) 33.9% 21.2% 398,316 12.5% 36.7% 24.6% Arbinet Corporation [ARBX] 428,776 (17.1%) 5.9% 1.3% NA NA NA NA NA NA NA NA Global Crossing Ltd. [GLBC] (6) 2,569,000 7.5% 30.3% 13.4% 2,504,374 (3.4%) 30.5% 14.5% 2,654,771 6.0% 31.4% 15.7% Vonage Holdings Corporation [VG] 899,508 5.0% 66.7% 7.5% 944,493 4.9% 68.3% 11.9% 917,659 (2.8%) 66.9% 9.6% COLT Telecom Group SA [LSE:COLT] (7) 2,288,319 (0.3%) 40.8% 19.8% 2,381,984 (0.1%) 40.2% 19.3% 2,404,902 1.0% 41.2% 19.9% IDT Corporation [IDT] 1,773,274 (4.5%) 23.6% 2.3% 1,805,290 0.3% 19.4% (1.0%) NA NA NA NA Mean 1,345,191 8.1% 40.1% 14.8% 1,415,177 5.9% 45.8% 16.9% 1,450,902 8.1% 51.2% 21.3% High 2,780,157 41.2% 66.7% 46.5% 2,504,374 37.5% 68.3% 49.0% 2,723,609 17.0% 66.9% 51.0% 75th Percentile 2,256,446 16.9% 52.6% 20.1% 2,327,837 4.9% 59.1% 19.3% 2,467,369 13.7% 62.6% 21.3% Median $1,336,391 4.9% 37.6% 13.5% $1,805,290 (0.1%) 46.1% 15.5% $1,580,015 9.3% 56.9% 19.1% 25th Percentile 373,036 0.5% 30.9% 3.6% 354,058 (1.3%) 33.0% 11.9% 346,962 2.1% 38.9% 14.5% Low 64,674 (17.1%) 5.9% 1.3% 64,393 (3.4%) 19.4% (1.0%) 72,688 (2.8%) 31.4% 9.6% IBASIS, INC. (8) $1,134,631 (19.2%) 11.1% 3.4% $1,034,625 (21.8%) 12.5% 4.2% $1,219,926 17.9% 12.4% 4.6% Company (1) (1) (2) (3) (4) (5) (6) (7) (8) |
