Exhibit (a)(51)
| Presentation to the Special Committee of the Board of Directors October 13, 2009 Regarding the Proposed Transaction CONFIDENTIAL DRAFT Jefferies & Company, Inc. Member SIPC |
| Disclaimer The following pages contain material provided to the Special Committee (the “Committee”) and the Board of Directors (the “Board”) of iBasis, Inc. (“iBasis” or the “Company”) by Jefferies & Company, Inc. (“Jefferies”) in connection with the tender offer by Royal KPN N.V. (“KPN”) to acquire the outstanding shares of the Company not owned by KPN and the Committee’s exploration of various strategic alternatives available to the Company to enhance shareholder value. These materials were prepared on a confidential basis in connection with an oral presentation to the Committee and not with a view toward complying with the disclosure standards under state or federal securities laws. These materials are solely for use of the Committee and may not be used for any other purpose without Jefferies’ written consent. The information contained in this presentation was based solely on publicly available information or information furnished to Jefferies. Jefferies has relied, without independent investigation or verification, on the accuracy, completeness and fair presentation of all such information and the conclusions contained herein are conditioned upon such information (whether written or oral) being accurate, complete and fairly presented in all respects, and Jefferies makes no representation or warranty in respect of the accuracy, completeness or fair presentation of such information. Jefferies does not provide accounting, tax, legal or regulatory advice. In addition, Jefferies and the Company mutually agree that, subject to applicable law, the Company (and its employees, representatives and other agents) may disclose any and all aspects of any potential transaction or structure described herein that are necessary to support any U.S. federal income tax benefits, and all materials of any kind (including tax opinions and other tax analyses) related thereto, without Jefferies imposing any limitation of any kind. i |
| Table of Contents Transaction Overview 1 Company Overview 4 Valuation Analysis 13 Appendix 26 ii |
| Transaction Overview 1 |
| Key Terms Of KPN’s Proposal (1) Per KPN Offer to Purchase dated October 5, 2009. PROPOSAL SUMMARY(1) Acquirer Royal KPN N.V. Target iBasis, Inc. (shares not currently owned by KPN) Consideration $2.25 per share in cash KPN Share Ownership KPN owns approximately 56.3% of the outstanding shares of iBasis Tender Process KPN commenced the Offer on July 28, 2009 at an offer price of $1.55 per share KPN increased the Offer price to $2.25 on October 5, 2009 Tender Conditions Among other things, the Offer is conditioned upon: a non-waivable condition that a majority of the minority (excluding KPN and the directors and officers of iBasis) tender their shares, a waivable condition that enough shares will be tendered so that KPN will own at least 90% of the outstanding shares, a waivable condition that iBasis’ poison pill is either declared null and void by a court or redeemed or rescinded by the iBasis Board, and a waivable condition that the Delaware action is dismissed or settled Financing There is no financing condition to the Offer Key Transaction Considerations If KPN owns at least 90% of the outstanding shares following consummation of the Offer, KPN will cause iBasis to enter into a merger in which all outstanding shares not owned by KPN will be converted into the right to receive $2.25 in cash The Offer will expire on October 23, 2009 unless extended 2 |
| Transaction Overview Implied Transaction Metrics And Relative Multiple Summary ($ Thousands, except per share values) (1) Represents undisturbed price prior to KPN press release dated July 13, 2009, outlining the purchase proposal. (2) Diluted shares outstanding calculated using treasury method, based on 71.2M shares of common stock, 432.5k warrants at a weighted average exercise price of $6.72 as of 9/30/09 and 5.4M stock options at a weighted average exercise price of $3.49 as of 9/30/09, as provided by iBasis management. Assumes all warrants and options vest upon change of control. (3) As of 9/30/09, the Company had $57.6M in cash and $19.9M in debt, yielding a balance sheet adjustment of $37.7M, per iBasis management. (4) iBasis historical and projected figures sourced from publicly available data and iBasis management. All figures adjusted to exclude amortization of intangibles, stock-based compensation, and one-time expenses when available. (5) Valuation information calculated using the closing price on 10/12/09. (6) Valuation information calculated using the closing price on 7/10/09. (7) LTM refers to the Last Twelve Months ending 6/30/09, except IDT which refers to the period ending 4/30/09; and BSE:500483, referring to 3/31/09. LTM iBasis financials refer to the period ending 6/30/09; except for cash, debt and shares outstanding (9/30/09). 3 Current Market Data Transaction Metrics Median Telecommunications Public Seller Premium Median Completed Minority Squeeze-Out Premium Proposal Price Per Share: $2.25 Closing Price as of 10/12/2009: $2.30 Premium to Closing Price as of 10/12/2009: (2.2%) Undisturbed Closing Price (7/10/09) (1) : 1.30 Premium to Undisturbed Closing Price (7/10/09) (1) : 73.1% 23.3% 33.4% 20 Trading Days Prior to Undisturbed Closing Price (6/12/09) (1) : 1.43 Premium to 20-Day Prior to Undisturbed Closing Price (6/12/09) (1) : 57.3% 27.9% 29.3% Current Closing Price Undisturbed Closing Price (1) Diluted Shares Outstanding (2) 72,157 71,617 Diluted Shares Outstanding (2) 72,135 Equity Market Value $165,962 $93,102 Equity Market Value $162,303 Plus: Total Debt (3) 19,856 19,856 Plus: Total Debt (3) 19,856 Less: Cash (3) ($57,564) ($57,564) Less: Cash (3) ($57,564) Total Enterprise Value $128,254 $55,394 Total Enterprise Value $124,595 Current Market Multiples Applicable Figures (4) Implied Multiple (5) Undisturbed Implied Multiple (6) Implied Transaction Multiples Implied Transaction Multiples Median Comparable Companies (5) Median Comparable Transactions Total Enterprise Value / LTM Revenue (7) $1,134,631 0.1x 0.0x Total Enterprise Value / LTM Revenue (7) 0.1x 1.0x 0.5x Total Enterprise Value / 12/31/09P Revenue 1,034,625 0.1x 0.1x Total Enterprise Value / 12/31/09P Revenue 0.1x 1.1x NA Total Enterprise Value / 12/31/10P Revenue 1,219,926 0.1x 0.0x Total Enterprise Value / 12/31/10P Revenue 0.1x 1.0x NA Total Enterprise Value / LTM Gross Profit (7) $126,216 1.0x 0.4x Total Enterprise Value / LTM Gross Profit (7) 1.0x 1.8x 2.4x Total Enterprise Value / 12/31/09P Gross Profit 129,187 1.0x 0.4x Total Enterprise Value / 12/31/09P Gross Profit 1.0x 2.5x NA Total Enterprise Value / 12/31/10P Gross Profit 151,615 0.8x 0.4x Total Enterprise Value / 12/31/10P Gross Profit 0.8x 2.4x NA Total Enterprise Value / LTM EBITDA (7) $38,671 3.3x 1.4x Total Enterprise Value / LTM EBITDA (7) 3.2x 6.9x 6.8x Total Enterprise Value / 12/31/09P EBITDA 43,790 2.9x 1.3x Total Enterprise Value / 12/31/09P EBITDA 2.8x 6.4x NA Total Enterprise Value / 12/31/10P EBITDA 55,652 2.3x 1.0x Total Enterprise Value / 12/31/10P EBITDA 2.2x 5.7x NA |
| Company Overview 4 |
| iBasis Historical And Projected Financial Income Statement Consolidated Income Statement: FY ending December 31, 2007A-2014E(1) ($ Millions) (1) iBasis historical and projected figures provided by iBasis management. (2) Trading includes Connectivity revenue and gross profit. (3) One-Time Adjustments include, but are not limited to option analysis expense, retroactive regulatory fees and KPN transaction related fees. (4) Excludes TDC acquisition in 2008. 5 FYE FYE LTM Fiscal Year Ended December 31, 2007 PF 2008A 6/30/2009 2009E 2010E 2011E 2012E 2013E 2014E Revenues Trading (2) 1,082.8 $ 985.0 $ 808.3 $ 709.5 $ 749.9 $ 785.9 $ 823.3 $ 862.1 $ 902.5 $ Retail 110.5 96.6 100.2 86.6 84.2 85.4 86.6 87.9 89.2 Existing Outsourcing 197.3 242.0 226.1 219.8 243.4 251.1 259.1 267.4 276.0 New Outsourcing - - - 18.8 142.4 265.7 371.1 460.4 535.3 Total Revenue 1,390.6 $ 1,323.6 $ 1,134.6 $ 1,034.6 $ 1,219.9 $ 1,388.1 $ 1,540.1 $ 1,677.8 $ 1,803.0 $ % Growth 7.2% (4.8%) (19.2%) (21.8%) 17.9% 13.8% 10.9% 8.9% 7.5% Gross Profit Trading (2) 80.6 $ 74.6 $ 82.1 $ 93.1 $ 105.0 $ 118.4 $ 133.4 $ 150.4 $ % Margin 8.2% 9.2% 11.6% 12.4% 13.4% 14.4% 15.5% 16.7% Retail 12.8 13.6 13.7 13.6 13.8 14.0 14.2 14.4 % Margin 13.3% 13.6% 15.9% 16.2% 16.2% 16.2% 16.2% 16.2% Existing Outsourcing 42.9 38.0 31.5 29.8 28.8 29.6 30.4 31.3 % Margin 17.7% 16.8% 14.3% 12.3% 11.5% 11.4% 11.4% 11.3% New Outsourcing - - 1.9 15.0 30.0 45.0 60.0 75.0 % Margin NM NM 10.0% 10.5% 11.3% 12.1% 13.0% 14.0% Gross Profit 142.4 $ 136.3 $ 126.2 $ 129.2 $ 151.6 $ 177.6 $ 207.0 $ 238.1 $ 271.1 $ % Margin 10.2% 10.3% 11.1% 12.5% 12.4% 12.8% 13.4% 14.2% 15.0% Total Operating Expenses 101.3 98.2 90.2 87.5 98.1 108.6 118.9 130.0 141.1 EBITDA 41.1 38.1 36.0 41.7 53.5 69.0 88.1 108.0 130.0 One-Time Adjustments (3) 8.6 1.7 0.3 (0.3) - - - - - Stock-Based Compensation 2.6 2.5 2.5 2.4 2.2 2.5 2.5 3.5 4.9 Adjusted EBITDA 52.3 $ 42.3 $ 38.7 $ 43.8 $ 55.7 $ 71.4 $ 90.6 $ 111.6 $ 134.9 $ % Margin 3.8% 3.2% 3.4% 4.2% 4.6% 5.1% 5.9% 6.6% 7.5% Operating Cash Flow 33.0 $ 37.7 $ 33.1 $ 56.9 $ 71.3 $ 88.8 $ 107.7 $ 129.4 $ Capex (4) 16.0 11.8 12.0 18.3 20.8 23.1 25.2 27.0 Free Cash Flow 17.0 $ 26.0 $ 21.1 $ 38.6 $ 50.5 $ 65.7 $ 82.5 $ 102.4 $ % Margin 1.3% 2.3% 2.0% 3.2% 3.6% 4.3% 4.9% 5.7% |
| Projected Segment Revenue And Gross Profit(1) Revenue (2009E – 2014E) Gross Profit (2009E – 2014E) ($Millions) 5-Year CAGR Retail: 0.6% Outsourcing: 27.7% Trading: 4.9% Retail: 1.0% 5-Year CAGR Outsourcing: 26.1% Trading: 12.9% (1) Projected financials provided by iBasis management. Total: 11.8% Total: 16.0% 6 |
| iBasis Quarterly Performance Consolidated Income Statement: FY 2009E(1) ($ Millions) (1) iBasis historical and projected figures provided by iBasis management. (2) 2009E financials less year to date performance. (3) Trading includes Connectivity revenue and gross profit. (4) One-Time Adjustments include, but are not limited to option analysis expense, retroactive regulatory fees and KPN transaction related fees. 7 Fiscal Year Ended December 31, Q1A Q2A Q3 Prelim. YTD 2009E Q4 Remaining (2) Q4 Budget Revenues Trading (3) 184.1 $ 166.7 $ 176.5 $ 527.3 $ 709.5 $ 182.2 $ 181.3 $ Retail 24.2 20.9 18.1 63.3 86.6 23.3 20.9 Existing Outsourcing 47.2 53.7 57.3 158.1 219.8 61.7 59.7 New Outsourcing - - - - 18.8 18.8 18.8 Total Revenue 255.5 $ 241.3 $ 251.8 $ 748.6 $ 1,034.6 $ 286.0 $ 281.3 $ Gross Profit Trading (4) 20.0 $ 19.7 $ 21.7 $ 61.4 $ 82.1 $ 20.7 $ 21.6 $ % Margin 10.9% 11.8% 12.3% 11.6% 11.6% 11.3% 11.9% Retail 3.6 3.4 3.2 10.2 13.7 3.5 3.4 % Margin 14.9% 16.3% 17.8% 16.2% 15.9% 15.0% 16.3% Existing Outsourcing 7.4 8.7 8.0 24.1 31.5 7.4 7.9 % Margin 15.7% 16.1% 14.0% 15.2% 14.3% 12.0% 13.2% New Outsourcing - - - - 1.9 1.9 1.9 % Margin NM NM NM NM 10.0% 10.0% 10.0% Gross Profit 31.0 $ 31.8 $ 32.9 $ 95.7 $ 129.2 $ 33.5 $ 34.8 $ % Margin 12.1% 13.2% 13.1% 12.8% 12.5% 11.7% 12.4% Total Operating Expenses 22.2 21.8 28.2 72.2 87.5 15.3 22.6 EBITDA 8.8 10.0 4.7 23.5 41.7 18.2 12.2 One-Time Adjustments (4) 0.3 0.0 7.4 7.7 (0.3) (8.0) - Stock-Based Compensation 0.6 0.6 0.6 1.8 2.4 0.6 0.6 Adjusted EBITDA 9.7 $ 10.7 $ 12.7 $ 33.1 $ 43.8 $ 10.8 $ 12.8 $ % Margin 3.8% 4.4% 5.0% 4.4% 4.2% 3.8% 4.5% Operating Cash Flow 4.9 $ 15.2 $ 1.6 $ 21.8 $ 33.1 $ 11.4 $ 15.9 $ Capex 1.6 1.2 2.1 4.9 12.0 7.1 4.6 Free Cash Flow 3.3 $ 14.0 $ (0.5) $ 16.8 $ 21.1 $ 4.3 $ 11.4 $ % Margin 1.3% 5.8% (0.2%) 2.2% 2.0% 1.5% 4.0% |
| iBasis Historical Stock Performance Historical Daily Share Price and Volume Performance from July 10, 2008 to October 12, 2009 Average Share Price (7/10/08 – 7/10/09): $1.85(3) Revised KPN Offer Price: $2.25 Recent Trading Activity Source: Capital IQ (1) Undisturbed price prior to KPN press release as of July 13, 2009, outlining the purchase proposal. (2) High and low stock prices represent closing day high and low share prices. (3) Averages and high / low represent respective periods prior to 7/10/09. Proposal: $2.25 Current: $2.30 8 % Premium % Premium Share price as of 7/10/2009 (1) : $1.30 73.1% 20-Day Average Price (3) : $1.26 78.6% Share price as of 10/12/2009: $2.30 (2.2%) 90-Day Average Price (3) : $1.16 94.0% 1-Year High (8/12/2008) (2)(3) : $4.32 (47.9%) 180-Day Average Price (3) : $1.02 120.6% 1-Year Low (3/3/2009) (2)(3) : $0.54 316.7% 1-Year Average Price (3) : $1.85 21.9% |
| iBasis Stock Performance Since July 10, 2008 10/21/08: Reported Q3 2008 Financial Results 8/20/08: Announced Completion of $15 Million Stock Repurchase Program 7/22/08: Reported Q2 2008 Financial Results 1/26/09: Reported Q4 and FYE 2008 Financial Results 11/3/08: Unveils Expanded Portfolio Of Voice Products To Address Needs of All Segments of International Voice Industry 7/13/09: KPN announces intent to purchase remaining interest in iBasis for $1.55 per share Historical Daily Share Price and Volume Performance From July 10, 2008 to October 12, 2009 4/27/09: Reported Q1 2009 Financial Results 7/22/09: Reported Q2 2009 Financial Results 12/15/08: Announced that BITE Group selected iBasis to carry its international mobile voice traffic from Latvia and Lithuania 2/9/09: Announced that Corporación Nacional de Telecomunicaciones connected to the iBasis Network for both termination and origination of international calls 7/28/09: KPN commences offer to purchase the remaining interest in iBasis for $1.55 per share Source: Capital IQ. 10/05/09: KPN announces a revised offer to purchase remaining interest in iBasis for $2.25 per share 9 Share Price Volume in Thousands |
| Historical Daily Share Price and Volume Performance From July 10, 2004 to October 12, 2009 Revised Offer Price of $2.25 iBasis Stock Performance Since July 10, 2004 Source: Capital IQ. 10 % Premium 1 - Year Average (7/10/08-7/10/09) $1.85 21.9% 3 - Year Average (7/10/06-7/10/09) $5.65 (60.2%) 5 - Year Average (7/10/04-7/10/09) $6.18 (63.6%) Share Price Volume in Thousands |
| Index of Public Company Comparables, iBasis And NASDAQ Composite July 10, 2008 – October 12, 2009 Relative Trading Performance Source: Capital IQ. (1) iBasis peer index is comprised of iBasis public comparables which include 8x8 Inc., Arbinet Corporation, Citic 1616 Holdings Ltd., COLT Telecom Group SA, Global Crossing Ltd., IDT Corporation, Neutral Tandem, Inc., Rostelecom OAO, Tata Communications, Ltd. and Vonage Holdings Corporation, weighted by market cap. Index Performance (1) NASDAQ (5.3%) iBasis (25.8%) Peer Index(1) (32.5%) Peer Index(1) iBasis NASDAQ 3.2% 21.7% 8.3% July 28, 2009 – October 12, 2009 11 |
| Company One Year Trading Volume Analysis (1) Volume At Price Analysis July 10,2008 to July 10, 2009 1- Year VWAP = $2.04 52 Week High = $4.32 52 Week Low = $0.54 Average Daily Volume: 87,359 Source: Capital IQ. (1) Represents daily closing stock prices. Trading Range Cumulative VAP Revised KPN Proposal ($2.25) 12 0.0% 18.5% 27.1% 17.6% 8.3% 0.8% 6.8% 16.6% 4.3% 18.5% 45.6% 63.3% 71.6% 72.4% 79.1% 95.7% 100.0% 0.0% 10.0% 20.0% 30.0% 40.0% 50.0% 60.0% 70.0% 80.0% 90.0% 100.0% 0.0% 5.0% 10.0% 15.0% 20.0% 25.0% 30.0% $0.00 - $0.50 $0.50 - $1.00 $1.00 - $1.50 $1.50 - $2.00 $2.00 - $2.50 $2.50 - $3.00 $3.00 - $3.50 $3.50 - $4.00 $4.00 - $4.50 Cumulative Volume at Price (%) Volume at Price (%) |
| Valuation Analysis 13 |
| iBasis Valuation Analysis Jefferies’ approach to valuing the Company utilizes several methodologies, including: Public Company Comparables Analysis, a method of valuing an entity relative to publicly-traded companies with similar products or services, similar operating or financial characteristics, or similar customers or markets Jefferies reviewed ten public company comparables in the diversified carrier segment with revenue less than $3 billion Transaction Comparables Analysis, a method of valuing an entity relative to merger and acquisition (“M&A”) transactions involving companies having similar products or services, similar operating or financial characteristics, or similar customers or markets. Jefferies notes that KPN presently owns approximately 56.3% of iBasis’ outstanding shares Jefferies reviewed five telecommunications transactions in the diversified carrier segment announced since January 1, 2005 Premiums Paid Analysis, a method of valuing an entity by analyzing the premiums paid in selected M&A transactions with public sellers. Jefferies notes that KPN presently owns approximately 56.3% of iBasis’ outstanding shares Jefferies reviewed two sets of premiums Selected North American Telecommunication transactions with equity consideration between $25 million and $1 billion. Selected transactions since January 1, 2007, where an existing majority shareholder purchased the remaining interest Discounted Cash Flow Analysis, a method of valuing an entity relative to the present value of future cash flows subject to the Company’s Weighted Average Cost of Capital (“WACC”) A sensitivity table displays implied per share values based on a range of terminal growth rates and discount rates Jefferies did not attribute any particular weight to any analysis, methodology or factor considered by it, but rather made qualitative judgments as to the significance and relevance of each analysis and factor; accordingly, Jefferies’ analyses must be considered as a whole. Considering any portion of the analyses or the factors considered, without considering all analyses and factors, could create a misleading or incomplete view of the process underlying the conclusions expressedherein. 14 |
| Valuation Summary 0.2x – 0.6x LTM Revenue of $1,134.6 million Range of Premiums Applied to 1 Trading Day Price of $1.30 0.2x – 0.6x 12/31/09P Revenue of $1,034.6 million 0.2x – 0.6x 12/31/10P Revenue of $1,219.9 million Comparable Company Analysis Range of Premiums Applied to 20 Trading Day Price of $1.43 Implied iBasis Equity Price Per Share Methodology Relevant Multiples / iBasis Metrics (2)(3)(4) Based on Multiple of Revenue (1) Based on Multiple of Gross Profit (1) Based on Multiple of EBITDA (1) Comparable Transaction Analysis Based on Adjusted Price / Revenue Multiple (1) Premium to 20 Trading Days Prior to Announcement Premium to 1 Trading Day Prior to Announcement Telecommunications Premiums Analysis 3.5x – 7.0x LTM EBITDA of $38.7 million 2.5x – 5.5x 12/31/10P EBITDA of $55.7 million 3.0x – 6.5x 12/31/09P EBITDA of $43.8 million Implied Enterprise Value ($MM) $106.6 $395.1 Based on Adjusted Price / EBITDA Multiple (1) 17% – 20% Discount Rate with a Terminal Growth Rate of 2.0% – 4.0% 0.3x – 0.6x LTM Revenue of $1,134.6 million 1.5x – 3.0x LTM Gross Profit of $126.2 million (1) Implied equity price based on implied enterprise value at identified multiples, subject to net debt adjustment. Implied equity price per share determined by dividing the implied equity market capitalization by fully diluted shares outstanding at that price. As of 9/30/09, the Company had $57.6M in cash and $19.9M in debt, yielding a balance sheet adjustment of $37.7M, per iBasis management. (2) Valuation information calculated using the closing price on 10/12/09. Projected financials calculated from selected analyst reports and calendarized to 12/31/09 and 12/31/10. All figures adjusted to exclude discontinued operations, amortization of intangibles, stock-based compensation, and one-time expenses, when available. (3) LTM refers to the Last Twelve Months ending 6/30/09, except IDT which refers to the period ending 4/30/09; and BSE:500483, referring to 3/31/09. LTM iBasis financials refer to the period ending 6/30/09; except for cash, debt and shares outstanding (9/30/09). (4) iBasis historical and projected figures provided by iBasis management. Based on Expected FCF & Standalone Discount Rate (1) Discounted Cash Flow Valuation $250.8 $539.4 $683.6 $972.2 Minority Squeeze-Out Premium Analysis Premium to 20 Trading Days Prior to Announcement Premium to 1 Trading Day Prior to Announcement Based on Adjusted Price / Gross Profit Multiple (1) Range of Premiums Applied to 1 Trading Day Price of $1.30 Range of Premiums Applied to 20 Trading Day Price of $1.43 6.0x – 7.0x LTM EBITDA of $38.7 million 0.7x – 3.7x LTM Gross Profit of $126.2 million 0.7x – 2.7x 12/31/10P Gross Profit of $151.6 million 0.7x – 3.2x 12/31/09P Gross Profit of $129.2 million Based on Expected FCF & Comparable Discount Rate(1) 11% – 14% Discount Rate with a Terminal Growth Rate of 2.0% – 4.0% Consideration per share: $2.25 25th% 75th% Median $14.00 $13.91 15 |
| Comparable Company Analysis – Operating Metrics ($ Thousands) Selected Diversified Carrier Comparables With Revenue Below $3 Billion (1) Valuation information calculated using the closing price on 10/12/09. Projected financials calculated from selected analyst reports and calendarized to 12/31/09 and 12/31/10. All figures adjusted to exclude discontinued operations, amortization of intangibles, stock-based compensation, and one-time expenses, when available. (2) LTM refers to the Last Twelve Months ending 6/30/09, except IDT which refers to the period ending 4/30/09; and BSE:500483, referring to 3/31/09. LTM iBasis financials refer to the period ending 6/30/09; except for cash, debt and shares outstanding (9/30/09). (3) BSE:500483 historic financials converted from INR to USD using an average of the daily Interbank rates over the applicable period; balance sheet data converted using the 3/31/09 daily Interbank rate of 0.01917:1; projected financials and market data converted using the 10/12/09 daily Interbank rate of 0.02127:1. (4) RTS:RTKM historic financials converted from RUB to USD using an average of the daily Interbank rates over the applicable period; balance sheet data converted using the 6/30/09 daily Interbank rate of 0.03195:1; projected financials and market data converted using the 10/12/09 daily Interbank rate of 0.03375:1. All figures are proforma the acquisition of RTComm.RU. (5) SEHK:1883 historic financials converted from HKD to USD using an average of the daily Interbank rates over the applicable period; balance sheet data converted using the 6/30/09 daily Interbank rate of 0.12903:1; projected financials converted using the 10/12/09 daily Interbank rate of 0.12901:1. All figures are proforma the acquisition of China Motion Netcom Limited and CPCNet. (6) LSE:COLT historic financials converted from EUR to USD using an average of the daily Interbank rates over the applicable period; balance sheet data converted using the 6/30/09 daily Interbank rate of 1.40469:1; projected financials and market data converted using the 10/12/09 daily Interbank rate of 1.47248:1. (7) iBasis historical and projected figures provided by iBasis management. 16 LTM (2) Projected 12/31/2009 Projected 12/31/2010 Revenue Revenue Growth Gross Margin EBITDA Margin Revenue Revenue Growth Gross Margin EBITDA Margin Revenue Revenue Growth Gross Margin EBITDA Margin 8x8, Inc. [EGHT] $63,951 1.2% 64.6% 1.7% $63,815 (2.2%) 64.0% 2.1% $73,964 15.9% 66.7% 10.1% Tata Communications Ltd. [BSE:500483] (3) 2,160,824 20.1% 34.5% 13.5% 2,383,294 17.4% NA 15.5% 2,808,103 17.8% NA 18.3% Arbinet Corporation [ARBX] 378,182 (27.1%) 5.6% 0.8% NA NA NA NA NA NA NA NA Neutral Tandem, Inc. [TNDM] 145,582 42.4% 55.9% 48.3% 169,700 40.4% 57.0% 48.9% 200,500 18.1% 58.9% 51.0% Rostelecom OAO [RTS:RTKM] (4) 2,305,880 (0.2%) NA 17.2% 2,326,556 0.1% 52.0% 20.4% 2,384,134 2.5% 56.0% 21.4% Global Crossing Ltd. [GLBC] 2,548,000 2.1% 31.2% 14.3% 2,533,090 (2.3%) 31.5% 15.3% 2,695,979 6.4% 32.5% 16.3% Citic 1616 Holdings Ltd. [SEHK:1883] (5) 375,036 5.1% 32.4% 20.0% 378,138 0.5% 31.9% 19.4% 438,273 15.9% 32.1% 19.6% Vonage Holdings Corporation [VG] 892,012 1.5% 67.3% 9.8% 885,000 (1.7%) NA 10.5% 891,000 0.7% NA 10.7% COLT Telecom Group SA [LSE:COLT] (6) 2,288,319 (0.3%) 40.8% 19.8% 2,464,048 (0.1%) 40.2% 19.3% 2,487,755 1.0% 41.2% 19.9% IDT Corporation [IDT] 1,773,274 (4.5%) 23.6% 2.3% 1,805,290 0.3% 19.4% (1.0%) NA NA NA NA Mean 1,293,106 4.0% 39.5% 14.8% 1,445,437 5.8% 42.3% 16.7% 1,497,463 9.8% 47.9% 20.9% High 2,548,000 42.4% 67.3% 48.3% 2,533,090 40.4% 64.0% 48.9% 2,808,103 18.1% 66.7% 51.0% 75th Percentile 2,256,446 4.3% 55.9% 19.2% 2,383,294 0.5% 54.5% 19.4% 2,539,811 16.4% 58.1% 20.3% Median $1,332,643 1.4% 34.5% 13.9% $1,805,290 0.1% 40.2% 15.5% $1,637,567 11.2% 48.6% 18.9% 25th Percentile 375,822 (0.3%) 31.2% 4.2% 378,138 (1.7%) 31.7% 10.5% 378,830 2.1% 34.6% 14.9% Low 63,951 (27.1%) 5.6% 0.8% 63,815 (2.3%) 19.4% (1.0%) 73,964 0.7% 32.1% 10.1% IBASIS, INC. (7) $1,134,631 (19.2%) 11.1% 3.4% $1,034,625 (21.8%) 12.5% 4.2% $1,219,926 17.9% 12.4% 4.6% Company (1) |
| Comparable Company Analysis – Trading Metrics (1) Valuation information calculated using the closing price on 10/12/09. Projected financials calculated from selected analyst reports and calendarized to 12/31/09 and 12/31/10. All figures adjusted to exclude discontinued operations, amortization of intangibles, stock-based compensation, and one-time expenses, when available. (2) LTM refers to the Last Twelve Months ending 6/30/09, except IDT which refers to the period ending 4/30/09; and BSE:500483, referring to 3/31/09. LTM iBasis financials refer to the period ending 6/30/09; except for cash, debt and shares outstanding (9/30/09). (3) Total Enterprise Value (TEV) is defined as Equity Market Capitalization (EMC) plus total debt less cash and cash equivalents. (4) BSE:500483 historic financials converted from INR to USD using an average of the daily Interbank rates over the applicable period; balance sheet data converted using the 3/31/09 daily Interbank rate of 0.01917:1; projected financials and market data converted using the 10/12/09 daily Interbank rate of 0.02127:1. (5) RTS:RTKM historic financials converted from RUB to USD using an average of the daily Interbank rates over the applicable period; balance sheet data converted using the 6/30/09 daily Interbank rate of 0.03195:1; projected financials and market data converted using the 10/12/09 daily Interbank rate of 0.03375:1. All figures are proforma the acquisition of RTComm.RU. (6) SEHK:1883 historic financials converted from HKD to USD using an average of the daily Interbank rates over the applicable period; balance sheet data converted using the 6/30/09 daily Interbank rate of 0.12903:1; projected financials converted using the 10/12/09 daily Interbank rate of 0.12901:1. All figures are proforma the acquisition of China Motion Netcom Limited and CPCNet. (7) LSE:COLT historic financials converted from EUR to USD using an average of the daily Interbank rates over the applicable period; balance sheet data converted using the 6/30/09 daily Interbank rate of 1.40469:1; projected financials and market data converted using the 10/12/09 daily Interbank rate of 1.47248:1. (8) iBasis historical and projected figures provided by iBasis management. ($ Thousands) Selected Diversified Carrier Comparables With Revenue Below $3 Billion 17 TEV / Rev Multiples (3) TEV / Gross Margin Multiples (3) TEV / EBITDA Multiples (3) Company (1) Net Cash Equity Market Cap LTM (2) Projected 12/31/09 Projected 12/31/10 LTM (2) Projected 12/31/09 Projected 12/31/10 LTM (2) Projected 12/31/09 Projected 12/31/10 8x8, Inc. [EGHT] $15,409 $86,864 1.1x 1.1x 1.0x 1.7x 1.7x 1.4x 65.3x 52.7x 9.5x Tata Communications Ltd. [BSE:500483] (4) (1,118,953) 2,976,417 1.9x 1.7x 1.5x 5.5x NA NA 14.0x 11.1x 8.0x Arbinet Corporation [ARBX] 18,076 55,402 0.1x NA NA 1.8x NA NA 11.7x NA NA Neutral Tandem, Inc. [TNDM] 141,145 745,337 4.2x 3.6x 3.0x 7.4x 6.2x 5.1x 8.6x 7.3x 5.9x Rostelecom OAO [RTS:RTKM] (5) 551,727 3,569,501 1.3x 1.3x 1.3x NA 2.5x 2.3x 7.6x 6.4x 5.9x Global Crossing Ltd. [GLBC] (1,317,400) 942,338 0.9x 0.9x 0.8x 2.8x 2.8x 2.6x 6.2x 5.8x 5.1x Citic 1616 Holdings Ltd. [SEHK:1883] (6) 108,570 577,660 1.3x 1.2x 1.1x 3.9x 3.9x 3.3x 6.2x 6.4x 5.5x Vonage Holdings Corporation [VG] (168,691) 278,219 0.5x 0.5x 0.5x 0.7x NA NA 5.1x 4.8x 4.7x COLT Telecom Group SA [LSE:COLT] (7) 341,481 1,614,595 0.6x 0.5x 0.5x 1.4x 1.3x 1.2x 2.8x 2.7x 2.6x IDT Corporation [IDT] 29,567 81,016 0.0x 0.0x NA 0.1x 0.1x NA 1.3x NM NA Mean (139,907) 1,092,735 1.2x 1.2x 1.2x 2.8x 2.7x 2.7x 12.9x 12.1x 5.9x High 551,727 3,569,501 4.2x 3.6x 3.0x 7.4x 6.2x 5.1x 65.3x 52.7x 9.5x 75th Percentile 133,001 1,446,531 1.3x 1.3x 1.3x 3.9x 3.4x 3.1x 10.9x 8.2x 6.4x Median $23,822 $661,498 1.0x 1.1x 1.0x 1.8x 2.5x 2.4x 6.9x 6.4x 5.7x 25th Percentile (122,666) 134,702 0.5x 0.5x 0.8x 1.4x 1.5x 1.7x 5.4x 5.6x 5.0x Low (1,317,400) 55,402 0.0x 0.0x 0.5x 0.1x 0.1x 1.2x 1.3x 2.7x 2.6x Metrics at $2.30 Current Price Per Share: IBASIS, INC. (8) $37,708 $165,962 0.1x 0.1x 0.1x 1.0x 1.0x 0.8x 3.3x 2.9x 2.3x Metrics at $2.25 Implied Consideration Per Share: IBASIS, INC. (8) $37,708 $162,303 0.1x 0.1x 0.1x 1.0x 1.0x 0.8x 3.2x 2.8x 2.2x |
| Operating Metrics Of Comparable Companies 2009 Projected Revenue Growth (1) 2010 Projected Revenue Growth (1) LTM EBITDA Margin (2) IDT 0.3% Tata 18.2% VG (1.7%) TNDM 40.4% GLBC (2.3%) Citic 0.5% EGHT (2.2%) LSE:COLT (0.1%) (1) Projected financials calculated from selected analyst reports and calendarized to 12/31/09 and 12/31/10. All figures adjusted to exclude discontinued operations, amortization of intangibles, stock-based compensation, and one-time expenses, when available. (2) LTM refers to the Last Twelve Months ending 6/30/09, except IDT which refers to the period ending 4/30/09; and BSE:500483, referring to 3/31/09. LTM iBasis financials refer to the period ending 6/30/09; except for cash, debt and shares outstanding (9/30/09). All figures adjusted to exclude discontinued operations, amortization of intangibles, stock-based compensation, and one-time expenses, when available. ARBX NA Citic 15.9% Tata 17.0% EGHT 15.9% iBasis 17.9% VG 0.7% GLBC 6.4% RTS:RTKM 2.5% TNDM 18.1% IDT NA LSE:COLT 19.8% Citic 20.0% TNDM 48.3% EGHT 1.7% VG 9.8% IDT 2.3% GLBC 14.3% RTS:RTKM 17.2% ARBX 0.8% LTM Gross Margin (2) LSE:COLT 40.8% EGHT 64.6% VG 67.3% iBasis 11.1% Citic 32.4% GLBC 31.2% Tata 34.5% TNDM 55.9% ARBX 5.6% RTS:RTKM 0.1% iBasis (21.8%) ARBX NA LSE:COLT 1.0% IDT 23.6% RTS:RTKM NA Tata 13.5% iBasis 3.4% 18 |
| Valuation Metrics Of Comparable Companies Calculated on 10/12/2009 Calculated on 7/28/2009 2009 Projected EBITDA Multiple (1)(2) 2009 Projected Gross Profit Multiple (1)(2) 2009 Projected Revenue Multiple (1)(2) 2010 Projected EBITDA Multiple (1)(2) 2010 Projected Gross Profit Multiple (1)(2) 2010 Projected Revenue Multiple (1)(2) (1) Projected financials calculated from selected analyst reports and calendarized to 12/31/09 and 12/31/10. All figures adjusted to exclude discontinued operations, amortization of intangibles, stock-based compensation, and one-time expenses, when available. (2) Comparable companies excluded if metrics are not available. NM refers to not meaningful as EBITDA margin is less than zero. Median: 0.7x Median: 1.1x Median: 4.3x Median: 5.7x Median: 0.8x Median: 1.0x Median: 7.0x Median: 6.4x Median: 1.7x Median: 2.5x Median: 2.1x Median: 2.4x 19 |
| Comparable Transaction Analysis ($ Millions) Selected Diversified Carrier Transactions Announced Since January 1, 2003 (1) Prices paid have been adjusted for cash and debt on the seller's balance sheet at the time of acquisition if known. (2) Excludes stock-based compensation and one-time expenses when available. (3) China Motion Netcom Limited adjusted price converted from HKD to USD using the 8/29/08 daily Interbank rate of 0.12903:1; financials converted using an average of the daily Interbank rates over the last twelve month period ending 3/31/08. 20 Announce Date Buyer Seller Seller Description Adjusted Price (1) Seller Revenue Seller Gross Margin Seller EBITDA Margin (2) Adjusted Price / Revenue Adjusted Price / Gross Profit Adjusted Price / EBITDA (2) 8/29/2008 Citic 1616 Holdings Ltd. China Motion Netcom Limited (3) Provides telecommunication marketing services through marketing and wholesaling international direct dial (IDD) services and calling card services $30.6 $57.0 15.2% 3.8% 0.5x 3.5x 14.1x 1/23/2007 Leucadia National Corp. Telco Group, Inc. Provides wireless telecommunication, prepaid international long distance, dial around long distance, and dial up high speed Internet services 160.0 500.0 NA NA 0.3x NA NA 9/21/2006 Globalive Communications Corp. Yak Communications Inc. Provides a full range of telecommunications services and Voice over Internet Protocol (VoIP) services to small and medium sized businesses 53.3 92.4 40.1% 9.4% 0.6x 1.4x 6.1x 6/28/2005 IDT Corporation Net2Phone Inc. Provides voice over Internet protocol-based telecommunications products and services to consumers, enterprises, and telecommunications providers worldwide 111.0 80.2 40.4% (24.8%) 1.4x 3.4x NM 6/25/2005 Videsh Sanchar Nigam Ltd. Teleglobe International Holdings Ltd. Provides international voice, data, Internet, and mobile roaming services 242.0 1,042.9 16.3% 3.4% 0.2x 1.4x 6.8x Mean 0.6x 2.5x 9.0x High 1.4x 3.5x 14.1x 75th Percentile 0.6x 3.5x 10.4x Median 0.5x 2.4x 6.8x 25th Percentile 0.3x 1.4x 6.4x Low 0.2x 1.4x 6.1x Metrics at $2.25 Implied Consideration Per Share: Royal KPN N.V. iBasis, Inc. $124.6 $1,134.6 11.1% 3.4% 0.1x 1.0x 3.2x |
| Telecommunications: Public Premiums Summary – One Day Prior(1) Selected North American Telecommunications Services Transactions With Equity Consideration Between $25 Million And $1 Billion Announced Since January 1, 2005 $2.25 per share represents a 73.1% premium to iBasis’s undisturbed share price on 7/10/09 (1) Jefferies notes that KPN presently owns approximately 56.3% of iBasis’ outstanding shares. 21 10 12 4 1 0 2 0 2 4 6 8 10 12 14 0% - 20% 20% - 40% 40% - 60% 60 - 80% 80% - 100% Above 100% Number of Transactions Premium Paid To Seller's Share Price One Day Prior to Announcement High 134.4% 75th Percentile 36.7% Median 23.3% 25th Percentile 17.2% Low 0.2% |
| Telecommunications: Public Premiums Summary – Twenty Days Prior(1) Selected North American Telecommunications Services Transactions With Equity Consideration Between $25 Million And $1 Billion Announced Since January 1, 2005 $2.25 per share represents a 57.3% premium to iBasis’s undisturbed share price on 6/12/09 (1) Jefferies notes that KPN presently owns approximately 56.3% of iBasis’ outstanding shares. 22 2 8 11 3 1 2 2 0 2 4 6 8 10 12 Below 0% 0% - 20% 20% - 40% 40% - 60% 60 - 80% 80% - 100% Above 100% Number of Transactions Premium Paid To Seller's Share Price Twenty Days Prior to Announcement High 128.5% 75th Percentile 43.4% Median 27.9% 25th Percentile 14.6% Low (6.4%) 2 Above 100% |
| Minority Squeeze-Out Transactions: Public Premiums Summary – One Day Prior $2.25 per share represents a 73.1% premium to iBasis’s undisturbed share price on 7/10/09 23 3 7 9 2 0 3 4 0 1 2 3 4 5 6 7 8 9 10 Below 0% 0% - 20% 20% - 40% 40% - 60% 60 - 80% 80% - 100% Above 100% Number of Transactions Completed Premium Paid To Seller's Share Price One Day Prior to Announcement High 250.0% 75th Percentile 55.5% Median 33.4% 25th Percentile 12.7% Low (12.8%) |
| Minority Squeeze-Out Transactions: Public Premiums Summary – Twenty Days Prior $2.25 per share represents a 57.3% premium to iBasis’s undisturbed share price on 6/12/09 24 4 5 9 5 1 1 3 0 1 2 3 4 5 6 7 8 9 10 Below 0% 0% - 20% 20% - 40% 40% - 60% 60 - 80% 80% - 100% Above 100% Number of Transactions Completed Premium Paid To Seller's Share Price Twenty Days Prior to Announcement High 400.0% 75th Percentile 54.7% Median 29.3% 25th Percentile 13.8% Low (24.7%) 3 Above 100% |

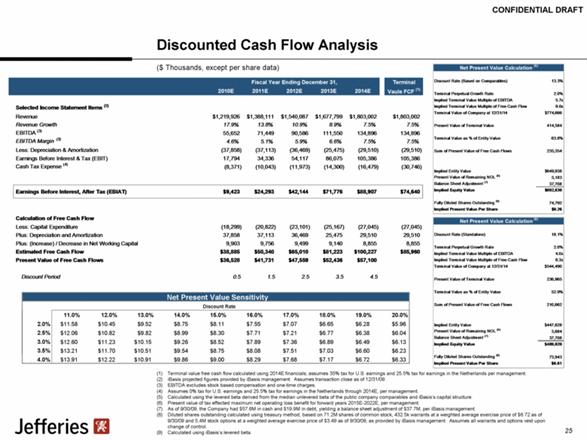
| Discounted Cash Flow Analysis ($ Thousands, except per share data) (1) Terminal value free cash flow calculated using 2014E financials; assumes 35% tax for U.S. earnings and 25.5% tax for earnings in the Netherlands per management. (2) iBasis projected figures provided by iBasis management. Assumes transaction close as of 12/31/09. (3) EBITDA excludes stock based compensation and one-time charges. (4) Assumes 0% tax for U.S. earnings and 25.5% tax for earnings in the Netherlands through 2014E, per management. (5) Calculated using the levered beta derived from the median unlevered beta of the public company comparables and iBasis‘s capital structure. (6) Present value of tax effected maximum net operating loss benefit for forward years 2015E-2022E, per management. (7) As of 9/30/09, the Company had $57.6M in cash and $19.9M in debt, yielding a balance sheet adjustment of $37.7M, per iBasis management. (8) Diluted shares outstanding calculated using treasury method, based on 71.2M shares of common stock, 432.5k warrants at a weighted average exercise price of $6.72 as of 9/30/09 and 5.4M stock options at a weighted average exercise price of $3.49 as of 9/30/09, as provided by iBasis management. Assumes all warrants and options vest upon change of control. (9) Calculated using iBasis’s levered beta. 25 Discount Rate (Based on Comparables) 13.3% Terminal Perpetual Growth Rate 2.0% Implied Terminal Value Multiple of EBITDA 5.7x Implied Terminal Value Multiple of Free Cash Flow 9.0x Terminal Value of Company at 12/31/14 $774,666 Present Value of Terminal Value 414,584 Terminal Value as % of Entity Value 63.8% Sum of Present Value of Free Cash Flows 235,354 Implied Entity Value $649,938 Present Value of Remaining NOL (6) 5,183 Balance Sheet Adjustment (7) 37,708 Implied Equity Value $692,830 Fully Diluted Shares Outstanding (8) 74,792 Implied Present Value Per Share $9.26 Net Present Value Calculation (5) Fiscal Year Ending December 31, Terminal 2010E 2011E 2012E 2013E 2014E Vaule FCF (1) Selected Income Statement Items (2) Revenue $1,219,926 $1,388,111 $1,540,087 $1,677,799 $1,803,002 $1,803,002 Revenue Growth 17.9% 13.8% 10.9% 8.9% 7.5% 7.5% EBITDA (3) 55,652 71,449 90,586 111,550 134,896 134,896 EBITDA Margin (3) 4.6% 5.1% 5.9% 6.6% 7.5% 7.5% Less: Depreciation & Amortization (37,858) (37,113) (36,469) (25,475) (29,510) (29,510) Earnings Before Interest & Tax (EBIT) 17,794 34,336 54,117 86,075 105,386 105,386 Cash Tax Expense (4) (8,371) (10,043) (11,973) (14,300) (16,479) (30,746) Earnings Before Interest, After Tax (EBIAT) $9,423 $24,293 $42,144 $71,776 $88,907 $74,640 Calculation of Free Cash Flow Less: Capital Expenditure (18,299) (20,822) (23,101) (25,167) (27,045) (27,045) Plus: Depreciation and Amortization 37,858 37,113 36,469 25,475 29,510 29,510 Plus: (Increase) / Decrease in Net Working Capital 9,903 9,756 9,499 9,140 8,855 8,855 Estimated Free Cash Flow $38,885 $50,340 $65,010 $81,223 $100,227 $85,960 Present Value of Free Cash Flows $36,528 $41,731 $47,559 $52,436 $57,100 Discount Period 0.5 1.5 2.5 3.5 4.5 Terminal Growth Rate Discount Rate (Standalone) 18.1% Terminal Perpetual Growth Rate 2.0% Implied Terminal Value Multiple of EBITDA 4.0x Implied Terminal Value Multiple of Free Cash Flow 6.3x Terminal Value of Company at 12/31/14 $544,490 Present Value of Terminal Value 236,965 Terminal Value as % of Entity Value 52.9% Sum of Present Value of Free Cash Flows 210,662 Implied Entity Value $447,628 Present Value of Remaining NOL (6) 3,684 Balance Sheet Adjustment (7) 37,708 Implied Equity Value $489,020 Fully Diluted Shares Outstanding (8) 73,943 Implied Present Value Per Share $6.61 Net Present Value Calculation (9) |
| Appendix 26 |
| Comparable Public Company Descriptions 27 Company Name Description Citic 1616 Holdings Ltd CITIC 1616 Holdings Limited, an investment holding company, provides connectivity and value-added services to telecom operators worldwide. It provides telecom services, including voice services, mobile SMS, virtual network operations and data services, and telecom solutions; and other value added services, such as signaling transit, prepaid roaming, and VAS applications to telecom carriers, mobile operators, and Internet service providers. The company’s voice services handle fixed line-to-fixed line, and fixed line-to-mobile international calls for fixed line and hybrid telecoms operators; mobile roaming calls and data activities for hybrid telecoms operators; and in -bound and out-bound voice traffic for the telecoms operators. Its mobile SMS services include mobile international SMS hubbing services. The company was founded in 1999 and is headquartered in Central, Hong Kong. CITIC 1616 Holdings Limited is a subsidiary of CITIC Pacific Limited. 8x8 Inc. 8x8, Inc. engages in the development, marketing, and sale of telecommunication services and technology for Internet Protocol (IP), telephony, and video applications in the United States and internationally. It provides 8x8 voice and video broadband phone services that enable broadband Internet users to add digital voice and video communications services to their high-speed Internet connections. The company also offers 8x8 Virtual Office business telephone services, which enable users to be part of a virtual PBX that includes automated attendants to assist callers, conference bridges, extension-to-extension dialing, etc. In addition, it provides 8x8 Trunking services that provide dial tone together with local, long distance, and international call routing services to that equipment from its network. 8x8 MobileTalk enables mobile phone users to make international calls from their mobile phones over the 8x8 international network. 8x8, Inc. sells its 8x8 services to end users through direct sales force, Web site, retail channels, online channels, network marketing firms, and third-party resellers. 8x8, Inc. was founded in 1987 and is headquartered in Santa Clara, California. Arbinet Corporation Arbinet Corporation provides solutions for the telecommunications industry based upon an electronic market for trading, routing, and settling communications capacity. The company offers voice exchange products and services consisting of PrimeVoice that rematches orders and updates a seller’s quality profile including: SelectVoice, DirectAxcess, RapidClear and SoftSwitchAxcess. Its other voice exchange products and services comprise AssuredAxcess, a service that automatically routes a buyer’s call directly to its destination; PrivateExchange, an outsourced solution that allows communications services providers to manage their bilateral commercial agreements; and Global Number Portability Query Services, which enable a carrier to query its systems for information about the carrier currently serving an end customer in order to route and rate the call correctly. It also offers Internet exchange products and services that provide Internet Protocol transit and peering services to the Internet service providers and content sites. Arbinet Corporation was founded in 1996 and is headquartered in New Brunswick, New Jersey. |
| Comparable Public Company Descriptions (cont’d) 28 Company Name Description COLT Telecom Group SA COLT Telecom Group S.A. provides business communications solutions and services in Europe and the United States. The company offers data, voice, and managed services. Its data services include ethernet, Internet Protocol vpn, Internet Protocol voice and bandwidth services. Managed services consist of application hosting, infrastructure management and network and facilities management. Voice services comprise VoIP, non-VoIP services, intelligent network services, and network partnering. The company also offers professional services that enable customers to plan, implement, and operate solutions for their business needs. Also, COLT Telecom Group provides services that allow other licensed operators to use spare capacity on its network. As of December 31, 2008, COLT Telecom Group operated a 25,000 kilometer network that includes metropolitan area networks in 34 European cities with direct fiber connections into 16,000 buildings and 18 data centers, as well as connected 85 cities. The company was founded in 1992 and is based in Luxembourg, Luxembourg. Global Crossing Ltd. Global Crossing Limited provides telecommunications solutions over an integrated global IP-based network. Its core network connects approximately 390 cities in 30 countries, and delivers services to approximately 690 cities in 60 countries and 6 continents, worldwide. The company’s IP services are global in scale, linking enterprises, governments, and carriers with customers, employees, and partners worldwide in a secure environment that is suited for IP-based business applications, allowing e-commerce to thrive. Global Crossing offers a range of data, voice, and security products to Fortune 500, as well as 700 carriers, mobile operators, and ISPs. Its Professional Services and Managed Solutions provide VoIP, security, and network consulting and management services to support its Global Crossing IP VPN service and Global Crossing VoIP services. Global Crossing natively deployed IPv6 in both its private and public backbone networks. The company was founded in 1997 and is based in Hamilton, Bermuda. IDT Corporation IDT Corporation provides telecommunications services and products. The company operates in five segments: Prepaid Products, Consumer Phone Services, Wholesale Telecommunications Services, IDT Energy, and IDT Capital. The Prepaid Products segment markets and sells prepaid and rechargeable calling cards, and prepaid wireless phone services. The Consumer Phone Services segment sells consumer local and long distance services. The Wholesale Telecommunications Services segment sells telecommunications services to its wholesale customers, as well as provides a range of VoIP communications services. The IDT Energy segment resells natural gas and electrical power to consumers and small business customers in New York State. The IDT Capital segment consists of IDT Carmel, IDT Local Media and WMET 1160 AM radio station and IDW publishing. It operates in the United States, Europe, Latin America, and Asia. The company was founded in 1990 and is headquartered in Newark, New Jersey. |
| Comparable Public Company Descriptions (cont’d) 29 Company Name Description Neutral Tandem, Inc. Neutral Tandem, Inc. provides tandem interconnection services principally to competitive carriers, including wireless, wireline, cable, and broadband telephony companies in the United States. Its services enable competitive carriers to interconnect and exchange local and long distance traffic between their networks without establishing direct switch-to-switch connections. The company manages network capacity between its tandem switches and customers’ switches. Its network automatically switches IP-originated or conventional time division multiplexing (TDM) traffic to terminating carriers, using either protocol. As of December 31, 2008, its network connected 1,336 competitive carrier switches, creating approximately 1.9 million switch-to-switch routes serving approximately 391 million telephone numbers assigned to these carriers. The company was founded in 2001 and is headquartered in Chicago, Illinois. Rostelecom OAO OAO Rostelecom provides domestic and international long-distance telecommunications services to the government, businesses, and individuals in the Russian Federation. It provides switching and transmission infrastructure that connects the Russian domestic telecommunications trunk network with foreign networks and facilitates the transmission of telecommunications traffic in the Russian Federation. The company has international fiber optic links (FOLs) accessing Finland, Denmark, Turkey, Italy, Bulgaria, Japan, Korea, China, Estonia, Kazakhstan, Ukraine, Georgia, and Belarus. As of December 31, 2008, its digital network comprised 49,987 kilometers, including 35,291 kilometers of FOLs and 14,696 kilometers of digital radio-relay lines. The company was founded in 1993 and is headquartered in Moscow, the Russian Federation. OAO Rostelecom is a subsidiary of OAO Svyazinvest. Tata Communications Ltd. Tata Communications Limited provides integrated telecommunications solutions internationally. The company operates in three segments: Wholesale Voice, Enterprise and Carrier Data, and Other Services. The Wholesale Voice segment provides international long distance and national long distance voice services. The Enterprise and Carrier Data segment offers corporate data transmission services, such as international private leased circuits, frame relay, Internet leased line circuits, and national private leased circuits. The Other Services segment provides global roaming, Internet, virtual private network, and data centre services. Tata Communications serves the Fortune 1000 and mid-sized enterprises, service providers, and consumers. It has collaboration agreements with Cisco Systems Inc. and Philippine Long Distance Telephone Co. to offer public Cisco TelePresence service in the Philippines. The company, formerly known as Videsh Sanchar Nigam Limited, was founded in 1986 and is based in Mumbai, India. Tata Communications Limited is a part of the Tata Group. Vonage Holdings Corporation Vonage Holdings Corp. provides broadband VoIP services to residential and small business and home office customers. It offers various features, such as call waiting, caller ID with name, call forwarding, and voicemail. In addition, it offers services, including Vonage visual voicemails, virtual phone numbers and residential and business fax services, as well as Vonage SoftPhone, a software application that is downloaded and enables user to use a computer as a telephone. Further, the company offers Vonage-enabled devices, such as Vonage V- Portal to connect up to two Vonage lines through a high-speed Internet connection and includes a networking router; analog telephone adapters; Vonage Bundled Cordless Phone; V-phone and Vonage Companion. As of December 31, 2008, it had approximately 2.6 million subscriber lines in service. The company was incorporated in 2000 and is headquartered in Holmdel, New Jersey. |
| Valuation Analysis – Discount Rate Calculation (1) Levered betas derived from Bloomberg. (2) Equity Market Capitalization as of 10/12/09 close. (3) Normalized corporate tax rate of 38% includes federal, state and foreign taxes, excluding all net operating loss carryforwards and tax credits. (4) Unlevered Beta = Levered Beta * (Equity Market Capitalization / (Debt * (1- Corporate Tax Rate) + Equity Market Capitalization)). (5) Source: Ibbotson Associates, Inc., Stocks, Bonds, Bills, and Inflation 2009 Valuation Yearbook, Ibbotson and Associates, Chicago, 2009. (6) 10 Year U.S. Treasury Bond Rate at 10/12/09. (7) Calculated using the levered beta derived from the median unlevered beta of the public company comparables and iBasis‘s capital structure. (8) Assumed cost of debt based on iBasis’s current capital structure. ($ Thousands) 30 Public Company Comparables Levered Beta (1) Equity Market Capitalization (2) Total Debt Corporate Tax Rate (3) Unlevered Beta (4) 8x8, Inc. [EGHT] 0.66 $86,864 $76 38.0% 0.66 Tata Communications Ltd. [BSE:500483] NA 2,976,417 1,286,839 38.0% NA Arbinet Corporation [ARBX] 1.15 55,402 3,899 38.0% 1.10 Neutral Tandem, Inc. [TNDM] 0.88 745,337 1,456 38.0% 0.88 Rostelecom OAO [RTS:RTKM] NA 3,569,501 309,383 38.0% NA Global Crossing Ltd. [GLBC] 1.21 942,338 1,710,400 38.0% 0.57 Citic 1616 Holdings Ltd. [SEHK:1883] NA 577,660 0 38.0% NA Vonage Holdings Corporation [VG] 1.30 278,219 224,691 38.0% 0.86 COLT Telecom Group SA [LSE:COLT] NA 1,614,595 0 38.0% NA IDT Corporation [IDT] 0.45 81,016 118,545 38.0% 0.23 Median of Comparables 1.01 $661,498 $61,222 38.0% 0.76 Calculation of Levered Beta Company Unlevered Beta (4) Equity Market Capitalization (2) Total Debt Corporate Tax Rate Levered Beta IBASIS, INC. (Based on Comparables) 0.76 $165,962 $19,856 38.0% 0.82 IBASIS, INC. (Standalone) 1.64 Calculation of Cost of Equity Based on Comparables Standalone Market Risk Premium (5): 6.5% 6.5% Risk Free Rate (6): 3.4% 3.4% Size Premium (5): 5.8% 5.8% CAPM: (Risk Free Rate + (Levered Beta * Market Risk Premium) + Size Premium) Cost of Equity (7) 14.5% 19.9% Weighted Average Cost of Capital (WACC) Equity Ratio: 89.3% 89.3% Total Debt Ratio: 10.7% 10.7% Tax Rate: 38.0% 38.0% WACC: [Debt/(Debt + Equity)*Cost of Debt*(1-Tax Rate)]+[(Equity/(Debt+Equity)*Cost of Equity] Weighted Average Cost of Capital (7) 13.3% 18.1% Cost of Debt (8): 5.25% |
| Public Premiums Selected North American Telecommunication Services Transactions With Equity Consideration Between $25 Million And $1 Billion Announced Since January 1, 2005 Pending. 31 Announce Date Buyer Seller Seller Description Premium Paid One Day Before Announce Premium Paid Twenty Trading Days Before Announce 9/23/2009 Harbinger Capital Partners SkyTerra Communications, Inc. (1) Provides mobile satellite communications services in the United States and Canada 47.1% 52.4% 7/28/2009 Sprint Nextel Corp. Virgin Mobile USA, Inc. (1) Wireless communications services provider, offers prepaid and postpaid services for the youth market primarily in the Untied States 30.6% 34.8% 5/28/2009 Zayo Group LLC FiberNet Telecom Group Inc. Provides telecommunications services , including transport services, VoIP Peering services, and colocation services 15.5% 9.0% 5/11/2009 Windstream Corp D&E Communications Inc. (1) Provides telecommunications services such as telephone and data access services, long distance 61.2% 87.6% 11/7/2008 AT&T Inc. Centennial Communications Corp. (1) Provides wireless and integrated telecommunications services in the United States and Puerto Rico 121.4% 128.5% 8/24/2008 ABRY Partners Q9 Networks Inc. Provides outsourced data center infrastructure services for organizations with mission-critical IT operations 31.0% 35.3% 6/19/2008 Deluxe Corp. Hostopia.com Inc. Provides web hosting services that enable small and medium-sized businesses to establish and maintain an internet presence 134.4% 120.3% 10/28/2007 Platinum Equity LLC Covad Communications Group Inc. Provides voice and data communications products and services to consumers and businesses 59.4% 64.5% 7/30/2007 Verizon Wireless Inc. Rural Cellular Corp. Provides wireless telecommunication services primarily to rural markets in the United States 41.5% 2.7% 7/17/2007 CaucusCom Merger Corp. Metromedia International Group Provides telecommunications services including modern digital voice, data and multimedia communications capabilities 29.5% 14.6% 7/2/2007 Consolidated Communications Holding North Pittsburgh Systems Provides retail, rental and servicing of telephone communications equipment and services, provides dial-up and dedicated Internet access and related Web services 17.6% 25.3% |
| Public Premiums (cont’d) Selected North American Telecommunication Services Transactions With Equity Consideration Between $25 Million And $1 Billion Announced Since January 1, 2005 32 Announce Date Buyer Seller Seller Description Premium Paid One Day Before Announce Premium Paid Twenty Trading Days Before Announce 6/26/2007 Website Pros Inc. Web.com Inc. Provides application and web hosting and consulting services offering do-it-yourself and professional website design and website hosting 21.9% 34.2% 6/25/2007 RCN Corp. Neon Communications Group Inc. Provides Internet infrastructure and network services 5.0% 1.9% 5/29/2007 Windstream Corp. CT Communications Inc. Provide integrated telecommunications services to residential and business customers located primarily in North Carolina 46.0% 29.0% 3/20/2007 Integra Telecom Inc. Eschelon Telecom Inc. Provides integrated communications services offering local and long-distance, Internet access, leased lines, and data services 17.2% 27.9% 3/19/2007 Communications Investment Partners Ltd Stratos Global Corp. Provides wireless telecommunication services offering customers operating in remote locations with a varietly of wireless IP, data and voice satellite solutions 0.2% 17.0% 10/12/2006 Internap Network Services Corp. VitalStream Holdings Inc. Provides audio and video streaming services 36.7% (6.4%) 9/22/2006 Cavalier Telephone LLC Talk America Holdings Inc. Provides local and long distance telecommunication services to residential and small business customers 23.3% 43.4% 9/21/2006 Globalive Communications Corp. Yak Communications Inc. Provides telecommunications services offering a full array of long distance, calling cards, data services, and broadband voice 34.6% 81.0% 9/18/2006 Citizens Communications Company Commonwealth Telephone Enterprise Inc. Provides telecommunications services in Pennsylvania 8.3% 22.0% 6/27/2006 Hector Acquisition Corp. Hector Communications Corp. Provides telecommunications services, such as local telephone and cable television services 23.3% 22.8% 5/5/2006 Tele Pacific Communications Inc. Mpower Holding Corp. Provides telecommunications, high-speed data, Internet access and web hosting services 2.7% 30.6% |
| Public Premiums (cont’d) Selected North American Telecommunication Services Transactions With Equity Consideration Between $25 Million And $1 Billion Announced Since January 1, 2005 33 Announce Date Buyer Seller Seller Description Premium Paid One Day Before Announce Premium Paid Twenty Trading Days Before Announce 2/6/2006 West Corp. Raindance Communications Inc. Provides internet communication services such as web conferencing that allow users to communicate through web applications 33.0% 36.4% 1/30/2006 West Corp. Intrado Inc. Provides emergency-telephony solutions that manage and deliver information for telecommunications providers 13.0% 13.5% 12/12/2005 iPass GoRemote Internet Enterprise broadband services 23.0% 25.7% 8/30/2005 Sprint Nextel Corp. IWO Holdings Inc. Provides wireless personal telecommunications services network to customers 18.9% 8.3% 8/9/2005 Vector Capital Corp. Register.com Inc. Provides Internet domain name registration services 2.1% (1.6%) 7/25/2005 VSNL Teleglobe Provides telecom network services 22.0% 54.1% 5/11/2005 Rogers Communication Inc. Call-Net Enterprise Inc. Provides telecommunication services; internet service provider 34.4% 18.8% Mean 32.9% 35.6% High 134.4% 128.5% 75th Percentile 36.7% 43.4% Median 23.3% 27.9% 25th Percentile 17.2% 14.6% Low 0.2% (6.4%) |
| Public Premiums Minority Squeeze-Out Transactions Announced Since January 1, 2007 (1) Premium calculated using the final agreed to price, post all negotiations, over the respective trading price prior to the first announcement of the transaction. (2) Pending, approved by special committee. 34 Announce Date Buyer Seller Primary Industry Prior Ownership Percentage Completed Premium Paid One Day Before Announce (1) Completed Premium Paid Twenty Trading Days Before Announce (1) 4/3/2009 TAT Technologies, Ltd. Limco-Piedmont Inc. Aerospace and Defense 61.8% 12.0% 35.0% 3/25/2009 Hearst Broadcasting, Inc Hearst-Argyle Television, Inc. Broadcasting 81.9% 115.3% 174.4% 3/23/2009 Cox Media Group, Inc. Cox Radio Inc. Broadcasting 78.0% 45.5% (5.1%) 2/27/2009 Individual Investor (Company Director) Vita Food Products Inc. Packaged Foods and Meats 57.7% 250.0% 400.0% 2/9/2009 Mill Road Capital; Galaxy Partners Galaxy Nutritional Foods Inc. Packaged Foods and Meats 53.1% 111.8% 44.0% 1/27/2009 BT Group plc Net2S Group Internet Software and Services 97.8% 85.6% 58.3% 1/15/2009 Individual Investor (Company Director) Hiland Holdings GP LP (2) Oil and Gas Storage and Transportation 61.0% (9.1%) (1.2%) 11/12/2008 Investor Group Renasant Financial Partners Financial Services 93.0% 0.0% 9.4% 8/12/2008 Bank of Tokyo-Mitsubishi UFJ, Ltd. UnionBanCal Corp. Regional Bank 64.9% 26.3% 103.0% 7/31/2008 Individual Investor (Company CEO) Zones Inc. Technology Distributors 54.0% 28.7% (8.1%) |
| Public Premiums (cont’d) Minority Squeeze-Out Transactions Announced Since January 1, 2007 (1) Premium calculated using the final agreed to price, post all negotiations, over the respective trading price prior to the first announcement of the transaction. 35 Announce Date Buyer Seller Primary Industry Prior Ownership Percentage Completed Premium Paid One Day Before Announce (1) Completed Premium Paid Twenty Trading Days Before Announce (1) 7/21/2008 Roche Holdings Inc. Genetech Inc. Biotechnology 55.9% 16.1% 27.1% 6/30/2008 Investor Group Dectron Internationale HVAC 73.2% 86.7% 69.4% 6/26/2008 National Patent Development Corp. Five Star Products Inc. Distributors 74.9% 33.3% 14.3% 3/10/2008 Nationwide Nationwide Financial Services, Inc. Life and Health Insurance 66.4% 37.8% 24.3% 3/5/2008 Infogrames Entertainment SA Atari, Inc. Home Entertainment Software 51.4% 0.0% 22.6% 12/27/2007 GreenShift Corporation GS AgriFuels Corporation Industrial Machinery 90.0% 138.1% 38.9% 11/16/2007 Icahn Enterprises, L.P. Atlantic Coast Entertainment Holdings Casinos and Gaming 94.2% 17.7% 17.7% 10/23/2007 Investor Group Waste Industries USA Waste Services Company 51.0% 33.5% 31.5% 10/9/2007 NV Holdings Navtech Software 66.6% 39.7% 58.9% 9/5/2007 Investor Group Promatek Industries Software and Hardware Products 54.5% (7.0%) 25.0% |
| Public Premiums (cont’d) Minority Squeeze-Out Transactions Announced Since January 1, 2007 (1) Premium calculated using the final agreed to price, post all negotiations, over the respective trading price prior to the first announcement of the transaction. 36 Announce Date Buyer Seller Primary Industry Prior Ownership Percentage Completed Premium Paid One Day Before Announce (1) Completed Premium Paid Twenty Trading Days Before Announce (1) 8/9/2007 Applied Digital Solutions Inc. Digital Angel Corp. Electronic Manufacturing Services 55.2% (12.8%) (24.7%) 7/17/2007 Alfa Mutual Insurance Company Alfa Corp. Property and Causalty Insurance 54.7% 44.7% 31.5% 6/22/2007 Liberty Media Fun Technologies Online Gaming 53.0% 11.1% 6.7% 5/14/2007 United Pacific Industries Ltd. Spear & Jackson Inc. Household Applicances 61.8% 92.2% 81.5% 2/26/2007 Holcim Group St. Lawrence Cement Group Construction 79.0% 33.5% 49.0% 2/26/2007 Palisafe Capital Management LLC Refac Optical Group Specialty Stores 91.7% 39.2% 53.5% 2/22/2007 American Financial Group Inc. Great American Financial Resources Inc. Life and Health Insurance 81.2% 13.0% 12.5% 1/24/2007 American International Group, Inc. 21st Century Insurance Group Property and Causalty Insurance 61.9% 32.6% 24.9% Mean 47.0% 49.1% High 250.0% 400.0% 75th Percentile 55.5% 54.7% Median 33.4% 29.3% 25th Percentile 12.7% 13.8% Low (12.8%) (24.7%) |