Table of Contents
UNITED STATES
SECURITIES AND EXCHANGE COMMISSION
Washington, D.C. 20549
Form 10-K
| þ | ANNUAL REPORT PURSUANT TO SECTION 13 OR 15(d) OF THE SECURITIES EXCHANGE ACT OF 1934 |
For the fiscal year ended December 31, 2011
OR
| ¨ | TRANSITION REPORT PURSUANT TO SECTION 13 OR 15(d) OF THE SECURITIES EXCHANGE ACT OF 1934 |
For the transition period from to
Commission file number 001-15395
MARTHA STEWART LIVING OMNIMEDIA, INC.
(Exact Name of Registrant as Specified in Its Charter)
| Delaware | 52-2187059 | |
| (State or Other Jurisdiction of Incorporation or Organization) | (I.R.S. Employer Identification No.) | |
| 601 West 26th Street, New York, New York | 10001 | |
| (Address of Principal Executive Offices) | (Zip Code) | |
Registrant’s telephone number, including area code: (212) 827-8000
Securities Registered Pursuant to Section 12(b) of the Act:
Title of Each Class | Name of Each Exchange on Which Registered | |
| Class A Common Stock, Par Value $0.01 Per Share | New York Stock Exchange |
Securities Registered Pursuant to Section 12(g) of the Act:
None
Indicate by check mark if the registrant is a well-known seasoned issuer, as defined in Rule 405 of the Securities Act. Yes ¨ No þ
Indicate by check mark if the registrant is not required to file reports pursuant to Section 13 of Section 15(d) of the Act. Yes ¨ No þ
Indicate by check mark whether the registrant: (1) has filed all reports required to be filed by Section 13 or 15(d) of the Securities Exchange Act of 1934 during the preceding 12 months (or for such shorter period that the registrant was required to file such reports), and (2) has been subject to such filing requirements for the past 90 days. Yes þ No ¨
Indicate by check mark whether the registrant has submitted electronically and posted on its corporate Web site, if any, every Interactive Data File required to be submitted and posted pursuant to Rule 405 of Regulation S-T during the preceding 12 months (or for such shorter period that the registrant was required to submit and post such files). Yes þ No ¨
Indicate by check mark if disclosure of delinquent filers pursuant to Item 405 of Regulation S-K is not contained herein, and will not be contained, to the best of registrant’s knowledge, in definitive proxy or information statements incorporated by reference in Part III of this Form 10-K or any amendment to this Form 10-K. ¨
Indicate by check mark whether the registrant is a large accelerated filer, an accelerated filer, a non-accelerated filer or a smaller reporting company. See definitions of “large accelerated filer,” “accelerated filer” and “smaller reporting company” in Rule 12b-2 of the Exchange Act. (Check one):
| Large accelerated filer | ¨ | Accelerated filer | þ | |||
| Non-accelerated filer | ¨ (Do not check if a smaller reporting company) | Smaller reporting company | ¨ | |||
Indicate by check mark whether the registrant is a shell company (as defined in Rule 12b-2 of the Act). Yes ¨ No þ
The aggregate market value of the voting stock held by non-affiliates of the registrant, computed by reference to the number of shares outstanding and using the price at which the stock was last sold on June 30, 2011, was $120,445,676.*
| * | Excludes 1,404,427 shares of our Class A Common Stock, and 25,984,625 shares of our Class B Common Stock, held by directors, officers and 10% stockholders, as of June 30, 2011. Exclusion of shares held by any person should not be construed to indicate that such person possesses the power, direct or indirect, to direct or cause the direction of the management or policies of the Company, or that such person controls, is controlled by or under common control with the Company. |
Number of Shares Outstanding As of March 2, 2012
40,842,451 shares of Class A Common Stock
25,984,625 shares of Class B Common Stock
Documents Incorporated by Reference.
Portions of Martha Stewart Living Omnimedia, Inc.’s Proxy Statement for
Its 2012 Annual Meeting of Stockholders are Incorporated
by Reference into Part III of This Report.
Table of Contents
PART I | ||||
| 5 | ||||
| 5 | ||||
| 5 | ||||
| 6 | ||||
| 9 | ||||
| 10 | ||||
| 12 | ||||
| 13 | ||||
| 13 | ||||
| 19 | ||||
| 20 | ||||
| 20 | ||||
| 20 | ||||
PART II | ||||
| 21 | ||||
| 23 | ||||
Item 7. Management’s Discussion and Analysis of Financial Condition and Results of Operations | 25 | |||
Item 7A. Quantitative and Qualitative Disclosure About Market Risk | 42 | |||
| 43 | ||||
Item 9. Changes in and Disagreements with Accountants on Accounting and Financial Disclosure | 43 | |||
| 43 | ||||
| 45 | ||||
PART III | ||||
Item 10. Directors, Executive Officers and Corporate Governance | 46 | |||
| 46 | ||||
| 46 | ||||
Item 13. Certain Relationships and Related Transactions, and Director Independence | 47 | |||
| 47 | ||||
PART IV | ||||
| 48 | ||||
| 54 | ||||
2
Table of Contents
| F-1 | ||||
| F-2 | ||||
Consolidated Statements of Operations for the years ended December 31, 2011, 2010 and 2009 | F-3 | |||
| F-4 | ||||
| F-5 | ||||
Consolidated Statements of Cash Flows for the years ended December 31, 2011, 2010 and 2009 | F-6 | |||
| F-7 | ||||
| F-34 | ||||
Exhibit Index | ||||
3
Table of Contents
In this Annual Report on Form 10-K, the terms “we,” “us,” “our,” “MSO” and the “Company” refer to Martha Stewart Living Omnimedia, Inc. and, unless the context requires otherwise, Martha Stewart Living Omnimedia LLC (“MSLO LLC”), the legal entity that, prior to October 22, 1999, operated many of the businesses we now operate, and their respective subsidiaries.
FORWARD-LOOKING STATEMENTS
All statements in this Annual Report on Form 10-K, except to the extent describing historical facts, are “forward-looking statements,” as that term is defined in the Private Securities Litigation Reform Act of 1995. These forward-looking statements represent our current beliefs regarding future events, many of which, by their nature, are inherently uncertain and outside of our control. These statements often can be identified by terminology such as “may,” “will,” “should,” “could,” “expects,” “intends,” “plans,” “anticipates,” “believes,” “estimates,” “potential” or “continue” or the negative of these terms or other comparable terminology. Our actual results may differ materially from those projected in these statements, and factors that could cause such differences include those factors discussed in “Risk Factors” in Item 1A of this Annual Report on Form 10-K and those discussed in the “Management’s Discussion and Analysis of Financial Condition and Results of Operations” in Item 7, as well as other factors. Forward-looking statements herein speak only as of the date of filing of this Annual Report on Form 10-K. We undertake no obligation to publicly update any forward-looking statements, whether as a result of new information, future events or otherwise. You are advised, however, to consult any further disclosures we make on related subjects in the reports we file with the Securities and Exchange Commission (the “SEC”).
4
Table of Contents
PART I
We are an integrated media and merchandising company providing consumers with inspiring lifestyle content and well-designed, high-quality products. We are organized into three business segments: Publishing and Broadcasting, our two media segments, and Merchandising. This combination enables us to cross-promote our content and products.
Our strategy to generate growth and profitability includes the following imperatives:
| • | Grow our merchandising business by leveraging our brand equity to expand the distribution of product in existing categories, diversify into new categories and distribution channels, and negotiate new partnerships that fully reward us for the value of our brands and our active role in product development and design; |
| • | Strengthen our media business by creating a brand-centric advertising sales force and by using our content across existing and new distribution channels; and |
| • | Expand our media presence and pursuing merchandising opportunities internationally. |
The media and merchandise we create generally encompasses the following core areas:
| • | Cooking and Entertaining |
| • | Holiday and Celebrations |
| • | Crafts |
| • | Home |
| • | Whole Living (healthy living and sustainable practices) |
| • | Weddings |
| • | Organizing |
| • | Gardening |
| • | Pets (grooming, apparel, feeding and health) |
As of March 1, 2012, we had approximately 582 employees. Our designed and branded products are available in thousands of retail outlets across the country including The Home Depot, Macy’s, Petsmart and, effective in the first quarter of 2012, in many Staples stores.
Our revenues from foreign sources were $9.8 million, $6.5 million and $10.8 million in 2011, 2010 and 2009, respectively, which was largely comprised of international sales of television content. In the future, we plan to grow international revenues from other areas of our business. Substantially all of our assets are located within the United States.
Martha Stewart published her first book,Entertaining, in 1982. Over the next eight years she became a well-known authority on the domestic arts, authoring eight more books on a variety of our core content areas. In 1990, Time Publishing Ventures, Inc. (“TPV”), a subsidiary of Time Inc., launchedMartha Stewart Livingmagazine with Ms. Stewart serving as its editor-in-chief. In 1993, TPV began producing a weekly television program,Living, hosted by Ms. Stewart. In 1995, TPV launched a mail-order catalog,Martha by Mail, which made available products featured in, or developed in connection with, the magazine and television program. In late 1996 and early 1997, a series of transactions occurred resulting in MSLO LLC acquiring substantially all Martha Stewart-related businesses. Ms. Stewart was the majority owner of MSLO LLC; TPV retained a small equity interest in the business. On October 22, 1999, MSLO LLC merged into MSO, then a wholly owned subsidiary of MSLO LLC. Immediately following the merger, we consummated an initial public offering.
5
Table of Contents
BUSINESS SEGMENTS
Our three business segments are described below. Additional financial information relating to these segments may be found in Note 14,Industry Segments, in the Notes to Consolidated Financial Statements of this Annual Report on Form 10-K, which information is incorporated herein by reference.
In 2011, our Publishing segment accounted for 64% of our total revenues, consisting of operations related to magazine and book publishing and digital distribution, principally through our website,marthastewart.com. Revenues from magazine and digital advertising represented approximately 65% of the segment’s revenues in 2011, while circulation revenues represented approximately 33% of the segment’s revenues.
Magazines
Martha Stewart Living.Our flagship magazine,Martha Stewart Living, is the foundation of our publishing business. Launched in 1990 as a quarterly publication with a circulation of 250,000, we currently publishMartha Stewart Livingon a monthly basis with a rate base of 2.05 million. The magazine appeals primarily to the college-educated woman between the ages of 25 and 54 who owns her principal residence.Martha Stewart Livingoffers lifestyle ideas and original how-to information in a highly visual, upscale editorial environment. The magazine has won numerous prestigious industry awards and is the leading publication for the Martha Stewart brand.Martha Stewart Living generates a majority of our magazine revenues, largely from advertising and circulation revenues.
Martha Stewart Weddings.We launchedMartha Stewart Weddingsin 1994, originally as an annual publication. In 1997, it went to semi-annual publication and became a quarterly in 1999.Martha Stewart Weddingstargets the upscale bride and serves as an important vehicle for introducing young women to our brands.Martha Stewart Weddingsis distributed primarily through newsstands.
Everyday Food.We launchedEveryday Foodin September 2003 after publishing four test issues. This digest-sized magazine, now published ten times per year, targets women ages 25 to 49 and is intended to broaden our consumer audience.Everyday Food features quick, easy recipes for the everyday cook, along with seasonal menus, cooking instructions, suggestions for healthy, “smart” eating and money saving shopping tips.
Whole Living.In August 2004, we acquired certain assets and liabilities ofBody + Soulmagazine andDr. Andrew Weil’s Self Healingnewsletter (“Body & Soul Group”), publications featuring “natural living” content. In 2010, we discontinued our relationship with Dr. Andrew Weil and no longer publishDr. Andrew Weil’s Self Healingnewsletter or any Dr. Weil special interest publications. Effective with the June 2010 issue, we changed the name ofBody + Soul/Whole Livingmagazine toWhole Livingin an attempt to more effectively integrate the magazine with our corresponding website,wholeliving.com, and to broaden the editorial coverage of the magazine, which we believe may provide opportunities to increase consumer and advertising demand.
Magazine Summary
Certain information related to our subscription magazines is as follows:
Title | 2009 Rate Base * | 2010 Rate Base * | 2011 Rate Base * | 2012 Rate Base * | Frequency | |||||||||||||||
Martha Stewart Living | 2,025,000 | 2,025,000 | 2,050,000 | 2,050,000 | 12 | |||||||||||||||
Martha Stewart Weddings | N/A | *** | N/A | *** | N/A | *** | N/A | *** | 4 | ** | ||||||||||
Everyday Food | 1,000,000 | 1,000,000 | 1,025,000 | 1,025,000 | 10 | |||||||||||||||
Whole Living | 600,000 | 650,000 | 700,000 | 750,000 | 10 | |||||||||||||||
| * | Rate base increases are effective with the January issues which typically are on sale in December of the prior fiscal year. |
6
Table of Contents
| ** | In addition, we anticipate producing two special issues ofMartha Stewart Weddings in 2012, as compared to the one special issue ofMartha Stewart Weddings we produced in each of 2011, 2010 and 2009. |
| *** | Does not have a stated rate base. |
Special Interest Publications.In addition to our periodic magazines, we occasionally publish special interest magazine editions. Our special interest publications provide in-depth advice and ideas around a particular topic in one of our core content areas, allowing us to leverage our distribution network to generate additional revenues. Our special interest publications are sold at newsstands and may include advertising. In 2011, we publishedMartha Stewart Living Halloween Flights of Fancy Special,Martha Stewart Holiday Handbook, a full-sizedEveryday Food special, andMartha Stewart Weddings—Destination Weddings and Dream Honeymoons.
Magazine Production, Distribution and Fulfillment.We print most of our domestic magazines under agreements with R. R. Donnelly and currently purchase paper through an agreement with Time Inc. In November 2011, we signed a new printing services agreement with R.R. Donnelly, extending the term through 2017 in exchange for rate concessions from the prior agreement. As paper prices decreased in 2009 and 2010 because of lower market demand, many paper mills consolidated operations in response to the declining paper demand. As a result of those actions, paper prices increased in 2011. Based on recent information from our paper supplier, we expect paper pricing to decline slightly in the first half of 2012 and increase in the second half of 2012. However, we expect our costs for magazine distribution to be lower in 2012 due to fewer pages in our magazines and lower print orders, as part of our circulation is increasingly distributed through digital editions, partially offset by one additionalMartha Stewart Weddings special and increased postage unit costs. We use no other significant raw materials in our businesses. Newsstand distribution of the magazines is handled by Time Warner Retail Sales and Marketing, an affiliate of Time Inc., under an agreement that expires in June 2014. Subscription fulfillment services also for our magazines are provided by Time Customer Service, another affiliate of Time Inc., under an agreement that expires in June 2014.
Books
During 2007, we announced a multi-year agreement with Clarkson Potter/Publishers to publish ten Martha Stewart branded books. Subsequent amendments ultimately increased the number of books to be delivered to 17, all of which had been delivered and accepted as of December 31, 2011. Three books were published in 2011 under this agreement:Pies & Tarts,Entertaining andHandmade Holiday Crafts.In 2011, we negotiated a new multi-year, multi-book agreement with Clarkson Potter/Publishers to continue providing Martha Stewart branded books in the future.
In August 2008, we announced a multi-year agreement with Harper Studio to publish ten Emeril Lagasse branded books, of which four had been delivered and accepted through December 31, 2011.Sizzling Skilletswas published under this agreement in 2011.
Through our efforts in the books business and the rights we acquired related to Emeril’s book backlist, we now have a library of approximately 92 published books.
Digital Properties
marthastewart.com
Themarthastewart.com website is the flagship of our digital properties, offering a vast quantity of continually updated articles and recipes developed from several Martha Stewart brands, including our magazine properties. Since the website’s re-launch in 2007 as a content-focused, advertising-driven media website,marthastewart.com has received many industry awards. The website provides engaging experiences in several lifestyle categories: food, entertaining, holidays, home and garden, crafts and pets. The website also serves as a gateway to our other properties, includingwholeliving.com andmarthastewartweddings.com. In 2011, we
7
Table of Contents
invested in a re-platforming of our website that allows for additional functionality in 2012 and beyond. The enhancements to the website are expected to improve user engagement and expand our advertising inventory which, in combination, is expected to drive growth in our audience and revenues. In 2011,marthastewart.com averaged 3.6 million monthly unique visitors, a 25% increase over 2010, and 67 million monthly pageviews, a 5% increase over 2010.
marthastewartweddings.com
In 2008, we launchedmarthastewartweddings.comto guide brides-to-be through the process of planning and designing of their weddings, with a strong emphasis on identifying and developing each bride’s personalized wedding style. The site continues to grow in traffic and audience attention, averaging around 0.5 million monthly unique viewers in 2011, a 33% increase over 2010, and around 15 million monthly average pageviews, a 30% increase over 2010.
wholeliving.com
In 2008, we also launchedwholeliving.com, a website designed to help women achieve their goals for living better lives, with a focus on wellness and beauty, healthy recipes, green living, fitness, and personal happiness. In 2010, unique visitors towholeliving.com doubled due to improvements in branding, product and programming, as well as due to an increase in popularity of this lifestyle category overall. While unique viewers decreased 4% in 2011 compared to 2010, monthly average page views increased 17% to around 4 million and total visits increased to over 1 million average monthly visits, a 53% increase over 2010.
Digital Products
In 2011, we developed five digital apps that were available for download through Apple iTunes. We launched iPad apps of Martha Stewart Living and Everyday Food, which are enhanced digital versions of those titles for the iPad, and which are also available on other tablets. The three other iPad apps that launched were Egg Dyeing 101, Cocktails and Smoothies, along with add-ons and updates of our existing apps.
Digital Editions are available for all of our publications. In addition to the iPad versions of Martha Stewart Living and Everyday Food, we also have digital versions of these titles, along with Martha Stewart Weddings and Whole Living, available through the Color Nook, Kindle Fire and through the Zinio platform. Digital editions account for approximately 3% percent of all our circulation.
Competition
Publishing is a highly competitive business. Our magazines, books and digital apps compete not only with other magazines, books and digital apps, but also with other mass media, websites and many other types of leisure-time activities. Competition for advertising dollars in magazine operations is primarily based on advertising rates, as well as editorial and aesthetic quality, the desirability of the magazine’s demographic, reader response to advertisers’ products and services and the effectiveness of the advertising sales staff.Martha Stewart Livingcompetes for readers and advertising dollars with women’s service, decorating, cooking and lifestyle magazines and websites.Everyday Foodcompetes for readers and advertising dollars with women’s service and cooking magazines and websites.Martha Stewart Weddingscompetes for readers and advertising dollars primarily with wedding service magazines and websites.Whole Livingcompetes for readers and advertising dollars primarily with women’s lifestyle, health, fitness, and natural living magazines and websites. Our special interest publications can compete with a variety of magazines depending on the focus of the particular issue. Capturing advertising sales for our digital properties is highly competitive as well.marthastewart.comcompetes with other how-to, food and lifestyle websites. Our challenge is to attract and retain users through an easy-to-use and content-relevant website. Competition for digital advertising rates is based on the number of unique users we attract each month, the demographic profile of that audience and the number of pages they view on our site.
8
Table of Contents
Seasonality
Our Publishing segment can experience fluctuations in quarterly performance due to variations in the publication schedule from year to year, timing of direct mail expenses, delivery and acceptance of books under our long-term book contracts and variability of audience and traffic onmarthastewart.com, as well as other seasonal factors. Not all of our magazines are published on a regularly scheduled basis throughout the year. Additionally, the publication schedule for our special interest publications can vary and lead to quarterly fluctuations in the Publishing segment’s results. Advertising revenue in our magazines and onmarthastewart.comis typically highest in the fourth quarter of the year due to higher consumer demand for our holiday content, and corresponding higher advertiser demand to reach our audience with their marketing messages.
Our Broadcasting business segment accounted for 14% of our total revenues in 2011. The segment consists of operations relating to the production of television programming, the domestic and international distribution of our library of programming in existing and repurposed formats, revenue derived from the provision of talent services, and the operations of our satellite radio channel. We generally own the copyrights in the programs we produce for television and radio distribution.
The Martha Stewart Showlaunched in September 2005 as a syndicated daily lifestyle series hosted by Martha Stewart.The Martha Stewart Show generates the majority of the Broadcasting segment’s revenue. Filmed in front of a studio audience, the Emmy™ Award-winning show consists of several segments within each episode, featuring inspiring ideas and new projects from one or several of our core content areas. NBC Universal Domestic Television Distribution distributed the program domestically through season 5, which ended in September 2010.
In 2010, we partnered with Hallmark Channel, a cable television network owned and operated by Crown Media Holdings, Inc., to exclusively televise original episodes of theThe Martha Stewart Show. Season 6 ofThe Martha Stewart Show began airing on Hallmark Channel in September 2010.The Martha Stewart Show, in its current format with a live audience, is expected to conclude on Hallmark Channel with the completion of season 7 in September 2012. As part of our overall Hallmark Channel agreement, we also agreed to develop a range of new and original series and prime time specials, which includedMad Hungry with Lucinda Scala Quinn,Martha Bakes andPetkeeping with Marc Morrone. We own the television content we produce for Hallmark Channel and we have the right in the future to further monetize these assets. Revenues forThe Martha Stewart Showon Hallmark Channel are mostly comprised of advertising, product integration and international licensing revenues. Revenues for the companion programs on Hallmark Channel generally consist of licensing revenue.
Emeril Lagasse also provides various television services for us. In 2011, Emeril Lagasse hostedThe Originals on the Cooking Channel, as well asEmeril’s Table, which aired on Hallmark Channel.
TheMartha Stewart Living Radiochannel launched on Sirius Satellite Radio, now known as Sirius XM Radio, in November 2005 providing programming 24 hours a day, seven days a week, of which 65 hours each week was original programming created by our experts. In November 2011, we renewed our agreement with Sirius XM Radio for a one-year term ending December 31, 2012 at a reduced license fee, along with a reduction of original programming to approximately 40 hours each week.
Competition
Broadcasting is a highly competitive business. Overall competitive factors in this segment include programming content, quality and distribution as well as the demographic appeal of the programming. Competition for television and radio advertising dollars is based primarily on advertising rates, audience size and
9
Table of Contents
demographic composition, viewer response to advertisers’ products and services and the effectiveness of the advertising sales staffs. Our television programs compete directly for viewers, distribution and/or advertising dollars with other lifestyle and how-to television programs, as well as with general programming on other television stations and all other competing forms of media. Our radio programs compete for listeners with similarly themed programming on both satellite and terrestrial radio.
Seasonality
Our Broadcasting segment can experience fluctuations in quarterly performance due to, among other things, seasonal advertising patterns, seasonal influences on people’s viewing habits and audience increases for our programming during holiday seasons. Because television seasons run 12 months beginning and ending in the middle of September, the 2011 results include a large portion of season 6 ofThe Martha Stewart Show and the first 14 weeks of season 7 ofThe Martha Stewart Show on Hallmark Channel. While repeat episodes air over the summer, original episodes usually run September to May and typically generate higher ratings and revenues.
Our Merchandising segment contributed 22% of our total revenues in 2011. The segment consists of operations related to the design of merchandise and related packaging, promotional and advertising materials, and the licensing of various proprietary trademarks, in connection with retail programs conducted through a number of retailers and manufacturers. Pursuant to agreements with our retail and manufacturing partners, we are typically responsible for the design of all merchandise and/or related packaging, signage, advertising and promotional materials. Our retail partners source the products through a manufacturer base and are mostly responsible for the promotion of the product. Our manufacturing partners source and/or produce the branded products sometimes together with other lines they make or sell. Our licensing agreements do not require us to maintain any inventory nor incur any significant expenses other than employee compensation. We own all trademarks for each of our branded merchandising programs and generally retain all intellectual property rights related to the designs of the merchandise, packaging, signage and collateral materials developed for the various programs.
Select Licensed Retail Partnerships
Martha Stewart Living at The Home Depot
In 2010, we launched theMartha Stewart Living program at The Home Depot, which is currently available at all of The Home Depot’s 1,978 stores in the United States and all of the 180 The Home Depot stores in Canada, as well as onhomedepot.com and Home Decorators Collection catalog business. TheMartha Stewart Living program at The Home Depot encompasses a broad range of home décor, paint, storage and organization products, outdoor furniture, window treatments, kitchen and bathroom cabinetry, countertops, carpet and seasonal holiday decor. On February 29, 2012, we announced the extension of our agreement with The Home Depot through March 2016 and plan to offer an expanded array ofMartha Stewart Living branded products.
Martha Stewart Collection at Macy’s
In September 2007, we introduced theMartha Stewart Collection at Macy’s. It is currently available at the nearly 650 Macy’s stores in the United States that offer home products, as well onmacys.com. TheMartha Stewart Collection line encompasses a broad range of home goods, including bed and bath textiles, housewares, food preparation and other kitchen items, tabletop, holiday decorating and trim-a-tree items.
J.C. Penney
In December 2011, we announced a strategic alliance with J.C. Penney Corporation, Inc. (“J. C. Penney”) and our plans to launch distinct Martha Stewart retail stores inside at least 600 of J.C. Penney’s department stores
10
Table of Contents
and to jointly develop an e-commerce site pursuant to a 10-year license agreement. For information regarding J.C. Penney’s investment in our company, see Note 8,Shareholders’ Equity, in the Notes to Consolidated Financial Statements of this Annual Report on Form 10-K. These Martha Stewart stores are intended to be destinations where consumers can experience an engaging and inspiring environment and buy a variety of affordable, high-quality home and lifestyle merchandise. We expect to launch both the Martha Stewart stores and the Martha Stewart-branded e-commerce site in early 2013.
Select Licensed Martha Stewart Manufacturing Partnerships
Martha Stewart Crafts
In May 2007, we launchedMartha Stewart Crafts, a paper-based crafting program with our manufacturing partner, Wilton Properties Inc. (formerly UCG Paper Crafts Properties Inc. and EK Success), at Michaels stores in the United States. The program consists of tools, embellishments, paper/albums, and other seasonal products. Distribution for this program has expanded to include multiple specialty and independent craft chains in the United States and internationally.
In 2011, we further expanded ourMartha Stewart Crafts portfolio by introducing a line of craft paints with Plaid Enterprises and a line of yarns and looms with Orchard Yarn and Thread, Inc. (d/b/a Lion Brand Yarn).
Martha Stewart Pets with Age Group
In July 2010, we launched theMartha Stewart Pets line, developed in partnership with Age Group Ltd and sold currently at Petsmart stores. The program consists of a wide range of pet accessories, including apparel, collars, leashes, bedding, grooming supplies and toys.
KB Home / Martha Stewart Homes
We have had a partnership with KB Home for the development ofMartha Stewart Homes since 2005. The KB Home communities created with Martha Stewart feature homes with unique exterior and interior details that are inspired by Martha Stewart’s own homes. TheMartha Stewart Homes are currently available at multiple communities in California, Colorado, North Carolina and Florida. We also offer a range of design options, featured exclusively at KB Home Studios nationwide.
Martha Stewart Home Office with Avery
In December 2011, shipment of products forMartha Stewart Home Office with Avery began, in preparation for the launch of the line in February 2012. TheMartha Stewart Home Office line is sold currently at Staples and on Staples.com. The line encompasses a range of home office products, including surface organization, journals, portable filing and pantry organization.
Select Licensed Emeril Lagasse Manufacturing Partnerships
We acquired certain licensing agreements in connection with our April 2008 acquisition of specific Emeril Lagasse assets and have entered into new licensing agreements following the acquisition. These licensing agreements are primarily associated with partnerships with various food and kitchen preparation manufacturers that produce products under the Emeril Lagasse brand.
Emerilware by All-Clad
Introduced in August 2000,Emerilwareby All-Clad consists of lines of high-quality, gourmet cookware and barbeque tools available at department stores and specialty retail outlets across the United States, as well as through the Home Shopping Network.
11
Table of Contents
Emerilware by T-Fal
Launched in November 2006,Emerilwareby T-FAL is a line of small kitchen appliances available at department stores and specialty retail outlets across the United States, as well as through the Home Shopping Network.
Emeril’s Original with B&G Foods
In September 2000, Emeril Lagasse introduced with B&G Foods,Emeril’s Original, a signature line of seasonings, salad dressings, basting sauces and marinades, mustards, salsas, pasta sauces, pepper sauces, spice rubs, cooking sprays and stocks available at supermarkets and specialty markets across the United States, as well as through the Home Shopping Network.
Emeril’s Gourmet Coffee with Timothy’s World Coffee
Launched in September 2007,Emeril’s Gourmet Coffee with Timothy’s World Coffeeis a single-cup coffee program comprised of flavored coffees inspired by Emeril Lagasse. The program is available in department and specialty stores nationwide, as well as in certain national hotel chains.
Other Emeril Manufacturing Partnerships
In 2010, we introduced a variety of new partnerships, includingEmerilware Cutlery with SED International Inc. (formerly Lehrhoff ABL Inc.),which is a branded cutlery collection that includes knives and cutting boards. The line was launched on the Home Shopping Network in November. We also introducedEmeril’s Red Marble Steaks with Allen Brothers which is a line of hand-selected, aged steaks. The line, launched in the spring of 2010, is available through catalog, online and the Home Shopping Network.
Competition
The retail business is highly competitive and the principal competition for all of our merchandising lines consists of mass-market and department stores that compete with the mass-market, home improvement and department stores in which our Merchandising segment products are sold. Our merchandising lines also compete within the mass-market, home improvement and department stores that carry our product lines with other products offered by these stores in the respective product categories. Competitive factors include numbers and locations of stores, brand awareness and price. We also compete with the internet businesses of these stores and other websites that sell similar retail goods.
Seasonality
Revenues from the Merchandising segment can vary significantly from quarter to quarter due to new product launches and the seasonality of many product lines.
We use multiple trademarks to distinguish our various publications and brands, includingMartha Stewart Living (the name of our flagship publication as well as the trademark for products sold at Home Depot),Martha Stewart Collection (for goods sold at Macy’s),Martha Stewart Crafts,Martha Stewart Weddings,Everyday Food,Whole Living,Mad Hungry andEmeril. These and numerous other trademarks are the subject of registrations and pending applications filed by us for use with a variety of products and other content, both domestically and internationally, and we continue to expand our worldwide usage and registration of related trademarks. We also register, both offensively and defensively, key domain names containing our trademarks, such aswww.marthastewart.com,www.marthastewartweddings.com,www.wholeliving.com,www.emerils.com andwww.everydayfood.com.
12
Table of Contents
We regularly file copyrights regarding our proprietary designs and editorial content. We have also applied for, and in some instances are now the owners of, domestic and international design and utility patents covering certain of ourMartha Stewart Crafts paper punches.
We regard our rights in and to our trademarks, our proprietary designs and editorial content as valuable assets in the marketing of our products. Accordingly, we vigorously police and protect our trademarks against infringement and denigration by third parties. We also work with our licensees to assure that our trademarks are used properly. We own and license the perpetual rights to the “Martha Stewart” portion of our marks pursuant to an agreement between us and Ms. Stewart, the description of which is incorporated by reference into Item 13 of this Annual Report on Form 10-K.
Our flagship website can be found on the Internet atwww.marthastewart.com. Our proxy statements, Annual Reports on Form 10-K, Quarterly Reports on Form 10-Q and Current Reports on Form 8-K and any amendments to these documents, as well as certain other forms we file with or furnish to the SEC, can be viewed and downloaded free of charge as soon as reasonably practicable after they have been filed with the SEC by accessingwww.marthastewart.comand clicking on Investor Relations and SEC Filings. Please note that information on, or that can be accessed through, our website is not deemed “filed” with the SEC and is not incorporated by reference into any of our filings under the Securities Act of 1933, as amended (the “Securities Act”), or the Securities Exchange Act of 1934, as amended (the “Exchange Act”), irrespective of any general incorporation language contained in such filing.
A wide range of factors could materially affect our performance. Like other companies, we are susceptible to macroeconomic changes that may affect the general economic climate and our performance, the performance of those with whom we do business, and the appetite of consumers for products and publications. Similarly, the price of our stock is impacted by general equity market conditions, the relative attractiveness of our market sector, differences in results of operations from estimates and projections, and other factors beyond our control. In addition to the factors affecting specific business operations identified in connection with the description of those operations and the financial results of those operations elsewhere in this report, the factors listed below could adversely affect our operations. Although the risk factors listed below are the risk factors that Company management considers significant, material risk factors that are not presently known to Company management may also adversely affect our operations.
Our success depends in part on the popularity of our brands and the reputation and popularity of Martha Stewart, our Founder, and Emeril Lagasse. Any adverse reactions to publicity relating to Ms. Stewart or Mr. Lagasse, or the loss of either of their services, could adversely affect our revenues, results of operations and our ability to maintain or generate a consumer base.
While we believe there has been significant consumer acceptance for our products as stand-alone brands, the image, reputation, popularity and talent of Martha Stewart and Emeril Lagasse remain important factors.
Ms. Stewart’s efforts, personality and leadership, including her services as an officer and director of MSLO, have been, and continue to be, critical to our success. While we have managed our business without her daily participation at times in the past, the repeated diminution or loss of her services due to disability, death or some other cause, or any repeated or sustained shifts in public or industry perceptions of her, could have a material adverse effect on our business. Ms. Stewart’s current employment agreement ends March 31, 2012. We expect to enter into an extension of Ms. Stewart’s employment agreement prior to its expiration.
13
Table of Contents
In addition, in 2008 we acquired the assets relating to Emeril Lagasse’s businesses other than his restaurants and foundation. The value of these assets is largely related to the ongoing popularity and participation of Mr. Lagasse in the activities related to exploiting these assets. Therefore, the continued value of these assets could be materially adversely affected if Mr. Lagasse were to lose popularity with the public or be unable to participate in our business, forcing us potentially to write-down a significant amount of the value we paid for these assets.
A loss of the services of other key personnel could have a material adverse effect on our business.
Our continued success depends to a large degree upon our ability to attract and retain key management executives, as well as upon a number of members of creative, technology, and sales and marketing staffs. The loss of some of our key executives or key members of our operating staff, or an inability to attract or retain other key individuals, could materially adversely affect us.
Failure of the economy to sustain a recovery or difficulties in the financial markets could significantly impact our business, financial condition, results of operations and cash flows, and could adversely affect the value of our assets or hamper our ability to raise additional funds.
The economy experienced extreme disruption during each of the three years in the period ended December 31, 2011, including extreme volatility in securities prices, severely diminished liquidity and a drastic reduction in credit availability. These events led to increased unemployment, a downturn in the housing market, declines in consumer confidence and declines in personal income and consumer spending, particularly discretionary spending. These adverse consumer trends led to reduced spending on general merchandise, homes and home improvement projects—categories in which we license our brands—resulting in weaker revenues from our licensed products in our Merchandising business.
This economic downturn also resulted in extraordinary and unprecedented uncertainty and instability for many companies, across all industries, and severely impacted many of the companies with which we do business. We depend on advertising revenue in our Publishing and Broadcasting businesses. We cannot control how much or where companies choose to advertise. Since 2009, we have seen a significant downturn in advertising dollars generally in the marketplace, and more competition for the reduced dollars. During the course of the advertising recession, we experienced a decline in advertising revenues, and a permanent reversal of that trend is not assured. If advertisers continue to spend less money, or if they advertise elsewhere in lieu of our magazines, websites or television programming, our business and revenues will be materially adversely affected. Furthermore, if our licensees experience financial hardship, they may be unwilling or unable to pay us royalties or continue selling our products, regardless of their contractual obligations. We cannot predict the future health and viability of the companies with which we do business and upon which we depend for royalty revenues, advertising dollars and credit.
Although economic conditions have stabilized and shown some indications of improvement, it is difficult to judge the scope and sustainability of any general economic recovery. This makes it difficult for us to forecast consumer and product demand trends and companies’ willingness to spend money to advertise in our media properties. While consumer spending and confidence have improved, consumer spending remains constrained. Unemployment remains and is expected to remain at high levels and the housing market remains weak and may in fact further deteriorate. If consumer confidence, consumer spending and the housing market do not rebound and/or if the companies with which we do business experience ongoing problems, our revenues may not grow as planned. An extended period of reduced cash flows could increase our need for credit at a time when such credit may not be available. Because of residual uncertainties regarding the economy, our operating results will be difficult to predict, and prior results will not necessarily be indicative of results to be expected in future periods.
In addition, we have significant goodwill, intangible and other assets recorded on our balance sheet. We evaluate the recoverability of the carrying amount of our goodwill, intangible and other assets on an ongoing
14
Table of Contents
basis, and we may in the future incur substantial impairment charges, which would adversely affect our financial results. Impairment assessment inherently involves the exercise of judgment in determining assumptions about expected future cash flows and the impact of market conditions on those assumptions. Although we believe the assumptions we have used in testing for impairment are reasonable, significant changes in any one of our assumptions could produce a significantly different result. Future events and changing market conditions may prove our assumptions to be wrong with respect to prices, costs, holding periods or other factors. Differing results may amplify impairment charges in the future.
Acquiring or developing additional brands or businesses poses inherent financial and other risks and challenges and may result in losses.
If we were to acquire or create a new brand, or expand an existing brand, we may be required to increase expenditures to accelerate the development process with the goal of achieving longer-term cost savings and improved profitability. Brand developments may increase expenses if we hire additional personnel to manage our growth. These investments also would require significant time commitments from our senior management and place a strain on their ability to manage our existing businesses.
We continue to evaluate the acquisition of other businesses. These transactions involve challenges and risks in negotiation, execution, valuation, and integration. Moreover, competition for certain types of acquisitions is significant, particularly in the field of interactive media. Even if successfully negotiated, closed, and integrated, an acquisition may not advance our business strategy and may result in losses.
We are expanding our merchandising and licensing programs into new areas and products, the failure of any of which could diminish the perceived value of our brand, impair our ability to grow and adversely affect our prospects.
Our growth depends to a significant degree upon our ability to develop new or expand existing retail merchandising programs. We have entered into several new merchandising and licensing agreements in the past few years. Some of these agreements are exclusive and have a duration of many years. While we require that our licensees maintain the quality of our respective brands through specific contractual provisions, we cannot be certain that our licensees, or their manufacturers and distributors, will honor their contractual obligations or that they will not take other actions that will diminish the value of our brands.
There is also a risk that our extension into new business areas will meet with disapproval from consumers. We cannot guarantee that these programs will be fully implemented, or if implemented, that they will be successful. If the licensing or merchandising programs do not succeed, we may be prohibited from seeking different channels for our products due to the exclusive nature and multi-year terms of these agreements. Disputes with new or existing licensees may arise that could hinder our ability to grow or expand our product lines. Disputes also could prevent or delay our ability to collect the licensing revenue that we expect in connection with these products. If such developments occur or our merchandising programs are otherwise not successful, the value and recognition of our brands, as well as our business, financial condition and prospects, could be materially adversely affected.
For example, a dispute with a current licensee is a lawsuit filed on January 23, 2012, against us in the Supreme Court of the State of New York, County of New York titled Macy’s, Inc. and Macy’s Merchandising Group, Inc. v. Martha Stewart Living Omnimedia, Inc. In this lawsuit, Macy’s Inc. and Macy’s Merchandising Group, Inc. (together, the “Macy’s plaintiffs”) claim that our planned activities under the agreement governing our strategic alliance with J.C. Penney Corporation, Inc. materially breach the agreement between us and Macy’s Merchandising Group, Inc. dated April 3, 2006 (the “Macy’s Agreement”). The Macy’s plaintiffs seek a declaratory judgment, preliminary and permanent injunctive relief, and incidental and other damages. The Macy’s plaintiffs initially filed a motion for a preliminary injunction and subsequently withdrew the motion without prejudice. On February 10, 2012, the Company filed an answer to the Macy’s plaintiffs’ original
15
Table of Contents
complaint and asserted three counterclaims against the Macy’s plaintiffs, alleging that Macy’s, Inc. and Macy’s Merchandising Group, Inc. had breached the Macy’s Agreement by, among other things, failing to maximize net sales. The Macy’s plaintiffs have denied the allegations of the counterclaims. If the Macy’s plaintiffs are successful and we are enjoined, some of the future benefits we anticipate receiving from our relationship with J. C. Penney could be reduced.
If adverse trends develop in the television production business generally, or if we were unable to sustain a television presence, our business could be adversely affected.
Television revenues may be affected by a number of other factors, most of which are not within our control. These factors include a general decline in daytime television viewers, pricing pressure in the television advertising marketplace, the strength of the channel on which our programming is carried, general economic conditions, increases in production costs, availability of other forms of entertainment and leisure time activities and other factors. Any or all of these factors may quickly change, and these changes cannot be predicted with certainty. There has been a reduction in advertising dollars generally available and more competition for the reduced dollars across more media platforms.
The Martha Stewart Show has experienced a decline in ratings in 2011 compared to 2010 that reflect the general decline in daytime cable television viewers. If ratings for the show were to further decline, it would adversely affect our Broadcasting advertising revenues.
In addition, if we are unsuccessful in creating replacement programming forThe Martha Stewart Show, which is expected to only air through September 2012, or if visibility of Ms. Stewart on different television programming formats is diminished, Broadcasting segment revenues will be severely reduced. Publishing segment advertising revenues could be negatively impacted, as well as opportunities for multi-platform advertising sales.
We have also produced television shows featuring Emeril Lagasse. Emeril’s failure to maintain or build popularity could negatively impact his marketing platform and his products, as well as the loss of anticipated revenue and profits from his television shows.
We have placed emphasis on building an advertising-revenue-based website, dependent on a large consumer audience and resulting page views. Failure to maintain growth could adversely affect our brand and business prospects.
Our growth depends to a significant degree upon the continued development and growth of our digital properties. We have had failures with direct commerce in the past, and only limited experience in building an advertising-revenue-based website. When initial results from the re-launch of themarthastewart.com site in the second quarter of 2007 were below expectations, we made changes to the site and continue to enhance and upgrade the site including the 2010/2011 initiative to re-platformmarthastewart.com. We cannot be certain that those changes will enable us to sustain growth for our website in the long term. In addition, the competition for advertising dollars has intensified. In order for our digital properties to succeed, we must, among other things maintain and continue to:
| • | significantly increase our online audience and advertising revenue; |
| • | attract and retain a base of frequent visitors to our website; |
| • | expand the content, products and interactive experiences we offer on our website; |
| • | respond to competitive developments while maintaining a distinct brand identity; |
| • | develop and upgrade our technologies so that they can support more efficient and effective migration of content from the print platform and provide a more robust user experience; and |
| • | bring innovative product features to market in a timely manner. |
16
Table of Contents
We cannot be certain that we will be successful in achieving these and other necessary objectives. If we are not successful in achieving these objectives, our business, financial condition and prospects could be materially adversely affected.
If we are unable to predict, respond to and influence trends in what the public finds appealing, our business will be adversely affected.
Our continued success depends on our ability to provide creative, useful and attractive ideas, information, concepts, programming, content and products that strongly appeal to a large number of consumers, as well as distributing the content through the latest technology and traditional channels. In order to accomplish this, we must be able to respond quickly and effectively to changes in consumer tastes for ideas, information, concepts, programming, technology, content and products. The strength of our brands and our business units depends in part on our ability to influence tastes through broadcasting, print publication, digital distribution and merchandising. We cannot be sure that our new ideas and content will have the appeal and garner the acceptance that they have in the past, or that we will be able to respond quickly to changes in the tastes of homemakers and other consumers and their appetite for new technology.
Absence of new product launches may reduce our earnings or generate losses.
Our future success will depend in part on our ability to continue offering new products and services that successfully gain market acceptance by addressing the needs of our current and future customers. Our efforts to introduce new products or integrate acquired products may not be successful or profitable. The process of internally researching and developing, launching, gaining acceptance and establishing profitability for a new product, or assimilating and marketing an acquired product, is both risky and costly. New products generally incur initial operating losses. Costs related to the development of new products and services are generally expensed as incurred and, accordingly, our profitability from year to year may be adversely affected by the number and timing of new product launches. For example, we had a cumulative loss of $15.7 million in connection withBlueprint, which we ceased publishing in 2007. Other businesses and brands that we may develop also may prove not to be successful.
Our principal print business vendors are consolidating and this may adversely affect our business and operations.
We rely on certain principal vendors in the print portion of our Publishing segment and their ability or willingness to sell goods and services to us at favorable prices and other terms. Many factors outside our control may harm these relationships and the ability and willingness of these vendors to sell these goods and services to us on favorable terms. Our principal vendors include paper suppliers, printers, subscription fulfillment houses, subscription agents and national newsstand wholesalers, distributors and retailers. Each of these industries in recent years has experienced consolidation among its principal participants. Further consolidation may result in decreased competition, which may lead to greater dependence on certain vendors and increased prices; as well as interruptions and delays in services provided by such vendors, all of which could adversely affect our results of operations. As a result of many paper mills consolidating their operations, we experienced paper price increases in 2011.
We may be adversely affected by fluctuations in paper, postage and distribution costs.
In our Publishing segment, our principal raw material is paper for the print portion of that business. Paper prices have fluctuated over the past several years. We generally purchase paper from major paper suppliers who adjust the price periodically. We have not entered, and do not currently plan to enter, into long-term forward price or option contracts for paper. Accordingly, significant increases in paper prices would adversely affect our future results of operations.
17
Table of Contents
Postage for magazine distribution is also one of our significant expenses. We primarily use the U.S. Postal Service to distribute magazine subscriptions. In recent years, postage rates have increased, and a significant further increase in postage prices could adversely affect our future results of operations. We may not be able to recover, in whole or in part, paper or postage cost increases.
Distribution of magazines to newsstands and bookstores is conducted primarily through companies known as wholesalers. Wholesalers have in the past advised us that they intended to increase the price of their services. We have not experienced any material increase to date; however, some wholesalers have experienced credit and going concern risks. It is possible that other wholesalers likewise may seek to increase the price of their services or discontinue operations. An increase in the price of our wholesalers’ services could have a material adverse effect on our results of operations. The need to change wholesalers could cause a disruption or delay in deliveries, which could adversely impact our results of operations.
We may be adversely affected by a continued weakening of newsstand sales.
The magazine industry has seen a weakening of newsstand sales during the past few years. A continuation of this decline would adversely affect our financial condition and results of operations by further reducing our circulation revenue and causing us to either incur higher circulation expenses to maintain our rate bases, or to reduce our rate bases, which would in turn negatively impact our revenue.
Our websites and internal networks may be vulnerable to unauthorized persons accessing our systems, which could disrupt our operations and result in the theft of our proprietary information.
Our website activities involve the storage and transmission of proprietary information, which we endeavor to protect from third party access. However, it is possible that unauthorized persons may be able to circumvent our protections and misappropriate proprietary information or cause interruptions or malfunctions in our digital operations. We may be required to spend significant capital and other resources to protect against or remedy any such security breaches. Accordingly, security breaches could expose us to a risk of loss due to business interruption, or litigation. Our security measures and contractual provisions attempting to limit our liability in these areas may not be successful or enforceable.
Martha Stewart controls our Company through her stock ownership, enabling her to elect most of our board of directors, and potentially to block matters requiring stockholder approval, including any potential changes of control.
Ms. Stewart controls all of our outstanding shares of Class B Common Stock, representing over 89% of our voting power. The Class B Common Stock has ten votes per share, while Class A Common Stock, which is the stock available to the public, has one vote per share. Because of this dual-class structure, Ms. Stewart has a disproportionately influential vote. As a result, Ms. Stewart has the ability to control unilaterally the outcome of all matters requiring stockholder approval, including the election and removal of all directors other than the two directors whose election is controlled by J.C. Penney and generally any merger, consolidation or sale of all or substantially all of our assets, and indirectly the ability to control our management and affairs. Ms. Stewart’s concentrated control could, among other things, discourage others from initiating any potential merger, takeover or other change of control transaction that may otherwise be beneficial to our businesses and stockholders.
Our intellectual property may be infringed upon or others may accuse us of infringing on their intellectual property, either of which could adversely affect our business and result in costly litigation.
Our business is highly dependent upon our creativity and resulting intellectual property. We are susceptible to others imitating our products and infringing our intellectual property rights. We may not be able to successfully protect our intellectual property rights, upon which we depend. In addition, the laws of many foreign
18
Table of Contents
countries do not protect intellectual property rights to the same extent as do the laws of the United States. Imitation of our products or infringement of our intellectual property rights could diminish the value of our brands or otherwise adversely affect our revenues. If we are alleged to have infringed the intellectual property rights of another party, any resulting litigation could be costly, affecting our finances and our reputation. Litigation also diverts the time and resources of management, regardless of the merits of the claim. There can be no assurance that we would prevail in any litigation relating to our intellectual property. If we were to lose such a case, and be required to cease the sale of certain products or the use of certain technology or if we were forced to pay monetary damages, the results could adversely affect our financial condition and our results of operations.
We operate in three highly competitive businesses: Publishing, Broadcasting and Merchandising, each of which subjects us to competitive pressures and other uncertainties.
We face intense competitive pressures and uncertainties in each of our three businesses.
Our magazines, books and related publishing products compete not only with other magazines, books and publishing products, but also with other mass media, websites, and many other types of leisure-time activities. We face significant competition from a number of print and website publishers, some of which have greater financial and other resources than we have, which may enhance their ability to compete in the markets we serve. As advertising budgets have diminished, the competition for advertising dollars has intensified. Competition for advertising revenue in publications is primarily based on advertising rates, the nature and scope of readership, reader response to the promotions for advertisers’ products and services, the desirability of the magazine’s demographic and the effectiveness of advertising sales teams. Other competitive factors in publishing include product positioning, editorial quality, circulation, price, customer service, circulation revenues and, ultimately, advertising revenues. Our websites compete with other how-to, food and lifestyle websites. Our challenge is to attract and retain users through an easy-to-use and content-relevant website. Competition for digital adverting is based on the number of unique users we attract each month, the demographic profile of that audience and the number of pages they view on our site. Because some forms of media have relatively low barriers to entry, we anticipate that additional competitors, some of which have greater resources than we do, may enter these markets and intensify competition.
Our television programs compete directly for viewers, distribution and/or advertising dollars with other lifestyle and how-to television programs, as well as with general programming and all other competing forms of media. Overall competitive factors in Broadcasting include programming content, quality and distribution, as well as the demographic appeal of the programming. Competition for television and radio advertising dollars is based primarily on advertising rates, audience size and demographic composition, viewer response to advertisers’ products and services and the effectiveness of the advertising sales staff. Our radio programs compete for listeners with similarly themed programming on both satellite and terrestrial radio.
Our Merchandising segment competitors consist of mass-market and department stores that compete with the mass-market, home improvement and department stores in which our Merchandising segment products are sold. Our merchandising lines also compete within the mass-market, home improvement and department stores that carry our product lines with other products offered by these stores in the respective product categories. We also compete with the internet businesses of these stores and other websites that sell similar retail goods.
Our failure to meet the competitive pressures in any of these segments could negatively impact our results of operations and financial condition.
Item 1B.Unresolved Staff Comments.
None.
19
Table of Contents
Information concerning the location, use and approximate square footage of our principal facilities as of December 31, 2011, all of which are leased, is set forth below:
Location | Use | Approximate Area in Square Feet | ||||
601 West 26th Street New York, NY | Product design facilities, photography studio, test kitchens and property storage
Principal executive and administrative offices; Publishing segment offices; Corporate offices; and advertising sales offices | 218,249 | ||||
226 West 26th Street New York, NY | Executive and administrative office for television production | 24,586 | ||||
221 West 26th Street New York, NY | Television production facilities | 23,723 | ||||
Satellite Sales Offices in Michigan, Illinois and California | Advertising sales offices | 7,271 | ||||
We expect to vacate our television production facilities at 221 West 26th Street and our executive and administrative office for television production at 226 West 26th Street at the end of the second quarter of 2012. The other leases for our offices and facilities expire between 2012 and 2018, and some of these leases are subject to our renewal.
We also have an intangible asset agreement covering our use of various properties owned by Martha Stewart for our editorial, creative and product development processes. These living laboratories allow us to experiment with new designs and new products, such as garden layouts, help generate ideas for new content available to all of our media outlets and serve as locations for photo spreads and television segments. The description of this intangible asset agreement is incorporated by reference into Item 13 and disclosed in the related party transaction disclosure in Note 11,Related Party Transactions, in the Notes to Consolidated Financial Statements of this Annual Report on Form 10-K.
We believe that our existing facilities are well maintained and in good operating condition.
On January 23, 2012, Macy’s Inc. and Macy’s Merchandising Group, Inc. filed a lawsuit against us in the Supreme Court of the State of New York, County of New York titled Macy’s, Inc. and Macy’s Merchandising Group, Inc. v. Martha Stewart Living Omnimedia, Inc. In such lawsuit, the Macy’s plaintiffs claim that our planned activities under our commercial agreement with J.C. Penney Corporation, Inc. (“JCP”) materially breach the agreement between us and Macy’s Merchandising Group, Inc. dated April 3, 2006. The Macy’s plaintiffs seek a declaratory judgment, preliminary and permanent injunctive relief, and incidental and other damages. The Macy’s plaintiffs initially filed a motion for a preliminary injunction and subsequently withdrew the motion without prejudice. On February 10, 2012, we filed an answer to the Macy’s plaintiffs’ original complaint and asserted three counterclaims against the Macy’s plaintiffs, alleging that Macy’s Inc. and Macy’s Merchandising Group, Inc. had breached the Macy’s Agreement by, among other things, failing to maximize net sales. The Macy’s plaintiffs have denied the allegations of the counterclaims. We believe that we have meritorious defenses to the claims made by the Macy’s plaintiffs, and we intend to vigorously defend such claims. Litigation costs in this matter may be significant.
We are party to legal proceedings in the ordinary course of business, including product liability claims for which we are indemnified by our licensees[, other than Macy’s]. None of these proceedings is deemed material.
Item 4.Mine Safety Disclosures.
Not applicable.
20
Table of Contents
PART II
Item 5.Market for Registrant’s Common Equity, Related Stockholder Matters and Issuer Purchases of Equity Securities.
Market for the Common Stock
Our Class A Common Stock is listed and traded on The New York Stock Exchange (the “NYSE”). Our Class B Common Stock is not listed or traded on any exchange, but is convertible into Class A Common Stock at the option of its owner on a share-for-share basis. The following table sets forth the high and low sales price of our Class A Common Stock as reported by the NYSE for each of the periods listed.
| Q1 2010 | Q2 2010 | Q3 2010 | Q4 2010 | Q1 2011 | Q2 2011 | Q3 2011 | Q4 2011 | |||||||||||||||||||||||||
High Sales Price | $ | 6.15 | $ | 7.45 | $ | 5.75 | $ | 4.96 | $ | 4.54 | $ | 5.49 | $ | 4.75 | $ | 5.19 | ||||||||||||||||
Low Sales Price | $ | 4.36 | $ | 4.89 | $ | 4.28 | $ | 4.25 | $ | 3.40 | $ | 3.45 | $ | 2.97 | $ | 2.77 | ||||||||||||||||
As of March 1, 2012, there were 7,572 record holders of our Class A Common Stock and one record holder of our Class B Common Stock. This does not include the number of persons whose stock is in nominee or “street name” accounts through brokers.
Dividends
We do not pay regular quarterly dividends. However, in December 2011, our Board of Directors declared and paid a special one-time dividend of $0.25 per share of common stock for a total dividend payment of $16.7 million.
Recent Sales of Unregistered Securities and Use of Proceeds
As previously reported, on December 6, 2011, JCP purchased 11 million newly issued shares of our $0.01 par value Class A Common Stock and one share of our Series A Preferred Stock in exchange for cash of $38.5 million.
Issuer Purchases of Equity Securities
The following table provides information about our purchases of our Class A Common Stock during each month of the quarter ended December 31, 2011:
Period | Total Number of Shares (or Units) Purchased (1) | Average Price Paid per Share (or Unit) | Total Number of Shares (or Units) Purchased as Part of Publicly Announced Plans or Programs | Maximum Number (or Approximate Dollar Value) of Shares (or Units) that May Yet Be Purchased under the Plans or Programs | ||||||||||||
October 2011 | 1,539 | $ | 3.12 | Not applicable | Not applicable | |||||||||||
November 2011 | — | — | Not applicable | Not applicable | ||||||||||||
December 2011 | — | — | Not applicable | Not applicable | ||||||||||||
|
|
|
| |||||||||||||
Total | 1,539 | $ | 3.12 | |||||||||||||
| (1) | Represents shares withheld by, or delivered to us pursuant to provisions in agreements with recipients of restricted stock granted under our stock incentive plans allowing us to withhold, or the recipient to deliver to us, the number of shares having the fair value equal to tax withholding due. |
21
Table of Contents
Notwithstanding anything to the contrary set forth in any of our filings under the Securities Act or the Exchange Act, the following performance graph shall not be deemed to be incorporated by reference into any such filings.
PERFORMANCE GRAPH
The following graph compares the performance of our Class A Common Stock with that of the Standard & Poor’s 500 Stock Index (“S&P 500 Composite Index”) and the stocks included in the Media General Financial Services database under the Standard Industry Code 2721 (Publishing-Periodicals) (the “SIC Code Index”*) during the period commencing on January 1, 2007 and ending on December 31, 2011. The graph assumes that $100 was invested in each of our Class A Common Stock, the S&P 500 Composite Index and the SIC Code Index at the beginning of the relevant period, is calculated as of the end of each calendar month and assumes reinvestment of dividends. The performance shown in the graph represents past performance and should not be considered an indication of future performance.
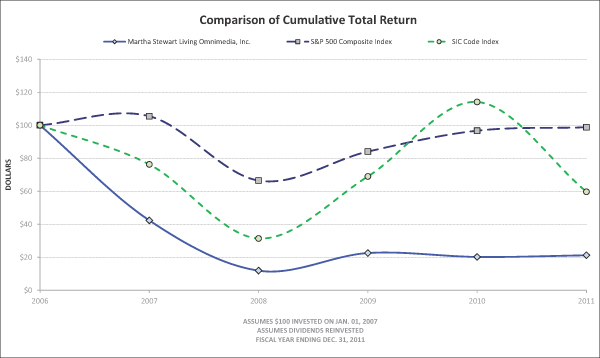
| * | The SIC Code Index consists of companies that are primarily publishers of periodicals, although many also conduct other businesses, including owning and operating television stations and cable networks, and is weighted according to market capitalization of the companies in the index. The hypothetical investment assumes investment in a portfolio of equity securities that mirror the composition of the SIC Code Index. |
22
Table of Contents
Item 6.Selected Financial Data.
The information set forth below for the five years ended December 31, 2011 is not necessarily indicative of results of future operations, and should be read in conjunction with Item 7, “Management’s Discussion and Analysis of Financial Condition and Results of Operations” and the consolidated financial statements and related notes thereto incorporated by reference into Item 8 of this Annual Report on Form 10-K. The Notes to Selected Financial Data below include certain factors that may affect the comparability of the information presented below (in thousands, including per share amounts).
| 2011 | 2010 | 2009 | 2008 | 2007 | ||||||||||||||||
INCOME STATEMENT DATAREVENUES | ||||||||||||||||||||
Publishing | $ | 140,857 | $ | 145,573 | $ | 146,100 | $ | 179,116 | $ | 202,916 | ||||||||||
Broadcasting | 31,962 | 42,434 | 46,111 | 47,328 | 40,263 | |||||||||||||||
Merchandising | 48,614 | 42,806 | 52,566 | 57,866 | 84,711 | |||||||||||||||
|
|
|
|
|
|
|
|
|
| |||||||||||
Total revenues | 221,433 | 230,813 | 244,777 | 284,310 | 327,890 | |||||||||||||||
|
|
|
|
|
|
|
|
|
| |||||||||||
Operating (loss) income | (18,594 | ) | (8,663 | ) | (11,968 | ) | (10,857 | ) | 7,714 | |||||||||||
|
|
|
|
|
|
|
|
|
| |||||||||||
Net (loss) income | $ | (15,519 | ) | $ | (9,596 | ) | $ | (14,578 | ) | $ | (15,665 | ) | $ | 10,289 | ||||||
|
|
|
|
|
|
|
|
|
| |||||||||||
PER SHARE DATA | ||||||||||||||||||||
Earnings/(loss) per share: | ||||||||||||||||||||
Basic and diluted—Net (loss) income | $ | (0.28 | ) | $ | (0.18 | ) | $ | (0.27 | ) | $ | (0.29 | ) | $ | 0.20 | ||||||
|
|
|
|
|
|
|
|
|
| |||||||||||
Weighted average common shares outstanding: | ||||||||||||||||||||
Basic | 55,881 | 54,440 | 53,880 | 53,360 | 52,449 | |||||||||||||||
Diluted | 55,881 | 54,440 | 53,880 | 53,360 | 52,696 | |||||||||||||||
Dividends per common share | $ | 0.25 | $ | — | $ | — | $ | — | $ | — | ||||||||||
FINANCIAL POSITION | ||||||||||||||||||||
Cash and cash equivalents | $ | 38,453 | $ | 23,204 | $ | 25,384 | $ | 50,204 | $ | 30,536 | ||||||||||
Short-term investments | 11,051 | 10,091 | 13,085 | 9,915 | 26,745 | |||||||||||||||
Total assets | 216,120 | 222,314 | 229,791 | 261,285 | 255,267 | |||||||||||||||
Long-term obligations | — | 7,500 | 13,500 | 19,500 | — | |||||||||||||||
Shareholders’ equity | 147,947 | 139,033 | 143,820 | 150,995 | 155,529 | |||||||||||||||
OTHER FINANCIAL DATA | ||||||||||||||||||||
Cash flow (used in) provided by operating activities | $ | (2,220 | ) | $ | 1,872 | $ | (9,273 | ) | $ | 39,699 | $ | 8,306 | ||||||||
Cash flow (used in) provided by investing activities | 6,886 | 153 | (9,617 | ) | (38,856 | ) | (6,606 | ) | ||||||||||||
Cash flow (used in) provided by financing activities | 10,583 | (4,205 | ) | (5,930 | ) | 18,825 | 308 | |||||||||||||
NOTES TO SELECTED FINANCIAL DATA
(Loss) / income from continuing operations
2011 results include restructuring charges of approximately $5.1 million.
2010results include the recognition of substantially all of the exclusive license fee of approximately $5.0 million from Hallmark Channel for a significant portion of our library of programming, as well as licensing revenue for other new programming delivered to Hallmark Channel.
2009results include a net benefit to operating loss of approximately $20 million from certain items including the revenue from Kmart of $14.5 million, the recognition of previously deferred Kmart Corporation (“Kmart”) royalties of $10.0 million as non-cash revenue, an incremental $3.9 million from the conclusion of our
23
Table of Contents
relationship with TurboChef Technologies, Inc. (“TurboChef”), a $3.0 million cash receipt related to a make-whole payment and a non-cash impairment charge of $11.4 million related to a cost-based equity investment in United Craft MS Brands LLC recorded in the Merchandising segment.
2008results include revenues from Kmart of $23.8 million, as well as a $9.3 million non-cash goodwill impairment charge recorded in the Publishing segment.
2007results include revenues from Kmart of $64.3 million, as well as non-cash equity compensation expense of $6.0 million due to the vesting of the final warrant granted to Mark Burnett in connection with the production ofThe Martha Stewart Show.
24
Table of Contents
Item 7.Management’s Discussion and Analysis of Financial Condition and Results of Operations.
EXECUTIVE SUMMARY
We are an integrated media and merchandising company providing consumers with inspiring lifestyle content and programming, and high-quality, licensed products that we design. We are organized into three business segments: Publishing and Broadcasting representing our media platforms; and Merchandising. Summarized below are our operating results for 2011, 2010 and 2009.
| 2011 | 2010 | 2009 | ||||||||||
Total Revenues | $ | 221,433 | $ | 230,813 | $ | 244,777 | ||||||
Total Operating Costs and Expenses | (240,027 | ) | (239,476 | ) | (256,745 | ) | ||||||
|
|
|
|
|
| |||||||
Total Operating Loss | $ | (18,594 | ) | $ | (8,663 | ) | $ | (11,968 | ) | |||
|
|
|
|
|
| |||||||
We generate revenue from various sources such as advertising customers and licensing partners. Publishing is our largest business segment, accounting for 64% of our total revenues in 2011. The primary source of Publishing segment revenue is advertising from our magazines, which includeMartha Stewart Living,Martha Stewart Weddings,Everyday Food andWhole Living. Magazine subscriptions, advertising revenue generated from our digital properties and newsstand sales, along with royalties from our book business, account for most of the balance of Publishing segment revenue. Broadcasting segment revenue is derived primarily from television advertising and license fees from our agreement with Hallmark Channel, as well as satellite radio advertising and license fees. Television programming is comprised ofThe Martha Stewart Show, a daily home and lifestyle show,Martha Bakes and other holiday and interview specials featuring Martha Stewart. In addition, we produce television programming featuring other talent, including programs featuring Chef Emeril Lagasse, Mad Hungry with Lucinda Scala Quinn andPetkeeping with Marc Morrone. The satellite radio programming that we produce airs as theMartha Stewart Living Radio channel on Sirius XM Radio. Merchandising segment revenues are generated from the licensing of our trademarks and designs for a variety of products sold at multiple price points through a wide range of distribution channels. Our retail partnerships include ourMartha Stewart Living program at The Home Depot and ourMartha Stewart Collection at Macy’s. We have manufacturing partnerships with Wilton Properties Inc. for ourMartha Stewart Crafts program and with Age Group for ourMartha Stewart Pets line, as well as with a variety of manufacturing partnerships to produce products under the Emeril Lagasse brand. In 2012, we expect to earn revenues from Avery for our Martha Stewart Home Office line and from our J.C. Penney alliance for our initial design efforts.
We incur expenses primarily consisting of compensation and related charges across all segments. In addition, we incur expenses related to the physical costs associated with producing magazines (including related direct mail and other marketing expenses), the editorial costs associated with creating content across our media platforms, the technology costs associated with our digital properties and the costs associated with producing our television programming. We also incur general overhead costs, including facilities and related expenses. In 2011, we incurred restructuring charges associated with the installation of a new executive management team and the implementation of their strategic vision. The restructuring charges primarily consisted of employee severance and other employee-related termination costs, as well as certain consulting and recruiting costs.
25
Table of Contents
Detailed segment operating results for 2011, 2010 and 2009 are summarized below.
| 2011 | 2010 | 2009 | ||||||||||
Segment Revenues: | ||||||||||||
Publishing Segment | $ | 140,857 | $ | 145,573 | $ | 146,100 | ||||||
Broadcasting Segment | 31,962 | 42,434 | 46,111 | |||||||||
Merchandising Segment | 48,614 | 42,806 | 52,566 | |||||||||
|
|
|
|
|
| |||||||
TOTAL REVENUES | 221,433 | 230,813 | 244,777 | |||||||||
Segment Operating Costs and Expenses: | ||||||||||||
Publishing Segment | (147,321 | ) | (142,923 | ) | (146,269 | ) | ||||||
Broadcasting Segment | (36,702 | ) | (44,012 | ) | (39,971 | ) | ||||||
Merchandising Segment | (18,642 | ) | (17,805 | ) | (26,915 | ) | ||||||
|
|
|
|
|
| |||||||
TOTAL OPERATING COSTS AND EXPENSES BEFORE CORPORATE EXPENSES | (202,665 | ) | (204,740 | ) | (213,155 | ) | ||||||
Operating Income / (Loss): | ||||||||||||
Publishing Segment | (6,464 | ) | 2,650 | (169 | ) | |||||||
Broadcasting Segment | (4,740 | ) | (1,578 | ) | 6,140 | |||||||
Merchandising Segment | 29,972 | 25,001 | 25,651 | |||||||||
|
|
|
|
|
| |||||||
Total Segment Operating Income Before Corporate Expenses | 18,768 | 26,073 | 31,622 | |||||||||
Corporate Expenses * | (37,362 | ) | (34,736 | ) | (43,590 | ) | ||||||
|
|
|
|
|
| |||||||
TOTAL OPERATING LOSS | $ | (18,594 | ) | $ | (8,663 | ) | $ | (11,968 | ) | |||
|
|
|
|
|
| |||||||
| * | Corporate expenses include unallocated costs of items such as compensation and related costs for certain departments such as executive, finance, legal, human resources, office services and information technology, as well as allocated portions of rent and related expenses for these departments that reflect current utilization of office space. Unallocated expenses are recorded as Corporate expenses because these items are directed and controlled by central management and not our segment management and therefore should not be included as part of our segment operating performance. |
2011 Operating Results Compared to 2010 Operating Results
In 2011, total revenues decreased 4% from 2010 largely due to lower television and print advertising revenue. The 2010 revenues also included royalties related to our Kmart and 1-800-Flowers.com agreements, which ended in January 2010 and June 2010, respectively, and the $2.2 million termination payment that we received from 1-800-Flowers.com, as well as substantially all of the exclusive license fee of approximately $5.0 million from Hallmark Channel for a significant portion of our library of programming. The 2010 revenues further included a $1.0 million one-time payment received from a manufacturing partner. The reduced television and print advertising revenues and the absence of these 2010 items were partially offset by higher 2011 television revenue from license fees related to our new programming on Hallmark Channel, an increase in Merchandising segment revenues from increased sales by certain of our existing partners and higher digital advertising revenue.
In 2011, our operating costs and expenses before Corporate expenses decreased 1% from 2010 predominantly due to lower television production and distribution costs related to seasons 6 and 7 ofThe Martha Stewart Show in our Broadcasting segment, as well as lower advertising staff costs from the reorganization of our advertising sales department in the fourth quarter of 2010 in both the Publishing and Broadcasting segments. These decreases in costs were partially offset by higher paper, printing and distribution expenses, higher content creation costs and higher subscriber acquisition costs in our Publishing segment in 2011, as well as higher expenses associated with our expanded merchandising relationships. Segment operating costs and expenses before Corporate expenses included restructuring charges, which mainly consisted of employee severance and certain consulting costs.
26
Table of Contents
Corporate expenses increased 8% in 2011 as compared to 2010 primarily due to restructuring charges. These Corporate restructuring charges, which consisted of employee severance and other employee-related termination costs, as well as certain consulting and recruiting costs, were partially offset by the reallocation of facilities-related expenses primarily to the Publishing segment, as described further in the segment discussion below.
2010 Operating Results Compared to 2009 Operating Results
In 2010, total revenues decreased approximately 6% from 2009 due predominantly to the conclusion of our Kmart agreement, which ended in January 2010, as well as the absence of TurboChef revenue in 2010. Revenues also declined in 2010 due to lower magazine subscription revenue, lower licensing fees related to our radio agreement with Sirius XM Radio, and lower print and television advertising revenues. Partially offsetting these decreases was an increase in revenues from Merchandising segment partners other than Kmart in 2010 from 2009, including a one-time $1.0 million payment received from a manufacturing partner, as well as higher 2010 television revenue from license fees from the delivery of new programming, an exclusive license fee of approximately $5.0 million from Hallmark Channel for a significant portion of our library of television programming and higher digital advertising revenue.
In 2010, our operating costs and expenses before Corporate expenses decreased approximately 4% from 2009. The 2009 operating costs and expenses were impacted by non-cash impairment charges in the Merchandising segment of $11.4 million related to our cost-based equity investment in United Craft MS Brands, LLC. Separately, 2009 results were favorably impacted by a $3.0 million cash make-whole payment in the Merchandising segment. Excluding these two items, our segment operating costs and expenses in 2010 were approximately flat with 2009, as increases in Broadcasting production costs related to the delivery of new programming were offset by declines in Publishing general and administrative, which benefited from lower headcount and facilities-related costs, as well as depreciation and amortization expenses, which decreased primarily due to full depreciation by the second quarter of 2010 of the costs associated with the 2007 launch of our redesigned website.
Corporate general and administrative expenses decreased in 2010 compared to 2009 due to lower rent expense as a result of the consolidation of certain offices and lower cash and non-cash bonuses and lower compensation-related expenses.
Liquidity
During 2011, our overall cash, cash equivalents and short-term investments increased $16.2 million from December 31, 2010 largely from the proceeds received from issuing 11.0 million shares of our Class A Common Stock and one share of Series A Preferred Stock to JCP in exchange for $38.5 million and the proceeds from selling our cost-based investment in WeddingWire for $11.0 million. These proceeds were partially offset by the payment of a special one-time dividend of $16.7 million, the complete repayment of our outstanding term loan balance of $9.0 million with Bank of America, N.A. (“Bank of America”) and cash used for capital expenditures and operations during 2011. Cash, cash equivalents and short-term investments were $49.5 million and $33.3 million at December 30, 2011 and December 31, 2010, respectively.
27
Table of Contents
RESULTS OF OPERATIONS
Comparison of 2011 to 2010.
PUBLISHING SEGMENT
(in thousands) | 2011 | 2010 | Better / (Worse) | |||||||||
Publishing Segment Revenues | ||||||||||||
Print Advertising | $ | 67,740 | $ | 73,797 | $ | (6,057 | ) | |||||
Digital Advertising | 23,366 | 21,420 | 1,946 | |||||||||
Circulation | 46,109 | 46,442 | (333 | ) | ||||||||
Books | 1,814 | 2,756 | (942 | ) | ||||||||
Other | 1,828 | 1,158 | 670 | |||||||||
|
|
|
|
|
| |||||||
Total Publishing Segment Revenues | $ | 140,857 | $ | 145,573 | $ | (4,716 | ) | |||||
|
|
|
|
|
| |||||||
Publishing Segment Operating Costs and Expenses | ||||||||||||
Production, distribution and editorial | (86,197 | ) | (82,433 | ) | (3,764 | ) | ||||||
Selling and promotion | (51,036 | ) | (52,872 | ) | 1,836 | |||||||
General and administrative | (8,486 | ) | (6,491 | ) | (1,995 | ) | ||||||
Depreciation and amortization | (774 | ) | (1,127 | ) | 353 | |||||||
Restructuring charges | (828 | ) | — | (828 | ) | |||||||
|
|
|
|
|
| |||||||
Total Publishing Segment Operating Costs and Expenses | $ | (147,321 | ) | $ | (142,923 | ) | $ | (4,398 | ) | |||
|
|
|
|
|
| |||||||
Publishing Segment Operating (Loss) / Income | $ | (6,464 | ) | $ | 2,650 | $ | (9,114 | ) | ||||
|
|
|
|
|
| |||||||
Publishing segment revenues decreased 3% in 2011 from the prior year. Print advertising revenue decreased $6.1 million in 2011 from 2010 due to the decrease in advertising pages inMartha Stewart Living,Everyday Food andWhole Living, partially offset by higher rates across these three publications.Martha Stewart Weddings advertising revenue increased due to an increase in advertising pages, partially offset by lower rates. Digital advertising revenue increased $1.9 million in 2011 from 2010 due to an increase in sold advertising volume, partially offset by lower rates. Circulation revenue was essentially flat in 2011 as compared to 2010 due to lower newsstand sales ofMartha Stewart Living,Everyday Food andWhole Living, partially offset by the sales of the special issue ofEveryday Food with no comparable special interest publication in the prior year, as well as higher newsstand sales ofMartha Stewart Weddings. Also offsetting the decline in combined newsstand sales was the increase in volume of subscription copies ofMartha Stewart Living at higher revenues per copy from 2010. Revenue related to our books business decreased $0.9 million primarily due to the delivery and acceptance in 2011 of lower-value manuscripts related to our multi-book agreements with Clarkson Potter/Publishers for Martha Stewart books. Other revenue increased $0.7 million primarily due to increased digital distribution and sales of our content on portable devices, including iPad versions of our titles and iPad/iPhone apps.
Magazine Publication Schedule Year ended December 31, | 2011 | 2010 | ||||||
Martha Stewart Living | 12 Issues | 12 Issues | ||||||
Martha Stewart Weddings(a) | 4 Issues | 4 Issues | ||||||
Everyday Food | 10 Issues | 10 Issues | ||||||
Whole Living | 10 Issues | 10 Issues | ||||||
Special Interest Publications | 4 Issues | 3 Issues | ||||||
| (a) | In both 2011 and 2010 we published one special issue ofMartha Stewart Weddings. |
Production, distribution and editorial expenses increased $3.8 million in 2011 from 2010 due to higher paper, printing and distribution prices and the costs associated with the additional special issue ofEveryday Food. Production, distribution and editorial expenses also increased due to higher art and editorial compensation
28
Table of Contents
and story costs to support the digital and print magazines, books, websites and other digital initiatives, partially offset by savings from a lower volume of magazine pages produced. Selling and promotion expenses decreased $1.8 million due to lower staff costs primarily from the fourth quarter 2010 reorganization of our advertising sales department, lower advertising sales commission costs and lower print advertising marketing expenses. These decreases were partially offset by higher subscriber acquisition costs, higher newsstand marketing costs and higher digital marketing and advertising operations costs supporting the increase in digital advertising revenues. General and administrative expenses increased $2.0 million largely due to a higher allocation of facilities-related expenses to our Publishing segment to reflect the 2011 utilization of office space, as well as higher compensation expense. The increase in our Publishing segment rent allocation was offset by a decrease in the Corporate rent allocation. Depreciation and amortization expenses decreased by $0.4 million during 2011 compared to 2010 reflecting the full depreciation during the second quarter of 2010 of the costs associated with our 2007 launch of our redesigned website. Restructuring charges included employee severance and certain consulting costs.
BROADCASTING SEGMENT
(in thousands) | 2011 | 2010 | Better / (Worse) | |||||||||
Broadcasting Segment Revenues | ||||||||||||
Advertising | $ | 15,201 | $ | 23,499 | $ | (8,298 | ) | |||||
Radio | 3,343 | 3,500 | (157 | ) | ||||||||
Licensing and other | 13,418 | 15,435 | (2,017 | ) | ||||||||
|
|
|
|
|
| |||||||
Total Broadcasting Segment Revenues | $ | 31,962 | $ | 42,434 | $ | (10,472 | ) | |||||
|
|
|
|
|
| |||||||
Broadcasting Segment Operating Costs and Expenses | ||||||||||||
Production, distribution and editorial | (32,219 | ) | (37,870 | ) | 5,651 | |||||||
Selling and promotion | (1,446 | ) | (3,254 | ) | 1,808 | |||||||
General and administrative | (1,967 | ) | (2,010 | ) | 43 | |||||||
Depreciation and amortization | (470 | ) | (878 | ) | 408 | |||||||
Restructuring charges | (600 | ) | — | (600 | ) | |||||||
|
|
|
|
|
| |||||||
Total Broadcasting Segment Operating Costs and Expenses | $ | (36,702 | ) | $ | (44,012 | ) | $ | 7,310 | ||||
|
|
|
|
|
| |||||||
Broadcasting Segment Operating Loss | $ | (4,740 | ) | $ | (1,578 | ) | $ | (3,162 | ) | |||
|
|
|
|
|
| |||||||
Broadcasting segment revenues decreased 25% in 2011 from 2010. Advertising revenue decreased $8.3 million primarily due to the decline in ratings, as well as lower rates, for season 6 ofThe Martha Stewart Show on Hallmark Channel as compared to season 5 ofThe Martha Stewart Show in syndication. Advertising revenue also declined due to fewer sales of television integrations, lower integration rates and decreased radio advertising in 2011 from 2010. Television licensing and other revenue decreased $2.0 million primarily due to the inclusion in the first quarter of 2010 of substantially all of the exclusive license fee of approximately $5.0 million from Hallmark Channel for a significant portion of our library of programming, as well as lower talent fees for certain television programming featuring Emeril Lagasse and lower international sales ofThe Martha Stewart Show. The decrease in these television licensing revenues was partially offset by the delivery of new television programming in 2011 to Hallmark Channel as part of the companion programming toThe Martha Stewart Show, which includedEmeril’s Table,Mad Hungry with Lucinda Scala Quinn,Martha Bakes, holiday and other specials andPetkeeping with Marc Morrone.
Production, distribution and editorial expenses decreased $5.7 million due to lower television production costs related to season 6 ofThe Martha Stewart Show on Hallmark Channel and the absence of distribution fees, which were payable under the season 5 syndication agreement forThe Martha Stewart Show. The cost savings fromThe Martha Stewart Show season 6 were partially offset by higher television production costs associated with the delivery of new programming to Hallmark Channel and a non-cash impairment charge of approximately $1.3 million for a definite-lived intangible asset previously acquired by the Broadcasting segment related to a
29
Table of Contents
television content library. Selling and promotion expenses decreased $1.8 million primarily due to lower staff costs from the fourth quarter 2010 reorganization of our advertising sales department. Restructuring charges included employee severance as well as certain other non-recurring costs.
MERCHANDISING SEGMENT
(in thousands) | 2011 | 2010 | Better / (Worse) | |||||||||
Merchandising Segment Revenues | ||||||||||||
Royalty and other | $ | 48,614 | $ | 42,806 | $ | 5,808 | ||||||
|
|
|
|
|
| |||||||
Total Merchandising Segment Revenues | $ | 48,614 | $ | 42,806 | $ | 5,808 | ||||||
|
|
|
|
|
| |||||||
Merchandising Segment Operating Costs and Expenses | ||||||||||||
Production, distribution and editorial | (8,668 | ) | (7,891 | ) | (777 | ) | ||||||
Selling and promotion | (4,726 | ) | (4,162 | ) | (564 | ) | ||||||
General and administrative | (5,203 | ) | (5,709 | ) | 506 | |||||||
Depreciation and amortization | (32 | ) | (43 | ) | 11 | |||||||
Restructuring charges | (13 | ) | — | (13 | ) | |||||||
|
|
|
|
|
| |||||||
Total Merchandising Segment Operating Costs and Expenses | $ | (18,642 | ) | $ | (17,805 | ) | $ | (837 | ) | |||
|
|
|
|
|
| |||||||
Merchandising Segment Operating Income | $ | 29,972 | $ | 25,001 | $ | 4,971 | ||||||
|
|
|
|
|
| |||||||
Merchandising segment revenues increased 14% in 2011 from 2010. Royalty and other revenues increased $5.8 million primarily due to increased sales by certain of our existing partners, partially offset by the inclusion in the prior-year period of royalties and a one-time $2.2 million termination payment from 1-800-Flowers.com, an agreement that ended in June 2010. In addition, the prior year included royalties from the terminated Kmart license and other expired partnerships, as well as a one-time $1.0 million payment received from a manufacturing partner.
Production, distribution and editorial expenses increased $0.8 million primarily due to higher compensation expenses associated with an increase in headcount to support our new merchandising relationships. Selling and promotion expenses increased $0.6 million mostly as a result of services that we provided to our partners for reimbursable creative services projects. General and administrative expenses decreased $0.5 million largely due to the benefit in non-cash equity compensation expense from a large forfeiture of equity awards in connection with certain executive departures in the Merchandising segment.
CORPORATE
(in thousands) | 2011 | 2010 | Better / (Worse) | |||||||||
Corporate Operating Costs and Expenses | ||||||||||||
General and administrative | $ | (30,985 | ) | $ | (32,152 | ) | $ | 1,167 | ||||
Depreciation and amortization | (2,702 | ) | (2,584 | ) | (118 | ) | ||||||
Restructuring charges | (3,675 | ) | — | (3,675 | ) | |||||||
|
|
|
|
|
| |||||||
Total Corporate Operating Costs and Expenses | $ | (37,362 | ) | $ | (34,736 | ) | $ | (2,626 | ) | |||
|
|
|
|
|
| |||||||
Corporate operating costs and expenses increased 8% in 2011 from 2010. General and administrative expenses decreased $1.2 million due to the reallocation of facilities-related expenses to our Publishing segment to reflect 2011 utilization of office space, as well as the inclusion in 2010 of severance charges related to the reorganization of our advertising sales department, lower rent expense from the consolidation of certain offices and decreased general overhead spending. These decreases were partially offset by an increase in compensation expense as a result of overlaps in our executive management team during transition periods and higher professional fees. Restructuring charges included employee severance and other employee-related termination
30
Table of Contents
costs, as well as certain consulting and recruiting costs. Also included in the $3.7 million restructuring charge is an approximate $0.4 million reversal of non-cash equity compensation expense related to certain employee departures.
OTHER ITEMS
LOSS ON SALE OF FIXED ASSET. Loss on the sale of a fixed asset was $0.6 million for 2010 with no comparable loss in 2011.
GAIN ON SALE OF SHORT-TERM INVESTMENTS.Gain on the sale of short-term investments from the disposition of certain marketable equity securities was $1.5 million in 2010 with no comparable gain in 2011.
GAIN / (LOSS) ON EQUITY SECURITIES.Gain on equity securities was $0.02 million for 2011 compared to a loss of $(0.02) million in 2010. Income/(loss) on equity securities in 2010 was the result of marking a warrant then held by us to fair value in accordance with accounting principles governing these financial instruments. That warrant was cancelled during the three months ended September 30, 2011 resulting in a loss that was partially offset by the gains previously recorded in 2011.
NET GAIN ON SALE OF COST-BASED INVESTMENT.Net gain on the sale of a cost-based investment was $7.6 million for 2011 with no comparable gain in 2010. The gain was related to selling our cost-based investment in WeddingWire in December 2011 for cash of $11.0 million.
OTHER-THAN-TEMPORARY LOSS ON COST-BASED INVESTMENTS.Other-than-temporary loss on cost-based investments was $2.7 million for 2011 with no comparable loss in 2010. The loss was related to the write down of the carrying value of the Company’s cost-based investments in pingg and Ziplist after concluding that these investments were substantially impaired.
NET LOSS. Net loss was $(15.5) million for 2011, compared to a net loss of $(9.6) million for 2010, as a result of the factors described above.
31
Table of Contents
RESULTS OF OPERATIONS
Comparison of 2010 to 2009.
PUBLISHING SEGMENT
(in thousands) | 2010 | 2009 | Better / (Worse) | |||||||||
Publishing Segment Revenues | ||||||||||||
Print Advertising | $ | 73,797 | $ | 74,815 | $ | (1,018 | ) | |||||
Digital Advertising | 21,420 | 16,986 | 4,434 | |||||||||
Circulation | 46,442 | 50,506 | (4,064 | ) | ||||||||
Books | 2,756 | 2,779 | (23 | ) | ||||||||
Other | 1,158 | 1,014 | 144 | |||||||||
|
|
|
|
|
| |||||||
Total Publishing Segment Revenues | $ | 145,573 | $ | 146,100 | $ | (527 | ) | |||||
|
|
|
|
|
| |||||||
Publishing Segment Operating Costs and Expenses | ||||||||||||
Production, distribution and editorial | (82,433 | ) | (82,304 | ) | (129 | ) | ||||||
Selling and promotion | (52,872 | ) | (53,355 | ) | 483 | |||||||
General and administrative | (6,491 | ) | (8,419 | ) | 1,928 | |||||||
Depreciation and amortization | (1,127 | ) | (2,191 | ) | 1,064 | |||||||
|
|
|
|
|
| |||||||
Total Publishing Segment Operating Costs and Expenses | $ | (142,923 | ) | $ | (146,269 | ) | $ | 3,346 | ||||
|
|
|
|
|
| |||||||
Publishing Segment Operating Income / (Loss) | $ | 2,650 | $ | (169 | ) | $ | 2,819 | |||||
|
|
|
|
|
| |||||||
Publishing segment revenues were essentially flat in 2010 from 2009. Print advertising revenue decreased $1.0 million in 2010 from 2009 due to the decrease in advertising rates across all publications, which was largely offset by an increase in pages atMartha Stewart Living,Martha Stewart Weddings andWhole Living. Digital advertising revenue increased $4.4 million or 26% in 2010 from 2009 due to an increase in sold advertising volume. Overall digital advertising rates were lower in 2010 compared to 2009. Circulation revenue decreased $4.1 million in 2010 from the prior year due to the discontinuation of the subscription-basedDr. Andrew Weil’s Self Healing newsletter and lower effective subscription rates per copy and lower volume atMartha Stewart LivingandEveryday Food. Circulation revenue was also impacted by the discontinuation of the newsstand-based Weil special interest publications and lower unit sales ofMartha Stewart Weddings, special interest publications andEveryday Food. Partially offsetting the decline in circulation revenue were lower agent commissions for subscriptions ofEveryday Food andWhole Living.
Magazine Publication Schedule Year ended December 31, | 2010 | 2009 | ||||||
Martha Stewart Living | 12 Issues | 12 Issues | ||||||
Martha Stewart Weddings(a) | 4 Issues | 4 Issues | ||||||
Everyday Food | 10 Issues | 10 Issues | ||||||
Whole Living | 10 Issues | 10 Issues | ||||||
Special Interest Publications | 3 Issues | 6 Issues | ||||||
Dr. Andrew Weil’s Self Healing newsletter | None | 12 Issues | ||||||
| (a) | In 2010 and 2009 we published one specialMartha Stewart Weddingsissue. |
Production, distribution and editorial expenses increased $0.1 million in 2010 from 2009 due to higher art and editorial compensation and story costs to support the print and digital magazines, books and the websites, as well as higher production and distribution expenses related to the increase in magazine pages. These expenses were partially offset by lower paper costs, lower cash and non-cash bonuses and the discontinuation ofDr. Andrew Weil’s Self Healing newsletter and the Weil special interest publications. Selling and promotion expenses decreased $0.5 million due to lower advertising and consumer marketing staff costs including lower cash and non-cash bonuses, as well as lower subscriber acquisition costs, lower newsstand placement expenses
32
Table of Contents
and the discontinuation of the Weil newsletter and special interest publications. The decrease in selling and promotion expenses was partially offset by higher direct mail investment forMartha Stewart Living and additional website infrastructure investment related to the replatforming of the website. General and administrative expenses decreased $1.9 million primarily due to lower headcount and lower facilities-related costs. Depreciation and amortization expenses decreased $1.1 million primarily due to the full depreciation by the second quarter of 2010 of the costs associated with the 2007 launch of our redesigned website.
BROADCASTING SEGMENT
(in thousands) | 2010 | 2009 | Better / (Worse) | |||||||||
Broadcasting Segment Revenues | ||||||||||||
Advertising | $ | 23,499 | $ | 24,454 | $ | (955 | ) | |||||
Radio | 3,500 | 7,000 | (3,500 | ) | ||||||||
Licensing and other | 15,435 | 14,657 | 778 | |||||||||
|
|
|
|
|
| |||||||
Total Broadcasting Segment Revenues | $ | 42,434 | $ | 46,111 | $ | (3,677 | ) | |||||
|
|
|
|
|
| |||||||
Broadcasting Segment Operating Costs and Expenses | ||||||||||||
Production, distribution and editorial | (37,870 | ) | (33,262 | ) | (4,608 | ) | ||||||
Selling and promotion | (3,254 | ) | (3,028 | ) | (226 | ) | ||||||
General and administrative | (2,010 | ) | (2,292 | ) | 282 | |||||||
Depreciation and amortization | (878 | ) | (1,389 | ) | 511 | |||||||
|
|
|
|
|
| |||||||
Total Broadcasting Segment Operating Costs and Expenses | $ | (44,012 | ) | $ | (39,971 | ) | $ | (4,041 | ) | |||
|
|
|
|
|
| |||||||
Broadcasting Segment Operating (Loss) / Income | $ | (1,578 | ) | $ | 6,140 | $ | (7,718 | ) | ||||
|
|
|
|
|
| |||||||
Broadcasting segment revenues decreased 8% in 2010 from 2009. Advertising revenue decreased $1.0 million primarily due to the decline in household ratings for season 5 ofThe Martha Stewart Show in syndication compared with season 4. The decrease was partially offset by an increase in the quantity of integrations at higher rates and the inclusion of advertising revenue from our radio agreement with Sirius XM Radio, which provides for lower licensing fees than our previous agreement, but also provides an opportunity to replace a portion of the licensing fees through advertising sales. However, as a result of the lower licensing fees in the new radio agreement, radio licensing revenue decreased $3.5 million. Licensing and other revenue increased $0.8 million in 2010 due to the recognition of substantially all of the exclusive license fee of approximately $5.0 million from Hallmark Channel for a significant portion of our library of programming. In addition, licensing revenue increased from the delivery of new television programming to the Hallmark Channel as part of the companion programming toThe Martha Stewart Show, which includesMad Hungry with Lucinda Scala Quinn,Whatever Martha!, holiday and other specials andPetkeeping with Marc Morrone. These increases were largely offset by the absence of revenue from our TurboChef relationship and historical cable retransmission revenue, both of which contributed revenues in 2009, as well as lower licensing revenues related to Emeril Lagasse’s television programming and lower international licensing revenues.
Production, distribution and editorial expenses increased $4.6 million due primarily to television production costs related to the new programming on Hallmark Channel. These expenses were partially offset by lower distribution fees and production cost savings related to season 5 ofThe Martha Stewart Show as compared to the prior year’s season 4. Selling and promotion expenses increased $0.2 million due to higher compensation-related costs. Depreciation and amortization expenses decreased $0.5 million primarily due to the timing of amortization in connection with the revenue recognition related to our library of Emeril Lagasse television content.
33
Table of Contents
MERCHANDISING SEGMENT
(in thousands) | 2010 | 2009 | Better / (Worse) | |||||||||
Merchandising Segment Revenues | ||||||||||||
Royalty and other | $ | 41,621 | $ | 28,066 | $ | 13,555 | ||||||
Kmart earned royalty | 114 | 7,793 | (7,679 | ) | ||||||||
Kmart minimum guarantee true-up | 1,071 | 6,707 | (5,636 | ) | ||||||||
Recognition of previously deferred royalties from Kmart | — | 10,000 | (10,000 | ) | ||||||||
|
|
|
|
|
| |||||||
Total Merchandising Segment Revenues | $ | 42,806 | $ | 52,566 | $ | (9,760 | ) | |||||
|
|
|
|
|
| |||||||
Merchandising Segment Operating Costs and Expenses | ||||||||||||
Production, distribution and editorial | (7,891 | ) | (9,549 | ) | 1,658 | |||||||
Selling and promotion | (4,162 | ) | (2,950 | ) | (1,212 | ) | ||||||
General and administrative | (5,709 | ) | (2,922 | ) | (2,787 | ) | ||||||
Depreciation and amortization | (43 | ) | (62 | ) | 19 | |||||||
Impairment charge—other asset | — | (11,432 | ) | 11,432 | ||||||||
|
|
|
|
|
| |||||||
Total Merchandising Segment Operating Costs and Expenses | $ | (17,805 | ) | $ | (26,915 | ) | $ | 9,110 | ||||
|
|
|
|
|
| |||||||
Merchandising Segment Operating Income | $ | 25,001 | $ | 25,651 | $ | (650 | ) | |||||
|
|
|
|
|
| |||||||
Merchandising segment revenues decreased 19% in 2010 from 2009. The 2009 revenues included $24.5 million of revenues related to our agreement with Kmart as compared to only $1.2 million in 2010. Excluding revenues from Kmart, other Merchandising segment revenues increased $13.6 million or 48% primarily due to the contributions of our new merchandising relationships, higher royalty rates and sales volume from certain of our existing partners, a one-time $1.0 million payment received from a manufacturing partner and the additional one-time revenue from the early termination of our agreement with 1-800-Flowers.com. These increases in royalty and other revenue were partially offset by the absence of revenue from our TurboChef relationship, which contributed revenues in 2009.
Our agreement with Kmart ended in January 2010. The pro-rata portion of revenues related to the contractual minimum amounts from Kmart covering the specified periods is listed separately above as Kmart minimum guarantee true-up. In 2009, we also recognized royalties that were previously received and deferred and were subject to recoupment. No royalties were recouped throughout the Kmart relationship and therefore, we recognized $10.0 million as non-cash revenue in the fourth quarter of 2009.
Production, distribution and editorial expenses decreased $1.7 million in 2010 due to lower allocated facilities costs, as compared to 2009, as well as lower cash and non-cash bonuses. The allocation policy for facilities expenses changed in 2010 for the Merchandising segment only. All allocated rent and facilities charges are now reflected in the Merchandising segment in the general and administrative expense category. This allocation change does not impact any of our other business segments. Selling and promotion expenses increased $1.2 million mostly as a result of services that we provide to our partners for reimbursable, zero-margin creative services projects. General and administrative costs increased $2.8 million largely due to the benefit of a $3.0 million cash make-whole payment that we recognized in 2009 from our crafts manufacturing partner in connection with our investment as the result of its capital restructuring. In addition, general and administrative costs increased in 2010 due to higher allocated facilities costs due to the change in policy described above, partially offset by lower cash and non-cash bonus accruals. In 2009, we recorded non-cash impairment charges of $11.4 million related to our cost-based equity investment in United Craft MS Brands, LLC.
34
Table of Contents
CORPORATE
(in thousands) | 2010 | 2009 | Better / (Worse) | |||||||||
Corporate Operating Costs and Expenses | ||||||||||||
General and administrative | $ | (32,152 | ) | $ | (39,358 | ) | $ | 7,206 | ||||
Depreciation and amortization | (2,584 | ) | (4,232 | ) | 1,648 | |||||||
|
|
|
|
|
| |||||||
Total Corporate Operating Costs and Expenses | $ | (34,736 | ) | $ | (43,590 | ) | $ | 8,854 | ||||
|
|
|
|
|
| |||||||
Corporate operating costs and expenses decreased 20% in 2010 from 2009. General and administrative expenses decreased $7.2 million due to lower rent expense as a result of the consolidation of certain offices and lower cash and non-cash bonuses and lower compensation-related expenses. Depreciation and amortization expenses decreased $1.6 million due to lower depreciation expense also related to the relocation of our office space.
OTHER ITEMS
LOSS ON SALE OF FIXED ASSET. Loss on the sale of a fixed asset was $0.6 million for 2010 with no comparable loss in the prior year.
GAIN ON SALE OF SHORT-TERM INVESTMENTS.Gain on the sale of short-term investments from the disposition of certain marketable equity securities was $1.5 million for 2010 and $0.3 million in 2009.
LOSS ON EQUITY SECURITIES.Loss on equity securities was $0.02 million for 2010 compared to $0.9 million in 2009. The losses were the result of marking certain assets to fair value in accordance with accounting principles governing derivative instruments.
OTHER (LOSS)/INCOME. Other loss was $0.2 million for 2009 with no comparable loss in 2010. The other loss in 2009 was related to certain investments in equity securities that were previously accounted for under the equity method but, since the second quarter of 2009, have been accounted for under the cost method.
NET LOSS. Net loss was $(9.6) million for 2010, compared to a net loss of $(14.6) million for 2009, as a result of the factors described above.
LIQUIDITY AND CAPITAL RESOURCES
Overview
During 2011, our overall cash, cash equivalents and short-term investments increased $16.2 million from December 31, 2010 largely from the proceeds received from issuing 11.0 million shares of our Class A Common Stock and one share of Series A Preferred Stock to JCP in exchange for $38.5 million and the proceeds from selling our cost-based investment in the WeddingWire for $11.0 million. These proceeds were partially offset by the payment of a special one-time dividend of $16.7 million, the complete repayment of our outstanding $9.0 million term loan balance with Bank of America and cash used for capital expenditures and operations during 2011. Cash, cash equivalents and short-term investments were $49.5 million and $33.3 million at December 31, 2011 and December 31, 2010, respectively.
During February 2012, we increased our line of credit with Bank of America to $25.0 million, incorporating a previous $5.0 million line, which proceeds are available for investment opportunities, working capital, and the issuance of letters of credit. We believe that our available cash balances and short-term investments, along with our new line of credit, will be sufficient to meet our cash needs for working capital and capital expenditures for at least the next 12 months.
35
Table of Contents
Operating Activities
Our cash inflows from operating activities are generated by our business segments from revenues, as described above, which include cash from advertising and magazine customers and licensing partners. Operating cash outflows generally include employee and related costs, the physical costs associated with producing magazines, the editorial costs associated with creating content across our media platforms, the technology costs associated with our digital properties, the production costs incurred for our television programming and the cash costs of facilities.
Cash (used in) and provided by operating activities was $(2.2) million, $1.9 million and $(9.3) million in 2011, 2010 and 2009, respectively. In 2011, the $(2.2) million of cash used in operations was the result of our operating loss, as discussed earlier, as well as payments of certain non-recurring Broadcasting segment liabilities established in prior years and a delay in the timing of cash receipts from magazine subscription orders. These decreases in cash from operations were partially offset by the collection of advertising and television license fee receivables and the receipt of an upfront advance payment related to our new multi-book agreement with Clarkson Potter/Publishers for Martha Stewart books.
In 2010, cash provided by operations was $1.9 million despite our 2010 operating loss. Cash provided by operations in 2010 benefited from the satisfaction of the 2009 year-end receivable due from Kmart and other advertising receivables, partially offset by the addition of a receivable related to the recognition of substantially all of the exclusive license fee from Hallmark Channel for a significant portion of our library of programming. Additionally, in the fourth quarter of 2010, there were significant expenses incurred for several television productions, which were paid in 2011.
In 2009, cash used in operations was $(9.3) million reflecting our operating loss. In addition, cash was used in operations as the result of lower cash received from Kmart related to lower contractual minimum guaranteed payments and lower 2009 earned royalties. Cash used in operating activities also declined due to lower cash received for new subscriptions during 2009 as the result of higher agency commissions and lower effective subscription rates per copy.
Investing Activities
Our cash inflows from investing activities generally include proceeds from the sale of short-term investments. In 2011, cash inflows from investing activities also included the proceeds from selling a cost-based investment classified as an other noncurrent asset. Investing cash outflows generally include payments for short- and long-term investments and additions to property, plant, and equipment.
Cash provided by and (used in) investing activities was $6.9 million, $0.2 million and $(9.6) million in 2011, 2010 and 2009, respectively. In 2011, the $6.9 million of cash provided by investing activities was primarily due to the proceeds from selling our cost-based investment in the WeddingWire for $11.0 million. Those proceeds were partially offset by cash used for capital improvements to our information technology infrastructure and certain costs associated with our websites, as well as the net purchases of short-term investments.
In 2010, cash flow provided by investing activities was $0.2 million predominantly the result of cash received from the sale of a fixed asset and net sales of short-term investments largely offset by cash used for capital improvements, including expenditures to upgrade office technology and to relocate and consolidate certain offices.
In 2009, cash flow used in investing activities was $(9.6) million reflecting $8.6 million paid for capital improvements primarily in conjunction with our relocation and consolidation of certain offices. Additionally, cash was used to invest in a non-controlling interest in Ziplist and for net purchases of short-term investments.
36
Table of Contents
Financing Activities
Our cash inflows from financing activities generally include proceeds from the exercise of stock options for our Class A Common Stock issued under our equity incentive plans. Cash outflows from financing activities generally include principal repayments on outstanding debt.
Cash flows provided by and (used in) financing activities were $10.6 million, $(4.2) million and $(5.9) million in 2011, 2010 and 2009, respectively. In 2011, cash provided by financing activities was primarily the result of proceeds received from issuing 11.0 million shares of our Class A Common Stock and one share of Series A Preferred Stock to JCP in exchange for $38.5 million. These proceeds were partially offset by the payment of a special one-time dividend of $16.7 million and the complete repayment of our outstanding $9.0 million term loan balance with Bank of America.
In 2010, we made $4.5 million in principal pre-payments on our term loan with Bank of America related to the acquisition of certain assets of Emeril Lagasse.
In 2009, we made $6.0 million in principal pre-payments on our term loan with Bank of America related to the acquisition of certain assets of Emeril Lagasse.
Debt
As of December 31, 2011, we had a line of credit with Bank of America in the amount of $5.0 million, which was generally used to secure letters of credit. We had no outstanding borrowings under this facility as of December 31, 2011 and had letters of credit outstanding of $2.6 million which act as security for certain leases. We were compliant with the debt covenants as of December 31, 2011. See Note 17,Subsequent Events, in the Notes to Consolidated Financial Statements of this Annual Report on Form 10-K for discussion of a new line of credit entered into in 2012.
During February 2012, we increased our line of credit with Bank of America to $25.0 million, incorporating the previous $5.0 million line, which proceeds are available for investment opportunities, working capital and the issuance of letters of credit. The interest rate on outstanding amounts is equal to a floating rate of 1-month London Interbank Offered Rate (“LIBOR”) Daily Floating Rate plus 1.85%. The unused commitment fee is equal to 0.25%. The line of credit terms require us to be in compliance with certain financial and other covenants. A summary of the most significant financial covenants is as follows:
Financial Covenants | ||||
Tangible Net Worth | At least $40.0 million | |||
Current Ratio | At least 1.75 to 1.0 | |||
Unencumbered liquid assets | Equal to or greater than outstanding principal balance plus accrued interest |
The loan agreement also contains a variety of other customary affirmative and negative covenants. The loan agreement expires February 14, 2013 and any then outstanding amounts borrowed under the agreement are then due and payable.
In 2008, we entered into a loan agreement with Bank of America in the amount of $30.0 million related to the acquisition of certain assets of Emeril Lagasse. The interest rate paid in 2011 on all outstanding amounts was equal to a floating rate of 1-month LIBOR plus 2.85%. The loan balance was fully paid as of December 31, 2011.
37
Table of Contents
Cash Requirements
Our commitments consist primarily of leases for office facilities under operating lease agreements. Future minimum payments under our operating leases are summarized in the table below. See Note 12,Commitments and Contingencies, in the Notes to Consolidated Financial Statements of this Annual Report on Form 10-K for further discussion.
| Payments due by period (in thousands) | ||||||||||||||||||||||||
Contractual Obligations | Total | Less than 1 year | 1-3 years | 3-5 years | More than 5 years | Other | ||||||||||||||||||
Operating Lease Obligations (1) | $ | 51,688 | $ | 11,411 | $ | 16,239 | $ | 15,200 | $ | 8,838 | $ | — | ||||||||||||
Unrecognized Tax Benefits (2) | 72 | — | — | — | — | 72 | ||||||||||||||||||
|
|
|
|
|
|
|
|
|
|
|
| |||||||||||||
Total | $ | 51,760 | $ | 11,411 | $ | 16,239 | $ | 15,200 | $ | 8,838 | $ | 72 | ||||||||||||
| (1) | Operating lease obligations are shown net of sublease income in this table. This table is inclusive of the future minimum payments expected to be paid in 2012 towards rent of our television production studio and television administrative office operating lease which runs through June 2012. See Note 13,Commitments and Contingencies, in the Notes to Consolidated Financial Statements of this Annual Report on Form 10-K for further discussion of operating leases. |
| (2) | These amounts represent expected payments with interest for uncertain tax positions as of December 31, 2011. We are not able to reasonably estimate the timing of future cash flows related to $0.07 million of this liability, and therefore have presented this amount as “Other” in the table above. See Note 10,Income Taxes, in the Notes to Consolidated Financial Statements of this Annual Report on Form 10-K for further discussion of income taxes. |
In addition to our contractual obligations, we expect to use approximately $4.0 million in cash in 2012 for capital expenditures primarily for leasehold improvements to our office space and continued upgrades to our corporate information technology.
OFF-BALANCE SHEET ARRANGEMENTS
Our bylaws may require us to indemnify our directors and officers against liabilities that may arise by reason of their status as such and to advance their expenses incurred as a result of any legal proceedings against them as to which they could be indemnified. We also have contractual indemnification obligations with our directors.
CRITICAL ACCOUNTING POLICIES AND ESTIMATES
General
Our discussion and analysis of our financial condition and results of operations are based upon our consolidated financial statements, which have been prepared in accordance with United States generally accepted accounting principles (“GAAP”). The preparation of these financial statements requires us to make estimates and judgments that affect the reported amounts of assets, liabilities, revenues and expenses, and related disclosure of contingent assets and liabilities. On an on-going basis, we evaluate our estimates, including those related to bad debts, inventories, deferred production costs, long-lived assets and accrued losses. We base our estimates on historical experience and on various other assumptions that we believe to be reasonable under the circumstances, the results of which form the basis for making judgments about the carrying values of assets and liabilities that are not readily apparent from other sources. Actual results may differ from these estimates under different assumptions or conditions.
We believe that, of our significant accounting policies disclosed in this Annual Report on Form 10-K, the following may involve the highest degree of judgment and complexity.
38
Table of Contents
Revenue Recognition
We recognize revenues when realized or realizable and earned. Revenues and associated accounts receivable are recorded net of provisions for estimated future returns, doubtful accounts and other allowances.
We participate in certain arrangements containing multiple deliverables. These arrangements generally consist of custom-created advertising programs delivered on multiple media platforms, as well as licensing programs which may also be supported by various promotional plans. Examples of significant program deliverables include print advertising pages in our publications, product integrations on our television and radio programs, and advertising impressions delivered on our website. Arrangements that were executed prior to January 1, 2010 are accounted for in accordance with the provisions of Accounting Standards Codification (“ASC”) Topic 605,Revenue Recognition (“ASC 605”). Because we elected to early adopt, on a prospective basis, Financial Accounting Standards Board (“FASB”) ASU No. 09-13,Revenue Recognition (Topic 605): Multiple-Deliverable Revenue Arrangements (a consensus of the FASB Emerging Issues Task Force) (“ASU 09-13”), arrangements executed on or after January 1, 2010 are subject to the new guidance. ASU 09-13 updated the then existing multiple-element arrangement guidance in ASC 605.
The determination of units of accounting includes several criteria under both ASC 605 and ASU 09-13. Consistent with ASC 605, ASU 09-13 requires that we examine separate contracts with the same entity or related parties that are entered into or near the same time to determine if the arrangements should be considered a single arrangement in the determination of units of accounting. While both ASC 605 and ASU 09-13 require that units delivered have standalone value to the customer, ASU 09-13 modified the separation criteria in determining units of accounting by eliminating the requirement to obtain objective and reliable evidence of the fair value of undelivered items. As a result of the elimination of this requirement, our significant program deliverables generally meet the separation criteria under ASU 09-13, whereas under ASC 605 they did not qualify as separate units of accounting.
For those arrangements accounted for under ASC 605, if we are unable to put forth objective and reliable evidence of the fair value of each deliverable, then we account for the deliverables as a combined unit of accounting rather than separate units of accounting. In this case, the arrangement fee is recognized as revenue as the earnings process is completed, generally over the fulfillment term of the last deliverable.
For those arrangements accounted for under ASU 09-13, we are required to allocate revenue based on the relative selling price of each deliverable which qualifies as a unit of accounting, even if such deliverables are not sold separately by us or other vendors. Determination of selling price is a judgmental process which requires numerous assumptions. The consideration is allocated at the inception of the arrangement to all deliverables based upon their relative selling prices. Selling prices for deliverables that qualify as separate units of accounting are determined using a hierarchy of: (1) vendor-specific objective evidence (“VSOE”), (2) third-party evidence, and (3) best estimate of selling price. We are able to establish VSOE of selling price for certain of our radio deliverables; however, in most instances we have allocated consideration based upon our best estimate of selling price. We established VSOE of selling price for certain radio deliverables by demonstrating that a substantial majority of the recent standalone sales of those deliverables are priced within a relatively narrow range. However, our other deliverables generally are priced with a wide range of discounts/premiums as the result of a variety of factors including the size of the advertiser and the volume and placement of advertising sold to the advertiser. Our best estimate of selling price is intended to represent the price at which it would sell the deliverable if we were to sell the item regularly on a standalone basis. Our estimates consider market conditions, such as competitor pricing pressures, as well as entity-specific factors that are consistent with normal pricing practices, such as the recent history of the selling prices of similar products when sold on a standalone basis, the impact of the cost of customization, the size of the transaction, and other factors contemplated in negotiating the arrangement with the customer. The arrangement fee is recognized as revenue as the earnings process is completed, generally at the time each unit of accounting is fulfilled (i.e., when magazines are on sale, at the time television integrations are aired or when the digital impressions are served).
39
Table of Contents
Print advertising revenues are generally recorded upon the on-sale dates of the magazines and are stated net of agency commissions and cash and sales discounts. Subscription revenues are recognized on a straight-line basis over the life of the subscription as issues are delivered. Newsstand revenues are recognized based on estimates with respect to future returns and net of brokerage and newsstand-related fees. We base our estimates on our historical experience and current market conditions. Revenues earned from book publishing are recorded as manuscripts are delivered to and/or accepted by our publisher. Additional revenue is recorded as sales on a unit basis exceed the advanced royalty for the individual title or in certain cases, advances on cross-collateralized titles. Digital advertising revenues are generally based on the sale of impression-based advertisements, which are recorded in the period in which the advertisements are served.
Television advertising revenues for season 5 ofThe Martha Stewart Show in syndication were recognized when the related commercials were aired and were recorded net of agency commission and estimated reserves for television audience underdelivery. Television spot advertising for season 6 ofThe Martha Stewart Show was sold by Hallmark Channel, with net receipts payable to us quarterly. Hallmark Channel is currently selling television spot advertising for season 7 ofThe Martha Stewart Show. Since advertisers contract with Hallmark Channel directly, balance sheet reserves for television audience underdelivery are not required; however, revenues continue to be recognized when commercials are aired and are recorded net of agency commission and the impact of television audience underdelivery as determined by Hallmark. Television integration revenues are recognized when the segment featuring the related product/brand immersion is initially aired. Television revenues related to talent services provided by Emeril Lagasse are generally recognized when services are performed, regardless of when the episodes air. Licensing revenues are recorded as earned in accordance with the specific terms of each agreement and are generally recognized upon delivery of the episodes to the licensee, provided that the license period has begun. Throughout 2010, we executed several agreements with Hallmark Channel, certain of which are combined as one arrangement. The agreements with Hallmark Channel are accounted for under the guidance set forth in ASC 926,Entertainment—Films. Radio advertising revenues are generally recorded when the related commercials are aired and are recorded net of agency commissions. Licensing revenues from our radio programming are recorded on a straight-line basis over the term of the agreement.
Licensing-based revenues, most of which are in our Merchandising segment, are accrued on a monthly basis based on the specific mechanisms of each contract. Payments are typically made by our partners on a quarterly basis. Generally, revenues are accrued based on actual net sales, while any minimum guarantees are earned evenly over the fiscal year. We had an agreement with Kmart dated June 21, 2001, as amended April 22, 2004, which ended in January 2010. Revenues related to our agreement with Kmart had been recorded on a monthly basis based on actual retail sales, until the last period of the year, when we recognized a substantial majority of the true-up between the minimum royalty amount and royalties paid on actual sales. Not recognizing revenue until the fourth quarter was originally driven in large part by concern about whether the collectability of the minimums was reasonably assured in the wake of the Kmart Chapter 11 filing. Concern about the collectability persisted in subsequent years due to difficulties in the relationship with Kmart and numerous store closings that caused royalties to fall short of the minimums. Accordingly, the true-up payment was recorded in the fourth quarter at the time the true-up amounts were known and subsequently collected.
We maintain reserves for all segment receivables, as appropriate. These reserves are adjusted regularly based upon actual results. Allowances for uncollectible receivables are estimated based upon a combination of write-off history, aging analysis, and any specific, known troubled accounts. If the financial condition of our customers were to deteriorate, resulting in an impairment of their ability to make payments, additional allowances might be required.
Television Production Costs
Television production costs are capitalized and amortized based upon estimates of future revenues to be received and future costs to be incurred for the applicable television product. We base our estimates primarily on
40
Table of Contents
existing contracts for programs, historical advertising rates and ratings, as well as market conditions. Estimated future revenues and costs are adjusted regularly based upon actual results and changes in market and other conditions. To the extent that estimated future results are losses, capitalized television production costs are written down to zero.
Goodwill and Indefinite-Lived Intangible Assets
We review goodwill for impairment by applying a fair-value based test annually, or more frequently if events or changes in circumstances warrant, in accordance with ASC 350, “Intangibles—Goodwill and Other” (“ASC 350”). Potential goodwill impairment is measured based upon a two-step process. In the first step, we compare the fair value of a reporting unit with our carrying amount including goodwill using a discounted cash flow (“DCF”) valuation method. The DCF analyses are based on the current operating budgets and estimated long-term growth projections for each reporting unit. Future cash flows are discounted based on a market comparable weighted average cost of capital rate for each reporting unit, adjusted for market and other risks where appropriate. In addition, we analyze any difference between the sum of the fair values of the reporting units and our total market capitalization for reasonableness, taking into account certain factors, including control premiums.
If the fair value of a reporting unit exceeds its carrying value, goodwill of the reporting unit is considered not impaired, thus rendering unnecessary the second step in impairment testing. If the fair value of the reporting unit is less than the carrying value, a second step is performed in which the implied fair value of the reporting unit’s goodwill is compared to the carrying value of the goodwill. The implied fair value of the goodwill is determined based on the difference between the fair value of the reporting unit and the net fair value of the identifiable assets and liabilities of the reporting unit. If the implied fair value of the goodwill is less than the carrying value, the difference is recognized as an impairment charge.
Based on our quantitative assessment performed during the fourth quarter of 2011, the fair value of the goodwill within the Publishing and Merchandising reporting units exceeded its carrying value by more than 15%. For 2011, 2010 and 2009, no impairment charges related to goodwill were deemed necessary.
We estimate fair values based on the future expected cash flows, revenues, earnings and other factors, which consider reporting unit level historical results, current trends, and operating and cash flow projections. Significant judgments inherent in this analysis include estimating the amount of and timing of future cash flows and the selection of appropriate discount rates and long-term growth rate assumptions. Our estimates are subject to uncertainty, and may be affected by a number of factors outside our control, including general economic conditions, the competitive market and regulatory changes. If actual results differ from our estimate of future cash flows, revenues, earnings and other factors, we may record additional impairment charges in the future.
Changes to our estimates and assumptions associated with the reporting units could materially affect the determination of fair value and could result in an impairment charge, which could be material to our financial position and results of operations. Increasing the discount rate we used by 1% would not have resulted in the Publishing or Merchandising reporting unit’s carrying value exceeding the fair value.
Long-Lived and Definite-Lived Intangible Assets
We review the carrying values of our long-lived assets whenever events or changes in circumstances indicate that such carrying values may not be recoverable. Unforeseen events and changes in circumstances and market conditions and material differences in the value of long-lived assets due to changes in estimates of future cash flows could negatively affect the fair value of our assets and result in an impairment charge, which could have a material adverse effect on our financial statements. In the fourth quarter of 2011, we recorded a non-cash impairment charge of approximately $1.3 million for a definite-lived intangible asset previously acquired by the Broadcasting segment related to a television content library. Because the future undiscounted cash flows for this asset were determined to be significantly lower than the carrying value, we wrote the asset down to zero.
41
Table of Contents
Deferred Income Tax Asset Valuation Allowance
We record a valuation allowance to reduce our deferred income tax assets to the amount that is more likely than not to be realized. In evaluating our ability to recover our deferred income tax assets, we consider all available positive and negative evidence, including our operating results, ongoing tax planning and forecasts of future taxable income on a jurisdiction by jurisdiction basis. Our cumulative pre-tax loss in recent years represents sufficient negative evidence for us to determine that the establishment of a full valuation allowance against the deferred tax asset is appropriate. This valuation allowance offsets net deferred tax assets associated with future tax deductions, as well as carryforward items. In the event we were to determine that we would be able to realize our deferred income tax assets in the future in excess of their net recorded amount, we would make an adjustment to the valuation allowance which would reduce the provision for income taxes. See Note 10,Income Taxes, in the Notes to Consolidated Financial Statements of this Annual Report on Form 10-K for further discussion of income taxes.
Non-Cash Equity Compensation
We currently have a stock incentive plan that permits us to grant various types of stock-based incentives to key employees, directors and consultants. The primary types of incentives that have been granted under the plan are restricted shares of common stock, restricted stock unit awards and stock options. Restricted shares granted to employees are valued at the market value of traded shares on the date of grant. Performance-based awards are accrued as compensation expense based on the probable outcome of the performance condition, consistent with requirements of ASC Topic 718,Compensation—Stock Compensation. Service-based option awards are valued using a Black-Scholes option pricing model. We apply variable accounting to non-employee price-based restricted stock unit awards in accordance with the provisions of ASC Topic 718. The Black-Scholes option pricing model requires numerous assumptions, including expected volatility of our Class A Common Stock price and expected life of the option. Price-based options and price-based restricted stock unit awards are valued using the Monte Carlo Simulation method which takes into account assumptions such as expected volatility of our Class A Common Stock, the risk-free interest rate based on the contractual term of the award, expected dividend yield, vesting schedule, and the probability that the market conditions of the award will be achieved. If factors change and we employ different assumptions for estimating stock-based compensation expense in future periods or if we adopt a different valuation model, the future period calculations of stock-based compensation expense may differ significantly from what we have recorded in the current period and could materially affect our financial statements.
Item 7A.Quantitative and Qualitative Disclosure about Market Risk.
We are exposed to market rate risk for changes in interest rates as those rates relate to our investment portfolio. The primary objective of our investment activities is to preserve principal while at the same time maximizing yields without significantly increasing risk. We attempt to protect and preserve our invested funds by limiting default, market and reinvestment risk. To achieve this objective, we invest our excess cash in debt instruments of the United States Government and its agencies and in high-quality corporate issuers (including bank instruments and money market funds) and, by internal policy, limit both the term and amount of credit exposure to any one issuer. As of December 31, 2011, net unrealized gains and losses on these investments were not material. However, in 2011, we recorded approximately $0.3 million in interest income. Our future investment income may fluctuate due to changes in interest rates and levels of cash balances, or we may suffer losses in principal if forced to sell securities that have declined in market value due to changes in interest rates before their maturity.
42
Table of Contents
Item 8.Financial Statements and Supplementary Data.
The information required by this Item is set forth on pages F-1 through F-32 of this Annual Report on Form 10-K and is incorporated by reference herein.
Item 9.Changes in and Disagreements with Accountants on Accounting and Financial Disclosure.
None.
Item 9A.Controls and Procedures.
Evaluation of Disclosure Controls and Procedures
Under the supervision and with the participation of our management, including our principal executive officer and our principal financial officer, we evaluated the effectiveness of our disclosure controls and procedures (as defined in the Rules 13a-15(e) and 15d-15(e) under the Securities Exchange Act of 1934, as amended (the “Exchange Act”)) required by Exchange Act Rules 13a-15(b) or 15d-15(b), as of the end of the period covered by this report. Based upon that evaluation, our principal executive officer and principal financial officer concluded that our disclosure controls and procedures were effective as of that date to provide reasonable assurance that information we are required to disclose in reports that we file or submit under the Exchange Act is recorded, processed, summarized and reported within the time periods specified in Securities and Exchange Commission rules and forms, and include controls and procedures designed to ensure that information required to be disclosed by us in such reports is accumulated and communicated to our management, including the principal executive officer and principal financial officer, as appropriate to allow timely decisions regarding required disclosure.
Management’s Report on Internal Control Over Financial Reporting
Our management is responsible for establishing and maintaining adequate internal control over financial reporting. Under the supervision and with the participation of our management, including our principal executive officer and principal financial officer, we assessed the effectiveness of our internal control over financial reporting as of the end of the period covered by this report based on the framework in “Internal Control—Integrated Framework” issued by the Committee of Sponsoring Organizations of the Treadway Commission. Based on that assessment, our principal executive officer and principal financial officer concluded that our internal control over financial reporting was effective to provide reasonable assurance regarding the reliability of our financial reporting and the preparation of our financial statements for external purposes in accordance with United States generally accepted accounting principles.
Our independent registered public accounting firm, Ernst & Young LLP, has issued an attestation report on our internal control over financial reporting. Their attestation report is included herein.
Evaluation of Changes in Internal Control Over Financial Reporting
Under the supervision and with the participation of our management, including our principal executive officer and principal financial officer, we have determined that, during the fourth quarter of 2011, there were no changes in our internal control over financial reporting that have materially affected, or are reasonably likely to materially affect, our internal control over financial reporting.
43
Table of Contents
Report of Independent Registered Public Accounting Firm
The Board of Directors and Shareholders of Martha Stewart Living Omnimedia, Inc.
We have audited Martha Stewart Living Omnimedia, Inc.’s internal control over financial reporting as of December 31, 2011, based on criteria established in Internal Control—Integrated Framework issued by the Committee of Sponsoring Organizations of the Treadway Commission (the COSO criteria). The Company’s management is responsible for maintaining effective internal control over financial reporting, and for its assessment of the effectiveness of internal control over financial reporting included in the accompanying Management’s Report on Internal Control Over Financial Reporting. Our responsibility is to express an opinion on the Company’s internal control over financial reporting based on our audit.
We conducted our audit in accordance with the standards of the Public Company Accounting Oversight Board (United States). Those standards require that we plan and perform the audit to obtain reasonable assurance about whether effective internal control over financial reporting was maintained in all material respects. Our audit included obtaining an understanding of internal control over financial reporting, assessing the risk that a material weakness exists, testing and evaluating the design and operating effectiveness of internal control based on the assessed risk, and performing such other procedures as we considered necessary in the circumstances. We believe that our audit provides a reasonable basis for our opinion.
A company’s internal control over financial reporting is a process designed to provide reasonable assurance regarding the reliability of financial reporting and the preparation of financial statements for external purposes in accordance with generally accepted accounting principles. A company’s internal control over financial reporting includes those policies and procedures that (1) pertain to the maintenance of records that, in reasonable detail, accurately and fairly reflect the transactions and dispositions of the assets of the company; (2) provide reasonable assurance that transactions are recorded as necessary to permit preparation of financial statements in accordance with generally accepted accounting principles, and that receipts and expenditures of the company are being made only in accordance with authorizations of management and directors of the company; and (3) provide reasonable assurance regarding prevention or timely detection of unauthorized acquisition, use or disposition of the company’s assets that could have a material effect on the financial statements.
Because of its inherent limitations, internal control over financial reporting may not prevent or detect misstatements. Also, projections of any evaluation of effectiveness to future periods are subject to the risk that controls may become inadequate because of changes in conditions, or that the degree of compliance with the policies or procedures may deteriorate.
In our opinion, Martha Stewart Living Omnimedia, Inc. maintained, in all material respects, effective internal control over financial reporting as of December 31, 2011, based on the COSO criteria.
We also have audited, in accordance with the standards of the Public Company Accounting Oversight Board (United States), the consolidated balance sheets of Martha Stewart Living Omnimedia, Inc. as of December 31, 2011 and 2010, and the related consolidated statements of operations, shareholders’ equity and comprehensive loss, and cash flows for each of the three years in the period ended December 31, 2011 and our report dated March 6, 2012 expressed an unqualified opinion thereon.
/s/ Ernst & Young LLP
New York, New York
March 6, 2012
44
Table of Contents
During February 2012, we increased our line of credit with Bank of America to $25.0 million, incorporating the previous $5.0 million line, which proceeds are available for investment opportunities, working capital and the issuance of letters of credit. The interest rate on outstanding amounts is equal to a floating rate of 1-month LIBOR Daily Floating Rate plus 1.85%. The unused commitment fee is equal to 0.25%. The line of credit terms require us to be in compliance with certain financial and other covenants. A summary of the most significant financial covenants is as follows:
Financial Covenants | ||||
Tangible Net Worth | At least $40.0 million | |||
Current Ratio | At least 1.75 to 1.0 | |||
Unencumbered liquid assets | Equal to or greater than outstanding principal balance plus accrued interest |
The loan agreement also contains a variety of other customary affirmative and negative covenants. The loan agreement expires February 14, 2013 and any then outstanding amounts borrowed under the agreement are then due and payable.
45
Table of Contents
PART III
Item 10.Directors, Executive Officers and Corporate Governance.
The information required by this Item is set forth in our Proxy Statement for our 2012 annual meeting of stockholders (our “Proxy Statement”) under the captions “PROPOSAL 1—ELECTION OF DIRECTORS—Information Concerning Nominees,” “INFORMATION CONCERNING EXECUTIVE OFFICERS,” “MEETINGS AND COMMITTEES OF THE BOARD—Code of Ethics” and “—Audit Committee,” and “SECTION 16(a) BENEFICIAL OWNERSHIP REPORTING COMPLIANCE” and is hereby incorporated herein by reference.
Item 11.Executive Compensation.
The information required by this Item is set forth in our Proxy Statement under the captions“MEETINGS AND COMMITTEES OF THE BOARD—Compensation Committee Interlocks and Insider Participation,”“COMPENSATION OF OUTSIDE DIRECTORS,” “DIRECTOR COMPENSATION TABLE,” “COMPENSATION COMMITTEE REPORT,” “COMPENSATION DISCUSSION AND ANALYSIS,” “SUMMARY COMPENSATION TABLE,” “GRANTS OF PLAN-BASED AWARDS IN 2011,” “EXECUTIVE COMPENSATION AGREEMENTS,” “OUTSTANDING EQUITY AWARDS AT FISCAL YEAR-END 2011,” “OPTION EXERCISES AND STOCK VESTED DURING 2011,”and“POTENTIAL PAYMENTS UPON TERMINATION OR CHANGE IN CONTROL”and is hereby incorporated herein by reference.
Item 12.Security Ownership of Certain Beneficial Owners and Management and Related Stockholder Matters.
The information required by this Item regarding beneficial ownership of our equity securities is set forth in our Proxy Statement under the caption “SECURITY OWNERSHIP OF CERTAIN BENEFICIAL OWNERS AND MANAGEMENT” and is hereby incorporated herein by reference.
Equity Compensation Plan Information
The following table sets forth certain information regarding our equity compensation plans as of December 31, 2011.
EQUITY COMPENSATION PLAN INFORMATION
Plan Category | Number of Securities to be Issued upon Exercise of Outstanding Options, Warrants and Rights (a) | Weighted-Exercise Price of Outstanding Options, Warrants and Rights (b) | Number of Securities Remaining Available for Future Issuance Under Equity Compensation Plans (Excluding Securities Reflected in Column (a) (c) | |||||||||
Equity Compensation plans approved by security holders: | 8,658,475 | (1) | $ | 7.50 | 1,531,131 | (2) | ||||||
Equity Compensation plans not approved by security holders: | 416,667 | (3) | $ | 12.59 | N/A | |||||||
Total | 9,075,142 | N/A | N/A | |||||||||
| (1) | Includes 554,849 shares subject to awards the vesting of which are tied service periods, 208,500 shares subject to awards the vesting of which are tied to satisfaction of performance goals and 540,000 shares subject to awards the vesting of which are tied to the satisfaction of pricing levels in respect of our Class A Common Stock. The weighted average exercise price reported in column (b) does not take these awards into account. |
46
Table of Contents
| (2) | Represents shares available for grant under the Martha Stewart Living Omnimedia Omnibus Stock and Option Compensation Plan. |
| (3) | Represents the remainder of a warrant issued in connection with a consulting agreement in August 2006; the shares became fully vested in July 2007. See Note 9,Employee and Non-Employee Benefit and Compensation Plans, in the Notes to Consolidated Financial Statements of this Annual Report on Form 10-K for further discussion. |
Item 13.Certain Relationships and Related Transactions, and Director Independence.
The information required by this Item is set forth in our Proxy Statement under the caption “CERTAIN RELATIONSHIPS AND RELATED PERSON TRANSACTIONS” and “MEETING AND COMMITTEES OF THE BOARD—Corporate Governance” and is hereby incorporated herein by reference.
Item 14.Principal Accountant Fees and Services.
The information required by this Item is set forth in our Proxy Statement under the caption “INDEPENDENT REGISTERED PUBLIC ACCOUNTING FIRM” and is hereby incorporated herein by reference.
47
Table of Contents
PART IV
Item 15.Exhibits and Financial Statement Schedules.
(a) (1) and (2) Financial Statements and Schedules: See page F-1 of this Annual Report on Form 10-K.
(3) Exhibits:
Exhibit | Exhibit Title | |||
| 3.1 | — | Martha Stewart Living Omnimedia, Inc. Certificate of Incorporation (incorporated by reference to Exhibit 3.1 to our Registration Statement on Form S-1, as amended, file number 333-84001 (the “Registration Statement”)). | ||
| 3.1.1 | Certificate of Designations of the Series A Preferred Stock of Martha Stewart Living Omnimedia, Inc. (incorporated by reference to our Current Report on Form 8-K/A (file number 001-15395) filed on December 13, 2011). | |||
| 3.2 | — | Second Amended and Restated By-Laws of Martha Stewart Living Omnimedia, Inc. (incorporated by reference to our Current Report on Form 8-K (file number 001-15395) filed on December 12, 2011). | ||
| 4.1 | — | Warrant to purchase shares of Class A Common Stock, dated August 11, 2006 (incorporated by reference to Exhibit 4.2 to our Quarterly Report on Form 10-Q (file number 001-15395) for the quarter ended September 30, 2006 (the “September 2006 10-Q”)). | ||
| 4.2 | — | Investor Rights Agreement dated as of December 6, 2011 by and between Martha Stewart Living Omnimedia, Inc. and J.C. Penney Corporation, Inc. (incorporated by reference to Exhibit 2 to the Schedule 13D (file number 001-15395) filed by J.C. Penney Company, Inc. on December 16, 2011). | ||
| 10.1† | — | 1999 Stock Incentive Plan (incorporated by reference to the Registration Statement), as amended by Exhibits 10.1.1, 10.1.2 and 10.1.3. | ||
| 10.1.1† | — | Amendment No. 1 to the 1999 Stock Incentive Plan, dated as of March 9, 2000 (incorporated by reference to our Annual Report on Form 10-K (file number 001-15395) for the year ended December 31, 1999 (the “1999 10-K”)). | ||
| 10.1.2† | — | Amendment No. 2 to the Amended and Restated 1999 Stock Incentive Plan, dated as of May 11, 2000 (incorporated by reference to our Quarterly Report on Form 10-Q (file number 001-15395) for the quarter ended June 30, 2000). | ||
| 10.1.3† | — | Amendment No. 3 to the Amended and Restated 1999 Stock Incentive Plan (incorporated by reference to our Current Report on Form 8-K (file number 001-15395) filed on May 17, 2005 (the “May 17, 2005 8-K”)). | ||
| 10.2† | — | 1999 Non-Employee Director Stock and Option Compensation Plan (incorporated by reference to the Registration Statement) as amended by Exhibit 10.2.1. | ||
| 10.2.1† | — | Amendment No. 1 to the Martha Stewart Living Omnimedia, Inc. Non-Employee Director Stock and Option Compensation Plan (incorporated by reference to the May 17, 2005 8-K). | ||
| 10.3 | — | Form of Intellectual Property License and Preservation Agreement, dated as of October 22, 1999, by and between Martha Stewart Living Omnimedia, Inc. and Martha Stewart (incorporated by reference to Exhibit 10.8 to the Registration Statement). | ||
| 10.4†* | — | Director Compensation Program | ||
48
Table of Contents
Exhibit | Exhibit Title | |||
| 10.5.† | — | Amended and Restated Employment Agreement, dated as of July 26, 2011, between Martha Stewart Living Omnimedia, Inc. and Charles A. Koppelman (incorporated by reference to Exhibit 10.1 to our Quarterly Report on Form 10-Q (file number 001-15395) for the quarter ended September 30, 2011 (“September 2011 10-Q”)), as amended by Exhibit 10.5.1. | ||
| 10.5.1† | — | Amendment dated as of September 15, 2011 to the Amended and Restated Employment Agreement, dated as of July 26, 2011, between Martha Stewart Living Omnimedia, Inc. and Charles A. Koppelman (incorporated by reference to Exhibit 10.2 to our September 2011 10-Q). | ||
| 10.6 | — | Lease, dated August 20, 1999, between 601 West Associates LLC and Martha Stewart Living Omnimedia LLC (incorporated by reference to Exhibit 10.12 to the Registration Statement) as amended by Exhibits 10.6.1 and 10.6.2. | ||
| 10.6.1 | — | First Lease Modification Agreement, dated December 24, 1999, between 601 West Associates LLC and Martha Stewart Living Omnimedia, Inc. (incorporated by reference to Exhibit 10.12.1 to our 1999 10-K). | ||
| 10.6.2 | — | Sixth Lease Modification Agreement, dated as of June 14, 2007, between 601 West Associates LLC and Martha Stewart Living Omnimedia, Inc (incorporated by reference to Exhibit 10.1 to our Quarterly Report on Form 10-Q (file number 001-15395) for the quarter ended March 31, 2008 (“March 2008 10-Q”)). | ||
| 10.7† | — | Employment Agreement, dated as of September 17, 2008, between Martha Stewart Living Omnimedia, Inc. and Robin Marino (incorporated by reference to Exhibit 10.4 to our Quarterly Report on Form 10-Q (file number 001-15395) for the quarter ended September 30, 2008 (the “September 2008 10-Q”). | ||
| 10.8† | — | Letter Agreement, dated as of September 1, 2009, between Martha Stewart Living Omnimedia, Inc. and Peter Hurwitz (incorporated by reference to Exhibit 10.5 to our September 2011 10-Q). | ||
| 10.9† | — | Amended and Restated Employment Agreement, dated as of April 1, 2009, between Martha Stewart Living Omnimedia, Inc. and Martha Stewart (incorporated by reference to Exhibit 10.2 to our Quarterly Report on Form 10-Q (file number 001-15395) for the Quarter ended March 31, 2009 (“March 2009 10-Q”). | ||
| 10.10 | — | Intangible Asset License Agreement, dated as of June 13, 2008, between Martha Stewart Living Omnimedia, Inc. and MS Real Estate Management Company (incorporated by reference to Exhibit 10.9 to our Quarterly Report on Form 10-Q (file number 001-15395) for the quarter ended June 30, 2008, as amended by Exhibits 10.10.1 and 10.10.2. | ||
| 10.10.1 | — | First Amendment, dated as of December, 2008, to the Intangible Asset License Agreement between MS Real Estate Management Company and Martha Stewart Living Omnimedia, Inc. dated as of June 13, 2008 (incorporated by reference to Exhibit 10.11.1 to our Annual Report on Form 10-K (file number 001-15395) for the year ended December 31, 2009 (the “2009 10-K”)). | ||
| 10.10.2 | — | Second Amendment, dated as of February 8, 2010, to the Intangible Asset License Agreement between MS Real Estate Management Company and Martha Stewart Living Omnimedia, Inc. dated as of June 13, 2008, as amended (incorporated by reference to Exhibit 10.11.2 to the 2009 10-K). | ||
| 10.11† | — | Employment Agreement, dated as of March 24, 2009, between Martha Stewart Living Omnimedia, Inc. and Kelli Turner (incorporated by reference to Exhibit 10.1 to our March 2009 10-Q). | ||
49
Table of Contents
Exhibit | Exhibit Title | |||
| 10.12† | — | Form of Restricted Stock Award Agreement for use under the Martha Stewart Living Omnimedia, Inc. Amended and Restated 1999 Stock Incentive Plan (incorporated by reference to Exhibit 10.1 to our Current Report on Form 8-K (file number 001-15395) filed on January 14, 2005). | ||
| 10.13† | — | Registration Rights Agreement between Charles A. Koppelman and Martha Stewart Living Omnimedia, Inc. dated January 24, 2005 (incorporated by reference to Exhibit 10.3 to our Current Report on Form 8-K (file number 001-15395) filed on October 21, 2005). | ||
| 10.14 | — | Warrant Registration Rights Agreement, dated as of August 11, 2006, between Martha Stewart Living Omnimedia, Inc. and Mark Burnett (incorporated by reference to Exhibit 10.3 to our September 2006 10-Q). | ||
| 10.15† | — | Services Agreement, dated as of July 26, 2011, between Martha Stewart Living Omnimedia, Inc. and Charles Koppelman (incorporated by reference to Exhibit 10.3 to our September 2011 10-Q). | ||
| 10.16 | — | Publicity Rights Agreement, dated as of April 2, 2008, by and among Martha Stewart Living Omnimedia, Inc., MSLO Shared IP Sub LLC and Emeril J. Lagasse, III (incorporated by reference to Exhibit 10.4 to our March 2008 10-Q). | ||
| 10.17 | — | Amended and Restated Loan Agreement, dated as of August 7, 2009, by and among Bank of America, N.A., MSLO Emeril Acquisition Sub LLC and Martha Stewart Living Omnimedia, Inc. (incorporated by reference to Exhibit 10.1 to our Quarterly Report on Form 10-Q (file number 001-15395) for the quarter ended September 30, 2009 (“September 2009 10-Q”)), as amended by Exhibits 10.17.1, 10.17.2, 10.17.3 and 10.17.4. | ||
| 10.17.1 | — | Waiver and Amendment to Loan Documents, dated as of December 18, 2009, to Amended and Restated Loan Agreement dated as of August 7, 2009 among Bank of America, N.A., MSLO Emeril Acquisition Sub LLC and Martha Stewart Living Omnimedia, Inc. (incorporated by reference to Exhibit 10.22 to our 2009 10-K). | ||
| 10.17.2 | — | Waiver and Amendment, dated as of November 1, 2010, to the Amended and Restated Loan Agreement, dated as of August 7, 2009, by and among Bank of America, N.A., MSLO Emeril Acquisition Sub LLC and Martha Stewart Living Omnimedia, Inc. (incorporated by reference to Exhibit 10.1 to our Quarterly Report on Form 10-Q (file number 001-15395) for the quarter ended September 30, 2010). | ||
| 10.17.3 | — | Waiver and Amendment, dated as of March 11, 2011, to the Amended and Restated Loan Agreement, dated as of August 7, 2009, by and among Bank of America, N.A., MSLO Emeril Acquisition Sub LLC and Martha Stewart Living Omnimedia, Inc. (incorporated by reference to Exhibit 10.3 to our Quarterly Report on Form 10-Q (file number 001-15395) for the quarter ended March 31, 2011 (“March 2011 10-Q”)). | ||
| 10.17.4 | — | Amendment, dated as of June 29, 2011, to the Amended and Restated Loan Agreement, dated as of August 7, 2009, by and among Bank of America, N.A., MSLO Emeril Acquisition Sub LLC and Martha Stewart Living Omnimedia, Inc. ((incorporated by reference to Exhibit 10.2 to our Quarterly Report on Form 10-Q (file number 001-15395) for the quarter ended June 30, 2011 (“June 2011 10-Q”)). | ||
| 10.18 | — | Security Agreement, dated as of July 31, 2008, among Martha Stewart Living Omnimedia, Inc., MSLO Emeril Acquisition Sub LLC, and Bank of America, N.A. (incorporated by reference to Exhibit 10.1 to our September 2008 10-Q), as amended by Exhibits 10.18.1, 10.18.2, and 10.17.1. | ||
50
Table of Contents
Exhibit | Exhibit Title | |||
| 10.18.1 | — | Waiver and Omnibus Amendment No. 1, dated as of June 18, 2009, to Loan Agreement dated as of April 4, 2008 by and among Bank of America, N.A., MSLO Emeril Acquisition Sub LLC and Martha Stewart Living Omnimedia, Inc. (incorporated by reference to Exhibit 10.1 to our Quarterly Report on Form 10-Q (file number 001-15395) for the quarter ended June 30, 2009). | ||
| 10.18.2 | — | Amendment No. 2, dated as of August 7, 2009, to Security Agreement dated as of July 31, 2008 among Martha Stewart Living Omnimedia, Inc., Emeril Acquisition Sub LLC and Bank of America, (incorporated by reference to Exhibit 10.2 to our September 2009 10-Q). | ||
| 10.19 | — | Continuing and Unconditional Guaranty dated as of April 4, 2008 executed by Martha Stewart Living Omnimedia, Inc., MSO IP Holdings, Inc., Martha Stewart, Inc., Body and Soul Omnimedia, Inc., MSLO Productions, Inc., MSLO Productions—Home, Inc., MSLO Productions—EDF, Inc. and Flour Productions, Inc. (incorporated by reference to Exhibit 10.8 to our March 2008 10-Q), as reaffirmed by Exhibit 10.22.1. | ||
| 10.19.1 | — | Reaffirmation of Guaranty, dated as of August 7, 2009, executed by Martha Stewart Living Omnimedia, Inc., MSO IP Holdings, Inc., Martha Stewart, Inc., Body and Soul Omnimedia, Inc., MSLO Productions, Inc. MSLO Productions Home, Inc. MSLO Productions—EDF, Inc and Flour Productions, Inc. (incorporated by reference to Exhibit 10.3 to our September 2009 10-Q). | ||
| 10.20 | — | Registration Rights Agreement, dated as of April 2, 2008, by and among Martha Stewart Living Omnimedia, Inc., Emeril’s Food of Love Productions, L.L.C., emerils.com, LLC and Emeril J. Lagasse, III (incorporated by reference to Exhibit 10.9 to our March 2008 10-Q). | ||
| 10.21† | — | Martha Stewart Living Omnimedia, Inc. Director Deferral Plan (incorporated by reference to Exhibit 10.46 to our Annual Report on Form 10-K (file number 001-15395) for the year ended December 31, 2008 (the “2008 10-K”)). | ||
| 10.22† | — | Martha Stewart Living Omnimedia, Inc. Omnibus Stock and Option Compensation Plan (incorporated by reference to Exhibit 99.1 to our Current Report on Form 8-K (file number 001-15395) filed on May 20, 2008 (“May 20, 2008 8-K”)). | ||
| 10.23† | — | Form of Martha Stewart Living Omnimedia, Inc. Omnibus Stock and Option Compensation Plan Stock Option Agreement and forms of related Notices (incorporated by reference to Exhibit 99.2 to our May 20, 2008 8-K). | ||
| 10.24† | — | Form of Martha Stewart Living Omnimedia, Inc. Omnibus Stock and Option Compensation Plan Restricted Stock Unit Agreement (incorporated by reference to Exhibit 10.1 to our March 2011 10-Q). | ||
| 10.25† | — | Form of Martha Stewart Living Omnimedia, Inc. Omnibus Stock and Option Compensation Plan Restricted Stock Unit Agreement for Directors (incorporated by reference to Exhibit 10.2 to our March 2011 10-Q). | ||
| 10.26† | — | Form of Martha Stewart Living Omnimedia, Inc. Omnibus Stock and Option Compensation Plan Restricted Stock Grant Agreement (incorporated by reference to Exhibit 99.4 to our May 20, 2008 8-K). | ||
| 10.27† | — | Form of Martha Stewart Living Omnimedia, Inc. Omnibus Stock and Option Compensation Plan Stock Appreciation Right Agreement and form of related Notice (incorporated by reference to Exhibit 99.5 to our May 20, 2008 8-K). | ||
| 10.28† | — | Form of Martha Stewart Living Omnimedia, Inc. Omnibus Stock and Option Compensation Plan Stock Grant Agreement and form of related Acknowledgement (incorporated by reference to Exhibit 99.6 to our May 20, 2008 8-K). | ||
51
Table of Contents
Exhibit | Exhibit Title | |||
| 10.29† | — | Form of Performance-Based Restricted Stock Unit Agreement pursuant to the Martha Stewart Living Omnimedia, Inc. Omnibus Stock and Option Compensation Plan (incorporated by reference to Exhibit 10.1 to our Current Report on Form 8-K (file number 001-15395) filed on February 12, 2009). | ||
| 10.30† | — | Martha Stewart Living Omnimedia, Inc. Omnibus Stock and Option Compensation Plan Restricted Stock Grant Agreement dated October 1, 2008 between Martha Stewart Living Omnimedia, Inc. and Charles Koppelman (incorporated by reference to Exhibit 10.5 to our September 2008 10-Q). | ||
| 10.31† | — | Martha Stewart Living Omnimedia, Inc. Omnibus Stock and Option Compensation Plan Stock Option Grant Agreement and form of related Notice dated October 1, 2008 between Martha Stewart Living Omnimedia, Inc. and Charles Koppelman (incorporated by reference to Exhibit 10.6 to our September 2008 10-Q). | ||
| 10.32† | — | Martha Stewart Living Omnimedia, Inc. Annual Incentive Plan (incorporated by reference to the Company’s proxy statement filed in respect of its 2005 annual meeting of stockholders, dated as of April 7, 2005). | ||
| 10.33† | — | Form of Martha Stewart Living Omnimedia, Inc. Indemnification Agreement for Directors (incorporated by reference to Exhibit 10.1 to our June 2011 10-Q). | ||
| 10.34† | — | Employment Agreement, dated as of May 24, 2011, between Martha Stewart Living Omnimedia, Inc. and Lisa Gersh (incorporated by reference to Exhibit 10.3 to our June 2011 10-Q). | ||
| 10.35† | — | Employment Agreement, dated as of September 6, 2011, between Martha Stewart Living Omnimedia, Inc. and Kenneth P. West (incorporated by reference to Exhibit 10.4 to our September 2011 10-Q). | ||
| 10.36†* | — | Employment Agreement, dated as of August 22, 2011, between Martha Stewart Living Omnimedia, Inc. and Daniel Taitz. | ||
| 10.37 | — | Securities Purchase Agreement, dated as of December 6, 2011, by and between Martha Stewart Living Omnimedia, Inc. and J.C. Penney Corporation, Inc. (incorporated by reference to Exhibit 1 to the Schedule 13D (file number 001-15395) filed by J.C. Penney Company, Inc. on December 16, 2011). | ||
| 10.38† | — | Separation Agreement and General Release, dated as of September 13, 2011, between Martha Stewart Living Omnimedia, Inc. and Peter Hurwitz (incorporated by reference to Exhibit 10.5 to our September 2011 10-Q). | ||
| 10.39*+ | — | JCP/MSLO Agreement, dated as of December 6, 2011, by and between J.C. Penney Corporation, Inc. and Martha Stewart Living Omnimedia, Inc., as amended by Exhibit 10.39.1. | ||
| 10.39.1* | — | First Amendment, dated as of January 4, 2012, to the JCP/MSLO Agreement, dated as of December 6, 2011, by and between J.C. Penney Corporation, Inc. and Martha Stewart Living Omnimedia, Inc. | ||
| 21* | — | List of Subsidiaries. | ||
| 23.1* | — | Consent of Independent Registered Public Accounting Firm. | ||
| 31.1* | — | Certification of Principal Executive Officer Pursuant to Section 302 of the Sarbanes-Oxley Act of 2002. | ||
| 31.2* | — | Certification of Principal Financial Officer Pursuant to Section 302 of the Sarbanes-Oxley Act of 2002. | ||
52
Table of Contents
Exhibit | Exhibit Title | |||
| 32* | — | Certification of Principal Executive Officer and Chief Financial Officer Pursuant to Section 906 of the Sarbanes-Oxley Act of 2002. | ||
| 101.INS *** | XBRL Instance Document | |||
| 101.SCH *** | XBRL Taxonomy Extension Schema Document | |||
| 101.CAL *** | XBRL Taxonomy Extension Calculation Linkbase Document | |||
| 101.DEF *** | XBRL Taxonomy Extension Definition Linkbase Document | |||
| 101.LAB *** | XBRL Taxonomy Extension Label Linkbase Document | |||
| 101.PRE *** | XBRL Taxonomy Extension Presentation Linkbase Document | |||
| † | Indicates management contracts and compensatory plans. |
| + | Indicates that confidential treatment has been requested as to certain portions of this exhibit pursuant to Rule 24b-2 of the Securities Exchange Act of 1934, as amended. |
| * | Indicates filed herewith. |
| ** | Schedules and exhibits to this Agreement have been omitted. The Company agrees to furnish a supplemental copy of any omitted schedule or exhibit to the Securities and Exchange Commission upon request. |
| *** | In accordance with Rule 406T of Regulation S-T, these XBRL (eXtensible Business Reporting Language) documents are furnished and not filed or a part of a registration statement or prospectus for purposes of Sections 11 or 12 of the Securities Act of 1933 or Section 18 of the Securities Exchange Act of 1934 and otherwise are not subject to liability under these sections. |
53
Table of Contents
Pursuant to the requirements of Section 13 or 15(d) of the Securities Exchange Act of 1934, the Registrant has duly caused this report to be signed on its behalf by the undersigned, thereunto duly authorized.
Dated: March 6, 2012
| MARTHA STEWART LIVING OMNIMEDIA, INC. | ||
| By: | /s/ LISA GERSH | |
| Lisa Gersh | ||
| President and Chief Operating Officer | ||
Pursuant to the requirements of the Securities Exchange Act of 1934, this report has been signed below by the following persons on behalf of the registrant and in the capacities and on the date indicated.
Signature | Capacity | |||
/s/ LISA GERSH Lisa Gersh | President and Director (Principal Executive Officer) | |||
/s/ KENNETH P. WEST Kenneth P. West | Chief Financial Officer (Principal Financial Officer) | |||
/s/ ALLISON JACQUES Allison Jacques | Controller (Principal Accounting Officer) | |||
/s/ CHARLES A. KOPPELMAN Charles A. Koppelman | Chairman of the Board | |||
/s/ CHARLOTTE BEERS Charlotte Beers | Director | |||
/s/ FREDERIC FEKKAI Frederic Fekkai | Director | |||
/s/ ARLEN KANTARIAN Arlen Kantarian | Director | |||
/s/ MICHAEL W. KRAMER Michael W. Kramer | Director | |||
/s/ WILLIAM A. ROSKIN William A. Roskin | Director | |||
/s/ CLAUDIA SLACIK Claudia Slacik | Director | |||
/s/ TODD SLOTKIN Todd Slotkin | Director | |||
54
Table of Contents
Signature | Capacity | |||
/s/ MARGARET M. SMYTH Margaret M. Smyth | Director | |||
/s/ MARTHA STEWART Martha Stewart | Director | |||
/s/ DANIEL E. WALKER Daniel E. Walker | Director | |||
Each of the above signatures is affixed as of March 6, 2012
55
Table of Contents
INDEX TO CONSOLIDATED FINANCIAL STATEMENTS,
FINANCIAL STATEMENT SCHEDULES AND OTHER
FINANCIAL INFORMATION
Consolidated Financial Statements: | ||||
| F-2 | ||||
Consolidated Statements of Operations for the years ended December 31, 2011, 2010 and 2009 | F-3 | |||
| F-4 | ||||
| F-5 | ||||
Consolidated Statements of Cash Flows for the years ended December 31, 2011, 2010, and 2009 | F-6 | |||
| F-7 | ||||
| F-34 | ||||
All other schedules are omitted because they are not applicable or the required information is shown in the Consolidated Financial Statements or Notes thereto.
F-1
Table of Contents
Report of Independent Registered Public Accounting Firm
The Board of Directors and Shareholders of Martha Stewart Living Omnimedia, Inc.
We have audited the accompanying consolidated balance sheets of Martha Stewart Living Omnimedia, Inc. as of December 31, 2011 and 2010, and the related consolidated statements of operations, shareholders’ equity and comprehensive loss, and cash flows for each of the three years in the period ended December 31, 2011. Our audits also included the financial statement schedule listed in the Index at Item 15(a). These financial statements and schedule are the responsibility of the Company’s management. Our responsibility is to express an opinion on these financial statements and schedule based on our audits.
We conducted our audits in accordance with the standards of the Public Company Accounting Oversight Board (United States). Those standards require that we plan and perform the audit to obtain reasonable assurance about whether the financial statements are free of material misstatement. An audit includes examining, on a test basis, evidence supporting the amounts and disclosures in the financial statements. An audit also includes assessing the accounting principles used and significant estimates made by management, as well as evaluating the overall financial statement presentation. We believe that our audits provide a reasonable basis for our opinion.
In our opinion, the financial statements referred to above present fairly, in all material respects, the consolidated financial position of Martha Stewart Living Omnimedia, Inc. at December 31, 2011 and 2010, and the consolidated results of its operations and its cash flows for each of the three years in the period ended December 31, 2011, in conformity with U.S. generally accepted accounting principles. Also, in our opinion, the related financial statement schedule, when considered in relation to the basic financial statements taken as a whole, presents fairly in all material respects the information set forth therein.
We also have audited, in accordance with the standards of the Public Company Accounting Oversight Board (United States), Martha Stewart Living Omnimedia Inc.’s internal control over financial reporting as of December 31, 2011, based on criteria established in Internal Control-Integrated Framework issued by the Committee of Sponsoring Organizations of the Treadway Commission and our report dated March 6, 2012 expressed an unqualified opinion thereon.
/s/ Ernst & Young LLP
New York, New York
March 6, 2012
F-2
Table of Contents
MARTHA STEWART LIVING OMNIMEDIA, INC.
CONSOLIDATED STATEMENTS OF OPERATIONS
For the Years Ended December 31, 2011, 2010 and 2009
(in thousands except share and per share data)
| 2011 | 2010 | 2009 | ||||||||||
REVENUES | ||||||||||||
Publishing | $ | 140,857 | $ | 145,573 | $ | 146,100 | ||||||
Broadcasting | 31,962 | 42,434 | 46,111 | |||||||||
Merchandising | 48,614 | 42,806 | 52,566 | |||||||||
|
|
|
|
|
| |||||||
Total revenues | 221,433 | 230,813 | 244,777 | |||||||||
|
|
|
|
|
| |||||||
OPERATING COSTS AND EXPENSES | ||||||||||||
Production, distribution and editorial | 127,084 | 128,194 | 125,115 | |||||||||
Selling and promotion | 57,208 | 60,288 | 59,333 | |||||||||
General and administrative | 46,641 | 46,362 | 52,991 | |||||||||
Depreciation and amortization | 3,978 | 4,632 | 7,874 | |||||||||
Restructuring charges | 5,116 | — | — | |||||||||
Impairment charge—other asset | — | — | 11,432 | |||||||||
|
|
|
|
|
| |||||||
Total operating costs and expenses | 240,027 | 239,476 | 256,745 | |||||||||
|
|
|
|
|
| |||||||
OPERATING LOSS | (18,594 | ) | (8,663 | ) | (11,968 | ) | ||||||
OTHER INCOME / (EXPENSE) | ||||||||||||
Interest expense, net | (283 | ) | (66 | ) | (101 | ) | ||||||
Loss on sale of fixed asset | — | (647 | ) | — | ||||||||
Gain on sale of short-term investments | — | 1,512 | 330 | |||||||||
Gain /(loss) on equity securities | 15 | (15 | ) | (877 | ) | |||||||
Other loss | — | — | (236 | ) | ||||||||
Net gain on sale of cost-based investment | 7,647 | — | — | |||||||||
Other-than-temporary loss on cost-based investments | (2,724 | ) | — | — | ||||||||
|
|
|
|
|
| |||||||
Total other income / (expense) | 4,655 | 784 | (884 | ) | ||||||||
LOSS BEFORE INCOME TAXES | (13,939 | ) | (7,879 | ) | (12,852 | ) | ||||||
Income tax provision | (1,580 | ) | (1,717 | ) | (1,726 | ) | ||||||
|
|
|
|
|
| |||||||
NET LOSS | $ | (15,519 | ) | $ | (9,596 | ) | $ | (14,578 | ) | |||
|
|
|
|
|
| |||||||
LOSS PER SHARE—BASIC AND DILUTED | ||||||||||||
Net loss | $ | (0.28 | ) | $ | (0.18 | ) | $ | (0.27 | ) | |||
|
|
|
|
|
| |||||||
WEIGHTED AVERAGE COMMON SHARES OUTSTANDING | ||||||||||||
Basic and diluted | 55,880,896 | 54,440,490 | 53,879,785 | |||||||||
The accompanying notes are an integral part of these consolidated financial statements.
F-3
Table of Contents
MARTHA STEWART LIVING OMNIMEDIA, INC.
CONSOLIDATED BALANCE SHEETS
December 31, 2011 and 2010
(in thousands except share and per share data)
| 2011 | 2010 | |||||||
ASSETS | ||||||||
CURRENT ASSETS | ||||||||
Cash and cash equivalents | $ | 38,453 | $ | 23,204 | ||||
Short-term investments | 11,051 | 10,091 | ||||||
Accounts receivable, net | 48,237 | 59,250 | ||||||
Inventory | 7,225 | 5,309 | ||||||
Deferred television production costs | — | 2,413 | ||||||
Other current assets | 4,858 | 4,772 | ||||||
|
|
|
| |||||
Total current assets | 109,824 | 105,039 | ||||||
|
|
|
| |||||
PROPERTY, PLANT AND EQUIPMENT,net | 13,396 | 14,507 | ||||||
GOODWILL,net | 45,107 | 45,107 | ||||||
OTHER INTANGIBLE ASSETS,net | 45,215 | 46,547 | ||||||
OTHER NONCURRENT ASSETS,net | 2,578 | 11,114 | ||||||
|
|
|
| |||||
Total assets | $ | 216,120 | $ | 222,314 | ||||
|
|
|
| |||||
LIABILITIES AND SHAREHOLDERS’ EQUITY | ||||||||
CURRENT LIABILITIES | ||||||||
Accounts payable and accrued liabilities | $ | 23,728 | $ | 30,062 | ||||
Accrued payroll and related costs | 7,008 | 6,541 | ||||||
Current portion of deferred subscription revenue | 16,018 | 18,734 | ||||||
Current portion of other deferred revenue | 5,147 | 4,732 | ||||||
Current portion loan payable | — | 1,500 | ||||||
|
|
|
| |||||
Total current liabilities | 51,901 | 61,569 | ||||||
|
|
|
| |||||
DEFERRED SUBSCRIPTION REVENUE | 3,975 | 4,529 | ||||||
OTHER DEFERRED REVENUE | 2,333 | 1,413 | ||||||
LOAN PAYABLE | — | 7,500 | ||||||
DEFERRED INCOME TAX LIABILITY | 5,874 | 4,527 | ||||||
OTHER NONCURRENT LIABILITIES | 4,090 | 3,743 | ||||||
|
|
|
| |||||
Total liabilities | 68,173 | 83,281 | ||||||
|
|
|
| |||||
COMMITMENTS AND CONTINGENCIES | ||||||||
SHAREHOLDERS’ EQUITY | ||||||||
Series A Preferred Stock, 1 share issued and outstanding in 2011 | — | — | ||||||
Class A Common Stock, $0.01 par value, 350,000,000 shares authorized; 40,893,964 and 28,753,212 shares issued and outstanding in 2011 and 2010, respectively | 409 | 288 | ||||||
Class B Common Stock, $0.01 par value, 150,000,000 shares authorized; 25,984,625 and 26,317,960 shares issued and outstanding in 2011 and 2010 | 260 | 263 | ||||||
Capital in excess of par value | 336,661 | 295,576 | ||||||
Accumulated deficit | (188,442 | ) | (156,201 | ) | ||||
Accumulated other comprehensive loss | (166 | ) | (118 | ) | ||||
|
|
|
| |||||
| 148,722 | 139,808 | |||||||
|
|
|
| |||||
Less: Class A treasury stock—59,400 shares at cost | (775 | ) | (775 | ) | ||||
|
|
|
| |||||
Total shareholders’ equity | 147,947 | 139,033 | ||||||
|
|
|
| |||||
Total liabilities and shareholders’ equity | $ | 216,120 | $ | 222,314 | ||||
|
|
|
| |||||
The accompanying notes are an integral part of these consolidated financial statements.
F-4
Table of Contents
MARTHA STEWART LIVING OMNIMEDIA, INC.
CONSOLIDATED STATEMENTS OF SHAREHOLDERS’ EQUITY AND COMPREHENSIVE LOSS
For the Years Ended December 31, 2011, 2010 and 2009
(in thousands)
| Class A Common Stock | Class B Common Stock | Capital in excess of par value | Accumulated Deficit | Accumulated Other Comprehensive Income/(Loss) | Class A Treasury Stock | Total | ||||||||||||||||||||||||||||||||||
| Shares | Amount | Shares | Amount | Shares | Amount | |||||||||||||||||||||||||||||||||||
Balance at January 1, 2009 | 28,204 | $ | 282 | 26,690 | $ | 267 | $ | 283,248 | $ | (132,027 | ) | $ | — | (59 | ) | $ | (775 | ) | $ | 150,995 | ||||||||||||||||||||
Comprehensive loss: | ||||||||||||||||||||||||||||||||||||||||
Net loss | — | — | — | — | — | (14,578 | ) | — | — | — | (14,578 | ) | ||||||||||||||||||||||||||||
Other comprehensive loss: | ||||||||||||||||||||||||||||||||||||||||
Unrealized gain on investment | — | — | — | — | — | — | 263 | — | — | 263 | ||||||||||||||||||||||||||||||
|
| |||||||||||||||||||||||||||||||||||||||
Total comprehensive loss | — | — | — | — | — | — | — | — | — | (14,315 | ) | |||||||||||||||||||||||||||||
Issuance of shares in conjunction with stock option exercises | 10 | — | — | — | 70 | — | — | — | — | 70 | ||||||||||||||||||||||||||||||
Issuance of shares of stock and restricted stock, net of cancellations and tax withholdings | 99 | 1 | — | — | (558 | ) | — | — | — | — | (557 | ) | ||||||||||||||||||||||||||||
Non-cash equity compensation | — | — | — | — | 7,627 | — | — | — | — | 7,627 | ||||||||||||||||||||||||||||||
|
|
|
|
|
|
|
|
|
|
|
|
|
|
|
|
|
|
|
| |||||||||||||||||||||
Balance at December 31, 2009 | 28,313 | 283 | 26,690 | 267 | 290,387 | (146,605 | ) | 263 | (59 | ) | (775 | ) | 143,820 | |||||||||||||||||||||||||||
Comprehensive loss: | ||||||||||||||||||||||||||||||||||||||||
Net loss | — | — | — | — | — | (9,596 | ) | — | — | — | (9,596 | ) | ||||||||||||||||||||||||||||
Other comprehensive loss: | ||||||||||||||||||||||||||||||||||||||||
Unrealized gain on investment, net | — | — | — | — | — | — | 1,131 | — | — | 1,131 | ||||||||||||||||||||||||||||||
Realized gain on investment | (1,512 | ) | — | — | (1,512 | ) | ||||||||||||||||||||||||||||||||||
|
| |||||||||||||||||||||||||||||||||||||||
Total comprehensive loss | — | — | — | — | — | — | — | — | — | (9,977 | ) | |||||||||||||||||||||||||||||
Conversion of shares | 372 | 4 | (372 | ) | (4 | ) | — | — | — | — | — | — | ||||||||||||||||||||||||||||
Issuance of shares in conjunction with stock option exercises | 142 | 2 | — | — | 293 | — | — | — | — | 295 | ||||||||||||||||||||||||||||||
Issuance of shares of stock and restricted stock, net of cancellations and tax withholdings | (74 | ) | (1 | ) | — | — | (460 | ) | — | — | — | — | (461 | ) | ||||||||||||||||||||||||||
Non-cash equity compensation | — | — | — | — | 5,356 | — | — | — | — | 5,356 | ||||||||||||||||||||||||||||||
|
|
|
|
|
|
|
|
|
|
|
|
|
|
|
|
|
|
|
| |||||||||||||||||||||
Balance at December 31, 2010 | 28,753 | 288 | 26,318 | 263 | 295,576 | (156,201 | ) | (118 | ) | (59 | ) | (775 | ) | 139,033 | ||||||||||||||||||||||||||
Comprehensive loss: | ||||||||||||||||||||||||||||||||||||||||
Net loss | — | — | — | — | — | (15,519 | ) | — | — | — | (15,519 | ) | ||||||||||||||||||||||||||||
Other comprehensive loss: | ||||||||||||||||||||||||||||||||||||||||
Unrealized loss on investment | — | — | — | — | — | — | (48 | ) | — | — | (48 | ) | ||||||||||||||||||||||||||||
|
| |||||||||||||||||||||||||||||||||||||||
Total comprehensive loss | — | — | — | — | — | — | — | — | — | (15,567 | ) | |||||||||||||||||||||||||||||
Conversion of shares | 333 | 3 | (333 | ) | (3 | ) | — | — | — | — | — | — | ||||||||||||||||||||||||||||
Issuance of shares in conjunction with stock option exercises | 840 | 8 | — | — | 1,704 | — | — | — | — | 1,712 | ||||||||||||||||||||||||||||||
Issuance of shares of stock and restricted stock, net of cancellations and tax withholdings | (32 | ) | — | — | — | (78 | ) | — | — | — | — | (78 | ) | |||||||||||||||||||||||||||
Issuance of shares of stock in connection with equity sale, net of expenses | 11,000 | 110 | — | — | 34,483 | — | — | — | — | 34,593 | ||||||||||||||||||||||||||||||
Common stock dividends | — | — | — | — | — | (16,722 | ) | — | — | — | (16,722 | ) | ||||||||||||||||||||||||||||
Non-cash equity compensation | — | — | — | — | 4,976 | — | — | — | — | 4,976 | ||||||||||||||||||||||||||||||
|
|
|
|
|
|
|
|
|
|
|
|
|
|
|
|
|
|
|
| |||||||||||||||||||||
Balance at December 31, 2011 | 40,894 | $ | 409 | 25,985 | $ | 260 | $ | 336,661 | $ | (188,442 | ) | $ | (166 | ) | (59 | ) | $ | (775 | ) | $ | 147,947 | |||||||||||||||||||
|
|
|
|
|
|
|
|
|
|
|
|
|
|
|
|
|
|
|
| |||||||||||||||||||||
The accompanying notes are an integral part of these consolidated financial statements.
F-5
Table of Contents
MARTHA STEWART LIVING OMNIMEDIA, INC.
CONSOLIDATED STATEMENTS OF CASH FLOWS
For the Years Ended December 31, 2011, 2010 and 2009
(in thousands)
| 2011 | 2010 | 2009 | ||||||||||
CASH FLOWS FROM OPERATING ACTIVITIES | ||||||||||||
Net loss | $ | (15,519 | ) | $ | (9,596 | ) | $ | (14,578 | ) | |||
Adjustments to reconcile net loss to net cash (used in)/provided by operating activities: | ||||||||||||
Non-cash revenue | (1,062 | ) | (4,608 | ) | (13,446 | ) | ||||||
Depreciation and amortization | 3,978 | 4,632 | 7,874 | |||||||||
Amortization of deferred television production costs | 23,964 | 27,269 | 20,651 | |||||||||
Impairment charge | — | — | 11,432 | |||||||||
Other-than-temporary loss on cost-based investments | 2,724 | — | — | |||||||||
Non-cash equity compensation | 5,020 | 5,400 | 7,947 | |||||||||
Deferred income tax expense | 1,346 | 1,327 | 1,347 | |||||||||
(Income)/loss on equity securities | (15 | ) | 15 | 877 | ||||||||
Gain on sale of short-term investment | — | (1,512 | ) | (330 | ) | |||||||
Net gain on sale of cost-based investment | (7,647 | ) | — | — | ||||||||
Loss on sale of fixed assets | — | 647 | — | |||||||||
Other non-cash charges, net | 1,907 | 563 | 683 | |||||||||
Changes in operating assets and liabilities | ||||||||||||
Accounts receivable, net | 11,013 | (711 | ) | (3,864 | ) | |||||||
Inventory | (1,916 | ) | (143 | ) | 887 | |||||||
Deferred television production costs | (21,395 | ) | (25,894 | ) | (20,363 | ) | ||||||
Accounts payable and accrued liabilities and other | (6,292 | ) | 4,969 | (1,914 | ) | |||||||
Accrued payroll and related costs | 467 | (954 | ) | (30 | ) | |||||||
Deferred subscription revenue | (3,270 | ) | (996 | ) | (5,212 | ) | ||||||
Deferred revenue | 2,241 | (484 | ) | 5 | ||||||||
Other changes | 2,236 | 1,948 | (1,239 | ) | ||||||||
|
|
|
|
|
| |||||||
Total changes in operating assets and liabilities | (16,916 | ) | (22,265 | ) | (31,730 | ) | ||||||
|
|
|
|
|
| |||||||
Net cash (used in)/provided by operating activities | (2,220 | ) | 1,872 | (9,273 | ) | |||||||
|
|
|
|
|
| |||||||
CASH FLOWS FROM INVESTING ACTIVITIES | ||||||||||||
Capital expenditures | (2,879 | ) | (4,707 | ) | (8,609 | ) | ||||||
Proceeds from the sale of fixed assets | �� | — | 1,403 | — | ||||||||
Purchases of short-term investments | (8,414 | ) | (15,345 | ) | (25,010 | ) | ||||||
Sales of short-term investments | 7,179 | 18,802 | 24,830 | |||||||||
Proceeds from the sale of cost-based investment | 11,000 | — | — | |||||||||
Investment in other non-current assets | — | — | (828 | ) | ||||||||
|
|
|
|
|
| |||||||
Net cash provided by/(used in) investing activities | 6,886 | 153 | (9,617 | ) | ||||||||
|
|
|
|
|
| |||||||
CASH FLOWS FROM FINANCING ACTIVITIES | ||||||||||||
Repayment of long-term debt | (9,000 | ) | (4,500 | ) | (6,000 | ) | ||||||
Dividends paid | (16,722 | ) | — | — | ||||||||
Proceeds from equity sale, net of expenses | 34,593 | — | — | |||||||||
Proceeds from exercise of stock options | 1,712 | 295 | 70 | |||||||||
|
|
|
|
|
| |||||||
Net cash provided by/(used in) financing activities | 10,583 | (4,205 | ) | (5,930 | ) | |||||||
|
|
|
|
|
| |||||||
Net increase/(decrease) in cash | 15,249 | (2,180 | ) | (24,820 | ) | |||||||
CASH AND CASH EQUIVALENTS, BEGINNING OF YEAR | 23,204 | 25,384 | 50,204 | |||||||||
|
|
|
|
|
| |||||||
CASH AND CASH EQUIVALENTS, END OF YEAR | $ | 38,453 | $ | 23,204 | $ | 25,384 | ||||||
|
|
|
|
|
| |||||||
The accompanying notes are an integral part of these consolidated financial statements.
F-6
Table of Contents
NOTES TO CONSOLIDATED FINANCIAL STATEMENTS
(in millions except share data and where noted)
1. THE COMPANY
Martha Stewart Living Omnimedia, Inc. (together with its wholly owned subsidiaries, the “Company”) is a leading provider of original “how to” content and products for homemakers and other consumers. The Company’s business segments are Publishing, Broadcasting and Merchandising.
The Publishing segment primarily consists of the Company’s operations related to its magazines and books, as well as its digital operations which includes the content-driven website,marthastewart.com. The Broadcasting segment primarily consists of the Company’s television production operations, which produce television programming and other licensing revenue, and its satellite radio operations. The Merchandising segment consists of the Company’s operations related to the design and branding of merchandise and related promotional and packaging materials that are distributed by its retail and manufacturing partners in exchange for royalty income.
2. SUMMARY OF SIGNIFICANT ACCOUNTING POLICIES
Recent accounting standards
In September 2011, the Financial Accounting Standards Board (“FASB”) issued Accounting Standards Update (“ASU”) 2011-08, “Intangibles—Goodwill and Other: Testing Goodwill for Impairment” (“ASU 2011-08”), which amended Accounting Standards Codification (“ASC”) 350, “Intangibles—Goodwill and Other.” This amendment is intended to simplify how an entity tests goodwill for impairment and allows an entity to first assess qualitative factors to determine whether it is necessary to perform the two-step quantitative goodwill impairment test. An entity no longer is required to calculate the fair value of a reporting unit unless the entity determines, based on a qualitative assessment, that it is more likely than not that the reporting unit’s fair value is less than its carrying amount. The more-likely-than-not threshold is defined as having a likelihood of more than 50%. ASU 2011-08 was effective for the Company beginning January 1, 2012, although early adoption was permitted. The Company does not expect ASU 2011-08 to have an impact on its consolidated financial position, results of operations or cash flows.
In June 2011, the FASB issued ASU 2011-05, “Comprehensive Income: Presentation of Comprehensive Income,” (“ASU 2011-05”) which amended ASC 220, “Presentation of Comprehensive Income.” In accordance with the new guidance, an entity will no longer be permitted to present comprehensive income in its consolidated statements of stockholders’ equity. Instead, entities will be required to present components of comprehensive income in either one continuous financial statement with two sections, net income and comprehensive income, or in two separate but consecutive statements. The guidance, which must be applied retroactively, was effective for the Company beginning January 1, 2012. The adoption of ASU 2011-05 concerns disclosure only and the Company does not expect ASU 2011-05 to have an impact on its consolidated financial position, results of operations or cash flows.
In May 2011, the FASB issued ASU 2011-04, “Fair Value Measurement: Amendments to Achieve Common Fair Value Measurement and Disclosure Requirements in U.S. GAAP and IFRSs,” (“ASU 2011-04”) which amended ASC 820, “Fair Value Measurement.” This amendment is intended to result in convergence between accounting principles generally accepted in the Unites States (“GAAP”) and International Financial Reporting Standards requirements for measurement of and disclosures about fair value. This amendment clarifies the application of existing fair value measurements and disclosures, and changes certain principles or requirements for fair value measurements and disclosures. ASU 2011-04 is effective for the year beginning January 1, 2012. The Company is currently assessing the potential impact, if any, ASU 2011-04 may have on its consolidated financial position, results of operations and cash flows.
In October 2009, the FASB issued ASU 09-13,Revenue Recognition (Topic 605): Multiple-Deliverable Revenue Arrangements (a consensus of the FASB Emerging Issues Task Force) (“ASU 09-13”). The Company adopted this standard on January 1, 2010. The adoption of this standard did not have a material impact on the Company’s consolidated financial statements.
F-7
Table of Contents
Principles of consolidation
The consolidated financial statements include the accounts of all wholly owned subsidiaries. Investments in which the Company does not exercise significant influence over the investee are accounted for using the cost method of accounting. All significant intercompany transactions have been eliminated.
ASC 810, “Consolidation” (“ASC 810”), provides a framework for identifying variable interest entities (“VIEs”) and determining when a company should include the assets, liabilities, noncontrolling interests and results of activities of a VIE in its consolidated financial statements.
In general, a VIE is a corporation, partnership, limited liability company, trust, or any other legal structure used to conduct activities or hold assets that either (1) has an insufficient amount of equity to carry out its principal activities without additional subordinated financial support, (2) has a group of equity owners that are unable to make significant decisions about its activities, or (3) has a group of equity owners that do not have the obligation to absorb losses or the right to receive returns generated by its operations.
Consolidation of a VIE is evaluated using a qualitative approach, based on determination of which party has the power to direct the most economically significant activities of the entity. A VIE must be consolidated if the enterprise has both (a) the power to direct the activities of the VIE that most significantly impact the entity’s economic performance and (b) the obligation to absorb losses or the right to receive benefits from the VIE that could potentially be significant to the VIE. ASC 810 requires continuous assessments of whether an enterprise is the primary beneficiary of a VIE.
As of December 31, 2011, the Company has one cost-based investment in a technology company that represents an interest in a VIE. There are no future contractual funding commitments at this time. The Company has determined that the Company is not the primary beneficiary of this entity since the Company does not have the power to direct the activities that most significantly impact the entity’s economic performance. Accordingly, the Company does not consolidate this entity. In addition, the Company is not exposed to any further risk of loss from its interest in the VIE since the cost-based investment was impaired and has no carrying value on the Company’s balance sheet as of December 31, 2011. See the discussion in this footnote, specifically under “Other non-current assets” for further information.
Acquisitions
The Company accounts for acquisitions using the purchase method. Under this method, the acquiring company allocates the purchase price to the assets acquired based upon their estimated fair values at the date of acquisition, including intangible assets that can be identified. The purchase price in excess of the fair value of the net assets acquired is recorded as goodwill.
Investment in equity securities
During 2010 and 2009 the Company held certain investments in equity securities which had readily determinable fair values. These securities were accounted for as available-for-sale securities and were reported at fair value, with unrealized gains and losses excluded from earnings and reported as accumulated other comprehensive income/(loss) within shareholders’ equity. If a decline in fair value of any of these securities had been judged to be other than temporary, the cost basis of the securities would have been written down to fair value and the amount of the write-down would have been accounted for as a realized loss, included in earnings. No such write-downs occurred in either year. In 2010, the Company sold all of its investments in equity securities for a gain of $1.5 million which is included in total other (expense)/income on the consolidated statement of operations for that year. Accordingly, as of December 31, 2011 and 2010, the Company no longer held investments in equity securities with readily determinable fair values.
F-8
Table of Contents
Cash and cash equivalents
Cash and cash equivalents include cash equivalents that mature within three months of the date of purchase.
Short-term investments
Short-term investments include investments that have maturity dates in excess of three months, but generally less than one year, from the date of acquisition. See Note 3,Fair Value Measurements,for further discussion.
Inventories
Inventory consisting of paper is stated at the lower of cost or market. Cost is determined using the first-in, first-out (“FIFO”) method.
Television production costs
Television production costs are capitalized and amortized based upon estimates of future revenues to be received and future costs to be incurred for the applicable television product. The Company bases its estimates primarily on existing contracts for programs, historical advertising rates and ratings, as well as market conditions. Estimated future revenues and costs are adjusted regularly based upon actual results and changes in market and other conditions. To the extent that estimated future results are losses, capitalized television production costs are written down to zero.
Property, plant and equipment
Property, plant and equipment is stated at cost and depreciated using the straight-line method over the estimated useful lives of the assets. Leasehold improvements are amortized using the straight-line method over the lease term or, if shorter, the estimated useful lives of the related assets.
The useful lives of the Company’s assets are as follows:
Studio sets | 2 years | |||
Furniture, fixtures and equipment | 3 – 5 years | |||
Computer hardware and software | 3 – 5 years | |||
Leasehold improvements | life of lease |
Goodwill and intangible assets
Goodwill
The components of goodwill as of December 31, 2011 and 2010 are set forth in the schedule below, and are reported within the Publishing and Merchandising segments:
(In thousands) | ||||
Publishing | $ | 44,257 | ||
Merchandising | 850 | |||
|
| |||
Total | $ | 45,107 | ||
|
| |||
The Company reviews goodwill for impairment by applying a fair-value based test annually, or more frequently if events or changes in circumstances warrant, in accordance with ASC 350, “Intangibles—Goodwill and Other” (“ASC 350”). Potential goodwill impairment is measured based upon a two-step process. In the first
F-9
Table of Contents
step, the Company compares the fair value of a reporting unit with its carrying amount including goodwill using a discounted cash flow (“DCF”) valuation method. The DCF analyses are based on the current operating budgets and estimated long-term growth projections for each reporting unit. Future cash flows are discounted based on a market comparable weighted average cost of capital rate for each reporting unit, adjusted for market and other risks where appropriate. In addition, the Company analyzes any difference between the sum of the fair values of the reporting units and its total market capitalization for reasonableness, taking into account certain factors, including control premiums.
If the fair value of a reporting unit exceeds its carrying amount, goodwill of the reporting unit is considered not impaired, thus rendering unnecessary the second step in impairment testing. If the fair value of the reporting unit is less than the carrying value, a second step is performed in which the implied fair value of the reporting unit’s goodwill is compared to the carrying value of the goodwill. The implied fair value of the goodwill is determined based on the difference between the fair value of the reporting unit and the net fair value of the identifiable assets and liabilities of the reporting unit. If the implied fair value of the goodwill is less than the carrying value, the difference is recognized as an impairment charge. For 2011, 2010 and 2009, no impairment charges related to goodwill were deemed necessary.
The Company estimates fair values based on the future expected cash flows, revenues, earnings and other factors, which consider reporting unit level historical results, current trends, and operating and cash flow projections. Significant judgments inherent in this analysis include estimating the amount of and timing of future cash flows and the selection of appropriate discount rates and long-term growth rate assumptions. The Company’s estimates are subject to uncertainty, and may be affected by a number of factors outside its control, including general economic conditions, the competitive market and regulatory changes. If actual results differ from the Company’s estimate of future cash flows, revenues, earnings and other factors, it may record additional impairment charges in the future.
Intangible assets
The components of intangible assets as of December 31, 2011, 2010 and 2009 are set forth in the schedule below, and are reported within the Publishing, Broadcasting and Merchandising segments:
(In thousands) | Balance at December 31, 2009 | Amortization expense | Balance at December 31, 2010 | Amortization expense | Impairment expense | Balance at December 31, 2011 | ||||||||||||||||||
Trademarks | $ | 45,200 | $ | — | $ | 45,200 | $ | — | $ | — | $ | 45,200 | ||||||||||||
Other intangibles | 6,160 | — | 6,160 | — | — | 6,160 | ||||||||||||||||||
Accumulated amortization — other intangibles | (4,290 | ) | (523 | ) | (4,813 | ) | (12 | ) | (1,320 | ) | (6,145 | ) | ||||||||||||
|
|
|
|
|
|
|
|
|
|
|
| |||||||||||||
Total | $ | 47,070 | $ | (523 | ) | $ | 46,547 | $ | (12 | ) | $ | (1,320 | ) | $ | 45,215 | |||||||||
|
|
|
|
|
|
|
|
|
|
|
| |||||||||||||
The Company reviews intangible assets with indefinite useful lives for impairment by applying a fair-value based test annually or more frequently if events or changes in circumstances warrant, in accordance with ASC 350. The Company performs the impairment test by comparing the fair value of an intangible asset with its carrying amount. If the carrying amount of an intangible asset exceeds its fair value, an impairment loss must be recognized in an amount equal to that excess. The Company estimates fair values using the DCF methodology based on the future expected cash flows, revenues, earnings and other factors, which consider reporting unit historical results, current trends, and operating and cash flow projections. The Company’s estimates are subject to uncertainty, and may be affected by a number of factors outside its control, including general economic conditions, the competitive market and regulatory changes. If actual results differ from the Company’s estimate of future cash flows, revenues, earnings and other factors, it may record additional impairment charges in the future. For 2011, 2010, and 2009, no impairment charges for intangible assets with indefinite useful lives were deemed necessary.
F-10
Table of Contents
The Company reviews long-lived tangible assets and intangible assets with definite useful lives for impairment whenever events or changes in circumstances indicate that their carrying values may not be recoverable and exceeds their fair value, in accordance with ASC 360, “Property, Plant, and Equipment.” Using the Company’s best estimates based on reasonable assumptions and projections, the Company records an impairment loss to write down the assets to their estimated fair values if carrying values of such assets exceed their related undiscounted expected future cash flows. An impairment loss is measured as the amount by which the carrying amount exceeds the fair value. The Company evaluates intangible assets with definite useful lives at the lowest level at which independent cash flows can be identified. The Company evaluates corporate assets or other long-lived assets at a consolidated entity or segment reporting unit level, as appropriate.
The Company amortizes intangible assets with definite lives over their estimated useful lives and reviews these assets for impairment. The Company is currently amortizing one acquired intangible asset with a remaining definite life through March 2013.
In the fourth quarter of 2011, the Company recorded a non-cash impairment charge of approximately $1.3 million for a definite-lived intangible asset previously acquired by the Broadcasting segment related to a television content library. Because the future undiscounted cash flows for this asset were determined to be significantly lower than the carrying value, the Company wrote the asset down to zero. For the years ended December 31, 2010 and 2009, no impairment charges for long-lived tangible and intangible assets with definite useful lives were deemed necessary.
Investments in other non-current assets
The Company has investments in preferred stock of several technology companies accounted for under the cost method. As of December 31, 2010, the Company’s aggregate carrying value of these cost-based investments was $5.8 million and was included within other noncurrent assets in the consolidated balance sheet. Cost-based investments are analyzed for impairment quarterly based on current market conditions and other factors relative to those investments.
During the fourth quarter of 2011 the Company sold its cost-based investment in WeddingWire, Inc. (“WeddingWire”) for $11.0 million in cash. The transaction resulted in a gain of $7.6 million, which represents cash received in excess of the $3.0 million carrying value of this cost-based investment and the $0.4 million intangible asset related to an associated commercial agreement with WeddingWire. The Company also recorded other-than-temporary losses of approximately $2.7 million to write down the carrying value of cost-based investments in pingg and Ziplist after concluding that the Company’s investments in pingg and Ziplist were substantially impaired. This conclusion was the result of analyzing recent results, cash levels, and prospects for raising additional capital by these two entities, as well as a shift by the Company’s new executive management team in the Company’s strategic focus away from these entities. The write-down of approximately $2.7 million reduced the value of these cost-based investments to zero as of December 31, 2011. Each of these three transactions is included in “Other income/(expense)” on the Company’s consolidated statement of operations for 2011.
Revenue recognition
The Company recognizes revenues when realized or realizable and earned. Revenues and associated accounts receivable are recorded net of provisions for estimated future returns, doubtful accounts and other allowances. Allowances for uncollectible receivables are estimated based upon a combination of write-off history, aging analysis, and any specific, known troubled accounts.
Magazine advertising revenues are recorded based on the on-sale dates of magazines and are stated net of agency commissions and cash and sales discounts.
F-11
Table of Contents
Deferred subscription revenue results from advance payments for subscriptions received from subscribers and is recognized on a straight-line basis over the life of the subscription as issues are delivered.
Newsstand revenues are recognized based on the on-sale dates of magazines and are recorded based upon estimates of sales, net of brokerage and newsstand related fees. Estimated returns are recorded based upon historical experience.
Deferred book revenue results from advance payments received from the Company’s publishers and is recognized as manuscripts are delivered to and accepted by the publishers. Revenue is also earned from book publishing as sales on a unit basis exceed the advanced royalty.
Digital advertising revenues on the Company’s websites are generally based on the sale of impression-based advertisements, which are recorded in the period in which the advertisements are served.
Television advertising revenues for season 5 ofThe Martha Stewart Show in syndication were recognized when the related commercials were aired and were recorded net of agency commission and estimated reserves for television audience underdelivery. Television spot advertising beginning with season 6 ofThe Martha Stewart Show in September 2010 has been sold by Hallmark Channel, with net receipts payable to the Company quarterly. Since advertisers contract with Hallmark Channel directly, balance sheet reserves for television audience underdelivery are not required; however, revenues continue to be recognized when commercials are aired and are recorded net of agency commission and the impact of television audience underdelivery as determined by Hallmark Channel. Television integration revenues are recognized when the segment featuring the related product/brand immersion is initially aired. Television revenues related to talent services provided by Emeril Lagasse are generally recognized when services are performed, regardless of when the episodes air. Licensing revenues are recorded as earned in accordance with the specific terms of each agreement and are generally recognized upon delivery of the episodes to the licensee, provided that the license period has begun. The agreements with Hallmark Channel are accounted for under the guidance set forth in ASC 926,Entertainment—Films. Radio advertising revenues are generally recorded when the related commercials are aired and are recorded net of agency commissions. Licensing revenues from the Company’s radio programming are recorded on a straight-line basis over the term of the agreement.
Licensing-based revenues, most of which are in the Merchandising segment, are accrued on a monthly basis based on the specific mechanisms of each contract. Payments are typically made by the Company’s partners on a quarterly basis. Generally, revenues are accrued based on actual net sales, while any minimum guarantees are earned evenly over the fiscal year. Prior to 2010, the Company historically recognized a substantial portion of the revenue resulting from the difference between the minimum royalty amount (under a licensing agreement with Kmart Corporation (“Kmart”) dated June 21, 2001, as amended April 22, 2004) and royalties paid on actual sales in the fourth quarter of each year, when the amount could be determined. The Company’s agreement with Kmart ended in January 2010.
The Company participates in certain arrangements containing multiple deliverables. These arrangements generally consist of custom-created advertising programs delivered on multiple media platforms, as well as licensing programs which may also be supported by various promotional plans. Examples of significant program deliverables include print advertising pages in the Company’s publications, product integrations on the Company’s television programs, and advertising impressions delivered on the Company’s website. Arrangements that were executed prior to January 1, 2010 are accounted for in accordance with the provisions of ASC Topic 605,Revenue Recognition (“ASC 605”). Because the Company elected to early adopt ASU 09-13, on a prospective basis, arrangements executed on or after January 1, 2010 have been subject to the new guidance. ASU 09-13 updated the existing multiple-element arrangement guidance in ASC 605.
ASC 605 and ASU 09-13 require that the Company examine separate contracts with the same entity or related parties that are entered into simultaneously or near the same time to determine if the arrangements should
F-12
Table of Contents
be considered a single arrangement in the determination of units of accounting. While both ASC 605 and ASU 09-13 require that units delivered have standalone value to the customer, ASU 09-13 modifies the separation criteria in determining units of accounting by eliminating the requirement to obtain objective and reliable evidence of the fair value of undelivered items. As a result of the elimination of this requirement, the Company’s significant program deliverables generally meet the separation criteria under ASU 09-13, whereas under ASC 605 they did not qualify as separate units of accounting.
For those arrangements accounted for under ASC 605, if the Company is unable to put forth objective and reliable evidence of the fair value of each deliverable, then the Company accounts for the deliverables as a combined unit of accounting rather than separate units of accounting. In this case, revenue is recognized as the earnings process is completed, generally over the fulfillment term of the last deliverable.
For those arrangements accounted for under ASU 09-13, the Company is required to allocate revenue based on the relative selling price of each deliverable which qualifies as a unit of accounting, even if such deliverables are not sold separately by either the Company itself or other vendors. Determination of selling price is a judgmental process that requires numerous assumptions. The consideration is allocated at the inception of the arrangement to all deliverables based upon their relative selling prices. Selling prices for deliverables that qualify as separate units of accounting are determined using a hierarchy of: (1) vendor-specific objective evidence (“VSOE”), (2) third-party evidence and (3) best estimate of selling price. The Company is able to establish VSOE of selling price for certain of its radio deliverables; however, in most instances it has allocated consideration based upon its best estimate of selling price. The Company established VSOE of selling price of certain radio deliverables by demonstrating that a substantial majority of the recent standalone sales of those deliverables are priced within a relatively narrow range. The Company’s other deliverables are generally priced with a wide range of discounts/premiums as the result of a variety of factors including the size of the advertiser and the volume and placement of advertising sold to the advertiser. The Company’s best estimate of selling price is intended to represent the price at which it would sell the deliverable if the Company were to sell the item regularly on a standalone basis. The Company’s estimates consider market conditions, such as competitor pricing pressures, as well as entity-specific factors that are consistent with normal pricing practices, such as the recent history of the selling prices of similar products when sold on a standalone basis, the impact of the cost of customization, the size of the transaction, and other factors contemplated in negotiating the arrangement with the customer. The arrangement fee is recognized as revenue as the earnings process is completed, generally at the time each unit of accounting is fulfilled (i.e., when magazines are on sale, at the time television integrations are aired or when the digital impressions are served).
Advertising costs
Advertising costs, consisting primarily of direct-response advertising, are expensed in the period in which the related advertising campaign occurs.
Earnings per share
Basic earnings per share is computed using the weighted average number of actual common shares outstanding during the period. Diluted earnings per share reflects the potential dilution that would occur from the exercise of stock options and shares covered under a warrant and the vesting of restricted stock and restricted stock units. For the years ended December 31, 2011, 2010 and 2009, the shares of the Company’s $0.01 par value Class A common stock (“Class A Common Stock”) subject to options, the warrant, restricted stock and restricted stock units that were excluded from the computation of diluted earnings per share because their effect would have been antidilutive were 7,345,060, 5,389,222 and 5,696,344.
Use of estimates
The preparation of financial statements in conformity with GAAP requires management to make estimates and assumptions that affect the amounts reported in the financial statements and accompanying notes. Actual results could differ from those estimates.
F-13
Table of Contents
Equity compensation
The Company has issued stock-based compensation to certain of its employees and a non-employee consultant. In accordance with the fair-value recognition provisions of ASC Topic 718,Share-Based Payments (“ASC Topic 718”) and SEC Staff Accounting Bulletin No. 107, compensation cost associated with employee grants recognized in the 2011, 2010 and 2009 was based on the grant date fair value estimated in accordance with the provisions of ASC Topic 718. The Company applies variable accounting to its non-employee price-based restricted stock unit (“RSU”) awards in accordance with the provisions of ASC Topic 718. Employee stock option, restricted stock, and RSU awards with service period-based vesting triggers (“service period-based” awards) are amortized as non-cash equity compensation expense on a straight-line basis over the expected vesting period. The Company values service period-based option awards using the Black-Scholes option pricing model. The Black-Scholes option pricing model requires numerous assumptions, including volatility of the Company’s Class A Common Stock and expected life of the option. Service period-based restricted stock and RSU awards are valued at the market value of traded shares on the date of grant. Recognition of compensation expense for awards intended to vest upon the achievement of certain adjusted earnings before interest, taxes, depreciation and amortization (“EBITDA”) targets over a performance period (“performance-based” awards) is based on the probable outcome of the performance condition. Compensation cost is accrued if it is probable that the performance condition will be achieved and is not accrued if it is not probable that the performance condition will be achieved. Options and RSUs with Class A Common Stock price-based vesting triggers (“price-based” awards) are valued using the Monte Carlo Simulation method which takes into account assumptions such as volatility of the Company’s Class A Common Stock, the risk-free interest rate based on the contractual term of the award, the expected dividend yield, the vesting schedule, and the probability that the market conditions of the award will be achieved.
Other
Certain prior year financial information has been reclassified to conform to the 2011 financial statement presentation. Certain facilities costs related to the Company’s television production studio have been reclassified from general and administrative costs to production, print and distribution costs on the consolidated statement of operations for 2010 and 2009 in the amounts of approximately $4.0 million and $3.6 million, respectively.
3. FAIR VALUE MEASUREMENTS
The Company categorizes its assets and liabilities measured at fair value into a fair value hierarchy that prioritizes the inputs used in pricing the asset or liability. The three levels of the fair value hierarchy are:
| • | Level 1: Observable inputs such as quoted prices for identical assets and liabilities in active markets obtained from independent sources. |
| • | Level 2: Other inputs that are observable directly or indirectly, such as quoted prices for similar assets or liabilities in active markets, quoted prices for identical or similar assets or liabilities in markets that are not active and inputs that are derived principally from or corroborated by observable market data. The fair value of the Company’s level 2 financial assets is primarily obtained from observable market prices for identical underlying securities that may not be actively traded. Certain of these securities may have different market prices from multiple market data sources, in which case a weighted average market price is used. |
| • | Level 3: Unobservable inputs for which there is little or no market data and require the Company to develop its own assumptions, based on the best information available in the circumstances, about the assumptions market participants would use in pricing the asset or liability. |
F-14
Table of Contents
The following tables present the Company’s assets that are measured at fair value on a recurring basis:
| December 31, 2011 | ||||||||||||||||
| (in thousands) | Quoted Market Prices in Active Markets for Identical Assets (Level 1) | Significant Other Observable Inputs (Level 2) | Significant Unobservable Inputs (Level 3) | Total Fair Value Measurements | ||||||||||||
Short-term investments: | ||||||||||||||||
U.S. government and agency securities | $ | — | $ | 3,858 | $ | — | $ | 3,858 | ||||||||
Corporate obligations | — | 5,122 | — | 5,122 | ||||||||||||
Other fixed income securities | — | 545 | — | 545 | ||||||||||||
International securities | — | 1,526 | — | 1,526 | ||||||||||||
|
|
|
|
|
|
|
| |||||||||
Total | $ | — | $ | 11,051 | $ | — | $ | 11,051 | ||||||||
|
|
|
|
|
|
|
| |||||||||
| December 31, 2010 | ||||||||||||||||
| (in thousands) | Quoted Market Prices in Active Markets for Identical Assets (Level 1) | Significant Other Observable Inputs (Level 2) | Significant Unobservable Inputs (Level 3) | Total Fair Value Measurements | ||||||||||||
Short-term investments: | ||||||||||||||||
U.S. government and agency securities | $ | — | $ | 1,637 | $ | — | $ | 1,637 | ||||||||
Corporate obligations | — | 5,977 | — | 5,977 | ||||||||||||
Other fixed income securities | — | 2,140 | — | 2,140 | ||||||||||||
International securities | — | 337 | — | 337 | ||||||||||||
|
|
|
|
|
|
|
| |||||||||
Total | $ | — | $ | 10,091 | $ | — | $ | 10,091 | ||||||||
|
|
|
|
|
|
|
| |||||||||
The Company has no liabilities that are measured at fair value on a recurring basis.
Marketable Equity Securities
During 2010, the Company sold the marketable equity securities it held at December 31, 2009 for a gain of $1.5 million which is included in total other (expense)/income on the consolidated statements of operations. The specific identification method was used to determine the cost of the securities sold.
Assets measured at fair value on a nonrecurring basis
The Company’s non-financial assets, such as goodwill, intangible assets and property and equipment, as well as cost method investments, are measured at fair value when there is an indicator of impairment and are recorded at fair value only when an impairment charge is recognized. Such impairment charges would incorporate fair value measurements based on Level 3 inputs. See Note 2,Summary of Significant Accounting Policies, for further discussion on measuring the Company’s non-financial assets.
F-15
Table of Contents
4. ACCOUNTS RECEIVABLE, NET
The components of accounts receivable at December 31, 2011 and 2010 were as follows:
(in thousands) | 2011 | 2010 | ||||||
Advertising | $ | 29,252 | $ | 36,529 | ||||
Licensing | 17,484 | 19,888 | ||||||
Other | 3,131 | 4,335 | ||||||
|
|
|
| |||||
| 49,867 | 60,752 | |||||||
Less: reserve for credits and uncollectible accounts | 1,630 | 1,502 | ||||||
|
|
|
| |||||
| $ | 48,237 | $ | 59,250 | |||||
|
|
|
| |||||
5. INVENTORIES
Inventory is comprised of paper, and was valued at $7.2 million and $5.3 million at December 31, 2011 and 2010, respectively. Cost is determined using the FIFO method.
6. PROPERTY, PLANT AND EQUIPMENT, NET
The components of property, plant and equipment as of December 31, 2011 and 2010 were as follows:
(in thousands) | 2011 | 2010 | ||||||
Studios and equipment | $ | 3,702 | $ | 4,202 | ||||
Furniture, fixtures and equipment | 6,144 | 7,702 | ||||||
Computer hardware and software | 9,096 | 8,404 | ||||||
Leasehold improvements | 29,665 | 29,690 | ||||||
|
|
|
| |||||
Total Property, Plant and Equipment | 48,607 | 49,998 | ||||||
Less: accumulated depreciation and amortization | 35,211 | 35,491 | ||||||
|
|
|
| |||||
Net Property, Plant and Equipment | $ | 13,396 | $ | 14,507 | ||||
|
|
|
| |||||
Depreciation and amortization expenses related to property, plant and equipment were $3.9 million, $3.8 million and $6.4 million, for 2011, 2010 and 2009, respectively.
7. CREDIT FACILITIES
As of December 31, 2011, the Company had a line of credit with Bank of America N.A. (“Bank of America”) in the amount of $5.0 million, which was generally used to secure letters of credit. The Company had no outstanding borrowings under this facility as of December 31, 2011 and had letters of credit outstanding of $2.6 million which act as security for certain leases. The Company was compliant with the debt covenants as of December 31, 2011. See Note 17,Subsequent Events, for discussion of an increased line of credit in 2012.
In 2008, the Company entered into a loan agreement with Bank of America in the amount of $30.0 million related to the acquisition of certain assets of Emeril Lagasse. The interest rate paid on all outstanding amounts during 2011 was equal to a floating rate of 1-month London Interbank Offered Rate (“LIBOR”) plus 2.85%. The loan balance was paid in full in December 2011. In connection with the loan repayment, the Company expensed deferred financing charges of approximately $0.2 million.
8. SHAREHOLDERS’ EQUITY
Preferred Stock, Strategic investor
In December 2011, J. C. Penney Corporation, Inc. (“JCP”) purchased 11,000,000 newly-issued shares of the Class A Common Stock and one share of the Company’s Series A Preferred Stock in exchange for cash of $38.5 million. The investment in the Class A Common Stock represented approximately 16.6% of the Company’s total
F-16
Table of Contents
Class A Common Stock outstanding immediately after the issuance. The single share of the Series A Preferred Stock entitles JCP to nominate and elect two directors to the Company’s board of directors (the “Board”), has nominal liquidation preference, is not convertible into shares of the Company’s common stock, does not have a dividend preference, and is transferrable only to certain JCP affiliated entities. In connection with its Class A Common Stock, JCP is entitled to three demand registrations and piggyback rights; however, JCP may not exercise its demand registration rights until the earlier of December 2014 and the date the number of independent members of the Company’s Board, plus the JCP members of the Board, constitutes less than a majority of the members of the Board. Until December 2015, JCP is also generally prohibited from taking certain takeover actions towards the Company without consent from the Board. JCP is further prohibited from transferring its shares of Class A Common Stock to any person other than certain affiliates, or in connection with a Board approved acquisition transaction, or in an open market transaction, or by a registration statement as long as the transferee will own less than 5% of the then-outstanding shares of the Company’s common stock after the transfer.
Common Stock
The Company has two classes of common stock outstanding. The $0.01 par value Class B common stock (“Class B Common Stock”) is identical in all respects to Class A Common Stock, except with respect to voting and conversion rights. Each share of Class B Common Stock entitles its holder to ten votes and is convertible on a one-for-one basis to Class A Common Stock at the option of the holder and automatically upon most transfers.
Dividends
During December 2011 the Board declared and paid a special one-time dividend of $0.25 per share of common stock for a total dividend payment of $16.7 million.
9. EMPLOYEE AND NON-EMPLOYEE BENEFIT AND COMPENSATION PLANS
Retirement Plans
The Company established a 401(k) retirement plan effective July 1, 1997, available to substantially all employees. An employee can contribute up to a maximum of 25% of compensation to the plan, or the maximum allowable contribution by the Internal Revenue Code, whichever is less. The Company matches 50% of the first 6% of compensation contributed. Employees vest ratably in employer-matching contributions over a period of four years of service. The employer-matching contributions totaled approximately $0.6 million, $0.8 million and $1.0 million for 2011, 2010 and 2009, respectively.
The Company does not sponsor any post-retirement and/or post-employment benefit plan.
Stock Incentive Plans
Prior to May 2008, the Company had several stock incentive plans that permitted the Company to grant various types of share-based incentives to key employees, directors and consultants. The primary types of incentives granted under these plans were stock options and restricted shares of Class A Common Stock. The Compensation Committee of the Board was authorized to grant awards for up to a maximum of 10,000,000 underlying shares of Class A Common Stock under the Martha Stewart Living Omnimedia, Inc. Amended and Restated 1999 Stock Incentive Plan (the “1999 Plan”), and awards for up to a maximum of 600,000 underlying shares of Class A Common Stock under the Company’s Non-Employee Director Stock and Option Compensation Plan (the “Non-Employee Director Plan”).
In April 2008, the Board adopted the Martha Stewart Living Omnimedia, Inc. Stock and Compensation Plan (the “Stock Plan”), which was approved by the Company’s stockholders at the Company’s 2008 annual meeting in May 2008. The Stock Plan has 10,000,000 shares of Class A Common Stock available for issuance. The Stock
F-17
Table of Contents
Plan replaced the 1999 Plan and Non-Employee Director Plan (together, the “Prior Plans”), which together had an aggregate of approximately 1,850,000 shares still available for issuance. Therefore, the total net effect of the replacement of the Prior Plans and adoption of the Stock Plan was an increase of approximately 8,150,000 shares of Class A Common Stock available for issuance under the Company’s stock plans. The primary types of incentives that have been granted under the Stock Plan are stock options and RSUs.
Compensation expense is recognized in the production, distribution and editorial, the selling and promotion, and the general and administrative expense lines of the Company’s consolidated statements of operations. For 2011, 2010 and 2009, the Company recorded non-cash equity compensation expense of $5.5 million, $5.4 million, and $7.9 million, respectively.
Black-Scholes Assumptions
The Company uses the Black-Scholes option pricing model to value options and warrants that only have service period-based vesting triggers. The model requires numerous assumptions, including expected volatility of the Company’s Class A Common Stock price, expected life of the option and expected cancellations.
Monte Carlo Simulation Assumptions
The Company uses the Monte Carlo Simulation method to value options and RSUs with price-based vesting triggers. This method requires numerous assumptions, including expected volatility of the Company’s Class A Common Stock price and expected service periods.
Stock Options
Options which were issued under the 1999 Plan were granted with an exercise price equal to the closing price of Class A Common Stock on the most recent prior date for which a closing price was available, without regard to after-hours trading. Options granted under the Stock Plan are granted with an exercise price equal to the closing price of the Class A Common Stock on the date of grant. Stock options have a term not to exceed 10 years. The Compensation Committee determines the vesting period and terms for the Company’s stock options, which may include service period-based, performance-based, or price-based vesting triggers. Generally, service period-based employee stock options vest ratably on each of either the first three or four anniversaries of the grant date. Service period-based non-employee director options generally vest over a one-year period from the grant date. Performance-based and price-based options vest only when the specific vesting triggers of the award are achieved. Option awards usually do not provide for accelerated vesting upon retirement, death, or disability unless specifically included in the applicable award agreement. The amount of non-cash equity compensation expense the Company recognizes during a period is based on the portion of the option awards that are ultimately expected to vest. The Company estimates option forfeitures at the time of grant and revises those estimates in subsequent periods if actual forfeitures differ from those estimates. Option expense for 2011, 2010 and 2009 was $2.4 million, $3.3 million and $2.9 million, respectively. As of December 31, 2011 and 2010, there was $2.7 million and $4.2 million, respectively, of total unrecognized compensation cost related to stock options to be recognized over a weighted average period of 3.0 years. The intrinsic value of options exercised during 2011 was $2.1 million, with intrinsic value defined as the difference between the market price on the date of exercise and the grant date price. For 2010, this value was insignificant. The total cash received (classified as financing cash flows) from the exercise of stock options was $1.7 million and $0.3 million for 2011 and 2010, respectively.
Stock options under the Stock Plan were issued to employees as follows: 2,565,559 in 2011, 870,002 in 2010, and 3,805,765 in 2009.
F-18
Table of Contents
The fair value of employee service period-based option awards was estimated on the grant date using the Black-Scholes option-pricing model on the basis of the following weighted average assumptions:
| 2011 | 2010 | 2009 | ||||
Risk-free interest rates | 0.17% – 2.09% | 1.0% – 1.6% | 0.9% – 2.33% | |||
Dividend yields | Zero | Zero | Zero | |||
Expected volatility | 60.38% – 61.25% | 61.8% – 63.8% | 45.1% – 64.3% | |||
Expected option life | 1.0 – 7.0 years | 2.5 – 3.7 years | 2.5 – 3.7 years | |||
Average fair market value per option granted | $0.75 - $2.56 | $2.14 – $2.61 | $0.71 – $3.29 |
Note:This table represents a blend of assumptions.
The fair value of employee price-based option awards was estimated on the grant date using the Monte Carlo Simulation method on the basis of the following weighted average assumptions:
| 2011 | ||
Risk-free interest rate | 1.34% – 2.29% | |
Expected volatility | 59.72% – 60.55% | |
Expected service period | 0.46 – 2.0 years | |
Dividends | Zero | |
Estimated value of price-based option awards | $0.42 – $2.35 |
Changes in outstanding options under the Prior Plans during 2011 and 2010 were as follows:
| Number of shares subject to options | Weighted average exercise price | |||||||
Outstanding as of December 31, 2009 | 2,832,867 | $ | 13.37 | |||||
Exercised—service period-based | (3,500 | ) | 6.78 | |||||
Cancelled—service period-based | (249,467 | ) | 21.55 | |||||
|
|
|
| |||||
Outstanding as of December 31, 2010 | 2,579,900 | $ | 12.59 | |||||
Cancelled—service period-based (1) | (443,375 | ) | 9.51 | |||||
|
|
|
| |||||
Outstanding as of December 31, 2011 | 2,136,525 | $ | 13.23 | |||||
|
|
|
| |||||
Options exercisable at December 31, 2011 | 2,136,525 | $ | 13.23 | |||||
|
|
|
| |||||
| (1) | Includes approximately 310,000 options cancelled in connection with the departure of certain executives in the Merchandising segment. |
F-19
Table of Contents
Changes in outstanding options under the Stock Plan during 2011 and 2010 were as follows:
| Number of shares subject to options | Weighted average exercise price | |||||||
Outstanding as of December 31, 2009 | 4,200,499 | $ | 3.87 | |||||
Granted—service period-based | 870,002 | 5.45 | ||||||
Exercised—service period-based | (138,249 | ) | 1.96 | |||||
Cancelled—service period-based | (190,376 | ) | 4.30 | |||||
|
|
|
| |||||
Outstanding as of December 31, 2010 | 4,741,876 | $ | 4.20 | |||||
Granted—service period-based | 1,740,559 | 3.93 | ||||||
Granted—price-based | 825,000 | 9.00 | ||||||
Exercised—service period-based | (840,000 | ) | 2.04 | |||||
Cancelled—service period-based (1) | (1,082,167 | ) | 4.28 | |||||
Cancelled—performance-based | (166,667 | ) | 5.80 | |||||
|
|
|
| |||||
Outstanding as of December 31, 2011 | 5,218,601 | $ | 5.15 | |||||
|
|
|
| |||||
Options exercisable at December 31, 2011 | 2,012,250 | $ | 5.19 | |||||
|
|
|
| |||||
Shares available for grant at December 31, 2011 | 1,531,131 | |||||||
|
| |||||||
| (1) | Includes approximately 471,000 and 350,000 options cancelled in connection with the departure of certain executives in the Merchandising segment and Corporate. |
The following table summarizes information about the shares subject to stock options outstanding under the Company’s Prior Plans and the Stock Plan as of December 31, 2011:
| Weighted Average Remaining Contractual Life in Years | Shares Subject to Options Outstanding | Shares Subject to Options Exercisable | ||||||||||||||||||
Range of Exercise Price Per Share | Number Outstanding | Weighted Average Exercise Price | Number Exercisable | Weighted Average Exercise Price | ||||||||||||||||
$1.96 – $12.00 | 6.7 | 6,389,726 | 5.52 | 3,183,375 | 5.92 | |||||||||||||||
$14.90 – $15.75 | 0.1 | 400 | 15.75 | 400 | 15.75 | |||||||||||||||
$15.90 | 0.1 | 150,000 | 15.90 | 150,000 | 15.90 | |||||||||||||||
$16.45 – $18.90 | 2.9 | 415,000 | 18.54 | 415,000 | 18.54 | |||||||||||||||
$19.92 – $26.25 | 3.8 | 200,000 | 20.35 | 200,000 | 20.35 | |||||||||||||||
$26.56 – $33.75 | 3.1 | 200,000 | 28.55 | 200,000 | 28.55 | |||||||||||||||
|
|
|
|
|
|
|
|
|
| |||||||||||
$1.96 – $33.75 | 6.2 | 7,355,126 | 7.50 | 4,148,775 | 9.33 | |||||||||||||||
|
|
|
|
|
|
|
|
|
| |||||||||||
F-20
Table of Contents
Stock Option awards to new hires in 2011
During 2011, the Company made awards under the Stock Plan to several new members of its executive management team, as provided for in their employment agreements. Certain of such awards include only service period-based vesting triggers and consist of options to purchase an aggregate of 550,000 shares of Class A Common Stock at various exercise prices (in each case the closing price on the dates of grant), which options vest as to 183,333 shares on each of the second, third, and fourth anniversaries of the employment start dates of the relevant employees. Non-cash equity compensation expense of approximately $0.1 million was recorded for the year ended December 31, 2011 related to these awards. The Company measured the fair value of these awards as of the grant dates using the Black-Scholes option pricing model, which fair value is recognized over the service period of the awards. As of December 31, 2011, there was $0.9 million of total unrecognized compensation cost related to these service period-based stock option awards to be recognized over a period of 3.9 years. The following table summarizes the assumptions used in the Black-Scholes option-pricing model:
Risk-free interest rates | 0.511% – 0.629% | |
Dividend | Zero | |
Expected volatility | 60.80% – 61.25% | |
Expected option life | 3.7 years | |
Average fair value per option granted | $1.30 – $2.17 |
The Company also made option awards to these employees which include price-based vesting triggers. The price-based option awards consisted of options to purchase an aggregate of 825,000 shares of Class A Common Stock. Of these, options for 206,250 shares with an exercise price of $6 per share will vest only at such time as the trailing average closing price of the Class A Common Stock during any 30 consecutive trading days during the term of the applicable employment agreements (“the trailing average”) has been at least $6, options for 206,250 shares with an exercise price of $8 per share will vest only at such time as such trailing average has been at least $8, options for 206,250 shares with an exercise price of $10 per share will vest only at such time as such trailing average has been at least $10, and options for 206,250 shares with an exercise price of $12 per share will vest only at such time as such trailing average has been at least $12. Non-cash equity compensation expense of approximately $0.5 million was recorded for the year ending December 31, 2011 related to these price-based awards. The Company measured the fair value of these price-based awards as of the grant dates using the Monte Carlo Simulation method, which fair value is recognized over the expected service period of the awards. As of December 31, 2011, there was $0.5 million of total unrecognized compensation cost related to these price-based stock option awards to be recognized over the expected service period listed below. See above for the Monte Carlo Simulation method weighted average assumptions.
Restricted Stock and Restricted Stock Units
Restricted stock represents shares of common stock that are subject to restrictions on transfer and risk of forfeiture until the fulfillment of specified conditions. RSUs represent the contingent right to one share of Class A Common Stock. The Compensation Committee determines the vesting period and terms for the Company’s restricted stock and RSUs, which may include service period-based, performance-based, or price-based vesting triggers. Service period-based restricted stock and RSUs are generally expensed ratably over the vesting period, typically ranging from three to four years. Performance-based and price-based RSUs vest only when the specific vesting triggers of the award are achieved. The amount of non-cash equity compensation expense the Company recognizes during a period is based on the portion of the restricted stock and RSU awards that are ultimately expected to vest. The Company estimates restricted stock and RSU forfeitures at the time of grant and revises those estimates in subsequent periods if actual forfeitures differ from those estimates. Restricted stock and RSUs usually do not provide for accelerated vesting upon retirement, death, or disability unless specifically included in the applicable award agreement. Restricted stock and RSU expense for 2011, 2010 and 2009 was $3.1 million, $2.1 million and $5.1 million, respectively.
F-21
Table of Contents
Service period-based restricted stock
The fair value of service period-based shares of restricted stock under the Prior Plans was determined based on the closing price of the Company’s Class A Common Stock on the day preceding the grant date. As of December 31, 2011, all such shares had vested. As of December 31, 2010 and 2009, the weighted-average grant date fair values of service period-based nonvested shares were $0.1 million and $1.5 million, respectively. As of December 31, 2010, there was $0.2 million of total unrecognized compensation cost related to service period-based nonvested restricted stock to be recognized over a weighted-average period of less than one-half year.
A summary of the shares of service period-based restricted stock issued under the Prior Plans as of December 31, 2011 and changes during 2011 are as follows:
(in thousands, except share data) | Shares | Weighted Average Grant Date Value | ||||||
Nonvested at December 31, 2010 | 61,693 | $ | 7.27 | |||||
Vested (1) | (54,213 | ) | 7.31 | |||||
Forfeitures | (7,480 | ) | 7.04 | |||||
|
|
|
| |||||
Nonvested at December 31, 2011 | — | $ | — | |||||
|
|
|
| |||||
| (1) | Included in the gross shares vested during 2011 are 21,671 shares of Class A Common Stock which were surrendered by recipients in order to fulfill their tax withholding obligations. |
The fair value of service period-based nonvested shares under the Stock Plan is determined based on the closing price of the Company’s Class A Common Stock on the grant dates. As of December 31, 2010, the weighted-average grant date fair value of service period-based nonvested shares was $4.4 million. As of December 31, 2011, there was no unrecognized compensation cost related to service period-based nonvested restricted stock.
A summary of the shares of service period-based restricted stock issued under the Stock Plan that had not yet vested as of December 31, 2011 and changes during 2011 are as follows:
(in thousands, except share data) | Shares | Weighted Average Grant Date Value | ||||||
Nonvested at December 31, 2010 | 320,922 | $ | 8.24 | |||||
Granted | 33,037 | 4.01 | ||||||
Vested (1) | (128,097 | ) | 6.93 | |||||
Forfeitures (2) | (217,510 | ) | 8.52 | |||||
|
|
|
| |||||
Nonvested at December 31, 2011 | 8,352 | $ | 4.49 | |||||
|
|
|
| |||||
| (1) | Included in the gross shares vested during 2011 are 1,539 shares of Class A Common Stock which were surrendered by recipients in order to fulfill their tax withholding obligations. |
| (2) | Included in the gross shares forfeited during 2011 are 200,000 shares of Class A Common Stock which were forfeited in connection with the July 2011 amended and restated employment agreement entered into between the Company and Charles A. Koppelman, the Executive Chairman of the Company. See “Non-employee equity compensation” below for further discussion. |
Service period-based RSUs
The fair value of service period-based nonvested RSUs under the Stock Plan is determined based on the closing price of the Company’s Class A Common Stock on the grant dates. As of December 31, 2011, the weighted-average grant date fair values of service period-based nonvested RSUs were $6.3 million. As of December 31, 2011, there was $1.7 million of total unrecognized compensation cost related to service period-based nonvested RSUs to be recognized over a weighted-average period of approximately 1.5 years.
F-22
Table of Contents
A summary of the shares of service period-based RSUs issued under the Stock Plan that had not yet vested as of December 31, 2011 and changes during 2011 is as follows:
(in thousands, except share data) | Shares | Weighted Average Grant Date Value | ||||||
Nonvested at December 31, 2010 | — | $ | — | |||||
Granted | 639,698 | 4.11 | ||||||
Vested | (12,500 | ) | 3.95 | |||||
Forfeitures (1) | (87,500 | ) | 3.95 | |||||
|
|
|
| |||||
Nonvested at December 31, 2011 | 539,698 | $ | 4.14 | |||||
|
|
|
| |||||
| (1) | Includes approximately 25,000 RSUs forfeited in connection with the departure of certain executives in the Merchandising segment. |
Performance-based RSUs
During 2010 and 2009, the Company granted 550,000 and 351,625 RSUs, respectively, which contain vesting triggers based upon the Company’s achievement of certain adjusted EBITDA targets over a performance period.
During 2010, in recognition of changing economic conditions and to ensure the continued retention and motivation of key employees, the Company’s Compensation Committee approved modifications to the performance conditions associated with the RSUs issued during 2010 and 2009. The modifications effectively replaced performance condition vesting triggers with service-period vesting triggers. Consistent with requirements of ASC Topic 718,Compensation—Stock Compensation, the awards are being amortized over the requisite service period on a prospective basis from the date the Compensation Committee approved the removal of the performance conditions (December 3, 2010), which is deemed to be the grant date for accounting purposes.
The fair value of nonvested performance-based RSUs is determined based on the closing price of the Company’s Class A Common Stock on the grant dates. As of December 31, 2011 and 2010, the weighted-average grant date fair values of nonvested performance-based RSUs were $0.9 million and $6.3 million, respectively. As of December 31, 2011, there was $0.4 million of total unrecognized compensation cost related to nonvested performance-based RSUs to be recognized over a weighted-average period of just under one year.
A summary of the performance-based RSUs issued under the Stock Plan that have not vested as of December 31, 2011 and changes during 2011 is as follows:
(in thousands, except share data) | Shares | Weighted Average Grant Date Value (1) | ||||||
Nonvested at December 31, 2010 | 720,000 | $ | 4.62 | |||||
Vested | (170,000 | ) | 4.62 | |||||
Forfeitures (2) | (341,500 | ) | 4.62 | |||||
|
|
|
| |||||
Nonvested at December 31, 2011 | 208,500 | $ | 4.62 | |||||
|
|
|
| |||||
| (1) | The weighted average grant date value included in the table above was adjusted to reflect the impact of the modifications approved on December 3, 2010 to the 2010 and 2009 awards. |
| (2) | Includes approximately 156,000 and 120,000 performance-based RSUs forfeited in connection with the departure of certain executives in the Merchandising segment and Corporate. |
F-23
Table of Contents
Price-based RSUs
The fair value of nonvested price-based RSUs under the Stock Plan is determined based on the closing price of the Company’s Class A Common Stock on the grant dates. As of December 31, 2011, the weighted-average grant date fair values of nonvested price-based RSUs, all of which were issued during 2011, were $6.1 million. As of December 31, 2011, there was $0.5 million of total unrecognized compensation cost related to nonvested price-based RSUs to be recognized over a weighted-average period of approximately 1.5 years.
As of December 31, 2011, 440,000 price-based RSUs issued under the Stock Plan had not yet vested. The weighted average grant date value of these RSUs was $3.89. (See “RSU awards to new hires in 2011” below.)
RSU awards to new hires in 2011
The new members of the Company’s executive management team received 350,000 RSUs, with service period vesting triggers, of which approximately 116,667 RSUs vest on each of the second, third, and fourth anniversaries of their employment start dates. Non-cash equity compensation expense of approximately $0.2 million was recorded during the year ended December 31, 2011 related to these awards. The Company measured the fair value of these service period-based awards as of the grant date and will recognize this fair value over the remaining service periods of the awards. As of December 31, 2011, there was $1.3 million of total unrecognized compensation cost related to these RSUs to be recognized over a period of 3.9 years.
The Company also made RSU awards to these executives which include price-based vesting triggers. The price-based RSUs consist of the contingent right to receive an aggregate of 440,000 shares of Class A Common Stock, of which 50,000 RSUs will vest at such time as the trailing average has been at least $6, an additional 110,000 RSUs will vest at such time as such trailing average has been at least $8, an additional 110,000 RSUs will vest at such time as such trailing average has been at least $10, an additional 110,000 RSUs will vest at such time as such trailing average has been at least $12, and the final 60,000 RSUs will vest at such time as the trailing average has been at least $14. Non-cash equity compensation expense of approximately $0.6 million was recorded during the year ended December 31, 2011 related to these price-based awards. The Company measured the fair value of these price-based awards as of the dates of issuance using the Monte Carlo Simulation method, which fair value is recognized over the expected service period of the awards. As of December 31, 2011, there was $0.5 million of total unrecognized compensation cost related to these price-based RSUs to be recognized over the expected service period listed below. The following table summarizes the assumptions used in the Monte Carlo Simulation method:
Risk-free interest rate | 0.37 - 1.17% | |
Dividend | Zero | |
Expected volatility | 67.83% - 70.20% | |
Expected service period | 0.42 - 1.94 years | |
Estimated value of price-based RSUs | $0.87 - $4.43 |
Non-Employee Equity Compensation
On July 26, 2011, the Company and Charles A. Koppelman, the Executive Chairman of the Company, entered into an amended and restated employment agreement which amended Mr. Koppelman’s employment term to extend from July 26, 2011 through the transition date, which was the earlier of December 31, 2011 and the date on which the Company’s President and Chief Operating Officer began to report directly to the Board. The amended and restated employment agreement further provided that upon expiration of the employment term all outstanding equity awards held by Mr. Koppelman would vest and/or become exercisable, with the exception of 200,000 performance shares if such shares had not already vested. Additionally, the period for exercising any vested stock options held by Mr. Koppelman was extended to the later of one year from the employment termination date or one year from the date of termination of Mr. Koppelman’s service as a director of the
F-24
Table of Contents
Company, but in no event beyond the remaining term of the options. On July 26, 2011, the Company and Mr. Koppelman also entered into a services agreement, which provided that, commencing on the transition date, Mr. Koppelman would continue to serve as a member of the Board and that he would carry out other duties and responsibilities as assigned to him by the Board in a non-employee capacity. On September 15, 2011, the Company’s President and Chief Operating Officer began reporting to the Board directly. Accordingly, Mr. Koppelman’s employment with the Company terminated and the services agreement became effective. In connection with these agreements, Mr. Koppelman received cash severance payments of approximately $1.5 million and vested in all outstanding equity awards with the exception of 200,000 performance-based shares, which were forfeited. Mr. Koppelman also became entitled to receive Board fees on the same terms as apply to independent members of the Board, including an initial grant of RSUs equivalent to an equal number of shares of Class A Common Stock having a value of $50,000 on the transition date. Accordingly, Mr. Koppelman received 15,151 service-period based RSUs which vest 100% in September 2012. The vesting and forfeiture of Mr. Koppelman’s equity awards in connection with his employment agreement are reflected in the tables presented previously in this Note 9. Additionally, Mr. Koppelman received price-based RSUs which consist of the contingent right to receive 100,000 shares of Class A Common Stock, of which 50,000 RSUs will vest at such time as the trailing average closing price of the Class A Common Stock has been at least $6, and an additional 50,000 RSUs will vest at such time as such trailing average has been at least $8. To the extent vested, the RSUs will settle on December 31, 2012 or, if earlier, Mr. Koppelman’s termination of service as a Board member. Non-cash equity compensation expense of approximately $44,500 was recorded during the year ended December 31, 2011 related to these price-based awards. The Company measured the fair value of these price-based awards as of each reporting period using the Monte Carlo Simulation method, which fair value is recognized over the expected service period of the awards. As of December 31, 2011, there was $0.2 million of total unrecognized compensation cost related to these price-based RSUs to be recognized over the expected service period listed below. The following table summarizes the assumptions used in the Monte Carlo Simulation method:
Risk-free interest rate | 0.12% | |
Expected volatility | 67.38% | |
Expected service period | 0.37 - 0.57 years | |
Dividend | Zero | |
Estimated value of price-based RSUs | $1.61 - $2.64 |
On August 11, 2006, in connection with Mark Burnett’s continued services as executive producer of the syndicated daytime television show,The Martha Stewart Show, the Company issued to Mr. Burnett a warrant to purchase up to 833,333 shares of Class A Common Stock at an exercise price of $12.59 per share, subject to vesting pursuant to certain performance criteria. During 2007, the warrant vested with respect to one-half the shares and was exercised on a cashless basis, pursuant to which Mr. Burnett acquired 154,112 shares and forfeited 262,555 shares based on the closing price of the Class A Common Stock of $19.98 the day prior to exercise. The balance of this warrant vested later in 2007 and remained outstanding as of December 31, 2011. This warrant expires in March 2012.
Mr. Burnett’s warrant was issued pursuant to the exemption from registration provided by Section 4(2) of the Securities Act of 1933, as amended. The warrant issued to Mr. Burnett is not covered by the Company’s existing equity plans. In connection with the warrant, the Company also entered into a registration rights agreement with Mr. Burnett and the Company thereafter registered the shares covered under the warrant agreement, in addition to certain other shares, pursuant to a registration statement on Form S-3 filed with the SEC.
10. INCOME TAXES
The Company follows ASC Topic 740, Income Taxes (“ASC 740”). Under the asset and liability method of ASC 740, deferred assets and liabilities are recognized for the future costs and benefits attributable to differences between the financial statement carrying amounts of existing assets and liabilities and their respective tax bases. The Company periodically reviews the requirements for a valuation allowance and makes adjustments to such allowances when changes in circumstances result in changes in management’s judgment about the future
F-25
Table of Contents
realization of deferred tax assets. ASC 740 places more emphasis on historical information, such as the Company’s cumulative operating results and its current year results than it places on estimates of future taxable income. Therefore the Company has established a valuation allowance of $83.8 million against certain deferred tax assets as of December 31, 2011. In addition, the Company has recorded a net deferred tax liability of $5.8 million which is attributable to differences between the financial statement carrying amounts of current and prior year acquisitions of certain indefinite-lived intangible assets and their respective tax bases. The Company intends to maintain a valuation allowance until evidence would support the conclusion that it is more likely than not that the deferred tax asset could be realized.
The (provision)/benefit for income taxes consist of the following for 2011, 2010, and 2009:
(in thousands) | 2011 | 2010 | 2009 | |||||||||
Current Income Tax (Expense)/Benefit | ||||||||||||
Federal | $ | — | $ | — | $ | (40 | ) | |||||
State and local | 29 | (236 | ) | (207 | ) | |||||||
Foreign | (262 | ) | (154 | ) | (132 | ) | ||||||
|
|
|
|
|
| |||||||
Total current income tax (expense)/benefit | (233 | ) | (390 | ) | (379 | ) | ||||||
|
|
|
|
|
| |||||||
Deferred Income Tax (Expense) | ||||||||||||
Federal | (1,149 | ) | (1,133 | ) | (1,112 | ) | ||||||
State and local | (198 | ) | (194 | ) | (235 | ) | ||||||
|
|
|
|
|
| |||||||
Total deferred income tax (expense) | (1,347 | ) | (1,327 | ) | (1,347 | ) | ||||||
|
|
|
|
|
| |||||||
Income tax provision from continuing operations | $ | (1,580 | ) | $ | (1,717 | ) | $ | (1,726 | ) | |||
|
|
|
|
|
| |||||||
A reconciliation of the federal income tax provision from continuing operations at the statutory rate to the effective rate for 2011, 2010, and 2009 is as follows:
(in thousands) | 2011 | 2010 | 2009 | |||||||||
Computed tax benefit at the federal statutory rate of 35% | $ | 4,879 | $ | 2,757 | $ | 4,499 | ||||||
State income taxes, net of federal benefit | (50 | ) | (130 | ) | (99 | ) | ||||||
Non-deductible compensation | (30 | ) | (532 | ) | (1,414 | ) | ||||||
Non-deductible expense | (132 | ) | (156 | ) | (153 | ) | ||||||
Tax on foreign income | (262 | ) | (154 | ) | (132 | ) | ||||||
Valuation allowance | (6,090 | ) | (3,681 | ) | (4,332 | ) | ||||||
Other | 105 | 179 | (95 | ) | ||||||||
|
|
|
|
|
| |||||||
Provision for income taxes | $ | (1,580 | ) | $ | (1,717 | ) | $ | (1,726 | ) | |||
|
|
|
|
|
| |||||||
Effective tax rate | 11.3 | % | 21.8 | % | 13.4 | % | ||||||
|
|
|
|
|
| |||||||
F-26
Table of Contents
Significant components of the Company’s deferred tax assets and liabilities as of December 31, 2011 and 2010 were as follows:
(in thousands) | 2011 | 2010 | ||||||
Deferred Tax Assets | ||||||||
Provision for doubtful accounts | $ | 955 | $ | 917 | ||||
Accrued rent | 1,688 | 1,504 | ||||||
Reserve for newsstand returns | 52 | 272 | ||||||
Accrued compensation | 9,620 | 8,322 | ||||||
Deferred royalty revenue | 131 | 275 | ||||||
NOL/credit carryforwards | 56,777 | 51,736 | ||||||
Depreciation | 5,778 | 5,889 | ||||||
Amortization of intangible assets | 8,987 | 7,748 | ||||||
Other | 482 | 1,108 | ||||||
|
|
|
| |||||
Total deferred tax assets | 84,470 | 77,771 | ||||||
|
|
|
| |||||
Deferred Tax Liabilities | ||||||||
Prepaid expenses | (624 | ) | (808 | ) | ||||
Amortization of intangible assets | (5,874 | ) | (4,527 | ) | ||||
|
|
|
| |||||
Total deferred tax liabilities | (6,498 | ) | (5,335 | ) | ||||
Valuation allowance | (83,846 | ) | (76,963 | ) | ||||
|
|
|
| |||||
Net Deferred Tax Liability | $ | (5,874 | ) | $ | (4,527 | ) | ||
|
|
|
| |||||
At December 31, 2011, the Company had aggregate federal net operating loss carryforwards of $118.8 million (before-tax), which will be available to reduce future taxable income through 2031, with the majority expiring in years 2024 and 2025. The Company had federal and state tax credit carryforwards of $2.9 million which begin to expire in 2014. To the extent the Company achieves positive net income in the future, the net operating loss and credits carryforwards may be utilized and the Company’s valuation allowance will be adjusted accordingly.
ASC 740 further establishes guidance on the accounting for uncertain tax positions. As of December 31, 2011, the Company had an ASC 740 liability balance of $72,000. Of this amount, $50,000 represented unrecognized tax benefits, which if recognized at some point in the future would favorably impact the effective tax rate, and $22,000 is interest. The Company treats interest and penalties due to a taxing authority on unrecognized tax positions as interest and penalty expense. As of December 31, 2011 and December 31, 2010, the Company recorded $22,000 and $82,000 of accrued interest and penalties in the consolidated balance sheets. Following is a reconciliation of the Company’s total gross unrecognized tax benefits for 2011 and 2010.
(in thousands) | 2011 | 2010 | ||||||
Gross balance at January 1 | $ | 213 | $ | 131 | ||||
Additions based on tax positions related to the current year | — | — | ||||||
Additions for tax positions of prior years | 16 | 82 | ||||||
Reductions for tax positions of prior years | — | — | ||||||
Settlements | (179 | ) | — | |||||
Reductions due to lapse of applicable statute of limitations | — | — | ||||||
|
|
|
| |||||
Gross balance at December 31 | 50 | 213 | ||||||
Interest and penalties | 22 | 82 | ||||||
|
|
|
| |||||
Balance including interest and penalties at December 31 | $ | 72 | $ | 295 | ||||
|
|
|
| |||||
F-27
Table of Contents
The Company is no longer subject to U.S. federal income tax examinations by tax authorities for the years before 2005 and state examinations for the years before 2003. The Company does not anticipate that the liability will change significantly over the next 12 months.
11. RELATED PARTY TRANSACTIONS
On June 13, 2008, the Company entered into an intangible asset license agreement (the “Intangible Asset License Agreement”) with MS Real Estate Management Company (“MSRE”), an entity owned by Martha Stewart. The Intangible Asset License Agreement is retroactive to September 18, 2007 and has a five-year term.
Pursuant to the Intangible Asset License Agreement, the Company pays an annual fee of $2.0 million to MSRE for the perpetual, exclusive right to use Ms. Stewart’s lifestyle intangible asset in connection with Company products and services and to access various real properties owned by Ms. Stewart during the term of the agreement. On February 8, 2010, the Company executed an amendment to the Intangible Asset License Agreement. Pursuant to the amendment, for 2010 only, the annual fee of $2.0 million that was otherwise payable on or about September 15, 2010 was reduced to $1.95 million and paid in two installments, the first of which was $0.95 million and was paid on February 9, 2010; and the remainder of which was paid on September 15, 2010 as originally scheduled. The $2.0 million annual fee for 2011 was paid on September 15, 2011.
MSRE is responsible, at its expense, to maintain and landscape the properties in a manner consistent with past practices; provided, however, that the Company is responsible for approved business expenses associated with security and telecommunications systems and security personnel related to Ms. Stewart at the properties, and must reimburse MSRE for up to $0.1 million of approved and documented household expenses. In each of the years ended December 31, 2011 and 2010, the Company reimbursed MSRE $0.1 million for approved and documented household expenses.
The Company also reimbursed MSRE for certain costs borne by MSRE associated with various Company business activities which were conducted at properties covered by the Intangible Asset License Agreement. For 2011, reimbursements for these costs were insignificant. For 2010, the Company reimbursed MSRE $0.1 million for these costs. No similar costs were reimbursed in 2009.
On February 28, 2001, the Company entered into a Split-Dollar Agreement with Martha Stewart and The Martha Stewart Family Limited Partnership (the “MS Partnership”), under which the Company agreed to pay a significant portion of the premiums on whole life policies insuring Ms. Stewart. The policies were owned by and benefited the MS Partnership. Due to uncertainty as to whether such arrangements constituted prohibited loans to executive officers and directors after the enactment of the Sarbanes-Oxley Act in 2002, the Split-Dollar Agreement was amended so that the Company would not be obligated to make further premium payments after 2002.
Because the intent of the agreement was frustrated by the enactment of Sarbanes-Oxley and so that the parties could realize the existing cash surrender value of the policies rather than risking depleting the future surrender value, the Company, Ms. Stewart and the MS Partnership terminated the Split-Dollar Agreement, as amended, effective November 9, 2009. In connection with the termination, the MS Partnership agreed to surrender and cancel the policies subject to the Split-Dollar Agreement for their cash surrender value as of such date. As part of the arrangement the Company reimbursed the MS Partnership approximately $0.3 million for the premiums paid towards the policies (which amount, if determined to be taxable, would be subject to a tax gross-up).
In April 2009, the Company entered into an amended and restated employment agreement (the “2009 Employment Agreement”) with Martha Stewart which replaced the existing agreement between the Company and Ms. Stewart that was scheduled to expire in September 2009. The 2009 Employment Agreement expires March 31, 2012. The Company expects to enter into an extension of Ms. Stewart’s employment agreement prior
F-28
Table of Contents
to its expiration. During the term of the 2009 Employment Agreement, Ms. Stewart is entitled to talent compensation of $2.0 million per year. In addition, she is entitled to an annual bonus in an amount determined by the Compensation Committee, with a target bonus equal to $1.0 million and a maximum annual bonus of 150% of the target amount. Ms. Stewart received a $3.0 million make whole/retention payment in connection with the execution of the agreement, which amount is subject to pro-rata forfeiture in the event Ms. Stewart terminates the agreement without good reason or the Company terminates the agreement with cause. Separately, Ms. Stewart’s compensation includes a portion of personnel costs paid by the Company for individuals performing work on her behalf.
For discussion of agreements with Charles A. Koppelman, the Company’s Executive Chairman, see Note 9,Employee and Non-Employee Benefit and Compensation Plans,specifically under Non-Employee Equity Compensation.
Related party compensation expense includes salary, bonus and non-cash equity compensation as determined under ASC Topic 718. Alexis Stewart, the daughter of Martha Stewart, is a beneficial owner of more than 10% of the Company’s stock. She has been employed by the Company and has served as a co-host of a Company television show and a co-host of a Company radio show. The Company paid Alexis Stewart aggregate compensation of $0.3 million, $0.4 million and $0.4 million in 2011, 2010 and 2009, respectively. The Company has also employed certain other members of Martha Stewart’s and Charles Koppelman’s family. Aggregate compensation for these employees was $0.7 million, $0.7 million and $0.6 million in 2011, 2010 and 2009, respectively.
Prior to the sale of its interest in WeddingWire and recording the other-than-temporary loss on its investment in pingg, the Company had determined that these cost-based investments represented interests in VIEs. See Note 2,Summary of Significant Accounting Policies, specifically underInvestments in other non-current assets, for further discussion. The Company derived digital advertising revenues from these VIEs, a portion of which were payable to the VIEs. For 2011, total revenues and payables from these investments were $0.1 million and $0.2 million, respectively. For 2010, total revenues and payables from these investments were $0.5 million and $0.2 million, respectively.
For the years ended December 31, 2011, 2010 and 2009, respectively, the Company made charitable contributions of $30,000, $20,000, and $40,000 to a foundation with which Martha Stewart is affiliated.
12. COMMITMENTS AND CONTINGENCIES
Operating Leases
The Company leases office facilities, filming locations, and equipment under operating lease agreements. The Company expects to vacate its television production facilities at 221 West 26th Street and its executive and administrative office for television production at 226 West 26th Street at the end of the second quarter of 2012. Leases for the Company’s other offices and facilities expire between 2012 and 2018, and some of these leases are subject to the Company’s renewal. Total rent expense charged to operations for all such leases, inclusive of the Company’s television production facilities and television administrative offices, was approximately $13.5 million, $14.0 million, and $15.2 million for the years ended December 31, 2011, 2010, and 2009, respectively, net of sublease income of $1.3 million, $1.3 million and $0.7 million in 2011, 2010 and 2009, respectively. Rent expense for operating leases, which may include free rent or fixed escalation amounts in addition to minimum lease payments, is recognized on a straight-line basis over the duration of each lease term.
F-29
Table of Contents
The following is a schedule of future minimum payments under operating leases at December 31, 2011. The table includes total minimum lease payment commitments which include rent and other charges:
(in thousands) | Operating Lease Payments | Sublease Income | Net Operating Lease Payments | |||||||||
2012 | $ | 12,476 | $ | 1,065 | $ | 11,411 | ||||||
2013 | 9,113 | 401 | 8,712 | |||||||||
2014 | 7,941 | 414 | 7,527 | |||||||||
2015 | 8,147 | 426 | 7,721 | |||||||||
2016 | 7,918 | 439 | 7,479 | |||||||||
Thereafter | 8,838 | — | 8,838 | |||||||||
|
|
|
|
|
| |||||||
Total | $ | 54,433 | $ | 2,745 | $ | 51,688 | ||||||
|
|
|
|
|
| |||||||
Operating lease obligations are shown net of sublease income in this table.
Legal Matters
On January 23, 2012, Macy’s Inc. and Macy’s Merchandising Group, Inc. (together, the “Macy’s plaintiffs”) filed a lawsuit against the Company in the Supreme Court of the State of New York, County of New York titled Macy’s, Inc. and Macy’s Merchandising Group, Inc. v. Martha Stewart Living Omnimedia, Inc. In such lawsuit, the Macy’s plaintiffs claim that the Company’s planned activities under its commercial agreement with J.C. Penney Corporation, Inc. materially breach the agreement between the Company and Macy’s Merchandising Group, Inc. dated April 3, 2006 (the “Macy’s Agreement”). The Macy’s plaintiffs seek a declaratory judgment, preliminary and permanent injunctive relief, and incidental and other damages. The Macy’s plaintiffs initially filed a motion for a preliminary injunction and subsequently withdrew the motion without prejudice. On February 10, 2012, the Company filed an answer to the Macy’s plaintiffs’ original complaint and asserted three counterclaims against the Macy’s plaintiffs, alleging that Macy’s, Inc. and Macy’s Merchandising Group, Inc. had breached the Macy’s Agreement by, among other things, failing to maximize net sales. The Macy’s plaintiffs have denied the allegations of the counterclaims. The Company believes that it has meritorious defenses to the claims made by the Macy’s plaintiffs, and intends to vigorously defend such claims. If the lawsuit against the Company is successful and the Company is enjoined, some of the future benefits the Company anticipates receiving from its relationship with J. C. Penney Corporation, Inc. could be reduced.
The Company is a party to other legal proceedings in the ordinary course of business, including product liability claims for which the Company is indemnified by its licensees. None of these proceedings is deemed material.
Other
See Note 7,Credit Facilities, for discussion of the Company’s line of credit with Bank of America.
13. SELECTED QUARTERLY FINANCIAL DATA (UNAUDITED)
(in thousands, including per share data)
Year ended December 31, 2011 | First Quarter | Second Quarter | Third Quarter | Fourth Quarter | Total | |||||||||||||||
Revenues | $ | 52,675 | $ | 54,860 | $ | 52,204 | $ | 61,694 | $ | 221,433 | ||||||||||
Operating (loss) / income | (6,776 | ) | (2,486 | ) | (9,294 | ) | (38 | ) | (18,594 | ) | ||||||||||
Net (loss) / income | $ | (7,077 | ) | $ | (2,938 | ) | $ | (9,701 | ) | $ | 4,197 | $ | (15,519 | ) | ||||||
(Loss)/earnings per share—basic and diluted | $ | (0.13 | ) | $ | (0.05 | ) | $ | (0.18 | ) | $ | 0.07 | $ | (0.28 | ) | ||||||
Weighted average common shares outstanding | ||||||||||||||||||||
Basic | 54,716 | 54,766 | 54,990 | 59,015 | 55,881 | |||||||||||||||
Diluted | 54,716 | 54,766 | 54,990 | 59,606 | 55,881 | |||||||||||||||
F-30
Table of Contents
Year ended December 31, 2010 | First Quarter | Second Quarter | Third Quarter | Fourth Quarter | Total | |||||||||||||||
Revenues | $ | 53,236 | $ | 55,299 | $ | 49,688 | $ | 72,590 | $ | 230,813 | ||||||||||
Operating (loss)/income | (3,369 | ) | (803 | ) | (7,908 | ) | 3,417 | (8,663 | ) | |||||||||||
Net (loss)/income | $ | (3,865 | ) | $ | (1,249 | ) | $ | (8,586 | ) | $ | 4,104 | $ | (9,596 | ) | ||||||
(Loss)/earnings per share—basic | $ | (0.07 | ) | $ | (0.02 | ) | $ | (0.16 | ) | $ | 0.08 | $ | (0.18 | ) | ||||||
(Loss)/earnings per share—diluted | $ | (0.07 | ) | $ | (0.02 | ) | $ | (0.16 | ) | $ | 0.07 | $ | (0.18 | ) | ||||||
Weighted average common shares outstanding | ||||||||||||||||||||
Basic | 54,327 | 54,389 | 54,487 | 54,512 | 54,440 | |||||||||||||||
Diluted | 54,327 | 54,389 | 54,487 | 55,789 | 54,440 | |||||||||||||||
Note: Basic and diluted earnings per share are computed independently for each quarter and full year presented. Accordingly, the sum of the quarterly earnings per share data may not agree with the calculated full year earnings per share.
Fourth Quarter 2011 Items:
Results include an approximate $1.3 million non-cash impairment charge related to a previously acquired television content library, a gain on sale of a cost-based investment of approximately $7.6 million, and other-than-temporary loss charges on cost-based investments of approximately $2.7 million.
14. INDUSTRY SEGMENTS
The Company is an integrated media and merchandising company providing consumers with inspiring lifestyle content and programming, and well-designed, high-quality products. The Company’s business segments are Publishing, Broadcasting and Merchandising.
The Publishing segment primarily consists of the Company’s operations related to its magazines and books, as well as its digital operations which includes the content-driven website, www.marthastewart.com. The Broadcasting segment primarily consists of the Company’s television production operations and its satellite radio operations. Seasons 1 through 5 ofThe Martha Stewart Show aired in syndication over a twelve-month period from mid-September 2005 through mid-September 2010. Season 6 ofThe Martha Stewart Show aired on Hallmark Channel also over a 12-month period beginning and ending in the middle of September, with season 7 ofThe Martha Stewart Show airing on Hallmark Channel through September 2012. The Merchandising segment consists of the Company’s operations related to the design of merchandise and related promotional and packaging materials that are licensed to and distributed by its retail and manufacturing partners.
F-31
Table of Contents
The accounting policies for the Company’s business segments are the same as those described in Note 2,Summary of Significant Accounting Policies. Segment information for 2011, 2010, and 2009 is as follows:
(in thousands) | Publishing | Broadcasting | Merchandising | Corporate | Consolidated | |||||||||||||||
2011 | ||||||||||||||||||||
Revenues | $ | 140,857 | $ | 31,962 | $ | 48,614 | $ | — | $ | 221,433 | ||||||||||
Non-cash equity compensation | (682 | ) | (67 | ) | (224 | ) | (4,523 | ) | (5,496 | ) | ||||||||||
Depreciation and amortization | (774 | ) | (470 | ) | (32 | ) | (2,702 | ) | (3,978 | ) | ||||||||||
Restructuring charges | (828 | ) | (600 | ) | (13 | ) | (3,675 | ) | (5,116 | ) | ||||||||||
Operating income/(loss) | (6,464 | ) | (4,740 | ) | 29,972 | (37,362 | ) | (18,594 | ) | |||||||||||
Total assets | 83,769 | 28,352 | 81,199 | 22,800 | 216,120 | |||||||||||||||
Capital expenditures | 1,221 | 32 | 7 | 1,619 | 2,879 | |||||||||||||||
2010 | ||||||||||||||||||||
Revenues | $ | 145,573 | $ | 42,434 | $ | 42,806 | $ | — | $ | 230,813 | ||||||||||
Non-cash equity compensation | (552 | ) | (230 | ) | (803 | ) | (3,816 | ) | (5,401 | ) | ||||||||||
Depreciation and amortization | (1,127 | ) | (878 | ) | (43 | ) | (2,584 | ) | (4,632 | ) | ||||||||||
Operating income/(loss) | 2,650 | (1,578 | ) | 25,001 | (34,736 | ) | (8,663 | ) | ||||||||||||
Total assets | 91,914 | 39,092 | 73,659 | 17,649 | 222,314 | |||||||||||||||
Capital expenditures | 815 | 843 | 10 | 3,039 | 4,707 | |||||||||||||||
2009 | ||||||||||||||||||||
Revenues | $ | 146,100 | $ | 46,111 | $ | 52,566 | $ | — | $ | 244,777 | ||||||||||
Non-cash equity compensation | (1,233 | ) | (889 | ) | (1,468 | ) | (4,357 | ) | (7,947 | ) | ||||||||||
Depreciation and amortization | (2,191 | ) | (1,389 | ) | (62 | ) | (4,232 | ) | (7,874 | ) | ||||||||||
Impairment charge-other asset | — | — | 11,432 | — | 11,432 | |||||||||||||||
Operating income/(loss) | (169 | ) | 6,140 | 25,651 | (43,590 | ) | (11,968 | ) | ||||||||||||
Total assets | 92,393 | 27,458 | 75,711 | 34,229 | 229,791 | |||||||||||||||
Capital expenditures | 337 | 23 | 99 | 8,150 | 8,609 | |||||||||||||||
15. RESTRUCTURING CHARGES
The Company incurred approximately $5.1 million in restructuring charges during 2011. Restructuring charges include employee severance and other employee-related termination costs, as well as certain consulting and recruiting costs. Included in the $5.1 million restructuring charge is an approximate $0.5 million reversal of non-cash equity compensation expense related to certain employee departures.
16. OTHER INFORMATION
The Company’s financial instruments consist of cash and cash equivalents, short-term investments, accounts receivable, accounts payable and accrued expenses. The carrying amount of these accounts approximates fair value.
The Company’s revenues from foreign sources were $9.8 million, $6.5 million and $10.8 million in 2011, 2010 and 2009, respectively.
The Company’s revenues from Kmart Corporation—which predominately are included in the Merchandising segment—relative to the Company’s total revenues were approximately 11% for 2009.
Advertising expense, including subscription acquisition costs, was $15.3 million, $14.3 million, and $14.8 million for 2011, 2010, and 2009, respectively.
Production, distribution and editorial expenses; selling and promotion expenses; and general and administrative expenses are all presented exclusive of depreciation and amortization, impairment charges and restructuring charges, which are shown separately within “Operating Costs and Expenses.”
F-32
Table of Contents
Interest paid in 2011, 2010, and 2009 was $0.3 million, $0.5 million, and $0.5 million, respectively, and was predominantly related to the Company’s loan with Bank of America that it paid off in December 2011.
Income taxes paid in 2011, 2010, and 2009 were $0.6 million, $0.5 million, and $0.3 million, respectively.
17. SUBSEQUENT EVENTS
Line of credit
During February 2012, the Company increased its line of credit with Bank of America to $25.0 million, incorporating the previous $5.0 million line, which proceeds are available for investment opportunities, working capital, and the issuance of letters of credit. See Note 7,Credit Facilities, for further discussion of the Company’s line of credit with Bank of America. The interest rate on outstanding amounts is equal to a floating rate of 1-month LIBOR Daily Floating Rate plus 1.85%. The unused commitment fee is equal to 0.25%. The line of credit terms require the Company to be in compliance with certain financial and other covenants. A summary of the most significant financial covenants is as follows:
Financial Covenants | ||
Tangible Net Worth | At least $40.0 million | |
Current Ratio | At least 1.75 to 1.0 | |
Unencumbered liquid assets | Equal to or greater than outstanding principal balance plus accrued interest |
The loan agreement also contains a variety of other customary affirmative and negative covenants. The loan agreement expires February 14, 2013 and any then outstanding amounts borrowed under the agreement are then due and payable.
Legal Matters
See Note 12,Commitments and Contingencies, specifically underLegal Matters, for discussion of litigation initiated subsequent to December 31, 2011.
F-33
Table of Contents
MARTHA STEWART LIVING OMNIMEDIA, INC.
SCHEDULE II—VALUATION AND QUALIFYING ACCOUNTS
(in thousands)
Description | Balance, Beginning of Year | Additions Charged to Revenues, Costs and Expenses | Additions/ (Deductions) Charged to Balance Sheet Accounts | (Deductions) Charged to Revenues, Costs and Expenses | Balance, End of Year | |||||||||||||||
Allowance for doubtful accounts: | ||||||||||||||||||||
Year ended December 31, | ||||||||||||||||||||
2011 | $ | 1,502 | $ | 1,196 | $ | (334 | ) | $ | (734 | ) | $ | 1,630 | ||||||||
2010 | 1,351 | 773 | (144 | ) | (478 | ) | 1,502 | |||||||||||||
2009 | 1,502 | 716 | (131 | ) | (736 | ) | 1,351 | |||||||||||||
Reserve for audience underdelivery: | ||||||||||||||||||||
Year ended December 31, | ||||||||||||||||||||
2011 | $ | — | $ | — | $ | — | $ | — | $ | — | ||||||||||
2010 | 2,857 | 2,065 | (3,605 | ) | (1,317 | ) | — | |||||||||||||
2009 | 1,869 | 2,434 | (336 | ) | (1,110 | ) | 2,857 | |||||||||||||
Reserve for valuation allowance on the deferred tax asset: | ||||||||||||||||||||
Year ended December 31, | ||||||||||||||||||||
2011 | $ | 76,963 | $ | 6,883 | $ | — | $ | — | $ | 83,846 | ||||||||||
2010 | 73,282 | 3,681 | — | — | 76,963 | |||||||||||||||
2009 | 68,003 | 4,332 | 947 | — | 73,282 | |||||||||||||||
F-34
Table of Contents
EXHIBIT INDEX
Exhibit | Exhibit Title | |||
| 3.1 | — | Martha Stewart Living Omnimedia, Inc. Certificate of Incorporation (incorporated by reference to Exhibit 3.1 to our Registration Statement on Form S-1, as amended, file number 333-84001 (the “Registration Statement”)). | ||
| 3.1.1 | Certificate of Designations of the Series A Preferred Stock of Martha Stewart Living Omnimedia, Inc. (incorporated by reference to our Current Report on Form 8-K/A (file number 001-15395) filed on December 13, 2011). | |||
| 3.2 | — | Second Amended and Restated By-Laws of Martha Stewart Living Omnimedia, Inc. (incorporated by reference to our Current Report on Form 8-K (file number 001-15395) filed on December 12, 2011). | ||
| 4.1 | — | Warrant to purchase shares of Class A Common Stock, dated August 11, 2006 (incorporated by reference to Exhibit 4.2 to our Quarterly Report on Form 10-Q (file number 001-15395) for the quarter ended September 30, 2006 (the “September 2006 10-Q”)). | ||
| 4.2 | — | Investor Rights Agreement dated as of December 6, 2011 by and between Martha Stewart Living Omnimedia, Inc. and J.C. Penney Corporation, Inc. (incorporated by reference to Exhibit 2 to the Schedule 13D (file number 001-15395) filed by J.C. Penney Company, Inc. on December 16, 2011). | ||
| 10.1† | — | 1999 Stock Incentive Plan (incorporated by reference to the Registration Statement), as amended by Exhibits 10.1.1, 10.1.2 and 10.1.3. | ||
| 10.1.1† | — | Amendment No. 1 to the 1999 Stock Incentive Plan, dated as of March 9, 2000 (incorporated by reference to our Annual Report on Form 10-K (file number 001-15395) for the year ended December 31, 1999 (the “1999 10-K”)). | ||
| 10.1.2† | — | Amendment No. 2 to the Amended and Restated 1999 Stock Incentive Plan, dated as of May 11, 2000 (incorporated by reference to our Quarterly Report on Form 10-Q (file number 001-15395) for the quarter ended June 30, 2000). | ||
| 10.1.3† | — | Amendment No. 3 to the Amended and Restated 1999 Stock Incentive Plan (incorporated by reference to our Current Report on Form 8-K (file number 001-15395) filed on May 17, 2005 (the “May 17, 2005 8-K”)). | ||
| 10.2† | — | 1999 Non-Employee Director Stock and Option Compensation Plan (incorporated by reference to the Registration Statement) as amended by Exhibit 10.2.1. | ||
| 10.2.1† | — | Amendment No. 1 to the Martha Stewart Living Omnimedia, Inc. Non-Employee Director Stock and Option Compensation Plan (incorporated by reference to the May 17, 2005 8-K). | ||
| 10.3 | — | Form of Intellectual Property License and Preservation Agreement, dated as of October 22, 1999, by and between Martha Stewart Living Omnimedia, Inc. and Martha Stewart (incorporated by reference to Exhibit 10.8 to the Registration Statement). | ||
| 10.4†* | — | Director Compensation Program | ||
| 10.5.† | — | Amended and Restated Employment Agreement, dated as of July 26, 2011, between Martha Stewart Living Omnimedia, Inc. and Charles A. Koppelman (incorporated by reference to Exhibit 10.1 to our Quarterly Report on Form 10-Q (file number 001-15395) for the quarter ended September 30, 2011 (“September 2011 10-Q”)), as amended by Exhibit 10.5.1. | ||
| 10.5.1† | — | Amendment dated as of September 15, 2011 to the Amended and Restated Employment Agreement, dated as of July 26, 2011, between Martha Stewart Living Omnimedia, Inc. and Charles A. Koppelman (incorporated by reference to Exhibit 10.2 to our September 2011 10-Q). | ||
Table of Contents
Exhibit | Exhibit Title | |||
| 10.6 | — | Lease, dated August 20, 1999, between 601 West Associates LLC and Martha Stewart Living Omnimedia LLC (incorporated by reference to Exhibit 10.12 to the Registration Statement) as amended by Exhibits 10.6.1 and 10.6.2. | ||
| 10.6.1 | — | First Lease Modification Agreement, dated December 24, 1999, between 601 West Associates LLC and Martha Stewart Living Omnimedia, Inc. (incorporated by reference to Exhibit 10.12.1 to our 1999 10-K). | ||
| 10.6.2 | — | Sixth Lease Modification Agreement, dated as of June 14, 2007, between 601 West Associates LLC and Martha Stewart Living Omnimedia, Inc (incorporated by reference to Exhibit 10.1 to our Quarterly Report on Form 10-Q (file number 001-15395) for the quarter ended March 31, 2008 (“March 2008 10-Q”)). | ||
| 10.7† | — | Employment Agreement, dated as of September 17, 2008, between Martha Stewart Living Omnimedia, Inc. and Robin Marino (incorporated by reference to Exhibit 10.4 to our Quarterly Report on Form 10-Q (file number 001-15395) for the quarter ended September 30, 2008 (the “September 2008 10-Q”). | ||
| 10.8† | — | Letter Agreement, dated as of September 1, 2009, between Martha Stewart Living Omnimedia, Inc. and Peter Hurwitz (incorporated by reference to Exhibit 10.5 to our September 2011 10-Q). | ||
| 10.9† | — | Amended and Restated Employment Agreement, dated as of April 1, 2009, between Martha Stewart Living Omnimedia, Inc. and Martha Stewart (incorporated by reference to Exhibit 10.2 to our Quarterly Report on Form 10-Q (file number 001-15395) for the Quarter ended March 31, 2009 (“March 2009 10-Q”). | ||
| 10.10 | — | Intangible Asset License Agreement, dated as of June 13, 2008, between Martha Stewart Living Omnimedia, Inc. and MS Real Estate Management Company (incorporated by reference to Exhibit 10.9 to our Quarterly Report on Form 10-Q (file number 001-15395) for the quarter ended June 30, 2008, as amended by Exhibits 10.10.1 and 10.10.2. | ||
| 10.10.1 | — | First Amendment, dated as of December, 2008, to the Intangible Asset License Agreement between MS Real Estate Management Company and Martha Stewart Living Omnimedia, Inc. dated as of June 13, 2008 (incorporated by reference to Exhibit 10.11.1 to our Annual Report on Form 10-K (file number 001-15395) for the year ended December 31, 2009 (the “2009 10-K”)). | ||
| 10.10.2 | — | Second Amendment, dated as of February 8, 2010, to the Intangible Asset License Agreement between MS Real Estate Management Company and Martha Stewart Living Omnimedia, Inc. dated as of June 13, 2008, as amended (incorporated by reference to Exhibit 10.11.2 to the 2009 10-K). | ||
| 10.11† | — | Employment Agreement, dated as of March 24, 2009, between Martha Stewart Living Omnimedia, Inc. and Kelli Turner (incorporated by reference to Exhibit 10.1 to our March 2009 10-Q). | ||
| 10.12† | — | Form of Restricted Stock Award Agreement for use under the Martha Stewart Living Omnimedia, Inc. Amended and Restated 1999 Stock Incentive Plan (incorporated by reference to Exhibit 10.1 to our Current Report on Form 8-K (file number 001-15395) filed on January 14, 2005). | ||
| 10.13† | — | Registration Rights Agreement between Charles A. Koppelman and Martha Stewart Living Omnimedia, Inc. dated January 24, 2005 (incorporated by reference to Exhibit 10.3 to our Current Report on Form 8-K (file number 001-15395) filed on October 21, 2005). | ||
| 10.14 | — | Warrant Registration Rights Agreement, dated as of August 11, 2006, between Martha Stewart Living Omnimedia, Inc. and Mark Burnett (incorporated by reference to Exhibit 10.3 to our September 2006 10-Q). | ||
Table of Contents
Exhibit | Exhibit Title | |||
| 10.15† | — | Services Agreement, dated as of July 26, 2011, between Martha Stewart Living Omnimedia, Inc. and Charles Koppelman (incorporated by reference to Exhibit 10.3 to our September 2011 10-Q). | ||
| 10.16 | — | Publicity Rights Agreement, dated as of April 2, 2008, by and among Martha Stewart Living Omnimedia, Inc., MSLO Shared IP Sub LLC and Emeril J. Lagasse, III (incorporated by reference to Exhibit 10.4 to our March 2008 10-Q). | ||
| 10.17 | — | Amended and Restated Loan Agreement, dated as of August 7, 2009, by and among Bank of America, N.A., MSLO Emeril Acquisition Sub LLC and Martha Stewart Living Omnimedia, Inc. (incorporated by reference to Exhibit 10.1 to our Quarterly Report on Form 10-Q (file number 001-15395) for the quarter ended September 30, 2009 (“September 2009 10-Q”)), as amended by Exhibits 10.17.1, 10.17.2, 10.17.3 and 10.17.4. | ||
| 10.17.1 | — | Waiver and Amendment to Loan Documents, dated as of December 18, 2009, to Amended and Restated Loan Agreement dated as of August 7, 2009 among Bank of America, N.A., MSLO Emeril Acquisition Sub LLC and Martha Stewart Living Omnimedia, Inc. (incorporated by reference to Exhibit 10.22 to our 2009 10-K). | ||
| 10.17.2 | — | Waiver and Amendment, dated as of November 1, 2010, to the Amended and Restated Loan Agreement, dated as of August 7, 2009, by and among Bank of America, N.A., MSLO Emeril Acquisition Sub LLC and Martha Stewart Living Omnimedia, Inc. (incorporated by reference to Exhibit 10.1 to our Quarterly Report on Form 10-Q (file number 001-15395) for the quarter ended September 30, 2010). | ||
| 10.17.3 | — | Waiver and Amendment, dated as of March 11, 2011, to the Amended and Restated Loan Agreement, dated as of August 7, 2009, by and among Bank of America, N.A., MSLO Emeril Acquisition Sub LLC and Martha Stewart Living Omnimedia, Inc. (incorporated by reference to Exhibit 10.3 to our Quarterly Report on Form 10-Q (file number 001-15395) for the quarter ended March 31, 2011 (“March 2011 10-Q”)). | ||
| 10.17.4 | — | Amendment, dated as of June 29, 2011, to the Amended and Restated Loan Agreement, dated as of August 7, 2009, by and among Bank of America, N.A., MSLO Emeril Acquisition Sub LLC and Martha Stewart Living Omnimedia, Inc. ((incorporated by reference to Exhibit 10.2 to our Quarterly Report on Form 10-Q (file number 001-15395) for the quarter ended June 30, 2011 (“June 2011 10-Q”)). | ||
| 10.18 | — | Security Agreement, dated as of July 31, 2008, among Martha Stewart Living Omnimedia, Inc., MSLO Emeril Acquisition Sub LLC, and Bank of America, N.A. (incorporated by reference to Exhibit 10.1 to our September 2008 10-Q), as amended by Exhibits 10.18.1, 10.18.2, and 10.17.1. | ||
| 10.18.1 | — | Waiver and Omnibus Amendment No. 1, dated as of June 18, 2009, to Loan Agreement dated as of April 4, 2008 by and among Bank of America, N.A., MSLO Emeril Acquisition Sub LLC and Martha Stewart Living Omnimedia, Inc. (incorporated by reference to Exhibit 10.1 to our Quarterly Report on Form 10-Q (file number 001-15395) for the quarter ended June 30, 2009). | ||
| 10.18.2 | — | Amendment No. 2, dated as of August 7, 2009, to Security Agreement dated as of July 31, 2008 among Martha Stewart Living Omnimedia, Inc., Emeril Acquisition Sub LLC and Bank of America, (incorporated by reference to Exhibit 10.2 to our September 2009 10-Q). | ||
| 10.19 | — | Continuing and Unconditional Guaranty dated as of April 4, 2008 executed by Martha Stewart Living Omnimedia, Inc., MSO IP Holdings, Inc., Martha Stewart, Inc., Body and Soul Omnimedia, Inc., MSLO Productions, Inc., MSLO Productions—Home, Inc., MSLO Productions—EDF, Inc. and Flour Productions, Inc. (incorporated by reference to Exhibit 10.8 to our March 2008 10-Q), as reaffirmed by Exhibit 10.22.1. | ||
Table of Contents
Exhibit | Exhibit Title | |||
| 10.19.1 | — | Reaffirmation of Guaranty, dated as of August 7, 2009, executed by Martha Stewart Living Omnimedia, Inc., MSO IP Holdings, Inc., Martha Stewart, Inc., Body and Soul Omnimedia, Inc., MSLO Productions, Inc. MSLO Productions Home, Inc. MSLO Productions—EDF, Inc and Flour Productions, Inc. (incorporated by reference to Exhibit 10.3 to our September 2009 10-Q). | ||
| 10.20 | — | Registration Rights Agreement, dated as of April 2, 2008, by and among Martha Stewart Living Omnimedia, Inc., Emeril’s Food of Love Productions, L.L.C., emerils.com, LLC and Emeril J. Lagasse, III (incorporated by reference to Exhibit 10.9 to our March 2008 10-Q). | ||
| 10.21† | — | Martha Stewart Living Omnimedia, Inc. Director Deferral Plan (incorporated by reference to Exhibit 10.46 to our Annual Report on Form 10-K (file number 001-15395) for the year ended December 31, 2008 (the “2008 10-K”)). | ||
| 10.22† | — | Martha Stewart Living Omnimedia, Inc. Omnibus Stock and Option Compensation Plan (incorporated by reference to Exhibit 99.1 to our Current Report on Form 8-K (file number 001-15395) filed on May 20, 2008 (“May 20, 2008 8-K”)). | ||
| 10.23† | — | Form of Martha Stewart Living Omnimedia, Inc. Omnibus Stock and Option Compensation Plan Stock Option Agreement and forms of related Notices (incorporated by reference to Exhibit 99.2 to our May 20, 2008 8-K). | ||
| 10.24† | — | Form of Martha Stewart Living Omnimedia, Inc. Omnibus Stock and Option Compensation Plan Restricted Stock Unit Agreement (incorporated by reference to Exhibit 10.1 to our March 2011 10-Q). | ||
| 10.25† | — | Form of Martha Stewart Living Omnimedia, Inc. Omnibus Stock and Option Compensation Plan Restricted Stock Unit Agreement for Directors (incorporated by reference to Exhibit 10.2 to our March 2011 10-Q). | ||
| 10.26† | — | Form of Martha Stewart Living Omnimedia, Inc. Omnibus Stock and Option Compensation Plan Restricted Stock Grant Agreement (incorporated by reference to Exhibit 99.4 to our May 20, 2008 8-K). | ||
| 10.27† | — | Form of Martha Stewart Living Omnimedia, Inc. Omnibus Stock and Option Compensation Plan Stock Appreciation Right Agreement and form of related Notice (incorporated by reference to Exhibit 99.5 to our May 20, 2008 8-K). | ||
| 10.28† | — | Form of Martha Stewart Living Omnimedia, Inc. Omnibus Stock and Option Compensation Plan Stock Grant Agreement and form of related Acknowledgement (incorporated by reference to Exhibit 99.6 to our May 20, 2008 8-K). | ||
| 10.29† | — | Form of Performance-Based Restricted Stock Unit Agreement pursuant to the Martha Stewart Living Omnimedia, Inc. Omnibus Stock and Option Compensation Plan (incorporated by reference to Exhibit 10.1 to our Current Report on Form 8-K (file number 001-15395) filed on February 12, 2009). | ||
| 10.30† | — | Martha Stewart Living Omnimedia, Inc. Omnibus Stock and Option Compensation Plan Restricted Stock Grant Agreement dated October 1, 2008 between Martha Stewart Living Omnimedia, Inc. and Charles Koppelman (incorporated by reference to Exhibit 10.5 to our September 2008 10-Q). | ||
| 10.31† | — | Martha Stewart Living Omnimedia, Inc. Omnibus Stock and Option Compensation Plan Stock Option Grant Agreement and form of related Notice dated October 1, 2008 between Martha Stewart Living Omnimedia, Inc. and Charles Koppelman (incorporated by reference to Exhibit 10.6 to our September 2008 10-Q). | ||
Table of Contents
Exhibit | Exhibit Title | |||
| 10.32† | — | Martha Stewart Living Omnimedia, Inc. Annual Incentive Plan (incorporated by reference to the Company’s proxy statement filed in respect of its 2005 annual meeting of stockholders, dated as of April 7, 2005). | ||
| 10.33† | — | Form of Martha Stewart Living Omnimedia, Inc. Indemnification Agreement for Directors (incorporated by reference to Exhibit 10.1 to our June 2011 10-Q). | ||
| 10.34† | — | Employment Agreement, dated as of May 24, 2011, between Martha Stewart Living Omnimedia, Inc. and Lisa Gersh (incorporated by reference to Exhibit 10.3 to our June 2011 10-Q). | ||
| 10.35† | — | Employment Agreement, dated as of September 6, 2011, between Martha Stewart Living Omnimedia, Inc. and Kenneth P. West (incorporated by reference to Exhibit 10.4 to our September 2011 10-Q). | ||
| 10.36†* | — | Employment Agreement, dated as of August 22, 2011, between Martha Stewart Living Omnimedia, Inc. and Daniel Taitz. | ||
| 10.37 | — | Securities Purchase Agreement, dated as of December 6, 2011, by and between Martha Stewart Living Omnimedia, Inc. and J.C. Penney Corporation, Inc. (incorporated by reference to Exhibit 1 to the Schedule 13D (file number 001-15395) filed by J.C. Penney Company, Inc. on December 16, 2011). | ||
| 10.38† | — | Separation Agreement and General Release, dated as of September 13, 2011, between Martha Stewart Living Omnimedia, Inc. and Peter Hurwitz (incorporated by reference to Exhibit 10.5 to our September 2011 10-Q). | ||
| 10.39*+ | — | JCP/MSLO Agreement, dated as of December 6, 2011, by and between J.C. Penney Corporation, Inc. and Martha Stewart Living Omnimedia, Inc., as amended by Exhibit 10.39.1. | ||
| 10.39.1* | — | First Amendment, dated as of January 4, 2012, to the JCP/MSLO Agreement, dated as of December 6, 2011, by and between J.C. Penney Corporation, Inc. and Martha Stewart Living Omnimedia, Inc. | ||
| 21* | — | List of Subsidiaries. | ||
| 23.1* | — | Consent of Independent Registered Public Accounting Firm. | ||
| 31.1* | — | Certification of Principal Executive Officer Pursuant to Section 302 of the Sarbanes-Oxley Act of 2002. | ||
| 31.2* | — | Certification of Principal Financial Officer Pursuant to Section 302 of the Sarbanes-Oxley Act of 2002. | ||
| 32* | — | Certification of Principal Executive Officer and Chief Financial Officer Pursuant to Section 906 of the Sarbanes-Oxley Act of 2002. | ||
| 101.INS *** | XBRL Instance Document | |||
| 101.SCH *** | XBRL Taxonomy Extension Schema Document | |||
| 101.CAL *** | XBRL Taxonomy Extension Calculation Linkbase Document | |||
| 101.DEF *** | XBRL Taxonomy Extension Definition Linkbase Document | |||
| 101.LAB *** | XBRL Taxonomy Extension Label Linkbase Document | |||
| 101.PRE *** | XBRL Taxonomy Extension Presentation Linkbase Document | |||
| † | Indicates management contracts and compensatory plans. |
Table of Contents
| + | Indicates that confidential treatment has been requested as to certain portions of this exhibit pursuant to Rule 24b-2 of the Securities Exchange Act of 1934, as amended. |
| * | Indicates filed herewith. |
| ** | Schedules and exhibits to this Agreement have been omitted. The Company agrees to furnish a supplemental copy of any omitted schedule or exhibit to the Securities and Exchange Commission upon request. |
| *** | In accordance with Rule 406T of Regulation S-T, these XBRL (eXtensible Business Reporting Language) documents are furnished and not filed or a part of a registration statement or prospectus for purposes of Sections 11 or 12 of the Securities Act of 1933 or Section 18 of the Securities Exchange Act of 1934 and otherwise are not subject to liability under these sections. |