UNITED STATES
SECURITIES AND EXCHANGE COMMISSION
WASHINGTON, D.C. 20549
FORM N-CSR
CERTIFIED SHAREHOLDER REPORT OF REGISTERED MANAGEMENT
INVESTMENT COMPANIES
Investment Company Act file number 811-9545
Seligman Asset Allocation Series, Inc.
(Exact name of Registrant as specified in charter)
734 Ameriprise Financial Center
Minneapolis, MN 55474
(Address of principal executive offices) (Zip code)
Lawrence P. Vogel
100 Park Avenue
New York, New York 10017
(Name and address of agent for service)
Registrant’s telephone number, including area code: (212) 850-1864
Date of fiscal year end: 12/31
Date of reporting period: 12/31/08
ITEM 1. | REPORTS TO STOCKHOLDERS. |
Seligman
Asset Allocation Series, Inc.
Seligman Asset Allocation Aggressive Growth Fund
Seligman Asset Allocation Growth Fund
Seligman Asset Allocation Moderate Growth Fund
Seligman Asset Allocation Balanced Fund
Annual Report
December 31, 2008
Asset Allocation Strategies
Seeking to Manage Risk
Over Time
Table of Contents
|
|
2 | |
|
|
4 | |
|
|
10 | |
|
|
11 | |
|
|
13 | |
|
|
15 | |
|
|
17 | |
|
|
18 | |
|
|
20 | |
|
|
34 | |
|
|
50 | |
|
|
51 | |
|
|
52 | |
|
|
58 | |
|
|
59 | |
|
|
63 |
1
Interview With Your Portfolio Manager
Charles W. Kadlec
|
|
Q: | How did Seligman Asset Allocation Series, Inc. perform for the year ended December 31, 2008? |
|
|
A: | For the year ended December 31, 2008, based on the net asset value of each Fund’s Class A shares, Seligman Asset Allocation Aggressive Growth Fund posted a total return of -45.8%, Seligman Asset Allocation Growth Fund posted -45.5%, Seligman Asset Allocation Moderate Growth Fund posted -45.0%, and Seligman Asset Allocation Balanced Fund posted -36.0%. |
|
|
| During the same period, the Dow Jones Aggressive Portfolio Index, the benchmark for both Seligman Asset Allocation Aggressive Growth Fund and Seligman Asset Allocation Growth Fund, posted -40.7%. The Dow Jones Moderately Aggressive Portfolio Index, the benchmark for Seligman Asset Allocation Moderate Growth Fund, posted -33.2%. The Dow Jones Moderate Portfolio Index, the benchmark for Seligman Asset Allocation Balanced Fund, posted -24.8%. |
|
|
Q: | What market conditions and events materially affected the performance of the Funds for the year ended December 31, 2008? |
|
|
A: | During the period under review, markets around the world were characterized by extreme turmoil and historical levels of negative performance as repercussions of the US subprime lending crisis spread beyond domestic residential real estate and triggered previously inconceivable business failures, loss of liquidity in the credit markets, and government intervention. Uncertainty caused by these events was heightened by continuing concerns about escalating energy prices during the first part of the year, and then by growing concerns about a deflation-ary cycle during the latter part. Against a backdrop of continuing global political unrest — as well as a sensational scandal in the domestic financial markets at year-end — these market conditions adversely affected every asset class in which the Funds invest, with the exception of US government securities and investment grade fixed income. |
|
|
Q: | What investment strategies or techniques materially affected the Funds’ performances during the year? |
|
|
A: | The Funds’ investment strategy is designed to provide investors with broad diversification across a variety of equity, real estate and fixed-income securities. Such diversification typically can help a Fund limit downside risk because poor returns in some asset classes may be offset by higher returns in others. However, the strategy proved ineffective during the year because of the nearly all-inclusive negative performance from Underlying Seligman mutual funds as well as the asset classes in which the Funds invest. |
|
|
| Asset class performance during the year is noteworthy in two respects. First was the severity of the negative returns delivered by all but two of the asset classes in which the Funds invest (U.S. government securities and investment grade fixed income). With returns ranging from approximately -26% (high-yield bonds) to -53% (emerging markets equities), a number of asset classes established their worst calendar-year return in history. Second, and especially relevant for the Funds’ performance, was the degree to which major asset classes plummeted in lock-step, thereby minimizing the benefits typically produced by prudent diversification. Correlation, a statistical measure that indicates whether asset classes have tended to perform alike, provides a means of gauging |
2
Interview With Your Portfolio Manager
Charles W. Kadlec
|
|
| why the Fund’s diversification strategy faltered during the year. A correlation of 100% means that two asset classes move up and down identically, while a correlation of zero means their relative movements have no relationships or are random. The lower the correlation, the greater the diversification. One example is particularly illustrative: The long-term historical correlation between US small-cap stocks and high-yield bonds had been less than 50% prior to 2008; however, during this past year, it ballooned to more than 90%. |
|
|
| Poor asset class performance was exacerbated overall by underperformance from several Underlying Funds. For example, Seligman International Growth Fund, which is an Underlying Fund in each of the Funds, returned -57.9% for the year, significantly below the MSCI EAFE Index, which is a widely recognized proxy for international large-cap stocks. And the potential for fixed income investments to buffer negative equity performance was diminished by the relative underperformance of all three fixed-income Underlying Funds. |
|
|
| Despite the poor results delivered during the year, we believe our investment process will reward genuine long-term investors who are willing to stay invested through periods of volatility and market aberrations like we experienced during 2008. For example, during the first 20 days of January 2009, small-cap stocks were down 13.2%, but Seligman High Yield Fund had a positive 5.8% total return. Our investment process does not shift our allocations in an attempt to time short term swings in the relative performance among the various asset classes in which we invest. Instead, we use the cash inflows and outflows of the Funds to continuously rebalance toward our target allocations. This approach reduces to the extent possible both transaction costs and the generation of taxable gains. It also provides discipline to add to positions that are weak relative to other parts of the portfolio at what we believe will prove to be relatively attractive prices. |
|
The views and opinions expressed are those of the Portfolio Manager(s), are provided for general information only, and do not constitute specific tax, legal, or investment advice to, or recommendations for, any person. There can be no guarantee as to the accuracy of market forecasts. Opinions, estimates, and forecasts may be changed without notice. |
|
|
| Portfolio Management |
|
|
| Seligman Asset Allocation Series, Inc. is managed by Charles W. Kadlec. Mr. Kadlec is the architect of several investment strategies, chief among them Seligman Time Horizon Matrix and Seligman Harvester. |
3
This section of the report is intended to help you understand the performance of each Fund of Seligman Asset Allocation Series and to provide a summary of each Fund’s portfolio characteristics.
Performance data quoted in this report represents past performance and does not guarantee or indicate future investment results. The rates of return will vary and the principal value of an investment will fluctuate. Shares, if redeemed, may be worth more or less than their original cost. Current performance may be lower or higher than the performance data quoted. Total returns of each Fund as of the most recent month end will be made available at www.seligman.com1 by the seventh business day following that month end. Calculations assume reinvestment of distributions, if any. Performance data quoted does not reflect the deduction of taxes that an investor may pay on distributions or the redemption of shares. The Funds’ manager waived certain fees and reimbursed certain expenses of each Fund other than distribution and service (12b-1) fees, as described in the Series’ prospectus. Absent such waivers and reimbursements, returns and yields would have been lower.
The chart for each Fund compares a $10,000 hypothetical investment made in Class A shares, with and without the initial 5.75% maximum sales charge, to $10,000 investments made in its benchmarks since each Fund’s commencement of operations through December 31, 2008. The performance of Class B and Class C shares, which commenced on later dates, and of Class A, Class B and Class C shares for other periods, with and without applicable sales charges and contingent deferred sales charges (“CDSCs”), is not shown in the chart but is included in the total returns table that follows the chart. The performance of Class B and Class C shares will differ from the performance shown for Class A shares based on the differences in sales charges and fees paid by shareholders.
Returns for Class A shares are calculated with and without the effect of the initial 5.75% maximum sales charge that became effective on January 7, 2008. Returns for Class B shares are calculated with and without the effect of the maximum 5% CDSC, charged on redemptions made within one year of the date of purchase, declining to 1% in the sixth year and 0% thereafter. Returns for Class B shares since inception reflect automatic conversion to Class A shares approximately eight years after their date of purchase. Returns for Class C shares are calculated with and without the effect of the 1% CDSC, charged on redemptions made within one year of purchase. Returns for Class C shares would have been lower for periods prior to June 4, 2007 if the 1% initial sales charge then in effect was incurred. On May 16, 2008, Class D shares of the Funds were converted to Class C shares at their respective net asset values. Effective at the close of business on May 16, 2008, Class D shares are no longer offered by the Funds.
An investment in a Fund is not a deposit in a bank and is not insured or guaranteed by the Federal Deposit Insurance Corporation or any other government agency.
|
|
1 | The website reference is an inactive textual reference and information contained in or otherwise accessible through the web-site does not form a part of this report or the Series’ prospectus or statement of additional information. |
4
Performance Overview
Seligman Asset Allocation Aggressive Growth Fund
|
Investment Results |
Total Returns |
For Periods Ended December 31, 2008 |
|
|
|
|
|
|
|
|
|
|
|
|
|
|
|
|
|
|
| Average Annual | |||||||||
|
|
|
| ||||||||||
|
| Six Months* |
| One Year |
| Five Years |
| Since Inception† |
| ||||
Class A |
|
|
|
|
|
|
|
|
|
|
|
|
|
With Sales Charge |
| (43.96 | )% |
| (48.93 | )% |
| (3.02 | )% |
| (3.61 | )% |
|
Without Sales Charge |
| (40.54 | ) |
| (45.80 | ) |
| (1.86 | ) |
| (2.97 | ) |
|
Class B |
|
|
|
|
|
|
|
|
|
|
|
|
|
With CDSC# |
| (43.41 | ) |
| (48.59 | ) |
| (2.91 | ) |
| n/a |
|
|
Without CDSC |
| (40.73 | ) |
| (46.15 | ) |
| (2.58 | ) |
| (4.15 | )## |
|
Class C |
|
|
|
|
|
|
|
|
|
|
|
|
|
With 1% CDSC |
| (41.27 | ) |
| (46.64 | ) |
| n/a |
|
| n/a |
|
|
Without CDSC |
| (40.73 | ) |
| (46.15 | ) |
| (2.58 | ) |
| (3.67 | ) |
|
Benchmarks** |
|
|
|
|
|
|
|
|
|
|
|
|
|
Dow Jones Aggressive Portfolio Index (Global Series) |
| (33.94 | ) |
| (40.69 | ) |
| 0.21 |
|
| (0.34 | )†† |
|
Lipper Fund of Funds (Affiliated) Average |
| (25.35 | ) |
| (30.85 | ) |
| (0.76 | ) |
| 0.01 |
|
|
Lipper Multi-Cap Core Funds Average |
| (31.60 | ) |
| (38.81 | ) |
| (2.61 | ) |
| (1.25 | ) |
|
|
|
|
|
|
|
|
|
|
|
|
|
|
|
|
|
|
Net Asset Value Per Share |
|
|
|
|
|
|
|
|
|
|
|
|
|
|
|
|
| ||||||||||||||||
|
| 12/31/08 |
| 6/30/08 |
| 12/31/07 |
| |||||||||
Class A |
|
| $ | 4.34 |
|
|
| $ | 8.03 |
|
|
| $ | 8.81 |
|
|
Class B |
|
|
| 4.10 |
|
|
|
| 7.65 |
|
|
|
| 8.42 |
|
|
Class C |
|
|
| 4.10 |
|
|
|
| 7.65 |
|
|
|
| 8.42 |
|
|
|
See footnotes on page 9. |
5
Performance Overview
Seligman Asset Allocation Growth Fund
|
Investment Results |
Total Returns |
For Periods Ended December 31, 2008 |
|
|
|
|
|
|
|
|
|
|
|
|
|
|
|
|
|
|
| Average Annual | |||||||||
|
|
|
| ||||||||||
|
| Six Months* |
| One Year |
| Five Years |
| Since Inception† |
| ||||
Class A |
|
|
|
|
|
|
|
|
|
|
|
|
|
With Sales Charge |
| (43.49 | )% |
| (48.63 | )% |
| (3.30 | )% |
| (3.78 | )% |
|
Without Sales Charge |
| (40.01 | ) |
| (45.51 | ) |
| (2.14 | ) |
| (3.14 | ) |
|
Class B |
|
|
|
|
|
|
|
|
|
|
|
|
|
With CDSC# |
| (42.83 | ) |
| (48.28 | ) |
| (3.21 | ) |
| n/a |
|
|
Without CDSC |
| (40.29 | ) |
| (45.98 | ) |
| (2.91 | ) |
| (4.44 | )## |
|
Class C |
|
|
|
|
|
|
|
|
|
|
|
|
|
With 1% CDSC |
| (40.79 | ) |
| (46.44 | ) |
| n/a |
|
| n/a |
|
|
Without CDSC |
| (40.29 | ) |
| (45.98 | ) |
| (2.91 | ) |
| (3.90 | ) |
|
Benchmarks** |
|
|
|
|
|
|
|
|
|
|
|
|
|
Dow Jones Aggressive Portfolio Index (Global Series) |
| (33.94 | ) |
| (40.69 | ) |
| 0.21 |
|
| (0.34 | )†† |
|
Lipper Fund of Funds (Affiliated) Average |
| (25.35 | ) |
| (30.85 | ) |
| (0.76 | ) |
| 0.01 |
|
|
Lipper Multi-Cap Core Funds Average |
| (31.60 | ) |
| (38.81 | ) |
| (2.61 | ) |
| (1.25 | ) |
|
|
|
|
|
|
|
|
|
|
|
|
|
|
|
|
|
|
Net Asset Value Per Share |
|
|
|
|
|
|
|
|
|
|
|
|
|
|
|
|
| ||||||||||||||||
|
| 12/31/08 |
| 6/30/08 |
| 12/31/07 |
| |||||||||
Class A |
|
| $ | 3.94 |
|
|
| $ | 7.63 |
|
|
| $ | 8.40 |
|
|
Class B |
|
|
| 3.67 |
|
|
|
| 7.21 |
|
|
|
| 7.97 |
|
|
Class C |
|
|
| 3.67 |
|
|
|
| 7.21 |
|
|
|
| 7.97 |
|
|
|
See footnotes on page 9. |
6
Performance Overview
Seligman Asset Allocation Moderate Growth Fund
|
Investment Results |
Total Returns |
For Periods Ended December 31, 2008 |
|
|
|
|
|
|
|
|
|
|
|
|
|
|
|
|
|
|
| Average Annual | |||||||||
|
|
|
| ||||||||||
|
| Six Months* |
| One Year |
| Five Years |
| Since Inception† |
| ||||
Class A |
|
|
|
|
|
|
|
|
|
|
|
|
|
With Sales Charge |
| (43.51 | )% |
| (48.12 | )% |
| (4.14 | )% |
| (4.14 | )% |
|
Without Sales Charge |
| (40.09 | ) |
| (44.98 | ) |
| (2.99 | ) |
| (3.50 | ) |
|
Class B |
|
|
|
|
|
|
|
|
|
|
|
|
|
With CDSC# |
| (42.89 | ) |
| (47.77 | ) |
| (4.06 | ) |
| n/a |
|
|
Without CDSC |
| (40.31 | ) |
| (45.40 | ) |
| (3.74 | ) |
| (4.17 | )## |
|
Class C |
|
|
|
|
|
|
|
|
|
|
|
|
|
With 1% CDSC |
| (40.82 | ) |
| (45.87 | ) |
| n/a |
|
| n/a |
|
|
Without CDSC |
| (40.31 | ) |
| (45.40 | ) |
| (3.74 | ) |
| (4.24 | ) |
|
Benchmarks** |
|
|
|
|
|
|
|
|
|
|
|
|
|
Dow Jones Moderately Aggressive Portfolio Index (Global Series) |
| (27.45 | ) |
| (33.17 | ) |
| 1.15 |
|
| 1.05 | †† |
|
Lipper Fund of Funds (Affiliated) Average |
| (25.35 | ) |
| (30.85 | ) |
| (0.76 | ) |
| 0.01 |
|
|
Lipper Multi-Cap Core Funds Average |
| (31.60 | ) |
| (38.81 | ) |
| (2.61 | ) |
| (1.25 | ) |
|
|
|
|
|
|
|
|
|
|
|
|
|
|
|
|
|
|
Net Asset Value Per Share |
|
|
|
|
|
|
|
|
|
|
|
|
|
|
|
|
| ||||||||||||||||
|
| 12/31/08 |
| 6/30/08 |
| 12/31/07 |
| |||||||||
Class A |
|
| $ | 3.86 |
|
|
| $ | 7.43 |
|
|
| $ | 8.09 |
|
|
Class B |
|
|
| 3.77 |
|
|
|
| 7.29 |
|
|
|
| 7.97 |
|
|
Class C |
|
|
| 3.77 |
|
|
|
| 7.29 |
|
|
|
| 7.97 |
|
|
|
See footnotes on page 9. |
7
Performance Overview
Seligman Asset Allocation Balanced Fund
|
Investment Results |
Total Returns |
For Periods Ended December 31, 2008 |
|
|
|
|
|
|
|
|
|
|
|
|
|
|
|
|
|
|
| Average Annual | |||||||||
|
|
|
| ||||||||||
|
| Six Months* |
| One Year |
| Five Years |
| Since Inception† |
| ||||
Class A |
|
|
|
|
|
|
|
|
|
|
|
|
|
With Sales Charge |
| (36.02 | )% |
| (39.65 | )% |
| (4.09 | )% |
| (4.41 | )% |
|
Without Sales Charge |
| (32.10 | ) |
| (36.01 | ) |
| (2.96 | ) |
| (3.77 | ) |
|
Class B |
|
|
|
|
|
|
|
|
|
|
|
|
|
With CDSC# |
| (35.61 | ) |
| (39.53 | ) |
| (4.03 | ) |
| n/a |
|
|
Without CDSC |
| (32.38 | ) |
| (36.51 | ) |
| (3.69 | ) |
| (4.52 | )## |
|
Class C |
|
|
|
|
|
|
|
|
|
|
|
|
|
With 1% CDSC |
| (33.03 | ) |
| (37.12 | ) |
| n/a |
|
| n/a |
|
|
Without CDSC |
| (32.38 | ) |
| (36.51 | ) |
| (3.69 | ) |
| (4.52 | ) |
|
Benchmarks** |
|
|
|
|
|
|
|
|
|
|
|
|
|
Dow Jones Moderate Portfolio Index (Global Series) |
| (20.38 | ) |
| (24.75 | ) |
| 2.00 |
|
| 2.46 | †† |
|
Lipper Fund of Funds (Affiliated) Average |
| (25.35 | ) |
| (30.85 | ) |
| (0.76 | ) |
| 0.01 |
|
|
Lipper Mixed-Asset Target Allocation Moderate Funds Average |
| (20.51 | ) |
| (25.38 | ) |
| (0.36 | ) |
| 0.41 |
|
|
|
|
|
|
|
|
|
|
|
|
|
|
|
|
|
|
|
Net Asset Value Per Share |
|
|
|
|
|
|
|
|
|
|
|
|
|
|
|
|
| ||||||||||||||||
|
| 12/31/08 |
| 6/30/08 |
| 12/31/07 |
| |||||||||
Class A |
|
| $ | 3.80 |
|
|
| $ | 5.88 |
|
|
| $ | 6.30 |
|
|
Class B |
|
|
| 3.80 |
|
|
|
| 5.88 |
|
|
|
| 6.30 |
|
|
Class C |
|
|
| 3.80 |
|
|
|
| 5.88 |
|
|
|
| 6.30 |
|
|
|
See footnotes on page 9. |
8
|
|
|
* |
| Returns for periods of less than one year are not annualized. |
|
|
|
** |
| The Dow Jones Aggressive Portfolio Index (Global Series), the Dow Jones Moderately Aggressive Portfolio Index (Global Series) and the Dow Jones Moderate Portfolio Index (Global Series) (“Dow Jones Indices”), the Lipper Fund of Funds (Affiliated) Average, the Lipper Mixed-Asset Target Allocation Moderate Funds Average and the Lipper Multi-Cap Core Funds Average are unmanaged benchmarks that assume reinvestment of all distributions and exclude the effect of fees, taxes, and sales charges. The Dow Jones Indices also exclude the effect of expenses. The Dow Jones Aggressive Portfolio Index (Global Series) measures balanced and multi-asset-class portfolios with risk profiles that are set monthly at 100% of the current risk of an all-equity stock portfolio. The Dow Jones Moderately Aggressive Portfolio Index (Global Series) measures balanced and multi-asset-class portfolios with risk profiles that are set monthly at 80% of the current risk of an all-equity stock portfolio. The Dow Jones Moderate Portfolio Index (Global Series) measures balanced and multi-asset-class portfolios with risk profiles that are set monthly at 60% of the current risk of an all-equity stock portfolio. The Lipper Fund of Funds (Affiliated) Average measures the performance of funds that invest 80% or more of their assets in mutual funds that are managed by an affiliated investment manager. The Lipper Mixed-Asset Target Allocation Moderate Funds Average measures the performance of funds that, by portfolio practice, maintain a mix of between 40% - 60% equity securities, with the remainder invested in bonds, cash and cash equivalents. The Lipper Multi-Cap Core Funds Average measures the performance of funds that, by portfolio practice, invest in a variety of market capitalization ranges without concentrating 75% of their equity assets in any one market capitalization range over an extended period of time. Multi-cap funds typically have between 25% and 75% of their assets invested in companies with market capitalizations (on a three-year weighted basis) above 300% of the dollar-weighted median market capitalization of the middle 1,000 securities of the S&P SuperComposite 1500 Index. Investors cannot invest directly in an index or average. |
|
|
|
# |
| The CDSC is 5% if you sell your shares within one year of purchase and 2% for the five-year period. |
|
|
|
## |
| Return for Class B shares since inception reflects automatic conversion to Class A shares approximately eight years after their date of purchase. |
|
|
|
† |
| Commencement of investment operations for Class A shares was 1/10/00. Class A share returns were computed from the commencement of investment operations. Class B and C shares were offered to the public on 1/10/00, but were first issued at the dates indicated below. Total returns for Class B and C shares of the Fund have been computed from the commencement of investment operations and incorporate the total return of Class A shares of the Fund from the commencement of investment operations through the initial issuance date of each of the other classes of shares, adjusted to reflect the higher expenses associated with the Administration, Shareholder Services and Distribution Plan for those classes that would have been incurred had they first been issued on the commencement of investment operations date. The total returns of Class B and C shares from their individual initial issuance dates would be different, and may be lower, than those shown above. |
|
|
|
|
|
|
|
|
|
| Class B |
| Class C |
| ||
Aggressive Growth Fund |
|
| 4/24/00 |
|
| 2/8/00 |
|
Growth Fund |
|
| 3/21/00 |
|
| 1/18/00 |
|
Moderate Growth Fund |
|
| 2/18/00 |
|
| 3/6/00 |
|
Balanced Fund |
|
| 2/17/00 |
|
| 1/18/00 |
|
|
|
†† | From December 31, 1999. |
9
Seligman Asset Allocation Aggressive Growth Fund
|
|
|
|
|
|
|
|
Allocation to Underlying Funds |
| Percent of Portfolio |
| ||||
|
| 2008 |
| 2007 |
| ||
Domestic Equity Funds |
|
| 60.4 |
|
| 60.1 |
|
Global Equity Funds |
|
| 34.6 |
|
| 35.0 |
|
REIT Fund |
|
| 5.0 |
|
| 4.9 |
|
Total |
|
| 100.0 |
|
| 100.0 |
|
|
|
|
|
|
|
|
|
Seligman Asset Allocation Growth Fund |
|
| |||||
|
|
|
| ||||
Allocation to Underlying Funds |
| Percent of Portfolio |
| ||||
|
| 2008 |
| 2007 |
| ||
Domestic Equity Funds |
|
| 58.1 |
|
| 57.8 |
|
Global Equity Funds |
|
| 31.9 |
|
| 32.2 |
|
REIT Fund |
|
| 10.0 |
|
| 10.0 |
|
Total |
|
| 100.0 |
|
| 100.0 |
|
|
|
|
|
|
|
|
|
Seligman Asset Allocation Moderate Growth Fund |
|
| |||||
|
|
|
| ||||
Allocation to Underlying Funds |
| Percent of Portfolio |
| ||||
|
| 2008 |
| 2007 |
| ||
Domestic Equity Funds |
|
| 55.4 |
|
| 55.7 |
|
Fixed Income Fund |
|
| 9.8 |
|
| 10.0 |
|
Global Equity Funds |
|
| 25.0 |
|
| 24.6 |
|
REIT Fund |
|
| 9.8 |
|
| 9.7 |
|
Total |
|
| 100.0 |
|
| 100.0 |
|
|
|
|
|
|
|
|
|
Seligman Asset Allocation Balanced Fund |
|
|
|
|
|
|
|
|
|
|
| ||||
Allocation to Underlying Funds |
| Percent of Portfolio |
| ||||
|
| 2008 |
| 2007 |
| ||
Domestic Equity Funds |
|
| 45.3 |
|
| 45.2 |
|
Fixed Income Funds |
|
| 28.9 |
|
| 29.9 |
|
Global Equity Fund |
|
| 9.8 |
|
| 10.2 |
|
REIT Fund |
|
| 16.0 |
|
| 14.7 |
|
Total |
|
| 100.0 |
|
| 100.0 |
|
10
Understanding and Comparing
Your Fund’s Expenses
As a shareholder of a Fund of the Series, you incur ongoing expenses, such as management fees, distribution and service (12b-1) fees, and other Fund expenses. The information below is intended to help you understand your ongoing expenses (in dollars) of investing in a Fund and to compare them with the ongoing expenses of investing in other mutual funds. Please note that the expenses shown in the table are meant to highlight your ongoing expenses only and do not reflect the operating expenses of the Underlying Funds, or any transactional costs, such as sales charges (also known as loads) on certain purchases or redemptions. Therefore, the table is useful in comparing ongoing expenses only, and will not help you determine the relative total expenses of owning different funds. In addition, if Underlying Fund expenses and transactional costs were included, your total expenses would have been higher.
The table is based on an investment of $1,000 invested at the beginning of July 1, 2008 and held for the entire six-month period ended December 31, 2008.
Actual Expenses
The table below provides information about actual expenses and actual account values. You may use the information, together with the amount you invested, to estimate the expenses that you paid over the period. Simply divide your account value at the beginning of the period by $1,000 (for example, an $8,600 account value divided by $1,000 = 8.6), then multiply the result by the number under the heading entitled “Expenses Paid During Period” for the share class of the Fund you own to estimate the expenses you paid on your account during the period.
Hypothetical Example for Comparison Purposes
The table below also provides information about hypothetical expenses and hypothetical account values based on the actual expense ratio of each Fund and an assumed rate of return of 5% per year before expenses, which is not the actual return of any Fund. The hypothetical expenses and account values may not be used to estimate the ending account value or the actual expenses you paid for the period. You may use this information to compare the ongoing expenses of investing in a Fund and other mutual funds. To do so, compare this 5% hypothetical example with the 5% hypothetical examples that appear in the shareholder reports of the other mutual funds.
(Continued on next page.)
11
Understanding and Comparing
Your Fund’s Expenses (continued)
|
|
|
|
|
|
|
|
|
|
|
|
|
|
|
|
|
|
|
|
|
|
|
|
|
|
|
|
|
|
|
| Actual |
| Hypothetical |
| ||||||||||||
|
|
|
|
|
|
|
|
|
| ||||||||||||||
Fund |
| Beginning |
| Annualized |
| Ending |
| Expenses Paid |
| Ending |
| Expenses Paid |
| ||||||||||
Aggressive Growth Fund |
|
|
|
|
|
|
|
|
|
|
|
|
|
|
|
|
| ||||||
Class A |
| $ | 1,000.00 |
| 0.39 | % |
| $ | 594.60 |
|
| $ | 1.57 |
|
| $ | 1,023.17 |
|
| $ | 1.99 |
|
|
Class B |
|
| 1,000.00 |
| 1.15 |
|
|
| 592.70 |
|
|
| 4.60 |
|
|
| 1,019.36 |
|
|
| 5.83 |
|
|
Class C |
|
| 1,000.00 |
| 1.15 |
|
|
| 592.70 |
|
|
| 4.60 |
| �� |
| 1,019.36 |
|
|
| 5.83 |
|
|
Growth Fund |
|
|
|
|
|
|
|
|
|
|
|
|
|
|
|
|
|
|
|
|
|
|
|
Class A |
|
| 1,000.00 |
| 0.39 |
|
|
| 599.90 |
|
|
| 1.57 |
|
|
| 1,023.17 |
|
|
| 1.99 |
|
|
Class B |
|
| 1,000.00 |
| 1.15 |
|
|
| 597.10 |
|
|
| 4.63 |
|
|
| 1,019.34 |
|
|
| 5.85 |
|
|
Class C |
|
| 1,000.00 |
| 1.15 |
|
|
| 597.10 |
|
|
| 4.63 |
|
|
| 1,019.34 |
|
|
| 5.85 |
|
|
Moderate Growth Fund |
|
|
|
|
|
|
|
|
|
|
|
|
|
|
|
|
|
|
|
|
|
|
|
Class A |
|
| 1,000.00 |
| 0.25 |
|
|
| 599.10 |
|
|
| 0.99 |
|
|
| 1,023.90 |
|
|
| 1.25 |
|
|
Class B |
|
| 1,000.00 |
| 1.01 |
|
|
| 596.90 |
|
|
| 4.04 |
|
|
| 1,020.07 |
|
|
| 5.12 |
|
|
Class C |
|
| 1,000.00 |
| 1.01 |
|
|
| 596.90 |
|
|
| 4.04 |
|
|
| 1,020.07 |
|
|
| 5.12 |
|
|
Balanced Fund |
|
|
|
|
|
|
|
|
|
|
|
|
|
|
|
|
|
|
|
|
|
|
|
Class A |
|
| 1,000.00 |
| 0.26 |
|
|
| 679.00 |
|
|
| 1.11 |
|
|
| 1,023.81 |
|
|
| 1.34 |
|
|
Class B |
|
| 1,000.00 |
| 1.01 |
|
|
| 676.20 |
|
|
| 4.24 |
|
|
| 1,020.08 |
|
|
| 5.11 |
|
|
Class C |
|
| 1,000.00 |
| 1.01 |
|
|
| 676.20 |
|
|
| 4.24 |
|
|
| 1,020.08 |
|
|
| 5.11 |
|
|
|
|
* | Expenses of Class B and Class C shares are higher than expenses of Class A shares due to the higher 12b-1 fees paid by Class B and Class C shares. See the Series’ prospectus for a description of each share class and its expenses and sale charges. The Funds’ manager waived its investment management fee and/or reimbursed a portion of each Fund’s expenses, other than distribution and service (12b-1) fees, as described in Note 4. Absent such waiver/reimbursement, the expense ratios and expenses paid for the period would have been higher. |
|
|
** | Expenses are equal to each Fund’s annualized expense ratio based on actual expenses for the period July 1, 2008 to December 31, 2008, multiplied by the average account value over the period, multiplied by 184/366 (number of days in the period). |
12
|
December 31, 2008 |
|
Seligman Asset Allocation Aggressive Growth Fund† |
|
|
|
|
|
|
|
|
|
| Shares |
| Value |
| ||
Domestic Equity Funds 60.9% |
|
|
|
|
|
|
|
Seligman Capital Fund* |
|
| 185,073 |
| $ | 2,481,829 |
|
Seligman Communications and Information Fund* |
|
| 73,832 |
|
| 1,790,426 |
|
Seligman Frontier Fund* |
|
| 50,345 |
|
| 343,856 |
|
Seligman Growth Fund* |
|
| 115,202 |
|
| 336,390 |
|
Seligman Large-Cap Value Fundø |
|
| 34,533 |
|
| 337,387 |
|
Seligman Smaller-Cap Value Fund*ø |
|
| 161,424 |
|
| 1,489,944 |
|
|
|
|
|
|
| 6,779,832 |
|
Global Equity Funds 34.8% |
|
|
|
|
|
|
|
Seligman Emerging Markets Fund*ø |
|
| 169,674 |
|
| 1,107,971 |
|
Seligman Global Smaller Companies Fund*ø |
|
| 270,524 |
|
| 2,234,529 |
|
Seligman International Growth Fund* |
|
| 73,064 |
|
| 539,212 |
|
|
|
|
|
|
| 3,881,712 |
|
REIT Fund 5.0% |
|
|
|
|
|
|
|
Seligman LaSalle Global Real Estate Fund |
|
| 196,031 |
|
| 558,688 |
|
Total Investments In Underlying Funds (Cost $17,388,222) 100.7% |
|
|
|
|
| 11,220,232 |
|
Other Assets Less Liabilities (0.7)% |
|
|
|
|
| (82,792 | ) |
Net Assets 100.0% |
|
|
|
| $ | 11,137,440 |
|
|
|
|
|
|
|
|
|
Seligman Asset Allocation Growth Fund† |
|
|
|
|
|
|
|
|
|
|
|
|
|
|
|
|
| Shares |
| Value |
| ||
Domestic Equity Funds 57.9% |
|
|
|
|
|
|
|
Seligman Capital Fund* |
|
| 203,533 |
| $ | 2,729,377 |
|
Seligman Communications and Information Fund* |
|
| 73,610 |
|
| 1,785,042 |
|
Seligman Frontier Fund* |
|
| 80,113 |
|
| 547,172 |
|
Seligman Growth Fund* |
|
| 551,600 |
|
| 1,610,672 |
|
Seligman Large-Cap Value Fundø |
|
| 167,025 |
|
| 1,631,834 |
|
Seligman Smaller-Cap Value Fund*ø |
|
| 237,909 |
|
| 2,195,900 |
|
|
|
|
|
|
| 10,499,997 |
|
Global Equity Funds 31.8% |
|
|
|
|
|
|
|
Seligman Emerging Markets Fund*ø |
|
| 276,341 |
|
| 1,804,507 |
|
Seligman Global Smaller Companies Fund*ø |
|
| 371,361 |
|
| 3,067,442 |
|
Seligman International Growth Fund* |
|
| 120,460 |
|
| 888,995 |
|
|
|
|
|
|
| 5,760,944 |
|
REIT Fund 9.9% |
|
|
|
|
|
|
|
Seligman LaSalle Global Real Estate Fund |
|
| 631,433 |
|
| 1,799,584 |
|
Total Investments In Underlying Funds (Cost $28,439,672) 99.6% |
|
|
|
|
| 18,060,525 |
|
Money Market Fund 0.4% |
|
|
|
|
|
|
|
SSgA U.S. Treasury Money Market Fund (Cost $66,055) |
|
| 66,055 |
|
| 66,055 |
|
Total Investments (Cost $28,505,727) 100.0% |
|
|
|
|
| 18,126,580 |
|
Other Assets Less Liabilities 0.0% |
|
|
|
|
| 7,329 |
|
Net Assets 100.0% |
|
|
|
| $ | 18,133,909 |
|
|
|
|
|
|
|
|
|
See footnotes on page 14. |
13
|
Portfolios of Investments |
December 31, 2008 |
|
Seligman Asset Allocation Moderate Growth Fund† |
|
|
|
|
|
|
|
|
|
| Shares |
| Value |
| ||
Domestic Equity Funds 55.8% |
|
|
|
|
|
|
|
Seligman Capital Fund* |
|
| 293,745 |
| $ | 3,939,121 |
|
Seligman Communications and Information Fund* |
|
| 79,713 |
|
| 1,933,040 |
|
Seligman Growth Fund* |
|
| 597,421 |
|
| 1,744,469 |
|
Seligman Large-Cap Value Fundø |
|
| 180,900 |
|
| 1,767,393 |
|
Seligman Smaller-Cap Value Fund*ø |
|
| 150,253 |
|
| 1,386,835 |
|
|
|
|
|
|
| 10,770,858 |
|
Fixed-Income Fund 9.9% |
|
|
|
|
|
|
|
Seligman High-Yield Fund |
|
| 986,921 |
|
| 1,914,627 |
|
Global Equity Funds 25.1% |
|
|
|
|
|
|
|
Seligman Emerging Markets Fund*ø |
|
| 149,462 |
|
| 975,987 |
|
Seligman Global Smaller Companies Fund*ø |
|
| 236,411 |
|
| 1,952,755 |
|
Seligman International Growth Fund* |
|
| 261,244 |
|
| 1,927,981 |
|
|
|
|
|
|
| 4,856,723 |
|
REIT Fund 9.9% |
|
|
|
|
|
|
|
Seligman LaSalle Global Real Estate Fund |
|
| 668,560 |
|
| 1,905,396 |
|
Total Investments In Underlying Funds (Cost $30,224,180) 100.7% |
|
|
|
|
| 19,447,604 |
|
Other Assets Less Liabilities (0.7)% |
|
|
|
|
| (129,150 | ) |
Net Assets 100.0% |
|
|
|
| $ | 19,318,454 |
|
|
|
|
|
|
|
|
|
Seligman Asset Allocation Balanced Fund† |
|
|
|
|
|
|
|
|
|
|
|
|
|
|
|
|
| Shares |
| Value |
| ||
Domestic Equity Funds 46.6% |
|
|
|
|
|
|
|
Seligman Capital Fund* |
|
| 75,759 |
| $ | 1,015,928 |
|
Seligman Common Stock Fundø |
|
| 184,116 |
|
| 1,108,378 |
|
Seligman Growth Fund* |
|
| 413,144 |
|
| 1,206,381 |
|
Seligman Large-Cap Value Fundø |
|
| 124,698 |
|
| 1,218,300 |
|
|
|
|
|
|
| 4,548,987 |
|
Fixed-Income Funds 29.7% |
|
|
|
|
|
|
|
Seligman Cash Management Fund |
|
| 483,723 |
|
| 483,723 |
|
Seligman Core Fixed Income Fund |
|
| 146,361 |
|
| 957,201 |
|
Seligman High-Yield Fund |
|
| 506,516 |
|
| 982,641 |
|
Seligman U.S. Government Securities Fund |
|
| 65,723 |
|
| 482,407 |
|
|
|
|
|
|
| 2,905,972 |
|
Global Equity Fund 10.1% |
|
|
|
|
|
|
|
Seligman International Growth Fund* |
|
| 134,181 |
|
| 990,256 |
|
REIT Fund 16.4% |
|
|
|
|
|
|
|
Seligman LaSalle Monthly Dividend Real Estate Fund |
|
| 523,887 |
|
| 1,603,094 |
|
Total Investments In Underlying Funds (Cost $13,325,034) 102.8% |
|
|
|
|
| 10,048,309 |
|
Money Market Fund 0.5% |
|
|
|
|
|
|
|
SSgA U.S. Treasury Money Market Fund (Cost $44,031) |
|
| 44,031 |
|
| 44,031 |
|
Total Investments (Cost $13,369,065) 103.3% |
|
|
|
|
| 10,092,340 |
|
Other Assets Less Liabilities (3.3)% |
|
|
|
|
| (320,517 | ) |
Net Assets 100.0% |
|
|
|
| $ | 9,771,823 |
|
|
|
† | The Fund and each of the investment companies in which the Fund invests may be deemed to be affiliates of one another (Note 8). |
|
|
* | Non-income producing security. |
|
|
ø | Security has paid capital gain distributions during the year ended December 31, 2008. |
|
|
See Notes to Financial Statements. |
14
Statements of Assets and Liabilities
December 31, 2008
|
|
|
|
|
|
|
|
|
|
|
|
|
|
|
| Seligman |
| Seligman |
| Seligman |
| Seligman |
| ||||
Assets: |
|
|
|
|
|
|
|
|
|
|
|
|
|
Investments, at value |
|
|
|
|
|
|
|
|
|
|
|
|
|
Underlying Funds |
| $ | 11,220,232 |
| $ | 18,060,525 |
| $ | 19,447,604 |
| $ | 10,048,309 |
|
Money Market Fund |
|
| — |
|
| 66,055 |
|
| — |
|
| 44,031 |
|
Total Investments* |
|
| 11,220,232 |
|
| 18,126,580 |
|
| 19,447,604 |
|
| 10,092,340 |
|
Cash |
|
| 9,762 |
|
| — |
|
| — |
|
| — |
|
Receivable for Capital Stock sold |
|
| 72,420 |
|
| 62,157 |
|
| 39,772 |
|
| 10,998 |
|
Prepaid registration fees |
|
| 17,236 |
|
| 17,436 |
|
| 17,436 |
|
| 17,186 |
|
Receivable from the Manager (Note 4) |
|
| 4,601 |
|
| 2,489 |
|
| 6,027 |
|
| 7,488 |
|
Dividends receivable |
|
| — |
|
| — |
|
| 9,446 |
|
| 5,972 |
|
Other |
|
| 914 |
|
| 1,318 |
|
| 1,493 |
|
| 690 |
|
Total Assets |
|
| 11,325,165 |
|
| 18,209,980 |
|
| 19,521,778 |
|
| 10,134,674 |
|
|
|
|
|
|
|
|
|
|
|
|
|
|
|
Liabilities: |
|
|
|
|
|
|
|
|
|
|
|
|
|
Payable for Capital Stock repurchased |
|
| 160,859 |
|
| 43,185 |
|
| 135,110 |
|
| 245,581 |
|
Distribution and service (12b-1) fees payable |
|
| 3,213 |
|
| 5,760 |
|
| 6,370 |
|
| 3,033 |
|
Bank overdraft |
|
| — |
|
| — |
|
| 30,755 |
|
| 78,100 |
|
Dividends payable |
|
| — |
|
| — |
|
| — |
|
| 14,262 |
|
Accrued expenses and other |
|
| 23,653 |
|
| 27,126 |
|
| 31,089 |
|
| 21,875 |
|
Total Liabilities |
|
| 187,725 |
|
| 76,071 |
|
| 203,324 |
|
| 362,851 |
|
Net Assets |
| $ | 11,137,440 |
| $ | 18,133,909 |
| $ | 19,318,454 |
| $ | 9,771,823 |
|
|
|
|
|
|
|
|
|
|
|
|
|
|
|
Composition of Net Assets: |
|
|
|
|
|
|
|
|
|
|
|
|
|
Capital Stock, at $0.001 par value: |
|
|
|
|
|
|
|
|
|
|
|
|
|
Class A |
| $ | 1,461 |
| $ | 2,305 |
| $ | 2,531 |
| $ | 1,278 |
|
Class B |
|
| 398 |
|
| 761 |
|
| 654 |
|
| 242 |
|
Class C |
|
| 773 |
|
| 1,709 |
|
| 1,881 |
|
| 1,049 |
|
Additional paid-in capital |
|
| 18,036,750 |
|
| 29,894,021 |
|
| 32,040,227 |
|
| 15,716,389 |
|
Dividends in excess of net investment |
|
| (517 | ) |
| (583 | ) |
| (615 | ) |
| (14,752 | ) |
Accumulated net realized loss (Note 6) |
|
| (733,435 | ) |
| (1,385,157 | ) |
| (1,949,648 | ) |
| (2,655,658 | ) |
Net unrealized depreciation of investments |
|
| (6,167,990 | ) |
| (10,379,147 | ) |
| (10,776,576 | ) |
| (3,276,725 | ) |
Net Assets |
| $ | 11,137,440 |
| $ | 18,133,909 |
| $ | 19,318,454 |
| $ | 9,771,823 |
|
|
|
|
|
|
|
|
|
|
|
|
|
|
|
*Cost of total investments: |
| $ | 17,388,222 |
| $ | 28,505,727 |
| $ | 30,224,180 |
| $ | 13,369,065 |
|
(Continued on page 16.)
15
Statements of Assets and Liabilities
December 31, 2008
|
|
|
|
|
|
|
|
|
|
|
|
|
|
|
|
|
|
|
|
|
|
|
|
|
|
|
|
|
| Seligman |
| Seligman |
| Seligman |
| Seligman |
| ||||
Net Assets: |
|
|
|
|
|
|
|
|
|
|
|
|
|
Class A |
| $ | 6,343,095 |
| $ | 9,071,823 |
| $ | 9,760,530 |
| $ | 4,862,791 |
|
Class B |
|
| 1,629,402 |
|
| 2,792,650 |
|
| 2,467,131 |
|
| 917,780 |
|
Class C |
|
| 3,164,943 |
|
| 6,269,436 |
|
| 7,090,793 |
|
| 3,991,252 |
|
|
|
|
|
|
|
|
|
|
|
|
|
|
|
Shares of Capital Stock Outstanding: |
|
|
|
|
|
|
|
|
|
|
|
|
|
Class A |
|
| 1,461,060 |
|
| 2,305,328 |
|
| 2,531,264 |
|
| 1,278,099 |
|
Class B |
|
| 397,777 |
|
| 761,201 |
|
| 654,883 |
|
| 241,236 |
|
Class C |
|
| 772,813 |
|
| 1,709,059 |
|
| 1,882,434 |
|
| 1,048,950 |
|
|
|
|
|
|
|
|
|
|
|
|
|
|
|
Net Asset Value per Share: |
|
|
|
|
|
|
|
|
|
|
|
|
|
Class A |
| $ | 4.34 |
| $ | 3.94 |
| $ | 3.86 |
| $ | 3.80 |
|
Class B |
| $ | 4.10 |
| $ | 3.67 |
| $ | 3.77 |
| $ | 3.80 |
|
Class C |
| $ | 4.10 |
| $ | 3.67 |
| $ | 3.77 |
| $ | 3.80 |
|
16
Statements of Operations
For the Year Ended December 31, 2008
|
|
|
|
|
|
|
|
|
|
|
|
|
|
|
| Seligman |
| Seligman |
| Seligman |
| Seligman |
| ||||
Investment Income: |
|
|
|
|
|
|
|
|
|
|
|
|
|
Dividends from Underlying Funds* |
| $ | 12,661 |
| $ | 41,646 |
| $ | 356,577 |
| $ | 349,305 |
|
Other |
|
| 75 |
|
| 128 |
|
| 155 |
|
| 70 |
|
Total Investment Income |
|
| 12,736 |
|
| 41,774 |
|
| 356,732 |
|
| 349,375 |
|
|
|
|
|
|
|
|
|
|
|
|
|
|
|
Expenses: |
|
|
|
|
|
|
|
|
|
|
|
|
|
Distribution and service (12b-1) fees |
|
| 61,577 |
|
| 110,440 |
|
| 131,524 |
|
| 61,933 |
|
Registration |
|
| 58,879 |
|
| 63,237 |
|
| 61,966 |
|
| 57,852 |
|
Auditing and legal fees |
|
| 22,700 |
|
| 28,143 |
|
| 30,555 |
|
| 18,989 |
|
Management fees |
|
| 19,124 |
|
| 28,506 |
|
| 32,079 |
|
| 14,984 |
|
Shareholder account services |
|
| 14,560 |
|
| 21,107 |
|
| 20,031 |
|
| 13,928 |
|
Custody and related services |
|
| 13,476 |
|
| 18,184 |
|
| 22,352 |
|
| 17,939 |
|
Shareholder reports and communications |
|
| 8,120 |
|
| 9,192 |
|
| 11,297 |
|
| 7,228 |
|
Directors’ fees and expenses |
|
| 1,659 |
|
| 2,229 |
|
| 2,459 |
|
| 1,402 |
|
Miscellaneous |
|
| 6,651 |
|
| 5,403 |
|
| 7,515 |
|
| 4,125 |
|
|
|
|
|
|
|
|
|
|
|
|
|
|
|
Total Expenses Before Waiver/Reimbursement |
|
| 206,746 |
|
| 286,441 |
|
| 319,778 |
|
| 198,380 |
|
Waiver/reimbursement of expenses (Note 4) |
|
| (68,672 | ) |
| (61,978 | ) |
| (108,056 | ) |
| (98,987 | ) |
Total Expenses After Waiver/Reimbursement |
|
| 138,074 |
|
| 224,463 |
|
| 211,722 |
|
| 99,393 |
|
Net Investment Income (Loss) |
|
| (125,338 | ) |
| (182,689 | ) |
| 145,010 |
|
| 249,982 |
|
|
|
|
|
|
|
|
|
|
|
|
|
|
|
Net Realized and Unrealized Gain (Loss) on Investments: |
|
|
|
|
|
|
|
|
|
|
|
|
|
Net realized gain (loss) on investments in Underlying Funds* |
|
| (112,044 | ) |
| 836,888 |
|
| 81,558 |
|
| (1,786,600 | ) |
Net change in unrealized appreciation of investments |
|
| (10,736,399 | ) |
| (16,538,084 | ) |
| (17,847,704 | ) |
| (4,658,851 | ) |
Net Loss on Investments |
|
| (10,848,443 | ) |
| (15,701,196 | ) |
| (17,766,146 | ) |
| (6,445,451 | ) |
Decrease in Net Assets from Operations |
| $ | (10,973,781 | ) | $ | (15,883,885 | ) | $ | (17,621,136 | ) | $ | (6,195,469 | ) |
|
|
* | Represents dividends (Note 8) and net realized gain from affiliated issuers. |
See Notes to Financial Statements.
17
Statements of Changes in Net Assets
|
|
|
|
|
|
|
|
|
|
|
|
|
|
|
| Seligman |
| Seligman |
| ||||||||
|
|
| |||||||||||
|
| Year Ended December 31, |
| Year Ended December 31, |
| ||||||||
|
|
| |||||||||||
|
| 2008 |
| 2007 |
| 2008 |
| 2007 |
| ||||
Operations: |
|
|
|
|
|
|
|
|
|
|
|
|
|
Net investment loss |
| $ | (125,338 | ) | $ | (145,621 | ) | $ | (182,689 | ) | $ | (205,383 | ) |
Net realized gain (loss) on investments and capital gain distributions from Underlying Funds |
|
| (112,044 | ) |
| 2,012,363 |
|
| 836,888 |
|
| 4,295,137 |
|
Net change in unrealized appreciation of investments |
|
| (10,736,399 | ) |
| 610,132 |
|
| (16,538,084 | ) |
| (546,262 | ) |
Increase (Decrease) in Net Assets from Operations |
|
| (10,973,781 | ) |
| 2,476,874 |
|
| (15,883,885 | ) |
| 3,543,492 |
|
Distributions to Shareholders: |
|
|
|
|
|
|
|
|
|
|
|
|
|
Net realized short-term gain on investments and distributions from Underlying Funds: |
|
|
|
|
|
|
|
|
|
|
|
|
|
Class A |
|
| (1,559 | ) |
| (226,718 | ) |
| (1,998 | ) |
| (297,058 | ) |
Class B |
|
| (455 | ) |
| (41,949 | ) |
| (756 | ) |
| (67,225 | ) |
Class C |
|
| (779 | ) |
| (52,760 | ) |
| (1,503 | ) |
| (108,396 | ) |
Class D |
|
| — |
|
| (12,103 | ) |
| — |
|
| (21,076 | ) |
Total |
|
| (2,793 | ) |
| (333,530 | ) |
| (4,257 | ) |
| (493,755 | ) |
Net realized long-term gain on investments and distributions from Underlying Funds: |
|
|
|
|
|
|
|
|
|
|
|
|
|
Class A |
|
| (920,589 | ) |
| (491,106 | ) |
| (1,569,822 | ) |
| (1,121,270 | ) |
Class B |
|
| (256,866 | ) |
| (192,266 | ) |
| (568,112 | ) |
| (500,892 | ) |
Class C |
|
| (452,360 | ) |
| (232,813 | ) |
| (1,177,082 | ) |
| (784,483 | ) |
Class D |
|
| — |
|
| (48,938 | ) |
| — |
|
| (144,318 | ) |
Total |
|
| (1,629,815 | ) |
| (965,123 | ) |
| (3,315,016 | ) |
| (2,550,963 | ) |
Decrease in Net Assets from Distributions |
|
| (1,632,608 | ) |
| (1,298,653 | ) |
| (3,319,273 | ) |
| (3,044,718 | ) |
Capital Share Transactions: |
|
|
|
|
|
|
|
|
|
|
|
|
|
Net proceeds from sales of shares |
|
| 2,977,951 |
|
| 5,146,487 |
|
| 3,467,334 |
|
| 5,895,005 |
|
Exchanged from associated funds |
|
| 921,443 |
|
| 1,129,172 |
|
| 2,127,305 |
|
| 5,153,924 |
|
Investment of distributions |
|
| 1,532,916 |
|
| 1,211,082 |
|
| 3,109,075 |
|
| 2,884,353 |
|
Total |
|
| 5,432,310 |
|
| 7,486,741 |
|
| 8,703,714 |
|
| 13,933,282 |
|
Cost of shares repurchased |
|
| (3,390,627 | ) |
| (2,884,976 | ) |
| (5,137,556 | ) |
| (5,586,193 | ) |
Exchanged into associated funds |
|
| (2,286,611 | ) |
| (553,619 | ) |
| (3,875,231 | ) |
| (1,434,929 | ) |
Total |
|
| (5,677,238 | ) |
| (3,438,595 | ) |
| (9,012,787 | ) |
| (7,021,122 | ) |
Increase (Decrease) in Net Assets from Capital Share Transactions |
|
| (244,928 | ) |
| 4,048,146 |
|
| (309,073 | ) |
| 6,912,160 |
|
Increase (Decrease) in Net Assets |
|
| (12,851,317 | ) |
| 5,226,367 |
|
| (19,512,231 | ) |
| 7,410,934 |
|
Net Assets: |
|
|
|
|
|
|
|
|
|
|
|
|
|
Beginning of year |
|
| 23,988,757 |
|
| 18,762,390 |
|
| 37,646,140 |
|
| 30,235,206 |
|
End of Year* |
| $ | 11,137,440 |
| $ | 23,988,757 |
| $ | 18,133,909 |
| $ | 37,646,140 |
|
|
|
|
|
|
|
|
|
|
|
|
|
|
|
|
* | Including undistributed (dividends in excess of) net investment income |
| $ | (517 | ) | $ | 541 |
| $ | (583 | ) | $ | 2,263 |
|
See Notes to Financial Statements.
18
Statements of Changes in Net Assets
(continued)
|
|
|
|
|
|
|
|
|
|
|
|
|
|
|
| Seligman |
| Seligman |
| ||||||||
|
|
| |||||||||||
|
| Year Ended December 31, |
| Year Ended December 31, |
| ||||||||
|
|
| |||||||||||
|
| 2008 |
| 2007 |
| 2008 |
| 2007 |
| ||||
Operations: |
|
|
|
|
|
|
|
|
|
|
|
|
|
Net investment income |
| $ | 145,010 |
| $ | 135,836 |
| $ | 249,982 |
| $ | 260,227 |
|
Net realized gain (loss) on investments and capital gain distributions from Underlying Funds |
|
| 81,558 |
|
| 3,193,165 |
|
| (1,786,600 | ) |
| 1,354,488 |
|
Net change in unrealized appreciation of investments |
|
| (17,847,704 | ) |
| 464,917 |
|
| (4,658,851 | ) |
| (1,079,273 | ) |
Increase (Decrease) in Net Assets from Operations |
|
| (17,621,136 | ) |
| 3,793,918 |
|
| (6,195,469 | ) |
| 535,442 |
|
Distributions to Shareholders: |
|
|
|
|
|
|
|
|
|
|
|
|
|
Net investment income: |
|
|
|
|
|
|
|
|
|
|
|
|
|
Class A |
|
| (74,610 | ) |
| (135,144 | ) |
| (142,020 | ) |
| (147,189 | ) |
Class B |
|
| (18,291 | ) |
| (692 | ) |
| (23,407 | ) |
| (29,223 | ) |
Class C |
|
| (52,109 | ) |
| — |
|
| (71,538 | ) |
| (63,271 | ) |
Class D |
|
| — |
|
| — |
|
| (8,624 | ) |
| (20,544 | ) |
Total |
|
| (145,010 | ) |
| (135,836 | ) |
| (245,589 | ) |
| (260,227 | ) |
Net realized short-term gain on investments and distributions from Underlying Funds: |
|
|
|
|
|
|
|
|
|
|
|
|
|
Class A |
|
| (41,535 | ) |
| (304,859 | ) |
| (5,142 | ) |
| (143,161 | ) |
Class B |
|
| (11,623 | ) |
| (91,777 | ) |
| (1,280 | ) |
| (44,413 | ) |
Class C |
|
| (32,073 | ) |
| (212,719 | ) |
| (4,777 | ) |
| (101,913 | ) |
Class D |
|
| — |
|
| (58,519 | ) |
| — |
|
| (34,280 | ) |
Total |
|
| (85,231 | ) |
| (667,874 | ) |
| (11,199 | ) |
| (323,767 | ) |
Net realized long-term gain on investments and distributions from Underlying Funds: |
|
|
|
|
|
|
|
|
|
|
|
|
|
Class A |
|
| (1,336,942 | ) |
| (238,133 | ) |
| (205,952 | ) |
| — |
|
Class B |
|
| (410,679 | ) |
| (80,910 | ) |
| (45,973 | ) |
| — |
|
Class C |
|
| (1,133,364 | ) |
| (186,129 | ) |
| (181,639 | ) |
| — |
|
Class D |
|
| — |
|
| (51,204 | ) |
| — |
|
| — |
|
Total |
|
| (2,880,985 | ) |
| (556,376 | ) |
| (433,564 | ) |
| — |
|
Return of Capital: |
|
|
|
|
|
|
|
|
|
|
|
|
|
Class A |
|
| (12,593 | ) |
| — |
|
| — |
|
| — |
|
Class B |
|
| (3,087 | ) |
| — |
|
| — |
|
| — |
|
Class C |
|
| (8,795 | ) |
| — |
|
| — |
|
| — |
|
Total |
|
| (24,475 | ) |
| — |
|
| — |
|
| — |
|
Decrease in Net Assets from Distributions |
|
| (3,135,701 | ) |
| (1,360,086 | ) |
| (690,352 | ) |
| (583,994 | ) |
Capital Share Transactions: |
|
|
|
|
|
|
|
|
|
|
|
|
|
Net proceeds from sales of shares |
|
| 3,071,849 |
|
| 6,729,058 |
|
| 1,372,896 |
|
| 3,143,992 |
|
Exchanged from associated funds |
|
| 2,904,741 |
|
| 2,852,641 |
|
| 2,347,093 |
|
| 1,938,042 |
|
Investment of distributions |
|
| 2,904,871 |
|
| 1,271,933 |
|
| 642,524 |
|
| 510,247 |
|
Total |
|
| 8,881,461 |
|
| 10,853,632 |
|
| 4,362,513 |
|
| 5,592,281 |
|
Cost of shares repurchased |
|
| (7,966,518 | ) |
| (6,662,424 | ) |
| (4,540,707 | ) |
| (3,729,670 | ) |
Exchanged into associated funds |
|
| (4,725,954 | ) |
| (2,188,125 | ) |
| (1,489,917 | ) |
| (471,263 | ) |
Total |
|
| (12,692,472 | ) |
| (8,850,549 | ) |
| (6,030,624 | ) |
| (4,200,933 | ) |
Increase (Decrease) in Net Assets from Capital Share Transactions |
|
| (3,811,011 | ) |
| 2,003,083 |
|
| (1,668,111 | ) |
| 1,391,348 |
|
Increase (Decrease) in Net Assets |
|
| (24,567,848 | ) |
| 4,436,915 |
|
| (8,553,932 | ) |
| 1,342,796 |
|
Net Assets: |
|
|
|
|
|
|
|
|
|
|
|
|
|
Beginning of year |
|
| 43,886,302 |
|
| 39,449,387 |
|
| 18,325,755 |
|
| 16,982,959 |
|
End of Year* |
| $ | 19,318,454 |
| $ | 43,886,302 |
| $ | 9,771,823 |
| $ | 18,325,755 |
|
|
|
|
|
|
|
|
|
|
|
|
|
|
|
|
|
* | Including undistributed (dividends in excess of) net investment income |
| $ | (615 | ) | $ | 36,024 |
| $ | (14,752 | ) | $ | 7,927 |
|
See Notes to Financial Statements.
19
|
|
|
1. | Organization and Multiple Classes of Shares — Seligman Asset Allocation Series, Inc. (the “Series”) is registered with the Securities and Exchange Commission (the “SEC”) under the Investment Company Act of 1940, as amended (the “1940 Act”), as an open-end diversified management investment company (Note 10). The Series consists of four separate funds: Seligman Asset Allocation Aggressive Growth Fund (“Aggressive Growth Fund”), Seligman Asset Allocation Growth Fund (“Growth Fund”), Seligman Asset Allocation Moderate Growth Fund (“Moderate Growth Fund”) and Seligman Asset Allocation Balanced Fund (“Balanced Fund”). Each Fund invests in a combination of Class A shares of other Seligman mutual funds (the “Underlying Funds”). Each Fund of the Series offers three classes of shares. | |
|
| |
| Class A shares are sold with an initial sales charge of up to 5.75% (4.75% prior to January 7, 2008) and are subject to a continuing service fee of up to 0.25% on an annual basis. Class A shares purchased in an amount of $1,000,000 or more are sold without an initial sales charge but are subject to a contingent deferred sales charge (“CDSC”) of 1% on redemptions made within 18 months of purchase. Effective January 7, 2008, eligible employee benefit plans which have at least $2,000,000 in plan assets may purchase Class A shares at net asset value, but, in the event of plan termination, will be subject to a CDSC of 1% on shares purchased within 18 months prior to plan termination. | |
|
| |
| Class B shares are sold without an initial sales charge but are subject to a distribution fee of 0.75% on an annual basis, and a CDSC, if applicable, of 5% on redemptions made in the first year of purchase, declining to 1% in the sixth year and 0% thereafter. Class B shares will automatically convert to Class A shares approximately eight years after their date of purchase. If Class B shares of the Fund are exchanged for Class B shares of another Seligman registered investment company, the holding period of the shares exchanged will be added to the holding period of the shares acquired, both for determining the applicable CDSC and the conversion of Class B shares to Class A shares. | |
|
| |
| Class C shares are sold without an initial sales charge but are subject to a distribution fee of up to 0.75% on an annual basis, and a CDSC, if applicable, of 1% imposed on redemptions made within one year of purchase. | |
|
| |
| The three classes of shares for each Fund represent interests in the same portfolio of investments, have the same rights and are generally identical in all respects except that each class bears its separate distribution and service (12b-1) fees and certain other class-specific expenses, and has exclusive voting rights with respect to any matter on which a separate vote of any class is required. | |
|
| |
2. | Significant Accounting Policies — The financial statements have been prepared in conformity with accounting principles generally accepted in the United States of America, which require management to make certain estimates and assumptions at the date of the financial statements. Actual results may differ from these estimates. The following summarizes the significant accounting policies of the Series: | |
|
| |
| a. | Security Valuation and Risk — Underlying Funds owned by a Fund are valued at their respective net asset values. Securities traded on an exchange are valued at the last sales price on the primary exchange or market on which they are traded. Securities not listed on an exchange or security market, or securities for which there is no last sales price, are valued at the mean of the most recent bid and asked prices or are valued by RiverSource Investments, LLC (“RiverSource” or the “Manager”) based on quotations provided by primary market makers in such securities. Securities for which market quotations are not readily available (or are otherwise no longer valid or reliable) are valued at fair value determined in accordance with procedures approved by the Board of Directors. This can occur in the event of, among other things, natural disasters, acts of terrorism, market disruptions, intra-day trading halts, and extreme market volatility. The determination of fair value involves subjective judgments. As a result, using fair value to price a security may result in a price materially different from the prices used by other mutual funds to determine net asset value or the price that may be realized upon the actual sale of the security. Short-term holdings maturing in 60 days or less are valued at current market quotations or amortized cost if the Manager believes it |
20
Notes to Financial Statements
|
|
|
|
| approximates fair value. Short-term holdings that mature in more than 60 days are valued at current market quotations until the 60th day prior to maturity and are then valued as described above for securities maturing in 60 days or less. Investments in money market funds are valued at net asset value. |
|
| |
|
| On January 1, 2008, the Funds adopted Statement of Financial Accounting Standards No. 157 (“SFAS 157”), “Fair Value Measurements.” SFAS 157 establishes a three-tier hierarchy to classify the assumptions, referred to as inputs, used in valuation techniques (as described above) to measure fair value of the Funds’ investments. These inputs are summarized in three broad levels: Level 1 – quoted prices in active markets for identical investments; Level 2 – other significant observable inputs (including quoted prices in inactive markets or for similar investments); and Level 3 – significant unobservable inputs (including the Funds’ own assumptions in determining fair value) (Note 3). Observable inputs are those based on market data obtained from sources independent of the Funds, and unobservable inputs reflect the Funds’ own assumptions based on the best information available. The inputs or methodology used for valuing securities may not be an indication of the risk associated with investing in those securities. |
|
| |
|
| The following risks apply to some or all of the Underlying Funds in which the Funds invest. An Underlying Fund may concentrate its investments in stocks of large-, medium- or small-capitalization companies. At times, one or more of these groups of stocks has experienced periods of volatility and negative performance. During such periods, the value of such stocks may decline and the performance of an Underlying Fund investing in such companies may be negatively affected. The products of technology companies may be subject to severe competition and rapid obsolescence, and technology stocks may be subject to greater price fluctuation, government regulation, and limited liquidity as compared to other investments. There are specific risks associated with global investing, such as currency fluctuations, foreign taxation, differences in financial reporting practices, and rapid changes in political and economic conditions. Investments in emerging market companies should be considered speculative. Investments in real estate securities may be subject to specific risks, such as risks of general and local economic conditions, and risks related to individual properties. To the extent that a Fund has a substantial percentage of its assets exposed to an industry through its investment in the Underlying Funds, the Fund’s performance may be negatively affected if that industry falls out of favor. A portfolio with fewer holdings may be subject to greater volatility than a portfolio with a greater number of holdings. US government and other fixed income securities are subject to interest rate risk, credit risk, prepayment risk and market risk. Securities that are not guaranteed by the US Government may have increased credit risk, including, but not limited to, the risk of non-payment of principal or interest. High-yield securities are subject to higher volatility in yield and market value and a greater risk of loss of principal and interest than higher-rated, investment-grade fixed-income securities. |
|
| |
| b. | Multiple Class Allocations — Each Fund’s income, expenses (other than class-specific expenses), and realized and unrealized gains or losses are allocated daily to each class of shares of that Fund based upon the relative value of the shares of each class. Class-specific expenses, which include distribution and service (12b-1) fees and any other items that are specifically attributed to a particular class, are charged directly to such class. For the year ended December 31, 2008, distribution and service (12b-1) fees were the only class-specific expenses. |
|
|
|
| c. | Security Transactions and Related Investment Income — Investment transactions are recorded on trade dates. Identified cost of investments sold is used for both financial statement and federal income tax purposes. Interest income is recorded on an accrual basis. Dividends receivable are recorded on ex-dividend dates. Distributions received from the Fund’s investments are initially recorded as dividend income as reported by the issuers. Portions of these distributions will be appropriately recharacterized as capital gains or returns of capital based on reporting from the issuers received after the end of the year. The annual financial statements will reflect any such recharacterizations. |
21
Notes to Financial Statements
|
|
|
| d. | Distributions to Shareholders — Dividends and distributions to shareholders are recorded on ex-dividend dates. |
| ||
| e. | Taxes — Each Fund in the Series has elected to be taxed as a regulated investment company and intends to distribute substantially all taxable net income and net gain realized. |
| ||
|
| Financial Accounting Standards Board (“FASB”) Interpretation No. 48 (“FIN 48”), “Accounting for Uncertainty in Income Taxes — an interpretation of FASB Statement No. 109,” requires the Funds to measure and recognize in their financial statements the benefit of a tax position taken (or expected to be taken) on an income tax return if such position will more likely than not be sustained upon examination based on the technical merits of the position. The Funds file income tax returns in the US Federal jurisdiction, as well as the New York State and New York City jurisdictions. Based upon their review of tax positions for the Funds’ open tax years of 2005-2008 in these jurisdictions, the Funds have determined that FIN 48 did not have a material impact on the Funds’ financial statements for the year ended December 31, 2008. |
| ||
3. | Fair Value Measurements — A summary of the value of the Funds’ investments as of December 31, 2008, based on the level of inputs used in accordance with SFAS 157 (Note 2a), is as follows: |
|
|
|
|
|
|
|
|
|
|
|
|
|
|
|
Valuation Inputs |
| Aggressive |
| Growth |
| Moderate |
| Balanced |
| |||||
Level 1 – | Quoted Prices in Active Markets for Identical Investments |
| $ | 11,220,232 |
| $ | 18,126,580 |
| $ | 19,447,604 |
| $ | 10,092,340 |
|
Level 2 – | Other Significant Observable Inputs |
|
| — |
|
| — |
|
| — |
|
| — |
|
Level 3 – | Significant Unobservable Inputs |
|
| — |
|
| — |
|
| — |
|
| — |
|
Total |
|
| $ | 11,220,232 |
| $ | 18,126,580 |
| $ | 19,447,604 |
| $ | 10,092,340 |
|
|
|
|
4. | Management and Distribution Services, and Other Related-Party Transactions — | |
|
|
|
| a. | Management and Administrative Services — On November 7, 2008, RiverSource, investment manager to the RiverSource complex of funds, and a wholly owned subsidiary of Ameriprise Financial, Inc. (“Ameriprise”), announced the closing of its acquisition (the “Acquisition”) of J. & W. Seligman & Co. Incorporated (“JWS”). With the Acquisition completed and shareholders of the Funds having previously approved (at a Special Meeting held earlier in November 2008) a new Investment Management Services Agreement between RiverSource and the Series with respect to each Fund, RiverSource is the new investment manager of the Funds effective November 7, 2008. |
|
| |
|
| The Manager receives a fee (and, prior to November 7, 2008, JWS received a fee), calculated daily and payable monthly, equal to 0.10% per annum of each Fund’s average daily net assets. The Manager (and JWS) voluntarily waived its management fee and reimbursed each Fund’s expenses, other than distribution and service (12b-1) fees, that exceeded 0.50% per annum of the Fund’s average daily net assets through March 31, 2005. Beginning April 1, 2005 through April 30, 2009, the Manager (and JWS) has contractually undertaken to waive its management fee and/or reimburse each Fund’s expenses in order to limit Fund expenses (other than distribution and service (12b-1) fees) to 0.40% per annum of average daily net assets for Aggressive Growth Fund and Growth Fund and to limit Fund expenses to 0.25% per annum of average daily net assets for Moderate Growth Fund and Balanced Fund. From May 1, 2009 through December 31, 2010, the Manager has contractually undertaken to waive its management fee and/or to reimburse each Fund’s expenses, other than distribution and service (12b-1) fees, that exceed 0.75% per annum of average daily net assets. |
22
Notes to Financial Statements
|
|
| For the year ended December 31, 2008, RiverSource and JWS received management fees in the following amounts: |
|
|
|
|
|
|
|
|
|
|
|
|
|
| Fund |
| RiverSource |
| JWS |
| ||||||
| ||||||||||||
| Aggressive Growth Fund |
|
| $ | 1,713 |
|
|
| $ | 17,411 |
|
|
| ||||||||||||
| Growth Fund |
|
|
| 2,477 |
|
|
|
| 26,029 |
|
|
| ||||||||||||
| Moderate Growth Fund |
|
|
| 2,710 |
|
|
|
| 29,369 |
|
|
| ||||||||||||
| Balanced Fund |
|
|
| 1,410 |
|
|
|
| 13,574 |
|
|
|
|
|
| For the year ended December 31, 2008, the amount of expenses waived and reimbursed by the Manager and JWS, and the amount receivable from the Manager at December 31, 2008 were as follows: |
|
|
|
|
|
|
|
|
|
|
|
|
|
|
|
|
|
|
|
|
| Waiver and Reimbursements |
| Receivable from |
| |||||||||||
| Fund |
| RiverSource |
| JWS |
|
| ||||||||||
| |||||||||||||||||
| Aggressive Growth Fund |
|
| $ | 12,512 |
|
|
| $ | 56,160 |
|
|
| $ | 4,601 |
|
|
| |||||||||||||||||
| Growth Fund |
|
|
| 11,571 |
|
|
|
| 50,407 |
|
|
|
| 2,489 |
|
|
| |||||||||||||||||
| Moderate Growth Fund |
|
|
| 15,586 |
|
|
|
| 92,470 |
|
|
|
| 6,027 |
|
|
| |||||||||||||||||
| Balanced Fund |
|
|
| 15.075 |
|
|
|
| 83,912 |
|
|
|
| 7,488 |
|
|
|
|
|
| Under an Administrative Services Agreement, effective November 7, 2008, Ameriprise administers certain aspects of the Funds’ business and other affairs at no cost. Ameriprise provides the Funds with office space, and certain administrative and other services and executive and other personnel as are necessary for operations of the Funds. Ameriprise pays all of the compensation of Board members of the Series who are employees or consultants of RiverSource and of the officers and other personnel of the Series. Ameriprise reserves the right to seek Board approval to increase the fees payable by the Funds under the Administrative Services Agreement. However, Ameriprise anticipates that any such increase in fees would be offset by corresponding decreases in advisory fees under the Investment Management Services Agreement. If an increase in fees under the Administrative Services Agreement would not be offset by corresponding decreases in advisory fees, the Funds will inform shareholders prior to the effectiveness of such increase. Prior to November 7, 2008, administrative services were provided to the Funds by JWS as part of its former management agreement with the Series with respect to each Fund. |
|
|
b. | Distribution Services — For the year ended December 31, 2008, RiverSource Fund Distributors, Inc. (formerly Seligman Advisors, Inc.) (the “Distributor”), agent for the distribution of the Series’ shares and an affiliate of the Manager, received the following commissions and concessions from sales of Class A shares. Commissions were also paid to dealers for sales of Class A shares as follows: |
|
|
|
|
|
|
|
|
|
|
|
|
|
| Fund |
| Commissions |
| Dealer |
| ||||||
| ||||||||||||
| Aggressive Growth Fund |
|
| $ | 4,928 |
|
|
| $ | 26,087 |
|
|
| ||||||||||||
| Growth Fund |
|
|
| 7,811 |
|
|
|
| 57,729 |
|
|
| ||||||||||||
|
|
|
|
|
|
|
|
|
|
|
|
|
| Fund |
| Commissions |
| Dealer |
| ||||||
| ||||||||||||
| Moderate Growth Fund |
|
| $ | 4,914 |
|
|
| $ | 32,713 |
|
|
| ||||||||||||
| Balanced Fund |
|
|
| 2,173 |
|
|
|
| 12,430 |
|
|
|
|
|
| Each Fund of the Series has an Administration, Shareholder Services and Distribution Plan (the “Plan”) with respect to distribution of its shares. Under the Plan, with respect to Class A, Class B, Class C, and Class D shares (only through May 16, 2008), service organizations can enter into agreements with the Distributor and receive a continuing service fee of up to 0.25% per annum of the average daily net assets attributable to the particular service organizations for providing personal services and/or the maintenance of shareholder accounts. To avoid any duplication of the service fee, the service fees to be paid by each class of a Fund will be reduced by the dollar amount of any service fees paid by the Underlying Funds with respect to shares owned by the Fund. |
23
Notes to Financial Statements
|
|
| For the year ended December 31, 2008, service fees incurred by the Aggressive Growth Fund, Growth Fund, Moderate Growth Fund, and the Balanced Fund (net of service fees paid by Underlying Funds), aggregated $0, $0, $0, and $778, respectively, or 0.00%, 0.00%, 0.00%, and 0.01%, respectively, per annum of the average daily net assets of each Fund’s Class A shares. |
|
|
| Under the Plan, with respect to Class C and Class D shares (only through May 16, 2008), service organizations may receive up to 0.75% per annum of the average daily net assets for providing other distribution assistance. Such fees are paid monthly by the Funds to the Distributor pursuant to the Plan. |
|
|
| For the year ended December 31, 2008, the service fees and distribution fees incurred under the Plan (net of service fees paid by Underlying Funds), and their equivalent per annum percentage of the average daily net assets of Class B, Class C, and Class D shares, were as follows: |
|
|
|
|
|
|
|
|
|
|
|
|
|
|
|
| Fund |
| Class B |
| Class C |
| Class D |
| Fee Rate |
| ||||
| ||||||||||||||
| Aggressive Growth Fund |
| $ | 23,134 |
| $ | 35,357 |
| $ | 3,086 |
|
| 0.75 | % |
| ||||||||||||||
| Growth Fund |
|
| 36,820 |
|
| 67,813 |
|
| 5,807 |
|
| 0.75 |
|
| ||||||||||||||
| Moderate Growth Fund |
|
| 35,145 |
|
| 86,234 |
|
| 10,145 |
|
| 0.75 |
|
| ||||||||||||||
| Balanced Fund |
|
| 14,031 |
|
| 41,821 |
|
| 5,303 |
|
| 0.75 |
|
|
|
|
| The Distributor and RiverSource Services, Inc. (formerly Seligman Services, Inc.), also an affiliate of the Manager, are eligible to receive distribution and service (12b-1) fees pursuant to the Plan. For the year ended December 31, 2008, the Distributor and Seligman Services, Inc. received distribution and service (12b-1) fees pursuant to the Plan as follows: |
|
|
|
|
|
|
|
|
| Fund |
| Distribution and |
| |||
| |||||||
| Aggressive Growth Fund |
|
| $ | 690 |
|
|
| |||||||
| Growth Fund |
|
|
| 1,765 |
|
|
| |||||||
|
|
|
|
|
|
|
|
| Fund |
| Distribution and |
| |||
| |||||||
| Moderate Growth Fund |
|
| $ | 1,590 |
|
|
| |||||||
| Balanced Fund |
|
|
| 579 |
|
|
|
|
|
| The Distributor is entitled to retain any CDSC imposed on certain redemptions of Class A, Class C and Class D shares. For the year ended December 31, 2008, such charges amounted to $3,632 for Aggressive Growth Fund, $2,547 for Growth Fund, $1,811 for Moderate Growth Fund and $2,658 for Balanced Fund. The Distributor has sold its rights to third parties to collect any CDSC imposed on redemptions of Class B shares. |
| |
c. | Transfer Agents and Shareholder Services — For the year ended December 31, 2008, Seligman Data Corp., which is owned by certain associated investment companies, charged the Series at cost the following amounts for shareholder account services in accordance with a methodology approved by the Series’ directors: |
|
|
|
|
|
|
|
| Fund |
| Amount | |||
| ||||||
| Aggressive Growth Fund |
|
| $ | 14,560 |
|
| ||||||
| Growth Fund |
|
|
| 21,107 |
|
| ||||||
|
|
|
|
|
|
|
| Fund |
| Amount | |||
| ||||||
| Moderate Growth Fund |
|
| $ | 20,031 |
|
| ||||||
| Balanced Fund |
|
|
| 13,928 |
|
|
|
|
| Costs of Seligman Data Corp. directly attributable to each Fund were charged to the Fund. The remaining charges were allocated to the Funds by Seligman Data Corp. pursuant to a formula based on each Fund’s net assets, shareholder transaction volume and number of shareholder accounts. |
|
|
| The Series’ Board has approved RiverSource Service Corporation (“RSC”) as the Funds’ new transfer and shareholder service agent, and the termination of the Funds’ relationship with Seligman Data Corp., effective on or about May 9, 2009. RSC is an affiliate of RiverSource. The Boards of Directors/Trustees of certain of the other Seligman funds, including the Underlying Funds, have also approved this change with respect to such funds. The overall transfer and shareholder service agent fees expected to be borne directly and indirectly by the Funds as a result of the services to be provided by RSC are generally expected to be lower than the overall transfer and shareholder service agent fees currently borne directly and indirectly by the Funds under the arrangements with SDC. Nevertheless, as a result of the termination of the relationship with Seligman Data Corp., each Underlying Fund (and not each Fund directly) will incur certain non-recurring charges that would in the aggregate approximate 0.16% |
24
Notes to Financial Statements
|
|
| of that Underlying Fund’s net assets as of January 23, 2009 (the “Non-Recurring Charges”). These Non-Recurring Charges will be incurred by the Underlying Funds over the next several months beginning January 28, 2009. Although shareholders of the Funds will not directly incur the Non-Recurring Charges, each Fund’s shareholders will bear a proportionate share of the Non-Recurring Charges indirectly as a result of such Funds’ investments in the Underlying Funds. |
|
|
d. | Directors’ Fees and Expenses — Directors’ fees and expenses includes the compensation of Board members who are not employees of RiverSource and the Funds’ proportionate share of certain expenses of a company providing limited administrative services to the Funds and the other Seligman and RiverSource Funds. These expenses include boardroom and office expense, employee compensation, employee health and retirement benefits and certain other expenses. |
|
|
| The Series has a compensation arrangement under which directors who receive fees may elect to defer receiving such fees. Directors may elect to have their deferred fees accrue interest or earn a return based on the performance of selected Funds of the Series or other funds in the Seligman and RiverSource Groups of Investment Companies. Deferred fees and related accrued earnings are not deductible by a Fund for federal income tax purposes until such amounts are paid. At December 31, 2008, the cost of such fees and earnings/loss accrued thereon is included in directors’ fees and expenses, and the accumulated balance thereof at December 31, 2008, is included in accrued expenses and other liabilities are as follows: |
|
|
|
|
|
|
|
| Fund |
| Amount | |||
| ||||||
| Aggressive Growth Fund |
|
| $ | 516 |
|
| ||||||
| Growth Fund |
|
|
| 584 |
|
| ||||||
|
|
|
|
|
|
|
| Fund |
| Amount | |||
| ||||||
| Moderate Growth Fund |
|
| $ | 615 |
|
| ||||||
| Balanced Fund |
|
|
| 490 |
|
|
|
|
|
|
Certain officers and directors of the Series are officers or directors of the Manager, Ameriprise, the Distributor, RiverSource Services, Inc., RSC, and/or Seligman Data Corp. | |
5. | Purchases and Sales of Securities — Purchases and sales of portfolio securities (Underlying Funds), excluding short-term investments, for the year ended December 31, 2008, were as follows: |
|
|
|
|
|
|
|
|
|
|
|
|
|
| Fund |
| Purchases |
| Sales |
| ||||||
| ||||||||||||
| Aggressive Growth Fund |
|
| $ | 3,207,348 |
|
|
| $ | 4,862,625 |
|
|
| ||||||||||||
| Growth Fund |
|
|
| 6,091,131 |
|
|
|
| 9,617,739 |
|
|
| ||||||||||||
|
|
|
|
|
|
|
|
|
|
|
|
|
| Fund |
| Purchases |
| Sales |
| ||||||
| ||||||||||||
| Moderate Growth Fund |
|
| $ | 8,336,622 |
|
|
| $ | 14,776,347 |
|
|
| ||||||||||||
| Balanced Fund |
|
|
| 5,817,081 |
|
|
|
| 7,476,162 |
|
|
|
|
|
6. | Federal Tax Information — Certain components of income, expense and realized capital gain and loss are recognized at different times or have a different character for federal income tax purposes and for financial reporting purposes. Where such differences are permanent in nature, they are reclassified in the components of net assets based on their characterization for federal income tax purposes. Any such reclassifications will have no effect on net assets, results of operations or net asset value per share of the Fund. As a result of the differences described above, the treatment for financial reporting purposes of distributions made during the year from net investment income or net realized gains may differ from their treatment for federal income tax purposes. Further, the cost of investments also can differ for federal income tax purposes. |
|
|
| The tax basis information presented is based on operating results for the year ended December 31, 2008, and will vary from the final tax information as of the Fund’s year end. |
|
|
| At December 31, 2008, the tax basis cost of investments for federal income tax purposes for each Fund was as follows: |
|
|
|
|
|
|
|
| Fund |
| Tax Basis Cost | |||
| ||||||
| Aggressive Growth Fund |
|
| $ | 18,048,446 |
|
| ||||||
| Growth Fund |
|
|
| 30,061,456 |
|
| ||||||
|
|
|
|
|
|
|
| Fund |
| Tax Basis Cost | |||
| ||||||
| Moderate Growth Fund |
|
| $ | 32,137,670 |
|
| ||||||
| Balanced Fund |
|
|
| 15,957,408 |
|
|
25
Notes to Financial Statements
|
|
| The tax basis cost was greater than the cost for financial reporting purposes primarily due to the following tax deferral of losses on wash sales: |
|
|
|
|
|
|
|
| Fund |
| Amount | |||
| ||||||
| Aggressive Growth Fund |
|
| $ | 653,769 |
|
| ||||||
| Growth Fund |
|
|
| 1,536,437 |
|
| ||||||
|
|
|
|
|
|
|
| Fund |
| Amount | |||
| ||||||
| Moderate Growth Fund |
|
| $ | 1,891,725 |
|
| ||||||
| Balanced Fund |
|
|
| 2,529,382 |
|
|
|
|
| At December 31, 2008, the tax basis components of accumulated losses were as follows: |
|
|
|
|
|
|
|
|
|
|
|
|
|
|
|
|
|
|
|
|
|
|
| Aggressive Growth |
| Growth |
| Moderate Growth |
| Balanced |
| |||||||||
| |||||||||||||||||||
| Gross unrealized appreciation of portfolio securities |
|
| $ | — |
|
| $ | — |
|
| $ | — |
|
| $ | 20,406 |
| |
| |||||||||||||||||||
| Gross unrealized depreciation of portfolio securities |
|
|
| (6,828,214 | ) |
|
| (11,934,876 | ) |
|
| (12,690,066 | ) |
|
| (5,885,474 | ) | |
| |||||||||||||||||||
| Net unrealized depreciation of portfolio securities |
|
|
| (6,828,214 | ) |
|
| (11,934,876 | ) |
|
| (12,690,066 | ) |
|
| (5,865,068 | ) | |
| |||||||||||||||||||
| Undistributed net realized gain |
|
|
| — |
|
|
| 151,283 |
|
|
| — |
|
|
| — |
| |
| |||||||||||||||||||
| Timing differences (post-October losses) |
|
|
| (79,666 | ) |
|
| — |
|
|
| (57,924 | ) |
|
| (126,275 | ) | |
| |||||||||||||||||||
| Total accumulated losses |
|
| $ | (6,907,880 | ) |
| $ | (11,783,593 | ) |
| $ | (12,747,990 | ) |
| $ | (5,991,343 | ) | |
| |||||||||||||||||||
|
|
| From November 1, 2008 through December 31, 2008, the Aggressive Growth Fund, the Moderate Growth Fund and the Balanced Fund incurred $79,666, $57,924 and $126,275, respectively, of net realized capital losses. As permitted by tax regulations, the Funds intend to elect to defer these losses and treat them as arising in the fiscal year ended December 31, 2009. These losses will be available to offset future taxable net gains. |
|
|
| The tax character of distributions paid for the years ended December 31, 2008 and 2007 were as follows: |
|
|
|
|
|
|
|
|
|
|
|
|
|
|
|
|
|
|
|
|
| Year Ended December 31, |
| |||||||||||||
|
|
| |||||||||||||||
|
|
| 2008 |
| 2007 |
| |||||||||||
|
| ||||||||||||||||
|
|
| Ordinary |
| Long-Term |
| Return of |
| Ordinary |
| Long-Term |
| |||||
| |||||||||||||||||
| Aggressive Growth Fund |
| $ | 2,793 |
| $ | 1,629,815 |
| $ | — |
| $ | 333,530 |
| $ | 965,123 |
|
| |||||||||||||||||
| Growth Fund |
|
| 4,257 |
|
| 3,315,016 |
|
| — |
|
| 493,755 |
|
| 2,550,963 |
|
| |||||||||||||||||
| Moderate Growth Fund |
|
| 230,241 |
|
| 2,880,985 |
|
| 24,475 |
|
| 803,710 |
|
| 556,376 |
|
| |||||||||||||||||
| Balanced Fund |
|
| 256,788 |
|
| 433,564 |
|
| — |
|
| 583,994 |
|
| — |
|
|
26
Notes to Financial Statements
|
|
7. | Capital Stock Share Transactions — The Board of Directors of the Series, at its discretion, may classify any unissued shares of Capital Stock among any Fund of the Series. Transactions in shares of Capital Stock were as follows: |
|
|
|
|
|
|
|
|
|
|
|
|
|
|
|
| Year Ended December 31, |
| ||||||||||
|
| ||||||||||||
Aggressive Growth Fund |
| 2008† |
| 2007 |
| ||||||||
Class A |
| Shares |
| Amount |
| Shares |
| Amount |
| ||||
Net proceeds from sales of shares |
|
| 262,710 |
| $ | 1,902,697 |
|
| 409,250 |
| $ | 3,602,296 |
|
Exchanged from associated funds |
|
| 98,661 |
|
| 555,146 |
|
| 78,466 |
|
| 699,102 |
|
Investment of distributions |
|
| 152,385 |
|
| 911,810 |
|
| 78,393 |
|
| 714,598 |
|
Converted from Class B* |
|
| 57,771 |
|
| 312,570 |
|
| 17,532 |
|
| 156,913 |
|
Total |
|
| 571,527 |
|
| 3,682,223 |
|
| 583,641 |
|
| 5,172,909 |
|
Cost of shares repurchased |
|
| (235,309 | ) |
| (1,618,153 | ) |
| (161,904 | ) |
| (1,450,915 | ) |
Exchanged into associated funds |
|
| (379,539 | ) |
| (1,778,004 | ) |
| (6,259 | ) |
| (56,458 | ) |
Total |
|
| (614,848 | ) |
| (3,396,157 | ) |
| (168,163 | ) |
| (1,507,373 | ) |
Increase (decrease) |
|
| (43,321 | ) | $ | 286,066 |
|
| 415,478 |
| $ | 3,665,536 |
|
| |||||||||||||
Class B |
|
| Shares |
|
| Amount |
|
| Shares |
|
| Amount |
|
Net proceeds from sales of shares |
|
| 24,700 |
| $ | 171,426 |
|
| 48,726 |
| $ | 409,475 |
|
Exchanged from associated funds |
|
| 11,142 |
|
| 79,397 |
|
| 29,355 |
|
| 253,333 |
|
Investment of distributions |
|
| 34,888 |
|
| 200,459 |
|
| 20,719 |
|
| 181,142 |
|
Total |
|
| 70,730 |
|
| 451,282 |
|
| 98,800 |
|
| 843,950 |
|
Cost of shares repurchased |
|
| (91,195 | ) |
| (563,467 | ) |
| (49,230 | ) |
| (426,781 | ) |
Exchanged into associated funds |
|
| (11,903 | ) |
| (83,045 | ) |
| (35,614 | ) |
| (308,936 | ) |
Converted to Class A* |
|
| (60,965 | ) |
| (312,569 | ) |
| (18,365 | ) |
| (156,913 | ) |
Total |
|
| (164,063 | ) |
| (959,081 | ) |
| (103,209 | ) |
| (892,630 | ) |
Decrease |
|
| (93,333 | ) | $ | (507,799 | ) |
| (4,409 | ) | $ | (48,680 | ) |
| |||||||||||||
Class C |
|
| Shares |
|
| Amount |
|
| Shares |
|
| Amount |
|
Net proceeds from sales of shares |
|
| 119,881 |
| $ | 780,126 |
|
| 89,734 |
| $ | 772,373 |
|
Exchanged from associated funds |
|
| 32,703 |
|
| 246,154 |
|
| 15,818 |
|
| 134,176 |
|
Investment of distributions |
|
| 74,213 |
|
| 420,647 |
|
| 30,596 |
|
| 267,336 |
|
Converted from Class D** |
|
| 144,365 |
|
| 1,188,123 |
|
| — |
|
| — |
|
Total |
|
| 371,162 |
|
| 2,635,050 |
|
| 136,148 |
|
| 1,173,885 |
|
Cost of shares repurchased |
|
| (163,653 | ) |
| (1,029,979 | ) |
| (92,513 | ) |
| (783,096 | ) |
Exchanged into associated funds |
|
| (72,242 | ) |
| (425,562 | ) |
| (16,239 | ) |
| (134,302 | ) |
Total |
|
| (235,895 | ) |
| (1,455,541 | ) |
| (108,752 | ) |
| (917,398 | ) |
Increase |
|
| 135,267 |
| $ | 1,179,509 |
|
| 27,396 |
| $ | 256,487 |
|
| |||||||||||||
Class D |
|
| Shares |
|
| Amount |
|
| Shares |
|
| Amount |
|
Net proceeds from sales of shares |
|
| 16,047 |
| $ | 123,701 |
|
| 42,664 |
| $ | 362,343 |
|
Exchanged from associated funds |
|
| 5,191 |
|
| 40,746 |
|
| 4,872 |
|
| 42,561 |
|
Investment of distributions |
|
| — |
|
| — |
|
| 5,502 |
|
| 48,006 |
|
Total |
|
| 21,238 |
|
| 164,447 |
|
| 53,038 |
|
| 452,910 |
|
Cost of shares repurchased |
|
| (23,683 | ) |
| (179,028 | ) |
| (26,285 | ) |
| (224,184 | ) |
Exchanged into associated funds |
|
| — |
|
| — |
|
| (5,991 | ) |
| (53,923 | ) |
Converted to Class C** |
|
| (144,365 | ) |
| (1,188,123 | ) |
| — |
|
| — |
|
Total |
|
| (168,048 | ) |
| (1,367,151 | ) |
| (32,276 | ) |
| (278,107 | ) |
Increase (decrease) |
|
| (146,810 | ) | $ | (1,202,704 | ) |
| 20,762 |
| $ | 174,803 |
|
|
See footnotes on page 30. |
27
Notes to Financial Statements
|
|
|
|
|
|
|
|
|
|
|
|
|
|
|
| Year Ended December 31, |
| ||||||||||
|
| ||||||||||||
Growth Fund |
| 2008† |
| 2007 |
| ||||||||
Class A |
|
| Shares |
|
| Amount |
|
| Shares |
|
| Amount |
|
Net proceeds from sales of shares |
|
| 342,656 |
| $ | 2,308,025 |
|
| 451,088 |
| $ | 3,939,264 |
|
Exchanged from associated funds |
|
| 398,074 |
|
| 1,714,522 |
|
| 320,972 |
|
| 2,868,610 |
|
Investment of distributions |
|
| 300,373 |
|
| 1,498,635 |
|
| 157,535 |
|
| 1,371,683 |
|
Converted from Class B* |
|
| 47,836 |
|
| 346,258 |
|
| 29,639 |
|
| 266,993 |
|
Total |
|
| 1,088,939 |
|
| 5,867,440 |
|
| 959,234 |
|
| 8,446,550 |
|
Cost of shares repurchased |
|
| (377,101 | ) |
| (2,372,525 | ) |
| (285,299 | ) |
| (2,477,480 | ) |
Exchanged into associated funds |
|
| (479,311 | ) |
| (2,617,389 | ) |
| (94,783 | ) |
| (857,922 | ) |
Total |
|
| (856,412 | ) |
| (4,989,914 | ) |
| (380,082 | ) |
| (3,335,402 | ) |
Increase |
|
| 232,527 |
| $ | 877,526 |
|
| 579,152 |
| $ | 5,111,148 |
|
| |||||||||||||
Class B |
|
| Shares |
|
| Amount |
|
| Shares |
|
| Amount |
|
Net proceeds from sales of shares |
|
| 43,415 |
| $ | 276,004 |
|
| 85,286 |
| $ | 713,946 |
|
Exchanged from associated funds |
|
| 13,646 |
|
| 94,137 |
|
| 196,447 |
|
| 1,648,186 |
|
Investment of distributions |
|
| 109,366 |
|
| 515,767 |
|
| 63,357 |
|
| 525,914 |
|
Total |
|
| 166,427 |
|
| 885,908 |
|
| 345,090 |
|
| 2,888,046 |
|
Cost of shares repurchased |
|
| (107,178 | ) |
| (681,153 | ) |
| (100,678 | ) |
| (847,600 | ) |
Exchanged into associated funds |
|
| (116,154 | ) |
| (722,283 | ) |
| (40,293 | ) |
| (352,439 | ) |
Converted to Class A* |
|
| (50,626 | ) |
| (346,348 | ) |
| (31,354 | ) |
| (267,490 | ) |
Total |
|
| (273,958 | ) |
| (1,749,784 | ) |
| (172,325 | ) |
| (1,467,529 | ) |
Increase (decrease) |
|
| (107,531 | ) | $ | (863,876 | ) |
| 172,765 |
| $ | 1,420,517 |
|
| |||||||||||||
Class C |
|
| Shares |
|
| Amount |
|
| Shares |
|
| Amount |
|
Net proceeds from sales of shares |
|
| 131,412 |
| $ | 759,518 |
|
| 114,290 |
| $ | 949,208 |
|
Exchanged from associated funds |
|
| 58,387 |
|
| 238,952 |
|
| 27,950 |
|
| 240,337 |
|
Investment of distributions |
|
| 234,879 |
|
| 1,094,673 |
|
| 99,350 |
|
| 823,597 |
|
Converted from Class D** |
|
| 272,951 |
|
| 2,139,936 |
|
| — |
|
| — |
|
Total |
|
| 697,629 |
|
| 4,233,079 |
|
| 241,590 |
|
| 2,013,142 |
|
Cost of shares repurchased |
|
| (304,405 | ) |
| (1,892,996 | ) |
| (216,138 | ) |
| (1,801,497 | ) |
Exchanged into associated funds |
|
| (82,501 | ) |
| (520,415 | ) |
| (22,296 | ) |
| (181,073 | ) |
Total |
|
| (386,906 | ) |
| (2,413,411 | ) |
| (238,434 | ) |
| (1,982,570 | ) |
Increase |
|
| 310,723 |
| $ | 1,819,668 |
|
| 3,156 |
| $ | 30,572 |
|
| |||||||||||||
Class D |
|
| Shares |
|
| Amount |
|
| Shares |
|
| Amount |
|
Net proceeds from sales of shares |
|
| 16,730 |
| $ | 123,877 |
|
| 35,025 |
| $ | 293,084 |
|
Exchanged from associated funds |
|
| 10,938 |
|
| 79,694 |
|
| 48,238 |
|
| 396,791 |
|
Investment of distributions |
|
| — |
|
| — |
|
| 19,729 |
|
| 163,159 |
|
Total |
|
| 27,668 |
|
| 203,571 |
|
| 102,992 |
|
| 853,034 |
|
Cost of shares repurchased |
|
| (25,277 | ) |
| (190,882 | ) |
| (54,939 | ) |
| (459,616 | ) |
Exchanged into associated funds |
|
| (2,076 | ) |
| (15,144 | ) |
| (5,393 | ) |
| (43,495 | ) |
Converted to Class C** |
|
| (272,951 | ) |
| (2,139,936 | ) |
| — |
|
| — |
|
Total |
|
| (300,304 | ) |
| (2,345,962 | ) |
| (60,332 | ) |
| (503,111 | ) |
Increase (decrease) |
|
| (272,636 | ) | $ | (2,142,391 | ) |
| 42,660 |
| $ | 349,923 |
|
|
See footnotes on page 30. |
28
Notes to Financial Statements
|
|
|
|
|
|
|
|
|
|
|
|
|
|
|
| Year Ended December 31, |
| ||||||||||
|
| ||||||||||||
Moderate Growth Fund |
| 2008† |
| 2007 |
| ||||||||
Class A |
|
| Shares |
|
| Amount |
|
| Shares |
|
| Amount |
|
Net proceeds from sales of shares |
|
| 288,023 |
| $ | 1,961,394 |
|
| 568,796 |
| $ | 4,645,333 |
|
Exchanged from associated funds |
|
| 470,419 |
|
| 2,217,860 |
|
| 122,974 |
|
| 1,006,152 |
|
Investment of distributions |
|
| 303,481 |
|
| 1,395,832 |
|
| 80,011 |
|
| 656,089 |
|
Converted from Class B* |
|
| 80,761 |
|
| 518,822 |
|
| 47,044 |
|
| 378,811 |
|
Total |
|
| 1,142,684 |
|
| 6,093,908 |
|
| 818,825 |
|
| 6,686,385 |
|
Cost of shares repurchased |
|
| (645,083 | ) |
| (4,134,553 | ) |
| (380,070 | ) |
| (3,095,547 | ) |
Exchanged into associated funds |
|
| (327,389 | ) |
| (1,765,297 | ) |
| (65,860 | ) |
| (542,727 | ) |
Total |
|
| (972,472 | ) |
| (5,899,850 | ) |
| (445,930 | ) |
| (3,638,274 | ) |
Increase |
|
| 170,212 |
| $ | 194,058 |
|
| 372,895 |
| $ | 3,048,111 |
|
| |||||||||||||
Class B |
|
| Shares |
|
| Amount |
|
| Shares |
|
| Amount |
|
Net proceeds from sales of shares |
|
| 28,766 |
| $ | 192,360 |
|
| 56,962 |
| $ | 465,976 |
|
Exchanged from associated funds |
|
| 50,456 |
|
| 357,076 |
|
| 21,979 |
|
| 177,213 |
|
Investment of distributions |
|
| 83,772 |
|
| 383,875 |
|
| 18,223 |
|
| 147,245 |
|
Total |
|
| 162,994 |
|
| 933,311 |
|
| 97,164 |
|
| 790,434 |
|
Cost of shares repurchased |
|
| (164,439 | ) |
| (983,316 | ) |
| (197,026 | ) |
| (1,611,159 | ) |
Exchanged into associated funds |
|
| (51,680 | ) |
| (289,391 | ) |
| (9,887 | ) |
| (77,923 | ) |
Converted to Class A* |
|
| (82,331 | ) |
| (518,822 | ) |
| (47,857 | ) |
| (378,784 | ) |
Total |
|
| (298,450 | ) |
| (1,791,529 | ) |
| (254,770 | ) |
| (2,067,866 | ) |
Decrease |
|
| (135,456 | ) | $ | (858,218 | ) |
| (157,606 | ) | $ | (1,277,432 | ) |
| |||||||||||||
Class C |
|
| Shares |
|
| Amount |
|
| Shares |
|
| Amount |
|
Net proceeds from sales of shares |
|
| 109,826 |
| $ | 657,570 |
|
| 121,843 |
| $ | 978,462 |
|
Exchanged from associated funds |
|
| 41,323 |
|
| 232,972 |
|
| 195,999 |
|
| 1,555,253 |
|
Investment of distributions |
|
| 248,909 |
|
| 1,125,164 |
|
| 44,656 |
|
| 360,818 |
|
Converted from Class D** |
|
| 475,251 |
|
| 3,740,222 |
|
| — |
|
| — |
|
Total |
|
| 875,309 |
|
| 5,755,928 |
|
| 362,498 |
|
| 2,894,533 |
|
Cost of shares repurchased |
|
| (407,790 | ) |
| (2,514,052 | ) |
| (177,718 | ) |
| (1,419,338 | ) |
Exchanged into associated funds |
|
| (399,329 | ) |
| (2,452,186 | ) |
| (191,813 | ) |
| (1,481,089 | ) |
Total |
|
| (807,119 | ) |
| (4,966,238 | ) |
| (369,531 | ) |
| (2,900,427 | ) |
Increase (decrease) |
|
| 68,190 |
| $ | 789,690 |
|
| (7,033 | ) | $ | (5,894 | ) |
| |||||||||||||
Class D |
|
| Shares |
|
| Amount |
|
| Shares |
|
| Amount |
|
Net proceeds from sales of shares |
|
| 35,238 |
| $ | 260,525 |
|
| 79,321 |
| $ | 639,260 |
|
Exchanged from associated funds |
|
| 13,295 |
|
| 96,833 |
|
| 13,936 |
|
| 114,023 |
|
Investment of distributions |
|
| — |
|
| — |
|
| 13,339 |
|
| 107,781 |
|
Total |
|
| 48,533 |
|
| 357,358 |
|
| 106,596 |
|
| 861,064 |
|
Cost of shares repurchased |
|
| (45,777 | ) |
| (334,597 | ) |
| (66,237 | ) |
| (536,380 | ) |
Exchanged into associated funds |
|
| (30,075 | ) |
| (219,080 | ) |
| (10,242 | ) |
| (86,386 | ) |
Converted to Class C** |
|
| (475,250 | ) |
| (3,740,222 | ) |
| — |
|
| — |
|
Total |
|
| (551,102 | ) |
| (4,293,899 | ) |
| (76,479 | ) |
| (622,766 | ) |
Increase (decrease) |
|
| (502,569 | ) | $ | (3,936,541 | ) |
| 30,117 |
| $ | 238,298 |
|
|
See footnotes on page 30. |
29
Notes to Financial Statements
|
|
|
|
|
|
|
|
|
|
|
|
|
|
|
| Year Ended December 31, |
| ||||||||||
|
|
| |||||||||||
Balanced Fund |
| 2008† |
| 2007 |
| ||||||||
| |||||||||||||
Class A |
| Shares |
| Amount |
| Shares |
| Amount |
| ||||
| |||||||||||||
Net proceeds from sales of shares |
|
| 147,679 |
| $ | 715,369 |
|
| 339,692 |
| $ | 2,216,114 |
|
Exchanged from associated funds |
|
| 248,550 |
|
| 1,154,006 |
|
| 145,994 |
|
| 944,290 |
|
Investment of distributions |
|
| 69,570 |
|
| 335,061 |
|
| 40,877 |
|
| 259,526 |
|
Converted from Class B* |
|
| 85,153 |
|
| 460,647 |
|
| 39,080 |
|
| 255,265 |
|
Total |
|
| 550,952 |
|
| 2,665,083 |
|
| 565,643 |
|
| 3,675,195 |
|
Cost of shares repurchased |
|
| (466,504 | ) |
| (2,252,144 | ) |
| (312,191 | ) |
| (2,050,056 | ) |
Exchanged into associated funds |
|
| (98,737 | ) |
| (460,240 | ) |
| (42,730 | ) |
| (274,440 | ) |
Total |
|
| (565,241 | ) |
| (2,712,384 | ) |
| (354,921 | ) |
| (2,324,496 | ) |
Increase (decrease) |
|
| (14,289 | ) | $ | (47,301 | ) |
| 210,722 |
| $ | 1,350,699 |
|
|
|
|
|
|
|
|
|
|
|
|
|
|
|
Class B |
| Shares |
| Amount |
| Shares |
| Amount |
| ||||
| |||||||||||||
Net proceeds from sales of shares |
|
| 22,699 |
| $ | 133,235 |
|
| 15,086 |
| $ | 97,476 |
|
Exchanged from associated funds |
|
| 44,132 |
|
| 233,310 |
|
| 82,120 |
|
| 527,626 |
|
Investment of distributions |
|
| 12,988 |
|
| 63,281 |
|
| 9,368 |
|
| 59,189 |
|
Total |
|
| 79,819 |
|
| 429,826 |
|
| 106,574 |
|
| 684,291 |
|
Cost of shares repurchased |
|
| (135,996 | ) |
| (719,218 | ) |
| (79,761 | ) |
| (517,820 | ) |
Exchanged into associated funds |
|
| (29,265 | ) |
| (127,583 | ) |
| (12,744 | ) |
| (81,125 | ) |
Converted to Class A* |
|
| (85,138 | ) |
| (460,568 | ) |
| (39,072 | ) |
| (255,274 | ) |
Total |
|
| (250,399 | ) |
| (1,307,369 | ) |
| (131,577 | ) |
| (854,219 | ) |
Decrease |
|
| (170,580 | ) | $ | (877,543 | ) |
| (25,003 | ) | $ | (169,928 | ) |
|
|
|
|
|
|
|
|
|
|
|
|
|
|
Class C |
| Shares |
| Amount |
| Shares |
| Amount |
| ||||
| |||||||||||||
Net proceeds from sales of shares |
|
| 73,343 |
| $ | 417,146 |
|
| 85,557 |
| $ | 560,927 |
|
Exchanged from associated funds |
|
| 149,868 |
|
| 794,043 |
|
| 48,638 |
|
| 312,784 |
|
Investment of distributions |
|
| 49,454 |
|
| 234,710 |
|
| 22,355 |
|
| 141,094 |
|
Converted from Class D** |
|
| 300,471 |
|
| 1,895,975 |
|
| — |
|
| — |
|
Total |
|
| 573,136 |
|
| 3,341,874 |
|
| 156,550 |
|
| 1,014,805 |
|
Cost of shares repurchased |
|
| (241,663 | ) |
| (1,267,791 | ) |
| (146,057 | ) |
| (949,986 | ) |
Exchanged into associated funds |
|
| (185,532 | ) |
| (902,094 | ) |
| (16,261 | ) |
| (105,485 | ) |
Total |
|
| (427,195 | ) |
| (2,169,885 | ) |
| (162,318 | ) |
| (1,055,471 | ) |
Increase (decrease) |
|
| 145,941 |
| $ | 1,171,989 |
|
| (5,768 | ) | $ | (40,666 | ) |
|
|
|
|
|
|
|
|
|
|
|
|
|
|
Class D |
| Shares |
| Amount |
| Shares |
| Amount |
| ||||
| |||||||||||||
Net proceeds from sales of shares |
|
| 18,176 |
| $ | 107,067 |
|
| 41,026 |
| $ | 269,484 |
|
Exchanged from associated funds |
|
| 27,892 |
|
| 165,734 |
|
| 23,610 |
|
| 153,342 |
|
Investment of distributions |
|
| 1,603 |
|
| 9,472 |
|
| 7,993 |
|
| 50,438 |
|
Total |
|
| 47,671 |
|
| 282,273 |
|
| 72,629 |
|
| 473,264 |
|
Cost of shares repurchased |
|
| (50,285 | ) |
| (301,554 | ) |
| (33,002 | ) |
| (211,808 | ) |
Exchanged into associated funds |
|
| — |
|
| — |
|
| (1,576 | ) |
| (10,213 | ) |
Converted to Class C** |
|
| (300,471 | ) |
| (1,895,975 | ) |
| — |
|
| — |
|
Total |
|
| (350,756 | ) |
| (2,197,529 | ) |
| (34,578 | ) |
| (222,021 | ) |
Increase (decrease) |
|
| (303,085 | ) | $ | (1,915,256 | ) |
| 38,051 |
| $ | 251,243 |
|
|
|
|
|
|
|
|
|
|
|
|
|
|
|
|
|
|
| * | Automatic conversion of Class B shares to Class A shares approximately eight years after the initial purchase date. The amounts of dividends accrued on Class B shares between the last dividend payment date and the conversion date is invested in Class A shares and is included in the conversion from Class B amount. |
|
|
|
| ** | Effective May 16, 2008, Class D shares were converted to Class C shares. |
|
|
|
| † | January 1, 2008 to May 16, 2008, in the case of Class D shares. |
30
Notes to Financial Statements
|
|
8. | Affiliated Issuers — Each Fund invests in certain securities of open-end registered investment companies that are part of the same group of investment companies (the Seligman Group). As defined under the Investment Company Act of 1940, as amended, an affiliated issuer is one in which a fund owns 5% or more of the outstanding voting securities, or an issuer which is under common ownership or control. Each Fund and each of the investment companies in which that Fund invests may be deemed to be affiliates of one another. A summary of each Fund’s transactions in the securities of affiliated issuers during the year ended December 31, 2008, is as follows: |
|
|
|
|
|
|
|
|
|
|
|
|
|
|
|
|
|
|
|
|
|
|
|
|
| Value |
| |||||||
|
| Purchases |
| Sales |
| Dividend |
|
| ||||||||
Affiliated Issuer |
|
|
|
| 12/31/08 |
| 12/31/07 |
| ||||||||
| ||||||||||||||||
Aggressive Growth Fund |
|
|
|
|
|
|
|
|
|
|
|
|
|
|
|
|
Seligman Capital Fund |
| $ | 664,935 |
| $ | 984,519 |
| $ | — |
| $ | 2,481,829 |
| $ | 5,289,316 |
|
Seligman Communications and Information Fund |
|
| 262,547 |
|
| 1,077,203 |
|
| — |
|
| 1,790,426 |
|
| 3,889,677 |
|
Seligman Frontier Fund |
|
| 79,890 |
|
| 147,841 |
|
| — |
|
| 343,856 |
|
| 697,044 |
|
Seligman Growth Fund |
|
| 40,814 |
|
| 124,317 |
|
| — |
|
| 336,390 |
|
| 723,993 |
|
Seligman Large-Cap Value Fund |
|
| 83,904 |
|
| 220,774 |
|
| 2,980 |
|
| 337,387 |
|
| 730,139 |
|
Seligman Smaller-Cap Value Fund |
|
| 491,892 |
|
| 762,541 |
|
| — |
|
| 1,489,944 |
|
| 3,073,404 |
|
Seligman Emerging Markets Fund |
|
| 501,128 |
|
| 346,418 |
|
| — |
|
| 1,107,971 |
|
| 2,390,916 |
|
Seligman Global Smaller Companies Fund |
|
| 447,676 |
|
| 656,627 |
|
| — |
|
| 2,234,529 |
|
| 4,803,150 |
|
Seligman International Growth Fund |
|
| 320,631 |
|
| 185,074 |
|
| — |
|
| 539,212 |
|
| 1,180,863 |
|
Seligman LaSalle Global Real Estate Fund† |
|
| 313,931 |
|
| 357,311 |
|
| 16,136 |
|
| 558,688 |
|
| 1,172,643 |
|
Total |
| $ | 3,207,348 |
| $ | 4,862,625 |
| $ | 19,116 |
| $ | 11,220,232 |
| $ | 23,951,145 |
|
Growth Fund |
|
|
|
|
|
|
|
|
|
|
|
|
|
|
|
|
Seligman Capital Fund |
| $ | 739,669 |
| $ | 1,224,892 |
| $ | — |
| $ | 2,729,377 |
| $ | 5,692,210 |
|
Seligman Communications and Information Fund |
|
| 395,412 |
|
| 1,178,027 |
|
| — |
|
| 1,785,042 |
|
| 3,728,396 |
|
Seligman Frontier Fund |
|
| 130,371 |
|
| 297,531 |
|
| — |
|
| 547,172 |
|
| 1,132,153 |
|
Seligman Growth Fund |
|
| 337,062 |
|
| 786,964 |
|
| — |
|
| 1,610,672 |
|
| 3,383,959 |
|
Seligman Large-Cap Value Fund |
|
| 399,938 |
|
| 994,391 |
|
| 12,718 |
|
| 1,631,834 |
|
| 3,327,099 |
|
Seligman Smaller-Cap Value Fund |
|
| 794,598 |
|
| 1,305,947 |
|
| — |
|
| 2,195,900 |
|
| 4,469,540 |
|
Seligman Emerging Markets Fund† |
|
| 1,178,168 |
|
| 1,078,885 |
|
| — |
|
| 1,804,507 |
|
| 3,800,704 |
|
Seligman Global Smaller Companies Fund† |
|
| 541,567 |
|
| 1,000,516 |
|
| — |
|
| 3,067,442 |
|
| 6,412,298 |
|
Seligman International Growth Fund† |
|
| 470,612 |
|
| 315,184 |
|
| — |
|
| 888,995 |
|
| 1,891,005 |
|
Seligman LaSalle Global Real Estate Fund† |
|
| 1,103,734 |
|
| 1,435,402 |
|
| 48,220 |
|
| 1,799,584 |
|
| 3,761,616 |
|
Total |
| $ | 6,091,131 |
| $ | 9,617,739 |
| $ | 60,938 |
| $ | 18,060,525 |
| $ | 37,598,980 |
|
Moderate Growth Fund |
|
|
|
|
|
|
|
|
|
|
|
|
|
|
|
|
Seligman Capital Fund |
| $ | 1,619,739 |
| $ | 2,773,098 |
| $ | — |
| $ | 3,939,121 |
| $ | 8,842,282 |
|
Seligman Communications and Information Fund |
|
| 548,704 |
|
| 1,771,169 |
|
| — |
|
| 1,933,040 |
|
| 4,501,794 |
|
Seligman Growth Fund |
|
| 463,813 |
|
| 1,246,613 |
|
| — |
|
| 1,744,469 |
|
| 4,026,196 |
|
Seligman Large-Cap Value Fund |
|
| 527,692 |
|
| 1,532,483 |
|
| 13,531 |
|
| 1,767,393 |
|
| 4,005,455 |
|
Seligman Smaller-Cap Value Fund |
|
| 452,873 |
|
| 951,824 |
|
| — |
|
| 1,386,835 |
|
| 3,048,983 |
|
Seligman High-Yield Fund |
|
| 1,196,352 |
|
| 2,296,393 |
|
| 310,411 |
|
| 1,914,627 |
|
| 4,370,584 |
|
Seligman Emerging Markets Fund |
|
| 659,312 |
|
| 692,321 |
|
| — |
|
| 975,987 |
|
| 2,189,430 |
|
Seligman Global Smaller Companies Fund |
|
| 407,366 |
|
| 767,325 |
|
| — |
|
| 1,952,755 |
|
| 4,252,863 |
|
Seligman International Growth Fund† |
|
| 1,057,268 |
|
| 874,600 |
|
| — |
|
| 1,927,981 |
|
| 4,368,828 |
|
Seligman LaSalle Global Real Estate Fund† |
|
| 1,403,503 |
|
| 1,870,521 |
|
| 54,400 |
|
| 1,905,396 |
|
| 4,242,195 |
|
Total |
| $ | 8,336,622 |
| $ | 14,776,347 |
| $ | 378,342 |
| $ | 19,447,604 |
| $ | 43,848,610 |
|
|
|
|
|
|
|
|
|
|
|
|
|
|
|
|
|
|
|
|
| See footnote on page 32. |
31
Notes to Financial Statements
|
|
|
|
|
|
|
|
|
|
|
|
|
|
|
|
|
|
|
|
|
|
|
|
| Value |
| |||||||
|
| Purchases |
| Sales |
| Dividend |
|
| ||||||||
Affiliated Issuer |
|
|
|
| 12/31/08 |
| 12/31/07 |
| ||||||||
| ||||||||||||||||
Balanced Fund |
|
|
|
|
|
|
|
|
|
|
|
|
|
|
|
|
Seligman Capital Fund |
| $ | 607,038 |
| $ | 569,381 |
| $ | — |
| $ | 1,015,928 |
| $ | 1,850,664 |
|
Seligman Common Stock Fund |
|
| 405,891 |
|
| 320,209 |
|
| 35,559 |
|
| 1,108,378 |
|
| 2,009,093 |
|
Seligman Growth Fund |
|
| 538,504 |
|
| 603,035 |
|
| — |
|
| 1,206,381 |
|
| 2,205,988 |
|
Seligman Large-Cap Value Fund |
|
| 455,484 |
|
| 653,649 |
|
| 9,507 |
|
| 1,218,300 |
|
| 2,181,955 |
|
Seligman Cash Management Fund |
|
| 263,602 |
|
| 686,714 |
|
| 9,265 |
|
| 483,723 |
|
| 906,835 |
|
Seligman Core Fixed Income Fund† |
|
| 605,957 |
|
| 1,356,411 |
|
| 63,156 |
|
| 957,201 |
|
| 1,828,985 |
|
Seligman High-Yield Fund |
|
| 485,930 |
|
| 669,778 |
|
| 144,436 |
|
| 982,641 |
|
| 1,813,671 |
|
Seligman U.S. Government Securities Fund |
|
| 275,080 |
|
| 729,515 |
|
| 22,761 |
|
| 482,407 |
|
| 908,142 |
|
Seligman International Growth Fund† |
|
| 662,983 |
|
| 314,528 |
|
| — |
|
| 990,256 |
|
| 1,869,080 |
|
Seligman LaSalle Monthly Dividend Real Estate Fund† |
|
| 1,516,612 |
|
| 1,572,942 |
|
| 123,582 |
|
| 1,603,094 |
|
| 2,693,120 |
|
Total |
| $ | 5,817,081 |
| $ | 7,476,162 |
| $ | 408,266 |
| $ | 10,048,309 |
| $ | 18,267,533 |
|
|
|
|
|
|
|
|
|
|
|
|
|
|
|
|
|
|
|
|
|
| † | Fund’s holdings representing 5% or more of the outstanding voting securities. |
|
|
9. | Other Matters — In late 2003, JWS conducted an extensive internal review concerning mutual fund trading practices. JWS’s review, which covered the period 2001-2003, noted one arrangement that permitted frequent trading in certain open-end registered investment companies then managed by JWS (the “Seligman Funds”); this arrangement was in the process of being closed down by JWS before September 2003. JWS identified three other arrangements that permitted frequent trading, all of which had been terminated by September 2002. In January 2004, JWS, on a voluntary basis, publicly disclosed these four arrangements to its clients and to shareholders of the Seligman Funds. JWS also provided information concerning mutual fund trading practices to the SEC and the Office of the Attorney General of the State of New York (“NYAG”). |
|
|
| In September 2005, the New York staff of the SEC indicated that it was considering recommending to the Commissioners of the SEC the instituting of a formal action against JWS and the Distributor relating to frequent trading in the Seligman Funds. JWS responded to the staff in October 2005 that it believed that any action would be both inappropriate and unnecessary, especially in light of the fact that JWS had previously resolved the underlying issue with the Independent Directors of the Seligman Funds and made recompense to the affected Seligman Funds. |
|
|
| In September 2006, the NYAG commenced a civil action in New York State Supreme Court against JWS, the Distributor, Seligman Data Corp. and Brian T. Zino (collectively, the “Seligman Parties”), alleging, in substance, that, in addition to the four arrangements noted above, the Seligman Parties permitted other persons to engage in frequent trading and, as a result, the prospectus disclosure used by the registered investment companies then managed by JWS is and has been misleading. The NYAG included other related claims and also claimed that the fees charged by JWS to the Seligman Funds were excessive. The NYAG is seeking damages of at least $80 million and restitution, disgorgement, penalties and costs and injunctive relief. The Seligman Parties answered the complaint in December 2006 and believe that the claims are without merit. |
|
|
| Any resolution of these matters may include the relief noted above or other sanctions or changes in procedures. Any damages would be paid by JWS and not by the Seligman Funds. If the NYAG obtains injunctive relief, each of JWS, RiverSource and their affiliates could, in the absence of the SEC in its discretion granting exemptive relief, be enjoined from providing advisory and underwriting services to the Seligman Funds and other registered investment companies, including those funds in the RiverSource complex. |
32
Notes to Financial Statements
|
|
| Neither JWS nor RiverSource believes that the foregoing legal action or other possible actions will have a material adverse impact on JWS, RiverSource or their current and former clients, including the Seligman Funds and other investment companies managed by RiverSource; however, there can be no assurance of this or that these matters and any related publicity will not affect demand for shares of the Seligman Funds and such other investment companies or have other adverse consequences. |
|
|
10. | Subsequent Events — On January 8, 2009, the Series’ Board approved in principle the merger of the Funds as follows: Asset Allocation Aggressive Growth Fund and Asset Allocation Growth Fund will merge into the RiverSource Portfolio Builder Total Equity Fund; Asset Allocation Balanced Fund will merge into RiverSource Portfolio Builder Moderate Aggressive Fund; and Asset Allocation Moderate Growth Fund will merge into RiverSource Portfolio Builder Aggressive Fund. The completion of each merger is subject to approval by shareholders of the respective Fund. It is currently anticipated that proxy materials regarding the mergers will be distributed to shareholders of the Funds during the first or second quarter of 2009, and that a special meeting of shareholders to consider such mergers will be scheduled for the second quarter of 2009. |
33
The tables below are intended to help you understand the financial performance of each Class of each Fund for the periods presented. Certain information reflects financial results for a single share of a Class that was held throughout the periods shown. Per share amounts are calculated using average shares outstanding during the period. Total return shows the rate that you would have earned (or lost) on an investment in each Class, assuming you reinvested all your dividends and capital gain distributions, if any. Total returns do not reflect any sales charges, fees or transaction costs on your investments or taxes investors may incur on distributions or on the redemption of shares, and are not annualized for periods of less than one year.
Aggressive Growth Fund
|
|
|
|
|
|
|
|
|
|
|
|
|
|
|
|
|
|
| Year Ended December 31, | ||||||||||||||
|
| |||||||||||||||
Class A |
| 2008 |
| 2007 |
| 2006 |
| 2005 |
| 2004 |
| |||||
Per Share Data: |
|
|
|
|
|
|
|
|
|
|
|
|
|
|
|
|
Net Asset Value, Beginning of Year |
| $ | 8.81 |
| $ | 8.27 |
| $ | 7.25 |
| $ | 6.56 |
| $ | 5.68 |
|
Income (Loss) from Investment Operations: |
|
|
|
|
|
|
|
|
|
|
|
|
|
|
|
|
Net investment loss |
|
| (0.02 | ) |
| (0.03 | ) |
| (0.03 | ) |
| (0.03 | ) |
| (0.03 | ) |
Net realized and unrealized gain (loss) on investments |
|
| (3.87 | ) |
| 1.11 |
|
| 1.23 |
|
| 0.72 |
|
| 0.91 |
|
Total from Investment Operations |
|
| (3.89 | ) |
| 1.08 |
|
| 1.20 |
|
| 0.69 |
|
| 0.88 |
|
Less Distributions to Shareholders: |
|
|
|
|
|
|
|
|
|
|
|
|
|
|
|
|
Net realized short-term capital gains |
|
| — |
|
| (0.16 | ) |
| (0.12 | ) |
| — |
|
| — |
|
Net realized long-term capital gains |
|
| (0.58 | ) |
| (0.38 | ) |
| (0.06 | ) |
| — |
|
| — |
|
Total Distributions |
|
| (0.58 | ) |
| (0.54 | ) |
| (0.18 | ) |
| — |
|
| — |
|
Net Asset Value, End of Year |
| $ | 4.34 |
| $ | 8.81 |
| $ | 8.27 |
| $ | 7.25 |
| $ | 6.56 |
|
Total Return |
|
| (45.80 | )% |
| 12.86 | % |
| 16.62 | % |
| 10.52 | % |
| 15.49 | %# |
Ratios/Supplemental Data: |
|
|
|
|
|
|
|
|
|
|
|
|
|
|
|
|
Net assets, end of year (000s omitted) |
| $ | 6,343 |
| $ | 13,253 |
| $ | 9,007 |
| $ | 5,747 |
| $ | 4,230 |
|
Ratio of expenses to average net assets |
|
| 0.40 | % |
| 0.40 | % |
| 0.40 | % |
| 0.42 | % |
| 0.51 | % |
Ratio of net investment loss to average net assets |
|
| (0.33 | )% |
| (0.29 | )% |
| (0.40 | )% |
| (0.42 | )% |
| (0.50 | )% |
Portfolio turnover rate |
|
| 16.67 | % |
| 6.33 | % |
| 1.27 | % |
| 2.27 | % |
| 2.79 | % |
Without fee waiver and expense reimbursement:* |
|
|
|
|
|
|
|
|
|
|
|
|
|
|
|
|
Ratio of expenses to average net assets |
|
| 0.76 | % |
| 0.60 | % |
| 0.71 | % |
| 1.03 | % |
| 1.22 | % |
Ratio of net investment loss to average net assets |
|
| (0.69 | )% |
| (0.49 | )% |
| (0.71 | )% |
| (1.03 | )% |
| (1.21 | )% |
|
See footnotes on page 49. |
34
Financial Highlights
Aggressive Growth Fund (continued)
|
|
|
|
|
|
|
|
|
|
|
|
|
|
|
|
|
|
| Year Ended December 31, | ||||||||||||||
|
| |||||||||||||||
Class B |
| 2008 |
| 2007 |
| 2006 |
| 2005 |
| 2004 |
| |||||
Per Share Data: |
|
|
|
|
|
|
|
|
|
|
|
|
|
|
|
|
Net Asset Value, Beginning of Year |
| $ | 8.42 |
| $ | 7.92 |
| $ | 6.95 |
| $ | 6.33 |
| $ | 5.53 |
|
Income (Loss) from Investment Operations: |
|
|
|
|
|
|
|
|
|
|
|
|
|
|
|
|
Net investment loss |
|
| (0.07 | ) |
| (0.09 | ) |
| (0.09 | ) |
| (0.08 | ) |
| (0.07 | ) |
Net realized and unrealized gain (loss) on investments |
|
| (3.67 | ) |
| 1.06 |
|
| 1.18 |
|
| 0.70 |
|
| 0.87 |
|
Total from Investment Operations |
|
| (3.74 | ) |
| 0.97 |
|
| 1.09 |
|
| 0.62 |
|
| 0.80 |
|
Less Distributions to Shareholders: |
|
|
|
|
|
|
|
|
|
|
|
|
|
|
|
|
Net realized short-term capital gains |
|
| — |
|
| (0.09 | ) |
| (0.06 | ) |
| — |
|
| — |
|
Net realized long-term capital gains |
|
| (0.58 | ) |
| (0.38 | ) |
| (0.06 | ) |
| — |
|
| — |
|
Total Distributions |
|
| (0.58 | ) |
| (0.47 | ) |
| (0.12 | ) |
| — |
|
| — |
|
Net Asset Value, End of Year |
| $ | 4.10 |
| $ | 8.42 |
| $ | 7.92 |
| $ | 6.95 |
| $ | 6.33 |
|
Total Return |
|
| (46.15 | )% |
| 12.01 | % |
| 15.76 | % |
| 9.79 | % |
| 14.47 | %# |
Ratios/Supplemental Data: |
|
|
|
|
|
|
|
|
|
|
|
|
|
|
|
|
Net assets, end of year (000s omitted) |
| $ | 1,629 |
| $ | 4,133 |
| $ | 3,925 |
| $ | 3,001 |
| $ | 2,060 |
|
Ratio of expenses to average net assets |
|
| 1.15 | % |
| 1.15 | % |
| 1.16 | % |
| 1.18 | % |
| 1.26 | % |
Ratio of net investment loss to average net assets |
|
| (1.08 | )% |
| (1.04 | )% |
| (1.16 | )% |
| (1.18 | )% |
| (1.25 | )% |
Portfolio turnover rate |
|
| 16.67 | % |
| 6.33 | % |
| 1.27 | % |
| 2.27 | % |
| 2.79 | % |
Without fee waiver and expense reimbursement:* |
|
|
|
|
|
|
|
|
|
|
|
|
|
|
|
|
Ratio of expenses to average net assets |
|
| 1.51 | % |
| 1.35 | % |
| 1.47 | % |
| 1.79 | % |
| 1.97 | % |
Ratio of net investment loss to average net assets |
|
| (1.44 | )% |
| (1.24 | )% |
| (1.47 | )% |
| (1.79 | )% |
| (1.96 | )% |
|
See footnotes on page 49. |
35
Financial Highlights
Aggressive Growth Fund (continued)
|
|
|
|
|
|
|
|
|
|
|
|
|
|
|
|
|
|
| Year Ended December 31, | ||||||||||||||
|
| |||||||||||||||
Class C |
| 2008 |
| 2007 |
| 2006 |
| 2005 |
| 2004 |
| |||||
Per Share Data: |
|
|
|
|
|
|
|
|
|
|
|
|
|
|
|
|
Net Asset Value, Beginning of Year |
| $ | 8.42 |
| $ | 7.92 |
| $ | 6.95 |
| $ | 6.33 |
| $ | 5.53 |
|
Income (Loss) from Investment Operations: |
|
|
|
|
|
|
|
|
|
|
|
|
|
|
|
|
Net investment loss |
|
| (0.07 | ) |
| (0.09 | ) |
| (0.09 | ) |
| (0.08 | ) |
| (0.07 | ) |
Net realized and unrealized gain (loss) on investments |
|
| (3.67 | ) |
| 1.06 |
|
| 1.18 |
|
| 0.70 |
|
| 0.87 |
|
Total from Investment Operations |
|
| (3.74 | ) |
| 0.97 |
|
| 1.09 |
|
| 0.62 |
|
| 0.80 |
|
Less Distributions to Shareholders: |
|
|
|
|
|
|
|
|
|
|
|
|
|
|
|
|
Net realized short-term capital gains |
|
| — |
|
| (0.09 | ) |
| (0.06 | ) |
| — |
|
| — |
|
Net realized long-term capital gains |
|
| (0.58 | ) |
| (0.38 | ) |
| (0.06 | ) |
| — |
|
| — |
|
Total Distributions |
|
| (0.58 | ) |
| (0.47 | ) |
| (0.12 | ) |
| — |
|
| — |
|
Net Asset Value, End of Year |
| $ | 4.10 |
| $ | 8.42 |
| $ | 7.92 |
| $ | 6.95 |
| $ | 6.33 |
|
Total Return |
|
| (46.15 | )% |
| 12.01 | % |
| 15.76 | % |
| 9.79 | % |
| 14.47 | %# |
Ratios/Supplemental Data: |
|
|
|
|
|
|
|
|
|
|
|
|
|
|
|
|
Net assets, end of year (000s omitted) |
| $ | 3,165 |
| $ | 5,367 |
| $ | 4,832 |
| $ | 3,420 |
| $ | 2,755 |
|
Ratio of expenses to average net assets |
|
| 1.16 | % |
| 1.16 | % |
| 1.16 | % |
| 1.18 | % |
| 1.26 | % |
Ratio of net investment loss to average net assets |
|
| (1.09 | )% |
| (1.05 | )% |
| (1.16 | )% |
| (1.18 | )% |
| (1.25 | )% |
Portfolio turnover rate |
|
| 16.67 | % |
| 6.33 | % |
| 1.27 | % |
| 2.27 | % |
| 2.79 | % |
Without fee waiver and expense reimbursement:* |
|
|
|
|
|
|
|
|
|
|
|
|
|
|
|
|
Ratio of expenses to average net assets |
|
| 1.52 | % |
| 1.36 | % |
| 1.47 | % |
| 1.79 | % |
| 1.97 | % |
Ratio of net investment loss to average net assets |
|
| (1.45 | )% |
| (1.25 | )% |
| (1.47 | )% |
| (1.79 | )% |
| (1.96 | )% |
|
See footnotes on page 49. |
36
Financial Highlights
Aggressive Growth Fund (continued)
|
|
|
|
|
|
|
|
|
|
|
|
|
|
|
|
|
|
| 1/1/08 |
| Year Ended December 31, | ||||||||||||
|
|
| ||||||||||||||
Class D |
|
| 2007 |
| 2006 |
| 2005 |
| 2004 |
| ||||||
Per Share Data: |
|
|
|
|
|
|
|
|
|
|
|
|
|
|
|
|
Net Asset Value, Beginning of Period |
| $ | 8.42 |
| $ | 7.92 |
| $ | 6.95 |
| $ | 6.33 |
| $ | 5.53 |
|
Income (Loss) from Investment Operations: |
|
|
|
|
|
|
|
|
|
|
|
|
|
|
|
|
Net investment loss |
|
| (0.03 | ) |
| (0.09 | ) |
| (0.09 | ) |
| (0.08 | ) |
| (0.07 | ) |
Net realized and unrealized gain (loss) on investments |
|
| (0.16 | ) |
| 1.06 |
|
| 1.18 |
|
| 0.70 |
|
| 0.87 |
|
Total from Investment Operations |
|
| (0.19 | ) |
| 0.97 |
|
| 1.09 |
|
| 0.62 |
|
| 0.80 |
|
Less Distributions to Shareholders: |
|
|
|
|
|
|
|
|
|
|
|
|
|
|
|
|
Net realized short-term capital gains |
|
| — |
|
| (0.09 | ) |
| (0.06 | ) |
| — |
|
| — |
|
Net realized long-term capital gains |
|
| — |
|
| (0.38 | ) |
| (0.06 | ) |
| — |
|
| — |
|
Total Distributions |
|
| — |
|
| (0.47 | ) |
| (0.12 | ) |
| — |
|
| — |
|
Net Asset Value, End of Period |
| $ | 8.23 |
| $ | 8.42 |
| $ | 7.92 |
| $ | 6.95 |
| $ | 6.33 |
|
Total Return |
|
| (2.26 | )% |
| 12.01 | % |
| 15.76 | % |
| 9.79 | % |
| 14.47 | %# |
Ratios/Supplemental Data: |
|
|
|
|
|
|
|
|
|
|
|
|
|
|
|
|
Net assets, end of period (000s omitted) |
|
| — |
| $ | 1,235 |
| $ | 998 |
| $ | 876 |
| $ | 768 |
|
Ratio of expenses to average net assets |
|
| 1.16 | %† |
| 1.16 | % |
| 1.16 | % |
| 1.18 | % |
| 1.26 | % |
Ratio of net investment loss to average net assets |
|
| (1.16 | )%† |
| (1.05 | )% |
| (1.16 | )% |
| (1.18 | )% |
| (1.25 | )% |
Portfolio turnover rate |
|
| 16.67 | %†† |
| 6.33 | % |
| 1.27 | % |
| 2.27 | % |
| 2.79 | % |
Without fee waiver and expense reimbursement:* |
|
|
|
|
|
|
|
|
|
|
|
|
|
|
|
|
Ratio of expenses to average net assets |
|
| 1.42 | %† |
| 1.36 | % |
| 1.47 | % |
| 1.79 | % |
| 1.97 | % |
Ratio of net investment loss to average net assets |
|
| (1.42 | )%† |
| (1.25 | )% |
| (1.47 | )% |
| (1.79 | )% |
| (1.96 | )% |
|
See footnotes on page 49. |
37
Financial Highlights
Growth Fund
|
|
|
|
|
|
|
|
|
|
|
|
|
|
|
|
|
|
| Year Ended December 31, | ||||||||||||||
|
| |||||||||||||||
Class A |
| 2008 |
| 2007 |
| 2006 |
| 2005 |
| 2004 |
| |||||
Per Share Data: |
|
|
|
|
|
|
|
|
|
|
|
|
|
|
|
|
Net Asset Value, Beginning of Year |
| $ | 8.40 |
| $ | 8.16 |
| $ | 7.18 |
| $ | 6.53 |
| $ | 5.67 |
|
Income (Loss) from Investment Operations: |
|
|
|
|
|
|
|
|
|
|
|
|
|
|
|
|
Net investment loss |
|
| (0.02 | ) |
| (0.01 | ) |
| — | ø |
| (0.03 | ) |
| (0.03 | ) |
Net realized and unrealized gain (loss) on investments |
|
| (3.66 | ) |
| 0.99 |
|
| 1.16 |
|
| 0.68 |
|
| 0.89 |
|
Total from Investment Operations |
|
| (3.68 | ) |
| 0.98 |
|
| 1.16 |
|
| 0.65 |
|
| 0.86 |
|
Less Distributions to Shareholders: |
|
|
|
|
|
|
|
|
|
|
|
|
|
|
|
|
Net realized short-term capital gains |
|
| — |
|
| (0.15 | ) |
| (0.08 | ) |
| — |
|
| — |
|
Net realized long-term capital gains |
|
| (0.78 | ) |
| (0.59 | ) |
| (0.10 | ) |
| — |
|
| — |
|
Total Distributions |
|
| (0.78 | ) |
| (0.74 | ) |
| (0.18 | ) |
| — |
|
| — |
|
Net Asset Value, End of Year |
| $ | 3.94 |
| $ | 8.40 |
| $ | 8.16 |
| $ | 7.18 |
| $ | 6.53 |
|
Total Return |
|
| (45.51 | )% |
| 11.84 | % |
| 16.30 | % |
| 9.79 | % |
| 15.34 | %# |
Ratios/Supplemental Data: |
|
|
|
|
|
|
|
|
|
|
|
|
|
|
|
|
Net assets, end of year (000s omitted) |
| $ | 9,072 |
| $ | 17,405 |
| $ | 12,189 |
| $ | 9,133 |
| $ | 7,179 |
|
Ratio of expenses to average net assets |
|
| 0.40 | % |
| 0.40 | % |
| 0.40 | % |
| 0.42 | % |
| 0.50 | % |
Ratio of net investment loss to average net assets |
|
| (0.25 | )% |
| (0.15 | )% |
| (0.39 | )% |
| (0.42 | )% |
| (0.47 | )% |
Portfolio turnover rate |
|
| 21.06 | % |
| 17.87 | % |
| 5.63 | % |
| 5.42 | % |
| 5.50 | % |
Without fee waiver and expense reimbursement:* |
|
|
|
|
|
|
|
|
|
|
|
|
|
|
|
|
Ratio of expenses to average net assets |
|
| 0.62 | % |
| 0.49 | % |
| 0.53 | % |
| 0.67 | % |
| 0.75 | % |
Ratio of net investment loss to average net assets |
|
| (0.47 | )% |
| (0.24 | )% |
| (0.52 | )% |
| (0.67 | )% |
| (0.72 | )% |
See footnotes on page 49. |
38
Financial Highlights
Growth Fund (continued)
|
|
|
|
|
|
|
|
|
|
|
|
|
|
|
|
|
|
| Year Ended December 31, | ||||||||||||||
|
| |||||||||||||||
Class B |
| 2008 |
| 2007 |
| 2006 |
| 2005 |
| 2004 |
| |||||
Per Share Data: |
|
|
|
|
|
|
|
|
|
|
|
|
|
|
|
|
Net Asset Value, Beginning of Year |
| $ | 7.97 |
| $ | 7.77 |
| $ | 6.85 |
| $ | 6.28 |
| $ | 5.49 |
|
Income (Loss) from Investment Operations: |
|
|
|
|
|
|
|
|
|
|
|
|
|
|
|
|
Net investment loss |
|
| (0.06 | ) |
| (0.08 | ) |
| (0.08 | ) |
| (0.08 | ) |
| (0.07 | ) |
Net realized and unrealized gain (loss) on investments |
|
| (3.46 | ) |
| 0.95 |
|
| 1.12 |
|
| 0.65 |
|
| 0.86 |
|
Total from Investment Operations |
|
| (3.52 | ) |
| 0.87 |
|
| 1.04 |
|
| 0.57 |
|
| 0.79 |
|
Less Distributions to Shareholders: |
|
|
|
|
|
|
|
|
|
|
|
|
|
|
|
|
Net realized short-term capital gains |
|
| — |
|
| (0.08 | ) |
| (0.02 | ) |
| — |
|
| — |
|
Net realized long-term capital gains |
|
| (0.78 | ) |
| (0.59 | ) |
| (0.10 | ) |
| — |
|
| — |
|
Total Distributions |
|
| (0.78 | ) |
| (0.67 | ) |
| (0.12 | ) |
| — |
|
| — |
|
Net Asset Value, End of Year |
| $ | 3.67 |
| $ | 7.97 |
| $ | 7.77 |
| $ | 6.85 |
| $ | 6.28 |
|
Total Return |
|
| (45.98 | )% |
| 11.00 | % |
| 15.30 | % |
| 9.08 | % |
| 14.39 | %# |
Ratios/Supplemental Data: |
|
|
|
|
|
|
|
|
|
|
|
|
|
|
|
|
Net assets, end of year (000s omitted) |
| $ | 2,793 |
| $ | 6,924 |
| $ | 5,411 |
| $ | 4,703 |
| $ | 4,041 |
|
Ratio of expenses to average net assets |
|
| 1.15 | % |
| 1.15 | % |
| 1.16 | % |
| 1.18 | % |
| 1.25 | % |
Ratio of net investment loss to average net assets |
|
| (1.00 | )% |
| (0.90 | )% |
| (1.15 | )% |
| (1.18 | )% |
| (1.22 | )% |
Portfolio turnover rate |
|
| 21.06 | % |
| 17.87 | % |
| 5.63 | % |
| 5.42 | % |
| 5.50 | % |
Without fee waiver and expense reimbursement:* |
|
|
|
|
|
|
|
|
|
|
|
|
|
|
|
|
Ratio of expenses to average net assets |
|
| 1.37 | % |
| 1.24 | % |
| 1.29 | % |
| 1.43 | % |
| 1.50 | % |
Ratio of net investment loss to average net assets |
|
| (1.22 | )% |
| (0.99 | )% |
| (1.28 | )% |
| (1.43 | )% |
| (1.47 | )% |
|
See footnotes on page 49. |
39
Financial Highlights
Growth Fund (continued)
|
|
|
|
|
|
|
|
|
|
|
|
|
|
|
|
|
|
| Year Ended December 31, | ||||||||||||||
|
| |||||||||||||||
Class C |
| 2008 |
| 2007 |
| 2006 |
| 2005 |
| 2004 |
| |||||
Per Share Data: |
|
|
|
|
|
|
|
|
|
|
|
|
|
|
|
|
Net Asset Value, Beginning of Year |
| $ | 7.97 |
| $ | 7.77 |
| $ | 6.85 |
| $ | 6.28 |
| $ | 5.49 |
|
Income (Loss) from Investment Operations: |
|
|
|
|
|
|
|
|
|
|
|
|
|
|
|
|
Net investment loss |
|
| (0.06 | ) |
| (0.08 | ) |
| (0.08 | ) |
| (0.08 | ) |
| (0.07 | ) |
Net realized and unrealized gain (loss) on investments |
|
| (3.46 | ) |
| 0.95 |
|
| 1.12 |
|
| 0.65 |
|
| 0.86 |
|
Total from Investment Operations |
|
| (3.52 | ) |
| 0.87 |
|
| 1.04 |
|
| 0.57 |
|
| 0.79 |
|
Less Distributions to Shareholders: |
|
|
|
|
|
|
|
|
|
|
|
|
|
|
|
|
Net realized short-term capital gains |
|
| — |
|
| (0.08 | ) |
| (0.02 | ) |
| — |
|
| — |
|
Net realized long-term capital gains |
|
| (0.78 | ) |
| (0.59 | ) |
| (0.10 | ) |
| — |
|
| — |
|
Total Distributions |
|
| (0.78 | ) |
| (0.67 | ) |
| (0.12 | ) |
| — |
|
| — |
|
Net Asset Value, End of Year |
| $ | 3.67 |
| $ | 7.97 |
| $ | 7.77 |
| $ | 6.85 |
| $ | 6.28 |
|
Total Return |
|
| (45.98 | )% |
| 11.00 | % |
| 15.30 | % |
| 9.08 | % |
| 14.39 | %# |
Ratios/Supplemental Data: |
|
|
|
|
|
|
|
|
|
|
|
|
|
|
|
|
Net assets, end of year (000s omitted) |
| $ | 6,269 |
| $ | 11,144 |
| $ | 10,847 |
| $ | 8,756 |
| $ | 6,588 |
|
Ratio of expenses to average net assets |
|
| 1.16 | % |
| 1.16 | % |
| 1.16 | % |
| 1.18 | % |
| 1.25 | % |
Ratio of net investment loss to average net assets |
|
| (1.01 | )% |
| (0.91 | )% |
| (1.15 | )% |
| (1.18 | )% |
| (1.22 | )% |
Portfolio turnover rate |
|
| 21.06 | % |
| 17.87 | % |
| 5.63 | % |
| 5.42 | % |
| 5.50 | % |
Without fee waiver and expense reimbursement:* |
|
|
|
|
|
|
|
|
|
|
|
|
|
|
|
|
Ratio of expenses to average net assets |
|
| 1.38 | % |
| 1.25 | % |
| 1.29 | % |
| 1.43 | % |
| 1.50 | % |
Ratio of net investment loss to average net assets |
|
| (1.23 | )% |
| (1.00 | )% |
| (1.28 | )% |
| (1.43 | )% |
| (1.47 | )% |
|
See footnotes on page 49. |
40
Financial Highlights
Growth Fund (continued)
|
|
|
|
|
|
|
|
|
|
|
|
|
|
|
|
| |
|
| 1/1/08 |
| Year Ended December 31, |
| ||||||||||||
|
|
| |||||||||||||||
Class D |
|
| 2007 |
| 2006 |
| 2005 |
| 2004 |
| |||||||
Per Share Data: |
|
|
|
|
|
|
|
|
|
|
|
|
|
|
|
| |
Net Asset Value, Beginning of Period |
| $ | 7.97 |
| $ | 7.78 |
| $ | 6.85 |
| $ | 6.28 |
| $ | 5.49 |
| |
Income (Loss) from Investment Operations: |
|
|
|
|
|
|
|
|
|
|
|
|
|
|
|
| |
Net investment loss |
|
| (0.03 | ) |
| (0.08 | ) |
| (0.08 | ) |
| (0.08 | ) |
| (0.07 | ) | |
Net realized and unrealized gain (loss) on investments |
|
| (0.10 | ) |
| 0.94 |
|
| 1.13 |
|
| 0.65 |
|
| 0.86 |
| |
Total from Investment Operations |
|
| (0.13 | ) |
| 0.86 |
|
| 1.05 |
|
| 0.57 |
|
| 0.79 |
| |
Less Distributions to Shareholders: |
|
|
|
|
|
|
|
|
|
|
|
|
|
|
|
| |
Net realized short-term capital gains |
|
| — |
|
| (0.08 | ) |
| (0.02 | ) |
| — |
|
| — |
| |
Net realized long-term capital gains |
|
| — |
|
| (0.59 | ) |
| (0.10 | ) |
| — |
|
| — |
| |
Total Distributions |
|
| — |
|
| (0.67 | ) |
| (0.12 | ) |
| — |
|
| — |
| |
Net Asset Value, End of Period |
| $ | 7.84 |
| $ | 7.97 |
| $ | 7.78 |
| $ | 6.85 |
| $ | 6.28 |
| |
Total Return |
|
| (1.63 | )% |
| 11.00 | % |
| 15.30 | % |
| 9.08 | % |
| 14.39 | %# | |
Ratios/Supplemental Data: |
|
|
|
|
|
|
|
|
|
|
|
|
|
|
|
| |
Net assets, end of period (000s omitted) |
|
| — |
| $ | 2,173 |
| $ | 1,788 |
| $ | 1,767 |
| $ | 1,340 |
| |
Ratio of expenses to average net assets |
|
| 1.16 | %† |
| 1.16 | % |
| 1.16 | % |
| 1.18 | % |
| 1.25 | % | |
Ratio of net investment loss to average net assets |
|
| (1.16 | )%† |
| (0.91 | )% |
| (1.15 | )% |
| (1.18 | )% |
| (1.22 | )% | |
Portfolio turnover rate |
|
| 21.06 | %†† |
| 17.87 | % |
| 5.63 | % |
| 5.42 | % |
| 5.50 | % | |
Without fee waiver and expense reimbursement:* |
|
|
|
|
|
|
|
|
|
|
|
|
|
|
|
| |
Ratio of expenses to average net assets |
|
| 1.30 | %† |
| 1.25 | % |
| 1.29 | % |
| 1.43 | % |
| 1.50 | % | |
Ratio of net investment loss to average net assets |
|
| (1.30 | )%† |
| (1.00 | )% |
| (1.28 | )% |
| (1.43 | )% |
| (1.47 | )% | |
|
|
See footnotes on page 49. |
41
Financial Highlights
Moderate Growth Fund
|
|
|
|
|
|
|
|
|
|
|
|
|
|
|
|
|
|
| Year Ended December 31, |
| |||||||||||||
|
| |||||||||||||||
Class A |
| 2008 |
| 2007 |
| 2006 |
| 2005 |
| 2004 |
| |||||
Per Share Data: |
|
|
|
|
|
|
|
|
|
|
|
|
|
|
|
|
Net Asset Value, Beginning of Year |
| $ | 8.09 |
| $ | 7.61 |
| $ | 6.64 |
| $ | 6.18 |
| $ | 5.53 |
|
Income from Investment Operations: |
|
|
|
|
|
|
|
|
|
|
|
|
|
|
|
|
Net investment income |
|
| 0.06 |
|
| 0.06 |
|
| 0.04 |
|
| 0.05 |
|
| 0.05 |
|
Net realized and unrealized gain (loss) on investments |
|
| (3.61 | ) |
| 0.72 |
|
| 1.02 |
|
| 0.46 |
|
| 0.66 |
|
Total from Investment Operations |
|
| (3.55 | ) |
| 0.78 |
|
| 1.06 |
|
| 0.51 |
|
| 0.71 |
|
Less Distributions to Shareholders: |
|
|
|
|
|
|
|
|
|
|
|
|
|
|
|
|
Net investment income |
|
| (0.04 | ) |
| (0.06 | ) |
| (0.04 | ) |
| (0.05 | ) |
| (0.05 | ) |
Net realized short-term capital gains |
|
| (0.01 | ) |
| (0.13 | ) |
| (0.05 | ) |
| — |
|
| (0.01 | ) |
Net realized long-term capital gains |
|
| (0.62 | ) |
| (0.11 | ) |
| — |
|
| — |
|
| — |
|
Return of capital |
|
| (0.01 | ) |
| — |
|
| — |
|
| — |
|
| — |
|
Total Distributions |
|
| (0.68 | ) |
| (0.30 | ) |
| (0.09 | ) |
| (0.05 | ) |
| (0.06 | ) |
Net Asset Value, End of Year |
| $ | 3.86 |
| $ | 8.09 |
| $ | 7.61 |
| $ | 6.64 |
| $ | 6.18 |
|
Total Return |
|
| (44.98 | )% |
| 10.18 | % |
| 16.00 | % |
| 8.32 | % |
| 12.79 | %# |
Ratios/Supplemental Data: |
|
|
|
|
|
|
|
|
|
|
|
|
|
|
|
|
Net assets, end of year (000s omitted) |
| $ | 9,761 |
| $ | 19,108 |
| $ | 15,138 |
| $ | 11,020 |
| $ | 7,313 |
|
Ratio of expenses to average net assets |
|
| 0.25 | % |
| 0.25 | % |
| 0.25 | % |
| 0.30 | % |
| 0.50 | % |
Ratio of net investment income to average net assets |
|
| 0.87 | % |
| 0.76 | % |
| 0.56 | % |
| 0.73 | % |
| 0.80 | % |
Portfolio turnover rate |
|
| 25.59 | % |
| 20.42 | % |
| 6.55 | % |
| 3.45 | % |
| 16.84 | % |
Without fee waiver and expense reimbursement:* |
|
|
|
|
|
|
|
|
|
|
|
|
|
|
|
|
Ratio of expenses to average net assets |
|
| 0.59 | % |
| 0.45 | % |
| 0.47 | % |
| 0.60 | % |
| 0.70 | % |
Ratio of net investment income to average net assets |
|
| 0.53 | % |
| 0.56 | % |
| 0.34 | % |
| 0.43 | % |
| 0.62 | % |
|
|
See footnotes on page 49. |
42
Financial Highlights
Moderate Growth Fund (continued)
|
|
|
|
|
|
|
|
|
|
|
|
|
|
|
|
|
|
| Year Ended December 31, |
| |||||||||||||
|
| |||||||||||||||
Class B |
| 2008 |
| 2007 |
| 2006 |
| 2005 |
| 2004 |
| |||||
Per Share Data: |
|
|
|
|
|
|
|
|
|
|
|
|
|
|
|
|
Net Asset Value, Beginning of Year |
| $ | 7.97 |
| $ | 7.50 |
| $ | 6.55 |
| $ | 6.10 |
| $ | 5.47 |
|
Income (Loss) from Investment Operations: |
|
|
|
|
|
|
|
|
|
|
|
|
|
|
|
|
Net investment income (loss) |
|
| 0.01 |
|
| — | ø |
| (0.01 | ) |
| — | ø |
| 0.01 |
|
Net realized and unrealized gain (loss) on investments |
|
| (3.54 | ) |
| 0.70 |
|
| 1.00 |
|
| 0.46 |
|
| 0.64 |
|
Total from Investment Operations |
|
| (3.53 | ) |
| 0.70 |
|
| 0.99 |
|
| 0.46 |
|
| 0.65 |
|
Less Distributions to Shareholders: |
|
|
|
|
|
|
|
|
|
|
|
|
|
|
|
|
Net investment income |
|
| (0.01 | ) |
| — | ø |
| — |
|
| —ø |
|
| (0.01 | ) |
Dividends in excess of net investment income |
|
| (0.03 | ) |
| — |
|
| — |
|
| — |
|
| — |
|
Net realized short-term capital gains |
|
| (0.01 | ) |
| (0.12 | ) |
| (0.04 | ) |
| (0.01 | ) |
| (0.01 | ) |
Net realized long-term capital gains |
|
| (0.62 | ) |
| (0.11 | ) |
| — |
|
| — |
|
| — |
|
Total Distributions |
|
| (0.67 | ) |
| (0.23 | ) |
| (0.04 | ) |
| (0.01 | ) |
| (0.02 | ) |
Net Asset Value, End of Year |
| $ | 3.77 |
| $ | 7.97 |
| $ | 7.50 |
| $ | 6.55 |
| $ | 6.10 |
|
Total Return |
|
| (45.40 | )% |
| 9.23 | % |
| 15.13 | % |
| 7.39 | % |
| 12.11 | %# |
Ratios/Supplemental Data: |
|
|
|
|
|
|
|
|
|
|
|
|
|
|
|
|
Net assets, end of year (000s omitted) |
| $ | 2,467 |
| $ | 6,302 |
| $ | 7,110 |
| $ | 5,888 |
| $ | 4,360 |
|
Ratio of expenses to average net assets |
|
| 1.00 | % |
| 1.00 | % |
| 1.01 | % |
| 1.06 | % |
| 1.25 | % |
Ratio of net investment income (loss) to average net assets |
|
| 0.12 | % |
| 0.01 | % |
| (0.20 | )% |
| (0.03 | )% |
| 0.05 | % |
Portfolio turnover rate |
|
| 25.59 | % |
| 20.42 | % |
| 6.55 | % |
| 3.45 | % |
| 16.84 | % |
Without fee waiver and expense reimbursement:* |
|
|
|
|
|
|
|
|
|
|
|
|
|
|
|
|
Ratio of expenses to average net assets |
|
| 1.34 | % |
| 1.20 | % |
| 1.23 | % |
| 1.36 | % |
| 1.45 | % |
Ratio of net investment loss to average net assets |
|
| (0.22 | )% |
| (0.19 | )% |
| (0.42 | )% |
| (0.33 | )% |
| (0.14 | )% |
|
|
See footnotes on page 49. |
43
|
Financial Highlights |
|
Moderate Growth Fund (continued) |
|
|
|
|
|
|
|
|
|
|
|
|
|
|
|
|
|
|
| Year Ended December 31, |
| |||||||||||||
|
|
| ||||||||||||||
Class C |
| 2008 |
| 2007 |
| 2006 |
| 2005 |
| 2004 |
| |||||
Per Share Data: |
|
|
|
|
|
|
|
|
|
|
|
|
|
|
|
|
Net Asset Value, Beginning of Year |
| $ | 7.97 |
| $ | 7.50 |
| $ | 6.55 |
| $ | 6.11 |
| $ | 5.47 |
|
Income (Loss) from Investment Operations: |
|
|
|
|
|
|
|
|
|
|
|
|
|
|
|
|
Net investment income (loss) |
|
| 0.01 |
|
| — | ø |
| (0.01 | ) |
| — | ø |
| 0.01 |
|
Net realized and unrealized gain (loss) on investments |
|
| (3.54 | ) |
| 0.70 |
|
| 1.00 |
|
| 0.45 |
|
| 0.65 |
|
Total from Investment Operations |
|
| (3.53 | ) |
| 0.70 |
|
| 0.99 |
|
| 0.45 |
|
| 0.66 |
|
Less Distributions to Shareholders: |
|
|
|
|
|
|
|
|
|
|
|
|
|
|
|
|
Net investment income |
|
| (0.01 | ) |
| — | ø |
| — |
|
| — | ø |
| (0.01 | ) |
Dividends in excess of net investment income |
|
| (0.03 | ) |
| — |
|
| — |
|
| — |
|
| — |
|
Net realized short-term capital gains |
|
| (0.01 | ) |
| (0.12 | ) |
| (0.04 | ) |
| (0.01 | ) |
| (0.01 | ) |
Net realized long-term capital gains |
|
| (0.62 | ) |
| (0.11 | ) |
| — |
|
| — |
|
| — |
|
Total Distributions |
|
| (0.67 | ) |
| (0.23 | ) |
| (0.04 | ) |
| (0.01 | ) |
| (0.02 | ) |
Net Asset Value, End of Year |
| $ | 3.77 |
| $ | 7.97 |
| $ | 7.50 |
| $ | 6.55 |
| $ | 6.11 |
|
Total Return |
|
| (45.40 | )% |
| 9.23 | % |
| 15.13 | % |
| 7.39 | % |
| 12.11 | %# |
Ratios/Supplemental Data: |
|
|
|
|
|
|
|
|
|
|
|
|
|
|
|
|
Net assets, end of year (000s omitted) |
| $ | 7,091 |
| $ | 14,469 |
| $ | 13,659 |
| $ | 10,576 |
| $ | 7,981 |
|
Ratio of expenses to average net assets |
|
| 1.01 | % |
| 1.01 | % |
| 1.01 | % |
| 1.06 | % |
| 1.25 | % |
Ratio of net investment income (loss) to average net assets |
|
| 0.11 | % |
| — |
|
| (0.20 | )% |
| (0.03 | )% |
| 0.05 | % |
Portfolio turnover rate |
|
| 25.59 | % |
| 20.42 | % |
| 6.55 | % |
| 3.45 | % |
| 16.84 | % |
Without fee waiver and expense reimbursement:* |
|
|
|
|
|
|
|
|
|
|
|
|
|
|
|
|
Ratio of expenses to average net assets |
|
| 1.35 | % |
| 1.21 | % |
| 1.23 | % |
| 1.36 | % |
| 1.46 | % |
Ratio of net investment loss to average net assets |
|
| (0.23 | )% |
| (0.20 | )% |
| (0.42 | )% |
| (0.33 | )% |
| (0.14 | )% |
|
|
|
|
|
|
|
|
|
|
|
|
|
|
|
|
|
See footnotes on page 49. |
44
|
Financial Highlights |
|
Moderate Growth Fund (continued) |
|
|
|
|
|
|
|
|
|
|
|
|
|
|
|
|
|
|
| 1/1/08 |
| Year Ended December 31, |
| |||||||||||
|
|
| ||||||||||||||
Class D |
|
| 2007 |
| 2006 |
| 2005 |
| 2004 |
| ||||||
Per Share Data: |
|
|
|
|
|
|
|
|
|
|
|
|
|
|
|
|
Net Asset Value, Beginning of Period |
| $ | 7.97 |
| $ | 7.50 |
| $ | 6.55 |
| $ | 6.11 |
| $ | 5.47 |
|
Income (Loss) from Investment Operations: |
|
|
|
|
|
|
|
|
|
|
|
|
|
|
|
|
Net investment income (loss) |
|
| — | ø |
| — | ø |
| (0.01 | ) |
| — | ø |
| 0.01 |
|
Net realized and unrealized gain (loss) on investments |
|
| (0.10 | ) |
| 0.70 |
|
| 1.00 |
|
| 0.45 |
|
| 0.65 |
|
Total from Investment Operations |
|
| (0.10 | ) |
| 0.70 |
|
| 0.99 |
|
| 0.45 |
|
| 0.66 |
|
Less Distributions to Shareholders: |
|
|
|
|
|
|
|
|
|
|
|
|
|
|
|
|
Net investment income |
|
| — |
|
| — | ø |
| — |
|
| — | ø |
| (0.01 | ) |
Net realized short-term capital gains |
|
| — |
|
| (0.12 | ) |
| (0.04 | ) |
| (0.01 | ) |
| (0.01 | ) |
Net realized long-term capital gains |
|
| — |
|
| (0.11 | ) |
| — |
|
| — |
|
| — |
|
Total Distributions |
|
| — |
|
| (0.23 | ) |
| (0.04 | ) |
| (0.01 | ) |
| (0.02 | ) |
Net Asset Value, End of Period |
| $ | 7.87 |
| $ | 7.97 |
| $ | 7.50 |
| $ | 6.55 |
| $ | 6.11 |
|
Total Return |
|
| (1.25 | )% |
| 9.23 | % |
| 15.13 | % |
| 7.39 | % |
| 12.11 | %# |
Ratios/Supplemental Data: |
|
|
|
|
|
|
|
|
|
|
|
|
|
|
|
|
Net assets, end of period (000s omitted) |
|
| — |
| $ | 4,007 |
| $ | 3,543 |
| $ | 3,154 |
| $ | 1,999 |
|
Ratio of expenses to average net assets |
|
| 1.01 | %† |
| 1.01 | % |
| 1.01 | % |
| 1.06 | % |
| 1.25 | % |
Ratio of net investment income (loss) to average net assets |
|
| (0.09 | )%† |
| — |
|
| (0.20 | )% |
| (0.03 | )% |
| 0.05 | % |
Portfolio turnover rate |
|
| 25.59 | %†† |
| 20.42 | % |
| 6.55 | % |
| 3.45 | % |
| 16.84 | % |
Without fee waiver and expense reimbursement:* |
|
|
|
|
|
|
|
|
|
|
|
|
|
|
|
|
Ratio of expenses to average net assets |
|
| 1.26 | %† |
| 1.21 | % |
| 1.23 | % |
| 1.36 | % |
| 1.45 | % |
Ratio of net investment loss to average net assets |
|
| (0.34 | )%† |
| (0.20 | )% |
| (0.42 | )% |
| (0.33 | )% |
| (0.14 | )% |
| ||||||||||||||||
See footnotes on page 49. |
45
|
Financial Highlights |
|
Balanced Fund |
|
|
|
|
|
|
|
|
|
|
|
|
|
|
|
|
|
|
| Year Ended December 31, |
| |||||||||||||
|
|
| ||||||||||||||
Class A |
| 2008 |
| 2007 |
| 2006 |
| 2005 |
| 2004 |
| |||||
Per Share Data: |
|
|
|
|
|
|
|
|
|
|
|
|
|
|
|
|
Net Asset Value, Beginning of Year |
| $ | 6.30 |
| $ | 6.31 |
| $ | 5.67 |
| $ | 5.53 |
| $ | 5.13 |
|
Income (Loss) from Investment Operations: |
|
|
|
|
|
|
|
|
|
|
|
|
|
|
|
|
Net investment income |
|
| 0.11 |
|
| 0.12 |
|
| 0.09 |
|
| 0.09 |
|
| 0.08 |
|
Net realized and unrealized gain (loss) on investments |
|
| (2.34 | ) |
| 0.10 |
|
| 0.65 |
|
| 0.16 |
|
| 0.42 |
|
Total from Investment Operations |
|
| (2.23 | ) |
| 0.22 |
|
| 0.74 |
|
| 0.25 |
|
| 0.50 |
|
Less Distributions to Shareholders: |
|
|
|
|
|
|
|
|
|
|
|
|
|
|
|
|
Net investment income |
|
| (0.11 | ) |
| (0.12 | ) |
| (0.09 | ) |
| (0.09 | ) |
| (0.08 | ) |
Net realized short-term capital gains |
|
| — |
|
| (0.11 | ) |
| — |
|
| (0.02 | ) |
| (0.02 | ) |
Net realized long-term capital gains |
|
| (0.16 | ) |
| — |
|
| — |
|
| — |
|
| — |
|
Return of capital |
|
| — |
|
| — |
|
| (0.01 | ) |
| — |
|
| — |
|
Total Distributions |
|
| (0.27 | ) |
| (0.23 | ) |
| (0.10 | ) |
| (0.11 | ) |
| (0.10 | ) |
Net Asset Value, End of Year |
| $ | 3.80 |
| $ | 6.30 |
| $ | 6.31 |
| $ | 5.67 |
| $ | 5.53 |
|
Total Return |
|
| (36.01 | )% |
| 3.51 | % |
| 13.09 | % |
| 4.53 | % |
| 9.90 | %# |
Ratios/Supplemental Data: |
|
|
|
|
|
|
|
|
|
|
|
|
|
|
|
|
Net assets, end of year (000s omitted) |
| $ | 4,863 |
| $ | 8,137 |
| $ | 6,823 |
| $ | 6,422 |
| $ | 5,092 |
|
Ratio of expenses to average net assets |
|
| 0.26 | % |
| 0.25 | % |
| 0.25 | % |
| 0.31 | % |
| 0.50 | % |
Ratio of net investment income to average net assets |
|
| 2.06 | % |
| 1.82 | % |
| 1.45 | % |
| 1.60 | % |
| 1.46 | % |
Portfolio turnover rate |
|
| 38.51 | % |
| 19.98 | % |
| 10.82 | % |
| 18.35 | % |
| 25.59 | % |
Without fee waiver and expense reimbursement:* |
|
|
|
|
|
|
|
|
|
|
|
|
|
|
|
|
Ratio of expenses to average net assets |
|
| 0.93 | % |
| 0.71 | % |
| 0.74 | % |
| 0.82 | % |
| 0.79 | % |
Ratio of net investment income to average net assets |
|
| 1.39 | % |
| 1.36 | % |
| 0.96 | % |
| 1.09 | % |
| 1.19 | % |
|
|
|
|
|
|
|
|
|
|
|
|
|
|
|
|
|
See footnotes on page 49. |
46
|
Financial Highlights |
|
Balanced Fund (continued) |
|
|
|
|
|
|
|
|
|
|
|
|
|
|
|
|
|
|
| Year Ended December 31, |
| |||||||||||||
|
|
| ||||||||||||||
Class B |
| 2008 |
| 2007 |
| 2006 |
| 2005 |
| 2004 |
| |||||
Per Share Data: |
|
|
|
|
|
|
|
|
|
|
|
|
|
|
|
|
Net Asset Value, Beginning of Year |
| $ | 6.30 |
| $ | 6.31 |
| $ | 5.67 |
| $ | 5.53 |
| $ | 5.13 |
|
Income (Loss) from Investment Operations: |
|
|
|
|
|
|
|
|
|
|
|
|
|
|
|
|
Net investment income |
|
| 0.07 |
|
| 0.07 |
|
| 0.04 |
|
| 0.05 |
|
| 0.04 |
|
Net realized and unrealized gain (loss) on investments |
|
| (2.34 | ) |
| 0.10 |
|
| 0.66 |
|
| 0.16 |
|
| 0.42 |
|
Total from Investment Operations |
|
| (2.27 | ) |
| 0.17 |
|
| 0.70 |
|
| 0.21 |
|
| 0.46 |
|
Less Distributions to Shareholders: |
|
|
|
|
|
|
|
|
|
|
|
|
|
|
|
|
Net investment income |
|
| (0.07 | ) |
| (0.07 | ) |
| (0.04 | ) |
| (0.05 | ) |
| (0.04 | ) |
Net realized short-term capital gains |
|
| — |
|
| (0.11 | ) |
| — |
|
| (0.02 | ) |
| (0.02 | ) |
Net realized long-term capital gains |
|
| (0.16 | ) |
| — |
|
| — |
|
| — |
|
| — |
|
Return of capital |
|
| — |
|
| — |
|
| (0.02 | ) |
| — |
|
| — |
|
Total Distributions |
|
| (0.23 | ) |
| (0.18 | ) |
| (0.06 | ) |
| (0.07 | ) |
| (0.06 | ) |
Net Asset Value, End of Year |
| $ | 3.80 |
| $ | 6.30 |
| $ | 6.31 |
| $ | 5.67 |
| $ | 5.53 |
|
Total Return |
|
| (36.51 | )% |
| 2.75 | % |
| 12.25 | % |
| 3.76 | % |
| 9.09 | %# |
Ratios/Supplemental Data: |
|
|
|
|
|
|
|
|
|
|
|
|
|
|
|
|
Net assets, end of year (000s omitted) |
| $ | 918 |
| $ | 2,594 |
| $ | 2,755 |
| $ | 3,219 |
| $ | 3,932 |
|
Ratio of expenses to average net assets |
|
| 1.01 | % |
| 1.00 | % |
| 1.00 | % |
| 1.07 | % |
| 1.25 | % |
Ratio of net investment income to average net assets |
|
| 1.31 | % |
| 1.07 | % |
| 0.70 | % |
| 0.84 | % |
| 0.71 | % |
Portfolio turnover rate |
|
| 38.51 | % |
| 19.98 | % |
| 10.82 | % |
| 18.35 | % |
| 25.59 | % |
Without fee waiver and expense reimbursement:* |
|
|
|
|
|
|
|
|
|
|
|
|
|
|
|
|
Ratio of expenses to average net assets |
|
| 1.68 | % |
| 1.46 | % |
| 1.49 | % |
| 1.58 | % |
| 1.54 | % |
Ratio of net investment income to average net assets |
|
| 0.64 | % |
| 0.61 | % |
| 0.21 | % |
| 0.33 | % |
| 0.44 | % |
|
|
|
|
|
|
|
|
|
|
|
|
|
|
|
|
|
See footnotes on page 49. |
47
|
Financial Highlights |
|
Balanced Fund (continued) |
|
|
|
|
|
|
|
|
|
|
|
|
|
|
|
|
|
|
| Year Ended December 31, |
| |||||||||||||
|
|
| ||||||||||||||
Class C |
| 2008 |
| 2007 |
| 2006 |
| 2005 |
| 2004 |
| |||||
Per Share Data: |
|
|
|
|
|
|
|
|
|
|
|
|
|
|
|
|
Net Asset Value, Beginning of Year |
| $ | 6.30 |
| $ | 6.31 |
| $ | 5.67 |
| $ | 5.53 |
| $ | 5.13 |
|
Income (Loss) from Investment Operations: |
|
|
|
|
|
|
|
|
|
|
|
|
|
|
|
|
Net investment income |
|
| 0.07 |
|
| 0.07 |
|
| 0.04 |
|
| 0.05 |
|
| 0.04 |
|
Net realized and unrealized gain (loss) on investments |
|
| (2.34 | ) |
| 0.10 |
|
| 0.66 |
|
| 0.16 |
|
| 0.42 |
|
Total from Investment Operations |
|
| (2.27 | ) |
| 0.17 |
|
| 0.70 |
|
| 0.21 |
|
| 0.46 |
|
Less Distributions to Shareholders: |
|
|
|
|
|
|
|
|
|
|
|
|
|
|
|
|
Net investment income |
|
| (0.07 | ) |
| (0.07 | ) |
| (0.04 | ) |
| (0.05 | ) |
| (0.04 | ) |
Net realized short-term capital gains |
|
| — |
|
| (0.11 | ) |
| — |
|
| (0.02 | ) |
| (0.02 | ) |
Net realized long-term capital gains |
|
| (0.16 | ) |
| — |
|
| — |
|
| — |
|
| — |
|
Return of capital |
|
| — |
|
| — |
|
| (0.02 | ) |
| — |
|
| — |
|
Total Distributions |
|
| (0.23 | ) |
| (0.18 | ) |
| (0.06 | ) |
| (0.07 | ) |
| (0.06 | ) |
Net Asset Value, End of Year |
| $ | 3.80 |
| $ | 6.30 |
| $ | 6.31 |
| $ | 5.67 |
| $ | 5.53 |
|
Total Return |
|
| (36.51 | )% |
| 2.75 | % |
| 12.25 | % |
| 3.76 | % |
| 9.09 | %# |
Ratios/Supplemental Data: |
|
|
|
|
|
|
|
|
|
|
|
|
|
|
|
|
Net assets, end of year (000s omitted) |
| $ | 3,991 |
| $ | 5,686 |
| $ | 5,733 |
| $ | 5,382 |
| $ | 6,149 |
|
Ratio of expenses to average net assets |
|
| 1.00 | % |
| 1.00 | % |
| 1.00 | % |
| 1.07 | % |
| 1.25 | % |
Ratio of net investment income to average net assets |
|
| 1.32 | % |
| 1.07 | % |
| 0.70 | % |
| 0.84 | % |
| 0.71 | % |
Portfolio turnover rate |
|
| 38.51 | % |
| 19.98 | % |
| 10.82 | % |
| 18.35 | % |
| 25.59 | % |
Without fee waiver and expense reimbursement:* |
|
|
|
|
|
|
|
|
|
|
|
|
|
|
|
|
Ratio of expenses to average net assets |
|
| 1.67 | % |
| 1.46 | % |
| 1.49 | % |
| 1.58 | % |
| 1.54 | % |
Ratio of net investment income to average net assets |
|
| 0.65 | % |
| 0.61 | % |
| 0.21 | % |
| 0.33 | % |
| 0.44 | % |
|
|
|
|
|
|
|
|
|
|
|
|
|
|
|
|
|
See footnotes on page 49. |
48
|
Financial Highlights |
|
Balanced Fund (continued) |
|
|
|
|
|
|
|
|
|
|
|
|
|
|
|
|
|
|
| 1/1/08 |
| Year Ended December 31, |
| |||||||||||
|
|
|
| |||||||||||||
Class D |
|
| 2007 |
| 2006 |
| 2005 |
| 2004 |
| ||||||
Per Share Data: |
|
|
|
|
|
|
|
|
|
|
|
|
|
|
|
|
Net Asset Value, Beginning of Period |
| $ | 6.30 |
| $ | 6.31 |
| $ | 5.67 |
| $ | 5.53 |
| $ | 5.13 |
|
Income from Investment Operations: |
|
|
|
|
|
|
|
|
|
|
|
|
|
|
|
|
Net investment income |
|
| 0.04 |
|
| 0.07 |
|
| 0.04 |
|
| 0.05 |
|
| 0.04 |
|
Net realized and unrealized gain (loss) on investments |
|
| — | ø |
| 0.10 |
|
| 0.66 |
|
| 0.16 |
|
| 0.42 |
|
Total from Investment Operations |
|
| 0.04 |
|
| 0.17 |
|
| 0.70 |
|
| 0.21 |
|
| 0.46 |
|
Less Distributions to Shareholders: |
|
|
|
|
|
|
|
|
|
|
|
|
|
|
|
|
Net investment income |
|
| (0.03 | ) |
| (0.07 | ) |
| (0.04 | ) |
| (0.05 | ) |
| (0.04 | ) |
Net realized short-term capital gains |
|
| — |
|
| (0.11 | ) |
| — |
|
| (0.02 | ) |
| (0.02 | ) |
Return of capital |
|
| — |
|
| — |
|
| (0.02 | ) |
| — |
|
| — |
|
Total Distributions |
|
| (0.03 | ) |
| (0.18 | ) |
| (0.06 | ) |
| (0.07 | ) |
| (0.06 | ) |
Net Asset Value, End of Period |
| $ | 6.31 |
| $ | 6.30 |
| $ | 6.31 |
| $ | 5.67 |
| $ | 5.53 |
|
Total Return |
|
| 0.63 | % |
| 2.75 | % |
| 12.25 | % |
| 3.76 | % |
| 9.09 | %# |
Ratios/Supplemental Data: |
|
|
|
|
|
|
|
|
|
|
|
|
|
|
|
|
Net assets, end of period (000s omitted) |
|
| — |
| $ | 1,909 |
| $ | 1,672 |
| $ | 1,904 |
| $ | 1,106 |
|
Ratio of expenses to average net assets |
|
| 1.01 | %† |
| 1.00 | % |
| 1.00 | % |
| 1.07 | % |
| 1.25 | % |
Ratio of net investment income to average net assets |
|
| 1.56 | %† |
| 1.07 | % |
| 0.70 | % |
| 0.84 | % |
| 0.71 | % |
Portfolio turnover rate |
|
| 38.51 | %†† |
| 19.98 | % |
| 10.82 | % |
| 18.35 | % |
| 25.59 | % |
Without fee waiver and expense reimbursement:* |
|
|
|
|
|
|
|
|
|
|
|
|
|
|
|
|
Ratio of expenses to average net assets |
|
| 1.54 | %† |
| 1.46 | % |
| 1.49 | % |
| 1.58 | % |
| 1.54 | % |
Ratio of net investment income to average net assets |
|
| 1.03 | %† |
| 0.61 | % |
| 0.21 | % |
| 0.33 | % |
| 0.44 | % |
| ||||||||||||||||
|
|
|
* | The Manager, at its discretion, reimbursed certain expenses and waived certain management fees for the years presented (Note 4). | |
|
| |
** | Date of conversion to Class C shares. | |
|
| |
ø | Less than + or – $0.005. | |
|
| |
† | Annualized. | |
|
| |
†† | Computed at the Fund level for the year ended December 31, 2008. | |
|
| |
# | Excluding the effect of the payments to certain of the underlying Seligman Funds received from the Manager in 2004, total return would have been as follows: |
|
|
|
|
|
|
|
|
|
|
|
|
|
|
|
|
|
Aggressive Growth Fund |
|
| Growth Fund |
|
| Moderate Growth Fund |
|
| Balanced Fund |
|
| |||||
| Class A | 15.43 | % |
| Class A | 15.30 | % |
| Class A | 12.77 | % |
| Class A | 9.89 | % |
|
| Class B | 14.41 |
|
| Class B | 14.35 |
|
| Class B | 12.09 |
|
| Class B | 9.08 |
|
|
| Class C | 14.41 |
|
| Class C | 14.35 |
|
| Class C | 12.09 |
|
| Class C | 9.08 |
|
|
| Class D | 14.41 |
|
| Class D | 14.35 |
|
| Class D | 12.09 |
|
| Class D | 9.08 |
|
|
See Notes to Financial Statements.
49
Report of Independent Registered
Public Accounting Firm
The Board of Directors and Shareholders of
Seligman Asset Allocation Series, Inc.:
We have audited the accompanying statements of assets and liabilities, including the portfolios of investments of Seligman Asset Allocation Series, Inc. (the “Series”) comprising Seligman Asset Allocation Aggressive Growth Fund, Seligman Asset Allocation Growth Fund, Seligman Asset Allocation Moderate Growth Fund, and Seligman Asset Allocation Balanced Fund, as of December 31, 2008, and the related statements of operations for the year then ended, the statements of changes in net assets for each of the two years in the period then ended, and the financial highlights for each of the periods presented. These financial statements and financial highlights are the responsibility of the Series’ management. Our responsibility is to express an opinion on these financial statements and financial highlights based on our audits.
We conducted our audits in accordance with the standards of the Public Company Accounting Oversight Board (United States). Those standards require that we plan and perform the audit to obtain reasonable assurance about whether the financial statements and financial highlights are free of material misstatement. The Series is not required to have, nor were we engaged to perform, an audit of its internal control over financial reporting. Our audits included consideration of internal control over financial reporting as a basis for designing audit procedures that are appropriate in the circumstances, but not for the purpose of expressing an opinion on the effectiveness of the Series’ internal control over financial reporting. Accordingly, we express no such opinion. An audit also includes examining, on a test basis, evidence supporting the amounts and disclosures in the financial statements, assessing the accounting principles used and significant estimates made by management, as well as evaluating the overall financial statement presentation. Our procedures included confirmation of securities owned as of December 31, 2008, by correspondence with the shareholder service agent. We believe that our audits provide a reasonable basis for our opinion.
In our opinion, the financial statements and financial highlights referred to above present fairly, in all material respects, the financial position of each of the funds constituting Seligman Asset Allocation Series, Inc. as of December 31, 2008, the results of their operations for the year then ended, the changes in their net assets for each of the two years in the period then ended, and the financial highlights for the respective stated periods, in conformity with accounting principles generally accepted in the United States of America.
DELOITTE & TOUCHE LLP
New York, New York
February 27, 2009
50
Required Federal Income Tax Information
(unaudited)
Dividends paid for the year ended December 31, 2008 other than qualified dividend income are subject to federal income tax as “ordinary income.” In order to claim the dividends received deduction for these distributions, corporate shareholders must have held their shares for 46 days or more during the 90-day period beginning 45 days before each ex-dividend date. Under the Internal Revenue Code, the dividends paid to corporate shareholders that qualify for the dividends received deduction were as follows:
|
|
|
|
|
|
|
|
|
|
|
|
|
|
|
| Dividends Received Deduction Percent |
| ||||||||||
|
| ||||||||||||
|
| Aggressive Growth |
| Growth |
| Moderate Growth |
| Balanced |
| ||||
Class A |
| 100.00 | % |
| 100.00 | % |
| 11.42 | % |
| 6.46 | % |
|
Class B |
| 100.00 |
|
| 100.00 |
|
| 13.98 |
|
| 10.08 |
|
|
Class C |
| 100.00 |
|
| 100.00 |
|
| 12.69 |
|
| 10.24 |
|
|
Class D |
| 100.00 |
|
| 100.00 |
|
| 100.00 |
|
| 9.36 |
|
|
For the year ended December 31, 2008, the Funds designate the following as qualified dividends to individual shareholders:
|
|
|
|
|
|
|
|
|
|
|
|
|
|
|
| Qualified Dividends Percent |
| ||||||||||
|
| ||||||||||||
|
| Aggressive Growth |
| Growth |
| Moderate Growth |
| Balanced |
| ||||
Class A |
| 100.00 | % |
| 100.00 | % |
| 23.93 | % |
| 6.93 | % |
|
Class B |
| 100.00 |
|
| 100.00 |
|
| 29.30 |
|
| 10.81 |
|
|
Class C |
| 100.00 |
|
| 100.00 |
|
| 26.60 |
|
| 10.98 |
|
|
Class D |
| 100.00 |
|
| 100.00 |
|
| 100.00 |
|
| 10.04 |
|
|
In order for an individual to claim dividends received as qualified dividends, individual shareholders must have held their shares for more than 60 days during the 121-day period beginning 60 days before each ex-dividend date.
51
Matters Relating to the Directors’
Consideration of the Approval of the
Investment Management Services Agreement
In the discussion below, the term “Series” refers to Seligman Asset Allocation Series, Inc. and the term “Fund” refers to Seligman Asset Allocation Aggressive Growth Fund, Seligman Asset Allocation Growth Fund, Seligman Asset Allocation Moderate Growth Fund and Seligman Asset Allocation Balance Fund.
Background
On July 7, 2008, RiverSource Investments, LLC (“RiverSource”), a wholly owned subsidiary of Ameriprise Financial, Inc. (“Ameriprise”), entered into a stock purchase agreement with the shareholders of J. & W. Seligman & Co. Incorporated (“Seligman”) under which RiverSource would acquire all of the outstanding capital stock of Seligman (the “Transaction”). The consummation of the Transaction resulted in the automatic termination of the Series’ management agreement with Seligman (the “Seligman Management Agreement”) in respect of each Fund. In anticipation of the termination of the Seligman Management Agreement, at a meeting held on July 29, 2008, the directors of the Series then serving unanimously approved an investment management agreement with RiverSource (the “Proposed Advisory Agreement”) in respect of each Fund. At the special meeting of shareholders of the Funds held on November 3, 2008, the shareholders of each Fund approved the Proposed Advisory Agreement. The Transaction closed on November 7, 2008, and upon the closing, RiverSource became the investment advisor to each Fund.
Board Considerations
Prior to their approval of the Proposed Advisory Agreement, the directors requested and evaluated extensive materials from, and were provided materials and information about the Transaction and matters related to the proposed approval by, Seligman, RiverSource and Ameriprise.
In consultation with experienced counsel, who advised on the legal standards for consideration by the directors, the directors reviewed the Proposed Advisory Agreement with RiverSource. The independent directors also discussed the proposed approval with counsel in private sessions.
At their meetings on June 12, 2008, July 17, 2008 and July 29, 2008, the directors discussed the Transaction with Seligman, and the Transaction and RiverSource’s plans and intentions regarding the Series (and each Fund) with representatives of Ameriprise and RiverSource.
The directors considered all factors they believed relevant, including the specific matters discussed below. In their deliberations, the directors did not identify any particular information that was all-important or controlling, and directors may have attributed different weights to the various factors. The directors determined that the selection of RiverSource to advise the Series (and each Fund), and the overall arrangements between the Series (and each Fund) and RiverSource as provided in the Proposed Advisory Agreement, including the proposed advisory fee and the related administration arrangements between the Series (and each Fund) and Ameriprise, were fair and reasonable in light of the services to be performed, expenses incurred and such other matters as the directors considered relevant. The material factors and conclusions that formed the basis for the directors’ determination included, in addition, the factors discussed in further detail below:
|
|
(i) | the reputation, financial strength and resources of RiverSource, and its parent, Ameriprise; |
|
|
(ii) | the capabilities of RiverSource with respect to compliance and its regulatory histories; |
|
|
(iii) | an assessment of RiverSource’s compliance system by the Series’ Chief Compliance Officer; |
|
|
(iv) | that the portfolio management team for each Fund would not change as a result of the Transaction; |
|
|
(v) | that RiverSource and Ameriprise assured the directors that following the Transaction there will not be any diminution in the nature, quality and extent of services provided to the Series (and each Fund) or its shareholders; |
52
Matters Relating to the Directors’
Consideration of the Approval of the
Investment Management Services Agreement
|
|
(vi) | that within the past year the directors had performed a full annual review of the Seligman Management Agreement, as required by the Investment Company Act of 1940 (“1940 Act”), for the Series (and each Fund) and had determined that they were satisfied with the nature, extent and quality of services provided thereunder and that the management fee rate for each Fund was satisfactory; |
|
|
(vii) | the potential benefits to the Series (and each Fund) of the combination of RiverSource and Seligman, including: greater resources to attract and retain high quality investment personnel; greater depth and breadth of investment management capabilities; a continued high level of service to the Series (and each Fund); and the potential for realization of economies of scale over time since the Series (and each Fund) will be part of a much larger fund complex; |
|
|
(viii) | the fact that each Fund’s total advisory and administrative fees would not increase by virtue of the Proposed Advisory Agreement, but would remain the same; |
|
|
(ix) | that RiverSource, and not the Series or Funds, would bear the costs of obtaining all approvals of the Proposed Advisory Agreement; |
|
|
(x) | the qualifications of the personnel of RiverSource and Ameriprise that would provide advisory and administrative services to the Series (and each Fund); |
|
|
(xi) | the terms and conditions of the Proposed Advisory Agreement, including the directors’ review of differences from the Seligman Management Agreement; |
|
|
(xii) | that RiverSource and Ameriprise have agreed to refrain from imposing or seeking to impose, for a period of two years after the closing of the Transaction, any “unfair burden” (within the meaning of Section 15(f) of 1940 Act) on the Series and each Fund; and |
|
|
(xiii) | that certain members of RiverSource’s management have a significant amount of experience integrating other fund families. |
Nature, Extent and Quality of Services Provided
In considering the nature, extent and quality of the services to be provided under the Proposed Advisory Agreement, the directors of the Series considered, among other things, the expected impact of the Transaction on the operations of the Series and each Fund, the information provided by RiverSource with respect to the nature, extent and quality of services to be provided by it, RiverSource’s compliance programs and compliance records, and presentations provided on the quality of RiverSource’s investment research capabilities and the other resources it and Ameriprise have indicated that they would dedicate to performing services for the Series and each Fund.
The directors noted the professional experience and qualifications of the portfolio management team of each Fund and the senior personnel of RiverSource. The directors considered a report by, the Series’ Chief Compliance Officer, assessing RiverSource’s compliance system, which was followed by a private session with the Series’ Chief Compliance Officer. They also discussed RiverSource’s compliance system with the Chief Compliance Officer for the funds managed by RiverSource. The directors also considered RiverSource’s presentation on the selection of brokers and dealers for portfolio transactions. As administrative services (provided under the Seligman Management Agreement) would be provided to the Series (and each Fund) by Ameriprise at no additional cost under a new administrative services agreement rather than pursuant to the Proposed Advisory Agreement, the directors considered Ameriprise’s capability to provide such administrative services as well as RiverSource’s and Ameriprise’s roles in coordinating the activities of the Series’ (and each Fund’s) other service providers. The directors noted that Ameriprise intended to continue Seligman’s practice of sub-contracting administrative services provided by Seligman for the Series (and each Fund) to
53
Matters Relating to the Directors’
Consideration of the Approval of the
Investment Management Services Agreement
State Street Bank and Trust Company for the foreseeable future. The directors concluded that, overall, they were satisfied with assurances from RiverSource and Ameriprise as to the expected nature, extent and quality of the services to be provided to the Series (and each Fund) under the Proposed Advisory Agreement and the new administrative services agreement.
Costs of Services Provided and Profitability
In considering the costs of services to be provided by RiverSource under the Proposed Advisory Agreement, the directors considered, among other things, the projected pre-tax, pre-distribution expense profitability of RiverSource’s proposed relationship with the Series (and each Fund) and discussed the assumptions of RiverSource and the limitations of the information provided. The directors noted that RiverSource had undertaken to provide profitability information in connection with future contract continuances. The directors also considered RiverSource’s financial condition based on information provided by it.
The directors noted that the proposed fee under the Proposed Advisory Agreement was the same as provided under the Seligman Management Agreement. The directors recognized that it is difficult to make comparisons of profitability from fund advisory contracts because comparative information is not generally publicly available and is affected by numerous factors. In reviewing the projected profitability information, the directors considered the effect of fall-out benefits on RiverSource’s expenses. The directors concluded that they were satisfied that RiverSource’s estimated future profitability from its relationship with each Fund was not excessive.
Fall-Out Benefits
The directors considered that broker-dealer affiliates of RiverSource, including a broker-dealer affiliate of Seligman (which became an affiliate of RiverSource following the closing of the Transaction) will receive 12b-1 fees from each Fund in respect of shares held in certain accounts, and that each Fund’s distributor (which became a subsidiary of RiverSource following the closing of the Transaction) retains a portion of the 12b-1 fees from each Fund and receives a portion of the sales charges on sales or redemptions of certain classes of shares of each Fund. The directors recognized that RiverSource’s profitability would be somewhat lower without these benefits. The directors noted that RiverSource may derive reputational and other benefits from its association with the Funds.
Investment Results
The directors received and reviewed detailed performance information on each Fund at each regular Board meeting during the year in addition to the information received for the meeting regarding approval of the Proposed Advisory Agreement. The directors noted that each Fund’s current portfolio management team would continue to advise the Fund after the Transaction.
The directors reviewed performance information on each Fund covering a wide range of periods, including the first six months of the calendar year, the preceding seven calendar years and annualized one-, three- and five-year rolling periods ending June 30, 2008. For these periods the directors reviewed information comparing each Fund to other funds with similar investment objectives as determined by Lipper, with one or more selected securities indices, to a group of competitor funds selected by Seligman and, where applicable, similar RiverSource funds. The directors also reviewed information about portfolio turnover rates of each Fund compared to other investment companies with similar investment objectives, including, where applicable, RiverSource funds.
The directors recognized that it is not possible to predict what effect, if any, consummation of the Transaction would have on the future performance of the Funds.
54
Matters Relating to the Directors’
Consideration of the Approval of the
Investment Management Services Agreement
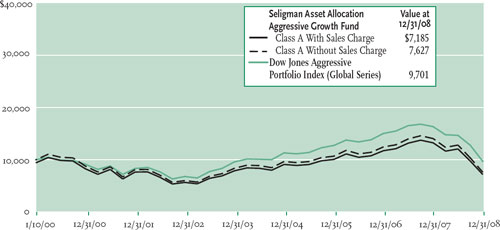
Seligman Asset Allocation Aggressive Growth Fund. The directors reviewed information comparing the Fund to the Lipper Multi-Cap Core Funds Average, the Lipper Fund of Funds (Affiliated), the Dow Jones Aggressive Portfolio Index (Global Series) and the Dow Jones Aggressive Portfolio Index (US Series), as well as performance relative to the other funds in Lipper Multi-Cap Core Funds Average, the Lipper Fund of Funds (Affiliated) and to a group of competitor funds selected by Seligman. The directors noted that the Fund was above the Lipper Multi-Cap Core median for the periods presented, and that the Fund’s results were above each of its benchmarks for the five- and three-year periods, except for the Dow Jones (Global) benchmark for the five-year period, which the Fund lagged slightly. The directors also noted that the Fund’s results had generally exceeded its benchmarks for each calendar year from 2003 through 2007, and exceeded each benchmark for the first six months of 2008, other than the Lipper Fund of Funds (Affiliated). Taking into account these comparisons and the other factors considered, the directors concluded that the Fund’s investment results were satisfactory.
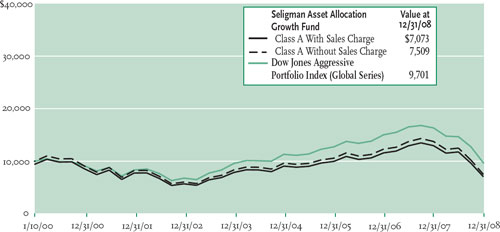
Seligman Asset Allocation Growth Fund. The directors reviewed information comparing the Fund to the Lipper Multi-Cap Core Funds Average, the Lipper Fund of Funds (Affiliated), the Dow Jones Aggressive Portfolio Index (Global Series), the Dow Jones Aggressive Portfolio Index (US Series), as well as performance relative to the other funds in the Lipper Multi-Cap Core Funds Average, the Lipper Fund of Funds (Affiliated) and to a group of competitor funds selected by Seligman. The directors noted that the Fund was above the Lipper Multi-Cap Core median in all periods presented, and that the Fund’s results were above each of its benchmarks for the three- and five-year periods, except for the Dow Jones (Global Series) benchmark, which the Fund lagged in the five-year period. The directors also noted that the Fund’s results had generally exceeded its benchmarks for each calendar year from 2003 through 2007, and exceeded each benchmark for the first six months of 2008, other than the Lipper Fund of Funds (Affiliated). Taking into account these comparisons and the other factors considered, the directors concluded that the Fund’s investment results were satisfactory.
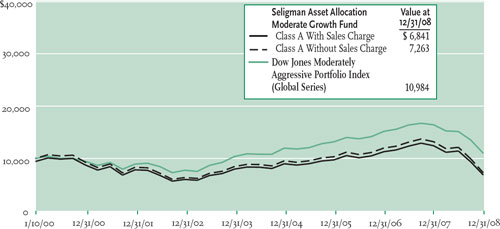
Seligman Asset Allocation Moderate Growth Fund. The directors reviewed information comparing the Fund to the Lipper Multi-Cap Core Funds Average, the Lipper Fund of Funds (Affiliated), the Dow Jones Moderately Aggressive Portfolio Index (Global Series), the Dow Jones Moderately Aggressive Portfolio Index (US Series), as well as the other funds in the Lipper Multi-Cap Core Funds Average, the Lipper Fund of Funds (Affiliated) and to a group of competitor funds selected by Seligman. The directors noted that the Fund was above the Lipper median in both categories for all periods presented, and that the Fund’s results were above each of its benchmarks for the three- and five-year periods, except for the Dow Jones (Global Series) benchmark, which the Fund lagged in the five-year period. The directors also noted that the Fund’s results exceeded each benchmark in 2007, although it lagged most of them slightly for the first six months of 2008, other than the Lipper Multi-Cap Core Funds Average. Taking into account these comparisons and the other factors considered, the directors concluded that the Fund’s investment results were satisfactory.
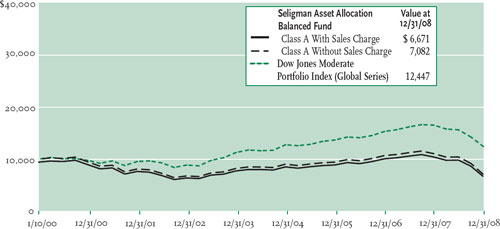
Seligman Asset Allocation Balanced Fund. The directors reviewed information comparing the Fund to the Lipper Mixed-Asset Target Allocation Moderate Funds Average, the Lipper Fund of Funds (Affiliated), the Dow Jones Moderate Portfolio Index (Global Series) and the Dow Jones Moderate Portfolio Index (US Series), as well as performance relative to the other funds in the Lipper Mixed-Asset Target Allocation Moderate Funds Average, the Lipper Fund of Funds (Affiliated) and to a group of competitor funds selected by Seligman. The directors noted that the Fund’s results were mixed, although generally lagging the benchmarks for most periods, but also that the Fund equaled or exceeded each of its benchmarks except the Dow Jones Moderate Portfolio Index (Global Series) for the first six months of 2008. Taking into account these comparisons and the other factors considered, the directors concluded that the Fund’s investment results were satisfactory.
55
Matters Relating to the Directors’
Consideration of the Approval of the
Investment Management Services Agreement
Management Fee and Other Expenses
The directors considered the proposed advisory fee rate to be paid by each Fund to RiverSource, which is the same as the management fee rate paid by each Fund under the Seligman Management Agreement. In addition to the materials provided by Seligman, RiverSource provided information regarding the fees for each of the RiverSource funds and managed accounts. With respect to each Fund, the directors noted that the proposed advisory fee rate for such Fund was higher than certain RiverSource funds in the same Lipper category and lower than others, and that the RiverSource equity fund fee rates are generally subject to adjustments based on investment performance whereas the proposed fee rate for each Fund, consistent with those in the Seligman Management Agreement, does not reflect performance adjustments. The directors recognized that it is difficult to make comparisons of advisory and management fees because there are variations in the services that are included in the fees paid by other funds.
The directors compared each Fund’s proposed advisory fee rate to the rate paid by other funds in its Lipper category (the “peer group”). In considering the proposed advisory fee rate, the directors noted that the management fee rate under the Seligman Management Agreement covers administrative services provided by Seligman, whereas the Proposed Advisory Agreement does not include such services, but that Ameriprise will provide such services to each Fund pursuant to a separate administrative services agreement initially without a fee. The directors further considered that the administrative fees, since they are not included in an advisory agreement, could be increased without stockholder approval, although RiverSource noted that, at that time, it did not have an intention to seek an increase, and that any such administrative fee increase would require board approval. The directors also noted RiverSource’s and Ameriprise’s covenants in the Transaction’s stock purchase agreement regarding compliance with Section 15(f) of the 1940 Act.
The directors also considered the total expense ratio of each Fund in comparison to the fees and expenses of funds within its peer group. In considering the expense ratios of the Funds, the directors noted that the Funds have elected to have shareholder services provided at cost by Seligman Data Corp. (“SDC”). The directors also reviewed each Fund’s total expense ratio as compared to the fees and expenses of funds within its peer group. In considering the expense ratios of each Fund, the directors noted that each Fund has elected to have shareholder services provided at cost by SDC. SDC provided services exclusively to the Seligman Group of Funds, and the directors believed that the arrangement with SDC has provided each Fund and its shareholders with a consistently high level of service. The directors noted that RiverSource had previously indicated that no changes to the arrangements with SDC were being proposed at the time by RiverSource.
For each Fund, the directors noted that they had concluded in their most recent continuance considerations that the management fee and total expense ratio were at an acceptable level in light of the quality of services provided to the Fund and in comparison to the Fund’s peer group; that the advisory fee would not be increased and would stay the same for all but one of the Funds; that the total expense ratio had not changed materially since that determination; and that RiverSource had represented that the overall expenses for each Fund were not expected to be adversely affected by the Transaction. On that basis, the directors concluded that the total expense ratio and proposed advisory fee for each such Fund anticipated to result from the proposed arrangements with RiverSource was acceptable. The directors also noted the Funds that currently had the benefit of waiver and reimbursement policies of Seligman, that RiverSource had agreed to continue such waiver and reimbursement policies for the periods announced by Seligman.
56
Matters Relating to the Directors’
Consideration of the Approval of the
Investment Management Services Agreement
Economies of Scale
The directors noted that the management fee schedules for the Funds do not have breakpoints that reduce the fee rate on assets above specified levels. The directors recognized that there is no direct relationship between the economies of scale realized by funds and those realized by their investment advisers as assets increase. The directors do not believe that there is a uniform methodology for establishing breakpoints that give effect to fund-specific economies of scale with respect to services provided by fund advisers. The directors also observed that in the investment company industry as a whole, as well as among funds similar to each Fund, there is no uniformity or pattern in the fees and asset levels at which breakpoints (if any) apply, and that the advisory agreements for many competitor funds do not have breakpoints at all. The directors noted that RiverSource had indicated that no changes to the Funds’ breakpoint arrangements were proposed to be made at the time. Having taken these factors into account, the directors concluded that each Fund’s breakpoint arrangements were acceptable under the Fund’s circumstances. The directors also recognized that the Funds may benefit from certain economies of scale over time from becoming a part of the larger RiverSource fund complex, based on potential future synergies of operations.
57
Shareholders of Seligman Asset Allocation Series, Inc. voted on two proposals at a Special Meeting of Shareholders held on November 3, 2008. Shareholders voted in favor of each of the proposals. The description of each proposal and number of shares voted are as follows:
Proposal 1
To consider and vote upon the proposed Investment Management Services Agreement with RiverSource Investments, LLC:
|
|
|
|
|
|
|
|
|
| For |
| Against |
| Abstain |
|
Asset Allocation Aggressive Growth Fund |
| 1,056,843.008 |
| 79,650.467 |
| 80,037.117 |
|
Asset Allocation Growth Fund |
| 1,897,851.568 |
| 57,022.798 |
| 75,462.365 |
|
Asset Allocation Moderate Growth Fund |
| 2,024,927.322 |
| 67,588.900 |
| 99,921.899 |
|
Proposal 2
To elect ten directors to the Board:
|
|
|
|
|
|
|
| For |
| Withheld |
|
Kathleen Blatz |
| 8,595,749.076 |
| 4,135,77.407 |
|
Arne H. Carlson |
| 8,600,232.747 |
| 4,090,93.736 |
|
Pamela G. Carlton |
| 8,596,803.149 |
| 4,125,23.334 |
|
Patricia M. Flynn |
| 8,602,945.392 |
| 4,063,81.091 |
|
Anne P. Jones |
| 8,596,803.149 |
| 4,125,23.334 |
|
Jeffrey Laikind |
| 8,593,036.431 |
| 4,162,90.052 |
|
Stephen R. Lewis, Jr. |
| 8,599,178.674 |
| 4,101,47.809 |
|
Catherine James Paglia |
| 8,595,749.076 |
| 4,135,77.407 |
|
Alison Taunton-Rigby |
| 8,595,492.076 |
| 4,148,34.407 |
|
William F. Truscott |
| 8,592,581.316 |
| 4,167,45.167 |
|
The Meeting was adjourned until November 6, 2008, at which the following proposal was voted on by shareholders and approved:
Proposal 1
To consider and vote upon the proposed Investment Management Services Agreement with RiverSource Investments, LLC:
|
|
|
|
|
|
|
|
|
| For |
| Against |
| Abstain |
|
Asset Allocation Balanced Fund |
| 1,241,872.929 |
| 37,427.172 |
| 158,873.270 |
|
58
Shareholders elect a Board of Directors that oversees the Series’ operations. In connection with the acquisition of the Funds’ prior investment manager, J. & W. Seligman & Co. Incorporated, by RiverSource Investments, LLC, shareholders of the Funds voted at a Special Meeting of Shareholders held on November 3, 2008 to elect 10 members to the Series’ Board. Messrs. Maher and Richie served on the Series’ Board prior to the acquisition and will continue to do so.
Each member of the Board oversees 163 portfolios in the fund complex managed by RiverSource Investments, which includes 59 Seligman Funds and 104 RiverSource Funds. The address of each Director is 901 S. Marquette Ave., Minneapolis, MN 55402.
Independent Directors
|
|
|
|
Name, (Age), Position(s) |
| Principal Occupation(s) During Past Five Years, Directorships | |
Kathleen Blatz (54)1,2,6,7 |
| Attorney. Formerly, Chief Justice, Minnesota Supreme Court, 1998-2006. | |
• | Director: From |
|
|
Arne H. Carlson (74)1,2,3,5,6 |
| Formerly, Chairman, RiverSource Funds, 1999-2006; Governor of Minnesota. | |
• | Director: From |
| |
Pamela G. Carlton (54)4,6,7 |
| President, Springboard — Partners in Cross Cultural Leadership (consulting company). | |
• | Director: From |
| |
| November 7, 2008 |
|
|
Patricia M. Flynn (58)1,3,6 |
| Trustee Professor of Economics and Management, Bentley College. Formerly, Dean, McCallum Graduate School of Business, Bentley College. | |
• | Director: From |
| |
| November 7, 2008 |
| |
Anne P. Jones (73) |
| Attorney and Consultant. | |
• | Director: From |
|
|
|
|
|
|
Jeffrey Laikind, CFA (73)4,6,7 |
| Director, American Progressive Insurance. Formerly, Managing Director, Shikiar Asset Management. | |
• | Director: From |
| |
Stephen R. Lewis, Jr. (69)1,2,3,4,6 |
| President Emeritus and Professor of Economics, Carleton College; Director, Valmont Industries, Inc. (manufactures irrigation systems). | |
• | Director and Chairman |
| |
John F. Maher (64)4,6,7 |
| Retired President and Chief Executive Officer, and former Director, Great Western Financial Corporation (bank holding company) and its principal subsidiary, Great Western Bank (a federal savings bank). | |
• | Director: December 2006 |
| |
| to Date |
| |
|
|
|
|
See footnotes on page 60. |
59
Directors and Officers
Independent Directors (continued)
|
|
|
|
Name, (Age), Position(s) |
| Principal Occupation(s) During Past Five Years, Directorships | |
Catherine James Paglia |
| Director, Enterprise Asset Management, Inc. (private real estate and asset management company). | |
• | Director: From |
| |
Leroy C. Richie (66)3,4,6 |
| Counsel, Lewis & Munday, P.C. (law firm); Director, Vibration Control Technologies, LLC (auto vibration technology); Lead Outside Director, Digital Ally Inc. (digital imaging) and Infinity, Inc. (oil and gas exploration and production); Director and Chairman, Highland Park Michigan Economic Development Corp.; and Chairman, Detroit Public Schools Foundation; Director, OGE Energy Corp. (energy and energy services provider). Formerly, Chairman and Chief Executive Officer, Q Standards Worldwide, Inc. (library of technical standards); Director, Kerr-McGee Corporation (diversified energy and chemical company); Trustee, New York University Law Center Foundation; and Vice Chairman, Detroit Medical Center and Detroit Economic Growth Corp. | |
• | Director: 2000 to Date |
| |
|
|
| |
|
|
| |
|
|
| |
|
|
| |
|
|
| |
|
|
| |
|
|
| |
|
|
| |
|
|
| |
Alison Taunton-Rigby (64)3,4,5,6 |
| Chief Executive Officer and Director, RiboNovix, Inc. since 2003 (biotechnology); Director, Idera Pharmaceutical, Inc. (biotechnology); Healthways, Inc. (health management programs). Formerly, President, Forester Biotech. | |
• | Director: From |
| |
|
|
| |
|
|
|
|
Interested Director* | |||
|
|
|
|
William F. Truscott (48)*6 |
| President — US Asset Management and Chief Investment Officer, Ameriprise Financial, Inc. and President, Chairman of the Board, and Chief Investment Officer, RiverSource Investments, LLC; Director, President and Chief Executive Officer, Ameriprise Certificate Company; and Chairman of the Board, Chief Executive Officer, and President, RiverSource Distributors, Inc. Formerly, Senior Vice President — Chief Investment Officer, Ameriprise Financial, Inc.; and Chairman of the Board and Chief Investment Officer, RiverSource Investments, LLC, 2001-2005. | |
• | Director and Vice |
| |
|
|
| |
|
|
| |
|
|
| |
|
|
| |
|
|
* | Mr. Truscott is considered an “interested person” of the Series, as defined in the Investment Company Act of 1940, as amended, by virtue of his position with Ameriprise Financial, Inc. and its affiliates. |
|
|
|
|
|
Member: |
| 1 Board Governance Committee |
|
|
|
| 2 Compliance Committee |
|
|
|
| 3 Contracts Committee |
|
|
|
| 4 Distribution Committee |
|
|
|
| 5 Executive Committee |
|
|
|
| 6 Investment Review Committee |
|
|
|
| 7 Joint Audit Committee |
|
|
60
Fund Officers
The Board appoints officers who are responsible for day-to-day business decisions based on policies it has established. The officers serve at the pleasure of the Board. In addition to Mr. Truscott, who is a Director and Vice President of the Series, the Series’ other officers are:
|
|
|
|
Name, (Age), Position(s) |
| Principal Occupation(s) During Past Five Years | |
Patrick T. Bannigan (43) |
| Director and Senior Vice President — Asset Management, Products and Marketing, RiverSource Investments, LLC; Director and Vice President - Asset Management, Products and Marketing, RiverSource Distributors, Inc. Formerly, Managing Director and Global Head of Product, Morgan Stanley Investment Management, 2004-2006; President, Touchstone Investments, 2002-2004. | |
• | President: From |
| |
• | 172 Ameriprise Financial |
| |
Michelle M. Keeley (44) |
| Executive Vice President — Equity and Fixed Income, Ameriprise Financial, Inc. and RiverSource Investments, LLC; Vice President — Investments, Ameriprise Certificate Company. Formerly, Senior Vice President — Fixed Income, Ameriprise Financial, Inc., 2002-2006 and RiverSource Investments, LLC, 2004-2006. | |
• | Vice President: From |
| |
• | 172 Ameriprise Financial |
| |
Amy K. Johnson (43) |
| Vice President — Asset Management and Trust Company Services, RiverSource Investments, LLC. Formerly, Vice President — Operations and Compliance, RiverSource Investments, LLC, 2004-2006; Director of Product Development — Mutual Funds, Ameriprise Financial, Inc., 2001-2004. | |
• | Vice President: From |
| |
• | 5228 Ameriprise |
| |
Scott R. Plummer (49) |
| Vice President and Chief Counsel — Asset Management, Ameriprise Financial, Inc.; Chief Counsel, RiverSource Distributors, Inc. and Chief Legal Officer and Assistant Secretary, RiverSource Investments, LLC; Vice President, General Counsel, and Secretary, Ameriprise Certificate Company. Formerly, Vice President — Asset Management Compliance, Ameriprise Financial, Inc., 2004-2005; Senior Vice President and Chief Compliance Officer, USBancorp Asset Management, 2002-2004. | |
• | Vice President, General |
| |
• | 5228 Ameriprise |
| |
Lawrence P. Vogel (52) |
| Treasurer of each of the investment companies of the Seligman Group of Funds since 2000; and Treasurer, Seligman Data Corp. since 2000. Formerly, Senior Vice President, J. & W. Seligman & Co. Incorporated and Vice President of each of the investment companies of the Seligman Group of Funds, 1992-2008. | |
• | Treasurer: 2000 to Date |
| |
• | 100 Park Avenue |
| |
61
Fund Officers (continued)
|
|
|
|
Name, (Age), Position(s) |
| Principal Occupation(s) During Past Five Years | |
Eleanor T.M. Hoagland (56) |
| Chief Compliance Officer, RiverSource Investments, LLC (J. & W. Seligman & Co. Incorporated prior to November 7, 2008), of each of the investment companies of the Seligman Group of Funds since 2004; Money Laundering Prevention Officer and Identity Theft Prevention Officer, RiverSource Investments, LLC for each of the investment companies of the Seligman Group of Funds since November 7, 2008. Formerly, Managing Director, J. & W. Seligman & Co. Incorporated and Vice President of each of the investment companies of the Seligman Group of Funds, 2004-2008. | |
• | Chief Compliance |
| |
• | Money Laundering |
| |
• | 100 Park Avenue |
| |
The Series’ Statement of Additional Information (SAI) includes additional information about Series directors and is available, without charge, upon request. You may call toll-free (800) 221-2450 in the US or call collect (212) 682-7600 outside the US to request a copy of the SAI, to request other information about the Funds, or to make shareholder inquiries.
62
|
|
|
Fund Symbols |
| |
Aggressive Growth Fund |
| |
Class A: STHAX |
| |
Class B: SBTHX |
| |
Class C: STHCX |
| |
|
| |
Growth Fund |
| |
Class A: SATWX |
| |
Class B: STWBX |
| |
Class C: STWCX |
| |
|
| |
Moderate Growth Fund |
| |
Class A: SANAX |
| |
Class B: SANBX |
| |
Class C: STNCX |
| |
|
| |
Balanced Fund |
| |
Class A: SATVX |
| |
Class B: STVBX |
| |
Class C: STVCX |
| |
|
| |
Manager |
| |
From November 7, 2008 |
| |
RiverSource Investments, LLC |
| |
200 Ameriprise Financial Center |
| |
Minneapolis, MN 55474 |
| |
|
| |
Until November 6, 2008 |
| |
J. & W. Seligman & Co. |
| |
Incorporated |
| |
100 Park Avenue |
| |
New York, NY 10017 |
| |
|
| |
Shareholder Service Agent |
| |
Seligman Data Corp. |
| |
100 Park Avenue |
| |
New York, NY 10017 |
| |
|
| |
Mail Inquiries to: |
| |
P.O. Box 9759 |
| |
Providence, RI 02940-9759 |
| |
|
| |
General Distributor |
| |
RiverSource Fund Distributors, Inc. |
| |
(formerly Seligman Advisors, Inc.) |
| |
100 Park Avenue |
| |
New York, NY 10017 |
| |
|
| |
Independent Registered Public |
| |
Accounting Firm |
| |
Deloitte & Touche LLP |
| |
|
| |
Important Telephone Numbers |
| |
(800) 221-2450 | Shareholder Services |
|
(800) 445-1777 | Retirement Plan |
|
| Services |
|
(212) 682-7600 | Outside the |
|
| United States |
|
(800) 622-4597 | 24-Hour Automated |
|
| Telephone Access |
|
| Service |
|
| ||
Quarterly Schedule of Investments
A complete schedule of portfolio holdings owned by the Series will be filed with the SEC for the first and third quarter of each fiscal year on Form N-Q, and will be available to shareholders (i) without charge, upon request, by calling toll-free (800) 221-2450 in the US or collect (212) 682-7600 outside the US or (ii) on the SEC’s website at www.sec.gov.1 In addition, the Form N-Q may be reviewed and copied at the SEC’s Public Reference Room in Washington, D.C. Information on the operation of the Public Reference Room may be obtained by calling (800) SEC-0330. Certain of the information contained in the Fund’s Form N-Q is also made available to shareholders on Seligman’s website at www.seligman.com.1
Proxy Voting
A description of the policies and procedures used by the Series to determine how to vote proxies relating to portfolio securities as well as information regarding how the Series voted proxies relating to portfolio securities during the 12-month period ended June 30 of each year will be available (i) without charge, upon request, by calling toll-free (800) 221-2450 in the US or collect (212) 682-7600 outside the US and (ii) on the SEC’s website at www.sec.gov.1 Information for each new 12-month period ending June 30 will be available no later than August 31 of that year.
|
|
1 | These website references are inactive textual references and information contained in or otherwise accessible through these websites does not form a part of this report or the Series’ prospectus or statement of additional information. |
63
This report is intended only for the information of shareholders or those who have received the offering prospectus covering shares of Capital Stock of Seligman Asset Allocation Series, Inc., which contains information about the investment objectives, risks, charges, and expenses of the Series, each of which should be considered carefully before investing or sending money.
THF2 12/08
ITEM 2. | CODE OF ETHICS. |
As of December 31, 2008, the registrant has adopted a code of ethics that applies to its principal executive and senior financial officers. The registrant adopted a revised code of ethics on November 13, 2008, which is attached as an exhibit to this Form N-CSR. The new code of ethics is substantially the same as the prior code of ethics. | |
ITEM 3. | AUDIT COMMITTEE FINANCIAL EXPERT. |
The Registrant's board of directors has determined that independent directors Pamela G. Carlton, Jeffrey Laikind, John F. Maher and Anne P. Jones, each qualify as audit committee financial experts. | |
ITEM 4. | PRINCIPAL ACCOUNTANT FEES AND SERVICES. |
(a) – (d) Aggregate fees billed to the registrant for the last two fiscal years for professional services rendered by the registrant’s principal accountant were as follows: | |
2008 | 2007 | ||||
Audit Fees | $59,020 | $53,923 | |||
Audit-Related Fees | – | – | |||
Tax Fees | 11,000 | 9,400 | |||
All Other Fees | – | 2,333 | |||
Audit fees include amounts related to the audit of the registrant’s annual financial statements and services normally provided by the accountant in connection with statutory and regulatory filings. Tax fees include amounts related to tax compliance, tax planning, and tax advice. Other fees include the registrant's pro-rata share of amounts for services related to the assessment of procedures for compliance with anti-money laundering regulations by the registrant and certain other associated investment companies. | |
Aggregate fees billed by the registrant’s principal accountant for the last two fiscal years for non-audit services provided to the registrant’s investment adviser (not including a sub-adviser whose role is primarily portfolio management and is sub-contracted or overseen by another investment adviser) and any entity controlling, controlled by, or under common control with the investment adviser that provides ongoing services to the registered investment company, where the engagement relates directly to the operations and financial reporting of the registrant, were as follows: | |
2008 | 2007 | ||||
Audit-Related Fees | $144,330 | $141,440 | |||
Tax Fees | 8,500 | 9,000 | |||
All Other Fees | – | 15,000 | |||
Audit-related fees include amounts for (i) attestation services for the registrant’s shareholder service agent; (ii) testing of the registrant’s shareholder service agent’s conversion to a new record-keeping system and (iii) performance of certain agreed-upon procedures relating to certain services performed by the registrant’s distributor. Tax fees include amounts related to amounts paid by the registrant’s investment adviser for the preparation of the registrant’s 2007 |
tax return and tax compliance, tax planning, and tax advice for and an evaluation of certain tax reporting procedures of the registrant’s shareholder service agent. Other fees include the amounts for services related to the assessment of procedures for compliance with anti-money laundering regulations by certain of the registrant’s affiliates. | ||
(e) (1) The Audit Committee is required to preapprove audit and non-audit services performed for the registrant by the principal accountant in order to assure that the provision of such services does not impair the principal accountant’s independence. The Audit Committee also is required to preapprove certain non-audit services performed by the registrant’s principal accountant for the registrant’s investment adviser (not including any sub-adviser whose role is primarily portfolio management and is subcontracted with or overseen by another investment adviser) and certain of the adviser’s affiliates that provide services directly related to the operations and financial reporting of the registrant. Unless a type of service to be provided by the principal accountant has received preapproval, it will require specific preapproval by the Audit Committee. | ||
Notwithstanding the foregoing, under certain circumstances, preapproval of non-audit services of a de minimis amount is not required. | ||
(2) No services included in (b) – (d) above were approved pursuant to the waiver provisions of paragraphs (c)(7)(i)(C) or (c)(7)(ii) of Rule 2-01 of Regulation S-X. | ||
(f) Not applicable. | ||
(g) The aggregate fees billed for the most recent fiscal year and the preceding fiscal year by the registrant’s principal accountant for non-audit services rendered to the registrant, its investment adviser (not including any subadviser whose role is primarily portfolio management and is subcontracted with or overseen by another investment adviser), and any entity controlling, controlled by, or under common control with the investment adviser that provides ongoing services to the registrant were $163,830 and $177,173, respectively. | ||
(h) All non-audit services rendered in (g) above were pre-approved by the registrant’s audit committee. Accordingly, the audit committee considered whether these services were compatible with maintaining the principal accountant’s independence. | ||
ITEM 5. | AUDIT COMMITTEE OF LISTED REGISTRANTS. | |
Not applicable. | ||
ITEM 6. | INVESTMENTS. | |
(a) | Schedule I - Investments in securities of unaffiliated issuers. Included in Item 1 above. | |
(b) | Not applicable. | |
ITEM 7. | DISCLOSURE OF PROXY VOTING POLICIES AND PROCEDURES FOR CLOSED-END MANAGEMENT INVESTMENT COMPANIES. | |
Not applicable. | ||
ITEM 8. | PORTFOLIO MANAGERS OF CLOSED-END MANAGEMENT INVESTMENT COMPANIES. | |
Not applicable. | ||
ITEM 9. | PURCHASES OF EQUITY SECURITIES BY CLOSED-END MANAGEMENT INVESTMENT COMPANY AND AFFILIATED PURCHASERS. | |
Not applicable. |
ITEM 10. | SUBMISSION OF MATTERS TO A VOTE OF SECURITY HOLDERS. | |
Effective November 7, 2008, the duties of the Nominating Committee of the Board of Directors of the registrant have been assumed by the Board Governance Committee of the Board. The Board Governance Committee would recommend to the Board the size, structure and composition of the Board and its committees. This committee would also review candidates for Board membership including candidates recommended by stockholders. | ||
ITEM 11. | CONTROLS AND PROCEDURES. | |
(a) The registrant's principal executive officer and principal financial officer have concluded, based upon their evaluation of the registrant's disclosure controls and procedures as conducted within 90 days of the filing date of this report, that these disclosure controls and procedures provide reasonable assurance that material information required to be disclosed by the registrant in the report it files or submits on Form N-CSR is recorded, processed, summarized and reported, within the time periods specified in the Commission's rules and forms and that such material information is accumulated and communicated to the registrant's management, including its principal executive officer and principal financial officer, as appropriate, in order to allow timely decisions regarding required disclosure. | ||
(b) The registrant’s principal executive officer and principal financial officer are aware of no changes in the registrant’s internal control over financial reporting that occurred during the second fiscal quarter of the period covered by this report that has materially affected, or is reasonably likely to materially affect, the registrant’s internal control over financial reporting. | ||
ITEM 12. | EXHIBITS. | |
(a)(1) | Code of Ethics for Principal Executive and Senior Financial Officers. | |
(a)(2) | Certifications of principal executive officer and principal financial officer as required by Rule 30a-2(a) under the Investment Company Act of 1940. | |
(a)(3) | Not applicable. | |
(b) | Certifications of chief executive officer and chief financial officer as required by Rule 30a-2(b) under the Investment Company Act of 1940. | |
SIGNATURES
Pursuant to the requirements of the Securities Exchange Act of 1934 and the Investment Company Act of 1940, the registrant has duly caused this report to be signed on its behalf by the undersigned, thereunto duly authorized.
SELIGMAN ASSET ALLOCATION SERIES, INC. | |
By: | /S/ PATRICK T. BANNIGAN |
Patrick T. Bannigan | |
President and Chief Executive Officer | |
Date: March 9, 2009 |
Pursuant to the requirements of the Securities Exchange Act of 1934 and the Investment Company Act of 1940, this report has been signed below by the following persons on behalf of the registrant and in the capacities and on the dates indicated.
By: | /S/ PATRICK T. BANNIGAN |
Patrick T. Bannigan | |
President and Chief Executive Officer | |
Date: March 9, 2009 |
By: | /S/ LAWRENCE P.VOGEL |
Lawrence P. Vogel | |
Treasurer and Chief Financial Officer | |
Date: March 9, 2009 |
SELIGMAN ASSET ALLOCATION SERIES, INC. | ||
EXHIBIT INDEX | ||
(a)(1) | Code of Ethics for Principal Executive and Senior Financial Officers. | |
(a)(2) | Certifications of principal executive officer and principal financial officer as required by Rule 30a-2(a) under the Investment Company Act of 1940. | |
(b) | Certification of chief executive officer and chief financial officer as required by Rule 30a-2(b) of the Investment Company Act of 1940. | |