UNITED STATES
SECURITIES AND EXCHANGE COMMISSION
WASHINGTON, D.C. 20549
FORM N-CSR
CERTIFIED SHAREHOLDER REPORT OF REGISTERED MANAGEMENT
INVESTMENT COMPANIES
Investment Company Act file number 811-9545
Seligman Time Horizon/Harvester Series, Inc.
(Exact name of Registrant as specified in charter)
100 Park Avenue
New York, New York 10017
(Address of principal executive offices) (Zip code)
Lawrence P. Vogel
100 Park Avenue
New York, New York 10017
(Name and address of agent for service)
Registrant’s telephone number, including area code: (212) 850-1864
Date of fiscal year end: 12/31
Date of reporting period: 12/31/05
FORM N-CSR
ITEM 1. REPORTS TO STOCKHOLDERS.
Seligman Time Horizon/Harvester Series, Inc. Seligman Time Horizon 30 Fund Seligman Time Horizon 20 Fund Seligman Time Horizon 10 Fund Seligman Harvester Fund | |
Annual Report December 31, 2005 Asset Allocation Strategies Seeking to Manage Risk Over Time | |
Seligman
142 Years of Investment Experience
J. & W. Seligman & Co. Incorporated is a firm with a long tradition of investment expertise, offering a broad array of investment choices to help today’s investors seek their long-term financial goals.
Established in 1864, Seligman has a history of providing financial services marked not by fanfare, but rather by a quiet and firm adherence to financial prudence. While the world has changed dramatically in the 142 years since Seligman first opened its doors, the firm has continued to offer its clients high-quality investment solutions through changing times.
In the late 19th century, as the country grew, Seligman helped finance the westward expansion of the railroads, the construction of the Panama Canal, and the launching of urban transit systems. In the early 20th century, the firm helped fund the growing capital needs of new industries, including the nascent automobile and steel industries.
With the formation of Tri-Continental Corporation in 1929 — today, one of the nation’s largest diversified publicly-traded closed-end investment companies —Seligman began shifting its emphasis to investment management. In 1930, Seligman established what would be the first in an impressive lineup of mutual funds.
Seligman is proud of its distinctive past and of the traditional values that continue to shape the firm’s business decisions and investment judgment. While much has changed over the years, the firm’s commitment to providing prudent investment management that seeks to build wealth for clients over time is an enduring value that will continue to guide Seligman.
Table of Contents | |
To The Shareholders | 1 |
Interview With Your Portfolio Manager | 2 |
Performance Overview | 4 |
Portfolio Overview | 10 |
Understanding and Comparing Your Fund’s Expenses | 11 |
Portfolios of Investments | 13 |
Statements of Assets and Liabilities | 15 |
Statements of Operations | 17 |
Statements of Changes in Net Assets | 18 |
Notes to Financial Statements | 20 |
Financial Highlights | 30 |
Report of Independent Registered Public Accounting Firm | 46 |
Required Federal Income Tax Information | 47 |
Matters Relating to the Directors’ Consideration of the Continuance of the Management Agreement | 48 |
Directors and Officers | 53 |
Additional Fund Information | 57 |
To The Shareholders
We are pleased to present your annual shareholder report for Seligman Time Horizon/Harvester Series, Inc. The report contains an interview with your Portfolio Manager, the Series’ investment results, portfolios of investments, and audited financial statements.
For the year ended December 31, 2005, based on the net asset value of Class A shares, Seligman Time Horizon 30 Fund delivered a total return of 10.52%, Seligman Time Horizon 20 Fund delivered a total return of 9.79%, Seligman Time Horizon 10 Fund delivered a total return of 8.32%, and Seligman Harvester Fund delivered a total return of 4.53%. During the same period, the broader market, as measured by the S&P 500 Index, returned 4.90%, and the fixed income market, as measured by the Lehman Brothers Government/Credit Index returned 2.37%.
We thank you for your continued support of Seligman Time Horizon/Harvester Series, and look forward to serving your investment needs for many years to come.
By order of the Board of Directors,
William C. Morris
Chairman
Brian T. Zino
President
February 17, 2006
Manager J. & W. Seligman & Co. Incorporated 100 Park Avenue New York, NY 10017 | Shareholder Service Agent Seligman Data Corp. 100 Park Avenue New York, NY 10017 | Important Telephone Numbers (800) 221-2450 Shareholder Services (800) 445-1777 Retirement Plan Services (212) 682-7600 Outside the United States (800) 622-4597 24-Hour Automated Telephone Access Service |
General Distributor Seligman Advisors, Inc. 100 Park Avenue New York, NY 10017 | General Counsel Sullivan & Cromwell LLP | |
Independent Registered Public Accounting Firm Deloitte & Touche LLP |
1
Interview With Your Portfolio Manager
Charles W. Kadlec
Q: | How did Seligman Time Horizon/Harvester Series, Inc. perform for the year ended December 31, 2005? |
A: | For the year ended December 31, 2005, based on the net asset value of Class A shares, Seligman Time Horizon 30 Fund delivered a total return of 10.52%, Seligman Time Horizon 20 Fund delivered 9.79%, Seligman Time Horizon 10 Fund delivered 8.32%, and Seligman Harvester Fund delivered 4.53%. During the same period, the S&P 500 Index returned 4.90% and the Lehman Government/Credit Index returned 2.37%. |
Q: | What market conditions and events materially affected the Funds’ performances during the period? |
A: | During the period under review, markets around the world were affected by a wide variety of events, including sharply escalating energy prices, rising interest rates, natural disasters, and continuing concerns over terrorism. |
Despite such challenges, many economies, particularly the US, proved to be resilient and encouraging, if not strong. Core inflation remained low, and consumer spending remained strong despite periods of sluggishness throughout the year. Corporate profits and capital spending tended to increase, and merger and acquisition activity accelerated. European and Japanese markets showed strength, with particularly impressive results coming from emerging markets. Technology was strong worldwide, due in large part to a healthy overall global electronics market. | |
The mixed, often uncertain environment created by these events and developments proved highly favorable for the Funds because of their wide, strategic diversification across equities, fixed income and equity real estate investment trusts (REITs). Every asset class to which the Funds allocate delivered positive returns. The Time Horizon 30, Time Horizon 20 and Time Horizon 10 Funds especially benefited from their large exposure to US and international equities, including emerging markets. | |
Q: | What investment strategies or techniques materially affected the Funds’ performances during the period? |
A: | We maintain research-based strategic allocations for all Funds in the Series based on the “time horizon” to a financial goal and avoid short-term or tactical shifts in portfolio weightings. As a result of this investment philosophy, the Funds in the Series benefited from allocations to a number of asset classes that performed well during the year, particularly emerging markets, large- and mid-cap domestic equities, international equities, and technology. |
Seligman Time Horizon 30 Fund had the greatest exposure to overseas equities, with emphasis on the particularly well-performing areas of emerging markets and global smaller companies, and so benefited the most from international exposure. While Seligman Harvester Fund maintained the lowest international exposure, with no exposure to Seligman Emerging Markets Fund or Seligman Global Smaller Companies Fund, it did add to its return by being exposed to international large-company equities. | |
The Funds all benefited from their exposure to mid- and large-cap US equities. In particular, the Time Horizon 30, Time Horizon 20 and Time Horizon 10 Funds received strong contributions from Seligman Capital Fund, Seligman Large-Cap Value Fund and Seligman Communications and Information Fund, |
2
Interview With Your Portfolio Manager
Charles W. Kadlec
which significantly outperformed technology stocks as a whole. Performance of these three Time Horizon Funds was hurt, however, by their allocations to US small-cap stocks, as the Seligman funds in this asset class underperformed their benchmarks for the period. The Harvester Fund, which, as the most conservative of the Time Horizon Funds, has no exposure to small-cap or technology stocks, benefited from allocations to Seligman Capital Fund, Seligman Growth Fund and Seligman Large-Cap Value Fund. | |
Even though fixed-income markets lagged equity markets in 2005, Seligman Time Horizon 10 Fund and Seligman Harvester Fund each received small but positive returns from allocations to Seligman High-Yield Fund. In addition, Seligman Harvester Fund received a positive contribution from Seligman Investment Grade Fixed Income Fund. | |
Seligman Harvester Fund and Seligman Time Horizon 10 Fund also benefited from allocations to equity REITs, even though Seligman LaSalle Monthly Dividend Real Estate Fund, which primarily seeks a high level of current income, lagged the strong total-return performance of equity REITs in general. |
__________
The views and opinions expressed are those of the Portfolio Manager(s), are provided for general information only, and do not constitute specific tax, legal, or investment advice to, or recommendations for, any person. There can be no guarantee as to the accuracy of market forecasts. Opinions, estimates, and forecasts may be changed without notice.
Portfolio Management Seligman Time Horizon/Harvester Series, Inc. is managed by Charles W. Kadlec. Mr. Kadlec is a Director and Managing Director of J. & W. Seligman & Co. Incorporated and President of Seligman Advisers, Inc. and Seligman Services, Inc. Mr. Kadlec is the architect of several investment strategies, chief among them Seligman Time Horizon Matrix and Seligman Harvester. |
3
Performance Overview
This section of the report is intended to help you understand the performance of each Fund of Seligman Time Horizon/Harvester Series and to provide a summary of each Fund’s portfolio characteristics.
Performance data quoted in this report represents past performance and does not guarantee or indicate future investment results. The rates of return will vary and the principal value of an investment will fluctuate. Shares, if redeemed, may be worth more or less than their original cost. Current performance may be lower or higher than the performance data quoted. Total returns of each Fund as of the most recent month end will be made available at www.seligman.com1 by the seventh business day following that month end. Calculations assume reinvestment of distributions, if any. Performance data quoted does not reflect the deduction of taxes that an investor may pay on distributions or the redemption of shares. J. & W. Seligman & Co. Incorporated (the “Manager”) waived certain fees and reimbursed certain expenses of each Fund other than distribution and service fees, as described in the Series’ prospectus. Absent such waivers and reimbursements, returns and yields would have been lower.
Returns for Class A shares are calculated with and without the effect of the initial 4.75% maximum sales charge. Returns for Class B shares are calculated with and without the effect of the maximum 5% contingent deferred sales charge (“CDSC”), charged on redemptions made within one year of the date of purchase, declining to 1% in the sixth year and 0% thereafter. Returns for Class C shares are calculated with and without the effect of the initial 1% maximum sales charge and the 1% CDSC that is charged on redemptions made within 18 months of the date of purchase. Returns for Class D shares are calculated with and without the effect of the 1% CDSC, charged on redemptions made within one year of the date of purchase.
The chart for each Fund compares a $10,000 hypothetical investment made in Class A shares, with and without the initial 4.75% maximum sales charge, to a $10,000 investment made in its benchmark since each Fund’s commencement of operations through December 31, 2005. The performance of Class B, Class C, and Class D shares, which commenced on later dates, and of Class A, Class B, Class C, and Class D shares for other periods, with and without applicable sales charges and CDSCs, is not shown in the following charts but is included in the total returns tables. The performance of Class B, Class C and Class D shares will differ from the performance shown for Class A shares based on the differences in sales charges and fees paid by shareholders.
An investment in a Fund is not a deposit in a bank and is not insured or guaranteed by the Federal Deposit Insurance Corporation or any other government agency.
__________
1 | The website reference is an inactive textual reference and information contained in or otherwise accessible through the website does not form a part of this report or the Series’ prospectus or statement of additional information. |
4
Performance Overview
Seligman Time Horizon 30 Fund
Investment Results
Total Returns
For Periods Ended December 31, 2005
Average Annual | ||||||||||||
Class A | Six Months | * | One Year | Five Years | Since Inception | † | ||||||
With Sales Charge | 5.38 | % | 5.23 | % | 3.01 | % | 0.30 | % | ||||
Without Sales Charge | 10.69 | 10.52 | 4.02 | 1.13 | ||||||||
Class B | ||||||||||||
With CDSC** | 5.32 | 4.79 | 2.90 | (0.05 | ) | |||||||
Without CDSC | 10.32 | 9.79 | 3.25 | 0.44 | ||||||||
Class C | ||||||||||||
With Sales Charge and CDSC | 8.29 | 7.77 | 3.05 | 0.23 | ||||||||
Without Sales Charge and CDSC | 10.32 | 9.79 | 3.25 | 0.39 | ||||||||
Class D | ||||||||||||
With 1% CDSC | 9.32 | 8.79 | n/a | n/a | ||||||||
Without CDSC | 10.32 | 9.79 | 3.25 | 0.39 | ||||||||
Benchmark | ||||||||||||
S&P 500*** | 5.75 | 4.90 | 0.54 | (1.01 | ) |
Net Asset Value Per Share
12/31/05 | 6/30/05 | 12/31/04 | |
Class A | $7.25 | $6.55 | $6.56 |
Class B | 6.95 | 6.30 | 6.33 |
Class C | 6.95 | 6.30 | 6.33 |
Class D | 6.95 | 6.30 | 6.33 |
__________
See footnotes on page 9.
5
Performance Overview
Seligman Time Horizon 20 Fund
Investment Results per Share
Total Returns
For Periods Ended December 31, 2005
Average Annual | ||||||||||||
Class A | Six Months | * | One Year | Five Years | Since Inception | † | ||||||
With Sales Charge | 5.12 | % | 4.51 | % | 2.06 | % | 0.14 | % | ||||
Without Sales Charge | 10.29 | 9.79 | 3.05 | 0.97 | ||||||||
Class B | ||||||||||||
With CDSC** | 4.95 | 4.08 | 1.93 | (0.25 | ) | |||||||
Without CDSC | 9.95 | 9.08 | 2.29 | 0.23 | ||||||||
Class C | ||||||||||||
With Sales Charge and CDSC | 7.91 | 7.05 | 2.10 | 0.03 | ||||||||
Without Sales Charge and CDSC | 9.95 | 9.08 | 2.29 | 0.19 | ||||||||
Class D | ||||||||||||
With 1% CDSC | 8.95 | 8.08 | n/a | n/a | ||||||||
Without CDSC | 9.95 | 9.08 | 2.29 | 0.19 | ||||||||
Benchmark | ||||||||||||
S&P 500*** | 5.75 | 4.90 | 0.54 | (1.01 | ) |
Net Asset Value Per Share
12/31/05 | 6/30/05 | 12/31/04 | |
Class A | $7.18 | $6.51 | $6.53 |
Class B | 6.85 | 6.23 | 6.28 |
Class C | 6.85 | 6.23 | 6.28 |
Class D | 6.85 | 6.23 | 6.28 |
__________
See footnotes on page 9.
6
Performance Overview
Seligman Time Horizon 10 Fund
Investment Results per Share
Total Returns
For Periods Ended December 31, 2005
Average Annual | ||||||||||||
Class A | Six Months | * | One Year | Five Years | Since Inception | † | ||||||
With Sales Charge | 2.99 | % | 3.14 | % | 1.13 | % | (0.28 | )% | ||||
Without Sales Charge | 8.14 | 8.32 | 2.12 | 0.54 | ||||||||
Class B | ||||||||||||
With CDSC** | 2.74 | 2.39 | 0.97 | (0.70 | ) | |||||||
Without CDSC | 7.74 | 7.39 | 1.35 | (0.23 | ) | |||||||
Class C | ||||||||||||
With Sales Charge and CDSC | 5.70 | 5.36 | 1.13 | (0.37 | ) | |||||||
Without Sales Charge and CDSC | 7.74 | 7.39 | 1.35 | (0.21 | ) | |||||||
Class D | ||||||||||||
With 1% CDSC | 6.74 | 6.39 | n/a | n/a | ||||||||
Without CDSC | 7.74 | 7.39 | 1.35 | (0.25 | ) | |||||||
Benchmark | ||||||||||||
S&P 500*** | 5.75 | 4.90 | 0.54 | (1.01 | ) |
Net Asset Value Per Share
12/31/05 | 6/30/05 | 12/31/04 | |
Class A | $6.64 | $6.19 | $6.18 |
Class B | 6.55 | 6.09 | 6.10 |
Class C | 6.55 | 6.09 | 6.11 |
Class D | 6.55 | 6.09 | 6.11 |
__________
See footnotes on page 9.
7
Performance Overview
Seligman Harvester Fund
Investment Results per Share
Total Returns
For Periods Ended December 31, 2005
Average Annual | ||||||||||||
Class A | Six Months | * | One Year | Five Years | Since Inception | † | ||||||
With Sales Charge | (0.71 | )% | (0.50 | )% | (1.10 | )% | (1.75 | )% | ||||
Without Sales Charge | 4.16 | 4.53 | (0.13 | ) | (0.94 | ) | ||||||
Class B | ||||||||||||
With CDSC** | (1.24 | ) | (1.24 | ) | (1.23 | ) | (2.14 | ) | ||||
Without CDSC | 3.76 | 3.76 | (0.87 | ) | (1.70 | ) | ||||||
Class C | ||||||||||||
With Sales Charge and CDSC | 1.65 | 1.65 | (1.08 | ) | (1.89 | ) | ||||||
Without Sales Charge and CDSC | 3.76 | 3.76 | (0.87 | ) | (1.72 | ) | ||||||
Class D | ||||||||||||
With 1% CDSC | 2.76 | 2.76 | n/a | n/a | ||||||||
Without CDSC | 3.76 | 3.76 | (0.87 | ) | (1.72 | ) | ||||||
Benchmarks | ||||||||||||
Lehman Brothers Government/Credit Index*** | (0.37 | ) | 2.37 | 6.11 | 7.11 | |||||||
S&P 500*** | 5.75 | 4.90 | 0.54 | (1.01 | ) |
Net Asset Value Per Share | Dividend Per Share |
and Yield Information | |
For the Periods Ended December 31, 2005 |
12/31/05 | 6/30/05 | 12/31/04 | Dividends Paidø | SEC 30-Day Yield‡ | ||||||||||||
Class A | $ | 5.67 | $ | 5.51 | $ | 5.53 | $ | 0.106 | 1.75 | % | ||||||
Class B | 5.67 | 5.51 | 5.53 | 0.065 | 1.08 | |||||||||||
Class C | 5.67 | 5.51 | 5.53 | 0.065 | 1.08 | |||||||||||
Class D | 5.67 | 5.51 | 5.53 | 0.065 | 1.08 |
__________
See footnotes on page 9.
8
Performance Overview
__________
* | Returns for periods of less than one year are not annualized. |
** | The CDSC is 5% for periods of one year or less, 2% for the five-year period, and 1% since inception. |
*** | The Lehman Brothers Government/Credit Index (“Lehman Index”) and the Standard & Poor’s 500 Composite Stock Index (“S&P 500”) are unmanaged benchmarks that assume reinvestment of all distributions and exclude the effect of taxes, fees and sales charges. The Lehman Index is composed of all bonds that are investment grade (rated Baa or higher by Moody’s or BBB or higher by S&P, if unrated by Moody’s). The S&P 500 measures the performance of 500 of the largest US companies based on market capitalization. Investors cannot invest directly in an index. |
† | Commencement of investment operations for Class A shares was 1/10/00. Class A share returns were computed from the commencement of investment operations. Class B, C, and D shares were offered to the public on 1/10/00, but were first issued at the dates indicated below. Total returns for Class B, C, and D shares of the Fund have been computed from the commencement of investment operations and incorporate the total return of Class A shares of the Fund from the commencement of investment operations through the initial issuance date of each of the other classes of shares, adjusted to reflect the higher expenses associated with the Administration, Shareholder Services and Distribution Plan for those classes that would have been incurred had they first been issued on the commencement of investment operations date. The total returns of Class B, C, and D shares from their individual initial issuance dates would be different, and may be lower, than those shown above. |
Class B | Class C | Class D | ||
Time Horizon 30 Fund | 4/24/00 | 2/8/00 | 2/14/00 | |
Time Horizon 20 Fund | 3/21/00 | 1/18/00 | 1/21/00 | |
Time Horizon 10 Fund | 2/18/00 | 3/6/00 | 2/15/00 | |
Harvester Fund | 2/17/00 | 1/18/00 | 2/29/00 |
Ø | Represents the per share amount paid or declared for the year ended December 31, 2005. |
‡ | Current yield, representing the annualized yield for the 30-day period ended December 31, 2005, has been computed in accordance with SEC regulations and will vary. During the period, the Manager waived certain fees and reimbursed certain expenses as described in the Series’ prospectus. Without these waivers/reimbursements, the yields would be zero. |
9
Portfolio Overview
Seligman Time Horizon 30 Fund
Allocation to Underlying Funds | Percent of Portfolio | ||
December 31, | |||
2005 | 2004 | ||
Domestic Equity Funds | 59.6 | 59.9 | |
Global Equity Funds | 40.4 | 40.1 | |
Total | 100.0 | 100.0 |
Seligman Time Horizon 20 Fund
Allocation to Underlying Funds | Percent of Portfolio | ||
December 31, | |||
2005 | 2004 | ||
Domestic Equity Funds | 62.2 | 63.0 | |
Global Equity Funds | 37.8 | 37.0 | |
Total | 100.0 | 100.0 |
Seligman Time Horizon 10 Fund
Allocation to Underlying Funds | Percent of Portfolio | ||
December 31, | |||
2005 | 2004 | ||
Domestic Equity Funds | 54.6 | 55.0 | |
Fixed Income Funds | 10.0 | 10.0 | |
Global Equity Funds | 25.5 | 25.1 | |
REIT Funds | 9.9 | 9.9 | |
Total | 100.0 | 100.0 |
Seligman Harvester Fund
Allocation to Underlying Funds | Percent of Portfolio | ||
December 31, | |||
2005 | 2004 | ||
Domestic Equity Funds | 44.8 | 45.0 | |
Fixed Income Funds | 30.2 | 30.0 | |
Global Equity Funds | 10.1 | 10.1 | |
REIT Funds | 14.9 | 14.9 | |
Total | 100.0 | 100.0 |
10
Understanding and Comparing
Your Fund’s Expenses
As a shareholder of a Fund of the Series, you incur ongoing expenses, such as management fees, distribution and service (12b-1) fees, and other fund expenses. The information below is intended to help you understand your ongoing expenses (in dollars) of investing in a Fund and to compare them with the ongoing expenses of investing in other mutual funds. Please note that the expenses shown in the table are meant to highlight your ongoing expenses only and do not reflect any transactional costs, such as sales charges (also known as loads) on certain purchases or redemptions. Therefore, the table is useful in comparing ongoing expenses only, and will not help you determine the relative total expenses of owning different funds. In addition, if transactional costs were included, your total expenses would have been higher.
The table is based on an investment of $1,000 invested at the beginning of July 1, 2005 and held for the entire six-month period ended December 31, 2005.
Actual Expenses
The table below provides information about actual expenses and actual account values. You may use the information, together with the amount you invested, to estimate the expenses that you paid over the period. Simply divide your account value at the beginning of the period by $1,000 (for example, an $8,600 account value divided by $1,000 = 8.6), then multiply the result by the number under the heading entitled “Expenses Paid During Period” for the share class of the Fund you own to estimate the expenses you paid on your account during the period.
Hypothetical Example for Comparison Purposes
The table below also provides information about hypothetical expenses and hypothetical account values based on the actual expense ratio of each Fund and an assumed rate of return of 5% per year before expenses, which is not the actual return of any Fund. The hypothetical expenses and account values may not be used to estimate the ending account value or the actual expenses you paid for the period. You may use this information to compare the ongoing expenses of investing in a Fund and other mutual funds. To do so, compare this 5% hypothetical example with the 5% hypothetical examples that appear in the shareholder reports of the other mutual funds.
(Continued on next page.)
11
Understanding and Comparing
Your Fund’s Expenses (continued)
Actual | Hypothetical | |||||||||||||||||
Fund | Beginning Account Value 7/1/05 | Annualized Expense Ratio* | Ending Account Value 12/31/05 | Expenses Paid During Period** 7/1/05 to 12/31/05 | Ending Account Value 12/31/05 | Expenses Paid During Period** 7/1/05 to 12/31/05 | ||||||||||||
Time Horizon 30 Fund | ||||||||||||||||||
Class A | $ | 1,000.00 | 0.40% | $ | 1,106.90 | $ | 2.23 | $1,023.18 | $2.05 | |||||||||
Class B | 1,000.00 | 1.16 | 1,103.20 | 6.12 | 1,019.38 | 5.88 | ||||||||||||
Class C | 1,000.00 | 1.16 | 1,103.20 | 6.12 | 1,019.38 | 5.88 | ||||||||||||
Class D | 1,000.00 | 1.16 | 1,103.20 | 6.12 | 1,019.38 | 5.88 | ||||||||||||
Time Horizon 20 Fund | ||||||||||||||||||
Class A | 1,000.00 | 0.40 | 1,102.90 | 2.13 | 1,023.18 | 2.05 | ||||||||||||
Class B | 1,000.00 | 1.16 | 1,099.50 | 6.13 | 1,019.37 | 5.89 | ||||||||||||
Class C | 1,000.00 | 1.16 | 1,099.50 | 6.13 | 1,019.37 | 5.89 | ||||||||||||
Class D | 1,000.00 | 1.16 | 1,099.50 | 6.13 | 1,019.37 | 5.89 | ||||||||||||
Time Horizon 10 Fund | ||||||||||||||||||
Class A | 1,000.00 | 0.26 | 1,081.40 | 1.34 | 1,023.92 | 1.30 | ||||||||||||
Class B | 1,000.00 | 1.01 | 1,077.40 | 5.30 | 1,020.11 | 5.15 | ||||||||||||
Class C | 1,000.00 | 1.01 | 1,077.40 | 5.30 | 1,020.11 | 5.15 | ||||||||||||
Class D | 1,000.00 | 1.01 | 1,077.40 | 5.30 | 1,020.11 | 5.15 | ||||||||||||
Harvester | ||||||||||||||||||
Class A | 1,000.00 | 0.26 | 1,041.60 | 1.31 | 1,023.92 | 1.30 | ||||||||||||
Class B | 1,000.00 | 1.00 | 1,037.60 | 5.15 | 1,020.15 | 5.11 | ||||||||||||
Class C | 1,000.00 | 1.00 | 1,037.60 | 5.15 | 1,020.15 | 5.11 | ||||||||||||
Class D | 1,000.00 | 1.00 | 1,037.60 | 5.15 | 1,020.15 | 5.11 |
__________
* | Expenses of Class B, Class C, and Class D shares are higher than expenses of Class A shares due to the higher 12b-1 fees paid by Class B, Class C, and Class D shares. See the Series’ prospectus for a description of each share class and its expenses and sales charges. J. & W. Seligman & Co. Incorporated, the Manager, is waiving its investment management fee and reimbursing a portion of each Fund’s expenses, other than distribution and service fees (Note 3). Absent such waiver/reimbursement, the expense ratios and expenses paid for the period would have been higher. |
** | Expenses are equal to the Fund’s annualized expense ratio based on actual expenses for the period July 1, 2005 to December 31, 2005, multiplied by the average account value over the period, multiplied by 184/365 (number of days in the period). |
12
Portfolios of Investments
December 31, 2005
Seligman Time Horizon 30 Fund
Shares | Value | ||||
Domestic Equity Funds 59.1% | |||||
Seligman Capital Fund* | 132,442 | $ | 2,821,014 | ||
Seligman Communications and Information Fund* | 75,178 | 2,051,608 | |||
Seligman Frontier Fund*Ø | 30,750 | 382,837 | |||
Seligman Growth Fund* | 93,207 | 382,149 | |||
Seligman Large-Cap Value Fund | 30,326 | 387,870 | |||
Seligman Smaller-Cap Value Fund*Ø | 106,427 | 1,683,675 | |||
7,709,153 | |||||
Global Equity Funds 40.1% | |||||
Seligman Emerging Markets Fund*Ø | 123,657 | 1,328,076 | |||
Seligman Global Smaller Companies Fund*Ø | 194,830 | 3,249,764 | |||
Seligman International Growth Fund* | 47,709 | 655,999 | |||
5,233,839 | |||||
Total Investments (Cost $10,515,482) 99.2% | 12,942,992 | ||||
Other Assets Less Liabilities 0.8% | 101,607 | ||||
Net Assets 100.0% | $ | 13,044,599 | |||
Seligman Time Horizon 20 Fund | |||||
Shares | Value | ||||
Domestic Equity Funds 61.9% | |||||
Seligman Capital Fund* | 223,769 | $ | 4,766,280 | ||
Seligman Communications and Information Fund* | 86,988 | 2,373,902 | |||
Seligman Frontier Fund*Ø | 56,593 | 704,583 | |||
Seligman Growth Fund* | 521,937 | 2,139,942 | |||
Seligman Large-Cap Value Fund | 170,593 | 2,181,884 | |||
Seligman Smaller-Cap Value Fund*Ø | 183,801 | 2,907,732 | |||
15,074,323 | |||||
Global Equity Funds 37.7% | |||||
Seligman Emerging Markets Fund*Ø | 234,028 | 2,513,461 | |||
Seligman Global Smaller Companies Fund*Ø | 251,213 | 4,190,233 | |||
Seligman International Growth Fund* | 180,075 | 2,476,031 | |||
9,179,725 | |||||
Total Investments (Cost $20,307,824) 99.6% | 24,254,048 | ||||
Other Assets Less Liabilities 0.4% | 104,628 | ||||
Net Assets 100.0% | $ | 24,358,676 |
__________
See footnotes on page 14.
13
Portfolios of Investments
December 31, 2005
Seligman Time Horizon 10 Fund | ||||||
Shares | Value | |||||
Domestic Equity Funds 54.4% | ||||||
Seligman Capital Fund* | 284,491 | $ | 6,059,658 | |||
Seligman Communications and Information Fund* | 110,691 | 3,020,757 | ||||
Seligman Growth Fund* | 660,222 | 2,706,910 | ||||
Seligman Large-Cap Value Fund | 214,434 | 2,742,611 | ||||
Seligman Smaller-Cap Value Fund*Ø | 134,731 | 2,131,445 | ||||
16,661,381 | ||||||
Fixed-Income Funds 9.9% | ||||||
Seligman High-Yield Fund | 917,619 | 3,037,319 | ||||
Global Equity Funds 25.4% | ||||||
Seligman Emerging Markets Fund*Ø | 145,789 | 1,565,774 | ||||
Seligman Global Smaller Companies Fund*Ø | 185,281 | 3,090,487 | ||||
Seligman International Growth Fund* | 226,972 | 3,120,865 | ||||
7,777,126 | ||||||
REIT Funds 9.8% | ||||||
Seligman LaSalle Monthly Dividend Real Estate FundØ | 347,030 | 3,019,161 | ||||
Total Investments (Cost $27,274,764) 99.5% | 30,494,987 | |||||
Other Assets Less Liabilities 0.5% | 143,081 | |||||
Net Assets 100.0% | $ | 30,638,068 | ||||
Seligman Harvester Fund | ||||||
Shares | Value | |||||
Domestic Equity Funds 44.8% | ||||||
Seligman Capital Fund* | 79,340 | $ | 1,689,942 | |||
Seligman Common Stock Fund | 158,785 | 1,853,021 | ||||
Seligman Growth Fund* | 491,774 | 2,016,273 | ||||
Seligman Large-Cap Value Fund | 158,465 | 2,026,767 | ||||
7,586,003 | ||||||
Fixed-Income Funds 30.2% | ||||||
Seligman High-Yield Fund | 514,739 | 1,703,786 | ||||
Seligman Investment Grade Fixed Income Fund | 239,971 | 1,706,194 | ||||
Seligman U.S. Government Securities Fund | 247,645 | 1,706,274 | ||||
5,116,254 | ||||||
Global Equity Funds 10.1% | ||||||
Seligman International Growth Fund* | 124,782 | 1,715,753 | ||||
REIT Funds 15.0% | ||||||
Seligman LaSalle Monthly Dividend Real Estate FundØ | 290,944 | 2,531,213 | ||||
Total Investments (Cost $15,770,417) 100.1% | 16,949,223 | |||||
Other Assets Less Liabilities (0.1)% | (22,089 | ) | ||||
Net Assets 100.0% | $ | 16,927,134 |
__________
* | Non-income producing security. |
Ø | Security paid capital gain distributions during the year ended December 31, 2005. |
See Notes to Financial Statements.
14
Statements of Assets and Liabilities
December 31, 2005
Seligman Time Horizon 30 Fund | Seligman Time Horizon 20 Fund | Seligman Time Horizon 10 Fund | Seligman Harvester Fund | ||||||||||
Assets: | |||||||||||||
Investments in Underlying Funds, at value (see portfolios of investments) | $ | 12,942,992 | $ | 24,254,048 | $ | 30,494,987 | $ | 16,949,223 | |||||
Cash | 93,714 | 116,840 | 224,098 | 52,441 | |||||||||
Receivable for Capital Stock sold | 33,037 | 115,413 | 44,499 | 14,819 | |||||||||
Prepaid registration fees | 28,175 | 28,073 | 28,674 | 28,124 | |||||||||
Receivable from Manager | 9,986 | 10,553 | 10,709 | 13,288 | |||||||||
Dividends receivable | 24 | 136 | 7,425 | 18,039 | |||||||||
Other | 481 | 1,014 | 1,248 | 841 | |||||||||
Total Assets | 13,108,409 | 24,526,077 | 30,811,640 | 17,076,775 | |||||||||
Liabilities: | |||||||||||||
Payable for investments purchased | 26,918 | — | 59,787 | 21,975 | |||||||||
Payable for Capital Stock repurchased | 9,360 | 126,058 | 63,779 | 65,831 | |||||||||
Distribution and service fees payable | 5,543 | 11,636 | 17,817 | 8,403 | |||||||||
Dividends payable | — | — | — | 25,619 | |||||||||
Accrued expenses and other | 21,989 | 29,707 | 32,189 | 27,813 | |||||||||
Total Liabilities | 63,810 | 167,401 | 173,572 | 149,641 | |||||||||
Net Assets | $ | 13,044,599 | $ | 24,358,676 | $ | 30,638,068 | $ | 16,927,134 | |||||
Composition of Net Assets: | |||||||||||||
Capital Stock, at $0.001 par value: | |||||||||||||
Class A | $ | 793 | $ | 1,271 | $ | 1,659 | $ | 1,132 | |||||
Class B | 432 | 687 | 899 | 567 | |||||||||
Class C | 492 | 1,278 | 1,614 | 949 | |||||||||
Class D | 126 | 258 | 481 | 336 | |||||||||
Additional paid-in capital | 10,547,921 | 20,683,082 | 29,910,418 | 17,858,778 | |||||||||
Accumulated net investment loss | (1,783 | ) | (1,802 | ) | (1,814 | ) | (27,428 | ) | |||||
Accumulated net realized gain (loss) | 69,108 | (272,322 | ) | (2,495,412 | ) | (2,086,006 | ) | ||||||
Net unrealized appreciation of investments | 2,427,510 | 3,946,224 | 3,220,223 | 1,178,806 | |||||||||
Net Assets | $ | 13,044,599 | $ | 24,358,676 | $ | 30,638,068 | $ | 16,927,134 | |||||
Investments in Underlying Funds, at cost | $ | 10,515,482 | $ | 20,307,824 | $ | 27,274,764 | $ | 15,770,417 |
(Continued on page 16.)
15
Statements of Assets and Liabilities
December 31, 2005
Seligman Time Horizon 30 Fund | Seligman Time Horizon 20 Fund | Seligman Time Horizon 10 Fund | Seligman Harvester Fund | ||||||||||
Net Assets: | |||||||||||||
Class A | $ | 5,746,712 | $ | 9,133,401 | $ | 11,020,449 | $ | 6,422,126 | |||||
Class B | 3,001,370 | 4,702,680 | 5,887,905 | 3,219,347 | |||||||||
Class C | 3,420,183 | 8,755,547 | 10,575,720 | 5,381,877 | |||||||||
Class D | 876,334 | 1,767,048 | 3,153,994 | 1,903,784 | |||||||||
Shares of Capital Stock Outstanding: | |||||||||||||
Class A | 792,683 | 1,271,464 | 1,658,649 | 1,131,919 | |||||||||
Class B | 431,947 | 686,576 | 898,799 | 567,400 | |||||||||
Class C | 492,219 | 1,278,305 | 1,614,428 | 948,538 | |||||||||
Class D | 126,114 | 257,990 | 481,487 | 335,537 | |||||||||
Net Asset Value per Share: | |||||||||||||
Class A | $ | 7.25 | $ | 7.18 | $ | 6.64 | $ | 5.67 | |||||
Class B | $ | 6.95 | $ | 6.85 | $ | 6.55 | $ | 5.67 | |||||
Class C | $ | 6.95 | $ | 6.85 | $ | 6.55 | $ | 5.67 | |||||
Class D | $ | 6.95 | $ | 6.85 | $ | 6.55 | $ | 5.67 |
__________
See Notes to Financial Statements.
16
Statements of Operations
For the Year Ended December 31, 2005
Seligman Time Horizon 30 Fund | Seligman Time Horizon 20 Fund | Seligman Time Horizon 10 Fund | Seligman Harvester Fund | ||||||||||
Investment Income: | |||||||||||||
Dividends from Underlying Funds | $ | 24 | $ | 137 | $ | 268,504 | $ | 321,548 | |||||
Expenses: | |||||||||||||
Registration | 55,401 | 57,307 | 58,100 | 57,342 | |||||||||
Distribution and service fees | 44,933 | 103,156 | 128,208 | 81,791 | |||||||||
Auditing and legal fees | 18,658 | 26,670 | 28,900 | 24,648 | |||||||||
Management fees | 10,703 | 21,472 | 25,945 | 16,870 | |||||||||
Shareholder reports and communications | 7,087 | 11,141 | 12,037 | 10,399 | |||||||||
Directors’ fees and expenses | 5,909 | 6,151 | 6,249 | 6,046 | |||||||||
Shareholder account services | 4,580 | 11,514 | 11,830 | 12,474 | |||||||||
Custody and related services | 4,867 | 6,435 | 6,775 | 5,683 | |||||||||
Miscellaneous | 3,428 | 4,308 | 4,597 | 4,063 | |||||||||
Total Expenses Before Waiver/ Reimbursement | 155,566 | 248,154 | 282,641 | 219,316 | |||||||||
Waiver/reimbursement of expenses (Note 3) | (65,426 | ) | (54,350 | ) | (76,066 | ) | (85,253 | ) | |||||
Total Expenses After Waiver/Reimbursement | 90,140 | 193,804 | 206,575 | 134,063 | |||||||||
Net Investment Income (Loss) | (90,116 | ) | (193,667 | ) | 61,929 | 187,485 | |||||||
Net Realized and Unrealized Gain (Loss) on Investments: | |||||||||||||
Net realized loss on investments | (55,688 | ) | (127,283 | ) | (16,274 | ) | (152,224 | ) | |||||
Capital gain distributions from underlying funds | 317,540 | 495,368 | 559,394 | 204,546 | |||||||||
Net change in unrealized appreciation of investments | 939,608 | 1,946,287 | 1,619,295 | 474,036 | |||||||||
Net Gain on Investments | 1,201,460 | 2,314,372 | 2,162,415 | 526,358 | |||||||||
Increase in Net Assets from Operations | $ | 1,111,344 | $ | 2,120,705 | $ | 2,224,344 | $ | 713,843 |
__________
See Notes to Financial Statements.
17
Statements of Changes in Net Assets
Seligman Time Horizon 30 Fund | Seligman Time Horizon 20 Fund | ||||||||||||
Year Ended December 31, | Year Ended December 31, | ||||||||||||
2005 | 2004 | 2005 | 2004 | ||||||||||
Operations: | |||||||||||||
Net investment loss | $ | (90,116 | ) | $ | (74,739 | ) | $ | (193,667 | ) | $ | (157,405 | ) | |
Net realized gain (loss) on investments and capital gain distributions from Underlying Funds | 261,852 | (22,826 | ) | 368,085 | (151,529 | ) | |||||||
Net change in unrealized appreciation of investments | 939,608 | 1,322,486 | 1,946,287 | 2,671,795 | |||||||||
Increase in Net Assets from Operations | 1,111,344 | 1,224,921 | 2,120,705 | 2,362,861 | |||||||||
Capital Share Transactions: | |||||||||||||
Net proceeds from sales of shares | 2,605,023 | 2,572,022 | 5,940,073 | 4,123,487 | |||||||||
Exchanged from associated funds | 1,319,365 | 756,250 | 1,601,616 | 2,191,466 | |||||||||
Total | 3,924,388 | 3,328,272 | 7,541,689 | 6,314,953 | |||||||||
Cost of shares repurchased | (1,695,402 | ) | (1,543,562 | ) | (3,764,974 | ) | (3,892,349 | ) | |||||
Exchanged into associated funds | (109,157 | ) | (181,793 | ) | (687,770 | ) | (155,303 | ) | |||||
Total | (1,804,559 | ) | (1,725,355 | ) | (4,452,744 | ) | (4,047,652 | ) | |||||
Increase in Net Assets from Capital Share Transactions | 2,119,829 | 1,602,917 | 3,088,945 | 2,267,301 | |||||||||
Increase in Net Assets | 3,231,173 | 2,827,838 | 5,209,650 | 4,630,162 | |||||||||
Net Assets: | |||||||||||||
Beginning of year | 9,813,426 | 6,985,588 | 19,149,026 | 14,518,864 | |||||||||
End of Year* | $ | 13,044,599 | $ | 9,813,426 | $ | 24,358,676 | $ | 19,149,026 | |||||
__________ | |||||||||||||
* Including accumulated net investment loss as follows | $ | (1,783 | ) | $ | (1,758 | ) | $ | (1,802 | ) | $ | (1,776 | ) | |
See Notes to Financial Statements. |
18
Statements of Changes in Net Assets
(continued)
Seligman Time Horizon 10 Fund | Seligman Harvester Fund | ||||||||||||
Year Ended December 31, | Year Ended December 31, | ||||||||||||
2005 | 2004 | 2005 | 2004 | ||||||||||
Operations: | |||||||||||||
Net investment income | $ | 61,929 | $ | 51,309 | $ | 187,485 | $ | 141,127 | |||||
Net realized gain (loss) on investments and capital gain distributions from Underlying Funds | 543,120 | (229,864 | ) | 52,322 | (527,397 | ) | |||||||
Net change in unrealized appreciation of investments | 1,619,295 | 2,461,030 | 474,036 | 1,768,646 | |||||||||
Increase in Net Assets from Operations | 2,224,344 | 2,282,475 | 713,843 | 1,382,376 | |||||||||
Distributions to Shareholders: | |||||||||||||
Net investment income: | |||||||||||||
Class A | (44,548 | ) | (28,456 | ) | (90,788 | ) | (51,909 | ) | |||||
Class B | (5,193 | ) | (7,352 | ) | (30,981 | ) | (31,434 | ) | |||||
Class C | (9,370 | ) | (12,403 | ) | (51,050 | ) | (47,901 | ) | |||||
Class D | (2,818 | ) | (3,098 | ) | (14,666 | ) | (9,883 | ) | |||||
Total | (61,929 | ) | (51,309 | ) | (187,485 | ) | (141,127 | ) | |||||
Dividends in excess of net investment income: | |||||||||||||
Class A | (44,749 | ) | (36,943 | ) | (27,387 | ) | (28,753 | ) | |||||
Class B | (5,215 | ) | (9,545 | ) | (9,345 | ) | (17,411 | ) | |||||
Class C | (9,413 | ) | (16,103 | ) | (15,399 | ) | (26,533 | ) | |||||
Class D | (2,831 | ) | (4,022 | ) | (4,425 | ) | (5,475 | ) | |||||
Total | (62,208 | ) | (66,613 | ) | (56,556 | ) | (78,172 | ) | |||||
Decrease in Net Assets from Distributions | (124,137 | ) | (117,922 | ) | (244,041 | ) | (219,299 | ) | |||||
Capital Share Transactions: | |||||||||||||
Net proceeds from sales of shares | 6,704,078 | 5,076,443 | 3,623,237 | 3,509,213 | |||||||||
Exchanged from associated funds | 4,767,290 | 2,482,468 | 1,156,202 | 2,144,064 | |||||||||
Investment of dividends | 115,780 | 109,424 | 192,347 | 188,135 | |||||||||
Total | 11,587,148 | 7,668,335 | 4,971,786 | 5,841,412 | |||||||||
Cost of shares repurchased | (3,683,042 | ) | (3,765,717 | ) | (4,193,947 | ) | (5,305,935 | ) | |||||
Exchanged into associated funds | (1,020,158 | ) | (849,847 | ) | (600,216 | ) | (731,721 | ) | |||||
Total | (4,703,200 | ) | (4,615,564 | ) | (4,794,163 | ) | (6,037,656 | ) | |||||
Increase (Decrease) in Net Assets from Capital Share Transactions | 6,883,948 | 3,052,771 | 177,623 | (196,244 | ) | ||||||||
Increase in Net Assets | 8,984,155 | 5,217,324 | 647,425 | 966,833 | |||||||||
Net Assets: | |||||||||||||
Beginning of year | 21,653,913 | 16,436,589 | 16,279,709 | 15,312,876 | |||||||||
End of Year* | $ | 30,638,068 | $ | 21,653,913 | $ | 16,927,134 | $ | 16,279,709 | |||||
__________ | |||||||||||||
* Including accumulated net investment loss as follows | $ | (1,814 | ) | $ | (1,788 | ) | $ | (27,428 | ) | $ | (6,043 | ) | |
See Notes to Financial Statements. |
19
Notes to Financial Statements
1. | Multiple Classes of Shares — Seligman Time Horizon/Harvester Series, Inc. (the “Series”) consists of four separate funds: Seligman Time Horizon 30 Fund (“Time Horizon 30 Fund”), Seligman Time Horizon 20 Fund (“Time Horizon 20 Fund”), Seligman Time Horizon 10 Fund (“Time Horizon 10 Fund”), and Seligman Harvester Fund (“Harvester Fund”). Each Fund invests in a combination of Class A shares of other Seligman mutual funds (the “Underlying Funds”). Each Fund of the Series offers four classes of shares. |
Class A shares are sold with an initial sales charge of up to 4.75%. Class A shares purchased in an amount of $1,000,000 or more are sold without an initial sales charge but are subject to a contingent deferred sales charge (“CDSC”) of 1% on redemptions within 18 months of purchase. Eligible employee benefit plans which have at least $500,000 invested in the Seligman Group of Mutual Funds or 50 eligible employees may purchase Class A shares at net asset value, but, in the event of plan termination, will be subject to a CDSC of 1% on shares purchased within 18 months prior to plan termination. | |
Class B shares are sold without an initial sales charge but are subject to a distribution fee of 0.75% on an annual basis, and a CDSC, if applicable, of 5% on redemptions in the first year of purchase, declining to 1% in the sixth year and 0% thereafter. Class B shares will automatically convert to Class A shares approximately eight years after their date of purchase. If Class B shares of the Fund are exchanged for Class B shares of another Seligman registered investment company, the holding period of the shares exchanged will be added to the holding period of the shares acquired, both for determining the applicable CDSC and the conversion of Class B shares to Class A shares. | |
Class C shares are sold primarily with an initial sales charge of up to 1% and a CDSC, if applicable, of 1% imposed on redemptions made within 18 months of purchase. Shares purchased through certain financial intermediaries may be bought without an initial sales charge and with a 1% CDSC on redemptions made within 12 months of purchase. All Class C shares are subject to a distribution fee of up to 0.75% on an annual basis. | |
Class D shares are sold without an initial sales charge but are subject to a distribution fee of up to 0.75% on an annual basis, and a CDSC, if applicable, of 1% imposed on redemptions made within one year of purchase. | |
The four classes of shares for each Fund represent interests in the same portfolio of investments, have the same rights and are generally identical in all respects except that each class bears its separate distribution and certain other class-specific expenses, and has exclusive voting rights with respect to any matter on which a separate vote of any class is required. | |
2. | Significant Accounting Policies — The financial statements have been prepared in conformity with accounting principles generally accepted in the United States of America, which require management to make certain estimates and assumptions at the date of the financial statements. Actual results may differ from these estimates. The following summarizes the significant accounting policies of the Series: |
a. | Security Valuation — Underlying Funds owned by a Fund are valued at their respective net asset values. Securities traded on an exchange are valued at the last sales price on the primary exchange or market on which they are traded. Securities not listed on an exchange or security market, or securities for which there is no last sales price, are valued at the mean of the most recent bid and asked prices or are valued by J. & W. Seligman & Co. Incorporated (the “Manager”) based on quotations provided by primary market makers in such securities. Securities for which market quotations are not readily available (or are otherwise no longer valid or reliable) are valued at fair value determined in accordance with procedures approved by the Board of Directors. This can occur in the event of, among other things, natural disasters, acts of terrorism, market disruptions, intra-day trading halts, and extreme market volatility. Short-term holdings maturing in 60 days or less are valued at amortized cost. | |
b. | Federal Taxes — Each Fund in the Series has elected to be taxed as a regulated investment company and intends to distribute substantially all taxable net income and net gain realized. |
20
Notes to Financial Statements
c. | Security Transactions and Related Investment Income — Investment transactions are recorded on trade dates. Indentified cost of investments sold is used for both financial statement and federal income tax purposes. Interest income is recorded on an accrual basis. Dividends receivable are recorded on ex-dividend dates. Distributions received from the Fund’s investments are initially recorded as dividend income as reported by the issuers. Portions of these distributions will be appropriately recharacterized as capital gains or returns of capital based on reporting from the issuers received afer the end of the year. The annual financial statements will reflect any such recharacterizations. | |
d. | Multiple Class Allocations — Each Fund’s income, expenses (other than class-specific expenses), and realized and unrealized gains or losses are allocated daily to each class of shares of that Fund based upon the relative value of the shares of each class. Class-specific expenses, which include distribution and service fees and any other items that are specifically attributed to a particular class, are charged directly to such class. For the year ended December 31, 2005, distribution and service fees were the only class-specific expenses. | |
e. | Distributions to Shareholders — Dividends and distributions to shareholders are recorded on ex-dividend dates. | |
3. | Management Fee, Distribution Services, and Other Transactions — The Manager manages the affairs of the Series and provides the necessary personnel and facilities. Compensation of all officers of the Series, all directors of the Series who are employees of the Manager, and all personnel of the Series and the Manager is paid by the Manager. The Manager receives a fee, calculated daily and payable monthly, equal to 0.10% per annum of each Fund’s average daily net assets. The Manager voluntarily waived its management fee and reimbursed each Fund’s expenses, other than distribution and service fees, that exceeded 0.50% per annum of the Fund’s average daily net assets through March 31, 2005. Beginning April 1, 2005 through December 31, 2006, the Manager has contractually undertaken to waive its management fee and/or reimburse each Fund’s expenses in order to limit Fund expenses (other than distribution and service fees) to 0.40% per annum of average daily net assets for Time Horizon 30 Fund and Time Horizon 20 Fund and to limit Fund expenses to 0.25% per annum of average daily net assets for Time Horizon 10 Fund and Harvester Fund. From January 1, 2007 through December 31, 2010, the Manager has contractually undertaken to waive its management fee and/or to reimburse each Fund’s expenses, other than distribution and service fees, that exceed 0.75% per annum of average daily net assets. |
For the year ended December 31, 2005, the amount of expenses waived and reimbursed by the Manager and the amount receivable from the Manager at December 31, 2005 were as follows: |
Fund | Waiver and Reimbursements | Receivable from Manager | |||||
Time Horizon 30 Fund | $65,426 | $ 9,986 | |||||
Time Horizon 20 Fund | 54,350 | 10,553 | |||||
Time Horizon 10 Fund | 76,066 | 10,709 | |||||
Harvester Fund | 85,253 | 13,288 |
For the year ended December 31, 2005, Seligman Advisors, Inc. (the “Distributor”), agent for the distribution of the Series’ shares and an affiliate of the Manager, received the following concessions for sales of Class A shares after commissions were paid to dealers for sales of Class A and Class C shares:
Fund | Distributor Concessions | Dealer Commissions | Fund | Distributor Concessions | Dealer Commissions | ||
Time Horizon 30 Fund | $4,763 | $39,650 | Time Horizon 10 Fund | $8,261 | $71,533 | ||
Time Horizon 20 Fund | 6,626 | 54,329 | Harvester Fund | 5,247 | 42,847 |
21
Notes to Financial Statements
Each Fund of the Series has an Administration, Shareholder Services and Distribution Plan (the “Plan”) with respect to distribution of its shares. Under the Plan, with respect to Class A, Class B, Class C, and Class D shares, service organizations can enter into agreements with the Distributor and receive a continuing service fee of up to 0.25% per annum of the average daily net assets attributable to the particular service organizations for providing personal services and/or the maintenance of shareholder accounts. To avoid any duplication of the service fee, the service fees to be paid by each class of a Fund will be reduced by the dollar amount of any service fees paid by the Underlying Funds with respect to shares owned by the Fund. | |
For the year ended December 31, 2005, service fees incurred by the Time Horizon 30 Fund, Time Horizon 20 Fund, Time Horizon 10 Fund, and the Harvester Fund (net of service fees paid by underlying funds), aggregated $113, $225, $364, and $148, respectively, or 0.01% per annum of the average daily net assets of Class A shares. | |
Under the Plan, with respect to Class C and Class D shares, service organizations may receive up to 0.75% per annum of the average daily net assets for providing other distribution assistance. Such fees are paid monthly by the Funds to the Distributor pursuant to the Plan. | |
With respect to Class B shares, a distribution fee of 0.75% per annum of the average daily net assets is payable monthly by the Funds to the Distributor; however, the Distributor has sold its rights to this fee with respect to a substantial portion of Class B shares to third parties (the “Purchasers”), which provide funding to the Distributor to enable it to pay commissions to dealers at the time of the sale of the related Class B shares. Distribution fees retained by the Distributor, for the year ended December 31, 2005, were as follows: |
Fund | Amount | Fund | Amount | ||
Time Horizon 30 Fund | $ 2 | Time Horizon 10 Fund | $22 | ||
Time Horizon 20 Fund | 52 | Harvester Fund | — |
For the year ended December 31, 2005, the service fees and distribution fees incurred under the Plan (net of service fees paid by Underlying Funds), and their equivalent per annum percentage of the average daily net assets of Class B, Class C, and Class D shares, were as follows: |
Fund | Class B | Class C | Class D | Fee Rate | |
Time Horizon 30 Fund | $17,220 | $22,019 | $ 5,581 | 0.75% | |
Time Horizon 20 Fund | 32,480 | 58,292 | 12,159 | 0.75 | |
Time Horizon 10 Fund | 37,876 | 70,435 | 19,533 | 0.75 | |
Harvester Fund | 26,815 | 43,767 | 11,061 | 0.75 |
The Distributor is entitled to retain any CDSC imposed on certain redemptions of Class A, Class C and Class D shares. For the year ended December 31, 2005, such charges amounted to $807 for Time Horizon 30 Fund, $1,193 for Time Horizon 20 Fund, $2,105 for Time Horizon 10 Fund and $562 for Harvester Fund. The Distributor has sold its rights to the Purchasers to collect any CDSC imposed on redemptions of Class B shares. | |
Seligman Services, Inc., an affiliate of the Manager, is eligible to receive commissions from certain sales of shares of the Series, as well as distribution and service fees pursuant to the Plan. For the year ended December 31, 2005, Seligman Services, Inc. received commissions from the sale of shares of each Fund and distribution and service fees, pursuant to the Plan, as follows: |
Fund | Commissions | Distribution and Service Fees | Fund | Commissions | Distribution and Service Fees | ||
Time Horizon 30 Fund | $112 | $ 686 | Time Horizon 10 Fund | $1,257 | $587 | ||
Time Horizon 20 Fund | 473 | 1,907 | Harvester Fund | 553 | 776 |
22
Notes to Financial Statements
For the year ended December 31, 2005, Seligman Data Corp., which is owned by certain associated investment companies, charged the Series at cost the following amounts for shareholder account services in accordance with a methodology approved by the Series’ directors: |
Fund | Amount | Fund | Amount | ||
Time Horizon 30 Fund | $ 4,580 | Time Horizon 10 Fund | $11,830 | ||
Time Horizon 20 Fund | 11,514 | Harvester Fund | 12,474 |
Costs of Seligman Data Corp. directly attributable to each Fund were charged to the Fund. The remaining charges were allocated to the Funds by Seligman Data Corp. pursuant to a formula based on each Fund’s net assets, shareholder transaction volume and number of shareholder accounts. | |
Certain officers and directors of the Series are officers or directors of the Manager, the Distributor, Seligman Services, Inc., and/or Seligman Data Corp. | |
The Series has a compensation arrangement under which directors who receive fees may elect to defer receiving such fees. Directors may elect to have their deferred fees accrue interest or earn a return based on the performance of selected Funds of the Series or other funds in the Seligman Group of Investment Companies. Deferred fees and related accrued earnings are not deductible by the Fund for federal income tax purposes until such amounts are paid. The cost of such fees and earnings/loss accrued theron is included in directors’ fees and expenses, and the accumulated balances thereof at December 31, 2005, included in other liabilities, were as follows: |
Fund | Amount | Fund | Amount | ||
Time Horizon 30 Fund | $1,783 | Time Horizon 10 Fund | $1,814 | ||
Time Horizon 20 Fund | 1,802 | Harvester Fund | 1,809 |
These accumulated balances were paid to the participating director in January, 2006. | |
4. | Purchases and Sales of Securities — Purchases and sales of portfolio securities (Underlying Funds), excluding short-term investments, for the year ended December 31, 2005, were as follows: |
Fund | Purchases | Sales | Fund | Purchases | Sales | ||
Time Horizon 30 Fund | $2,543,561 | $ 243,013 | Time Horizon 10 Fund | $8,286,916 | $ 889,850 | ||
Time Horizon 20 Fund | 4,482,850 | 1,160,069 | Harvester Fund | 3,423,008 | 3,082,968 |
5. | Federal Tax Information — Certain components of income, expense and realized capital gain and loss are recognized at different times or have a different character for federal income tax purposes and for financial reporting purposes. Where such differences are permanent in nature, they are reclassified in the components of net assets based on their characterization for federal income tax purposes. Any such reclassifications will have no effect on net assets, results of operations or net asset value per share of the Fund. As a result of the differences described above, the treatment for financial reporting purposes of distributions made during the year from net investment income or net realized gains may differ from their treatment for federal income tax purposes. Further, the cost of investments also can differ for federal income tax purposes. |
At December 31, 2005, the tax basis cost of investments for federal income tax purposes for each Fund was as follows: |
Fund | Tax Basis Cost | Fund | Tax Basis Cost | ||
Time Horizon 30 Fund | $10,574,653 | Time Horizon 10 Fund | $27,789,069 | ||
Time Horizon 20 Fund | 20,832,820 | Harvester Fund | 16,399,871 |
23
Notes to Financial Statements
The tax basis cost was greater than the cost for financial reporting purposes primarily due to the following tax deferral of losses on wash sales: |
Fund | Amount | Fund | Amount | ||
Time Horizon 30 Fund | $ 59,171 | Time Horizon 10 Fund | $514,826 | ||
Time Horizon 20 Fund | 524,996 | Harvester Fund | 637,031 |
At December 31, 2005, the tax basis components of accumulated earnings (losses) were as follows: |
Time Horizon 30 Fund | Time Horizon 20 Fund | Time Horizon 10 Fund | Harvester Fund | ||||||||||
Gross unrealized appreciation of portfolio securities | $ | 2,564,877 | $ | 4,008,822 | $ | 3,430,501 | $ | 1,141,550 | |||||
Gross unrealized depreciation of portfolio securities | (196,538 | ) | (587,594 | ) | (724,583 | ) | (592,198 | ) | |||||
Net unrealized appreciation of portfolio securities | 2,368,339 | 3,421,228 | 2,705,918 | 549,352 | |||||||||
Capital loss carryforwards | — | — | (1,981,041 | ) | (1,456,553 | ) | |||||||
Accumulated net realized gain | 128,279 | 252,675 | — | — | |||||||||
Total accumulated earnings (losses) | $ | 2,496,618 | $ | 3,673,903 | $ | 724,877 | $ | (907,201 | ) |
At December 31, 2005, Time Horizon 10 Fund and Harvester Fund had net capital loss carryforwards for federal income tax purposes which are available for offset against future taxable net capital gains. The loss carryforwards expire as follows: |
Expiration | 2009 | 2010 | 2011 | 2012 | Total | |
Time Horizon 10 Fund | — | $325,445 | $1,535,611 | $119,985 | $1,981,041 | |
Harvester Fund | $119,589 | — | 874,015 | 462,949 | 1,456,553 |
Accordingly, no capital gains distributions are expected to be paid to shareholders of these Funds until net capital gains have been realized in excess of the available capital loss carryforwards. | |
For the years ended December 31, 2005 and 2004, all of the distributions to shareholders were from ordinary income. |
24
Notes to Financial Statements
6. | Capital Stock Share Transactions — The Board of Directors of the Series, at its discretion, may classify any unissued shares of Capital Stock among any Fund of the Series. The Series has authorized 4,000,000,000 shares all at a par value of $0.001 per share. Transactions in shares of Capital Stock were as follows: |
Year Ended December 31, | ||||||||||||||
Time Horizon 30 Fund | 2005 | 2004 | ||||||||||||
Class A | Shares | Amount | Shares | Amount | ||||||||||
Net proceeds from sales of shares | 203,801 | $ | 1,365,453 | 190,061 | $ | 1,112,466 | ||||||||
Exchanged from associated funds | 56,799 | 379,616 | 72,724 | 443,224 | ||||||||||
Conversion from Class B* | 9,425 | 63,152 | 727 | 4,250 | ||||||||||
Total | 270,025 | 1,808,221 | 263,512 | 1,559,940 | ||||||||||
Cost of shares repurchased | (111,416 | ) | (724,707 | ) | (88,375 | ) | (517,442 | ) | ||||||
Exchanged into associated funds | (10,876 | ) | (73,156 | ) | (5,768 | ) | (35,034 | ) | ||||||
Total | (122,292 | ) | (797,863 | ) | (94,143 | ) | (552,476 | ) | ||||||
Increase | 147,733 | $ | 1,010,358 | 169,369 | $ | 1,007,464 | ||||||||
Class B | Shares | Amount | Shares | Amount | ||||||||||
Net proceeds from sales of shares | 78,099 | $ | 507,580 | 92,397 | $ | 535,390 | ||||||||
Exchanged from associated funds | 110,548 | 709,386 | 27,514 | 160,926 | ||||||||||
Total | 188,647 | 1,216,966 | 119,911 | 696,316 | ||||||||||
Cost of shares repurchased | (68,152 | ) | (438,152 | ) | (49,158 | ) | (280,372 | ) | ||||||
Exchanged into associated funds | (3,995 | ) | (24,832 | ) | (14,186 | ) | (82,571 | ) | ||||||
Conversion to Class A* | (9,809 | ) | (63,152 | ) | (751 | ) | (4,250 | ) | ||||||
Total | (81,956 | ) | (526,136 | ) | (64,095 | ) | (367,193 | ) | ||||||
Increase | 106,691 | $ | 690,830 | 55,816 | $ | 329,123 | ||||||||
Class C | Shares | Amount | Shares | Amount | ||||||||||
Net proceeds from sales of shares | 94,129 | $ | 611,959 | 145,321 | $ | 824,510 | ||||||||
Exchanged from associated funds | 20,489 | 133,096 | 3,012 | 17,406 | ||||||||||
Total | 114,618 | 745,055 | 148,333 | 841,916 | ||||||||||
Cost of shares repurchased | (56,627 | ) | (360,847 | ) | (87,348 | ) | (508,478 | ) | ||||||
Exchanged into associated funds | (648 | ) | (4,268 | ) | (3,345 | ) | (19,854 | ) | ||||||
Total | (57,275 | ) | (365,115 | ) | (90,693 | ) | (528,332 | ) | ||||||
Increase | 57,343 | $ | 379,940 | 57,640 | $ | 313,584 | ||||||||
Class D | Shares | Amount | Shares | Amount | ||||||||||
Net proceeds from sales of shares | 18,484 | $ | 120,031 | 17,338 | $ | 99,656 | ||||||||
Exchanged from associated funds | 14,823 | 97,267 | 24,381 | 134,694 | ||||||||||
Total | 33,307 | 217,298 | 41,719 | 234,350 | ||||||||||
Cost of shares repurchased | (27,354 | ) | (171,696 | ) | (40,159 | ) | (237,270 | ) | ||||||
Exchanged into associated funds | (1,129 | ) | (6,901 | ) | (8,101 | ) | (44,334 | ) | ||||||
Total | (28,483 | ) | (178,597 | ) | (48,260 | ) | (281,604 | ) | ||||||
Increase (decrease) | 4,824 | $ | 38,701 | (6,541 | ) | $ | (47,254 | ) |
__________
See footnote on page 28.
25
Notes to Financial Statements
Year Ended December 31, | ||||||||||||||
Time Horizon 20 Fund | 2005 | 2004 | ||||||||||||
Class A | Shares | Amount | Shares | Amount | ||||||||||
Net proceeds from sales of shares | 367,829 | $ | 2,427,597 | 361,390 | $ | 2,143,950 | ||||||||
Exchanged from associated funds | 127,482 | 836,457 | 212,964 | 1,247,625 | ||||||||||
Conversion from Class B* | 13,031 | 89,339 | — | — | ||||||||||
Total | 508,342 | 3,353,393 | 574,354 | 3,391,575 | ||||||||||
Cost of shares repurchased | (303,936 | ) | (2,005,057 | ) | (285,067 | ) | (1,677,393 | ) | ||||||
Exchanged into associated funds | (31,563 | ) | (204,074 | ) | (11,495 | ) | (67,609 | ) | ||||||
Total | (335,499 | ) | (2,209,131 | ) | (296,562 | ) | (1,745,002 | ) | ||||||
Increase | 172,843 | $ | 1,144,262 | 277,792 | $ | 1,646,573 | ||||||||
Class B | Shares | Amount | Shares | Amount | ||||||||||
Net proceeds from sales of shares | 130,738 | $ | 814,592 | 120,409 | $ | 683,202 | ||||||||
Exchanged from associated funds | 65,434 | 416,228 | 95,020 | 544,908 | ||||||||||
Total | 196,172 | 1,230,820 | 215,429 | 1,228,110 | ||||||||||
Cost of shares repurchased | (125,064 | ) | (786,097 | ) | (105,327 | ) | (614,001 | ) | ||||||
Exchanged into associated funds | (14,677 | ) | (91,920 | ) | (3,141 | ) | (16,705 | ) | ||||||
Conversion to Class A* | (13,638 | ) | (89,339 | ) | — | — | ||||||||
Total | (153,379 | ) | (967,356 | ) | (108,468 | ) | (630,706 | ) | ||||||
Increase | 42,793 | $ | 263,464 | 106,961 | $ | 597,404 | ||||||||
Class C | Shares | Amount | Shares | Amount | ||||||||||
Net proceeds from sales of shares | 364,414 | $ | 2,279,575 | 195,971 | $ | 1,123,507 | ||||||||
Exchanged from associated funds | 38,503 | 235,996 | 27,129 | 156,978 | ||||||||||
Total | 402,917 | 2,515,571 | 223,100 | 1,280,485 | ||||||||||
Cost of shares repurchased | (119,254 | ) | (755,924 | ) | (202,538 | ) | (1,158,981 | ) | ||||||
Exchanged into associated funds | (54,736 | ) | (351,029 | ) | (8,155 | ) | (48,778 | ) | ||||||
Total | (173,990 | ) | (1,106,953 | ) | (210,693 | ) | (1,207,759 | ) | ||||||
Increase | 228,927 | $ | 1,408,618 | 12,407 | $ | 72,726 | ||||||||
Class D | Shares | Amount | Shares | Amount | ||||||||||
Net proceeds from sales of shares | 66,728 | $ | 418,309 | 29,586 | $ | 172,828 | ||||||||
Exchanged from associated funds | 17,522 | 112,935 | 42,663 | 241,955 | ||||||||||
Total | 84,250 | 531,244 | 72,249 | 414,783 | ||||||||||
Cost of shares repurchased | (33,559 | ) | (217,896 | ) | (76,330 | ) | (441,974 | ) | ||||||
Exchanged into associated funds | (6,191 | ) | (40,747 | ) | (4,070 | ) | (22,211 | ) | ||||||
Total | (39,750 | ) | (258,643 | ) | (80,400 | ) | (464,185 | ) | ||||||
Increase (decrease) | 44,500 | $ | 272,601 | (8,151 | ) | $ | (49,402 | ) |
__________
See footnote on page 28.
26
Notes to Financial Statements
Year Ended December 31, | ||||||||||||||
Time Horizon 10 Fund | 2005 | 2004 | ||||||||||||
Class A | Shares | Amount | Shares | Amount | ||||||||||
Net proceeds from sales of shares | 475,659 | $ | 2,950,906 | 346,943 | $ | 1,977,385 | ||||||||
Exchanged from associated funds | 176,690 | 1,090,947 | 209,361 | 1,213,167 | ||||||||||
Conversion from Class B* | 12,647 | 79,959 | 20,479 | 119,979 | ||||||||||
Investment of dividends | 12,731 | 84,916 | 10,323 | 62,558 | ||||||||||
Total | 677,727 | 4,206,728 | 587,106 | 3,373,089 | ||||||||||
Cost of shares repurchased | (196,150 | ) | (1,232,749 | ) | (142,543 | ) | (813,780 | ) | ||||||
Exchanged into associated funds | (5,269 | ) | (32,508 | ) | (60,023 | ) | (341,650 | ) | ||||||
Total | (201,419 | ) | (1,265,257 | ) | (202,566 | ) | (1,155,430 | ) | ||||||
Increase | 476,308 | $ | 2,941,471 | 384,540 | $ | 2,217,659 | ||||||||
Class B | Shares | Amount | Shares | Amount | ||||||||||
Net proceeds from sales of shares | 184,388 | $ | 1,124,581 | 100,214 | $ | 565,107 | ||||||||
Exchanged from associated funds | 129,435 | 785,657 | 65,237 | 363,409 | ||||||||||
Investment of dividends | 1,329 | 8,747 | 2,299 | 13,774 | ||||||||||
Total | 315,152 | 1,918,985 | 167,750 | 942,290 | ||||||||||
Cost of shares repurchased | (106,651 | ) | (656,662 | ) | (159,231 | ) | (917,473 | ) | ||||||
Exchanged into associated funds | (11,075 | ) | (65,728 | ) | (27,133 | ) | (152,011 | ) | ||||||
Conversion to Class A* | (12,859 | ) | (79,959 | ) | (20,805 | ) | (119,979 | ) | ||||||
Total | (130,585 | ) | (802,349 | ) | (207,169 | ) | (1,189,463 | ) | ||||||
Increase (decrease) | 184,567 | $ | 1,116,636 | (39,419 | ) | $ | (247,173 | ) | ||||||
Class C | Shares | Amount | Shares | Amount | ||||||||||
Net proceeds from sales of shares | 308,008 | $ | 1,876,573 | 371,423 | $ | 2,089,435 | ||||||||
Exchanged from associated funds | 339,426 | 2,078,093 | 83,877 | 470,709 | ||||||||||
Investment of dividends | 2,526 | 16,620 | 4,366 | 26,152 | ||||||||||
Total | 649,960 | 3,971,286 | 459,666 | 2,586,296 | ||||||||||
Cost of shares repurchased | (203,980 | ) | (1,257,463 | ) | (279,504 | ) | (1,574,674 | ) | ||||||
Exchanged into associated funds | (138,827 | ) | (833,866 | ) | (62,858 | ) | (337,465 | ) | ||||||
Total | (342,807 | ) | (2,091,329 | ) | (342,362 | ) | (1,912,139 | ) | ||||||
Increase | 307,153 | $ | 1,879,957 | 117,304 | $ | 674,157 | ||||||||
Class D | Shares | Amount | Shares | Amount | ||||||||||
Net proceeds from sales of shares | 122,192 | $ | 752,018 | 79,560 | $ | 444,516 | ||||||||
Exchanged from associated funds | 132,938 | 812,593 | 76,984 | 435,183 | ||||||||||
Investment of dividends | 835 | 5,497 | 1,159 | 6,940 | ||||||||||
Total | 255,965 | 1,570,108 | 157,703 | 886,639 | ||||||||||
Cost of shares repurchased | (87,425 | ) | (536,168 | ) | (80,714 | ) | (459,790 | ) | ||||||
Exchanged into associated funds | (14,570 | ) | (88,056 | ) | (3,270 | ) | (18,721 | ) | ||||||
Total | (101,995 | ) | (624,224 | ) | (83,984 | ) | (478,511 | ) | ||||||
Increase | 153,970 | $ | 945,884 | 73,719 | $ | 408,128 |
__________
See footnote on page 28.
27
Notes to Financial Statements
Year Ended December 31, | ||||||||||||||
Harvester Fund | 2005 | 2004 | ||||||||||||
Class A | Shares | Amount | Shares | Amount | ||||||||||
Net proceeds from sales of shares | 351,839 | $ | 1,907,608 | 439,764 | $ | 2,298,900 | ||||||||
Exchanged from associated funds | 65,728 | 360,365 | 65,682 | 345,904 | ||||||||||
Conversion from Class B* | 22,987 | 126,955 | 11,491 | 60,885 | ||||||||||
Investment of dividends | 17,912 | 99,502 | 13,418 | 71,225 | ||||||||||
Total | 458,466 | 2,494,430 | 530,355 | 2,776,914 | ||||||||||
Cost of shares repurchased | (234,268 | ) | (1,284,529 | ) | (196,514 | ) | (1,043,866 | ) | ||||||
Exchanged into associated funds | (13,622 | ) | (74,311 | ) | (13,260 | ) | (69,639 | ) | ||||||
Total | (247,890 | ) | (1,358,840 | ) | (209,774 | ) | (1,113,505 | ) | ||||||
Increase | 210,576 | $ | 1,135,590 | 320,581 | $ | 1,663,409 | ||||||||
Class B | Shares | Amount | Shares | Amount | ||||||||||
Net proceeds from sales of shares | 21,238 | $ | 115,578 | 47,142 | $ | 245,837 | ||||||||
Exchanged from associated funds | 87,542 | 477,874 | 146,483 | 765,910 | ||||||||||
Investment of dividends | 5,196 | 28,932 | 7,745 | 41,211 | ||||||||||
Total | 113,976 | 622,384 | 201,370 | 1,052,958 | ||||||||||
Cost of shares repurchased | (194,086 | ) | (1,068,411 | ) | (259,692 | ) | (1,349,023 | ) | ||||||
Exchanged into associated funds | (40,887 | ) | (221,398 | ) | (23,621 | ) | (123,397 | ) | ||||||
Conversion to Class A* | (22,986 | ) | (126,945 | ) | (11,490 | ) | (60,877 | ) | ||||||
Total | (257,959 | ) | (1,416,754 | ) | (294,803 | ) | (1,533,297 | ) | ||||||
Decrease | (143,983 | ) | $ | (794,370 | ) | (93,433 | ) | $ | (480,339 | ) | ||||
Class C | Shares | Amount | Shares | Amount | ||||||||||
Net proceeds from sales of shares | 139,258 | $ | 768,026 | 138,229 | $ | 726,823 | ||||||||
Exchanged from associated funds | 33,600 | 182,945 | 147,654 | 775,651 | ||||||||||
Investment of dividends | 8,819 | 49,116 | 12,210 | 64,996 | ||||||||||
Total | 181,677 | 1,000,087 | 298,093 | 1,567,470 | ||||||||||
Cost of shares repurchased | (293,089 | ) | (1,624,987 | ) | (386,700 | ) | (2,013,876 | ) | ||||||
Exchanged into associated funds | (52,321 | ) | (288,009 | ) | (97,039 | ) | (509,818 | ) | ||||||
Total | (345,410 | ) | (1,912,996 | ) | (483,739 | ) | (2,523,694 | ) | ||||||
Decrease | (163,733 | ) | $ | (912,909 | ) | (185,646 | ) | $ | (956,224 | ) | ||||
Class D | Shares | Amount | Shares | Amount | ||||||||||
Net proceeds from sales of shares | 150,708 | $ | 832,015 | 45,170 | $ | 237,645 | ||||||||
Exchanged from associated funds | 24,610 | 135,018 | 48,895 | 256,599 | ||||||||||
Investment of dividends | 2,644 | 14,797 | 2,009 | 10,703 | ||||||||||
Total | 177,962 | 981,830 | 96,074 | 504,947 | ||||||||||
Cost of shares repurchased | (39,524 | ) | (216,020 | ) | (168,973 | ) | (899,170 | ) | ||||||
Exchanged into associated funds | (3,039 | ) | (16,498 | ) | (5,566 | ) | (28,867 | ) | ||||||
Total | (42,563 | ) | (232,518 | ) | (174,539 | ) | (928,037 | ) | ||||||
Increase (decrease) | 135,399 | $ | 749,312 | (78,465 | ) | $ | (423,090 | ) |
__________
* | Automatic conversion of Class B shares to Class A shares approximately eight years after the initial purchase date. The amounts of dividends accrued on Class B shares between the last dividend payment date and the conversion date is invested in Class A shares and is included in the conversion from Class B amount. |
28
Notes to Financial Statements
7. | Other Matters — In late 2003, the Manager conducted an extensive internal review in response to public announcements concerning frequent trading in shares of open-end mutual funds. As of September 2003, the Manager had one arrangement that permitted frequent trading in the Seligman mutual funds. This arrangement was in the process of being closed down by the Manager before the first proceedings relating to trading practices within the mutual fund industry were publicly announced. Based on a review of the Manager’s records for 2001 through 2003, the Manager identified three other arrangements that had permitted frequent trading in the Seligman mutual funds. All three had already been terminated prior to the end of September 2002. |
The results of the Manager’s internal review were presented to the Independent Directors of all the Seligman registered investment companies (the “Seligman Funds”). In order to resolve matters with the Independent Directors relating to the four arrangements that permitted frequent trading, the Manager, in May 2004, made payments to three mutual funds and agreed to waive a portion of its management fee with respect to another mutual fund. | |
Since February 2004, the Manager has been in discussions with the New York staff of the Securities and Exchange Commission (“SEC”) and the Office of the New York Attorney General (“Attorney General”) in connection with their review of frequent trading in certain of the Seligman Funds. No late trading is involved. This review was apparently stimulated by the Manager’s voluntary public disclosure of the foregoing arrangements in January 2004. In March 2005, negotiations to settle the matter were initiated by the New York staff of the SEC. After several months of negotiations, tentative agreement was reached, both with the New York staff of the SEC and the Attorney General, on the financial terms of a settlement. However, settlement discussions with the Attorney General ended when the Attorney General sought to impose operating conditions on the Manager that were unacceptable to the Manager, would have applied in perpetuity and were not requested or required by the SEC. Subsequently, the New York staff of the SEC indicated that, in lieu of moving forward under the terms of the tentative financial settlement, the staff was considering recommending to the Commissioners of the SEC the instituting of a formal action against the Manager and the Distributor (together, “Seligman”). | |
Seligman believes that any action would be both inappropriate and unnecessary, especially in light of the fact that Seligman previously resolved the underlying issue with the Independent Directors of the Seligman Funds and made recompense to the affected Seligman Funds. | |
Immediately after settlement discussions with the Attorney General ended, the Attorney General issued subpoenas to certain of the Seligman Funds and their directors. The subpoenas seek various Board materials and information relating to the deliberations of the Independent Directors as to the advisory fees paid by the Seligman Funds to the Manager. The Manager has objected to the Attorney General’s seeking of such information and, on September 6, 2005, filed suit in federal district court seeking to enjoin the Attorney General from pursuing a fee inquiry. Seligman believes that the Attorney General’s inquiry is improper because Congress has vested exclusive regulatory oversight of investment company advisory fees in the SEC. | |
At the end of September 2005, the Attorney General indicated that it intends to file an action at some time in the future alleging, in substance, that the Manager permitted other persons to engage in frequent trading other than the arrangements described above and, as a result, the prospectus disclosure of the Seligman Funds is and has been misleading. Seligman believes any such action would be without merit. | |
Any resolution of these matters with regulatory authorities may include, but not be limited to, sanctions, penalties, injunctions regarding Seligman, restitution to mutual fund shareholders or changes in procedures. Any penalties or restitution will be paid by Seligman and not by the Seligman Funds. | |
Seligman does not believe that the foregoing possible actions or any threatened legal actions should have a material adverse impact on the Manager, the Distributor or the Seligman Funds; however, there can be no assurance of this, or that these matters and any related publicity will not result in reduced demand for shares of the Seligman Funds or other adverse consequences. |
29
Financial Highlights
The tables below are intended to help you understand the financial performance of each Class of each Fund for the periods presented. Certain information reflects financial results for a single share of a Class that was held throughout the periods shown. Per share amounts are calculated using average shares outstanding. “Total Return” shows the rate that you would have earned (or lost) on an investment in each Class, assuming you reinvested all your dividends and capital gain distributions. Total returns do not reflect any taxes or sales charges and are not annualized for periods of less than one year.
Time Horizon 30 Fund
Year Ended December 31, | ||||||||||||||||
Class A | 2005 | 2004 | 2003 | 2002 | 2001 | |||||||||||
Per Share Data: | ||||||||||||||||
Net Asset Value, Beginning of Year | $ | 6.56 | $ | 5.68 | $ | 4.08 | $ | 5.51 | $ | 6.24 | ||||||
Income (Loss) from Investment Operations: | ||||||||||||||||
Net investment loss | (0.03 | ) | (0.03 | ) | (0.02 | ) | (0.02 | ) | (0.03 | ) | ||||||
Net realized and unrealized gain (loss) on investments | 0.72 | 0.91 | 1.62 | (1.41 | ) | (0.46 | ) | |||||||||
Total from Investment Operations | 0.69 | 0.88 | 1.60 | (1.43 | ) | (0.49 | ) | |||||||||
Less Distributions: | ||||||||||||||||
Distributions from net investment income | — | — | — | — | (0.03 | ) | ||||||||||
Distributions from net realized capital gains | — | — | — | — | (0.21 | ) | ||||||||||
Total Distributions | — | — | — | — | (0.24 | ) | ||||||||||
Net Asset Value, End of Year | $ | 7.25 | $ | 6.56 | $ | 5.68 | $ | 4.08 | $ | 5.51 | ||||||
Total Return | 10.52 | % | 15.49 | %# | 39.22 | % | (25.95 | )% | (7.47 | )% | ||||||
Ratios/Supplemental Data: | ||||||||||||||||
Net assets, end of year (000s omitted) | $ | 5,747 | $ | 4,230 | $ | 2,703 | $ | 1,531 | $ | 1,399 | ||||||
Ratio of expenses to average net assets | 0.42 | % | 0.51 | % | 0.51 | % | 0.51 | % | 0.51 | % | ||||||
Ratio of net investment loss to average net assets | (0.42 | )% | (0.50 | )% | (0.47 | )% | (0.49 | )% | (0.49 | )% | ||||||
Portfolio turnover rate | 2.27 | % | 2.79 | % | 1.74 | % | — | — | ||||||||
Without fee waiver and expense reimbursement:* | ||||||||||||||||
Ratio of expenses to average net assets | 1.03 | % | 1.22 | % | 1.58 | % | 1.93 | % | 3.70 | % | ||||||
Ratio of net investment loss to average net assets | (1.03 | )% | (1.21 | )% | (1.55 | )% | (1.91 | )% | (3.68 | )% |
__________
See footnotes on page 45.
30
Financial Highlights
Time Horizon 30 Fund (continued)
Year Ended December 31, | ||||||||||||||||
Class B | 2005 | 2004 | 2003 | 2002 | 2001 | |||||||||||
Per Share Data: | ||||||||||||||||
Net Asset Value, Beginning of Year | $ | 6.33 | $ | 5.53 | $ | 3.99 | $ | 5.43 | $ | 6.21 | ||||||
Income (Loss) from Investment Operations: | ||||||||||||||||
Net investment loss | (0.08 | ) | (0.07 | ) | (0.06 | ) | (0.06 | ) | (0.07 | ) | ||||||
Net realized and unrealized gain (loss) on investments | 0.70 | 0.87 | 1.60 | (1.38 | ) | (0.47 | ) | |||||||||
Total from Investment Operations | 0.62 | 0.80 | 1.54 | (1.44 | ) | (0.54 | ) | |||||||||
Less Distributions: | ||||||||||||||||
Distributions from net investment income | — | — | — | — | (0.03 | ) | ||||||||||
Distributions from net realized capital gains | — | — | — | — | (0.21 | ) | ||||||||||
Total Distributions | — | — | — | — | (0.24 | ) | ||||||||||
Net Asset Value, End of Year | $ | 6.95 | $ | 6.33 | $ | 5.53 | $ | 3.99 | $ | 5.43 | ||||||
Total Return | 9.79 | % | 14.47 | %# | 38.60 | % | (26.52 | )% | (8.32 | )% | ||||||
Ratios/Supplemental Data: | ||||||||||||||||
Net assets, end of year (000s omitted) | $ | 3,001 | $ | 2,060 | $ | 1,490 | $ | 806 | $ | 679 | ||||||
Ratio of expenses to average net assets | 1.18 | % | 1.26 | % | 1.25 | % | 1.26 | % | 1.26 | % | ||||||
Ratio of net investment loss to average net assets | (1.18 | )% | (1.25 | )% | (1.22 | )% | (1.24 | )% | 1.24 | % | ||||||
Portfolio turnover rate | 2.27 | % | 2.79 | % | 1.74 | % | — | — | ||||||||
Without fee waiver and expense reimbursement:* | ||||||||||||||||
Ratio of expenses to average net assets | 1.79 | % | 1.97 | % | 2.33 | % | 2.68 | % | 4.45 | % | ||||||
Ratio of net investment loss to average net assets | (1.79 | )% | (1.96 | )% | (2.30 | )% | (2.66 | )% | (4.43 | )% |
__________
See footnotes on page 45.
31
Financial Highlights
Time Horizon 30 Fund (continued)
Year Ended December 31, | ||||||||||||||||
Class C | 2005 | 2004 | 2003 | 2002 | 2001 | |||||||||||
Per Share Data: | ||||||||||||||||
Net Asset Value, Beginning of Year | $ | 6.33 | $ | 5.53 | $ | 3.99 | $ | 5.43 | $ | 6.21 | ||||||
Income (Loss) from Investment Operations: | ||||||||||||||||
Net investment loss | (0.08 | ) | (0.07 | ) | (0.06 | ) | (0.06 | ) | (0.07 | ) | ||||||
Net realized and unrealized gain (loss) on investments | 0.70 | 0.87 | 1.60 | (1.38 | ) | (0.47 | ) | |||||||||
Total from Investment Operations | 0.62 | 0.80 | 1.54 | (1.44 | ) | (0.54 | ) | |||||||||
Less Distributions: | ||||||||||||||||
Distributions from net investment income | — | — | — | — | (0.03 | ) | ||||||||||
Distributions from net realized capital gains | — | — | — | — | (0.21 | ) | ||||||||||
Total Distributions | — | — | — | — | (0.24 | ) | ||||||||||
Net Asset Value, End of Year | $ | 6.95 | $ | 6.33 | $ | 5.53 | $ | 3.99 | $ | 5.43 | ||||||
Total Return | 9.79 | % | 14.47 | %# | 38.60 | % | (26.52 | )% | (8.32 | )% | ||||||
Ratios/Supplemental Data: | ||||||||||||||||
Net assets, end of year (000s omitted) | $ | 3,420 | $ | 2,755 | $ | 2,086 | $ | 1,649 | $ | 1,950 | ||||||
Ratio of expenses to average net assets | 1.18 | % | 1.26 | % | 1.25 | % | 1.26 | % | 1.26 | % | ||||||
Ratio of net investment loss to average net assets | (1.18 | )% | (1.25 | )% | (1.22 | )% | (1.24 | )% | (1.24 | )% | ||||||
Portfolio turnover rate | 2.27 | % | 2.79 | % | 1.74 | % | — | — | ||||||||
Without fee waiver and expense reimbursement:* | ||||||||||||||||
Ratio of expenses to average net assets | 1.79 | % | 1.97 | % | 2.33 | % | 2.68 | % | 4.45 | % | ||||||
Ratio of net investment loss to average net assets | (1.79 | )% | (1.96 | )% | (2.30 | )% | (2.66 | )% | (4.43 | )% |
__________
See footnotes on page 45.
32
Financial Highlights
Time Horizon 30 Fund (continued)
Year Ended December 31, | ||||||||||||||||
Class D | 2005 | 2004 | 2003 | 2002 | 2001 | |||||||||||
Per Share Data: | ||||||||||||||||
Net Asset Value, Beginning of Year | $ | 6.33 | $ | 5.53 | $ | 3.99 | $ | 5.43 | $ | 6.21 | ||||||
Income (Loss) from Investment Operations: | ||||||||||||||||
Net investment loss | (0.08 | ) | (0.07 | ) | (0.06 | ) | (0.06 | ) | (0.07 | ) | ||||||
Net realized and unrealized gain (loss) on investments | 0.70 | 0.87 | 1.60 | (1.38 | ) | (0.47 | ) | |||||||||
Total from Investment Operations | 0.62 | 0.80 | 1.54 | (1.44 | ) | (0.54 | ) | |||||||||
Less Distributions: | ||||||||||||||||
Distributions from net investment income | — | — | — | — | (0.03 | ) | ||||||||||
Distributions from net realized capital gains | — | — | — | — | (0.21 | ) | ||||||||||
Total Distributions | — | — | — | — | (0.24 | ) | ||||||||||
Net Asset Value, End of Year | $ | 6.95 | $ | 6.33 | $ | 5.53 | $ | 3.99 | $ | 5.43 | ||||||
Total Return | 9.79 | % | 14.47 | %# | 38.60 | % | (26.52 | )% | (8.32 | )% | ||||||
Ratios/Supplemental Data: | ||||||||||||||||
Net assets, end of year (000s omitted) | $ | 876 | $ | 768 | $ | 707 | $ | 355 | $ | 395 | ||||||
Ratio of expenses to average net assets | 1.18 | % | 1.26 | % | 1.25 | % | 1.26 | % | 1.26 | % | ||||||
Ratio of net investment loss to average net assets | (1.18 | )% | (1.25 | )% | (1.22 | )% | (1.24 | )% | (1.24 | )% | ||||||
Portfolio turnover rate | 2.27 | % | 2.79 | % | 1.74 | % | — | — | ||||||||
Without fee waiver and expense reimbursement:* | ||||||||||||||||
Ratio of expenses to average net assets | 1.79 | % | 1.97 | % | 2.33 | % | 2.68 | % | 4.45 | % | ||||||
Ratio of net investment loss to average net assets | (1.79 | )% | (1.96 | )% | (2.30 | )% | (2.66 | )% | (4.43 | )% |
__________
See footnotes on page 45.
33
Financial Highlights
Time Horizon 20 Fund
Year Ended December 31, | ||||||||||||||||
Class A | 2005 | 2004 | 2003 | 2002 | 2001 | |||||||||||
Per Share Data: | ||||||||||||||||
Net Asset Value, Beginning of Year | $ | 6.53 | $ | 5.67 | $ | 4.11 | $ | 5.59 | $ | 6.47 | ||||||
Income (Loss) from Investment Operations: | ||||||||||||||||
Net investment loss | (0.03 | ) | (0.03 | ) | (0.02 | ) | (0.02 | ) | (0.03 | ) | ||||||
Net realized and unrealized gain (loss) on investments | 0.68 | 0.89 | 1.58 | (1.46 | ) | (0.61 | ) | |||||||||
Total from Investment Operations | 0.65 | 0.86 | 1.56 | (1.48 | ) | (0.64 | ) | |||||||||
Less Distributions: | ||||||||||||||||
Distributions from net investment income | — | — | — | — | (0.03 | ) | ||||||||||
Distributions from net realized capital gains | — | — | — | — | (0.21 | ) | ||||||||||
Total Distributions | — | — | — | — | (0.24 | ) | ||||||||||
Net Asset Value, End of Year | $ | 7.18 | $ | 6.53 | $ | 5.67 | $ | 4.11 | $ | 5.59 | ||||||
Total Return | 9.79 | % | 15.34 | %# | 37.96 | % | (26.48 | )% | (9.52 | )% | ||||||
Ratios/Supplemental Data: | ||||||||||||||||
Net assets, end of year (000s omitted) | $ | 9,133 | $ | 7,179 | $ | 4,657 | $ | 2,683 | $ | 2,842 | ||||||
Ratio of expenses to average net assets | 0.42 | % | 0.50 | % | 0.50 | % | 0.51 | % | 0.51 | % | ||||||
Ratio of net investment loss to average net assets | (0.42 | )% | (0.47 | )% | (0.41 | )% | (0.44 | )% | (0.44 | )% | ||||||
Portfolio turnover rate | 5.42 | % | 5.50 | % | 1.55 | % | 3.01 | % | — | |||||||
Without fee waiver and expense reimbursement:* | ||||||||||||||||
Ratio of expenses to average net assets | 0.67 | % | 0.75 | % | 0.81 | % | 1.19 | % | 1.64 | % | ||||||
Ratio of net investment loss to average net assets | (0.67 | )% | (0.72 | )% | (0.73 | )% | (1.12 | )% | (1.57 | )% |
__________
See footnotes on page 45.
34
Financial Highlights
Time Horizon 20 Fund (continued)
Year Ended December 31, | ||||||||||||||||
Class B | 2005 | 2004 | 2003 | 2002 | 2001 | |||||||||||
Per Share Data: | ||||||||||||||||
Net Asset Value, Beginning of Year | $ | 6.28 | $ | 5.49 | $ | 4.00 | $ | 5.48 | $ | 6.41 | ||||||
Income (Loss) from Investment Operations: | ||||||||||||||||
Net investment loss | (0.08 | ) | (0.07 | ) | (0.05 | ) | (0.06 | ) | (0.07 | ) | ||||||
Net realized and unrealized gain (loss) on investments | 0.65 | 0.86 | 1.54 | (1.42 | ) | (0.62 | ) | |||||||||
Total from Investment Operations | 0.57 | 0.79 | 1.49 | (1.48 | ) | (0.69 | ) | |||||||||
Less Distributions: | ||||||||||||||||
Distributions from net investment income | — | — | — | — | (0.03 | ) | ||||||||||
Distributions from net realized capital gains | — | — | — | — | (0.21 | ) | ||||||||||
Total Distributions | — | — | — | — | (0.24 | ) | ||||||||||
Net Asset Value, End of Year | $ | 6.85 | $ | 6.28 | $ | 5.49 | $ | 4.00 | $ | 5.48 | ||||||
Total Return | 9.08 | % | 14.39 | %# | 37.25 | % | (27.01 | )% | (10.40 | )% | ||||||
Ratios/Supplemental Data: | ||||||||||||||||
Net assets, end of year (000s omitted) | $ | 4,703 | $ | 4,041 | $ | 2,949 | $ | 1,559 | $ | 1,463 | ||||||
Ratio of expenses to average net assets | 1.18 | % | 1.25 | % | 1.25 | % | 1.26 | % | 1.26 | % | ||||||
Ratio of net investment loss to average net assets | (1.18 | )% | (1.22 | )% | (1.16 | )% | (1.19 | )% | (1.19 | )% | ||||||
Portfolio turnover rate | 5.42 | % | 5.50 | % | 1.55 | % | 3.01 | % | — | |||||||
Without fee waiver and expense reimbursement:* | ||||||||||||||||
Ratio of expenses to average net assets | 1.43 | % | 1.50 | % | 1.56 | % | 1.94 | % | 2.39 | % | ||||||
Ratio of net investment loss to average net assets | (1.43 | )% | (1.47 | )% | (1.48 | )% | (1.87 | )% | (2.32 | )% |
__________
See footnotes on page 45.
35
Financial Highlights
Time Horizon 20 Fund (continued)
Year Ended December 31, | ||||||||||||||||
Class C | 2005 | 2004 | 2003 | 2002 | 2001 | |||||||||||
Per Share Data: | ||||||||||||||||
Net Asset Value, Beginning of Year | $ | 6.28 | $ | 5.49 | $ | 4.00 | $ | 5.48 | $ | 6.41 | ||||||
Income (Loss) from Investment Operations: | ||||||||||||||||
Net investment loss | (0.08 | ) | (0.07 | ) | (0.05 | ) | (0.06 | ) | (0.07 | ) | ||||||
Net realized and unrealized gain (loss) on investments | 0.65 | 0.86 | 1.54 | (1.42 | ) | (0.62 | ) | |||||||||
Total from Investment Operations | 0.57 | 0.79 | 1.49 | (1.48 | ) | (0.69 | ) | |||||||||
Less Distributions: | ||||||||||||||||
Distributions from net investment income | — | — | — | — | (0.03 | ) | ||||||||||
Distributions from net realized capital gains | — | — | — | — | (0.21 | ) | ||||||||||
Total Distributions | — | — | — | — | (0.24 | ) | ||||||||||
Net Asset Value, End of Year | $ | 6.85 | $ | 6.28 | $ | 5.49 | $ | 4.00 | $ | 5.48 | ||||||
Total Return | 9.08 | % | 14.39 | %# | 37.25 | % | (27.01 | )% | (10.40 | )% | ||||||
Ratios/Supplemental Data: | ||||||||||||||||
Net assets, end of year (000s omitted) | $ | 8,756 | $ | 6,588 | $ | 5,695 | $ | 4,405 | $ | 6,017 | ||||||
Ratio of expenses to average net assets | 1.18 | % | 1.25 | % | 1.25 | % | 1.26 | % | 1.26 | % | ||||||
Ratio of net investment loss to average net assets | (1.18 | )% | (1.22 | )% | (1.16 | )% | (1.19 | )% | (1.19 | )% | ||||||
Portfolio turnover rate | 5.42 | % | 5.50 | % | 1.55 | % | 3.01 | % | — | |||||||
Without fee waiver and expense reimbursement:* | ||||||||||||||||
Ratio of expenses to average net assets | 1.43 | % | 1.50 | % | 1.56 | % | 1.94 | % | 2.39 | % | ||||||
Ratio of net investment loss to average net assets | (1.43 | )% | (1.47 | )% | (1.48 | )% | (1.87 | )% | (2.32 | )% |
__________
See footnotes on page 45.
36
Financial Highlights
Time Horizon 20 Fund (continued)
Year Ended December 31, | ||||||||||||||||
Class D | 2005 | 2004 | 2003 | 2002 | 2001 | |||||||||||
Per Share Data: | ||||||||||||||||
Net Asset Value, Beginning of Year | $ | 6.28 | $ | 5.49 | $ | 4.00 | $ | 5.48 | $ | 6.41 | ||||||
Income (Loss) from Investment Operations: | ||||||||||||||||
Net investment loss | (0.08 | ) | (0.07 | ) | (0.05 | ) | (0.06 | ) | (0.07 | ) | ||||||
Net realized and unrealized gain (loss) on investments | 0.65 | 0.86 | 1.54 | (1.42 | ) | (0.62 | ) | |||||||||
Total from Investment Operations | 0.57 | 0.79 | 1.49 | (1.48 | ) | (0.69 | ) | |||||||||
Less Distributions: | ||||||||||||||||
Distributions from net investment income | — | — | — | — | (0.03 | ) | ||||||||||
Distributions from net realized capital gains | — | — | — | — | (0.21 | ) | ||||||||||
Total Distributions | — | — | — | — | (0.24 | ) | ||||||||||
Net Asset Value, End of Year | $ | 6.85 | $ | 6.28 | $ | 5.49 | $ | 4.00 | $ | 5.48 | ||||||
Total Return | 9.08 | % | 14.39 | %# | 37.25 | % | (27.01 | )% | (10.40 | )% | ||||||
Ratios/Supplemental Data: | ||||||||||||||||
Net assets, end of year (000s omitted) | $ | 1,767 | $ | 1,340 | $ | 1,217 | $ | 933 | $ | 1,057 | ||||||
Ratio of expenses to average net assets | 1.18 | % | 1.25 | % | 1.25 | % | 1.26 | % | 1.26 | % | ||||||
Ratio of net investment loss to average net assets | (1.18 | )% | (1.22 | )% | (1.16 | )% | (1.19 | )% | (1.19 | )% | ||||||
Portfolio turnover rate | 5.42 | % | 5.50 | % | 1.55 | % | 3.01 | % | — | |||||||
Without fee waiver and expense reimbursement:* | ||||||||||||||||
Ratio of expenses to average net assets | 1.43 | % | 1.50 | % | 1.56 | % | 1.94 | % | 2.39 | % | ||||||
Ratio of net investment loss to average net assets | (1.43 | )% | (1.47 | )% | (1.48 | )% | (1.87 | )% | (2.32 | )% |
__________
See footnotes on page 45.
37
Financial Highlights
Time Horizon 10 Fund
Year Ended December 31, | ||||||||||||||||
Class A | 2005 | 2004 | 2003 | 2002 | 2001 | |||||||||||
Per Share Data: | ||||||||||||||||
Net Asset Value, Beginning of Year | $ | 6.18 | $ | 5.53 | $ | 4.19 | $ | 5.55 | $ | 6.59 | ||||||
Income (Loss) from Investment Operations: | ||||||||||||||||
Net investment income | 0.05 | 0.05 | 0.04 | 0.05 | 0.10 | |||||||||||
Net realized and unrealized gain (loss) on investments | 0.46 | 0.66 | 1.34 | (1.35 | ) | (0.82 | ) | |||||||||
Total from Investment Operations | 0.51 | 0.71 | 1.38 | (1.30 | ) | (0.72 | ) | |||||||||
Less Distributions: | ||||||||||||||||
Distributions from net investment income | (0.05 | ) | (0.05 | ) | (0.04 | ) | (0.05 | ) | (0.13 | ) | ||||||
Dividends in excess of net investment income | — | (0.01 | ) | — | — | — | ||||||||||
Return of capital | — | — | — | (0.01 | ) | — | ||||||||||
Distributions from net realized capital gains | — | — | — | — | (0.19 | ) | ||||||||||
Total Distributions | (0.05 | ) | (0.06 | ) | (0.04 | ) | (0.06 | ) | (0.32 | ) | ||||||
Net Asset Value, End of Year | $ | 6.64 | $ | 6.18 | $ | 5.53 | $ | 4.19 | $ | 5.55 | ||||||
Total Return | 8.32 | % | 12.79 | %# | 32.96 | % | (23.43 | )% | (10.69 | )% | ||||||
Ratios/Supplemental Data: | ||||||||||||||||
Net assets, end of year (000s omitted) | $ | 11,020 | $ | 7,313 | $ | 4,415 | $ | 2,627 | $ | 3,014 | ||||||
Ratio of expenses to average net assets | 0.30 | % | 0.50 | % | 0.50 | % | 0.51 | % | 0.51 | % | ||||||
Ratio of net investment income to average net assets | 0.73 | % | 0.80 | % | 0.87 | % | 1.01 | % | 1.64 | % | ||||||
Portfolio turnover rate | 3.45 | % | 16.84 | % | 7.48 | % | 8.20 | % | 6.38 | % | ||||||
Without fee waiver and expense reimbursement:* | ||||||||||||||||
Ratio of expenses to average net assets | 0.60 | % | 0.70 | % | 0.81 | % | 0.87 | % | 1.27 | % | ||||||
Ratio of net investment income to average net assets | 0.43 | % | 0.62 | % | 0.56 | % | 0.65 | % | 0.88 | % |
__________
See footnotes on page 45.
38
Financial Highlights
Time Horizon 10 Fund (continued)
Year Ended December 31, | ||||||||||||||||
Class B | 2005 | 2004 | 2003 | 2002 | 2001 | |||||||||||
Per Share Data: | ||||||||||||||||
Net Asset Value, Beginning of Year | $ | 6.10 | $ | 5.47 | $ | 4.16 | $ | 5.50 | $ | 6.55 | ||||||
Income (Loss) from Investment Operations: | ||||||||||||||||
Net investment income | —ø | 0.01 | 0.01 | 0.02 | 0.05 | |||||||||||
Net realized and unrealized gain (loss) on investments | 0.46 | 0.64 | 1.31 | (1.33 | ) | (0.81 | ) | |||||||||
Total from Investment Operations | 0.46 | 0.65 | 1.32 | (1.31 | ) | (0.76 | ) | |||||||||
Less Distributions: | ||||||||||||||||
Distributions from net investment income | — | ø | (0.01 | ) | (0.01 | ) | (0.02 | ) | (0.10 | ) | ||||||
Dividends in excess of net investment income | (0.01 | ) | (0.01 | ) | — | — | — | |||||||||
Return of capital | — | — | — | (0.01 | ) | — | ||||||||||
Distributions from net realized capital gain | — | — | — | — | (0.19 | ) | ||||||||||
Total Distributions | (0.01 | ) | (0.02 | ) | (0.01 | ) | (0.03 | ) | (0.29 | ) | ||||||
Net Asset Value, End of Year | $ | 6.55 | $ | 6.10 | $ | 5.47 | $ | 4.16 | $ | 5.50 | ||||||
Total Return | 7.39 | % | 12.11 | %# | 31.71 | % | (23.90 | )% | (11.38 | )% | ||||||
Ratios/Supplemental Data: | ||||||||||||||||
Net assets, end of year (000s omitted) | $ | 5,888 | $ | 4,360 | $ | 4,123 | $ | 3,110 | $ | 4,270 | ||||||
Ratio of expenses to average net assets | 1.06 | % | 1.25 | % | 1.25 | % | 1.26 | % | 1.26 | % | ||||||
Ratio of net investment income to average net assets | (0.03 | )% | 0.05 | % | 0.12 | % | 0.26 | % | 0.89 | % | ||||||
Portfolio turnover rate | 3.45 | % | 16.84 | % | 7.48 | % | 8.20 | % | 6.38 | % | ||||||
Without fee waiver and expense reimbursement:* | ||||||||||||||||
Ratio of expenses to average net assets | 1.36 | % | 1.45 | % | 1.56 | % | 1.62 | % | 2.02 | % | ||||||
Ratio of net investment income (loss) to average net assets | (0.33 | )% | (0.14 | )% | (0.19 | )% | (0.10 | )% | 0.13 | % |
__________
See footnotes on page 45.
39
Financial Highlights
Time Horizon 10 Fund (continued)
Year Ended December 31, | ||||||||||||||||
Class C | 2005 | 2004 | 2003 | 2002 | 2001 | |||||||||||
Per Share Data: | ||||||||||||||||
Net Asset Value, Beginning of Year | $ | 6.11 | $ | 5.47 | $ | 4.16 | $ | 5.50 | $ | 6.55 | ||||||
Income (Loss) from Investment Operations: | ||||||||||||||||
Net investment income | — | ø | 0.01 | 0.01 | 0.02 | 0.05 | ||||||||||
Net realized and unrealized gain (loss) on investments | 0.45 | 0.65 | 1.31 | (1.33 | ) | (0.81 | ) | |||||||||
Total from Investment Operations | 0.45 | 0.66 | 1.32 | (1.31 | ) | (0.76 | ) | |||||||||
Less Distributions: | ||||||||||||||||
Distributions from net investment income | —ø | (0.01 | ) | (0.01 | ) | (0.02 | ) | (0.10 | ) | |||||||
Dividends in excess of net investment income | (0.01 | ) | (0.01 | ) | — | — | — | |||||||||
Return of capital | — | — | — | (0.01 | ) | — | ||||||||||
Distributions from net realized capital gains | — | — | — | — | (0.19 | ) | ||||||||||
Total Distributions | (0.01 | ) | (0.02 | ) | (0.01 | ) | (0.03 | ) | (0.29 | ) | ||||||
Net Asset Value, End of Year | $ | 6.55 | $ | 6.11 | $ | 5.47 | $ | 4.16 | $ | 5.50 | ||||||
Total Return | 7.39 | % | 12.11 | %# | 31.71 | % | (23.90 | )% | (11.38 | )% | ||||||
Ratios/Supplemental Data: | ||||||||||||||||
Net assets, end of year (000s omitted) | $ | 10,576 | $ | 7,981 | $ | 6,510 | $ | 6,491 | $ | 7,933 | ||||||
Ratio of expenses to average net assets | 1.06 | % | 1.25 | % | 1.25 | % | 1.26 | % | 1.26 | % | ||||||
Ratio of net investment income to average net assets | (0.03 | )% | 0.05 | % | 0.12 | % | 0.26 | % | 0.89 | % | ||||||
Portfolio turnover rate | 3.45 | % | 16.84 | % | 7.48 | % | 8.20 | % | 6.38 | % | ||||||
Without fee waiver and expense reimbursement:* | ||||||||||||||||
Ratio of expenses to average net assets | 1.36 | % | 1.46 | % | 1.56 | % | 1.62 | % | 2.02 | % | ||||||
Ratio of net investment income (loss) to average net assets | (0.33 | )% | (0.14 | )% | (0.19 | )% | (0.10 | )% | 0.13 | % |
__________
See footnotes on page 45.
40
Financial Highlights
Time Horizon 10 Fund (continued)
Year Ended December 31, | ||||||||||||||||
Class D | 2005 | 2004 | 2003 | 2002 | 2001 | |||||||||||
Per Share Data: | ||||||||||||||||
Net Asset Value, Beginning of Year | $ | 6.11 | $ | 5.47 | $ | 4.16 | $ | 5.50 | $ | 6.55 | ||||||
Income (Loss) from Investment Operations: | ||||||||||||||||
Net investment income | —ø | 0.01 | 0.01 | 0.02 | 0.05 | |||||||||||
Net realized and unrealized gain (loss) on investments | 0.45 | 0.65 | 1.31 | (1.33 | ) | (0.81 | ) | |||||||||
Total from Investment Operations | 0.45 | 0.66 | 1.32 | (1.31 | ) | (0.76 | ) | |||||||||
Less Distributions: | ||||||||||||||||
Distributions from net investment income | — | ø | (0.01 | ) | (0.01 | ) | (0.02 | ) | (0.10 | ) | ||||||
Dividends in excess of net investment income | (0.01 | ) | (0.01 | ) | — | — | — | |||||||||
Return of capital | — | — | — | (0.01 | ) | — | ||||||||||
Distributions from net realized capital gains | — | — | — | — | (0.19 | ) | ||||||||||
Total Distributions | (0.01 | ) | (0.02 | ) | (0.01 | ) | (0.03 | ) | (0.29 | ) | ||||||
Net Asset Value, End of Year | $ | 6.55 | $ | 6.11 | $ | 5.47 | $ | 4.16 | $ | 5.50 | ||||||
Total Return | 7.39 | % | 12.11 | %# | 31.71 | % | (23.90 | )% | (11.38 | )% | ||||||
Ratios/Supplemental Data: | ||||||||||||||||
Net assets, end of year (000s omitted) | $ | 3,154 | $ | 1,999 | $ | 1,388 | $ | 994 | $ | 1,209 | ||||||
Ratio of expenses to average net assets | 1.06 | % | 1.25 | % | 1.25 | % | 1.26 | % | 1.26 | % | ||||||
Ratio of net investment income to average net assets | (0.03 | )% | 0.05 | % | 0.12 | % | 0.26 | % | 0.89 | % | ||||||
Portfolio turnover rate | 3.45 | % | 16.84 | % | 7.48 | % | 8.20 | % | 6.38 | % | ||||||
Without fee waiver and expense reimbursement:* | ||||||||||||||||
Ratio of expenses to average net assets | 1.36 | % | 1.45 | % | 1.56 | % | 1.62 | % | 2.02 | % | ||||||
Ratio of net investment income (loss) to average net assets | (0.33 | )% | (0.14 | )% | (0.19 | )% | (0.10 | )% | 0.13 | % |
__________
See footnotes on page 45.
41
Financial Highlights
Harvester Fund
Year Ended December 31, | ||||||||||||||||
Class A | 2005 | 2004 | 2003 | 2002 | 2001 | |||||||||||
Per Share Data: | ||||||||||||||||
Net Asset Value, Beginning of Year | $ | 5.53 | $ | 5.13 | $ | 4.29 | $ | 5.31 | $ | 6.56 | ||||||
Income (Loss) from Investment Operations: | ||||||||||||||||
Net investment income | 0.09 | 0.08 | 0.08 | 0.10 | 0.20 | |||||||||||
Net realized and unrealized gain (loss) on investments | 0.16 | 0.42 | 0.83 | (0.96 | ) | (1.15 | ) | |||||||||
Total from Investment Operations | 0.25 | 0.50 | 0.91 | (0.86 | ) | (0.95 | ) | |||||||||
Less Distributions: | ||||||||||||||||
Distributions from net investment income | (0.09 | ) | (0.08 | ) | (0.07 | ) | (0.10 | ) | (0.24 | ) | ||||||
Dividends in excess of net investment income | (0.02 | ) | (0.02 | ) | — | (0.04 | ) | — | ||||||||
Return of capital | — | — | — | (0.02 | ) | — | ||||||||||
Distributions from net realized capital gains | — | — | — | — | (0.06 | ) | ||||||||||
Total Distributions | (0.11 | ) | (0.10 | ) | (0.07 | ) | (0.16 | ) | (0.30 | ) | ||||||
Net Asset Value, End of Year | $ | 5.67 | $ | 5.53 | $ | 5.13 | $ | 4.29 | $ | 5.31 | ||||||
Total Return | 4.53 | % | 9.90 | %# | 21.44 | % | (16.54 | )% | (14.64 | )% | ||||||
Ratios/Supplemental Data: | ||||||||||||||||
Net assets, end of year (000s omitted) | $ | 6,422 | $ | 5,092 | $ | 3,085 | $ | 2,135 | $ | 1,830 | ||||||
Ratio of expenses to average net assets | 0.31 | % | 0.50 | % | 0.50 | % | 0.51 | % | 0.51 | % | ||||||
Ratio of net investment income to average net assets | 1.60 | % | 1.46 | % | 1.52 | % | 1.85 | % | 3.47 | % | ||||||
Portfolio turnover rate | 18.35 | % | 25.59 | % | 5.69 | % | 39.28 | % | 12.80 | % | ||||||
Without fee waiver and expense reimbursement:* | ||||||||||||||||
Ratio of expenses to average net assets | 0.82 | % | 0.79 | % | 0.73 | % | 1.05 | % | 1.36 | % | ||||||
Ratio of net investment income to average net assets | 1.09 | % | 1.19 | % | 1.29 | % | 1.31 | % | 2.61 | % |
__________
See footnotes on page 45.
42
Financial Highlights
Harvester Fund (continued)
Year Ended December 31, | ||||||||||||||||
Class B | 2005 | 2004 | 2003 | 2002 | 2001 | |||||||||||
Per Share Data: | ||||||||||||||||
Net Asset Value, Beginning of Year | $ | 5.53 | $ | 5.13 | $ | 4.29 | $ | 5.31 | $ | 6.54 | ||||||
Income (Loss) from Investment Operations: | ||||||||||||||||
Net investment income | 0.05 | 0.04 | 0.04 | 0.05 | 0.16 | |||||||||||
Net realized and unrealized gain (loss) on investments | 0.16 | 0.42 | 0.84 | (0.96 | ) | (1.15 | ) | |||||||||
Total from Investment Operations | 0.21 | 0.46 | 0.88 | (0.91 | ) | (0.99 | ) | |||||||||
Less Distributions: | ||||||||||||||||
Distributions from net investment income | (0.05 | ) | (0.04 | ) | (0.04 | ) | (0.05 | ) | (0.18 | ) | ||||||
Dividends in excess of net investment income | (0.02 | ) | (0.02 | ) | — | (0.04 | ) | — | ||||||||
Return of capital | — | — | — | (0.02 | ) | — | ||||||||||
Distributions from net realized capital gains | — | — | — | — | (0.06 | ) | ||||||||||
Total Distributions | (0.07 | ) | (0.06 | ) | (0.04 | ) | (0.11 | ) | (0.24 | ) | ||||||
Net Asset Value, End of Year | $ | 5.67 | $ | 5.53 | $ | 5.13 | $ | 4.29 | $ | 5.31 | ||||||
Total Return | 3.76 | % | 9.09 | %# | 20.55 | % | (17.28 | )% | (15.18 | )% | ||||||
Ratios/Supplemental Data: | ||||||||||||||||
Net assets, end of year (000s omitted) | $ | 3,219 | $ | 3,932 | $ | 4,133 | $ | 2,855 | $ | 2,470 | ||||||
Ratio of expenses to average net assets | 1.07 | % | 1.25 | % | 1.25 | % | 1.26 | % | 1.26 | % | ||||||
Ratio of net investment income to average net assets | 0.84 | % | 0.71 | % | 0.77 | % | 1.10 | % | 2.72 | % | ||||||
Portfolio turnover rate | 18.35 | % | 25.59 | % | 5.69 | % | 39.28 | % | 12.80 | % | ||||||
Without fee waiver and expense reimbursement:* | ||||||||||||||||
Ratio of expenses to average net assets | 1.58 | % | 1.54 | % | 1.48 | % | 1.80 | % | 2.11 | % | ||||||
Ratio of net investment income to average net assets | 0.33 | % | 0.44 | % | 0.54 | % | 0.56 | % | 1.86 | % |
__________
See footnotes on page 45.
43
Financial Highlights
Harvester Fund (continued)
Year Ended December 31, | ||||||||||||||||
Class C | 2005 | 2004 | 2003 | 2002 | 2001 | |||||||||||
Per Share Data: | ||||||||||||||||
Net Asset Value, Beginning of Year | $ | 5.53 | $ | 5.13 | $ | 4.29 | $ | 5.31 | $ | 6.54 | ||||||
Income (Loss) from Investment Operations: | ||||||||||||||||
Net investment income | 0.05 | 0.04 | 0.04 | 0.05 | 0.15 | |||||||||||
Net realized and unrealized gain (loss) on investments | 0.16 | 0.42 | 0.84 | (0.96 | ) | (1.14 | ) | |||||||||
Total from Investment Operations | 0.21 | 0.46 | 0.88 | (0.91 | ) | (0.99 | ) | |||||||||
Less Distributions: | ||||||||||||||||
Distributions from net investment income | (0.05 | ) | (0.04 | ) | (0.04 | ) | (0.05 | ) | (0.18 | ) | ||||||
Dividends in excess of net investment income | (0.02 | ) | (0.02 | ) | — | (0.04 | ) | — | ||||||||
Return of capital | — | — | — | (0.02 | ) | — | ||||||||||
Distributions from net realized capital gains | — | — | — | — | (0.06 | ) | ||||||||||
Total Distributions | (0.07 | ) | (0.06 | ) | (0.04 | ) | (0.11 | ) | (0.24 | ) | ||||||
Net Asset Value, End of Year | $ | 5.67 | $ | 5.53 | $ | 5.13 | $ | 4.29 | $ | 5.31 | ||||||
Total Return | 3.76 | % | 9.09 | %# | 20.55 | % | (17.28 | )% | (15.18 | )% | ||||||
Ratios/Supplemental Data: | ||||||||||||||||
Net assets, end of year (000s omitted) | $ | 5,382 | $ | 6,149 | $ | 6,665 | $ | 6,371 | $ | 7,965 | ||||||
Ratio of expenses to average net assets | 1.07 | % | 1.25 | % | 1.25 | % | 1.26 | % | 1.26 | % | ||||||
Ratio of net investment income to average net assets | 0.84 | % | 0.71 | % | 0.77 | % | 1.10 | % | 2.72 | % | ||||||
Portfolio turnover rate | 18.35 | % | 25.59 | % | 5.69 | % | 39.28 | % | 12.80 | % | ||||||
Without fee waiver and expense reimbursement:* | ||||||||||||||||
Ratio of expenses to average net assets | 1.58 | % | 1.54 | % | 1.48 | % | 1.80 | % | 2.11 | % | ||||||
Ratio of net investment income to average net assets | 0.33 | % | 0.44 | % | 0.54 | % | 0.56 | % | 1.86 | % |
__________
See footnotes on page 45.
44
Financial Highlights
Harvester Fund (continued)
Year Ended December 31, | ||||||||||||||||
Class D | 2005 | 2004 | 2003 | 2002 | 2001 | |||||||||||
Per Share Data: | ||||||||||||||||
Net Asset Value, Beginning of Year | $ | 5.53 | $ | 5.13 | $ | 4.29 | $ | 5.31 | $ | 6.54 | ||||||
Income (Loss) from Investment Operations: | ||||||||||||||||
Net investment income | 0.05 | 0.04 | 0.04 | 0.05 | 0.15 | |||||||||||
Net realized and unrealized gain (loss) on investments | 0.16 | 0.42 | 0.84 | (0.96 | ) | (1.14 | ) | |||||||||
Total from Investment Operations | 0.21 | 0.46 | 0.88 | (0.91 | ) | (0.99 | ) | |||||||||
Less Distributions: | ||||||||||||||||
Distributions from net investment income | (0.05 | ) | (0.04 | ) | (0.04 | ) | (0.05 | ) | (0.18 | ) | ||||||
Dividends in excess of net investment income | (0.02 | ) | (0.02 | ) | — | (0.04 | ) | — | ||||||||
Return of capital | — | — | — | (0.02 | ) | — | ||||||||||
Distributions from net realized capital gain | — | — | — | — | (0.06 | ) | ||||||||||
Total Distributions | (0.07 | ) | (0.06 | ) | (0.04 | ) | (0.11 | ) | (0.24 | ) | ||||||
Net Asset Value, End of Year | $ | 5.67 | $ | 5.53 | $ | 5.13 | $ | 4.29 | $ | 5.31 | ||||||
Total Return | 3.76 | % | 9.09 | %# | 20.55 | % | (17.28 | )% | (15.18 | )% | ||||||
Ratios/Supplemental Data: | ||||||||||||||||
Net assets, end of year (000s omitted) | $ | 1,904 | $ | 1,106 | $ | 1,431 | $ | 1,125 | $ | 1,316 | ||||||
Ratio of expenses to average net assets | 1.07 | % | 1.25 | % | 1.25 | % | 1.26 | % | 1.26 | % | ||||||
Ratio of net investment income to average net assets | 0.84 | % | 0.71 | % | 0.77 | % | 1.10 | % | 2.72 | % | ||||||
Portfolio turnover rate | 18.35 | % | 25.59 | % | 5.69 | % | 39.28 | % | 12.80 | % | ||||||
Without fee waiver and expense reimbursement:* | ||||||||||||||||
Ratio of expenses to average net assets | 1.58 | % | 1.54 | % | 1.48 | % | 1.80 | % | 2.11 | % | ||||||
Ratio of net investment income to average net assets | 0.33 | % | 0.44 | % | 0.54 | % | 0.56 | % | 1.86 | % |
__________
* | The Manager, at its discretion, reimbursed certain expenses and waived certain management fees for the periods presented (Note 3). |
ø | Less than + or - $0.01. |
# | Excluding the effect of the payments to certain of the underlying Seligman Funds received from the Manager (Note 7), total return would have been as follows: |
Time Horizon 30 Fund | Time Horizon 20 Fund | Time Horizon 10 Fund | Harvester Fund | ||||||||
Class A | 15.43% | Class A | 15.30% | Class A | 12.77% | Class A | 9.89% | ||||
Class B | 14.41 | Class B | 14.35 | Class B | 12.09 | Class B | 9.08 | ||||
Class C | 14.41 | Class C | 14.35 | Class C | 12.09 | Class C | 9.08 | ||||
Class D | 14.41 | Class D | 14.35 | Class D | 12.09 | Class D | 9.08 |
See Notes to Financial Statements.
45
Report of Independent Registered
Public Accounting Firm
The Board of Directors and Shareholders,
Seligman Time Horizon/Harvester Series, Inc.:
We have audited the accompanying statement of assets and liabilities, including the portfolios of investments of Seligman Time Horizon/Harvester Series, Inc. (the “Series”) comprising Seligman Time Horizon 30 Fund, Seligman Time Horizon 20 Fund, Seligman Time Horizon 10 Fund, and Seligman Harvester Fund, as of December 31, 2005, and the related statements of operations for the year then ended, the statements of changes in net assets for each of the two years in the period then ended, and the financial highlights for each of the five years in the period then ended. These financial statements and financial highlights are the responsibility of the Series’ management. Our responsibility is to express an opinion on these financial statements and financial highlights based on our audits.
We conducted our audits in accordance with the standards of the Public Company Accounting Oversight Board (United States). Those standards require that we plan and perform the audit to obtain reasonable assurance about whether the financial statements and financial highlights are free of material misstatement. The Series is not required to have, nor were we engaged to perform, an audit of its internal control over financial reporting. Our audits included consideration of internal control over financial reporting as a basis for designing audit procedures that are appropriate in the circumstances, but not for the purpose of expressing an opinion on the effectiveness of the Series’ internal control over financial reporting. Accordingly, we express no such opinion. An audit also includes examining, on a test basis, evidence supporting the amounts and disclosures in the financial statements, assessing the accounting principles used and significant estimates made by management, as well as evaluating the overall financial statement presentation. Our procedures included confirmation of securities owned as of December 31, 2005, by correspondence with the custodian and shareholder service agent. We believe that our audits provide a reasonable basis for our opinion.
In our opinion, the financial statements and financial highlights referred to above present fairly, in all material respects, the financial position of each of the funds constituting Seligman Time Horizon/ Harvester Series, Inc. as of December 31, 2005, the results of their operations for the year then ended, the changes in their net assets for each of the two years in the period then ended, and the financial highlights for each of the five years in the period then ended, in conformity with accounting principles generally accepted in the United States of America.
DELOITTE & TOUCHE LLP
New York, New York
February 28, 2006
46
Required Federal Income Tax
Information
Dividends paid for the year ended December 31, 2005 are subject to federal income tax as “ordinary income.” In order to claim the dividends received deduction for these distributions, corporate shareholders must have held their shares for 46 days or more during the 90-day period beginning 45 days before each ex-dividend date. Under the Internal Revenue Code, the dividends paid to corporate shareholders that qualify for the dividends received deduction were as follows:
Dividends Received Deduction Percent | ||
TimeHorizon 10 Fund | Harvester Fund | |
Class A | 40.21 | 3.03 |
Class B | 100.00 | 5.09 |
Class C | 100.00 | 5.07 |
Class D | 100.00 | 4.65 |
For the year ended December 31, 2005, the Funds designate the following as qualified dividends to individual shareholders:
Qualified Dividends Percent | ||
Time Horizon 10 Fund | Harvester Fund | |
Class A | 40.21 | 3.03 |
Class B | 100.00 | 5.09 |
Class C | 100.00 | 5.07 |
Class D | 100.00 | 4.65 |
In order for an individual to claim dividends received as qualified dividends, individual shareholders must have held their shares for more than 60 days during the 121-day period beginning 60 days before each ex-dividend date.
47
Matters Relating to the Directors’
Consideration of the Continuance of the
Management Agreement
In this disclosure, the term “Funds” refers to the Seligman Time Horizon 30 Fund, the Seligman Time Horizon 20 Fund, the Seligman Time Horizon 10 Fund, and the Seligman Harvester Fund. The term “Series” refers to the Seligman Time Horizon/Harvester Series, Inc.
The directors of the Series unanimously approved the continuance of the Management Agreement between the Series and the Manager in respect of each Fund at a meeting held on November 17, 2005.
In preparation for the meeting, experienced counsel who are independent of the Manager had discussed with the Manager the continuances and nature of materials to be provided to the directors, the directors had requested and evaluated extensive materials from the Manager, including performance and expense information for other investment companies with similar investment objectives derived from data compiled by Lipper Inc. (“Lipper”). Prior to voting, the directors reviewed the proposed continuance of the Management Agreement with the Manager and with experienced counsel who are independent of the Manager and received a memorandum from such counsel discussing the legal standards for their consideration of the proposed continuance. The independent directors also discussed the proposed continuance in a private session with counsel at which no representatives of the Manager were present.
In reaching their determination with respect to the continuance of the Management Agreement, the directors considered their knowledge of the nature and quality of the services provided by the Manager to the Funds gained from their experience as directors/and or trustees of the Seligman Group of Funds, their overall confidence in the Manager’s integrity and competence they have gained from that experience, the Manager’s initiative in identifying and raising potential issues with the directors and its responsiveness, frankness and attention to concerns raised by the directors in the past, including the Manager’s willingness to consider and implement organizational and operational changes designed to improve investment results and the services provided to the Seligman Group of Funds. The directors noted that the Board has six regular meetings each year, at each of which they receive presentations from the Manager on the investment results of the Funds and review extensive materials and information presented by the Manager.
The directors also considered all other factors they believed relevant, including the following:
1. | information comparing the performance of the Funds to other investment companies with similar investment objectives and to an index, and in the case of the Harvester Fund, to two indices; |
2. | the nature, extent and quality of investment and administrative services rendered by the Manager; |
3. | payments received by the Manager from all sources in respect of the Funds and all investment companies in the Seligman Group of Funds; |
4. | the costs borne by, and profitability of, the Manager and its affiliates in providing services to the Funds and to all investment companies in the Seligman Group of Funds; |
5. | comparative fee and expense data for the Funds and other investment companies with similar investment objectives; |
6. | the extent to which economies of scale would be realized as the Funds grows and whether the fee level reflects these economies of scale for the benefit of investors; |
7. | information about “revenue sharing” arrangements that the Manager enters into in respect of theFunds; |
8. | portfolio turnover rates of the Funds compared to other investment companies with similar investment objectives; |
9. | fall-out benefits which the Manager and its affiliates receive from their relationship to the Funds; |
48
Matters Relating to the Directors’
Consideration of the Continuance of the
Management Agreement
10. | the professional experience and qualifications of the Funds’ portfolio management team and other senior personnel of the Manager; and |
11. | the terms of the Management Agreement. |
In their deliberations, the directors did not identify any particular information that was all-important or controlling, and directors attributed different weights to the various factors.
The directors determined that the overall arrangements between the Funds and the Manager, as provided in the Management Agreement, were fair and reasonable in light of the services performed, expenses incurred and such other matters as the directors considered relevant in the exercise of their reasonable judgment.
The material factors and conclusions that formed the basis for the directors’ reaching their determination to approve the continuance of the Management Agreement in respect of each Fund (including their determinations that the Manager should continue to be the investment adviser for the Funds, and that the fees payable to the Manager pursuant to the Management Agreement are appropriate) were separately discussed by the directors.
Nature, Extent and Quality of Services Provided by the Manager
The directors noted that, under the Management Agreement, the Manager, subject to the control of the directors, administers the Funds’ business and other affairs. The Manager manages the investment of the assets of the Funds, including making purchases and sales of portfolio securities consistent with the Funds’ investment objective and policies. The Manager also provides the Funds with such office space, administrative and other services (exclusive of, and in addition to, any such services provided by any others retained by the Funds) and executive and other personnel as are necessary for the Funds’ operations. The Manager pays all of the compensation of directors of the Series who are employees or consultants of the Manager and of the officers and employees of the Series, including the Funds’ chief compliance officer. The Manager also provides senior management for Seligman Data Corp. (“SDC”), a company owned by certain of the investment companies in the Seligman Group of Funds that provides shareholder services to the Funds and other investment companies in the Seligman Group of Funds at cost.
The directors considered the scope and quality of services provided by the Manager under the Management Agreement and noted that the scope of services provided had expanded over time as a result of regulatory and other developments. The directors noted that, for example, the Manager is responsible for maintaining and monitoring its own and the Funds’ compliance programs, and these compliance programs have recently been refined and enhanced in light of recently adopted regulatory requirements. The directors considered the quality of the investment research capabilities of the Manager and the other resources they have dedicated to performing services for the Funds. The quality of administrative and other services, including the Manager’s role in coordinating the activities of the Funds’ other service providers, also were considered. The directors concluded that, overall, they were satisfied with the nature, extent and quality of services provided (and expected to be provided) to the Funds under the Management Agreement.
On an ongoing basis, the Manager reports to the directors on the status of various matters relating to market timing activity affecting certain funds in the Seligman Group of Funds. In connection with the continuance review, the Manager and its counsel and the directors' special counsel also addressed, among other matters: the action brought by the Manager and its president against the Attorney General of the State of New York seeking an order enjoining the Attorney General from, among other things, investigating the fees paid by the Funds in the Seligman Group of Funds to the Manager; the ex parte application filed by the Attorney General to seek further discovery and appoint a special referee to supervise the Attorney General’s investigation relating to market timing; and the indication by the Staff of the New York Office of the Securities and
49
Matters Relating to the Directors’
Consideration of the Continuance of the
Management Agreement
Exchange Commission (“SEC”) that it was considering recommending that the SEC institute a formal action against the Manager and Seligman Advisors, Inc. relating to market timing. After a detailed presentation by the Manager and further discussion with the Manager, the Manager’s counsel, the directors' special counsel and other experienced counsel independent of the Manager, the independent directors concluded that they retained confidence in the integrity of the Manager and its ability to provide management services to the Funds.
Costs of Services Provided and Profitability to the Manager
At the request of the directors, the Manager provided information concerning profitability of the Manager’s investment advisory and investment company activities and its financial condition based on historical information for 2004 and 2005 (through September 30) and estimates for full-year 2005. The information considered by the directors included operating profit margin information for the Manager’s investment company business alone (i.e., excluding results of its other businesses) and on a consolidated basis. The directors also reviewed the Manager’s profitability data and estimated profitability data for the Funds. The directors reviewed with the Manager’s chief financial officer the assumptions and methods of allocation used by the Manager in preparing the profitability data. The Manager stated its belief that the methods of allocation used were reasonable, but it noted that there are limitations inherent in allocating costs to multiple individual advisory products served by an organization such as the Manager where each of the advisory products draws on, and benefits from, the research and other resources of the organization.
The directors recognized that it is difficult to make comparisons of profitability from fund management contracts because comparative information is not generally publicly available and is affected by numerous factors, including the structure of the particular adviser, the types of funds it manages, its business mix, numerous assumptions regarding allocations and the adviser’s capital structure and cost of capital. In considering profitability information, the directors considered the effect of fall-out benefits on the Manager’s expenses, as well as the “revenue sharing” arrangements the Manager has entered into with certain entities that distribute shares of the Seligman Group of Funds. The directors focused on profitability of the Manager’s relationships with the Funds before taxes and distribution expenses. The directors recognized that the Manager should, in the abstract, be entitled to earn a reasonable level of profits for the services it provides to the Funds and, based on their review, concluded that they were satisfied that the Manager’s level of profitability from its relationship with the Funds was not excessive.
Fall-Out Benefits
The directors considered that a broker-dealer affiliate of the Manager receives 12b-1 fees from the Funds in respect of shares held in accounts for which there is no other broker of record, and that the Funds’ distributor (another affiliate of the Manager) retains a portion of the 12b-1 fees from the Seligman Group of Funds and receives a portion of the sales charges on sales or redemptions of certain classes of shares.
The directors recognized that the Manager’s profitability would be somewhat lower if its affiliates did not receive the other benefits described above. The directors noted that the Manager derives reputational and other benefits from its association with the Funds.
Investment Results
In addition to the information received by the directors for the meeting, the directors receive detailed performance information for the Funds at each regular Board meeting during the year. The directors reviewed information showing performance of each Fund compared to other funds in the Lipper Multi-Cap Core Funds Average, the Lipper Funds of Funds (Affiliated) Average, the Standard & Poor’s 500 Index and, in the case of
50
Matters Relating to the Directors’
Consideration of the Continuance of the
Management Agreement
the Harvester Fund, the Lehman Brothers Government/Credit Index. The directors also compared each Fund to a group of competitor funds selected by the Manager. The Manager selected five competitor funds for the Time Horizon 30 Fund and the Time Horizon 20 Fund, and thirteen competitor funds for the Time Horizon 10 Fund and the Harvester Fund. The comparisons in each case were over the annualized rolling three- and five-year periods ended September 30, 2005, for each calendar year in the 2001-to-2004 period, and for the first nine months of 2005, as applicable. The directors recognized that due to the nature of the Funds’ investment processes and philosophy, the comparative information provided comparing the Funds’ performance to their respective Lipper categories, benchmarks and competitor funds was of limited utility. The directors also noted that in addition to the evaluation in connection with their annual continuance consideration, they review the investment process for the Funds with the Manager at least annually.
Seligman Time Horizon 30 Fund — The comparative information showed that the Time Horizon 30 Fund’s investment results were above the S&P 500, both Lipper averages and the competitor average for the rolling three-year period and for 2003, 2004 and the nine months of 2005. Despite results that were in some cases substantially below the benchmarks in 2002, the Fund also exceeded the S&P 500 and was very close to the Lipper Multi-Cap Core Funds Average for the rolling five-year period, although it lagged the other benchmarks over that period. Based on their review, the directors concluded that the Time Horizon 30 Fund’s relative investment performance over time was satisfactory.
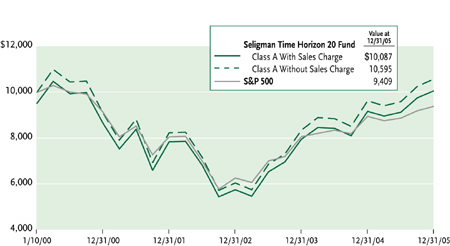
Seligman Time Horizon 20 Fund — The comparative information showed that the Time Horizon 20 Fund’s investment results were above the S&P 500, both Lipper averages and the competitor average for the rolling three-year period and for 2003, 2004 and the nine months of 2005. Despite results that were in some cases substantially below the benchmarks in 2002, the Fund also exceeded the S&P 500 for the rolling five-year period, although it lagged the other benchmarks over that period. Based on their review, the directors concluded that the Time Horizon 20 Fund’s relative investment performance over time was satisfactory.
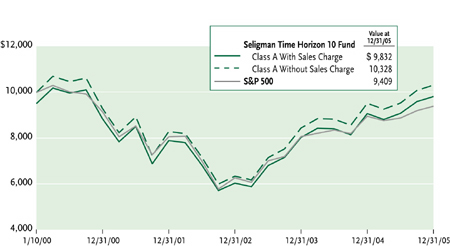
Seligman Time Horizon 10 Fund — The comparative information showed that the Time Horizon 10 Fund’s investment results were above the S&P 500, both Lipper averages and the competitor average for the rolling three-year period and for 2003, 2004 and the nine months of 2005. Despite results that were in some cases substantially below the benchmarks in 2001 and 2002, the Fund also exceeded the S&P 500 for the rolling five-year period, although it lagged the other benchmarks over that period. Based on their review, the directors concluded that the Time Horizon 10 Fund’s relative investment performance over time was satisfactory.
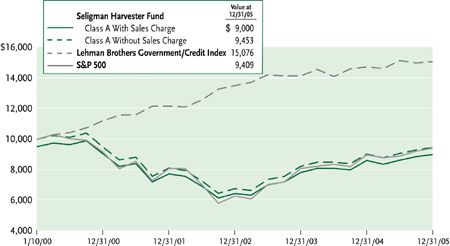
Seligman Harvester Fund — The comparative information showed that the Harvester Fund’s investment results were below the S&P 500, the Lehman Index, both Lipper averages and the competitor average for the rolling five-year period and (except for the Lehman Index) the rolling three-year period. The directors noted that the Harvester Fund’s more recent results appeared to show some improvement, and that the Fund was above the competitor average for 2003 and 2004, above the Lehman Index for 2003, 2004 and the nine months of 2005, and also above the S&P 500 for the nine months of 2005. Based on their review, the directors concluded that the Harvester Fund’s relative investment performance over time was acceptable.
Management Fees and Other Expenses
The directors considered the management fee rate paid by the Funds to the Manager. The directors recognized that it is difficult to make comparisons of management fees because there are variations in the services that are included in the fees paid by other funds.
The peer group for each Fund consisted of the funds in the Lipper Fund of Funds (Affiliated) category having between $4 million and $100 million of average net assets attributable to Class A shares in their most
51
Matters Relating to the Directors’
Consideration of the Continuance of the
Management Agreement
recent fiscal year. The information showed that each Fund’s asset allocation fee rate of 0.10% (before waivers) was less than the median, and substantially less than the average, for the 69 funds in such group. The Manager noted that, for each fund in the peer group (including the Funds), the fund’s management company would also earn management fees from the affiliated underlying funds in which the fund invests, and that the comparative information did not take those amounts into account.
The directors also reviewed each Fund’s total expense ratio for the most recent fiscal year, as compared to the expense ratios for other funds in the peer group. The directors recognized that the expense ratio information for the Funds potentially reflected on the Manager’s provision of services, as the Manager is responsible for coordinating services provided to the Funds by others. The directors noted that, effective April 1, 2005 and continuing until at least December 31, 2006, the Manager had undertaken to reimburse each Fund’s expenses (other than 12b-1 fees and extraordinary expenses) to the extent such expenses exceed 0.40% per annum (in the case of the Time Horizon 30 Fund and the Time Horizon 20 Fund) or 0.25% per annum (in the case of the Time Horizon 10 Fund and the Harvester Fund) of average daily net assets, and that the effect of this undertaking was not reflected in the expense ratio information they reviewed.
In considering the expense ratios of the Funds, the directors noted the Funds have elected to have shareholder services provided at cost by SDC and that the Manager provides senior management of SDC as part of the services covered by its management fees. SDC provides services exclusively to the Seligman Group of Funds, and the directors noted that the arrangement with SDC has provided the Funds and its shareholders with a consistently high level of service.
The directors noted that each Fund’s expense ratio was lower (and, giving effect to the contractual waiver, materially lower) than the peer group median and average. The Manager explained that its decision to cap expenses was due to the small size of each Fund. The directors were satisfied that each Fund’s expense ratio was satisfactory.
Economies of Scale
The directors noted that none of the Funds’ management fee schedules contain breakpoints that reduce the fee rate on assets above specified levels. The directors recognized that there is no direct relationship between the economies of scale realized by funds and those realized by the Manager as assets increase, largely because economies of scale are realized (if at all) by the Manager across a variety of products and services, and not only in respect of a single fund. The directors do not believe there is a uniform methodology for establishing breakpoints that give effect to fund-specific services provided by the Manager and to the economies of scale that the Manager may realize in its overall mutual fund business or those components of it which directly or indirectly affect a fund’s operations. The directors observed that in the mutual fund industry as a whole, as well as among funds similar to the Funds, there is no uniformity or pattern in the fees and asset levels at which breakpoints (if any) apply. Depending on the age and size of a particular fund and its manager’s cost structure, different conclusions can be drawn as to whether there are economies of scale to be realized at any particular level of assets, notwithstanding the intuitive conclusion that such economies exist, or will be realized at some level of total assets. Moreover, because different managers have different cost structures and service models, it is difficult to draw meaningful conclusions from the breakpoints that may have been adopted by comparable funds. The directors also noted that the advisory agreements for many competitor funds do not have breakpoints at all and that, in any event, the Funds have not benefited from significant net sales in recent times. Having taken these factors into account, the directors concluded that the absence of breakpoints in each Fund’s fee rate schedule was acceptable under each Fund’s circumstances.
52
Directors and Officers
Information pertaining to the Directors and Officers of Seligman Time Horizon/Harvester Series is set forth below.
Independent Directors
Name, (Age), Position(s) held with Fundø | Principal Occupation(s) During Past Five Years, Directorships and Other Information |
John R. Galvin (76)1,3 • Director: 1999 to Date • Oversees 58 Portfolios in Fund Complex | Dean Emeritus, Fletcher School of Law and Diplomacy at Tufts University; Director or Trustee of each of the investment companies of the Seligman Group of Funds†; and Chairman Emeritus, American Council on Germany. Formerly, Governor of the Center for Creative Leadership; Director, Raytheon Co. (defense and commercial electronics) and USLIFE Corporation (life insurance); and Trustee, Institute for Defense Analyses. From June 1987 to June 1992, Mr. Galvin was the Supreme Allied Commander, NATO, and the Commander-in-Chief, United States European Command. |
Alice S. Ilchman (70)2,3 • Director: 1999 to Date • Oversees 58 Portfolios in Fund Complex | President Emerita, Sarah Lawrence College; Director or Trustee of each of the investment companies of the Seligman Group of Funds†; Director, Jeannette K. Watson Summer Fellowship (summer internships for college students); Trustee, Committee for Economic Development; Governor, Court of Governors, London School of Economics; and Director, Public Broadcasting Service (PBS). Formerly, Trustee, Save the Children (non-profit child assistance organization). From January 1998 until December 2000, Chairman, The Rockefeller Foundation (charitable foundation). From September 1987 until September 1997, Director, New York Telephone Company. |
Frank A. McPherson (72)2,3 • Director: 1999 to Date • Oversees 58 Portfolios in Fund Complex | Retired Chairman of the Board and Chief Executive Officer of Kerr-McGee Corporation (diversified energy and chemical company); Director or Trustee of each of the investment companies of the Seligman Group of Funds†; and Director, DCP Midstream GP, LLP (natural gas processing), Integris Health (owner of various hospitals), Oklahoma Chapter of the Nature Conservancy, Oklahoma Medical Research Foundation, Boys and Girls Clubs of Oklahoma, Oklahoma City Public Schools Foundation, and Oklahoma Foundation for Excellence in Education. Formerly, Director, ConocoPhillips (integrated international oil corporation), Kimberly-Clark Corporation (consumer products), BOK Financial (bank holding company), and the Federal Reserve System’s Kansas City Reserve Bank. |
Betsy S. Michel (63)1,3 • Director: 1999 to Date • Oversees 58 Portfolios in Fund Complex | Attorney; Director or Trustee of each of the investment companies of the Seligman Group of Funds†; and Trustee, The Geraldine R. Dodge Foundation (charitable foundation). Formerly, Chairman of the Board of Trustees of St. George’s School (Newport, RI); and Trustee, World Learning, Inc. (international educational training), and Council of New Jersey Grantmakers. |
__________
See footnotes on page 56.
53
Directors and Officers
Independent Directors (continued)
Name, (Age), Position(s) held with Fundø | Principal Occupation(s) During Past Five Years, Directorships and Other Information |
Leroy C. Richie (64)1,3 • Director: 2000 to Date • Oversees 57 Portfolios in Fund Complex | Counsel, Lewis & Munday, P.C. (law firm); Chairman and Chief Executive Officer, Q Standards Worldwide, Inc. (library of technical standards); Director or Trustee of each of the investment companies of the Seligman Group of Funds† (with the exception of Seligman Cash Management Fund, Inc.); Director, Kerr-McGee Corporation (diversified energy and chemical company), Infinity, Inc. (oil and gas services and exploration), and Vibration Control Technologies, LLC (auto vibration technology); Lead Outside Director, Digital Ally Inc. (digital imaging); Director and Chairman, Highland Park Michigan Economic Development Corp.; and Chairman, Detroit Public Schools Foundation, and Detroit Economic Growth Corp. Formerly, Trustee, New York University Law Center Foundation; and Vice Chairman, Detroit Medical Center. From 1990 until 1997, Vice President and General Counsel, Automotive Legal Affairs, Chrysler Corporation. |
Robert L. Shafer (73)2,3 • Director: 1999 to Date • Oversees 58 Portfolios in Fund Complex | Ambassador and Permanent Observer of the Sovereign Military Order of Malta to the United Nations; and Director or Trustee of each of the investment companies of the Seligman Group of Funds†. Formerly, Director, USLIFE Corporation (life insurance); and Vice President, Pfizer Inc. (pharmaceuticals). |
James N. Whitson (70)1,3 • Director: 1999 to Date • Oversees 58 Portfolios in Fund Complex | Director or Trustee of each of the investment companies of the Seligman Group of Funds†; and Director, CommScope, Inc. (manufacturer of coaxial cable). Retired Executive Vice President and Chief Operating Officer, Sammons Enterprises, Inc. (a diversified holding company). Formerly, Director and Consultant, Sammons Enterprises, Inc. and Director, C-SPAN (cable television network). |
__________
See footnotes on page 56.
54
Directors and Officers
Interested Directors and Principal Officers
Name, (Age), Position(s) held with Fundø | Principal Occupation(s) During Past Five Years, Directorships and Other Information |
William C. Morris (67)* • Director and Chairman of the Board: 1999 to Date • Oversees 58 Portfolios in Fund Complex | Chairman, J. & W. Seligman & Co. Incorporated; Chairman of the Board and Director or Trustee of each of the investment companies of the Seligman Group of Funds†; Chairman, Seligman Advisors, Inc., Seligman Services, Inc. and Carbo Ceramics Inc. (manufacturer of ceramic proppants for oil and gas industry); Director, Seligman Data Corp.; and President and Chief Executive Officer of The Metropolitan Opera Association. Formerly, Director, Kerr-McGee Corporation (diversified energy and chemical company) and Chief Executive Officer of each of the investment companies of the Seligman Group of Funds. |
Brian T. Zino (53)* • Director and President: 1999 to Date • Chief Executive Officer: 2002 to Date • Oversees 57 Portfolios in Fund Complex | Director and President, J. & W. Seligman & Co. Incorporated; President and Chief Executive Officer of each of the investment companies of the Seligman Group of Funds†; Director or Trustee of each of the investment companies of the Seligman Group of Funds (with the exception of Seligman Cash Management Fund, Inc.); Director, Seligman Advisors, Inc. and Seligman Services, Inc.; Chairman, Seligman Data Corp.; Member of the Board of Governors of the Investment Company Institute; and Director (formerly Chairman), ICI Mutual Insurance Company. |
Eleanor T. M. Hoagland (54) • Vice President and Chief Compliance Officer: 2004 to Date | Managing Director, J. & W. Seligman & Co. Incorporated; and Vice President and Chief Compliance Officer of each of the investment companies of the Seligman Group of Funds†. Formerly, Managing Director, Partner and Chief Portfolio Strategist, AMT Capital Management. |
Charles W. Kadlec (59) • Vice President and Portfolio Manager: 1999 to Date | Managing Director and Director of J. & W. Seligman & Co. Incorporated and Director and President of Seligman Advisors, Inc. and Seligman Services, Inc.; Vice President and Co-Portfolio Manager of Seligman TargetHorizon ETF Portfolios, Inc. Mr. Kadlec is the architect of several investment strategies, chief among them Seligman Time Horizon Matrix and Seligman Harvester. |
__________
See footnotes on page 56.
55
Directors and Officers
Interested Directors and Principal Officers (continued)
Name, (Age), Position(s) held with Fundø | Principal Occupation(s) During Past Five Years, Directorships and Other Information |
Thomas G. Rose (48) • Vice President: 2000 to Date | Managing Director, Chief Financial Officer, and Treasurer, J. & W. Seligman & Co. Incorporated; Senior Vice President, Finance, Seligman Advisors, Inc. and Seligman Data Corp.; and Vice President of each of the investment companies of the Seligman Group of Funds†, Seligman Services, Inc. and Seligman International, Inc. |
Lawrence P. Vogel (49) • Vice President: 1999 to Date • Treasurer: 2000 to Date | Senior Vice President and Treasurer, Investment Companies, J. & W. Seligman & Co. Incorporated; Vice President and Treasurer of each of the investment companies of the Seligman Group of Funds†; and Treasurer of Seligman Data Corp. |
Frank J. Nasta (41) • Secretary: 1999 to Date | Director, Managing Director, General Counsel and Corporate Secretary, J. & W. Seligman & Co. Incorporated; Secretary of each of the investment companies of the Seligman Group of Funds†; and Corporate Secretary, Seligman Advisors, Inc., Seligman Services, Inc., Seligman International, Inc., and Seligman Data Corp. |
The Fund’s Statement of Additional Information (SAI) includes additional information about Fund directors and is available, without charge, upon request. You may call toll-free (800) 221-2450 in the US or collect (212) 682-7600 outside the US to request a copy of the SAI, to request other information about the Fund, or to make shareholder inquiries.
__________
ø | The address for each of the directors and officers is 100 Park Avenue, 8th floor, New York, NY 10017. Each Director serves for an indefinite term, until the election and qualification of a successor or until his or her earlier death, resignation or removal. Each officer is elected annually by the Board of Directors. |
† | The Seligman Group of Funds consists of 24 registered investment companies. |
* | Messrs. Morris and Zino are considered “interested persons” of the Fund, as defined in the Investment Company Act of 1940, as amended, by virtue of their positions with J. & W. Seligman & Co. Incorporated and its affiliates. |
Member: | 1 Audit Committee |
2 Director Nominating Committee | |
3 Board Operations Committee |
56
Additional Fund Information
Quarterly Schedule of Investments
A complete schedule of portfolio holdings owned by the Fund will be filed with the SEC for the first and third quarter of each fiscal year on Form N-Q, and will be available to shareholders (i) without charge, upon request, by calling toll-free (800) 221-2450 in the US or collect (212) 682-7600 outside the US or (ii) on the SEC’s website at www.sec.gov.1 In addition, the Form N-Q may be reviewed and copied at the SEC’s Public Reference Room in Washington, D.C. Information on the operation of the Public Reference Room may be obtained by calling (800) SEC-0330. Certain of the information contained in the Fund’s Form N-Q is also made available to shareholders on Seligman’s website at www.seligman.com.1
Proxy Voting
A description of the policies and procedures used by the Fund to determine how to vote proxies relating to portfolio securities as well as information regarding how the Fund voted proxies relating to portfolio securities during the 12-month period ended June 30 of each year will be available (i) without charge, upon request, by calling toll-free (800) 221-2450 in the US or collect (212) 682-7600 outside the US and (ii) on the SEC’s website at www.sec.gov.1 Information for each new 12-month period ending June 30 will be available no later than August 31 of that year.
__________
1 These website references are inactive textual references and information contained in or otherwise accessible through these websites does not form a part of this report or the Fund’s
prospectus or statement of additional information.
57
This report is intended only for the information of shareholders or those who have received the offering prospectus covering shares of Capital Stock of Seligman Time Horizon/Harvester, Series, Inc., which contains information about the investment objectives, risks, charges, and expenses of the Series, each of which should be considered carefully before investing. The prospectus, which contains information about these factors, should be read carefully before investing or sending money. | THF2 12/05 |
ITEM 2. CODE OF ETHICS.
As of December 31, 2005, the registrant has adopted a code of ethics that applies to its principal executive and principal financial officers.
ITEM 3. AUDIT COMMITTEE FINANCIAL EXPERT.
The registrant’s board of directors has determined that Mr. James N. Whitson, a member of its audit committee, is an audit committee financial expert. Mr. Whitson is “independent” as such term is defined in Form N-CSR.
ITEM 4. PRINCIPAL ACCOUNTANT FEES AND SERVICES.
(a) - (d) Aggregate fees billed to the registrant for the last two fiscal years for professional services rendered by the registrant’s principal accountant were as follows:
2005 | 2004 | ||
Audit Fees | $48,710 | $46,658 | |
Audit-Related Fees | - | - | |
Tax Fees | 9,400 | 8,800 | |
All Other Fees | - | 1,931 |
Audit fees include amounts related to the audit of the registrant’s annual financial statements and services normally provided by the accountant in connection with statutory and regulatory filings. Tax fees include amounts related to tax compliance, tax planning, and tax advice. Other fees include the registrant's pro-rata share of amounts for services related to the assessment of procedures for compliance with anti-money laundering regulations by the registrant and certain other associated investment companies.
Aggregate fees billed by the registrant’s principal accountant for the last two fiscal years for non-audit services provided to the registrant’s investment adviser (not including a sub-adviser whose role is primarily portfolio management and is sub-contracted or overseen by another investment adviser) and any entity controlling, controlled by, or under common control with the investment adviser that provides ongoing services to the registered investment company, where the engagement relates directly to the operations and financial reporting of the registrant, were as follows:
2005 | 2004 | ||
Audit-Related Fees | $124,560 | $118,630 | |
Tax Fees | 8,000 | 13,703 | |
All Other Fees | - | 43,000 |
Audit-related fees include amounts for (i) attestation services for the registrant’s shareholder service agent and (ii) performance of certain agreed-upon procedures relating to certain services performed by the registrant’s distributor. Tax fees include amounts related to tax compliance, tax planning, and tax advice for and an evaluation of certain tax reporting procedures of the registrant’s shareholder service agent. Other fees relates to electronic communication processing services performed on behalf of outside counsel of the investment adviser.
(e) (1) The Audit Committee is required to preapprove audit and non-audit services performed for the registrant by the principal accountant in order to assure that the provision of such services does not impair the principal accountant’s independence. The Audit Committee also is required to preapprove certain non-audit services performed by the registrant’s principal accountant for the registrant’s investment adviser (not including any sub-adviser whose role is primarily portfolio management and is subcontracted with or overseen by another investment adviser) and certain of the adviser’s affiliates that provide services directly related to the operations and financial reporting of the registrant. Unless a type of service to be provided by the principal accountant has received preapproval, it will require specific preapproval by the Audit Committee.
The Audit Committee may delegate preapproval authority to one or more of its members. The member or members to whom such authority is delegated shall report any preapproval decisions to the Audit Committee at its next scheduled meeting.
Notwithstanding the foregoing, under certain circumstances, preapproval of non-audit services of a de minimis amount is not required.
(2) No services included in (b) - (d) above were approved pursuant to the waiver provisions of paragraphs (c)(7)(i)(C) or (c)(7)(ii) of Rule 2-01 of Regulation S-X.
(f) Not applicable.
(g) The aggregate fees billed for the most recent fiscal year and the preceding fiscal year by the registrant’s principal accountant for non-audit services rendered to the registrant, its investment adviser (not including any sub-adviser whose role is primarily portfolio management and is subcontracted with or overseen by another investment adviser), and any entity controlling, controlled by, or under common control with the investment adviser that provides ongoing services to the registrant were $141,960 and $186,064, respectively.
(h) All non-audit services rendered in (g) above were pre-approved by the registrant’s audit committee. Accordingly, the audit committee considered whether these services were compatible with maintaining the principal accountant’s independence.
ITEM 5. AUDIT COMMITTEE OF LISTED REGISTRANTS.
Not applicable.
ITEM 6. SCHEDULE OF INVESTMENTS.
Included in Item 1 above.
ITEM 7. DISCLOSURE OF PROXY VOTING POLICIES AND PROCEDURES FOR CLOSED-END MANAGEMENT INVESTMENT COMPANIES.
Not applicable.
ITEM 8. PORTFOLIO MANAGERS OF CLOSED-END MANAGEMENT INVESTMENT COMPANIES.
Not applicable.
ITEM 9. PURCHASES OF EQUITY SECURITIES BY CLOSED-END MANAGEMENT INVESTMENT COMPANY AND AFFILIATED PURCHASERS.
Not applicable.
ITEM 10. SUBMISSION OF MATTERS TO A VOTE OF SECURITY HOLDERS.
Not applicable.
ITEM 11. CONTROLS AND PROCEDURES.
(a) The registrant's principal executive officer and principal financial officer have concluded, based upon their evaluation of the registrant's disclosure controls and procedures as conducted within 90 days of the filing date of this report, that these disclosure controls and procedures provide reasonable assurance that material information required to be disclosed by the registrant in the report it files or submits on Form N-CSR is recorded, processed, summarized and reported, within the time periods specified in the Commission's rules and forms and that such material information is accumulated and communicated to the registrant's management, including its principal executive officer and principal financial officer, as appropriate, in order to allow timely decisions regarding required disclosure.
(b) The registrant’s principal executive officer and principal financial officer are aware of no changes in the registrant’s internal control over financial reporting that occurred during the second fiscal quarter of the period covered by this report that has materially affected, or is reasonably likely to materially affect, the registrant’s internal control over financial reporting.
ITEM 12. EXHIBITS.
(a)(1) | Code of Ethics for Principal Executive and Principal Financial Officers. |
(a)(2) | Certifications of principal executive officer and principal financial officer as required by Rule 30a-2(a) under the Investment Company Act of 1940. |
(a)(3) | Not applicable. |
(b) | Certifications of chief executive officer and chief financial officer as required by Rule 30a-2(b) under the Investment Company Act of 1940. |
SIGNATURES
Pursuant to the requirements of the Securities Exchange Act of 1934 and the Investment Company Act of 1940, the registrant has duly caused this report to be signed on its behalf by the undersigned, thereunto duly authorized.
SELIGMAN TIME HORIZON/HARVESTER SERIES, INC.
By:
/S/ BRIAN T. ZINO
Brian T. Zino
President and Chief Executive Officer
Date: March 9, 2006
Pursuant to the requirements of the Securities Exchange Act of 1934 and the Investment Company Act of 1940, this report has been signed below by the following persons on behalf of the registrant and in the capacities and on the dates indicated.
By: X
/S/ BRIAN T. ZINOBrian T. Zino
President and Chief Executive Officer
Date: March 9, 2006
By:
/S/ LAWRENCE P.VOGELLawrence P. Vogel
Vice President, Treasurer and Chief Financial Officer
Date: March 9, 2006
SELIGMAN TIME HORIZON/HARVESTER SERIES, INC.
EXHIBIT INDEX
(a)(1) Code of Ethics for Principal Executive and Principal Financial Officers.
(a)(2) Certifications of principal executive officer and principal financial officer as required by Rule 30a-2(a) under the Investment Company Act of 1940.
(b) Certification of chief executive officer and chief financial officer as required by Rule 30a-2(b) of the Investment Company Act of 1940.