UNITED STATES
SECURITIES AND EXCHANGE COMMISSION
Washington, D.C. 20549
FORM N-CSR
CERTIFIED SHAREHOLDER REPORT OF REGISTERED
MANAGEMENT INVESTMENT COMPANIES
Investment Company Act File Number: 811-09561
Century Capital Management Trust
SECURITIES AND EXCHANGE COMMISSION
Washington, D.C. 20549
FORM N-CSR
CERTIFIED SHAREHOLDER REPORT OF REGISTERED
MANAGEMENT INVESTMENT COMPANIES
Investment Company Act File Number: 811-09561
Century Capital Management Trust
(Exact name of registrant as specified in charter)
c/o Century Capital Management, LLC
100 Federal Street, Boston, Massachusetts 02110
c/o Century Capital Management, LLC
100 Federal Street, Boston, Massachusetts 02110
(Address of principal executive offices) (Zip code)
Maureen Kane
Century Capital Management, LLC
100 Federal Street, Boston, Massachusetts 02110
Maureen Kane
Century Capital Management, LLC
100 Federal Street, Boston, Massachusetts 02110
Registrant's telephone number, including area code: (617) 482-3060
Date of fiscal year end: October 31
Date of reporting period: April 30, 2010
Item 1. Reports to Stockholders
TOTAL RETURNS FOR THESIX MONTHS ENDED APRIL 30, 2010
| Ticker Symbol | Total Returns | ||
| Century Shares Trust (“CST”) | |||
| Institutional Shares | CENSX | 15.47% | |
| Investor Shares | CENVX | 15.29% | |
| S&P 500 Index | 15.66% | ||
Century Small Cap Select Fund (“CSCS”) | |||
| Institutional Shares | CSMCX | 21.91% | |
| Investor Shares | CSMVX | 21.69% | |
| Russell 2000 Growth Index | 25.49% |
Past performance is no guarantee of future results. The recent growth rate in the global equity markets has helped to produce short-term returns for some sectors/asset classes that are not typical and may not continue in the future. Because of ongoing market volatility, Fund performance may be subject to substantial short-term changes.
TABLE OF CONTENTS
| Page | |
| 1 | |
Fund Summaries: | |
| 3 | |
| 6 | |
| 9 | |
Financial Statements: | |
| 10 | |
| 18 | |
| 19 | |
| 20 | |
| 21 | |
| 25 | |
| 30 |
This report is submitted for the general information of the shareholders of Century Shares Trust and Century Small Cap Select Fund (each a “Fund” and collectively, the “Funds”). It is not authorized for distribution to prospective investors unless it is preceded or accompanied by the Funds’ current prospectus, which includes information regarding the Funds’ objective(s), risks, and charges and expenses, experience of its management, and other information. The Funds’ prospectus contains this and other important information about the Funds. Please read the prospectus carefully before you invest.
Investments in mutual funds involve risks. Century Small Cap Select Fund concentrates its investments in the financial services and health care group of industries. Concentration in a particular industry subjects the Fund to the risks associated with that industry and, as a result, the Fund may be subject to greater price volatility than funds with less concentrated portfolios. In addition, the Fund invests in smaller companies which pose greater risks than those associated with larger, more established companies. Century Shares Trust may invest a significant portion of assets in securities of companies within the same market sector. If the Fund’s portfolio is over weighted in a sector, any negative development affecting that sector will have a greater impact on the Fund than a fund that is not over weighted in that sector. The views in this report were those of the Century Funds’ Chief Investment Officer and Portfolio Managers as of April 30, 2010 and may not reflect their views on the date that this report is first published or anytime thereafter. These views are intended to assist shareholders in understanding their investments and do not constitute investment advice. There is no assurance that the Funds will continue to invest in the securities mentioned.
CENTURY FUNDS
We are at an interesting crossroads of our continued economic recovery, where investor optimism may diverge from rising investor expectations about future growth. We stand confident that the fragile economic optimism we discussed in December remains firmly in place. The allocations within the Century Funds’ portfolios reflect this encouraging viewpoint. However, we are concerned by long-term growth risks that we see on the horizon, which may impact equity markets and how we position the Funds over the coming years. In this report we will share with you our thoughts on the current environment, how we view the challenges of tomorrow, and provide you an update on the Century Funds.
Investor optimism continues to march forward, interrupted by moments of political volatility. Equity investors pushed the S&P 500 Index up another 15.7% during the six-month period ended April 30, 2010, despite concerns about the economic turmoil in Greece, fears of contagion to other European Union members, unknown consequences of financial market reform, stimulus spending, deficits, and taxation. This optimism rallied the stock market 80% from its March 2009 low to its peak in late April of this year.
The economic results posted since our last report remain constructive. U.S. GDP increased 3.2% during the first quarter of 2010, which marked the third consecutive quarter of positive growth. Unemployment edged slightly higher in April to 9.9%, yet the economy has seen positive job growth in the first months of this year and industrial and consumer surveys indicate favorable growth continuing. Inflation levels remain dormant, and the Federal Reserve has indicated that interest rates will remain low for an extended period.
First quarter earnings results recently concluded with the majority of firms beating analyst profit expectations, and we are beginning to see the reappearance of revenue growth among reporting companies. As we discussed last year, expense cuts and cost containment were responsible for much of the recent earnings recovery. We noted that revenue growth was a necessary catalyst should the equity markets continue their advance towards higher levels. We believe that the return of revenue growth is likely to be selective, and renewed interest among investors in companies with positive revenue momentum should benefit the high-quality, industry-leading stocks that we seek out.
We are positioning the portfolios to reflect the current economic recovery by increasing exposure to cyclical stocks within the industrial and consumer discretionary sectors, while reducing exposure to health care, as discussed in the Commentary for each Fund.
We define the current geopolitical conditions as accommodative and expansionary, but we are uncomfortable with the expanded role that governments continue to play in the global economy. The developed nations have injected trillions of stimulus dollars and guarantees to thwart the global debt crisis. As investors, we are struggling to understand how the tremendous cost of this global safety net will be paid for and how the support will be withdrawn from the system without burdening future generations and creating a worse debt crisis in a few
CENTURY FUNDS
___________
1
years. Will global leaders have the courage to make difficult decisions? Are Americans willing to reduce their expectations of public services and how much they are willing to pay for these services? Herein lies our concern about the expectations of future growth.
“A politician thinks of the next election. A statesman, of the next generation.”
– James Freeman Clarke
The invoice for all of the recent federal stimulus spending will come due, unless sustainable job growth accelerates soon. It will require higher taxes and slower spending on public programs, people, and pensions. The likely policy solutions around lower spending and higher taxes are painful and unpopular. We are hopeful that American, European, and Asian statesmen/women will have the fortitude to do the right thing for the benefit of the next generation of investors. In the meantime, the government’s expanded role in the global economy is likely to add significant risk and volatility to the capital markets.
We are firm believers that “necessity is the mother of invention,” and that democracy and capitalism provide the creative innovation to solve “insurmountable” problems. Our investment philosophy incorporates this belief, seeking out the highest quality companies at times of market stress, because we believe that innovative leaders adapt to adverse conditions and thrive as their revenues, market share, and profitability grow faster than their struggling peers.
Like many of you, our eyes are focused on the long-term. We seek to balance the events of today with the prospects of tomorrow. We understand that your financial needs and goals require planning and competent management. Retirement planning, one of the most critical issues facing individuals today, is a challenge borne increasingly by the investor alone and must adapt to changing conditions. Future retirees understand that the pillars of a traditional retirement no longer exist, and therefore, it is critical for them to plan, save, and invest for the future.
These challenges motivate our efforts to 1) manage the rewards and risks of our daily investment decisions and 2) determine the best ways to position our portfolios to benefit from the great opportunities and weather the unforeseen problems that will determine our future together.
Thank you for your continued support and investment in the Century Funds. We welcome your questions and comments always.
Respectfully submitted,

Alexander L. Thorndike
Chairman of the Century Funds
CENTURY FUNDS
___________
2
How did the Portfolio Perform?
For the six-month period ended April 30, 2010, Century Small Cap Select Fund Institutional Shares returned 21.91% and the Investor Shares returned 21.69%, underperforming the Russell 2000 Growth Index’s return of 25.49%.
What factors Influenced Performance?
During the period, the stock market benefited from improving macroeconomic fundamentals along with healthier corporate results. The labor market showed signs of improvement, and core inflation remained under control. GDP growth was up a solid 3.2% in the first quarter of 2010, and many companies reported favorable results. The strong stock market performance was an indication that investors believe in a sustainable economic recovery. The Fund’s defensive posture created a drag on performance from November 1, 2009 to February 28, 2010, but a mid-period shift, toward companies that should benefit from an economic upturn, enabled the Fund to outperform the Index from February 28, 2010 to April 30, 2010.
Significant contributions from Atlas Air Worldwide Holdings, Inc. (an aircraft outsource operator), NxStage Medical, Inc. (a medical devices manufacturer), and Cohen & Steers, Inc. (a real estate asset manager) were offset by relative weakness from BJ’s Wholesale Club, Inc. (a warehouse club operator), Masimo Corp. (medical monitoring manufacturer), and Neutral Tandem, Inc. (telecom service provider). Although BJ’s Wholesale Club stock rose 9% during the six month period ended April 30, 2010, it lagged the Consumer Staples sector, which rebounded 28.5%.
The combination of underweighting Consumer Discretionary stocks and overweighting Financial stocks resulted in a modest drag on performance. The Consumer Discretionary sector rose 34% and was the best performing sector for the six months ending April 30, 2010. The Fund’s average exposure to Consumer Discretionary stocks was below that of the Index during the period, but we focused on increasing the consumer weighting in companies that we believe should experience improved sales growth and margin improvement as the economy improves, such as apparel, home improvement and restaurants. Our modest overweight of Financial stocks hindered performance. Although Financial stocks returned a very respectable 19.7%, they lagged the Russell 2000 Growth Index by more than 5.0%.
Describe Recent Portfolio Activity
The Fund’s exposure to the Consumer Discretionary and Industrial sectors increased the most as we focused on stocks that we believe will benefit from the economic upturn. We continue to believe that the Industrial sector will play an important role in helping the U.S. economy get back on its feet. In order to fund these increased allocations, we trimmed holdings in the Financials and Health Care sectors. The Fund’s exposure to Information Technology stocks remains significant at about 25% of the portfolio. We believe that technology companies will benefit from increased spending by corporations seeking to improve productivity and efficiency through the use of software and hardware solutions.
CENTURY FUNDS
___________
3
CENTURY SMALL CAP SELECT FUND COMMENTARY (CONTINUED)
Describe Portfolio Positioning at Period-End
We believe that the U.S. economy will continue to improve at a slow, steady pace. We have positioned the portfolio with a mix of companies that we believe offer the quality franchise growth characteristics that will benefit from the recovery. Our exposure to the Information Technology, Consumer Discretionary, and Industrial sectors reflects our enthusiasm for the recovery’s sustainable fundamentals. We believe this mix will enable the portfolio to better withstand market volatility, while also participating in market appreciation.
| Ten Largest Holdings* | |
| BRUKER CORP. | 3.77% |
| Life science instruments | |
| CORE LABORATORIES NV | 3.14% |
| Energy reservoir management provider | |
| j2 GLOBAL COMMUNICATIONS, INC. | 2.96% |
| Electronic communication services | |
| CORNELL COMPANIES, INC. | 2.94% |
| Correctional services | |
| SIGNATURE BANK | 2.91% |
| Business and personal banking | |
| MICROS SYSTEMS, INC. | 2.75% |
| Information Services | |
| LUMBER LIQUIDATORS | |
| HOLDINGS, INC. | 2.63% |
| Specialty retailer of hardwood flooring | |
| HITTITE MICROWAVE CORP. | 2.49% |
| Designs specialty semiconductors | |
| BROOKDALE SENIOR LIVING, INC. | 2.48% |
| Operates senior living communities | |
| G-III APPAREL GROUP LTD | 2.48% |
| Apparel brands provider | |
| Portfolio Composition* | |
| Information Technology | 24.8% |
| Health Care | 20.7% |
| Industrials | 18.0% |
| Consumer Discretionary | 17.2% |
| Financials | 6.9% |
| Energy | 4.5% |
| Materials | 4.5% |
| Consumer Staples | 2.1% |
Short-term investment less net liabilities | 1.3% |
*Based on the Fund’s net assets at April 30, 2010 and subject to change.
CENTURY FUNDS
___________
4
PERFORMANCE SUMMARY
Century Small Cap Select Fund – Institutional Shares and Investor Shares
The performance information shown below is historical and does not guarantee future results. Investment return and principal value fluctuate with changing market conditions so that, when redeemed, shares may be worth more or less than their original cost. Current performance may be substantially lower or higher than the Fund’s historical performance. Please call (800) 303-1928 for the Fund’s most recent month-end performance. As stated in the Fund’s current prospectus, the total (gross) annual operating expenses is 1.55% for the Investor Shares and 1.16% for the Institutional Shares. Returns would have been lower during relevant periods if certain fees had not been waived or expenses reimbursed. To discourage short-term trading, the Fund may impose a redemption fee of 1.00% on shares held less than 90 days. Performance figures and graphs do not reflect the deduction of taxes that a shareholder would pay on Fund distributions or redemption of Fund shares. Returns may vary by share class.
The recent growth rate in the global equity markets has helped to produce short-term returns for some sectors/asset classes that are not typical and may not continue in the future. Because of ongoing market volatility, Fund performance may be subject to substantial short-term changes.
Average Annual Total Returns as of 4/30/10 (%)
| 1 Year | 3 Years | 5 Years | 10 Years | ||||
| Century Small Cap Select Institutional Shares | 45.30 | -4.74 | 1.16 | 9.74 | |||
| Russell 2000 Growth Index | 45.20 | -1.93 | 6.06 | -0.06 | |||
| 1 Year | 3 Years | 5 Years | 10 Years | ||||
| Century Small Cap Select Investor Shares | 44.76 | -5.10 | 0.81 | 9.39 | |||
| Russell 2000 Growth Index | 45.20 | -1.93 | 6.06 | -0.06 |
Sources: Century Capital Management, LLC and Russell
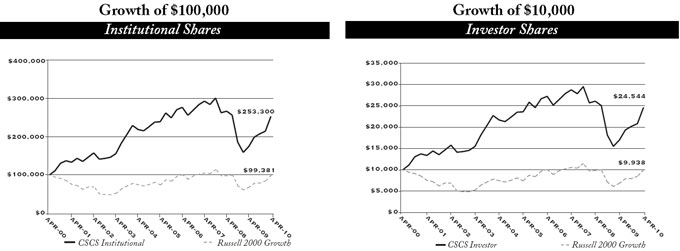
The graphs and table reflect the change in value of a hypothetical investment in the Fund, including reinvest of dividends and distributions, compared with the listed indices.
Index returns assume reinvestment of dividends and, unlike Fund returns, do not reflect any fees or expenses. It is not possible to invest directly in an index. Minimum initial investment for Institutional Shares is $100,000.
The Russell 2000® Growth Index measures the performance of the small-cap growth segment of the U.S. equity universe. It includes those Russell 2000® companies with higher price-to-value ratios and higher forecasted growth values.
CENTURY FUNDS
___________
5
How did the Portfolio Perform?
For the six-month period ended April 30, 2010, Century Shares Trust’s Institutional Shares and Investor Shares slightly underperformed the S&P 500 Index, returning 15.47% and 15.29%, respectively, versus the return of the S&P 500 Index of 15.66%.
What factors Influenced Performance?
The Fund performed roughly in-line with the S&P 500 Index throughout the period, although a shift toward cyclically-oriented companies enabled the Fund to slightly outperform the Index in the second half of the period. Stock selection was the primary reason for the underperformance. Strong performance by NII Holdings, Inc. (a Latin American wireless operator), Fastenal Company (an industrial supply distributor), and AmerisourceBergen Corp. (a drug distributor) was offset by weakness in QUALCOMM, Inc. (a wireless telecom developer), Ecolab, Inc (a cleaning products distributor), Google, Inc. (online advertising), and GameStop, Corp. (a video game retailer).
In terms of sector allocation, underweighting defensive sectors benefited performance while overweighting Information Technology and Health Care hindered performance. The Fund has low exposure to defensive sectors such as Consumer Staples and Utility stocks because we believe they offer less appreciation potential if the economy continues to strengthen. In contrast, we continue to maintain an overweight position in Information Technology, believing the corporate world will continue to seek out technology solutions to improve their operations. The Fund’s overweight position in Health Care has been a drag on performance recently, but we are comfortable with the consistent long term growth of medical innovation and increased health insurance coverage.
Describe Recent Portfolio Activity
The most notable changes to the portfolio were the increased exposure to Consumer Discretionary stocks and the reduced exposure to Consumer Staples stocks. We believe the U.S. economy has stabilized and will improve gradually. As companies begin to hire again and the unemployment rate begins to decline, we believe the average consumer will return to stores and increase their spending. As this trend plays out, Consumer Discretionary stocks should benefit. We also trimmed holdings in the Financial sector.
CENTURY FUNDS
___________
6
CENTURY SHARES TRUST COMMENTARY (CONTINUED)
Describe Portfolio Positioning at Period-End
The Fund continues to invest primarily in higher quality ‘Blue Chip’ companies that offer attractive growth prospects. The portfolio is currently positioned with a mix of cyclically-oriented franchises and high quality brand names. Despite the stock market’s heightened volatility, we believe the economic recovery will continue and that the Fund is positioned to benefit.
| Ten Largest Holdings* | |
| ORACLE CORP. | 4.19% |
| Enterprise software provider | |
| EXPRESS SCRIPTS, INC. | 4.13% |
| Pharmacy benefit management | |
| APPLE, INC. | 3.94% |
| Worldwide technology company | |
| CISCO SYSTEMS, INC. | 3.90% |
| Technology networking | |
| MICROSOFT CORP. | 3.28% |
| Worldwide Software and hardware provider | |
| AMERISOURCEBERGEN CORP. | 3.26% |
| Pharmaceutical services company | |
| NII HOLDINGS, INC. | 3.07% |
| Wireless communication services in Latin America | |
| GOOGLE, INC. | 3.01% |
| Internet solutions | |
| FASTENAL CO. | 2.63% |
| Industrial and construction supplies | |
| ACCENTURE PLC | 2.51% |
| Management and technology consulting | |
| Portfolio Composition* | |
| Information Technology | 31.7% |
| Consumer Discretionary | 14.3% |
| Health Care | 14.0% |
| Industrials | 11.9% |
| Energy | 7.2% |
| Financials | 5.9% |
| Consumer Staples | 5.1% |
| Materials | 4.5% |
| Telecommunication Services | 3.1% |
Short-term investment less net liabilities | 2.3% |
*Based on the Fund’s net assets at April 30, 2010 and subject to change.
CENTURY FUNDS
___________
7
PERFORMANCE SUMMARY
Century Shares Trust – Institutional Shares and Investor Shares
The performance information shown below is historical and does not guarantee future results. Investment return and principal value fluctuate with changing market conditions so that, when redeemed, shares may be worth more or less than their original cost. Current performance may be substantially lower or higher than the Fund’s historical performance. Please call (800) 303-1928 for the Fund’s most recent month-end performance. As stated in the Fund’s current prospectus, the total (gross) annual operating expense, is 1.22% for the Institutional Shares and 2.66% for the Investor Shares. The adviser has agreed contractually to reimburse or pay operating expenses for the Fund’s Investor Shares to the extent necessary to maintain net operating expenses at 1.45% through February 28, 2011. Returns would have been lower during relevant periods if certain fees had not been waived or expenses reimbursed. To discourage short-term trading, the Fund may impose a redemption fee of 1.00% on shares held less than 90 days. Performance figures and graphs do not reflect the deduction of taxes that a shareholder would pay on Fund distributions or redemption of Fund shares. Returns may vary by share class.
The recent growth rate in the global equity markets has helped to produce short-term returns for some sectors/asset classes that are not typical and may not continue in the future. Because of ongoing market volatility, Fund performance may be subject to substantial short-term changes.
| Average Annual Total Returns as of 4/30/10 (%) | |||||||
| 1 Year | 3 Years | 5 Years | 10 Years | ||||
| CST Institutional Shares | 32.28 | -3.75 | 2.28 | 6.18 | |||
| S&P 500 Index | 38.84 | -5.05 | 2.63 | -0.19 | |||
| 1 Year | 3 Years | Since Inception* | |||||
| CST Investor Shares | 31.78 | -3.99 | 0.75 | ||||
| S&P 500 Index | 38.84 | -5.05 | 1.51 |
Sources: Century Capital Management, LLC and S&P
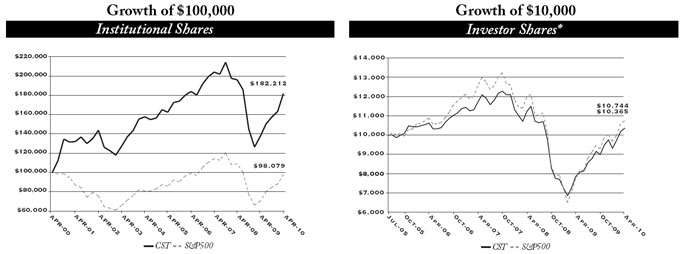
The graphs and table reflect the change in value of a hypothetical investment in the Fund, including reinvest of dividends and distributions, compared with the listed indices.
Index returns assume reinvestment of dividends and, unlike Fund returns, do not reflect any fees or expenses. It is not possible to invest directly in an index. Minimum initial investment for Institutional Shares is $100,000.
The S&P 500® Index is a broad based unmanaged index representing the performance of 500 widely held common stocks. One cannot invest directly in an index.
*Inception Date July 18, 2005
CENTURY FUNDS
___________
8
As a shareholder of a Fund, you incur two types of costs: (1) transaction costs including redemption fees, and (2) ongoing costs, including management fees, distribution and service fees (in the case of Investor Shares of both Funds) and other Fund expenses. This Example is intended to help you understand your ongoing costs (in dollars) of investing in the Fund and to compare those costs with the ongoing costs of investing in other mutual funds.
The Example is based on an investment of $1,000 invested at the beginning of the period and held for the entire period (November 1, 2009 to April 30, 2010).
Actual Expenses
The first line of the table below provides information about actual account values and actual expenses. You may use the information in this line, together with the amount you invested, to estimate the expenses that you paid over the period. Simply divide your account value by $1,000.00 (for example, an $8,600 account value divided by $1,000.00=8.6), then multiply the result by the number in the first line under the heading entitled “Expenses Paid During Period” to estimate the expenses you paid on your account during this period. An annual maintenance fee of $10.00 that is charged once a year may apply for certain IRA accounts. This fee is not included in the table below. If it were, the estimate of expenses you paid during the period would be higher, and your ending account value lower, by this amount.
Hypothetical Example for Comparison Purposes
The second line of the table below provides information about hypothetical account values and hypothetical expenses based on the Fund’s actual expense ratio and an assumed rate of return of 5% per year before expenses, which is not the Fund’s actual return. The hypothetical account values and expenses may not be used to estimate the actual ending account balance or expenses you paid for the period. You may use this information to compare the ongoing costs of investing in the Fund and other funds. To do so, compare this 5% hypothetical example with the 5% hypothetical examples that appear in the shareholder reports of the other funds.
Please note that the expenses shown in the table are meant to highlight your ongoing costs only and do not reflect any transactional costs such as redemption fees. Therefore, the second line of the table is useful in comparing ongoing costs only, and will not help you determine the relative total costs of owning different funds. In addition, if these transactional costs were included, your costs would have been higher.
| Century Shares Trust | ||||||||||||
Beginning Account Value November 1, 2009 | Ending Account Value April 30, 2010 | Expenses Paid During Period* Six Months Ending April 30, 2010 | ||||||||||
| Based on Actual Fund Return | ||||||||||||
| Institutional Shares | $ | 1,000.00 | $ | 1,154.70 | $ | 6.25 | ||||||
| Investor Shares | $ | 1,000.00 | $ | 1,152.90 | $ | 7.74 | ||||||
| Based on Hypothetical 5% Yearly Return before expenses | ||||||||||||
| Institutional Shares | $ | 1,000.00 | $ | 1,018.99 | $ | 5.86 | ||||||
| Investor Shares | $ | 1,000.00 | $ | 1,017.60 | $ | 7.25 | ||||||
* The Fund’s annualized expense ratios are 1.17% for Institutional Shares and 1.45% for Investor Shares. The dollar amounts shown as “Expenses Paid” are equal to the annual expense ratio multiplied by the average account value over the period, multiplied by the number of days in the most recent fiscal half-year, then divided by 365.
| Century Small Cap Select Fund | ||||||||||||
Beginning Account Value November 1, 2009 | Ending Account Value April 30, 2010 | Expenses Paid During Period* Six Months Ending April 30, 2010 | ||||||||||
| Based on Actual Fund Return | ||||||||||||
| Institutional Shares | $ | 1,000.00 | $ | 1,219.10 | $ | 6.27 | ||||||
| Investor Shares | $ | 1,000.00 | $ | 1,216.90 | $ | 8.41 | ||||||
| Based on Hypothetical 5% Yearly Return before expenses | ||||||||||||
| Institutional Shares | $ | 1,000.00 | $ | 1,019.14 | $ | 5.71 | ||||||
| Investor Shares | $ | 1,000.00 | $ | 1,017.26 | $ | 7.65 | ||||||
*The Fund’s annualized expense ratios are 1.14% for Institutional Shares and 1.53% for Investor Shares. The dollar amounts shown as “Expenses Paid” are equal to the annual expense ratio multiplied by the average account value over the period, multiplied by the number of days in the most recent fiscal half-year, then divided by 365.
CENTURY FUNDS
___________
9
PORTFOLIO OF INVESTMENTS – AS OF APRIL 30, 2010 (UNAUDITED)
| Shares | Value | ||||
| COMMON STOCK - 97.7% | |||||
| Consumer Discretionary - 14.3% | |||||
| AUTOMOBILES - 1.4% | |||||
| 203,450 Ford Motor Co.* | $ | 2,648,919 | |||
| DIVERSIFIED CONSUMER SERVICES - 1.7% | |||||
| 12,800 Strayer Education, Inc. | 3,111,936 | ||||
| HOTELS, RESTAURANTS & LEISURE - 3.1% | |||||
| 23,600 Panera Bread Co. Class A* | 1,839,384 | ||||
| 147,900 Starbucks Corp. | 3,842,442 | ||||
| 5,681,826 | |||||
| INTERNET & CATALOG RETAIL - 1.3% | |||||
| 17,050 Amazon.com, Inc.* | 2,336,873 | ||||
| MEDIA - 3.8% | |||||
| 106,100 Discovery Communications, Inc.* | 4,106,070 | ||||
| 61,550 Scripps Networks Interactive, Inc. Class A | 2,790,677 | ||||
| 6,896,747 | |||||
| SPECIALTY RETAIL - 3.0% | |||||
| 76,650 Guess?, Inc. | 3,515,936 | ||||
| 75,350 Lowe’s Cos, Inc. | 2,043,492 | ||||
| 5,559,428 | |||||
| 26,235,729 | |||||
| Consumer Staples - 5.1% | |||||
| BEVERAGES - 2.0% | |||||
| 56,350 PepsiCo, Inc. | 3,675,147 | ||||
| FOOD & STAPLES RETAILING - 2.1% | |||||
| 104,600 CVS Caremark Corp. | 3,862,878 | ||||
| FOOD PRODUCTS - 1.0% | |||||
| 71,700 ConAgra Foods, Inc. | 1,754,499 | ||||
| 9,292,524 | |||||
| Energy - 7.2% | |||||
| ENERGY EQUIPMENT & SERVICES - 3.7% | |||||
| 80,697 Helmerich & Payne, Inc. | 3,277,912 | ||||
| 48,553 Schlumberger Ltd. | 3,467,655 | ||||
| 6,745,567 | |||||
See notes to financial statements.
CENTURY FUNDS
___________
10
CENTURY SHARES TRUST (CONTINUED)
PORTFOLIO OF INVESTMENTS – AS OF APRIL 30, 2010 (UNAUDITED)
| Shares | Value | ||||
| Energy (continued) | |||||
| OIL, GAS & CONSUMABLE FUELS - 3.5% | |||||
| 30,234 Apache Corp. | $ | 3,076,612 | |||
| 75,350 CONSOL Energy, Inc. | 3,366,638 | ||||
| 6,443,250 | |||||
| 13,188,817 | |||||
| Financials - 5.9% | |||||
| CAPITAL MARKETS - 2.8% | |||||
| 158,650 Och-Ziff Capital Management Group LLC | 2,779,548 | ||||
| 15,650 The Goldman Sachs Group, Inc. | 2,272,380 | ||||
| 5,051,928 | |||||
| DIVERSIFIED FINANCIAL SERVICES - 2.2% | |||||
| 95,250 JPMorgan Chase & Co. | 4,055,745 | ||||
| INSURANCE - 0.9% | |||||
| 15 Berkshire Hathaway, Inc. Class A* | 1,729,875 | ||||
| 10,837,548 | |||||
| Health Care - 14.0% | |||||
| BIOTECHNOLOGY - 1.2% | |||||
| 37,750 Alexion Pharmaceuticals, Inc.* | 2,071,720 | ||||
| HEALTH CARE EQUIPMENT & SUPPLIES - 3.7% | |||||
| 66,750 St Jude Medical, Inc.* | 2,724,735 | ||||
| 66,500 Zimmer Holdings, Inc.* | 4,050,515 | ||||
| 6,775,250 | |||||
| HEALTH CARE PROVIDERS & SERVICES - 7.4% | |||||
| 193,750 AmerisourceBergen Corp. | 5,977,187 | ||||
| 75,500 Express Scripts, Inc.* | 7,559,815 | ||||
| 13,537,002 | |||||
| LIFE SCIENCES TOOLS & SERVICES - 1.7% | |||||
| 43,850 Waters Corp.* | 3,156,762 | ||||
| 25,540,734 | |||||
| Industrials - 11.9% | |||||
| AEROSPACE & DEFENSE - 2.1% | |||||
| 57,600 Rockwell Collins, Inc. | 3,744,000 | ||||
| AIR FREIGHT & LOGISTICS - 1.9% | |||||
| 38,950 FedEx Corp. | 3,505,889 | ||||
See notes to financial statements.
CENTURY FUNDS
___________
11
CENTURY SHARES TRUST (CONTINUED)
PORTFOLIO OF INVESTMENTS – AS OF APRIL 30, 2010 (UNAUDITED)
| Shares | Value | ||||
| Industrials (continued) | |||||
| INDUSTRIAL CONGLOMERATES - 1.0% | |||||
| 21,350 3M Co. | $ | 1,893,105 | |||
| MACHINERY - 3.2% | |||||
| 63,450 Deere & Co. | 3,795,579 | ||||
| 38,450 Illinois Tool Works, Inc. | 1,964,795 | ||||
| 5,760,374 | |||||
| ROAD & RAIL - 1.1% | |||||
| 36,050 CSX Corp. | 2,020,603 | ||||
| TRADING COMPANIES & DISTRIBUTORS - 2.6% | |||||
| 88,150 Fastenal Co. | 4,820,923 | ||||
| 21,744,894 | |||||
| Information Technology - 31.7% | |||||
| COMMUNICATIONS EQUIPMENT - 4.9% | |||||
| 265,200 Cisco Systems, Inc.* | 7,139,184 | ||||
| 48,250 QUALCOMM, Inc. | 1,869,205 | ||||
| 9,008,389 | |||||
| COMPUTERS & PERIPHERALS - 6.1% | |||||
| 27,650 Apple, Inc.* | 7,219,968 | ||||
| 206,350 EMC Corp.* | 3,922,713 | ||||
| 11,142,681 | |||||
| INTERNET SOFTWARE & SERVICES - 3.0% | |||||
| 10,500 Google, Inc. Class A* | 5,517,120 | ||||
| IT SERVICES - 6.1% | |||||
| 105,250 Accenture PLC | 4,593,110 | ||||
| 21,450 International Business Machines Corp. | 2,767,050 | ||||
| 15,550 MasterCard, Inc. Class A | 3,857,022 | ||||
| 11,217,182 | |||||
| SEMICONDUCTORS & SEMICONDUCTOR EQUIPMENT - 4.1% | |||||
| 165,300 Intel Corp. | 3,773,799 | ||||
| 146,200 Xilinx, Inc. | 3,769,036 | ||||
| 7,542,835 | |||||
See notes to financial statements.
CENTURY FUNDS
___________
12
CENTURY SHARES TRUST (CONTINUED)
PORTFOLIO OF INVESTMENTS – AS OF APRIL 30, 2010 (UNAUDITED)
| Shares | Value | ||||
| Information Technology (continued) | |||||
| SOFTWARE - 7.5% | |||||
| 196,890 Microsoft Corp. | $ | 6,013,021 | |||
| 296,950 Oracle Corp. | 7,673,188 | ||||
| 13,686,209 | |||||
| 58,114,416 | |||||
| Materials - 4.5% | |||||
| CHEMICALS - 2.8% | |||||
| 24,416 Air Products & Chemicals, Inc. | 1,874,660 | ||||
| 28,900 Potash Corp. of Saskatchewan, Inc. | 3,193,450 | ||||
| 5,068,110 | |||||
| METALS & MINING - 1.7% | |||||
| 61,400 Rio Tinto PLC ADR | 3,122,804 | ||||
| 8,190,914 | |||||
| Telecommunication Services - 3.1% | |||||
| WIRELESS TELECOMMUNICATION SERVICES - 3.1% | |||||
| 132,650 NII Holdings, Inc.* | 5,627,013 | ||||
Total Investment in Common Stocks - 97.7% (Identified cost, $133,990,226) | |||||
| 178,772,589 | |||||
| SHORT-TERM INVESTMENT - 2.4% | |||||
| 4,459,900 State Street Institutional Government Money Market Fund (Identified cost, $4,459,900) | 4,459,900 | ||||
| Total Investments - 100.1% | |||||
| (Identified cost, $138,450,126) | 183,232,489 | ||||
| Cash and Receivables Less Liabilities - (0.1)% | |||||
| Liabilities in Excess of Other Assets | (159,399 | ) | |||
| Net Assets - 100% | $ | 183,073,090 | |||
* Non-income producing security
ADR American Depositary Receipt
See notes to financial statements.
CENTURY FUNDS
___________
13
CENTURY SMALL CAP SELECT FUND
PORTFOLIO OF INVESTMENTS – AS OF APRIL 30, 2010 (UNAUDITED)
| Shares | Value | ||||
| COMMON STOCK - 98.7% | |||||
| Consumer Discretionary - 17.2% | |||||
| DISTRIBUTORS - 2.0% | |||||
| 317,400 LKQ Corp.* | $ | 6,684,444 | |||
| DIVERSIFIED CONSUMER SERVICES - 2.4% | |||||
| 91,300 Capella Education Co.* | 8,273,606 | ||||
| HOTELS, RESTAURANTS & LEISURE - 1.9% | |||||
| 84,650 Panera Bread Co. Class A* | 6,597,621 | ||||
| SPECIALTY RETAIL - 8.4% | |||||
| 164,000 DSW, Inc. Class A* | 4,952,800 | ||||
| 293,500 Lumber Liquidators Holdings, Inc.* | 8,940,010 | ||||
| 204,350 Monro Muffler Brake, Inc. | 7,327,991 | ||||
| 252,150 Williams-Sonoma, Inc. | 7,261,920 | ||||
| 28,482,721 | |||||
| TEXTILES, APPAREL & LUXURY GOODS - 2.5% | |||||
| 294,000 G-III Apparel Group Ltd.* | 8,408,400 | ||||
| 58,446,792 | |||||
| Consumer Staples - 2.1% | |||||
| FOOD & STAPLES RETAILING - 2.1% | |||||
| 188,750 BJ’s Wholesale Club, Inc.* | 7,225,350 | ||||
| Energy - 4.5% | |||||
| ENERGY EQUIPMENT & SERVICES - 4.5% | |||||
| 71,250 Core Laboratories NV | 10,679,662 | ||||
| 79,750 Dril-Quip, Inc.* | 4,619,918 | ||||
| 15,299,580 | |||||
| Financials - 6.9% | |||||
| CAPITAL MARKETS - 2.3% | |||||
| 292,900 Cohen & Steers, Inc. | 7,928,803 | ||||
| COMMERCIAL BANKS - 4.6% | |||||
| 244,550 Signature Bank* | 9,874,929 | ||||
| 153,550 Wintrust Financial Corp. | 5,727,415 | ||||
| 15,602,344 | |||||
| 23,531,147 | |||||
See notes to financial statements.
CENTURY FUNDS
___________
14
CENTURY SMALL CAP SELECT FUND (CONTINUED)
PORTFOLIO OF INVESTMENTS – AS OF APRIL 30, 2010 (UNAUDITED)
| Shares | Value | ||||
| Health Care - 20.7% | |||||
| HEALTH CARE EQUIPMENT & SUPPLIES - 3.3% | |||||
| 140,300 Masimo Corp. | $ | 3,284,423 | |||
| 622,600 NxStage Medical, Inc.* | 7,919,472 | ||||
| 11,203,895 | |||||
| HEALTH CARE PROVIDERS & SERVICES - 7.6% | |||||
| 257,750 Bio-Reference Labs, Inc.* | 6,031,350 | ||||
| 391,350 Brookdale Senior Living, Inc.* | 8,414,025 | ||||
| 210,300 IPC The Hospitalist Co., Inc.* | 6,527,712 | ||||
| 105,450 Lincare Holdings, Inc.* | 4,923,460 | ||||
| 25,896,547 | |||||
| HEALTH CARE TECHNOLOGY - 3.9% | |||||
| 122,550 Quality Systems, Inc. | 7,844,425 | ||||
| 78,100 SXC Health Solutions Corp.* | 5,443,570 | ||||
| 13,287,995 | |||||
| LIFE SCIENCES TOOLS & SERVICES - 3.8% | |||||
| 837,950 Bruker Corp.* | 12,812,256 | ||||
| PHARMACEUTICALS - 2.1% | |||||
| 255,050 Par Pharmaceutical Cos, Inc.* | 6,922,057 | ||||
| 70,122,750 | |||||
| Industrials - 18.0% | |||||
| AIR FREIGHT & LOGISTICS - 4.0% | |||||
| 117,950 Atlas Air Worldwide Holdings, Inc.* | 6,519,096 | ||||
| 216,300 Hub Group, Inc. Class A* | 6,923,763 | ||||
| 13,442,859 | |||||
| AIRLINES - 1.5% | |||||
| 99,400 Allegiant Travel Co.* | 5,112,142 | ||||
| COMMERCIAL SERVICES & SUPPLIES - 2.9% | |||||
| 363,059 Cornell Companies, Inc.* | 9,984,123 | ||||
| ELECTRICAL EQUIPMENT - 5.4% | |||||
| 208,200 II-VI, Inc.* | 7,466,052 | ||||
| 190,700 Polypore International, Inc.* | 3,377,297 | ||||
| 239,000 Woodward Governor Co. | 7,659,950 | ||||
| 18,503,299 | |||||
| PROFESSIONAL SERVICES - 1.8% | |||||
| 432,150 Kforce, Inc.* | 6,002,564 | ||||
See notes to financial statements.
CENTURY FUNDS
___________
15
CENTURY SMALL CAP SELECT FUND (CONTINUED)
PORTFOLIO OF INVESTMENTS – AS OF APRIL 30, 2010 (UNAUDITED)
| Shares | Value | ||||
| Industrials (continued) | |||||
| TRADING COMPANIES & DISTRIBUTORS - 2.4% | |||||
| 263,750 Applied Industrial Technologies, Inc. | $ | 8,118,225 | |||
| 61,163,212 | |||||
| Information Technology - 24.8% | |||||
| COMMUNICATIONS EQUIPMENT - 3.2% | |||||
| 93,900 Acme Packet, Inc.* | 2,454,546 | ||||
| 96,600 DG FastChannel, Inc.* | 3,398,388 | ||||
| 266,850 Tekelec* | 4,837,991 | ||||
| 10,690,925 | |||||
| INTERNET SOFTWARE & SERVICES - 5.1% | |||||
| 352,450 Internet Brands, Inc. Class A* | 3,647,857 | ||||
| 417,650 j2 Global Communications, Inc.* | 10,057,012 | ||||
| 445,950 LivePerson, Inc.* | 3,683,547 | ||||
| 17,388,416 | |||||
| IT SERVICES - 1.1% | |||||
| 793,200 Online Resources Corp.* | 3,696,312 | ||||
| SEMICONDUCTORS & SEMICONDUCTOR EQUIPMENT - 4.4% | |||||
| 165,100 Hittite Microwave Corp.* | 8,466,328 | ||||
| 85,300 Power Integrations, Inc. | 3,282,344 | ||||
| 68,550 Silicon Laboratories, Inc.* | 3,314,392 | ||||
| 15,063,064 | |||||
| SOFTWARE - 11.0% | |||||
| 285,550 Commvault Systems, Inc.* | 5,982,272 | ||||
| 246,700 Informatica Corp.* | 6,169,967 | ||||
| 251,550 MICROS Systems, Inc.* | 9,347,598 | ||||
| 161,850 Pegasystems, Inc. | 5,125,790 | ||||
| 248,250 Sourcefire, Inc.* | 5,553,352 | ||||
| 224,850 Websense, Inc.* | 5,119,835 | ||||
| 37,298,814 | |||||
| 84,137,531 | |||||
| Materials - 4.5% | |||||
| CHEMICALS - 2.0% | |||||
| 256,350 Balchem Corp. | 6,649,719 | ||||
| CONTAINERS & PACKAGING - 0.3% | |||||
| 15,300 Greif, Inc. Class A | 905,454 | ||||
See notes to financial statements.
CENTURY FUNDS
___________
16
CENTURY SMALL CAP SELECT FUND (CONTINUED)
PORTFOLIO OF INVESTMENTS – AS OF APRIL 30, 2010 (UNAUDITED)
| Shares | Value | ||||
| Materials (continued) | |||||
| METALS & MINING - 2.2% | |||||
| 141,900 Schnitzer Steel Industries, Inc. Class A | $ | 7,662,600 | |||
| 15,217,773 | |||||
| Total Investment in Common Stocks - 98.7% | |||||
| (Identified cost, $252,299,237) | 335,144,135 | ||||
| SHORT-TERM INVESTMENT - 2.0% | |||||
| 6,955,538 State Street Institutional | |||||
Government Money Market Fund (Identified cost, $6,955,538) | 6,955,538 | ||||
| Total Investments - 100.7% | |||||
| (Identified cost, $259,254,775) | 342,099,673 | ||||
| Cash and Receivables Less Liabilities - (0.7)% | |||||
| Liabilities in Excess of Other Assets | (2,454,375 | ) | |||
| Net Assets - 100% | $ | 339,645,298 | |||
* Non-income producing security
See notes to financial statements.
CENTURY FUNDS
___________
17
Century Shares Trust | Century Small Cap Select Fund | |||||||
| Assets: | ||||||||
| Investments, at value (Note 1A) (Identified cost of $138,450,126 and $259,254,775, respectively) | $ | 183,232,489 | $ | 342,099,673 | ||||
| Dividends and interest receivable | 111,793 | 41,416 | ||||||
| Receivable for investments sold | — | 6,061,542 | ||||||
| Receivable for Fund shares sold | 1,249 | 395,975 | ||||||
| Receivable for dividend reclaims | 7,604 | — | ||||||
| Prepaid expenses | 12,171 | 20,658 | ||||||
| Total Assets | 183,365,306 | 348,619,264 | ||||||
| Liabilities: | ||||||||
| Payable to Affiliates: | ||||||||
| Investment adviser fee (Note 4) | 120,492 | 267,095 | ||||||
| Administration fee (Note 5) | 15,159 | 2,500 | ||||||
| Distribution and service fees (Note 6) | 1,687 | 18,112 | ||||||
| Accrued expenses and other liabilities | 107,934 | 152,907 | ||||||
| Payable for investments purchased | 111 | 7,993,784 | ||||||
| Payable for Fund shares repurchased | 46,833 | 539,568 | ||||||
| Total Liabilities | 292,216 | 8,973,966 | ||||||
| Net Assets | $ | 183,073,090 | $ | 339,645,298 | ||||
| At April 30, 2010, net assets consisted of: | ||||||||
| Paid-in capital | $ | 136,570,901 | $ | 434,268,447 | ||||
| Distributions in excess of net investment income | (219,427 | ) | (458,922 | ) | ||||
| Accumulated undistributed net realized gains/(losses) on investments | 1,939,253 | (177,009,125 | ) | |||||
| Unrealized appreciation in value of investments | 44,782,363 | 82,844,898 | ||||||
| Net assets applicable to outstanding capital stock | $ | 183,073,090 | $ | 339,645,298 | ||||
| Net Assets consist of: | ||||||||
| Institutional Shares | $ | 181,426,175 | $ | 244,936,350 | ||||
| Investor Shares | $ | 1,646,915 | $ | 94,708,948 | ||||
| Shares Outstanding consist of (Note 2): | ||||||||
| Institutional Shares | 9,331,533 | 12,301,903 | ||||||
| Investor Shares | 84,663 | 4,865,944 | ||||||
| Net Asset Value Per Share | ||||||||
| (Represents both the offering and redemption price*) | ||||||||
| Institutional Shares | $ | 19.44 | $ | 19.91 | ||||
| Investor Shares | $ | 19.45 | $ | 19.46 | ||||
| * | In general, shares of the Funds may be redeemed at net asset value. However, upon the redemption of shares held less than 90 days, a redemption fee of 1% of the current net asset value of the shares may be assessed and retained by each share class of each Fund for the benefit of their respective remaining shareholders. The redemption fee is accounted for as an addition to paid-in-capital. |
See notes to financial statements.
CENTURY FUNDS
___________
18
Century Shares Trust | Century Small Cap Select Fund | |||||||
| Investment Income: | ||||||||
| Dividends (net of foreign withholding tax of $785 and $2,983, respectively) | $ | 859,379 | $ | 1,243,465 | ||||
| Interest | 220 | 569 | ||||||
| Other Income | — | 272,117 | ||||||
| Total investment income | 859,599 | 1,516,151 | ||||||
| Expenses: | ||||||||
| Investment adviser fee (Note 4/Note 7) | 702,964 | 1,494,481 | ||||||
| Non-interested trustees’ remuneration | 46,061 | 79,437 | ||||||
| Transfer agent | ||||||||
| Institutional Shares | 65,876 | 34,036 | ||||||
| Investor Shares | 5,430 | 98,225 | ||||||
| Custodian | 26,335 | 37,086 | ||||||
| Administration fees (Note 5) | 88,176 | 2,500 | ||||||
| Insurance | 8,719 | 17,324 | ||||||
| Professional fees | 35,429 | 46,336 | ||||||
| Registration | 14,368 | 24,038 | ||||||
| Distribution and service fees (Note 6) | 1,418 | 92,047 | ||||||
| Printing and other expenses | 41,959 | 49,563 | ||||||
| Total expenses | 1,036,735 | 1,975,073 | ||||||
| Adviser reimbursement (Note 7) | (4,769 | ) | — | |||||
| Net expenses | 1,031,966 | 1,975,073 | ||||||
| Net investment loss | (172,367 | ) | (458,922 | ) | ||||
| Realized and unrealized gain/(loss) on investments: | ||||||||
| Net realized gain from investment transactions | 14,300,468 | 21,460,839 | ||||||
| Increase in unrealized appreciation on investments | 11,359,122 | 42,559,648 | ||||||
| Net realized and unrealized gain on investments | 25,659,590 | 64,020,487 | ||||||
| Net increase in net assets resulting from operations | $ | 25,487,223 | $ | 63,561,565 | ||||
See notes to financial statements.
CENTURY FUNDS
___________
19
Century Shares Trust | Century Small Cap Select Fund | |||||||||||||||
INCREASE (DECREASE) IN NET ASSETS: | Six Months Ended April 30, 2010 (Unaudited) | Year Ended October 31, 2009 | Six Months Ended April 30, 2010 (Unaudited) | Year Ended October 31, 2009 | ||||||||||||
| Operations: | ||||||||||||||||
| Net investment income/(loss) | $ | (172,367 | ) | $ | 38,240 | $ | (458,922 | ) | $ | (602,965 | ) | |||||
| Net realized gain/(loss) on investment transactions | 14,300,468 | (9,196,030 | ) | 21,460,839 | (89,355,285 | ) | ||||||||||
| Change in net unrealized appreciation | 11,359,122 | 21,964,091 | 42,559,648 | 121,153,665 | ||||||||||||
| Net increase in net assets resulting from operations | 25,487,223 | 12,806,301 | 63,561,565 | 31,195,415 | ||||||||||||
| Distributions to shareholders from: | ||||||||||||||||
| Net investment income Institutional Shares | (47,060 | ) | (321,578 | ) | — | — | ||||||||||
| Capital share transactions - net (Note 2) | (9,992,137 | ) | (13,680,291 | ) | (32,022,041 | ) | (88,146,797 | ) | ||||||||
| Redemption fees | 14 | 553 | 1,556 | 10,751 | ||||||||||||
| Total increase/(decrease) | 15,448,040 | (1,195,015 | ) | 31,541,080 | (56,940,631 | ) | ||||||||||
| Net Assets: | ||||||||||||||||
| Beginning of period | 167,625,050 | 168,820,065 | 308,104,218 | 365,044,849 | ||||||||||||
| End of period | $ | 183,073,090 | $ | 167,625,050 | $ | 339,645,298 | $ | 308,104,218 | ||||||||
| Distributions in excess of net investment income | $ | (219,427 | ) | $ | — | $ | (458,922 | ) | $ | — | ||||||
See notes to financial statements.
CENTURY FUNDS
___________
20
| Century Shares Trust | Six Months Ended April 30, 2010 | Year Ended October 31, | ||||||||||||||||||||||
| Institutional Shares | (Unaudited) | 2009 | 2008 | 2007 | 2006 | 2005 | ||||||||||||||||||
| Net Asset Value, beginning of period | $ | 16.84 | $ | 15.51 | $ | 29.52 | $ | 35.69 | $ | 35.40 | $ | 35.62 | ||||||||||||
| Income/(loss) from Investment Operations: | ||||||||||||||||||||||||
Net investment income/(loss) (a) | (0.02 | ) | 0.00 | † | (0.01 | ) | 0.16 | 0.10 | 0.19 | |||||||||||||||
| Net realized and unrealized gain/(loss) on investments | 2.62 | 1.36 | (7.44 | ) | 2.95 | 3.31 | 3.54 | |||||||||||||||||
| Total income/(loss) from investment operations | 2.60 | 1.36 | (7.45 | ) | 3.11 | 3.41 | 3.73 | |||||||||||||||||
| Less Distributions From: | ||||||||||||||||||||||||
| Net investment income | (0.00 | )† | (0.03 | ) | (0.30 | ) | (0.43 | ) | (0.77 | ) | (0.32 | ) | ||||||||||||
| Net realized gain on investment transactions | (0.00 | ) | 0.00 | (6.26 | ) | (8.85 | ) | (2.35 | ) | (3.63 | ) | |||||||||||||
| Total distributions | (0.00 | ) | (0.03 | ) | (6.56 | ) | (9.28 | ) | (3.12 | ) | (3.95 | ) | ||||||||||||
| Redemption fees | 0.00 | † | 0.00 | † | 0.00 | † | 0.00 | † | 0.00 | † | 0.00 | † | ||||||||||||
| Net Asset Value, end of period | $ | 19.44 | $ | 16.84 | $ | 15.51 | $ | 29.52 | $ | 35.69 | $ | 35.40 | ||||||||||||
| Total Return | 15.47 | %** | 8.59 | % | (32.31 | )% | 11.86 | % | 10.17 | % | 11.18 | % | ||||||||||||
| Ratios and supplemental data | ||||||||||||||||||||||||
| Net assets, end of period (000 omitted) | $ | 181,426 | $ | 166,574 | $ | 168,199 | $ | 287,670 | $ | 305,172 | $ | 323,643 | ||||||||||||
| Ratio of expenses to average net assets | 1.17 | %* | 1.20 | % | 1.17 | % | 1.10 | % | 1.11 | % | 1.12 | % | ||||||||||||
| Ratio of net investment income/(loss)to average net assets | (0.19 | )%* | 0.03 | % | (0.02 | )% | 0.56 | % | 0.29 | % | 0.55 | % | ||||||||||||
| Portfolio Turnover Rate | 36 | %** | 79 | % | 91 | % | 38 | % | 48 | % | 19 | % | ||||||||||||
| (a) | Calculated based on average shares outstanding during the period. |
| † | Amount represents less than $0.005 per share. |
| ** | Not annualized |
| * | Annualized |
See notes to financial statements.
CENTURY FUNDS
___________
21
FINANCIAL HIGHLIGHTS
| Century Shares Trust | Six Months Ended April 30, 2010 | Year Ended October 31, | Period Ended October 31, | |||||||||||||||||||||
| Investor Shares | (Unaudited) | 2009 | 2008 | 2007 | 2006 | 2005(a) | ||||||||||||||||||
| Net Asset Value, beginning of period | $ | 16.87 | $ | 15.54 | $ | 29.46 | $ | 35.41 | $ | 35.35 | $ | 35.00 | ||||||||||||
| Income/(loss) from Investment Operations: | ||||||||||||||||||||||||
Net investment income/(loss) (b) | (0.04 | ) | (0.03 | ) | (0.06 | ) | 0.01 | (0.19 | ) | (0.03 | ) | |||||||||||||
| Net realized and unrealized gain/(loss)on investments | 2.62 | 1.36 | (7.47 | ) | 2.96 | 3.27 | 0.29 | |||||||||||||||||
| Total income/(loss) from investment operations | 2.58 | 1.33 | (7.53 | ) | 2.97 | 3.08 | 0.26 | |||||||||||||||||
| Less Distributions From: | ||||||||||||||||||||||||
| Net investment income | (0.00 | ) | (0.00 | ) | (0.13 | ) | (0.07 | ) | (0.68 | ) | (0.00 | ) | ||||||||||||
| Net realized gain on investment transactions | (0.00 | ) | (0.00 | ) | (6.26 | ) | (8.85 | ) | (2.35 | ) | (0.00 | ) | ||||||||||||
| Total distributions | (0.00 | ) | (0.00 | ) | (6.39 | ) | (8.92 | ) | (3.03 | ) | (0.00 | ) | ||||||||||||
| Redemption fees | 0.00 | † | 0.00 | † | 0.00 | † | 0.00 | † | 0.01 | 0.09 | ||||||||||||||
| Net Asset Value, end of period | $ | 19.45 | $ | 16.87 | $ | 15.54 | $ | 29.46 | $ | 35.41 | $ | 35.35 | ||||||||||||
| Total Return | 15.29 | %** | 8.35 | % | (32.45 | )% | 11.38 | % | 9.18 | % | 1.00 | %** | ||||||||||||
| Ratios and supplemental data | ||||||||||||||||||||||||
| Net assets, end of period (000 omitted) | $ | 1,647 | $ | 1,051 | $ | 621 | $ | 1,006 | $ | 1,844 | $ | 1,139 | ||||||||||||
| Ratio of expenses to average net assets | 1.45 | %* | 1.45 | % | 1.45 | % | 1.56 | % | 2.00 | % | 1.20 | %* | ||||||||||||
| Ratio of expenses to average net assets without giving effect to contractual expense agreement | 2.27 | %* | 2.64 | % | 1.61 | % | 1.95 | % | 2.15 | % | 1.35 | %* | ||||||||||||
| Ratio of net investment income/(loss) to average net assets | (0.49 | )%* | (0.22 | )% | (0.31 | )% | 0.05 | % | (0.58 | )% | (0.36 | )%* | ||||||||||||
| Portfolio turnover rate | 36 | %** | 79 | % | 91 | % | 38 | % | 48 | % | 19 | %(c) | ||||||||||||
| (a) | From the commencement date of investment operations, July 18, 2005 to October 31, 2005. |
| (b) | Calculated based on average shares outstanding during the period. |
| (c) | For the one year period ended October 31, 2005. |
| † | Amount represents less than $0.005 per share. |
| ** | Not annualized |
| * | Annualized |
See notes to financial statements.
CENTURY FUNDS
___________
22
FINANCIAL HIGHLIGHTS
| Century Small Cap Select Fund | Six Months Ended April 30, 2010 | Year Ended October 31, | ||||||||||||||||||||||
| Institutional Shares | (Unaudited) | 2009 | 2008 | 2007 | 2006 | 2005 | ||||||||||||||||||
| Net Asset Value, beginning of period | $ | 16.34 | $ | 14.62 | $ | 26.13 | $ | 25.74 | $ | 24.15 | $ | 22.46 | ||||||||||||
| Income/(loss) from Investment Operations: | ||||||||||||||||||||||||
Net investment income/(loss) (a) | (0.02 | ) | (0.01 | ) | (0.12 | ) | 0.00 | † | 0.06 | 0.03 | ||||||||||||||
| Net realized and unrealized gain/(loss) on investments | 3.59 | 1.73 | (9.00 | ) | 2.75 | 1.90 | 2.22 | |||||||||||||||||
| Total income/(loss) from investment operations | 3.57 | 1.72 | (9.12 | ) | 2.75 | 1.96 | 2.25 | |||||||||||||||||
| Less Distributions From: | ||||||||||||||||||||||||
| Net investment income | (0.00 | ) | (0.00 | ) | (0.10 | ) | (0.35 | ) | (0.09 | ) | (0.00 | ) | ||||||||||||
| Net realized gain on investment transactions | (0.00 | ) | (0.00 | ) | (2.10 | ) | (2.01 | ) | (0.28 | ) | (0.56 | ) | ||||||||||||
| Tax return of capital | (0.00 | ) | (0.00 | ) | (0.19 | ) | (0.00 | ) | (0.00 | ) | (0.00 | ) | ||||||||||||
| Total distributions | (0.00 | ) | (0.00 | ) | (2.39 | ) | (2.36 | ) | (0.37 | ) | (0.56 | ) | ||||||||||||
| Redemption fees | 0.00 | † | 0.00 | † | 0.00 | † | 0.00 | † | 0.00 | † | 0.00 | † | ||||||||||||
| Net Asset Value, end of period | $ | 19.91 | $ | 16.34 | $ | 14.62 | $ | 26.13 | $ | 25.74 | $ | 24.15 | ||||||||||||
| Total Return | 21.91 | %** | 11.69 | % | (38.24 | % ) | 11.61 | % | 8.21 | % | 10.19 | % | ||||||||||||
| Ratios and supplemental data | ||||||||||||||||||||||||
| Net assets, end of period (000 omitted) | $ | 244,936 | $ | 216,295 | $ | 262,793 | $ | 575,027 | $ | 540,697 | $ | 585,723 | ||||||||||||
| Ratio of expenses to average net assets | 1.14 | %* | 1.14 | % | 1.11 | % | 1.08 | % | 1.07 | % | 1.06 | % | ||||||||||||
| Ratio of net investment income/(loss) to average net assets | (0.18 | )%* | (0.08 | )% | (0.57 | )% | 0.02 | % | 0.25 | % | 0.13 | % | ||||||||||||
| Portfolio Turnover Rate | 53 | %** | 133 | % | 104 | % | 100 | % | 127 | % | 96 | % | ||||||||||||
| (a) | Calculated based on average shares outstanding during the period. |
| † | Amount represents less than $0.005 per share. |
| ** | Not annualized |
| * | Annualized |
See notes to financial statements.
CENTURY FUNDS
___________
23
FINANCIAL HIGHLIGHTS
| Century Small Cap Select Fund | Six Months Ended April 30, 2010 | Year Ended October 31, | ||||||||||||||||||||||
| Investor Shares | (Unaudited) | 2009 | 2008 | 2007 | 2006 | 2005 | ||||||||||||||||||
| Net Asset Value, beginning of period | $ | 16.00 | $ | 14.37 | $ | 25.72 | $ | 25.40 | $ | 23.86 | $ | 22.26 | ||||||||||||
| Income/(loss) from Investment Operations: | ||||||||||||||||||||||||
Net investment loss (a) | (0.05 | ) | (0.07 | ) | (0.20 | ) | (0.06 | ) | (0.02 | ) | (0.04 | ) | ||||||||||||
| Net realized and unrealized gain/(loss) on investments | 3.51 | 1.70 | (8.86 | ) | 2.71 | 1.86 | 2.20 | |||||||||||||||||
| Total income/(loss) from investment operations | 3.46 | 1.63 | (9.06 | ) | 2.65 | 1.84 | 2.16 | |||||||||||||||||
| Less Distributions From: | ||||||||||||||||||||||||
| Net investment income | (0.00 | ) | (0.00 | ) | (0.00 | ) | (0.32 | ) | (0.03 | ) | (0.00 | ) | ||||||||||||
| Net realized gain on investment transactions | (0.00 | ) | (0.00 | ) | (2.10 | ) | (2.01 | ) | (0.28 | ) | (0.56 | ) | ||||||||||||
| Tax return of capital | (0.00 | ) | (0.00 | ) | (0.19 | ) | (0.00 | ) | (0.00 | ) | (0.00 | ) | ||||||||||||
| Total distributions | (0.00 | ) | (0.00 | ) | (2.29 | ) | (2.33 | ) | (0.31 | ) | (0.56 | ) | ||||||||||||
| Redemption fees | 0.00 | † | 0.00 | † | 0.00 | † | 0.00 | † | 0.01 | 0.00 | † | |||||||||||||
| Net Asset Value, end of period | $ | 19.46 | $ | 16.00 | $ | 14.37 | $ | 25.72 | $ | 25.40 | $ | 23.86 | ||||||||||||
| Total Return | 21.69 | %** | 11.27 | % | (38.49 | )% | 11.34 | % | 7.83 | % | 9.87 | % | ||||||||||||
| Ratios and supplemental data | ||||||||||||||||||||||||
| Net assets, end of period (000 omitted) | $ | 94,709 | $ | 91,809 | $ | 102,252 | $ | 257,750 | $ | 353,581 | $ | 407,048 | ||||||||||||
| Ratio of expenses to average net assets | 1.53 | %* | 1.53 | % | 1.50 | % | 1.36 | % | 1.45 | % | 1.35 | % | ||||||||||||
| Ratio of net investment loss to average net assets | (0.57 | )%* | (0.47 | )% | (0.96 | )% | (0.24 | )% | (0.09 | )% | (0.17 | )% | ||||||||||||
| Portfolio turnover rate | 53 | %** | 133 | % | 104 | % | 100 | % | 127 | % | 96 | % | ||||||||||||
(a) Calculated based on average shares outstanding during the period.
† Amount represents less than $0.005 per share.
** Not annualized
* Annualized
See notes to financial statements.
CENTURY FUNDS
___________
24
(1) SIGNIFICANT ACCOUNTING POLICIES – Century Capital Management Trust (the “Trust”) is registered under the Investment Company Act of 1940 (“1940 Act”), as amended, as an open-end management investment company organized as a Massachusetts business trust. Century Shares Trust and Century Small Cap Select Fund (each a “Fund” and, collectively, the “Funds”) are diversified series of the Trust. The following is a summary of significant accounting policies consistently followed by both Funds in the preparation of their financial statements. The policies are in conformity with accounting principles generally accepted in the United States of America (“generally accepted accounting policies”).
A. Security Valuations –– Equity securities are valued at the last reported sale price or official closing price on the primary exchange or market on which they are traded, as reported by an independent pricing service. If no sale price or official closing price is reported, market value is generally determined based on quotes or closing prices obtained from a quotation reporting system, established market maker, or reputable pricing service. For unlisted securities and for exchange-listed securities for which there are no reported sales or official closing prices, fair value is generally determined using closing bid prices. Short-term obligations, maturing in 60 days or less, are valued at amortized cost, which approximates fair value. Investments in open-end mutual funds are valued at their closing net asset value each business day.
Fair value is defined as the price that the Funds would receive to sell an investment or pay to transfer a liability in an orderly transaction with an independent buyer in the principal market, or in the absence of a principal market the most advantageous market for the investment or liability. The hierarchy of inputs that are used in determining the fair value of the Funds’ investments is summarized below.
• Level 1 – quoted prices in active markets for identical investments
| • | Level 2 – significant other observable inputs (including quoted prices for similar investments, interest rates, prepayment speeds, credit risk, etc.) |
| • | Level 3 – significant unobservable inputs (including the Fund’s own assumptions in determining the fair value of investments) |
The inputs or methodology used for valuing securities are not necessarily an indication of the risk associated with investing in those securities.
The following is a summary of the inputs used as of April 30, 2010 in valuing the Funds’ investments carried at fair value:
Quoted Prices In Active Market for Identical Assets (Level 1) | Significant Other Observable Inputs (Level 2) | Significant Unobservable Inputs (Level 3) | Total | |||||||||||||
| Century Shares Trust | ||||||||||||||||
| Common Stock* | $ | 178,772,589 | $ | — | $ | — | $ | 178,772,589 | ||||||||
| Money Market Funds | 4,459,900 | — | — | 4,459,900 | ||||||||||||
| Total Investments | $ | 183,232,489 | $ | — | $ | — | $ | 183,232,489 | ||||||||
| Century Small Cap Select Fund | ||||||||||||||||
| Common Stock* | $ | 335,144,135 | $ | — | $ | — | $ | 335,144,135 | ||||||||
| Money Market Funds | 6,955,538 | — | — | 6,955,538 | ||||||||||||
| Total Investments | $ | 342,099,673 | $ | — | $ | — | $ | 342,099,673 | ||||||||
| * | At April 30, 2010, the Funds held investments in common stocks classified as Level 1, with corresponding major categories as shown on each Fund’s Portfolio of Investments. |
CENTURY FUNDS
___________
25
B. Security Transactions –– Security transactions are recorded on a trade date basis. Gain or loss on sales is determined by the use of a specific identification method, for both financial reporting and federal income tax purposes. Dividend income is recorded on the ex-dividend date. Payments received from certain investments held by the Funds may be comprised of dividends, capital gains and return of capital. The Funds originally estimate the expected classification of such payments. The amounts may subsequently be reclassified upon receipt of information from the issuer. The Funds may invest in equity securities issued or guaranteed by companies organized and based in countries outside of the United States. These securities may be traded on foreign securities exchanges or in foreign over-the-counter markets. Foreign dividend income is recorded on ex-dividend date or as soon as practicable after the Fund determines the existence of a dividend declaration after exercising reasonable due diligence. Foreign income and capital gain on some foreign securities may be subject to foreign withholding taxes, which are accrued as applicable. Interest income is recorded daily on an accrual basis.
C. Use of Estimates –– The preparation of these financial statements in accordance with generally accepted accounting principles incorporates estimates made by management in determining the reported amounts of assets, liabilities, income and expenses of the Funds. Actual results could differ from those estimates.
D. Risks and Uncertainty — Century Small Cap Select Fund concentrates its investments in certain industries detailed in the Portfolio of Investments, which subjects the Fund to the risks associated with those industries and may result in greater fluctuation in share value than is experienced in more diversified portfolios. In addition, the Fund invests in smaller companies, which generally involves greater risk than investing in larger, more established companies.
Investments in securities issued by non U.S. companies have certain risks not present in domestic issuers.
At any given time, a significant portion of the assets of either Fund may be invested in securities of companies within the same market sector of the economy. Companies within the same sector often face similar issues and, consequently, may react similarly to changes in market conditions. If either Fund has a significant weighting in one or more sectors, it may be subject to more risk and price volatility than other funds.
E. Multiple Classes of Shares –– Each Fund offers two classes of shares, which differ in their respective distribution and service fees. Investment income, realized and unrealized capital gains and losses, the common expenses of the Fund, and certain fund-level expense reductions, if any, are allocated on a pro rata basis to each class based on the relative net assets of each class to the total net assets of the Fund. Certain expense reductions may differ by class. Because transfer agent fees include a per account fee, each class differs with respect to transfer agent fees incurred.
F. Redemption Fees –– In general, shares of each Fund may be redeemed at net asset value. However, upon the redemption of shares held less than 90 days, a redemption fee of 1% of the current net asset value of the shares may be assessed and retained by each share class of each Fund for the benefit of the Fund’s remaining shareholders. The redemption fee is accounted for as an addition to paid-in-capital.
G. Income Tax Information and Distributions to Shareholders –– Each year, each Fund intends to qualify as a regulated investment company by distributing all of its taxable income and sufficient net investment income and net realized gains, if any, under Subchapter M of the Internal Revenue Code. As a result, no provision for income taxes is required in the accompanying financial statements. Foreign taxes are provided for based on each Fund’s understanding of the tax rules and rates that exist in the foreign markets in which it invests. Income dividends and capital gain distributions are declared separately for each class. Distributions are recorded on the ex-dividend date. Income and capital gain distributions are determined in accordance with income tax regulations, which may differ from generally accepted accounting principles. Capital accounts within the financial statements are adjusted for permanent book and tax differences. Generally accepted accounting principles require that any distributions in excess of tax basis earnings and profits be reported in the financial statements as a tax return of capital.
CENTURY FUNDS
___________
26
The identified cost of investments in securities owned by each Fund for federal income tax purposes was substantially the same as the cost for financial reporting purposes. Accordingly, gross unrealized appreciation and depreciation at April 30, 2010 were as follows:
| Century Shares Trust | ||||
| Gross unrealized appreciation | $ | 45,515,722 | ||
| Gross unrealized depreciation | (733,359 | ) | ||
| Unrealized net appreciation | $ | 44,782,363 | ||
| Identified cost | $ | 138,450,126 | ||
As of October 31, 2009, the Fund had a capital loss carryforward of $12,151,070, of which $2,618,549 will expire on October 31, 2016 and $9,532,521 will expire on October 31, 2017. This carryforward may be used to offset future capital gains to the extent provided by regulations.
| Century Small Cap Select Fund | ||||
| Gross unrealized appreciation | $ | 85,841,962 | ||
| Gross unrealized depreciation | (2,997,064 | ) | ||
| Unrealized net appreciation | $ | 82,844,898 | ||
| Identified cost | $ | 259,254,775 | ||
As of October 31, 2009, the Fund had a capital loss carryforward of $196,714,474, of which $106,779,845 will expire on October 31, 2016 and $89,934,629 will expire on October 31, 2017. This carryforward may be used to offset future capital gains to the extent provided by regulations.
As of April 30, 2010, the Funds had no uncertain tax positions that would require financial statement recognition or disclosure. The Funds’ federal tax returns filed for the fiscal years ended October 31, 2006, October 31, 2007 and October 31, 2008 remain subject to examination by the Internal Revenue Service.
(2) TRANSACTIONS IN SHARES
Century Shares Trust –– The number of authorized shares is unlimited. Transactions in each class of shares were as follows:
| Six Months Ended April 30, 2010 | ||||||||||||||||
| Institutional Shares | Investor Shares | |||||||||||||||
| Shares | Amount | Shares | Amount | |||||||||||||
| Sold | 50,147 | $ | 948,896 | 24,970 | $ | 487,075 | ||||||||||
| Issued to shareholders in reinvestment of distributions from: | 2,175 | 39,358 | — | — | ||||||||||||
| Net investment income | 52,322 | 988,254 | 24,970 | 487,075 | ||||||||||||
| Repurchased | (614,849 | ) | (11,419,446 | ) | (2,623 | ) | (48,020 | ) | ||||||||
| Net increase (decrease) | (562,527 | ) | $ | (10,431,192 | ) | 22,347 | $ | 439,055 | ||||||||
CENTURY FUNDS
___________
27
| Year Ended October 31, 2009 | ||||||||||||||||
| Institutional Shares | Investor Shares | |||||||||||||||
| Shares | Amount | Shares | Amount | |||||||||||||
| Sold | 139,209 | $ | 2,019,011 | 49,061 | $ | 712,476 | ||||||||||
| Issued to shareholders in reinvestment of distributions from: | ||||||||||||||||
| Net investment income | 18,364 | 266,814 | — | — | ||||||||||||
| 157,573 | 2,285,825 | 49,061 | 712,476 | |||||||||||||
| Repurchased | (1,105,452 | ) | (16,290,154 | ) | (26,716 | ) | (388,438 | ) | ||||||||
| Net increase (decrease) | (947,879 | ) | $ | (14,004,329 | ) | 22,345 | $ | 324,038 | ||||||||
Century Small Cap Select –– The number of authorized shares is unlimited. Transactions in each class of shares were as follows:
| Six Months Ended April 30, 2010 | ||||||||||||||||
| Institutional Shares | Investor Shares | |||||||||||||||
| Shares | Amount | Shares | Amount | |||||||||||||
| Sold | 1,673,447 | $ | 29,329,771 | 215,263 | $ | 3,825,136 | ||||||||||
| Repurchased | (2,610,159 | ) | (46,201,892 | ) | (1,086,581 | ) | (18,975,056 | ) | ||||||||
| Net decrease . | (936,712 | ) | $ | (16,872,121 | ) | (871,318 | ) | $ | (15,149,920 | ) | ||||||
| Year Ended October 31, 2009 | ||||||||||||||||
| Institutional Shares | Investor Shares | |||||||||||||||
| Shares | Amount | Shares | Amount | |||||||||||||
| Sold | 4,979,230 | $ | 66,831,146 | 938,066 | $ | 12,686,105 | ||||||||||
| Repurchased | (9,720,611 | ) | (135,453,439 | ) | (2,315,783 | ) | (32,210,609 | ) | ||||||||
| Net decrease | (4,741,381 | ) | $ | (68,622,293 | ) | (1,377,717 | ) | $ | (19,524,504 | ) | ||||||
(3) INVESTMENT SECURITIES TRANSACTIONS
Century Shares Trust purchases and sales of investment securities (excluding short-term securities and U.S. Government obligations) aggregated $62,299,524 and $72,072,487, respectively, during the six months ended April 30, 2010.
Century Small Cap Select Fund purchases and sales of investment securities (excluding short-term securities and U.S. Government obligations) aggregated $164,551,976 and $197,499,355, respectively, during the six months ended April 30, 2010.
(4) INVESTMENT ADVISER FEE
Century Shares Trust: The Trust has entered into an Investment Advisory Agreement (the “Agreement”) with Century Capital Management, LLC (“CCM”) pursuant to which CCM provides an investment program for Century Shares Trust. Under the Agreement, the Fund pays a management fee based on the Fund’s average daily net assets computed at the following annual rates: 0.80% of the first $500 million and 0.70% of the amounts exceeding $500 million.
Century Small Cap Select Fund: The Trust has entered into an Investment Advisory and Management Services Agreement (the “Agreement”) with CCM pursuant to which CCM provides investment advisory, management and administrative services to Century Small Cap Select Fund. Under the Agreement, the Fund pays a monthly management fee at the annual rate of 0.95% of the Fund’s average daily net assets.
(5) ADMINISTRATION FEES — The Trust has entered into an Administration Agreement with CCM pursuant to which CCM provides certain administrative services to Century Shares Trust at the annual rate of 0.10% of the Fund’s average daily net assets.
CENTURY FUNDS
___________
28
Per the Investment Advisory and Management Services Agreement between the Trust and CCM, Century Small Cap Select Fund reimburses CCM for expenses associated with having the adviser’s personnel perform shareholder service functions and certain financial, accounting, administrative and clerical services.
CCM has entered into a Sub-Administration Agreement with State Street Bank and Trust Company (“State Street”) pursuant to which State Street provides certain administrative services to each Fund on behalf of CCM. CCM pays State Street a sub-administration fee for sub-administration services provided to each Fund.
(6) DISTRIBUTION AND SERVICE FEES –– The Trust has adopted Distribution and Service Plans (the “Plans”) pursuant to Rule 12b-1 under the 1940 Act on behalf of Century Shares Trust and Century Small Cap Select Fund. The Plans authorize each Fund to pay up to 0.25% of the average daily net assets of the Funds’ Investor Shares class for distribution and shareholder services. The Plans may be terminated at any time by the vote of a majority of the independent Trustees or by the vote of the holders of a majority of the outstanding shares of the Investor Shares.
The Trust has entered into agreements with financial intermediaries to provide recordkeeping, processing, shareholder communications and other services to customers of the intermediaries and have agreed to compensate the intermediaries for providing such services. Certain services would be provided by the Funds if the shares of each customer were registered directly with the Funds’ transfer agent. Each Fund pays a portion of the intermediary fees attributable to shares of the Fund not exceeding the estimated expense the Fund would have paid its transfer agent had each customer’s shares been registered directly with the transfer agent instead of held through the intermediary accounts.
(7) ADVISER REIMBURSEMENTS — CCM contractually agreed to waive a portion of its management fee and reimburse or pay operating expenses of Century Shares Trust Investor Shares to the extent necessary to maintain the total operating expenses of the Investor Shares at 1.45% through February 28, 2011.
During the six months ended April 30, 2010, CCM reimbursed Century Shares Trust and Century Small Cap Select Fund $2,445 and $5,781, respectively, for distribution fees paid by the Funds in their short term money market fund investments. These amounts reduced the investment advisory fee expense shown on the Statement of Operations.
CCM may, out of its own resources and without additional cost to the Funds or their shareholders, provide compensation to certain financial intermediaries, such as broker-dealers and financial advisors, in connection with the sale of shares of the Funds or the provision of services to Fund shareholders. For example, such compensation may be paid to an intermediary for providing access to a third party platform, such as a mutual fund supermarket, or for providing services to shareholders who invest via such a platform. This compensation is in addition to any distribution and service fees paid by the Funds pursuant to a Rule 12b-1 Plan and in addition to subtransfer agency fees paid by the Funds.
(8) SUBSEQUENT EVENTS — In preparing the financial statements as of April 30, 2010, management considered the impact of subsequent events occurring through June 17, 2010, the date the financial statements were issued, for potential recognition or disclosure in these financial statements.
CENTURY FUNDS
___________
29
Century Capital Management, LLC (CCM) serves as the investment adviser and administrator to Century Shares Trust (CST) pursuant to an investment advisory agreement and an amended and restated administration agreement, each between Century Capital Management Trust, on behalf of CST, and CCM. CCM also serves as the investment adviser and provides administrative services to Century Small Cap Select Fund (CSCS) pursuant to an investment advisory and management services agreement between Century Capital Management Trust, on behalf of CSCS, and CCM. The Trustees of Century Capital Management Trust determine annually whether to continue the investment advisory and administration agreements for each of CST and CSCS.
At a meeting held on December 14, 2009, based on their evaluation of the information provided by CCM, the Trustees, including the independent Trustees voting separately, unanimously approved the continuation of the investment advisory agreement for each of CST and CSCS for another year.
In advance of the meeting, the Board, including all of the independent Trustees, received, among other things: (i) a Lipper Inc. report comparing each Fund’s fees and expenses to those of a peer group and peer universe for that Fund, each selected by Lipper; (ii) information regarding the average annual total returns for the 1, 3, 5, 10 and 15 years ended October 31, 2009 and November 30, 2009 for CST and for the 1, 3 and 5 years ended October 31, 2009 and November 30, 2009 and since inception for CSCS, as well as comparative total return information for various securities indicies and the applicable Lipper peer group, and information concerning each Fund’s Morningstar ranking; (iii) reports from CCM that described (a) the services provided to each Fund and information about the personnel providing those services, (b) the fees paid under the investment advisory and administration agreements, (c) compliance and oversight, (d) “fall-out” benefits to CCM, (e) brokerage and soft dollar arrangements, and (f) the fees paid by and services provided to comparable accounts; (iv) a profitability report prepared by CCM and (v) CCM’s Form ADV. In addition, at each regularly scheduled Board meeting, the Trustees receive and review, among other things, information concerning each Fund’s performance and the services provided to each Fund by CCM. The independent Trustees also received a memorandum from their counsel outlining the legal standards and certain other considerations relevant to the Trustees’ deliberations.
After receiving the requested information, the independent Trustees met in executive session to consider the investment advisory and administrative arrangements. The Trustees then unanimously determined to approve the continuance of the investment advisory and administration agreements with respect to each Fund for another year.
In determining to approve the continuation of the investment advisory and administration agreements, the Trustees considered a number of factors as outlined below. The Trustees did not identify any single factor as controlling. The Trustees evaluated all information available to them on a Fund-by-Fund basis, and their determinations were made separately in respect of each Fund. They also took into account the common interests of both of the Funds in their review. Throughout their deliberations, the independent Trustees were represented by counsel.
Nature, Quality and Extent of Services Provided
In considering the nature, extent and quality of the services provided by CCM under the investment advisory and administration agreements, the Board considered the terms of those agreements and reviewed information provided by CCM relating to its operations and personnel. The Trustees also considered their knowledge of the nature and quality of the services provided by CCM to the Funds gained from their experience as trustees of the Funds and noted the expectations of the shareholders who had invested in the Funds. The Board considered that CCM was responsible for the management and administration of each Fund’s operations. They also considered that CCM provides day-to-day management of each Fund’s portfolio of investments, including making purchases and sales of portfolio securities consistent with each Fund’s investment objectives and policies.
The Board considered CCM’s resources and personnel, focusing in particular on investment and compliance resources and personnel. The Board reviewed each portfolio manager’s experience and qualifications, as well as CCM’s investment approach and research process. The Board also reviewed CCM’s trading procedures and brokerage practices, including information regarding soft dollar arrangements.
CENTURY FUNDS
___________
30
The Board also considered that, as administrator, CCM is responsible for the administration of each Fund’s business and other affairs. It was noted that CCM supervises and monitors the performance of each Fund’s service providers and provides each Fund with personnel (including officers) as are necessary for the Fund’s operations. It was noted that CCM pays all of the compensation of Mr. Thorndike and Mr. Fulkerson, the interested Trustees, and the Funds’ officers. The Board also noted that CCM assisted the Funds in meeting legal and regulatory requirements and considered, among other things, CCM’s compliance program. The Board considered the fees paid to CCM for the provision of such services.
Taking all of the foregoing into account, the Trustees concluded that they were satisfied with the nature, extent and quality of services provided to the Funds under the investment advisory and administration agreements.
Costs of Services Provided and Profitability
The Trustees reviewed information concerning the costs of services provided to the Funds by CCM, and the profitability to CCM of its investment advisory and administrative relationship with each Fund for the periods ended December 31, 2008 and December 31, 2009 (estimated as of November 30, 2009), along with a description of the methodology used by CCM in preparing the profitability information. It was noted, among other things, that profitability was shown on a Fund-by-Fund basis and that the 2009 estimated pre-tax profit margin was less than the 2008 pre-tax profit margin with respect to each of the Funds.
The Trustees recognized that CCM should be entitled to earn a reasonable level of profit for the services provided to each Fund, and that it is difficult to make comparisons of profitability from fund advisory and administration contracts because comparative information is not generally available and is affected by numerous factors, including the structure of the particular adviser, the types of funds it manages, its business mix, numerous assumptions about allocations and the adviser’s capital structure and cost of capital. The Trustees concluded that, taking all of the foregoing into account, they were satisfied that CCM’s level of profitability from its relationship with each Fund was not excessive.
Fall-Out Benefits
The Trustees considered the extent to which CCM benefited from soft dollar arrangements whereby it receives brokerage and research services from brokers that execute a Fund’s purchases and sales of investment securities. It was noted that CCM had represented that it fulfills its fiduciary obligation of seeking best execution when engaging in portfolio transactions for the Funds. The Trustees concluded that the direct and indirect benefits to CCM from its relationship with the Funds were reasonable.
Economies of Scale
The Trustees considered the extent to which CCM may realize economies of scale or other efficiencies in managing and supporting the Funds. It was noted that as assets increase certain fixed costs may be spread across a larger asset base, and it was noted that any economies of scale or other efficiencies might be realized (if at all) across a variety of products and services, including the Funds, and not only in respect of a single Fund. The Trustees recognized that economies of scale are difficult to identify and quantify and that, among other factors that may be relevant, are the following: fee levels, expense subsidization, investment by CCM in research and analytical capabilities and CCM’s commitment and resource allocation to the Funds. The Trustees noted that profitability also may be an indicator of the availability of any economies of scale, although profitability may vary for other reasons particularly as the level of services are maintained notwithstanding a decline in CCM’s fee revenues from the Funds. The Trustees noted that the advisory fee schedule for CST included breakpoints that would allow the shareholders of CST to share in economies of scale, if any, experienced by CCM in managing that Fund. The Trustees noted that the advisory fee schedule for CSCS did not include breakpoints that would reduce the fee rate on assets above specified levels. The Board determined that the current fee structure for CSCS was acceptable given the fee level, the fees waived by CCM in prior years in respect of CSCS, and the current size of the Fund.
CENTURY FUNDS
___________
31
Investment Results
CST. The Trustees reviewed comparative information that showed that CST’s average annual total return for both the Institutional class of shares and the Investor class of shares was better than the average annual total return of the Standard & Poor’s 500 Index for the 3, 10 and 15 year periods ended October 31, 2009 and worse than the average annual return of the Standard & Poor’s 500 Index for the 1 and 5 year periods ended October 31, 2009. They noted that CST’s average annual total return for both the Institutional class of shares and the Investor class of shares was better than the average annual total return of the Russell 1000 Growth Index and CST’s Lipper peer group for the 10 and 15 year periods ended October 31, 2009 (as applicable) and worse than the average annual return of the Russell 1000 Growth Index and CST’s Lipper peer group for the 1, 3 and 5 year periods ended October 31, 2009. The Trustees noted that Morningstar had awarded CST a four star rating as at November 30, 2009. The Trustees considered CCM’s explanation of CST’s recent relative underperformance. The Trustees considered the impact of market conditions on CST’s performance and the strategies to be employed by CCM in an effort to improve CST’s performance. The Trustees agreed that they would continue to closely monitor the performance of CST.
CSCS. The Trustees reviewed comparative information that showed that CSCS’s average annual total return for the Institutional class of shares was better than the average annual total returns of the Russell 2000 Growth Index and the Russell 2000 Index for the 1 year period ended October 31, 2009 and since inception of CSCS (December, 1999) but worse than the average annual total return of CSCS’s Lipper peer group for the 1 year period. The Trustees considered that CSCS’s average annual total return for the Institutional class of shares was worse than the average annual total returns of the Russell 2000 Growth Index and CSCS’s Lipper peer group for the 3 and 5 year periods ended October 31, 2009 but better than the Russell 2000 Index for the 3 year period ended October 31, 2009. With respect to CSCS’s Investor class of shares, the Trustees considered that the average annual total return of the Investor class of shares was better than or in line with the average annual total returns of the Russell 2000 Growth Index, the Russell 2000 Index and CSCS’s Lipper peer group for 1 year period ended October 31, 2009 and since inception (February, 2000) but worse than the average annual total returns of the Russell 2000 Growth Index, the Russell 2000 Index and CSCS’s Lipper peer group for the 3 and 5 year periods ended October 31, 2009. The Trustees noted that Morningstar had awarded CSCS a three star rating as at November 30, 2009. The Trustees considered CCM’s explanation of CSCS’s relative underperformance for the 3 and 5 year periods. The Trustees considered the impact of market conditions on CSCS’s performance and the strategies to be employed by CCM in an effort to improve CSCS’s performance. The Trustees agreed that they would continue to closely monitor the performance of CSCS.
Fees and Other Expenses
The Trustees considered the advisory fees paid by each Fund to CCM. The Trustees also considered the administrative fee rate paid by CST to CCM. The Trustees considered (i) the level of each Fund’s advisory fee versus its peer group and peer universe as shown in the Lipper materials and (ii) each Fund’s total expense ratio as compared to its peer group and peer universe as shown in the Lipper materials.
The Trustees also considered the fees that CCM charges institutional investors and other clients with investment objectives similar to the Funds. The Trustees reviewed materials from CCM describing the differences in services provided to these other clients, which noted that typically more services were provided to the Funds than these other clients and that, because of the constant issuance and redemption of Fund shares, the Funds were more difficult to manage than other clients. With respect to CCM’s subadvisory relationship with another mutual fund, the Trustees considered CCM’s investment mandate for that fund and that CCM provided fewer services to that fund than it provided to the Funds. The materials showed that the fee rates charged by CCM to each Fund were generally similar to (but not necessarily as low as, in all cases) the fees paid by CCM’s other clients.
The information obtained from Lipper for the meeting compared the advisory fee, transfer agency/custodian fees, distribution fees, other nonmanagement expenses and total expenses for the Institutional class of shares of each Fund and the CSCS Investor class of shares to those of a group of competitor funds of roughly equivalent size, as well as a universe of competitor funds. The Trustees did not independently verify any of the information provided by Lipper.
CENTURY FUNDS
___________
32
CST. The Trustees reviewed information that showed that CST’s advisory fee (which includes administration) was higher than the Lipper peer group and peer universe averages and that CST’s total expense ratio for CST’s Institutional class of shares was higher than the Lipper peer group average and the Lipper peer universe average. The Trustees considered that certain of the funds in the peer group had lower advisory fees than CST as a result of fee waivers that could be terminated. The Trustees also considered the services provided by CCM as compared to the services provided by other advisers and the ability of the other advisers to realize economies of scale across a larger fund complex. The Trustees concluded that the advisory fees and total expense ratios of CST were reasonable in relation to the nature and quality of the services provided by CCM.
CSCS. The Trustees reviewed information that showed that CSCS’s advisory fee was higher than the Lipper peer group average and the Lipper peer universe average. The Trustees also reviewed information that showed that the total expense ratio for CSCS’s Institutional class of shares was higher than the average total expense ratio of the Lipper peer group but lower than the average total expense ratio of the Lipper peer universe, and that the total expense ratio for CSCS’s Investor class of shares was higher than the average total expense ratio of the Lipper peer group but lower than the average total expense ratio of the Lipper peer universe. The Trustees also considered information provided to them regarding the costs to CCM of providing investment advisory services to CSCS, noting in particular the competitive market for analysts and portfolio managers and that the research needed to implement CSCS’s investment strategy was relatively costly. The Trustees also considered the services provided by CCM compared to the other advisers and ability of the other advisers to realize economies of scale across a larger fund complex. The Trustees concluded that the advisory fees, administrative fees and total expense ratios of CSCS were reasonable in relation to the nature and quality of the services provided by CCM.
CENTURY FUNDS
___________
33
Availability of Quarterly Portfolio Schedules. Each Fund files a complete schedule of its portfolio holdings with the SEC for the first and third quarters of the Fund’s fiscal year on Form N-Q. The Forms N-Q are available on the SEC’s website at http://www.sec.gov, and they may be reviewed and copied at the SEC’s Public Reference Room in Washington, DC. Information on the operation of the SEC’s Public Reference Room may be obtained by calling 1-800-SEC-0330.
Availability of Proxy Voting Policies and Procedures and Proxy Voting Record. A description of the policies and procedures that each Fund uses to determine how to vote proxies relating to portfolio securities and each Fund’s proxy voting record for the 12-month period ended June 30 are available, without charge, upon request, by calling 1-800-321-1928. You may also obtain a copy of the Funds’ proxy voting policies and procedures and proxy voting record on the SEC’s website at http://www.sec.gov.
CENTURY FUNDS
___________
34
CENTURY FUNDS PRIVACY POLICY
Century Capital Management and the Century Funds are committed to maintaining the confidentiality, integrity and security of your personal information and financial data. We consider this information to be private and held in confidence between you and Century. This is to inform you of our policies to protect the privacy of your nonpublic personal information.
Information We Collect
When you invest in the Century Funds, we collect certain nonpublic personal information about you, which we use to open and service your account and respond to your requests. This information includes your name, address, tax identification number, birth date, investment selection, beneficiary information and possibly personal bank account information. It also includes information about your transactions and account history, as well as information that we may receive from third parties, such as financial advisers, consumer reporting agencies, and consultants.
Disclosure Policy
We do not disclose nonpublic personal information about current or former shareholders or customers to any third parties except as necessary to process a transaction, service an account, or as otherwise permitted by law. For example, the Century Funds use a third party transfer agent who uses your information only to process or analyze transactions that you have requested. Our contracts with such parties contain provisions restricting their use of your nonpublic personal information to those purposes for which they were hired. We do not sell non-public personal information to anyone.
Confidentiality and Security
We restrict access to nonpublic personal information about you to those employees and service providers involved in administering or servicing your account or helping us meet our regulatory obligations. We maintain physical, electronic and procedural safeguards that comply with federal standards to protect your nonpublic personal information.
This Privacy Policy applies to Century Shares Trust and Century Small Cap Select Fund.
CENTURY FUNDS ��
___________
35
This Page Intentionally Left Blank.
___________
36
FUND INFORMATION | |
INVESTMENT ADVISER | SHAREHOLDER INFORMATION |
| Century Capital Management, LLC | 1-800-303-1928 |
| 100 Federal Street | |
| Boston, Massachusetts 02110 | |
REGULAR MAILING ADDRESS | OVERNIGHT MAILING ADDRESS |
| Century Funds | Century Funds |
| PO Box 588 | c/o Atlantic Shareholder Services, LLC |
| Portland, ME 04112 | 3 Canal Plaza, Ground Floor |
| Portland, ME 04101 | |
DISTRIBUTOR | |
| Foreside Fund Services, LLC | |
| Three Canal Plaza, Suite 100 | |
| Portland, ME 04101 | |
| www.foreside.com |
Item 2. Code of Ethics.
Not applicable.
Item 3. Audit Committee Financial Expert.
Not applicable.
Item 4. Principal Accountant Fees and Services.
Not applicable.
Item 5. Audit Committee of Listed Registrants.
Not applicable.
Item 6. Investments.
Not applicable.
Item 7. Disclosure of Proxy Voting Policies and Procedures for Closed-End Management Investment Companies.
Not applicable.
Item 8. Portfolio Managers of Closed-End Management Investment Companies.
Not applicable.
Item 9. Purchases of Equity Securities by Closed-End Management Investment Company and Affiliated Purchasers.
Not applicable.
Item 10. Submission of Matters to a Vote of Security Holders
There have been no material changes to the procedures by which shareholders may recommend nominees to the Trust's Board of Trustees since the Trust last provided disclosure as to such procedures in response to the requirements of Item 407(c)(2)(iv) of Regulation S-K (as required by Item 22(b)(15) of Schedule 14A), or this Item.
Item 11. Controls and Procedures.
(a) The registrant's principal executive officer and principal financial officer, after evaluating the effectiveness of the registrant's "disclosure controls and procedures" (as defined in the Investment Company Act of 1940 Rule 30-a-2(c) under the Act (17 CFR 270.30a-2(c))) as of a date (the "Evaluation Date") within 90 days of the filing date of this report, have concluded that, as of the Evaluation Date, the registrant's disclosure controls and procedures were adequately designed to ensure that the information required to be disclosed by the registrant in this Form N-CSR is recorded, processed, summarized and reported within the time periods specified in the Commission's rules and forms.
(b) There were no changes in the registrant's internal control over financial reporting (as defined in Rule 30a-3(d) under the Act (17 CFR 270.30a-3(d))) that occurred during the registrant's second fiscal quarter of the period covered by this report that has materially affected, or is reasonably likely to materially affect, the registrant's internal control over financial reporting.
Item 12. Exhibits.
(a) (1) Certification pursuant to Rule 30a-2(a) under the Investment Company Act of 1940 (17 CFR 270.30a-2(a)) is filed and attached hereto as Exhibit 99.302CERT.
(b) Certification pursuant to Rule 30a-2(b) under the Investment Company Act of 1940 (17 CFR 270.30a-2(b)) is filed and attached hereto as Exhibit 99.906CERT.
(b) Certification pursuant to Rule 30a-2(b) under the Investment Company Act of 1940 (17 CFR 270.30a-2(b)) is filed and attached hereto as Exhibit 99.906CERT.
SIGNATURES
Pursuant to the requirements of the Securities Exchange Act of 1934 and the Investment Company Act of 1940, the registrant has duly caused this report to be signed on its behalf by the undersigned, thereunto duly authorized.
Century Capital Management Trust
By: /s/ Alexander L. Thorndike
______________________________
Alexander L. Thorndike, Chairman
Date: July 9, 2010
Pursuant to the requirements of the Securities Exchange Act of 1934 and the Investment Company Act of 1940, this report has been signed below by the following persons on behalf of the registrant and in the capacities and on the dates indicated.
By: /s/ Alexander L. Thorndike
_________________________________________
Alexander L. Thorndike, Principal Executive Officer
Date: July 9, 2010
By: /s/ Julie Smith
________________________________
Julie Smith, Principal Financial Officer
Date: July 9, 2010