UNITED STATES
SECURITIES AND EXCHANGE COMMISSION
Washington, D.C. 20549
FORM N-CSR
CERTIFIED SHAREHOLDER REPORT OF REGISTERED
MANAGEMENT INVESTMENT COMPANIES
Investment Company Act file number: 811-09599
STATE STREET MASTER FUNDS
(Exact name of registrant as specified in charter)
P.O. Box 5501
Boston, Massachusetts 02206
(Address of principal executive offices)(Zip code)
| | |
| (Name and Address of Agent for Service) | | Copy to: |
| |
David James, Vice President and Managing Director and Managing Counsel State Street Bank and Trust Company 100 Huntington Avenue, 3rd Floor Boston, Massachusetts 02116 | | Timothy W. Diggins, Esq. Ropes & Gray 800 Boylston Street Boston, Massachusetts 02110-2624 |
Registrant’s telephone number, including area code: (617) 662-1742
Date of fiscal year end: December 31
Date of reporting period: December 31, 2014
| Item 1. | Shareholder Report. |
Annual Report
31 December 2014
State Street Master Funds
State Street Money Market Portfolio
State Street Tax Free Money Market Portfolio
State Street U.S. Government Money Market Portfolio
State Street Treasury Money Market Portfolio
State Street Treasury Plus Money Market Portfolio

State Street Money Market Portfolio
Portfolio Statistics (Unaudited)
| | | | |
Portfolio Composition* | | | December 31, 2014 | |
Certificates of Deposit | | | 38.2 | % |
Treasury Repurchase Agreements | | | 34.1 | |
Financial Company Commercial Paper | | | 19.0 | |
Other Notes | | | 3.9 | |
Other Repurchase Agreements | | | 3.3 | |
Government Agency Repurchase Agreements | | | 1.6 | |
Asset Backed Commercial Paper | | | 0.7 | |
Liabilities in Excess of Other Assets | | | (0.8 | ) |
Total | | | 100.0 | % |
| | | | |
Maturity Ladder* | | | December 31, 2014 | |
Overnight (1 Day) | | | 22.1 | % |
2-30 Days | | | 30.7 | |
31-60 Days | | | 17.9 | |
61-90 Days | | | 11.2 | |
Over 90 Days | | | 18.9 | |
Total | | | 100.8 | % |
Average days to maturity | | | 26 | |
Weighted average life | | | 55 | |
| * | As a percentage of net assets as of the date indicated. The Portfolio’s composition will vary over time. |
See Notes to Financial Statements.
32
State Street Money Market Portfolio
Portfolio of Investments
December 31, 2014
| | | | | | | | | | | | | | | | | | | | |
Name of Issuer
and Title of Issue | | Interest
Rate | | | Next Rate
Reset Date | | | Maturity
Date | | | Principal
Amount | | | Value | |
| | | | | | | | | | | | | | | | | | | | |
| ASSET BACKED COMMERCIAL PAPER – 0.7% | |
Collateralized Commercial Paper Co. LLC(a) | | | 0.200 | % | | | 02/11/2015 | | | | 02/11/2015 | | | $ | 300,000,000 | | | $ | 299,931,666 | |
| | | | | | | | | | | | | | | | | | | | |
| FINANCIAL COMPANY COMMERCIAL PAPER – 19.0% | |
Australia & New Zealand Banking Group Ltd.(b)(c) | | | 0.241 | % | | | 01/13/2015 | | | | 04/13/2015 | | | | 85,000,000 | | | | 85,000,000 | |
BNP Paribas(a) | | | 0.300 | % | | | 01/06/2015 | | | | 01/06/2015 | | | | 200,000,000 | | | | 199,991,667 | |
BNP Paribas(a) | | | 0.260 | % | | | 01/22/2015 | | | | 01/22/2015 | | | | 300,000,000 | | | | 299,954,500 | |
Caisse des Depots et Consignations(a)(d) | | | 0.230 | % | | | 02/03/2015 | | | | 02/03/2015 | | | | 50,000,000 | | | | 49,989,458 | |
Caisse des Depots et Consignations(a)(d) | | | 0.200 | % | | | 02/20/2015 | | | | 02/20/2015 | | | | 450,000,000 | | | | 449,875,000 | |
Caisse des Depots et Consignations(a)(d) | | | 0.215 | % | | | 04/02/2015 | | | | 04/02/2015 | | | | 150,000,000 | | | | 149,918,479 | |
Caisse des Depots et Consignations(a)(d) | | | 0.215 | % | | | 04/07/2015 | | | | 04/07/2015 | | | | 175,000,000 | | | | 174,899,667 | |
DnB Bank ASA(a)(c) | | | 0.210 | % | | | 01/13/2015 | | | | 01/13/2015 | | | | 300,000,000 | | | | 299,979,000 | |
DnB Bank ASA(a)(c) | | | 0.225 | % | | | 01/20/2015 | | | | 01/20/2015 | | | | 250,000,000 | | | | 249,971,632 | |
DnB Bank ASA(a)(c) | | | 0.225 | % | | | 01/20/2015 | | | | 01/20/2015 | | | | 110,000,000 | | | | 109,986,938 | |
DnB Bank ASA(a)(c) | | | 0.190 | % | | | 01/26/2015 | | | | 01/26/2015 | | | | 350,000,000 | | | | 349,953,819 | |
DnB Bank ASA(a)(c) | | | 0.215 | % | | | 03/06/2015 | | | | 03/06/2015 | | | | 385,000,000 | | | | 384,852,844 | |
Erste Abwicklungsanstalt(a)(c) | | | 0.180 | % | | | 02/10/2015 | | | | 02/10/2015 | | | | 125,000,000 | | | | 124,975,000 | |
General Electric Capital Corp.(a) | | | 0.200 | % | | | 01/08/2015 | | | | 01/08/2015 | | | | 100,000,000 | | | | 99,996,111 | |
HSBC Bank PLC(a)(c) | | | 0.230 | % | | | 03/30/2015 | | | | 03/30/2015 | | | | 150,000,000 | | | | 149,915,667 | |
HSBC Bank PLC(b)(c) | | | 0.252 | % | | | 01/12/2015 | | | | 09/10/2015 | | | | 100,000,000 | | | | 100,000,000 | |
HSBC Bank PLC(b)(c) | | | 0.244 | % | | | 01/02/2015 | | | | 10/02/2015 | | | | 175,000,000 | | | | 175,000,000 | |
JP Morgan Securities LLC(b)(c) | | | 0.327 | % | | | 01/06/2015 | | | | 02/06/2015 | | | | 350,000,000 | | | | 350,000,000 | |
Nationwide Building Society(a)(c) | | | 0.190 | % | | | 01/07/2015 | | | | 01/07/2015 | | | | 150,000,000 | | | | 149,995,250 | |
Nordea Bank AB(a)(c) | | | 0.200 | % | | | 01/22/2015 | | | | 01/22/2015 | | | | 145,000,000 | | | | 144,983,083 | |
Nordea Bank AB(a)(c) | | | 0.200 | % | | | 02/24/2015 | | | | 02/24/2015 | | | | 300,000,000 | | | | 299,910,000 | |
Nordea Bank AB(a)(c) | | | 0.200 | % | | | 02/26/2015 | | | | 02/26/2015 | | | | 175,000,000 | | | | 174,945,556 | |
Skandinaviska Enskilda Banken AB(a)(c) | | | 0.200 | % | | | 02/05/2015 | | | | 02/05/2015 | | | | 495,000,000 | | | | 494,903,750 | |
Skandinaviska Enskilda Banken AB(a)(c) | | | 0.240 | % | | | 03/02/2015 | | | | 03/02/2015 | | | | 385,000,000 | | | | 384,846,000 | |
Societe Generale(a)(c) | | | 0.240 | % | | | 03/03/2015 | | | | 03/03/2015 | | | | 325,000,000 | | | | 324,867,833 | |
Sumitomo Mitsui Banking Corp.(a)(c) | | | 0.240 | % | | | 01/22/2015 | | | | 01/22/2015 | | | | 350,000,000 | | | | 349,951,000 | |
Svenska Handelsbanken AB(a)(c) | | | 0.200 | % | | | 04/17/2015 | | | | 04/17/2015 | | | | 200,000,000 | | | | 199,882,222 | |
Swedbank AB(a) | | | 0.230 | % | | | 02/02/2015 | | | | 02/02/2015 | | | | 100,000,000 | | | | 99,979,556 | |
Swedbank AB(a) | | | 0.230 | % | | | 02/05/2015 | | | | 02/05/2015 | | | | 100,000,000 | | | | 99,977,639 | |
Swedbank AB(a) | | | 0.230 | % | | | 02/10/2015 | | | | 02/10/2015 | | | | 200,000,000 | | | | 199,948,889 | |
Toyota Motor Credit Corp.(a) | | | 0.200 | % | | | 01/07/2015 | | | | 01/07/2015 | | | | 50,000,000 | | | | 49,998,333 | |
Toyota Motor Credit Corp.(a) | | | 0.200 | % | | | 01/08/2015 | | | | 01/08/2015 | | | | 129,000,000 | | | | 128,994,984 | |
Westpac Banking Corp.(b)(c) | | | 0.231 | % | | | 01/16/2015 | | | | 01/16/2015 | | | | 409,500,000 | | | | 409,500,000 | |
Westpac Banking Corp.(b)(c) | | | 0.228 | % | | | 01/05/2015 | | | | 03/04/2015 | | | | 250,000,000 | | | | 249,998,437 | |
Westpac Banking Corp.(b)(c) | | | 0.243 | % | | | 01/26/2015 | | | | 04/24/2015 | | | | 150,000,000 | | | | 150,000,000 | |
| | | | | | | | | | | | | | | | | | | | |
TOTAL FINANCIAL COMPANY COMMERCIAL PAPER | | | | | | | | | | | | 7,716,942,314 | |
| | | | | | | | | | | | | | | | | | | | |
See Notes to Financial Statements.
33
State Street Money Market Portfolio
Portfolio of Investments — (continued)
December 31, 2014
| | | | | | | | | | | | | | | | | | | | |
Name of Issuer
and Title of Issue | | Interest
Rate | | | Next Rate
Reset Date | | | Maturity
Date | | | Principal
Amount | | | Value | |
| | | | | | | | | | | | | | | | | | | | |
| CERTIFICATES OF DEPOSIT – 38.2% | |
Bank of America NA(a) | | | 0.230 | % | | | 01/23/2015 | | | | 01/23/2015 | | | $ | 121,000,000 | | | $ | 121,000,000 | |
Bank of America NA(a) | | | 0.230 | % | | | 01/26/2015 | | | | 01/26/2015 | | | | 195,000,000 | | | | 195,000,000 | |
Bank of Montreal(a) | | | 0.190 | % | | | 01/07/2015 | | | | 01/07/2015 | | | | 145,000,000 | | | | 145,000,000 | |
Bank of Montreal(b) | | | 0.282 | % | | | 01/20/2015 | | | | 06/17/2015 | | | | 325,000,000 | | | | 325,000,000 | |
Bank of Nova Scotia(b) | | | 0.287 | % | | | 01/07/2015 | | | | 06/05/2015 | | | | 335,000,000 | | | | 335,000,000 | |
Bank of Nova Scotia(b) | | | 0.262 | % | | | 01/12/2015 | | | | 09/04/2015 | | | | 350,000,000 | | | | 350,000,000 | |
Bank of Tokyo – Mitsubishi(a) | | | 0.200 | % | | | 01/09/2015 | | | | 01/09/2015 | | | | 140,000,000 | | | | 140,000,000 | |
Bank of Tokyo – Mitsubishi(a) | | | 0.200 | % | | | 02/04/2015 | | | | 02/04/2015 | | | | 200,000,000 | | | | 200,000,000 | |
Bank of Tokyo – Mitsubishi(a) | | | 0.200 | % | | | 03/16/2015 | | | | 03/16/2015 | | | | 350,000,000 | | | | 350,000,000 | |
Barclays Bank(b) | | | 0.336 | % | | | 03/09/2015 | | | | 04/01/2015 | | | | 500,000,000 | | | | 500,000,000 | |
Barclays Bank(b) | | | 0.390 | % | | | 01/26/2015 | | | | 06/25/2015 | | | | 685,000,000 | | | | 685,000,000 | |
BNP Paribas(a) | | | 0.250 | % | | | 02/04/2015 | | | | 02/04/2015 | | | | 500,000,000 | | | | 500,000,000 | |
BNP Paribas(a) | | | 0.250 | % | | | 03/12/2015 | | | | 03/12/2015 | | | | 384,000,000 | | | | 384,000,000 | |
Canadian Imperial Bank of Commerce(b) | | | 0.317 | % | | | 01/05/2015 | | | | 06/04/2015 | | | | 195,000,000 | | | | 195,000,000 | |
Chase Bank USA NA(b) | | | 0.240 | % | | | 01/26/2015 | | | | 01/26/2015 | | | | 124,000,000 | | | | 124,000,000 | |
Chase Bank USA NA(b) | | | 0.247 | % | | | 01/26/2015 | | | | 02/24/2015 | | | | 124,000,000 | | | | 124,000,000 | |
Citibank NA(a) | | | 0.200 | % | | | 01/06/2015 | | | | 01/06/2015 | | | | 50,000,000 | | | | 50,000,000 | |
Citibank NA(a) | | | 0.230 | % | | | 01/26/2015 | | | | 01/26/2015 | | | | 375,000,000 | | | | 375,000,000 | |
Credit Agricole Corporate & Investment Bank(a) | | | 0.250 | % | | | 02/03/2015 | | | | 02/03/2015 | | | | 700,000,000 | | | | 700,000,000 | |
Credit Suisse(a) | | | 0.230 | % | | | 01/07/2015 | | | | 01/07/2015 | | | | 285,000,000 | | | | 285,000,000 | |
Credit Suisse(a) | | | 0.310 | % | | | 02/05/2015 | | | | 02/05/2015 | | | | 400,000,000 | | | | 400,000,000 | |
ING Bank NV(a) | | | 0.300 | % | | | 02/02/2015 | | | | 02/02/2015 | | | | 125,000,000 | | | | 125,000,000 | |
ING Bank NV(a) | | | 0.310 | % | | | 02/11/2015 | | | | 02/11/2015 | | | | 140,000,000 | | | | 140,000,000 | |
ING Bank NV(a) | | | 0.310 | % | | | 02/27/2015 | | | | 02/27/2015 | | | | 200,000,000 | | | | 200,000,000 | |
ING Bank NV(a) | | | 0.320 | % | | | 03/02/2015 | | | | 03/02/2015 | | | | 200,000,000 | | | | 200,000,000 | |
ING Bank NV(a) | | | 0.320 | % | | | 03/10/2015 | | | | 03/10/2015 | | | | 400,000,000 | | | | 400,000,000 | |
ING Bank NV(a) | | | 0.240 | % | | | 03/18/2015 | | | | 03/18/2015 | | | | 208,000,000 | | | | 208,000,000 | |
Lloyds Bank PLC(a) | | | 0.250 | % | | | 02/09/2015 | | | | 02/09/2015 | | | | 221,000,000 | | | | 221,000,000 | |
Nordea Bank AB(a) | | | 0.245 | % | | | 01/22/2015 | | | | 01/22/2015 | | | | 100,000,000 | | | | 99,999,709 | |
Norinchukin Bank(a) | | | 0.190 | % | | | 01/08/2015 | | | | 01/08/2015 | | | | 375,000,000 | | | | 374,999,995 | |
Norinchukin Bank(a) | | | 0.230 | % | | | 01/26/2015 | | | | 01/26/2015 | | | | 500,000,000 | | | | 500,000,000 | |
Rabobank Nederland NV(a) | | | 0.210 | % | | | 01/08/2015 | | | | 01/08/2015 | | | | 216,000,000 | | | | 216,000,000 | |
Rabobank Nederland NV(a) | | | 0.220 | % | | | 03/13/2015 | | | | 03/13/2015 | | | | 350,000,000 | | | | 350,000,000 | |
Rabobank Nederland NV(a) | | | 0.210 | % | | | 04/06/2015 | | | | 04/06/2015 | | | | 300,000,000 | | | | 300,000,000 | |
Rabobank Nederland NV(a) | | | 0.210 | % | | | 05/04/2015 | | | | 05/04/2015 | | | | 200,000,000 | | | | 200,000,000 | |
Royal Bank of Canada(b) | | | 0.236 | % | | | 01/20/2015 | | | | 05/20/2015 | | | | 125,000,000 | | | | 125,000,000 | |
Royal Bank of Canada(b) | | | 0.260 | % | | | 01/29/2015 | | | | 08/31/2015 | | | | 120,000,000 | | | | 120,000,000 | |
Royal Bank of Canada(b) | | | 0.262 | % | | | 01/12/2015 | | | | 09/10/2015 | | | | 180,000,000 | | | | 180,000,000 | |
Standard Chartered Bank(a) | | | 0.160 | % | | | 01/02/2015 | | | | 01/02/2015 | | | | 150,000,000 | | | | 150,000,000 | |
Sumitomo Mitsui Banking Corp.(a) | | | 0.240 | % | | | 01/22/2015 | | | | 01/22/2015 | | | | 150,000,000 | | | | 150,000,000 | |
Sumitomo Mitsui Banking Corp.(a) | | | 0.220 | % | | | 02/06/2015 | | | | 02/06/2015 | | | | 100,000,000 | | | | 100,000,000 | |
See Notes to Financial Statements.
34
State Street Money Market Portfolio
Portfolio of Investments — (continued)
December 31, 2014
| | | | | | | | | | | | | | | | | | | | |
Name of Issuer
and Title of Issue | | Interest
Rate | | | Next Rate
Reset Date | | | Maturity
Date | | | Principal
Amount | | | Value | |
| | | | | | | | | | | | | | | | | | | | |
| CERTIFICATES OF DEPOSIT – (continued) | |
Sumitomo Mitsui Banking Corp.(a) | | | 0.220 | % | | | 02/27/2015 | | | | 02/27/2015 | | | $ | 150,000,000 | | | $ | 150,000,000 | |
Svenska Handelsbanken AB(a) | | | 0.205 | % | | | 01/26/2015 | | | | 01/26/2015 | | | | 150,000,000 | | | | 150,000,521 | |
Svenska Handelsbanken AB(a) | | | 0.195 | % | | | 02/02/2015 | | | | 02/02/2015 | | | | 200,000,000 | | | | 200,000,888 | |
Svenska Handelsbanken AB(a) | | | 0.220 | % | | | 02/09/2015 | | | | 02/09/2015 | | | | 178,660,000 | | | | 178,660,966 | |
Svenska Handelsbanken AB(a) | | | 0.215 | % | | | 04/16/2015 | | | | 04/16/2015 | | | | 300,000,000 | | | | 300,004,372 | |
Swedbank AB(a) | | | 0.230 | % | | | 01/07/2015 | | | | 01/07/2015 | | | | 200,000,000 | | | | 200,000,000 | |
Toronto Dominion Bank(a) | | | 0.200 | % | | | 01/13/2015 | | | | 01/13/2015 | | | | 175,000,000 | | | | 175,000,000 | |
Toronto Dominion Bank(a) | | | 0.200 | % | | | 01/14/2015 | | | | 01/14/2015 | | | | 125,000,000 | | | | 125,000,000 | |
Toronto Dominion Bank(a) | | | 0.200 | % | | | 01/15/2015 | | | | 01/15/2015 | | | | 125,000,000 | | | | 125,000,000 | |
Toronto Dominion Bank(a) | | | 0.200 | % | | | 03/03/2015 | | | | 03/03/2015 | | | | 355,000,000 | | | | 355,000,000 | |
Toronto Dominion Bank(b) | | | 0.243 | % | | | 02/23/2015 | | | | 08/24/2015 | | | | 289,000,000 | | | | 289,000,000 | |
UBS AG(a) | | | 0.220 | % | | | 02/06/2015 | | | | 02/06/2015 | | | | 535,000,000 | | | | 535,000,000 | |
UBS AG(b) | | | 0.267 | % | | | 01/05/2015 | | | | 03/05/2015 | | | | 300,500,000 | | | | 300,500,000 | |
Wells Fargo Bank NA(b) | | | 0.231 | % | | | 01/12/2015 | | | | 03/12/2015 | | | | 225,000,000 | | | | 225,000,000 | |
Wells Fargo Bank NA(b) | | | 0.231 | % | | | 01/09/2015 | | | | 04/09/2015 | | | | 214,000,000 | | | | 214,000,000 | |
Wells Fargo Bank NA(b) | | | 0.253 | % | | | 01/08/2015 | | | | 07/07/2015 | | | | 300,000,000 | | | | 300,000,000 | |
Wells Fargo Bank NA(b) | | | 0.250 | % | | | 01/12/2015 | | | | 07/14/2015 | | | | 458,000,000 | | | | 458,000,000 | |
Westpac Banking Corp.(b) | | | 0.227 | % | | | 01/06/2015 | | | | 01/06/2015 | | | | 250,000,000 | | | | 249,999,822 | |
Westpac Banking Corp.(b) | | | 0.231 | % | | | 01/16/2015 | | | | 01/16/2015 | | | | 155,000,000 | | | | 155,000,000 | |
| | | | | | | | | | | | | | | | | | | | |
TOTAL CERTIFICATES OF DEPOSIT | | | | | | | | | | | | 15,528,166,273 | |
| | | | | | | | | | | | | | | | | | | | |
| OTHER NOTES – 3.9% | |
Bank of America NA(a) | | | 0.230 | % | | | 02/09/2015 | | | | 02/09/2015 | | | | 192,000,000 | | | | 192,000,000 | |
Bank of America NA(a) | | | 0.230 | % | | | 02/19/2015 | | | | 02/19/2015 | | | | 234,000,000 | | | | 234,000,000 | |
JPMorgan Chase Bank NA(b) | | | 0.355 | % | | | 03/09/2015 | | | | 01/07/2016 | | | | 260,000,000 | | | | 260,000,000 | |
JPMorgan Chase Bank NA(b) | | | 0.352 | % | | | 01/22/2015 | | | | 01/22/2016 | | | | 175,000,000 | | | | 175,000,000 | |
Royal Bank of Canada(b)(d) | | | 0.322 | % | | | 01/07/2015 | | | | 01/07/2016 | | | | 155,000,000 | | | | 155,000,000 | |
Svenska Handelsbanken AB(b)(d) | | | 0.320 | % | | | 01/27/2015 | | | | 06/26/2015 | | | | 180,000,000 | | | | 180,000,000 | |
Wells Fargo Bank NA(b) | | | 0.328 | % | | | 03/10/2015 | | | | 01/08/2016 | | | | 155,000,000 | | | | 155,000,000 | |
Wells Fargo Bank NA(b) | | | 0.336 | % | | | 01/20/2015 | | | | 01/20/2016 | | | | 227,000,000 | | | | 227,000,000 | |
| | | | | | | | | | | | | | | | | | | | |
TOTAL OTHER NOTES | | | | | | | | | | | | | | | | | | | 1,578,000,000 | |
| | | | | | | | | | | | | | | | | | | | |
See Notes to Financial Statements.
35
State Street Money Market Portfolio
Portfolio of Investments — (continued)
December 31, 2014
| | | | | | | | | | | | | | | | | | | | |
Name of Issuer
and Title of Issue | | Interest
Rate | | | Next Rate
Reset Date | | | Maturity
Date | | | Principal
Amount | | | Value | |
| | | | | | | | | | | | | | | | | | | | |
| GOVERNMENT AGENCY REPURCHASE AGREEMENTS – 1.6% | |
Agreement with Citigroup Global Markets, Inc. and The Bank of New York Mellon (Tri-Party), dated 12/26/2014 (collateralized by various Federal Home Loan Mortgage Corporations, 3.000% – 6.500% due 10/01/2023 – 12/01/2044, Federal National Mortgage Associations, 3.500% – 6.000% due 06/01/2023 – 12/01/2044, Government National Mortgage Associations, 4.000% – 6.000% due 06/15/2040 – 12/20/2044, and a U.S. Treasury Bond, 2.750% due 02/15/2024, valued at $255,000,066); expected proceeds $250,004,375 | | | 0.090 | % | | | 01/02/2015 | | | | 01/02/2015 | | | $ | 250,000,000 | | | $ | 250,000,000 | |
Agreement with Goldman Sachs & Co. and The Bank of New York Mellon (Tri-Party), dated 12/31/2014 (collateralized by Federal Home Loan Mortgage Corporations, 2.500% – 5.500% due 03/01/2024 – 01/01/2045, and Federal National Mortgage Associations, 2.500% – 6.000% due 02/01/2024 – 12/01/2044, valued at $306,000,001); expected proceeds $300,004,667 | | | 0.080 | % | | | 01/07/2015 | | | | 01/07/2015 | | | | 300,000,000 | | | | 300,000,000 | |
Agreement with Goldman Sachs & Co. and The Bank of New York Mellon (Tri-Party), dated 12/31/2014 (collateralized by Federal Home Loan Mortgage Corporations, 2.500% – 6.500% due 04/01/2019 – 11/01/2044, and Federal National Mortgage Associations, 2.500% –6.000% due 12/01/2025 – 12/01/2044, valued at $102,000,000); expected proceeds $100,001,778 | | | 0.080 | % | | | 01/08/2015 | | | | 01/08/2015 | | | | 100,000,000 | | | | 100,000,000 | |
| | | | | | | | | | | | | | | | | | | | |
TOTAL GOVERNMENT AGENCY REPURCHASE AGREEMENTS | | | | | | | | | | | | 650,000,000 | |
| | | | | | | | | | | | | | | | | | | | |
| TREASURY REPURCHASE AGREEMENTS – 34.1% | |
Agreement with Federal Reserve Bank of New York and The Bank of New York Mellon (Tri-Party), dated 12/08/2014 (collateralized by a U.S. Treasury Bond, 2.750% due 08/15/2042, and U.S. Treasury Notes, 1.625% – 2.625% due 08/15/2020 – 08/15/2022, valued at $3,013,254,995); expected proceeds $3,000,186,667 | | | 0.080 | % | | | 01/05/2015 | | | | 01/05/2015 | | | | 3,000,000,000 | | | | 3,000,000,000 | |
See Notes to Financial Statements.
36
State Street Money Market Portfolio
Portfolio of Investments — (continued)
December 31, 2014
| | | | | | | | | | | | | | | | | | | | |
Name of Issuer
and Title of Issue | | Interest
Rate | | | Next Rate
Reset Date | | | Maturity
Date | | | Principal
Amount | | | Value | |
| | | | | | | | | | | | | | | | | | | | |
| TREASURY REPURCHASE AGREEMENTS – (continued) | |
Agreement with Federal Reserve Bank of New York and The Bank of New York Mellon (Tri-Party), dated 12/15/2014 (collateralized by a U.S. Treasury Bond, 4.500% due 05/15/2038, and U.S. Treasury Notes, 1.375% – 4.000% due 08/15/2018 – 08/15/2022, valued at $777,673,569); expected proceeds $775,031,646 | | | 0.070 | % | | | 01/05/2015 | | | | 01/05/2015 | | | $ | 775,000,000 | | | $ | 775,000,000 | |
Agreement with Federal Reserve Bank of New York and The Bank of New York Mellon (Tri-Party), dated 12/29/2014 (collateralized by a U.S. Treasury Bond, 4.500% due 05/15/2038, and U.S. Treasury Notes, 1.625% – 4.000% due 02/28/2018 – 08/15/2022, valued at $1,504,537,044); expected proceeds $1,500,029,167 | | | 0.100 | % | | | 01/05/2015 | | | | 01/05/2015 | | | | 1,500,000,000 | | | | 1,500,000,000 | |
Agreement with Federal Reserve Bank of New York and The Bank of New York Mellon (Tri-Party), dated 12/31/2014 (collateralized by a U.S. Treasury Bond, 2.750% due 08/15/2042, and U.S. Treasury Notes, 1.375% – 4.000% due 02/29/2016 – 11/15/2022, valued at $8,610,023,984); expected proceeds $8,610,023,917 | | | 0.050 | % | | | 01/02/2015 | | | | 01/02/2015 | | | | 8,610,000,000 | | | | 8,610,000,000 | |
| | | | | | | | | | | | | | | | | | | | |
TOTAL TREASURY REPURCHASE AGREEMENTS | | | | | | | | 13,885,000,000 | |
| | | | | | | | | | | | | | | | | | | | |
| OTHER REPURCHASE AGREEMENTS – 3.3% | |
Agreement with Citigroup Global Markets, Inc. and The Bank of New York Mellon (Tri-Party), dated 12/05/2014 (collateralized by a Collateralized Mortgage Obligation, 1.255% due 09/17/2031, and Corporate Bonds, 0.524% – 9.750% due 03/06/2015 – 12/31/2099, valued at $162,328,344); expected proceeds $155,244,125 | | | 0.630 | % | | | 01/02/2015 | | | | 03/05/2015 | | | | 155,000,000 | | | | 155,000,000 | |
Agreement with Credit Suisse Securities (USA) LLC and JP Morgan Chase & Co. (Tri-Party), dated 12/31/2014 (collateralized by various Corporate Bonds, 0.000% – 11.875% due 07/15/2015 – 09/01/2066, Medium Term Notes, 4.300% – 5.017% due 10/17/2021 – 06/26/2024, and U.S. Treasury Notes, 0.250% – 4.250% due 08/15/2015 – 12/31/2018 valued at $487,411,705); expected proceeds $450,185,625 | | | 0.450 | % | | | 01/02/2015 | | | | 02/02/2015 | | | | 450,000,000 | | | | 450,000,000 | |
See Notes to Financial Statements.
37
State Street Money Market Portfolio
Portfolio of Investments — (continued)
December 31, 2014
| | | | | | | | | | | | | | | | | | | | |
Name of Issuer
and Title of Issue | | Interest
Rate | | | Next Rate
Reset Date | | | Maturity
Date | | | Principal
Amount | | | Value | |
| | | | | | | | | | | | | | | | | | | | |
| OTHER REPURCHASE AGREEMENTS – (continued) | |
Agreement with Goldman Sachs & Co. and The Bank of New York Mellon (Tri-Party), dated 12/05/2014 (collateralized by a Common Stock, and U.S. Treasury Strips, 0.000% due 11/15/2031 – 08/15/2043 valued at $128,194,443); expected proceeds $125,125,000 | | | 0.400 | % | | | 01/02/2015 | | | | 03/05/2015 | | | $ | 125,000,000 | | | $ | 125,000,000 | |
Agreement with Goldman Sachs & Co. and The Bank of New York Mellon (Tri-Party), dated 12/19/2014 (collateralized by various Common Stocks, a Corporate Bond, 5.500% due 02/06/2044, and a U.S. Treasury Bill, 0.000% due 01/08/2015 valued at $334,729,030); expected proceeds $310,471,372 | | | 0.460 | % | | | 01/02/2015 | | | | 04/17/2015 | | | | 310,000,000 | | | | 310,000,000 | |
Agreement with JP Morgan Securities, Inc. and JP Morgan Chase & Co. (Tri-Party), dated 12/19/2014 (collateralized by various Corporate Bonds, 0.000% – 9.700% due 03/15/2015 – 03/15/2072 valued at $344,078,912); expected proceeds $320,385,031 | | | 0.364 | % | | | 01/16/2015 | | | | 04/17/2015 | | | | 320,000,000 | | | | 320,000,000 | |
| | | | | | | | | | | | | | | | | | | | |
TOTAL OTHER REPURCHASE AGREEMENTS | | | | | | | | | | | | 1,360,000,000 | |
| | | | | | | | | | | | | | | | | | | | |
TOTAL INVESTMENTS(e)(f) – 100.8% | | | | | | | | | | | | 41,018,040,253 | |
Liabilities in Excess of Other Assets – (0.8)% | | | | | | | | | | | | | | | | | | | (313,572,633 | ) |
| | | | | | | | | | | | | | | | | | | | |
NET ASSETS – 100.0% | | | | | | | | | | | | | | | | | | $ | 40,704,467,620 | |
| | | | | | | | | | | | | | | | | | | | |
| (a) | Rate represents annualized yield at date of purchase |
| (b) | Variable Rate Security – Interest rate shown is rate in effect as of December 31, 2014. |
| (c) | Rule 144A, Section 4(2) or other security, which is restricted to resale to institutional investors. The Portfolio’s investment manager has deemed this security to be liquid based upon procedures approved by the Board of Trustees. These securities represent $5,712,844,664 or 14.03% of net assets as of December 31, 2014. |
| (d) | Security subject to restrictions on resale under federal securities laws, which may only be resold upon registration under the Securities Act of 1933, as amended (“1933 Act”) or in transactions exempt from registration, including sales to qualified institutional buyers pursuant to Rule 144A of the 1933 Act. The Portfolio does not have the right to demand that this security be registered. The Portfolio’s investment manager has deemed this security to be liquid based upon procedures approved by the Board of Trustees. These securities represent $1,159,637,241 or 2.85% of net assets as of December 31, 2014. |
| (e) | Unless otherwise indicated, the values of the securities of the Portfolio are determined based on Level 2 inputs established by provisions surrounding fair value measurements and disclosures (Note 2). |
| (f) | Also represents the cost for federal tax purposes |
See Notes to Financial Statements.
38
State Street Tax Free Money Market Portfolio
Portfolio Statistics (Unaudited)
| | | | |
Portfolio Composition* | | | December 31, 2014 | |
Cash/Money Market Fund | | | 24.4 | % |
General Obligations | | | 18.6 | |
Housing | | | 14.9 | |
Health | | | 7.8 | |
Transportation | | | 7.8 | |
Power | | | 7.3 | |
Education | | | 7.2 | |
Pollution | | | 4.1 | |
Water | | | 2.5 | |
Development | | | 2.1 | |
Industrial Revenue/Pollution Control Revenue | | | 1.5 | |
Airport | | | 1.2 | |
Stadium | | | 0.6 | |
Liabilities in Excess of Other Assets | | | (0.0 | )** |
Total | | | 100.0 | % |
| | | | |
Maturity Ladder* | | | December 31, 2014 | |
Overnight (1 Day) | | | 33.3 | % |
2-30 Days | | | 66.7 | |
31-60 Days | | | 0.0 | |
61-90 Days | | | 0.0 | |
Over 90 Days | | | 0.0 | |
Total | | | 100.0 | % |
Average days to maturity | | | 5 | |
Weighted average life | | | 5 | |
| * | As a percentage of net assets as of the date indicated. The Portfolio’s composition will vary over time. |
| ** | Amount represents less than 0.05% of net assets. |
See Notes to Financial Statements.
39
State Street Tax Free Money Market Portfolio
Portfolio of Investments
December 31, 2014
| | | | | | | | | | | | | | | | | | | | |
Name of Issuer
and Title of Issue | | Interest
Rate | | | Next Rate
Reset Date | | | Maturity
Date | | | Principal
Amount | | | Value | |
| | | | | | | | | | | | | | | | | | | | |
| VARIABLE RATE DEMAND NOTES – 75.6% | |
| California – 6.9% | |
California Infrastructure & Economic Development Bank, Revenue Bonds, Pacific Gas & Electric Co., LOC: Sumitomo Mitsui Banking(a) | | | 0.010 | % | | | 01/02/2015 | | | | 01/02/2015 | | | $ | 2,000,000 | | | $ | 2,000,000 | |
California Infrastructure & Economic Development Bank, Revenue Bonds, Pacific Gas & Electric Co., Series D, LOC: Sumitomo Mitsui Banking(a) | | | 0.010 | % | | | 01/02/2015 | | | | 01/02/2015 | | | | 4,875,000 | | | | 4,875,000 | |
City of Hemet, Multi Family Housing Revenue Bonds, Sunwest Retirement, Series A, LIQ: FHLMC(a) | | | 0.050 | % | | | 01/07/2015 | | | | 01/07/2015 | | | | 1,500,000 | | | | 1,500,000 | |
East Bay Municipal Utility District, System Revenue Bonds, Series A-2, RMKT 01/12/11, SPA: Barclays Bank PLC(a) | | | 0.020 | % | | | 01/07/2015 | | | | 01/07/2015 | | | | 2,630,000 | | | | 2,630,000 | |
Lancaster Redevelopment Agency, Multi Family Housing Revenue Bonds, 20th Street Apartments Project, Series C, LIQ: FNMA(a) | | | 0.050 | % | | | 01/07/2015 | | | | 01/07/2015 | | | | 1,000,000 | | | | 1,000,000 | |
San Francisco City & County Airports Commission, Revenue Bonds, Second Series 36-A, RMKT 06/02/09, LOC: U.S. Bank N.A.(a) | | | 0.020 | % | | | 01/07/2015 | | | | 01/07/2015 | | | | 3,000,000 | | | | 3,000,000 | |
State of California, GO Unlimited, Series A, LOC: Royal Bank of Canada(a) | | | 0.020 | % | | | 01/07/2015 | | | | 01/07/2015 | | | | 2,500,000 | | | | 2,500,000 | |
| | | | | | | | | | | | | | | | | | | | |
| | | | | | | | | | | | | | | | | | | 17,505,000 | |
| | | | | | | | | | | | | | | | | | | | |
| Colorado – 5.2% | |
Colorado Housing & Finance Authority, Revenue Bonds, Multi Family, Class I A-1, SPA: FHLB(a) | | | 0.020 | % | | | 01/07/2015 | | | | 01/07/2015 | | | | 5,445,000 | | | | 5,445,000 | |
Colorado Housing & Finance Authority, Revenue Bonds, Single Family, Series B-3, SPA: Barclays Bank PLC, LIQ: FHA(a) | | | 0.020 | % | | | 01/07/2015 | | | | 01/07/2015 | | | | 4,000,000 | | | | 4,000,000 | |
Southern Ute Indian Tribe of Southern Ute Indian Reservation, Revenue Bonds(a) | | | 0.070 | % | | | 01/07/2015 | | | | 01/07/2015 | | | | 3,700,000 | | | | 3,700,000 | |
| | | | | | | | | | | | | | | | | | | | |
| | | | | | | | | | | | | | | | | | | 13,145,000 | |
| | | | | | | | | | | | | | | | | | | | |
| Connecticut – 6.8% | |
Connecticut Housing Finance Authority, Revenue Bonds, Mortgage Finance Program, Subseries B-6, SPA: Bank of Tokyo-Mitsubishi UFJ(a) | | | 0.040 | % | | | 01/07/2015 | | | | 01/07/2015 | | | | 3,000,000 | | | | 3,000,000 | |
Connecticut Housing Finance Authority, Revenue Bonds, Subseries E-3, INS: Government Authority, SPA: Bank of Tokyo-Mitsubishi UFJ(a) | | | 0.040 | % | | | 01/07/2015 | | | | 01/07/2015 | | | | 4,750,000 | | | | 4,750,000 | |
See Notes to Financial Statements.
40
State Street Tax Free Money Market Portfolio
Portfolio of Investments — (continued)
December 31, 2014
| | | | | | | | | | | | | | | | | | | | |
Name of Issuer
and Title of Issue | | Interest
Rate | | | Next Rate
Reset Date | | | Maturity
Date | | | Principal
Amount | | | Value | |
| | | | | | | | | | | | | | | | | | | | |
| VARIABLE RATE DEMAND NOTES – (continued) | |
| Connecticut – (continued) | |
Connecticut State Health & Educational Facility Authority, Revenue Bonds, Yale University, Series U-2(a) | | | 0.020 | % | | | 01/07/2015 | | | | 01/07/2015 | | | $ | 9,480,000 | | | $ | 9,480,000 | |
| | | | | | | | | | | | | | | | | | | | |
| | | | | | | | | | | | | | | | | | | 17,230,000 | |
| | | | | | | | | | | | | | | | | | | | |
| Delaware – 2.7% | |
Delaware River & Bay Authority, Revenue Bonds, LOC: TD Bank N.A.(a) | | | 0.030 | % | | | 01/07/2015 | | | | 01/07/2015 | | | | 6,900,000 | | | | 6,900,000 | |
| | | | | | | | | | | | | | | | | | | | |
| Florida – 0.9% | |
JEA Electric System, Revenue Bonds, Series 3-A, SPA: Royal Bank of Canada(a) | | | 0.020 | % | | | 01/07/2015 | | | | 01/07/2015 | | | | 2,415,000 | | | | 2,415,000 | |
| | | | | | | | | | | | | | | | | | | | |
| Indiana – 4.5% | |
City of Indianapolis, Revenue Bonds, Lakeside Pointe and Fox Club, LIQ: FNMA(a) | | | 0.060 | % | | | 01/07/2015 | | | | 01/07/2015 | | | | 2,000,000 | | | | 2,000,000 | |
Indiana Finance Authority, Hospital Revenue Bonds, Indiana University Health, Series C, LOC: Northern Trust Company(a) | | | 0.020 | % | | | 01/07/2015 | | | | 01/07/2015 | | | | 9,295,000 | | | | 9,295,000 | |
| | | | | | | | | | | | | | | | | | | | |
| | | | | | | | | | | | | | | | | | | 11,295,000 | |
| | | | | | | | | | | | | | | | | | | | |
| Maryland – 2.0% | |
Maryland State Health & Higher Educational Facilities Authority, Revenue Bonds, University of Maryland Medical System, Class A, LOC: Wachovia Bank N.A.(a) | | | 0.060 | % | | | 01/07/2015 | | | | 01/07/2015 | | | | 3,545,000 | | | | 3,545,000 | |
Maryland State Stadium Authority Lease, Revenue Bonds, Football Stadium, SPA: Sumitomo Mitsui Banking(a) | | | 0.040 | % | | | 01/07/2015 | | | | 01/07/2015 | | | | 1,520,000 | | | | 1,520,000 | |
| | | | | | | | | | | | | | | | | | | | |
| | | | | | | | | | | | | | | | | | | 5,065,000 | |
| | | | | | | | | | | | | | | | | | | | |
| Massachusetts – 6.8% | |
Commonwealth of Massachusetts, Central Artery, GO Limited, Series B, SPA: U.S. Bank N.A.(a) | | | 0.020 | % | | | 01/02/2015 | | | | 01/02/2015 | | | | 4,465,000 | | | | 4,465,000 | |
Massachusetts Bay Transportation Authority, Revenue Bonds, Senior Series A-1, SPA: JP Morgan Chase Bank(a) | | | 0.030 | % | | | 01/07/2015 | | | | 01/07/2015 | | | | 7,900,000 | | | | 7,900,000 | |
Massachusetts Bay Transportation Authority, Revenue Bonds, Series A1, RMKT 09/30/11, INS: Government Authority, SPA: Barclays Bank PLC(a) | | | 0.010 | % | | | 01/07/2015 | | | | 01/07/2015 | | | | 4,835,000 | | | | 4,835,000 | |
| | | | | | | | | | | | | | | | | | | | |
| | | | | | | | | | | | | | | | | | | 17,200,000 | |
| | | | | | | | | | | | | | | | | | | | |
| Michigan – 1.2% | |
Michigan State University, Revenue Bonds, Series A, SPA: JP Morgan Chase Bank(a) | | | 0.010 | % | | | 01/07/2015 | | | | 01/07/2015 | | | | 3,000,000 | | | | 3,000,000 | |
| | | | | | | | | | | | | | | | | | | | |
See Notes to Financial Statements.
41
State Street Tax Free Money Market Portfolio
Portfolio of Investments — (continued)
December 31, 2014
| | | | | | | | | | | | | | | | | | | | |
Name of Issuer
and Title of Issue | | Interest
Rate | | | Next Rate
Reset Date | | | Maturity
Date | | | Principal
Amount | | | Value | |
| | | | | | | | | | | | | | | | | | | | |
| VARIABLE RATE DEMAND NOTES – (continued) | |
| Minnesota – 0.6% | |
City of Minneapolis, Revenue Bonds, University Gateway Project, SPA: Wells Fargo Bank N.A.(a) | | | 0.040 | % | | | 01/07/2015 | | | | 01/07/2015 | | | $ | 1,635,000 | | | $ | 1,635,000 | |
| | | | | | | | | | | | | | | | | | | | |
| Missouri – 2.4% | |
Missouri Development Finance Board Cultural Facilities Revenue Bonds, Nelson Gallery Foundation, Series A, SPA: Northern Trust Company(a) | | | 0.030 | % | | | 01/02/2015 | | | | 01/02/2015 | | | | 5,000,000 | | | | 5,000,000 | |
Missouri State Health & Educational Facilities Authority, Revenue Bonds, Washington University, Series B, SPA: Wells Fargo Bank N.A.(a) | | | 0.030 | % | | | 01/02/2015 | | | | 01/02/2015 | | | | 1,000,000 | | | | 1,000,000 | |
| | | | | | | | | | | | | | | | | | | | |
| | | | | | | | | | | | | | | | | | | 6,000,000 | |
| | | | | | | | | | | | | | | | | | | | |
| New Hampshire – 1.3% | |
New Hampshire Health & Education Facilities Authority, Revenue Bonds, Dartmouth College, SPA: JP Morgan Chase Bank(a) | | | 0.030 | % | | | 01/07/2015 | | | | 01/07/2015 | | | | 3,375,000 | | | | 3,375,000 | |
| | | | | | | | | | | | | | | | | | | | |
| New York – 4.7% | |
New York City Transitional Finance Authority, Revenue Bonds, New York City Recovery, Series 3, Subseries 3-F, SPA: Royal Bank of Canada(a) | | | 0.030 | % | | | 01/02/2015 | | | | 01/02/2015 | | | | 2,500,000 | | | | 2,500,000 | |
New York City Transitional Finance Authority, Revenue Bonds, New York City Recovery, Series 3, Subseries 3-H, SPA: Royal Bank of Canada(a) | | | 0.030 | % | | | 01/02/2015 | | | | 01/02/2015 | | | | 2,685,000 | | | | 2,685,000 | |
New York State Dormitory Authority, Revenue Bonds, Cornell University, Series A, SPA: JP Morgan Chase Bank(a) | | | 0.040 | % | | | 01/07/2015 | | | | 01/07/2015 | | | | 1,900,000 | | | | 1,900,000 | |
New York State Dormitory Authority, Revenue Bonds, Rockefeller University, Series A, SPA: JP Morgan Chase Bank(a) | | | 0.040 | % | | | 01/07/2015 | | | | 01/07/2015 | | | | 3,520,000 | | | | 3,520,000 | |
New York State Dormitory Authority, Revenue Bonds, Rockefeller University, Series B, SPA: U.S. Bank N.A.(a) | | | 0.040 | % | | | 01/07/2015 | | | | 01/07/2015 | | | | 1,300,000 | | | | 1,300,000 | |
| | | | | | | | | | | | | | | | | | | | |
| | | | | | | | | | | | | | | | | | | 11,905,000 | |
| | | | | | | | | | | | | | | | | | | | |
| North Carolina – 11.3% | |
Charlotte COPs, Convention Facility Project, Series B, SPA: Wachovia Bank N.A.(a) | | | 0.060 | % | | | 01/07/2015 | | | | 01/07/2015 | | | | 2,250,000 | | | | 2,250,000 | |
City of Wilmington, GO Unlimited, SPA: Wells Fargo Bank N.A.(a) | | | 0.020 | % | | | 01/07/2015 | | | | 01/07/2015 | | | | 900,000 | | | | 900,000 | |
County of Guilford, GO Unlimited, Series B, SPA: Wells Fargo Bank N.A.(a) | | | 0.030 | % | | | 01/07/2015 | | | | 01/07/2015 | | | | 8,185,000 | | | | 8,185,000 | |
See Notes to Financial Statements.
42
State Street Tax Free Money Market Portfolio
Portfolio of Investments — (continued)
December 31, 2014
| | | | | | | | | | | | | | | | | | | | |
Name of Issuer
and Title of Issue | | Interest
Rate | | | Next Rate
Reset Date | | | Maturity
Date | | | Principal
Amount | | | Value | |
| | | | | | | | | | | | | | | | | | | | |
| VARIABLE RATE DEMAND NOTES – (continued) | |
| North Carolina – (continued) | |
County of Wake, GO Unlimited, Series B, SPA: Wells Fargo Bank N.A.(a) | | | 0.030 | % | | | 01/07/2015 | | | | 01/07/2015 | | | $ | 3,100,000 | | | $ | 3,100,000 | |
County of Wake, GO Unlimited, Series C, SPA: Wells Fargo Bank N.A.(a) | | | 0.030 | % | | | 01/07/2015 | | | | 01/07/2015 | | | | 3,000,000 | | | | 3,000,000 | |
County of Wake, GO Unlimited, Series C, SPA: Wells Fargo Bank N.A.(a) | | | 0.030 | % | | | 01/07/2015 | | | | 01/07/2015 | | | | 4,100,000 | | | | 4,100,000 | |
North Carolina Medical Care Commission & Health Care facilities, Revenue Bonds, Novant Health Group, Series A, SPA: JP Morgan Chase Bank N.A.(a) | | | 0.060 | % | | | 01/07/2015 | | | | 01/07/2015 | | | | 7,000,000 | | | | 7,000,000 | |
| | | | | | | | | | | | | | | | | | | | |
| | | | | | | | | | | | | | | | | | | 28,535,000 | |
| | | | | | | | | | | | | | | | | | | | |
| Ohio – 3.0% | |
Ohio Air Quality Development Authority, Revenue Bonds, Ohio Valley Electric Corp., Series B, LOC: Bank of Nova Scotia(a) | | | 0.040 | % | | | 01/07/2015 | | | | 01/07/2015 | | | | 7,500,000 | | | | 7,500,000 | |
| | | | | | | | | | | | | | | | | | | | |
| Oregon – 3.4% | |
State of Oregon, GO Unlimited, Veterans Welfare Bonds, Series 84, SPA: Bank of Tokyo-Mitsubishi UFJ(a) | | | 0.020 | % | | | 01/07/2015 | | | | 01/07/2015 | | | | 7,600,000 | | | | 7,600,000 | |
State of Oregon, GO Unlimited, Veterans Welfare Bonds, Series 90-B, SPA: Bank of Tokyo-Mitsubishi UFJ(a) | | | 0.030 | % | | | 01/07/2015 | | | | 01/07/2015 | | | | 920,000 | | | | 920,000 | |
| | | | | | | | | | | | | | | | | | | | |
| | | | | | | | | | | | | | | | | | | 8,520,000 | |
| | | | | | | | | | | | | | | | | | | | |
| Pennsylvania – 1.5% | |
City of Philadelphia Water & Wastewater, Revenue Bonds, Series B, RMKT 09/10/08, LOC: TD Bank N.A.(a) | | | 0.030 | % | | | 01/07/2015 | | | | 01/07/2015 | | | | 3,765,000 | | | | 3,765,000 | |
| | | | | | | | | | | | | | | | | | | | |
| Rhode Island – 2.6% | |
Rhode Island Health & Educational Building Corp., Revenue Bonds, Bryant University, LOC: TD Bank N.A.(a) | | | 0.020 | % | | | 01/07/2015 | | | | 01/07/2015 | | | | 6,555,000 | | | | 6,555,000 | |
| | | | | | | | | | | | | | | | | | | | |
| South Carolina – 2.0% | |
City of North Charleston, Tax Increment Revenue Bonds, Charleston Naval Complex, SPA: Bank of America N.A.(a) | | | 0.030 | % | | | 01/07/2015 | | | | 01/07/2015 | | | | 5,055,000 | | | | 5,055,000 | |
| | | | | | | | | | | | | | | | | | | | |
| Texas – 0.8% | |
Harris County Health Facilities Development Corps., Revenue Bonds, Texas Children’s, Series B-1, RMKT 02/02/09, SPA: JP Morgan Chase Bank(a) | | | 0.030 | % | | | 01/07/2015 | | | | 01/07/2015 | | | | 2,080,000 | | | | 2,080,000 | |
| | | | | | | | | | | | | | | | | | | | |
| Utah – 1.2% | |
County of Utah UT, Revenue Bonds, Series B, IHC Health Services, Inc.,(a) | | | 0.040 | % | | | 01/07/2015 | | | | 01/07/2015 | | | | 3,100,000 | | | | 3,100,000 | |
| | | | | | | | | | | | | | | | | | | | |
See Notes to Financial Statements.
43
State Street Tax Free Money Market Portfolio
Portfolio of Investments — (continued)
December 31, 2014
| | | | | | | | | | | | | | | | | | | | |
Name of Issuer
and Title of Issue | | Interest
Rate | | | Next Rate
Reset Date | | | Maturity
Date | | | Principal
Amount | | | Value | |
| VARIABLE RATE DEMAND NOTES – (continued) | |
| Washington – 2.6% | |
Washington State Housing Finance Commission, Revenue Bonds, INS: FHLMC, LOC: Bank of America N.A.(a) | | | 0.050 | % | | | 01/07/2015 | | | | 01/07/2015 | | | $ | 1,605,000 | | | $ | 1,605,000 | |
Washington State Housing Finance Commission, Revenue Bonds, New Haven Apartments, INS: FNMA, LIQ: FNMA(a) | | | 0.050 | % | | | 01/07/2015 | | | | 01/07/2015 | | | | 5,000,000 | | | | 5,000,000 | |
| | | | | | | | | | | | | | | | | | | | |
| | | | | | | | | | | | | | | | | | | 6,605,000 | |
| | | | | | | | | | | | | | | | | | | | |
| West Virginia – 1.2% | |
West Virginia Economic Development Authority, Solid Waste Disposal Facilities, Appalachian Power Corp., Series B, LOC: Sumitomo Mitsui Banking(a) | | | 0.040 | % | | | 01/07/2015 | | | | 01/07/2015 | | | | 3,000,000 | | | | 3,000,000 | |
| | | | | | | | | | | | | | | | | | | | |
TOTAL VARIABLE RATE DEMAND NOTES | | | | | | | | | | | | | | | | | | | 191,385,000 | |
| | | | | | | | | | | | | | | | | | | | |
| | | | | |
| | | | | | | | | | | | Shares | | | | |
INVESTMENT COMPANY – 24.4% | |
Dreyfus Tax Exempt Cash Management Fund Investor Shares 0.07%(b)(c) | | | | | | | | | | | | | | | 61,856,729 | | | | 61,856,729 | |
| | | | | | | | | | | | | | | | | | | | |
TOTAL INVESTMENTS(d)(e) – 100.0% | | | | | | | | | | | | | | | | | | | 253,241,729 | |
Liabilities in Excess of Other Assets – (0.0)%(f) | | | | | | | | | | | | | | | | | | | (46,418 | ) |
| | | | | | | | | | | | | | | | | | | | |
NET ASSETS – 100.0% | | | | | | | | | | | | | | | | | | $ | 253,195,311 | |
| | | | | | | | | | | | | | | | | | | | |
| (a) | Variable Rate Security – Interest rate shown is rate in effect as of December 31, 2014. |
| (b) | Value determined based on Level 1 inputs established by provisions surrounding fair value measurements and disclosures |
| (c) | The rate shown is the annualized seven-day yield at period end. |
| (d) | Unless otherwise indicated, the values of the securities of the Portfolio are determined based on Level 2 inputs established by provisions surrounding fair value measurements and disclosures (Note 2). |
| (e) | Also represents the cost for federal tax purposes |
| (f) | Amount represents less than 0.05% of net assets |
| | |
Acronym | | Name |
| COP | | Certificates of Participation |
| FHA | | Federal Housing Administration |
| FHLB | | Federal Home Loan Bank |
| FHLMC | | Federal Home Loan Mortgage Corp. |
| FNMA | | Federal National Mortgage Association |
| GO | | General Obligation |
| INS | | Insured |
| LIQ | | Liquidity Agreement |
| LOC | | Letter of Credit |
| RMKT | | Remarketable |
| SPA | | Standby Purchase Agreement |
See Notes to Financial Statements.
44
State Street U.S. Government Money Market Portfolio
Portfolio Statistics (Unaudited)
| | | | |
Portfolio Composition* | | | December 31, 2014 | |
Government Agency Debt | | | 69.4 | % |
Treasury Repurchase Agreements | | | 15.2 | |
Treasury Debt | | | 8.7 | |
Government Agency Repurchase Agreements | | | 1.0 | |
Assets in Excess of Other Liabilities | | | 5.7 | |
Total | | | 100.0 | % |
| | | | |
Maturity Ladder* | | | December 31, 2014 | |
Overnight (1 Day) | | | 13.0 | % |
2-30 Days | | | 34.8 | |
31-60 Days | | | 17.4 | |
61-90 Days | | | 10.4 | |
Over 90 Days | | | 18.7 | |
Total | | | 94.3 | % |
Average days to maturity | | | 41 | |
Weighted average life | | | 48 | |
| * | As a percentage of net assets as of the date indicated. The Portfolio’s composition will vary over time. |
See Notes to Financial Statements.
45
State Street U.S. Government Money Market Portfolio
Portfolio of Investments
December 31, 2014
| | | | | | | | | | | | | | | | | | | | |
Name of Issuer
and Title of Issue | | Interest
Rate | | | Next Rate
Reset Date | | | Maturity
Date | | | Principal
Amount | | | Value | |
| | | | | | | | | | | | | | | | | | | | |
| GOVERNMENT AGENCY DEBT – 69.4% | |
Federal Farm Credit Bank(a) | | | 0.102 | % | | | 01/15/2015 | | | | 01/15/2015 | | | $ | 30,000,000 | | | $ | 29,998,833 | |
Federal Farm Credit Bank(b) | | | 0.103 | % | | | 01/05/2015 | | | | 03/04/2015 | | | | 111,000,000 | | | | 110,998,970 | |
Federal Farm Credit Bank(a) | | | 0.130 | % | | | 03/17/2015 | | | | 03/17/2015 | | | | 25,000,000 | | | | 24,993,229 | |
Federal Farm Credit Bank(a) | | | 0.081 | % | | | 04/21/2015 | | | | 04/21/2015 | | | | 42,000,000 | | | | 41,989,733 | |
Federal Home Loan Bank(a) | | | 0.046 | % | | | 01/07/2015 | | | | 01/07/2015 | | | | 132,000,000 | | | | 131,999,010 | |
Federal Home Loan Bank(a) | | | 0.048 | % | | | 01/07/2015 | | | | 01/07/2015 | | | | 165,000,000 | | | | 164,998,707 | |
Federal Home Loan Bank(a) | | | 0.051 | % | | | 01/07/2015 | | | | 01/07/2015 | | | | 28,000,000 | | | | 27,999,767 | |
Federal Home Loan Bank(a) | | | 0.097 | % | | | 01/07/2015 | | | | 01/07/2015 | | | | 50,000,000 | | | | 49,999,208 | |
Federal Home Loan Bank(a) | | | 0.100 | % | | | 01/07/2015 | | | | 01/07/2015 | | | | 46,000,000 | | | | 45,999,249 | |
Federal Home Loan Bank(a) | | | 0.102 | % | | | 01/16/2015 | | | | 01/16/2015 | | | | 20,000,000 | | | | 19,999,167 | |
Federal Home Loan Bank(b) | | | 0.109 | % | | | 01/20/2015 | | | | 01/20/2015 | | | | 212,000,000 | | | | 211,999,455 | |
Federal Home Loan Bank(a) | | | 0.111 | % | | | 01/20/2015 | | | | 01/20/2015 | | | | 174,000,000 | | | | 174,000,000 | |
Federal Home Loan Bank(a) | | | 0.063 | % | | | 01/21/2015 | | | | 01/21/2015 | | | | 125,000,000 | | | | 124,995,694 | |
Federal Home Loan Bank(a) | | | 0.107 | % | | | 01/21/2015 | | | | 01/21/2015 | | | | 50,000,000 | | | | 49,997,083 | |
Federal Home Loan Bank(a) | | | 0.102 | % | | | 01/23/2015 | | | | 01/23/2015 | | | | 40,000,000 | | | | 39,997,556 | |
Federal Home Loan Bank(a) | | | 0.102 | % | | | 01/23/2015 | | | | 01/23/2015 | | | | 50,000,000 | | | | 49,996,944 | |
Federal Home Loan Bank(a) | | | 0.080 | % | | | 01/26/2015 | | | | 01/26/2015 | | | | 5,920,000 | | | | 5,919,671 | |
Federal Home Loan Bank(a) | | | 0.066 | % | | | 01/28/2015 | | | | 01/28/2015 | | | | 450,000,000 | | | | 449,978,062 | |
Federal Home Loan Bank(a) | | | 0.069 | % | | | 01/28/2015 | | | | 01/28/2015 | | | | 87,000,000 | | | | 86,995,628 | |
Federal Home Loan Bank(a) | | | 0.071 | % | | | 01/30/2015 | | | | 01/30/2015 | | | | 185,000,000 | | | | 184,989,568 | |
Federal Home Loan Bank(a) | | | 0.102 | % | | | 01/30/2015 | | | | 01/30/2015 | | | | 102,000,000 | | | | 101,991,783 | |
Federal Home Loan Bank(a) | | | 0.102 | % | | | 01/30/2015 | | | | 01/30/2015 | | | | 70,000,000 | | | | 69,994,361 | |
Federal Home Loan Bank(a) | | | 0.092 | % | | | 02/06/2015 | | | | 02/06/2015 | | | | 125,600,000 | | | | 125,588,696 | |
Federal Home Loan Bank(a) | | | 0.094 | % | | | 02/06/2015 | | | | 02/06/2015 | | | | 38,000,000 | | | | 37,996,504 | |
Federal Home Loan Bank(a) | | | 0.102 | % | | | 02/06/2015 | | | | 02/06/2015 | | | | 160,000,000 | | | | 159,984,000 | |
Federal Home Loan Bank(a) | | | 0.102 | % | | | 02/11/2015 | | | | 02/11/2015 | | | | 27,900,000 | | | | 27,896,823 | |
Federal Home Loan Bank(a) | | | 0.098 | % | | | 02/13/2015 | | | | 02/13/2015 | | | | 233,000,000 | | | | 232,973,283 | |
Federal Home Loan Bank(a) | | | 0.102 | % | | | 02/13/2015 | | | | 02/13/2015 | | | | 29,000,000 | | | | 28,996,536 | |
Federal Home Loan Bank(a) | | | 0.100 | % | | | 02/18/2015 | | | | 02/18/2015 | | | | 50,000,000 | | | | 49,993,467 | |
Federal Home Loan Bank(a) | | | 0.097 | % | | | 02/20/2015 | | | | 02/20/2015 | | | | 50,000,000 | | | | 49,993,403 | |
Federal Home Loan Bank(a) | | | 0.099 | % | | | 02/25/2015 | | | | 02/25/2015 | | | | 193,000,000 | | | | 192,971,398 | |
Federal Home Loan Bank(a) | | | 0.102 | % | | | 02/25/2015 | | | | 02/25/2015 | | | | 100,000,000 | | | | 99,984,722 | |
Federal Home Loan Bank(a) | | | 0.107 | % | | | 02/25/2015 | | | | 02/25/2015 | | | | 160,000,000 | | | | 159,974,333 | |
Federal Home Loan Bank(a) | | | 0.107 | % | | | 03/04/2015 | | | | 03/04/2015 | | | | 87,000,000 | | | | 86,983,968 | |
Federal Home Loan Bank(a) | | | 0.108 | % | | | 03/05/2015 | | | | 03/05/2015 | | | | 156,750,000 | | | | 156,747,793 | |
Federal Home Loan Bank(b) | | | 0.110 | % | | | 03/06/2015 | | | | 03/06/2015 | | | | 30,000,000 | | | | 29,999,765 | |
Federal Home Loan Bank(b) | | | 0.128 | % | | | 03/18/2015 | | | | 03/18/2015 | | | | 125,580,000 | | | | 125,580,675 | |
Federal Home Loan Bank(a) | | | 0.086 | % | | | 04/22/2015 | | | | 04/22/2015 | | | | 65,000,000 | | | | 64,982,965 | |
Federal Home Loan Bank(a) | | | 0.091 | % | | | 04/24/2015 | | | | 04/24/2015 | | | | 168,000,000 | | | | 167,952,540 | |
Federal Home Loan Bank(a) | | | 0.093 | % | | | 04/29/2015 | | | | 04/29/2015 | | | | 40,650,000 | | | | 40,637,742 | |
Federal Home Loan Bank(a) | | | 0.095 | % | | | 04/29/2015 | | | | 04/29/2015 | | | | 36,000,000 | | | | 35,988,908 | |
See Notes to Financial Statements.
46
State Street U.S. Government Money Market Portfolio
Portfolio of Investments — (continued)
December 31, 2014
| | | | | | | | | | | | | | | | | | | | |
Name of Issuer
and Title of Issue | | Interest
Rate | | | Next Rate
Reset Date | | | Maturity
Date | | | Principal
Amount | | | Value | |
| | | | | | | | | | | | | | | | | | | | |
| GOVERNMENT AGENCY DEBT – (continued) | |
Federal Home Loan Bank(a) | | | 0.140 | % | | | 06/03/2015 | | | | 06/03/2015 | | | $ | 40,000,000 | | | $ | 39,976,540 | |
Federal Home Loan Bank(a) | | | 0.142 | % | | | 06/03/2015 | | | | 06/03/2015 | | | | 7,000,000 | | | | 6,995,835 | |
Federal Home Loan Mortgage Corp.(a) | | | 0.092 | % | | | 01/05/2015 | | | | 01/05/2015 | | | | 62,000,000 | | | | 61,999,380 | |
Federal Home Loan Mortgage Corp.(a) | | | 0.041 | % | | | 01/12/2015 | | | | 01/12/2015 | | | | 38,000,000 | | | | 37,999,536 | |
Federal Home Loan Mortgage Corp.(a) | | | 0.051 | % | | | 01/12/2015 | | | | 01/12/2015 | | | | 38,000,000 | | | | 37,999,419 | |
Federal Home Loan Mortgage Corp.(a) | | | 0.087 | % | | | 01/12/2015 | | | | 01/12/2015 | | | | 88,800,000 | | | | 88,797,694 | |
Federal Home Loan Mortgage Corp.(a) | | | 0.097 | % | | | 01/12/2015 | | | | 01/12/2015 | | | | 26,000,000 | | | | 25,999,245 | |
Federal Home Loan Mortgage Corp.(a) | | | 0.072 | % | | | 01/13/2015 | | | | 01/13/2015 | | | | 55,100,000 | | | | 55,098,714 | |
Federal Home Loan Mortgage Corp.(a) | | | 0.097 | % | | | 01/13/2015 | | | | 01/13/2015 | | | | 25,000,000 | | | | 24,999,208 | |
Federal Home Loan Mortgage Corp.(a) | | | 0.041 | % | | | 01/16/2015 | | | | 01/16/2015 | | | | 27,000,000 | | | | 26,999,550 | |
Federal Home Loan Mortgage Corp.(a) | | | 0.087 | % | | | 01/16/2015 | | | | 01/16/2015 | | | | 19,900,000 | | | | 19,899,295 | |
Federal Home Loan Mortgage Corp.(a) | | | 0.092 | % | | | 01/22/2015 | | | | 01/22/2015 | | | | 137,000,000 | | | | 136,992,807 | |
Federal Home Loan Mortgage Corp.(a) | | | 0.092 | % | | | 01/23/2015 | | | | 01/23/2015 | | | | 113,000,000 | | | | 112,993,785 | |
Federal Home Loan Mortgage Corp.(a) | | | 0.041 | % | | | 01/28/2015 | | | | 01/28/2015 | | | | 151,000,000 | | | | 150,995,470 | |
Federal Home Loan Mortgage Corp.(a) | | | 0.071 | % | | | 01/28/2015 | | | | 01/28/2015 | | | | 18,900,000 | | | | 18,899,008 | |
Federal Home Loan Mortgage Corp.(a) | | | 0.092 | % | | | 02/02/2015 | | | | 02/02/2015 | | | | 38,000,000 | | | | 37,996,960 | |
Federal Home Loan Mortgage Corp.(a) | | | 0.090 | % | | | 02/03/2015 | | | | 02/03/2015 | | | | 99,750,000 | | | | 99,741,771 | |
Federal Home Loan Mortgage Corp.(a) | | | 0.087 | % | | | 02/04/2015 | | | | 02/04/2015 | | | | 103,750,000 | | | | 103,741,671 | |
Federal Home Loan Mortgage Corp.(a) | | | 0.103 | % | | | 02/10/2015 | | | | 02/10/2015 | | | | 31,112,000 | | | | 31,108,543 | |
Federal Home Loan Mortgage Corp.(a) | | | 0.091 | % | | | 03/02/2015 | | | | 03/02/2015 | | | | 187,000,000 | | | | 186,971,950 | |
Federal Home Loan Mortgage Corp.(a) | | | 0.076 | % | | | 03/03/2015 | | | | 03/03/2015 | | | | 195,000,000 | | | | 195,076,931 | |
Federal Home Loan Mortgage Corp.(a) | | | 0.096 | % | | | 03/05/2015 | | | | 03/05/2015 | | | | 50,000,000 | | | | 49,991,688 | |
Federal Home Loan Mortgage Corp.(a) | | | 0.085 | % | | | 03/09/2015 | | | | 03/09/2015 | | | | 70,000,000 | | | | 69,988,926 | |
Federal Home Loan Mortgage Corp.(a) | | | 0.055 | % | | | 03/12/2015 | | | | 03/12/2015 | | | | 51,000,000 | | | | 50,994,546 | |
Federal Home Loan Mortgage Corp.(a) | | | 0.095 | % | | | 03/16/2015 | | | | 03/16/2015 | | | | 84,000,000 | | | | 83,983,597 | |
Federal Home Loan Mortgage Corp.(a) | | | 0.070 | % | | | 03/25/2015 | | | | 03/25/2015 | | | | 110,000,000 | | | | 109,982,247 | |
Federal Home Loan Mortgage Corp.(a) | | | 0.071 | % | | | 04/01/2015 | | | | 04/01/2015 | | | | 173,000,000 | | | | 172,969,725 | |
Federal Home Loan Mortgage Corp.(a) | | | 0.111 | % | | | 04/13/2015 | | | | 04/13/2015 | | | | 195,000,000 | | | | 194,939,225 | |
Federal Home Loan Mortgage Corp.(a) | | | 0.096 | % | | | 04/14/2015 | | | | 04/14/2015 | | | | 100,000,000 | | | | 99,972,819 | |
Federal Home Loan Mortgage Corp.(a) | | | 0.096 | % | | | 04/24/2015 | | | | 04/24/2015 | | | | 100,000,000 | | | | 99,970,181 | |
Federal Home Loan Mortgage Corp.(a) | | | 0.101 | % | | | 04/24/2015 | | | | 04/24/2015 | | | | 75,700,000 | | | | 75,676,239 | |
Federal Home Loan Mortgage Corp.(a) | | | 0.101 | % | | | 05/05/2015 | | | | 05/05/2015 | | | | 61,400,000 | | | | 61,378,851 | |
Federal Home Loan Mortgage Corp.(a) | | | 0.091 | % | | | 05/08/2015 | | | | 05/08/2015 | | | | 125,000,000 | | | | 124,960,312 | |
Federal Home Loan Mortgage Corp.(a) | | | 0.111 | % | | | 05/11/2015 | | | | 05/11/2015 | | | | 18,182,000 | | | | 18,174,778 | |
Federal Home Loan Mortgage Corp.(a) | | | 0.111 | % | | | 05/26/2015 | | | | 05/26/2015 | | | | 78,000,000 | | | | 77,965,442 | |
Federal Home Loan Mortgage Corp.(a) | | | 0.132 | % | | | 06/08/2015 | | | | 06/08/2015 | | | | 67,500,000 | | | | 67,461,487 | |
Federal Home Loan Mortgage Corp.(a) | | | 0.133 | % | | | 06/08/2015 | | | | 06/08/2015 | | | | 70,000,000 | | | | 69,959,754 | |
Federal Home Loan Mortgage Corp.(a) | | | 0.150 | % | | | 06/15/2015 | | | | 06/15/2015 | | | | 84,000,000 | | | | 83,943,020 | |
Federal Home Loan Mortgage Corp.(a) | | | 0.152 | % | | | 06/15/2015 | | | | 06/15/2015 | | | | 20,000,000 | | | | 19,986,250 | |
Federal National Mortgage Assoc.(a) | | | 0.072 | % | | | 01/05/2015 | | | | 01/05/2015 | | | | 27,000,000 | | | | 26,999,790 | |
Federal National Mortgage Assoc.(a) | | | 0.051 | % | | | 01/07/2015 | | | | 01/07/2015 | | | | 9,000,000 | | | | 8,999,925 | |
See Notes to Financial Statements.
47
State Street U.S. Government Money Market Portfolio
Portfolio of Investments — (continued)
December 31, 2014
| | | | | | | | | | | | | | | | | | | | |
Name of Issuer
and Title of Issue | | Interest
Rate | | | Next Rate
Reset Date | | | Maturity
Date | | | Principal
Amount | | | Value | |
| | | | | | | | | | | | | | | | | | | | |
| GOVERNMENT AGENCY DEBT – (continued) | |
Federal National Mortgage Assoc.(a) | | | 0.087 | % | | | 01/07/2015 | | | | 01/07/2015 | | | $ | 112,875,000 | | | $ | 112,873,401 | |
Federal National Mortgage Assoc.(a) | | | 0.072 | % | | | 01/12/2015 | | | | 01/12/2015 | | | | 62,330,000 | | | | 62,328,667 | |
Federal National Mortgage Assoc.(a) | | | 0.097 | % | | | 01/14/2015 | | | | 01/14/2015 | | | | 142,000,000 | | | | 141,995,129 | |
Federal National Mortgage Assoc.(a) | | | 0.097 | % | | | 01/21/2015 | | | | 01/21/2015 | | | | 25,000,000 | | | | 24,998,681 | |
Federal National Mortgage Assoc.(a) | | | 0.046 | % | | | 02/02/2015 | | | | 02/02/2015 | | | | 92,000,000 | | | | 91,996,320 | |
Federal National Mortgage Assoc.(a) | | | 0.092 | % | | | 02/02/2015 | | | | 02/02/2015 | | | | 38,000,000 | | | | 37,996,960 | |
Federal National Mortgage Assoc.(a) | | | 0.097 | % | | | 02/02/2015 | | | | 02/02/2015 | | | | 156,000,000 | | | | 155,986,827 | |
Federal National Mortgage Assoc.(a) | | | 0.092 | % | | | 02/03/2015 | | | | 02/03/2015 | | | | 155,000,000 | | | | 154,987,212 | |
Federal National Mortgage Assoc.(a) | | | 0.097 | % | | | 02/04/2015 | | | | 02/04/2015 | | | | 75,000,000 | | | | 74,993,271 | |
Federal National Mortgage Assoc.(a) | | | 0.094 | % | | | 02/11/2015 | | | | 02/11/2015 | | | | 54,000,000 | | | | 53,994,373 | |
Federal National Mortgage Assoc.(a) | | | 0.095 | % | | | 02/11/2015 | | | | 02/11/2015 | | | | 13,000,000 | | | | 12,998,623 | |
Federal National Mortgage Assoc.(a) | | | 0.046 | % | | | 02/17/2015 | | | | 02/17/2015 | | | | 81,000,000 | | | | 80,995,241 | |
Federal National Mortgage Assoc.(a) | | | 0.102 | % | | | 02/18/2015 | | | | 02/18/2015 | | | | 50,000,000 | | | | 49,993,333 | |
Federal National Mortgage Assoc.(a) | | | 0.077 | % | | | 02/25/2015 | | | | 02/25/2015 | | | | 58,333,000 | | | | 58,326,316 | |
Federal National Mortgage Assoc.(a) | | | 0.051 | % | | | 02/26/2015 | | | | 02/26/2015 | | | | 61,000,000 | | | | 60,995,256 | |
Federal National Mortgage Assoc.(b) | | | 0.140 | % | | | 01/27/2015 | | | | 02/27/2015 | | | | 25,000,000 | | | | 25,000,991 | |
Federal National Mortgage Assoc.(a) | | | 0.110 | % | | | 03/18/2015 | | | | 03/18/2015 | | | | 94,000,000 | | | | 93,978,171 | |
Federal National Mortgage Assoc.(a) | | | 0.086 | % | | | 04/01/2015 | | | | 04/01/2015 | | | | 157,000,000 | | | | 156,966,637 | |
Federal National Mortgage Assoc.(a) | | | 0.091 | % | | | 04/02/2015 | | | | 04/02/2015 | | | | 25,000,000 | | | | 24,994,313 | |
Federal National Mortgage Assoc.(a) | | | 0.064 | % | | | 04/15/2015 | | | | 04/15/2015 | | | | 120,000,000 | | | | 119,978,160 | |
Federal National Mortgage Assoc.(a) | | | 0.096 | % | | | 04/16/2015 | | | | 04/16/2015 | | | | 100,000,000 | | | | 99,972,292 | |
Federal National Mortgage Assoc.(a) | | | 0.071 | % | | | 04/27/2015 | | | | 04/27/2015 | | | | 84,000,000 | | | | 83,981,053 | |
Federal National Mortgage Assoc.(a) | | | 0.096 | % | | | 04/27/2015 | | | | 04/27/2015 | | | | 45,000,000 | | | | 44,986,225 | |
Federal National Mortgage Assoc.(a) | | | 0.111 | % | | | 05/13/2015 | | | | 05/13/2015 | | | | 15,000,000 | | | | 14,993,950 | |
Federal National Mortgage Assoc.(a) | | | 0.111 | % | | | 05/27/2015 | | | | 05/27/2015 | | | | 32,353,000 | | | | 32,338,567 | |
Federal National Mortgage Assoc.(a) | | | 0.132 | % | | | 06/03/2015 | | | | 06/03/2015 | | | | 25,000,000 | | | | 24,986,188 | |
Federal National Mortgage Assoc.(a) | | | 0.142 | % | | | 06/10/2015 | | | | 06/10/2015 | | | | 121,750,000 | | | | 121,674,244 | |
| | | | | | | | | | | | | | | | | | | | |
TOTAL GOVERNMENT AGENCY DEBT | | | | 9,163,951,714 | |
| | | | | | | | | | | | | | | | | | | | |
| TREASURY DEBT – 8.7% | |
U.S. Treasury Bill(a) | | | 0.025 | % | | | 01/02/2015 | | | | 01/02/2015 | | | | 125,000,000 | | | | 124,999,913 | |
U.S. Treasury Bill(a) | | | 0.018 | % | | | 01/08/2015 | | | | 01/08/2015 | | | | 154,000,000 | | | | 153,999,476 | |
U.S. Treasury Bill(a) | | | 0.020 | % | | | 01/08/2015 | | | | 01/08/2015 | | | | 96,000,000 | | | | 95,999,627 | |
U.S. Treasury Bill(a) | | | 0.033 | % | | | 01/08/2015 | | | | 01/08/2015 | | | | 75,000,000 | | | | 74,999,526 | |
U.S. Treasury Bill(a) | | | 0.035 | % | | | 01/08/2015 | | | | 01/08/2015 | | | | 125,000,000 | | | | 124,999,149 | |
U.S. Treasury Bill(a) | | | 0.008 | % | | | 01/15/2015 | | | | 01/15/2015 | | | | 158,400,000 | | | | 158,399,538 | |
U.S. Treasury Bill(a) | | | 0.010 | % | | | 01/15/2015 | | | | 01/15/2015 | | | | 41,000,000 | | | | 40,999,841 | |
U.S. Treasury Bill(a) | | | 0.020 | % | | | 01/22/2015 | | | | 01/22/2015 | | | | 200,000,000 | | | | 199,997,667 | |
U.S. Treasury Note(b) | | | 0.100 | % | | | 01/01/2015 | | | | 01/31/2016 | | | | 143,000,000 | | | | 142,962,318 | |
U.S. Treasury Note(b) | | | 0.108 | % | | | 01/01/2015 | | | | 10/31/2016 | | | | 34,000,000 | | | | 33,964,040 | |
| | | | | | | | | | | | | | | | | | | | |
TOTAL TREASURY DEBT | | | | | | | | | | | | | | | | | | | 1,151,321,095 | |
| | | | | | | | | | | | | | | | | | | | |
See Notes to Financial Statements.
48
State Street U.S. Government Money Market Portfolio
Portfolio of Investments — (continued)
December 31, 2014
| | | | | | | | | | | | | | | | | | | | |
Name of Issuer
and Title of Issue | | Interest
Rate | | | Next Rate
Reset Date | | | Maturity
Date | | | Principal
Amount | | | Value | |
| | | | | | | | | | | | | | | | | | | | |
| GOVERNMENT AGENCY REPURCHASE AGREEMENTS – 1.0% | |
Agreement with BNP Paribas Securities Corp. and The Bank of New York Mellon (Tri-Party), dated 12/31/2014 (collateralized by a Federal Home Loan Bank, 0.000% due 08/28/2017, and a U.S. Treasury Note, 2.375% due 08/15/2024, valued at $61,200,063); expected proceeds $60,000,167 | | | 0.050 | % | | | 01/02/2015 | | | | 01/02/2015 | | | $ | 60,000,000 | | | $ | 60,000,000 | |
Agreement with Citigroup Global Markets, Inc. and The Bank of New York Mellon (Tri-Party), dated 12/31/2014 (collateralized by a Federal Farm Credit Bank, 0.131% due 06/16/2015, Federal Home Loan Banks, 0.000% – 2.000% due 12/18/2019 – 04/10/2028, Federal Home Loan Mortgage Corporations, 0.000% – 1.750% due 05/30/2019 – 08/27/2029, a Federal National Mortgage Association, 2.660% due 09/06/2023, Resolution Funding Strips, 0.000% due 07/15/2026 – 04/15/2028, a RFCSP Strip Principal, 0.000% due 01/15/2030, and U.S. Treasury Notes, 2.000% – 2.250% due 03/31/2016 – 11/30/2020, valued at $54,060,017); expected proceeds $53,000,177 | | | 0.060 | % | | | 01/02/2015 | | | | 01/02/2015 | | | | 53,000,000 | | | | 53,000,000 | |
Agreement with Societe Generale and The Bank of New York Mellon (Tri-Party), dated 12/31/2014 (collateralized by Federal Farm Credit Banks, 0.940% – 1.100% due 08/22/2017 – 11/13/2017, and a Federal Home Loan Bank, 0.625% due 10/24/2016, valued at $25,503,330); expected proceeds $25,000,111 | | | 0.080 | % | | | 01/02/2015 | | | | 01/02/2015 | | | | 25,000,000 | | | | 25,000,000 | |
| | | | | | | | | | | | | | | | | | | | |
TOTAL GOVERNMENT AGENCY REPURCHASE AGREEMENTS | | | | | | | | 138,000,000 | |
| | | | | | | | | | | | | | | | | | | | |
| TREASURY REPURCHASE AGREEMENTS – 15.2% | |
Agreement with Barclays Capital, Inc. and The Bank of New York Mellon (Tri-Party), dated 12/31/2014 (collateralized by a U.S. Treasury Bond, 3.750% due 11/15/2043, and U.S. Treasury Notes, 2.000% – 3.625% due 08/15/2019 – 02/28/2021, valued at $306,000,026); expected proceeds $300,001,000 | | | 0.060 | % | | | 01/02/2015 | | | | 01/02/2015 | | | | 300,000,000 | | | | 300,000,000 | |
See Notes to Financial Statements.
49
State Street U.S. Government Money Market Portfolio
Portfolio of Investments — (continued)
December 31, 2014
| | | | | | | | | | | | | | | | | | | | |
Name of Issuer
and Title of Issue | | Interest
Rate | | | Next Rate
Reset Date | | | Maturity
Date | | | Principal
Amount | | | Value | |
| TREASURY REPURCHASE AGREEMENTS – (continued) | |
Agreement with Barclays Capital, Inc. and The Bank of New York Mellon (Tri-Party), dated 12/31/2014 (collateralized by U.S. Treasury Bonds, 2.750% – 4.250% due 05/15/2039 – 08/15/2042, and a U.S. Treasury Note, 1.375% due 06/30/2018, valued at $357,000,044); expected proceeds $350,002,722 | | | 0.040 | % | | | 01/07/2015 | | | | 01/07/2015 | | | $ | 350,000,000 | | | $ | 350,000,000 | |
Agreement with BNP Paribas Securities Corp. and The Bank of New York Mellon (Tri-Party), dated 12/31/2014 (collateralized by U.S. Treasury Notes, 0.375% – 1.750% due 03/31/2016 – 04/30/2019, valued at $150,960,140); expected proceeds $148,000,411 | | | 0.050 | % | | | 01/02/2015 | | | | 01/02/2015 | | | | 148,000,000 | | | | 148,000,000 | |
Agreement with Citigroup Global Markets, Inc. and The Bank of New York Mellon (Tri-Party), dated 12/31/2014 (collateralized by U.S. Treasury Notes, 0.500% – 1.000% due 06/30/2016 – 09/15/2017, valued at $53,040,047); expected proceeds $52,000,144 | | | 0.050 | % | | | 01/02/2015 | | | | 01/02/2015 | | | | 52,000,000 | | | | 52,000,000 | |
Agreement with Credit Agricole Corporate and Investment Bank and The Bank of New York Mellon (Tri-Party), dated 12/31/2014 (collateralized by a U.S. Treasury Bill, 0.000% due 04/02/2015, U.S. Treasury Bonds 3.125% – 5.375% due 02/15/2029 – 08/15/2044, and U.S. Treasury Notes, 1.625% – 4.000% due 08/31/2017 – 11/15/2022, valued at $357,000,035); expected proceeds $350,000,972 | | | 0.050 | % | | | 01/02/2015 | | | | 01/02/2015 | | | | 350,000,000 | | | | 350,000,000 | |
Agreement with Credit Agricole Corporate and Investment Bank and The Bank of New York Mellon (Tri-Party), dated 12/31/2014 (collateralized by a U.S. Treasury Bond, 0.125% due 04/15/2019, valued at $178,500,060); expected proceeds $175,000,583 | | | 0.060 | % | | | 01/02/2015 | | | | 01/02/2015 | | | | 175,000,000 | | | | 175,000,000 | |
Agreement with HSBC Securities USA, Inc. and JP Morgan Chase & Co. (Tri-Party), dated 12/31/2014 (collateralized by U.S. Treasury Strips, 0.000% due 05/15/2018 – 11/15/2024, valued at $204,002,778); expected proceeds $200,002,333 | | | 0.060 | % | | | 01/07/2015 | | | | 01/07/2015 | | | | 200,000,000 | | | | 200,000,000 | |
Agreement with JP Morgan Securities, Inc. and JP Morgan Chase & Co. (Tri-Party), dated 12/31/2014 (collateralized by U.S. Treasury Bonds, 3.000% – 3.125% due 05/15/2042 – 02/15/2043, and U.S. Treasury Notes, 0.875% – 4.250% due 08/15/2015 – 11/15/2024, valued at $34,684,057); expected proceeds $34,000,170 | | | 0.090 | % | | | 01/02/2015 | | | | 01/02/2015 | | | | 34,000,000 | | | | 34,000,000 | |
See Notes to Financial Statements.
50
State Street U.S. Government Money Market Portfolio
Portfolio of Investments — (continued)
December 31, 2014
| | | | | | | | | | | | | | | | | | | | |
Name of Issuer
and Title of Issue | | Interest
Rate | | | Next Rate
Reset Date | | | Maturity
Date | | | Principal
Amount | | | Value | |
| TREASURY REPURCHASE AGREEMENTS – (continued) | |
Agreement with Merrill Lynch Government Securities, Inc. and The Bank of New York Mellon (Tri-Party), dated 12/31/2014 (collateralized by U.S. Treasury Notes, 0.500% – 1.000% due 08/31/2016 – 10/31/2016, valued at $102,000,022); expected proceeds $100,000,278 | | | 0.050 | % | | | 01/02/2015 | | | | 01/02/2015 | | | $ | 100,000,000 | | | $ | 100,000,000 | |
Agreement with Societe Generale and The Bank of New York Mellon (Tri-Party), dated 12/31/2014 (collateralized by U.S. Treasury Bonds, 2.750% – 3.750% due 11/15/2042 – 11/15/2043, U.S. Treasury Notes, 0.250% – 2.125% due 01/31/2015 – 11/15/2022, and a U.S. Treasury Strip, 0.000% due 05/15/2024, valued at $299,880,056); expected proceeds $294,001,143 | | | 0.070 | % | | | 01/02/2015 | | | | 01/02/2015 | | | | 294,000,000 | | | | 294,000,000 | |
| | | | | | | | | | | | | | | | | | | | |
TOTAL TREASURY REPURCHASE AGREEMENTS | | | | 2,003,000,000 | |
| | | | | | | | | | | | | | | | | | | | |
TOTAL INVESTMENTS(c)(d) – 94.3% | | | | 12,456,272,809 | |
Assets in Excess of Other Liabilities – 5.7% | | | | 751,594,796 | |
| | | | | | | | | | | | | | | | | | | | |
NET ASSETS – 100.0% | | | $ | 13,207,867,605 | |
| | | | | | | | | | | | | | | | | | | | |
| (a) | Rate represents annualized yield at date of purchase |
| (b) | Variable Rate Security – Interest rate shown is rate in effect at December 31, 2014 |
| (c) | Unless otherwise indicated, the values of the securities of the Portfolio are determined based on Level 2 inputs established by provisions surrounding fair value measurements and disclosures (Note 2). |
| (d) | Also represents the cost for federal tax purposes |
See Notes to Financial Statements.
51
State Street Treasury Money Market Portfolio
Portfolio Statistics (Unaudited)
| | | | |
Portfolio Composition* | | | December 31, 2014 | |
Treasury Debt | | | 105.4 | % |
Liabilities in Excess of Other Assets | | | (5.4 | ) |
Total | | | 100.0 | % |
| | | | |
Maturity Ladder* | | | December 31, 2014 | |
Overnight (1 Day) | | | 4.7 | % |
2-30 Days | | | 50.3 | |
31-60 Days | | | 32.3 | |
61-90 Days | | | 10.8 | |
Over 90 Days | | | 7.3 | |
Total | | | 105.4 | % |
Average days to maturity | | | 35 | |
Weighted average life | | | 43 | |
| * | As a percentage of net assets as of the date indicated. The Portfolio’s composition will vary over time. |
See Notes to Financial Statements.
52
State Street Treasury Money Market Portfolio
Portfolio of Investments
December 31, 2014
| | | | | | | | | | | | | | | | | | | | |
Name of Issuer
and Title of Issue | | Interest
Rate | | | Next Rate
Reset Date | | | Maturity
Date | | | Principal
Amount | | | Value | |
| | | | | | | | | | | | | | | | | | | | |
| TREASURY DEBT – 105.4% | | | | | | | | | | | | | | | |
U.S. Treasury Bill(a) | | | 0.025 | % | | | 01/02/2015 | | | | 01/02/2015 | | | $ | 95,000,000 | | | $ | 94,999,974 | |
U.S. Treasury Bill(a) | | | 0.025 | % | | | 01/02/2015 | | | | 01/02/2015 | | | | 25,030,000 | | | | 25,029,991 | |
U.S. Treasury Bill(a) | | | 0.025 | % | | | 01/02/2015 | | | | 01/02/2015 | | | | 3,410,000 | | | | 3,409,998 | |
U.S. Treasury Bill(a) | | | 0.025 | % | | | 01/02/2015 | | | | 01/02/2015 | | | | 354,357,000 | | | | 354,356,754 | |
U.S. Treasury Bill(a) | | | 0.001 | % | | | 01/08/2015 | | | | 01/08/2015 | | | | 137,491,000 | | | | 137,490,973 | |
U.S. Treasury Bill(a) | | | 0.003 | % | | | 01/08/2015 | | | | 01/08/2015 | | | | 100,000,000 | | | | 99,999,951 | |
U.S. Treasury Bill(a) | | | 0.005 | % | | | 01/08/2015 | | | | 01/08/2015 | | | | 80,000,000 | | | | 79,999,922 | |
U.S. Treasury Bill(a) | | | 0.006 | % | | | 01/08/2015 | | | | 01/08/2015 | | | | 150,000,000 | | | | 149,999,825 | |
U.S. Treasury Bill(a) | | | 0.010 | % | | | 01/08/2015 | | | | 01/08/2015 | | | | 130,000,000 | | | | 129,999,747 | |
U.S. Treasury Bill(a) | | | 0.018 | % | | | 01/08/2015 | | | | 01/08/2015 | | | | 372,000,000 | | | | 371,998,734 | |
U.S. Treasury Bill(a) | | | 0.020 | % | | | 01/08/2015 | | | | 01/08/2015 | | | | 233,000,000 | | | | 232,999,094 | |
U.S. Treasury Bill(a) | | | 0.061 | % | | | 01/08/2015 | | | | 01/08/2015 | | | | 19,411,000 | | | | 19,410,770 | |
U.S. Treasury Bill(a) | | | 0.008 | % | | | 01/15/2015 | | | | 01/15/2015 | | | | 557,000,000 | | | | 556,998,375 | |
U.S. Treasury Bill(a) | | | 0.010 | % | | | 01/15/2015 | | | | 01/15/2015 | | | | 294,000,000 | | | | 293,998,857 | |
U.S. Treasury Bill(a) | | | 0.017 | % | | | 01/15/2015 | | | | 01/15/2015 | | | | 100,000,000 | | | | 99,999,319 | |
U.S. Treasury Bill(a) | | | 0.020 | % | | | 01/15/2015 | | | | 01/15/2015 | | | | 409,000,000 | | | | 408,996,819 | |
U.S. Treasury Bill(a) | | | 0.005 | % | | | 01/22/2015 | | | | 01/22/2015 | | | | 250,000,000 | | | | 249,999,271 | |
U.S. Treasury Bill(a) | | | 0.013 | % | | | 01/22/2015 | | | | 01/22/2015 | | | | 250,000,000 | | | | 249,998,177 | |
U.S. Treasury Bill(a) | | | 0.017 | % | | | 01/22/2015 | | | | 01/22/2015 | | | | 125,000,000 | | | | 124,998,724 | |
U.S. Treasury Bill(a) | | | 0.020 | % | | | 01/22/2015 | | | | 01/22/2015 | | | | 701,000,000 | | | | 700,991,822 | |
U.S. Treasury Bill(a) | | | 0.060 | % | | | 01/22/2015 | | | | 01/22/2015 | | | | 200,000,000 | | | | 199,993,000 | |
U.S. Treasury Bill(a) | | | 0.015 | % | | | 01/29/2015 | | | | 01/29/2015 | | | | 450,000,000 | | | | 449,994,938 | |
U.S. Treasury Bill(a) | | | 0.020 | % | | | 01/29/2015 | | | | 01/29/2015 | | | | 400,000,000 | | | | 399,993,778 | |
U.S. Treasury Bill(a) | | | 0.060 | % | | | 01/29/2015 | | | | 01/29/2015 | | | | 200,000,000 | | | | 199,990,667 | |
U.S. Treasury Bill(a) | | | 0.010 | % | | | 02/05/2015 | | | | 02/05/2015 | | | | 115,000,000 | | | | 114,998,882 | |
U.S. Treasury Bill(a) | | | 0.020 | % | | | 02/05/2015 | | | | 02/05/2015 | | | | 600,000,000 | | | | 599,988,333 | |
U.S. Treasury Bill(a) | | | 0.051 | % | | | 02/05/2015 | | | | 02/05/2015 | | | | 200,000,000 | | | | 199,990,083 | |
U.S. Treasury Bill(a) | | | 0.030 | % | | | 02/12/2015 | | | | 02/12/2015 | | | | 600,000,000 | | | | 599,979,000 | |
U.S. Treasury Bill(a) | | | 0.048 | % | | | 02/12/2015 | | | | 02/12/2015 | | | | 100,000,000 | | | | 99,994,458 | |
U.S. Treasury Bill(a) | | | 0.028 | % | | | 02/19/2015 | | | | 02/19/2015 | | | | 639,000,000 | | | | 638,976,082 | |
U.S. Treasury Bill(a) | | | 0.053 | % | | | 02/19/2015 | | | | 02/19/2015 | | | | 138,000,000 | | | | 137,990,139 | |
U.S. Treasury Bill(a) | | | 0.055 | % | | | 02/19/2015 | | | | 02/19/2015 | | | | 87,000,000 | | | | 86,993,487 | |
U.S. Treasury Bill(a) | | | 0.017 | % | | | 02/26/2015 | | | | 02/26/2015 | | | | 625,000,000 | | | | 624,982,986 | |
U.S. Treasury Bill(a) | | | 0.048 | % | | | 02/26/2015 | | | | 02/26/2015 | | | | 200,000,000 | | | | 199,985,222 | |
U.S. Treasury Bill(a) | | | 0.027 | % | | | 03/05/2015 | | | | 03/05/2015 | | | | 155,000,000 | | | | 154,992,676 | |
U.S. Treasury Bill(a) | | | 0.050 | % | | | 03/05/2015 | | | | 03/05/2015 | | | | 200,000,000 | | | | 199,982,500 | |
U.S. Treasury Bill(a) | | | 0.048 | % | | | 03/12/2015 | | | | 03/12/2015 | | | | 105,000,000 | | | | 104,990,302 | |
U.S. Treasury Bill(a) | | | 0.042 | % | | | 03/19/2015 | | | | 03/19/2015 | | | | 100,000,000 | | | | 99,990,910 | |
U.S. Treasury Bill(a) | | | 0.046 | % | | | 03/19/2015 | | | | 03/19/2015 | | | | 150,000,000 | | | | 149,985,241 | |
U.S. Treasury Bill(a) | | | 0.042 | % | | | 03/26/2015 | | | | 03/26/2015 | | | | 200,000,000 | | | | 199,980,167 | |
U.S. Treasury Bill(a) | | | 0.037 | % | | | 04/02/2015 | | | | 04/02/2015 | | | | 100,000,000 | | | | 99,990,521 | |
See Notes to Financial Statements.
53
State Street Treasury Money Market Portfolio
Portfolio of Investments — (continued)
December 31, 2014
| | | | | | | | | | | | | | | | | | | | |
Name of Issuer
and Title of Issue | | Interest
Rate | | | Next Rate
Reset Date | | | Maturity
Date | | | Principal
Amount | | | Value | |
| TREASURY DEBT – (continued) | | | | | | | | | | | | | | | |
U.S. Treasury Bill(a) | | | 0.040 | % | | | 04/02/2015 | | | | 04/02/2015 | | | $ | 375,000,000 | | | $ | 374,962,500 | |
U.S. Treasury Bill(a) | | | 0.045 | % | | | 04/09/2015 | | | | 04/09/2015 | | | | 50,000,000 | | | | 49,993,875 | |
U.S. Treasury Note(b) | | | 0.100 | % | | | 01/01/2015 | | | | 01/31/2016 | | | | 193,000,000 | | | | 192,950,122 | |
U.S. Treasury Note(b) | | | 0.108 | % | | | 01/01/2015 | | | | 10/31/2016 | | | | 30,000,000 | | | | 29,968,271 | |
U.S. Treasury Note(a) | | | 0.061 | % | | | 03/31/2015 | | | | 03/31/2015 | | | | 200,000,000 | | | | 200,092,556 | |
| | | | | | | | | | | | | | | | | | | | |
TOTAL TREASURY DEBT | | | | | | | | | | | | | | | | | | | 10,797,407,793 | |
| | | | | | | | | | | | | | | | | | | | |
TOTAL INVESTMENTS(c)(d) – 105.4% | | | | | | | | 10,797,407,793 | |
Liabilities in Excess of Other Assets – (5.4)% | | | | | | | | (549,947,502 | ) |
| | | | | | | | | | | | | | | | | | | | |
NET ASSETS – 100.0% | | | | | | | $ | 10,247,460,291 | |
| | | | | | | | | | | | | | | | | | | | |
| (a) | Rate represents annualized yield at date of purchase |
| (b) | Variable Rate Security – Interest rate shown is rate in effect at December 31, 2014 |
| (c) | Unless otherwise indicated, the values of the securities of the Portfolio are determined based on Level 2 inputs established by provisions surrounding fair value measurements and disclosures (Note 2). |
| (d) | Also represents the cost for federal tax purposes |
See Notes to Financial Statements.
54
State Street Treasury Plus Money Market Portfolio
Portfolio Statistics (Unaudited)
| | | | |
Portfolio Composition* | | | December 31, 2014 | |
Treasury Debt | | | 77.6 | % |
Treasury Repurchase Agreements | | | 16.9 | |
Assets in Excess of Other Liabilities | | | 5.5 | |
Total | | | 100.0 | % |
| | | | |
Maturity Ladder* | | | December 31, 2014 | |
Overnight (1 Day) | | | 26.9 | % |
2-30 Days | | | 38.7 | |
31-60 Days | | | 15.2 | |
61-90 Days | | | 8.1 | |
Over 90 Days | | | 5.6 | |
Total | | | 94.5 | % |
Average days to maturity | | | 24 | |
Weighted average life | | | 32 | |
| * | As a percentage of net assets as of the date indicated. The Portfolio’s composition will vary over time. |
See Notes to Financial Statements.
55
State Street Treasury Plus Money Market Portfolio
Portfolio of Investments
December 31, 2014
| | | | | | | | | | | | | | | | | | | | |
Name of Issuer
and Title of Issue | | Interest
Rate | | | Next Rate
Reset Date | | | Maturity
Date | | | Principal
Amount | | | Value | |
| | | | | | | | | | | | | | | | | | | | |
| TREASURY DEBT – 77.6% | | | | | | | | | | | | | | | |
U.S. Treasury Bill(a) | | | 0.010 | % | | | 01/02/2015 | | | | 01/02/2015 | | | $ | 50,000,000 | | | $ | 49,999,986 | |
U.S. Treasury Bill(a) | | | 0.011 | % | | | 01/02/2015 | | | | 01/02/2015 | | | | 25,000,000 | | | | 24,999,992 | |
U.S. Treasury Bill(a) | | | 0.012 | % | | | 01/02/2015 | | | | 01/02/2015 | | | | 50,000,000 | | | | 49,999,983 | |
U.S. Treasury Bill(a) | | | 0.020 | % | | | 01/02/2015 | | | | 01/02/2015 | | | | 25,000,000 | | | | 24,999,986 | |
U.S. Treasury Bill(a) | | | 0.025 | % | | | 01/02/2015 | | | | 01/02/2015 | | | | 25,000,000 | | | | 24,999,983 | |
U.S. Treasury Bill (a) | | | 0.063 | % | | | 01/02/2015 | | | | 01/02/2015 | | | | 100,000,000 | | | | 99,999,826 | |
U.S. Treasury Bill(a) | | | 0.017 | % | | | 01/08/2015 | | | | 01/08/2015 | | | | 77,000,000 | | | | 76,999,738 | |
U.S. Treasury Bill (a) | | | 0.020 | % | | | 01/08/2015 | | | | 01/08/2015 | | | | 48,000,000 | | | | 47,999,813 | |
U.S. Treasury Bill(a) | | | 0.061 | % | | | 01/08/2015 | | | | 01/08/2015 | | | | 100,000,000 | | | | 99,998,814 | |
U.S. Treasury Bill(a) | | | 0.007 | % | | | 01/15/2015 | | | | 01/15/2015 | | | | 147,000,000 | | | | 146,999,571 | |
U.S. Treasury Bill(a) | | | 0.010 | % | | | 01/15/2015 | | | | 01/15/2015 | | | | 38,000,000 | | | | 37,999,852 | |
U.S. Treasury Bill(a) | | | 0.020 | % | | | 01/15/2015 | | | | 01/15/2015 | | | | 55,000,000 | | | | 54,999,572 | |
U.S. Treasury Bill(a) | | | 0.060 | % | | | 01/15/2015 | | | | 01/15/2015 | | | | 100,000,000 | | | | 99,997,667 | |
U.S. Treasury Bill(a) | | | 0.020 | % | | | 01/22/2015 | | | | 01/22/2015 | | | | 175,000,000 | | | | 174,997,958 | |
U.S. Treasury Bill(a) | | | 0.060 | % | | | 01/22/2015 | | | | 01/22/2015 | | | | 100,000,000 | | | | 99,996,500 | |
U.S. Treasury Bill(a) | | | 0.020 | % | | | 01/29/2015 | | | | 01/29/2015 | | | | 131,000,000 | | | | 130,997,962 | |
U.S. Treasury Bill(a) | | | 0.060 | % | | | 01/29/2015 | | | | 01/29/2015 | | | | 100,000,000 | | | | 99,995,333 | |
U.S. Treasury Bill(a) | | | 0.020 | % | | | 02/05/2015 | | | | 02/05/2015 | | | | 75,000,000 | | | | 74,998,542 | |
U.S. Treasury Bill(a) | | | 0.051 | % | | | 02/05/2015 | | | | 02/05/2015 | | | | 50,000,000 | | | | 49,997,521 | |
U.S. Treasury Bill(a) | | | 0.048 | % | | | 02/12/2015 | | | | 02/12/2015 | | | | 50,000,000 | | | | 49,997,229 | |
U.S. Treasury Bill(a) | | | 0.028 | % | | | 02/19/2015 | | | | 02/19/2015 | | | | 75,000,000 | | | | 74,997,193 | |
U.S. Treasury Bill(a) | | | 0.053 | % | | | 02/19/2015 | | | | 02/19/2015 | | | | 30,000,000 | | | | 29,997,856 | |
U.S. Treasury Bill(a) | | | 0.055 | % | | | 02/19/2015 | | | | 02/19/2015 | | | | 20,000,000 | | | | 19,998,503 | |
U.S. Treasury Bill(a) | | | 0.017 | % | | | 02/26/2015 | | | | 02/26/2015 | | | | 100,000,000 | | | | 99,997,278 | |
U.S. Treasury Bill(a) | | | 0.048 | % | | | 02/26/2015 | | | | 02/26/2015 | | | | 20,000,000 | | | | 19,998,522 | |
U.S. Treasury Bill(a) | | | 0.050 | % | | | 03/05/2015 | | | | 03/05/2015 | | | | 75,000,000 | | | | 74,993,438 | |
U.S. Treasury Bill(a) | | | 0.048 | % | | | 03/12/2015 | | | | 03/12/2015 | | | | 50,000,000 | | | | 49,995,382 | |
U.S. Treasury Bill(a) | | | 0.046 | % | | | 03/19/2015 | | | | 03/19/2015 | | | | 50,000,000 | | | | 49,995,080 | |
U.S. Treasury Bill(a) | | | 0.042 | % | | | 03/26/2015 | | | | 03/26/2015 | | | | 50,000,000 | | | | 49,995,042 | |
U.S. Treasury Bill(a) | | | 0.037 | % | | | 04/02/2015 | | | | 04/02/2015 | | | | 25,000,000 | | | | 24,997,630 | |
U.S. Treasury Bill(a) | | | 0.040 | % | | | 04/02/2015 | | | | 04/02/2015 | | | | 75,000,000 | | | | 74,992,500 | |
U.S. Treasury Note(b) | | | 0.100 | % | | | 01/01/2015 | | | | 01/31/2016 | | | | 47,500,000 | | | | 47,487,736 | |
U.S. Treasury Note(b) | | | 0.108 | % | | | 01/01/2015 | | | | 10/31/2016 | | | | 7,000,000 | | | | 6,992,597 | |
| | | | | | | | | | | | | | | | | | | | |
TOTAL TREASURY DEBT | | | | | | | | | | | | | | | | | | | 2,145,414,585 | |
| | | | | | | | | | | | | | | | | | | | |
| TREASURY REPURCHASE AGREEMENTS – 16.9% | |
Agreement with Barclays Capital, Inc. and The Bank of New York Mellon (Tri-Party), dated 12/31/2014 (collateralized by U.S. Treasury Notes, 2.250% – 2.625% due 11/15/2020 – 04/30/2021, valued at $204,000,087); expected proceeds $200,000,667 | | | 0.060 | % | | | 01/02/2015 | | | | 01/02/2015 | | | | 200,000,000 | | | | 200,000,000 | |
See Notes to Financial Statements.
56
State Street Treasury Plus Money Market Portfolio
Portfolio of Investments — (continued)
December 31, 2014
| | | | | | | | | | | | | | | | | | | | |
Name of Issuer
and Title of Issue | | Interest
Rate | | | Next Rate
Reset Date | | | Maturity
Date | | | Principal
Amount | | | Value | |
| TREASURY REPURCHASE AGREEMENTS – (continued) | |
Agreement with BNP Paribas Securities Corp. and The Bank of New York Mellon (Tri-Party), dated 12/31/2014 (collateralized by U.S. Treasury Notes, 0.250% – 3.500% due 02/29/2016 – 05/15/2020, valued at $20,400,053); expected proceeds $20,000,056 | | | 0.050 | % | | | 01/02/2015 | | | | 01/02/2015 | | | $ | 20,000,000 | | | $ | 20,000,000 | |
Agreement with Citigroup Global Markets, Inc. and The Bank of New York Mellon (Tri-Party), dated 12/31/2014 (collateralized by a U.S. Treasury Note, 1.000% due 09/15/2017, valued at $30,600,041); expected proceeds $30,000,083 | | | 0.050 | % | | | 01/02/2015 | | | | 01/02/2015 | | | | 30,000,000 | | | | 30,000,000 | |
Agreement with Credit Agricole Corporate and Investment Bank and The Bank of New York Mellon (Tri-Party), dated 12/31/2014 (by U.S. Treasury Inflation Bonds, 0.625% – 2.375% due 01/15/2027 – 02/15/2043, and a U.S. Treasury Note, 1.625% due 11/15/2022, valued at $130,560,043); expected proceeds $128,000,356 | | | 0.050 | % | | | 01/02/2015 | | | | 01/02/2015 | | | | 128,000,000 | | | | 128,000,000 | |
Agreement with Societe Generale Inc. and The Bank of New York Mellon (Tri-Party), dated 12/31/2014 (collateralized by U.S. Treasury Notes, 0.375% – 2.750% due 01/15/2016 – 11/15/2023, and a U.S. Treasury Strip, 0.000% due 02/15/2024, valued at $91,800,092); expected proceeds $90,000,350 | | | 0.070 | % | | | 01/02/2015 | | | | 01/02/2015 | | | | 90,000,000 | | | | 90,000,000 | |
| | | | | | | | | | | | | | | | | | | | |
TOTAL TREASURY REPURCHASE AGREEMENTS | | | | | | | | | | | | | | | | 468,000,000 | |
| | | | | | | | | | | | | | | | | | | | |
TOTAL INVESTMENTS(c)(d) – 94.5% | | | | | | | | | | | | | | | | | | | 2,613,414,585 | |
Assets in Excess of Other Liabilities – 5.5% | | | | | | | | | | | | | | | | | | | 152,115,386 | |
| | | | | | | | | | | | | | | | | | | | |
NET ASSETS – 100.0% | | | | | | | | | | | | | | | | | | $ | 2,765,529,971 | |
| | | | | | | | | | | | | | | | | | | | |
| (a) | Rate represents annualized yield at date of purchase |
| (b) | Variable Rate Security – Interest rate shown is rate in effect at December 31, 2014 |
| (c) | Unless otherwise indicated, the values of the securities of the Portfolio are determined based on Level 2 inputs established by provisions surrounding fair value measurements and disclosures (Note 2). |
| (d) | Also represents the cost for federal tax purposes |
See Notes to Financial Statements.
57
State Street Master Funds
Statements of Assets and Liabilities
December 31, 2014
| | | | | | | | | | | | | | | | | | | | |
| | | Money Market
Portfolio | | | Tax Free
Money Market
Portfolio | | | U.S. Government
Money Market
Portfolio | | | Treasury
Money Market
Portfolio | | | Treasury Plus
Money Market
Portfolio | |
Assets | | | | | | | | | | | | | | | | | | | | |
Investments at market value and amortized cost (Note 2) | | $ | 25,123,040,253 | | | $ | 253,241,729 | | | $ | 10,315,272,809 | | | $ | 10,797,407,793 | | | $ | 2,145,414,585 | |
Repurchase Agreements, at market value and cost (Note 2) | | | 15,895,000,000 | | | | – | | | | 2,141,000,000 | | | | – | | | | 468,000,000 | |
| | | | | | | | | | | | | | | | | | | | |
Total Investments | | | 41,018,040,253 | | | | 253,241,729 | | | | 12,456,272,809 | | | | 10,797,407,793 | | | | 2,613,414,585 | |
Cash | | | – | | | | – | | | | 752,711,211 | | | | 276,103,845 | | | | 227,408,183 | |
Interest receivable | | | 9,189,761 | | | | 11,432 | | | | 309,950 | | | | 156,358 | | | | 7,744 | |
Prepaid expenses and other assets | | | 68,570 | | | | 15,761 | | | | 28,896 | | | | 32,012 | | | | 18,599 | |
| | | | | | | | | | | | | | | | | | | | |
Total assets | | | 41,027,298,584 | | | | 253,268,922 | | | | 13,209,322,866 | | | | 11,073,700,008 | | | | 2,840,849,111 | |
| | | | | | | | | | | | | | | | | | | | |
Liabilities | | | | | | | | | | | | | | | | | | | | |
Investment securities purchased | | | – | | | | – | | | | – | | | | 824,957,438 | | | | 74,992,500 | |
Due to custodian | | | 318,723,260 | | | | – | | | | – | | | | – | | | | – | |
Management fee payable (Note 3) | | | 3,141,229 | | | | 19,560 | | | | 1,094,453 | | | | 953,270 | | | | 215,960 | |
Administration and custody fees payable (Note 3) | | | 917,761 | | | | 7,818 | | | | 315,538 | | | | 283,884 | | | | 64,658 | |
Professional fees payable | | | 39,505 | | | | 42,039 | | | | 42,039 | | | | 42,039 | | | | 42,039 | |
Accrued expenses and other liabilities | | | 9,209 | | | | 4,194 | | | | 3,231 | | | | 3,086 | | | | 3,983 | |
| | | | | | | | | | | | | | | | | | | | |
Total liabilities | | | 322,830,964 | | | | 73,611 | | | | 1,455,261 | | | | 826,239,717 | | | | 75,319,140 | |
| | | | | | | | | | | | | | | | | | | | |
Net Assets | | $ | 40,704,467,620 | | | $ | 253,195,311 | | | $ | 13,207,867,605 | | | $ | 10,247,460,291 | | | $ | 2,765,529,971 | |
| | | | | | | | | | | | | | | | | | | | |
See Notes to Financial Statements.
58
State Street Master Funds
Statements of Operations
Year Ended December 31, 2014
| | | | | | | | | | | | | | | | | | | | |
| | | Money Market
Portfolio | | | Tax Free
Money Market
Portfolio | | | U.S. Government
Money Market
Portfolio | | | Treasury
Money Market
Portfolio | | | Treasury Plus
Money Market
Portfolio | |
Investment Income | | | | | | | | | | | | | | | | | | | | |
Interest | | $ | 76,635,514 | | | $ | 111,966 | | | $ | 8,111,110 | | | $ | 5,288,882 | | | $ | 1,338,376 | |
| | | | | | | | | | | | | | | | | | | | |
Expenses | | | | | | | | | | | | | | | | | | | | |
Management fees (Note 3) | | | 19,958,835 | | | | 142,719 | | | | 5,464,519 | | | | 5,865,639 | | | | 1,308,611 | |
Administration and custody fees (Note 3) | | | 5,052,518 | | | | 37,919 | | | | 1,384,549 | | | | 1,486,005 | | | | 332,865 | |
Trustees’ fees (Note 4) | | | 726,374 | | | | 15,002 | | | | 174,472 | | | | 233,559 | | | | 47,767 | |
Professional fees | | | 166,651 | | | | 59,486 | | | | 85,730 | | | | 93,057 | | | | 66,712 | |
Printing fees | | | 14,349 | | | | 4,570 | | | | 4,571 | | | | 4,571 | | | | 4,571 | |
Other expenses | | | 176,390 | | | | 50,990 | | | | 104,706 | | | | 111,525 | | | | 85,247 | |
| | | | | | | | | | | | | | | | | | | | |
Total expenses | | | 26,095,117 | | | | 310,686 | | | | 7,218,547 | | | | 7,794,356 | | | | 1,845,773 | |
| | | | | | | | | | | | | | | | | | | | |
Net Investment Income (Loss) | | | 50,540,397 | | | | (198,720 | ) | | | 892,563 | | | | (2,505,474 | ) | | | (507,397 | ) |
| | | | | | | | | | | | | | | | | | | | |
Realized Gain (Loss) | | | | | | | | | | | | | | | | | | | | |
Net realized gain on investments | | | 200,540 | | | | – | | | | 13,831 | | | | 130,828 | | | | – | |
| | | | | | | | | | | | | | | | | | | | |
Net Increase (Decrease) in Net Assets Resulting from Operations | | $ | 50,740,937 | | | $ | (198,720 | ) | | $ | 906,394 | | | $ | (2,374,646 | ) | | $ | (507,397 | ) |
| | | | | | | | | | | | | | | | | | | | |
See Notes to Financial Statements.
59
State Street Master Funds
Statements of Changes in Net Assets
| | | | | | | | | | | | | | | | |
| | | Money Market Portfolio | | | Tax Free Money Market Portfolio | |
| | | Year Ended
December 31,
2014 | | | Year Ended
December 31,
2013 | | | Year Ended
December 31,
2014 | | | Year Ended
December 31,
2013 | |
Increase (Decrease) in Net Assets From | | | | | | | | | | | | | | | | |
Operations: | | | | | | | | | | | | | | | | |
Net investment income (loss) | | $ | 50,540,397 | | | $ | 50,355,030 | | | $ | (198,720 | ) | | $ | (118,693 | ) |
Net realized gain on investments | | | 200,540 | | | | 179,110 | | | | – | | | | – | |
| | | | | | | | | | | | | | | | |
Net increase (decrease) in net assets from operations | | | 50,740,937 | | | | 50,534,140 | | | | (198,720 | ) | | | (118,693 | ) |
| | | | | | | | | | | | | | | | |
Capital Transactions: | | | | | | | | | | | | | | | | |
Contributions | | | 76,110,543,297 | | | | 65,248,452,641 | | | | 966,996,003 | | | | 1,034,388,036 | |
Withdrawals | | | (69,510,120,416 | ) | | | (58,754,444,878 | ) | | | (1,021,632,232 | ) | | | (1,234,759,623 | ) |
| | | | | | | | | | | | | | | | |
Net increase (decrease) in net assets from capital transactions | | | 6,600,422,881 | | | | 6,494,007,763 | | | | (54,636,229 | ) | | | (200,371,587 | ) |
| | | | | | | | | | | | | | | | |
Net Increase (Decrease) in Net Assets | | | 6,651,163,818 | | | | 6,544,541,903 | | | | (54,834,949 | ) | | | (200,490,280 | ) |
Net Assets | | | | | | | | | | | | | | | | |
Beginning of year | | | 34,053,303,802 | | | | 27,508,761,899 | | | | 308,030,260 | | | | 508,520,540 | |
| | | | | | | | | | | | | | | | |
End of year | | $ | 40,704,467,620 | | | $ | 34,053,303,802 | | | $ | 253,195,311 | | | $ | 308,030,260 | |
| | | | | | | | | | | | | | | | |
See Notes to Financial Statements.
60
State Street Master Funds
Statements of Changes in Net Assets
| | | | | | | | | | | | | | | | |
| | | U.S. Government Money Market Portfolio | | | Treasury Money Market Portfolio | |
| | | Year Ended
December 31, 2014 | | | Year Ended
December 31, 2013 | | | Year Ended
December 31,
2014 | | | Year Ended
December 31,
2013 | |
Increase (Decrease) in Net Assets From | | | | | | | | | | | | | | | | |
Operations: | | | | | | | | | | | | | | | | |
Net investment income (loss) | | $ | 892,563 | | | $ | 2,961,527 | | | $ | (2,505,474 | ) | | $ | 268,931 | |
Net realized gain on investments | | | 13,831 | | | | – | | | | 130,828 | | | | 34,160 | |
| | | | | | | | | | | | | | | | |
Net increase (decrease) in net assets from operations | | | 906,394 | | | | 2,961,527 | | | | (2,374,646 | ) | | | 303,091 | |
| | | | | | | | | | | | | | | | |
Capital Transactions: | | | | | | | | | | | | | | | | |
Contributions | | | 29,375,563,089 | | | | 23,862,095,303 | | | | 27,518,525,235 | | | | 29,957,818,460 | |
Withdrawals | | | (24,881,521,721 | ) | | | (23,773,323,291 | ) | | | (31,826,712,166 | ) | | | (28,112,159,319 | ) |
| | | | | | | | | | | | | | | | |
Net increase (decrease) in net assets from capital transactions | | | 4,494,041,368 | | | | 88,772,012 | | | | (4,308,186,931 | ) | | | 1,845,659,141 | |
| | | | | | | | | | | | | | | | |
Net Increase (Decrease) in Net Assets | | | 4,494,947,762 | | | | 91,733,539 | | | | (4,310,561,577 | ) | | | 1,845,962,232 | |
Net Assets | | | | | | | | | | | | | | | | |
Beginning of year | | | 8,712,919,843 | | | | 8,621,186,304 | | | | 14,558,021,868 | | | | 12,712,059,636 | |
| | | | | | | | | | | | | | | | |
End of year | | $ | 13,207,867,605 | | | $ | 8,712,919,843 | | | $ | 10,247,460,291 | | | $ | 14,558,021,868 | |
| | | | | | | | | | | | | | | | |
See Notes to Financial Statements.
61
State Street Master Funds
Statements of Changes in Net Assets
| | | | | | | | |
| | | Treasury Plus Money Market Portfolio | |
| | | Year Ended
December 31,
2014 | | | Year Ended
December 31,
2013 | |
Increase (Decrease) in Net Assets From Operations: | | | | | | | | |
Net investment income (loss) | | $ | (507,397 | ) | | $ | 26,184 | |
Net realized gain on investments | | | – | | | | (1,536 | ) |
| | | | | | | | |
Net increase (decrease) in net assets from operations | | | (507,397 | ) | | | 24,648 | |
| | | | | | | | |
Capital Transactions: | | | | | | | | |
Contributions | | | 12,046,302,272 | | | | 9,982,616,922 | |
Withdrawals | | | (12,033,281,777 | ) | | | (9,528,165,497 | ) |
| | | | | | | | |
Net increase (decrease) in net assets from capital transactions | | | 13,020,495 | | | | 454,451,425 | |
| | | | | | | | |
Net increase (decrease) in net assets | | | 12,513,098 | | | | 454,476,073 | |
Net Assets | | | | | | | | |
Beginning of year | | | 2,753,016,873 | | | | 2,298,540,800 | |
| | | | | | | | |
End of year | | $ | 2,765,529,971 | | | $ | 2,753,016,873 | |
| | | | | | | | |
See Notes to Financial Statements.
62
State Street Master Funds
Financial Highlights
| | | | | | | | | | | | | | | | | | | | |
| | | | | | Ratios to Average Net Assets | | | Net Assets
End of
Period
(000s Omitted) | |
Period Ended December 31, | | Total
Return(a) | | | Gross
Operating
Expenses | | | Net
Operating
Expenses | | | Net
Investment
Income | | |
Money Market Portfolio | | | | | | | | | | | | | | | | | | | | |
2014 | | | 0.13 | % | | | 0.07 | % | | | 0.07 | % | | | 0.13 | % | | $ | 40,704,468 | |
2013 | | | 0.15 | % | | | 0.06 | % | | | 0.06 | % | | | 0.15 | % | | $ | 34,053,304 | |
2012 | | | 0.26 | % | | | 0.06 | % | | | 0.06 | % | | | 0.25 | % | | $ | 27,508,762 | |
2011 | | | 0.20 | % | | | 0.07 | % | | | 0.07 | % | | | 0.20 | %(b) | | $ | 22,780,186 | |
2010 | | | 0.20 | % | | | 0.12 | % | | | 0.12 | % | | | 0.20 | % | | $ | 26,503,826 | |
Tax Free Money Market Portfolio | | | | | | | | | | | | | | | | | | | | |
2014 | | | (0.07 | )% | | | 0.11 | % | | | 0.11 | % | | | (0.07 | )% | | $ | 253,195 | |
2013 | | | (0.03 | )% | | | 0.11 | % | | | 0.11 | % | | | (0.04 | )% | | $ | 308,030 | |
2012 | | | 0.01 | % | | | 0.11 | % | | | 0.11 | % | | | 0.01 | % | | $ | 508,521 | |
2011 | | | 0.04 | % | | | 0.11 | % | | | 0.11 | % | | | 0.04 | %(b) | | $ | 331,194 | |
2010 | | | 0.13 | % | | | 0.13 | % | | | 0.13 | % | | | 0.11 | % | | $ | 405,328 | |
U.S. Government Money Market Portfolio | | | | | | | | | | | | | | | | | | | | |
2014 | | | 0.01 | % | | | 0.07 | % | | | 0.07 | % | | | 0.01 | % | | $ | 13,207,868 | |
2013 | | | 0.03 | % | | | 0.07 | % | | | 0.07 | % | | | 0.03 | % | | $ | 8,712,920 | |
2012 | | | 0.08 | % | | | 0.07 | % | | | 0.07 | % | | | 0.08 | % | | $ | 8,621,186 | |
2011 | | | 0.04 | % | | | 0.07 | % | | | 0.07 | % | | | 0.04 | %(b) | | $ | 5,779,444 | |
2010 | | | 0.07 | % | | | 0.12 | % | | | 0.12 | % | | | 0.08 | % | | $ | 4,910,900 | |
Treasury Money Market Portfolio | | | | | | | | | | | | | | | | | | | | |
2014 | | | (0.02 | )% | | | 0.07 | % | | | 0.07 | % | | | (0.02 | )% | | $ | 10,247,460 | |
2013 | | | 0.00 | %(c) | | | 0.07 | % | | | 0.07 | % | | | 0.00 | %(c) | | $ | 14,558,022 | |
2012 | | | 0.02 | % | | | 0.07 | % | | | 0.07 | % | | | 0.02 | % | | $ | 12,712,060 | |
2011 | | | (0.09 | )% | | | 0.07 | % | | | 0.07 | % | | | (0.03 | )%(b) | | $ | 12,094,364 | |
2010 | | | 0.01 | % | | | 0.12 | % | | | 0.12 | % | | | 0.01 | % | | $ | 3,656,739 | |
Treasury Plus Money Market Portfolio | | | | | | | | | | | | | | | | | | | | |
2014 | | | (0.02 | )% | | | 0.07 | % | | | 0.07 | % | | | (0.02 | )% | | $ | 2,765,530 | |
2013 | | | 0.00 | %(c) | | | 0.07 | % | | | 0.07 | % | | | 0.00 | %(c) | | $ | 2,753,017 | |
2012 | | | 0.06 | % | | | 0.08 | % | | | 0.08 | % | | | 0.06 | % | | $ | 2,298,541 | |
2011 | | | 0.00 | %(c) | | | 0.08 | % | | | 0.08 | % | | | (0.01 | )%(b) | | $ | 1,361,158 | |
2010 | | | 0.03 | % | | | 0.12 | % | �� | | 0.12 | % | | | 0.03 | % | | $ | 933,748 | |
| (a) | Results represent past performance and are not indicative of future results. Total return for periods of less than one year are not annualized. |
| (b) | Results reflect the effect of expense waivers. Without these waivers, net investment income would have been lower. |
| (c) | Amount is less than 0.005%. |
See Notes to Financial Statements.
63
State Street Master Funds
Notes to Financial Statements
December 31, 2014
The State Street Master Funds (the “Trust”) is registered under the Investment Company Act of 1940, as amended (the “1940 Act”), as an open-end management investment company, and was organized as a business trust under the laws of the Commonwealth of Massachusetts on July 27, 1999. The Trust comprises ten investment portfolios: State Street Equity 500 Index Portfolio, State Street Equity 400 Index Portfolio, State Street Equity 2000 Index Portfolio, State Street Aggregate Bond Index Portfolio, State Street Money Market Portfolio, State Street Tax Free Money Market Portfolio, State Street Limited Duration Bond Portfolio, State Street U.S. Government Money Market Portfolio, State Street Treasury Money Market Portfolio and State Street Treasury Plus Money Market Portfolio. At December 31, 2014, the following Portfolios were operational: State Street Equity 500 Index Portfolio, State Street Money Market Portfolio, State Street Tax Free Money Market Portfolio, State Street U.S. Government Money Market Portfolio, State Street Treasury Money Market Portfolio and State Street Treasury Plus Money Market Portfolio. Information presented in these financial statements pertains only to State Street Money Market Portfolio, State Street Tax Free Money Market Portfolio, State Street U.S. Government Money Market Portfolio, State Street Treasury Money Market Portfolio and State Street Treasury Plus Money Market Portfolio (the “Portfolios”). The Portfolios commenced operations as follows:
| | |
| Portfolio Name | | Commencement Date |
State Street Money Market Portfolio | | August 12, 2004 |
State Street Tax Free Money Market Portfolio | | February 7, 2007 |
State Street U.S. Government Money Market Portfolio | | October 17, 2007 |
State Street Treasury Money Market Portfolio | | October 25, 2007 |
State Street Treasury Plus Money Market Portfolio | | October 24, 2007 |
The Portfolios are authorized to issue an unlimited number of non-transferable beneficial interests.
The Portfolios’ investment objectives are as follows:
| | |
| Portfolio Name | | Investment Objective |
| State Street Money Market Portfolio | | To seek to maximize current income, to the extent consistent with the preservation of capital and liquidity and the maintenance of a stable $1.00 per share net asset value by investing in U.S. dollar denominated money market securities. |
| State Street Tax Free Money Market Portfolio | | To seek to maximize current income, exempt from federal income taxes, to the extent consistent with the preservation of capital and liquidity and the maintenance of a stable $1.00 per share net asset value. |
| State Street U.S. Government Money Market Portfolio | | To seek to maximize current income, to the extent consistent with the preservation of capital and liquidity and the maintenance of a stable $1.00 per share net asset value. |
64
State Street Master Funds
Notes to Financial Statements — (continued)
December 31, 2014
| | |
| Portfolio Name | | Investment Objective |
| State Street Treasury Money Market Portfolio | | To seek a high level of current income consistent with preserving principal and liquidity and the maintenance of a stable $1.00 per share net asset value. |
| State Street Treasury Plus Money Market Portfolio | | To seek a high level of current income consistent with preserving principal and liquidity and the maintenance of a stable $1.00 per share net asset value. |
The Portfolios are investment companies and accordingly follow the investment company accounting and reporting guidance of the Financial Accounting Standards Board (“FASB”) Accounting Standards Codification Topic 946 Financial Services – Investment Companies.
Recent Regulatory Action
On July 23, 2014, the SEC adopted amendments to the governing rules for money market funds. The amendments require that, following a two-year implementation timeframe, institutional prime and institutional tax exempt money market funds adopt a floating net asset value. The rule changes also allow for certain liquidity-based redemption fees and gate, and include enhanced requirements for disclosure and stress testing. The degree to which a money market fund will be impacted by the rule amendments will depend upon the type of fund and type of investors (retail or institutional). At this time, management is evaluating the implications of these amendments and their impact to the Portfolios’ financial statements and accompanying notes.
| 2. | | Significant Accounting Policies |
The following is a summary of the significant accounting policies consistently followed by the Portfolios in the preparation of their financial statements.
Security valuation – As permitted under Rule 2a-7 of the 1940 Act and certain conditions therein, securities of the Portfolios are valued initially at cost and thereafter assume a constant amortization to maturity of any discount or premium. Investments in open-end investment companies are valued at their net asset value each business day. Each Portfolio may value securities for which market quotations are not readily available at “fair value,” as determined in good faith pursuant to procedures established by the Board of Trustees (the “Board”). The Board has adopted procedures concerning securities valuation, under which an Oversight Committee makes determinations as to whether market quotations are not readily available or do not otherwise accurately reflect the fair value of the security. The Oversight Committee, or a subgroup thereof, subject to oversight by the Board, may use fair value pricing in a variety of circumstances, including but not limited to, situations when trading in a security has been suspended or halted. If amortized cost is determined not to approximate fair value, the value of the portfolio securities will be determined under procedures established by and under the general supervision of the Oversight Committee. The Oversight Committee will assist in overseeing the comparison of amortized cost to market-based value. Fair value pricing involves subjective judgments and it is possible that the fair value determination for a security is materially different than the value that could be received on the sale of the security.
The Portfolios adopted provisions surrounding fair value measurements and disclosures that define fair value, establish a framework for measuring fair value in generally accepted accounting principles and expand disclosures about fair value measurements. This applies to fair value measurements that are already required or permitted by other accounting standards and is intended to increase consistency of those measurements and applies broadly to securities and other types of assets and liabilities. In accordance with these provisions, fair value is defined as the price that a Portfolio would receive upon selling an investment in a timely transaction to an independent buyer in the principal or most
65
State Street Master Funds
Notes to Financial Statements — (continued)
December 31, 2014
advantageous market of the investment. Various inputs are used in determining the value of the Portfolios’ investments.
The three tier hierarchy of inputs is summarized below:
| | • | | Level 1 – quoted prices in active markets for identical securities |
| | • | | Level 2 – other significant observable inputs (including quoted prices for similar securities, interest rates, prepayment speeds, credit risk, etc.) |
| | • | | Level 3 – significant unobservable inputs (including a Portfolio’s own assumptions in determining the fair value of investments) |
Investments that use Level 2 or Level 3 inputs may include, but are not limited to: (i) an unlisted security related to corporate actions; (ii) a restricted security (e.g., one that may not be publicly sold without registration under the Securities Act of 1933, as amended); (iii) a security whose trading has been suspended or which has been de-listed from its primary trading exchange; (iv) a security that is thinly traded; (v) a security in default or bankruptcy proceedings for which there is no current market quotation; (vi) a security affected by currency controls or restrictions; and (vii) a security affected by a significant event (e.g., an event that occurs after the close of the markets on which the security is traded but before the time as of which the Portfolios’ net assets are computed and that may materially affect the value of the Portfolio’s investments). The valuation of fixed income securities held by the Portfolios are obtained from an independent pricing service and categorized as Level 2 based on the use of other significant observable market based inputs (including quoted prices for similar securities, interest rates, prepayment speed, credit risk, etc). Examples of events that may be “significant events” are government actions, natural disasters, armed conflict, acts of terrorism, and significant market fluctuations.
Fair value pricing could result in a difference between the prices used to calculate a Portfolio’s net asset value and the prices used by such Portfolio’s benchmark index, which, in turn, could result in a difference between a Portfolio’s performance and the performance of such Portfolio’s benchmark index. The inputs or methodology used for valuation are not necessarily an indication of the risk associated with investing in those investments.
The inputs or methodology used for valuing securities are not an indication of the risk associated with investing in those securities.
The following is a summary of the inputs used, as of December 31, 2014, in valuing the Portfolios’ assets carried at fair value:
| | | | | | | | | | | | | | | | | | | | |
| | | Investments in
Securities | |
| Valuation Inputs | | State Street
Money Market
Portfolio | | | State Street
Tax Free
Money Market
Portfolio | | | State Street
U.S. Government
Money Market
Portfolio | | | State Street
Treasury
Money Market
Portfolio | | | State Street
Treasury Plus
Money Market
Portfolio | |
Level 1 – Quoted Prices | | $ | – | | | $ | 61,856,729 | | | $ | – | | | $ | – | | | $ | – | |
Level 2 – Other Significant Observable Inputs | | | 41,018,040,253 | | | | 191,385,000 | | | | 12,456,272,809 | | | | 10,797,407,793 | | | | 2,613,414,585 | |
Level 3 – Significant Unobservable Inputs | | | – | | | | – | | | | – | | | | – | | | | – | |
Total Investments | | $ | 41,018,040,253 | | | $ | 253,241,729 | | | $ | 12,456,272,809 | | | $ | 10,797,407,793 | | | $ | 2,613,414,585 | |
The type of inputs used to value each security under the provisions surrounding fair value measurement and disclosures is identified in each Portfolio of Investments, which also includes a breakdown of the Portfolios’ investments by category.
66
State Street Master Funds
Notes to Financial Statements — (continued)
December 31, 2014
Changes in valuation techniques may result in transfers in or out of an investment’s assigned level within the hierarchy. Transfers between fair value hierarchy levels are recognized at the end of the period. As of the year ended December 31, 2014, there were no transfers between levels.
Securities transactions, investment income and expenses – Securities transactions are recorded on a trade date basis. Interest income is recorded daily on the accrual basis and includes amortization of premium and accretion of discount on investments. Premium is amortized and discount is accreted using the straight line method. Realized gains and losses from securities transactions are recorded on the basis of identified cost. Expenses are accrued daily.
All of the net investment income and realized gains and losses from the security transactions of the Portfolios are allocated pro rata among the partners in the Portfolios daily based on each partner’s daily ownership percentage.
Federal income taxes – The Portfolios are not required to pay federal income taxes on their net investment income and net capital gains because they are treated as partnerships for federal income tax purposes. All interest, gains and losses of the Portfolios are deemed to have been “passed through” to the Portfolios’ partners in proportion to their holdings in the respective Portfolio, regardless of whether such items have been distributed by the Portfolios. Each partner is responsible for tax liability based on its distributive share; therefore, no provision has been made for federal income taxes.
The Portfolios have reviewed the tax positions for open years as of December 31, 2014, and determined they did not have a liability for any unrecognized tax expenses. The Portfolios recognize interest and penalties, if any, related to tax liabilities as income tax expense in the Statements of Operations. As of December 31, 2014, tax years 2012 through 2014 remain subject to examination by the Portfolios’ major tax jurisdictions, which include the United States of America and the Commonwealth of Massachusetts.
At December 31, 2014, the cost of investments for federal income tax purposes was substantially the same as the cost for financial reporting purposes.
Repurchase Agreements – A portfolio may enter into repurchase agreements under the terms of a Master Repurchase Agreement. A repurchase agreement customarily obligates the seller at the time it sells securities to a Portfolio to repurchase the securities at a mutually agreed upon price and time which, in the case of the Portfolios’ transactions, is generally within seven days. The total amount received by a Portfolio on repurchase is calculated to exceed the price paid by the Portfolio, reflecting an agreed-upon market rate of interest for the period of time to the settlement date, and is not necessarily related to the interest rate on the underlying securities. The underlying securities are ordinarily United States Government or Government Agency securities, but may consist of other securities. The value of the underlying securities, at the time of purchase and each subsequent business day, is required to be maintained at such a level that the value is equal to at least the principal amount of the repurchase price plus accrued interest. The use of repurchase agreements involves certain risks. Upon an event of default under the Master Repurchase Agreement, if the seller of securities under a repurchase agreement defaults on its obligation to repurchase the underlying securities (as a result of its bankruptcy or otherwise) a Portfolio will seek to dispose of such securities; this action could involve costs or delays. In addition, the proceeds of any such disposition may be less than the amount a Portfolio is owed under the repurchase agreement. A Portfolio may enter into repurchase agreements maturing within seven days with domestic dealers, banks and other financial institutions deemed to be creditworthy by SSGA Funds Management, Inc. (“SSGA FM” or the “Adviser”), a subsidiary of State Street Corporation and an affiliate of State Street Bank and Trust Company (“State Street”).
Expense allocation – Certain expenses are applicable to multiple Portfolios. Expenses directly attributable to a Portfolio are charged to that Portfolio. Expenses of the Trust that are not directly
67
State Street Master Funds
Notes to Financial Statements — (continued)
December 31, 2014
attributed to a Portfolio are allocated among the Portfolios, on the basis of relative net assets, except where a more appropriate allocation of expenses to each of the Portfolios can otherwise be made.
Use of estimates – The Portfolios’ financial statements are prepared in accordance with U.S. generally accepted accounting principles, which require the use of management estimates. Actual results could differ from those estimates. It is reasonably possible that these differences could be material.
Each Portfolio has entered into an investment advisory agreement with the Adviser, under which the Adviser directs the investments of the Portfolios in accordance with their investment objectives, policies, and limitations. In compensation for the Adviser’s services as investment adviser, each Portfolio pays the Adviser a management fee at an annual rate of 0.05% of its average daily net assets.
State Street is the administrator, custodian and transfer agent for the Portfolios. In compensation for State Street’s services as administrator, custodian and transfer agent, the Portfolios pay State Street an annual fee, which is accrued daily and payable monthly at the following fee rate:
| | |
| Asset Levels | | Annual percentage of average aggregate daily net assets |
First $400 million | | 0.03% |
Next $15 billion | | 0.02% |
Thereafter | | 0.01% |
Minimum annual fee per Portfolio | | $150,000 |
The minimum fee will be calculated by multiplying the minimum per fund fee by the number of Master and stand-alone funds to arrive at the total minimum fee. The greater of the asset based fee or the minimum fee will be charged to the Master and stand-alone funds.
Independent Trustees are compensated on a calendar year basis. Any Trustee who is deemed to be an “interested person” (as defined in the 1940 Act) of the Funds does not receive compensation from the Funds for his or her service as a Trustee.
As of January 24, 2014, each Independent Trustee receives for his or her services to the State Street Master Funds, State Street Institutional Investment Trust and SSGA Funds, a $141,500 annual base retainer in addition to $18,000 for each in-person meeting and $2,000 for each telephonic meeting from the Trust. The Trust will bear a pro rata allocation based on the Trust’s average monthly assets. The Co-Chairmen receive an additional $44,000 annual retainer. The Independent Trustees are reimbursed for travel and other out-of-pocket expenses in connection with meeting attendance. As of the date of this Statement, the Trustees were not paid pension or retirement benefits as part of the Trust’s expenses.
The Trust’s officers are compensated by the Adviser and its affiliates.
The Trust’s organizational documents provide that its officers and trustees are indemnified against certain liabilities arising out of the performance of their duties to the Trust. In addition, both in some of its principal service contracts and in the normal course of its business, the Trust enters into contracts that provide indemnifications to other parties for certain types of losses or liabilities. The Trust’s maximum exposure under these arrangements is unknown as this could involve future claims against the Trust. However, based on experience, the Trust expects the risk of loss to be remote.
68
Report of Independent Registered Public Accounting Firm
To the Board of Trustees and Owners of Beneficial Interest of
State Street Master Funds:
We have audited the accompanying statements of assets and liabilities, including the portfolios of investments, of State Street Money Market Portfolio, State Street Tax Free Money Market Portfolio, State Street U.S. Government Money Market Portfolio, State Street Treasury Money Market Portfolio and State Street Treasury Plus Money Market Portfolio (five of the portfolios constituting State Street Master Funds) (the “Portfolios”) as of December 31, 2014, and the related statements of operations for the year then ended, the statements of changes in net assets for each of the two years in the period then ended, and the financial highlights for each of the five years in the period then ended. These financial statements and financial highlights are the responsibility of the Portfolios’ management. Our responsibility is to express an opinion on these financial statements and financial highlights based on our audits.
We conducted our audits in accordance with the standards of the Public Company Accounting Oversight Board (United States). Those standards require that we plan and perform the audit to obtain reasonable assurance about whether the financial statements and financial highlights are free of material misstatement. We were not engaged to perform an audit of the Portfolios’ internal control over financial reporting. Our audits included consideration of internal control over financial reporting as a basis for designing audit procedures that are appropriate in the circumstances, but not for the purpose of expressing an opinion on the effectiveness of the Portfolios’ internal control over financial reporting. Accordingly, we express no such opinion. An audit also includes examining, on a test basis, evidence supporting the amounts and disclosures in the financial statements and financial highlights, assessing the accounting principles used and significant estimates made by management, and evaluating the overall financial statement presentation. Our procedures included confirmation of securities owned as of December 31, 2014, by correspondence with the custodian and others or by other appropriate auditing procedures where replies from others were not received. We believe that our audits provide a reasonable basis for our opinion.
In our opinion, the financial statements and financial highlights referred to above present fairly, in all material respects, the financial position of State Street Money Market Portfolio, State Street Tax Free Money Market Portfolio, State Street U.S. Government Money Market Portfolio, State Street Treasury Money Market Portfolio and State Street Treasury Plus Money Market Portfolio (five of the portfolios constituting State Street Master Funds) at December 31, 2014, the results of their operations for the year then ended, the changes in their net assets for each of the two years in the period then ended, and the financial highlights for each of the five years in the period then ended, in conformity with U.S. generally accepted accounting principles.

Boston, Massachusetts
February 27, 2015
69
State Street Master Funds
General Information
December 31, 2014 (Unaudited)
EXPENSE EXAMPLE
As a shareholder of a fund (the “Funds”), you incur ongoing costs, which include costs for administrative services and to the extent applicable, distribution (12b-1) fees, among others. This example is intended to help you understand your ongoing costs (in dollars) of investing in the Funds and to compare these costs with the ongoing costs of investing in other mutual funds. It is based on an investment of $1,000 made at the beginning of the period shown and held for the entire period from July 1, 2014 to December 31, 2014.
The table below illustrates your Fund’s costs in two ways:
| | • | | Based on actual fund return – This section helps you to estimate the actual expenses that you paid over the period. The “Ending Account Value” shown is derived from the Fund’s actual return, and the third column shows the dollar amount that would have been paid by an investor who started with $1,000 in the Fund. You may use the information here, together with the amount you invested, to estimate the expenses that you paid over the period. To do so, simply divide your account value by $1,000 (for example, an $8,600 account value divided by $1,000 = 8.6), then multiply the result by the number given for the Fund under the heading “Expenses Paid During Period”. |
| | • | | Based on hypothetical 5% return – This section is intended to help you compare your Fund’s costs with those of other mutual funds. It assumes that the Fund had a yearly return of 5% before expenses, but that the expense ratio is unchanged. In this case, because the return used is not the Fund’s actual return, the results do not apply to your investment. The example is useful in making comparisons because the Securities and Exchange Commission requires all mutual funds to calculate expenses based on a 5% return. You can assess your Fund’s costs by comparing this hypothetical example with the hypothetical examples that appear in shareholder reports of other funds. |
Six Months Ended December 31, 2014
| | | | | | | | | | | | |
| | | Beginning
Account Value July 1, 2014 | | | Ending Account Value December 31, 2014 | | | Expenses Paid During Period * | |
| | | | |
Based on Actual Portfolio Return | | | | | | | | | | | | |
| | | | |
Money Market Portfolio | | $ | 1,000.00 | | | $ | 1,000.70 | | | $ | 0.35 | |
| | | | |
Tax Free Money Market Portfolio | | $ | 1,000.00 | | | $ | 999.60 | | | $ | 0.60 | |
| | | | |
U.S. Government Money Market Portfolio | | $ | 1,000.00 | | | $ | 1,000.00 | | | $ | 0.35 | |
| | | | |
Treasury Money Market Portfolio | | $ | 1,000.00 | | | $ | 999.80 | | | $ | 0.35 | |
| | | | |
Treasury Plus Money Market Portfolio | | $ | 1,000.00 | | | $ | 999.90 | | | $ | 0.35 | |
70
State Street Master Funds
General Information — (continued)
December 31, 2014 (Unaudited)
EXPENSE EXAMPLE — (continued)
| | | | | | | | | | | | |
| | | Beginning
Account Value July 1, 2014 | | | Ending Account Value December 31, 2014 | | | Expenses Paid During Period * | |
| | | | |
Based on Hypothetical (5% return before expenses) | | | | | | | | | | | | |
| | | | |
Money Market Portfolio | | $ | 1,000.00 | | | $ | 1,024.85 | | | $ | 0.36 | |
| | | | |
Tax Free Money Market Portfolio | | $ | 1,000.00 | | | $ | 1,024.60 | | | $ | 0.61 | |
| | | | |
U.S. Government Money Market Portfolio | | $ | 1,000.00 | | | $ | 1,024.85 | | | $ | 0.36 | |
| | | | |
Treasury Money Market Portfolio | | $ | 1,000.00 | | | $ | 1,024.85 | | | $ | 0.36 | |
| | | | |
Treasury Plus Money Market Portfolio | | $ | 1,000.00 | | | $ | 1,024.85 | | | $ | 0.36 | |
| * | The calculations are based on expenses incurred in the most recent six month period of the Portfolios. Each Portfolio’s annualized expense ratio for the six months ended December 31, 2014 was as follows: |
| | | | |
Money Market Portfolio | | | 0.07% | |
Tax Free Money Market Portfolio | | | 0.12% | |
U.S. Government Money Market Portfolio | | | 0.07% | |
Treasury Money Market Portfolio | | | 0.07% | |
Treasury Plus Money Market Portfolio | | | 0.07% | |
| | The dollar amounts shown as “Expenses Paid” are equal to the annualized expense ratio multiplied by the average account value over the period, multiplied by 184/365 (the most recent six month period). |
Proxy Voting Policies and Procedures and Record
Information regarding the Fund’s proxy voting policies and procedures, as well as information regarding how the Fund voted proxies, if any, during the most recent 12-month period ended June 30 is available without charge (1) by calling 1-877-521-4083 (toll free), or (2) on the website of the Securities and Exchange Commission (“SEC”) at www.sec.gov.
Quarterly Portfolio Schedule
The Fund files a complete schedule of portfolio holdings with the SEC for the first and third quarters of each fiscal year on Form N-Q. The Fund’s Forms N-Q are available on the SEC’s website at www.sec.gov and may be reviewed and copied at the SEC’s Public Reference Room in Washington, DC. Information on the operation of the Public Reference Room may be obtained by calling 1-800-SEC-0330. The information on Form N-Q is available upon request, without charge, by calling 1-877-521-4083 (toll-free).
71
State Street Master Funds
Trustees and Officers Information
December 31, 2014
| | | | | | | | | | |
Name, Address,
and Year of Birth | | Position(s) Held
with Trust | | Term of Office
and Length of
Time Served | | Principal Occupation
During Past Five Years | | Number of
Funds in
Fund Complex
Overseen by
Trustee | | Other Directorships
Held by Trustee
During Past Five Years |
Independent Trustees | | | | | | | | | | |
Michael F. Holland State Street Financial Center One Lincoln Street Boston, MA 02111-2900 YOB: 1944 | | Trustee and Co-Chairman of the Board | | Term: Indefinite Elected: 7/99 | | Chairman, Holland & Company L.L.C. (investment adviser) (1995 – present). | | 59 | | Trustee, State Street Institutional Investment Trust; Trustee SSGA Funds; Director, the Holland Series Fund, Inc.; Director, The China Fund, Inc.; Director, The Taiwan Fund, Inc.; Director, Reaves Utility Income Fund, Inc.; and Director, Blackstone/GSO Loan Funds. |
Patrick J. Riley State Street Financial Center One Lincoln Street Boston, MA 02111-2900 YOB: 1948 | | Trustee and Co-Chairman of the Board | | Term: Indefinite Elected: 1/14 | | 2002 to May 2010, Associate Justice of the Superior Court, Commonwealth of Massachusetts; 1985 to 2002, Partner, Riley, Burke & Donahue, L.L.P. (law firm); 1998 to Present, Independent Director, State Street Global Advisers Ireland, Ltd. (investment company); 1998 to Present, Independent Director, SSGA Liquidity plc (formerly, SSGA Cash Management Fund plc); January 2009 to Present, Independent Director, SSGA Fixed Income plc; and January 2009 to Present, Independent Director, SSGA Qualified Funds PLC. | | 59 | | Trustee, State Street Institutional Investment Trust; Trustee SSGA Funds; Board Director and Chairman, SPDR Europe 1PLC (2011 – Present); Board Director and Chairman, SPDR Europe II, PLC (2013 –Present). |
William L. Boyan State Street Financial Center One Lincoln Street Boston, MA 02111-2900 YOB: 1937 | | Trustee and Co-Chairman of the Valuation Committee | | Term: Indefinite Elected: 7/99 | | President and Chief Operations Officer, John Hancock Financial Services (1959 – 1999). Mr. Boyan retired in 1999. Chairman Emeritus, Children’s Hospital, Boston, MA (1984 –2011); Former Chairman, Boston Plan For Excellence, Boston Public Schools (1995 – 2010); Member of Advisory Board of Florida Atlantic University Lifelong Learning Society. | | 59 | | Trustee, State Street Institutional Investment Trust; Trustee SSGA Funds; Former Trustee of Old Mutual South Africa Master Trust; Trustee, Children’s Hospital, Boston, MA. |
72
| | | | | | | | | | |
Name, Address,
and Year of Birth | | Position(s) Held
with Trust | | Term of Office
and Length of
Time Served | | Principal Occupation
During Past Five Years | | Number of
Funds in
Fund Complex
Overseen by
Trustee | | Other Directorships
Held by Trustee
During Past Five Years |
Independent Trustees (continued) |
William L. Marshall State Street Financial Center One Lincoln Street Boston, MA 02111-2900 YOB: 1942 | | Trustee and Co-Chairman of the Audit Committee | | Term: Indefinite Elected: 1/14 | | April 2011 to Present, Chairman (until April 2011, Chief Executive Officer and President), Wm. L. Marshall Associates, Inc., Wm. L. Marshall Companies, Inc. and the Marshall Financial Group, Inc. (a registered investment adviser and provider of financial and related consulting services); Certified Financial Planner; Member, Financial Planners Association; Director, (2008 – 2014) Doylestown Health Foundation Board; and the Ann Silverman Community Clinic of Doylestown, PA. | | 59 | | Trustee, State Street Institutional Investment Trust; Trustee SSGA Funds; Director, Marshall Financial Group, Inc. |
Richard D. Shirk State Street Financial Center One Lincoln Street Boston, MA 02111-2900 YOB: 1945 | | Trustee and Co-Chairman of the Qualified Legal and Compliance Committee | | Term: Indefinite Elected: 1/14 | | March 2001 to April 2002, Chairman (1996 to March 2001, President and Chief Executive Officer), Cerulean Companies, Inc. (holding company) (Retired); 1992 to March 2001, President and Chief Executive Officer, Blue Cross Blue Shield of Georgia (health insurer, managed healthcare); 1998 to December 2008, Chairman, Board Member and December 2008 to Present, Investment Committee Member, Healthcare Georgia Foundation (private foundation); September 2002 to Present, Lead Director and Board Member, Amerigroup Corp. (managed health care); 1999 to Present, Board Member and (since 2001) Investment Committee Member, Woodruff Arts Center; and 2003 to 2009, Trustee, Gettysburg College. | | 59 | | Trustee, State Street Institutional Investment Trust; Trustee SSGA Funds; Board member, AeroCare Holdings (privately held healthcare services company) (February 2003 – Present); Board member, Regenesis Biomedical (health care services) (April 2012 –Present). |
Rina K. Spence State Street Financial Center One Lincoln Street Boston, MA 02111-2900 YOB: 1948 | | Trustee and Co-Chairman of the Qualified Legal and Compliance Committee and Co-Chairman of the Governance Committee | | Term: Indefinite Elected: 7/99 | | President of SpenceCare International LLC (international healthcare consulting) (1999 – present); Chief Executive Officer, IEmily.com (health internet company) (2000 – 2001); Chief Executive Officer of Consensus Pharmaceutical, Inc. (1998 – 1999); Founder, President and Chief Executive Officer of Spence Center for Women’s Health (1994 – 1998); President and CEO Emerson Hospital (1984 – 1994); Trustee, Eastern Enterprise (utilities) (1988 – 2000). | | 59 | | Trustee, State Street Institutional Investment Trust; Trustee SSGA Funds; Director, Berkshire Life Insurance Company of America (1993 – 2009); Director, IEmily.com, Inc. (2000 – 2010); and Trustee, National Osteoporosis Foundation (2005 – 2008). |
73
| | | | | | | | | | |
Name, Address,
and Year of Birth | | Position(s) Held
with Trust | | Term of Office
and Length of
Time Served | | Principal Occupation
During Past Five Years | | Number of
Funds in
Fund Complex
Overseen by
Trustee | | Other Directorships
Held by Trustee
During Past Five Years |
Independent Trustees (continued) |
Bruce D. Taber State Street Financial Center One Lincoln Street Boston, MA 02111-2900 YOB: 1943 | | Trustee and Co-Chairman of the Valuation Committee and Co-Chairman of the Governance Committee | | Term: Indefinite Elected: 1/14 | | 1999 to Present, Partner, Zenergy LLC (a technology company providing Computer Modeling and System Analysis to the General Electric Power Generation Division); Until December 2008, Independent Director, SSGA Cash Management Fund plc; Until December 2008, Independent Director, State Street Global Advisers Ireland, Ltd. (investment companies); and Until August 1994, President, Alonzo B. Reed, Inc., (a Boston architect-engineering firm). | | 59 | | Trustee, State Street Institutional Investment Trust; Trustee SSGA Funds |
Douglas T. Williams State Street Financial Center One Lincoln Street Boston, MA 02111-2900 YOB: 1940 | | Trustee and Co-Chairman of the Audit Committee | | Term: Indefinite Elected: 7/99 | | President, Oakmont Homeowners Association (2012 – 2013); President, Mariner Sands Chapel; Executive Vice President and member of Executive Committee, Chase Manhattan Bank (1987 – 1999); President, Boston Stock Exchange Depository Trust Company, 1981 – 1982. | | 59 | | Trustee, State Street Institutional Investment Trust; Trustee SSGA Funds; Treasurer, Nantucket Educational Trust, (2002-2007). |
| | | | | |
Interested Trustees(1) | | | | | | | | | | |
Scott F. Powers State Street Financial Center One Lincoln Street Boston, MA 02111-2900 YOB: 1959 | | Trustee | | Term: Indefinite Elected Trustee: 1/14 | | May 2008 to Present, President and Chief Executive Officer of State Street Global Advisors; 2001 – 2008, Chief Executive Officer of Old Mutual Asset Management; Board of Directors, United Way of Massachusetts Bay; Board of Directors of Middlesex School; Incorporator, Cardigan Mountain School | | 59 | | |
James E. Ross SSGA Funds Management, Inc. State Street Financial Center One Lincoln Street Boston, MA 02111-2900 YOB: 1965 | | Trustee | | Term: Indefinite Elected Trustee: 2/07 | | Chairman and Director, SSGA Funds Management, Inc. (2012 – present); President, SSGA Funds Management, Inc. (2005 – 2012); Executive Vice President and Senior Managing Director, State Street Global Advisors (2006 – present); and Principal, State Street Global Advisors (2006 – present). | | 254 | | |
| (1) | Mr. Powers and Mr. Ross are Interested Trustees because of their employment by SSGA Funds Management, Inc., an affiliate of the Trust. |
74
| | | | | | |
Name, Address,
and Year of Birth | | Position(s) Held with Trust | | Term of Office
and Length of
Time Served | | Principal Occupation
During Past Five Years |
Officers: | | | | | | |
Ellen M. Needham SSGA Funds Management, Inc. State Street Financial Center One Lincoln Street Boston, MA 02111-2900 YOB: 1967 | | President | | Term: Indefinite Elected: 10/12 | | President and Director, SSGA Funds Management, Inc. (June 2012 – present); Chief Operating Officer, SSGA Funds Management, Inc. (May 2010 – June 2012); Senior Managing Director, SSGA Funds Management, Inc. (1992 – 2012) and Senior Managing Director, State Street Global Advisors (1992 – present).* |
Ann M. Carpenter SSGA Funds Management, Inc. State Street Financial Center One Lincoln Street Boston, MA 02111-2900 YOB: 1966 | | Vice President | | Term: Indefinite Elected: 10/12 | | Chief Operating Officer, SSGA Funds Management, Inc. (April 2014 – present); Vice President, SSGA Funds Management, Inc. (2008 – present); Principal, State Street Global Advisors (2005 – 2008 – present).* |
Laura F. Dell State Street Bank and Trust Company 100 Huntington Avenue Boston, MA 02116 YOB: 1964 | | Treasurer | | Term: Indefinite Elected: 11/10 | | Vice President, State Street Bank and Trust Company (2002 – present).* |
Chad C. Hallett SSGA Funds Management, Inc. State Street Financial Center One Lincoln Street Boston, MA 02111-2900 YOB: 1969 | | Assistant Treasurer | | Term: Indefinite Elected: 09/11 | | Vice President, State Street Global Advisors and SSGA Funds Management, Inc. (November 2014 – present); Vice President, State Street Bank and Trust Company (2001 – November 2014).* |
Caroline M. Connolly State Street Bank and Trust Company 100 Huntington Avenue Boston, MA 02116 YOB: 1975 | | Assistant Treasurer | | Term: Indefinite Elected: 09/11 | | Assistant Vice President, State Street Bank and Trust Company (2007 – present). |
Brian Harris State Street Financial Center One Lincoln Street Boston, MA 02111 YOB: 1973 | | Chief Compliance Officer | | Term: Indefinite Elected: 11/13 | | Vice President, State Street Global Advisors and SSGA Funds Management, Inc. (June 2013 – Present); Senior Vice President and Global Head of Investment Compliance, BofA Global Capital Management (September 2010 to May 2013); Director of Compliance, AARP Financial Inc. (July 2008 to August 2010). |
David K. James State Street Bank and Trust Company 100 Huntington Avenue Boston, MA 02116 YOB: 1970 | | Secretary | | Term: Indefinite Elected: 4/13 | | Managing Director and Managing Counsel, State Street Bank and Trust Company (2009 – present); Vice President and Counsel, PNC Global Investment Servicing (US), Inc. (2006 – 2009). |
Kristin Schantz State Street Bank and Trust Company 100 Huntington Avenue Boston, MA 02116 YOB: 1979 | | Assistant Secretary | | Term: Indefinite Elected: 2/14 | | Vice President and Counsel, State Street Bank and Trust Company (2013 – present); Vice President, Citi Fund Services Ohio, Inc. (2008 – 2013). |
| * | Served in various capacities and/or with various affiliated entities during noted time period. |
The Statement of Additional Information includes additional information about the Trustees and is available, without charge, upon request, by calling (toll free) 877-521-4083.
75
Trustees
William L. Boyan
Michael F. Holland
William L. Marshall
Scott F. Powers
Patrick J. Riley
James E. Ross
Richard D. Shirk
Rina K. Spence
Bruce D. Taber
Douglas T. Williams
Investment Adviser
SSGA Funds Management, Inc.
State Street Financial Center
One Lincoln Street
Boston, MA 02111
Administrator, Custodian and Transfer Agent
State Street Bank and Trust Company
State Street Financial Center
One Lincoln Street
Boston, MA 02111
Independent Public Registered Accounting Firm
Ernst & Young LLP
200 Clarendon Street
Boston, MA 02116
Legal Counsel
Ropes & Gray LLP
800 Boylston Street
Boston, MA 02199
This report is for shareholder information. This is not a prospectus intended for use in the purchase or
sale of shares of beneficial interest.
| | |
State Street Master Funds State Street Bank and Trust Company P.O. Box 5049 Boston, MA 02206 | | SSITINVAR IBG-14270 |
Annual Report
31 December 2014
State Street Master Funds
State Street Equity 500 Index Portfolio

State Street Equity 500 Index Portfolio (Unaudited)
Growth of a $10,000 Investment (a)
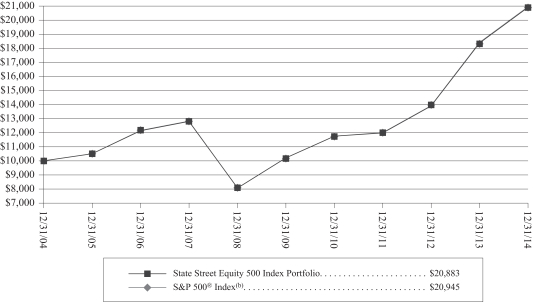
Investment Performance (a)
For the Year Ended December 31, 2014
| | | | | | | | | | | | |
| | | Total Return
One Year Ended
December 31, 2014 | | | Total Return
Average Annual
Five Years Ended
December 31, 2014 | | | Total Return
Average Annual
Ten Years Ended
December 31, 2014 | |
| | | | |
State Street Equity 500 Index Portfolio | | | 13.62 | % | | | 15.40 | % | | | 7.64 | % |
| | | | |
S&P 500® Index(b) | | | 13.68 | % | | | 15.45 | % | | | 7.67 | % |
| (a) | Total returns and performance graph information represent past performance and are not indicative of future results, which may be lower or higher than performance data quoted. Investment return and principal value of an investment will fluctuate so that a partner’s share, when redeemed, may be worth more or less than its original cost. The graph and table above do not reflect the deduction of taxes. |
| (b) | The Standard & Poor’s 500 Composite Stock Price Index (“S&P 500® Index”) is an unmanaged capitalization-weighted index of 500 widely held stocks recognized by investors to be representative of the U.S. stock market in general. It is not possible to invest directly in the S&P 500® Index. |
2
State Street Equity 500 Index Portfolio
MANAGEMENT DISCUSSION OF FUND PERFORMANCE
The State Street Equity 500 Index Portfolio (the “Fund”) seeks to replicate as closely as possible, before expenses, the performance of the Standard & Poor’s 500 Index (the “Index”). In seeking to achieve this objective, the Fund utilizes a passive management strategy designed to track the performance of the Index. The Fund also employs futures to maintain market exposure and otherwise assist in attempting to replicate the performance of the Index. The Fund invested in S&P 500 futures contracts to equitize the small amount of cash in the portfolio during the Reporting Period. Futures performance did not have a material impact on portfolio performance.
For the 12-month period ended December 31, 2014 (the “Reporting Period”), the total return for the Fund was 13.62%, and the total return for the Index was 13.68%. The Fund and Index returns reflect the reinvestment of dividends and other income. The Fund’s performance reflects the expenses of the Fund, including brokerage and advisory expenses. The Index is unmanaged and Index returns do not reflect fees and expenses of any kind, which would have a negative impact on returns. The expenses of managing the Fund and slight variations between the Fund’s holdings and the Index’s constituents contributed to the difference between the Fund’s performance and that of the Index.
The opening quarter of 2014 offered investors plenty of worthwhile return opportunities, but progress was not without pitfalls, and the best results arrived in unlikely corners of the marketplace. A disappointing January brought a number of chillier reports on global economic activity, and the first month of 2014 ended with US stocks hesitating near two-month lows. A weak manufacturing reading in early February served to unnerve investors further, driving averages of larger US equities to the worst levels since late October. But Janet Yellen, newly installed head of the US Federal Reserve, came across as thoroughgoing and confident in her first opportunity to provide formal testimony before Congress. With policy continuity assured, investors used the remainder of February to lift the Index back up and over the record levels at which it had traded near the end of 2013. Although performance of banking names faltered later in March when Citigroup emerged as a prominent failure in Federal Reserve stress tests, prospects for additional share offerings linked to internet and biotechnology themes had already made investors wary of excess equity supply in firms with rapid growth characteristics.
After an initial lift as the second quarter got underway, equities worldwide began once again to struggle with the possibility that growth in 2014 might not evolve as robustly as anticipated. The International Monetary Fund (IMF) contributed further to the uncertainty when it released its updated economic outlook. With interest rates potentially lower for longer than many market participants anticipate and net profit margins on large-cap stocks at 20 year highs, it’s no wonder the equity markets continue to hit record highs. Valuations continued to look attractive especially compared to 10-year interest rates. There was concern, though, amongst investors that the low level of volatility was creating complacency amongst equity owners which would spell trouble for the next correction. However, given the attractive valuations and very few other compelling alternatives, many investors were perhaps begrudgingly adding to their equities. For the quarter, the Index was up 5.22%
Positive earnings news from the US provided some relief from the gloom in the third quarter, as did comments from Fed Chair, Janet Yellen, in testimony before the US Senate. However, July ended with a decided thud, as the market had its biggest down day since February with the Index down 2% on the last day of trading. Equity markets stumbled in September as the Index was down 1.40%
The fourth quarter began as the third quarter ended with stocks sliding and bond markets rallying. The IMF cut its global growth forecasts and interest rates moved lower. US banks began reporting better
3
State Street Equity 500 Index Portfolio
MANAGEMENT DISCUSSION OF FUND PERFORMANCE — (continued)
than expected earnings which helped turn the equity rout around. Fed Vice-Chair Stanley Fischer helped improve sentiment when he said, “If foreign growth is weaker than anticipated, the consequences for the US economy could lead the Fed to remove accommodation more slowly than otherwise.” The Index began a dramatic rally and closed out the second half of October with a rise of 8.1% to end the month up 2.44%. The Index was up 2.69% in November which is similar to October’s gain, but the returns for the month were achieved on a much smoother glide upwards than October’s precipitous decline and meteoric rise. December posted a return that was relatively flat, leaving the Fund with a year-to-date return of over 13% for 2014.
On an individual security level, the top positive contributors to the Fund’s performance were: Union Pacific Corp., Intel Corporation and Facebook, Inc.
The top negative contributors to the Fund’s performance were: Transocean Ltd., Freeport-McMoRan, Inc. and Apache Corp.
4
State Street Equity 500 Index Portfolio (Unaudited)
EXPENSE EXAMPLE
As a shareholder of the State Street Equity 500 Index Portfolio (the “Portfolio”), you incur ongoing costs, which include costs for portfolio management and administrative services, among others. This example is intended to help you understand your ongoing costs (in dollars) of investing in the Portfolio and to compare these costs with the ongoing costs of investing in other mutual funds.
The example is based on an investment of $1,000 made at the beginning of the period shown and held for the entire period from July 1, 2014 to December 31, 2014.
The table below illustrates your Portfolio’s costs in two ways:
| | • | | Based on actual fund return. This section helps you to estimate the actual expenses that you paid over the period. The “Ending Account Value” shown is derived from the actual return of the Portfolio, and the third column shows the dollar amount that would have been paid by an investor who started with $1,000 in the Portfolio. You may use the information here, together with the amount you invested, to estimate the expenses that you paid over the period. |
To do so, simply divide your account value by $1,000 (for example, an $8,600 account value divided by $1,000 = 8.6), then multiply the result by the number given for the Portfolio under the heading “Expenses Paid During Period”.
| | • | | Based on hypothetical 5% return. This section is intended to help you compare your Portfolio’s costs with those of other mutual funds. It assumes that the Portfolio had a yearly return of 5% before expenses, but that the expense ratio is unchanged. In this case, because the return used is not the Portfolio’s actual return, the results do not apply to your investment. The example is useful in making comparisons because the Securities and Exchange Commission requires all mutual funds to calculate expenses based on a 5% return. You can assess your Portfolio’s costs by comparing this hypothetical example with the hypothetical examples that appear in shareholder reports of other funds. |
Six Months Ended December 31, 2014
| | | | | | | | | | | | |
| | | Beginning Account Value July 1, 2014 | | | Ending Account Value December 31, 2014 | | | Expenses Paid During Period * | |
| | | | |
Based on Actual Portfolio Return | | $ | 1,000.00 | | | $ | 1,060.90 | | | $ | 0.24 | |
| | | | |
Based on Hypothetical (5% return before expenses) | | $ | 1,000.00 | | | $ | 1,024.97 | | | $ | 0.23 | |
| * | The calculations are based on expenses incurred in the most recent fiscal period of the Portfolio. The annualized expense ratio for the six months ended December 31, 2014 was 0.046%. The dollar amounts shown as “Expenses Paid” are equal to the annualized expense ratio multiplied by the average account value over the period, multiplied by 184/365 (the most recent six month period). |
5
State Street Equity 500 Index Portfolio
Portfolio Statistics (Unaudited)
| | | | |
Portfolio Composition* | | | December 31, 2014 | |
Common Stocks | | | 96.9 | % |
Money Market Fund | | | 3.2 | |
U.S. Government Securities | | | 0.2 | |
Liabilities in Excess of Other Assets | | | (0.3 | ) |
Total | | | 100.0 | % |
| | | | |
Top Five Sectors (excluding short-term investments)* | | | December 31, 2014 | |
Information Technology | | | 19.1 | % |
Financials | | | 16.1 | |
Health Care | | | 13.8 | |
Consumer Discretionary | | | 11.7 | |
Industrials | | | 10.1 | |
Total | | | 70.8 | % |
| * | As a percentage of net assets as of the date indicated. The Portfolio’s composition will vary over time. |
See Notes to Financial Statements.
6
State Street Equity 500 Index Portfolio
Portfolio of Investments
December 31, 2014
| | | | | | | | |
| | | Shares | | | Market
Value | |
COMMON STOCKS – 96.9% | | | | | |
Consumer Discretionary – 11.7% | | | | | |
Amazon.com, Inc.(a) | | | 58,102 | | | $ | 18,031,956 | |
AutoNation, Inc.(a) | | | 12,469 | | | | 753,252 | |
AutoZone, Inc.(a) | | | 4,988 | | | | 3,088,121 | |
Bed Bath & Beyond, Inc.(a) | | | 31,630 | | | | 2,409,257 | |
Best Buy Co., Inc. | | | 44,213 | | | | 1,723,423 | |
BorgWarner, Inc. | | | 36,423 | | | | 2,001,444 | |
Cablevision Systems Corp. Class A | | | 30,812 | | | | 635,960 | |
CarMax, Inc.(a) | | | 32,197 | | | | 2,143,676 | |
Carnival Corp. | | | 69,149 | | | | 3,134,524 | |
CBS Corp. Class B | | | 72,993 | | | | 4,039,433 | |
Chipotle Mexican Grill, Inc.(a) | | | 4,614 | | | | 3,158,329 | |
Coach, Inc. | | | 38,800 | | | | 1,457,328 | |
Comcast Corp. Class A | | | 391,565 | | | | 22,714,686 | |
D.R. Horton, Inc. | | | 50,179 | | | | 1,269,027 | |
Darden Restaurants, Inc. | | | 20,917 | | | | 1,226,364 | |
Delphi Automotive PLC | | | 43,681 | | | | 3,176,482 | |
DIRECTV(a) | | | 76,375 | | | | 6,621,712 | |
Discovery Communications, Inc. Class A(a) | | | 21,597 | | | | 744,017 | |
Discovery Communications, Inc. Class C(a) | | | 39,797 | | | | 1,341,955 | |
Dollar General Corp.(a) | | | 44,487 | | | | 3,145,231 | |
Dollar Tree, Inc.(a) | | | 30,293 | | | | 2,132,021 | |
Expedia, Inc. | | | 15,023 | | | | 1,282,363 | |
Family Dollar Stores, Inc. | | | 13,465 | | | | 1,066,563 | |
Ford Motor Co. | | | 589,560 | | | | 9,138,180 | |
Fossil Group, Inc.(a) | | | 7,617 | | | | 843,506 | |
GameStop Corp. Class A | | | 16,878 | | | | 570,476 | |
Gannett Co., Inc. | | | 34,252 | | | | 1,093,666 | |
Gap, Inc. | | | 44,764 | | | | 1,885,012 | |
Garmin Ltd. | | | 19,560 | | | | 1,033,355 | |
General Motors Co. | | | 206,677 | | | | 7,215,094 | |
Genuine Parts Co. | | | 24,420 | | | | 2,602,439 | |
Goodyear Tire & Rubber Co. | | | 40,813 | | | | 1,166,027 | |
H&R Block, Inc. | | | 45,551 | | | | 1,534,158 | |
Harley-Davidson, Inc. | | | 33,585 | | | | 2,213,587 | |
Harman International Industries, Inc. | | | 10,405 | | | | 1,110,317 | |
Hasbro, Inc. | | | 15,428 | | | | 848,386 | |
Home Depot, Inc. | | | 201,910 | | | | 21,194,493 | |
Interpublic Group of Cos., Inc. | | | 62,228 | | | | 1,292,475 | |
Johnson Controls, Inc. | | | 102,206 | | | | 4,940,638 | |
Kohl’s Corp. | | | 29,888 | | | | 1,824,363 | |
L Brands, Inc. | | | 36,546 | | | | 3,163,056 | |
Leggett & Platt, Inc. | | | 20,944 | | | | 892,424 | |
Lennar Corp. Class A | | | 26,425 | | | | 1,184,104 | |
Lowe’s Cos., Inc. | | | 150,012 | | | | 10,320,826 | |
Macy’s, Inc. | | | 53,161 | | | | 3,495,336 | |
Marriott International, Inc. Class A | | | 33,797 | | | | 2,637,180 | |
Mattel, Inc. | | | 47,843 | | | | 1,480,502 | |
McDonald’s Corp. | | | 147,715 | | | | 13,840,895 | |
Michael Kors Holdings, Ltd.(a) | | | 29,886 | | | | 2,244,439 | |
Mohawk Industries, Inc.(a) | | | 9,669 | | | | 1,502,176 | |
Netflix, Inc.(a) | | | 8,828 | | | | 3,015,733 | |
Newell Rubbermaid, Inc. | | | 41,451 | | | | 1,578,869 | |
News Corp. Class A(a) | | | 69,414 | | | | 1,089,106 | |
NIKE, Inc. Class B | | | 105,051 | | | | 10,100,654 | |
Nordstrom, Inc. | | | 20,456 | | | | 1,624,002 | |
O’Reilly Automotive, Inc.(a) | | | 15,320 | | | | 2,950,938 | |
Omnicom Group, Inc. | | | 38,550 | | | | 2,986,468 | |
PetSmart, Inc. | | | 14,973 | | | | 1,217,230 | |
Priceline Group, Inc.(a) | | | 7,908 | | | | 9,016,781 | |
PulteGroup, Inc. | | | 47,343 | | | | 1,015,981 | |
PVH Corp. | | | 12,451 | | | | 1,595,845 | |
Ralph Lauren Corp. | | | 9,236 | | | | 1,710,138 | |
Ross Stores, Inc. | | | 31,072 | | | | 2,928,847 | |
Royal Caribbean Cruises, Ltd. | | | 25,100 | | | | 2,068,993 | |
Scripps Networks Interactive, Inc. Class A | | | 15,263 | | | | 1,148,846 | |
Staples, Inc. | | | 95,234 | | | | 1,725,640 | |
Starbucks Corp. | | | 114,546 | | | | 9,398,499 | |
Starwood Hotels & Resorts Worldwide, Inc. | | | 29,944 | | | | 2,427,560 | |
Target Corp. | | | 95,444 | | | | 7,245,154 | |
Tiffany & Co. | | | 16,081 | | | | 1,718,416 | |
Time Warner Cable, Inc. | | | 42,574 | | | | 6,473,802 | |
Time Warner, Inc. | | | 127,580 | | | | 10,897,884 | |
TJX Cos., Inc. | | | 105,275 | | | | 7,219,759 | |
Tractor Supply Co. | | | 19,474 | | | | 1,534,941 | |
TripAdvisor, Inc.(a) | | | 15,715 | | | | 1,173,282 | |
Twenty-First Century Fox, Inc. Class A | | | 285,609 | | | | 10,968,814 | |
Under Armour, Inc. Class A(a) | | | 25,076 | | | | 1,702,660 | |
Urban Outfitters, Inc.(a) | | | 15,839 | | | | 556,424 | |
V.F. Corp. | | | 53,528 | | | | 4,009,247 | |
Viacom, Inc. Class B | | | 57,541 | | | | 4,329,960 | |
Walt Disney Co. | | | 236,793 | | | | 22,303,533 | |
Whirlpool Corp. | | | 12,459 | | | | 2,413,807 | |
Wyndham Worldwide Corp. | | | 19,646 | | | | 1,684,841 | |
Wynn Resorts, Ltd. | | | 11,859 | | | | 1,764,145 | |
Yum! Brands, Inc. | | | 67,990 | | | | 4,953,071 | |
| | | | | | | | |
| | | | | | | 337,114,104 | |
| | | | | | | | |
Consumer Staples – 9.5% | | | | | | | | |
Altria Group, Inc. | | | 303,870 | | | | 14,971,675 | |
Archer-Daniels-Midland Co. | | | 97,392 | | | | 5,064,384 | |
Avon Products, Inc. | | | 58,558 | | | | 549,860 | |
Brown-Forman Corp. Class B | | | 24,161 | | | | 2,122,302 | |
Campbell Soup Co. | | | 24,983 | | | | 1,099,252 | |
Clorox Co. | | | 19,379 | | | | 2,019,486 | |
Coca-Cola Co. | | | 599,122 | | | | 25,294,931 | |
Coca-Cola Enterprises, Inc. | | | 35,313 | | | | 1,561,541 | |
Colgate-Palmolive Co. | | | 130,379 | | | | 9,020,923 | |
ConAgra Foods, Inc. | | | 66,051 | | | | 2,396,330 | |
Constellation Brands, Inc. Class A(a) | | | 24,776 | | | | 2,432,260 | |
Costco Wholesale Corp. | | | 66,834 | | | | 9,473,719 | |
CVS Health Corp. | | | 174,027 | | | | 16,760,540 | |
Dr. Pepper Snapple Group, Inc. | | | 28,303 | | | | 2,028,759 | |
Estee Lauder Cos., Inc. Class A | | | 32,763 | | | | 2,496,541 | |
General Mills, Inc. | | | 94,522 | | | | 5,040,858 | |
Hershey Co. | | | 23,615 | | | | 2,454,307 | |
Hormel Foods Corp. | | | 18,349 | | | | 955,983 | |
J.M. Smucker Co. | | | 14,855 | | | | 1,500,058 | |
Kellogg Co. | | | 40,207 | | | | 2,631,146 | |
Keurig Green Mountain, Inc. | | | 18,089 | | | | 2,394,893 | |
Kimberly-Clark Corp. | | | 57,473 | | | | 6,640,430 | |
Kraft Foods Group, Inc. | | | 90,751 | | | | 5,686,458 | |
See Notes to Financial Statements.
7
State Street Equity 500 Index Portfolio
Portfolio of Investments — (continued)
December 31, 2014
| | | | | | | | |
| | | Shares | | | Market
Value | |
COMMON STOCKS – (continued) | | | | | |
Consumer Staples – (continued) | | | | | | | | |
Kroger Co. | | | 76,955 | | | $ | 4,941,281 | |
Lorillard, Inc. | | | 53,128 | | | | 3,343,876 | |
McCormick & Co., Inc. | | | 20,261 | | | | 1,505,392 | |
Mead Johnson Nutrition Co. | | | 30,568 | | | | 3,073,307 | |
Molson Coors Brewing Co. Class B | | | 23,509 | | | | 1,751,891 | |
Mondelez International, Inc. Class A | | | 255,894 | | | | 9,295,350 | |
Monster Beverage Corp.(a) | | | 21,547 | | | | 2,334,617 | |
PepsiCo, Inc. | | | 226,738 | | | | 21,440,345 | |
Philip Morris International, Inc. | | | 237,687 | | | | 19,359,606 | |
Procter & Gamble Co. | | | 411,961 | | | | 37,525,527 | |
Reynolds American, Inc. | | | 45,070 | | | | 2,896,649 | |
Safeway, Inc. | | | 32,165 | | | | 1,129,635 | |
Sysco Corp. | | | 87,335 | | | | 3,466,326 | |
Tyson Foods, Inc. Class A | | | 44,691 | | | | 1,791,662 | |
Wal-Mart Stores, Inc. | | | 241,499 | | | | 20,739,934 | |
Walgreens Boots Alliance, Inc. | | | 133,713 | | | | 10,188,931 | |
Whole Foods Market, Inc. | | | 55,587 | | | | 2,802,697 | |
| | | | | | | | |
| | | | | | | 272,183,662 | |
| | | | | | | | |
Energy – 8.2% | | | | | | | | |
Anadarko Petroleum Corp. | | | 77,544 | | | | 6,397,380 | |
Apache Corp. | | | 56,370 | | | | 3,532,708 | |
Baker Hughes, Inc. | | | 64,694 | | | | 3,627,393 | |
Cabot Oil & Gas Corp. | | | 65,622 | | | | 1,943,067 | |
Cameron International Corp.(a) | | | 30,467 | | | | 1,521,827 | |
Chesapeake Energy Corp. | | | 78,594 | | | | 1,538,085 | |
Chevron Corp.(b) | | | 287,334 | | | | 32,233,128 | |
Cimarex Energy Co. | | | 13,242 | | | | 1,403,652 | |
ConocoPhillips | | | 187,103 | | | | 12,921,333 | |
CONSOL Energy, Inc. | | | 32,173 | | | | 1,087,769 | |
Denbury Resources, Inc. | | | 53,229 | | | | 432,752 | |
Devon Energy Corp. | | | 59,550 | | | | 3,645,056 | |
Diamond Offshore Drilling, Inc. | | | 9,954 | | | | 365,411 | |
Ensco PLC Class A | | | 32,889 | | | | 985,026 | |
EOG Resources, Inc. | | | 83,263 | | | | 7,666,024 | |
EQT Corp. | | | 22,243 | | | | 1,683,795 | |
ExxonMobil Corp.(b) | | | 644,672 | | | | 59,599,926 | |
FMC Technologies, Inc.(a) | | | 33,409 | | | | 1,564,878 | |
Halliburton Co. | | | 130,167 | | | | 5,119,468 | |
Helmerich & Payne, Inc. | | | 14,974 | | | | 1,009,547 | |
Hess Corp. | | | 38,344 | | | | 2,830,554 | |
Kinder Morgan, Inc. | | | 258,176 | | | | 10,923,427 | |
Marathon Oil Corp. | | | 99,689 | | | | 2,820,202 | |
Marathon Petroleum Corp. | | | 43,801 | | | | 3,953,478 | |
Murphy Oil Corp. | | | 24,962 | | | | 1,261,080 | |
Nabors Industries, Ltd. | | | 41,720 | | | | 541,526 | |
National Oilwell Varco, Inc. | | | 66,641 | | | | 4,366,985 | |
Newfield Exploration Co.(a) | | | 20,685 | | | | 560,977 | |
Noble Corp. PLC | | | 37,996 | | | | 629,594 | |
Noble Energy, Inc. | | | 54,795 | | | | 2,598,927 | |
Occidental Petroleum Corp. | | | 117,635 | | | | 9,482,557 | |
ONEOK, Inc. | | | 31,504 | | | | 1,568,584 | |
Phillips 66 | | | 85,692 | | | | 6,144,116 | |
Pioneer Natural Resources Co. | | | 23,524 | | | | 3,501,547 | |
QEP Resources, Inc. | | | 27,323 | | | | 552,471 | |
Range Resources Corp. | | | 24,841 | | | | 1,327,751 | |
Schlumberger, Ltd. | | | 195,272 | | | | 16,678,182 | |
Southwestern Energy Co.(a) | | | 51,844 | | | | 1,414,823 | |
Spectra Energy Corp. | | | 104,141 | | | | 3,780,318 | |
Tesoro Corp. | | | 20,049 | | | | 1,490,643 | |
Transocean, Ltd. | | | 47,690 | | | | 874,158 | |
Valero Energy Corp. | | | 78,586 | | | | 3,890,007 | |
Williams Cos., Inc. (The) | | | 102,610 | | | | 4,611,293 | |
| | | | | | | | |
| | | | | | | 234,081,425 | |
| | | | | | | | |
Financials – 16.1% | | | | | | | | |
ACE, Ltd. | | | 49,767 | | | | 5,717,233 | |
Affiliated Managers Group, Inc.(a) | | | 8,476 | | | | 1,798,946 | |
Aflac, Inc. | | | 69,737 | | | | 4,260,233 | |
Allstate Corp. | | | 63,967 | | | | 4,493,682 | |
American Express Co. | | | 136,052 | | | | 12,658,278 | |
American International Group, Inc. | | | 215,932 | | | | 12,094,351 | |
American Tower Corp. REIT | | | 59,682 | | | | 5,899,566 | |
Ameriprise Financial, Inc. | | | 27,963 | | | | 3,698,107 | |
Aon PLC | | | 42,882 | | | | 4,066,500 | |
Apartment Investment & Management Co. Class A REIT | | | 19,865 | | | | 737,985 | |
Assurant, Inc. | | | 10,846 | | | | 742,192 | |
AvalonBay Communities, Inc. REIT | | | 19,529 | | | | 3,190,843 | |
Bank of America Corp. | | | 1,598,166 | | | | 28,591,190 | |
Bank of New York Mellon Corp. | | | 172,691 | | | | 7,006,074 | |
BB&T Corp. | | | 109,439 | | | | 4,256,083 | |
Berkshire Hathaway, Inc. Class B(a) | | | 277,919 | | | | 41,729,538 | |
BlackRock, Inc. | | | 19,418 | | | | 6,943,100 | |
Boston Properties, Inc. REIT | | | 22,821 | | | | 2,936,835 | |
Capital One Financial Corp. | | | 85,268 | | | | 7,038,873 | |
CBRE Group, Inc.(a) | | | 42,908 | | | | 1,469,599 | |
Charles Schwab Corp. | | | 172,289 | | | | 5,201,405 | |
Chubb Corp. | | | 35,896 | | | | 3,714,159 | |
Cincinnati Financial Corp. | | | 23,305 | | | | 1,207,898 | |
Citigroup, Inc. | | | 462,693 | | | | 25,036,318 | |
CME Group, Inc. | | | 49,092 | | | | 4,352,006 | |
Comerica, Inc. | | | 25,917 | | | | 1,213,952 | |
Crown Castle International Corp. REIT | | | 51,842 | | | | 4,079,965 | |
Discover Financial Services | | | 68,377 | | | | 4,478,010 | |
E*TRADE Financial Corp.(a) | | | 43,889 | | | | 1,064,528 | |
Equity Residential REIT | | | 56,238 | | | | 4,040,138 | |
Essex Property Trust, Inc. REIT | | | 9,555 | | | | 1,974,063 | |
Fifth Third Bancorp | | | 122,654 | | | | 2,499,075 | |
Franklin Resources, Inc. | | | 57,851 | | | | 3,203,210 | |
General Growth Properties, Inc. REIT | | | 91,342 | | | | 2,569,450 | |
Genworth Financial, Inc. Class A(a) | | | 71,189 | | | | 605,107 | |
Goldman Sachs Group, Inc. | | | 62,188 | | | | 12,053,900 | |
Hartford Financial Services Group, Inc. | | | 70,630 | | | | 2,944,565 | |
HCP, Inc. REIT | | | 69,777 | | | | 3,072,281 | |
Health Care REIT, Inc. | | | 49,581 | | | | 3,751,794 | |
Host Hotels & Resorts, Inc. REIT | | | 113,659 | | | | 2,701,674 | |
See Notes to Financial Statements.
8
State Street Equity 500 Index Portfolio
Portfolio of Investments — (continued)
December 31, 2014
| | | | | | | | |
| | | Shares | | | Market
Value | |
COMMON STOCKS – (continued) | | | | | |
Financials – (continued) | | | | | | | | |
Hudson City Bancorp, Inc. | | | 66,376 | | | $ | 671,725 | |
Huntington Bancshares, Inc. | | | 122,865 | | | | 1,292,540 | |
Intercontinental Exchange, Inc. | | | 17,525 | | | | 3,843,057 | |
Invesco Ltd. | | | 65,489 | | | | 2,588,125 | |
Iron Mountain, Inc. REIT | | | 33,274 | | | | 1,286,373 | |
J.P. Morgan Chase & Co. | | | 571,672 | | | | 35,775,234 | |
KeyCorp | | | 128,679 | | | | 1,788,638 | |
Kimco Realty Corp. REIT | | | 64,016 | | | | 1,609,362 | |
Legg Mason, Inc. | | | 15,615 | | | | 833,373 | |
Leucadia National Corp. | | | 47,809 | | | | 1,071,878 | |
Lincoln National Corp. | | | 40,310 | | | | 2,324,678 | |
Loews Corp. | | | 48,012 | | | | 2,017,464 | |
M&T Bank Corp. | | | 19,334 | | | | 2,428,737 | |
Marsh & McLennan Cos., Inc. | | | 82,934 | | | | 4,747,142 | |
McGraw Hill Financial, Inc. | | | 40,298 | | | | 3,585,716 | |
MetLife, Inc. | | | 175,626 | | | | 9,499,610 | |
Moody’s Corp. | | | 27,234 | | | | 2,609,290 | |
Morgan Stanley | | | 231,955 | | | | 8,999,854 | |
NASDAQ OMX Group, Inc. | | | 15,925 | | | | 763,763 | |
Navient Corp. | | | 59,941 | | | | 1,295,325 | |
Northern Trust Corp. | | | 35,310 | | | | 2,379,894 | |
People’s United Financial, Inc. | | | 49,334 | | | | 748,890 | |
Plum Creek Timber Co., Inc. REIT | | | 27,186 | | | | 1,163,289 | |
PNC Financial Services Group, Inc. | | | 82,842 | | | | 7,557,676 | |
Principal Financial Group, Inc. | | | 40,326 | | | | 2,094,532 | |
Progressive Corp. | | | 85,852 | | | | 2,317,146 | |
ProLogis, Inc. REIT | | | 74,347 | | | | 3,199,151 | |
Prudential Financial, Inc. | | | 70,037 | | | | 6,335,547 | |
Public Storage, Inc. REIT | | | 21,452 | | | | 3,965,402 | |
Regions Financial Corp. | | | 213,143 | | | | 2,250,790 | |
Simon Property Group, Inc. REIT | | | 47,435 | | | | 8,638,388 | |
State Street Corp.(c) | | | 62,947 | | | | 4,941,340 | |
SunTrust Banks, Inc. | | | 78,882 | | | | 3,305,156 | |
T. Rowe Price Group, Inc. | | | 38,320 | | | | 3,290,155 | |
The Macerich Co. REIT | | | 20,945 | | | | 1,747,022 | |
Torchmark Corp. | | | 19,384 | | | | 1,050,031 | |
Travelers Cos., Inc. | | | 51,098 | | | | 5,408,723 | |
U.S. Bancorp | | | 271,630 | | | | 12,209,769 | |
Unum Group | | | 35,424 | | | | 1,235,589 | |
Ventas, Inc. REIT | | | 44,703 | | | | 3,205,205 | |
Vornado Realty Trust REIT | | | 27,746 | | | | 3,265,982 | |
Wells Fargo & Co. | | | 721,646 | | | | 39,560,634 | |
Weyerhaeuser Co. REIT | | | 81,681 | | | | 2,931,531 | |
XL Group PLC | | | 38,920 | | | | 1,337,680 | |
Zions Bancorporation | | | 31,258 | | | | 891,166 | |
| | | | | | | | |
| | | | | | | 463,155,278 | |
| | | | | | | | |
Health Care – 13.8% | | | | | | | | |
Abbott Laboratories | | | 227,959 | | | | 10,262,714 | |
AbbVie, Inc. | | | 241,063 | | | | 15,775,163 | |
Actavis PLC(a) | | | 40,969 | | | | 10,545,830 | |
Aetna, Inc. | | | 52,415 | | | | 4,656,024 | |
Agilent Technologies, Inc. | | | 52,075 | | | | 2,131,951 | |
Alexion Pharmaceuticals, Inc.(a) | | | 30,127 | | | | 5,574,399 | |
Allergan, Inc. | | | 45,014 | | | | 9,569,526 | |
AmerisourceBergen Corp. | | | 33,552 | | | | 3,025,048 | |
Amgen, Inc. | | | 116,391 | | | | 18,539,922 | |
Anthem, Inc. | | | 42,119 | | | | 5,293,095 | |
Baxter International, Inc. | | | 82,545 | | | | 6,049,723 | |
Becton Dickinson and Co. | | | 28,992 | | | | 4,034,527 | |
Biogen Idec, Inc.(a) | | | 35,847 | | | | 12,168,264 | |
Boston Scientific Corp.(a) | | | 208,377 | | | | 2,760,995 | |
Bristol-Myers Squibb Co. | | | 251,212 | | | | 14,829,044 | |
C.R. Bard, Inc. | | | 11,162 | | | | 1,859,812 | |
Cardinal Health, Inc. | | | 52,424 | | | | 4,232,190 | |
CareFusion Corp.(a) | | | 29,322 | | | | 1,739,968 | |
Celgene Corp.(a) | | | 122,865 | | | | 13,743,679 | |
Cerner Corp.(a) | | | 47,263 | | | | 3,056,026 | |
CIGNA Corp. | | | 39,811 | | | | 4,096,950 | |
Covidien PLC | | | 68,613 | | | | 7,017,738 | |
DaVita HealthCare Partners, Inc.(a) | | | 26,572 | | | | 2,012,563 | |
DENTSPLY International, Inc. | | | 20,166 | | | | 1,074,243 | |
Edwards Lifesciences Corp.(a) | | | 16,445 | | | | 2,094,764 | |
Eli Lilly & Co. | | | 149,057 | | | | 10,283,442 | |
Express Scripts Holding Co.(a) | | | 111,647 | | | | 9,453,152 | |
Gilead Sciences, Inc.(a) | | | 228,746 | | | | 21,561,598 | |
Hospira, Inc.(a) | | | 25,017 | | | | 1,532,291 | |
Humana, Inc. | | | 22,917 | | | | 3,291,569 | |
Intuitive Surgical, Inc.(a) | | | 5,452 | | | | 2,883,781 | |
Johnson & Johnson | | | 427,741 | | | | 44,728,876 | |
Laboratory Corp. of America Holdings(a) | | | 13,347 | | | | 1,440,141 | |
Mallinckrodt PLC(a) | | | 17,700 | | | | 1,752,831 | |
McKesson Corp. | | | 36,031 | | | | 7,479,315 | |
Medtronic, Inc. | | | 148,410 | | | | 10,715,202 | |
Merck & Co., Inc. | | | 435,198 | | | | 24,714,894 | |
Mylan, Inc.(a) | | | 56,907 | | | | 3,207,848 | |
Patterson Cos., Inc. | | | 11,159 | | | | 536,748 | |
PerkinElmer, Inc. | | | 16,632 | | | | 727,317 | |
Perrigo Co. PLC | | | 20,814 | | | | 3,479,268 | |
Pfizer, Inc. | | | 958,648 | | | | 29,861,885 | |
Quest Diagnostics, Inc. | | | 22,158 | | | | 1,485,915 | |
Regeneron Pharmaceuticals, Inc.(a) | | | 11,458 | | | | 4,700,645 | |
St. Jude Medical, Inc. | | | 44,053 | | | | 2,864,767 | |
Stryker Corp. | | | 45,595 | | | | 4,300,976 | |
Tenet Healthcare Corp.(a) | | | 13,452 | | | | 681,613 | |
Thermo Fisher Scientific, Inc. | | | 60,512 | | | | 7,581,549 | |
UnitedHealth Group, Inc. | | | 146,122 | | | | 14,771,473 | |
Universal Health Services, Inc. | | | 13,300 | | | | 1,479,758 | |
Varian Medical Systems, Inc.(a) | | | 15,631 | | | | 1,352,238 | |
Vertex Pharmaceuticals, Inc.(a) | | | 36,648 | | | | 4,353,782 | |
Waters Corp.(a) | | | 11,915 | | | | 1,343,059 | |
Zimmer Holdings, Inc. | | | 25,727 | | | | 2,917,956 | |
Zoetis, Inc. | | | 76,228 | | | | 3,280,091 | |
| | | | | | | | |
| | | | | | | 394,908,138 | |
| | | | | | | | |
Industrials – 10.1% | | | | | | | | |
3M Co. | | | 97,443 | | | | 16,011,834 | |
ADT Corp. | | | 25,056 | | | | 907,779 | |
Allegion PLC | | | 12,837 | | | | 711,940 | |
AMETEK, Inc. | | | 37,101 | | | | 1,952,626 | |
Boeing Co. | | | 100,924 | | | | 13,118,102 | |
C.H. Robinson Worldwide, Inc. | | | 22,382 | | | | 1,676,188 | |
Caterpillar, Inc. | | | 93,855 | | | | 8,590,548 | |
Cintas Corp. | | | 15,222 | | | | 1,194,014 | |
See Notes to Financial Statements.
9
State Street Equity 500 Index Portfolio
Portfolio of Investments — (continued)
December 31, 2014
| | | | | | | | |
| | | Shares | | | Market
Value | |
COMMON STOCKS – (continued) | | | | | |
Industrials – (continued) | | | | | | | | |
CSX Corp. | | | 148,359 | | | $ | 5,375,047 | |
Cummins, Inc. | | | 26,444 | | | | 3,812,431 | |
Danaher Corp. | | | 93,178 | | | | 7,986,286 | |
Deere & Co. | | | 53,954 | | | | 4,773,310 | |
Delta Air Lines, Inc. | | | 125,066 | | | | 6,151,997 | |
Dover Corp. | | | 24,145 | | | | 1,731,679 | |
Dun & Bradstreet Corp. | | | 6,145 | | | | 743,299 | |
Eaton Corp. PLC | | | 72,099 | | | | 4,899,848 | |
Emerson Electric Co. | | | 105,369 | | | | 6,504,428 | |
Equifax, Inc. | | | 17,295 | | | | 1,398,647 | |
Expeditors International of Washington, Inc. | | | 29,444 | | | | 1,313,497 | |
Fastenal Co. | | | 44,042 | | | | 2,094,638 | |
FedEx Corp. | | | 40,350 | | | | 7,007,181 | |
Flowserve Corp. | | | 18,955 | | | | 1,134,078 | |
Fluor Corp. | | | 22,556 | | | | 1,367,570 | |
General Dynamics Corp. | | | 48,689 | | | | 6,700,580 | |
General Electric Co. | | | 1,530,863 | | | | 38,684,908 | |
Honeywell International, Inc. | | | 120,603 | | | | 12,050,652 | |
Illinois Tool Works, Inc. | | | 56,071 | | | | 5,309,924 | |
Ingersoll-Rand PLC | | | 41,116 | | | | 2,606,343 | |
Jacobs Engineering Group, Inc.(a) | | | 20,157 | | | | 900,816 | |
Joy Global, Inc. | | | 14,887 | | | | 692,543 | |
Kansas City Southern | | | 16,704 | | | | 2,038,389 | |
L-3 Communications Holdings, Inc. | | | 12,465 | | | | 1,573,208 | |
Lockheed Martin Corp. | | | 41,249 | | | | 7,943,320 | |
Masco Corp. | | | 54,139 | | | | 1,364,303 | |
Nielsen NV | | | 52,275 | | | | 2,338,261 | |
Norfolk Southern Corp. | | | 47,268 | | | | 5,181,045 | |
Northrop Grumman Corp. | | | 31,686 | | | | 4,670,200 | |
PACCAR, Inc. | | | 54,235 | | | | 3,688,522 | |
Pall Corp. | | | 16,107 | | | | 1,630,189 | |
Parker-Hannifin Corp. | | | 21,814 | | | | 2,812,915 | |
Pentair PLC | | | 28,991 | | | | 1,925,582 | |
Pitney Bowes, Inc. | | | 30,921 | | | | 753,545 | |
Precision Castparts Corp. | | | 21,978 | | | | 5,294,061 | |
Quanta Services, Inc.(a) | | | 30,293 | | | | 860,018 | |
Raytheon Co. | | | 47,736 | | | | 5,163,603 | |
Republic Services, Inc. | | | 41,114 | | | | 1,654,839 | |
Robert Half International, Inc. | | | 20,374 | | | | 1,189,434 | |
Rockwell Automation, Inc. | | | 21,779 | | | | 2,421,825 | |
Rockwell Collins, Inc. | | | 19,500 | | | | 1,647,360 | |
Roper Industries, Inc. | | | 14,835 | | | | 2,319,452 | |
Ryder System, Inc. | | | 6,855 | | | | 636,487 | |
Snap-on, Inc. | | | 8,872 | | | | 1,213,157 | |
Southwest Airlines Co. | | | 105,927 | | | | 4,482,831 | |
Stanley Black & Decker, Inc. | | | 24,950 | | | | 2,397,196 | |
Stericycle, Inc.(a) | | | 12,204 | | | | 1,599,700 | |
Textron, Inc. | | | 44,906 | | | | 1,890,992 | |
Tyco International PLC | | | 67,336 | | | | 2,953,357 | |
Union Pacific Corp. | | | 134,838 | | | | 16,063,251 | |
United Parcel Service, Inc. Class B | | | 106,455 | | | | 11,834,602 | |
United Rentals, Inc.(a) | | | 15,200 | | | | 1,550,552 | |
United Technologies Corp. | | | 130,327 | | | | 14,987,605 | |
W.W. Grainger, Inc. | | | 9,412 | | | | 2,399,025 | |
Waste Management, Inc. | | | 63,304 | | | | 3,248,761 | |
Xylem, Inc. | | | 24,834 | | | | 945,430 | |
| | | | | | | | |
| | | | | | | 290,075,750 | |
| | | | | | | | |
Information Technology – 19.1% | | | | | |
Accenture PLC Class A | | | 96,082 | | | | 8,581,083 | |
Adobe Systems, Inc.(a) | | | 73,813 | | | | 5,366,205 | |
Akamai Technologies, Inc.(a) | | | 27,734 | | | | 1,746,133 | |
Alliance Data Systems Corp.(a) | | | 10,204 | | | | 2,918,854 | |
Altera Corp. | | | 43,754 | | | | 1,616,273 | |
Amphenol Corp. Class A | | | 45,180 | | | | 2,431,136 | |
Analog Devices, Inc. | | | 46,018 | | | | 2,554,919 | |
Apple, Inc. | | | 894,664 | | | | 98,753,012 | |
Applied Materials, Inc. | | | 190,653 | | | | 4,751,073 | |
Autodesk, Inc.(a) | | | 34,170 | | | | 2,052,250 | |
Automatic Data Processing, Inc. | | | 73,365 | | | | 6,116,440 | |
Avago Technologies, Ltd. | | | 38,718 | | | | 3,894,644 | |
Broadcom Corp. Class A | | | 81,235 | | | | 3,519,913 | |
CA, Inc. | | | 45,959 | | | | 1,399,452 | |
Cisco Systems, Inc. | | | 781,729 | | | | 21,743,792 | |
Citrix Systems, Inc.(a) | | | 25,678 | | | | 1,638,256 | |
Cognizant Technology Solutions Corp. Class A(a) | | | 93,627 | | | | 4,930,398 | |
Computer Sciences Corp. | | | 22,732 | | | | 1,433,253 | |
Corning, Inc. | | | 191,950 | | | | 4,401,413 | |
eBay, Inc.(a) | | | 172,158 | | | | 9,661,507 | |
Electronic Arts, Inc.(a) | | | 50,121 | | | | 2,356,439 | |
EMC Corp. | | | 306,874 | | | | 9,126,433 | |
F5 Networks, Inc.(a) | | | 10,559 | | | | 1,377,580 | |
Facebook, Inc. Class A(a) | | | 319,407 | | | | 24,920,134 | |
Fidelity National Information Services, Inc. | | | 44,886 | | | | 2,791,909 | |
First Solar, Inc.(a) | | | 11,749 | | | | 523,947 | |
Fiserv, Inc.(a) | | | 36,442 | | | | 2,586,289 | |
FLIR Systems, Inc. | | | 20,339 | | | | 657,153 | |
Google, Inc. Class A(a) | | | 43,323 | | | | 22,989,783 | |
Google, Inc. Class C(a) | | | 43,523 | | | | 22,910,507 | |
Harris Corp. | | | 16,098 | | | | 1,156,158 | |
Hewlett-Packard Co. | | | 282,863 | | | | 11,351,292 | |
Intel Corp. | | | 746,920 | | | | 27,105,727 | |
International Business Machines Corp. | | | 139,847 | | | | 22,437,053 | |
Intuit, Inc. | | | 43,326 | | | | 3,994,224 | |
Juniper Networks, Inc. | | | 58,444 | | | | 1,304,470 | |
KLA-Tencor Corp. | | | 26,573 | | | | 1,868,613 | |
Lam Research Corp. | | | 24,281 | | | | 1,926,454 | |
Linear Technology Corp. | | | 35,021 | | | | 1,596,958 | |
Mastercard, Inc. Class A | | | 148,349 | | | | 12,781,750 | |
Microchip Technology, Inc. | | | 28,206 | | | | 1,272,373 | |
Micron Technology, Inc.(a) | | | 163,528 | | | | 5,725,115 | |
Microsoft Corp.(b) | | | 1,254,977 | | | | 58,293,682 | |
Motorola Solutions, Inc. | | | 33,022 | | | | 2,215,116 | |
NetApp, Inc. | | | 49,643 | | | | 2,057,702 | |
NVIDIA Corp. | | | 75,012 | | | | 1,503,991 | |
Oracle Corp. | | | 493,470 | | | | 22,191,346 | |
Paychex, Inc. | | | 49,131 | | | | 2,268,378 | |
QUALCOMM, Inc. | | | 255,185 | | | | 18,967,901 | |
Red Hat, Inc.(a) | | | 28,130 | | | | 1,944,908 | |
Salesforce.com, Inc.(a) | | | 89,205 | | | | 5,290,749 | |
SanDisk Corp. | | | 33,206 | | | | 3,253,524 | |
Seagate Technology PLC | | | 49,776 | | | | 3,310,104 | |
Symantec Corp. | | | 108,203 | | | | 2,775,948 | |
See Notes to Financial Statements.
10
State Street Equity 500 Index Portfolio
Portfolio of Investments — (continued)
December 31, 2014
| | | | | | | | |
| | | Shares | | | Market
Value | |
COMMON STOCKS – (continued) | | | | | |
Information Technology – (continued) | | | | | |
TE Connectivity, Ltd. | | | 60,849 | | | $ | 3,848,699 | |
Teradata Corp.(a) | | | 21,913 | | | | 957,160 | |
Texas Instruments, Inc. | | | 158,906 | | | | 8,495,909 | |
Total System Services, Inc. | | | 22,999 | | | | 781,046 | |
VeriSign, Inc.(a) | | | 19,320 | | | | 1,101,240 | |
Visa, Inc. Class A | | | 74,910 | | | | 19,641,402 | |
Western Digital Corp. | | | 33,647 | | | | 3,724,723 | |
Western Union Co. | | | 74,940 | | | | 1,342,175 | |
Xerox Corp. | | | 161,592 | | | | 2,239,665 | |
Xilinx, Inc. | | | 39,642 | | | | 1,716,102 | |
Yahoo!, Inc.(a) | | | 137,637 | | | | 6,952,045 | |
| | | | | | | | |
| | | | | | | 547,143,882 | |
| | | | | | | | |
Materials – 3.1% | |
Air Products & Chemicals, Inc. | | | 29,807 | | | | 4,299,064 | |
Airgas, Inc. | | | 10,040 | | | | 1,156,407 | |
Alcoa, Inc. | | | 183,889 | | | | 2,903,607 | |
Allegheny Technologies, Inc. | | | 14,911 | | | | 518,455 | |
Avery Dennison Corp. | | | 13,318 | | | | 690,938 | |
Ball Corp. | | | 21,658 | | | | 1,476,426 | |
C.F. Industries Holdings, Inc. | | | 8,006 | | | | 2,181,955 | |
Dow Chemical Co. | | | 168,090 | | | | 7,666,585 | |
E.I. du Pont de Nemours & Co. | | | 138,794 | | | | 10,262,428 | |
Eastman Chemical Co. | | | 21,472 | | | | 1,628,866 | |
Ecolab, Inc. | | | 41,565 | | | | 4,344,374 | |
FMC Corp. | | | 18,522 | | | | 1,056,310 | |
Freeport-McMoRan, Inc. | | | 157,964 | | | | 3,690,039 | |
International Flavors & Fragrances, Inc. | | | 11,280 | | | | 1,143,341 | |
International Paper Co. | | | 66,808 | | | | 3,579,573 | |
LyondellBasell Industries NV Class A | | | 62,952 | | | | 4,997,759 | |
Martin Marietta Materials, Inc. | | | 8,655 | | | | 954,820 | |
MeadWestvaco Corp. | | | 24,943 | | | | 1,107,220 | |
Monsanto Co. | | | 72,794 | | | | 8,696,699 | |
Mosaic Co. | | | 47,516 | | | | 2,169,105 | |
Newmont Mining Corp. | | | 73,573 | | | | 1,390,530 | |
Nucor Corp. | | | 47,306 | | | | 2,320,359 | |
Owens-Illinois, Inc.(a) | | | 22,763 | | | | 614,373 | |
PPG Industries, Inc. | | | 21,444 | | | | 4,956,781 | |
Praxair, Inc. | | | 45,000 | | | | 5,830,200 | |
Sealed Air Corp. | | | 32,469 | | | | 1,377,660 | |
Sherwin-Williams Co. | | | 12,287 | | | | 3,231,972 | |
Sigma-Aldrich Corp. | | | 17,761 | | | | 2,438,052 | |
Vulcan Materials Co. | | | 18,490 | | | | 1,215,348 | |
| | | | | | | | |
| | | | | | | 87,899,246 | |
| | | | | | | | |
Telecommunication Services – 2.2% | |
AT&T, Inc. | | | 788,273 | | | | 26,478,090 | |
CenturyLink, Inc. | | | 86,173 | | | | 3,410,727 | |
Frontier Communications Corp. | | | 143,538 | | | | 957,399 | |
Level 3 Communications, Inc.(a) | | | 41,500 | | | | 2,049,270 | |
Verizon Communications, Inc. | | | 633,251 | | | | 29,623,482 | |
Windstream Holdings, Inc. | | | 85,867 | | | | 707,544 | |
| | | | | | | | |
| | | | | | | 63,226,512 | |
| | | | | | | | |
Utilities – 3.1% | |
AES Corp. | | | 98,059 | | | | 1,350,272 | |
AGL Resources, Inc. | | | 18,002 | | | | 981,289 | |
Ameren Corp. | | | 36,056 | | | | 1,663,263 | |
American Electric Power Co., Inc. | | | 75,043 | | | | 4,556,611 | |
CenterPoint Energy, Inc. | | | 65,335 | | | | 1,530,799 | |
CMS Energy Corp. | | | 42,001 | | | | 1,459,535 | |
Consolidated Edison, Inc. | | | 43,500 | | | | 2,871,435 | |
Dominion Resources, Inc. | | | 87,668 | | | | 6,741,669 | |
DTE Energy Co. | | | 26,039 | | | | 2,248,988 | |
Duke Energy Corp. | | | 107,391 | | | | 8,971,444 | |
Edison International | | | 49,505 | | | | 3,241,587 | |
Entergy Corp. | | | 27,000 | | | | 2,361,960 | |
Exelon Corp. | | | 131,659 | | | | 4,881,916 | |
FirstEnergy Corp. | | | 61,729 | | | | 2,406,814 | |
Integrys Energy Group, Inc. | | | 11,180 | | | | 870,363 | |
NextEra Energy, Inc. | | | 66,357 | | | | 7,053,086 | |
NiSource, Inc. | | | 47,478 | | | | 2,014,017 | |
Northeast Utilities | | | 46,443 | | | | 2,485,629 | |
NRG Energy, Inc. | | | 51,498 | | | | 1,387,871 | |
Pepco Holdings, Inc. | | | 35,659 | | | | 960,297 | |
PG&E Corp. | | | 72,012 | | | | 3,833,919 | |
Pinnacle West Capital Corp. | | | 15,456 | | | | 1,055,799 | |
PPL Corp. | | | 98,256 | | | | 3,569,641 | |
Public Service Enterprise Group, Inc. | | | 76,936 | | | | 3,185,920 | |
SCANA Corp. | | | 23,801 | | | | 1,437,580 | |
Sempra Energy | | | 35,624 | | | | 3,967,089 | |
Southern Co. | | | 139,484 | | | | 6,850,059 | |
TECO Energy, Inc. | | | 30,250 | | | | 619,823 | |
Wisconsin Energy Corp. | | | 32,976 | | | | 1,739,154 | |
Xcel Energy, Inc. | | | 80,800 | | | | 2,902,336 | |
| | | | | | | | |
| | | | | | | 89,200,165 | |
| | | | | | | | |
TOTAL COMMON STOCKS
(Cost: $1,279,834,253) | | | | 2,778,988,162 | |
| | | | | | | | |
| | |
| | | Par
Amount | | | | |
U.S. GOVERNMENT SECURITIES – 0.2% | |
U.S. Treasury Bill(b)(d)(e)
0.01% due 01/15/2015 | | $ | 2,000,000 | | | | 1,999,992 | |
U.S. Treasury Bill(b)(d)(e)
0.00% due 01/29/2015 | | | 3,760,000 | | | | 3,760,000 | |
U.S. Treasury Bill(b)(d)(e)
0.00% due 03/12/2015 | | | 400,000 | | | | 400,000 | |
| | | | | | | | |
TOTAL U.S. GOVERNMENT SECURITIES
(Cost: $6,159,992) | | | | 6,159,992 | |
| | | | | | | | |
| | |
| | | Shares | | | | |
MONEY MARKET FUND – 3.2% | |
State Street Institutional Liquid Reserves Fund, Premier Class 0.07%(c)(f) | | | 91,116,189 | | | | 91,116,189 | |
| | | | | | | | |
TOTAL MONEY MARKET FUND
(Cost: $91,116,189) | | | | 91,116,189 | |
| | | | | | | | |
TOTAL INVESTMENTS – 100.3%
(Cost $1,377,110,434) | | | | 2,876,264,343 | |
Liabilities in Excess of
Other Assets – (0.3)% | | | | (6,941,471 | ) |
| | | | | | | | |
NET ASSETS – 100.0% | | | | | | $ | 2,869,322,872 | |
| | | | | | | | |
See Notes to Financial Statements.
11
State Street Equity 500 Index Portfolio
Portfolio of Investments — (continued)
December 31, 2014
| (a) | Non-income producing security |
| (b) | All or part of this security has been designated as collateral for futures contracts |
| (c) | Affiliated issuer. See table that follows for more information. |
| (d) | Rate represents annualized yield at date of purchase |
| (e) | Securities are valued in accordance with procedures approved by the Board of Trustees. Securities’ values are determined based on Level 2 inputs. |
| (f) | The rate shown is the annualized seven-day yield at period end. |
| PLC | Public Limited Company |
| REIT | Real Estate Investment Trust |
| | | | | | | | | | | | |
Schedule of
Futures Contracts | | Number of
Contracts | | | Notional
Value | | | Unrealized
Appreciation | |
S&P 500 Financial Futures Contracts (long) Expiration Date 03/2015 | | | 875 | | | $ | 89,792,500 | | | $ | 2,382,058 | |
| | | | | | | | | | | | |
Total unrealized appreciation on open futures contracts purchased | | | | | | | | | | $ | 2,382,058 | |
| | | | | | | | | | | | |
Affiliates Table
Certain investments made by the Portfolio were made in securities affiliated with State Street and SSGA FM. Investments in State Street Corp., the holding company of State Street, were made according to its representative portion of the S&P 500® Index. The Portfolio also invested in the State Street Institutional Liquid Reserves Fund. Transactions in all affiliates for the period ending December 31, 2014 were as follows:
| | | | | | | | | | | | | | | | | | | | | | | | | | | | |
Security Description | | Number of shares
held at 12/31/13 | | | Shares purchased
for the year
ended 12/31/14 | | | Shares sold
for the year
ended 12/31/14 | | | Number of shares
held at 12/31/14 | | | Value at
12/31/14 | | | Income earned
for the year
ended
12/31/14 | | | Realized
gain/loss on
shares sold | |
State Street Corp. | | | 72,725 | | | | – | | | | 9,778 | * | | | 62,947 | | | $ | 4,941,340 | | | $ | 78,494 | | | $ | – | |
State Street Institutional Liquid Reserves Fund, Premier Class | | | 41,178,491 | | | | 407,287,719 | | | | 357,350,021 | | | | 91,116,189 | | | | 91,116,189 | | | | 45,460 | | | | – | |
| * | Shares of State Street Corp. were disposed of in a tax-free redemption in-kind (Note 7). |
See Notes to Financial Statements.
12
State Street Equity 500 Index Portfolio
Statement of Assets and Liabilities
December 31, 2014
| | | | |
Assets | | | | |
Investments in unaffiliated issuers at market value
(identified cost $1,283,925,771) | | $ | 2,780,206,814 | |
Investments in non-controlled affiliates at market value
(identified cost $93,184,663) (Note 4) | | | 96,057,529 | |
| | | | |
Total investments at market value (identified cost $1,377,110,434) | | | 2,876,264,343 | |
Dividends and interest receivable | | | 3,680,254 | |
Dividend receivable from non-controlled affiliates (Note 4) | | | 18,884 | |
| | | | |
Total assets | | | 2,879,963,481 | |
| | | | |
Liabilities | | | | |
Investment securities purchased | | | 4,649,775 | |
Due to custodian | | | 4,769,756 | |
Daily variation margin on futures contracts | | | 1,063,125 | |
Management fees payable (Note 4) | | | 157,953 | |
| | | | |
Total liabilities | | | 10,640,609 | |
| | | | |
Net Assets | | $ | 2,869,322,872 | |
| | | | |
See Notes to Financial Statements.
13
State Street Equity 500 Index Portfolio
Statement of Operations
Year Ended December 31, 2014
| | | | |
Investment Income | | | | |
Dividend income – unaffiliated issuers (net of foreign taxes withheld of $132,666) | | $ | 55,933,764 | |
Dividend income – non-controlled affiliated issuer | | | 123,954 | |
Interest | | | 46,355 | |
| | | | |
Total investment income | | | 56,104,073 | |
| | | | |
Expenses | | | | |
Management fees (Note 4) | | | 1,246,586 | |
Other expenses | | | 12,081 | |
| | | | |
Total expenses | | | 1,258,667 | |
| | | | |
Net Investment Income | | | 54,845,406 | |
| | | | |
Realized and Unrealized Gain (Loss) | | | | |
Net realized gain (loss) on: | | | | |
Investments – unaffiliated issuers | | | 10,063,213 | |
Futures contracts | | | 7,781,141 | |
| | | | |
| | | 17,844,354 | |
| | | | |
Net change in net unrealized appreciation (depreciation) on: | | | | |
Investments | | | 278,443,408 | |
Futures contracts | | | 664,091 | |
| | | | |
| | | 279,107,499 | |
| | | | |
Net realized and unrealized gain | | | 296,951,853 | |
| | | | |
Net Increase in Net Assets Resulting from Operations | | $ | 351,797,259 | |
| | | | |
See Notes to Financial Statements.
14
State Street Equity 500 Index Portfolio
Statements of Changes in Net Assets
| | | | | | | | |
| | | Year Ended
December 31, 2014 | | | Year Ended
December 31, 2013 | |
Increase (Decrease) in Net Assets From Operations: | | | | | | | | |
Net investment income | | $ | 54,845,406 | | | $ | 49,096,073 | |
Net realized gain on investments and futures contracts | | | 17,844,354 | | | | 26,611,003 | |
Net change in net unrealized appreciation on investments and futures contracts | | | 279,107,499 | | | | 590,532,985 | |
| | | | | | | | |
Net increase in net assets from operations | | | 351,797,259 | | | | 666,240,061 | |
| | | | | | | | |
Capital Transactions: | | | | | | | | |
Contributions | | | 353,779,321 | | | | 235,748,437 | |
Withdrawals | | | (185,039,609 | ) | | | (217,635,806 | ) |
In-kind redemptions (Note 7) | | | (390,808,177 | ) | | | – | |
| | | | | | | | |
Net increase (decrease) in net assets from capital transactions | | | (222,068,465 | ) | | | 18,112,631 | |
| | | | | | | | |
Net Increase in Net Assets | | | 129,728,794 | | | | 684,352,692 | |
Net Assets | | | | | | | | |
Beginning of year | | | 2,739,594,078 | | | | 2,055,241,386 | |
| | | | | | | | |
End of year | | $ | 2,869,322,872 | | | $ | 2,739,594,078 | |
| | | | | | | | |
See Notes to Financial Statements.
15
State Street Equity 500 Index Portfolio
Financial Highlights
The following table includes selected supplemental data and ratios to average net assets:
| | | | | | | | | | | | | | | | | | | | |
| | | Year Ended
12/31/14 | | | Year Ended
12/31/13 | | | Year Ended
12/31/12 | | | Year Ended
12/31/11 | | | Year Ended
12/31/10 | |
Supplemental Data and Ratios: | | | | | | | | | | | | | | | | | | | | |
Net assets, end of period (in thousands) | | $ | 2,869,323 | | | $ | 2,739,594 | | | $ | 2,055,241 | | | $ | 1,825,528 | | | $ | 2,098,137 | |
Ratios to average net assets: | | | | | | | | | | | | | | | | | | | | |
Expenses | | | 0.045 | % | | | 0.045 | % | | | 0.045 | % | | | 0.045 | % | | | 0.045 | % |
Net investment income | | | 1.98 | % | | | 2.05 | % | | | 2.26 | % | | | 2.04 | % | | | 1.99 | % |
Portfolio turnover rate(a) | | | 2 | % | | | 4 | % | | | 9 | % | | | 15 | % | | | 12 | % |
Total return(b) | | | 13.62 | % | | | 32.30 | % | | | 15.97 | % | | | 2.03 | % | | | 15.08 | % |
| (a) | The portfolio turnover rate excludes in-kind security transactions (Note 7). |
| (b) | Results represent past performance and are not indicative of future results. |
See Notes to Financial Statements.
16
State Street Equity 500 Index Portfolio
Notes to Financial Statements
December 31, 2014
State Street Master Funds (the “Trust”) is registered under the Investment Company Act of 1940, as amended (the “1940 Act”), as an open-end management investment company, and was organized as a business trust under the laws of the Commonwealth of Massachusetts on July 27, 1999. The Trust consists of ten investment portfolios: State Street Equity 500 Index Portfolio, State Street Equity 400 Index Portfolio, State Street Equity 2000 Index Portfolio, State Street Aggregate Bond Index Portfolio, State Street Money Market Portfolio, State Street Tax Free Money Market Portfolio, State Street Limited Duration Bond Portfolio, State Street Treasury Money Market Portfolio, State Street Treasury Plus Money Market Portfolio and State Street U.S. Government Money Market Portfolio. Information presented in these financial statements pertains only to the State Street Equity 500 Index Portfolio (the “Portfolio”).
At December 31, 2014, the following Portfolios were operational: State Street Money Market Portfolio, State Street Tax Free Money Market Portfolio, State Street U.S. Government Money Market Portfolio, State Street Treasury Money Market Portfolio and State Street Treasury Plus Money Market Portfolio. The Portfolio is authorized to issue an unlimited number of non-transferable beneficial interests.
The Portfolio’s investment objective is to replicate, as closely as possible, before expenses, the performance of the Standard & Poor’s 500 Index (the “S&P 500® Index”). The Portfolio uses a passive management strategy designed to track the performance of the S&P 500® Index. The S&P 500® Index is a well-known, unmanaged, stock index that includes common stocks of 500 companies from several industrial sectors representing a significant portion of the market value of all stocks publicly traded in the U.S. There is no assurance that the Portfolio will achieve its objective.
The Portfolio is an investment company and accordingly follows the investment company accounting and reporting guidance of the Financial Accounting Standards Board (“FASB”) Accounting Standards Codification Topic 946 Financial Services – Investment Companies.
| 2. | | Significant Accounting Policies |
The following is a summary of the significant accounting policies consistently followed by the Portfolio in the preparation of its financial statements.
Security valuation – The Portfolio’s investments are valued each business day by independent pricing services. Equity securities for which market quotations are available are valued at the last sale price or official closing price (closing bid price if no sale has occurred) on the primary market or exchange on which they trade. Investments in other mutual funds are valued at the net asset value per share. Fixed income securities and options are valued on the basis of the closing bid price. Futures contracts are valued at the quoted daily settlement price at the end of each day on the exchange upon which they are traded. Money market instruments maturing within 60 days of the valuation date are valued at amortized cost, a method by which each money market instrument is initially valued at cost, and thereafter a constant accretion or amortization of any discount or premium is recorded until maturity of the security. Investments in other mutual funds are valued at the net asset value per share. The Portfolio may value securities for which market quotations are not readily available at “fair value,” as determined in good faith pursuant to procedures established by the Board of Trustees.
17
State Street Equity 500 Index Portfolio
Notes to Financial Statements — (continued)
December 31, 2014
The Portfolio adopted provisions surrounding fair value measurements and disclosures that define fair value, establish a framework for measuring fair value in generally accepted accounting principles and expand disclosures about fair value measurements. This applies to fair value measurements that are already required or permitted by other accounting standards and is intended to increase consistency of those measurements and apply broadly to securities and other types of assets and liabilities. In accordance with these provisions, fair value is defined as the price that the Portfolio would receive upon selling an investment in a timely transaction to an independent buyer in the principal or most advantageous market of the investment. Various inputs are used in determining the value of the Portfolio’s investments.
The three tier hierarchy of inputs is summarized below:
| | • | | Level 1 – quoted prices in active markets for identical securities |
| | • | | Level 2 – other significant observable inputs (including quoted prices for similar securities, interest rates, prepayment speeds, credit risk, etc.) |
| | • | | Level 3 – significant unobservable inputs (including the Portfolio’s own assumptions in determining the fair value of investments) |
The inputs or methodology used for valuing securities are not an indication of the risk associated with investing in those securities.
The following is a summary of the inputs used, as of December 31, 2014, in valuing the Portfolio’s assets carried at fair value:
| | | | | | | | | | | | | | | | |
| Description | | Quoted Prices in Active Markets for Identical Assets (Level 1) | | | Significant Other Observable Inputs (Level 2) | | | Significant Unobservable Inputs (Level 3) | | | Total | |
ASSETS: | | | | | | | | | | | | | | | | |
INVESTMENTS: | | | | | | | | | | | | | | | | |
Common Stocks | | $ | 2,778,988,162 | | | $ | – | | | $ | – | | | $ | 2,778,988,162 | |
U.S. Government Securities | | | – | | | | 6,159,992 | | | | – | | | | 6,159,992 | |
Money Market Fund | | | 91,116,189 | | | | – | | | | – | | | | 91,116,189 | |
| | | | | | | | | | | | | | | | |
TOTAL INVESTMENTS | | | 2,870,104,351 | | | | 6,159,992 | | | | – | | | | 2,876,264,343 | |
OTHER ASSETS: | | | | | | | | | | | | | | | | |
Futures contracts* | | | 2,382,058 | | | | – | | | | – | | | | 2,382,058 | |
| | | | | | | | | | | | | | | | |
TOTAL ASSETS | | $ | 2,872,486,409 | | | $ | 6,159,992 | | | $ | – | | | $ | 2,878,646,401 | |
| | | | | | | | | | | | | | | | |
| * | Only unsettled receivable/payable for variation margin is reported within Statement of Assets and Liabilities. |
For the year ended December 31, 2014, there were no transfers between levels.
Securities transactions, investment income and expenses – Securities transactions are recorded on a trade date basis. Dividend income is recorded on the ex-dividend date. Interest income is recorded daily on the accrual basis and includes amortization of premium and accretion of discount on investments. Realized gains and losses from securities transactions are recorded on the basis of identified cost. Expenses are accrued daily based on average daily net assets.
18
State Street Equity 500 Index Portfolio
Notes to Financial Statements — (continued)
December 31, 2014
All of the net investment income and realized and unrealized gains and losses from the security transactions of the Portfolio are allocated pro rata among the partners in the Portfolio on a daily basis based on each partner’s daily ownership percentage.
Federal income taxes – The Portfolio is not required to pay federal income taxes on its net investment income and net capital gains because it is treated as a partnership for federal income tax purposes. All interest, dividends, gains and losses of the Portfolio are deemed to have been “passed through” to the Portfolio’s partners in proportion to their holdings in the Portfolio, regardless of whether such items have been distributed by the Portfolio. Each partner is responsible for tax liability based on its distributive share; therefore, no provision has been made for federal income taxes.
The Portfolio has reviewed the tax positions for open years as of and during the year ended December 31, 2014, and determined it did not have a liability for any unrecognized tax expenses. The Portfolio recognizes interest and penalties, if any, related to tax liabilities as income tax expense in the Statement of Operations. As of December 31, 2014, tax years 2011 through 2013 remain subject to examination by the Portfolio’s major tax jurisdictions, which include the United States of America and the Commonwealth of Massachusetts.
At December 31, 2014, the tax cost of investments was $1,377,110,434 on a federal tax basis. The aggregate gross unrealized appreciation and gross unrealized depreciation was $1,513,888,774 and $14,734,865, respectively, resulting in net appreciation of $1,499,153,909 for all securities as computed on a federal income tax basis.
Futures – The Portfolio may enter into financial futures contracts as part of its strategy to track the performance of the S&P 500® Index. Upon entering into a futures contract, the Portfolio is required to deposit with the broker cash or securities in an amount equal to a certain percentage of the contract amount. Variation margin payments are made or received by the Portfolio each day, depending on the daily fluctuations in the value of the underlying security or index, and are recorded for financial statement purposes as unrealized gains or losses by the Portfolio, which is recorded on the Statement of Assets and Liabilities. The Portfolio recognizes a realized gain or loss when the contract is closed, which is recorded on the Statement of Operations. The Portfolio voluntarily segregates securities in an amount equal to the outstanding value of the open futures contracts in accordance with Securities and Exchange Commission requirements.
The primary risks associated with the use of futures contracts are an imperfect correlation between the change in market value of the benchmark and the prices of futures contracts and the possibility of an illiquid market. To the extent permitted by the investment objective, restrictions and policies set forth in the Portfolio’s Prospectus and Statement of Additional Information, the Portfolio may participate in various derivative-based transactions. Derivative securities are instruments or agreements whose value is derived from an underlying security or index. The Portfolio’s use of derivatives includes futures. These instruments offer unique characteristics and risks that assist the Portfolio in meeting its investment objective. The Portfolio typically uses derivatives in two ways: cash equitization and return enhancement. Cash equitization is a technique that may be used by the Portfolio through the use of options and futures to earn “market-like” returns with the Portfolio’s excess and liquidity reserve cash balances and receivables. Return enhancement can be accomplished through the use of derivatives in the Portfolio. By purchasing certain instruments, the Portfolio may more effectively achieve the desired portfolio characteristics that assist in meeting the Portfolio’s investment objectives. Depending on how
19
State Street Equity 500 Index Portfolio
Notes to Financial Statements — (continued)
December 31, 2014
the derivatives are structured and utilized, the risks associated with them may vary widely. These risks are generally categorized as market risk, liquidity risk and counterparty or credit risk.
The following table, grouped into appropriate risk categories, discloses the amounts related to the Portfolio’s use of derivative instruments and hedging activities at December 31, 2014:
Asset Derivatives(1)
| | | | | | |
| | | Equity Contracts Risk | | Total | |
Futures Contracts | | $2,382,058 | | $ | 2,382,058 | |
Transactions in derivative instruments during the year ended December 31, 2014, were as follows:
Realized Gain (Loss)(2)
| | | | | | |
| | | Equity Contracts Risk | | Total | |
Futures Contracts | | $7,781,141 | | $ | 7,781,141 | |
Change in Appreciation (Depreciation)(3)
| | | | | | |
| | | Equity Contracts Risk | | Total | |
Futures Contracts | | $664,091 | | $ | 664,091 | |
| (1) | Portfolio of Investments: Unrealized appreciation of futures contracts. Only unsettled receivable/payable for variation margin is reported within Statement of Assets and Liabilities. |
| (2) | Statement of Operations location: Net realized gain (loss) on: Futures contracts |
| (3) | Statement of Operations location: Net change in unrealized appreciation (depreciation) on: Futures contracts |
The average notional of futures outstanding during the year ended December 31, 2014 was $66,568,250.
Use of estimates – The Portfolio’s financial statements are prepared in accordance with U.S. generally accepted accounting principles, which require the use of management estimates. Actual results could differ from those estimates. It is reasonably possible that these differences could be material.
| 3. | | Securities Transactions |
For the year ended December 31, 2014, purchases and sales of investment securities, excluding short-term investments, and futures contracts, aggregated to $253,957,017 and $65,856,635, respectively.
| 4. | | Related Party Fees and Transactions |
The Portfolio has entered into an investment advisory agreement with SSGA Funds Management, Inc. (“SSGA FM” or the “Adviser”), a subsidiary of State Street Corporation and an affiliate of State Street Bank and Trust Company (“State Street”), under which SSGA FM directs the investments of the Portfolio in accordance with its investment objective, policies, and limitations. The Trust has contracted with State Street to provide custody, administration and transfer agent services to the Portfolio. In compensation for SSGA FM’s services as investment adviser and for State Street’s services as
20
State Street Equity 500 Index Portfolio
Notes to Financial Statements — (continued)
December 31, 2014
administrator, custodian and transfer agent (and for assuming ordinary operating expenses of the Portfolio, including ordinary legal, audit and trustees expense), State Street receives a unitary fee, calculated daily, at the annual rate of 0.045% of the Portfolio’s average daily net assets.
Certain investments made by the Portfolio were made in securities affiliated with State Street and SSGA FM. Investments in State Street Corporation, the holding company of State Street, were made according to its representative portion of the S&P 500® Index. The market value of this investment at December 31, 2014 is listed in the Portfolio of Investments.
Independent Trustees are compensated on a calendar year basis. Any Trustee who is deemed to be an “interested person” (as defined in the 1940 Act) of the Funds does not receive compensation from the Funds for his or her service as a Trustee.
Each Independent Trustee receives for his or her services to the State Street Master Funds, State Street Institutional Investment Trust and SSGA Funds, a $141,500 annual base retainer in addition to $18,000 for each in-person meeting and $2,000 for each telephonic meeting from the Trust. The Trust will bear a pro rata allocation based on the Trust’s average monthly assets. The Co-Chairmen each receive an additional $44,000 annual retainer. The Independent Trustees are reimbursed for travel and other out-of-pocket expenses in connection with meeting attendance. As of the date of this Report, the Trustees were not paid pension or retirement benefits as part of the Trust’s expenses.
The Trust’s officers are compensated by the Adviser and its affiliates.
The Trust’s organizational documents provide that its officers and trustees are indemnified against certain liabilities arising out of the performance of their duties to the Trust. In addition, both in some of its principal service contracts and in the normal course of its business, the Trust enters into contracts that provide indemnifications to other parties for certain types of losses or liabilities. The Trust’s maximum exposure under these arrangements is unknown as this could involve future claims against the Trust. Management does not expect any significant claims.
On August 11, 2014, the State Street Equity 500 Index Fund redeemed its interest in the Portfolio in connection with a transfer of net assets to the State Street Equity 500 Index II Portfolio, a series of State Street Institutional Investment Trust. The transfer consisted of five hundred and three (503) securities totaling $387,955,841 at market value or 13% of the Portfolio and $2,852,336 in cash, and is disclosed in the Statement of Changes in Net Assets.
The Portfolio and other affiliated funds (each a “Participant” and, collectively, the “Participants”) share in a $300 million revolving credit facility provided by a syndication of banks. The Participants may borrow for the purpose of meeting shareholder redemption requests that otherwise might require the untimely disposition of securities. The Participants are charged an annual commitment fee which is
21
State Street Equity 500 Index Portfolio
Notes to Financial Statements — (continued)
December 31, 2014
calculated based on the unused portion of the shared credit line. Commitment fees are allocated among each of the Participants based on net assets. Commitment fees are ordinary fund operating expenses and are paid by the Adviser. A Participant incurs and pays the interest expense related to its borrowing. Interest is calculated at a rate per annum equal to the sum of the Federal Funds Rate plus 1%. The Portfolio may borrow up to a maximum of 33 percent of its assets. The Portfolio had no outstanding loans during the period ended December 31, 2014.
22
State Street Equity 500 Index Portfolio
Report of Independent Registered Public Accounting Firm
To the Board of Trustees and Owners of Beneficial Interest of
State Street Master Funds:
We have audited the accompanying statement of assets and liabilities, including the portfolio of investments, of State Street Equity 500 Index Portfolio (one of the portfolios constituting State Street Master Funds) (the “Portfolio”) as of December 31, 2014, and the related statement of operations for the year then ended, the statements of changes in net assets for each of the two years in the period then ended, and the financial highlights for each of the five years in the period then ended. These financial statements and financial highlights are the responsibility of the Portfolio’s management. Our responsibility is to express an opinion on these financial statements and financial highlights based on our audits.
We conducted our audits in accordance with the standards of the Public Company Accounting Oversight Board (United States). Those standards require that we plan and perform the audit to obtain reasonable assurance about whether the financial statements and financial highlights are free of material misstatement. We were not engaged to perform an audit of the Portfolio’s internal control over financial reporting. Our audits included consideration of internal control over financial reporting as a basis for designing audit procedures that are appropriate in the circumstances, but not for the purpose of expressing an opinion on the effectiveness of the Portfolio’s internal control over financial reporting. Accordingly, we express no such opinion. An audit also includes examining, on a test basis, evidence supporting the amounts and disclosures in the financial statements and financial highlights, assessing the accounting principles used and significant estimates made by management, and evaluating the overall financial statement presentation. Our procedures included confirmation of securities owned as of December 31, 2014, by correspondence with the custodian and others or by other appropriate auditing procedures where replies from others were not received. We believe that our audits provide a reasonable basis for our opinion.
In our opinion, the financial statements and financial highlights referred to above present fairly, in all material respects, the financial position of State Street Equity 500 Index Portfolio (one of the portfolios constituting State Street Master Funds) at December 31, 2014, the results of its operations for the year then ended, the changes in its net assets for each of the two years in the period then ended, and the financial highlights for each of the five years in the period then ended, in conformity with U.S. generally accepted accounting principles.

Boston, Massachusetts
February 27, 2015
23
State Street Equity 500 Index Portfolio
General Information
December 31, 2014
Proxy Voting Policies and Procedures
Information regarding the Fund’s proxy voting policies and procedures, as well as information regarding how the Fund voted proxies, if any, during the most recent 12-month period ended June 30 is available by August 31 of each year without charge (1) by calling
1-877-521-4083 (toll free), or (2) on the website of the Securities and Exchange Commission (“SEC”) at www.sec.gov.
Quarterly Portfolio Schedule
The Fund files a complete schedule of portfolio holdings with the SEC for the first and third quarters of each fiscal year on
Form N-Q. The Fund’s Forms N-Q are available on the SEC’s website at www.sec.gov and may be reviewed and copied at the SEC’s Public Reference Room in Washington, DC. Information on the operation of the Public Reference Room may be obtained by calling
1-800-SEC-0330. The information on Form N-Q is available upon request, without charge, by calling 1-877-521-4083 (toll-free).
24
State Street Equity 500 Index Portfolio
Trustees and Officers Information
December 31, 2014
| | | | | | | | | | |
Name, Address, and Year of Birth | | Position(s) Held
with Trust | | Term of Office
and Length of
Time Served | | Principal Occupation
During Past Five Years | | Number of
Funds in
Fund Complex
Overseen by
Trustee | | Other Directorships
Held by Trustee
During Past Five Years |
Independent Trustees | | | | | | | | | | |
Michael F. Holland State Street Financial Center One Lincoln Street Boston,
MA 02111-2900
YOB: 1944 | | Trustee and Co-Chairman of the Board | | Term: Indefinite Elected: 7/99 | | Chairman, Holland & Company L.L.C. (investment adviser) (1995 – present). | | 59 | | Trustee, State Street Institutional Investment Trust; Trustee SSGA Funds; Director, the Holland Series Fund, Inc.; Director, The China Fund, Inc.; Director, The Taiwan Fund, Inc.; Director, Reaves Utility Income Fund, Inc.; and Director, Blackstone/GSO Loan Funds. |
Patrick J. Riley State Street Financial Center One Lincoln Street Boston,
MA 02111-2900
YOB: 1948 | | Trustee and Co-Chairman of the Board | | Term: Indefinite Elected: 1/14 | | 2002 to May 2010, Associate Justice of the Superior Court, Commonwealth of Massachusetts; 1985 to 2002, Partner, Riley, Burke & Donahue, L.L.P. (law firm); 1998 to Present, Independent Director, State Street Global Advisers Ireland, Ltd. (investment company); 1998 to Present, Independent Director, SSGA Liquidity plc (formerly, SSGA Cash Management Fund plc); January 2009 to Present, Independent Director, SSGA Fixed Income plc; and January 2009 to Present, Independent Director, SSGA Qualified Funds PLC. | | 59 | | Trustee, State Street Institutional Investment Trust; Trustee SSGA Funds; Board Director and Chairman, SPDR Europe 1PLC Board (2011 – Present); Board Director and Chairman, SPDR Europe II, PLC (2013 – Present). |
William L. Boyan State Street Financial Center One Lincoln Street Boston,
MA 02111-2900
YOB: 1937 | | Trustee and Co-Chairman of the Valuation Committee | | Term: Indefinite Elected: 7/99 | | President and Chief Operations Officer, John Hancock Financial Services (1959 – 1999). Mr. Boyan retired in 1999. Chairman Emeritus, Children’s Hospital, Boston, MA (1984 – 2011); Former Chairman, Boston Plan For Excellence, Boston Public Schools (1995 – 2010); Member of Advisory Board of Florida Atlantic University Lifelong Learning Society. | | 59 | | Trustee, State Street Institutional Investment Trust; Trustee SSGA Funds; Former Trustee of Old Mutual South Africa Master Trust; Trustee, Children’s Hospital, Boston, MA. |
25
| | | | | | | | | | |
Name, Address, and Year of Birth | | Position(s) Held
with Trust | | Term of Office
and Length of
Time Served | | Principal Occupation
During Past Five Years | | Number of
Funds in
Fund Complex
Overseen by
Trustee | | Other Directorships
Held by Trustee
During Past Five Years |
Independent Trustees (continued) | | | | | | |
William L. Marshall State Street Financial Center One Lincoln Street Boston,
MA 02111-2900
YOB: 1942 | | Trustee and Co-Chairman of the Audit Committee | | Term: Indefinite Elected: 1/14 | | April 2011 to Present, Chairman (until April 2011, Chief Executive Officer and President), Wm. L. Marshall Associates, Inc., Wm. L. Marshall Companies, Inc. and the Marshall Financial Group, Inc. (a registered investment adviser and provider of financial and related consulting services); Certified Financial Planner; Member, Financial Planners Association; Director, (2008 – 2014) Doylestown Health Foundation Board; and the Ann Silverman Community Clinic of Doylestown, PA. | | 59 | | Trustee, State Street Institutional Investment Trust; Trustee SSGA Funds; Director, Marshall Financial Group, Inc. |
Richard D. Shirk State Street Financial Center One Lincoln Street Boston,
MA 02111-2900
YOB: 1945 | | Trustee and Co-Chairman of the Qualified Legal and Compliance Committee | | Term: Indefinite Elected: 1/14 | | March 2001 to April 2002, Chairman (1996 to March 2001, President and Chief Executive Officer), Cerulean Companies, Inc. (holding company) (Retired); 1992 to March 2001, President and Chief Executive Officer, Blue Cross Blue Shield of Georgia (health insurer, managed healthcare); 1998 to December 2008, Chairman, Board Member and December 2008 to Present, Investment Committee Member, Healthcare Georgia Foundation (private foundation); September 2002 to Present, Lead Director and Board Member, Amerigroup Corp. (managed health care); 1999 to Present, Board Member and (since 2001) Investment Committee Member, Woodruff Arts Center; and 2003 to 2009, Trustee, Gettysburg College. | | 59 | | Trustee, State Street Institutional Investment Trust; Trustee SSGA Funds; Board member, AeroCare Holdings (privately held healthcare services company) (February 2003 – Present); Board member, Regenesis Biomedical (health care services) (April 2012 – Present). |
Rina K. Spence State Street Financial Center One Lincoln Street Boston,
MA 02111-2900
YOB: 1948 | | Trustee and Co-Chairman of the Qualified Legal and Compliance Committee and Co-Chairman of the Governance Committee | | Term: Indefinite Elected: 7/99 | | President of SpenceCare International LLC (international healthcare consulting) (1999 – present); Chief Executive Officer, IEmily.com (health internet company) (2000 – 2001); Chief Executive Officer of Consensus Pharmaceutical, Inc. (1998 – 1999); Founder, President and Chief Executive Officer of Spence Center for Women’s Health (1994 – 1998); President and CEO Emerson Hospital (1984 – 1994); Trustee, Eastern Enterprise (utilities) (1988 – 2000). | | 59 | | Trustee, State Street Institutional Investment Trust; Trustee SSGA Funds; Director, Berkshire Life Insurance Company of America (1993 – 2009); Director, IEmily.com, Inc. (2000 – 2010); and Trustee, National Osteoporosis Foundation (2005 – 2008). |
26
| | | | | | | | | | |
Name, Address, and Year of Birth | | Position(s) Held
with Trust | | Term of Office
and Length of
Time Served | | Principal Occupation
During Past Five Years | | Number of
Funds in
Fund Complex
Overseen by
Trustee | | Other Directorships
Held by Trustee
During Past Five Years |
Independent Trustees (continued) | | | | | | |
Bruce D. Taber State Street Financial Center One Lincoln Street Boston, MA 02111-2900
YOB: 1943 | | Trustee and Co-Chairman of the Valuation Committee and Co-Chairman of the Governance Committee | | Term: Indefinite Elected: 1/14 | | 1999 to Present, Partner, Zenergy LLC (a technology company providing Computer Modeling and System Analysis to the General Electric Power Generation Division); Until December 2008, Independent Director, SSGA Cash Management Fund plc; Until December 2008, Independent Director, State Street Global Advisers Ireland, Ltd. (investment companies); and Until August 1994, President, Alonzo B. Reed, Inc., (a Boston architect-engineering firm). | | 59 | | Trustee, State Street Institutional Trust; Trustee SSGA Funds. |
Douglas T. Williams State Street Financial Center One Lincoln Street Boston, MA 02111-2900
YOB: 1940 | | Trustee and Co-Chairman of the Audit Committee | | Term: Indefinite Elected: 7/99 | | President, Oakmont Homeowners Association (2012 – 2013); President, Mariner Sands Chapel; Executive Vice President and member of Executive Committee, Chase Manhattan Bank (1987 – 1999); President, Boston Stock Exchange Depository Trust Company, 1981 – 1982. | | 59 | | Trustee, State Street Institutional Investment Trust; Trustee SSGA Funds; Treasurer, Nantucket Educational Trust, (2002 – 2007). |
| | | | | |
Interested Trustees(1) | | | | | | | | | | |
Scott F. Powers State Street Financial Center One Lincoln Street Boston, MA 02111-2900
YOB: 1959 | | Trustee | | Term: Indefinite Elected Trustee: 1/14 | | May 2008 to Present, President and Chief Executive Officer of State Street Global Advisors; 2001 – 2008, Chief Executive Officer of Old Mutual Asset Management; Board of Directors, United Way of Massachusetts Bay; Board of Directors of Middlesex School; Incorporator, Cardigan Mountain School | | 59 | | |
James E. Ross SSGA Funds Management, Inc. State Street Financial Center One Lincoln Street Boston, MA 02111-2900
YOB: 1965 | | Trustee | | Term: Indefinite Elected Trustee: 2/07 | | Chairman and Director, SSGA Funds Management, Inc. (2012 – present); President, SSGA Funds Management, Inc. (2005 – 2012); Executive Vice President and Senior Managing Director, State Street Global Advisors (2006 – present); and Principal, State Street Global Advisors (2006 – present). | | 254 | | |
| (1) | Mr. Powers and Mr. Ross are Interested Trustees because of their employment by SSGA Funds Management, Inc., an affiliate of the Trust. |
27
| | | | | | |
Name, Address, and Year of Birth | | Position(s) Held
with Trust | | Term of Office
and Length of Time Served | | Principal Occupation During Past Five Years |
Officers: | | | | | | |
Ellen M. Needham SSGA Funds Management, Inc.
State Street Financial Center One Lincoln Street Boston, MA 02111-2900
YOB: 1967 | | President | | Term: Indefinite
Elected: 10/12 | | President and Director, SSGA Funds Management, Inc.
(June 2012 – present); Chief Operating Officer, SSGA Funds Management, Inc. (May 2010 – June 2012); Senior Managing Director, SSGA Funds Management, Inc. (1992 – 2012) and Senior Managing Director, State Street Global Advisors (1992 – present).* |
Ann M. Carpenter SSGA Funds Management, Inc. State Street Financial Center One Lincoln Street Boston, MA 02111-2900
YOB: 1966 | | Vice President | | Term: Indefinite Elected: 10/12 | | Chief Operating Officer, SSGA Funds Management, Inc.
(April 2014 – present); Vice President, SSGA Funds Management, Inc. (2008 – present); Principal, State Street Global Advisors
(2005 – 2008 – present).* |
Laura F. Dell State Street Bank and
Trust Company 100 Huntington Avenue Boston, MA 02116
YOB: 1964 | | Treasurer | | Term: Indefinite Elected: 11/10 | | Vice President, State Street Bank and Trust Company (2002 – present).* |
Chad C. Hallett SSGA Funds Management, Inc. State Street Financial Center One Lincoln Street Boston, MA 02111-2900
YOB: 1969 | | Assistant Treasurer | | Term: Indefinite Elected: 09/11 | | Vice President, State Street Global Advisors and SSGA Funds Management, Inc. (November 2014 – present); Vice President, State Street Bank and Trust Company (2001 – November 2014).* |
Caroline M. Connolly State Street Bank and
Trust Company 100 Huntington Avenue Boston, MA 02116
YOB: 1975 | | Assistant Treasurer | | Term: Indefinite Elected: 09/11 | | Assistant Vice President, State Street Bank and Trust Company
(2007 – present). |
Brian Harris SSGA Funds Management, Inc. State Street Financial Center One Lincoln Street Boston, MA 02111
YOB: 1973 | | Chief Compliance Officer | | Term: Indefinite Elected: 11/13 | | Vice President, State Street Global Advisors and SSGA Funds Management, Inc. (June 2013 – Present); Senior Vice President and Global Head of Investment Compliance, BofA Global Capital Management (September 2010 to May 2013); Director of Compliance, AARP Financial Inc. (July 2008 to August 2010). |
David K. James State Street Bank and
Trust Company 100 Huntington Avenue Boston, MA 02116
YOB: 1970 | | Secretary | | Term: Indefinite Elected: 4/13 | | Managing Director and Managing Counsel, State Street Bank and Trust Company (2009 – present); Vice President and Counsel, PNC Global Investment Servicing (US), Inc. (2006 – 2009). |
Kristin Schantz State Street Bank and
Trust Company 100 Huntington Avenue Boston, MA 02116
YOB: 1979 | | Assistant Secretary | | Term: Indefinite Elected: 2/14 | | Vice President and Counsel, State Street Bank and Trust Company (2013 – present); Vice President, Citi Fund Services Ohio, Inc.
(2008 – 2013). |
| * | Served in various capacities and/or with various affiliated entities during noted time period. |
The Statement of Additional Information includes additional information about the Trustees and is available, without charge, upon request, by calling (toll free) 877-521-4083.
28
Trustees
William L. Boyan
Michael F. Holland
William L. Marshall
Scott F. Powers
Patrick J. Riley
James E. Ross
Richard D. Shirk
Rina K. Spence
Bruce D. Taber
Douglas T. Williams
Investment Adviser
SSGA Funds Management, Inc.
State Street Financial Center
One Lincoln Street
Boston, MA 02111
Administrator, Custodian and Transfer Agent
State Street Bank and Trust Company
State Street Financial Center
One Lincoln Street
Boston, MA 02111
Independent Registered Public Accounting Firm
Ernst & Young LLP
200 Clarendon Street
Boston, MA 02116
Legal Counsel
Ropes & Gray LLP
800 Boylston Street
Boston, MA 02119
This report is for shareholder information. This is not a prospectus intended for use in the purchase or sale of shares of beneficial interest.
| | |
State Street Equity 500 Index Portfolio State Street Bank and Trust Company P.O. Box 5049 Boston, MA 02206 IBG-14272 | | SSITEQ5PORTAR |
As of the end of the period covered by this report, State Street Master Funds (the “Trust” or “Registrant”) has adopted a code of ethics, as defined in Item 2(b) of Form N-CSR, that applies to the Registrant’s principal executive officer, principal financial officer, principal accounting officer or controller, or persons performing similar functions, regardless of whether these individuals are employed by the registrant or a third party (the “Code”). That Code comprises written standards that are reasonably designed to deter wrongdoing and to promote: (1) honest and ethical conduct, including the ethical handling of actual or apparent conflicts of interest between personal and professional relationships; (2) full, fair, accurate, timely and understandable disclosure in reports and documents that a Registrant files with, or submits to, the U.S. Securities Exchange Commission (the “SEC”) and in other public communications made by a Registrant; (3) compliance with applicable laws and governmental rules and regulations; (4) the prompt internal reporting to an appropriate person or persons identified in the Code of violations of the Code; and (5) accountability for adherence to the Code. As of the end of the period covered by the report, the Code was combined with other mutual funds advised by SSGA Funds Management, Inc. (“SSGA FM”). The Registrant has not granted any waivers from any provisions of the Code during the covered period. A copy of the Registrant’s Code is filed as Exhibit 12(a)(1) to this Form N-CSR.
| Item 3. | Audit Committee Financial Expert. |
The Trust’s Board of Trustees (the “Board”) has determined that the Trust has the following “audit committee financial experts” as defined in Item 3(b) of Form N-CSR serving on its Audit Committee: Messrs. Michael F. Holland, William L. Boyan and Mr. Richard D. Shirk. Each of the audit committee financial experts is “independent” as that term is defined in Item 3(a)(2) of Form N-CSR.
An “audit committee financial expert” is not an “expert” for any purpose, including for purposes of Section 11 of the Securities Act of 1933, as a result of being designated as an “audit committee financial expert.” Further, the designation of a person as an “audit committee financial expert” does not mean that the person has any greater duties, obligations, or liability than those imposed on the person without the “audit committee financial expert” designation. Similarly, the designation of a person as an “audit committee financial expert” does not affect the duties, obligations, or liability of any other member of the Audit Committee or Board of Trustees.
| Item 4. | Principal Accountant Fees and Services. |
For the fiscal years ended December 31, 2014 and December 31, 2013, the aggregate audit fees billed for professional services rendered by Ernst & Young LLP (“E&Y”), the Trust’s principal accountant, for the audit of the Trust’s annual financial statements or services normally provided by E&Y in connection with the
Trust’s statutory and regulatory filings and engagements were $177,600 and $177,600, respectively.
For the fiscal years ended December 31, 2014 and December 31, 2013, there were no fees for assurance and related services by E&Y reasonably related to the performance of the audit of the Trust’s financial statements that were not reported under paragraph (a) of this Item.
The aggregate tax fees billed for professional services rendered by E&Y for tax compliance, tax advice, and tax planning in the form of preparation of excise filings and income tax returns for the last two fiscal years ended December 31, 2014 and December 31, 2013 were $39,578 and $33,891, respectively.
For the fiscal years ended December 31, 2014 and December 31, 2013, there were no fees billed for professional services rendered by E&Y for products and services provided by E&Y to the Trust, other than the services reported in paragraphs (a) through (c).
For the fiscal years ended December 31, 2014 and December 31, 2013, the aggregate fees for professional services rendered by E&Y for products and services provided by E&Y to SSGA Funds Management, Inc. (the “Adviser”) and any entity controlling, controlled by, or under common control with the Adviser that provides ongoing services to the Trust that (i) relate directly to the operations and financial reporting of the Trust and (ii) were pre-approved by the Trust’s audit committee were approximately $7,886,395 and $7,426,155, respectively.
| | (e)(1) | Audit Committee Pre-Approval Policies and Procedures |
The Trust’s Audit Committee Charter states the following with respect to pre-approval procedures:
The Audit Committee shall have the following duties and powers:
| | • | | To pre-approve engagements by a Trust’s independent auditor for non-audit services to be rendered to the Fund’s investment adviser (not including any subadviser whose role is primarily portfolio management and is subcontracted with or overseen by another investment adviser), and any entity controlling, controlled by, or under common control with the investment adviser that provides ongoing services to the Fund, if the |
| | engagement relates directly to the operations and financial reporting of the Fund; |
| | • | | To establish, if deemed necessary or appropriate as an alternative to Audit Committee pre-approval of services to be provided by the independent auditor as required by paragraph (b) above, policies and procedures to permit such services to be pre-approved by other means, such as by action of a designated member or members of the Audit Committee, subject to the requirement that the decision of any member to whom authority is delegated to pre-approve an activity shall be presented to the full Audit Committee at its next scheduled meeting; |
Alternate Pre-Approval Procedure:
| | • | | The Chairperson, or a Co-Chairperson, of the Audit Committee is authorized to pre-approve any engagement involving the Trust’s independent auditors to the same extent as the Audit Committee. Any pre-approval decision by the Chairperson, or a Co-Chairperson, under the foregoing authority shall be presented to the Audit Committee at its next scheduled meeting. |
| | (e)(2) | Percentages of Services |
None of the services described in paragraphs (b) through (d) of this Item were performed in reliance on paragraph (c)(7)(i)(C) of Rule 2-01 of Regulation S-X during the period of time for which such rule was effective.
| | (g) | Total Fees Paid By Adviser and Certain Affiliates |
For the fiscal years ended December 31, 2014 and December 31, 2013, the aggregate non-audit fees billed by E&Y for services rendered to the Trust and the Adviser and any entity controlling, controlled by, or under common control with the Adviser that provided ongoing services to the Trust were approximately $22,200,000 and $19,400,000, respectively.
| | (h) | E&Y notified the Trust’s Audit Committee of all non-audit services that were rendered by E&Y to the Adviser and any entity controlling, controlled by, or under common control with the Adviser that provides services to the Trust, which services were not required to be pre-approved pursuant to paragraph (c)(7)(ii) of Rule 2-01 of Regulation S-X, allowing the Trust’s Audit Committee to consider whether such services were compatible with maintaining E&Y’s independence. |
| Item 5. | Audit Committees of Listed Registrants. |
Not applicable to the Registrant.
| Item 6. | Schedule of Investments. |
(a) Schedule of Investments is included as part of Item 1 of this Form N-CSR.
(b) Not applicable.
| Item 7. | Disclosure of Proxy Voting Policies and Procedures for Closed-End Management Investment Companies. |
Not applicable to the Registrant.
| Item 8. | Portfolio Managers of Closed-End Management Investment Companies. |
Not applicable to the Registrant.
| Item 9. | Purchases of Equity Securities by Closed-End Management Investment Company and Affiliated Purchasers. |
Not applicable to the Registrant.
| Item 10. | Submission of Matters to a Vote of Security Holders. |
The Board of Trustees approved an Amended and Restated Nominating Committee Charter (the “Charter”) at their February 13, 2014 Board Meeting. The Charter contains procedures related to how shareholders are to submit recommendations for Trustee candidates to the Trusts. Those procedures are as follows:
Procedures for Shareholders to Submit Nominee Candidates
(As of February 13, 2014)
A shareholder of the Trust, or of any series thereof, if applicable, must follow the following procedures in order to submit properly a nominee recommendation for the Nominating Committee’s consideration.
| | 1. | The shareholder must submit any such recommendation (a “Shareholder Recommendation”) in writing to the Trust, to the attention of the Trust’s Secretary, at the address of the principal executive offices of the Trust. |
| | 2. | The Shareholder Recommendation must be delivered to, or mailed and received at, the principal executive offices of the Trust not less than sixty (60) calendar days nor more than ninety (90) calendar days prior to the date of the Board or shareholder meeting at which the nominee candidate would be considered for election. Shareholder Recommendations will be kept on file for two years after receipt of the Shareholder Recommendation. A Shareholder Recommendation considered by the Nominating Committee in connection with the Nominating Committee’s nomination of any candidate(s) for appointment or election as an independent Trustee need not be considered again by the Nominating Committee in connection with any subsequent nomination(s). |
| | 3. | The Shareholder Recommendation must include: (i) a statement in writing setting forth (A) the name, age, date of birth, business address, residence address and nationality of the person recommended by the shareholder (the “candidate”), and the names and addresses of at least three professional references; (B) the number of all shares of the Trust (including the series and class, if applicable) owned of record or beneficially by the candidate, the date such shares were acquired and the investment intent of such acquisition(s), as reported to such shareholder by the candidate; (C) any other information regarding the candidate called for with respect to director nominees by paragraphs (a), (d), (e) and (f) of Item 401 of Regulation S-K or paragraph (b) of Item 22 of Rule 14a-101 (Schedule 14A) under the Securities Exchange Act of 1934, as amended (the “Exchange Act”), adopted by the Securities and Exchange Commission (or the corresponding provisions of any applicable regulation or rule subsequently adopted by the Securities and Exchange Commission or any successor agency with jurisdiction related to the Trust); (D) any other information regarding the candidate that would be required to be disclosed if the candidate were a nominee in a proxy statement or other filing required to be made in connection with solicitation of proxies for election of directors pursuant to Section 14 of the Exchange Act and the rules and regulations promulgated thereunder or any other applicable law or regulation; and (E) whether the recommending shareholder believes that the candidate is or will be an “interested person” of the Trust (as defined in the Investment Company Act of 1940, as amended) and, if not an “interested person,” information regarding the candidate that will be sufficient, in the discretion of the Board or the Nominating Committee, for the Trust to make such determination; (ii) the written and signed consent of the candidate to be named as a nominee and to serve as a Trustee if elected; (iii) the recommending shareholder’s name as it appears on the Trust’s books; (iv) the number of all shares of the Trust (including the series and class, if applicable) owned beneficially and of record by the recommending shareholder; (v) a complete description of all arrangements or understandings between the recommending shareholder and the candidate and any other person or persons (including their names) pursuant to which the recommendation is being made by the recommending shareholder including, without limitation, all direct and indirect compensation and other material monetary agreements, arrangements and understandings between the candidate and recommending shareholder during the past three years, and (vi) a brief description of the candidate’s relevant background and experience for membership on the Board, such as qualification as an audit committee financial expert. |
| | 4. | The Nominating Committee may require the recommending shareholder to furnish such other information as it may reasonably require or deem necessary to verify any information furnished pursuant to paragraph 3 above or to determine the eligibility of the candidate to serve as a Trustee of the Trust or to satisfy applicable law. If the recommending shareholder fails to provide such other information in writing within seven days of receipt of a written request from the Nominating Committee, the recommendation of such candidate as a nominee will be deemed not properly submitted for consideration, and the Nominating Committee will not be required to consider such candidate. |
| Item 11. | Controls and Procedures. |
(a) The Trust’s principal executive officer and principal financial officer have concluded that the Trust’s disclosure controls and procedures (as defined in Rule 30a-3(c) under the Investment Company Act of 1940, as amended (the “1940 Act”)) are effective to provide reasonable assurance that information required to be disclosed by the registrant on Form N-CSR is recorded, processed, summarized and reported as of a date within 90 days of the filing date of this report, that includes the disclosure required by this paragraph, based on their evaluation of these controls and procedures required by Rule 30a-3(b) under the 1940 Act and Rules 13a-15(b) or 15d-15(b) under the Securities Exchange Act of 1934.
(b) There were no changes in the Trust’s internal control over financial reporting (as defined in Rule 30a-3(d) under the 1940 Act) that occurred during the Trust’s second fiscal quarter of the period covered by this Form N-CSR filing that has materially affected, or is reasonably likely to materially affect, the Trust’s internal control over financial reporting.
(a)(1) Code of Ethics pursuant to Item 2 of Form N-CSR is attached hereto.
(a)(2) Certifications of principal executive officer and principal financial and accounting officer of the Trust as required by Rule 30a-2(a) under the 1940 Act are attached hereto.
(a)(3) Not applicable to the Registrant.
(b) Certifications of principal executive officer and principal financial and accounting officer of the Trust as required by Rule 30a-2(b) under the 1940 Act and Section 906 of the Sarbanes-Oxley Act of 2002 are attached hereto.
SIGNATURES
Pursuant to the requirements of the Securities Exchange Act of 1934 and the Investment Company Act of 1940, the Registrant has duly caused this report to be signed on its behalf by the undersigned, thereunto duly authorized.
Registrant: STATE STREET MASTER FUNDS
| | |
| |
| By: | | /s/ Ellen M. Needham |
| | Ellen M. Needham |
| | President |
Date: March 10, 2015
Pursuant to the requirements of the Securities Exchange Act of 1934 and the Investment Company Act of 1940, this report has been signed below by the following persons on behalf of the Registrant and in the capacities and on the dates indicated.
| | |
| By: | | /s/ Ellen M. Needham |
| | Ellen M. Needham |
| | President (Principal Executive Officer) |
Date: March 10, 2015
| | |
| By: | | /s/ Laura Dell |
| | Laura Dell |
| | Treasurer (Principal Financial and Accounting Officer) |
Date: March 10, 2015