UNITED STATES
SECURITIES AND EXCHANGE COMMISSION
Washington, D.C. 20549
FORMN-CSR
CERTIFIED SHAREHOLDER REPORT OF REGISTERED
MANAGEMENT INVESTMENT COMPANIES
Investment Company Act file number:811-09599
STATE STREET MASTER FUNDS
(Exact name of registrant as specified in charter)
One Iron Street, Boston, Massachusetts 02210
(Address of principal executive offices)(Zip code)
| | |
| (Name and Address of Agent for Service) | | Copy to: |
| |
Joshua A. Weinberg, Esq. Managing Director and Managing Counsel c/o SSGA Funds Management, Inc. One Iron Street Boston, Massachusetts 02210 | | Timothy W. Diggins, Esq. Ropes & Gray LLP 800 Boylston Street Boston, Massachusetts 02110-2624 |
Registrant’s telephone number, including area code: (617)664-7037
Date of fiscal year end: December 31
Date of reporting period: December 31, 2018
| Item 1. | Reports to Stockholders. |
Annual Report
December 31, 2018
State Street Master Funds
| State Street Equity 500 Index Portfolio |
The information contained in this report is intended for the general information of shareholders of the Portfolio and shareholders of any fund invested in the Portfolio. Interests in the Portfolio are offered solely to eligible investors in private placement transactions that do not involve any “public offering” within the meaning of Section 4(a)(2) of the 1933 Act. This report is not authorized for distribution (i) to prospective investors in any fund invested in the Portfolio unless preceded or accompanied by a current offering document for such fund or (ii) to prospective eligible investors in the Portfolio unless preceded or accompanied by a current offering document of the Portfolio. Eligible investors in the Portfolio may obtain a current Portfolio offering document by calling 1-800-997-7327. Please read the offering document carefully before investing in the Portfolio.
TABLE OF CONTENTS
The information contained in this report is intended for the general information of shareholders of the Portfolio and shareholders of any fund invested in the Portfolio. Interests in the Portfolio are offered solely to eligible investors in private placement transactions that do not involve any “public offering” within the meaning of Section 4(a)(2) of the 1933 Act. This report is not authorized for distribution (i) to prospective investors in any fund invested in the Portfolio unless preceded or accompanied by a current offering document for such fund or (ii) to prospective eligible investors in the Portfolio unless preceded or accompanied by a current offering document of the Portfolio. Eligible investors in the Portfolio may obtain a current Portfolio offering document by calling 1-800-997-7327. Please read the offering document carefully before investing in the Portfolio.
STATE STREET EQUITY 500 INDEX PORTFOLIO
Management's Discussion of Fund Performance (Unaudited)
The investment objective of the State Street Equity 500 Index Portfolio (the “Portfolio”) is to replicate as closely as possible, before expenses, the performance of the Standard & Poor’s 500 Index (the “S&P 500” or the “Index”). The Portfolio's benchmark is the S&P 500 Index.
For the12-month period ended December 31, 2018 (the “Reporting Period”), the total return for the Portfolio was–4.98% and the Index was–4.38%. The Portfolio and Index returns reflect the reinvestment of dividends and other income. The Portfolio’s performance reflects the expenses of managing the Portfolio, including brokerage and advisory expenses. The Index is unmanaged and Index returns do not reflect fees and expenses of any kind, which would have a negative impact on returns. Fees, cash drag, and the cumulative effect of security misweights contributed to the difference between the Portfolio’s performance and that of the Index.
Equity markets opened the first month of 2018 with an acceleration of positive momentum following up on what was the strongest year for global equity markets since 2009. The sharp rise in yields that accelerated into the end of the month coincided with a reversal in U.S. equities at the end of January, including the first drop of more than 1% in the Index since August. Despite this, the Index returned over 5.7% for the month of January. The fifteen month run of gains for global equity markets and historically low volatility across asset classes came to an abrupt end in February as U.S. equities fell into correction territory for the first time in two years. The release of the January non-farm payrolls report on February 2nd noted that average hourly earnings rose by approximately 2.9% on a year-over-year basis, the highest reading since the beginning of the economic recovery. The release prompted a swift reassessment of government bond yields and a 2.10% selloff in the S&P 500 for the day, a decline larger than any seen the whole of 2017. The next two months followed suit with a drop of 3.69% in February and a drop of 2.54% in March.
Markets took a tentative step forward in April after February and March left the Index in the red to close off the first quarter of 2018. Unlike early February, when rising yields that came close to 3% were widely cited as a catalyst that unnerved equity markets, the gradual rise in yields to 3% in April coincided with generally positive equity market performance. U.S. equity markets managed to post modest gains each month of the second quarter, even as increasing tensions around a possible global trade war contributed to a two week selloff in U.S. shares to close the quarter.
The market environment during the third quarter in many ways mimicked what had already transpired throughout much of 2018. The Index surpassed the 1990s bull market to enter into the longest bull market ever – setting all-time highs along the way. The final tallies on second quarter earnings played their part as S&P 500 companies delivered earnings growth of nearly 25% on a year-over-year basis, with more than 3 out of 4 companies beating expectations. Large cap stocks, as represented by the S&P 500, displayed the most uninterrupted progress during the third quarter – posting an advance of approximately 7.7%.
In what is usually a seasonally favorable period, in Q4 of 2018, US equities exhibited their worst quarterly performance since 2011 when the market was facing debt ceiling negotiations and a credit rating downgrade from Standard & Poor’s. Although volatility prevailed during the entirety of the quarter, October and December were particularly vicious. Both months started out with building optimism based on improved outlooks for trade deals. In October, the United States, Canada and Mexico came to terms on a trade agreement which briefly lifted spirits. Meanwhile, December’s arrival was met with a trade truce between the United States and China based on discussions at the G20 meeting in Argentina. However, a host of factors relating to rising interest rates, economic growth concerns and systematic or algorithmic trading strategies stifled those short-lived rallies and sent the S&P 500 down approximately 13.5% for the quarter. This brought the index to a final return of–4.38% for the year.
The Portfolio invested in futures to achieve the desired exposure during the Reporting Period.
On an individual security level, the top positive contributors to the Fund’s performance during the Reporting Period were: Microsoft Corporation, Amazon.com Inc., and Merck & Co., Inc. The top negative contributors to the Fund’s performance during the Reporting Period were: Facebook, Inc. Class A, General Electric Company, and AT&T Inc.
The views expressed above reflect those of the Fund’s portfolio manager only through the Reporting Period, and do not necessarily represent the views of the Adviser as a whole. Any such views are subject to change at any time based upon market or other conditions and the Adviser disclaims any responsibility to update such views. These views may not be relied on as investment advice and, because investment decisions for a fund are based on numerous factors, may not be relied on as an indication of trading intent on behalf of any fund.
See accompanying notes to financial statements.
1
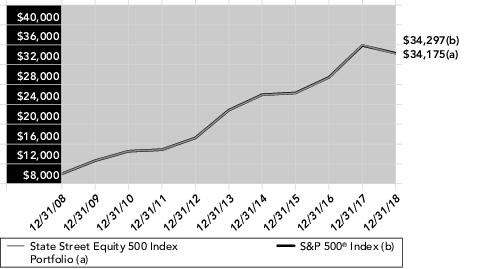
State Street Equity 500 Index Portfolio
Performance Summary (Unaudited)
Comparison of Change in Value of a $10,000 Investment
(Based on Net Asset Value)
Line graph is based on cumulative total return.
Performance as of December 31, 2018
| | | | | |
| | | Total Return
One Year Ended
December 31, 2018 | Average Annual
Total Return
Five Years Ended
December 31, 2018 | Average Annual
Total Return
Ten Years Ended
December 31, 2018 | |
| | State Street Equity 500 Index Portfolio | (4.98%) | 8.44% | 13.08% | |
| | S&P 500® Index(b) | (4.38%) | 8.49% | 13.12% | |
| | | | | |
| (b) | The S&P 500 Index includes five hundred (500) selected companies, all of which are listed on national stock exchanges and spans over 25 separate industry groups. |
Total returns and performance graph information represent past performance and are not indicative of future results, which may be lower or higher than performance data quoted. Investment return and principal value of an investment will fluctuate so that an investor’s share, when redeemed, may be worth more or less than its original cost. The graph and table above do not reflect the deduction of taxes that a shareholder would pay on fund distributions, sales, or the redemption of fund shares.
See accompanying notes to financial statements.
2
State Street Equity 500 Index Portfolio
PORTFOLIO STATISTICS (UNAUDITED)
Portfolio Composition as of December 31, 2018
| | | |
| | | % of Net Assets | |
| | Common Stocks | 98.0% | |
| | Short-Term Investments | 2.2 | |
| | Liabilities in Excess of Other Assets | (0.2) | |
| | TOTAL | 100.0% | |
(The composition is expressed as a percentage of net assets as of the date indicated. The composition will vary over time.)
Top Five Sectors as of December 31, 2018
| | | |
| | Description | % of Net Assets | |
| | Information Technology | 19.7% | |
| | Health Care | 15.2 | |
| | Financials | 13.1 | |
| | Communication Services | 9.9 | |
| | Consumer Discretionary | 9.7 | |
| | TOTAL | 67.6% | |
(The top five sectors are expressed as a percentage of net assets and may change over time.)
See accompanying notes to financial statements.
3
STATE STREET MASTER FUNDS
STATE STREET EQUITY 500 INDEX PORTFOLIO
SCHEDULE OF INVESTMENTS
December 31, 2018
| Security Description | | | Shares | | Value |
| COMMON STOCKS — 98.0% | | | | | |
| COMMUNICATION SERVICES — 9.9% | | | | | |
Activision Blizzard, Inc.
| | | 47,700 | | $2,221,389 |
Alphabet, Inc. Class A (a)
| | | 19,123 | | 19,982,770 |
Alphabet, Inc. Class C (a)
| | | 19,645 | | 20,344,558 |
AT&T, Inc.
| | | 465,200 | | 13,276,808 |
Cars.com, Inc. (a)
| | | 1 | | 22 |
CBS Corp. Class B
| | | 20,418 | | 892,675 |
CenturyLink, Inc.
| | | 62,587 | | 948,193 |
Charter Communications, Inc. Class A (a)
| | | 11,400 | | 3,248,658 |
Comcast Corp. Class A
| | | 289,330 | | 9,851,686 |
Discovery, Inc. Class A (a)(b)
| | | 9,497 | | 234,956 |
Discovery, Inc. Class C (a)
| | | 20,660 | | 476,833 |
DISH Network Corp. Class A (a)
| | | 15,100 | | 377,047 |
Electronic Arts, Inc. (a)
| | | 19,021 | | 1,500,947 |
Facebook, Inc. Class (a)
| | | 153,307 | | 20,097,015 |
Interpublic Group of Cos., Inc.
| | | 23,128 | | 477,131 |
Netflix, Inc. (a)
| | | 27,896 | | 7,466,643 |
News Corp. Class A
| | | 28,814 | | 327,039 |
News Corp. Class B
| | | 7,500 | | 86,625 |
Omnicom Group, Inc. (b)
| | | 14,950 | | 1,094,938 |
Take-Two Interactive Software, Inc. (a)
| | | 7,600 | | 782,344 |
TripAdvisor, Inc. (a)
| | | 7,215 | | 389,177 |
Twenty-First Century Fox, Inc. Class A
| | | 67,809 | | 3,262,969 |
Twenty-First Century Fox, Inc. Class B
| | | 31,200 | | 1,490,736 |
Twitter, Inc. (a)
| | | 45,500 | | 1,307,670 |
Verizon Communications, Inc.
| | | 263,951 | | 14,839,325 |
Viacom, Inc. Class B
| | | 24,341 | | 625,564 |
Walt Disney Co.
| | | 94,893 | | 10,405,017 |
| | | | | | 136,008,735 |
| CONSUMER DISCRETIONARY — 9.7% | | | | | |
Advance Auto Parts, Inc.
| | | 4,300 | | 677,078 |
Amazon.com, Inc. (a)
| | | 26,302 | | 39,504,815 |
Aptiv PLC
| | | 16,181 | | 996,264 |
AutoZone, Inc. (a)
| | | 1,588 | | 1,331,284 |
Best Buy Co., Inc.
| | | 16,013 | | 848,048 |
Booking Holdings, Inc. (a)
| | | 3,008 | | 5,181,039 |
BorgWarner, Inc.
| | | 13,223 | | 459,367 |
CarMax, Inc. (a)(b)
| | | 11,997 | | 752,572 |
Carnival Corp.
| | | 24,649 | | 1,215,196 |
Chipotle Mexican Grill, Inc. (a)
| | | 1,614 | | 696,909 |
D.R. Horton, Inc.
| | | 22,479 | | 779,122 |
Darden Restaurants, Inc.
| | | 8,117 | | 810,564 |
Dollar General Corp.
| | | 16,287 | | 1,760,299 |
Dollar Tree, Inc. (a)
| | | 15,782 | | 1,425,430 |
eBay, Inc. (a)
| | | 59,258 | | 1,663,372 |
Expedia Group, Inc.
| | | 7,923 | | 892,526 |
Foot Locker, Inc.
| | | 8,000 | | 425,600 |
Ford Motor Co.
| | | 251,860 | | 1,926,729 |
| Security Description | | | Shares | | Value |
Gap, Inc.
| | | 15,364 | | $395,777 |
Garmin, Ltd.
| | | 7,360 | | 466,035 |
General Motors Co.
| | | 84,577 | | 2,829,101 |
Genuine Parts Co.
| | | 9,220 | | 885,304 |
Goodyear Tire & Rubber Co.
| | | 14,413 | | 294,169 |
H&R Block, Inc. (b)
| | | 12,851 | | 326,030 |
Hanesbrands, Inc. (b)
| | | 23,400 | | 293,202 |
Harley-Davidson, Inc.
| | | 10,385 | | 354,336 |
Hasbro, Inc. (b)
| | | 7,628 | | 619,775 |
Hilton Worldwide Holdings, Inc.
| | | 18,700 | | 1,342,660 |
Home Depot, Inc.
| | | 72,010 | | 12,372,758 |
Kohl's Corp.
| | | 11,188 | | 742,212 |
L Brands, Inc.
| | | 15,246 | | 391,365 |
Leggett & Platt, Inc.
| | | 9,844 | | 352,809 |
Lennar Corp. Class A
| | | 18,125 | | 709,594 |
LKQ Corp. (a)
| | | 20,800 | | 493,584 |
Lowe's Cos., Inc.
| | | 51,012 | | 4,711,468 |
Macy's, Inc.
| | | 17,961 | | 534,879 |
Marriott International, Inc. Class A
| | | 17,852 | | 1,938,013 |
Mattel, Inc. (a)(b)
| | | 17,143 | | 171,259 |
McDonald's Corp.
| | | 49,115 | | 8,721,351 |
MGM Resorts International
| | | 31,800 | | 771,468 |
Michael Kors Holdings, Ltd. (a)
| | | 8,886 | | 336,957 |
Mohawk Industries, Inc. (a)
| | | 4,169 | | 487,606 |
Newell Brands, Inc. (b)
| | | 26,350 | | 489,846 |
NIKE, Inc. Class B
| | | 81,002 | | 6,005,488 |
Nordstrom, Inc. (b)
| | | 7,756 | | 361,507 |
Norwegian Cruise Line Holdings, Ltd. (a)
| | | 12,900 | | 546,831 |
O'Reilly Automotive, Inc. (a)
| | | 5,220 | | 1,797,403 |
PulteGroup, Inc.
| | | 16,443 | | 427,354 |
PVH Corp.
| | | 4,751 | | 441,605 |
Ralph Lauren Corp.
| | | 3,436 | | 355,489 |
Ross Stores, Inc.
| | | 23,344 | | 1,942,221 |
Royal Caribbean Cruises, Ltd.
| | | 11,300 | | 1,105,027 |
Starbucks Corp.
| | | 79,292 | | 5,106,405 |
Tapestry, Inc.
| | | 19,000 | | 641,250 |
Target Corp.
| | | 33,744 | | 2,230,141 |
Tiffany & Co.
| | | 6,581 | | 529,836 |
TJX Cos., Inc.
| | | 78,550 | | 3,514,327 |
Tractor Supply Co.
| | | 8,274 | | 690,383 |
Ulta Salon Cosmetics & Fragrance, Inc. (a)
| | | 3,600 | | 881,424 |
Under Armour, Inc. Class A (a)(b)
| | | 14,376 | | 254,024 |
Under Armour, Inc. Class C (a)(b)
| | | 14,478 | | 234,109 |
VF Corp.
| | | 20,128 | | 1,435,931 |
Whirlpool Corp.
| | | 4,559 | | 487,220 |
Wynn Resorts, Ltd.
| | | 6,259 | | 619,078 |
Yum! Brands, Inc.
| | | 19,790 | | 1,819,097 |
| | | | | | 133,803,922 |
| CONSUMER STAPLES — 7.3% | | | | | |
Altria Group, Inc.
| | | 119,570 | | 5,905,562 |
See accompanying notes to financial statements.
4
STATE STREET MASTER FUNDS
STATE STREET EQUITY 500 INDEX PORTFOLIO
SCHEDULE OF INVESTMENTS (continued)
December 31, 2018
| Security Description | | | Shares | | Value |
Archer-Daniels-Midland Co.
| | | 35,692 | | $1,462,301 |
British American Tobacco PLC ADR
| | | 1 | | 32 |
Brown-Forman Corp. Class B
| | | 10,827 | | 515,149 |
Campbell Soup Co. (b)
| | | 12,083 | | 398,618 |
Church & Dwight Co., Inc.
| | | 16,200 | | 1,065,312 |
Clorox Co.
| | | 8,179 | | 1,260,711 |
Coca-Cola Co.
| | | 244,222 | | 11,563,912 |
Colgate-Palmolive Co.
| | | 55,679 | | 3,314,014 |
Conagra Brands, Inc.
| | | 32,051 | | 684,609 |
Constellation Brands, Inc. Class A
| | | 10,576 | | 1,700,832 |
Costco Wholesale Corp.
| | | 28,234 | | 5,751,548 |
Coty, Inc. Class A (a)
| | | 28,940 | | 189,846 |
Estee Lauder Cos., Inc. Class A
| | | 14,363 | | 1,868,626 |
General Mills, Inc.
| | | 37,022 | | 1,441,637 |
Hershey Co.
| | | 8,615 | | 923,356 |
Hormel Foods Corp. (b)
| | | 15,998 | | 682,795 |
J.M. Smucker Co.
| | | 7,355 | | 687,619 |
Kellogg Co.
| | | 15,907 | | 906,858 |
Kimberly-Clark Corp.
| | | 22,373 | | 2,549,180 |
Kraft Heinz Co.
| | | 40,251 | | 1,732,403 |
Kroger Co.
| | | 51,310 | | 1,411,025 |
Lamb Weston Holdings, Inc.
| | | 9,400 | | 691,464 |
McCormick & Co., Inc.
| | | 8,061 | | 1,122,414 |
Molson Coors Brewing Co. Class B
| | | 11,409 | | 640,730 |
Mondelez International, Inc. Class A
| | | 94,294 | | 3,774,589 |
Monster Beverage Corp. (a)
| | | 25,487 | | 1,254,470 |
PepsiCo, Inc.
| | | 89,938 | | 9,936,350 |
Philip Morris International, Inc.
| | | 98,587 | | 6,581,668 |
Procter & Gamble Co.
| | | 158,913 | | 14,607,283 |
Sysco Corp.
| | | 30,735 | | 1,925,855 |
Tyson Foods, Inc. Class A
| | | 19,191 | | 1,024,799 |
Walmart, Inc.
| | | 91,599 | | 8,532,447 |
Walgreens Boots Alliance, Inc.
| | | 51,713 | | 3,533,549 |
| | | | | | 99,641,563 |
| ENERGY — 5.2% | | | | | |
Anadarko Petroleum Corp.
| | | 32,944 | | 1,444,265 |
Apache Corp.
| | | 24,970 | | 655,463 |
Baker Hughes a GE Co.
| | | 33,794 | | 726,571 |
Cabot Oil & Gas Corp.
| | | 26,722 | | 597,237 |
Chevron Corp.
| | | 121,934 | | 13,265,200 |
Cimarex Energy Co.
| | | 6,042 | | 372,489 |
Concho Resources, Inc. (a)
| | | 12,300 | | 1,264,317 |
ConocoPhillips
| | | 73,203 | | 4,564,207 |
Devon Energy Corp.
| | | 30,550 | | 688,597 |
Diamondback Energy, Inc.
| | | 9,700 | | 899,190 |
EOG Resources, Inc.
| | | 37,063 | | 3,232,264 |
Exxon Mobil Corp.
| | | 270,972 | | 18,477,581 |
Halliburton Co.
| | | 56,167 | | 1,492,919 |
Helmerich & Payne, Inc.
| | | 7,974 | | 382,274 |
Hess Corp.
| | | 16,544 | | 670,032 |
HollyFrontier Corp.
| | | 10,400 | | 531,648 |
Kinder Morgan, Inc.
| | | 117,476 | | 1,806,781 |
| Security Description | | | Shares | | Value |
Marathon Oil Corp.
| | | 55,089 | | $789,976 |
Marathon Petroleum Corp.
| | | 44,584 | | 2,630,902 |
National Oilwell Varco, Inc.
| | | 24,341 | | 625,564 |
Newfield Exploration Co. (a)
| | | 12,385 | | 181,564 |
Noble Energy, Inc.
| | | 32,895 | | 617,110 |
Occidental Petroleum Corp.
| | | 47,935 | | 2,942,250 |
ONEOK, Inc.
| | | 26,304 | | 1,419,101 |
Phillips 66
| | | 27,392 | | 2,359,821 |
Pioneer Natural Resources Co.
| | | 10,924 | | 1,436,724 |
Schlumberger, Ltd.
| | | 89,093 | | 3,214,475 |
TechnipFMC PLC
| | | 29,109 | | 569,954 |
Valero Energy Corp.
| | | 27,686 | | 2,075,619 |
Williams Cos., Inc.
| | | 76,410 | | 1,684,841 |
| | | | | | 71,618,936 |
| FINANCIALS — 13.1% | | | | | |
Affiliated Managers Group, Inc.
| | | 3,376 | | 328,957 |
Aflac, Inc.
| | | 49,574 | | 2,258,591 |
Allstate Corp.
| | | 22,467 | | 1,856,448 |
American Express Co.
| | | 44,552 | | 4,246,697 |
American International Group, Inc.
| | | 57,032 | | 2,247,631 |
Ameriprise Financial, Inc.
| | | 9,463 | | 987,653 |
Aon PLC
| | | 15,682 | | 2,279,536 |
Arthur J Gallagher & Co.
| | | 12,000 | | 884,400 |
Assurant, Inc.
| | | 3,946 | | 352,930 |
Bank of America Corp.
| | | 582,066 | | 14,342,106 |
Bank of New York Mellon Corp.
| | | 58,891 | | 2,771,999 |
BB&T Corp.
| | | 50,039 | | 2,167,690 |
Berkshire Hathaway, Inc. Class B (a)
| | | 124,619 | | 25,444,707 |
BlackRock, Inc.
| | | 7,718 | | 3,031,785 |
Brighthouse Financial, Inc. (a)
| | | 7,075 | | 215,646 |
Capital One Financial Corp.
| | | 29,968 | | 2,265,281 |
Cboe Global Markets, Inc.
| | | 7,500 | | 733,725 |
Charles Schwab Corp.
| | | 77,189 | | 3,205,659 |
Chubb, Ltd.
| | | 29,241 | | 3,777,352 |
Cincinnati Financial Corp.
| | | 9,205 | | 712,651 |
Citigroup, Inc.
| | | 155,593 | | 8,100,172 |
Citizens Financial Group, Inc.
| | | 28,500 | | 847,305 |
CME Group, Inc.
| | | 22,992 | | 4,325,255 |
Comerica, Inc.
| | | 11,017 | | 756,758 |
Discover Financial Services
| | | 22,277 | | 1,313,898 |
E*TRADE Financial Corp.
| | | 16,989 | | 745,477 |
Everest Re Group, Ltd.
| | | 2,700 | | 587,952 |
Fifth Third Bancorp
| | | 41,054 | | 966,001 |
First Republic Bank
| | | 10,500 | | 912,450 |
Franklin Resources, Inc.
| | | 17,151 | | 508,699 |
Goldman Sachs Group, Inc.
| | | 21,988 | | 3,673,095 |
Hartford Financial Services Group, Inc.
| | | 22,230 | | 988,124 |
Huntington Bancshares, Inc.
| | | 70,265 | | 837,559 |
Intercontinental Exchange, Inc.
| | | 36,125 | | 2,721,296 |
Invesco, Ltd.
| | | 28,289 | | 473,558 |
Jefferies Financial Group, Inc.
| | | 17,509 | | 303,956 |
JPMorgan Chase & Co.
| | | 212,172 | | 20,712,231 |
KeyCorp
| | | 64,479 | | 953,000 |
See accompanying notes to financial statements.
5
STATE STREET MASTER FUNDS
STATE STREET EQUITY 500 INDEX PORTFOLIO
SCHEDULE OF INVESTMENTS (continued)
December 31, 2018
| Security Description | | | Shares | | Value |
Lincoln National Corp.
| | | 14,310 | | $734,246 |
Loews Corp.
| | | 16,912 | | 769,834 |
M&T Bank Corp.
| | | 9,234 | | 1,321,662 |
Marsh & McLennan Cos., Inc.
| | | 32,534 | | 2,594,587 |
MetLife, Inc.
| | | 64,526 | | 2,649,438 |
Moody's Corp.
| | | 11,034 | | 1,545,201 |
Morgan Stanley
| | | 84,955 | | 3,368,466 |
MSCI, Inc.
| | | 6,000 | | 884,580 |
Nasdaq, Inc.
| | | 6,925 | | 564,872 |
Northern Trust Corp.
| | | 13,910 | | 1,162,737 |
People's United Financial, Inc.
| | | 22,434 | | 323,723 |
PNC Financial Services Group, Inc.
| | | 29,642 | | 3,465,446 |
Principal Financial Group, Inc.
| | | 15,726 | | 694,617 |
Progressive Corp.
| | | 37,852 | | 2,283,611 |
Prudential Financial, Inc.
| | | 26,937 | | 2,196,712 |
Raymond James Financial, Inc.
| | | 7,800 | | 580,398 |
Regions Financial Corp.
| | | 68,043 | | 910,415 |
S&P Global, Inc.
| | | 15,998 | | 2,718,700 |
State Street Corp. (c)
| | | 24,347 | | 1,535,565 |
SunTrust Banks, Inc.
| | | 29,782 | | 1,502,204 |
SVB Financial Group (a)
| | | 3,500 | | 664,720 |
Synchrony Financial
| | | 42,871 | | 1,005,754 |
T Rowe Price Group, Inc.
| | | 15,120 | | 1,395,878 |
Torchmark Corp.
| | | 6,384 | | 475,800 |
Travelers Cos., Inc.
| | | 17,298 | | 2,071,436 |
Unum Group
| | | 14,124 | | 414,963 |
US Bancorp
| | | 98,130 | | 4,484,541 |
Wells Fargo & Co.
| | | 270,146 | | 12,448,328 |
Willis Towers Watson PLC
| | | 8,379 | | 1,272,435 |
Zions Bancorp
| | | 12,058 | | 491,243 |
| | | | | | 180,370,342 |
| HEALTH CARE — 15.2% | | | | | |
Abbott Laboratories
| | | 112,849 | | 8,162,368 |
AbbVie, Inc.
| | | 95,863 | | 8,837,610 |
ABIOMED, Inc. (a)
| | | 2,800 | | 910,112 |
Agilent Technologies, Inc.
| | | 20,275 | | 1,367,751 |
Alexion Pharmaceuticals, Inc. (a)
| | | 14,427 | | 1,404,613 |
Align Technology, Inc. (a)
| | | 4,500 | | 942,435 |
Allergan PLC
| | | 20,426 | | 2,730,139 |
AmerisourceBergen Corp.
| | | 10,552 | | 785,069 |
Amgen, Inc.
| | | 40,591 | | 7,901,850 |
Anthem, Inc.
| | | 16,419 | | 4,312,122 |
Baxter International, Inc.
| | | 31,070 | | 2,045,027 |
Becton Dickinson and Co.
| | | 17,177 | | 3,870,322 |
Biogen, Inc. (a)
| | | 12,947 | | 3,896,011 |
Boston Scientific Corp. (a)
| | | 87,477 | | 3,091,437 |
Bristol-Myers Squibb Co.
| | | 105,112 | | 5,463,722 |
Cardinal Health, Inc.
| | | 18,624 | | 830,630 |
Celgene Corp. (a)
| | | 45,065 | | 2,888,216 |
Centene Corp. (a)
| | | 13,100 | | 1,510,430 |
Cerner Corp. (a)
| | | 20,963 | | 1,099,300 |
Cigna Corp.
| | | 24,385 | | 4,631,169 |
Cooper Cos., Inc.
| | | 3,300 | | 839,850 |
CVS Health Corp.
| | | 82,933 | | 5,433,770 |
| Security Description | | | Shares | | Value |
Danaher Corp.
| | | 39,478 | | $4,070,971 |
DaVita, Inc. (a)
| | | 9,072 | | 466,845 |
DENTSPLY SIRONA, Inc.
| | | 14,366 | | 534,559 |
Edwards Lifesciences Corp. (a)
| | | 13,490 | | 2,066,263 |
Eli Lilly & Co.
| | | 60,057 | | 6,949,796 |
Gilead Sciences, Inc.
| | | 82,346 | | 5,150,742 |
HCA Healthcare, Inc.
| | | 17,300 | | 2,152,985 |
Henry Schein, Inc. (a)
| | | 9,700 | | 761,644 |
Hologic, Inc. (a)
| | | 17,600 | | 723,360 |
Humana, Inc.
| | | 8,817 | | 2,525,894 |
IDEXX Laboratories, Inc. (a)
| | | 5,400 | | 1,004,508 |
Illumina, Inc. (a)
| | | 9,300 | | 2,789,349 |
Incyte Corp. (a)
| | | 11,900 | | 756,721 |
Intuitive Surgical, Inc. (a)
| | | 7,256 | | 3,475,044 |
IQVIA Holdings, Inc. (a)
| | | 10,000 | | 1,161,700 |
Johnson & Johnson
| | | 171,641 | | 22,150,271 |
Laboratory Corp. of America Holdings (a)
| | | 6,447 | | 814,643 |
McKesson Corp.
| | | 12,231 | | 1,351,159 |
Medtronic PLC
| | | 85,704 | | 7,795,636 |
Merck & Co., Inc.
| | | 165,798 | | 12,668,625 |
Mettler-Toledo International, Inc. (a)
| | | 1,600 | | 904,928 |
Mylan NV (a)
| | | 34,707 | | 950,972 |
Nektar Therapeutics (a)
| | | 10,700 | | 351,709 |
PerkinElmer, Inc.
| | | 7,032 | | 552,364 |
Perrigo Co. PLC
| | | 8,714 | | 337,668 |
Pfizer, Inc.
| | | 368,648 | | 16,091,485 |
Quest Diagnostics, Inc.
| | | 8,458 | | 704,298 |
Regeneron Pharmaceuticals, Inc. (a)
| | | 5,058 | | 1,889,163 |
ResMed, Inc.
| | | 9,500 | | 1,081,765 |
Stryker Corp.
| | | 20,195 | | 3,165,566 |
Thermo Fisher Scientific, Inc.
| | | 25,912 | | 5,798,846 |
UnitedHealth Group, Inc.
| | | 61,622 | | 15,351,273 |
Universal Health Services, Inc. Class B
| | | 5,300 | | 617,768 |
Varian Medical Systems, Inc. (a)
| | | 6,031 | | 683,373 |
Vertex Pharmaceuticals, Inc. (a)
| | | 16,348 | | 2,709,027 |
Waters Corp. (a)
| | | 5,015 | | 946,080 |
WellCare Health Plans, Inc. (a)
| | | 3,100 | | 731,879 |
Zimmer Biomet Holdings, Inc.
| | | 13,427 | | 1,392,648 |
Zoetis, Inc.
| | | 30,228 | | 2,585,703 |
| | | | | | 209,171,183 |
| INDUSTRIALS — 9.0% | | | | | |
3M Co.
| | | 37,043 | | 7,058,173 |
Alaska Air Group, Inc.
| | | 8,200 | | 498,970 |
Allegion PLC
| | | 5,437 | | 433,383 |
American Airlines Group, Inc. (b)
| | | 24,400 | | 783,484 |
AMETEK, Inc.
| | | 15,101 | | 1,022,338 |
AO Smith Corp.
| | | 9,700 | | 414,190 |
Arconic, Inc.
| | | 28,263 | | 476,514 |
Boeing Co.
| | | 33,624 | | 10,843,740 |
C.H. Robinson Worldwide, Inc.
| | | 8,582 | | 721,660 |
Caterpillar, Inc.
| | | 37,555 | | 4,772,114 |
See accompanying notes to financial statements.
6
STATE STREET MASTER FUNDS
STATE STREET EQUITY 500 INDEX PORTFOLIO
SCHEDULE OF INVESTMENTS (continued)
December 31, 2018
| Security Description | | | Shares | | Value |
Cintas Corp.
| | | 5,722 | | $961,239 |
Copart, Inc. (a)
| | | 13,200 | | 630,696 |
CSX Corp.
| | | 50,859 | | 3,159,870 |
Cummins, Inc.
| | | 9,844 | | 1,315,552 |
Deere & Co.
| | | 20,954 | | 3,125,708 |
Delta Air Lines, Inc.
| | | 39,466 | | 1,969,353 |
Dover Corp.
| | | 8,545 | | 606,268 |
Eaton Corp. PLC
| | | 28,199 | | 1,936,143 |
Emerson Electric Co.
| | | 40,469 | | 2,418,023 |
Equifax, Inc.
| | | 7,595 | | 707,322 |
Expeditors International of Washington, Inc.
| | | 11,844 | | 806,458 |
Fastenal Co.
| | | 17,642 | | 922,500 |
FedEx Corp.
| | | 15,750 | | 2,540,948 |
Flowserve Corp.
| | | 9,555 | | 363,281 |
Fluor Corp.
| | | 9,256 | | 298,043 |
Fortive Corp.
| | | 19,281 | | 1,304,552 |
Fortune Brands Home & Security, Inc.
| | | 10,100 | | 383,699 |
General Dynamics Corp.
| | | 17,789 | | 2,796,609 |
General Electric Co.
| | | 560,249 | | 4,241,085 |
Harris Corp.
| | | 7,498 | | 1,009,606 |
Honeywell International, Inc.
| | | 47,003 | | 6,210,036 |
Huntington Ingalls Industries, Inc.
| | | 2,800 | | 532,868 |
IHS Markit, Ltd. (a)
| | | 23,400 | | 1,122,498 |
Illinois Tool Works, Inc.
| | | 19,571 | | 2,479,450 |
Ingersoll-Rand PLC
| | | 15,116 | | 1,379,033 |
Jacobs Engineering Group, Inc.
| | | 7,057 | | 412,552 |
JB Hunt Transport Services, Inc.
| | | 5,500 | | 511,720 |
Johnson Controls International PLC
| | | 58,993 | | 1,749,142 |
Kansas City Southern
| | | 7,004 | | 668,532 |
L3 Technologies, Inc.
| | | 5,165 | | 896,954 |
Lockheed Martin Corp.
| | | 15,890 | | 4,160,638 |
Masco Corp.
| | | 17,839 | | 521,612 |
Nielsen Holdings PLC
| | | 23,375 | | 545,339 |
Norfolk Southern Corp.
| | | 17,268 | | 2,582,257 |
Northrop Grumman Corp.
| | | 11,186 | | 2,739,451 |
PACCAR, Inc.
| | | 21,435 | | 1,224,796 |
Parker-Hannifin Corp.
| | | 8,414 | | 1,254,864 |
Pentair PLC
| | | 11,791 | | 445,464 |
Quanta Services, Inc.
| | | 9,993 | | 300,789 |
Raytheon Co.
| | | 18,436 | | 2,827,161 |
Republic Services, Inc.
| | | 13,414 | | 967,015 |
Robert Half International, Inc.
| | | 6,974 | | 398,913 |
Rockwell Automation, Inc.
| | | 7,479 | | 1,125,440 |
Rollins, Inc.
| | | 9,450 | | 341,145 |
Roper Technologies, Inc.
| | | 6,735 | | 1,795,012 |
Snap-on, Inc.
| | | 3,572 | | 518,976 |
Southwest Airlines Co.
| | | 31,927 | | 1,483,967 |
Stanley Black & Decker, Inc.
| | | 9,650 | | 1,155,491 |
Textron, Inc.
| | | 14,806 | | 680,928 |
TransDigm Group, Inc. (a)
| | | 3,100 | | 1,054,186 |
Union Pacific Corp.
| | | 47,338 | | 6,543,532 |
| Security Description | | | Shares | | Value |
United Continental Holdings, Inc. (a)
| | | 14,200 | | $1,188,966 |
United Parcel Service, Inc. Class B
| | | 44,255 | | 4,316,190 |
United Rentals, Inc. (a)
| | | 5,600 | | 574,168 |
United Technologies Corp.
| | | 51,879 | | 5,524,076 |
Verisk Analytics, Inc. (a)
| | | 10,300 | | 1,123,112 |
W.W. Grainger, Inc.
| | | 2,712 | | 765,760 |
Waste Management, Inc.
| | | 24,704 | | 2,198,409 |
Xylem, Inc.
| | | 11,434 | | 762,877 |
| | | | | | 123,604,840 |
| INFORMATION TECHNOLOGY — 19.7% | | | | | |
Accenture PLC Class A
| | | 40,482 | | 5,708,367 |
Adobe, Inc. (a)
| | | 31,213 | | 7,061,629 |
Advanced Micro Devices, Inc. (a)(b)
| | | 57,400 | | 1,059,604 |
Akamai Technologies, Inc. (a)
| | | 10,234 | | 625,093 |
Alliance Data Systems Corp.
| | | 2,904 | | 435,832 |
Amphenol Corp. Class A
| | | 19,280 | | 1,562,066 |
Analog Devices, Inc.
| | | 23,970 | | 2,057,345 |
ANSYS, Inc. (a)
| | | 5,600 | | 800,464 |
Apple, Inc.
| | | 288,564 | | 45,518,085 |
Applied Materials, Inc.
| | | 63,553 | | 2,080,725 |
Arista Networks, Inc. (a)
| | | 3,100 | | 653,170 |
Autodesk, Inc. (a)
| | | 14,270 | | 1,835,265 |
Automatic Data Processing, Inc.
| | | 28,265 | | 3,706,107 |
Broadcom, Inc.
| | | 26,635 | | 6,772,748 |
Broadridge Financial Solutions, Inc.
| | | 7,000 | | 673,750 |
Cadence Design Systems, Inc. (a)
| | | 18,500 | | 804,380 |
Cisco Systems, Inc.
| | | 286,629 | | 12,419,635 |
Citrix Systems, Inc.
| | | 8,578 | | 878,902 |
Cognizant Technology Solutions Corp. Class A
| | | 36,627 | | 2,325,082 |
Corning, Inc.
| | | 53,050 | | 1,602,640 |
DXC Technology Co.
| | | 18,191 | | 967,215 |
F5 Networks, Inc. (a)
| | | 3,759 | | 609,071 |
Fidelity National Information Services, Inc.
| | | 21,186 | | 2,172,624 |
Fiserv, Inc. (a)
| | | 26,184 | | 1,924,262 |
FleetCor Technologies, Inc. (a)
| | | 5,800 | | 1,077,176 |
FLIR Systems, Inc.
| | | 8,239 | | 358,726 |
Fortinet, Inc. (a)
| | | 9,200 | | 647,956 |
Gartner, Inc. (a)(b)
| | | 6,000 | | 767,040 |
Global Payments, Inc.
| | | 10,575 | | 1,090,600 |
Hewlett Packard Enterprise Co.
| | | 89,363 | | 1,180,485 |
HP, Inc.
| | | 102,163 | | 2,090,255 |
Intel Corp.
| | | 291,020 | | 13,657,569 |
International Business Machines Corp.
| | | 58,447 | | 6,643,670 |
Intuit, Inc.
| | | 16,526 | | 3,253,143 |
IPG Photonics Corp. (a)
| | | 2,500 | | 283,225 |
Jack Henry & Associates, Inc.
| | | 4,900 | | 619,948 |
Juniper Networks, Inc.
| | | 22,844 | | 614,732 |
See accompanying notes to financial statements.
7
STATE STREET MASTER FUNDS
STATE STREET EQUITY 500 INDEX PORTFOLIO
SCHEDULE OF INVESTMENTS (continued)
December 31, 2018
| Security Description | | | Shares | | Value |
Keysight Technologies, Inc. (a)
| | | 12,000 | | $744,960 |
KLA-Tencor Corp.
| | | 9,873 | | 883,535 |
Lam Research Corp.
| | | 9,581 | | 1,304,645 |
Mastercard, Inc. Class A
| | | 57,949 | | 10,932,079 |
Maxim Integrated Products, Inc.
| | | 17,800 | | 905,130 |
Microchip Technology, Inc. (b)
| | | 15,006 | | 1,079,232 |
Micron Technology, Inc. (a)
| | | 70,928 | | 2,250,545 |
Microsoft Corp.
| | | 494,777 | | 50,254,500 |
Motorola Solutions, Inc.
| | | 10,428 | | 1,199,637 |
NetApp, Inc.
| | | 16,843 | | 1,005,022 |
NVIDIA Corp.
| | | 38,912 | | 5,194,752 |
Oracle Corp.
| | | 162,770 | | 7,349,065 |
Paychex, Inc.
| | | 21,131 | | 1,376,685 |
PayPal Holdings, Inc. (a)
| | | 75,858 | | 6,378,899 |
Qorvo, Inc. (a)
| | | 7,600 | | 461,548 |
QUALCOMM, Inc. (b)
| | | 77,585 | | 4,415,362 |
Red Hat, Inc. (a)
| | | 11,330 | | 1,990,001 |
salesforce.com, Inc. (a)
| | | 48,505 | | 6,643,730 |
Seagate Technology PLC
| | | 15,076 | | 581,783 |
Skyworks Solutions, Inc.
| | | 11,800 | | 790,836 |
Symantec Corp.
| | | 39,403 | | 744,520 |
Synopsys, Inc. (a)
| | | 9,400 | | 791,856 |
TE Connectivity, Ltd.
| | | 21,649 | | 1,637,314 |
Texas Instruments, Inc.
| | | 61,106 | | 5,774,517 |
Total System Services, Inc.
| | | 10,899 | | 885,980 |
VeriSign, Inc. (a)
| | | 6,920 | | 1,026,167 |
Visa, Inc. Class A
| | | 112,040 | | 14,782,558 |
Western Digital Corp.
| | | 19,506 | | 721,137 |
Western Union Co.
| | | 27,940 | | 476,656 |
Xerox Corp.
| | | 15,823 | | 312,662 |
Xilinx, Inc.
| | | 16,042 | | 1,366,297 |
| | | | | | 270,800,196 |
| MATERIALS — 2.7% | | | | | |
Air Products & Chemicals, Inc.
| | | 14,007 | | 2,241,820 |
Albemarle Corp. (b)
| | | 7,100 | | 547,197 |
Avery Dennison Corp.
| | | 5,818 | | 522,631 |
Ball Corp.
| | | 21,216 | | 975,512 |
Celanese Corp. Series A
| | | 8,600 | | 773,742 |
CF Industries Holdings, Inc.
| | | 14,730 | | 640,902 |
DowDuPont, Inc.
| | | 146,132 | | 7,815,139 |
Eastman Chemical Co.
| | | 8,972 | | 655,943 |
Ecolab, Inc.
| | | 16,165 | | 2,381,913 |
FMC Corp.
| | | 8,622 | | 637,683 |
Freeport-McMoRan, Inc.
| | | 90,364 | | 931,653 |
International Flavors & Fragrances, Inc. (b)
| | | 6,280 | | 843,216 |
International Paper Co.
| | | 25,408 | | 1,025,467 |
Linde PLC
| | | 35,029 | | 5,465,925 |
LyondellBasell Industries NV Class A
| | | 20,652 | | 1,717,420 |
Martin Marietta Materials, Inc. (b)
| | | 4,055 | | 696,933 |
Mosaic Co.
| | | 20,816 | | 608,035 |
Newmont Mining Corp.
| | | 33,373 | | 1,156,374 |
Nucor Corp.
| | | 20,306 | | 1,052,054 |
Packaging Corp. of America
| | | 6,300 | | 525,798 |
| Security Description | | | Shares | | Value |
PPG Industries, Inc.
| | | 15,488 | | $1,583,338 |
Sealed Air Corp.
| | | 11,269 | | 392,612 |
Sherwin-Williams Co.
| | | 5,187 | | 2,040,877 |
Vulcan Materials Co.
| | | 8,390 | | 828,932 |
WestRock Co.
| | | 16,448 | | 621,077 |
| | | | | | 36,682,193 |
| REAL ESTATE — 2.9% | | | | | |
Alexandria Real Estate Equities, Inc. REIT
| | | 6,700 | | 772,108 |
American Tower Corp. REIT
| | | 28,382 | | 4,489,749 |
Apartment Investment & Management Co. Class A, REIT
| | | 9,765 | | 428,488 |
AvalonBay Communities, Inc. REIT
| | | 9,129 | | 1,588,902 |
Boston Properties, Inc. REIT
| | | 9,821 | | 1,105,354 |
CBRE Group, Inc. Class A (a)
| | | 20,108 | | 805,124 |
Crown Castle International Corp. REIT
| | | 26,642 | | 2,894,121 |
Digital Realty Trust, Inc. REIT
| | | 13,300 | | 1,417,115 |
Duke Realty Corp. REIT
| | | 22,500 | | 582,750 |
Equinix, Inc. REIT
| | | 5,138 | | 1,811,453 |
Equity Residential REIT
| | | 24,138 | | 1,593,349 |
Essex Property Trust, Inc. REIT
| | | 4,455 | | 1,092,411 |
Extra Space Storage, Inc. REIT
| | | 7,500 | | 678,600 |
Federal Realty Investment Trust REIT
| | | 4,600 | | 542,984 |
HCP, Inc. REIT
| | | 31,277 | | 873,567 |
Host Hotels & Resorts, Inc. REIT
| | | 48,759 | | 812,813 |
Iron Mountain, Inc. REIT
| | | 18,074 | | 585,778 |
Kimco Realty Corp. REIT
| | | 23,116 | | 338,649 |
Macerich Co. REIT
| | | 7,245 | | 313,564 |
Mid-America Apartment Communities, Inc. REIT
| | | 6,900 | | 660,330 |
Prologis, Inc. REIT
| | | 40,546 | | 2,380,861 |
Public Storage REIT
| | | 9,452 | | 1,913,179 |
Realty Income Corp. REIT
| | | 18,100 | | 1,141,024 |
Regency Centers Corp. REIT
| | | 10,499 | | 616,081 |
SBA Communications Corp. REIT (a)
| | | 7,100 | | 1,149,419 |
Simon Property Group, Inc. REIT
| | | 19,435 | | 3,264,886 |
SL Green Realty Corp. REIT
| | | 6,100 | | 482,388 |
UDR, Inc. REIT
| | | 17,800 | | 705,236 |
Ventas, Inc. REIT
| | | 22,403 | | 1,312,592 |
Vornado Realty Trust REIT
| | | 10,446 | | 647,965 |
Welltower, Inc. REIT
| | | 23,881 | | 1,657,580 |
Weyerhaeuser Co. REIT
| | | 49,998 | | 1,092,956 |
| | | | | | 39,751,376 |
| UTILITIES — 3.3% | | | | | |
AES Corp.
| | | 43,759 | | 632,755 |
Alliant Energy Corp.
| | | 14,700 | | 621,075 |
Ameren Corp.
| | | 16,456 | | 1,073,425 |
American Electric Power Co., Inc.
| | | 31,543 | | 2,357,524 |
See accompanying notes to financial statements.
8
STATE STREET MASTER FUNDS
STATE STREET EQUITY 500 INDEX PORTFOLIO
SCHEDULE OF INVESTMENTS (continued)
December 31, 2018
| Security Description | | | Shares | | Value |
American Water Works Co., Inc.
| | | 11,300 | | $1,025,701 |
CenterPoint Energy, Inc.
| | | 31,335 | | 884,587 |
CMS Energy Corp.
| | | 18,801 | | 933,470 |
Consolidated Edison, Inc.
| | | 19,600 | | 1,498,616 |
Dominion Energy, Inc.
| | | 42,068 | | 3,006,179 |
DTE Energy Co.
| | | 11,439 | | 1,261,722 |
Duke Energy Corp.
| | | 45,891 | | 3,960,393 |
Edison International
| | | 21,305 | | 1,209,485 |
Entergy Corp.
| | | 12,200 | | 1,050,054 |
Evergy, Inc.
| | | 16,499 | | 936,648 |
Eversource Energy
| | | 20,243 | | 1,316,605 |
Exelon Corp.
| | | 61,959 | | 2,794,351 |
FirstEnergy Corp.
| | | 29,729 | | 1,116,324 |
NextEra Energy, Inc.
| | | 30,257 | | 5,259,272 |
NiSource, Inc.
| | | 23,078 | | 585,027 |
NRG Energy, Inc.
| | | 19,998 | | 791,921 |
PG&E Corp. (a)
| | | 33,712 | | 800,660 |
Pinnacle West Capital Corp.
| | | 6,556 | | 558,571 |
PPL Corp.
| | | 44,756 | | 1,267,937 |
Public Service Enterprise Group, Inc.
| | | 32,336 | | 1,683,089 |
SCANA Corp.
| | | 9,501 | | 453,958 |
Sempra Energy
| | | 17,724 | | 1,917,559 |
Southern Co.
| | | 64,984 | | 2,854,097 |
WEC Energy Group, Inc.
| | | 20,287 | | 1,405,078 |
Xcel Energy, Inc.
| | | 33,700 | | 1,660,399 |
| | | | | | 44,916,482 |
TOTAL COMMON STOCKS
(Cost $455,091,918)
| | | | | 1,346,369,768 |
| | | | |
| SHORT-TERM INVESTMENTS — 2.2% | | | |
State Street Institutional U.S. Government Money Market Fund, Class G Shares 2.31% (d) (e)
| | 27,348,182 | 27,348,182 |
| Security Description | | | Shares | | Value |
State Street Navigator Securities Lending Portfolio II (c) (f)
| | | 2,502,193 | | $2,502,193 |
TOTAL SHORT-TERM INVESTMENTS
(Cost $29,850,375)
| | | | | 29,850,375 |
TOTAL INVESTMENTS — 100.2%
(Cost $484,942,293)
| | | | | 1,376,220,143 |
LIABILITIES IN EXCESS OF OTHER ASSETS — (0.2)%
| | | | | (2,427,692) |
NET ASSETS — 100.0%
| | | | | $1,373,792,451 |
| (a) | Non-income producing security. |
| (b) | All or a portion of the shares of the security are on loan at December 31, 2018. |
| (c) | The Portfolio invested in an affiliated entity. Amounts related to these transactions during the period ended December 31, 2018 are shown in the Affiliate Table below. |
| (d) | The Portfolio invested in certain money market funds managed by SSGA Funds Management, Inc. Amounts related to these transactions during the period ended December 31, 2018 are shown in the Affiliate Table below. |
| (e) | The rate shown is the annualized seven-day yield at December 31, 2018. |
| (f) | Investment of cash collateral for securities loaned. |
| ADR | =American Depositary Receipt |
| REIT | =Real Estate Investment Trust |
At December 31, 2018, open futures contracts purchased were as follows:
| Description | | Number of
Contracts | | Expiration
Date | | Notional
Amount | | Value | | Unrealized
Appreciation/
Depreciation |
| E-Mini S&P 500 Index (long) | | 218 | | 03/15/2019 | | $28,521,589 | | $27,306,680 | | $(1,214,909) |
During the period ended December 31, 2018, average notional value related to futures contracts was $30,118,992 or2% of net assets.
See accompanying notes to financial statements.
9
STATE STREET MASTER FUNDS
STATE STREET EQUITY 500 INDEX PORTFOLIO
SCHEDULE OF INVESTMENTS (continued)
December 31, 2018
The following table summarizes the value of thePortfolio's investments according to the fair value hierarchy as of December 31, 2018.
| Description | | Level 1 –
Quoted Prices | | Level 2 –
Other Significant
Observable Inputs | | Level 3 –
Significant
Unobservable Inputs | | Total |
| ASSETS: | | | | | | | | |
| INVESTMENTS: | | | | | | | | |
Common Stocks
| | $1,346,369,768 | | $— | | $— | | $1,346,369,768 |
Short-Term Investments
| | 29,850,375 | | — | | — | | 29,850,375 |
TOTAL INVESTMENTS
| | $1,376,220,143 | | $— | | $— | | $1,376,220,143 |
LIABILITIES:
| | | | | | | | |
| OTHER FINANCIAL INSTRUMENTS: | | | | | | | | |
Futures Contracts(a)
| | (1,214,909) | | — | | — | | (1,214,909) |
TOTAL OTHER FINANCIAL INSTRUMENTS:
| | $(1,214,909) | | $— | | $— | | $(1,214,909) |
| (a) | Futures Contracts are valued at unrealized appreciation (depreciation). |
Affiliate Table
| | Number of
Shares Held
at
12/31/17 | | Value at
12/31/17 | | Cost of
Purchases | | Proceeds
from
Shares Sold | | Realized
Gain (Loss) | | Change in
Unrealized
Appreciation/
Depreciation | | Number of
Shares Held
at
12/31/18 | | Value at
12/31/18 | | Dividend
Income | | Capital
Gains
Distributions |
State Street Corp.
| 25,847 | | $2,522,926 | | $168,671 | | $324,786 | | $204,164 | | $(1,035,410) | | 24,347 | | $1,535,565 | | $43,170 | | $— |
State Street Institutional U.S. Government Money Market Fund, Class G Shares
| 27,556,254 | | 27,556,254 | | 252,651,950 | | 252,860,022 | | — | | — | | 27,348,182 | | 27,348,182 | | 460,985 | | — |
State Street Navigator Securities Lending Government Money Market Portfolio
| 818,690 | | 818,690 | | 32,435,236 | | 30,751,733 | | — | | — | | 2,502,193 | | 2,502,193 | | 11,485 | | — |
Total
| | | $30,897,870 | | $285,255,857 | | $283,936,541 | | $204,164 | | $(1,035,410) | | | | $31,385,940 | | $515,640 | | $— |
See accompanying notes to financial statements.
10
STATE STREET MASTER FUNDS
STATE STREET EQUITY 500 INDEX PORTFOLIO
STATEMENT OF ASSETS AND LIABILITIES
December 31, 2018
| ASSETS | |
Investments in unaffiliated issuers, at value*
| $1,344,834,203 |
Investments in affiliated issuers, at value
| 31,385,940 |
Total Investments
| 1,376,220,143 |
Cash at broker
| 2,731,182 |
Cash
| 244 |
Receivable for investments sold
| 461,847 |
Dividends receivable — unaffiliated issuers
| 1,539,706 |
Dividends receivable — affiliated issuers
| 62,317 |
Securities lending income receivable — unaffiliated issuers
| 1,236 |
Securities lending income receivable — affiliated issuers
| 445 |
Receivable from Adviser
| 3,701 |
TOTAL ASSETS
| 1,381,020,821 |
| LIABILITIES | |
Payable upon return of securities loaned
| 2,502,193 |
Payable for investments purchased
| 3,468,683 |
Payable to broker – accumulated variation margin on open futures contracts
| 1,213,915 |
Advisory fee payable
| 43,579 |
TOTAL LIABILITIES
| 7,228,370 |
NET ASSETS
| $1,373,792,451 |
| COST OF INVESTMENTS: | |
Investments in unaffiliated issuers
| $454,306,739 |
Investments in affiliated issuers
| 30,635,554 |
Total cost of investments
| $484,942,293 |
* Includes investments in securities on loan, at value
| $14,346,572 |
See accompanying notes to financial statements.
11
STATE STREET MASTER FUNDS
STATE STREET EQUITY 500 INDEX PORTFOLIO
STATEMENT OF OPERATIONS
For the Year Ended December 31, 2018
| INVESTMENT INCOME | |
Interest income — unaffiliated issuers
| $10,093 |
Dividend income — unaffiliated issuers
| 30,925,473 |
Dividend income — affiliated issuers
| 504,155 |
Unaffiliated securities lending income
| 19,079 |
Affiliated securities lending income
| 11,485 |
Foreign taxes withheld
| (120,794) |
TOTAL INVESTMENT INCOME (LOSS)
| 31,349,491 |
| EXPENSES | |
Advisory fee
| 701,914 |
TOTAL EXPENSES
| 701,914 |
NET INVESTMENT INCOME (LOSS)
| $30,647,577 |
| REALIZED AND UNREALIZED GAIN (LOSS) | |
| Net realized gain (loss) on: | |
Investments — unaffiliated issuers
| 149,701,126 |
Investments — affiliated issuers
| 204,164 |
Futures contracts
| (826,985) |
Net realized gain (loss)
| 149,078,305 |
| Net change in unrealized appreciation/depreciation on: | |
Investments — unaffiliated issuers
| (235,611,250) |
Investments — affiliated issuers
| (1,035,410) |
Futures contracts
| (1,704,289) |
Net change in unrealized appreciation/depreciation
| (238,350,949) |
NET REALIZED AND UNREALIZED GAIN (LOSS)
| (89,272,644) |
NET INCREASE (DECREASE) IN NET ASSETS FROM OPERATIONS
| $(58,625,067) |
See accompanying notes to financial statements.
12
STATE STREET MASTER FUNDS
STATE STREET EQUITY 500 INDEX PORTFOLIO
STATEMENTS OF CHANGES IN NET ASSETS
| | Year Ended
12/31/18 | | Year Ended
12/31/17 |
| INCREASE (DECREASE) IN NET ASSETS FROM OPERATIONS: | | | |
Net investment income (loss)
| $30,647,577 | | $31,216,140 |
Net realized gain (loss)
| 149,078,305 | | 96,690,402 |
Net change in unrealized appreciation/depreciation
| (238,350,949) | | 183,011,705 |
Net increase (decrease) in net assets resulting from operations
| (58,625,067) | | 310,918,247 |
| FROM BENEFICIAL INTEREST TRANSACTIONS: | | | |
Contributions
| 70,287,455 | | 44,261,255 |
Withdrawals
| (317,119,601) | | (194,742,512) |
Net increase (decrease) in net assets from capital transactions
| (246,832,146) | | (150,481,257) |
Net increase (decrease) in net assets during the period
| (305,457,213) | | 160,436,990 |
Net assets at beginning of period
| 1,679,249,664 | | 1,518,812,674 |
NET ASSETS AT END OF PERIOD
| $1,373,792,451 | | $1,679,249,664 |
See accompanying notes to financial statements.
13
STATE STREET EQUITY 500 INDEX PORTFOLIO
FINANCIAL HIGHLIGHTS
Selected data for a share outstanding throughout each period
| | Year
Ended
12/31/18 | | Year
Ended
12/31/17 | | Year
Ended
12/31/16 | | Year
Ended
12/31/15 | | Year
Ended
12/31/14 |
Total return (a)
| (4.98)% | | 22.42%(b) | | 11.90% | | 1.41% | | 13.62% |
| Ratios and Supplemental Data: | | | | | | | | | |
Net assets, end of period (in 000s)
| $1,373,792 | | $1,679,250 | | $1,518,813 | | $1,601,598 | | $2,869,323 |
| Ratios to average net assets: | | | | | | | | | |
Total expenses
| 0.05% | | 0.05% | | 0.05% | | 0.05% | | 0.050% |
Net expenses
| 0.05% | | 0.05% | | 0.04% | | 0.05% | | 0.05% |
Net investment income (loss)
| 1.96% | | 1.98% | | 2.18% | | 2.00% | | 1.98% |
Portfolio turnover rate
| 4% | | 2% | | 5% | | 7%(c) | | 2%(c) |
| (a) | Results represent past performance and are not indicative of future results. Total return for periods of less than one year are not annualized. |
| (b) | Reflects a non-recurring litigation payment received by the Portfolio from State Street Corp., an affiliate, which amounted to less than $0.01 per share outstanding as of March 8, 2017. This payment resulted in an increase to total return less than of 0.005% for the period ended December 31, 2017. |
| (c) | Portfolio turnover rate excludes in-kind security transactions. |
See accompanying notes to financial statements.
14
STATE STREET EQUITY 500 INDEX PORTFOLIO
NOTES TO FINANCIAL STATEMENTS
December 31, 2018
1. Organization
State Street Master Funds (the “Trust”), a Massachusetts business trust registered under the Investment Company Act of 1940, as amended (“1940 Act”), is an open-end management investment company.
As of December 31, 2018, the Trust consists of six (6) series (and corresponding classes, each of which have the same rights and privileges, including voting rights), each of which represents a separate series of beneficial interest in the Trust. The State Street Equity 500 Index Portfolio (the “Portfolio”) is authorized to issue an unlimited number of non transferable beneficial interests. The financial statements herein relate only to:
| Fund | Commencement of Operations | Diversification Classification |
| State Street Equity 500 Index Portfolio | March 1, 2000 | Diversified |
Under the Trust’s organizational documents, its officers and trustees are indemnified against certain liabilities arising out of the performance of their duties to the Trust. Additionally, in the normal course of business, the Trust enters into contracts with service providers that contain general indemnification clauses. The Trust’s maximum exposure under these arrangements is unknown as this would involve future claims that may be made against the Trust that have not yet occurred.
2. Summary of Significant Accounting Policies
The following is a summary of significant accounting policies followed by the Trust in the preparation of its financial statements:
The preparation of financial statements in accordance with U.S. generally accepted accounting principles (“U.S. GAAP”) requires management to make estimates and assumptions that affect the reported amounts and disclosures in the financial statements. Actual results could differ from those estimates. The Portfolio is an investment company under U.S. GAAP and follows the accounting and reporting guidance applicable to investment companies.
Security Valuation
The Portfolio's investments are valued at fair value each day that the New York Stock Exchange (“NYSE”) is open and, for financial reporting purposes, as of the report date should the reporting period end on a day that the NYSE is not open. Fair value is generally defined as the price a fund would receive to sell an asset or pay to transfer a liability in an orderly transaction between market participants at the measurement date. By its nature, a fair value price is a good faith estimate of the valuation in a current sale and may not reflect an actual market price. The investments of the Portfolio are valued pursuant to the policy and procedures developed by the Oversight Committee (the “Committee”) and approved by the Board of Trustees of the Trust (the “Board”). The Committee provides oversight of the valuation of investments for the Portfolio. The Board has responsibility for overseeing the determination of the fair value of investments.
Valuation techniques used to value the Portfolio's investments by major category are as follows:
• Equity investments traded on a recognized securities exchange for which market quotations are readily available are valued at the last sale price or official closing price, as applicable, on the primary market or exchange on which they trade. Equity investments traded on a recognized exchange for which there were no sales on that day are valued at the last published sale price or at fair value.
• Investments in registered investment companies (including money market funds) or other unitized pooled investment vehicles that are not traded on an exchange are valued at that day’s published net asset value (“NAV”) per share or unit.
• Exchange-traded futures contracts are valued at the closing settlement price on the primary market on which they are traded most extensively. Exchange-traded futures contracts traded on a recognized exchange for which there were no sales on that day are valued at the last reported sale price obtained from independent pricing services or brokers or at fair value.
STATE STREET EQUITY 500 INDEX PORTFOLIO
NOTES TO FINANCIAL STATEMENTS (continued)
December 31, 2018
In the event prices or quotations are not readily available or that the application of these valuation methods results in a price for an investment that is deemed to be not representative of the fair value of such investment, fair value will be determined in good faith by the Committee, in accordance with the valuation policy and procedures approved by the Board.
Various inputs are used in determining the value of the Portfolio's investments.
The Portfolio values its assets and liabilities at fair value using a fair value hierarchy consisting of three broad levels that prioritize the inputs to valuation techniques giving the highest priority to readily available unadjusted quoted prices in active markets for identical assets or liabilities (Level 1 measurements) and the lowest priority to unobservable inputs (Level 3 measurements) when market prices are not readily available or reliable. The categorization of a value determined for an investment within the hierarchy is based upon the pricing transparency of the investment and is not necessarily an indication of the risk associated with investing in it.
The three levels of the fair value hierarchy are as follows:
• Level 1 – Unadjusted quoted prices in active markets for an identical asset or liability;
• Level 2 – Inputs other than quoted prices included within Level 1 that are observable for the asset or liability either directly or indirectly, including quoted prices for similar assets or liabilities in active markets, quoted prices for identical or similar assets or liabilities in markets that are not considered to be active, inputs other than quoted prices that are observable for the asset or liability (such as exchange rates, financing terms, interest rates, yield curves, volatilities, prepayment speeds, loss severities, credit risks and default rates) or other market-corroborated inputs; and
• Level 3 – Unobservable inputs for the asset or liability, including the Committee’s assumptions used in determining the fair value of investments.
The value of the Portfolio’s investments according to the fair value hierarchy as of December 31, 2018 is disclosed in the Portfolio’s Schedule of Investments.
Investment Transactions and Income Recognition
Investment transactions are accounted for on trade date for financial reporting purposes. Realized gains and losses from the sale or disposition of investments are determined using the identified cost method. Dividend income and capital gain distributions, if any, are recognized on the ex-dividend date, or when the information becomes available, net of any foreign taxes withheld at source, if any. Interest income is recorded daily on an accrual basis. Non-cash dividends received in the form of stock are recorded as dividend income at fair value.
Distributions received by the Portfolio may include a return of capital that is estimated by management. Such amounts are recorded as a reduction of the cost of investments or reclassified to capital gains.
All of the net investment income and realized and unrealized gains and losses from the security transactions of the Portfolio are allocated pro rata among the partners in the Portfolio on a daily basis based on each partner’s daily ownership percentage.
Expenses
Certain expenses, which are directly identifiable to a specific Portfolio, are applied to that Portfolio within the Trust. Other expenses which cannot be attributed to a specific Portfolio are allocated in such a manner as deemed equitable, taking into consideration the nature and type of expense and the relative net assets of the Portfolio within the Trust.
Foreign Taxes
The Portfolio may be subject to foreign taxes (a portion of which may be reclaimable) on income, stock dividends, realized and unrealized capital gains on investments or certain foreign currency transactions. Foreign taxes are recorded in accordance with SSGA Funds Management, Inc.’s (the “Adviser” or “SSGA FM”) understanding of the applicable foreign tax regulations and rates that exist in the foreign jurisdictions in which the Portfolio invests. These foreign taxes, if any, are paid by the
STATE STREET EQUITY 500 INDEX PORTFOLIO
NOTES TO FINANCIAL STATEMENTS (continued)
December 31, 2018
Portfolio and are reflected in the Statement of Operations, if applicable. Foreign taxes payable or deferred as of December 31, 2018, if any, are disclosed in the Portfolio’s Statement of Assets and Liabilities.
3. Derivative Financial Instruments
Futures Contracts
The Portfolio may enter into futures contracts to meet its objectives. A futures contract is a standardized, exchange-traded agreement to buy or sell a financial instrument at a set price on a future date. Upon entering into a futures contract, the Portfolio is required to deposit with the broker, cash or securities in an amount equal to the minimum initial margin requirements of the clearing house. Subsequent payments are made or received by the Portfolio equal to the daily change in the contract value, accumulated, exchange rates, and or other transactional fees. The accumulation of those payments are recorded as variation margin receivable or payable with a corresponding offset to unrealized gains or losses. The Portfolio recognizes a realized gain or loss when the contract is closed.
Losses may arise if the value of a futures contract decreases due to unfavorable changes in the market rates or values of the underlying instrument during the term of the contract or if the counterparty does not perform under the contract. The use of futures contracts also involves the risk that the movements in the price of the futures contracts do not correlate with the movement of the assets underlying such contracts.
For the period ended December 31, 2018, the Portfolio entered into futures contracts for cash equitization, to reduce tracking error and to facilitate daily liquidity.
The following tables summarize the value of the Portfolio's derivative instruments as of December 31, 2018, and the related location in the accompanying Statement of Assets and Liabilities and Statement of Operations, presented by primary underlying risk exposure:
| | Liability Derivatives |
| | Interest Rate
Contracts
Risk | | Foreign
Exchange
Contracts
Risk | | Credit
Contracts
Risk | | Equity
Contracts
Risk | | Commodity
Contracts
Risk | | Total |
| State Street Equity 500 Index Portfolio | | | | | | | | | | | |
Futures Contracts
| $— | | $— | | $— | | $(1,213,915) | | $— | | $(1,213,915) |
| | Net Realized Gain (Loss) |
| | Interest Rate
Contracts
Risk | | Foreign
Exchange
Contracts
Risk | | Credit
Contracts
Risk | | Equity
Contracts
Risk | | Commodity
Contracts
Risk | | Total |
| State Street Equity 500 Index Portfolio | | | | | | | | | | | |
Futures Contracts
| $— | | $— | | $— | | $(826,985) | | $— | | $(826,985) |
| | Net Change in Unrealized Appreciation (Depreciation) |
| | Interest Rate
Contracts
Risk | | Foreign
Exchange
Contracts
Risk | | Credit
Contracts
Risk | | Equity
Contracts
Risk | | Commodity
Contracts
Risk | | Total |
| State Street Equity 500 Index Portfolio | | | | | | | | | | | |
Futures Contracts
| $— | | $— | | $— | | $(1,704,289) | | $— | | $(1,704,289) |
STATE STREET EQUITY 500 INDEX PORTFOLIO
NOTES TO FINANCIAL STATEMENTS (continued)
December 31, 2018
4. Fees and Transactions with Affiliates
Advisory, Administrator, Custodian, Sub-Administrator and Transfer Agent Fees
The Portfolio has entered into an Investment Advisory Agreement with SSGA FM. The Adviser is a wholly-owned subsidiary of State Street Global Advisors, Inc., which itself is a wholly-owned subsidiary of State Street Corporation ("State Street"). As compensation for the Adviser’s services to the Portfolio as investment adviser and administrator and State Street’s services to the Portfolio as sub-administrator, custodian and transfer agent (and for assuming ordinary operating expenses of the Portfolio, including ordinary legal and audit expenses), the Portfolio is obligated to pay a fee for the services in the amount of 0.045% of average daily net assets on an annual basis, accrued daily and paid monthly.
Other Transactions with Affiliates - Securities Lending
State Street, an affiliate of the Portfolio, acts as the securities lending agent for the Portfolio, pursuant to an amended and restated securities lending authorization agreement dated January 6, 2017, as amended December 7, 2018.
Proceeds collected by State Street on investment of cash collateral or any fee income are allocated as follows (after deduction of such other amounts payable to State Street under the terms of the securities lending agreement): 85% payable to the Portfolio, and 15% payable to State Street.
In addition, cash collateral from lending activities is invested in the State Street Navigator Securities Lending Portfolio II, an affiliated money market fund, for which SSGA FM serves as investment adviser. See Note 8 for additional information regarding securities lending.
Other Transactions with Affiliates
The Portfolio may invest in affiliated entities, including securities issued by State Street Corporation, affiliated funds, or entities deemed to be affiliates as a result of the Portfolio owning more than five percent of the entity’s voting securities or outstanding shares. Amounts relating to these transactions during the period ended December 31, 2018, are disclosed in the Schedule of Investments.
5. Trustees’ Fees
The fees and expenses of the Trust’s trustees, who are not “interested persons” of the Trust, as defined in the 1940 Act (“Independent Trustees”), are paid directly by the Portfolio. The Independent Trustees are reimbursed for travel and other out-of-pocket expenses in connection with meeting attendance and industry seminars.
6. Investment Transactions
Purchases and sales of investments (excluding in-kind transactions and short term investments) for the period ended December 31, 2018, were as follows:
| | Purchases | | Sales |
State Street Equity 500 Index Portfolio
| $54,027,233 | | $218,883,200 |
7. Income Tax Information
The Portfolio is not required to pay federal income taxes on its net investment income and net capital gains because it is treated as a partnership for federal income tax purposes. All interest, gains and losses of the Portfolio are deemed to have been “passed through” to the Portfolio’s partners in proportion to their holdings in the Portfolio, regardless of whether such items have been distributed by the Portfolio. Each partner is responsible for its tax liability based on its distributive share; therefore, no provision has been made for federal income taxes.
STATE STREET EQUITY 500 INDEX PORTFOLIO
NOTES TO FINANCIAL STATEMENTS (continued)
December 31, 2018
The Portfolio files federal and various state and local tax returns as required. No income tax returns are currently under examination. Generally, the federal returns are subject to examination by the Internal Revenue Service for a period of three years from date of filing, while the state returns may remain open for an additional year depending upon jurisdiction. SSGA FM has analyzed the Portfolio’s tax positions taken on tax returns for all open years and does not believe there are any uncertain tax positions that would require recognition of a tax liability.
As of December 31, 2018, gross unrealized appreciation and gross unrealized depreciation of investments and other financial instruments based on cost for federal income tax purposes were as follows:
| | Tax
Cost | | Gross
Unrealized
Appreciation | | Gross
Unrealized
Depreciation | | Net Unrealized
Appreciation
(Depreciation) |
State Street Equity 500 Index Portfolio
| $536,713,731 | | $916,094,259 | | $77,801,762 | | $838,292,497 |
8. Securities Lending
The Portfolio may lend securities to qualified broker-dealers or institutional investors. The loans are secured at all times by cash, cash equivalents or U.S. government securities in an amount at least equal to the market value of the securities loaned, plus accrued interest and dividends, determined on a daily basis and adjusted accordingly. The value of the collateral with respect to a loaned security may be temporarily more or less than the value of a security due to market fluctuations of securities values. With respect to each loan, if on any U.S. business day the aggregate market value of securities collateral plus cash collateral is less than the aggregate market value of the securities which are subject to the loan, the borrower will be notified to provide additional collateral on the next business day.
The Portfolio will regain record ownership of loaned securities to exercise certain beneficial rights; however, the Portfolio may bear the risk of delay in recovery of, or even loss of rights in the securities loaned should the borrower fail financially. In addition, the Portfolio will bear the risk of loss of any cash collateral that it may invest. The Portfolio receives compensation for lending its securities from interest or dividends earned on the cash, cash equivalents or U.S. government securities held as collateral, net of fee rebates paid to the borrower and net of fees paid to State Street as the lending agent. Additionally, the Portfolio will receive a fee from the borrower for non-cash collateral equal to a percentage of the market value of the loaned securities.
The market value of securities on loan as of December 31, 2018, and the value of the invested cash collateral are disclosed in the Portfolio's Statement of Assets and Liabilities. Non-cash collateral is not disclosed in the Portfolio's Statement of Assets and Liabilities as it is held by the lending agent on behalf of the Portfolio, and the Portfolio does not have the ability to re-hypothecate those securities. Securities lending income, as disclosed in the Portfolio's Statement of Operations, represents the income earned from the non-cash collateral and the investment of cash collateral, net of fee rebates paid to the borrower and net of fees paid to State Street as lending agent.
The following is a summary of the Portfolio’s securities lending agreements and related cash and non-cash collateral received as of December 31, 2018:
| Fund | | Market Value of
Securities on Loan | | Cash
Collateral
Received | | Non-Cash
Collateral
Received* | | Total
Collateral
Received |
State Street Equity 500 Index Portfolio
| | $ 14,346,572 | | $ 2,502,193 | | $ 12,033,927 | | $ 14,536,120 |
| * | The non-cash collateral includes U.S. Treasuries and U.S. Government Agency securities. |
STATE STREET EQUITY 500 INDEX PORTFOLIO
NOTES TO FINANCIAL STATEMENTS (continued)
December 31, 2018
The following table reflects a breakdown of transactions accounted for as secured borrowings, the gross obligation by the type of collateral pledged or securities loaned, and the remaining contractual maturity of those transactions as of December 31, 2018:
| | | | | Remaining Contractual Maturity of the Agreements
As of December 31, 2018 |
| Fund | | Securities
Lending
Transactions | | Overnight
and
Continuous | | <30 Days | | Between
30 & 90
Days | | >90 Days | | Total
Borrowings | | Gross Amount
of Recognized
Liabilities for
Securities Lending Transactions |
State Street Equity 500 Index Portfolio
| | Common Stocks | | $2,502,193 | | $— | | $— | | $— | | $2,502,193 | | $2,502,193 |
9. Line of Credit
The Portfolio and other affiliated funds (each a “Participant” and, collectively, the “Participants”) participate in a $500 million revolving credit facility provided by a syndication of banks under which the Participants may borrow to fund shareholder redemptions. This agreement expires in October 2019 unless extended or renewed.
The Participants are charged an annual commitment fee which is calculated based on the unused portion of the shared credit line. Commitment fees are allocated among each of the Participants based on relative net assets. Commitment fees are ordinary fund operating expenses. A Participant incurs and pays the interest expense related to its borrowing. Interest is calculated at a rate per annum equal to the sum of 1% plus the greater of the New York Fed Bank Rate and 1-month LIBOR rate.
The Portfolio had no outstanding loans as of December 31, 2018.
10. Risks
Concentration Risk
As a result of the Portfolio's ability to invest a large percentage of its assets in obligations of issuers within the same country, state, region, currency or economic sector, an adverse economic, business or political development may affect the value of the Portfolio's investments more than if the Fund were more broadly diversified.
Market and Credit Risk
In the normal course of business, the Portfolio trades financial instruments and enters into transactions where risk of potential loss exists due to changes in the general economic conditions and fluctuations of the market (market risk). Additionally, the Portfolio may also be exposed to credit risk in the event that an issuer or guarantor fails to perform or that an institution or entity with which the Portfolio has unsettled or open transactions defaults.
11. New Accounting Pronouncements
In August 2018, the U.S. Securities and Exchange Commission (the “SEC”) released its Final Rule on Disclosure Update and Simplification (the “Final Rule”) which is intended to simplify an issuer’s disclosure compliance efforts by removing redundant or outdated disclosure requirements without significantly altering the mix of information provided to investors. The Portfolio has adopted the Final Rule for the current period.
12. Subsequent Events
Management has evaluated the impact of all subsequent events on the Portfolio through the date the financial statements were issued and has determined that there were no subsequent events requiring adjustment or disclosure in the financial statements.
STATE STREET MASTER FUNDS
STATE STREET EQUITY 500 INDEX PORTFOLIO
REPORT OF INDEPENDENT REGISTERED PUBLIC ACCOUNTING FIRM
To the Owners of Beneficial Interest and Board of Trustees of State Street Equity 500 Index Portfolio
Opinion on the Financial Statements
We have audited the accompanying statement of assets and liabilities of State Street Equity 500 Index Portfolio (the “Portfolio”) (one of the portfolios constituting State Street Master Funds (the “Trust”)), including the schedule of investments, as of December 31, 2018, and the related statement of operations for the year then ended, the statement of changes in net assets for each of the two years in the period then ended, the financial highlights for each of the five years in the period then ended and the related notes (collectively referred to as the “financial statements”). In our opinion, the financial statements present fairly, in all material respects, the financial position of the Portfolio (one of the portfolios constituting State Street Master Funds) at December 31, 2018, the results of its operations for the year then ended, the changes in its net assets for each of the two years in the period then ended and its financial highlights for each of the five years in the period then ended, in conformity with U.S. generally accepted accounting principles.
Basis for Opinion
These financial statements are the responsibility of the Trust’s management. Our responsibility is to express an opinion on the Portfolio’s financial statements based on our audits. We are a public accounting firm registered with the Public Company Accounting Oversight Board (United States) (“PCAOB”) and are required to be independent with respect to the Fund in accordance with the U.S. federal securities laws and the applicable rules and regulations of the Securities and Exchange Commission and the PCAOB.
We conducted our audits in accordance with the standards of the PCAOB. Those standards require that we plan and perform the audit to obtain reasonable assurance about whether the financial statements are free of material misstatement, whether due to error or fraud. The Trust is not required to have, nor were we engaged to perform, an audit of the Trust’s internal control over financial reporting. As part of our audits, we are required to obtain an understanding of internal control over financial reporting, but not for the purpose of expressing an opinion on the effectiveness of the Trust’s internal control over financials reporting. Accordingly, we express no such opinion.
Our audits included performing procedures to assess the risks of material misstatement of the financial statements, whether due to error or fraud, and performing procedures that respond to those risks. Such procedures included examining, on a test basis, evidence regarding the amounts and disclosures in the financial statements. Our procedures included confirmation of securities owned as of December 31, 2018, by correspondence with the custodian, brokers and others or by other appropriate auditing procedures where replies from brokers and others were not received. Our audits also included evaluating the accounting principles used and significant estimates made by management, as well as evaluating the overall presentation of the financial statements. We believe that our audits provide a reasonable basis for our opinion.
We have served as the auditor of one or more State Street Global Advisors investment companies since 2000.
Boston, Massachusetts
February 27, 2019
STATE STREET MASTER FUNDS
STATE STREET EQUITY 500 INDEX PORTFOLIO
OTHER INFORMATION
December 31, 2018 (Unaudited)
Expense Example
As a shareholder of the Portfolio, you incur two types of costs: (1) transaction costs, including sales charges (loads), if applicable, on purchase payments, reinvested dividends, or other distributions and (2) ongoing costs, including advisory fees and to the the extent applicable, distribution(12b-1) and/or service fees; and other Portfolio expenses. This example is intended to help you understand your ongoing costs (in dollars) of investing in the Portfolio and to compare these costs with the ongoing costs of investing in other mutual funds. It is based on an investment of $1,000 made at the beginning of the period shown and held for the entire period from July 1, 2018 to December 31, 2018.
The table below illustrates your Portfolio's cost in two ways:
Based on actual fund return ——This section helps you to estimate the actual expenses that you paid over the period. The “Ending Account Value” shown is derived from each Portfolio's actual return, and the third column shows the dollar amount that would have been paid by an investor who started with $1,000 in the Portfolio. You may use the information here, together with the amount you invested, to estimate the expenses that you paid over the period. To do so, simply divide your account value by $1,000 (for example, an $8,600 account value divided by $1,000 = 8.6), then multiply the result by the number given for the Portfolio under the heading “Expenses Paid During Period”.
Based on hypothetical 5% return ——This section is intended to help you compare your Portfolio's costs with those of other mutual funds. It assumes that the Portfolio had a yearly return of 5% before expenses, but that the expense ratio is unchanged. In this case, because the return used is not the Portfolio's actual return, the results do not apply to your investment. The example is useful in making comparisons because the SEC requires all mutual funds to calculate expenses based on a 5% return. You can assess your Portfolio's costs by comparing this hypothetical example with the hypothetical examples that appear in shareholder reports of other funds.
Please note that the expenses shown in the table are meant to highlight your ongoing costs only and do not reflect any transaction costs, such as sales load charges (loads). Therefore, the hypothetical 5% return section of the table is useful in comparing ongoing costs only, and will not help you determine the relative total costs of owning different funds. In addition, if these transaction costs were included, your costs would have been higher.
STATE STREET MASTER FUNDS
STATE STREET EQUITY 500 INDEX PORTFOLIO
OTHER INFORMATION (continued)
December 31, 2018 (Unaudited)
| | | | Actual | | Hypothetical (assuming a 5%
return before expenses) |
| | Annualized
Expense Ratio | | Ending Account
Value | | Expenses Paid
During Period(a) | | Ending Account
Value | | Expenses Paid
During Period(a) |
State Street Equity 500 Index Portfolio
| 0.05% | | $931.10 | | $0.24 | | $1,025.00 | | $0.26 |
| (a) | Hypothetical expenses are equal to the Portfolio's annualized net expense ratio multiplied by the average account value of the year multiplied by 184, then divided by 365. |
Proxy Voting Policies and Procedures and Records
The Portfolio has adopted the proxy voting policies of the Adviser. A description of the policies and procedures that the Portfolio have adopted to determine how to vote proxies relating to portfolio securities are contained in the Portfolio’s Statement of Additional Information, which is available (i) without charge, upon request, by calling the Portfolio at 1-800-997-7327 (toll free) or (ii) on the SEC’s website atwww.sec.gov. Information regarding how the Portfolio voted proxies, if any, during the most recent 12-month period ended June 30 is available by August 31 of each year without charge (1) by calling 1-800-997-7327 (toll free), or (2) on the website of the SEC atwww.sec.gov.
Quarterly Portfolio Schedule
The Portfolio will file its complete schedule of investments with the SEC for the first and third quarters of each fiscal year on Form N-Q. The Portfolio’s Form N-Q is available (i) without charge, upon request, by calling the Portfolio at 1-800-997-7327 (toll free) or (ii) on the SEC’s website atwww.sec.gov.
Special Meeting of Shareholders — Voting Results
A special meeting of shareholders of State Street Master Funds (the “Trust”) was held on December 18, 2018 to elect the following four nominees as Trustees of the Trust: Michael A. Jessee, Ellen M. Needham, Donna M. Rapaccioli and John R. Costantino. At the meeting the following votes were recorded:
| Nominee | Shares For | Shares Withheld |
| Michael A. Jessee | 70,681,020,370.077 | 7,661,214,196.910 |
| Ellen M. Needham | 77,884,129,343.272 | 458,105,223.715 |
| Donna M. Rapaccioli | 78,036,680,506.030 | 305,554,060.957 |
| John R. Costantino | 78,035,382,515.554 | 306,852,051.433 |
| The other Trustees whose term of office continued after the meeting are as follows: James E. Ross, Michael F. Holland, Patrick J. Riley, Richard D. Shirk, Bruce D. Taber and Rina K. Spence. |
STATE STREET MASTER FUNDS
STATE STREET EQUITY 500 INDEX PORTFOLIO
OTHER INFORMATION (continued)
December 31, 2018 (Unaudited)
TRUSTEES AND OFFICERS INFORMATION
Name, Address
and Year of Birth | | Position(s) Held with Trust | | Term of
Office and
Length of
Time Served | | Principal Occupation During the Past Five Years and Relevant Experience | | Number of Funds in Fund Complex Overseen by Trustee† | | Other
Directorships
Held by Trustee
During the
Past Five Years |
| Trustees | | | | | | | | | | |
| Independent Trustees | | | | | | | | | | |
Michael F. Holland
c/o SSGA Funds
Management, Inc.
One Iron Street
Boston, MA 02210
YOB: 1944 | | Trustee and
Co-
Chairperson
of the Board | | Term: Indefinite
Elected: 7/99 | | Chairman, Holland & Company L.L.C. (investment adviser) (1995- present). | | 67 | | Director, the Holland Series Fund, Inc.; Director, The China Fund, Inc.; Director, The Taiwan Fund, Inc. (2007-2017); Director, Reaves Utility Income Fund, Inc.; and Director, Blackstone/GSO Loans (and Real Estate) Funds. |
Patrick J. Riley
c/o SSGA Funds
Management, Inc.
One Iron Street
Boston, MA 02210
YOB: 1948 | | Trustee and
Co-
Chairperson
of the Board | | Term: Indefinite
Elected: 1/14 | | 2002 to May 2010, Associate Justice of the Superior Court, Commonwealth of Massachusetts; 1985 to 2002, Partner, Riley, Burke & Donahue, L.L.P. (law firm); 1998 to Present, Independent Director, State Street Global Advisers Ireland, Ltd. (investment company); 1998 to Present, Independent Director, SSGA Liquidity plc (formerly, SSGA Cash Management Fund plc); January 2009 to Present, Independent Director, SSGA Fixed Income plc; and January 2009 to Present, Independent Director, SSGA Qualified Funds PLC. | | 67 | | Board Director and Chairman, SPDR Europe 1PLC Board (2011-Present); Board Director and Chairman, SPDR Europe II, PLC (2013- Present). |
John R. Costantino
c/o SSGA Funds
Management, Inc.
One Iron Street
Boston, MA 02210
YOB: 1946 | | Trustee and
Co-
Chairperson
of the Qualified
Legal and
Compliance Committee | | Term: Indefinite
Elected: 12/18 | | General Partner, NGN Capital LLC (2006 – present); and Managing Director, Vice President of Walden Capital Management (1996 – present). | | 67 | | Trustee of Neuroscience Research Institute (1986 – present); Trustee of Fordham University (1989 – 1995 and 2001 – 2007) and Trustee Emeritus (2007 – present); Trustee of GE Funds (1993 – February 2011); Director of Artes Medical (2006 – 2008); and Trustee of Gregorian University Foundation (1992 – 2007). |
Richard D. Shirk
c/o SSGA Funds
Management, Inc.
One Iron Street
Boston, MA 02210
YOB: 1945 | | Trustee and
Co-
Chairperson
of the Qualified
Legal and
Compliance Committee | | Term: Indefinite
Elected: 1/14 | | March 2001 to April 2002, Chairman (1996 to March 2001, President and Chief Executive Officer), Cerulean Companies, Inc. (holding company) (Retired); 1992 to March 2001, President and Chief Executive Officer, Blue Cross Blue Shield of Georgia (health insurer, managed healthcare). | | 67 | | 1998 to December 2008, Chairman, Board Member and December 2008 to Present, Investment Committee Member, Healthcare Georgia Foundation (private foundation); September 2002 to 2012, Lead Director and Board Member, Amerigroup Corp. (managed health care); 1999 to 2013, Board Member and (since 2001) Investment Committee Member, Woodruff Arts Center; and 2003 to 2009, Trustee, Gettysburg College; Board member, Aerocare Holdings, Regenesis Biomedical Inc. |
Rina K. Spence
c/o SSGA Funds
Management, Inc.
One Iron Street
Boston, MA 02210
YOB: 1948 | | Trustee and Co-
Chairperson of the Audit Committee,
Co-Chairperson of the Nominating Committee and
Co-
Chairperson of the Governance Committee | | Term: Indefinite
Elected: 7/99 | | President of SpenceCare International LLC (international healthcare consulting) (1999 – present); Chief Executive Officer, IEmily.com (health internet company) (2000 – 2001); Chief Executive Officer of Consensus Pharmaceutical, Inc. (1998 – 1999); Founder, President and Chief Executive Officer of Spence Center for Women’s Health (1994 – 1998); President and CEO, Emerson Hospital (1984 – 1994); Honorary Consul for Monaco in Boston (2015 – present). | | 67 | | |
STATE STREET MASTER FUNDS
STATE STREET EQUITY 500 INDEX PORTFOLIO
OTHER INFORMATION (continued)
December 31, 2018 (Unaudited)
Name, Address
and Year of Birth | | Position(s) Held with Trust | | Term of
Office and
Length of
Time Served | | Principal Occupation During the Past Five Years and Relevant Experience | | Number of Funds in Fund Complex Overseen by Trustee† | | Other
Directorships
Held by Trustee
During the
Past Five Years |
Bruce D. Taber
c/o SSGA Funds
Management, Inc.
One Iron Street
Boston, MA 02210
YOB: 1943 | | Trustee and Co-
Chairperson of the Valuation Committee, Co-
Chairperson of the Nominating Committee and Co
-Chairperson of the Governance Committee | | Term: Indefinite
Elected: 1/14 | | Retired; 1999 to 2016, Partner, Zenergy LLC (a technology company providing Computer Modeling and System Analysis to the General Electric Power Generation Division); Until December 2008, Independent Director, SSGA Cash Management Fund plc; Until December 2008, Independent Director, State Street Global Advisers Ireland, Ltd. (investment companies). | | 49 | | None. |
Michael A. Jessee
c/o SSGA Funds
Management, Inc.
One Iron Street
Boston, MA 02210
YOB: 1946 | | Trustee and Co-
Chairperson
of the Valuation Committee | | Term: Indefinite
Appointed: 7/16 | | Retired; formerly, President and Chief Executive Officer of the Federal Home Loan Bank of Boston (1989 – 2009); Trustee, Randolph-Macon College (2004-2016). | | 67 | | None. |
Donna M. Rapaccioli
c/o SSGA Funds
Management, Inc.
One Iron Street
Boston, MA 02210
YOB: 1962 | | Trustee and Co-
Chairperson
of the Audit Committee | | Term: Indefinite
Elected: 12/18 | | Dean of the Gabelli School of Business (2007 – present) and Accounting Professor (1987 – present) at Fordham University. | | 67 | | Director- Graduate Management Admissions Council (2015 - present); Trustee of Emmanuel College (2010 – present). |
| Interested Trustees(1) | | | | | | | | | | |
James E. Ross(2)
SSGA Funds Management, Inc.
One Iron Street
Boston, MA 02210
YOB: 1965 | | Trustee | | Term: Indefinite
Appointed: 2/07 | | Chairman and Director, SSGA Funds Management, Inc. (2005-present); Executive Vice President, State Street Global Advisors (2012-present); Chief Executive Officer and Director, State Street Global Advisors Funds Distributors, LLC (May 2017 – present); Director, State Street Global Markets, LLC (2013 - April 2017); President, SSGA Funds Management, Inc. (2005 – 2012), Principal, State Street Global Advisors (2000-2005). | | 185 | | SSGA SPDR ETFs Europe I plc (Director) (November 2016 – present); SSGA SPDR ETFs Europe II plc (Director) (November 2016 – present). |
Ellen M. Needham(3)
SSGA Funds Management, Inc.
One Iron Street
Boston, MA 02210
YOB: 1967 | | Trustee and President | | Term: Indefinite
Elected 12/18 | | President and Director, SSGA FM (2001 – present)*; Senior Managing Director, State Street Global Advisors (1992 – present)*; Director, State Street Global Advisors Funds Distributors, LLC (May 2017 – present).* | | 67 | | None. |
| † For the purpose of determining the number of portfolios overseen by the Trustees, “Fund Complex” comprises registered investment companies for which SSGA Funds Management, Inc. serves as investment adviser. |
| (1) The individuals listed below are Trustees who are “interested persons,” as defined in the 1940 Act, of the Trusts (“Interested Trustees”). |
| (2) Mr. Ross is an Interested Trustee because of his employment by SSGA Funds Management, Inc., an affiliate of the Trust. |
| (3) Ms. Needham is an Interested Trustee because of her employment by SSGA Funds Management, Inc., an affiliate of the Trust. |
| * Served in various capacities and/or with various affiliated entities during noted time period. |
| The following lists the principal officers for the Trust, as well as their mailing addresses and ages, positions with the Trust and length of time served, and present and principal occupations: |
STATE STREET MASTER FUNDS
STATE STREET EQUITY 500 INDEX PORTFOLIO
OTHER INFORMATION (continued)
December 31, 2018 (Unaudited)
Name, Address
and Year of Birth | | Position(s) Held with Trust | | Term of
Office and
Length of
Time Served | | Principal Occupation(s) During the Past 5 Years |
| Officers | | | | | | |
ELLEN M. NEEDHAM
SSGA Funds Management, Inc.
One Iron Street
Boston, MA 02210
YOB: 1967 | | President, Trustee | | Term: Indefinite
Elected: 10/12 | | President and Director, SSGA Funds Management, Inc. (2001 - present)*; Senior Managing Director, State Street Global Advisors (1992 - present); Director, State Street Global Advisors Funds Distributors, LLC (May 2017 - present).* |
BRUCE S. ROSENBERG
SSGA Funds Management, Inc.
One Iron Street
Boston, MA 02210
YOB: 1961 | | Treasurer | | Term: Indefinite
Elected: 2/16 | | Managing Director, State Street Global Advisors and SSGA Funds Management, Inc. (July 2015 - present); Director, Credit Suisse (April 2008 - July 2015). |
ANN M. CARPENTER
SSGA Funds Management, Inc.
One Iron Street
Boston, MA 02210
YOB: 1966 | | Vice
President
and Deputy
Treasurer | | Term: Indefinite
Elected: 10/12
Term: Indefinite
Elected: 2/16 | | Chief Operating Officer, SSGA Funds Management, Inc. (2005 - Present)*; Managing Director, State Street Global Advisors (2005 - present).* |
CHAD C. HALLETT
SSGA Funds Management, Inc.
One Iron Street
Boston, MA 02210
YOB: 1969 | | Deputy Treasurer | | Term: Indefinite
Elected: 2/16 | | Vice President, State Street Global Advisors and SSGA Funds Management, Inc. (November 2014 – present); Vice President, State Street Bank and Trust Company (2001 –November 2014).* |
DARLENE ANDERSON-VASQUEZ
SSGA Funds Management, Inc.
One Iron Street
Boston, MA 02210
YOB: 1968 | | Deputy Treasurer | | Term: Indefinite
Elected: 11/16 | | Managing Director, State Street Global Advisors and SSGA Funds Management, Inc. (May 2016 – present); Senior Vice President, John Hancock Investments (September 2007 – May 2016). |
ARTHUR A. JENSEN
SSGA Funds Management, Inc.
1600 Summer Street
Stamford, CT 06905
YOB: 1966 | | Deputy Treasurer | | Term: Indefinite
Elected: 11/16 | | Vice President at State Street Global Advisors (July 2016 – present); Deputy Treasurer of Elfun Funds (July 2016 – present); Treasurer of State Street Institutional Funds, State Street Variable Insurance Series Funds, Inc. and GE Retirement Savings Plan Funds (June 2011 – present); Treasurer of Elfun Funds (June 2011– July 2016); Mutual Funds Controller of GE Asset Management Incorporated (April 2011 – July 2016). |
SUJATA UPRETI
SSGA Funds Management, Inc.
One Iron Street
Boston, MA 02210
YOB: 1974 | | Assistant
Treasurer | | Term: Indefinite
Elected: 2/16 | | Vice President, State Street Global Advisors and SSGA Funds Management, Inc. (May 2015 – present); Assistant Director, Cambridge Associates, LLC (July 2014 – January 2015); Vice President, Bank of New York Mellon (July 2012 – August 2013); Manager, PricewaterhouseCoopers, LLP (September 2003 – July 2012). |
DANIEL FOLEY
SSGA Funds Management, Inc.
One Iron Street
Boston, MA 02210
YOB: 1972 | | Assistant
Treasurer | | Term: Indefinite
Elected: 2/16 | | Vice President, State Street Global Advisors and SSGA Funds Management, Inc. (April 2007 – present).* |
DANIEL G. PLOURDE
SSGA Funds Management, Inc.
One Iron Street
Boston, MA 02210
YOB: 1980 | | Assistant
Treasurer | | Term: Indefinite
Elected: 5/17 | | Vice President, State Street Global Advisors and SSGA Funds Management, Inc. (May 2015 – present); Officer, State Street Bank and Trust Company (March 2009 – May 2015). |
BRIAN HARRIS
SSGA Funds Management, Inc.
One Iron Street
Boston, MA 02210
YOB: 1973 | | Chief Compliance Officer, Anti-Money Laundering Officer and Code of Ethics Compliance Officer | | Term: Indefinite
Elected: 11/13
Term: Indefinite
Elected: 9/16 | | Managing Director, State Street Global Advisors and SSGA Funds Management, Inc. (2013—Present); Senior Vice President and Global Head of Investment Compliance, BofA Global Capital Management (September 2010 – May 2013). |
STATE STREET MASTER FUNDS
STATE STREET EQUITY 500 INDEX PORTFOLIO
OTHER INFORMATION (continued)
December 31, 2018 (Unaudited)
Name, Address
and Year of Birth | | Position(s) Held with Trust | | Term of
Office and
Length of
Time Served | | Principal Occupation(s) During the Past 5 Years |
JOSHUA A. WEINBERG
SSGA Funds Management, Inc.
One Iron Street
Boston, MA 02210
YOB: 1978 | | Chief Legal Officer | | Term: Indefinite
Elected: 2/15 | | Managing Director and Managing Counsel, State Street Global Advisors (2011 – present)*; Clerk, SSGA Funds Management, Inc. (2013 – present); Associate, Financial Services Group, Dechert LLP (2005 – 2011). |
JESSE D. HALLEE
State Street Bank and Trust Company
100 Summer Street,
7th Floor
Boston, MA 02111-2900
YOB: 1976 | | Secretary | | Term: Indefinite
Elected: 9/16 | | Vice President and Managing Counsel, State Street Bank and Trust Company (2013 – present); Vice President and Counsel, Brown Brothers Harriman & Co. (2007-2013). |
KHIMMARA GREER
State Street Bank and Trust Company
100 Summer Street,
7th Floor
Boston, MA 02111-2900
YOB: 1983 | | Assistant Secretary | | Term: Indefinite
Elected: 5/16 | | Vice President and Counsel, State Street Bank and Trust Company (2015- present); Regulatory Advisor, JPMorgan (2014 – 2015); Claims Case Manager, Liberty Mutual Insurance (2012 – 2014); Contract Attorney, Various Law Firms (2011 – 2012). |
| * Served in various capacities and/or with various affiliated entities during noted time period. |
| Statement of Additional Information (SAI) includes additional information about Fund's directors and is available, without charge, upon request and by calling 1-800-997-7327. |
Trustees
John R. Costantino
Michael F. Holland
Michael A. Jessee
Ellen M. Needham
Donna M. Rapaccioli
Patrick J. Riley
James E. Ross
Richard D. Shirk
Rina K. Spence
Bruce D. Taber
Investment Adviser and Administrator
SSGA Funds Management, Inc.
One Iron Street
Boston, MA 02210
Custodian, Sub-Administrator and Transfer Agent
State Street Bank and Trust Company
State Street Financial Center
One Lincoln Street
Boston, MA 02111
Independent Registered Public Accounting Firm
Ernst & Young LLP
200 Clarendon Street
Boston, MA 02116
Legal Counsel
Ropes & Gray LLP
800 Boylston Street
Boston, MA 02199
This report is for shareholder information. This is not a prospectus intended for use in the purchase or sale of shares of beneficial interest.
State Street Equity 500 Index Portfolio
State Street Bank and Trust Company
P.O. Box 5049
Boston, MA 02206
The information contained in this report is intended for the general information of shareholders of the Portfolio and shareholders of any fund invested in the Portfolio. Interests in the Portfolio are offered solely to eligible investors in private placement transactions that do not involve any “public offering” within the meaning of Section 4(a)(2) of the 1933 Act. This report is not authorized for distribution (i) to prospective investors in any fund invested in the Portfolio unless preceded or accompanied by a current offering document for such fund or (ii) to prospective eligible investors in the Portfolio unless preceded or accompanied by a current offering document of the Portfolio. Eligible investors in the Portfolio may obtain a current Portfolio offering document by calling 1-800-997-7327. Please read the offering document carefully before investing in the Portfolio.
Annual Report
December 31, 2018
State Street Master Funds
| State Street Money Market Portfolio |
The information contained in this report is intended for the general information of shareholders of the Portfolio and shareholders of any fund invested in the Portfolio. Interests in the Portfolio are offered solely to eligible investors in private placement transactions that do not involve any “public offering” within the meaning of Section 4(a)(2) of the 1933 Act. This report is not authorized for distribution (i) to prospective investors in any fund invested in the Portfolio unless preceded or accompanied by a current offering document for such fund or (ii) to prospective eligible investors in the Portfolio unless preceded or accompanied by a current offering document of the Portfolio. Eligible investors in the Portfolio may obtain a current Portfolio offering document by calling 1-877-521-4083. Please read the offering document carefully before investing in the Portfolio.
TABLE OF CONTENTS
The information contained in this report is intended for the general information of shareholders of the Portfolio and shareholders of any fund invested in the Portfolio. Interests in the Portfolio are offered solely to eligible investors in private placement transactions that do not involve any “public offering” within the meaning of Section 4(a)(2) of the 1933 Act. This report is not authorized for distribution (i) to prospective investors in any fund invested in the Portfolio unless preceded or accompanied by a current offering document for such fund or (ii) to prospective eligible investors in the Portfolio unless preceded or accompanied by a current offering document of the Portfolio. Eligible investors in the Portfolio may obtain a current Portfolio offering document by calling 1-877-521-4083. Please read the offering document carefully before investing in the Portfolio.
State Street Money Market Portfolio
PORTFOLIO STATISTICS (UNAUDITED)
Portfolio Composition as of December 31, 2018
| | | |
| | | % of Net Assets | |
| | Certificates of Deposit | 38.9% | |
| | Financial Company Commercial Paper | 22.2 | |
| | Other Notes | 16.5 | |
| | Other Repurchase Agreements | 7.9 | |
| | Asset Backed Commercial Paper | 6.2 | |
| | Treasury Repurchase Agreements | 4.3 | |
| | Government Agency Repurchase Agreements | 3.8 | |
| | Other Assets in Excess of Liabilities | 0.2 | |
| | TOTAL | 100.0% | |
(The composition is expressed as a percentage of net assets as of the date indicated. The composition will vary over time.)
Maturity Ladder as of December 31, 2018
| | | | |
| | | % of Net Assets | |
| | 2 to 30 Days | 53.8% | |
| | 31 to 60 Days | 10.5 | |
| | 61 to 90 Days | 7.7 | |
| | Over 90 Days | 27.8 | |
| | Total | 99.8% | |
| | Average days to maturity | 18 | |
| | Weighted average life | 63 | |
(The maturity ladder is expressed as a percentage of net assets as of the date indicated. The composition will vary over time.)
See accompanying notes to financial statements.
1
STATE STREET MASTER FUNDS
STATE STREET MONEY MARKET PORTFOLIO
SCHEDULE OF INVESTMENTS
December 31, 2018
| Name of Issuer and Title of Issue | | Interest Rate | | Next Rate Reset Date | | Maturity Date | | Principal Amount | | Value |
| ASSET BACKED COMMERCIAL PAPER—6.2% | | | | | | | | | | |
Antalis SA(a)
| | 2.480% | | 01/02/2019 | | 01/02/2019 | | $42,390,000 | | $42,384,204 |
Antalis SA(a)
| | 2.480% | | 01/03/2019 | | 01/03/2019 | | 97,050,000 | | 97,030,064 |
Antalis SA(a)
| | 2.480% | | 01/07/2019 | | 01/07/2019 | | 50,000,000 | | 49,975,889 |
Atlantic Asset Securitization LLC(a)
| | 2.420% | | 01/02/2019 | | 01/02/2019 | | 100,000,000 | | 99,986,328 |
Barton Capital SA(a)
| | 2.420% | | 01/02/2019 | | 01/02/2019 | | 81,000,000 | | 80,989,654 |
Bennington Stark Capital Corp. LLC(a)
| | 2.450% | | 01/07/2019 | | 01/07/2019 | | 30,000,000 | | 29,985,242 |
Kells Funding LLC(a)
| | 2.590% | | 04/05/2019 | | 04/05/2019 | | 110,000,000 | | 109,164,000 |
Versailles Commercial Paper LLC(a)
| | 2.360% | | 01/02/2019 | | 01/02/2019 | | 75,000,000 | | 74,989,746 |
Versailles Commercial Paper LLC(a)
| | 2.360% | | 01/03/2019 | | 01/03/2019 | | 65,000,000 | | 64,986,648 |
Victory Receivables Corp.(a)
| | 2.420% | | 01/10/2019 | | 01/10/2019 | | 50,000,000 | | 49,964,653 |
TOTAL ASSET BACKED COMMERCIAL PAPER
| | | | | | | | | | 699,456,428 |
| CERTIFICATES OF DEPOSIT—38.9% | | | | | | | | | | |
Bank of Montreal, 1 Month USD LIBOR + 0.28%(b)
| | 2.627% | | 01/04/2019 | | 03/04/2019 | | 125,000,000 | | 125,041,306 |
Bank of Montreal, 3 Month USD LIBOR + 0.22%(b)
| | 2.986% | | 03/11/2019 | | 12/09/2019 | | 150,000,000 | | 149,998,950 |
Bank of Nova Scotia, 3 Month USD LIBOR + 0.20%(b)
| | 2.614% | | 01/10/2019 | | 04/10/2019 | | 74,500,000 | | 74,515,784 |
Canadian Imperial Bank of Commerce, 1 Month USD LIBOR + 0.33%(b)
| | 2.762% | | 01/14/2019 | | 08/13/2019 | | 125,000,000 | | 125,002,603 |
Canadian Imperial Bank of Commerce, 3 Month USD LIBOR + 0.11%(b)
| | 2.559% | | 01/18/2019 | | 01/18/2019 | | 135,000,000 | | 135,004,038 |
Canadian Imperial Bank of Commerce, 3 Month USD LIBOR + 0.32%(b)
| | 2.728% | | 01/07/2019 | | 07/05/2019 | | 80,000,000 | | 80,068,283 |
Cooperatieve Rabobank UA, 1 Month USD LIBOR + 0.22%(b)
| | 2.620% | | 01/11/2019 | | 02/11/2019 | | 80,000,000 | | 80,015,721 |
Credit Agricole Corporate and Investment Bank(a)
| | 2.560% | | 02/04/2019 | | 02/04/2019 | | 150,000,000 | | 150,002,134 |
Credit Industriel et Commercial, 1 Month USD LIBOR + 0.14%(b)
| | 2.662% | | 01/31/2019 | | 01/31/2019 | | 100,000,000 | | 100,015,473 |
Credit Industriel et Commercial, 1 Month USD LIBOR + 0.32%(b)
| | 2.752% | | 01/14/2019 | | 06/13/2019 | | 139,000,000 | | 138,981,630 |
Credit Suisse, 3 Month USD LIBOR + 0.17%(b)
| | 2.615% | | 01/18/2019 | | 01/18/2019 | | 75,000,000 | | 75,003,178 |
ING Bank NV(a)
| | 2.880% | | 06/07/2019 | | 06/07/2019 | | 125,000,000 | | 125,000,000 |
KBC Bank NV(a)
| | 2.400% | | 01/03/2019 | | 01/03/2019 | | 327,000,000 | | 326,999,624 |
Lloyds Bank Corporate Markets PLC, 3 Month USD LIBOR + 0.18%(b)
| | 2.630% | | 01/22/2019 | | 07/19/2019 | | 150,000,000 | | 149,966,860 |
Mizuho Bank Ltd.(a)
| | 2.520% | | 01/22/2019 | | 01/22/2019 | | 150,000,000 | | 150,001,765 |
MUFG Bank Ltd.(a)
| | 2.650% | | 02/22/2019 | | 02/22/2019 | | 60,000,000 | | 60,001,098 |
MUFG Bank Ltd.(a)
| | 2.650% | | 02/25/2019 | | 02/25/2019 | | 125,000,000 | | 125,000,313 |
Nordea Bank AB, 1 Month USD LIBOR + 0.14%(b)
| | 2.519% | | 01/07/2019 | | 04/05/2019 | | 150,000,000 | | 149,986,165 |
Nordea Bank AB, 1 Month USD LIBOR + 0.22%(b)
| | 2.607% | | 01/08/2019 | | 02/08/2019 | | 100,000,000 | | 100,019,460 |
Nordea Bank AB, 3 Month USD LIBOR + 0.06%(b)
| | 2.873% | | 03/27/2019 | | 03/27/2019 | | 60,000,000 | | 59,995,655 |
Oversea-Chinese Banking Corp. Ltd.(a)
| | 2.430% | | 01/03/2019 | | 01/03/2019 | | 100,000,000 | | 100,000,036 |
Royal Bank of Canada, 3 Month USD LIBOR + 0.08%(b)
| | 2.478% | | 01/02/2019 | | 04/02/2019 | | 150,000,000 | | 149,988,868 |
Royal Bank of Canada, 3 Month USD LIBOR + 0.17%(b)
| | 2.578% | | 01/04/2019 | | 01/04/2019 | | 77,000,000 | | 77,000,254 |
Royal Bank of Canada, 3 Month USD LIBOR + 0.17%(b)
| | 2.620% | | 01/22/2019 | | 04/18/2019 | | 100,000,000 | | 100,016,963 |
Skandinaviska Enskilda Banken AB, 3 Month USD LIBOR + 0.13%(b)
| | 2.901% | | 03/11/2019 | | 09/11/2019 | | 140,000,000 | | 140,000,000 |
Societe Generale(a)
| | 2.500% | | 01/15/2019 | | 01/15/2019 | | 150,000,000 | | 150,001,698 |
Sumitomo Mitsui Banking Corp.(a)
| | 2.770% | | 03/08/2019 | | 03/08/2019 | | 75,000,000 | | 75,018,487 |
Sumitomo Mitsui Banking Corp., 1 Month USD LIBOR + 0.20%(b)
| | 2.545% | | 01/02/2019 | | 04/02/2019 | | 135,000,000 | | 135,010,379 |
Sumitomo Mitsui Banking Corp., 1 Month USD LIBOR + 0.22%(b)
| | 2.599% | | 01/07/2019 | | 02/05/2019 | | 49,000,000 | | 49,009,574 |
Sumitomo Mitsui Banking Corp., 3 Month USD LIBOR + 0.15%(b)
| | 2.595% | | 01/17/2019 | | 04/17/2019 | | 150,000,000 | | 149,995,147 |
Sumitomo Mitsui Trust Bank(a)
| | 2.810% | | 03/19/2019 | | 03/19/2019 | | 125,000,000 | | 125,008,658 |
Sumitomo Mitsui Trust Bank, 1 Month USD LIBOR + 0.18%(b)
| | 2.560% | | 01/07/2019 | | 02/06/2019 | | 115,000,000 | | 115,017,684 |
Svenska Handelsbanken AB, 1 Month USD LIBOR + 0.15%(b)
| | 2.656% | | 01/28/2019 | | 03/28/2019 | | 50,000,000 | | 50,000,536 |
Svenska Handelsbanken AB, 3 Month USD LIBOR + 0.19%(b)
| | 2.604% | | 01/10/2019 | | 04/10/2019 | | 84,000,000 | | 84,020,046 |
See accompanying notes to financial statements.
2
STATE STREET MASTER FUNDS
STATE STREET MONEY MARKET PORTFOLIO
SCHEDULE OF INVESTMENTS (continued)
December 31, 2018
| Name of Issuer and Title of Issue | | Interest Rate | | Next Rate Reset Date | | Maturity Date | | Principal Amount | | Value |
Svenska Handelsbanken AB, 3 Month USD LIBOR + 0.21%(b)
| | 3.014% | | 03/19/2019 | | 12/19/2019 | | $127,000,000 | | $126,999,501 |
Toronto-Dominion Bank, 1 Month USD LIBOR + 0.33%(b)
| | 2.679% | | 01/02/2019 | | 08/02/2019 | | 100,000,000 | | 99,999,980 |
Wells Fargo Bank NA, 1 Month USD LIBOR + 0.25%(b)
| | 2.629% | | 01/07/2019 | | 02/01/2019 | | 150,000,000 | | 150,031,216 |
TOTAL CERTIFICATES OF DEPOSIT
| | | | | | | | | | 4,357,739,067 |
| FINANCIAL COMPANY COMMERCIAL PAPER—22.2% | | | | | | | | | | |
Commonwealth Bank of Australia, 3 Month USD LIBOR + 0.10%(b)
| | 2.729% | | 02/18/2019 | | 05/16/2019 | | 87,000,000 | | 86,983,457 |
Commonwealth Bank of Australia, 3 Month USD LIBOR + 0.10%(b)
| | 2.745% | | 02/20/2019 | | 05/20/2019 | | 75,000,000 | | 74,985,212 |
CPPIB Capital, Inc.(a)
| | 2.350% | | 01/08/2019 | | 01/08/2019 | | 58,000,000 | | 57,969,363 |
DBS Bank Ltd.(a)
| | 2.460% | | 02/04/2019 | | 02/04/2019 | | 48,000,000 | | 47,876,333 |
DnB Bank ASA(a)
| | 2.400% | | 01/17/2019 | | 01/17/2019 | | 150,000,000 | | 149,830,355 |
DZ Bank AG Deutsche Zentral-Genossenschaftsbank(a)
| | 2.350% | | 01/02/2019 | | 01/02/2019 | | 150,000,000 | | 149,980,566 |
HSBC Bank PLC, 1 Month USD LIBOR + 0.30%(b)
| | 2.804% | | 01/22/2019 | | 07/22/2019 | | 100,000,000 | | 99,991,389 |
HSBC Bank PLC, 3 Month USD LIBOR + 0.16%(b)
| | 2.574% | | 01/10/2019 | | 01/10/2019 | | 149,000,000 | | 149,003,189 |
National Australia Bank Ltd., 1 Month USD LIBOR + 0.22%(b)
| | 2.569% | | 01/02/2019 | | 08/01/2019 | | 56,000,000 | | 55,968,340 |
NRW Bank(a)
| | 2.500% | | 01/04/2019 | | 01/04/2019 | | 150,000,000 | | 149,958,750 |
Oversea-Chinese Banking Corp. Ltd.(a)
| | 2.800% | | 03/26/2019 | | 03/26/2019 | | 105,000,000 | | 104,310,048 |
Oversea-Chinese Banking Corp. Ltd., 1 Month USD LIBOR + 0.15%(b)
| | 2.529% | | 01/07/2019 | | 03/05/2019 | | 150,000,000 | | 150,001,225 |
Oversea-Chinese Banking Corp. Ltd., 1 Month USD LIBOR + 0.15%(b)
| | 2.629% | | 01/21/2019 | | 02/21/2019 | | 75,000,000 | | 75,003,186 |
Sumitomo Mitsui Trust Bank(a)
| | 2.550% | | 01/17/2019 | | 01/17/2019 | | 125,000,000 | | 124,852,608 |
Toronto-Dominion Bank, 1 Month USD LIBOR + 0.25%(b)
| | 2.754% | | 01/22/2019 | | 01/22/2019 | | 125,000,000 | | 125,021,436 |
Toronto-Dominion Bank, 1 Month USD LIBOR + 0.37%(b)
| | 2.753% | | 01/07/2019 | | 11/07/2019 | | 125,000,000 | | 125,017,950 |
Toyota Credit Canada, Inc., 3 Month USD LIBOR + 0.07%(b)
| | 2.821% | | 03/05/2019 | | 05/22/2019 | | 50,000,000 | | 49,995,811 |
Toyota Credit Canada, Inc., 3 Month USD LIBOR + 0.07%(b)
| | 2.821% | | 03/05/2019 | | 05/29/2019 | | 79,000,000 | | 78,993,311 |
Toyota Motor Credit Corp., 1 Month USD LIBOR + 0.23%(b)
| | 2.579% | | 01/02/2019 | | 04/29/2019 | | 129,000,000 | | 129,000,170 |
UBS AG, 1 Month USD LIBOR + 0.33%(b)
| | 2.730% | | 01/11/2019 | | 06/11/2019 | | 99,000,000 | | 99,000,000 |
Westpac Banking Corp., 1 Month USD LIBOR + 0.18%(b)
| | 2.916% | | 02/27/2019 | | 11/27/2019 | | 75,000,000 | | 74,999,646 |
Westpac Banking Corp., 1 Month USD LIBOR + 0.23%(b)
| | 2.613% | | 01/07/2019 | | 01/07/2019 | | 75,000,000 | | 75,002,609 |
Westpac Banking Corp., 3 Month USD LIBOR + 0.07%(b)
| | 2.688% | | 02/11/2019 | | 08/12/2019 | | 50,000,000 | | 49,978,519 |
Westpac Banking Corp., 3 Month USD LIBOR + 0.07%(b)
| | 2.699% | | 02/18/2019 | | 08/16/2019 | | 72,500,000 | | 72,467,980 |
Westpac Banking Corp., 3 Month USD LIBOR + 0.13%(b)
| | 2.575% | | 01/18/2019 | | 01/18/2019 | | 125,000,000 | | 125,006,339 |
TOTAL FINANCIAL COMPANY COMMERCIAL PAPER
| | | | | | | | | | 2,481,197,792 |
| OTHER NOTES—16.5% | | | | | | | | | | |
Australia & New Zealand Banking Group Ltd.(a)
| | 2.400% | | 01/02/2019 | | 01/02/2019 | | 350,000,000 | | 350,000,000 |
Bank of America NA, 1 Month USD LIBOR + 0.16%(b)
| | 2.560% | | 01/11/2019 | | 02/11/2019 | | 90,000,000 | | 89,999,953 |
Bank of America NA, 1 Month USD LIBOR + 0.16%(b)
| | 2.630% | | 01/21/2019 | | 02/19/2019 | | 37,000,000 | | 36,999,969 |
Bank of America NA, 1 Month USD LIBOR + 0.24%(b)
| | 2.623% | | 01/07/2019 | | 01/07/2019 | | 50,000,000 | | 50,000,470 |
Bank of Nova Scotia(a)
| | 2.400% | | 01/02/2019 | | 01/02/2019 | | 200,000,000 | | 200,000,000 |
China Construction Bank(a)
| | 2.390% | | 01/02/2019 | | 01/02/2019 | | 150,000,000 | | 150,000,000 |
Citibank NA(a)
| | 2.400% | | 01/02/2019 | | 01/02/2019 | | 100,000,000 | | 100,000,000 |
Lloyds Bank Corporate Markets PLC(a)
| | 2.400% | | 01/02/2019 | | 01/02/2019 | | 150,000,000 | | 150,000,000 |
Lloyds Bank PLC(a)
| | 2.400% | | 01/02/2019 | | 01/02/2019 | | 100,000,000 | | 100,000,000 |
Mizuho Bank Ltd.(a)
| | 2.420% | | 01/02/2019 | | 01/02/2019 | | 145,299,000 | | 145,299,000 |
Mizuho Bank Ltd.(a)
| | 2.450% | | 01/02/2019 | | 01/02/2019 | | 150,000,000 | | 150,000,000 |
National Bank of Canada(a)
| | 2.420% | | 01/02/2019 | | 01/02/2019 | | 200,000,000 | | 200,000,000 |
Royal Bank of Canada(a)
| | 2.430% | | 01/02/2019 | | 01/02/2019 | | 125,000,000 | | 125,000,000 |
TOTAL OTHER NOTES
| | | | | | | | | | 1,847,299,392 |
See accompanying notes to financial statements.
3
STATE STREET MASTER FUNDS
STATE STREET MONEY MARKET PORTFOLIO
SCHEDULE OF INVESTMENTS (continued)
December 31, 2018
| Name of Issuer and Title of Issue | | Interest Rate | | Next Rate Reset Date | | Maturity Date | | Principal Amount | | Value |
| GOVERNMENT AGENCY REPURCHASE AGREEMENTS—3.8% | | | | | | | | | | |
Agreement with Bank of America and Bank of New York Mellon (Tri-Party), dated 12/31/2018 (collateralized by a Government National Mortgage Association, 5.000% due 11/20/2048, valued at $51,000,001); expected proceeds $50,008,333
| | 3.000% | | 01/02/2019 | | 01/02/2019 | | $50,000,000 | | $50,000,000 |
Agreement with Bank of Nova Scotia and Bank of New York Mellon (Tri-Party), dated 12/31/2018 (collateralized by Federal Home Loan Mortgage Corporations, 3.000% – 4.500% due 09/01/2026 – 12/01/2048, Federal National Mortgage Associations, 2.742% – 4.500% due 08/01/2039 – 10/01/2048, and Government National Mortgage Associations, 4.000% – 5.000% due 12/20/2045 – 11/20/2048, valued at $224,437,026); expected proceeds $220,036,300
| | 2.970% | | 01/02/2019 | | 01/02/2019 | | 220,000,000 | | 220,000,000 |
Agreement with JP Morgan Securities, Inc. and Bank of New York Mellon (Tri-Party), dated 12/31/2018 (collateralized by a Federal Home Loan Mortgage Corporation, 6.000% due 10/01/2037, a Federal Home Loan Mortgage Corporation Strip, 5.000% due 12/01/2034, and Federal National Mortgage Associations, 2.382% – 5.500% due 04/01/2021 – 09/01/2048, valued at $153,000,000); expected proceeds $150,025,000
| | 3.000% | | 01/02/2019 | | 01/02/2019 | | 150,000,000 | | 150,000,000 |
TOTAL GOVERNMENT AGENCY REPURCHASE AGREEMENTS
| | | | | | | | | | 420,000,000 |
| TREASURY REPURCHASE AGREEMENTS—4.3% | | | | | | | | | | |
Agreement with Bank of America and Bank of New York Mellon (Tri-Party), dated 12/31/2018 (collateralized by a U.S. Treasury Inflation Index Note, 1.875% due 07/15/2019, a U.S. Treasury Note, 1.750% due 05/15/2023, and U.S. Treasury Strips, 0.000% due 02/15/2039, valued at $312,834,172); expected proceeds $306,750,265
| | 2.950% | | 01/02/2019 | | 01/02/2019 | | 306,700,000 | | 306,700,000 |
Agreement with Citigroup Global Markets, Inc. and Bank of New York Mellon (Tri-Party), dated 12/31/2018 (collateralized by a U.S. Treasury Bond, 6.500% due 11/15/2026, and U.S. Treasury Notes, 2.250% – 2.625% due 11/15/2020 – 08/15/2027, valued at $51,000,064); expected proceeds $50,007,056
| | 2.540% | | 01/02/2019 | | 01/02/2019 | | 50,000,000 | | 50,000,000 |
Agreement with JP Morgan Securities, Inc. and Bank of New York Mellon (Tri-Party), dated 12/31/2018 (collateralized by U.S. Treasury Bonds, 3.000% – 5.250% due 02/15/2029 – 11/15/2044, valued at $127,500,073); expected proceeds $125,020,486
| | 2.950% | | 01/02/2019 | | 01/02/2019 | | 125,000,000 | | 125,000,000 |
TOTAL TREASURY REPURCHASE AGREEMENTS
| | | | | | | | | | 481,700,000 |
| OTHER REPURCHASE AGREEMENTS—7.9% | | | | | | | | | | |
Agreement with Bank of America and Bank of New York Mellon (Tri-Party), dated 12/28/2018 (collateralized by various Corporate Bonds, 2.030% – 3.963% due 12/15/2027 – 06/12/2051, valued at $89,250,001); expected proceeds $85,614,125(c)
| | 2.890% | | 01/01/2019 | | 03/28/2019 | | 85,000,000 | | 85,000,000 |
Agreement with Bank of Nova Scotia and Bank of New York Mellon (Tri-Party), dated 12/31/2018 (collateralized by various Corporate Bonds, 1.900% – 5.875% due 12/06/2019 – 06/15/2049, valued at $106,660,182); expected proceeds $100,014,111
| | 2.540% | | 01/02/2019 | | 01/02/2019 | | 100,000,000 | | 100,000,000 |
Agreement with BNP Paribas Securities Corp. and Bank of New York Mellon (Tri-Party), dated 10/25/2018 (collateralized by various Common Stocks, valued at $190,657,874); expected proceeds $176,264,375(c)
| | 2.890% | | 01/01/2019 | | 01/23/2019 | | 175,000,000 | | 175,000,000 |
See accompanying notes to financial statements.
4
STATE STREET MASTER FUNDS
STATE STREET MONEY MARKET PORTFOLIO
SCHEDULE OF INVESTMENTS (continued)
December 31, 2018
| Name of Issuer and Title of Issue | | Interest Rate | | Next Rate Reset Date | | Maturity Date | | Principal Amount | | Value |
Agreement with BNP Paribas Securities Corp. and Bank of New York Mellon (Tri-Party), dated 12/31/2018 (collateralized by various Common Stocks, valued at $303,204,455); expected proceeds $280,039,511
| | 2.540% | | 01/02/2019 | | 01/02/2019 | | $280,000,000 | | $280,000,000 |
Agreement with Citigroup Global Markets, Inc. and Bank of New York Mellon (Tri-Party), dated 12/07/2018 (collateralized by various Corporate Bonds, 0.000% – 12.250% due 03/18/2019 – 01/01/2999, valued at $113,419,302); expected proceeds $100,747,500(c)
| | 2.990% | | 01/01/2019 | | 03/07/2019 | | 100,000,000 | | 100,000,000 |
Agreement with UBS Securities LLC and Bank of New York Mellon (Tri-Party), dated 12/24/2018 (collateralized by various Corporate Bonds, 3.625% – 8.000% due 09/15/2020 – 05/09/2047, valued at $55,953,320); expected proceeds $50,051,197
| | 2.633% | | 01/07/2019 | | 01/07/2019 | | 50,000,000 | | 50,000,000 |
Agreement with Wells Fargo Bank and Bank of New York Mellon (Tri-Party), dated 12/31/2018 (collateralized by various Commercial Papers, 0.000% due 01/28/2019 – 06/05/2019, valued at $104,670,448); expected proceeds $100,049,583
| | 2.550% | | 01/07/2019 | | 01/07/2019 | | 100,000,000 | | 100,000,000 |
TOTAL OTHER REPURCHASE AGREEMENTS
| | | | | | | | | | 890,000,000 |
TOTAL INVESTMENTS –99.8%(d)
(Cost $11,177,526,925)
| | | | | | | | | | 11,177,392,679 |
Other Assets in Excess of Liabilities —0.2%
| | | | | | | | | | 18,991,988 |
NET ASSETS –100.0%
| | | | | | | | | | $11,196,384,667 |
| (a) | Rate represents annualized yield at date of purchase. |
| (b) | Variable Rate Security - Interest rate shown is rate in effect at December 31, 2018. For securities based on a published reference rate and spread, the reference rate and spread are indicated in the description above. |
| (c) | Illiquid security. These securities represent $360,000,000 or 3.2% of net assets as of December 31, 2018. |
| (d) | Also represents the cost for federal tax purposes. |
The following table summarizes the value of thePortfolio's investments according to the fair value hierarchy as of December 31, 2018.
| Description | | Level 1 –
Quoted Prices | | Level 2 –
Other Significant
Observable Inputs | | Level 3 –
Significant
Unobservable Inputs | | Total |
| Assets: | | | | | | | | |
| Investments: | | | | | | | | |
Asset Backed Commercial Paper
| | $— | | $699,456,428 | | $— | | $699,456,428 |
Certificates of Deposit
| | — | | 4,357,739,067 | | — | | 4,357,739,067 |
Financial Company Commercial Paper
| | — | | 2,481,197,792 | | — | | 2,481,197,792 |
Other Notes
| | — | | 1,847,299,392 | | — | | 1,847,299,392 |
Government Agency Repurchase Agreements
| | — | | 420,000,000 | | — | | 420,000,000 |
Treasury Repurchase Agreements
| | — | | 481,700,000 | | — | | 481,700,000 |
Other Repurchase Agreements
| | — | | 890,000,000 | | — | | 890,000,000 |
Total Investments
| | $— | | $11,177,392,679 | | $— | | $11,177,392,679 |
See accompanying notes to financial statements.
5
STATE STREET MASTER FUNDS
STATE STREET MONEY MARKET PORTFOLIO
STATEMENT OF ASSETS AND LIABILITIES
December 31, 2018
| ASSETS | |
Investments in unaffiliated issuers, at value
| $9,385,692,679 |
Repurchase agreements, at value
| 1,791,700,000 |
Total Investments
| 11,177,392,679 |
Cash
| 739 |
Interest receivable — unaffiliated issuers
| 19,685,488 |
Prepaid expenses and other assets
| 2,977 |
TOTAL ASSETS
| 11,197,081,883 |
| LIABILITIES | |
Advisory and administrator fee payable
| 474,019 |
Custody, sub-administration and transfer agent fees payable
| 145,704 |
Professional fees payable
| 42,493 |
Printing fees payable
| 9,541 |
Accrued expenses and other liabilities
| 25,459 |
TOTAL LIABILITIES
| 697,216 |
NET ASSETS
| $11,196,384,667 |
| COST OF INVESTMENTS: | |
Investments in unaffiliated issuers
| $9,385,826,925 |
Repurchase agreements
| 1,791,700,000 |
Total cost of investments
| $11,177,526,925 |
See accompanying notes to financial statements.
6
STATE STREET MASTER FUNDS
STATE STREET MONEY MARKET PORTFOLIO
STATEMENT OF OPERATIONS
For the Year Ended December 31, 2018
| INVESTMENT INCOME | |
Interest income — unaffiliated issuers
| $255,662,969 |
| EXPENSES | |
Advisory and administrator fee
| 6,048,347 |
Custodian, sub-administrator and transfer agent fees
| 1,544,693 |
Trustees’ fees and expenses
| 101,159 |
Professional fees and expenses
| 158,052 |
Insurance expense
| 39,729 |
Miscellaneous expenses
| 56,617 |
TOTAL EXPENSES
| 7,948,597 |
NET INVESTMENT INCOME (LOSS)
| $247,714,372 |
| REALIZED AND UNREALIZED GAIN (LOSS) | |
| Net realized gain (loss) on: | |
Investments — unaffiliated issuers
| 99,189 |
| Net change in unrealized appreciation/depreciation on: | |
Investments — unaffiliated issuers
| 11,343 |
NET REALIZED AND UNREALIZED GAIN (LOSS)
| 110,532 |
NET INCREASE (DECREASE) IN NET ASSETS FROM OPERATIONS
| $247,824,904 |
See accompanying notes to financial statements.
7
STATE STREET MASTER FUNDS
STATE STREET MONEY MARKET PORTFOLIO
STATEMENTS OF CHANGES IN NET ASSETS
| | Year Ended
12/31/18 | | Year Ended
12/31/17 |
| INCREASE (DECREASE) IN NET ASSETS FROM OPERATIONS: | | | |
Net investment income (loss)
| $247,714,372 | | $108,558,844 |
Net realized gain (loss)
| 99,189 | | (63,091) |
Net change in unrealized appreciation/depreciation
| 11,343 | | (946,240) |
Net increase (decrease) in net assets resulting from operations
| 247,824,904 | | 107,549,513 |
| CAPITAL TRANSACTIONS | | | |
Contributions
| 38,864,723,746 | | 26,478,211,141 |
Withdrawals
| (37,857,969,929) | | (24,916,607,332) |
Net increase (decrease) in net assets from capital transactions
| 1,006,753,817 | | 1,561,603,809 |
Net increase (decrease) in net assets during the period
| 1,254,578,721 | | 1,669,153,322 |
Net assets at beginning of period
| 9,941,805,946 | | 8,272,652,624 |
NET ASSETS AT END OF PERIOD
| $11,196,384,667 | | $9,941,805,946 |
See accompanying notes to financial statements.
8
STATE STREET MASTER FUNDS
STATE STREET MONEY MARKET PORTFOLIO
FINANCIAL HIGHLIGHTS
Selected data for a share outstanding throughout each period
| | Year
Ended
12/31/18 | | Year
Ended
12/31/17 | | Year
Ended
12/31/16 | | Year
Ended
12/31/15 | | Year
Ended
12/31/14 |
Total return (a)
| 2.06% | | 0.96% | | 0.51% | | 0.17% | | 0.13% |
| Ratios and Supplemental Data: | | | | | | | | | |
Net assets, end of period (in 000s)
| $11,196,385 | | $9,941,806 | | $8,272,653 | | $47,683,856 | | $40,704,468 |
| Ratios to average net assets: | | | | | | | | | |
Total expenses
| 0.07% | | 0.06% | | 0.07% | | 0.07% | | 0.07% |
Net investment income (loss)
| 2.05% | | 1.11% | | 0.49% | | 0.17% | | 0.13% |
| (a) | Results represent past performance and are not indicative of future results. Total return for periods of less than one year are not annualized. |
See accompanying notes to financial statements.
9
STATE STREET MASTER FUNDS
STATE STREET MONEY MARKET PORTFOLIO
NOTES TO FINANCIAL STATEMENTS
December 31, 2018
1. Organization
State Street Master Funds (the “Trust”), a Massachusetts business trust registered under the Investment Company Act of 1940, as amended (“1940 Act”), is an open-end management investment company.
As of December 31, 2018, the Trust consists of six (6) series each of which represents a separate series of beneficial interest in the Trust. The State Street Money Market Portfolio (the “Portfolio”) is authorized to issue an unlimited number of shares of beneficial interests with no par value. The financial statements herein relate only to the Portfolio.
The Portfolio operates as a floating net asset value (“NAV”) money market fund. As a floating NAV money market fund, the Portfolio (1) will utilize current market-based prices (except as otherwise generally permitted to value individual portfolio securities with remaining maturities of 60 days or less at amortized cost in accordance with Securities and Exchange Commission (“SEC”) guidance) to value its portfolio securities and transact at a floating NAV calculated to four decimal places; and (2) has adopted policies and procedures to impose liquidity fees on redemptions and/or temporary redemption gates in the event that the Portfolio’s weekly liquid assets fall below a designated threshold.
Under the Trust’s organizational documents, its officers and trustees are indemnified against certain liabilities arising out of the performance of their duties to the Trust. Additionally, in the normal course of business, the Trust enters into contracts with service providers that contain general indemnification clauses. The Trust’s maximum exposure under these arrangements is unknown as this would involve future claims that may be made against the Trust that have not yet occurred.
2. Summary of Significant Accounting Policies
The following is a summary of significant accounting policies followed by the Trust in the preparation of its financial statements:
The preparation of financial statements in accordance with U.S. generally accepted accounting principles (“U.S. GAAP”) requires management to make estimates and assumptions that affect the reported amounts and disclosures in the financial statements. Actual results could differ from those estimates. The Portfolio is an investment company under U.S. GAAP and follows the accounting and reporting guidance applicable to investment companies.
Security Valuation
The Portfolio's investments are valued at fair value each day that the New York Stock Exchange (“NYSE”) is open and, for financial reporting purposes, as of the report date should the reporting period end on a day that the NYSE is not open. Fair value is generally defined as the price a fund would receive to sell an asset or pay to transfer a liability in an orderly transaction between market participants at the measurement date. By its nature, a fair value price is a good faith estimate of the valuation in a current sale and may not reflect an actual market price. The investments of the Portfolio are valued pursuant to the policy and procedures developed by the Oversight Committee (the “Committee”) and approved by the Board. The Committee provides oversight of the valuation of investments for the Portfolio. The Board has responsibility for overseeing the determination of the fair value of investments.
Valuation techniques used to value the Portfolio's investments by major category are as follows:
• Government and municipal fixed income securities are generally valued using quotations from independent pricing services or brokers.
• Debt obligations (including short term investments) are valued using quotations from independent pricing services or brokers or are generally valued at the last reported evaluated prices.
• Repurchase agreements are valued at the repurchase price as of valuation date.
In the event prices or quotations are not readily available or that the application of these valuation methods results in a price for an investment that is deemed to be not representative of the fair value of such investment, fair value will be determined in good faith by the Committee, in accordance with the valuation policy and procedures approved by the Board.
Various inputs are used in determining the value of the Portfolio's investments.
STATE STREET MASTER FUNDS
STATE STREET MONEY MARKET PORTFOLIO
NOTES TO FINANCIAL STATEMENTS (continued)
December 31, 2018
The Portfolio values its assets and liabilities at fair value using a fair value hierarchy consisting of three broad levels that prioritize the inputs to valuation techniques giving the highest priority to readily available unadjusted quoted prices in active markets for identical assets or liabilities (Level 1 measurements) and the lowest priority to unobservable inputs (Level 3 measurements) when market prices are not readily available or reliable. The categorization of a value determined for an investment within the hierarchy is based upon the pricing transparency of the investment and is not necessarily an indication of the risk associated with investing in it.
The three levels of the fair value hierarchy are as follows:
• Level 1 – Unadjusted quoted prices in active markets for an identical asset or liability;
• Level 2 – Inputs other than quoted prices included within Level 1 that are observable for the asset or liability either directly or indirectly, including quoted prices for similar assets or liabilities in active markets, quoted prices for identical or similar assets or liabilities in markets that are not considered to be active, inputs other than quoted prices that are observable for the asset or liability (such as exchange rates, financing terms, interest rates, yield curves, volatilities, prepayment speeds, loss severities, credit risks and default rates) or other market-corroborated inputs; and
• Level 3 – Unobservable inputs for the asset or liability, including the Committee’s assumptions used in determining the fair value of investments.
Investment Transactions and Income Recognition
Investment transactions are accounted for on trade date for financial reporting purposes. Realized gains and losses from the sale or disposition of investments are determined using the identified cost method. Interest income is recorded daily on an accrual basis. All premiums and discounts are amortized/accreted for financial reporting purposes.
All of the net investment income and realized and unrealized gains and losses from the security transactions of the Portfolio are allocated pro rata among the partners in the Portfolio on a daily basis based on each partner’s daily ownership percentage.
Expenses
Certain expenses, which are directly identifiable to a specific Portfolio, are applied to that Portfolio within the Trust. Other expenses which cannot be attributed to a specific Portfolio are allocated in such a manner as deemed equitable, taking into consideration the nature and type of expense and the relative net assets of the Portfolio within the Trust.
3. Securities and Other Investments
Repurchase Agreements
The Portfolio may enter into repurchase agreements under the terms of a Master Repurchase Agreement. A repurchase agreement customarily obligates the seller at the time it sells securities to the Portfolio to repurchase the securities at a mutually agreed upon price and time. During the term of a repurchase agreement, the value of the underlying securities held as collateral on behalf of the Portfolio including accrued interest, is required to exceed the value of the repurchase agreement, including accrued interest.
The Portfolio monitors, on a daily basis, the value of the collateral to ensure it is at least equal to the Portfolio’s principal amount of the repurchase agreement (including accrued interest). The underlying securities are ordinarily United States Government or Government Agency securities, but may consist of other securities. The use of repurchase agreements involves certain risks including counterparty risks. In the event of a default by the counterparty, realization of the collateral proceeds could be delayed, during which the value of the collateral may decline.
As of December 31, 2018, the Portfolio had invested in repurchase agreements with the gross values of $1,791,700,000 and associated collateral equal to $1,883,586,918.
STATE STREET MASTER FUNDS
STATE STREET MONEY MARKET PORTFOLIO
NOTES TO FINANCIAL STATEMENTS (continued)
December 31, 2018
4. Fees and Transactions with Affiliates
Advisory and Administrator Fee
The Trust has entered into an investment advisory agreement with SSGA Funds Management, Inc. (the “Adviser” or “SSGA FM”), a subsidiary of State Street Corporation and an affiliate of State Street Bank and Trust Company (“State Street”), under which the Adviser directs the investments of the Portfolio in accordance with its investment objective, policies, and limitations. In compensation for the Adviser’s services as investment adviser, the Portfolio pays the Adviser a management fee at an annual rate of 0.05% of its average daily net assets. SSGA FM also serves as administrator.
Custodian, Sub-Administrator and Transfer Agent Fees
State Street serves as the custodian, sub-administrator and transfer agent to the Portfolio. For its services as custodian, sub-administrator and transfer agent, the Portfolio pays State Street an annual fee. The fees are accrued daily and paid monthly.
5. Trustees’ Fees
The fees and expenses of the Trust’s trustees, who are not “interested persons” of the Trust, as defined in the 1940 Act (“Independent Trustees”), are paid directly by the Portfolio. The Independent Trustees are reimbursed for travel and other out-of-pocket expenses in connection with meeting attendance and industry seminars.
6. Income Tax Information
The Portfolio is not required to pay federal income taxes on its net investment income and net capital gains because it is treated as a partnership for federal income tax purposes. All interest, gains and losses of the Portfolio are deemed to have been “passed through” to the Portfolio’s partners in proportion to their holdings in the Portfolio, regardless of whether such items have been distributed by the Portfolio. Each partner is responsible for its tax liability based on its distributive share; therefore, no provision has been made for federal income taxes.
The Portfolio files federal and various state and local tax returns as required. No income tax returns are currently under examination. Generally, the federal returns are subject to examination by the Internal Revenue Service for a period of three years from date of filing, while the state returns may remain open for an additional year depending upon jurisdiction. SSGA FM has analyzed the Portfolio’s tax positions taken on tax returns for all open years and does not believe there are any uncertain tax positions that would require recognition of a tax liability.
As of December 31, 2018, gross unrealized appreciation and gross unrealized depreciation of investments based on cost for federal income tax purposes were as follows:
| | Tax
Cost | | Gross
Unrealized
Appreciation | | Gross
Unrealized
Depreciation | | Net Unrealized
Appreciation
(Depreciation) |
State Street Money Market Portfolio
| $11,177,526,925 | | $310,526 | | $444,772 | | $(134,246) |
7. Risks
Concentration Risk
As a result of the Portfolio's ability to invest a large percentage of its assets in obligations of issuers within the same country, state, region, currency or economic sector, an adverse economic, business or political development may affect the value of the Portfolio’s investments more than if the Portfolio was more broadly diversified.
STATE STREET MASTER FUNDS
STATE STREET MONEY MARKET PORTFOLIO
NOTES TO FINANCIAL STATEMENTS (continued)
December 31, 2018
Market, Credit and Counterparty Risk
In the normal course of business, the Portfolio trades securities and enters into financial transactions where risk of potential loss exists due to changes in global economic conditions and fluctuations of the market (market risk). Additionally, the Portfolio may also be exposed to counterparty risk in the event that an issuer or guarantor fails to perform or that an institution or entity with which the Portfolio has unsettled or open transactions defaults. The value of securities held by the Portfolio may decline in response to certain events, including those directly involving the companies whose securities are owned by the Portfolio; conditions affecting the general economy; overall market changes; local, regional or global political, social or economic instability; and currency and interest rate and price fluctuations (credit risk).
Financial assets, which potentially expose the Portfolio to market, credit and counterparty risks, consist principally of investments and cash due from counterparties. The extent of the Portfolio’s exposure to market, credit and counterparty risks in respect to these financial assets approximates their value as recorded in the Portfolio’s Statement of Assets and Liabilities, less any collateral held by the Portfolio.
8. Recent Accounting Pronouncements
In March 2017, the Financial Accounting Standards Board (FASB) issued Accounting Standards Update (ASU) No. 2017-08, Receivables — Nonrefundable Fees and Other Costs (Subtopic 310-20): Premium Amortization on Purchased Callable Debt Securities. The amendments in the ASU shorten the amortization period for certain callable debt securities, held at a premium, to be amortized to the earliest call date. The ASU does not require an accounting change for securities held at a discount; which continues to be amortized to maturity. The ASU is effective for fiscal years and interim periods within those fiscal years beginning after December 15, 2018. Management is currently evaluating the impact, if any, of applying this provision.
In August 2018, the U.S. Securities and Exchange Commission (the “SEC”) released its Final Rule on Disclosure Update and Simplification (the “Final Rule”) which is intended to simplify an issuer’s disclosure compliance efforts by removing redundant or outdated disclosure requirements without significantly altering the mix of information provided to investors. The Portfolio has adopted the Final Rule for the current period.
9. Subsequent Events
Management has evaluated the impact of all subsequent events on the Portfolio through the date the financial statements were issued and has determined that there were no subsequent events requiring adjustment or disclosure in the financial statements.
STATE STREET MASTER FUNDS
STATE STREET MONEY MARKET PORTFOLIO
REPORT OF INDEPENDENT REGISTERED PUBLIC ACCOUNTING FIRM
To the Owners of Beneficial Interest and the Board of Trustees of State Street Money Market Portfolio
Opinion on the Financial Statements
We have audited the accompanying statement of assets and liabilities of State Street Money Market Portfolio (the “Portfolio”) (one of the portfolios constituting State Street Master Funds (the “Trust”)), including the schedule of investments, as of December 31, 2018, and the related statement of operations for the year then ended, the statements of changes in net assets for each of the two years in the period then ended, the financial highlights for each of the five years in the period then ended and the related notes (collectively referred to as the “financial statements”). In our opinion, the financial statements present fairly, in all material respects, the financial position of the Portfolio (one of the portfolios constituting State Street Master Funds) at December 31, 2018, the results of its operations for the year then ended, the changes in its net assets for each of the two years in the period then ended and its financial highlights for each of the five years in the period then ended, in conformity with U.S. generally accepted accounting principles.
Basis for Opinion
These financial statements are the responsibility of the Trust’s management. Our responsibility is to express an opinion on the Portfolio’s financial statements based on our audits. We are a public accounting firm registered with the Public Company Accounting Oversight Board (United States) (“PCAOB”) and are required to be independent with respect to the Trust in accordance with the U.S. federal securities laws and the applicable rules and regulations of the Securities and Exchange Commission and the PCAOB.
We conducted our audits in accordance with the standards of the PCAOB. Those standards require that we plan and perform the audit to obtain reasonable assurance about whether the financial statements are free of material misstatement, whether due to error or fraud. The Trust is not required to have, nor were we engaged to perform, an audit of the Trust’s internal control over financial reporting. As part of our audits we are required to obtain an understanding of internal control over financial reporting, but not for the purpose of expressing an opinion on the effectiveness of the Trust’s internal control over financials reporting. Accordingly, we express no such opinion.
Our audits included performing procedures to assess the risks of material misstatement of the financial statements, whether due to error or fraud, and performing procedures that respond to those risks. Such procedures included examining, on a test basis, evidence regarding the amounts and disclosures in the financial statements. Our procedures included confirmation of securities owned as of December 31, 2018, by correspondence with the custodian, brokers and others or by other appropriate auditing procedures where replies from brokers and others were not received. Our audits also included evaluating the accounting principles used and significant estimates made by management, as well as evaluating the overall presentation of the financial statements. We believe that our audits provide a reasonable basis for our opinion.
We have served as the auditor of one or more State Street Global Advisors investment companies since 2000.
Boston, Massachusetts
February 27, 2019
STATE STREET MASTER FUNDS
STATE STREET MONEY MARKET PORTFOLIO
OTHER INFORMATION
December 31, 2018 (Unaudited)
Expense Example
As a shareholder of the Portfolio, you incur two types of costs: (1) transaction costs, including sales charges (loads), if applicable, on purchase payments, reinvested dividends, or other distributions and (2) ongoing costs, including advisory fees and to the extent applicable, distribution (12b-1) and/or service fees; and other Portfolio expenses. This example is intended to help you understand your ongoing costs (in dollars) of investing in the Portfolio and to compare these costs with the ongoing costs of investing in other mutual funds. It is based on an investment of $1,000 made at the beginning of the period shown and held for the entire period from July 1, 2018 to December 31, 2018.
The table below illustrates your Portfolio’s cost in two ways:
Based on actual fund return ——This section helps you to estimate the actual expenses that you paid over the period. The “Ending Account Value” shown is derived from the Portfolio's actual return, and the third column shows the dollar amount that would have been paid by an investor who started with $1,000 in the Portfolio. You may use the information here, together with the amount you invested, to estimate the expenses that you paid over the period. To do so, simply divide your account value by $1,000 (for example, an $8,600 account value divided by $1,000 = 8.6), then multiply the result by the number given for the Portfolio under the heading “Expenses Paid During Period”.
Based on hypothetical 5% return ——This section is intended to help you compare your Portfolio’s costs with those of other mutual funds. It assumes that the Portfolio had a yearly return of 5% before expenses, but that the expense ratio is unchanged. In this case, because the return used is not the Portfolio’s actual return, the results do not apply to your investment. The example is useful in making comparisons because the SEC requires all mutual funds to calculate expenses based on a 5% return. You can assess your Portfolio’s costs by comparing this hypothetical example with the hypothetical examples that appear in shareholder reports of other funds.
Please note that the expenses shown in the table are meant to highlight your ongoing costs only and do not reflect any transaction costs, such as sales load charges (loads). Therefore, the hypothetical 5% return section of the table is useful in comparing ongoing costs only, and will not help you determine the relative total costs of owning different funds. In addition, if these transaction costs were included, your costs would have been higher.
| | | | Actual | | Hypothetical (assuming a 5%
return before expenses) |
| | Annualized
Expense Ratio | | Ending Account
Value | | Expenses Paid
During Period(a) | | Ending Account
Value | | Expenses Paid
During Period(a) |
State Street Money Market Portfolio
| 0.07% | | $1,011.30 | | $0.35 | | $1,024.90 | | $0.36 |
| (a) | Expenses are equal to the Portfolio’s annualized net expense ratio multiplied by the average account value of the period, multiplied by 184, then divided by 365. |
Proxy Voting Policies and Procedures and Records
The Portfolio has adopted the proxy voting policies of the Adviser. A description of the policies and procedures that the Portfolio has adopted to determine how to vote proxies relating to portfolio securities are contained in the Portfolio’s Statement of Additional Information, which is available (i) without charge, upon request, by calling the Portfolio at 1-877-521-4083 (toll free) or (ii) on the SEC’s website at www.sec.gov. Information regarding how the Portfolio voted proxies, if any, during the most recent 12-month period ended June 30 is available by August 31 of each year without charge (1) by calling 1-877-521-4083 (toll free), or (2) on the website of the SEC at www.sec.gov.
Quarterly Portfolio Schedule
The Portfolio will file its complete schedule of investments with the SEC for the first and third quarters of each fiscal year on Form N-Q. The Portfolio’s Form N-Q is available (i) without charge, upon request, by calling the Portfolio at 1-877-521-4083 (toll free) or (ii) on the SEC’s website at www.sec.gov.
STATE STREET MASTER FUNDS
STATE STREET MONEY MARKET PORTFOLIO
OTHER INFORMATION (continued)
December 31, 2018 (Unaudited)
Monthly Portfolio Schedule
The Portfolio files its monthly portfolio holdings with the SEC on Form N-MFP. The Portfolio’s Form N-MFP is available on the SEC’s website at www.sec.gov.
Special Meeting of Shareholders — Voting Results
A special meeting of shareholders of State Street Master Funds (the “Trust”) was held on December 18, 2018 to elect the following four nominees as Trustees of the Trust: Michael A. Jessee, Ellen M. Needham, Donna M. Rapaccioli and John R. Costantino. At the meeting the following votes were recorded:
| Nominee | Shares For | Shares Withheld |
| Michael A. Jessee | 70,681,020,370.077 | 7,661,214,196.910 |
| Ellen M. Needham | 77,884,129,343.272 | 458,105,223.715 |
| Donna M. Rapaccioli | 78,036,680,506.030 | 305,554,060.957 |
| John R. Costantino | 78,035,382,515.554 | 306,852,051.433 |
| The other Trustees whose term of office continued after the meeting are as follows: James E. Ross, Michael F. Holland, Patrick J. Riley, Richard D. Shirk, Bruce D. Taber and Rina K. Spence. |
STATE STREET MASTER FUNDS
STATE STREET MONEY MARKET PORTFOLIO
OTHER INFORMATION (continued)
December 31, 2018 (Unaudited)
TRUSTEES AND OFFICERS INFORMATION
Name, Address
and Year of Birth | | Position(s) Held with Trust | | Term of
Office and
Length of
Time Served | | Principal Occupation During the Past Five Years and Relevant Experience | | Number of Funds in Fund Complex Overseen by Trustee† | | Other
Directorships
Held by Trustee
During the
Past Five Years |
| Trustees | | | | | | | | | | |
| Independent Trustees | | | | | | | | | | |
Michael F. Holland
c/o SSGA Funds
Management, Inc.
One Iron Street
Boston, MA 02210
YOB: 1944 | | Trustee and
Co-
Chairperson
of the Board | | Term: Indefinite
Elected: 7/99 | | Chairman, Holland & Company L.L.C. (investment adviser) (1995- present). | | 67 | | Director, the Holland Series Fund, Inc.; Director, The China Fund, Inc.; Director, The Taiwan Fund, Inc. (2007-2017); Director, Reaves Utility Income Fund, Inc.; and Director, Blackstone/GSO Loans (and Real Estate) Funds. |
Patrick J. Riley
c/o SSGA Funds
Management, Inc.
One Iron Street
Boston, MA 02210
YOB: 1948 | | Trustee and
Co-
Chairperson
of the Board | | Term: Indefinite
Elected: 1/14 | | 2002 to May 2010, Associate Justice of the Superior Court, Commonwealth of Massachusetts; 1985 to 2002, Partner, Riley, Burke & Donahue, L.L.P. (law firm); 1998 to Present, Independent Director, State Street Global Advisers Ireland, Ltd. (investment company); 1998 to Present, Independent Director, SSGA Liquidity plc (formerly, SSGA Cash Management Fund plc); January 2009 to Present, Independent Director, SSGA Fixed Income plc; and January 2009 to Present, Independent Director, SSGA Qualified Funds PLC. | | 67 | | Board Director and Chairman, SPDR Europe 1PLC Board (2011-Present); Board Director and Chairman, SPDR Europe II, PLC (2013- Present). |
John R. Costantino
c/o SSGA Funds
Management, Inc.
One Iron Street
Boston, MA 02210
YOB: 1946 | | Trustee and
Co-
Chairperson
of the Qualified
Legal and
Compliance Committee | | Term: Indefinite
Elected: 12/18 | | General Partner, NGN Capital LLC (2006 – present); and Managing Director, Vice President of Walden Capital Management (1996 – present). | | 67 | | Trustee of Neuroscience Research Institute (1986 – present); Trustee of Fordham University (1989 – 1995 and 2001 – 2007) and Trustee Emeritus (2007 – present); Trustee of GE Funds (1993 – February 2011); Director of Artes Medical (2006 – 2008); and Trustee of Gregorian University Foundation (1992 – 2007). |
Richard D. Shirk
c/o SSGA Funds
Management, Inc.
One Iron Street
Boston, MA 02210
YOB: 1945 | | Trustee and
Co-
Chairperson
of the Qualified
Legal and
Compliance Committee | | Term: Indefinite
Elected: 1/14 | | March 2001 to April 2002, Chairman (1996 to March 2001, President and Chief Executive Officer), Cerulean Companies, Inc. (holding company) (Retired); 1992 to March 2001, President and Chief Executive Officer, Blue Cross Blue Shield of Georgia (health insurer, managed healthcare). | | 67 | | 1998 to December 2008, Chairman, Board Member and December 2008 to Present, Investment Committee Member, Healthcare Georgia Foundation (private foundation); September 2002 to 2012, Lead Director and Board Member, Amerigroup Corp. (managed health care); 1999 to 2013, Board Member and (since 2001) Investment Committee Member, Woodruff Arts Center; and 2003 to 2009, Trustee, Gettysburg College; Board member, Aerocare Holdings, Regenesis Biomedical Inc. |
Rina K. Spence
c/o SSGA Funds
Management, Inc.
One Iron Street
Boston, MA 02210
YOB: 1948 | | Trustee and Co-
Chairperson of the Audit Committee,
Co-Chairperson of the Nominating Committee and
Co-
Chairperson of the Governance Committee | | Term: Indefinite
Elected: 7/99 | | President of SpenceCare International LLC (international healthcare consulting) (1999 – present); Chief Executive Officer, IEmily.com (health internet company) (2000 – 2001); Chief Executive Officer of Consensus Pharmaceutical, Inc. (1998 – 1999); Founder, President and Chief Executive Officer of Spence Center for Women’s Health (1994 – 1998); President and CEO, Emerson Hospital (1984 – 1994); Honorary Consul for Monaco in Boston (2015 – present). | | 67 | | |
STATE STREET MASTER FUNDS
STATE STREET MONEY MARKET PORTFOLIO
OTHER INFORMATION (continued)
December 31, 2018 (Unaudited)
Name, Address
and Year of Birth | | Position(s) Held with Trust | | Term of
Office and
Length of
Time Served | | Principal Occupation During the Past Five Years and Relevant Experience | | Number of Funds in Fund Complex Overseen by Trustee† | | Other
Directorships
Held by Trustee
During the
Past Five Years |
Bruce D. Taber
c/o SSGA Funds
Management, Inc.
One Iron Street
Boston, MA 02210
YOB: 1943 | | Trustee and Co-
Chairperson of the Valuation Committee, Co-
Chairperson of the Nominating Committee and Co
-Chairperson of the Governance Committee | | Term: Indefinite
Elected: 1/14 | | Retired; 1999 to 2016, Partner, Zenergy LLC (a technology company providing Computer Modeling and System Analysis to the General Electric Power Generation Division); Until December 2008, Independent Director, SSGA Cash Management Fund plc; Until December 2008, Independent Director, State Street Global Advisers Ireland, Ltd. (investment companies). | | 49 | | None. |
Michael A. Jessee
c/o SSGA Funds
Management, Inc.
One Iron Street
Boston, MA 02210
YOB: 1946 | | Trustee and Co-
Chairperson
of the Valuation Committee | | Term: Indefinite
Appointed: 7/16 | | Retired; formerly, President and Chief Executive Officer of the Federal Home Loan Bank of Boston (1989 – 2009); Trustee, Randolph-Macon College (2004-2016). | | 67 | | None. |
Donna M. Rapaccioli
c/o SSGA Funds
Management, Inc.
One Iron Street
Boston, MA 02210
YOB: 1962 | | Trustee and Co-
Chairperson
of the Audit Committee | | Term: Indefinite
Elected: 12/18 | | Dean of the Gabelli School of Business (2007 – present) and Accounting Professor (1987 – present) at Fordham University. | | 67 | | Director- Graduate Management Admissions Council (2015 - present); Trustee of Emmanuel College (2010 – present). |
| Interested Trustees(1) | | | | | | | | | | |
James E. Ross(2)
SSGA Funds Management, Inc.
One Iron Street
Boston, MA 02210
YOB: 1965 | | Trustee | | Term: Indefinite
Appointed: 2/07 | | Chairman and Director, SSGA Funds Management, Inc. (2005-present); Executive Vice President, State Street Global Advisors (2012-present); Chief Executive Officer and Director, State Street Global Advisors Funds Distributors, LLC (May 2017 – present); Director, State Street Global Markets, LLC (2013 - April 2017); President, SSGA Funds Management, Inc. (2005 – 2012), Principal, State Street Global Advisors (2000-2005). | | 185 | | SSGA SPDR ETFs Europe I plc (Director) (November 2016 – present); SSGA SPDR ETFs Europe II plc (Director) (November 2016 – present). |
Ellen M. Needham(3)
SSGA Funds Management, Inc.
One Iron Street
Boston, MA 02210
YOB: 1967 | | Trustee and President | | Term: Indefinite
Elected 12/18 | | President and Director, SSGA FM (2001 – present)*; Senior Managing Director, State Street Global Advisors (1992 – present)*; Director, State Street Global Advisors Funds Distributors, LLC (May 2017 – present).* | | 67 | | None. |
| † For the purpose of determining the number of portfolios overseen by the Trustees, “Fund Complex” comprises registered investment companies for which SSGA Funds Management, Inc. serves as investment adviser. |
| (1) The individuals listed below are Trustees who are “interested persons,” as defined in the 1940 Act, of the Trusts (“Interested Trustees”). |
| (2) Mr. Ross is an Interested Trustee because of his employment by SSGA Funds Management, Inc., an affiliate of the Trust. |
| (3) Ms. Needham is an Interested Trustee because of her employment by SSGA Funds Management, Inc., an affiliate of the Trust. |
| * Served in various capacities and/or with various affiliated entities during noted time period. |
| The following lists the principal officers for the Trust, as well as their mailing addresses and ages, positions with the Trust and length of time served, and present and principal occupations: |
STATE STREET MASTER FUNDS
STATE STREET MONEY MARKET PORTFOLIO
OTHER INFORMATION (continued)
December 31, 2018 (Unaudited)
Name, Address
and Year of Birth | | Position(s) Held with Trust | | Term of
Office and
Length of
Time Served | | Principal Occupation(s) During the Past 5 Years |
| Officers | | | | | | |
ELLEN M. NEEDHAM
SSGA Funds Management, Inc.
One Iron Street
Boston, MA 02210
YOB: 1967 | | President, Trustee | | Term: Indefinite
Elected: 10/12 | | President and Director, SSGA Funds Management, Inc. (2001 - present)*; Senior Managing Director, State Street Global Advisors (1992 - present); Director, State Street Global Advisors Funds Distributors, LLC (May 2017 - present).* |
BRUCE S. ROSENBERG
SSGA Funds Management, Inc.
One Iron Street
Boston, MA 02210
YOB: 1961 | | Treasurer | | Term: Indefinite
Elected: 2/16 | | Managing Director, State Street Global Advisors and SSGA Funds Management, Inc. (July 2015 - present); Director, Credit Suisse (April 2008 - July 2015). |
ANN M. CARPENTER
SSGA Funds Management, Inc.
One Iron Street
Boston, MA 02210
YOB: 1966 | | Vice
President
and Deputy
Treasurer | | Term: Indefinite
Elected: 10/12
Term: Indefinite
Elected: 2/16 | | Chief Operating Officer, SSGA Funds Management, Inc. (2005 - Present)*; Managing Director, State Street Global Advisors (2005 - present).* |
CHAD C. HALLETT
SSGA Funds Management, Inc.
One Iron Street
Boston, MA 02210
YOB: 1969 | | Deputy Treasurer | | Term: Indefinite
Elected: 2/16 | | Vice President, State Street Global Advisors and SSGA Funds Management, Inc. (November 2014 – present); Vice President, State Street Bank and Trust Company (2001 –November 2014).* |
DARLENE ANDERSON-VASQUEZ
SSGA Funds Management, Inc.
One Iron Street
Boston, MA 02210
YOB: 1968 | | Deputy Treasurer | | Term: Indefinite
Elected: 11/16 | | Managing Director, State Street Global Advisors and SSGA Funds Management, Inc. (May 2016 – present); Senior Vice President, John Hancock Investments (September 2007 – May 2016). |
ARTHUR A. JENSEN
SSGA Funds Management, Inc.
1600 Summer Street
Stamford, CT 06905
YOB: 1966 | | Deputy Treasurer | | Term: Indefinite
Elected: 11/16 | | Vice President at State Street Global Advisors (July 2016 – present); Deputy Treasurer of Elfun Funds (July 2016 – present); Treasurer of State Street Institutional Funds, State Street Variable Insurance Series Funds, Inc. and GE Retirement Savings Plan Funds (June 2011 – present); Treasurer of Elfun Funds (June 2011– July 2016); Mutual Funds Controller of GE Asset Management Incorporated (April 2011 – July 2016). |
SUJATA UPRETI
SSGA Funds Management, Inc.
One Iron Street
Boston, MA 02210
YOB: 1974 | | Assistant
Treasurer | | Term: Indefinite
Elected: 2/16 | | Vice President, State Street Global Advisors and SSGA Funds Management, Inc. (May 2015 – present); Assistant Director, Cambridge Associates, LLC (July 2014 – January 2015); Vice President, Bank of New York Mellon (July 2012 – August 2013); Manager, PricewaterhouseCoopers, LLP (September 2003 – July 2012). |
DANIEL FOLEY
SSGA Funds Management, Inc.
One Iron Street
Boston, MA 02210
YOB: 1972 | | Assistant
Treasurer | | Term: Indefinite
Elected: 2/16 | | Vice President, State Street Global Advisors and SSGA Funds Management, Inc. (April 2007 – present).* |
DANIEL G. PLOURDE
SSGA Funds Management, Inc.
One Iron Street
Boston, MA 02210
YOB: 1980 | | Assistant
Treasurer | | Term: Indefinite
Elected: 5/17 | | Vice President, State Street Global Advisors and SSGA Funds Management, Inc. (May 2015 – present); Officer, State Street Bank and Trust Company (March 2009 – May 2015). |
BRIAN HARRIS
SSGA Funds Management, Inc.
One Iron Street
Boston, MA 02210
YOB: 1973 | | Chief Compliance Officer, Anti-Money Laundering Officer and Code of Ethics Compliance Officer | | Term: Indefinite
Elected: 11/13
Term: Indefinite
Elected: 9/16 | | Managing Director, State Street Global Advisors and SSGA Funds Management, Inc. (2013—Present); Senior Vice President and Global Head of Investment Compliance, BofA Global Capital Management (September 2010 – May 2013). |
STATE STREET MASTER FUNDS
STATE STREET MONEY MARKET PORTFOLIO
OTHER INFORMATION (continued)
December 31, 2018 (Unaudited)
Name, Address
and Year of Birth | | Position(s) Held with Trust | | Term of
Office and
Length of
Time Served | | Principal Occupation(s) During the Past 5 Years |
JOSHUA A. WEINBERG
SSGA Funds Management, Inc.
One Iron Street
Boston, MA 02210
YOB: 1978 | | Chief Legal Officer | | Term: Indefinite
Elected: 2/15 | | Managing Director and Managing Counsel, State Street Global Advisors (2011 – present)*; Clerk, SSGA Funds Management, Inc. (2013 – present); Associate, Financial Services Group, Dechert LLP (2005 – 2011). |
JESSE D. HALLEE
State Street Bank and Trust Company
100 Summer Street,
7th Floor
Boston, MA 02111-2900
YOB: 1976 | | Secretary | | Term: Indefinite
Elected: 9/16 | | Vice President and Managing Counsel, State Street Bank and Trust Company (2013 – present); Vice President and Counsel, Brown Brothers Harriman & Co. (2007-2013). |
KHIMMARA GREER
State Street Bank and Trust Company
100 Summer Street,
7th Floor
Boston, MA 02111-2900
YOB: 1983 | | Assistant Secretary | | Term: Indefinite
Elected: 5/16 | | Vice President and Counsel, State Street Bank and Trust Company (2015- present); Regulatory Advisor, JPMorgan (2014 – 2015); Claims Case Manager, Liberty Mutual Insurance (2012 – 2014); Contract Attorney, Various Law Firms (2011 – 2012). |
| * Served in various capacities and/or with various affiliated entities during noted time period. |
| Statement of Additional Information (SAI) includes additional information about Fund's directors and is available, without charge, upon request and by calling 1-877-521-4083. |
Trustees
John R. Costantino
Michael F. Holland
Michael A. Jessee
Ellen M. Needham
Donna M. Rapaccioli
Patrick J. Riley
James E. Ross
Richard D. Shirk
Rina K. Spence
Bruce D. Taber
Investment Adviser and Administrator
SSGA Funds Management, Inc.
One Iron Street
Boston, MA 02210
Custodian, Sub-Administrator and Transfer Agent
State Street Bank and Trust Company
State Street Financial Center
One Lincoln Street
Boston, MA 02111
Independent Registered Public Accounting Firm
Ernst & Young LLP
200 Clarendon Street
Boston, MA 02116
Legal Counsel
Ropes & Gray LLP
800 Boylston Street
Boston, MA 02199
This report is for shareholder information. This is not a prospectus intended for use in the purchase or sale of shares of beneficial interest.
State Street Master Funds
State Street Bank and Trust Company
P.O. Box 5049
Boston, MA 02206
STTMMAR1
The information contained in this report is intended for the general information of shareholders of the Portfolio and shareholders of any fund invested in the Portfolio. Interests in the Portfolio are offered solely to eligible investors in private placement transactions that do not involve any “public offering” within the meaning of Section 4(a)(2) of the 1933 Act. This report is not authorized for distribution (i) to prospective investors in any fund invested in the Portfolio unless preceded or accompanied by a current offering document for such fund or (ii) to prospective eligible investors in the Portfolio unless preceded or accompanied by a current offering document of the Portfolio. Eligible investors in the Portfolio may obtain a current Portfolio offering document by calling 1-877-521-4083. Please read the offering document carefully before investing in the Portfolio.
Annual Report
December 31, 2018
State Street Master Funds
| State Street U.S. Government Money Market Portfolio |
The information contained in this report is intended for the general information of shareholders of the Portfolio and shareholders of any fund invested in the Portfolio. Interests in the Portfolio are offered solely to eligible investors in private placement transactions that do not involve any “public offering” within the meaning of Section 4(a)(2) of the 1933 Act. This report is not authorized for distribution (i) to prospective investors in any fund invested in the Portfolio unless preceded or accompanied by a current offering document for such fund or (ii) to prospective eligible investors in the Portfolio unless preceded or accompanied by a current offering document of the Portfolio. Eligible investors in the Portfolio may obtain a current Portfolio offering document by calling 1-877-521-4083. Please read the offering document carefully before investing in the Portfolio.
TABLE OF CONTENTS
The information contained in this report is intended for the general information of shareholders of the Portfolio and shareholders of any fund invested in the Portfolio. Interests in the Portfolio are offered solely to eligible investors in private placement transactions that do not involve any “public offering” within the meaning of Section 4(a)(2) of the 1933 Act. This report is not authorized for distribution (i) to prospective investors in any fund invested in the Portfolio unless preceded or accompanied by a current offering document for such fund or (ii) to prospective eligible investors in the Portfolio unless preceded or accompanied by a current offering document of the Portfolio. Eligible investors in the Portfolio may obtain a current Portfolio offering document by calling 1-877-521-4083. Please read the offering document carefully before investing in the Portfolio.
State Street U.S. Government Money Market Portfolio
Portfolio Statistics (Unaudited)
Portfolio Composition as of December 31, 2018
| | | |
| | | % of Net Assets | |
| | Government Agency Debt | 51.8% | |
| | Treasury Debt | 18.1 | |
| | Treasury Repurchase Agreements | 15.2 | |
| | Government Agency Repurchase Agreements | 11.8 | |
| | Other Assets in Excess of Liabilities | 3.1 | |
| | TOTAL | 100.0% | |
(The composition is expressed as a percentage of net assets as of the date indicated. The composition will vary over time.)
Maturity Ladder as of December 31, 2018
| | | | |
| | | % of Net Assets | |
| | 2 to 30 Days | 37.3% | |
| | 31 to 60 Days | 11.9 | |
| | 61 to 90 Days | 6.8 | |
| | Over 90 Days | 40.9 | |
| | Total | 96.9% | |
| | Average days to maturity | 28 | |
| | Weighted average life | 100 | |
(The maturity ladder is expressed as a percentage of net assets as of the date indicated. The composition will vary over time.)
See accompanying notes to financial statements.
1
STATE STREET MASTER FUNDS
STATE STREET U.S. GOVERNMENT MONEY MARKET PORTFOLIO
SCHEDULE OF INVESTMENTS
December 31, 2018
| Name of Issuer and Title of Issue | | Interest Rate | | Next Rate Reset Date | | Maturity Date | | Principal Amount | | Value |
| GOVERNMENT AGENCY DEBT—51.8% | | | | | | | | | | |
Federal Farm Credit Bank, 1 Month USD LIBOR - 0.14%(a)
| | 2.205% | | 01/02/2019 | | 07/02/2019 | | $168,000,000 | | $167,995,795 |
Federal Farm Credit Bank, 1 Month USD LIBOR - 0.13%(a)
| | 2.215% | | 01/02/2019 | | 04/01/2019 | | 290,000,000 | | 289,997,839 |
Federal Farm Credit Bank(b)
| | 2.250% | | 01/30/2019 | | 01/30/2019 | | 20,000,000 | | 19,963,750 |
Federal Farm Credit Bank, 1 Month USD LIBOR - 0.13%(a)
| | 2.258% | | 01/07/2019 | | 06/07/2019 | | 184,300,000 | | 184,268,225 |
Federal Farm Credit Bank, 1 Month USD LIBOR - 0.06%(a)
| | 2.289% | | 01/03/2019 | | 12/03/2019 | | 350,000,000 | | 349,990,334 |
Federal Farm Credit Bank, 1 Month USD LIBOR - 0.15%(a)
| | 2.310% | | 01/18/2019 | | 07/18/2019 | | 136,150,000 | | 136,142,360 |
Federal Farm Credit Bank, 1 Month USD LIBOR - 0.06%(a)
| | 2.327% | | 01/10/2019 | | 12/10/2019 | | 325,000,000 | | 324,999,389 |
Federal Farm Credit Bank, 1 Month USD LIBOR - 0.11%(a)
| | 2.345% | | 01/15/2019 | | 01/15/2019 | | 100,200,000 | | 100,200,000 |
Federal Farm Credit Bank, 1 Month USD LIBOR - 0.04%(a)
| | 2.347% | | 01/10/2019 | | 02/10/2020 | | 200,000,000 | | 199,976,008 |
Federal Farm Credit Bank, 1 Month USD LIBOR - 0.10%(a)
| | 2.355% | | 01/16/2019 | | 04/16/2019 | | 199,000,000 | | 198,998,077 |
Federal Farm Credit Bank, 1 Month USD LIBOR - 0.10%(a)
| | 2.375% | | 01/20/2019 | | 09/20/2019 | | 227,000,000 | | 226,991,853 |
Federal Farm Credit Bank, 1 Month USD LIBOR - 0.15%(a)
| | 2.375% | | 01/29/2019 | | 01/29/2019 | | 168,100,000 | | 168,099,805 |
Federal Farm Credit Bank, 1 Month USD LIBOR - 0.09%(a)
| | 2.380% | | 01/19/2019 | | 06/19/2019 | | 200,000,000 | | 199,933,054 |
Federal Farm Credit Bank, 1 Month USD LIBOR - 0.12%(a)
| | 2.386% | | 01/25/2019 | | 03/25/2019 | | 100,000,000 | | 100,000,000 |
Federal Farm Credit Bank, 3 Month USD LIBOR - 0.12%(a)
| | 2.389% | | 01/27/2019 | | 01/27/2020 | | 25,000,000 | | 25,007,408 |
Federal Farm Credit Bank, 1 Month USD LIBOR - 0.07%(a)
| | 2.390% | | 01/17/2019 | | 12/17/2019 | | 275,000,000 | | 274,992,276 |
Federal Farm Credit Bank, Federal Reserve Bank Prime Loan Rate - 3.08%(a)
| | 2.420% | | 01/02/2019 | | 03/12/2019 | | 69,875,000 | | 69,861,470 |
Federal Farm Credit Bank, 1 Month USD LIBOR - 0.05%(a)
| | 2.461% | | 01/25/2019 | | 02/25/2020 | | 240,000,000 | | 239,950,467 |
Federal Farm Credit Bank, 1 Month USD LIBOR + 0.18%(a)
| | 2.580% | | 01/11/2019 | | 10/11/2019 | | 50,000,000 | | 50,094,437 |
Federal Farm Credit Bank, 3 Month USD MMY + 0.12%(a)
| | 2.601% | | 01/02/2019 | | 05/08/2019 | | 77,250,000 | | 77,273,649 |
Federal Home Loan Bank, 3 Month USD LIBOR - 0.33%(a)
| | 2.078% | | 01/04/2019 | | 01/04/2019 | | 495,800,000 | | 495,800,000 |
Federal Home Loan Bank, 3 Month USD LIBOR - 0.32%(a)
| | 2.094% | | 01/10/2019 | | 04/10/2019 | | 669,800,000 | | 669,800,000 |
Federal Home Loan Bank(b)
| | 2.200% | | 01/24/2019 | | 01/24/2019 | | 566,000,000 | | 565,204,456 |
Federal Home Loan Bank, 1 Month USD LIBOR - 0.13%(a)
| | 2.215% | | 01/02/2019 | | 03/01/2019 | | 290,000,000 | | 290,000,163 |
Federal Home Loan Bank(b)
| | 2.220% | | 01/02/2019 | | 01/02/2019 | | 400,000,000 | | 399,975,333 |
Federal Home Loan Bank(b)
| | 2.220% | | 01/03/2019 | | 01/03/2019 | | 311,875,000 | | 311,836,535 |
Federal Home Loan Bank, 1 Month USD LIBOR - 0.13%(a)
| | 2.220% | | 01/02/2019 | | 03/01/2019 | | 328,700,000 | | 328,700,000 |
Federal Home Loan Bank, 1 Month USD LIBOR - 0.13%(a)
| | 2.220% | | 01/02/2019 | | 08/02/2019 | | 500,000,000 | | 500,000,000 |
Federal Home Loan Bank, 1 Month USD LIBOR - 0.11%(a)
| | 2.235% | | 01/02/2019 | | 04/01/2019 | | 410,000,000 | | 410,000,000 |
Federal Home Loan Bank(b)
| | 2.243% | | 01/09/2019 | | 01/09/2019 | | 250,000,000 | | 249,874,322 |
Federal Home Loan Bank(b)
| | 2.250% | | 01/15/2019 | | 01/15/2019 | | 319,225,000 | | 318,945,678 |
Federal Home Loan Bank(b)
| | 2.250% | | 01/17/2019 | | 01/17/2019 | | 322,375,000 | | 322,052,625 |
Federal Home Loan Bank, 1 Month USD LIBOR - 0.08%(a)
| | 2.270% | | 01/02/2019 | | 03/01/2019 | | 250,000,000 | | 250,000,000 |
Federal Home Loan Bank, 1 Month USD LIBOR - 0.06%(a)
| | 2.287% | | 01/04/2019 | | 12/04/2019 | | 500,000,000 | | 500,000,000 |
Federal Home Loan Bank, 1 Month USD LIBOR - 0.09%(a)
| | 2.290% | | 01/06/2019 | | 04/05/2019 | | 298,000,000 | | 298,000,000 |
Federal Home Loan Bank(b)
| | 2.300% | | 02/11/2019 | | 02/11/2019 | | 584,575,000 | | 583,043,738 |
Federal Home Loan Bank(b)
| | 2.300% | | 02/19/2019 | | 02/19/2019 | | 176,225,000 | | 175,673,318 |
Federal Home Loan Bank(b)
| | 2.307% | | 02/12/2019 | | 02/12/2019 | | 176,225,000 | | 175,754,186 |
Federal Home Loan Bank, 1 Month USD LIBOR - 0.13%(a)
| | 2.330% | | 01/16/2019 | | 07/16/2019 | | 340,200,000 | | 340,200,000 |
Federal Home Loan Bank(b)
| | 2.357% | | 02/08/2019 | | 02/08/2019 | | 350,000,000 | | 349,129,219 |
Federal Home Loan Bank, 1 Month USD LIBOR - 0.09%(a)
| | 2.365% | | 01/15/2019 | | 04/15/2019 | | 500,000,000 | | 500,000,000 |
Federal Home Loan Bank(b)
| | 2.367% | | 02/13/2019 | | 02/13/2019 | | 300,000,000 | | 299,151,825 |
Federal Home Loan Bank(b)
| | 2.374% | | 02/20/2019 | | 02/20/2019 | | 300,000,000 | | 299,010,833 |
Federal Home Loan Bank, 1 Month USD LIBOR - 0.13%(a)
| | 2.376% | | 01/25/2019 | | 01/25/2019 | | 513,000,000 | | 513,000,000 |
Federal Home Loan Bank, 1 Month USD LIBOR - 0.13%(a)
| | 2.379% | | 01/24/2019 | | 01/24/2019 | | 161,000,000 | | 161,000,000 |
Federal Home Loan Bank, 1 Month USD LIBOR - 0.13%(a)
| | 2.381% | | 01/25/2019 | | 02/25/2019 | | 116,750,000 | | 116,750,000 |
Federal Home Loan Bank, 1 Month USD LIBOR - 0.13%(a)
| | 2.381% | | 01/26/2019 | | 07/26/2019 | | 99,800,000 | | 99,800,000 |
Federal Home Loan Bank, 1 Month USD LIBOR - 0.12%(a)
| | 2.391% | | 01/26/2019 | | 04/26/2019 | | 337,000,000 | | 337,000,000 |
Federal Home Loan Bank, 1 Month USD LIBOR - 0.11%(a)
| | 2.401% | | 01/26/2019 | | 05/24/2019 | | 338,000,000 | | 338,000,000 |
Federal Home Loan Bank, 1 Month USD LIBOR - 0.11%(a)
| | 2.401% | | 01/31/2019 | | 05/28/2019 | | 271,700,000 | | 271,685,025 |
Federal Home Loan Bank(b)
| | 2.403% | | 03/15/2019 | | 03/15/2019 | | 200,000,000 | | 199,025,450 |
Federal Home Loan Bank, 1 Month USD LIBOR - 0.07%(a)
| | 2.405% | | 01/19/2019 | | 09/19/2019 | | 200,000,000 | | 200,000,000 |
Federal Home Loan Bank, 1 Month USD LIBOR - 0.10%(a)
| | 2.411% | | 01/25/2019 | | 03/25/2019 | | 214,000,000 | | 214,000,000 |
See accompanying notes to financial statements.
2
STATE STREET MASTER FUNDS
STATE STREET U.S. GOVERNMENT MONEY MARKET PORTFOLIO
SCHEDULE OF INVESTMENTS (continued)
December 31, 2018
| Name of Issuer and Title of Issue | | Interest Rate | | Next Rate Reset Date | | Maturity Date | | Principal Amount | | Value |
Federal Home Loan Bank(b)
| | 2.413% | | 03/08/2019 | | 03/08/2019 | | $400,000,000 | | $398,230,467 |
Federal Home Loan Bank, 1 Month USD LIBOR - 0.09%(a)
| | 2.419% | | 01/24/2019 | | 06/24/2019 | | 214,000,000 | | 214,000,000 |
Federal Home Loan Bank(b)
| | 2.420% | | 03/28/2019 | | 03/28/2019 | | 150,000,000 | | 149,132,833 |
Federal Home Loan Bank, 1 Month USD LIBOR - 0.03%(a)
| | 2.445% | | 01/20/2019 | | 04/20/2020 | | 200,000,000 | | 200,000,000 |
Federal Home Loan Bank(b)
| | 2.465% | | 04/23/2019 | | 04/23/2019 | | 200,000,000 | | 198,466,222 |
Federal Home Loan Bank(b)
| | 2.490% | | 05/22/2019 | | 05/22/2019 | | 30,000,000 | | 29,707,425 |
Federal Home Loan Bank(b)
| | 2.500% | | 05/28/2019 | | 05/28/2019 | | 500,000,000 | | 494,895,833 |
Federal Home Loan Bank, Secured Overnight Financing Rate + 0.04%(a)
| | 2.500% | | 01/02/2019 | | 05/15/2019 | | 250,000,000 | | 250,000,000 |
Federal Home Loan Bank, Secured Overnight Financing Rate + 0.07%(a)
| | 2.525% | | 01/02/2019 | | 11/15/2019 | | 225,000,000 | | 225,000,000 |
Federal Home Loan Bank(b)
| | 2.559% | | 05/17/2019 | | 05/17/2019 | | 495,000,000 | | 494,953,037 |
Federal Home Loan Bank(b)
| | 2.563% | | 05/20/2019 | | 05/20/2019 | | 100,000,000 | | 99,989,504 |
Federal Home Loan Mortgage Corp., 3 Month USD LIBOR - 0.34%(a)
| | 2.068% | | 01/09/2019 | | 01/09/2019 | | 605,100,000 | | 605,100,000 |
Federal Home Loan Mortgage Corp., 3 Month USD LIBOR - 0.33%(a)
| | 2.078% | | 01/09/2019 | | 04/09/2019 | | 672,300,000 | | 672,300,000 |
Federal Home Loan Mortgage Corp., 1 Month USD LIBOR - 0.15%(a)
| | 2.237% | | 01/08/2019 | | 02/08/2019 | | 177,000,000 | | 177,000,000 |
Federal Home Loan Mortgage Corp.(b)
| | 2.280% | | 09/20/2019 | | 09/20/2019 | | 225,000,000 | | 225,000,000 |
Federal Home Loan Mortgage Corp., 1 Month USD LIBOR - 0.10%(a)
| | 2.355% | | 01/18/2019 | | 03/18/2019 | | 189,400,000 | | 189,400,000 |
Federal Home Loan Mortgage Corp., 1 Month USD LIBOR - 0.10%(a)
| | 2.375% | | 01/19/2019 | | 06/19/2019 | | 482,300,000 | | 482,300,000 |
Federal Home Loan Mortgage Corp.(b)
| | 2.390% | | 03/20/2019 | | 03/20/2019 | | 552,000,000 | | 549,141,560 |
Federal Home Loan Mortgage Corp.(b)
| | 2.475% | | 05/20/2019 | | 05/20/2019 | | 75,000,000 | | 74,283,281 |
Federal Home Loan Mortgage Corp., Secured Overnight Financing Rate - 0.03%(a)
| | 2.490% | | 01/02/2019 | | 06/19/2019 | | 419,000,000 | | 419,000,000 |
Federal National Mortgage Assoc.(b)
| | 2.240% | | 01/09/2019 | | 01/09/2019 | | 134,800,000 | | 134,732,900 |
Federal National Mortgage Assoc., Secured Overnight Financing Rate + 0.07%(a)
| | 2.530% | | 01/02/2019 | | 10/30/2019 | | 132,300,000 | | 132,300,000 |
Federal National Mortgage Assoc., Secured Overnight Financing Rate + 0.10%(a)
| | 2.560% | | 01/02/2019 | | 04/30/2020 | | 50,000,000 | | 50,000,000 |
Federal National Mortgage Assoc.(b)
| | 2.661% | | 08/02/2019 | | 08/02/2019 | | 400,000,000 | | 395,888,689 |
TOTAL GOVERNMENT AGENCY DEBT
| | | | | | | | | | 21,347,970,653 |
| TREASURY DEBT—18.1% | | | | | | | | | | |
U.S. Treasury Bill(b)
| | 2.220% | | 01/10/2019 | | 01/10/2019 | | 500,000,000 | | 499,723,638 |
U.S. Treasury Bill(b)
| | 2.275% | | 02/07/2019 | | 02/07/2019 | | 169,500,000 | | 169,103,676 |
U.S. Treasury Bill(b)
| | 2.300% | | 01/24/2019 | | 01/24/2019 | | 400,000,000 | | 399,412,222 |
U.S. Treasury Bill(b)
| | 2.310% | | 01/31/2019 | | 01/31/2019 | | 450,000,000 | | 449,135,256 |
U.S. Treasury Bill(b)
| | 2.388% | | 03/21/2019 | | 03/21/2019 | | 250,000,000 | | 248,690,191 |
U.S. Treasury Bill(b)
| | 2.390% | | 02/05/2019 | | 02/05/2019 | | 350,000,000 | | 349,186,736 |
U.S. Treasury Bill(b)
| | 2.415% | | 04/18/2019 | | 04/18/2019 | | 350,000,000 | | 347,487,729 |
U.S. Treasury Bill(b)
| | 2.465% | | 04/04/2019 | | 04/04/2019 | | 400,000,000 | | 397,507,611 |
U.S. Treasury Bill(b)
| | 2.465% | | 05/23/2019 | | 05/23/2019 | | 300,000,000 | | 297,083,083 |
U.S. Treasury Bill(b)
| | 2.480% | | 06/13/2019 | | 06/13/2019 | | 250,000,000 | | 247,192,778 |
U.S. Treasury Bill(b)
| | 2.488% | | 06/20/2019 | | 06/20/2019 | | 250,000,000 | | 247,065,517 |
U.S. Treasury Note(b)
| | 2.373% | | 02/28/2019 | | 02/28/2019 | | 300,000,000 | | 299,580,735 |
U.S. Treasury Note(b)
| | 2.443% | | 03/31/2019 | | 03/31/2019 | | 99,000,000 | | 98,713,494 |
U.S. Treasury Note(b)
| | 2.457% | | 04/15/2019 | | 04/15/2019 | | 200,000,000 | | 199,106,878 |
U.S. Treasury Note, 3 Month USD MMY(a)
| | 2.481% | | 01/02/2019 | | 01/31/2020 | | 460,000,000 | | 459,944,722 |
U.S. Treasury Note, 3 Month USD MMY + 0.03%(a)
| | 2.514% | | 01/02/2019 | | 04/30/2020 | | 1,182,122,000 | | 1,182,104,093 |
U.S. Treasury Note, 3 Month USD MMY + 0.05%(a)
| | 2.529% | | 01/02/2019 | | 10/31/2019 | | 150,000,000 | | 150,071,920 |
U.S. Treasury Note, 3 Month USD MMY + 0.06%(a)
| | 2.541% | | 01/02/2019 | | 07/31/2019 | | 475,000,000 | | 475,254,190 |
U.S. Treasury Note, 3 Month USD MMY + 0.07%(a)
| | 2.551% | | 01/02/2019 | | 04/30/2019 | | 300,576,200 | | 300,609,136 |
See accompanying notes to financial statements.
3
STATE STREET MASTER FUNDS
STATE STREET U.S. GOVERNMENT MONEY MARKET PORTFOLIO
SCHEDULE OF INVESTMENTS (continued)
December 31, 2018
| Name of Issuer and Title of Issue | | Interest Rate | | Next Rate Reset Date | | Maturity Date | | Principal Amount | | Value |
U.S. Treasury Note(b)
| | 2.553% | | 05/31/2019 | | 05/31/2019 | | $216,000,000 | | $214,742,863 |
U.S. Treasury Note(b)
| | 2.609% | | 07/31/2019 | | 07/31/2019 | | 250,000,000 | | 247,516,952 |
U.S. Treasury Note, 3 Month USD MMY + 0.14%(a)
| | 2.621% | | 01/02/2019 | | 01/31/2019 | | 170,000,000 | | 170,016,416 |
TOTAL TREASURY DEBT
| | | | | | | | | | 7,449,249,836 |
| GOVERNMENT AGENCY REPURCHASE AGREEMENTS—11.8% | | | | | | | | | | |
Agreement with Bank of Nova Scotia and Bank of New York Mellon (Tri-Party), dated 12/31/2018 (collateralized by Federal Home Loan Mortgage Corporations, 2.741% – 4.498% due 06/01/2042 – 08/01/2048, and Federal National Mortgage Associations, 2.611% – 6.500% due 01/01/2038 – 12/01/2048, valued at $158,126,087); expected proceeds $155,025,575
| | 2.970% | | 01/02/2019 | | 01/02/2019 | | 155,000,000 | | 155,000,000 |
Agreement with Citigroup Global Markets, Inc. and Bank of New York Mellon (Tri-Party), dated 12/28/2018 (collateralized by Federal Home Loan Mortgage Corporations, 0.000% – 15.011% due 06/15/2022 – 12/01/2048, Federal National Mortgage Associations, 0.300% – 8.000% due 02/01/2023 – 01/01/2049, and Government National Mortgage Associations, 0.000% – 57.189% due 04/20/2034 – 09/20/2068, valued at $951,214,112); expected proceeds $900,525,000
| | 3.000% | | 01/04/2019 | | 01/04/2019 | | 900,000,000 | | 900,000,000 |
Agreement with Citigroup Global Markets, Inc. and Bank of New York Mellon (Tri-Party), dated 12/31/2018 (collateralized by Federal Farm Credit Banks, 1.176% – 2.297% due 08/23/2019 – 12/11/2020, Federal Home Loan Banks, 0.000% – 3.440% due 10/21/2019 – 02/23/2038, Federal Home Loan Mortgage Corporations, 0.000% – 1.875% due 11/17/2020 – 11/15/2038, and Federal National Mortgage Associations, 1.500% – 2.000% due 07/30/2020 – 10/05/2022, valued at $44,880,412); expected proceeds $44,007,236
| | 2.960% | | 01/02/2019 | | 01/02/2019 | | 44,000,000 | | 44,000,000 |
Agreement with Goldman Sachs & Co. and Bank of New York Mellon (Tri-Party), dated 12/26/2018 (collateralized by Federal Home Loan Mortgage Corporations, 2.500% – 6.500% due 12/01/2020 – 12/15/2048, Federal National Mortgage Associations, 2.125% – 6.000% due 02/01/2019 – 11/25/2048, and Government National Mortgage Associations, 1.614% – 5.500% due 07/16/2038 – 09/16/2058, valued at $346,800,000); expected proceeds $340,160,650
| | 2.430% | | 01/02/2019 | | 01/02/2019 | | 340,000,000 | | 340,000,000 |
Agreement with Goldman Sachs & Co. and Bank of New York Mellon (Tri-Party), dated 12/27/2018 (collateralized by Federal Farm Credit Banks, 2.720% – 2.900% due 09/19/2022 – 06/28/2032, Federal Home Loan Banks, 1.125% – 4.150% due 07/14/2021 – 01/23/2043, Federal Home Loan Mortgage Corporations, 1.500% – 6.250% due 06/29/2022 – 07/15/2032, Federal National Mortgage Associations, 1.875% – 6.625% due 09/24/2026 – 11/15/2030, and U.S. Treasury Strips, 0.000% due 11/15/2019 – 02/15/2023, valued at $255,000,000); expected proceeds $250,118,611
| | 2.440% | | 01/03/2019 | | 01/03/2019 | | 250,000,000 | | 250,000,000 |
Agreement with Goldman Sachs & Co. and Bank of New York Mellon (Tri-Party), dated 12/27/2018 (collateralized by Federal Home Loan Mortgage Corporations, 2.500% – 5.500% due 02/15/2026 – 06/15/2047, Federal National Mortgage Associations, 2.500% – 7.500% due 05/01/2019 – 11/25/2048, and Government National Mortgage Associations, 1.794% – 5.000% due 07/20/2034 – 08/16/2060, valued at $510,000,000); expected proceeds $500,237,222
| | 2.440% | | 01/03/2019 | | 01/03/2019 | | 500,000,000 | | 500,000,000 |
See accompanying notes to financial statements.
4
STATE STREET MASTER FUNDS
STATE STREET U.S. GOVERNMENT MONEY MARKET PORTFOLIO
SCHEDULE OF INVESTMENTS (continued)
December 31, 2018
| Name of Issuer and Title of Issue | | Interest Rate | | Next Rate Reset Date | | Maturity Date | | Principal Amount | | Value |
Agreement with Goldman Sachs & Co. and Bank of New York Mellon (Tri-Party), dated 12/31/2018 (collateralized by Federal Home Loan Mortgage Corporations, 3.500% – 5.500% due 12/15/2035 – 12/15/2048, Federal National Mortgage Associations, 2.715% – 4.500% due 11/25/2024 – 07/25/2046, and Government National Mortgage Associations, 2.500% – 6.000% due 11/16/2033 – 06/16/2058, valued at $280,500,000); expected proceeds $275,133,681
| | 2.500% | | 01/07/2019 | | 01/07/2019 | | $275,000,000 | | $275,000,000 |
Agreement with Goldman Sachs & Co. and Bank of New York Mellon (Tri-Party), dated 12/31/2018 (collateralized by Federal Home Loan Mortgage Corporations, 4.000% – 7.000% due 08/01/2019 – 07/15/2048, and Federal National Mortgage Associations, 3.000% – 8.000% due 05/01/2019 – 02/01/2043, valued at $21,420,000); expected proceeds $21,003,383
| | 2.900% | | 01/02/2019 | | 01/02/2019 | | 21,000,000 | | 21,000,000 |
Agreement with JP Morgan Securities, Inc. and Bank of New York Mellon (Tri-Party), dated 12/31/2018 (collateralized by Federal National Mortgage Associations, 3.500% – 5.000% due 08/01/2023 – 10/01/2048, and Federal National Mortgage Associations Strips, 7.000% due 06/25/2023 – 10/25/2023, valued at $15,300,000); expected proceeds $15,002,500
| | 3.000% | | 01/02/2019 | | 01/02/2019 | | 15,000,000 | | 15,000,000 |
Agreement with Royal Bank of Canada and Bank of New York Mellon (Tri-Party), dated 12/31/2018 (collateralized by a Federal National Mortgage Association, 4.000% due 09/01/2048, and Government National Mortgage Associations, 4.000% – 5.000% due 08/15/2039 – 06/20/2047, valued at $255,000,054); expected proceeds $250,041,250
| | 2.970% | | 01/02/2019 | | 01/02/2019 | | 250,000,000 | | 250,000,000 |
Agreement with Royal Bank of Canada and Bank of New York Mellon (Tri-Party), dated 12/31/2018 (collateralized by Federal Home Loan Mortgage Corporations, 2.500% – 4.500% due 02/01/2028 – 10/01/2048, Federal National Mortgage Associations, 2.500% – 6.500% due 04/01/2019 – 01/01/2049, and Government National Mortgage Associations, 3.500% – 5.000% due 04/20/2042 – 11/20/2048, valued at $836,400,000); expected proceeds $820,136,667
| | 3.000% | | 01/02/2019 | | 01/02/2019 | | 820,000,000 | | 820,000,000 |
Agreement with Societe Generale and Bank of New York Mellon (Tri-Party), dated 12/31/2018 (collateralized by Federal Home Loan Mortgage Corporations, 2.756% – 5.966% due 01/01/2020 – 11/01/2030, a Federal National Mortgage Association, 2.965% due 06/25/2022, Government National Mortgage Associations, 3.500% – 4.500% due 08/20/2046 – 02/20/2047, and a U.S. Treasury Note, 2.625% due 07/31/2020, valued at $17,340,083); expected proceeds $17,002,833
| | 3.000% | | 01/02/2019 | | 01/02/2019 | | 17,000,000 | | 17,000,000 |
Agreement with TD Securities (USA) LLC and Bank of New York Mellon (Tri-Party), dated 12/31/2018 (collateralized by a Federal Home Loan Mortgage Corporation, 3.500% due 07/01/2046, and a Federal National Mortgage Association, 4.000% due 10/01/2048, valued at $158,100,000); expected proceeds $155,025,833
| | 3.000% | | 01/02/2019 | | 01/02/2019 | | 155,000,000 | | 155,000,000 |
Agreement with Wells Fargo Bank and Bank of New York Mellon (Tri-Party), dated 12/31/2018 (collateralized by Federal Home Loan Mortgage Corporations, 2.776% – 4.307% due 11/01/2039 – 07/01/2048, and Federal National Mortgage Associations, 0.000% – 5.500% due 07/01/2019 – 01/01/2049, valued at $1,158,913,120); expected proceeds $1,136,189,333
| | 3.000% | | 01/02/2019 | | 01/02/2019 | | 1,136,000,000 | | 1,136,000,000 |
TOTAL GOVERNMENT AGENCY REPURCHASE AGREEMENTS
| | | | | | | | | | 4,878,000,000 |
See accompanying notes to financial statements.
5
STATE STREET MASTER FUNDS
STATE STREET U.S. GOVERNMENT MONEY MARKET PORTFOLIO
SCHEDULE OF INVESTMENTS (continued)
December 31, 2018
| Name of Issuer and Title of Issue | | Interest Rate | | Next Rate Reset Date | | Maturity Date | | Principal Amount | | Value |
| TREASURY REPURCHASE AGREEMENTS—15.2% | | | | | | | | | | |
Agreement with Bank of Montreal and Bank of New York Mellon (Tri-Party), dated 12/31/2018 (collateralized by U.S. Treasury Notes, 1.500% – 3.375% due 05/31/2019 – 06/30/2024, valued at $102,000,046); expected proceeds $100,016,111
| | 2.900% | | 01/02/2019 | | 01/02/2019 | | $100,000,000 | | $100,000,000 |
Agreement with Bank of Montreal and Bank of New York Mellon (Tri-Party), dated 12/31/2018 (collateralized by U.S. Treasury Notes, 1.875% – 2.875% due 01/31/2020 – 12/31/2025, valued at $97,920,028); expected proceeds $96,045,733
| | 2.450% | | 01/07/2019 | | 01/07/2019 | | 96,000,000 | | 96,000,000 |
Agreement with Barclays Capital, Inc. and Bank of New York Mellon (Tri-Party), dated 12/31/2018 (collateralized by a U.S. Treasury Bond, 3.875% due 08/15/2040, and a U.S. Treasury Note, 2.750% due 08/31/2025, valued at $510,000,073); expected proceeds $500,081,944
| | 2.950% | | 01/02/2019 | | 01/02/2019 | | 500,000,000 | | 500,000,000 |
Agreement with Barclays Capital, Inc. and Bank of New York Mellon (Tri-Party), dated 12/31/2018 (collateralized by a U.S. Treasury Bond, 4.625% due 02/15/2040, and a U.S. Treasury Note, 2.750% due 08/31/2025, valued at $510,000,046); expected proceeds $500,080,556
| | 2.900% | | 01/02/2019 | | 01/02/2019 | | 500,000,000 | | 500,000,000 |
Agreement with Canadian Imperial Bank of Commerce and Bank of New York Mellon (Tri-Party), dated 12/31/2018 (collateralized by U.S. Treasury Notes, 2.000% – 2.625% due 06/30/2023 – 09/30/2024, valued at $91,800,061); expected proceeds $90,014,850
| | 2.970% | | 01/02/2019 | | 01/02/2019 | | 90,000,000 | | 90,000,000 |
Agreement with Citigroup Global Markets, Inc. and Bank of New York Mellon (Tri-Party), dated 12/28/2018 (collateralized by a U.S. Treasury Inflation Index Note, 0.500% due 01/15/2028, and U.S. Treasury Notes, 1.435% – 2.500% due 12/31/2019 – 01/31/2025, valued at $510,000,015); expected proceeds $500,247,917
| | 2.550% | | 01/04/2019 | | 01/04/2019 | | 500,000,000 | | 500,000,000 |
Agreement with Citigroup Global Markets, Inc. and Bank of New York Mellon (Tri-Party), dated 12/31/2018 (collateralized by a U.S. Treasury Inflation Index Note, 0.625% due 04/15/2023, and U.S. Treasury Notes, 1.858% – 2.875% due 04/30/2020 – 04/30/2025, valued at $59,160,082); expected proceeds $58,009,667
| | 3.000% | | 01/02/2019 | | 01/02/2019 | | 58,000,000 | | 58,000,000 |
Agreement with Goldman Sachs & Co. and Bank of New York Mellon (Tri-Party), dated 12/31/2018 (collateralized by a Federal Farm Credit Bank, 4.350% due 10/18/2038, Federal Home Loan Banks, 0.000% – 3.500% due 01/15/2019 – 08/10/2035, a U.S. Treasury Bill, 0.000% due 02/07/2019, U.S. Treasury Bonds, 2.500% – 4.375% due 05/15/2041 – 02/15/2045, and a U.S. Treasury Note, 2.625% due 06/30/2023, valued at $306,000,004); expected proceeds $300,148,750
| | 2.550% | | 01/07/2019 | | 01/07/2019 | | 300,000,000 | | 300,000,000 |
Agreement with HSBC Securities USA, Inc. and Bank of New York Mellon (Tri-Party), dated 12/31/2018 (collateralized by a U.S. Treasury Strip, 0.000% due 11/15/2027, valued at $84,660,000); expected proceeds $83,013,603
| | 2.950% | | 01/02/2019 | | 01/02/2019 | | 83,000,000 | | 83,000,000 |
Agreement with LLOYDS Bank PLC and Clearstream (Tri-Party), dated 08/17/2018 (collateralized by U.S. Treasury Inflation Index Notes, 0.125% – 2.500% due 01/15/2022 – 01/15/2029, and a U.S. Treasury Note, 6.000% due 02/15/2026, valued at $516,135,562); expected proceeds $506,380,833(c)
| | 2.470% | | 01/02/2019 | | 02/19/2019 | | 500,000,000 | | 500,000,000 |
See accompanying notes to financial statements.
6
STATE STREET MASTER FUNDS
STATE STREET U.S. GOVERNMENT MONEY MARKET PORTFOLIO
SCHEDULE OF INVESTMENTS (continued)
December 31, 2018
| Name of Issuer and Title of Issue | | Interest Rate | | Next Rate Reset Date | | Maturity Date | | Principal Amount | | Value |
Agreement with LLOYDS Bank PLC and Clearstream (Tri-Party), dated 12/27/2018 (collateralized by a U.S. Treasury Inflation Index Bond, 2.125% due 02/15/2040, U.S. Treasury Inflation Index Notes, 0.125% – 0.375% due 04/15/2021 – 07/15/2027, and U.S. Treasury Notes, 2.750% – 3.125% due 09/15/2021 – 11/15/2028, valued at $204,686,301); expected proceeds $200,097,222
| | 2.500% | | 01/03/2019 | | 01/03/2019 | | $200,000,000 | | $200,000,000 |
Agreement with MUFJ Securities, dated 12/28/2018 (collateralized by U.S. Treasury Bonds, 3.000% - 3.125% due 02/15/2047 – 05/15/2048, and a U.S. Treasury Note, 2.750% due 02/28/2025, valued at $280,482,459); expected proceeds $275,133,681
| | 2.500% | | 01/04/2019 | | 01/04/2019 | | 275,000,000 | | 275,000,000 |
Agreement with Norinchukin Bank and Bank of New York Mellon (Tri-Party), dated 12/11/2018 (collateralized by U.S. Treasury Inflation Index Notes, 0.375% – 1.125% due 01/15/2021 – 01/15/2027, and a U.S. Treasury Note, 2.000% due 11/15/2026, valued at $392,700,053); expected proceeds $387,444,750(c)
| | 2.540% | | 03/11/2019 | | 03/11/2019 | | 385,000,000 | | 385,000,000 |
Agreement with Norinchukin Bank and Bank of New York Mellon (Tri-Party), dated 12/21/2018 (collateralized by a U.S. Treasury Inflation Index Note, 1.125% due 01/15/2021, and U.S. Treasury Notes, 2.000% – 3.375% due 11/15/2019 – 11/15/2026, valued at $183,600,091); expected proceeds $181,146,600(c)
| | 2.520% | | 03/22/2019 | | 03/22/2019 | | 180,000,000 | | 180,000,000 |
Agreement with Royal Bank of Canada and Bank of New York Mellon (Tri-Party), dated 12/31/2018 (collateralized by U.S. Treasury Bonds, 2.250% – 3.625% due 02/15/2042 – 02/15/2048, and U.S. Treasury Inflation Index Bonds, 0.750% – 3.625% due 04/15/2028 – 02/15/2045, valued at $213,180,079); expected proceeds $209,034,253
| | 2.950% | | 01/02/2019 | | 01/02/2019 | | 209,000,000 | | 209,000,000 |
Agreement with Royal Bank of Canada and Bank of New York Mellon (Tri-Party), dated 12/31/2018 (collateralized by U.S. Treasury Bonds, 2.875% – 4.375% due 05/15/2040 – 05/15/2043, U.S. Treasury Inflation Index Bonds, 0.750% – 3.875% due 04/15/2029 – 02/15/2042, U.S. Treasury Inflation Index Notes, 0.125% – 0.750% due 04/15/2022 – 07/15/2028, and U.S. Treasury Notes, 1.500% – 2.125% due 10/31/2022 – 08/15/2026, valued at $561,000,048); expected proceeds $550,090,139
| | 2.950% | | 01/02/2019 | | 01/02/2019 | | 550,000,000 | | 550,000,000 |
Agreement with Societe Generale and Bank of New York Mellon (Tri-Party), dated 12/31/2018 (collateralized by U.S. Treasury Bonds, 2.250% – 3.625% due 11/15/2041 – 05/15/2047, U.S. Treasury Inflation Index Bonds, 0.875% – 1.750% due 01/15/2028 – 02/15/2047, U.S. Treasury Inflation Index Notes, 0.125% – 0.625% due 04/15/2019 – 01/15/2028, and U.S. Treasury Notes, 1.250% – 2.500% due 06/30/2020 – 02/15/2027, valued at $336,600,003); expected proceeds $330,054,083
| | 2.950% | | 01/02/2019 | | 01/02/2019 | | 330,000,000 | | 330,000,000 |
Agreement with Societe Generale and Bank of New York Mellon (Tri-Party), dated 12/31/2018 (collateralized by U.S. Treasury Bonds, 2.250% – 4.750% due 08/15/2040 – 05/15/2047, U.S. Treasury Inflation Index Bonds, 0.750% – 1.750% due 01/15/2028 – 02/15/2047, U.S. Treasury Inflation Index Notes, 0.125% – 0.625% due 04/15/2020 – 01/15/2028, and U.S. Treasury Notes, 1.250% – 3.625% due 06/30/2020 – 02/15/2027, valued at $408,000,027); expected proceeds $400,066,667
| | 3.000% | | 01/02/2019 | | 01/02/2019 | | 400,000,000 | | 400,000,000 |
See accompanying notes to financial statements.
7
STATE STREET MASTER FUNDS
STATE STREET U.S. GOVERNMENT MONEY MARKET PORTFOLIO
SCHEDULE OF INVESTMENTS (continued)
December 31, 2018
| Name of Issuer and Title of Issue | | Interest Rate | | Next Rate Reset Date | | Maturity Date | | Principal Amount | | Value |
Agreement with UBS Securities LLC and Bank of New York Mellon (Tri-Party), dated 12/31/2018 (collateralized by U.S. Treasury Bills, 0.000% due 01/03/2019 – 12/05/2019, U.S. Treasury Bonds, 2.250% – 8.125% due 08/15/2019 – 11/15/2048, U.S. Treasury Inflation Index Bonds, 0.750% – 2.500% due 01/15/2025 – 02/15/2048, U.S. Treasury Inflation Index Notes, 0.125% – 2.125% due 01/15/2019 – 01/15/2027, and U.S. Treasury Notes, 0.750% – 3.500% due 01/31/2019 – 11/15/2028, valued at $1,019,253,469); expected proceeds $1,000,163,888
| | 2.950% | | 01/02/2019 | | 01/02/2019 | | $1,000,000,000 | | $1,000,000,000 |
TOTAL TREASURY REPURCHASE AGREEMENTS
| | | | | | | | | | 6,256,000,000 |
TOTAL INVESTMENTS –96.9% (d)(e)
| | | | | | | | | | 39,931,220,489 |
Other Assets in Excess of Liabilities —3.1%
| | | | | | | | | | 1,290,561,756 |
NET ASSETS –100.0%
| | | | | | | | | | $41,221,782,245 |
| (a) | Variable Rate Security - Interest rate shown is rate in effect at December 31, 2018. For securities based on a published reference rate and spread, the reference rate and spread are indicated in the description above. |
| (b) | Rate shown is the discount rate at time of purchase. |
| (c) | Illiquid security. These securities represent $1,065,000,000 or 2.6% of net assets as of December 31, 2018. |
| (d) | Also represents the cost for federal tax purposes. |
| (e) | Unless otherwise indicated, the values of the securities of the Portfolio are determined based on Level 2 inputs (Note 2). |
See accompanying notes to financial statements.
8
STATE STREET MASTER FUNDS
STATE STREET U.S. GOVERNMENT MONEY MARKET PORTFOLIO
STATEMENT OF ASSETS AND LIABILITIES
December 31, 2018
| ASSETS | |
Investments in unaffiliated issuers, at value and cost
| $28,797,220,489 |
Repurchase agreements, at value and amortized cost
| 11,134,000,000 |
Total Investments
| 39,931,220,489 |
Cash
| 1,638,579,751 |
Interest receivable — unaffiliated issuers
| 51,752,736 |
Other Receivable
| 9,438 |
Prepaid expenses and other assets
| 12,521 |
TOTAL ASSETS
| 41,621,574,935 |
| LIABILITIES | |
Payable for investments purchased
| 397,507,611 |
Advisory and administrator fee payable
| 1,797,060 |
Custody, sub-administration and transfer agent fees payable
| 425,332 |
Trustees’ fees and expenses payable
| 1,320 |
Professional fees payable
| 42,493 |
Printing fees payable
| 15,483 |
Accrued expenses and other liabilities
| 3,391 |
TOTAL LIABILITIES
| 399,792,690 |
NET ASSETS
| $41,221,782,245 |
See accompanying notes to financial statements.
9
STATE STREET MASTER FUNDS
STATE STREET U.S. GOVERNMENT MONEY MARKET PORTFOLIO
STATEMENT OF OPERATIONS
For the Year Ended December 31, 2018
| INVESTMENT INCOME | |
Interest income — unaffiliated issuers
| $914,574,049 |
| EXPENSES | |
Advisory and administrator fee
| 24,728,271 |
Custodian, sub-administrator and transfer agent fees
| 6,562,810 |
Trustees’ fees and expenses
| 809,406 |
Professional fees and expenses
| 159,296 |
Printing and postage fees
| 40,983 |
Insurance expense
| 188,672 |
Miscellaneous expenses
| 29,359 |
TOTAL EXPENSES
| 32,518,797 |
NET INVESTMENT INCOME (LOSS)
| $882,055,252 |
| REALIZED GAIN (LOSS) | |
| Net realized gain (loss) on: | |
Investments — unaffiliated issuers
| 20,763 |
NET INCREASE (DECREASE) IN NET ASSETS FROM OPERATIONS
| $882,076,015 |
See accompanying notes to financial statements.
10
STATE STREET MASTER FUNDS
STATE STREET U.S. GOVERNMENT MONEY MARKET PORTFOLIO
STATEMENTS OF CHANGES IN NET ASSETS
| | Year Ended
12/31/18 | | Year Ended
12/31/17 |
| INCREASE (DECREASE) IN NET ASSETS FROM OPERATIONS: | | | |
Net investment income (loss)
| $882,055,252 | | $402,421,179 |
Net realized gain (loss)
| 20,763 | | (18,966) |
Net increase (decrease) in net assets resulting from operations
| 882,076,015 | | 402,402,213 |
| CAPITAL TRANSACTIONS | | | |
Contributions
| 142,050,377,534 | | 104,516,771,308 |
Withdrawals
| (150,375,688,545) | | (107,179,383,705) |
Net increase (decrease) in net assets from capital transactions
| (8,325,311,011) | | (2,662,612,397) |
Net increase (decrease) in net assets during the period
| (7,443,234,996) | | (2,260,210,184) |
Net assets at beginning of period
| 48,665,017,241 | | 50,925,227,425 |
NET ASSETS AT END OF PERIOD
| $41,221,782,245 | | $48,665,017,241 |
See accompanying notes to financial statements.
11
STATE STREET MASTER FUNDS
STATE STREET U.S. GOVERNMENT MONEY MARKET PORTFOLIO
FINANCIAL HIGHLIGHTS
Selected data for a share outstanding throughout each period
| | Year
Ended
12/31/18 | | Year
Ended
12/31/17 | | Year
Ended
12/31/16 | | Year
Ended
12/31/15 | | Year
Ended
12/31/14 |
Total return (a)
| 1.81% | | 0.74% | | 0.31% | | 0.03% | | 0.01% |
| Ratios and Supplemental Data: | | | | | | | | | |
Net assets, end of period (in 000s)
| $41,221,782 | | $48,665,017 | | $50,925,227 | | $16,023,491 | | $13,207,868 |
| Ratios to average net assets: | | | | | | | | | |
Total expenses
| 0.07% | | 0.06% | | 0.07% | | 0.07% | | 0.07% |
Net investment income (loss)
| 1.78% | | 0.85% | | 0.32% | | 0.03% | | 0.01% |
| (a) | Results represent past performance and are not indicative of future results. Total return for periods of less than one year are not annualized. |
See accompanying notes to financial statements.
12
STATE STREET MASTER FUNDS
STATE STREET U.S. GOVERNMENT MONEY MARKET PORTFOLIO
NOTES TO FINANCIAL STATEMENTS
December 31, 2018
1. Organization
State Street Master Funds (the “Trust”), a Massachusetts business trust registered under the Investment Company Act of 1940, as amended (“1940 Act”), is an open-end management investment company.
As of December 31, 2018, the Trust consists of six (6) series, each of which represents a separate series of beneficial interest in the Trust. State Street U.S. Government Money Market Portfolio (the “Portfolio”) is authorized to issue an unlimited number of shares of beneficial interest with no par value. The financial statements herein relate only to the Portfolio.
The Portfolio operates as a “government money market fund” within the meaning of Rule 2a-7 under the 1940 Act to comply with the amendments to Rule 2a-7 that became effective October 14, 2016. The Portfolio is not currently subject to liquidity fees or temporary suspensions of redemptions due to declines in the Portfolio's weekly liquid assets.
Under the Trust’s organizational documents, its officers and trustees are indemnified against certain liabilities arising out of the performance of their duties to the Trust. Additionally, in the normal course of business, the Trust enters into contracts with service providers that contain general indemnification clauses. The Trust’s maximum exposure under these arrangements is unknown as this would involve future claims that may be made against the Trust that have not yet occurred.
2. Summary of Significant Accounting Policies
The following is a summary of significant accounting policies followed by the Trust in the preparation of its financial statements:
The preparation of financial statements in accordance with U.S. generally accepted accounting principles (“U.S. GAAP”) requires management to make estimates and assumptions that affect the reported amounts and disclosures in the financial statements. Actual results could differ from those estimates. The Portfolio is an investment company under U.S. GAAP and follows the accounting and reporting guidance applicable to investment companies.
Security Valuation
The investments of the Portfolio are valued pursuant to the policy and procedures developed by the Oversight Committee (the “Committee”) and approved by the Board of Trustees of the Trust (the “Board”). The Committee provides oversight of the valuation of investments for the Portfolio. The Board has responsibility for overseeing the determination of the fair value of investments.
The Portfolio’s securities are recorded on the basis of amortized cost which approximates fair value as permitted by Rule 2a-7 under the 1940 Act. This method values a security at its cost on the date of purchase and, thereafter, assumes a constant amortization to maturity of any premiums or accretion of any discounts.
Because of the inherent uncertainties of valuation and under certain market conditions, the values reflected in the financial statements may differ from the value received upon actual sale of those investments and it is possible that the differences could be material.
Various inputs are used in determining the value of the Portfolio’s investments. The Portfolio values its assets and liabilities at fair value using a fair value hierarchy consisting of three broad levels that prioritize the inputs to valuation techniques giving the highest priority to readily available unadjusted quoted prices in active markets for identical assets or liabilities (Level 1 measurements) and the lowest priority to unobservable inputs (Level 3 measurements) when market prices are not readily available or reliable. The categorization of a value determined for an investment within the hierarchy is based upon the pricing transparency of the investment and is not necessarily an indication of the risk associated with investing in it.
The three levels of the fair value hierarchy are as follows:
• Level 1 – Unadjusted quoted prices in active markets for an identical asset or liability;
• Level 2 – Inputs other than quoted prices included within Level 1 that are observable for the asset or liability either directly or indirectly, including quoted prices for similar assets or liabilities in active markets, quoted prices for identical or similar assets or liabilities in markets that are not considered to be active, inputs other than quoted prices that are observable for the
STATE STREET MASTER FUNDS
STATE STREET U.S. GOVERNMENT MONEY MARKET PORTFOLIO
NOTES TO FINANCIAL STATEMENTS (continued)
December 31, 2018
asset or liability (such as exchange rates, financing terms, interest rates, yield curves, volatilities, prepayment speeds, loss severities, credit risks and default rates) or other market-corroborated inputs; and
• Level 3 – Unobservable inputs for the asset or liability, including the Committee’s assumptions used in determining the fair value of investments.
Investment Transactions and Income Recognition
Investment transactions are accounted for on trade date for financial reporting purposes. Realized gains and losses from the sale or disposition of investments are determined using the identified cost method. Interest income is recorded daily on an accrual basis. All premiums and discounts are amortized/accreted for financial reporting purposes.
All of the net investment income and realized gains and losses from the security transactions of the Portfolio are allocated pro rata among the partners in the Portfolio on a daily basis based on each partner’s daily ownership percentage.
Expenses
Certain expenses, which are directly identifiable to a specific Portfolio, are applied to that Portfolio within the Trust. Other expenses which cannot be attributed to a specific Portfolio are allocated in such a manner as deemed equitable, taking into consideration the nature and type of expense and the relative net assets of the Portfolio within the Trust.
3. Securities and Other Investments
Repurchase Agreements
The Portfolio may enter into repurchase agreements under the terms of a Master Repurchase Agreement. A repurchase agreement customarily obligates the seller at the time it sells securities to the Portfolio to repurchase the securities at a mutually agreed upon price and time. During the term of a repurchase agreement, the value of the underlying securities held as collateral on behalf of the Portfolio including accrued interest, is required to exceed the value of the repurchase agreement, including accrued interest.
The Portfolio monitors, on a daily basis, the value of the collateral to ensure it is at least equal to the Portfolio’s principal amount of the repurchase agreement (including accrued interest). The underlying securities are ordinarily United States Government or Government Agency securities, but may consist of other securities. The use of repurchase agreements involves certain risks including counterparty risks. In the event of a default by the counterparty, realization of the collateral proceeds could be delayed, during which the value of the collateral may decline.
As of December 31, 2018, the Portfolio had invested in repurchase agreements with the gross values of $11,134,000,000 and associated collateral equal to $11,396,172,315.
4. Fees and Transactions with Affiliates
Advisory and Administrator Fee
The Trust has entered into an investment advisory agreement with SSGA Funds Management, Inc. (the “Adviser” or “SSGA FM”), a subsidiary of State Street Corporation and an affiliate of State Street Bank and Trust Company (“State Street”), under which the Adviser directs the investments of the Portfolio in accordance with its investment objective, policies, and limitations. In compensation for the Adviser’s services as investment adviser, the Portfolio pays the Adviser a management fee at an annual rate of 0.05% of its average daily net assets. SSGA FM also serves as administrator.
Custodian, Sub-Administrator and Transfer Agent Fees
State Street serves as the custodian, sub-administrator and transfer agent to the Portfolio. For its services as custodian, sub-administrator and transfer agent, the Portfolio pays State Street an annual fee. The fees are accrued daily and paid monthly.
STATE STREET MASTER FUNDS
STATE STREET U.S. GOVERNMENT MONEY MARKET PORTFOLIO
NOTES TO FINANCIAL STATEMENTS (continued)
December 31, 2018
5. Trustees’ Fees
The fees and expenses of the Trust’s trustees, who are not “interested persons” of the Trust, as defined in the 1940 Act (“Independent Trustees”), are paid directly by the Portfolio. The Independent Trustees are reimbursed for travel and other out-of-pocket expenses in connection with meeting attendance and industry seminars.
6. Income Tax Information
The Portfolio is not required to pay federal income taxes on its net investment income and net capital gains because it is treated as a partnership for federal income tax purposes. All interest, gains and losses of the Portfolio are deemed to have been “passed through” to the Portfolio’s partners in proportion to their holdings in the Portfolio, regardless of whether such items have been distributed by the Portfolio. Each partner is responsible for its tax liability based on its distributive share; therefore, no provision has been made for federal income taxes.
The Portfolio files federal and various state and local tax returns as required. No income tax returns are currently under examination. Generally, the federal returns are subject to examination by the Internal Revenue Service for a period of three years from date of filing, while the state returns may remain open for an additional year depending upon jurisdiction. SSGA FM has analyzed the Portfolio’s tax positions taken on tax returns for all open years and does not believe there are any uncertain tax positions that would require recognition of a tax liability.
As of December 31, 2018, the cost of investments for federal income tax purposes was substantially the same as the cost for financial reporting purposes.
7. Risks
Concentration Risk
As a result of the Portfolio's ability to invest a large percentage of its assets in obligations of issuers within the same country, state, region, currency or economic sector, an adverse economic, business or political development may affect the value of the Portfolio’s investments more than if the Portfolio was more broadly diversified.
Market, Credit and Counterparty Risk
In the normal course of business, the Portfolio trades securities and enters into financial transactions where risk of potential loss exists due to changes in global economic conditions and fluctuations of the market (market risk). Additionally, the Portfolio may also be exposed to counterparty risk in the event that an issuer or guarantor fails to perform or that an institution or entity with which the Portfolio has unsettled or open transactions defaults. The value of securities held by the Portfolio may decline in response to certain events, including those directly involving the companies whose securities are owned by the Portfolio; conditions affecting the general economy; overall market changes; local, regional or global political, social or economic instability; and currency and interest rate and price fluctuations (credit risk).
Financial assets, which potentially expose the Portfolio to market, credit and counterparty risks, consist principally of investments and cash due from counterparties. The extent of the Portfolio’s exposure to market, credit and counterparty risks in respect to these financial assets approximates their value as recorded in the Portfolio’s Statement of Assets and Liabilities, less any collateral held by the Portfolio.
8. Recent Accounting Pronouncements
In March 2017, the Financial Accounting Standards Board (FASB) issued Accounting Standards Update (ASU) No. 2017-08, Receivables — Nonrefundable Fees and Other Costs (Subtopic 310-20): Premium Amortization on Purchased Callable Debt Securities. The amendments in the ASU shorten the amortization period for certain callable debt securities, held at a premium, to be amortized to the earliest call date. The ASU does not require an accounting change for securities held at a discount; which continues to be amortized to maturity. The ASU is effective for fiscal years and interim periods within those fiscal years beginning after December 15, 2018. Management is currently evaluating the impact, if any, of applying this provision.
STATE STREET MASTER FUNDS
STATE STREET U.S. GOVERNMENT MONEY MARKET PORTFOLIO
NOTES TO FINANCIAL STATEMENTS (continued)
December 31, 2018
In August 2018, the U.S. Securities and Exchange Commission (the “SEC”) released its Final Rule on Disclosure Update and Simplification (the “Final Rule”) which is intended to simplify an issuer’s disclosure compliance efforts by removing redundant or outdated disclosure requirements without significantly altering the mix of information provided to investors. The Portfolio has adopted the Final Rule for the current period.
9. Subsequent Events
Management has evaluated the impact of all subsequent events on the Portfolio through the date the financial statements were issued and has determined that there were no subsequent events requiring adjustment or disclosure in the financial statements.
STATE STREET MASTER FUNDS
STATE STREET U.S. GOVERNMENT MONEY MARKET PORTFOLIO
REPORT OF INDEPENDENT REGISTERED PUBLIC ACCOUNTING FIRM
To the Owners of Beneficial Interest and the Board of Trustees of State Street U.S. Government Money Market Portfolio
Opinion on the Financial Statements
We have audited the accompanying statement of assets and liabilities of State Street U.S. Government Money Market Portfolio (the “Portfolio”) (one of the portfolios constituting State Street Master Funds (the “Trust”)), including the schedule of investments, as of December 31, 2018, and the related statement of operations for the year then ended, the statements of changes in net assets for each of the two years in the period then ended, the financial highlights for each of the five years in the period then ended and the related notes (collectively referred to as the “financial statements”). In our opinion, the financial statements present fairly, in all material respects, the financial position of the Portfolio (one of the portfolios constituting State Street Master Funds) at December 31, 2018, the results of its operations for the year then ended, the changes in its net assets for each of the two years in the period then ended and its financial highlights for each of the five years in the period then ended, in conformity with U.S. generally accepted accounting principles.
Basis for Opinion
These financial statements are the responsibility of the Portfolio’s management. Our responsibility is to express an opinion on the Portfolio’s financial statements based on our audits. We are a public accounting firm registered with the Public Company Accounting Oversight Board (United States) (“PCAOB”) and are required to be independent with respect to the Trust in accordance with the U.S. federal securities laws and the applicable rules and regulations of the Securities and Exchange Commission and the PCAOB.
We conducted our audits in accordance with the standards of the PCAOB. Those standards require that we plan and perform the audit to obtain reasonable assurance about whether the financial statements are free of material misstatement, whether due to error or fraud. The Trust is not required to have, nor were we engaged to perform, an audit of the Trust’s internal control over financial reporting. As part of our audits we are required to obtain an understanding of internal control over financial reporting, but not for the purpose of expressing an opinion on the effectiveness of the Trust’s internal control over financials reporting. Accordingly, we express no such opinion.
Our audits included performing procedures to assess the risks of material misstatement of the financial statements, whether due to error or fraud, and performing procedures that respond to those risks. Such procedures included examining, on a test basis, evidence regarding the amounts and disclosures in the financial statements. Our procedures included confirmation of securities owned as of December 31, 2018, by correspondence with the custodian, brokers and others or by other appropriate auditing procedures where replies from brokers and others were not received. Our audits also included evaluating the accounting principles used and significant estimates made by management, as well as evaluating the overall presentation of the financial statements. We believe that our audits provide a reasonable basis for our opinion.
We have served as the auditor of one or more State Street Global Advisors investment companies since 2000.
Boston, Massachusetts
February 27, 2019
STATE STREET MASTER FUNDS
STATE STREET U.S. GOVERNMENT MONEY MARKET PORTFOLIO
OTHER INFORMATION
December 31, 2018 (Unaudited)
Expense Example
As a shareholder of a Portfolio, you incur two types of costs: (1) transaction costs, including sales charges (loads), if applicable, on purchase payments, reinvested dividends, or other distributions and (2) ongoing costs, including advisory fees and to the extent applicable, distribution (12b-1) and/or service fees; and other Portfolio expenses. This example is intended to help you understand your ongoing costs (in dollars) of investing in the Portfolio and to compare these costs with the ongoing costs of investing in other mutual funds. It is based on an investment of $1,000 made at the beginning of the period shown and held for the entire period from July 1, 2018 to December 31, 2018.
The table below illustrates your Portfolio's cost in two ways:
Based on actual fund return ——This section helps you to estimate the actual expenses that you paid over the period. The “Ending Account Value” shown is derived from the Portfolio's actual return, and the third column shows the dollar amount that would have been paid by an investor who started with $1,000 in the Portfolio. You may use the information here, together with the amount you invested, to estimate the expenses that you paid over the period. To do so, simply divide your account value by $1,000 (for example, an $8,600 account value divided by $1,000 = 8.6), then multiply the result by the number given for the Portfolio under the heading “Expenses Paid During Period”.
Based on hypothetical 5% return ——This section is intended to help you compare your Portfolio's costs with those of other mutual funds. It assumes that the Portfolio had a yearly return of 5% before expenses, but that the expense ratio is unchanged. In this case, because the return used is not the Portfolio's actual return, the results do not apply to your investment. The example is useful in making comparisons because the SEC requires all mutual funds to calculate expenses based on a 5% return. You can assess your Portfolio's costs by comparing this hypothetical example with the hypothetical examples that appear in shareholder reports of other funds.
Please note that the expenses shown in the table are meant to highlight your ongoing costs only and do not reflect any transaction costs, such as sales load charges (loads). Therefore, the hypothetical 5% return section of the table is useful in comparing ongoing costs only, and will not help you determine the relative total costs of owning different funds. In addition, if these transaction costs were included, your costs would have been higher.
| | | | Actual | | Hypothetical (assuming a 5%
return before expenses) |
| | Annualized
Expense Ratio | | Ending Account
Value | | Expenses Paid
During Period(a) | | Ending Account
Value | | Expenses Paid
During Period(a) |
State Street U.S. Government Money Market Portfolio
| 0.07% | | $1,010.30 | | $0.35 | | $1,024.90 | | $0.36 |
| (a) | Expenses are equal to the Portfolio's annualized net expense ratio multiplied by the average account value of the period, multiplied by 184, then divided by 365. |
STATE STREET MASTER FUNDS
STATE STREET U.S. GOVERNMENT MONEY MARKET PORTFOLIO
OTHER INFORMATION (continued)
December 31, 2018 (Unaudited)
Proxy Voting Policies and Procedures and Records
The Portfolio has adopted the proxy voting policies of the Adviser. A description of the policies and procedures that the Portfolio has adopted to determine how to vote proxies relating to portfolio securities are contained in the Portfolio’s Statement of Additional Information, which is available (i) without charge, upon request, by calling the Portfolio at 1-877-521-4083 (toll free) or (ii) on the SEC’s website at www.sec.gov. Information regarding how the Portfolio voted proxies, if any, during the most recent 12-month period ended June 30 is available by August 31 of each year without charge (1) by calling 1-877-521-4083 (toll free), or (2) on the website of the SEC at www.sec.gov.
Quarterly Portfolio Schedule
The Portfolio will file its complete schedule of investments with the SEC for the first and third quarters of each fiscal year on Form N-Q. The Portfolio’s Form N-Q is available (i) without charge, upon request, by calling the Portfolio at 1-877-521-4083 (toll free) or (ii) on the SEC’s website at www.sec.gov.
Monthly Portfolio Schedule
The Portfolio files its monthly portfolio holdings with the SEC on Form N-MFP. The Portfolio’s Form N-MFP is available on the SEC’s website at www.sec.gov.
Special Meeting of Shareholders — Voting Results
A special meeting of shareholders of State Street Master Funds (the “Trust”) was held on December 18, 2018 to elect the following four nominees as Trustees of the Trust: Michael A. Jessee, Ellen M. Needham, Donna M. Rapaccioli and John R. Costantino. At the meeting the following votes were recorded:
| Nominee | Shares For | Shares Withheld |
| Michael A. Jessee | 70,681,020,370.077 | 7,661,214,196.910 |
| Ellen M. Needham | 77,884,129,343.272 | 458,105,223.715 |
| Donna M. Rapaccioli | 78,036,680,506.030 | 305,554,060.957 |
| John R. Costantino | 78,035,382,515.554 | 306,852,051.433 |
| The other Trustees whose term of office continued after the meeting are as follows: James E. Ross, Michael F. Holland, Patrick J. Riley, Richard D. Shirk, Bruce D. Taber and Rina K. Spence. |
STATE STREET MASTER FUNDS
STATE STREET U.S. GOVERNMENT MONEY MARKET PORTFOLIO
OTHER INFORMATION (continued)
December 31, 2018 (Unaudited)
TRUSTEES AND OFFICERS INFORMATION
Name, Address
and Year of Birth | | Position(s) Held with Trust | | Term of
Office and
Length of
Time Served | | Principal Occupation During the Past Five Years and Relevant Experience | | Number of Funds in Fund Complex Overseen by Trustee† | | Other
Directorships
Held by Trustee
During the
Past Five Years |
| Trustees | | | | | | | | | | |
| Independent Trustees | | | | | | | | | | |
Michael F. Holland
c/o SSGA Funds
Management, Inc.
One Iron Street
Boston, MA 02210
YOB: 1944 | | Trustee and
Co-
Chairperson
of the Board | | Term: Indefinite
Elected: 7/99 | | Chairman, Holland & Company L.L.C. (investment adviser) (1995- present). | | 67 | | Director, the Holland Series Fund, Inc.; Director, The China Fund, Inc.; Director, The Taiwan Fund, Inc. (2007-2017); Director, Reaves Utility Income Fund, Inc.; and Director, Blackstone/GSO Loans (and Real Estate) Funds. |
Patrick J. Riley
c/o SSGA Funds
Management, Inc.
One Iron Street
Boston, MA 02210
YOB: 1948 | | Trustee and
Co-
Chairperson
of the Board | | Term: Indefinite
Elected: 1/14 | | 2002 to May 2010, Associate Justice of the Superior Court, Commonwealth of Massachusetts; 1985 to 2002, Partner, Riley, Burke & Donahue, L.L.P. (law firm); 1998 to Present, Independent Director, State Street Global Advisers Ireland, Ltd. (investment company); 1998 to Present, Independent Director, SSGA Liquidity plc (formerly, SSGA Cash Management Fund plc); January 2009 to Present, Independent Director, SSGA Fixed Income plc; and January 2009 to Present, Independent Director, SSGA Qualified Funds PLC. | | 67 | | Board Director and Chairman, SPDR Europe 1PLC Board (2011-Present); Board Director and Chairman, SPDR Europe II, PLC (2013- Present). |
John R. Costantino
c/o SSGA Funds
Management, Inc.
One Iron Street
Boston, MA 02210
YOB: 1946 | | Trustee and
Co-
Chairperson
of the Qualified
Legal and
Compliance Committee | | Term: Indefinite
Elected: 12/18 | | General Partner, NGN Capital LLC (2006 – present); and Managing Director, Vice President of Walden Capital Management (1996 – present). | | 67 | | Trustee of Neuroscience Research Institute (1986 – present); Trustee of Fordham University (1989 – 1995 and 2001 – 2007) and Trustee Emeritus (2007 – present); Trustee of GE Funds (1993 – February 2011); Director of Artes Medical (2006 – 2008); and Trustee of Gregorian University Foundation (1992 – 2007). |
Richard D. Shirk
c/o SSGA Funds
Management, Inc.
One Iron Street
Boston, MA 02210
YOB: 1945 | | Trustee and
Co-
Chairperson
of the Qualified
Legal and
Compliance Committee | | Term: Indefinite
Elected: 1/14 | | March 2001 to April 2002, Chairman (1996 to March 2001, President and Chief Executive Officer), Cerulean Companies, Inc. (holding company) (Retired); 1992 to March 2001, President and Chief Executive Officer, Blue Cross Blue Shield of Georgia (health insurer, managed healthcare). | | 67 | | 1998 to December 2008, Chairman, Board Member and December 2008 to Present, Investment Committee Member, Healthcare Georgia Foundation (private foundation); September 2002 to 2012, Lead Director and Board Member, Amerigroup Corp. (managed health care); 1999 to 2013, Board Member and (since 2001) Investment Committee Member, Woodruff Arts Center; and 2003 to 2009, Trustee, Gettysburg College; Board member, Aerocare Holdings, Regenesis Biomedical Inc. |
Rina K. Spence
c/o SSGA Funds
Management, Inc.
One Iron Street
Boston, MA 02210
YOB: 1948 | | Trustee and Co-
Chairperson of the Audit Committee,
Co-Chairperson of the Nominating Committee and
Co-
Chairperson of the Governance Committee | | Term: Indefinite
Elected: 7/99 | | President of SpenceCare International LLC (international healthcare consulting) (1999 – present); Chief Executive Officer, IEmily.com (health internet company) (2000 – 2001); Chief Executive Officer of Consensus Pharmaceutical, Inc. (1998 – 1999); Founder, President and Chief Executive Officer of Spence Center for Women’s Health (1994 – 1998); President and CEO, Emerson Hospital (1984 – 1994); Honorary Consul for Monaco in Boston (2015 – present). | | 67 | | |
STATE STREET MASTER FUNDS
STATE STREET U.S. GOVERNMENT MONEY MARKET PORTFOLIO
OTHER INFORMATION (continued)
December 31, 2018 (Unaudited)
Name, Address
and Year of Birth | | Position(s) Held with Trust | | Term of
Office and
Length of
Time Served | | Principal Occupation During the Past Five Years and Relevant Experience | | Number of Funds in Fund Complex Overseen by Trustee† | | Other
Directorships
Held by Trustee
During the
Past Five Years |
Bruce D. Taber
c/o SSGA Funds
Management, Inc.
One Iron Street
Boston, MA 02210
YOB: 1943 | | Trustee and Co-
Chairperson of the Valuation Committee, Co-
Chairperson of the Nominating Committee and Co
-Chairperson of the Governance Committee | | Term: Indefinite
Elected: 1/14 | | Retired; 1999 to 2016, Partner, Zenergy LLC (a technology company providing Computer Modeling and System Analysis to the General Electric Power Generation Division); Until December 2008, Independent Director, SSGA Cash Management Fund plc; Until December 2008, Independent Director, State Street Global Advisers Ireland, Ltd. (investment companies). | | 49 | | None. |
Michael A. Jessee
c/o SSGA Funds
Management, Inc.
One Iron Street
Boston, MA 02210
YOB: 1946 | | Trustee and Co-
Chairperson
of the Valuation Committee | | Term: Indefinite
Appointed: 7/16 | | Retired; formerly, President and Chief Executive Officer of the Federal Home Loan Bank of Boston (1989 – 2009); Trustee, Randolph-Macon College (2004-2016). | | 67 | | None. |
Donna M. Rapaccioli
c/o SSGA Funds
Management, Inc.
One Iron Street
Boston, MA 02210
YOB: 1962 | | Trustee and Co-
Chairperson
of the Audit Committee | | Term: Indefinite
Elected: 12/18 | | Dean of the Gabelli School of Business (2007 – present) and Accounting Professor (1987 – present) at Fordham University. | | 67 | | Director- Graduate Management Admissions Council (2015 - present); Trustee of Emmanuel College (2010 – present). |
| Interested Trustees(1) | | | | | | | | | | |
James E. Ross(2)
SSGA Funds Management, Inc.
One Iron Street
Boston, MA 02210
YOB: 1965 | | Trustee | | Term: Indefinite
Appointed: 2/07 | | Chairman and Director, SSGA Funds Management, Inc. (2005-present); Executive Vice President, State Street Global Advisors (2012-present); Chief Executive Officer and Director, State Street Global Advisors Funds Distributors, LLC (May 2017 – present); Director, State Street Global Markets, LLC (2013 - April 2017); President, SSGA Funds Management, Inc. (2005 – 2012), Principal, State Street Global Advisors (2000-2005). | | 185 | | SSGA SPDR ETFs Europe I plc (Director) (November 2016 – present); SSGA SPDR ETFs Europe II plc (Director) (November 2016 – present). |
Ellen M. Needham(3)
SSGA Funds Management, Inc.
One Iron Street
Boston, MA 02210
YOB: 1967 | | Trustee and President | | Term: Indefinite
Elected 12/18 | | President and Director, SSGA FM (2001 – present)*; Senior Managing Director, State Street Global Advisors (1992 – present)*; Director, State Street Global Advisors Funds Distributors, LLC (May 2017 – present).* | | 67 | | None. |
| † For the purpose of determining the number of portfolios overseen by the Trustees, “Fund Complex” comprises registered investment companies for which SSGA Funds Management, Inc. serves as investment adviser. |
| (1) The individuals listed below are Trustees who are “interested persons,” as defined in the 1940 Act, of the Trusts (“Interested Trustees”). |
| (2) Mr. Ross is an Interested Trustee because of his employment by SSGA Funds Management, Inc., an affiliate of the Trust. |
| (3) Ms. Needham is an Interested Trustee because of her employment by SSGA Funds Management, Inc., an affiliate of the Trust. |
| * Served in various capacities and/or with various affiliated entities during noted time period. |
| The following lists the principal officers for the Trust, as well as their mailing addresses and ages, positions with the Trust and length of time served, and present and principal occupations: |
STATE STREET MASTER FUNDS
STATE STREET U.S. GOVERNMENT MONEY MARKET PORTFOLIO
OTHER INFORMATION (continued)
December 31, 2018 (Unaudited)
Name, Address
and Year of Birth | | Position(s) Held with Trust | | Term of
Office and
Length of
Time Served | | Principal Occupation(s) During the Past 5 Years |
| Officers | | | | | | |
ELLEN M. NEEDHAM
SSGA Funds Management, Inc.
One Iron Street
Boston, MA 02210
YOB: 1967 | | President, Trustee | | Term: Indefinite
Elected: 10/12 | | President and Director, SSGA Funds Management, Inc. (2001 - present)*; Senior Managing Director, State Street Global Advisors (1992 - present); Director, State Street Global Advisors Funds Distributors, LLC (May 2017 - present).* |
BRUCE S. ROSENBERG
SSGA Funds Management, Inc.
One Iron Street
Boston, MA 02210
YOB: 1961 | | Treasurer | | Term: Indefinite
Elected: 2/16 | | Managing Director, State Street Global Advisors and SSGA Funds Management, Inc. (July 2015 - present); Director, Credit Suisse (April 2008 - July 2015). |
ANN M. CARPENTER
SSGA Funds Management, Inc.
One Iron Street
Boston, MA 02210
YOB: 1966 | | Vice
President
and Deputy
Treasurer | | Term: Indefinite
Elected: 10/12
Term: Indefinite
Elected: 2/16 | | Chief Operating Officer, SSGA Funds Management, Inc. (2005 - Present)*; Managing Director, State Street Global Advisors (2005 - present).* |
CHAD C. HALLETT
SSGA Funds Management, Inc.
One Iron Street
Boston, MA 02210
YOB: 1969 | | Deputy Treasurer | | Term: Indefinite
Elected: 2/16 | | Vice President, State Street Global Advisors and SSGA Funds Management, Inc. (November 2014 – present); Vice President, State Street Bank and Trust Company (2001 –November 2014).* |
DARLENE ANDERSON-VASQUEZ
SSGA Funds Management, Inc.
One Iron Street
Boston, MA 02210
YOB: 1968 | | Deputy Treasurer | | Term: Indefinite
Elected: 11/16 | | Managing Director, State Street Global Advisors and SSGA Funds Management, Inc. (May 2016 – present); Senior Vice President, John Hancock Investments (September 2007 – May 2016). |
ARTHUR A. JENSEN
SSGA Funds Management, Inc.
1600 Summer Street
Stamford, CT 06905
YOB: 1966 | | Deputy Treasurer | | Term: Indefinite
Elected: 11/16 | | Vice President at State Street Global Advisors (July 2016 – present); Deputy Treasurer of Elfun Funds (July 2016 – present); Treasurer of State Street Institutional Funds, State Street Variable Insurance Series Funds, Inc. and GE Retirement Savings Plan Funds (June 2011 – present); Treasurer of Elfun Funds (June 2011– July 2016); Mutual Funds Controller of GE Asset Management Incorporated (April 2011 – July 2016). |
SUJATA UPRETI
SSGA Funds Management, Inc.
One Iron Street
Boston, MA 02210
YOB: 1974 | | Assistant
Treasurer | | Term: Indefinite
Elected: 2/16 | | Vice President, State Street Global Advisors and SSGA Funds Management, Inc. (May 2015 – present); Assistant Director, Cambridge Associates, LLC (July 2014 – January 2015); Vice President, Bank of New York Mellon (July 2012 – August 2013); Manager, PricewaterhouseCoopers, LLP (September 2003 – July 2012). |
DANIEL FOLEY
SSGA Funds Management, Inc.
One Iron Street
Boston, MA 02210
YOB: 1972 | | Assistant
Treasurer | | Term: Indefinite
Elected: 2/16 | | Vice President, State Street Global Advisors and SSGA Funds Management, Inc. (April 2007 – present).* |
DANIEL G. PLOURDE
SSGA Funds Management, Inc.
One Iron Street
Boston, MA 02210
YOB: 1980 | | Assistant
Treasurer | | Term: Indefinite
Elected: 5/17 | | Vice President, State Street Global Advisors and SSGA Funds Management, Inc. (May 2015 – present); Officer, State Street Bank and Trust Company (March 2009 – May 2015). |
BRIAN HARRIS
SSGA Funds Management, Inc.
One Iron Street
Boston, MA 02210
YOB: 1973 | | Chief Compliance Officer, Anti-Money Laundering Officer and Code of Ethics Compliance Officer | | Term: Indefinite
Elected: 11/13
Term: Indefinite
Elected: 9/16 | | Managing Director, State Street Global Advisors and SSGA Funds Management, Inc. (2013—Present); Senior Vice President and Global Head of Investment Compliance, BofA Global Capital Management (September 2010 – May 2013). |
STATE STREET MASTER FUNDS
STATE STREET U.S. GOVERNMENT MONEY MARKET PORTFOLIO
OTHER INFORMATION (continued)
December 31, 2018 (Unaudited)
Name, Address
and Year of Birth | | Position(s) Held with Trust | | Term of
Office and
Length of
Time Served | | Principal Occupation(s) During the Past 5 Years |
JOSHUA A. WEINBERG
SSGA Funds Management, Inc.
One Iron Street
Boston, MA 02210
YOB: 1978 | | Chief Legal Officer | | Term: Indefinite
Elected: 2/15 | | Managing Director and Managing Counsel, State Street Global Advisors (2011 – present)*; Clerk, SSGA Funds Management, Inc. (2013 – present); Associate, Financial Services Group, Dechert LLP (2005 – 2011). |
JESSE D. HALLEE
State Street Bank and Trust Company
100 Summer Street,
7th Floor
Boston, MA 02111-2900
YOB: 1976 | | Secretary | | Term: Indefinite
Elected: 9/16 | | Vice President and Managing Counsel, State Street Bank and Trust Company (2013 – present); Vice President and Counsel, Brown Brothers Harriman & Co. (2007-2013). |
KHIMMARA GREER
State Street Bank and Trust Company
100 Summer Street,
7th Floor
Boston, MA 02111-2900
YOB: 1983 | | Assistant Secretary | | Term: Indefinite
Elected: 5/16 | | Vice President and Counsel, State Street Bank and Trust Company (2015- present); Regulatory Advisor, JPMorgan (2014 – 2015); Claims Case Manager, Liberty Mutual Insurance (2012 – 2014); Contract Attorney, Various Law Firms (2011 – 2012). |
| * Served in various capacities and/or with various affiliated entities during noted time period. |
| Statement of Additional Information (SAI) includes additional information about Portfolio's directors and is available, without charge, upon request and by calling 1-877-521-4083. |
Trustees
John R. Costantino
Michael F. Holland
Michael A. Jessee
Ellen M. Needham
Donna M. Rapaccioli
Patrick J. Riley
James E. Ross
Richard D. Shirk
Rina K. Spence
Bruce D. Taber
Investment Adviser and Administrator
SSGA Funds Management, Inc.
One Iron Street
Boston, MA 02210
Custodian, Sub-Administrator and Transfer Agent
State Street Bank and Trust Company
State Street Financial Center
One Lincoln Street
Boston, MA 02111
Independent Registered Public Accounting Firm
Ernst & Young LLP
200 Clarendon Street
Boston, MA 02116
Legal Counsel
Ropes & Gray LLP
800 Boylston Street
Boston, MA 02199
This report is for shareholder information. This is not a prospectus intended for use in the purchase or sale of shares of beneficial interest.
State Street Master Funds
State Street Bank and Trust Company
P.O. Box 5049
Boston, MA 02206
STTUSGOVAR1
00227374
The information contained in this report is intended for the general information of shareholders of the Portfolio and shareholders of any fund invested in the Portfolio. Interests in the Portfolio are offered solely to eligible investors in private placement transactions that do not involve any “public offering” within the meaning of Section 4(a)(2) of the 1933 Act. This report is not authorized for distribution (i) to prospective investors in any fund invested in the Portfolio unless preceded or accompanied by a current offering document for such fund or (ii) to prospective eligible investors in the Portfolio unless preceded or accompanied by a current offering document of the Portfolio. Eligible investors in the Portfolio may obtain a current Portfolio offering document by calling 1-877-521-4083. Please read the offering document carefully before investing in the Portfolio.
Annual Report
December 31, 2018
State Street Master Funds
| State Street Treasury Money Market Portfolio |
The information contained in this report is intended for the general information of shareholders of the Portfolio and shareholders of any fund invested in the Portfolio. Interests in the Portfolio are offered solely to eligible investors in private placement transactions that do not involve any “public offering” within the meaning of Section 4(a)(2) of the 1933 Act. This report is not authorized for distribution (i) to prospective investors in any fund invested in the Portfolio unless preceded or accompanied by a current offering document for such fund or (ii) to prospective eligible investors in the Portfolio unless preceded or accompanied by a current offering document of the Portfolio. Eligible investors in the Portfolio may obtain a current Portfolio offering document by calling 1-877-521-4083. Please read the offering document carefully before investing in the Portfolio.
TABLE OF CONTENTS
The information contained in this report is intended for the general information of shareholders of the Portfolio and shareholders of any fund invested in the Portfolio. Interests in the Portfolio are offered solely to eligible investors in private placement transactions that do not involve any “public offering” within the meaning of Section 4(a)(2) of the 1933 Act. This report is not authorized for distribution (i) to prospective investors in any fund invested in the Portfolio unless preceded or accompanied by a current offering document for such fund or (ii) to prospective eligible investors in the Portfolio unless preceded or accompanied by a current offering document of the Portfolio. Eligible investors in the Portfolio may obtain a current Portfolio offering document by calling 1-877-521-4083. Please read the offering document carefully before investing in the Portfolio.
State Street Treasury Money Market Portfolio
PORTFOLIO STATISTICS (UNAUDITED)
Portfolio Composition as of December 31, 2018
| | | |
| | | % of Net Assets | |
| | Treasury Debt | 116.6% | |
| | Liabilities in Excess of Other Assets | (16.6) | |
| | TOTAL | 100.0% | |
(The composition is expressed as a percentage of net assets as of the date indicated. The composition will vary over time.)
Maturity Ladder as of December 31, 2018
| | | | |
| | | % of Net Assets | |
| | 2 to 30 Days | 52.7% | |
| | 31 to 60 Days | 31.7 | |
| | 61 to 90 Days | 7.3 | |
| | Over 90 Days | 24.9 | |
| | Total | 116.6% | |
| | Average days to maturity | 36 | |
| | Weighted average life | 75 | |
(The maturity ladder is expressed as a percentage of net assets as of the date indicated. The composition will vary over time.)
See accompanying notes to financial statements.
1
STATE STREET MASTER FUNDS
STATE STREET TREASURY MONEY MARKET PORTFOLIO
SCHEDULE OF INVESTMENTS
December 31, 2018
| Name of Issuer and Title of Issue | | Interest Rate | | Next Rate Reset Date | | Maturity Date | | Principal Amount | | Value |
| TREASURY DEBT—116.6% | | | | | | | | | | |
U.S. Treasury Bill(a)
| | 2.140% | | 01/17/2019 | | 01/17/2019 | | $361,050,000 | | $360,688,419 |
U.S. Treasury Bill(a)
| | 2.175% | | 01/03/2019 | | 01/03/2019 | | 985,707,000 | | 985,586,623 |
U.S. Treasury Bill(a)
| | 2.220% | | 01/10/2019 | | 01/10/2019 | | 381,250,000 | | 381,039,899 |
U.S. Treasury Bill(a)
| | 2.240% | | 01/02/2019 | | 01/02/2019 | | 1,271,093,000 | | 1,271,012,746 |
U.S. Treasury Bill(a)
| | 2.260% | | 01/15/2019 | | 01/15/2019 | | 148,757,000 | | 148,625,079 |
U.S. Treasury Bill(a)
| | 2.269% | | 02/21/2019 | | 02/21/2019 | | 490,753,000 | | 489,135,831 |
U.S. Treasury Bill(a)
| | 2.275% | | 02/07/2019 | | 02/07/2019 | | 158,000,000 | | 157,625,108 |
U.S. Treasury Bill(a)
| | 2.281% | | 02/28/2019 | | 02/28/2019 | | 381,508,000 | | 380,076,094 |
U.S. Treasury Bill(a)
| | 2.285% | | 01/08/2019 | | 01/08/2019 | | 569,000,000 | | 568,747,732 |
U.S. Treasury Bill(a)
| | 2.300% | | 01/24/2019 | | 01/24/2019 | | 100,000,000 | | 99,853,056 |
U.S. Treasury Bill(a)
| | 2.310% | | 01/31/2019 | | 01/31/2019 | | 224,000,000 | | 223,569,650 |
U.S. Treasury Bill(a)
| | 2.315% | | 01/22/2019 | | 01/22/2019 | | 610,000,000 | | 609,170,930 |
U.S. Treasury Bill(a)
| | 2.326% | | 02/14/2019 | | 02/14/2019 | | 100,000,000 | | 99,714,000 |
U.S. Treasury Bill(a)
| | 2.350% | | 01/29/2019 | | 01/29/2019 | | 1,039,254,000 | | 1,037,376,101 |
U.S. Treasury Bill(a)
| | 2.365% | | 03/07/2019 | | 03/07/2019 | | 200,000,000 | | 199,145,972 |
U.S. Treasury Bill(a)
| | 2.370% | | 02/19/2019 | | 02/19/2019 | | 400,000,000 | | 398,709,668 |
U.S. Treasury Bill(a)
| | 2.375% | | 03/14/2019 | | 03/14/2019 | | 150,000,000 | | 149,287,500 |
U.S. Treasury Bill(a)
| | 2.380% | | 04/11/2019 | | 04/11/2019 | | 108,500,000 | | 107,782,694 |
U.S. Treasury Bill(a)
| | 2.388% | | 05/16/2019 | | 05/16/2019 | | 100,000,000 | | 99,104,687 |
U.S. Treasury Bill(a)
| | 2.390% | | 02/05/2019 | | 02/05/2019 | | 400,000,000 | | 399,070,556 |
U.S. Treasury Bill(a)
| | 2.415% | | 03/28/2019 | | 03/28/2019 | | 400,250,000 | | 397,940,891 |
U.S. Treasury Bill(a)
| | 2.415% | | 04/18/2019 | | 04/18/2019 | | 84,750,000 | | 84,141,672 |
U.S. Treasury Bill(a)
| | 2.420% | | 02/26/2019 | | 02/26/2019 | | 423,000,000 | | 421,436,075 |
U.S. Treasury Bill(a)
| | 2.430% | | 05/02/2019 | | 05/02/2019 | | 77,000,000 | | 76,371,103 |
U.S. Treasury Bill(a)
| | 2.465% | | 04/04/2019 | | 04/04/2019 | | 500,000,000 | | 496,884,514 |
U.S. Treasury Bill(a)
| | 2.465% | | 05/23/2019 | | 05/23/2019 | | 175,500,000 | | 173,798,554 |
U.S. Treasury Bill(a)
| | 2.475% | | 05/30/2019 | | 05/30/2019 | | 97,000,000 | | 96,006,356 |
U.S. Treasury Bill(a)
| | 2.480% | | 06/13/2019 | | 06/13/2019 | | 54,000,000 | | 53,393,640 |
U.S. Treasury Bill(a)
| | 2.480% | | 06/27/2019 | | 06/27/2019 | | 50,000,000 | | 49,390,333 |
U.S. Treasury Bill(a)
| | 2.505% | | 07/05/2019 | | 07/05/2019 | | 108,625,000 | | 107,241,796 |
U.S. Treasury Note(a)
| | 2.373% | | 02/28/2019 | | 02/28/2019 | | 69,000,000 | | 68,903,569 |
U.S. Treasury Note(a)
| | 2.443% | | 03/31/2019 | | 03/31/2019 | | 22,000,000 | | 21,936,332 |
U.S. Treasury Note(a)
| | 2.457% | | 04/15/2019 | | 04/15/2019 | | 49,400,000 | | 49,179,399 |
U.S. Treasury Note, 3 Month USD MMY(b)
| | 2.481% | | 01/01/2019 | | 01/31/2020 | | 385,000,000 | | 384,926,880 |
U.S. Treasury Note, 3 Month USD MMY + 0.03%(b)
| | 2.514% | | 01/01/2019 | | 04/30/2020 | | 335,500,000 | | 335,520,241 |
U.S. Treasury Note, 3 Month USD MMY + 0.04%(b)
| | 2.524% | | 01/01/2019 | | 07/31/2020 | | 127,200,000 | | 127,236,050 |
U.S. Treasury Note, 3 Month USD MMY + 0.05%(b)
| | 2.529% | | 01/01/2019 | | 10/31/2019 | | 112,000,000 | | 112,050,548 |
U.S. Treasury Note, 3 Month USD MMY + 0.06%(b)
| | 2.541% | | 01/01/2019 | | 07/31/2019 | | 150,000,000 | | 150,080,271 |
U.S. Treasury Note, 3 Month USD MMY + 0.07%(b)
| | 2.551% | | 01/01/2019 | | 04/30/2019 | | 85,800,000 | | 85,809,423 |
U.S. Treasury Note, 3 Month USD MMY + 0.14%(b)
| | 2.621% | | 01/01/2019 | | 01/31/2019 | | 632,000,000 | | 632,105,982 |
TOTAL INVESTMENTS –116.6% (c)(d)
| | | | | | | | | | 12,089,675,974 |
Liabilities in Excess of Other Assets —(16.6)%
| | | | | | | | | | (1,716,707,261) |
NET ASSETS –100.0%
| | | | | | | | | | $10,372,968,713 |
| (a) | Rate shown is the discount rate at time of purchase. |
| (b) | Variable Rate Security - Interest rate shown is rate in effect at December 31, 2018. For securities based on a published reference rate and spread, the reference rate and spread are indicated in the description above. |
| (c) | Also represents the cost for federal tax purposes. |
| (d) | Unless otherwise indicated, the values of the securities of the Portfolio are determined based on Level 2 inputs (Note 2). |
See accompanying notes to financial statements.
2
STATE STREET MASTER FUNDS
STATE STREET TREASURY MONEY MARKET PORTFOLIO
STATEMENT OF ASSETS AND LIABILITIES
December 31, 2018
| ASSETS | |
Investments in unaffiliated issuers, at value and cost
| $12,089,675,974 |
Cash
| 861 |
Interest receivable — unaffiliated issuers
| 8,239,860 |
Prepaid expenses and other assets
| 2,829 |
TOTAL ASSETS
| 12,097,919,524 |
| LIABILITIES | |
Payable for investments purchased
| 1,724,302,385 |
Advisory and administrator fee payable
| 408,688 |
Custody, sub-administration and transfer agent fees payable
| 187,884 |
Professional fees payable
| 42,493 |
Printing fees payable
| 8,187 |
Accrued expenses and other liabilities
| 1,174 |
TOTAL LIABILITIES
| 1,724,950,811 |
NET ASSETS
| $10,372,968,713 |
See accompanying notes to financial statements.
3
STATE STREET MASTER FUNDS
STATE STREET TREASURY MONEY MARKET PORTFOLIO
STATEMENT OF OPERATIONS
For the Year Ended December 31, 2018
| INVESTMENT INCOME | |
Interest income — unaffiliated issuers
| $208,649,848 |
| EXPENSES | |
Advisory and administrator fee
| 5,706,564 |
Custodian, sub-administrator and transfer agent fees
| 1,426,642 |
Trustees’ fees and expenses
| 208,990 |
Professional fees
| 159,072 |
Printing and postage fees
| 17,176 |
Insurance expense
| 56,897 |
Miscellaneous expenses
| 7,037 |
TOTAL EXPENSES
| 7,582,378 |
NET INVESTMENT INCOME (LOSS)
| $201,067,470 |
| REALIZED GAIN (LOSS) | |
| Net realized gain (loss) on: | |
Investments — unaffiliated issuers
| (90,111) |
NET INCREASE (DECREASE) IN NET ASSETS FROM OPERATIONS
| $200,977,359 |
See accompanying notes to financial statements.
4
STATE STREET MASTER FUNDS
STATE STREET TREASURY MONEY MARKET PORTFOLIO
STATEMENTS OF CHANGES IN NET ASSETS
| | Year Ended
12/31/18 | | Year Ended
12/31/17 |
| INCREASE (DECREASE) IN NET ASSETS FROM OPERATIONS: | | | |
Net investment income (loss)
| $201,067,470 | | $111,706,631 |
Net realized gain (loss)
| (90,111) | | 117,892 |
Net increase (decrease) in net assets resulting from operations
| 200,977,359 | | 111,824,523 |
| CAPITAL TRANSACTIONS | | | |
Contributions
| 23,045,517,549 | | 20,311,832,604 |
Withdrawals
| (25,879,128,300) | | (21,422,356,261) |
Net increase (decrease) in net assets from capital transactions
| (2,833,610,751) | | (1,110,523,657) |
Net increase (decrease) in net assets during the period
| (2,632,633,392) | | (998,699,134) |
Net assets at beginning of period
| 13,005,602,105 | | 14,004,301,239 |
NET ASSETS AT END OF PERIOD
| $10,372,968,713 | | $13,005,602,105 |
See accompanying notes to financial statements.
5
STATE STREET MASTER FUNDS
STATE STREET TREASURY MONEY MARKET PORTFOLIO
FINANCIAL HIGHLIGHTS
Selected data for a share outstanding throughout each period
| | Year
Ended
12/31/18 | | Year
Ended
12/31/17 | | Year
Ended
12/31/16 | | Year
Ended
12/31/15 | | Year
Ended
12/31/14 |
Total return (a)
| 1.80% | | 0.73% | | 0.25% | | (0.04)% | | (0.02)% |
| Ratios and Supplemental Data: | | | | | | | | | |
Net assets, end of period (in 000s)
| $10,372,969 | | $13,005,602 | | $14,004,301 | | $11,837,128 | | $10,247,460 |
| Ratios to average net assets: | | | | | | | | | |
Total expenses
| 0.07% | | 0.07% | | 0.07% | | 0.07% | | 0.07% |
Net investment income (loss)
| 1.76% | | 0.81% | | 0.25% | | (0.03)% | | (0.02)% |
| (a) | Results represent past performance and are not indicative of future results. Total return for periods of less than one year are not annualized. |
See accompanying notes to financial statements.
6
STATE STREET MASTER FUNDS
STATE STREET TREASURY MONEY MARKET PORTFOLIO
NOTES TO FINANCIAL STATEMENTS
December 31, 2018
1. Organization
State Street Master Funds (the “Trust”), a Massachusetts business trust registered under the Investment Company Act of 1940, as amended (“1940 Act”), is an open-end management investment company.
As of December 31, 2018, the Trust consists of six (6) series, each of which represents a separate series of beneficial interest in the Trust. State Street Treasury Money Market Portfolio (the “Portfolio”) is authorized to issue an unlimited number of shares of beneficial interest with no par value. The financial statements herein relate only to the Portfolio.
The Portfolio operates as a “government money market fund” within the meaning of Rule 2a-7 under the 1940 Act to comply with the amendments to Rule 2a-7 that became effective October 14, 2016. The Portfolio is not currently subject to liquidity fees or temporary suspensions of redemptions due to declines in the Portfolio's weekly liquid assets.
Under the Trust’s organizational documents, its officers and trustees are indemnified against certain liabilities arising out of the performance of their duties to the Trust. Additionally, in the normal course of business, the Trust enters into contracts with service providers that contain general indemnification clauses. The Trust’s maximum exposure under these arrangements is unknown as this would involve future claims that may be made against the Trust that have not yet occurred.
2. Summary of Significant Accounting Policies
The following is a summary of significant accounting policies followed by the Trust in the preparation of its financial statements:
The preparation of financial statements in accordance with U.S. generally accepted accounting principles (“U.S. GAAP”) requires management to make estimates and assumptions that affect the reported amounts and disclosures in the financial statements. Actual results could differ from those estimates. The Portfolio is an investment company under U.S. GAAP and follows the accounting and reporting guidance applicable to investment companies.
Security Valuation
The investments of the Portfolio are valued pursuant to the policy and procedures developed by the Oversight Committee (the “Committee”) and approved by the Board of Trustees of the Trust (the “Board”). The Committee provides oversight of the valuation of investments for the Portfolio. The Board has responsibility for overseeing the determination of the fair value of investments.
The Portfolio’s securities are recorded on the basis of amortized cost which approximates fair value as permitted by Rule 2a-7 under the 1940 Act. This method values a security at its cost on the date of purchase and, thereafter, assumes a constant amortization to maturity of any premiums or accretion of any discounts.
Because of the inherent uncertainties of valuation and under certain market conditions, the values reflected in the financial statements may differ from the value received upon actual sale of those investments and it is possible that the differences could be material.
Various inputs are used in determining the value of the Portfolio’s investments. The Portfolio values its assets and liabilities at fair value using a fair value hierarchy consisting of three broad levels that prioritize the inputs to valuation techniques giving the highest priority to readily available unadjusted quoted prices in active markets for identical assets or liabilities (Level 1 measurements) and the lowest priority to unobservable inputs (Level 3 measurements) when market prices are not readily available or reliable. The categorization of a value determined for an investment within the hierarchy is based upon the pricing transparency of the investment and is not necessarily an indication of the risk associated with investing in it.
The three levels of the fair value hierarchy are as follows:
• Level 1 – Unadjusted quoted prices in active markets for an identical asset or liability;
• Level 2 – Inputs other than quoted prices included within Level 1 that are observable for the asset or liability either directly or indirectly, including quoted prices for similar assets or liabilities in active markets, quoted prices for identical or similar assets or liabilities in markets that are not considered to be active, inputs other than quoted prices that are observable for the
STATE STREET MASTER FUNDS
STATE STREET TREASURY MONEY MARKET PORTFOLIO
NOTES TO FINANCIAL STATEMENTS (continued)
December 31, 2018
asset or liability (such as exchange rates, financing terms, interest rates, yield curves, volatilities, prepayment speeds, loss severities, credit risks and default rates) or other market-corroborated inputs; and
• Level 3 – Unobservable inputs for the asset or liability, including the Committee’s assumptions used in determining the fair value of investments.
Investment Transactions and Income Recognition
Investment transactions are accounted for on trade date for financial reporting purposes. Realized gains and losses from the sale or disposition of investments are determined using the identified cost method. Interest income is recorded daily on an accrual basis. All premiums and discounts are amortized/accreted for financial reporting purposes.
All of the net investment income and realized gains and losses from the security transactions of the Portfolio are allocated pro rata among the partners in the Portfolio on a daily basis based on each partner’s daily ownership percentage.
Expenses
Certain expenses, which are directly identifiable to a specific Portfolio, are applied to that Portfolio within the Trust. Other expenses which cannot be attributed to a specific Portfolio are allocated in such a manner as deemed equitable, taking into consideration the nature and type of expense and the relative net assets of the Portfolio within the Trust.
3. Fees and Transactions with Affiliates
Advisory and Administrator Fee
The Trust has entered into an investment advisory agreement with SSGA Funds Management, Inc. (the “Adviser” or “SSGA FM”), a subsidiary of State Street Corporation and an affiliate of State Street Bank and Trust Company (“State Street”), under which the Adviser directs the investments of the Portfolio in accordance with its investment objective, policies, and limitations. In compensation for the Adviser’s services as investment adviser, the Portfolio pays the Adviser a management fee at an annual rate of 0.05% of its average daily net assets. SSGA FM also serves as administrator.
Custodian, Sub-Administrator and Transfer Agent Fees
State Street serves as the custodian, sub-administrator and transfer agent to the Portfolio. For its services as custodian, sub-administrator and transfer agent, the Portfolio pays State Street an annual fee. The fees are accrued daily and paid monthly.
4. Trustees’ Fees
The fees and expenses of the Trust’s trustees, who are not “interested persons” of the Trust, as defined in the 1940 Act (“Independent Trustees”), are paid directly by the Portfolio. The Independent Trustees are reimbursed for travel and other out-of-pocket expenses in connection with meeting attendance and industry seminars.
5. Income Tax Information
The Portfolio is not required to pay federal income taxes on its net investment income and net capital gains because it is treated as a partnership for federal income tax purposes. All interest, gains and losses of the Portfolio are deemed to have been “passed through” to the Portfolio’s partners in proportion to their holdings in the Portfolio, regardless of whether such items have been distributed by the Portfolio. Each partner is responsible for its tax liability based on its distributive share; therefore, no provision has been made for federal income taxes.
The Portfolio files federal and various state and local tax returns as required. No income tax returns are currently under examination. Generally, the federal returns are subject to examination by the Internal Revenue Service for a period of three years from date of filing, while the state returns may remain open for an additional year depending upon jurisdiction. SSGA FM has analyzed the Portfolio’s tax positions taken on tax returns for all open years and does not believe there are any uncertain tax positions that would require recognition of a tax liability.
STATE STREET MASTER FUNDS
STATE STREET TREASURY MONEY MARKET PORTFOLIO
NOTES TO FINANCIAL STATEMENTS (continued)
December 31, 2018
As of December 31, 2018, the cost of investments for federal income tax purposes was substantially the same as the cost for financial reporting purposes.
6. Risks
Concentration Risk
As a result of the Portfolio's ability to invest a large percentage of its assets in obligations of issuers within the same country, state, region, currency or economic sector, an adverse economic, business or political development may affect the value of the Portfolio's investments more than if the Fund were more broadly diversified.
Market, Credit and Counterparty Risk
In the normal course of business, the Portfolio trades securities and enters into financial transactions where risk of potential loss exists due to changes in global economic conditions and fluctuations of the market (market risk). Additionally, the Portfolio may also be exposed to counterparty risk in the event that an issuer or guarantor fails to perform or that an institution or entity with which the Portfolio has unsettled or open transactions defaults. The value of securities held by the Portfolio may decline in response to certain events, including those directly involving the companies whose securities are owned by the Portfolio; conditions affecting the general economy; overall market changes; local, regional or global political, social or economic instability; and currency and interest rate and price fluctuations (credit risk).
Financial assets, which potentially expose the Portfolio to market, credit and counterparty risks, consist principally of investments and cash due from counterparties. The extent of the Portfolio’s exposure to market, credit and counterparty risks in respect to these financial assets approximates their value as recorded in the Portfolio’s Statement of Assets and Liabilities, less any collateral held by the Portfolio.
7. Recent Accounting Pronouncements
In March 2017, the Financial Accounting Standards Board (FASB) issued Accounting Standards Update (ASU) No. 2017-08, Receivables — Nonrefundable Fees and Other Costs (Subtopic 310-20): Premium Amortization on Purchased Callable Debt Securities. The amendments in the ASU shorten the amortization period for certain callable debt securities, held at a premium, to be amortized to the earliest call date. The ASU does not require an accounting change for securities held at a discount; which continues to be amortized to maturity. The ASU is effective for fiscal years and interim periods within those fiscal years beginning after December 15, 2018. Management is currently evaluating the impact, if any, of applying this provision.
In August 2018, the U.S. Securities and Exchange Commission (the “SEC”) released its Final Rule on Disclosure Update and Simplification (the “Final Rule”) which is intended to simplify an issuer’s disclosure compliance efforts by removing redundant or outdated disclosure requirements without significantly altering the mix of information provided to investors. The Portfolio has adopted the Final Rule for the current period.
8. Subsequent Events
Management has evaluated the impact of all subsequent events on the Portfolio through the date the financial statements were issued and has determined that there were no subsequent events requiring adjustment or disclosure in the financial statements.
STATE STREET MASTER FUNDS
STATE STREET TREASURY MONEY MARKET PORTFOLIO
REPORT OF INDEPENDENT REGISTERED PUBLIC ACCOUNTING FIRM
To the Owners of Beneficial Interest and the Board of Trustees of State Street Treasury Money Market Portfolio
Opinion on the Financial Statements
We have audited the accompanying statement of assets and liabilities of State Street Treasury Money Market Portfolio (the “Portfolio”) (one of the portfolios constituting State Street Master Funds (the “Trust”)), including the schedule of investments, as of December 31, 2018, and the related statement of operations for the year then ended, the statements of changes in net assets for each of the two years in the period then ended, the financial highlights for each of the five years in the period then ended and the related notes (collectively referred to as the “financial statements”). In our opinion, the financial statements present fairly, in all material respects, the financial position of the Portfolio (one of the portfolios constituting State Street Master Funds) at December 31, 2018, the results of its operations for the year then ended, the changes in its net assets for each of the two years in the period then ended and its financial highlights for each of the five years in the period then ended, in conformity with U.S. generally accepted accounting principles.
Basis for Opinion
These financial statements are the responsibility of the Trust’s management. Our responsibility is to express an opinion on the Portfolio’s financial statements based on our audits. We are a public accounting firm registered with the Public Company Accounting Oversight Board (United States) (“PCAOB”) and are required to be independent with respect to the Trust in accordance with the U.S. federal securities laws and the applicable rules and regulations of the Securities and Exchange Commission and the PCAOB.
We conducted our audits in accordance with the standards of the PCAOB. Those standards require that we plan and perform the audit to obtain reasonable assurance about whether the financial statements are free of material misstatement, whether due to error or fraud. The Trust is not required to have, nor were we engaged to perform, an audit of the Trust’s internal control over financial reporting. As part of our audits we are required to obtain an understanding of internal control over financial reporting, but not for the purpose of expressing an opinion on the effectiveness of the Trust’s internal control over financials reporting. Accordingly, we express no such opinion.
Our audits included performing procedures to assess the risks of material misstatement of the financial statements, whether due to error or fraud, and performing procedures that respond to those risks. Such procedures included examining, on a test basis, evidence regarding the amounts and disclosures in the financial statements. Our procedures included confirmation of securities owned as of December 31, 2018, by correspondence with the custodian, brokers and others or by other appropriate auditing procedures where replies from brokers and others were not received. Our audits also included evaluating the accounting principles used and significant estimates made by management, as well as evaluating the overall presentation of the financial statements. We believe that our audits provide a reasonable basis for our opinion.
We have served as the auditor of one or more State Street Global Advisors investment companies since 2000.
Boston, Massachusetts
February 27, 2019
STATE STREET MASTER FUNDS
STATE STREET TREASURY MONEY MARKET PORTFOLIO
OTHER INFORMATION
December 31, 2018 (Unaudited)
Expense Example
As a shareholder of the Portfolio, you incur two types of costs: (1) transaction costs, including sales charges (loads), if applicable, on purchase payments, reinvested dividends, or other distributions and (2) ongoing costs, including advisory fees and to the extent applicable, distribution (12b-1) and/or service fees; and other Portfolio expenses. This example is intended to help you understand your ongoing costs (in dollars) of investing in the Portfolio and to compare these costs with the ongoing costs of investing in other mutual funds. It is based on an investment of $1,000 made at the beginning of the period shown and held for the entire period from July 1, 2018 to December 31, 2018.
The table below illustrates your Portfolio's cost in two ways:
Based on actual fund return ——This section helps you to estimate the actual expenses that you paid over the period. The “Ending Account Value” shown is derived from the Portfolio's actual return, and the third column shows the dollar amount that would have been paid by an investor who started with $1,000 in the Portfolio. You may use the information here, together with the amount you invested, to estimate the expenses that you paid over the period. To do so, simply divide your account value by $1,000 (for example, an $8,600 account value divided by $1,000 = 8.6), then multiply the result by the number given for the Portfolio under the heading “Expenses Paid During Period”.
Based on hypothetical 5% return ——This section is intended to help you compare your Portfolio's costs with those of other mutual funds. It assumes that the Portfolio had a yearly return of 5% before expenses, but that the expense ratio is unchanged. In this case, because the return used is not the Portfolio's actual return, the results do not apply to your investment. The example is useful in making comparisons because the SEC requires all mutual funds to calculate expenses based on a 5% return. You can assess your Portfolio's costs by comparing this hypothetical example with the hypothetical examples that appear in shareholder reports of other funds.
Please note that the expenses shown in the table are meant to highlight your ongoing costs only and do not reflect any transaction costs, such as sales load charges (loads). Therefore, the hypothetical 5% return section of the table is useful in comparing ongoing costs only, and will not help you determine the relative total costs of owning different funds. In addition, if these transaction costs were included, your costs would have been higher.
| | | | Actual | | Hypothetical (assuming a 5%
return before expenses) |
| | Annualized
Expense Ratio | | Ending Account
Value | | Expenses Paid
During Period(a) | | Ending Account
Value | | Expenses Paid
During Period(a) |
State Street Treasury Money Market Portfolio
| 0.07% | | $1,010.30 | | $0.35 | | $1,024.90 | | $0.36 |
| (a) | Expenses are equal to the Portfolio’s annualized net expense ratio multiplied by the average account value of the period, multiplied by 184, then divided by 365. |
Proxy Voting Policies and Procedures and Records
The Portfolio has adopted the proxy voting policies of the Adviser. A description of the policies and procedures that the Portfolio has adopted to determine how to vote proxies relating to portfolio securities are contained in the Portfolio’s Statement of Additional Information, which is available (i) without charge, upon request, by calling the Portfolio at 1-877-521-4083 (toll free) or (ii) on the SEC’s website at www.sec.gov. Information regarding how the Portfolio voted proxies, if any, during the most recent 12-month period ended June 30 is available by August 31 of each year without charge (1) by calling 1-877-521-4083 (toll free), or (2) on the website of the SEC at www.sec.gov.
Quarterly Portfolio Schedule
The Portfolio will file its complete schedule of investments with the SEC for the first and third quarters of each fiscal year on Form N-Q. The Portfolio’s Form N-Q is available (i) without charge, upon request, by calling the Portfolio at 1-877-521-4083 (toll free) or (ii) on the SEC’s website at www.sec.gov.
STATE STREET MASTER FUNDS
STATE STREET TREASURY MONEY MARKET PORTFOLIO
OTHER INFORMATION (continued)
December 31, 2018 (Unaudited)
Monthly Portfolio Schedule
The Portfolio files its monthly portfolio holdings with the SEC on Form N-MFP. The Portfolio’s Form N-MFP is available on the SEC’s website at www.sec.gov.
Special Meeting of Shareholders — Voting Results
A special meeting of shareholders of State Street Master Funds (the “Trust”) was held on December 18, 2018 to elect the following four nominees as Trustees of the Trust: Michael A. Jessee, Ellen M. Needham, Donna M. Rapaccioli and John R. Costantino. At the meeting the following votes were recorded:
| Nominee | Shares For | Shares Withheld |
| Michael A. Jessee | 70,681,020,370.077 | 7,661,214,196.910 |
| Ellen M. Needham | 77,884,129,343.272 | 458,105,223.715 |
| Donna M. Rapaccioli | 78,036,680,506.030 | 305,554,060.957 |
| John R. Costantino | 78,035,382,515.554 | 306,852,051.433 |
| The other Trustees whose term of office continued after the meeting are as follows: James E. Ross, Michael F. Holland, Patrick J. Riley, Richard D. Shirk, Bruce D. Taber and Rina K. Spence. |
STATE STREET MASTER FUNDS
STATE STREET TREASURY MONEY MARKET PORTFOLIO
OTHER INFORMATION (continued)
December 31, 2018 (Unaudited)
TRUSTEES AND OFFICERS INFORMATION
Name, Address
and Year of Birth | | Position(s) Held with Trust | | Term of
Office and
Length of
Time Served | | Principal Occupation During the Past Five Years and Relevant Experience | | Number of Funds in Fund Complex Overseen by Trustee† | | Other
Directorships
Held by Trustee
During the
Past Five Years |
| Trustees | | | | | | | | | | |
| Independent Trustees | | | | | | | | | | |
Michael F. Holland
c/o SSGA Funds
Management, Inc.
One Iron Street
Boston, MA 02210
YOB: 1944 | | Trustee and
Co-
Chairperson
of the Board | | Term: Indefinite
Elected: 7/99 | | Chairman, Holland & Company L.L.C. (investment adviser) (1995- present). | | 67 | | Director, the Holland Series Fund, Inc.; Director, The China Fund, Inc.; Director, The Taiwan Fund, Inc. (2007-2017); Director, Reaves Utility Income Fund, Inc.; and Director, Blackstone/GSO Loans (and Real Estate) Funds. |
Patrick J. Riley
c/o SSGA Funds
Management, Inc.
One Iron Street
Boston, MA 02210
YOB: 1948 | | Trustee and
Co-
Chairperson
of the Board | | Term: Indefinite
Elected: 1/14 | | 2002 to May 2010, Associate Justice of the Superior Court, Commonwealth of Massachusetts; 1985 to 2002, Partner, Riley, Burke & Donahue, L.L.P. (law firm); 1998 to Present, Independent Director, State Street Global Advisers Ireland, Ltd. (investment company); 1998 to Present, Independent Director, SSGA Liquidity plc (formerly, SSGA Cash Management Fund plc); January 2009 to Present, Independent Director, SSGA Fixed Income plc; and January 2009 to Present, Independent Director, SSGA Qualified Funds PLC. | | 67 | | Board Director and Chairman, SPDR Europe 1PLC Board (2011-Present); Board Director and Chairman, SPDR Europe II, PLC (2013- Present). |
John R. Costantino
c/o SSGA Funds
Management, Inc.
One Iron Street
Boston, MA 02210
YOB: 1946 | | Trustee and
Co-
Chairperson
of the Qualified
Legal and
Compliance Committee | | Term: Indefinite
Elected: 12/18 | | General Partner, NGN Capital LLC (2006 – present); and Managing Director, Vice President of Walden Capital Management (1996 – present). | | 67 | | Trustee of Neuroscience Research Institute (1986 – present); Trustee of Fordham University (1989 – 1995 and 2001 – 2007) and Trustee Emeritus (2007 – present); Trustee of GE Funds (1993 – February 2011); Director of Artes Medical (2006 – 2008); and Trustee of Gregorian University Foundation (1992 – 2007). |
Richard D. Shirk
c/o SSGA Funds
Management, Inc.
One Iron Street
Boston, MA 02210
YOB: 1945 | | Trustee and
Co-
Chairperson
of the Qualified
Legal and
Compliance Committee | | Term: Indefinite
Elected: 1/14 | | March 2001 to April 2002, Chairman (1996 to March 2001, President and Chief Executive Officer), Cerulean Companies, Inc. (holding company) (Retired); 1992 to March 2001, President and Chief Executive Officer, Blue Cross Blue Shield of Georgia (health insurer, managed healthcare). | | 67 | | 1998 to December 2008, Chairman, Board Member and December 2008 to Present, Investment Committee Member, Healthcare Georgia Foundation (private foundation); September 2002 to 2012, Lead Director and Board Member, Amerigroup Corp. (managed health care); 1999 to 2013, Board Member and (since 2001) Investment Committee Member, Woodruff Arts Center; and 2003 to 2009, Trustee, Gettysburg College; Board member, Aerocare Holdings, Regenesis Biomedical Inc. |
Rina K. Spence
c/o SSGA Funds
Management, Inc.
One Iron Street
Boston, MA 02210
YOB: 1948 | | Trustee and Co-
Chairperson of the Audit Committee,
Co-Chairperson of the Nominating Committee and
Co-
Chairperson of the Governance Committee | | Term: Indefinite
Elected: 7/99 | | President of SpenceCare International LLC (international healthcare consulting) (1999 – present); Chief Executive Officer, IEmily.com (health internet company) (2000 – 2001); Chief Executive Officer of Consensus Pharmaceutical, Inc. (1998 – 1999); Founder, President and Chief Executive Officer of Spence Center for Women’s Health (1994 – 1998); President and CEO, Emerson Hospital (1984 – 1994); Honorary Consul for Monaco in Boston (2015 – present). | | 67 | | |
STATE STREET MASTER FUNDS
STATE STREET TREASURY MONEY MARKET PORTFOLIO
OTHER INFORMATION (continued)
December 31, 2018 (Unaudited)
Name, Address
and Year of Birth | | Position(s) Held with Trust | | Term of
Office and
Length of
Time Served | | Principal Occupation During the Past Five Years and Relevant Experience | | Number of Funds in Fund Complex Overseen by Trustee† | | Other
Directorships
Held by Trustee
During the
Past Five Years |
Bruce D. Taber
c/o SSGA Funds
Management, Inc.
One Iron Street
Boston, MA 02210
YOB: 1943 | | Trustee and Co-
Chairperson of the Valuation Committee, Co-
Chairperson of the Nominating Committee and Co
-Chairperson of the Governance Committee | | Term: Indefinite
Elected: 1/14 | | Retired; 1999 to 2016, Partner, Zenergy LLC (a technology company providing Computer Modeling and System Analysis to the General Electric Power Generation Division); Until December 2008, Independent Director, SSGA Cash Management Fund plc; Until December 2008, Independent Director, State Street Global Advisers Ireland, Ltd. (investment companies). | | 49 | | None. |
Michael A. Jessee
c/o SSGA Funds
Management, Inc.
One Iron Street
Boston, MA 02210
YOB: 1946 | | Trustee and Co-
Chairperson
of the Valuation Committee | | Term: Indefinite
Appointed: 7/16 | | Retired; formerly, President and Chief Executive Officer of the Federal Home Loan Bank of Boston (1989 – 2009); Trustee, Randolph-Macon College (2004-2016). | | 67 | | None. |
Donna M. Rapaccioli
c/o SSGA Funds
Management, Inc.
One Iron Street
Boston, MA 02210
YOB: 1962 | | Trustee and Co-
Chairperson
of the Audit Committee | | Term: Indefinite
Elected: 12/18 | | Dean of the Gabelli School of Business (2007 – present) and Accounting Professor (1987 – present) at Fordham University. | | 67 | | Director- Graduate Management Admissions Council (2015 - present); Trustee of Emmanuel College (2010 – present). |
| Interested Trustees(1) | | | | | | | | | | |
James E. Ross(2)
SSGA Funds Management, Inc.
One Iron Street
Boston, MA 02210
YOB: 1965 | | Trustee | | Term: Indefinite
Appointed: 2/07 | | Chairman and Director, SSGA Funds Management, Inc. (2005-present); Executive Vice President, State Street Global Advisors (2012-present); Chief Executive Officer and Director, State Street Global Advisors Funds Distributors, LLC (May 2017 – present); Director, State Street Global Markets, LLC (2013 - April 2017); President, SSGA Funds Management, Inc. (2005 – 2012), Principal, State Street Global Advisors (2000-2005). | | 185 | | SSGA SPDR ETFs Europe I plc (Director) (November 2016 – present); SSGA SPDR ETFs Europe II plc (Director) (November 2016 – present). |
Ellen M. Needham(3)
SSGA Funds Management, Inc.
One Iron Street
Boston, MA 02210
YOB: 1967 | | Trustee and President | | Term: Indefinite
Elected 12/18 | | President and Director, SSGA FM (2001 – present)*; Senior Managing Director, State Street Global Advisors (1992 – present)*; Director, State Street Global Advisors Funds Distributors, LLC (May 2017 – present).* | | 67 | | None. |
| † For the purpose of determining the number of portfolios overseen by the Trustees, “Fund Complex” comprises registered investment companies for which SSGA Funds Management, Inc. serves as investment adviser. |
| (1) The individuals listed below are Trustees who are “interested persons,” as defined in the 1940 Act, of the Trusts (“Interested Trustees”). |
| (2) Mr. Ross is an Interested Trustee because of his employment by SSGA Funds Management, Inc., an affiliate of the Trust. |
| (3) Ms. Needham is an Interested Trustee because of her employment by SSGA Funds Management, Inc., an affiliate of the Trust. |
| * Served in various capacities and/or with various affiliated entities during noted time period. |
| The following lists the principal officers for the Trust, as well as their mailing addresses and ages, positions with the Trust and length of time served, and present and principal occupations: |
STATE STREET MASTER FUNDS
STATE STREET TREASURY MONEY MARKET PORTFOLIO
OTHER INFORMATION (continued)
December 31, 2018 (Unaudited)
Name, Address
and Year of Birth | | Position(s) Held with Trust | | Term of
Office and
Length of
Time Served | | Principal Occupation(s) During the Past 5 Years |
| Officers | | | | | | |
ELLEN M. NEEDHAM
SSGA Funds Management, Inc.
One Iron Street
Boston, MA 02210
YOB: 1967 | | President, Trustee | | Term: Indefinite
Elected: 10/12 | | President and Director, SSGA Funds Management, Inc. (2001 - present)*; Senior Managing Director, State Street Global Advisors (1992 - present); Director, State Street Global Advisors Funds Distributors, LLC (May 2017 - present).* |
BRUCE S. ROSENBERG
SSGA Funds Management, Inc.
One Iron Street
Boston, MA 02210
YOB: 1961 | | Treasurer | | Term: Indefinite
Elected: 2/16 | | Managing Director, State Street Global Advisors and SSGA Funds Management, Inc. (July 2015 - present); Director, Credit Suisse (April 2008 - July 2015). |
ANN M. CARPENTER
SSGA Funds Management, Inc.
One Iron Street
Boston, MA 02210
YOB: 1966 | | Vice
President
and Deputy
Treasurer | | Term: Indefinite
Elected: 10/12
Term: Indefinite
Elected: 2/16 | | Chief Operating Officer, SSGA Funds Management, Inc. (2005 - Present)*; Managing Director, State Street Global Advisors (2005 - present).* |
CHAD C. HALLETT
SSGA Funds Management, Inc.
One Iron Street
Boston, MA 02210
YOB: 1969 | | Deputy Treasurer | | Term: Indefinite
Elected: 2/16 | | Vice President, State Street Global Advisors and SSGA Funds Management, Inc. (November 2014 – present); Vice President, State Street Bank and Trust Company (2001 –November 2014).* |
DARLENE ANDERSON-VASQUEZ
SSGA Funds Management, Inc.
One Iron Street
Boston, MA 02210
YOB: 1968 | | Deputy Treasurer | | Term: Indefinite
Elected: 11/16 | | Managing Director, State Street Global Advisors and SSGA Funds Management, Inc. (May 2016 – present); Senior Vice President, John Hancock Investments (September 2007 – May 2016). |
ARTHUR A. JENSEN
SSGA Funds Management, Inc.
1600 Summer Street
Stamford, CT 06905
YOB: 1966 | | Deputy Treasurer | | Term: Indefinite
Elected: 11/16 | | Vice President at State Street Global Advisors (July 2016 – present); Deputy Treasurer of Elfun Funds (July 2016 – present); Treasurer of State Street Institutional Funds, State Street Variable Insurance Series Funds, Inc. and GE Retirement Savings Plan Funds (June 2011 – present); Treasurer of Elfun Funds (June 2011– July 2016); Mutual Funds Controller of GE Asset Management Incorporated (April 2011 – July 2016). |
SUJATA UPRETI
SSGA Funds Management, Inc.
One Iron Street
Boston, MA 02210
YOB: 1974 | | Assistant
Treasurer | | Term: Indefinite
Elected: 2/16 | | Vice President, State Street Global Advisors and SSGA Funds Management, Inc. (May 2015 – present); Assistant Director, Cambridge Associates, LLC (July 2014 – January 2015); Vice President, Bank of New York Mellon (July 2012 – August 2013); Manager, PricewaterhouseCoopers, LLP (September 2003 – July 2012). |
DANIEL FOLEY
SSGA Funds Management, Inc.
One Iron Street
Boston, MA 02210
YOB: 1972 | | Assistant
Treasurer | | Term: Indefinite
Elected: 2/16 | | Vice President, State Street Global Advisors and SSGA Funds Management, Inc. (April 2007 – present).* |
DANIEL G. PLOURDE
SSGA Funds Management, Inc.
One Iron Street
Boston, MA 02210
YOB: 1980 | | Assistant
Treasurer | | Term: Indefinite
Elected: 5/17 | | Vice President, State Street Global Advisors and SSGA Funds Management, Inc. (May 2015 – present); Officer, State Street Bank and Trust Company (March 2009 – May 2015). |
BRIAN HARRIS
SSGA Funds Management, Inc.
One Iron Street
Boston, MA 02210
YOB: 1973 | | Chief Compliance Officer, Anti-Money Laundering Officer and Code of Ethics Compliance Officer | | Term: Indefinite
Elected: 11/13
Term: Indefinite
Elected: 9/16 | | Managing Director, State Street Global Advisors and SSGA Funds Management, Inc. (2013—Present); Senior Vice President and Global Head of Investment Compliance, BofA Global Capital Management (September 2010 – May 2013). |
STATE STREET MASTER FUNDS
STATE STREET TREASURY MONEY MARKET PORTFOLIO
OTHER INFORMATION (continued)
December 31, 2018 (Unaudited)
Name, Address
and Year of Birth | | Position(s) Held with Trust | | Term of
Office and
Length of
Time Served | | Principal Occupation(s) During the Past 5 Years |
JOSHUA A. WEINBERG
SSGA Funds Management, Inc.
One Iron Street
Boston, MA 02210
YOB: 1978 | | Chief Legal Officer | | Term: Indefinite
Elected: 2/15 | | Managing Director and Managing Counsel, State Street Global Advisors (2011 – present)*; Clerk, SSGA Funds Management, Inc. (2013 – present); Associate, Financial Services Group, Dechert LLP (2005 – 2011). |
JESSE D. HALLEE
State Street Bank and Trust Company
100 Summer Street,
7th Floor
Boston, MA 02111-2900
YOB: 1976 | | Secretary | | Term: Indefinite
Elected: 9/16 | | Vice President and Managing Counsel, State Street Bank and Trust Company (2013 – present); Vice President and Counsel, Brown Brothers Harriman & Co. (2007-2013). |
KHIMMARA GREER
State Street Bank and Trust Company
100 Summer Street,
7th Floor
Boston, MA 02111-2900
YOB: 1983 | | Assistant Secretary | | Term: Indefinite
Elected: 5/16 | | Vice President and Counsel, State Street Bank and Trust Company (2015- present); Regulatory Advisor, JPMorgan (2014 – 2015); Claims Case Manager, Liberty Mutual Insurance (2012 – 2014); Contract Attorney, Various Law Firms (2011 – 2012). |
| * Served in various capacities and/or with various affiliated entities during noted time period. |
| Statement of Additional Information (SAI) includes additional information about Portfolio's directors and is available, without charge, upon request and by calling 1-877-521-4083. |
Trustees
John R. Costantino
Michael F. Holland
Michael A. Jessee
Ellen M. Needham
Donna M. Rapaccioli
Patrick J. Riley
James E. Ross
Richard D. Shirk
Rina K. Spence
Bruce D. Taber
Investment Adviser and Administrator
SSGA Funds Management, Inc.
One Iron Street
Boston, MA 02210
Custodian, Sub-Administrator and Transfer Agent
State Street Bank and Trust Company
State Street Financial Center
One Lincoln Street
Boston, MA 02111
Independent Registered Public Accounting Firm
Ernst & Young LLP
200 Clarendon Street
Boston, MA 02116
Legal Counsel
Ropes & Gray LLP
800 Boylston Street
Boston, MA 02199
This report is for shareholder information. This is not a prospectus intended for use in the purchase or sale of shares of beneficial interest.
State Street Master Funds
State Street Bank and Trust Company
P.O. Box 5049
Boston, MA 02206
SSTTRAR1
The information contained in this report is intended for the general information of shareholders of the Portfolio and shareholders of any fund invested in the Portfolio. Interests in the Portfolio are offered solely to eligible investors in private placement transactions that do not involve any “public offering” within the meaning of Section 4(a)(2) of the 1933 Act. This report is not authorized for distribution (i) to prospective investors in any fund invested in the Portfolio unless preceded or accompanied by a current offering document for such fund or (ii) to prospective eligible investors in the Portfolio unless preceded or accompanied by a current offering document of the Portfolio. Eligible investors in the Portfolio may obtain a current Portfolio offering document by calling 1-877-521-4083. Please read the offering document carefully before investing in the Portfolio.
Annual Report
December 31, 2018
State Street Master Funds
| State Street Treasury Plus Money Market Portfolio |
The information contained in this report is intended for the general information of shareholders of the Portfolio and shareholders of any fund invested in the Portfolio. Interests in the Portfolio are offered solely to eligible investors in private placement transactions that do not involve any “public offering” within the meaning of Section 4(a)(2) of the 1933 Act. This report is not authorized for distribution (i) to prospective investors in any fund invested in the Portfolio unless preceded or accompanied by a current offering document for such fund or (ii) to prospective eligible investors in the Portfolio unless preceded or accompanied by a current offering document of the Portfolio. Eligible investors in the Portfolio may obtain a current Portfolio offering document by calling 1-877-521-4083. Please read the offering document carefully before investing in the Portfolio.
TABLE OF CONTENTS
The information contained in this report is intended for the general information of shareholders of the Portfolio and shareholders of any fund invested in the Portfolio. Interests in the Portfolio are offered solely to eligible investors in private placement transactions that do not involve any “public offering” within the meaning of Section 4(a)(2) of the 1933 Act. This report is not authorized for distribution (i) to prospective investors in any fund invested in the Portfolio unless preceded or accompanied by a current offering document for such fund or (ii) to prospective eligible investors in the Portfolio unless preceded or accompanied by a current offering document of the Portfolio. Eligible investors in the Portfolio may obtain a current Portfolio offering document by calling 1-877-521-4083. Please read the offering document carefully before investing in the Portfolio.
State Street Treasury Plus Money Market Portfolio
PORTFOLIO STATISTICS (UNAUDITED)
Portfolio Composition as of December 31, 2018
| | | |
| | | % of Net Assets | |
| | Treasury Debt | 54.1% | |
| | Treasury Repurchase Agreements | 36.4 | |
| | Other Assets in Excess of Liabilities | 9.5 | |
| | TOTAL | 100.0% | |
(The composition is expressed as a percentage of net assets as of the date indicated. The composition will vary over time.)
Maturity Ladder as of December 31, 2018
| | | | |
| | | % of Net Assets | |
| | 2 to 30 Days | 47.4% | |
| | 31 to 60 Days | 12.6 | |
| | 61 to 90 Days | 6.5 | |
| | Over 90 Days | 24.0 | |
| | Total | 90.5% | |
| | Average days to maturity | 27 | |
| | Weighted average life | 83 | |
(The maturity ladder is expressed as a percentage of net assets as of the date indicated. The composition will vary over time.)
See accompanying notes to financial statements.
1
STATE STREET MASTER FUNDS
STATE STREET TREASURY PLUS MONEY MARKET PORTFOLIO
SCHEDULE OF INVESTMENTS
December 31, 2018
| Name of Issuer and Title of Issue | | Interest Rate | | Next Rate Reset Date | | Maturity Date | | Principal Amount | | Value |
| TREASURY DEBT—54.1% | | | | | | | | | | |
U.S. Treasury Bill(a)
| | 2.140% | | 01/17/2019 | | 01/17/2019 | | $435,000,000 | | $434,564,534 |
U.S. Treasury Bill(a)
| | 2.175% | | 01/03/2019 | | 01/03/2019 | | 600,000,000 | | 599,927,444 |
U.S. Treasury Bill(a)
| | 2.220% | | 01/10/2019 | | 01/10/2019 | | 500,000,000 | | 499,723,637 |
U.S. Treasury Bill(a)
| | 2.269% | | 02/21/2019 | | 02/21/2019 | | 200,000,000 | | 199,357,258 |
U.S. Treasury Bill(a)
| | 2.275% | | 02/07/2019 | | 02/07/2019 | | 50,000,000 | | 49,883,090 |
U.S. Treasury Bill(a)
| | 2.281% | | 02/28/2019 | | 02/28/2019 | | 200,000,000 | | 199,265,011 |
U.S. Treasury Bill(a)
| | 2.285% | | 01/08/2019 | | 01/08/2019 | | 375,000,000 | | 374,832,948 |
U.S. Treasury Bill(a)
| | 2.300% | | 01/24/2019 | | 01/24/2019 | | 450,000,000 | | 449,338,750 |
U.S. Treasury Bill(a)
| | 2.310% | | 01/31/2019 | | 01/31/2019 | | 400,000,000 | | 399,231,558 |
U.S. Treasury Bill(a)
| | 2.326% | | 02/14/2019 | | 02/14/2019 | | 225,000,000 | | 224,356,500 |
U.S. Treasury Bill(a)
| | 2.375% | | 03/14/2019 | | 03/14/2019 | | 150,000,000 | | 149,287,500 |
U.S. Treasury Bill(a)
| | 2.380% | | 04/11/2019 | | 04/11/2019 | | 75,000,000 | | 74,504,167 |
U.S. Treasury Bill(a)
| | 2.388% | | 03/21/2019 | | 03/21/2019 | | 400,000,000 | | 397,904,306 |
U.S. Treasury Bill(a)
| | 2.390% | | 02/05/2019 | | 02/05/2019 | | 300,000,000 | | 299,302,917 |
U.S. Treasury Bill(a)
| | 2.415% | | 03/28/2019 | | 03/28/2019 | | 350,000,000 | | 347,980,792 |
U.S. Treasury Bill(a)
| | 2.415% | | 04/18/2019 | | 04/18/2019 | | 150,000,000 | | 148,923,313 |
U.S. Treasury Bill(a)
| | 2.465% | | 04/04/2019 | | 04/04/2019 | | 400,000,000 | | 397,507,611 |
U.S. Treasury Bill(a)
| | 2.465% | | 05/23/2019 | | 05/23/2019 | | 200,000,000 | | 198,055,389 |
U.S. Treasury Bill(a)
| | 2.480% | | 06/13/2019 | | 06/13/2019 | | 100,000,000 | | 98,877,111 |
U.S. Treasury Bill(a)
| | 2.480% | | 06/27/2019 | | 06/27/2019 | | 150,000,000 | | 148,171,000 |
U.S. Treasury Bill(a)
| | 2.488% | | 06/20/2019 | | 06/20/2019 | | 300,000,000 | | 296,478,615 |
U.S. Treasury Bill(a)
| | 2.505% | | 07/05/2019 | | 07/05/2019 | | 50,000,000 | | 49,363,313 |
U.S. Treasury Note, 3 Month USD MMY + 0.05%(b)
| | 2.364% | | 01/31/2019 | | 10/31/2020 | | 100,000,000 | | 99,840,781 |
U.S. Treasury Note(a)
| | 2.373% | | 02/28/2019 | | 02/28/2019 | | 89,000,000 | | 88,875,618 |
U.S. Treasury Note(a)
| | 2.443% | | 03/31/2019 | | 03/31/2019 | | 29,000,000 | | 28,916,074 |
U.S. Treasury Note(a)
| | 2.457% | | 04/15/2019 | | 04/15/2019 | | 50,000,000 | | 49,776,719 |
U.S. Treasury Note, 3 Month USD MMY(b)
| | 2.481% | | 01/02/2019 | | 01/31/2020 | | 763,000,000 | | 762,938,448 |
U.S. Treasury Note, 3 Month USD MMY + 0.03%(b)
| | 2.514% | | 01/02/2019 | | 04/30/2020 | | 665,800,000 | | 665,834,484 |
U.S. Treasury Note, 3 Month USD MMY + 0.04%(b)
| | 2.524% | | 01/02/2019 | | 07/31/2020 | | 303,150,000 | | 303,114,561 |
U.S. Treasury Note, 3 Month USD MMY + 0.05%(b)
| | 2.529% | | 01/02/2019 | | 10/31/2019 | | 246,000,000 | | 246,120,058 |
U.S. Treasury Note, 3 Month USD MMY + 0.06%(b)
| | 2.541% | | 01/02/2019 | | 07/31/2019 | | 150,000,000 | | 150,080,271 |
U.S. Treasury Note, 3 Month USD MMY + 0.07%(b)
| | 2.551% | | 01/02/2019 | | 04/30/2019 | | 64,398,000 | | 64,405,183 |
U.S. Treasury Note(a)
| | 2.553% | | 05/31/2019 | | 05/31/2019 | | 64,000,000 | | 63,627,515 |
U.S. Treasury Note(a)
| | 2.589% | | 06/30/2019 | | 06/30/2019 | | 120,000,000 | | 119,432,568 |
U.S. Treasury Note(a)
| | 2.609% | | 07/31/2019 | | 07/31/2019 | | 250,000,000 | | 247,516,952 |
U.S. Treasury Note, 3 Month USD MMY + 0.14%(b)
| | 2.621% | | 01/02/2019 | | 01/31/2019 | | 510,300,000 | | 510,371,224 |
TOTAL TREASURY DEBT
| | | | | | | | | | 9,437,687,220 |
| TREASURY REPURCHASE AGREEMENTS—36.4% | | | | | | | | | | |
Agreement with Bank of Nova Scotia and Bank of New York Mellon (Tri-Party), dated 12/31/2018 (collateralized by U.S. Treasury Bills, 0.000% due 01/03/2019 – 12/05/2019, a U.S. Treasury Inflation Index Bond, 0.625% due 02/15/2043, U.S. Treasury Inflation Index Notes, 0.125% due 01/15/2022 – 07/15/2022, and U.S. Treasury Notes, 0.875% – 3.375% due 02/28/2019 – 11/15/2026, valued at $408,066,936); expected proceeds $400,065,556
| | 2.950% | | 01/02/2019 | | 01/02/2019 | | 400,000,000 | | 400,000,000 |
Agreement with Barclays Capital, Inc. and Bank of New York Mellon (Tri-Party), dated 12/31/2018 (collateralized by a U.S. Treasury Bond, 3.375% due 05/15/2044, and a U.S. Treasury Note, 2.625% due 03/31/2025, valued at $204,000,110); expected proceeds $200,032,778
| | 2.950% | | 01/02/2019 | | 01/02/2019 | | 200,000,000 | | 200,000,000 |
See accompanying notes to financial statements.
2
STATE STREET MASTER FUNDS
STATE STREET TREASURY PLUS MONEY MARKET PORTFOLIO
SCHEDULE OF INVESTMENTS (continued)
December 31, 2018
| Name of Issuer and Title of Issue | | Interest Rate | | Next Rate Reset Date | | Maturity Date | | Principal Amount | | Value |
Agreement with Barclays Capital, Inc. and Bank of New York Mellon (Tri-Party), dated 12/31/2018 (collateralized by a U.S. Treasury Bond, 3.875% due 08/15/2040, and a U.S. Treasury Note, 2.625% - 2.750% due 03/31/2025 - 06/30/2025, valued at $762,960,063); expected proceeds $748,120,512
| | 2.900% | | 01/02/2019 | | 01/02/2019 | | $748,000,000 | | $748,000,000 |
Agreement with BNP Paribas Securities Corp. and Bank of New York Mellon (Tri-Party), dated 12/31/2018 (collateralized by a U.S. Treasury Bond, 8.750% due 08/15/2020, U.S. Treasury Notes, 2.000% – 2.875% due 08/15/2024 – 07/31/2025, and U.S. Treasury Strips, 0.000% due 05/15/2019 – 08/15/2028, valued at $34,680,000); expected proceeds $34,005,572
| | 2.950% | | 01/02/2019 | | 01/02/2019 | | 34,000,000 | | 34,000,000 |
Agreement with Citigroup Global Markets, Inc. and Bank of New York Mellon (Tri-Party), dated 12/28/2018 (collateralized by U.S. Treasury Notes, 1.125% – 2.875% due 12/31/2020 – 12/31/2025, valued at $510,000,078); expected proceeds $500,246,944
| | 2.540% | | 01/04/2019 | | 01/04/2019 | | 500,000,000 | | 500,000,000 |
Agreement with Citigroup Global Markets, Inc. and Bank of New York Mellon (Tri-Party), dated 12/31/2018 (collateralized by a U.S. Treasury Bond, 3.000% due 05/15/2047, and U.S. Treasury Notes, 1.250% – 2.375% due 05/31/2019 – 05/15/2027, valued at $31,620,068); expected proceeds $31,005,081
| | 2.950% | | 01/02/2019 | | 01/02/2019 | | 31,000,000 | | 31,000,000 |
Agreement with Credit Agricole Corporate and Investment Bank and Bank of New York Mellon (Tri-Party), dated 12/31/2018 (collateralized by a U.S. Treasury Inflation Index Note, 0.500% due 01/15/2028, and a U.S. Treasury Note, 1.375% due 09/30/2019, valued at $397,800,066); expected proceeds $390,063,917
| | 2.950% | | 01/02/2019 | | 01/02/2019 | | 390,000,000 | | 390,000,000 |
Agreement with Goldman Sachs & Co. and Bank of New York Mellon (Tri-Party), dated 12/26/2018 (collateralized by a U.S. Treasury Note, 2.750% due 05/31/2023, and U.S. Treasury Strips, 0.000% due 08/15/2020 – 05/15/2024, valued at $204,000,000); expected proceeds $200,094,111
| | 2.420% | | 01/02/2019 | | 01/02/2019 | | 200,000,000 | | 200,000,000 |
Agreement with Goldman Sachs & Co. and Bank of New York Mellon (Tri-Party), dated 12/31/2018 (collateralized by a U.S. Treasury Bill, 0.000% due 02/07/2019, a U.S. Treasury Bond, 5.000% due 05/15/2037, U.S. Treasury Notes, 2.500% – 2.625% due 12/31/2020 – 06/30/2023, and U.S. Treasury Strips, 0.000% due 02/15/2019 – 02/15/2024, valued at $204,000,051); expected proceeds $200,097,222
| | 2.500% | | 01/07/2019 | | 01/07/2019 | | 200,000,000 | | 200,000,000 |
Agreement with HSBC Securities USA, Inc. and Bank of New York Mellon (Tri-Party), dated 12/31/2018 (collateralized by a U.S. Treasury Inflation Index Bond, 2.500% due 01/15/2029, and a U.S. Treasury Note, 2.625% due 06/30/2023, valued at $421,260,012); expected proceeds $413,067,686
| | 2.950% | | 01/02/2019 | | 01/02/2019 | | 413,000,000 | | 413,000,000 |
Agreement with JP Morgan Securities, Inc. and Bank of New York Mellon (Tri-Party), dated 12/31/2018 (collateralized by U.S. Treasury Notes, 1.625% – 2.750% due 04/30/2020 – 05/15/2026, valued at $418,200,173); expected proceeds $410,067,195
| | 2.950% | | 01/02/2019 | | 01/02/2019 | | 410,000,000 | | 410,000,000 |
Agreement with LLOYDS Bank PLC, dated 08/17/2018 (collateralized by U.S. Treasury Inflation Index Notes, 0.125% due 04/15/2020 – 01/15/2023, and a U.S. Treasury Note, 2.000% due 04/30/2024, valued at $256,034,586); expected proceeds $253,190,417(c)
| | 2.470% | | 01/02/2019 | | 02/19/2019 | | 250,000,000 | | 250,000,000 |
See accompanying notes to financial statements.
3
STATE STREET MASTER FUNDS
STATE STREET TREASURY PLUS MONEY MARKET PORTFOLIO
SCHEDULE OF INVESTMENTS (continued)
December 31, 2018
| Name of Issuer and Title of Issue | | Interest Rate | | Next Rate Reset Date | | Maturity Date | | Principal Amount | | Value |
Agreement with Norinchukin Bank and Bank of New York Mellon (Tri-Party), dated 12/11/2018 (collateralized by U.S. Treasury Inflation Index Notes, 0.375% – 1.125% due 01/15/2021 – 01/15/2027, valued at $117,300,072); expected proceeds $115,730,250(c)
| | 2.540% | | 03/11/2019 | | 03/11/2019 | | $115,000,000 | | $115,000,000 |
Agreement with Norinchukin Bank and Bank of New York Mellon (Tri-Party), dated 12/21/2018 (collateralized by a U.S. Treasury Inflation Index Note, 1.125% due 01/15/2021, and a U.S. Treasury Note, 2.000% due 11/15/2026, valued at $71,400,070); expected proceeds $70,445,900(c)
| | 2.520% | | 03/22/2019 | | 03/22/2019 | | 70,000,000 | | 70,000,000 |
Agreement with Royal Bank of Canada and Bank of New York Mellon (Tri-Party), dated 12/31/2018 (collateralized by U.S. Treasury Bonds, 2.250% – 4.500% due 08/15/2039 – 05/15/2048, U.S. Treasury Inflation Index Bonds, 0.750% – 3.625% due 01/15/2028 – 02/15/2048, U.S. Treasury Inflation Index Notes, 0.125% – 0.625% due 04/15/2019 – 07/15/2027, and U.S. Treasury Notes, 1.125% – 3.625% due 04/30/2019 – 02/15/2028, valued at $943,500,086); expected proceeds $925,151,597
| | 2.950% | | 01/02/2019 | | 01/02/2019 | | 925,000,000 | | 925,000,000 |
Agreement with Royal Bank of Canada and Bank of New York Mellon (Tri-Party), dated 12/31/2018 (collateralized by U.S. Treasury Bonds, 2.500% – 8.500% due 02/15/2020 – 02/15/2047, U.S. Treasury Inflation Index Notes, 0.125% – 1.125% due 01/15/2021 – 01/15/2027, and U.S. Treasury Notes, 1.125% – 2.750% due 03/31/2020 – 11/15/2026, valued at $969,000,069); expected proceeds $950,155,694
| | 2.950% | | 01/02/2019 | | 01/02/2019 | | 950,000,000 | | 950,000,000 |
Agreement with TD Securities (USA) LLC and Bank of New York Mellon (Tri-Party), dated 12/31/2018 (collateralized by U.S. Treasury Notes, 1.875% – 2.000% due 02/28/2021 – 08/31/2022, valued at $9,180,056); expected proceeds $9,001,475
| | 2.950% | | 01/02/2019 | | 01/02/2019 | | 9,000,000 | | 9,000,000 |
Agreement with Wells Fargo Bank and Bank of New York Mellon (Tri-Party), dated 12/31/2018 (collateralized by U.S. Treasury Bonds, 3.625% – 8.875% due 02/15/2019 – 08/15/2043, and U.S. Treasury Notes, 1.375% – 3.125% due 06/30/2020 – 02/15/2026, valued at $510,083,620); expected proceeds $500,081,944
| | 2.950% | | 01/02/2019 | | 01/02/2019 | | 500,000,000 | | 500,000,000 |
TOTAL TREASURY REPURCHASE AGREEMENTS
| | | | | | | | | | 6,345,000,000 |
TOTAL INVESTMENTS –90.5% (d)(e)
| | | | | | | | | | 15,782,687,220 |
Other Assets in Excess of Liabilities —9.5%
| | | | | | | | | | 1,664,577,712 |
NET ASSETS –100.0%
| | | | | | | | | | $17,447,264,932 |
| (a) | Rate shown is the discount rate at time of purchase. |
| (b) | Variable Rate Security - Interest rate shown is rate in effect at December 31, 2018. For securities based on a published reference rate and spread, the reference rate and spread are indicated in the description above. |
| (c) | Illiquid security. These securities represent $435,000,000 or 2.5% of net assets as of December 31, 2018. |
| (d) | Also represents the cost for federal tax purposes. |
| (e) | Unless otherwise indicated, the values of the securities of the Portfolio are determined based on Level 2 inputs (Note 2). |
See accompanying notes to financial statements.
4
STATE STREET MASTER FUNDS
STATE STREET TREASURY PLUS MONEY MARKET PORTFOLIO
STATEMENT OF ASSETS AND LIABILITIES
December 31, 2018
| ASSETS | |
Investments in unaffiliated issuers, at value and cost
| $9,437,687,220 |
Repurchase agreements, at value and amortized cost
| 6,345,000,000 |
Total Investments
| 15,782,687,220 |
Cash
| 2,096,235,721 |
Interest receivable — unaffiliated issuers
| 16,261,298 |
Other Receivable
| 8,284 |
Prepaid expenses and other assets
| 3,336 |
TOTAL ASSETS
| 17,895,195,859 |
| LIABILITIES | |
Payable for investments purchased
| 446,870,924 |
Advisory and administrator fee payable
| 600,485 |
Custody, sub-administration and transfer agent fees payable
| 408,558 |
Professional fees payable
| 42,493 |
Printing fees payable
| 4,815 |
Accrued expenses and other liabilities
| 3,652 |
TOTAL LIABILITIES
| 447,930,927 |
NET ASSETS
| $17,447,264,932 |
See accompanying notes to financial statements.
5
STATE STREET MASTER FUNDS
STATE STREET TREASURY PLUS MONEY MARKET PORTFOLIO
STATEMENT OF OPERATIONS
For the Year Ended December 31, 2018
| INVESTMENT INCOME | |
Interest income — unaffiliated issuers
| $259,702,644 |
| EXPENSES | |
Advisory and administrator fee
| 6,965,920 |
Custodian, sub-administrator and transfer agent fees
| 2,223,515 |
Trustees’ fees and expenses
| 228,467 |
Professional fees
| 159,384 |
Printing and postage fees
| 8,670 |
Insurance expense
| 45,833 |
TOTAL EXPENSES
| 9,631,789 |
NET INVESTMENT INCOME (LOSS)
| $250,070,855 |
| REALIZED GAIN (LOSS) | |
| Net realized gain (loss) on: | |
Investments — unaffiliated issuers
| 1,950 |
NET INCREASE (DECREASE) IN NET ASSETS FROM OPERATIONS
| $250,072,805 |
See accompanying notes to financial statements.
6
STATE STREET MASTER FUNDS
STATE STREET TREASURY PLUS MONEY MARKET PORTFOLIO
STATEMENTS OF CHANGES IN NET ASSETS
| | Year Ended
12/31/18 | | Year Ended
12/31/17 |
| INCREASE (DECREASE) IN NET ASSETS FROM OPERATIONS: | | | |
Net investment income (loss)
| $250,070,855 | | $89,426,187 |
Net realized gain (loss)
| 1,950 | | (118) |
Net increase (decrease) in net assets resulting from operations
| 250,072,805 | | 89,426,069 |
| CAPITAL TRANSACTIONS | | | |
Contributions
| 39,817,102,235 | | 28,396,151,811 |
Withdrawals
| (36,800,190,630) | | (24,934,249,332) |
Net increase (decrease) in net assets from capital transactions
| 3,016,911,605 | | 3,461,902,479 |
Net increase (decrease) in net assets during the period
| 3,266,984,410 | | 3,551,328,548 |
Net assets at beginning of period
| 14,180,280,522 | | 10,628,951,974 |
NET ASSETS AT END OF PERIOD
| $17,447,264,932 | | $14,180,280,522 |
See accompanying notes to financial statements.
7
STATE STREET MASTER FUNDS
STATE STREET TREASURY PLUS MONEY MARKET PORTFOLIO
FINANCIAL HIGHLIGHTS
Selected data for a share outstanding throughout each period
| | Year
Ended
12/31/18 | | Year
Ended
12/31/17 | | Year
Ended
12/31/16 | | Year
Ended
12/31/15 | | Year
Ended
12/31/14 |
Total return (a)
| 1.82% | | 0.82% | | 0.23% | | (0.01)% | | (0.02)% |
| Ratios and Supplemental Data: | | | | | | | | | |
Net assets, end of period (in 000s)
| $17,447,265 | | $14,180,281 | | $10,628,952 | | $1,744,814 | | $2,765,530 |
| Ratios to average net assets: | | | | | | | | | |
Total expenses
| 0.07% | | 0.07% | | 0.07% | | 0.07% | | 0.07% |
Net investment income (loss)
| 1.79% | | 0.84% | | 0.27% | | (0.01)% | | (0.02)% |
| (a) | Results represent past performance and are not indicative of future results. Total return for periods of less than one year are not annualized. |
See accompanying notes to financial statements.
8
STATE STREET MASTER FUNDS
STATE STREET TREASURY PLUS MONEY MARKET PORTFOLIO
NOTES TO FINANCIAL STATEMENTS
December 31, 2018
1. Organization
State Street Master Funds (the “Trust”), a Massachusetts business trust registered under the Investment Company Act of 1940, as amended (“1940 Act”), is an open-end management investment company.
As of December 31, 2018, the Trust consists of six (6) series, each of which represents a separate series of beneficial interest in the Trust. State Street Treasury Plus Money Market Portfolio (the “Portfolio”) is authorized to issue an unlimited number of shares of beneficial interest with no par value. The financial statements herein relate only to the Portfolio.
The Portfolio operates as a “government money market fund” within the meaning of Rule 2a-7 under the 1940 Act to comply with the amendments to Rule 2a-7 that became effective October 14, 2016. The Portfolio is not currently subject to liquidity fees or temporary suspensions of redemptions due to declines in the Portfolio's weekly liquid assets.
Under the Trust’s organizational documents, its officers and trustees are indemnified against certain liabilities arising out of the performance of their duties to the Trust. Additionally, in the normal course of business, the Trust enters into contracts with service providers that contain general indemnification clauses. The Trust’s maximum exposure under these arrangements is unknown as this would involve future claims that may be made against the Trust that have not yet occurred.
2. Summary of Significant Accounting Policies
The following is a summary of significant accounting policies followed by the Trust in the preparation of its financial statements:
The preparation of financial statements in accordance with U.S. generally accepted accounting principles (“U.S. GAAP”) requires management to make estimates and assumptions that affect the reported amounts and disclosures in the financial statements. Actual results could differ from those estimates. The Portfolio is an investment company under U.S. GAAP and follows the accounting and reporting guidance applicable to investment companies.
Security Valuation
The investments of the Portfolio are valued pursuant to the policy and procedures developed by the Oversight Committee (the “Committee”) and approved by the Board of Trustees of the Trust (the “Board”). The Committee provides oversight of the valuation of investments for the Portfolio. The Board has responsibility for overseeing the determination of the fair value of investments.
The Portfolio’s securities are recorded on the basis of amortized cost which approximates fair value as permitted by Rule 2a-7 under the 1940 Act. This method values a security at its cost on the date of purchase and, thereafter, assumes a constant amortization to maturity of any premiums or accretion of any discounts.
Because of the inherent uncertainties of valuation and under certain market conditions, the values reflected in the financial statements may differ from the value received upon actual sale of those investments and it is possible that the differences could be material.
Various inputs are used in determining the value of the Portfolio’s investments. The Portfolio values its assets and liabilities at fair value using a fair value hierarchy consisting of three broad levels that prioritize the inputs to valuation techniques giving the highest priority to readily available unadjusted quoted prices in active markets for identical assets or liabilities (Level 1 measurements) and the lowest priority to unobservable inputs (Level 3 measurements) when market prices are not readily available or reliable. The categorization of a value determined for an investment within the hierarchy is based upon the pricing transparency of the investment and is not necessarily an indication of the risk associated with investing in it.
The three levels of the fair value hierarchy are as follows:
• Level 1 – Unadjusted quoted prices in active markets for an identical asset or liability;
• Level 2 – Inputs other than quoted prices included within Level 1 that are observable for the asset or liability either directly or indirectly, including quoted prices for similar assets or liabilities in active markets, quoted prices for identical or similar assets or liabilities in markets that are not considered to be active, inputs other than quoted prices that are observable for the
STATE STREET MASTER FUNDS
STATE STREET TREASURY PLUS MONEY MARKET PORTFOLIO
NOTES TO FINANCIAL STATEMENTS (continued)
December 31, 2018
asset or liability (such as exchange rates, financing terms, interest rates, yield curves, volatilities, prepayment speeds, loss severities, credit risks and default rates) or other market-corroborated inputs; and
• Level 3 – Unobservable inputs for the asset or liability, including the Committee’s assumptions used in determining the fair value of investments.
Investment Transactions and Income Recognition
Investment transactions are accounted for on trade date for financial reporting purposes. Realized gains and losses from the sale or disposition of investments are determined using the identified cost method. Interest income is recorded daily on an accrual basis. All premiums and discounts are amortized/accreted for financial reporting purposes.
All of the net investment income and realized gains and losses from the security transactions of the Portfolio are allocated pro rata among the partners in the Portfolio on a daily basis based on each partner’s daily ownership percentage.
Expenses
Certain expenses, which are directly identifiable to a specific Portfolio, are applied to that Portfolio within the Trust. Other expenses which cannot be attributed to a specific Portfolio are allocated in such a manner as deemed equitable, taking into consideration the nature and type of expense and the relative net assets of the Portfolio within the Trust.
3. Securities and Other Investments
Repurchase Agreements
The Portfolio may enter into repurchase agreements under the terms of a Master Repurchase Agreement. A repurchase agreement customarily obligates the seller at the time it sells securities to the Portfolio to repurchase the securities at a mutually agreed upon price and time. During the term of a repurchase agreement, the value of the underlying securities held as collateral on behalf of the Portfolio including accrued interest, is required to exceed the value of the repurchase agreement, including accrued interest.
The Portfolio monitors, on a daily basis, the value of the collateral to ensure it is at least equal to the Portfolio’s principal amount of the repurchase agreement (including accrued interest). The underlying securities are ordinarily United States Government or Government Agency securities, but may consist of other securities. The use of repurchase agreements involves certain risks including counterparty risks. In the event of a default by the counterparty, realization of the collateral proceeds could be delayed, during which the value of the collateral may decline.
As of December 31, 2018, the Portfolio had invested in repurchase agreements with the gross values of $6,345,000,000 and associated collateral equal to $6,473,086,116.
4. Fees and Transactions with Affiliates
Advisory and Administrator Fee
The Trust has entered into an investment advisory agreement with SSGA Funds Management, Inc. (the “Adviser” or “SSGA FM”), a subsidiary of State Street Corporation and an affiliate of State Street Bank and Trust Company (“State Street”), under which the Adviser directs the investments of the Portfolio in accordance with its investment objective, policies, and limitations. In compensation for the Adviser’s services as investment adviser, the Portfolio pays the Adviser a management fee at an annual rate of 0.05% of its average daily net assets. SSGA FM also serves as administrator.
Custodian, Sub-Administrator and Transfer Agent Fees
State Street serves as the custodian, sub-administrator and transfer agent to the Portfolio. For its services as custodian, sub-administrator and transfer agent the Portfolio pays State Street an annual fee. The fees are accrued daily and paid monthly.
STATE STREET MASTER FUNDS
STATE STREET TREASURY PLUS MONEY MARKET PORTFOLIO
NOTES TO FINANCIAL STATEMENTS (continued)
December 31, 2018
5. Trustees’ Fees
The fees and expenses of the Trust’s trustees, who are not “interested persons” of the Trust, as defined in the 1940 Act (“Independent Trustees”), are paid directly by the Portfolio. The Independent Trustees are reimbursed for travel and other out-of-pocket expenses in connection with meeting attendance and industry seminars.
6. Income Tax Information
The Portfolio is not required to pay federal income taxes on its net investment income and net capital gains because it is treated as a partnership for federal income tax purposes. All interest, gains and losses of the Portfolio are deemed to have been “passed through” to the Portfolio’s partners in proportion to their holdings in the Portfolio, regardless of whether such items have been distributed by the Portfolio. Each partner is responsible for its tax liability based on its distributive share; therefore, no provision has been made for federal income taxes.
The Portfolio files federal and various state and local tax returns as required. No income tax returns are currently under examination. Generally, the federal returns are subject to examination by the Internal Revenue Service for a period of three years from date of filing, while the state returns may remain open for an additional year depending upon jurisdiction. SSGA FM has analyzed the Portfolio’s tax positions taken on tax returns for all open years and does not believe there are any uncertain tax positions that would require recognition of a tax liability.
As of December 31, 2018, the cost of investments for federal income tax purposes was substantially the same as the cost for financial reporting purposes.
7. Risks
Concentration Risk
As a result of the Portfolio's ability to invest a large percentage of its assets in obligations of issuers within the same country, state, region, currency or economic sector, an adverse economic, business or political development may affect the value of the Portfolio's investments more than if the Portfolio was more broadly diversified.
Market, Credit and Counterparty Risk
In the normal course of business, the Portfolio trades securities and enters into financial transactions where risk of potential loss exists due to changes in global economic conditions and fluctuations of the market (market risk). Additionally, the Portfolio may also be exposed to counterparty risk in the event that an issuer or guarantor fails to perform or that an institution or entity with which the Portfolio has unsettled or open transactions defaults. The value of securities held by the Portfolio may decline in response to certain events, including those directly involving the companies whose securities are owned by the Portfolio; conditions affecting the general economy; overall market changes; local, regional or global political, social or economic instability; and currency and interest rate and price fluctuations (credit risk).
Financial assets, which potentially expose the Portfolio to market, credit and counterparty risks, consist principally of investments and cash due from counterparties. The extent of the Portfolio’s exposure to market, credit and counterparty risks in respect to these financial assets approximates their value as recorded in the Portfolio’s Statement of Assets and Liabilities, less any collateral held by the Portfolio.
8. Recent Accounting Pronouncements
In March 2017, the Financial Accounting Standards Board (FASB) issued Accounting Standards Update (ASU) No. 2017-08, Receivables — Nonrefundable Fees and Other Costs (Subtopic 310-20): Premium Amortization on Purchased Callable Debt Securities. The amendments in the ASU shorten the amortization period for certain callable debt securities, held at a premium, to be amortized to the earliest call date. The ASU does not require an accounting change for securities held at a discount; which continues to be amortized to maturity. The ASU is effective for fiscal years and interim periods within those fiscal years beginning after December 15, 2018. Management is currently evaluating the impact, if any, of applying this provision.
STATE STREET MASTER FUNDS
STATE STREET TREASURY PLUS MONEY MARKET PORTFOLIO
NOTES TO FINANCIAL STATEMENTS (continued)
December 31, 2018
In August 2018, the U.S. Securities and Exchange Commission (the “SEC”) released its Final Rule on Disclosure Update and Simplification (the “Final Rule”) which is intended to simplify an issuer’s disclosure compliance efforts by removing redundant or outdated disclosure requirements without significantly altering the mix of information provided to investors. The Portfolio has adopted the Final Rule for the current period.
9. Subsequent Events
Management has evaluated the impact of all subsequent events on the Portfolio through the date the financial statements were issued and has determined that there were no subsequent events requiring adjustment or disclosure in the financial statements.
STATE STREET MASTER FUNDS
STATE STREET TREASURY PLUS MONEY MARKET PORTFOLIO
REPORT OF INDEPENDENT REGISTERED PUBLIC ACCOUNTING FIRM
To the Owners of Beneficial Interest and the Board of Trustees of State Street Treasury Plus Money Market Portfolio
Opinion on the Financial Statements
We have audited the accompanying statement of assets and liabilities of State Street Treasury Plus Money Market Portfolio (the “Portfolio”) (one of the portfolios constituting State Street Master Funds (the “Trust”)), including the schedule of investments, as of December 31, 2018, and the related statement of operations for the year then ended, the statements of changes in net assets for each of the two years in the period then ended, the financial highlights for each of the five years in the period then ended and the related notes (collectively referred to as the “financial statements”). In our opinion, the financial statements present fairly, in all material respects, the financial position of the Portfolio (one of the portfolios constituting State Street Master Funds) at December 31, 2018, the results of its operations for the year then ended, the changes in its net assets for each of the two years in the period then ended and its financial highlights for each of the five years in the period then ended, in conformity with U.S. generally accepted accounting principles.
Basis for Opinion
These financial statements are the responsibility of the Trust’s management. Our responsibility is to express an opinion on the Portfolio’s financial statements based on our audits. We are a public accounting firm registered with the Public Company Accounting Oversight Board (United States) (“PCAOB”) and are required to be independent with respect to the Trust in accordance with the U.S. federal securities laws and the applicable rules and regulations of the Securities and Exchange Commission and the PCAOB.
We conducted our audits in accordance with the standards of the PCAOB. Those standards require that we plan and perform the audit to obtain reasonable assurance about whether the financial statements are free of material misstatement, whether due to error or fraud. The Trust is not required to have, nor were we engaged to perform, an audit of the Trust’s internal control over financial reporting. As part of our audits we are required to obtain an understanding of internal control over financial reporting, but not for the purpose of expressing an opinion on the effectiveness of the Trust’s internal control over financials reporting. Accordingly, we express no such opinion.
Our audits included performing procedures to assess the risks of material misstatement of the financial statements, whether due to error or fraud, and performing procedures that respond to those risks. Such procedures included examining, on a test basis, evidence regarding the amounts and disclosures in the financial statements. Our procedures included confirmation of securities owned as of December 31, 2018, by correspondence with the custodian, brokers and others or by other appropriate auditing procedures where replies from brokers and others were not received. Our audits also included evaluating the accounting principles used and significant estimates made by management, as well as evaluating the overall presentation of the financial statements. We believe that our audits provide a reasonable basis for our opinion.
We have served as the auditor of one or more State Street Global Advisors investment companies since 2000.
Boston, Massachusetts
February 27, 2019
STATE STREET MASTER FUNDS
STATE STREET TREASURY PLUS MONEY MARKET PORTFOLIO
OTHER INFORMATION
December 31, 2018 (Unaudited)
Expense Example
As a shareholder of the Portfolio, you incur two types of costs: (1) transaction costs, including sales charges (loads), if applicable, on purchase payments, reinvested dividends, or other distributions and (2) ongoing costs, including advisory fees and to the extent applicable, distribution (12b-1) and/or service fees; and other Portfolio expenses. This example is intended to help you understand your ongoing costs (in dollars) of investing in the Portfolio and to compare these costs with the ongoing costs of investing in other mutual funds. It is based on an investment of $1,000 made at the beginning of the period shown and held for the entire period from July 1, 2018 to December 31, 2018.
The table below illustrates your Portfolio's cost in two ways:
Based on actual fund return ——This section helps you to estimate the actual expenses that you paid over the period. The “Ending Account Value” shown is derived from the Portfolio's actual return, and the third column shows the dollar amount that would have been paid by an investor who started with $1,000 in the Portfolio. You may use the information here, together with the amount you invested, to estimate the expenses that you paid over the period. To do so, simply divide your account value by $1,000 (for example, an $8,600 account value divided by $1,000 = 8.6), then multiply the result by the number given for the Portfolio under the heading “Expenses Paid During Period”.
Based on hypothetical 5% return ——This section is intended to help you compare your Portfolio's costs with those of other mutual funds. It assumes that the Portfolio had a yearly return of 5% before expenses, but that the expense ratio is unchanged. In this case, because the return used is not the Portfolio's actual return, the results do not apply to your investment. The example is useful in making comparisons because the SEC requires all mutual funds to calculate expenses based on a 5% return. You can assess your Portfolio's costs by comparing this hypothetical example with the hypothetical examples that appear in shareholder reports of other funds.
Please note that the expenses shown in the table are meant to highlight your ongoing costs only and do not reflect any transaction costs, such as sales load charges (loads). Therefore, the hypothetical 5% return section of the table is useful in comparing ongoing costs only, and will not help you determine the relative total costs of owning different funds. In addition, if these transaction costs were included, your costs would have been higher.
STATE STREET MASTER FUNDS
STATE STREET TREASURY PLUS MONEY MARKET PORTFOLIO
OTHER INFORMATION (continued)
December 31, 2018 (Unaudited)
| | | | Actual | | Hypothetical (assuming a 5%
return before expenses) |
| | Annualized
Expense Ratio | | Ending Account
Value | | Expenses Paid
During Period(a) | | Ending Account
Value | | Expenses Paid
During Period(a) |
State Street Treasury Plus Money Market Portfolio
| 0.07% | | $1,011.40 | | $0.35 | | $1,024.90 | | $0.36 |
| (a) | Expenses are equal to the Portfolio’s annualized net expense ratio multiplied by the average account value of the period, multiplied by 184, then divided by 365. |
Proxy Voting Policies and Procedures and Records
The Portfolio has adopted the proxy voting policies of the Adviser. A description of the policies and procedures that the Portfolio has adopted to determine how to vote proxies relating to portfolio securities are contained in the Portfolio’s Statement of Additional Information, which is available (i) without charge, upon request, by calling the Portfolio at 1-877-521-4083 (toll free) or (ii) on the SEC’s website at www.sec.gov. Information regarding how the Portfolio voted proxies, if any, during the most recent 12-month period ended June 30 is available by August 31 of each year without charge (1) by calling 1-877-521-4083 (toll free), or (2) on the website of the SEC at www.sec.gov.
Quarterly Portfolio Schedule
The Portfolio will file its complete schedule of investments with the SEC for the first and third quarters of each fiscal year on Form N-Q. The Portfolio’s Form N-Q is available (i) without charge, upon request, by calling the Portfolio at 1-877-521-4083 (toll free) or (ii) on the SEC’s website at www.sec.gov.
Monthly Portfolio Schedule
The Portfolio files its monthly portfolio holdings with the SEC on Form N-MFP. The Portfolio’s Form N-MFP is available on the SEC’s website at www.sec.gov.
Special Meeting of Shareholders — Voting Results
A special meeting of shareholders of State Street Master Funds (the “Trust”) was held on December 18, 2018 to elect the following four nominees as Trustees of the Trust: Michael A. Jessee, Ellen M. Needham, Donna M. Rapaccioli and John R. Costantino. At the meeting the following votes were recorded:
| Nominee | Shares For | Shares Withheld |
| Michael A. Jessee | 70,681,020,370.077 | 7,661,214,196.910 |
| Ellen M. Needham | 77,884,129,343.272 | 458,105,223.715 |
| Donna M. Rapaccioli | 78,036,680,506.030 | 305,554,060.957 |
| John R. Costantino | 78,035,382,515.554 | 306,852,051.433 |
| The other Trustees whose term of office continued after the meeting are as follows: James E. Ross, Michael F. Holland, Patrick J. Riley, Richard D. Shirk, Bruce D. Taber and Rina K. Spence. |
STATE STREET MASTER FUNDS
STATE STREET TREASURY PLUS MONEY MARKET PORTFOLIO
OTHER INFORMATION (continued)
December 31, 2018 (Unaudited)
TRUSTEES AND OFFICERS INFORMATION
Name, Address
and Year of Birth | | Position(s) Held with Trust | | Term of
Office and
Length of
Time Served | | Principal Occupation During the Past Five Years and Relevant Experience | | Number of Funds in Fund Complex Overseen by Trustee† | | Other
Directorships
Held by Trustee
During the
Past Five Years |
| Trustees | | | | | | | | | | |
| Independent Trustees | | | | | | | | | | |
Michael F. Holland
c/o SSGA Funds
Management, Inc.
One Iron Street
Boston, MA 02210
YOB: 1944 | | Trustee and
Co-
Chairperson
of the Board | | Term: Indefinite
Elected: 7/99 | | Chairman, Holland & Company L.L.C. (investment adviser) (1995- present). | | 67 | | Director, the Holland Series Fund, Inc.; Director, The China Fund, Inc.; Director, The Taiwan Fund, Inc. (2007-2017); Director, Reaves Utility Income Fund, Inc.; and Director, Blackstone/GSO Loans (and Real Estate) Funds. |
Patrick J. Riley
c/o SSGA Funds
Management, Inc.
One Iron Street
Boston, MA 02210
YOB: 1948 | | Trustee and
Co-
Chairperson
of the Board | | Term: Indefinite
Elected: 1/14 | | 2002 to May 2010, Associate Justice of the Superior Court, Commonwealth of Massachusetts; 1985 to 2002, Partner, Riley, Burke & Donahue, L.L.P. (law firm); 1998 to Present, Independent Director, State Street Global Advisers Ireland, Ltd. (investment company); 1998 to Present, Independent Director, SSGA Liquidity plc (formerly, SSGA Cash Management Fund plc); January 2009 to Present, Independent Director, SSGA Fixed Income plc; and January 2009 to Present, Independent Director, SSGA Qualified Funds PLC. | | 67 | | Board Director and Chairman, SPDR Europe 1PLC Board (2011-Present); Board Director and Chairman, SPDR Europe II, PLC (2013- Present). |
John R. Costantino
c/o SSGA Funds
Management, Inc.
One Iron Street
Boston, MA 02210
YOB: 1946 | | Trustee and
Co-
Chairperson
of the Qualified
Legal and
Compliance Committee | | Term: Indefinite
Elected: 12/18 | | General Partner, NGN Capital LLC (2006 – present); and Managing Director, Vice President of Walden Capital Management (1996 – present). | | 67 | | Trustee of Neuroscience Research Institute (1986 – present); Trustee of Fordham University (1989 – 1995 and 2001 – 2007) and Trustee Emeritus (2007 – present); Trustee of GE Funds (1993 – February 2011); Director of Artes Medical (2006 – 2008); and Trustee of Gregorian University Foundation (1992 – 2007). |
Richard D. Shirk
c/o SSGA Funds
Management, Inc.
One Iron Street
Boston, MA 02210
YOB: 1945 | | Trustee and
Co-
Chairperson
of the Qualified
Legal and
Compliance Committee | | Term: Indefinite
Elected: 1/14 | | March 2001 to April 2002, Chairman (1996 to March 2001, President and Chief Executive Officer), Cerulean Companies, Inc. (holding company) (Retired); 1992 to March 2001, President and Chief Executive Officer, Blue Cross Blue Shield of Georgia (health insurer, managed healthcare). | | 67 | | 1998 to December 2008, Chairman, Board Member and December 2008 to Present, Investment Committee Member, Healthcare Georgia Foundation (private foundation); September 2002 to 2012, Lead Director and Board Member, Amerigroup Corp. (managed health care); 1999 to 2013, Board Member and (since 2001) Investment Committee Member, Woodruff Arts Center; and 2003 to 2009, Trustee, Gettysburg College; Board member, Aerocare Holdings, Regenesis Biomedical Inc. |
Rina K. Spence
c/o SSGA Funds
Management, Inc.
One Iron Street
Boston, MA 02210
YOB: 1948 | | Trustee and Co-
Chairperson of the Audit Committee,
Co-Chairperson of the Nominating Committee and
Co-
Chairperson of the Governance Committee | | Term: Indefinite
Elected: 7/99 | | President of SpenceCare International LLC (international healthcare consulting) (1999 – present); Chief Executive Officer, IEmily.com (health internet company) (2000 – 2001); Chief Executive Officer of Consensus Pharmaceutical, Inc. (1998 – 1999); Founder, President and Chief Executive Officer of Spence Center for Women’s Health (1994 – 1998); President and CEO, Emerson Hospital (1984 – 1994); Honorary Consul for Monaco in Boston (2015 – present). | | 67 | | |
STATE STREET MASTER FUNDS
STATE STREET TREASURY PLUS MONEY MARKET PORTFOLIO
OTHER INFORMATION (continued)
December 31, 2018 (Unaudited)
Name, Address
and Year of Birth | | Position(s) Held with Trust | | Term of
Office and
Length of
Time Served | | Principal Occupation During the Past Five Years and Relevant Experience | | Number of Funds in Fund Complex Overseen by Trustee† | | Other
Directorships
Held by Trustee
During the
Past Five Years |
Bruce D. Taber
c/o SSGA Funds
Management, Inc.
One Iron Street
Boston, MA 02210
YOB: 1943 | | Trustee and Co-
Chairperson of the Valuation Committee, Co-
Chairperson of the Nominating Committee and Co
-Chairperson of the Governance Committee | | Term: Indefinite
Elected: 1/14 | | Retired; 1999 to 2016, Partner, Zenergy LLC (a technology company providing Computer Modeling and System Analysis to the General Electric Power Generation Division); Until December 2008, Independent Director, SSGA Cash Management Fund plc; Until December 2008, Independent Director, State Street Global Advisers Ireland, Ltd. (investment companies). | | 49 | | None. |
Michael A. Jessee
c/o SSGA Funds
Management, Inc.
One Iron Street
Boston, MA 02210
YOB: 1946 | | Trustee and Co-
Chairperson
of the Valuation Committee | | Term: Indefinite
Appointed: 7/16 | | Retired; formerly, President and Chief Executive Officer of the Federal Home Loan Bank of Boston (1989 – 2009); Trustee, Randolph-Macon College (2004-2016). | | 67 | | None. |
Donna M. Rapaccioli
c/o SSGA Funds
Management, Inc.
One Iron Street
Boston, MA 02210
YOB: 1962 | | Trustee and Co-
Chairperson
of the Audit Committee | | Term: Indefinite
Elected: 12/18 | | Dean of the Gabelli School of Business (2007 – present) and Accounting Professor (1987 – present) at Fordham University. | | 67 | | Director- Graduate Management Admissions Council (2015 - present); Trustee of Emmanuel College (2010 – present). |
| Interested Trustees(1) | | | | | | | | | | |
James E. Ross(2)
SSGA Funds Management, Inc.
One Iron Street
Boston, MA 02210
YOB: 1965 | | Trustee | | Term: Indefinite
Appointed: 2/07 | | Chairman and Director, SSGA Funds Management, Inc. (2005-present); Executive Vice President, State Street Global Advisors (2012-present); Chief Executive Officer and Director, State Street Global Advisors Funds Distributors, LLC (May 2017 – present); Director, State Street Global Markets, LLC (2013 - April 2017); President, SSGA Funds Management, Inc. (2005 – 2012), Principal, State Street Global Advisors (2000-2005). | | 185 | | SSGA SPDR ETFs Europe I plc (Director) (November 2016 – present); SSGA SPDR ETFs Europe II plc (Director) (November 2016 – present). |
Ellen M. Needham(3)
SSGA Funds Management, Inc.
One Iron Street
Boston, MA 02210
YOB: 1967 | | Trustee and President | | Term: Indefinite
Elected 12/18 | | President and Director, SSGA FM (2001 – present)*; Senior Managing Director, State Street Global Advisors (1992 – present)*; Director, State Street Global Advisors Funds Distributors, LLC (May 2017 – present).* | | 67 | | None. |
| † For the purpose of determining the number of portfolios overseen by the Trustees, “Fund Complex” comprises registered investment companies for which SSGA Funds Management, Inc. serves as investment adviser. |
| (1) The individuals listed below are Trustees who are “interested persons,” as defined in the 1940 Act, of the Trusts (“Interested Trustees”). |
| (2) Mr. Ross is an Interested Trustee because of his employment by SSGA Funds Management, Inc., an affiliate of the Trust. |
| (3) Ms. Needham is an Interested Trustee because of her employment by SSGA Funds Management, Inc., an affiliate of the Trust. |
| * Served in various capacities and/or with various affiliated entities during noted time period. |
| The following lists the principal officers for the Trust, as well as their mailing addresses and ages, positions with the Trust and length of time served, and present and principal occupations: |
STATE STREET MASTER FUNDS
STATE STREET TREASURY PLUS MONEY MARKET PORTFOLIO
OTHER INFORMATION (continued)
December 31, 2018 (Unaudited)
Name, Address
and Year of Birth | | Position(s) Held with Trust | | Term of
Office and
Length of
Time Served | | Principal Occupation(s) During the Past 5 Years |
| Officers | | | | | | |
ELLEN M. NEEDHAM
SSGA Funds Management, Inc.
One Iron Street
Boston, MA 02210
YOB: 1967 | | President, Trustee | | Term: Indefinite
Elected: 10/12 | | President and Director, SSGA Funds Management, Inc. (2001 - present)*; Senior Managing Director, State Street Global Advisors (1992 - present); Director, State Street Global Advisors Funds Distributors, LLC (May 2017 - present).* |
BRUCE S. ROSENBERG
SSGA Funds Management, Inc.
One Iron Street
Boston, MA 02210
YOB: 1961 | | Treasurer | | Term: Indefinite
Elected: 2/16 | | Managing Director, State Street Global Advisors and SSGA Funds Management, Inc. (July 2015 - present); Director, Credit Suisse (April 2008 - July 2015). |
ANN M. CARPENTER
SSGA Funds Management, Inc.
One Iron Street
Boston, MA 02210
YOB: 1966 | | Vice
President
and Deputy
Treasurer | | Term: Indefinite
Elected: 10/12
Term: Indefinite
Elected: 2/16 | | Chief Operating Officer, SSGA Funds Management, Inc. (2005 - Present)*; Managing Director, State Street Global Advisors (2005 - present).* |
CHAD C. HALLETT
SSGA Funds Management, Inc.
One Iron Street
Boston, MA 02210
YOB: 1969 | | Deputy Treasurer | | Term: Indefinite
Elected: 2/16 | | Vice President, State Street Global Advisors and SSGA Funds Management, Inc. (November 2014 – present); Vice President, State Street Bank and Trust Company (2001 –November 2014).* |
DARLENE ANDERSON-VASQUEZ
SSGA Funds Management, Inc.
One Iron Street
Boston, MA 02210
YOB: 1968 | | Deputy Treasurer | | Term: Indefinite
Elected: 11/16 | | Managing Director, State Street Global Advisors and SSGA Funds Management, Inc. (May 2016 – present); Senior Vice President, John Hancock Investments (September 2007 – May 2016). |
ARTHUR A. JENSEN
SSGA Funds Management, Inc.
1600 Summer Street
Stamford, CT 06905
YOB: 1966 | | Deputy Treasurer | | Term: Indefinite
Elected: 11/16 | | Vice President at State Street Global Advisors (July 2016 – present); Deputy Treasurer of Elfun Funds (July 2016 – present); Treasurer of State Street Institutional Funds, State Street Variable Insurance Series Funds, Inc. and GE Retirement Savings Plan Funds (June 2011 – present); Treasurer of Elfun Funds (June 2011– July 2016); Mutual Funds Controller of GE Asset Management Incorporated (April 2011 – July 2016). |
SUJATA UPRETI
SSGA Funds Management, Inc.
One Iron Street
Boston, MA 02210
YOB: 1974 | | Assistant
Treasurer | | Term: Indefinite
Elected: 2/16 | | Vice President, State Street Global Advisors and SSGA Funds Management, Inc. (May 2015 – present); Assistant Director, Cambridge Associates, LLC (July 2014 – January 2015); Vice President, Bank of New York Mellon (July 2012 – August 2013); Manager, PricewaterhouseCoopers, LLP (September 2003 – July 2012). |
DANIEL FOLEY
SSGA Funds Management, Inc.
One Iron Street
Boston, MA 02210
YOB: 1972 | | Assistant
Treasurer | | Term: Indefinite
Elected: 2/16 | | Vice President, State Street Global Advisors and SSGA Funds Management, Inc. (April 2007 – present).* |
DANIEL G. PLOURDE
SSGA Funds Management, Inc.
One Iron Street
Boston, MA 02210
YOB: 1980 | | Assistant
Treasurer | | Term: Indefinite
Elected: 5/17 | | Vice President, State Street Global Advisors and SSGA Funds Management, Inc. (May 2015 – present); Officer, State Street Bank and Trust Company (March 2009 – May 2015). |
BRIAN HARRIS
SSGA Funds Management, Inc.
One Iron Street
Boston, MA 02210
YOB: 1973 | | Chief Compliance Officer, Anti-Money Laundering Officer and Code of Ethics Compliance Officer | | Term: Indefinite
Elected: 11/13
Term: Indefinite
Elected: 9/16 | | Managing Director, State Street Global Advisors and SSGA Funds Management, Inc. (2013—Present); Senior Vice President and Global Head of Investment Compliance, BofA Global Capital Management (September 2010 – May 2013). |
STATE STREET MASTER FUNDS
STATE STREET TREASURY PLUS MONEY MARKET PORTFOLIO
OTHER INFORMATION (continued)
December 31, 2018 (Unaudited)
Name, Address
and Year of Birth | | Position(s) Held with Trust | | Term of
Office and
Length of
Time Served | | Principal Occupation(s) During the Past 5 Years |
JOSHUA A. WEINBERG
SSGA Funds Management, Inc.
One Iron Street
Boston, MA 02210
YOB: 1978 | | Chief Legal Officer | | Term: Indefinite
Elected: 2/15 | | Managing Director and Managing Counsel, State Street Global Advisors (2011 – present)*; Clerk, SSGA Funds Management, Inc. (2013 – present); Associate, Financial Services Group, Dechert LLP (2005 – 2011). |
JESSE D. HALLEE
State Street Bank and Trust Company
100 Summer Street,
7th Floor
Boston, MA 02111-2900
YOB: 1976 | | Secretary | | Term: Indefinite
Elected: 9/16 | | Vice President and Managing Counsel, State Street Bank and Trust Company (2013 – present); Vice President and Counsel, Brown Brothers Harriman & Co. (2007-2013). |
KHIMMARA GREER
State Street Bank and Trust Company
100 Summer Street,
7th Floor
Boston, MA 02111-2900
YOB: 1983 | | Assistant Secretary | | Term: Indefinite
Elected: 5/16 | | Vice President and Counsel, State Street Bank and Trust Company (2015- present); Regulatory Advisor, JPMorgan (2014 – 2015); Claims Case Manager, Liberty Mutual Insurance (2012 – 2014); Contract Attorney, Various Law Firms (2011 – 2012). |
| * Served in various capacities and/or with various affiliated entities during noted time period. |
| Statement of Additional Information (SAI) includes additional information about Portfolio's directors and is available, without charge, upon request and by calling 1-877-521-4083. |
Trustees
John R. Costantino
Michael F. Holland
Michael A. Jessee
Ellen M. Needham
Donna M. Rapaccioli
Patrick J. Riley
James E. Ross
Richard D. Shirk
Rina K. Spence
Bruce D. Taber
Investment Adviser and Administrator
SSGA Funds Management, Inc.
One Iron Street
Boston, MA 02210
Custodian, Sub-Administrator and Transfer Agent
State Street Bank and Trust Company
State Street Financial Center
One Lincoln Street
Boston, MA 02111
Independent Registered Public Accounting Firm
Ernst & Young LLP
200 Clarendon Street
Boston, MA 02116
Legal Counsel
Ropes & Gray LLP
800 Boylston Street
Boston, MA 02199
This report is for shareholder information. This is not a prospectus intended for use in the purchase or sale of shares of beneficial interest.
State Street Master Funds
State Street Bank and Trust Company
P.O. Box 5049
Boston, MA 02206
STTTPAR1
00215114
The information contained in this report is intended for the general information of shareholders of the Portfolio and shareholders of any fund invested in the Portfolio. Interests in the Portfolio are offered solely to eligible investors in private placement transactions that do not involve any “public offering” within the meaning of Section 4(a)(2) of the 1933 Act. This report is not authorized for distribution (i) to prospective investors in any fund invested in the Portfolio unless preceded or accompanied by a current offering document for such fund or (ii) to prospective eligible investors in the Portfolio unless preceded or accompanied by a current offering document of the Portfolio. Eligible investors in the Portfolio may obtain a current Portfolio offering document by calling 1-877-521-4083. Please read the offering document carefully before investing in the Portfolio.
Annual Report
December 31, 2018
State Street Master Funds
| State Street International Developed Equity Index Portfolio |
The information contained in this report is intended for the general information of shareholders of the Portfolio and shareholders of any fund invested in the Portfolio. Interests in the Portfolio are offered solely to eligible investors in private placement transactions that do not involve any “public offering” within the meaning of Section 4(a)(2) of the 1933 Act. This report is not authorized for distribution (i) to prospective investors in any fund invested in the Portfolio unless preceded or accompanied by a current offering document for such fund or (ii) to prospective eligible investors in the Portfolio unless preceded or accompanied by a current offering document of the Portfolio. Eligible investors in the Portfolio may obtain a current Portfolio offering document by calling 1-877-521-4083. Please read the offering document carefully before investing in the Portfolio.
TABLE OF CONTENTS
The information contained in this report is intended for the general information of shareholders of the Portfolio and shareholders of any fund invested in the Portfolio. Interests in the Portfolio are offered solely to eligible investors in private placement transactions that do not involve any “public offering” within the meaning of Section 4(a)(2) of the 1933 Act. This report is not authorized for distribution (i) to prospective investors in any fund invested in the Portfolio unless preceded or accompanied by a current offering document for such fund or (ii) to prospective eligible investors in the Portfolio unless preceded or accompanied by a current offering document of the Portfolio. Eligible investors in the Portfolio may obtain a current Portfolio offering document by calling 1-877-521-4083. Please read the offering document carefully before investing in the Portfolio.
STATE STREET INTERNATIONAL DEVELOPED EQUITY INDEX PORTFOLIO
Management's Discussion of Fund Performance (Unaudited)
The State Street International Developed Equity Index Portfolio (the “Portfolio”) seeks to provide investment results that, before fees and expenses, correspond generally to the total return performance of a broad-based developed market (ex-U.S. and Canada) large and mid-capitalization equity index over the long term. The Portfolio’s benchmark is the MSCI EAFE (Europe, Australasia, Far East) Index (the “Index”).
For the 12-month period ended December 31, 2018 (the “Reporting Period”), the total return for the Portfolio was –13.83%, and for the Index was–13.79% (Net). The Portfolio and Index returns reflect the reinvestment of dividends and other income. The Portfolio’s performance reflects the expenses of managing the Portfolio, including brokerage and advisory expenses. The Index is unmanaged and Index returns do not reflect fees and expenses of any kind, which would have a negative impact on returns. The cumulative effect of small weighting differences between the securities and the currencies in the Portfolio and the Index contributed to the difference between the Portfolio’s performance and that of the Index.
The Portfolio had a negative performance in 2018. The Portfolio’s performance was driven by a global trade war, a weakening global economy and political unrest in Europe over Brexit. In the first calendar quarter of 2018, positive factors such as tax cuts in the U.S., progress in talks between North and South Korea and good macro and earnings data were offset by a global trade war, an increase in rates by the Fed, inflation fears and increased volatility. The negative performance in the second calendar quarter of 2018 was driven by geopolitical concerns (Russia, Iran, North Korea), global trade (U.S. and China, U.S. and EU) and more hawkish stances by the U.S. and U.K. central banks. The Portfolio’s performance in the third calendar quarter was positive as a result of strong earnings and macro data but performance was hurt by continued uncertainty around Brexit, political unrest in the U.S. and hawkish tones from the Fed. The Portfolio’s negative performance in the fourth quarter echoed similar themes from earlier in the year: a weakening global economy, trade wars, political unrest and inflationary concerns. Positive performance from a new NAFTA deal were offset by worries over the Italian budget, ongoing U.S.-China hostilities, the looming Brexit deadline, concerns over global growth (Chinese retail sales and industrial production, Australian unemployment, French GDP) and the partial U.S. government shutdown.
The Portfolio used MSCI EAFE Index futures contracts in order to gain exposure to the index during the Reporting Period. The Portfolio’s use of index futures helped the Portfolio track the Index.
On an individual security level, the top positive contributors to the Portfolio’s performance during the Reporting Period were GlaxoSmithKline plc, Sky Limited, and CSL Limited. The top negative contributors to the Portfolio’s performance during the Reporting Period were BASF SE, Bayer AG, and British American Tobacco p.l.c..
The views expressed above reflect those of the Portfolio’s portfolio manager only through the Reporting Period, and do not necessarily represent the views of the Adviser as a whole. Any such views are subject to change at any time based upon market or other conditions and the Adviser disclaims any responsibility to update such views. These views may not be relied on as investment advice and, because investment decisions for a fund are based on numerous factors, may not be relied on as an indication of trading intent on behalf of any fund.
See accompanying notes to financial statements.
1
STATE STREET INTERNATIONAL DEVELOPED EQUITY INDEX PORTFOLIO
Management's Discussion of Fund Performance (Unaudited) (continued)
Comparison of Change in Value of a $10,000 Investment
(Based on Net Asset Value)
Line graph is based on cumulative total return.
Performance as of December 31, 2018
| | | | |
| | | Total Return
One Year Ended
December 31, 2018 | Average Annual
Total Return
Inception to Date *
December 31, 2018 | |
| | State Street International Developed Equity Index Portfolio | (13.83%) | 3.27% | |
| | MSCI EAFE (Europe, Australasia, Far East) Index(1) | (13.79%) | 3.31% | |
| | | | |
| * | Inception date is April 28, 2016. |
| (1) | The MSCI EAFE (Europe, Australasia, Far East) Index is a free float-adjusted market capitalization index that is designed to capture large and mid-cap securities in developed market countries, excluding the United States and Canada. Index returns are net of dividend withholding taxes. |
Total returns and performance graph information represent past performance and are not indicative of future results, which may be lower or higher than performance data quoted. Investment return and principal value of an investment will fluctuate so that an investor’s share, when redeemed, may be worth more or less than its original cost. The graph and table above do not reflect the deduction of taxes that a shareholder would pay on fund distributions, sales, or the redemption of fund shares.
See accompanying notes to financial statements.
2
State Street International Developed Equity Index Portfolio
PORTFOLIO STATISTICS (UNAUDITED)
Top Five Holdings as of December 31, 2018
| | | | |
| | Description | Market Value | % of Net Assets | |
| | Nestle SA | 55,183,424 | 2.0% | |
| | Novartis AG | 41,112,252 | 1.5 | |
| | Roche Holding AG | 38,581,048 | 1.4 | |
| | HSBC Holdings PLC | 35,909,139 | 1.3 | |
| | Royal Dutch Shell PLC Class A | 29,552,743 | 1.0 | |
| | TOTAL | 200,338,606 | 7.2% | |
(The five largest holdings are subject to change, and there are no guarantees the Portfolio will continue to remain invested in any particular company.)
Top Five Sectors as of December 31, 2018
| | | |
| | Description | % of Net Assets | |
| | Banks | 11.4% | |
| | Pharmaceuticals | 8.6 | |
| | Insurance | 5.6 | |
| | Oil & Gas | 5.6 | |
| | Food | 4.7 | |
| | TOTAL | 35.9% | |
(The top five sectors are expressed as a percentage of net assets and may change over time.)
See accompanying notes to financial statements.
3
STATE STREET MASTER FUNDS
STATE STREET INTERNATIONAL DEVELOPED EQUITY INDEX PORTFOLIO
SCHEDULE OF INVESTMENTS
December 31, 2018
| Security Description | | | Shares | | Value |
| COMMON STOCKS — 97.5% | | | | | |
| AUSTRALIA — 6.7% | | | | | |
AGL Energy, Ltd.
| | | 140,588 | | $2,038,863 |
Alumina, Ltd.
| | | 492,770 | | 797,893 |
Amcor, Ltd.
| | | 241,367 | | 2,251,471 |
AMP, Ltd.
| | | 574,606 | | 991,080 |
APA Group
| | | 240,180 | | 1,437,237 |
Aristocrat Leisure, Ltd.
| | | 122,732 | | 1,887,048 |
ASX, Ltd.
| | | 39,723 | | 1,676,221 |
Aurizon Holdings, Ltd.
| | | 398,649 | | 1,201,177 |
AusNet Services
| | | 359,274 | | 393,304 |
Australia & New Zealand Banking Group, Ltd.
| | | 621,074 | | 10,694,791 |
Bank of Queensland, Ltd.
| | | 70,707 | | 482,844 |
Bendigo & Adelaide Bank, Ltd.
| | | 96,812 | | 735,399 |
BHP Group PLC
| | | 455,948 | | 9,590,763 |
BHP Group, Ltd.
| | | 643,098 | | 15,497,319 |
BlueScope Steel, Ltd.
| | | 105,115 | | 811,050 |
Boral, Ltd.
| | | 224,782 | | 781,738 |
Brambles, Ltd.
| | | 332,676 | | 2,377,169 |
Caltex Australia, Ltd.
| | | 50,938 | | 913,721 |
Challenger, Ltd.
| | | 110,251 | | 736,582 |
CIMIC Group, Ltd.
| | | 19,072 | | 582,852 |
Coca-Cola Amatil, Ltd.
| | | 92,226 | | 531,753 |
Cochlear, Ltd.
| | | 12,427 | | 1,518,495 |
Coles Group, Ltd. (a)(b)
| | | 234,650 | | 1,939,372 |
Commonwealth Bank of Australia
| | | 384,561 | | 19,598,207 |
Computershare, Ltd.
| | | 91,749 | | 1,110,324 |
Crown Resorts, Ltd.
| | | 69,813 | | 582,899 |
CSL, Ltd.
| | | 98,655 | | 12,859,936 |
Dexus REIT
| | | 208,348 | | 1,557,709 |
Domino's Pizza Enterprises, Ltd.
| | | 10,366 | | 296,650 |
Flight Centre Travel Group, Ltd.
| | | 8,586 | | 259,432 |
Fortescue Metals Group, Ltd.
| | | 318,953 | | 940,835 |
Goodman Group REIT
| | | 342,621 | | 2,564,010 |
GPT Group REIT
| | | 382,164 | | 1,436,692 |
Harvey Norman Holdings, Ltd. (b)
| | | 107,605 | | 239,382 |
Incitec Pivot, Ltd.
| | | 310,159 | | 716,194 |
Insurance Australia Group, Ltd. (a)
| | | 499,055 | | 2,459,342 |
LendLease Group
| | | 112,522 | | 921,276 |
Macquarie Group, Ltd.
| | | 69,175 | | 5,291,166 |
Medibank Pvt, Ltd.
| | | 542,337 | | 981,239 |
Mirvac Group REIT
| | | 745,563 | | 1,175,723 |
National Australia Bank, Ltd.
| | | 590,511 | | 10,006,371 |
Newcrest Mining, Ltd.
| | | 165,806 | | 2,544,657 |
Oil Search, Ltd.
| | | 277,983 | | 1,401,212 |
Orica, Ltd.
| | | 73,878 | | 897,174 |
Origin Energy, Ltd. (a)
| | | 379,917 | | 1,730,476 |
QBE Insurance Group, Ltd.
| | | 278,469 | | 1,980,025 |
Ramsay Health Care, Ltd.
| | | 29,431 | | 1,196,132 |
REA Group, Ltd.
| | | 10,695 | | 557,016 |
Santos, Ltd.
| | | 358,312 | | 1,382,339 |
| Security Description | | | Shares | | Value |
Scentre Group REIT
| | | 1,122,682 | | $3,082,435 |
SEEK, Ltd.
| | | 63,950 | | 761,752 |
Sonic Healthcare, Ltd.
| | | 88,625 | | 1,379,487 |
South32, Ltd.
| | | 1,072,398 | | 2,529,143 |
Stockland REIT
| | | 490,435 | | 1,215,337 |
Suncorp Group, Ltd.
| | | 280,850 | | 2,497,183 |
Sydney Airport
| | | 235,304 | | 1,114,851 |
Tabcorp Holdings, Ltd.
| | | 399,455 | | 1,206,418 |
Telstra Corp., Ltd.
| | | 888,283 | | 1,782,250 |
TPG Telecom, Ltd.
| | | 56,976 | | 258,315 |
Transurban Group Stapled Security
| | | 564,190 | | 4,627,259 |
Treasury Wine Estates, Ltd.
| | | 146,604 | | 1,527,496 |
Vicinity Centres REIT
| | | 661,985 | | 1,211,697 |
Washington H Soul Pattinson & Co., Ltd.
| | | 17,479 | | 306,277 |
Wesfarmers, Ltd.
| | | 242,869 | | 5,508,967 |
Westpac Banking Corp.
| | | 749,012 | | 13,203,699 |
Woodside Petroleum, Ltd.
| | | 199,520 | | 4,399,271 |
Woolworths Group, Ltd.
| | | 284,287 | | 5,888,059 |
WorleyParsons, Ltd.
| | | 56,776 | | 456,461 |
| | | | | | 187,510,917 |
| AUSTRIA — 0.2% | | | | | |
ANDRITZ AG
| | | 14,404 | | 660,613 |
Erste Group Bank AG (a)
| | | 67,409 | | 2,238,552 |
OMV AG
| | | 32,125 | | 1,404,681 |
Raiffeisen Bank International AG
| | | 34,387 | | 872,671 |
Verbund AG (b)
| | | 15,343 | | 653,165 |
Voestalpine AG
| | | 26,238 | | 782,842 |
| | | | | | 6,612,524 |
| BELGIUM — 0.9% | | | | | |
Ageas
| | | 38,930 | | 1,748,961 |
Anheuser-Busch InBev SA
| | | 165,977 | | 10,947,800 |
Colruyt SA
| | | 13,634 | | 970,054 |
Groupe Bruxelles Lambert SA
| | | 17,025 | | 1,480,678 |
KBC Group NV
| | | 54,440 | | 3,527,371 |
Proximus SADP
| | | 33,328 | | 899,896 |
Solvay SA
| | | 15,708 | | 1,567,970 |
Telenet Group Holding NV
| | | 10,840 | | 503,105 |
UCB SA
| | | 27,232 | | 2,219,587 |
Umicore SA
| | | 44,649 | | 1,779,272 |
| | | | | | 25,644,694 |
| CHILE — 0.0% (c) | | | | | |
Antofagasta PLC
| | | 74,949 | | 747,604 |
| CHINA — 0.2% | | | | | |
BeiGene, Ltd. ADR (a)
| | | 7,400 | | 1,037,924 |
BOC Hong Kong Holdings, Ltd.
| | | 779,000 | | 2,895,374 |
Minth Group, Ltd.
| | | 128,000 | | 412,806 |
Yangzijiang Shipbuilding Holdings, Ltd.
| | | 400,400 | | 367,205 |
| | | | | | 4,713,309 |
| DENMARK — 1.7% | | | | | |
AP Moller - Maersk A/S Class A
| | | 887 | | 1,046,255 |
See accompanying notes to financial statements.
4
STATE STREET MASTER FUNDS
STATE STREET INTERNATIONAL DEVELOPED EQUITY INDEX PORTFOLIO
SCHEDULE OF INVESTMENTS (continued)
December 31, 2018
| Security Description | | | Shares | | Value |
AP Moller - Maersk A/S Class B
| | | 1,483 | | $1,859,216 |
Carlsberg A/S Class B
| | | 23,912 | | 2,537,006 |
Chr. Hansen Holding A/S
| | | 21,761 | | 1,922,103 |
Coloplast A/S Class B
| | | 26,623 | | 2,467,377 |
Danske Bank A/S
| | | 157,694 | | 3,113,804 |
DSV A/S
| | | 41,695 | | 2,741,365 |
Genmab A/S (a)
| | | 13,917 | | 2,275,814 |
H Lundbeck A/S
| | | 15,024 | | 656,845 |
ISS A/S
| | | 38,781 | | 1,081,516 |
Novo Nordisk A/S Class B
| | | 403,159 | | 18,397,976 |
Novozymes A/S Class B
| | | 49,076 | | 2,186,936 |
Orsted A/S (d)
| | | 42,286 | | 2,822,327 |
Pandora A/S
| | | 25,242 | | 1,025,851 |
Tryg A/S
| | | 27,932 | | 701,301 |
Vestas Wind Systems A/S
| | | 42,940 | | 3,236,969 |
William Demant Holding A/S (a)
| | | 19,597 | | 555,072 |
| | | | | | 48,627,733 |
| FINLAND — 1.3% | | | | | |
Elisa Oyj
| | | 29,746 | | 1,226,869 |
Fortum Oyj
| | | 102,743 | | 2,243,307 |
Kone Oyj Class B
| | | 77,234 | | 3,676,397 |
Metso Oyj
| | | 26,240 | | 686,914 |
Neste Oyj
| | | 28,094 | | 2,163,310 |
Nokia Oyj
| | | 1,267,795 | | 7,289,876 |
Nokian Renkaat Oyj
| | | 25,302 | | 775,741 |
Nordea Bank Abp
| | | 684,831 | | 5,760,835 |
Orion Oyj Class B
| | | 24,454 | | 846,465 |
Sampo Oyj Class A
| | | 100,489 | | 4,412,310 |
Stora Enso Oyj Class R
| | | 128,218 | | 1,478,182 |
UPM-Kymmene Oyj
| | | 121,262 | | 3,070,447 |
Wartsila OYJ Abp
| | | 104,158 | | 1,654,453 |
| | | | | | 35,285,106 |
| FRANCE — 10.3% | | | | | |
Accor SA
| | | 38,556 | | 1,635,634 |
Aeroports de Paris
| | | 6,056 | | 1,145,742 |
Air Liquide SA
| | | 93,309 | | 11,567,945 |
Airbus SE
| | | 126,905 | | 12,180,197 |
Alstom SA
| | | 31,259 | | 1,260,328 |
Amundi SA (d)
| | | 13,383 | | 706,191 |
Arkema SA
| | | 14,803 | | 1,268,477 |
Atos SE
| | | 19,592 | | 1,600,908 |
AXA SA
| | | 428,285 | | 9,232,762 |
BioMerieux
| | | 7,385 | | 485,424 |
BNP Paribas SA
| | | 248,855 | | 11,229,790 |
Bollore SA
| | | 174,853 | | 699,591 |
Bouygues SA
| | | 47,859 | | 1,714,612 |
Bureau Veritas SA
| | | 54,972 | | 1,118,260 |
Capgemini SE
| | | 34,972 | | 3,470,111 |
Carrefour SA
| | | 122,788 | | 2,092,843 |
Casino Guichard Perrachon SA
| | | 9,264 | | 384,846 |
Cie de Saint-Gobain
| | | 105,269 | | 3,509,665 |
Cie Generale des Etablissements Michelin SCA
| | | 36,462 | | 3,613,788 |
CNP Assurances
| | | 37,775 | | 799,740 |
| Security Description | | | Shares | | Value |
Covivio REIT
| | | 7,536 | | $725,364 |
Credit Agricole SA
| | | 240,140 | | 2,588,686 |
Danone SA
| | | 133,076 | | 9,357,258 |
Dassault Aviation SA
| | | 467 | | 645,960 |
Dassault Systemes SE
| | | 28,473 | | 3,375,321 |
Edenred
| | | 49,231 | | 1,807,100 |
Eiffage SA
| | | 16,465 | | 1,373,250 |
Electricite de France SA
| | | 129,078 | | 2,036,266 |
Engie SA
| | | 391,029 | | 5,598,734 |
EssilorLuxottica SA
| | | 46,472 | | 5,867,596 |
Eurazeo SE
| | | 10,092 | | 712,966 |
Eutelsat Communications SA
| | | 32,571 | | 640,603 |
Faurecia SA
| | | 16,076 | | 607,737 |
Gecina SA REIT
| | | 9,737 | | 1,257,786 |
Getlink SE
| | | 102,452 | | 1,373,794 |
Hermes International
| | | 6,917 | | 3,833,395 |
ICADE REIT
| | | 5,854 | | 445,018 |
Iliad SA
| | | 5,881 | | 824,559 |
Imerys SA
| | | 8,119 | | 389,626 |
Ingenico Group SA
| | | 13,210 | | 748,104 |
Ipsen SA
| | | 8,146 | | 1,050,870 |
JCDecaux SA
| | | 12,316 | | 345,218 |
Kering SA
| | | 16,302 | | 7,670,424 |
Klepierre SA REIT
| | | 41,077 | | 1,265,965 |
Legrand SA
| | | 56,309 | | 3,173,422 |
L'Oreal SA
| | | 54,947 | | 12,637,905 |
LVMH Moet Hennessy Louis Vuitton SE
| | | 60,669 | | 17,907,139 |
Natixis SA
| | | 182,538 | | 859,505 |
Orange SA
| | | 432,736 | | 7,002,225 |
Pernod Ricard SA
| | | 46,091 | | 7,550,322 |
Peugeot SA
| | | 123,242 | | 2,626,783 |
Publicis Groupe SA
| | | 45,804 | | 2,622,231 |
Remy Cointreau SA
| | | 4,317 | | 488,316 |
Renault SA
| | | 40,226 | | 2,508,446 |
Rexel SA
| | | 55,951 | | 594,831 |
Safran SA
| | | 71,920 | | 8,665,496 |
Sanofi
| | | 246,225 | | 21,296,176 |
Sartorius Stedim Biotech
| | | 4,895 | | 488,786 |
Schneider Electric SE
| | | 118,491 | | 8,089,251 |
SCOR SE
| | | 33,090 | | 1,490,377 |
SEB SA
| | | 4,360 | | 562,210 |
Societe BIC SA
| | | 4,526 | | 461,253 |
Societe Generale SA
| | | 164,152 | | 5,220,432 |
Sodexo SA
| | | 19,735 | | 2,019,125 |
Suez
| | | 81,948 | | 1,080,117 |
Teleperformance
| | | 11,922 | | 1,902,557 |
Thales SA
| | | 22,273 | | 2,597,060 |
TOTAL SA
| | | 524,650 | | 27,696,618 |
Ubisoft Entertainment SA (a)
| | | 16,885 | | 1,360,411 |
Unibail-Rodamco-Westfield (e)
| | | 73,380 | | 552,757 |
Unibail-Rodamco-Westfield REIT
| | | 26,675 | | 4,128,823 |
Valeo SA
| | | 51,941 | | 1,514,691 |
Veolia Environnement SA
| | | 113,404 | | 2,327,646 |
Vinci SA
| | | 109,461 | | 9,011,886 |
See accompanying notes to financial statements.
5
STATE STREET MASTER FUNDS
STATE STREET INTERNATIONAL DEVELOPED EQUITY INDEX PORTFOLIO
SCHEDULE OF INVESTMENTS (continued)
December 31, 2018
| Security Description | | | Shares | | Value |
Vivendi SA
| | | 223,538 | | $5,437,836 |
Wendel SA
| | | 5,866 | | 702,089 |
| | | | | | 288,835,176 |
| GERMANY — 8.7% | | | | | |
1&1 Drillisch AG
| | | 12,173 | | 619,243 |
adidas AG
| | | 41,580 | | 8,669,868 |
Allianz SE
| | | 95,403 | | 19,100,754 |
Axel Springer SE
| | | 10,775 | | 608,235 |
BASF SE
| | | 203,533 | | 14,053,190 |
Bayer AG
| | | 206,683 | | 14,308,489 |
Bayerische Motoren Werke AG
| | | 72,799 | | 5,883,665 |
Bayerische Motoren Werke AG Preference Shares
| | | 13,069 | | 927,763 |
Beiersdorf AG
| | | 23,118 | | 2,409,116 |
Brenntag AG
| | | 35,735 | | 1,540,062 |
Commerzbank AG (a)
| | | 225,172 | | 1,488,575 |
Continental AG
| | | 24,838 | | 3,428,522 |
Covestro AG (d)
| | | 43,724 | | 2,158,269 |
Daimler AG
| | | 201,150 | | 10,556,756 |
Delivery Hero SE (a)(d)
| | | 20,117 | | 747,394 |
Deutsche Bank AG
| | | 427,426 | | 3,404,159 |
Deutsche Boerse AG
| | | 43,313 | | 5,196,415 |
Deutsche Lufthansa AG
| | | 54,713 | | 1,232,140 |
Deutsche Post AG
| | | 220,705 | | 6,032,466 |
Deutsche Telekom AG
| | | 738,099 | | 12,504,489 |
Deutsche Wohnen SE
| | | 80,291 | | 3,671,386 |
E.ON SE
| | | 495,279 | | 4,884,418 |
Evonik Industries AG
| | | 37,770 | | 941,254 |
Fraport AG Frankfurt Airport Services Worldwide
| | | 8,124 | | 580,063 |
Fresenius Medical Care AG & Co. KGaA
| | | 46,928 | | 3,038,494 |
Fresenius SE & Co. KGaA
| | | 92,904 | | 4,500,891 |
Fuchs Petrolub SE Preference Shares
| | | 14,455 | | 594,542 |
GEA Group AG
| | | 33,018 | | 849,252 |
Hannover Rueck SE
| | | 13,114 | | 1,764,472 |
HeidelbergCement AG
| | | 34,121 | | 2,082,109 |
Henkel AG & Co. KGaA Preference Shares
| | | 40,145 | | 4,378,073 |
Henkel AG & Co. KGaA
| | | 23,861 | | 2,338,977 |
HOCHTIEF AG
| | | 4,362 | | 586,902 |
HUGO BOSS AG
| | | 14,016 | | 863,927 |
Infineon Technologies AG
| | | 255,165 | | 5,065,228 |
Innogy SE (d)
| | | 4,735 | | 220,464 |
Innogy SE (a)
| | | 27,779 | | 1,178,766 |
KION Group AG
| | | 15,135 | | 766,979 |
Lanxess AG
| | | 20,021 | | 920,057 |
Merck KGaA
| | | 29,431 | | 3,027,291 |
METRO AG
| | | 34,671 | | 530,899 |
MTU Aero Engines AG
| | | 11,921 | | 2,158,594 |
Muenchener Rueckversicherungs-Gesellschaft AG in Muenchen
| | | 33,383 | | 7,271,725 |
OSRAM Licht AG
| | | 22,044 | | 955,569 |
| Security Description | | | Shares | | Value |
Porsche Automobil Holding SE Preference Shares
| | | 35,256 | | $2,081,241 |
ProSiebenSat.1 Media SE
| | | 51,152 | | 909,277 |
Puma SE
| | | 1,799 | | 878,137 |
QIAGEN NV (a)
| | | 48,061 | | 1,630,647 |
RWE AG
| | | 118,817 | | 2,575,933 |
SAP SE
| | | 218,222 | | 21,685,595 |
Sartorius AG Preference Shares
| | | 7,616 | | 948,108 |
Siemens AG
| | | 169,776 | | 18,899,452 |
Siemens Healthineers AG (a)(d)
| | | 32,376 | | 1,352,553 |
Symrise AG
| | | 28,316 | | 2,087,828 |
Telefonica Deutschland Holding AG
| | | 156,139 | | 610,080 |
ThyssenKrupp AG
| | | 100,059 | | 1,713,449 |
TUI AG
| | | 97,278 | | 1,394,418 |
Uniper SE
| | | 44,438 | | 1,148,064 |
United Internet AG
| | | 25,725 | | 1,123,368 |
Volkswagen AG
| | | 6,922 | | 1,100,682 |
Volkswagen AG Preference Shares
| | | 41,430 | | 6,579,348 |
Vonovia SE
| | | 107,968 | | 4,886,340 |
Wirecard AG
| | | 26,377 | | 4,004,300 |
Zalando SE (a)(d)
| | | 24,542 | | 629,558 |
| | | | | | 244,278,280 |
| HONG KONG — 3.6% | | | | | |
AIA Group, Ltd.
| | | 2,640,200 | | 21,919,189 |
ASM Pacific Technology, Ltd.
| | | 66,900 | | 644,703 |
Bank of East Asia, Ltd.
| | | 273,053 | | 868,401 |
CK Asset Holdings, Ltd.
| | | 556,679 | | 4,074,119 |
CK Hutchison Holdings, Ltd.
| | | 584,000 | | 5,609,252 |
CK Infrastructure Holdings, Ltd.
| | | 130,500 | | 988,415 |
CLP Holdings, Ltd.
| | | 353,500 | | 3,995,830 |
Dairy Farm International Holdings, Ltd.
| | | 77,000 | | 696,850 |
Galaxy Entertainment Group, Ltd.
| | | 508,000 | | 3,231,226 |
Hang Lung Group, Ltd.
| | | 187,000 | | 476,257 |
Hang Lung Properties, Ltd.
| | | 385,000 | | 733,675 |
Hang Seng Bank, Ltd.
| | | 162,200 | | 3,642,034 |
Henderson Land Development Co., Ltd.
| | | 288,579 | | 1,437,486 |
HK Electric Investments & HK Electric Investments, Ltd.
| | | 618,990 | | 624,576 |
HKT Trust & HKT, Ltd.
| | | 821,000 | | 1,182,841 |
Hong Kong & China Gas Co., Ltd.
| | | 1,987,350 | | 4,112,100 |
Hong Kong Exchanges & Clearing, Ltd.
| | | 257,105 | | 7,441,230 |
Hongkong Land Holdings, Ltd.
| | | 254,900 | | 1,605,870 |
Hysan Development Co., Ltd.
| | | 131,000 | | 623,264 |
Jardine Matheson Holdings, Ltd.
| | | 47,300 | | 3,291,134 |
Jardine Strategic Holdings, Ltd.
| | | 48,100 | | 1,765,751 |
Kerry Properties, Ltd.
| | | 146,000 | | 498,828 |
Link REIT
| | | 456,000 | | 4,618,621 |
Melco Resorts & Entertainment, Ltd. ADR
| | | 47,923 | | 844,403 |
See accompanying notes to financial statements.
6
STATE STREET MASTER FUNDS
STATE STREET INTERNATIONAL DEVELOPED EQUITY INDEX PORTFOLIO
SCHEDULE OF INVESTMENTS (continued)
December 31, 2018
| Security Description | | | Shares | | Value |
MTR Corp., Ltd.
| | | 319,601 | | $1,681,820 |
New World Development Co., Ltd.
| | | 1,361,077 | | 1,801,013 |
NWS Holdings, Ltd.
| | | 356,810 | | 731,909 |
PCCW, Ltd.
| | | 743,000 | | 427,996 |
Power Assets Holdings, Ltd.
| | | 308,000 | | 2,143,984 |
Sands China, Ltd.
| | | 530,800 | | 2,325,409 |
Shangri-La Asia, Ltd.
| | | 272,000 | | 402,996 |
Sino Land Co., Ltd.
| | | 711,717 | | 1,219,928 |
SJM Holdings, Ltd.
| | | 457,000 | | 426,102 |
Sun Hung Kai Properties, Ltd.
| | | 344,000 | | 4,903,395 |
Swire Pacific, Ltd. Class A
| | | 98,500 | | 1,040,438 |
Swire Properties, Ltd.
| | | 233,400 | | 819,800 |
Techtronic Industries Co., Ltd.
| | | 279,000 | | 1,482,422 |
WH Group, Ltd.
| | | 1,825,309 | | 1,405,814 |
Wharf Holdings, Ltd.
| | | 225,000 | | 586,256 |
Wharf Real Estate Investment Co., Ltd.
| | | 266,000 | | 1,591,716 |
Wheelock & Co., Ltd.
| | | 174,000 | | 994,527 |
Yue Yuen Industrial Holdings, Ltd.
| | | 149,500 | | 478,325 |
| | | | | | 99,389,905 |
| IRELAND — 0.6% | | | | | |
AerCap Holdings NV (a)
| | | 26,214 | | 1,038,075 |
AIB Group PLC
| | | 151,815 | | 638,654 |
Bank of Ireland Group PLC
| | | 192,382 | | 1,068,818 |
CRH PLC
| | | 179,303 | | 4,734,811 |
James Hardie Industries PLC
| | | 86,418 | | 919,874 |
Kerry Group PLC Class A
| | | 33,546 | | 3,317,111 |
Kingspan Group PLC
| | | 30,840 | | 1,317,822 |
Paddy Power Betfair PLC
| | | 16,595 | | 1,359,242 |
Ryanair Holdings PLC ADR (a)(b)
| | | 5,889 | | 420,121 |
Smurfit Kappa Group PLC
| | | 45,078 | | 1,198,609 |
| | | | | | 16,013,137 |
| ISRAEL — 0.5% | | | | | |
Azrieli Group, Ltd.
| | | 10,695 | | 510,887 |
Bank Hapoalim BM
| | | 235,198 | | 1,488,575 |
Bank Leumi Le-Israel BM
| | | 337,591 | | 2,041,763 |
Bezeq The Israeli Telecommunication Corp., Ltd.
| | | 417,768 | | 408,069 |
Check Point Software Technologies, Ltd. (a)
| | | 28,110 | | 2,885,492 |
Elbit Systems, Ltd.
| | | 5,012 | | 575,138 |
Israel Chemicals, Ltd.
| | | 150,124 | | 851,710 |
Mizrahi Tefahot Bank, Ltd.
| | | 33,833 | | 571,677 |
Nice, Ltd. (a)
| | | 13,541 | | 1,457,467 |
Teva Pharmaceutical Industries, Ltd. ADR (a)
| | | 87,728 | | 1,352,766 |
Teva Pharmaceutical Industries, Ltd.
| | | 129,045 | | 2,025,420 |
Wix.com, Ltd. (a)(b)
| | | 9,800 | | 885,332 |
| | | | | | 15,054,296 |
| Security Description | | | Shares | | Value |
| ITALY — 2.1% | | | | | |
Assicurazioni Generali SpA
| | | 264,505 | | $4,414,585 |
Atlantia SpA
| | | 111,340 | | 2,299,919 |
Davide Campari-Milano SpA
| | | 130,799 | | 1,104,226 |
Enel SpA
| | | 1,825,430 | | 10,525,516 |
Eni SpA
| | | 570,595 | | 8,967,484 |
Ferrari NV
| | | 27,146 | | 2,692,952 |
Intesa Sanpaolo SpA
| | | 3,347,274 | | 7,422,520 |
Leonardo SpA
| | | 97,959 | | 859,796 |
Luxottica Group SpA
| | | 39,200 | | 2,316,753 |
Mediobanca Banca di Credito Finanziario SpA
| | | 143,505 | | 1,210,016 |
Moncler SpA
| | | 40,772 | | 1,348,384 |
Pirelli & C SpA (a)(d)
| | | 89,601 | | 574,618 |
Poste Italiane SpA (d)
| | | 124,750 | | 995,974 |
Prysmian SpA
| | | 57,950 | | 1,117,562 |
Recordati SpA
| | | 22,725 | | 786,876 |
Snam SpA
| | | 491,323 | | 2,144,963 |
Telecom Italia SpA (e)
| | | 1,270,582 | | 605,678 |
Telecom Italia SpA/Milano (a)(e)
| | | 2,467,700 | | 1,363,366 |
Terna Rete Elettrica Nazionale SpA
| | | 299,455 | | 1,695,521 |
UniCredit SpA
| | | 453,047 | | 5,124,108 |
| | | | | | 57,570,817 |
| JAPAN — 24.1% | | | | | |
ABC-Mart, Inc. (b)
| | | 8,800 | | 487,663 |
Acom Co., Ltd.
| | | 91,400 | | 299,071 |
Aeon Co., Ltd.
| | | 138,700 | | 2,717,365 |
AEON Financial Service Co., Ltd.
| | | 30,000 | | 534,293 |
Aeon Mall Co., Ltd.
| | | 24,100 | | 384,185 |
AGC, Inc. (b)
| | | 43,200 | | 1,350,554 |
Air Water, Inc.
| | | 34,400 | | 522,043 |
Aisin Seiki Co., Ltd.
| | | 34,700 | | 1,208,167 |
Ajinomoto Co., Inc.
| | | 101,100 | | 1,803,333 |
Alfresa Holdings Corp.
| | | 38,500 | | 983,598 |
Alps Electric Co., Ltd.
| | | 42,400 | | 825,083 |
Amada Holdings Co., Ltd.
| | | 73,000 | | 657,376 |
ANA Holdings, Inc.
| | | 23,600 | | 847,720 |
Aozora Bank, Ltd. (b)
| | | 27,800 | | 829,832 |
Asahi Group Holdings, Ltd.
| | | 80,500 | | 3,132,247 |
Asahi Intecc Co., Ltd.
| | | 22,000 | | 930,411 |
Asahi Kasei Corp.
| | | 285,200 | | 2,937,392 |
Asics Corp. (b)
| | | 36,600 | | 468,696 |
Astellas Pharma, Inc.
| | | 423,300 | | 5,407,236 |
Bandai Namco Holdings, Inc.
| | | 42,200 | | 1,894,317 |
Bank of Kyoto, Ltd.
| | | 12,500 | | 517,819 |
Benesse Holdings, Inc.
| | | 13,600 | | 346,833 |
Bridgestone Corp. (b)
| | | 137,300 | | 5,301,033 |
Brother Industries, Ltd.
| | | 53,900 | | 801,266 |
Calbee, Inc.
| | | 15,200 | | 476,580 |
Canon, Inc. (b)
| | | 225,100 | | 6,157,090 |
Casio Computer Co., Ltd. (b)
| | | 43,400 | | 515,824 |
Central Japan Railway Co.
| | | 31,400 | | 6,629,732 |
Chiba Bank, Ltd.
| | | 134,000 | | 749,907 |
See accompanying notes to financial statements.
7
STATE STREET MASTER FUNDS
STATE STREET INTERNATIONAL DEVELOPED EQUITY INDEX PORTFOLIO
SCHEDULE OF INVESTMENTS (continued)
December 31, 2018
| Security Description | | | Shares | | Value |
Chubu Electric Power Co., Inc.
| | | 140,000 | | $1,993,802 |
Chugai Pharmaceutical Co., Ltd. (b)
| | | 50,000 | | 2,907,533 |
Chugoku Electric Power Co., Inc.
| | | 57,100 | | 743,187 |
Coca-Cola Bottlers Japan Holdings, Inc. (b)
| | | 29,100 | | 871,289 |
Concordia Financial Group, Ltd.
| | | 237,100 | | 911,965 |
Credit Saison Co., Ltd.
| | | 39,200 | | 461,261 |
CyberAgent, Inc.
| | | 21,600 | | 835,729 |
Dai Nippon Printing Co., Ltd.
| | | 57,600 | | 1,205,917 |
Daicel Corp.
| | | 51,500 | | 530,889 |
Daifuku Co., Ltd.
| | | 24,300 | | 1,111,844 |
Dai-ichi Life Holdings, Inc.
| | | 242,400 | | 3,795,682 |
Daiichi Sankyo Co., Ltd.
| | | 122,700 | | 3,926,534 |
Daikin Industries, Ltd.
| | | 56,100 | | 5,979,944 |
Daito Trust Construction Co., Ltd.
| | | 15,700 | | 2,148,617 |
Daiwa House Industry Co., Ltd.
| | | 128,000 | | 4,080,973 |
Daiwa House REIT Investment Corp.
| | | 371 | | 830,832 |
Daiwa Securities Group, Inc.
| | | 340,300 | | 1,726,391 |
DeNA Co., Ltd.
| | | 27,200 | | 454,676 |
Denso Corp.
| | | 94,500 | | 4,214,451 |
Dentsu, Inc. (b)
| | | 47,700 | | 2,132,512 |
Disco Corp.
| | | 6,500 | | 761,291 |
Don Quijote Holdings Co., Ltd. (b)
| | | 26,700 | | 1,659,700 |
East Japan Railway Co.
| | | 66,500 | | 5,885,991 |
Eisai Co., Ltd.
| | | 56,300 | | 4,362,782 |
Electric Power Development Co., Ltd.
| | | 35,600 | | 845,587 |
FamilyMart UNY Holdings Co., Ltd. (b)
| | | 14,300 | | 1,812,997 |
FANUC Corp.
| | | 43,300 | | 6,578,964 |
Fast Retailing Co., Ltd.
| | | 13,100 | | 6,730,593 |
Fuji Electric Co., Ltd.
| | | 24,800 | | 733,500 |
FUJIFILM Holdings Corp.
| | | 87,300 | | 3,397,630 |
Fujitsu, Ltd.
| | | 45,100 | | 2,814,562 |
Fukuoka Financial Group, Inc.
| | | 33,800 | | 689,155 |
Hakuhodo DY Holdings, Inc.
| | | 47,300 | | 679,009 |
Hamamatsu Photonics KK
| | | 31,600 | | 1,064,230 |
Hankyu Hanshin Holdings, Inc.
| | | 52,000 | | 1,729,937 |
Hikari Tsushin, Inc. (b)
| | | 4,900 | | 766,832 |
Hino Motors, Ltd.
| | | 49,600 | | 470,164 |
Hirose Electric Co., Ltd.
| | | 6,510 | | 639,044 |
Hisamitsu Pharmaceutical Co., Inc.
| | | 13,200 | | 730,292 |
Hitachi Chemical Co., Ltd.
| | | 19,900 | | 301,089 |
Hitachi Construction Machinery Co., Ltd.
| | | 24,800 | | 581,375 |
Hitachi High-Technologies Corp.
| | | 15,800 | | 497,553 |
Hitachi Metals, Ltd.
| | | 55,900 | | 585,927 |
Hitachi, Ltd.
| | | 216,300 | | 5,787,255 |
Honda Motor Co., Ltd.
| | | 356,900 | | 9,415,732 |
Hoshizaki Corp. (b)
| | | 11,800 | | 718,443 |
| Security Description | | | Shares | | Value |
Hoya Corp.
| | | 82,900 | | $4,998,255 |
Hulic Co., Ltd.
| | | 68,000 | | 610,491 |
Idemitsu Kosan Co., Ltd.
| | | 30,500 | | 1,003,555 |
IHI Corp.
| | | 34,800 | | 961,072 |
Iida Group Holdings Co., Ltd.
| | | 35,900 | | 622,029 |
Inpex Corp.
| | | 218,500 | | 1,955,079 |
Isetan Mitsukoshi Holdings, Ltd.
| | | 68,300 | | 756,364 |
Isuzu Motors, Ltd.
| | | 115,700 | | 1,632,971 |
ITOCHU Corp.
| | | 307,300 | | 5,229,268 |
J Front Retailing Co., Ltd.
| | | 52,200 | | 599,480 |
Japan Airlines Co., Ltd.
| | | 23,600 | | 836,965 |
Japan Airport Terminal Co., Ltd.
| | | 12,400 | | 430,607 |
Japan Exchange Group, Inc.
| | | 115,300 | | 1,869,559 |
Japan Post Bank Co., Ltd.
| | | 90,900 | | 1,002,497 |
Japan Post Holdings Co., Ltd.
| | | 355,200 | | 4,095,411 |
Japan Prime Realty Investment Corp. REIT (b)
| | | 191 | | 725,945 |
Japan Real Estate Investment Corp. REIT
| | | 292 | | 1,639,448 |
Japan Retail Fund Investment Corp. REIT
| | | 542 | | 1,084,346 |
Japan Tobacco, Inc. (b)
| | | 247,800 | | 5,909,572 |
JFE Holdings, Inc.
| | | 107,100 | | 1,715,123 |
JGC Corp.
| | | 49,900 | | 703,598 |
JSR Corp.
| | | 42,300 | | 638,076 |
JTEKT Corp.
| | | 49,700 | | 555,368 |
JXTG Holdings, Inc.
| | | 726,800 | | 3,820,312 |
Kajima Corp.
| | | 100,500 | | 1,353,862 |
Kakaku.com, Inc.
| | | 26,600 | | 470,831 |
Kamigumi Co., Ltd.
| | | 24,000 | | 493,497 |
Kaneka Corp.
| | | 9,800 | | 351,930 |
Kansai Electric Power Co., Inc.
| | | 161,400 | | 2,427,289 |
Kansai Paint Co., Ltd.
| | | 39,400 | | 759,163 |
Kao Corp. (b)
| | | 110,500 | | 8,212,341 |
Kawasaki Heavy Industries, Ltd.
| | | 33,000 | | 707,433 |
KDDI Corp.
| | | 387,900 | | 9,277,215 |
Keihan Holdings Co., Ltd.
| | | 19,400 | | 791,277 |
Keikyu Corp.
| | | 54,300 | | 889,369 |
Keio Corp.
| | | 23,300 | | 1,357,034 |
Keisei Electric Railway Co., Ltd.
| | | 28,100 | | 881,046 |
Keyence Corp.
| | | 21,300 | | 10,809,680 |
Kikkoman Corp.
| | | 33,000 | | 1,777,606 |
Kintetsu Group Holdings Co., Ltd.
| | | 40,200 | | 1,747,746 |
Kirin Holdings Co., Ltd.
| | | 185,300 | | 3,881,986 |
Kobayashi Pharmaceutical Co., Ltd.
| | | 10,700 | | 728,515 |
Kobe Steel, Ltd.
| | | 62,900 | | 438,004 |
Koito Manufacturing Co., Ltd.
| | | 23,100 | | 1,195,898 |
Komatsu, Ltd.
| | | 204,600 | | 4,411,259 |
Konami Holdings Corp.
| | | 18,800 | | 823,351 |
Konica Minolta, Inc.
| | | 93,100 | | 842,622 |
Kose Corp.
| | | 6,500 | | 1,022,558 |
Kubota Corp.
| | | 223,300 | | 3,178,079 |
Kuraray Co., Ltd.
| | | 66,900 | | 945,131 |
Kurita Water Industries, Ltd.
| | | 23,800 | | 577,890 |
See accompanying notes to financial statements.
8
STATE STREET MASTER FUNDS
STATE STREET INTERNATIONAL DEVELOPED EQUITY INDEX PORTFOLIO
SCHEDULE OF INVESTMENTS (continued)
December 31, 2018
| Security Description | | | Shares | | Value |
Kyocera Corp.
| | | 71,000 | | $3,564,399 |
Kyowa Hakko Kirin Co., Ltd.
| | | 59,900 | | 1,133,959 |
Kyushu Electric Power Co., Inc.
| | | 82,000 | | 978,335 |
Kyushu Railway Co.
| | | 36,500 | | 1,235,907 |
Lawson, Inc.
| | | 12,000 | | 760,151 |
LINE Corp. (a)(b)
| | | 16,600 | | 571,162 |
Lion Corp.
| | | 51,200 | | 1,059,326 |
LIXIL Group Corp.
| | | 57,100 | | 708,838 |
M3, Inc.
| | | 97,400 | | 1,308,550 |
Makita Corp.
| | | 51,400 | | 1,829,440 |
Marubeni Corp.
| | | 349,200 | | 2,458,388 |
Marui Group Co., Ltd.
| | | 39,800 | | 773,763 |
Maruichi Steel Tube, Ltd.
| | | 10,400 | | 328,451 |
Mazda Motor Corp.
| | | 127,000 | | 1,313,813 |
McDonald's Holdings Co. Japan, Ltd. (b)
| | | 13,200 | | 560,653 |
Mebuki Financial Group, Inc.
| | | 181,300 | | 482,519 |
Medipal Holdings Corp.
| | | 38,600 | | 828,538 |
MEIJI Holdings Co., Ltd.
| | | 27,500 | | 2,245,819 |
MINEBEA MITSUMI, Inc.
| | | 90,300 | | 1,308,636 |
MISUMI Group, Inc.
| | | 66,500 | | 1,405,583 |
Mitsubishi Chemical Holdings Corp.
| | | 292,900 | | 2,222,746 |
Mitsubishi Corp.
| | | 295,400 | | 8,131,140 |
Mitsubishi Electric Corp.
| | | 407,400 | | 4,517,177 |
Mitsubishi Estate Co., Ltd.
| | | 266,600 | | 4,202,568 |
Mitsubishi Gas Chemical Co., Inc.
| | | 35,900 | | 541,535 |
Mitsubishi Heavy Industries, Ltd.
| | | 67,900 | | 2,448,274 |
Mitsubishi Materials Corp.
| | | 21,600 | | 569,949 |
Mitsubishi Motors Corp.
| | | 149,700 | | 821,395 |
Mitsubishi Tanabe Pharma Corp.
| | | 61,500 | | 886,219 |
Mitsubishi UFJ Financial Group, Inc.
| | | 2,578,800 | | 12,643,089 |
Mitsubishi UFJ Lease & Finance Co., Ltd.
| | | 81,700 | | 393,179 |
Mitsui & Co., Ltd.
| | | 372,800 | | 5,744,141 |
Mitsui Chemicals, Inc.
| | | 42,100 | | 953,164 |
Mitsui Fudosan Co., Ltd.
| | | 201,000 | | 4,479,287 |
Mitsui OSK Lines, Ltd.
| | | 27,400 | | 599,121 |
Mizuho Financial Group, Inc.
| | | 5,273,800 | | 8,186,010 |
MonotaRO Co., Ltd. (b)
| | | 28,200 | | 698,606 |
MS&AD Insurance Group Holdings, Inc.
| | | 107,600 | | 3,071,624 |
Murata Manufacturing Co., Ltd.
| | | 40,600 | | 5,534,093 |
Nabtesco Corp. (b)
| | | 24,000 | | 524,122 |
Nagoya Railroad Co., Ltd.
| | | 43,700 | | 1,153,490 |
NEC Corp.
| | | 57,100 | | 1,699,234 |
Nexon Co., Ltd. (a)
| | | 103,100 | | 1,327,807 |
NGK Insulators, Ltd.
| | | 53,200 | | 722,975 |
NGK Spark Plug Co., Ltd.
| | | 36,100 | | 721,243 |
NH Foods, Ltd.
| | | 21,000 | | 791,460 |
Nidec Corp.
| | | 50,300 | | 5,719,295 |
Nikon Corp.
| | | 67,200 | | 1,001,431 |
Nintendo Co., Ltd.
| | | 25,300 | | 6,753,047 |
| Security Description | | | Shares | | Value |
Nippon Building Fund, Inc. REIT
| | | 296 | | $1,864,248 |
Nippon Electric Glass Co., Ltd. (b)
| | | 20,600 | | 505,636 |
Nippon Express Co., Ltd.
| | | 15,800 | | 881,338 |
Nippon Paint Holdings Co., Ltd. (b)
| | | 31,600 | | 1,082,951 |
Nippon Prologis REIT, Inc.
| | | 422 | | 891,964 |
Nippon Steel & Sumitomo Metal Corp.
| | | 168,400 | | 2,904,771 |
Nippon Telegraph & Telephone Corp.
| | | 155,700 | | 6,360,547 |
Nippon Yusen KK
| | | 36,900 | | 568,727 |
Nissan Chemical Corp.
| | | 28,300 | | 1,485,740 |
Nissan Motor Co., Ltd.
| | | 502,300 | | 4,030,212 |
Nisshin Seifun Group, Inc.
| | | 40,900 | | 846,593 |
Nissin Foods Holdings Co., Ltd.
| | | 14,700 | | 924,486 |
Nitori Holdings Co., Ltd.
| | | 17,000 | | 2,127,421 |
Nitto Denko Corp.
| | | 36,900 | | 1,864,255 |
Nomura Holdings, Inc.
| | | 766,000 | | 2,937,910 |
Nomura Real Estate Holdings, Inc.
| | | 31,100 | | 571,175 |
Nomura Real Estate Master Fund, Inc. REIT
| | | 818 | | 1,076,600 |
Nomura Research Institute, Ltd.
| | | 25,400 | | 943,399 |
NSK, Ltd.
| | | 73,800 | | 638,347 |
NTT Data Corp.
| | | 133,000 | | 1,460,739 |
NTT DOCOMO, Inc.
| | | 295,700 | | 6,663,795 |
Obayashi Corp.
| | | 145,600 | | 1,319,112 |
Obic Co., Ltd.
| | | 15,200 | | 1,176,211 |
Odakyu Electric Railway Co., Ltd.
| | | 63,400 | | 1,396,690 |
Oji Holdings Corp.
| | | 194,000 | | 999,043 |
Olympus Corp.
| | | 66,700 | | 2,051,793 |
Omron Corp.
| | | 44,700 | | 1,629,677 |
Ono Pharmaceutical Co., Ltd.
| | | 87,400 | | 1,788,388 |
Oracle Corp. Japan
| | | 7,200 | | 459,372 |
Oriental Land Co., Ltd.
| | | 45,100 | | 4,544,324 |
ORIX Corp.
| | | 286,600 | | 4,193,923 |
Osaka Gas Co., Ltd.
| | | 85,700 | | 1,569,259 |
Otsuka Corp. (b)
| | | 22,600 | | 622,084 |
Otsuka Holdings Co., Ltd.
| | | 84,300 | | 3,452,216 |
Panasonic Corp.
| | | 500,700 | | 4,520,744 |
Park24 Co., Ltd.
| | | 25,300 | | 556,432 |
Pigeon Corp. (b)
| | | 26,000 | | 1,113,795 |
Pola Orbis Holdings, Inc. (b)
| | | 20,800 | | 562,869 |
Rakuten, Inc. (a)(b)
| | | 179,400 | | 1,203,467 |
Recruit Holdings Co., Ltd.
| | | 246,300 | | 5,977,066 |
Renesas Electronics Corp. (a)
| | | 191,400 | | 872,260 |
Resona Holdings, Inc.
| | | 478,200 | | 2,304,374 |
Ricoh Co., Ltd.
| | | 153,100 | | 1,502,882 |
Rinnai Corp.
| | | 7,700 | | 508,116 |
Rohm Co., Ltd.
| | | 19,700 | | 1,264,075 |
Ryohin Keikaku Co., Ltd.
| | | 5,300 | | 1,282,550 |
Sankyo Co., Ltd.
| | | 9,200 | | 350,508 |
Santen Pharmaceutical Co., Ltd.
| | | 80,200 | | 1,159,342 |
SBI Holdings, Inc.
| | | 51,400 | | 1,011,462 |
See accompanying notes to financial statements.
9
STATE STREET MASTER FUNDS
STATE STREET INTERNATIONAL DEVELOPED EQUITY INDEX PORTFOLIO
SCHEDULE OF INVESTMENTS (continued)
December 31, 2018
| Security Description | | | Shares | | Value |
Secom Co., Ltd.
| | | 46,500 | | $3,862,744 |
Sega Sammy Holdings, Inc.
| | | 32,400 | | 453,597 |
Seibu Holdings, Inc.
| | | 48,100 | | 839,114 |
Seiko Epson Corp.
| | | 60,800 | | 857,844 |
Sekisui Chemical Co., Ltd.
| | | 82,700 | | 1,229,401 |
Sekisui House, Ltd.
| | | 137,500 | | 2,029,007 |
Seven & i Holdings Co., Ltd.
| | | 164,500 | | 7,171,339 |
Seven Bank, Ltd.
| | | 126,400 | | 361,752 |
SG Holdings Co., Ltd.
| | | 22,700 | | 592,561 |
Sharp Corp.
| | | 55,700 | | 559,462 |
Shimadzu Corp.
| | | 49,500 | | 980,841 |
Shimamura Co., Ltd. (b)
| | | 5,100 | | 390,466 |
Shimano, Inc.
| | | 16,600 | | 2,348,193 |
Shimizu Corp.
| | | 122,200 | | 996,846 |
Shin-Etsu Chemical Co., Ltd.
| | | 81,800 | | 6,364,169 |
Shinsei Bank, Ltd.
| | | 30,900 | | 368,665 |
Shionogi & Co., Ltd.
| | | 62,200 | | 3,555,177 |
Shiseido Co., Ltd.
| | | 85,600 | | 5,377,161 |
Shizuoka Bank, Ltd.
| | | 100,700 | | 790,254 |
Showa Denko KK (b)
| | | 28,300 | | 843,467 |
Showa Shell Sekiyu KK
| | | 44,000 | | 618,001 |
SMC Corp.
| | | 12,900 | | 3,908,271 |
SoftBank Group Corp.
| | | 181,100 | | 12,057,927 |
Sohgo Security Services Co., Ltd.
| | | 15,700 | | 735,524 |
Sompo Holdings, Inc.
| | | 73,900 | | 2,513,738 |
Sony Corp.
| | | 278,600 | | 13,524,346 |
Sony Financial Holdings, Inc.
| | | 41,600 | | 779,182 |
Stanley Electric Co., Ltd.
| | | 27,300 | | 768,874 |
Subaru Corp.
| | | 138,900 | | 2,987,777 |
SUMCO Corp. (b)
| | | 50,000 | | 559,176 |
Sumitomo Chemical Co., Ltd.
| | | 328,000 | | 1,593,438 |
Sumitomo Corp.
| | | 248,400 | | 3,535,311 |
Sumitomo Dainippon Pharma Co., Ltd.
| | | 37,000 | | 1,178,645 |
Sumitomo Electric Industries, Ltd.
| | | 163,800 | | 2,182,706 |
Sumitomo Heavy Industries, Ltd.
| | | 22,800 | | 680,582 |
Sumitomo Metal Mining Co., Ltd.
| | | 52,900 | | 1,421,162 |
Sumitomo Mitsui Financial Group, Inc.
| | | 291,100 | | 9,671,052 |
Sumitomo Mitsui Trust Holdings, Inc.
| | | 73,900 | | 2,709,072 |
Sumitomo Realty & Development Co., Ltd.
| | | 81,800 | | 3,001,657 |
Sumitomo Rubber Industries, Ltd. (b)
| | | 36,000 | | 426,560 |
Sundrug Co., Ltd.
| | | 16,700 | | 498,496 |
Suntory Beverage & Food, Ltd.
| | | 31,000 | | 1,401,449 |
Suzuken Co., Ltd.
| | | 17,400 | | 886,533 |
Suzuki Motor Corp.
| | | 77,600 | | 3,937,467 |
Sysmex Corp.
| | | 38,100 | | 1,832,162 |
T&D Holdings, Inc.
| | | 122,600 | | 1,429,207 |
Taiheiyo Cement Corp.
| | | 29,600 | | 915,937 |
Taisei Corp.
| | | 46,100 | | 1,976,945 |
| Security Description | | | Shares | | Value |
Taisho Pharmaceutical Holdings Co., Ltd.
| | | 8,100 | | $814,319 |
Taiyo Nippon Sanso Corp.
| | | 23,700 | | 387,962 |
Takashimaya Co., Ltd.
| | | 37,600 | | 481,159 |
Takeda Pharmaceutical Co., Ltd. (b)
| | | 161,100 | | 5,440,236 |
TDK Corp.
| | | 29,700 | | 2,089,815 |
Teijin, Ltd.
| | | 40,800 | | 653,380 |
Temp Holdings Co., Ltd.
| | | 41,200 | | 614,348 |
Terumo Corp.
| | | 67,200 | | 3,812,175 |
THK Co., Ltd.
| | | 26,100 | | 490,527 |
Tobu Railway Co., Ltd.
| | | 42,600 | | 1,150,470 |
Toho Co., Ltd.
| | | 25,300 | | 917,778 |
Toho Gas Co., Ltd.
| | | 17,900 | | 756,200 |
Tohoku Electric Power Co., Inc.
| | | 90,200 | | 1,192,089 |
Tokio Marine Holdings, Inc.
| | | 146,900 | | 7,010,604 |
Tokyo Century Corp.
| | | 9,800 | | 431,427 |
Tokyo Electric Power Co. Holdings, Inc. (a)
| | | 329,900 | | 1,963,494 |
Tokyo Electron, Ltd.
| | | 35,400 | | 4,038,017 |
Tokyo Gas Co., Ltd.
| | | 81,400 | | 2,066,624 |
Tokyu Corp.
| | | 115,700 | | 1,892,918 |
Tokyu Fudosan Holdings Corp.
| | | 128,600 | | 635,293 |
Toppan Printing Co., Ltd.
| | | 57,000 | | 840,077 |
Toray Industries, Inc.
| | | 302,600 | | 2,129,218 |
Toshiba Corp.
| | | 147,900 | | 4,178,918 |
Tosoh Corp.
| | | 56,500 | | 737,438 |
TOTO, Ltd.
| | | 30,300 | | 1,052,208 |
Toyo Seikan Group Holdings, Ltd.
| | | 37,200 | | 855,110 |
Toyo Suisan Kaisha, Ltd.
| | | 18,300 | | 639,662 |
Toyoda Gosei Co., Ltd.
| | | 16,800 | | 333,045 |
Toyota Industries Corp.
| | | 31,900 | | 1,479,934 |
Toyota Motor Corp.
| | | 503,000 | | 29,368,983 |
Toyota Tsusho Corp.
| | | 46,300 | | 1,369,398 |
Trend Micro, Inc. (a)
| | | 27,100 | | 1,474,612 |
Tsuruha Holdings, Inc.
| | | 8,000 | | 686,871 |
Unicharm Corp.
| | | 92,100 | | 2,987,594 |
United Urban Investment Corp. REIT
| | | 684 | | 1,061,084 |
USS Co., Ltd.
| | | 53,400 | | 899,937 |
Welcia Holdings Co., Ltd.
| | | 10,600 | | 479,205 |
West Japan Railway Co.
| | | 36,900 | | 2,610,226 |
Yahoo! Japan Corp.
| | | 630,500 | | 1,574,598 |
Yakult Honsha Co., Ltd.
| | | 25,300 | | 1,780,212 |
Yamada Denki Co., Ltd.
| | | 127,900 | | 614,349 |
Yamaguchi Financial Group, Inc.
| | | 39,000 | | 375,017 |
Yamaha Corp.
| | | 31,100 | | 1,326,601 |
Yamaha Motor Co., Ltd. (b)
| | | 65,300 | | 1,284,990 |
Yamato Holdings Co., Ltd. (b)
| | | 67,200 | | 1,852,188 |
Yamazaki Baking Co., Ltd.
| | | 30,000 | | 630,543 |
Yaskawa Electric Corp. (b)
| | | 56,100 | | 1,379,554 |
Yokogawa Electric Corp.
| | | 54,700 | | 947,771 |
Yokohama Rubber Co., Ltd. (b)
| | | 29,200 | | 549,588 |
See accompanying notes to financial statements.
10
STATE STREET MASTER FUNDS
STATE STREET INTERNATIONAL DEVELOPED EQUITY INDEX PORTFOLIO
SCHEDULE OF INVESTMENTS (continued)
December 31, 2018
| Security Description | | | Shares | | Value |
ZOZO, Inc.
| | | 43,000 | | $787,768 |
| | | | | | 677,333,661 |
| LUXEMBOURG — 0.3% | | | | | |
ArcelorMittal
| | | 139,773 | | 2,898,436 |
Aroundtown SA
| | | 174,218 | | 1,437,915 |
Eurofins Scientific SE
| | | 2,204 | | 821,358 |
Millicom International Cellular SA SDR
| | | 14,562 | | 922,254 |
RTL Group SA
| | | 8,135 | | 434,288 |
SES SA
| | | 73,688 | | 1,407,590 |
Tenaris SA
| | | 110,669 | | 1,194,266 |
| | | | | | 9,116,107 |
| MACAU — 0.0% (c) | | | | | |
MGM China Holdings, Ltd.
| | | 142,000 | | 238,319 |
Wynn Macau, Ltd.
| | | 334,400 | | 729,505 |
| | | | | | 967,824 |
| MEXICO — 0.0% (c) | | | | | |
Fresnillo PLC
| | | 38,505 | | 421,744 |
| NETHERLANDS — 4.5% | | | | | |
ABN AMRO Group NV (d)
| | | 90,876 | | 2,133,795 |
Aegon NV
| | | 379,991 | | 1,771,863 |
Akzo Nobel NV
| | | 53,800 | | 4,329,703 |
ASML Holding NV
| | | 89,416 | | 14,019,930 |
EXOR NV
| | | 23,718 | | 1,281,371 |
Heineken Holding NV
| | | 24,763 | | 2,087,702 |
Heineken NV
| | | 55,363 | | 4,885,849 |
ING Groep NV
| | | 839,571 | | 9,031,298 |
Koninklijke Ahold Delhaize NV
| | | 267,981 | | 6,762,509 |
Koninklijke DSM NV
| | | 38,256 | | 3,124,238 |
Koninklijke KPN NV
| | | 722,041 | | 2,113,027 |
Koninklijke Philips NV
| | | 204,447 | | 7,228,760 |
Koninklijke Vopak NV
| | | 12,918 | | 585,963 |
NN Group NV
| | | 63,742 | | 2,535,760 |
NXP Semiconductors NV
| | | 74,472 | | 5,457,308 |
Randstad NV
| | | 24,751 | | 1,134,311 |
Royal Dutch Shell PLC Class A
| | | 1,005,595 | | 29,552,743 |
Royal Dutch Shell PLC Class B
| | | 819,124 | | 24,411,726 |
Wolters Kluwer NV
| | | 61,534 | | 3,633,898 |
| | | | | | 126,081,754 |
| NEW ZEALAND — 0.2% | | | | | |
a2 Milk Co., Ltd. (a)
| | | 156,772 | | 1,172,127 |
Auckland International Airport, Ltd.
| | | 224,110 | | 1,078,989 |
Fisher & Paykel Healthcare Corp., Ltd.
| | | 128,350 | | 1,118,846 |
Fletcher Building, Ltd. (a)
| | | 197,701 | | 646,934 |
Meridian Energy, Ltd.
| | | 262,247 | | 598,768 |
Ryman Healthcare, Ltd.
| | | 94,456 | | 680,245 |
Spark New Zealand, Ltd.
| | | 418,892 | | 1,165,685 |
| | | | | | 6,461,594 |
| NORWAY — 0.7% | | | | | |
Aker BP ASA
| | | 26,570 | | 668,918 |
DNB ASA
| | | 209,349 | | 3,340,000 |
| Security Description | | | Shares | | Value |
Equinor ASA
| | | 263,153 | | $5,584,193 |
Gjensidige Forsikring ASA
| | | 44,759 | | 698,847 |
Marine Harvest ASA
| | | 96,285 | | 2,031,524 |
Norsk Hydro ASA
| | | 299,562 | | 1,356,464 |
Orkla ASA
| | | 171,379 | | 1,346,625 |
Schibsted ASA Class B
| | | 24,544 | | 744,045 |
Telenor ASA
| | | 165,779 | | 3,206,779 |
Yara International ASA
| | | 41,484 | | 1,597,722 |
| | | | | | 20,575,117 |
| PORTUGAL — 0.2% | | | | | |
EDP - Energias de Portugal SA
| | | 556,669 | | 1,940,250 |
Galp Energia SGPS SA
| | | 108,999 | | 1,718,887 |
Jeronimo Martins SGPS SA
| | | 58,599 | | 692,650 |
| | | | | | 4,351,787 |
| SINGAPORE — 1.2% | | | | | |
Ascendas Real Estate Investment Trust
| | | 519,850 | | 980,201 |
CapitaLand Commercial Trust REIT
| | | 489,338 | | 628,277 |
CapitaLand Mall Trust REIT
| | | 528,100 | | 875,646 |
CapitaLand, Ltd.
| | | 544,400 | | 1,242,175 |
City Developments, Ltd.
| | | 71,200 | | 424,170 |
ComfortDelGro Corp., Ltd.
| | | 404,300 | | 637,744 |
DBS Group Holdings, Ltd.
| | | 389,113 | | 6,763,087 |
Genting Singapore, Ltd.
| | | 1,169,200 | | 836,368 |
Golden Agri-Resources, Ltd.
| | | 777,200 | | 139,702 |
Jardine Cycle & Carriage, Ltd.
| | | 17,333 | | 449,539 |
Keppel Corp., Ltd.
| | | 300,300 | | 1,302,108 |
Oversea-Chinese Banking Corp., Ltd.
| | | 680,337 | | 5,620,392 |
SATS, Ltd.
| | | 115,600 | | 395,228 |
Sembcorp Industries, Ltd.
| | | 177,900 | | 331,523 |
Singapore Airlines, Ltd.
| | | 112,800 | | 779,586 |
Singapore Exchange, Ltd.
| | | 154,900 | | 812,572 |
Singapore Press Holdings, Ltd.
| | | 287,100 | | 495,000 |
Singapore Technologies Engineering, Ltd.
| | | 298,800 | | 765,086 |
Singapore Telecommunications, Ltd.
| | | 1,754,100 | | 3,770,736 |
Suntec Real Estate Investment Trust
| | | 384,500 | | 502,135 |
United Overseas Bank, Ltd.
| | | 287,590 | | 5,184,216 |
UOL Group, Ltd.
| | | 86,332 | | 392,073 |
Venture Corp., Ltd.
| | | 49,200 | | 503,551 |
Wilmar International, Ltd.
| | | 372,400 | | 852,449 |
| | | | | | 34,683,564 |
| SOUTH AFRICA — 0.0% (c) | | | | | |
Investec PLC
| | | 145,593 | | 817,919 |
| SPAIN — 3.0% | | | | | |
ACS Actividades de Construccion y Servicios SA
| | | 53,967 | | 2,087,053 |
Aena SME SA (d)
| | | 15,108 | | 2,344,499 |
Amadeus IT Group SA
| | | 96,741 | | 6,728,262 |
See accompanying notes to financial statements.
11
STATE STREET MASTER FUNDS
STATE STREET INTERNATIONAL DEVELOPED EQUITY INDEX PORTFOLIO
SCHEDULE OF INVESTMENTS (continued)
December 31, 2018
| Security Description | | | Shares | | Value |
Banco Bilbao Vizcaya Argentaria SA
| | | 1,473,086 | | $7,805,987 |
Banco de Sabadell SA
| | | 1,215,062 | | 1,389,692 |
Banco Santander SA
| | | 3,551,512 | | 16,130,023 |
Bankia SA
| | | 247,813 | | 725,216 |
Bankinter SA
| | | 140,229 | | 1,125,005 |
CaixaBank SA
| | | 778,993 | | 2,817,560 |
Enagas SA (b)
| | | 47,646 | | 1,285,954 |
Endesa SA
| | | 67,454 | | 1,552,225 |
Ferrovial SA
| | | 105,679 | | 2,137,679 |
Grifols SA
| | | 64,388 | | 1,685,558 |
Iberdrola SA
| | | 1,346,617 | | 10,803,404 |
Industria de Diseno Textil SA
| | | 240,333 | | 6,140,363 |
Mapfre SA
| | | 209,749 | | 556,277 |
Naturgy Energy Group SA
| | | 78,986 | | 2,009,918 |
Red Electrica Corp. SA
| | | 92,996 | | 2,072,481 |
Repsol SA
| | | 297,827 | | 4,793,689 |
Siemens Gamesa Renewable Energy SA (a)
| | | 53,415 | | 649,693 |
Telefonica SA
| | | 1,033,616 | | 8,671,600 |
| | | | | | 83,512,138 |
| SWEDEN — 2.5% | | | | | |
Alfa Laval AB
| | | 64,827 | | 1,386,719 |
Assa Abloy AB Class B
| | | 218,670 | | 3,900,659 |
Atlas Copco AB Class A
| | | 148,116 | | 3,516,687 |
Atlas Copco AB Class B
| | | 85,079 | | 1,855,149 |
Boliden AB
| | | 64,227 | | 1,390,763 |
Electrolux AB Class B
| | | 56,183 | | 1,185,655 |
Epiroc AB Class A (a)
| | | 153,263 | | 1,449,333 |
Epiroc AB Class B (a)
| | | 96,382 | | 857,517 |
Essity AB Class B
| | | 138,454 | | 3,398,162 |
Hennes & Mauritz AB Class B (b)
| | | 194,161 | | 2,759,822 |
Hexagon AB Class B
| | | 57,348 | | 2,639,114 |
Husqvarna AB Class B
| | | 101,271 | | 750,464 |
ICA Gruppen AB (b)
| | | 18,803 | | 671,880 |
Industrivarden AB Class C
| | | 37,373 | | 755,398 |
Investor AB Class B
| | | 99,536 | | 4,216,823 |
Kinnevik AB Class B
| | | 50,406 | | 1,214,972 |
L E Lundbergforetagen AB Class B
| | | 17,802 | | 524,471 |
Lundin Petroleum AB
| | | 44,572 | | 1,113,062 |
Sandvik AB
| | | 248,821 | | 3,546,026 |
Securitas AB Class B
| | | 67,661 | | 1,085,601 |
Skandinaviska Enskilda Banken AB Class A
| | | 370,638 | | 3,599,422 |
Skanska AB Class B
| | | 76,035 | | 1,209,239 |
SKF AB Class B
| | | 89,570 | | 1,358,323 |
Svenska Handelsbanken AB Class A
| | | 336,837 | | 3,734,676 |
Swedbank AB Class A
| | | 204,057 | | 4,551,427 |
Swedish Match AB
| | | 40,921 | | 1,611,297 |
Tele2 AB Class B
| | | 112,491 | | 1,433,124 |
Telefonaktiebolaget LM Ericsson Class B
| | | 692,551 | | 6,086,678 |
Telia Co. AB
| | | 609,793 | | 2,887,384 |
| Security Description | | | Shares | | Value |
Volvo AB Class B
| | | 354,113 | | $4,631,186 |
| | | | | | 69,321,033 |
| SWITZERLAND — 9.1% | | | | | |
ABB, Ltd.
| | | 406,405 | | 7,707,183 |
Adecco Group AG
| | | 35,541 | | 1,655,912 |
Baloise Holding AG
| | | 11,138 | | 1,529,808 |
Barry Callebaut AG
| | | 533 | | 827,777 |
Chocoladefabriken Lindt & Spruengli AG (e)
| | | 230 | | 1,423,210 |
Chocoladefabriken Lindt & Spruengli AG (e)
| | | 22 | | 1,635,829 |
Cie Financiere Richemont SA
| | | 116,472 | | 7,443,433 |
Clariant AG (a)
| | | 42,087 | | 772,321 |
Coca-Cola HBC AG (a)
| | | 42,454 | | 1,325,782 |
Credit Suisse Group AG (a)
| | | 570,915 | | 6,254,699 |
Dufry AG (a)(b)
| | | 6,987 | | 660,001 |
EMS-Chemie Holding AG
| | | 1,763 | | 835,181 |
Ferguson PLC
| | | 49,561 | | 3,166,775 |
Geberit AG
| | | 8,386 | | 3,252,148 |
Givaudan SA
| | | 2,023 | | 4,670,672 |
Glencore PLC (a)
| | | 2,461,621 | | 9,134,172 |
Julius Baer Group, Ltd. (a)
| | | 51,372 | | 1,824,441 |
Kuehne + Nagel International AG
| | | 12,543 | | 1,607,636 |
LafargeHolcim, Ltd. (a)
| | | 106,214 | | 4,363,631 |
Lonza Group AG (a)
| | | 16,282 | | 4,206,761 |
Nestle SA
| | | 681,702 | | 55,183,424 |
Novartis AG
| | | 482,252 | | 41,112,252 |
Pargesa Holding SA
| | | 8,029 | | 577,049 |
Partners Group Holding AG (b)
| | | 3,957 | | 2,392,343 |
Roche Holding AG
| | | 156,258 | | 38,581,048 |
Schindler Holding AG (e)
| | | 9,389 | | 1,854,370 |
Schindler Holding AG (e)
| | | 4,729 | | 914,331 |
SGS SA
| | | 1,218 | | 2,730,554 |
Sika AG
| | | 28,575 | | 3,611,732 |
Sonova Holding AG
| | | 12,443 | | 2,027,131 |
STMicroelectronics NV
| | | 141,218 | | 2,015,495 |
Straumann Holding AG
| | | 2,242 | | 1,405,514 |
Swatch Group AG (e)
| | | 7,069 | | 2,055,876 |
Swatch Group AG (e)
| | | 13,237 | | 762,692 |
Swiss Life Holding AG (a)
| | | 7,411 | | 2,846,221 |
Swiss Prime Site AG (a)
| | | 17,905 | | 1,444,860 |
Swiss Re AG
| | | 68,670 | | 6,277,683 |
Swisscom AG
| | | 5,602 | | 2,669,161 |
Temenos AG (a)
| | | 13,590 | | 1,625,341 |
UBS Group AG (a)
| | | 852,410 | | 10,579,465 |
Vifor Pharma AG
| | | 9,918 | | 1,075,506 |
Zurich Insurance Group AG
| | | 33,453 | | 9,946,312 |
| | | | | | 255,985,732 |
| UNITED ARAB EMIRATES — 0.0% (c) | | | | | |
NMC Health PLC
| | | 22,393 | | 780,300 |
| UNITED KINGDOM — 14.9% | | | | | |
3i Group PLC
| | | 201,490 | | 1,984,681 |
See accompanying notes to financial statements.
12
STATE STREET MASTER FUNDS
STATE STREET INTERNATIONAL DEVELOPED EQUITY INDEX PORTFOLIO
SCHEDULE OF INVESTMENTS (continued)
December 31, 2018
| Security Description | | | Shares | | Value |
Admiral Group PLC
| | | 39,715 | | $1,035,393 |
Anglo American PLC (b)
| | | 225,124 | | 5,011,255 |
Ashtead Group PLC
| | | 104,343 | | 2,175,429 |
Associated British Foods PLC
| | | 76,429 | | 1,988,655 |
AstraZeneca PLC
| | | 276,875 | | 20,709,839 |
Auto Trader Group PLC (d)
| | | 187,622 | | 1,086,769 |
Aviva PLC
| | | 842,136 | | 4,027,404 |
Babcock International Group PLC
| | | 37,284 | | 232,344 |
BAE Systems PLC
| | | 686,872 | | 4,017,082 |
Barclays PLC
| | | 3,711,403 | | 7,114,843 |
Barratt Developments PLC
| | | 211,532 | | 1,246,816 |
Berkeley Group Holdings PLC
| | | 24,770 | | 1,097,522 |
BP PLC
| | | 4,370,938 | | 27,608,672 |
British American Tobacco PLC
| | | 500,762 | | 15,944,260 |
British Land Co. PLC REIT
| | | 186,811 | | 1,268,603 |
BT Group PLC
| | | 1,823,392 | | 5,529,329 |
Bunzl PLC
| | | 73,223 | | 2,209,254 |
Burberry Group PLC
| | | 90,835 | | 2,007,756 |
Carnival PLC
| | | 37,037 | | 1,775,019 |
Centrica PLC
| | | 1,166,944 | | 2,004,910 |
CNH Industrial NV
| | | 234,858 | | 2,107,014 |
Coca-Cola European Partners PLC (a)(e)
| | | 10,100 | | 463,085 |
Coca-Cola European Partners PLC (e)
| | | 37,803 | | 1,738,951 |
Compass Group PLC
| | | 343,606 | | 7,220,673 |
ConvaTec Group PLC (d)
| | | 236,173 | | 417,948 |
Croda International PLC
| | | 28,934 | | 1,726,438 |
DCC PLC
| | | 19,979 | | 1,522,898 |
Diageo PLC
| | | 537,840 | | 19,145,552 |
Direct Line Insurance Group PLC
| | | 273,092 | | 1,108,470 |
easyJet PLC
| | | 35,408 | | 498,307 |
Experian PLC
| | | 197,352 | | 4,788,169 |
Fiat Chrysler Automobiles NV (a)
| | | 236,457 | | 3,428,018 |
G4S PLC
| | | 337,308 | | 846,088 |
GlaxoSmithKline PLC
| | | 1,084,136 | | 20,589,825 |
GVC Holdings PLC
| | | 121,153 | | 1,039,985 |
Hammerson PLC REIT
| | | 169,641 | | 711,684 |
Hargreaves Lansdown PLC
| | | 62,731 | | 1,477,244 |
HSBC Holdings PLC
| | | 4,358,478 | | 35,909,139 |
Imperial Brands PLC
| | | 206,531 | | 6,252,409 |
Informa PLC
| | | 259,497 | | 2,082,782 |
InterContinental Hotels Group PLC
| | | 37,451 | | 2,020,947 |
International Consolidated Airlines Group SA
| | | 124,373 | | 983,865 |
Intertek Group PLC
| | | 34,650 | | 2,118,251 |
ITV PLC
| | | 722,151 | | 1,148,285 |
J Sainsbury PLC
| | | 389,363 | | 1,314,116 |
John Wood Group PLC
| | | 138,104 | | 890,351 |
Johnson Matthey PLC
| | | 39,173 | | 1,396,441 |
Kingfisher PLC
| | | 424,155 | | 1,120,923 |
Land Securities Group PLC REIT
| | | 162,814 | | 1,668,003 |
| Security Description | | | Shares | | Value |
Legal & General Group PLC
| | | 1,263,587 | | $3,717,493 |
Lloyds Banking Group PLC
| | | 15,363,625 | | 10,145,546 |
London Stock Exchange Group PLC
| | | 67,125 | | 3,472,620 |
Marks & Spencer Group PLC
| | | 336,181 | | 1,058,412 |
Meggitt PLC
| | | 167,696 | | 1,005,950 |
Melrose Industries PLC
| | | 1,006,486 | | 2,100,328 |
Merlin Entertainments PLC (d)
| | | 128,644 | | 520,195 |
Micro Focus International PLC
| | | 36,071 | | 635,350 |
Micro Focus International PLC ADR (b)
| | | 52,641 | | 905,952 |
Mondi PLC
| | | 74,873 | | 1,557,677 |
National Grid PLC
| | | 716,276 | | 6,971,407 |
Next PLC
| | | 30,741 | | 1,562,546 |
Pearson PLC
| | | 171,114 | | 2,045,062 |
Persimmon PLC
| | | 68,081 | | 1,673,463 |
Prudential PLC
| | | 559,677 | | 9,993,519 |
Reckitt Benckiser Group PLC
| | | 146,312 | | 11,204,801 |
RELX PLC (e)
| | | 249,527 | | 5,137,197 |
RELX PLC (e)
| | | 176,822 | | 3,632,349 |
Rio Tinto PLC
| | | 255,807 | | 12,152,181 |
Rio Tinto, Ltd.
| | | 79,975 | | 4,418,048 |
Rolls-Royce Holdings PLC (a)
| | | 367,484 | | 3,884,629 |
Royal Bank of Scotland Group PLC
| | | 1,011,263 | | 2,790,975 |
Royal Mail PLC
| | | 191,233 | | 662,711 |
RSA Insurance Group PLC
| | | 207,162 | | 1,355,090 |
Sage Group PLC
| | | 222,415 | | 1,703,572 |
Schroders PLC
| | | 23,608 | | 734,540 |
Segro PLC REIT
| | | 206,434 | | 1,547,514 |
Severn Trent PLC
| | | 46,980 | | 1,086,281 |
Shire PLC ADR
| | | 2,187 | | 380,625 |
Shire PLC
| | | 201,332 | | 11,718,229 |
Smith & Nephew PLC
| | | 185,191 | | 3,452,979 |
Smiths Group PLC
| | | 83,662 | | 1,453,368 |
SSE PLC
| | | 213,481 | | 2,940,483 |
St James's Place PLC
| | | 111,071 | | 1,335,382 |
Standard Chartered PLC
| | | 615,919 | | 4,779,558 |
Standard Life Aberdeen PLC
| | | 476,148 | | 1,556,988 |
Taylor Wimpey PLC
| | | 651,840 | | 1,131,125 |
Tesco PLC
| | | 2,114,741 | | 5,120,027 |
Unilever NV
| | | 337,142 | | 18,275,849 |
Unilever PLC
| | | 246,629 | | 12,905,072 |
United Utilities Group PLC
| | | 143,567 | | 1,346,119 |
Vodafone Group PLC
| | | 5,820,419 | | 11,334,300 |
Weir Group PLC
| | | 47,109 | | 778,774 |
Whitbread PLC
| | | 39,523 | | 2,304,908 |
Wm Morrison Supermarkets PLC
| | | 494,784 | | 1,343,809 |
WPP PLC
| | | 265,323 | | 2,860,791 |
| | | | | | 418,505,490 |
See accompanying notes to financial statements.
13
STATE STREET MASTER FUNDS
STATE STREET INTERNATIONAL DEVELOPED EQUITY INDEX PORTFOLIO
SCHEDULE OF INVESTMENTS (continued)
December 31, 2018
| Security Description | | | Shares | | Value |
| UNITED STATES — 0.0% (c) | | | | | |
International Flavors & Fragrances, Inc.
| | | 1 | | $118 |
TOTAL COMMON STOCKS
(Cost $2,803,166,399)
| | | | | 2,739,199,380 |
| | | | |
| RIGHTS — 0.0% (c) | | | |
| SPAIN — 0.0% (c) | | | |
Repsol SA (expiring 01/14/19) (a)
| | 305,142 | 139,529 |
TOTAL RIGHTS
(Cost $143,140)
| | | 139,529 |
| SHORT-TERM INVESTMENT — 1.0% | |
State Street Navigator Securities Lending Portfolio II (f) (g)
(Cost $28,671,050)
| 28,671,050 | 28,671,050 |
TOTAL INVESTMENTS — 98.5%
(Cost $2,831,980,589)
| 2,768,009,959 |
OTHER ASSETS IN EXCESS OF LIABILITIES — 1.5%
| 41,500,326 |
NET ASSETS — 100.0%
| $2,809,510,285 |
| (a) | Non-income producing security. |
| (b) | All or a portion of the shares of the security are on loan at December 31, 2018. |
| (c) | Amount is less than 0.05% of net assets. |
| (d) | Securities purchased pursuant to Rule 144A of the Securities Act of 1933, as amended. These securities, which represent 0.6% of net assets as of December 31, 2018, are considered liquid and may be resold in transactions exempt from registration, normally to qualified institutional buyers. |
| (e) | Reflects separate holdings of the issuer's common stock traded on different securities exchanges. |
| (f) | The Portfolio invested in an affiliated entity. Amounts related to these transactions during the period ended December 31, 2018 are shown in the Affiliate Table below. |
| (g) | Investment of cash collateral for securities loaned. |
| ADR | = American Depositary Receipt |
| REIT | = Real Estate Investment Trust |
| SDR | = Swedish Depositary Receipt |
At December 31, 2018, open futures contracts purchased were as follows:
| Description | | Number of
Contracts | | Expiration
Date | | Notional
Amount | | Value | | Unrealized
Appreciation/
Depreciation |
| Mini MSCI EAFE (long) | | 507 | | 03/15/2019 | | $44,611,297 | | $43,500,600 | | $(1,110,697) |
During the period ended December 31, 2018, average notional value related to futures contracts was $48,948,480 or2% of net assets.
The following table summarizes the value of thePortfolio's investments according to the fair value hierarchy as of December 31, 2018.
| Description | | Level 1 –
Quoted Prices | | Level 2 –
Other Significant
Observable Inputs | | Level 3 –
Significant
Unobservable Inputs | | Total |
| ASSETS: | | | | | | | | |
| INVESTMENTS: | | | | | | | | |
Common Stocks
| | $2,739,199,380 | | $— | | $— | | $2,739,199,380 |
Rights
| | 139,529 | | — | | — | | 139,529 |
Short-Term Investment
| | 28,671,050 | | — | | — | | 28,671,050 |
TOTAL INVESTMENTS
| | $2,768,009,959 | | $— | | $— | | $2,768,009,959 |
| LIABILITIES: | | | | | | | | |
| OTHER FINANCIAL INSTRUMENTS: | | | | | | | | |
Futures Contracts(a)
| | (1,110,697) | | — | | — | | (1,110,697) |
TOTAL OTHER FINANCIAL INSTRUMENTS
| | $(1,110,697) | | $— | | $— | | $(1,110,697) |
| (a) | Futures Contracts are valued at unrealized appreciation (depreciation). |
See accompanying notes to financial statements.
14
STATE STREET MASTER FUNDS
STATE STREET INTERNATIONAL DEVELOPED EQUITY INDEX PORTFOLIO
SCHEDULE OF INVESTMENTS (continued)
December 31, 2018
Affiliate Table
| | Number of
Shares Held
at
12/31/17 | | Value at
12/31/17 | | Cost of
Purchases | | Proceeds
from
Shares Sold | | Realized
Gain (Loss) | | Change in
Unrealized
Appreciation/
Depreciation | | Number of
Shares Held
at
12/31/18 | | Value at
12/31/18 | | Dividend
Income | | Capital
Gains
Distributions |
State Street Institutional U.S. Government Money Market Fund, Class G Shares
| 18,151,852 | | $18,151,852 | | $741,374,315 | | $759,526,167 | | $— | | $— | | — | | $— | | $550,087 | | $— |
State Street Navigator Securities Lending Government Money Market Portfolio
| 15,887,666 | | 15,887,666 | | 717,897,085 | | 733,784,751 | | — | | — | | — | | — | | 743,634 | | — |
State Street Navigator Securities Lending Portfolio II
| — | | — | | 59,914,479 | | 31,243,429 | | — | | — | | 28,671,050 | | 28,671,050 | | 15,859 | | — |
Total
| | | $34,039,518 | | $1,519,185,879 | | $1,524,554,347 | | $— | | $— | | | | $28,671,050 | | $1,309,580 | | $— |
See accompanying notes to financial statements.
15
STATE STREET MASTER FUNDS
STATE STREET INTERNATIONAL DEVELOPED EQUITY INDEX PORTFOLIO
STATEMENT OF ASSETS AND LIABILITIES
December 31, 2018
| ASSETS | |
Investments in unaffiliated issuers, at value*
| $2,739,338,909 |
Investments in affiliated issuers, at value
| 28,671,050 |
Total Investments
| 2,768,009,959 |
Foreign currency, at value
| 3,896,609 |
Cash at broker
| 3,682,477 |
Receivable for investments sold
| 58,089,967 |
Dividends receivable — unaffiliated issuers
| 3,320,608 |
Dividends receivable — affiliated issuers
| 38,739 |
Securities lending income receivable — unaffiliated issuers
| 19,449 |
Securities lending income receivable — affiliated issuers
| 27,924 |
Receivable for foreign taxes recoverable
| 5,291,782 |
Prepaid expenses and other assets
| 8,584 |
TOTAL ASSETS
| 2,842,386,098 |
| LIABILITIES | |
Due to custodian
| 2,701,687 |
Payable upon return of securities loaned
| 28,671,050 |
Payable to broker – accumulated variation margin on open futures contracts
| 1,109,432 |
Advisory fee payable
| 312,632 |
Custodian fees payable
| 39,121 |
Professional fees payable
| 41,477 |
Printing and postage fees payable
| 284 |
Accrued expenses and other liabilities
| 130 |
TOTAL LIABILITIES
| 32,875,813 |
NET ASSETS
| $2,809,510,285 |
| COST OF INVESTMENTS: | |
Investments in unaffiliated issuers
| $2,803,309,539 |
Investments in affiliated issuers
| 28,671,050 |
Total cost of investments
| $2,831,980,589 |
Foreign currency, at cost
| $3,903,336 |
* Includes investments in securities on loan, at value
| $45,324,185 |
See accompanying notes to financial statements.
16
STATE STREET MASTER FUNDS
STATE STREET INTERNATIONAL DEVELOPED EQUITY INDEX PORTFOLIO
STATEMENT OF OPERATIONS
For the Year Ended December 31, 2018
| INVESTMENT INCOME | |
Interest income — unaffiliated issuers
| $27,946 |
Dividend income — unaffiliated issuers
| 94,158,453 |
Dividend income — affiliated issuers
| 550,087 |
Dividend income — non-cash transactions
| 5,656,216 |
Unaffiliated securities lending income
| 178,812 |
Affiliated securities lending income
| 759,493 |
Foreign taxes withheld
| (8,332,100) |
TOTAL INVESTMENT INCOME (LOSS)
| 92,998,907 |
| EXPENSES | |
Advisory fee
| 3,288,632 |
Administration and custody fees
| 924,705 |
Trustees’ fees and expenses
| 64,968 |
Professional fees and expenses
| 164,542 |
Printing and postage fees
| 5,047 |
Insurance expense
| 9,120 |
Miscellaneous expenses
| 39,950 |
TOTAL EXPENSES
| 4,496,964 |
NET INVESTMENT INCOME (LOSS)
| $88,501,943 |
| REALIZED AND UNREALIZED GAIN (LOSS) | |
| Net realized gain (loss) on: | |
Investments — unaffiliated issuers
| (17,834,003) |
Foreign currency transactions
| (1,335,079) |
Futures contracts
| (6,725,830) |
Net realized gain (loss)
| (25,894,912) |
| Net change in unrealized appreciation/depreciation on: | |
Investments — unaffiliated issuers
| (494,819,185) |
Foreign currency translations
| (215,399) |
Futures contracts
| (2,068,032) |
Net change in unrealized appreciation/depreciation
| (497,102,616) |
NET REALIZED AND UNREALIZED GAIN (LOSS)
| (522,997,528) |
NET INCREASE (DECREASE) IN NET ASSETS FROM OPERATIONS
| $(434,495,585) |
See accompanying notes to financial statements.
17
STATE STREET MASTER FUNDS
STATE STREET INTERNATIONAL DEVELOPED EQUITY INDEX PORTFOLIO
STATEMENTS OF CHANGES IN NET ASSETS
| | Year Ended
12/31/18 | | Year Ended
12/31/17 |
| INCREASE (DECREASE) IN NET ASSETS FROM OPERATIONS: | | | |
Net investment income (loss)
| $88,501,943 | | $69,187,821 |
Net realized gain (loss)
| (25,894,912) | | 5,670,197 |
Net change in unrealized appreciation/depreciation
| (497,102,616) | | 469,833,683 |
Net increase (decrease) in net assets resulting from operations
| (434,495,585) | | 544,691,701 |
| FROM BENEFICIAL INTEREST TRANSACTIONS: | | | |
Contributions
| 960,880,616 | | 562,875,573 |
Withdrawals
| (572,543,741) | | (232,962,957) |
Net increase (decrease) in net assets from capital transactions
| 388,336,875 | | 329,912,616 |
Net increase (decrease) in net assets during the period
| (46,158,710) | | 874,604,317 |
Net assets at beginning of period
| 2,855,668,995 | | 1,981,064,678 |
NET ASSETS AT END OF PERIOD
| $2,809,510,285 | | $2,855,668,995 |
See accompanying notes to financial statements.
18
STATE STREET MASTER FUNDS
STATE STREET INTERNATIONALDEVELOPED EQUITY INDEX PORTFOLIO
FINANCIAL HIGHLIGHTS
Selected data for a share outstanding throughout each period
| | Year
Ended
12/31/18 | | Year
Ended
12/31/17 | | For the
Period
4/29/16* -
12/31/16 |
Total return (a)
| (13.83)% | | 25.25% | | 1.00% |
| Ratios and Supplemental Data: | | | | | |
Net assets, end of period (in 000s)
| $2,809,510 | | $2,855,669 | | $1,981,065 |
| Ratios to average net assets: | | | | | |
Total expenses
| 0.15% | | 0.14% | | 0.15%(b) |
Net investment income (loss)
| 2.96% | | 2.80% | | 2.57%(b) |
Portfolio turnover rate
| 14% | | 4% | | 1%(c) |
| * | Commencement of operations. |
| (a) | Total return for periods of less than one year are not annualized. Results represent past performance and is not indicative of future results. |
| (b) | Annualized. |
| (c) | Not annualized. |
See accompanying notes to financial statements.
19
STATE STREET MASTER FUNDS
STATE STREET INTERNATIONAL DEVELOPED EQUITY INDEX PORTFOLIO
NOTES TO FINANCIAL STATEMENTS
December 31, 2018
1. Organization
State Street Master Funds (the “Trust”), a Massachusetts business trust registered under the Investment Company Act of 1940, as amended (“1940 Act”), is an open-end management investment company.
As of December 31, 2018, the Trust consists of six (6) investment portfolios (together, the “Portfolios”). Financial statements herein relate only to the State Street International Developed Equity Index Portfolio (the “Portfolio”), which commenced operations on April 29, 2016.
The Portfolio is classified as a diversified investment company under the 1940 Act.
Under the Trust’s organizational documents, its officers and trustees are indemnified against certain liabilities arising out of the performance of their duties to the Trust. Additionally, in the normal course of business, the Trust enters into contracts with service providers that contain general indemnification clauses. The Trust’s maximum exposure under these arrangements is unknown as this would involve future claims that may be made against the Trust that have not yet occurred.
2. Summary of Significant Accounting Policies
The following is a summary of significant accounting policies followed by the Trust in the preparation of its financial statements:
The preparation of financial statements in accordance with U.S. generally accepted accounting principles (“U.S. GAAP”) requires management to make estimates and assumptions that affect the reported amounts and disclosures in the financial statements. Actual results could differ from those estimates. The Portfolio is an investment company under U.S. GAAP and follows the accounting and reporting guidance applicable to investment companies.
Security Valuation
The Portfolio's investments are valued at fair value each day that the New York Stock Exchange (“NYSE”) is open and, for financial reporting purposes, as of the report date should the reporting period end on a day that the NYSE is not open. Fair value is generally defined as the price a fund would receive to sell an asset or pay to transfer a liability in an orderly transaction between market participants at the measurement date. By its nature, a fair value price is a good faith estimate of the valuation in a current sale and may not reflect an actual market price. The investments of the Portfolio are valued pursuant to the policy and procedures developed by the Oversight Committee (the “Committee”) and approved by the Board of Trustees of the Trust (the “Board”). The Committee provides oversight of the valuation of investments for the Portfolio. The Board has responsibility for overseeing the determination of the fair value of investments.
Valuation techniques used to value the Portfolio's investments by major category are as follows:
• Equity investments traded on a recognized securities exchange for which market quotations are readily available are valued at the last sale price or official closing price, as applicable, on the primary market or exchange on which they trade. Equity investments traded on a recognized exchange for which there were no sales on that day are valued at the last published sale price or at fair value.
• Rights and warrants are valued at the last reported sale price obtained from independent pricing services or brokers on the valuation date. If no price is obtained from pricing services or brokers, valuation will be based upon the intrinsic value, pursuant to the valuation policy and procedures approved by the Board.
• Investments in registered investment companies (including money market funds) or other unitized pooled investment vehicles that are not traded on an exchange are valued at that day’s published net asset value (“NAV”) per share or unit.
• Exchange-traded futures contracts are valued at the closing settlement price on the primary market on which they are traded most extensively. Exchange-traded futures contracts traded on a recognized exchange for which there were no sales on that day are valued at the last reported sale price obtained from independent pricing services or brokers or at fair value.
• Forward foreign currency exchange contracts are valued based on that day’s prevailing forward exchange rate for the underlying currencies. The rates are obtained from independent pricing services in accordance with the valuation policy and
STATE STREET MASTER FUNDS
STATE STREET INTERNATIONAL DEVELOPED EQUITY INDEX PORTFOLIO
NOTES TO FINANCIAL STATEMENTS (continued)
December 31, 2018
procedures approved by the Board.
In the event prices or quotations are not readily available or that the application of these valuation methods results in a price for an investment that is deemed to be not representative of the fair value of such investment, fair value will be determined in good faith by the Committee, in accordance with the valuation policy and procedures approved by the Board.
Various inputs are used in determining the value of the Portfolio’s investments.
The Portfolio values its assets and liabilities at fair value using a fair value hierarchy consisting of three broad levels that prioritize the inputs to valuation techniques giving the highest priority to readily available unadjusted quoted prices in active markets for identical assets or liabilities (Level 1 measurements) and the lowest priority to unobservable inputs (Level 3 measurements) when market prices are not readily available or reliable. The categorization of a value determined for an investment within the hierarchy is based upon the pricing transparency of the investment and is not necessarily an indication of the risk associated with investing in it.
The three levels of the fair value hierarchy are as follows:
• Level 1 – Unadjusted quoted prices in active markets for an identical asset or liability;
• Level 2 – Inputs other than quoted prices included within Level 1 that are observable for the asset or liability either directly or indirectly, including quoted prices for similar assets or liabilities in active markets, quoted prices for identical or similar assets or liabilities in markets that are not considered to be active, inputs other than quoted prices that are observable for the asset or liability (such as exchange rates, financing terms, interest rates, yield curves, volatilities, prepayment speeds, loss severities, credit risks and default rates) or other market-corroborated inputs; and
• Level 3 – Unobservable inputs for the asset or liability, including the Committee’s assumptions used in determining the fair value of investments.
The value of the Portfolio’s investments according to the fair value hierarchy as of December 31, 2018 is disclosed in the Portfolio’s Schedule of Investments.
Investment Transactions and Income Recognition
Investment transactions are accounted for on trade date for financial reporting purposes. Realized gains and losses from the sale or disposition of investments and foreign exchange transactions, if any, are determined using the identified cost method. Dividend income and capital gain distributions, if any, are recognized on the ex-dividend date, or when the information becomes available, net of any foreign taxes withheld at source, if any. Non-cash dividends received in the form of stock are recorded as dividend income at fair value.
Distributions received by the Portfolio may include a return of capital that is estimated by management. Such amounts are recorded as a reduction of the cost of investments or reclassified to capital gains.
All of the net investment income and realized gains and losses from the security transactions of the Portfolio are allocated pro rata among the partners in the Portfolio on a daily basis based on each partner’s daily ownership percentage.
Expenses
Certain expenses, which are directly identifiable to a specific Portfolio, are applied to that Portfolio within the Trust. Other expenses which cannot be attributed to a specific Portfolio are allocated in such a manner as deemed equitable, taking into consideration the nature and type of expense and the relative net assets of the Portfolio within the Trust.
Foreign Currency Translation
The accounting records of the Portfolio are maintained in U.S. dollars. Foreign currencies as well as investment securities and other assets and liabilities denominated in a foreign currency are translated to U.S. dollars using exchange rates at period end. Purchases and sales of securities, income receipts and expense payments denominated in foreign currencies are translated into U.S. dollars at the prevailing exchange rate on the respective dates of the transactions.
STATE STREET MASTER FUNDS
STATE STREET INTERNATIONAL DEVELOPED EQUITY INDEX PORTFOLIO
NOTES TO FINANCIAL STATEMENTS (continued)
December 31, 2018
The effects of exchange rate fluctuations on investments are included with the net realized and unrealized gain (loss) on investment securities. Other foreign currency transactions resulting in realized and unrealized gain (loss) are disclosed separately.
Foreign Taxes
The Portfolio may be subject to foreign taxes (a portion of which may be reclaimable) on income, stock dividends, realized and unrealized capital gains on investments or certain foreign currency transactions. Foreign taxes are recorded in accordance with SSGA Funds Management, Inc.'s (the “Adviser” or “SSGA FM”) understanding of the applicable foreign tax regulations and rates that exist in the foreign jurisdictions in which the Portfolio invests. These foreign taxes, if any, are paid by the Portfolio and are reflected in the Statement of Operations, if applicable. Foreign taxes payable or deferred as of December 31, 2018, if any, are disclosed in the Portfolio's Statement of Assets and Liabilities.
3. Derivative Financial Instruments
Futures Contracts
The Portfolio may enter into futures contracts to meet its objectives. A futures contract is a standardized, exchange-traded agreement to buy or sell a financial instrument at a set price on a future date. Upon entering into a futures contract, the Portfolio is required to deposit with the broker, cash or securities in an amount equal to the minimum initial margin requirements of the clearing house. Subsequent payments are made or received by the Portfolio equal to the daily change in the contract value, accumulated, exchange rates, and or other transactional fees. The accumulation of those payments are recorded as variation margin receivable or payable with a corresponding offset to unrealized gains or losses. The Portfolio recognizes a realized gain or loss when the contract is closed.
Losses may arise if the value of a futures contract decreases due to unfavorable changes in the market rates or values of the underlying instrument during the term of the contract or if the counterparty does not perform under the contract. The use of futures contracts also involves the risk that the movements in the price of the futures contracts do not correlate with the movement of the assets underlying such contracts.
For the period ended December 31, 2018, the Portfolio entered into futures contracts for cash equitization, to reduce tracking error and to facilitate daily liquidity.
The following summarizes the value of the Portfolio's derivative instruments as of December 31, 2018, and the related location in the accompanying Statement of Assets and Liabilities and Statement of Operations, presented by primary underlying risk exposure:
| | Liability Derivatives |
| | Interest Rate
Contracts
Risk | | Foreign
Exchange
Contracts
Risk | | Credit
Contracts
Risk | | Equity
Contracts
Risk | | Commodity
Contracts
Risk | | Total |
Futures Contracts
| $— | | $— | | $— | | $(1,109,432) | | $— | | $(1,109,432) |
| | Net Realized Gain (Loss) |
| | Interest Rate
Contracts
Risk | | Foreign
Exchange
Contracts
Risk | | Credit
Contracts
Risk | | Equity
Contracts
Risk | | Commodity
Contracts
Risk | | Total |
Futures Contracts
| $— | | $— | | $— | | $(6,725,830) | | $— | | $(6,725,830) |
STATE STREET MASTER FUNDS
STATE STREET INTERNATIONAL DEVELOPED EQUITY INDEX PORTFOLIO
NOTES TO FINANCIAL STATEMENTS (continued)
December 31, 2018
| | Net Change in Unrealized Appreciation (Depreciation) |
| | Interest Rate
Contracts
Risk | | Foreign
Exchange
Contracts
Risk | | Credit
Contracts
Risk | | Equity
Contracts
Risk | | Commodity
Contracts
Risk | | Total |
Futures Contracts
| $— | | $— | | $— | | $(2,068,032) | | $— | | $(2,068,032) |
4. Fees and Transactions with Affiliates
Advisory Fee
The Portfolio has entered into an Investment Advisory Agreement with the Adviser. For its advisory services to the Portfolio, the Portfolio pays the Adviser a management fee at an annual rate of 0.11% of its average daily net assets.
Administrator, Custodian, Sub-Administrator and Transfer Agent Fees
SSGA FM serves as administrator and State Street Bank and Trust Company (“State Street”), an affiliate of the Adviser, serves as custodian, sub-administrator and transfer agent to the Portfolio. For its services as custodian, sub-administrator, and transfer agent, the Portfolio pays State Street an annual fee. The fees are accrued daily and paid monthly.
Other Transactions with Affiliates - Securities Lending
State Street, an affiliate of the Portfolio, acts as the securities lending agent for the Portfolio, pursuant to an amended and restated securities lending authorization agreement dated January 6, 2017, as amended December 7, 2018.
Proceeds collected by State Street on investment of cash collateral or any fee income are allocated as follows (after deduction of such other amounts payable to State Street under the terms of the securities lending agreement): 85% payable to the Portfolio, and 15% payable to State Street.
In addition, cash collateral from lending activities is invested in the State Street Navigator Securities Lending Portfolio II, an affiliated fund, for which SSGA FM serves as investment adviser. See Note 8 for additional information regarding securities lending.
Other Transactions with Affiliates
The Portfolio may invest in affiliated entities, including securities issued by State Street Corporation., affiliated funds, or entities deemed to be affiliates as a result of the Portfolio owning more than five percent of the entity’s voting securities or outstanding shares. Amounts relating to these transactions during the period ended December 31, 2018, are disclosed in the Schedule of Investments.
Due to Custodian
In certain circumstances, the Portfolio may have cash overdrafts with the custodian due to expense payments, capital transactions, trading of securities, investment operations or derivative transactions. The Due to custodian amount if any, reflects cash overdrawn with State Street as custodian who is an affiliate of the Portfolio.
5. Trustees’ Fees
The fees and expenses of the Trust’s trustees, who are not “interested persons” of the Trust, as defined in the 1940 Act (“Independent Trustees”), are paid directly by the Portfolio. The Independent Trustees are reimbursed for travel and other out-of-pocket expenses in connection with meeting attendance and industry seminars.
STATE STREET MASTER FUNDS
STATE STREET INTERNATIONAL DEVELOPED EQUITY INDEX PORTFOLIO
NOTES TO FINANCIAL STATEMENTS (continued)
December 31, 2018
6. Investment Transactions
Purchases and sales of investments (excluding in-kind transactions, derivative contracts and short term investments) for the period ended December 31, 2018, were as follows:
| | Purchases | | Sales |
State Street International Developed Equity Index Portfolio
| $840,898,683 | | $408,340,901 |
7. Income Tax Information
The Portfolio is not required to pay federal income taxes on its net investment income and net capital gains because it is treated as a partnership for federal income tax purposes. All interest, gains and losses of the Portfolio are deemed to have been “passed through” to the Portfolio’s partners in proportion to their holdings in the Portfolio, regardless of whether such items have been distributed by the Portfolio. Each partner is responsible for its tax liability based on its distributive share; therefore, no provision has been made for federal income taxes.
The Portfolio files federal and various state and local tax returns as required. No income tax returns are currently under examination. Generally, the federal returns are subject to examination by the Internal Revenue Service for a period of three years from date of filing, while the state returns may remain open for an additional year depending upon jurisdiction. SSGA FM has analyzed the Portfolio’s tax positions taken on tax returns for all open years and does not believe there are any uncertain tax positions that would require recognition of a tax liability.
As of December 31, 2018, gross unrealized appreciation and gross unrealized depreciation of investments and other financial instruments based on cost for federal income tax purposes were as follows:
| | Tax
Cost | | Gross
Unrealized
Appreciation | | Gross
Unrealized
Depreciation | | Net Unrealized
Appreciation
(Depreciation) |
State Street International Developed Equity Index Portfolio
| $2,878,468,862 | | $203,057,521 | | $314,627,121 | | $(111,569,600) |
8. Securities Lending
The Portfolio may lend securities to qualified broker-dealers or institutional investors. The loans are secured at all times by cash, cash equivalents or U.S. government securities in an amount at least equal to the market value of the securities loaned, plus accrued interest and dividends, determined on a daily basis and adjusted accordingly. The value of the collateral with respect to a loaned security may be temporarily more or less than the value of a security due to market fluctuations of securities values. With respect to each loan, if on any U.S. business day the aggregate market value of securities collateral plus cash collateral is less than the aggregate market value of the securities which are subject to the loan, the borrower will be notified to provide additional collateral on the next business day.
The Portfolio will regain record ownership of loaned securities to exercise certain beneficial rights; however, the Portfolio may bear the risk of delay in recovery of, or even loss of rights in the securities loaned should the borrower fail financially. In addition, the Portfolio will bear the risk of loss of any cash collateral that it may invest. The Portfolio receives compensation for lending its securities from interest or dividends earned on the cash, cash equivalents or U.S. government securities held as collateral, net of fee rebates paid to the borrower and net of fees paid to State Street as the lending agent. Additionally, the Portfolio will receive a fee from the borrower for non-cash collateral equal to a percentage of the market value of the loaned securities.
The market value of securities on loan as of December 31, 2018, and the value of the invested cash collateral are disclosed in the Portfolio's Statement of Assets and Liabilities. Non-cash collateral is not disclosed in the Portfolio's Statement of Assets and Liabilities as it is held by the lending agent on behalf of the Portfolio, and the Portfolio does not have the ability to re-hypothecate those securities. Securities lending income, as disclosed in the Portfolio's Statement of Operations, represents the income earned from the non-cash collateral and the investment of cash collateral, net of fee rebates paid to the borrower and net of fees paid to State Street as lending agent.
STATE STREET MASTER FUNDS
STATE STREET INTERNATIONAL DEVELOPED EQUITY INDEX PORTFOLIO
NOTES TO FINANCIAL STATEMENTS (continued)
December 31, 2018
The following is a summary of the Portfolio’s securities lending agreements and related cash and non-cash collateral received as of December 31, 2018:
| Fund | | Market Value of
Securities on Loan | | Cash
Collateral
Received | | Non-Cash
Collateral
Received* | | Total
Collateral
Received |
State Street International Developed Equity Index Portfolio
| | $ 45,324,185 | | $ 28,671,050 | | $ 18,718,887 | | $ 47,389,937 |
| * | The non-cash collateral includes U.S. Treasuries and U.S. Government Agency securities. |
The following table reflects a breakdown of transactions accounted for as secured borrowings, the gross obligation by the type of collateral pledged or securities loaned, and the remaining contractual maturity of those transactions as of December 31, 2018:
| | | | | Remaining Contractual Maturity of the Agreements
As of December 31, 2018 |
| Fund | | Securities
Lending
Transactions | | Overnight
and
Continuous | | <30 Days | | Between
30 & 90
Days | | >90 Days | | Total
Borrowings | | Gross Amount
of Recognized
Liabilities for
Securities Lending Transactions |
State Street International Developed Equity Index Portfolio
| | Common Stocks | | $28,671,050 | | $— | | $— | | $— | | $28,671,050 | | $28,671,050 |
9. Line of Credit
The Portfolio and other affiliated funds (each a “Participant” and, collectively, the “Participants”) participate in a $500 million revolving credit facility provided by a syndication of banks under which the Participants may borrow to fund shareholder redemptions. This agreement expires in October 2019 unless extended or renewed.
The Participants are charged an annual commitment fee which is calculated based on the unused portion of the shared credit line. Commitment fees are allocated among each of the Participants based on relative net assets. Commitment fees are ordinary fund operating expenses. A Participant incurs and pays the interest expense related to its borrowing. Interest is calculated at a rate per annum equal to the sum of 1% plus the greater of the New York Fed Bank Rate and 1-month LIBOR rate.
The Portfolio had no outstanding loans as of December 31, 2018.
10. Risks
Foreign and Emerging Markets Risk
Investing in foreign markets involves risks and considerations not typically associated with investing in the U.S. Foreign securities may be subject to risk of loss because of government regulation, economic, political and social instability in the countries in which the Portfolio invests. Foreign markets may be less liquid than investments in the U.S. and may be subject to the risks of currency fluctuations. To the extent that the Portfolio invests in securities of issuers located in emerging markets, these risks may be even more pronounced.
Market and Credit Risk
In the normal course of business, the Portfolio trades financial instruments and enters into transactions where risk of potential loss exists due to changes in the general economic conditions and fluctuations of the market (market risk). Additionally, the Portfolio may also be exposed to credit risk in the event that an issuer or guarantor fails to perform or that an institution or entity with which the Portfolio has unsettled or open transactions defaults.
STATE STREET MASTER FUNDS
STATE STREET INTERNATIONAL DEVELOPED EQUITY INDEX PORTFOLIO
NOTES TO FINANCIAL STATEMENTS (continued)
December 31, 2018
11. New Accounting Pronouncements
In August 2018, the U.S. Securities and Exchange Commission (the “SEC”) released its Final Rule on Disclosure Update and Simplification (the “Final Rule”) which is intended to simplify an issuer’s disclosure compliance efforts by removing redundant or outdated disclosure requirements without significantly altering the mix of information provided to investors. The Portfolio has adopted the Final Rule for the current period.
12. Subsequent Events
Management has evaluated the impact of all subsequent events on the Portfolio through the date the financial statements were issued and has determined that there were no subsequent events requiring adjustment or disclosure in the financial statements.
STATE STREET MASTER FUNDS
STATE STREET INTERNATIONAL DEVELOPED EQUITY INDEX PORTFOLIO
REPORT OF INDEPENDENT REGISTERED PUBLIC ACCOUNTING FIRM
To the Owners of Beneficial Interest and Board of Trustees of State Street International Developed Equity Index Portfolio
Opinion on the Financial Statements
We have audited the accompanying statement of assets and liabilities of State Street International Developed Equity Index Portfolio (the “Portfolio”) (one of the portfolios constituting State Street Master Funds (the “Trust”)), including the schedule of investments, as of December 31, 2018, and the related statement of operations for the year then ended, the statements of changes in net assets for each of the two years in the period then ended, the financial highlights for each of the two years in the period then ended and the period from April 29, 2016 (commencement of operations) through December 31, 2016 and the related notes (collectively referred to as the “financial statements”). In our opinion, the financial statements present fairly, in all material respects, the financial position of the Portfolio (one of the portfolios constituting State Street Master Funds) at December 31, 2018, the results of its operations for the year then ended, the changes in its net assets for each of the two years in the period then ended and the financial highlights for each of the two years in the period then ended and the period from April 29, 2016 (commencement of operations) through December 31, 2016, in conformity with U.S. generally accepted accounting principles.
Basis for Opinion
These financial statements are the responsibility of the Trust’s management. Our responsibility is to express an opinion on the Portfolio’s financial statements based on our audits. We are a public accounting firm registered with the Public Company Accounting Oversight Board (United States) (“PCAOB”) and are required to be independent with respect to the Company in accordance with the U.S. federal securities laws and the applicable rules and regulations of the Securities and Exchange Commission and the PCAOB.
We conducted our audits in accordance with the standards of the PCAOB. Those standards require that we plan and perform the audit to obtain reasonable assurance about whether the financial statements are free of material misstatement, whether due to error or fraud. The Trust is not required to have, nor were we engaged to perform, an audit of the Trust’s internal control over financial reporting. As part of our audits, we are required to obtain an understanding of internal control over financial reporting, but not for the purpose of expressing an opinion on the effectiveness of the Trust’s internal control over financials reporting. Accordingly, we express no such opinion.
Our audits included performing procedures to assess the risks of material misstatement of the financial statements, whether due to error or fraud, and performing procedures that respond to those risks. Such procedures included examining, on a test basis, evidence regarding the amounts and disclosures in the financial statements. Our procedures included confirmation of securities owned as of December 31, 2018, by correspondence with the custodian, brokers and others or by other appropriate auditing procedures where replies from brokers and others were not received. Our audits also included evaluating the accounting principles used and significant estimates made by management, as well as evaluating the overall presentation of the financial statements. We believe that our audits provide a reasonable basis for our opinion.
We have served as the auditor of one or more State Street Global Advisors investment companies since 2000.
Boston, Massachusetts
February 27, 2019
STATE STREET MASTER FUNDS
STATE STREET INTERNATIONAL DEVELOPED EQUITY INDEX PORTFOLIO
OTHER INFORMATION
December 31, 2018 (Unaudited)
Expense Example
As a shareholder of a Portfolio, you incur two types of costs: (1) transaction costs, including sales charges (loads), if applicable, on purchase payments, reinvested dividends, or other distributions and (2) ongoing costs, including advisory fees and to the extent applicable, distribution (12b-1) and/or service fees; and other Portfolio expenses. This example is intended to help you understand your ongoing costs (in dollars) of investing in a Portfolio and to compare these costs with the ongoing costs of investing in other mutual funds. It is based on an investment of $1,000 made at the beginning of the period shown and held for the entire period from July 1, 2018 to December 31, 2018.
The table below illustrates your Portfolio's cost in two ways:
Based on actual fund return ——This section helps you to estimate the actual expenses that you paid over the period. The “Ending Account Value” shown is derived from each Portfolio's actual return, and the third column shows the dollar amount that would have been paid by an investor who started with $1,000 in the Portfolio. You may use the information here, together with the amount you invested, to estimate the expenses that you paid over the period. To do so, simply divide your account value by $1,000 (for example, an $8,600 account value divided by $1,000 = 8.6), then multiply the result by the number given for the Portfolio under the heading “Expenses Paid During Period”.
Based on hypothetical 5% return ——This section is intended to help you compare your Portfolio's costs with those of other mutual funds. It assumes that the Portfolio had a yearly return of 5% before expenses, but that the expense ratio is unchanged. In this case, because the return used is not the Portfolio's actual return, the results do not apply to your investment. The example is useful in making comparisons because the SEC requires all mutual funds to calculate expenses based on a 5% return. You can assess your Portfolio's costs by comparing this hypothetical example with the hypothetical examples that appear in shareholder reports of other funds.
Please note that the expenses shown in the table are meant to highlight your ongoing costs only and do not reflect any transaction costs, such as sales load charges (loads). Therefore, the hypothetical 5% return section of the table is useful in comparing ongoing costs only, and will not help you determine the relative total costs of owning different funds. In addition, if these transaction costs were included, your costs would have been higher.
STATE STREET MASTER FUNDS
STATE STREET INTERNATIONAL DEVELOPED EQUITY INDEX PORTFOLIO
OTHER INFORMATION (continued)
December 31, 2018 (Unaudited)
| | | | Actual | | Hypothetical (assuming a 5%
return before expenses) |
| | Annualized
Expense Ratio | | Ending Account
Value | | Expenses Paid
During Period(a) | | Ending Account
Value | | Expenses Paid
During Period(a) |
State Street International Developed Equity Index Portfolio
| 0.16% | | $886.20 | | $0.76 | | $1,024.40 | | $0.82 |
| (a) | Expenses are equal to the Fund's annualized net expense ratio multiplied by the average account value of the period, multiplied by 184, then divided by 365. |
Proxy Voting Policies and Procedures and Records
The Portfolio has adopted the proxy voting policies of the Adviser. A description of the policies and procedures that the Portfolio has adopted to determine how to vote proxies relating to portfolio securities are contained in the Portfolio’s Statement of Additional Information, which is available (i) without charge, upon request, by calling the Portfolio at 1-877-521-4083 (toll free) or (ii) on the SEC’s website at www.sec.gov. Information regarding how the Portfolio voted proxies, if any, during the most recent 12-month period ended June 30 is available by August 31 of each year without charge (1) by calling 1-877-521-4083 (toll free), or (2) on the website of the SEC at www.sec.gov.
Quarterly Portfolio Schedule
The Portfolio will file its complete schedule of investments with the SEC for the first and third quarters of each fiscal year on Form N-Q. The Portfolio’s Form N-Q is available (i) without charge, upon request, by calling the Portfolio at 1-877-521-4083 (toll free) or (ii) on the SEC’s website at www.sec.gov.
Special Meeting of Shareholders — Voting Results
A special meeting of shareholders of State Street Master Funds (the “Trust”) was held on December 18, 2018 to elect the following four nominees as Trustees of the Trust: Michael A. Jessee, Ellen M. Needham, Donna M. Rapaccioli and John R. Costantino. At the meeting the following votes were recorded:
| Nominee | Shares For | Shares Withheld |
| Michael A. Jessee | 70,681,020,370.077 | 7,661,214,196.910 |
| Ellen M. Needham | 77,884,129,343.272 | 458,105,223.715 |
| Donna M. Rapaccioli | 78,036,680,506.030 | 305,554,060.957 |
| John R. Costantino | 78,035,382,515.554 | 306,852,051.433 |
| The other Trustees whose term of office continued after the meeting are as follows: James E. Ross, Michael F. Holland, Patrick J. Riley, Richard D. Shirk, Bruce D. Taber and Rina K. Spence. |
STATE STREET MASTER FUNDS
STATE STREET INTERNATIONAL DEVELOPED EQUITY INDEX PORTFOLIO
OTHER INFORMATION (continued)
December 31, 2018 (Unaudited)
TRUSTEES AND OFFICERS INFORMATION
Name, Address
and Year of Birth | | Position(s) Held with Trust | | Term of
Office and
Length of
Time Served | | Principal Occupation During the Past Five Years and Relevant Experience | | Number of Funds in Fund Complex Overseen by Trustee† | | Other
Directorships
Held by Trustee
During the
Past Five Years |
| Trustees | | | | | | | | | | |
| Independent Trustees | | | | | | | | | | |
Michael F. Holland
c/o SSGA Funds
Management, Inc.
One Iron Street
Boston, MA 02210
YOB: 1944 | | Trustee and
Co-
Chairperson
of the Board | | Term: Indefinite
Elected: 7/99 | | Chairman, Holland & Company L.L.C. (investment adviser) (1995- present). | | 67 | | Director, the Holland Series Fund, Inc.; Director, The China Fund, Inc.; Director, The Taiwan Fund, Inc. (2007-2017); Director, Reaves Utility Income Fund, Inc.; and Director, Blackstone/GSO Loans (and Real Estate) Funds. |
Patrick J. Riley
c/o SSGA Funds
Management, Inc.
One Iron Street
Boston, MA 02210
YOB: 1948 | | Trustee and
Co-
Chairperson
of the Board | | Term: Indefinite
Elected: 1/14 | | 2002 to May 2010, Associate Justice of the Superior Court, Commonwealth of Massachusetts; 1985 to 2002, Partner, Riley, Burke & Donahue, L.L.P. (law firm); 1998 to Present, Independent Director, State Street Global Advisers Ireland, Ltd. (investment company); 1998 to Present, Independent Director, SSGA Liquidity plc (formerly, SSGA Cash Management Fund plc); January 2009 to Present, Independent Director, SSGA Fixed Income plc; and January 2009 to Present, Independent Director, SSGA Qualified Funds PLC. | | 67 | | Board Director and Chairman, SPDR Europe 1PLC Board (2011-Present); Board Director and Chairman, SPDR Europe II, PLC (2013- Present). |
John R. Costantino
c/o SSGA Funds
Management, Inc.
One Iron Street
Boston, MA 02210
YOB: 1946 | | Trustee and
Co-
Chairperson
of the Qualified
Legal and
Compliance Committee | | Term: Indefinite
Elected: 12/18 | | General Partner, NGN Capital LLC (2006 – present); and Managing Director, Vice President of Walden Capital Management (1996 – present). | | 67 | | Trustee of Neuroscience Research Institute (1986 – present); Trustee of Fordham University (1989 – 1995 and 2001 – 2007) and Trustee Emeritus (2007 – present); Trustee of GE Funds (1993 – February 2011); Director of Artes Medical (2006 – 2008); and Trustee of Gregorian University Foundation (1992 – 2007). |
Richard D. Shirk
c/o SSGA Funds
Management, Inc.
One Iron Street
Boston, MA 02210
YOB: 1945 | | Trustee and
Co-
Chairperson
of the Qualified
Legal and
Compliance Committee | | Term: Indefinite
Elected: 1/14 | | March 2001 to April 2002, Chairman (1996 to March 2001, President and Chief Executive Officer), Cerulean Companies, Inc. (holding company) (Retired); 1992 to March 2001, President and Chief Executive Officer, Blue Cross Blue Shield of Georgia (health insurer, managed healthcare). | | 67 | | 1998 to December 2008, Chairman, Board Member and December 2008 to Present, Investment Committee Member, Healthcare Georgia Foundation (private foundation); September 2002 to 2012, Lead Director and Board Member, Amerigroup Corp. (managed health care); 1999 to 2013, Board Member and (since 2001) Investment Committee Member, Woodruff Arts Center; and 2003 to 2009, Trustee, Gettysburg College; Board member, Aerocare Holdings, Regenesis Biomedical Inc. |
Rina K. Spence
c/o SSGA Funds
Management, Inc.
One Iron Street
Boston, MA 02210
YOB: 1948 | | Trustee and Co-
Chairperson of the Audit Committee,
Co-Chairperson of the Nominating Committee and
Co-
Chairperson of the Governance Committee | | Term: Indefinite
Elected: 7/99 | | President of SpenceCare International LLC (international healthcare consulting) (1999 – present); Chief Executive Officer, IEmily.com (health internet company) (2000 – 2001); Chief Executive Officer of Consensus Pharmaceutical, Inc. (1998 – 1999); Founder, President and Chief Executive Officer of Spence Center for Women’s Health (1994 – 1998); President and CEO, Emerson Hospital (1984 – 1994); Honorary Consul for Monaco in Boston (2015 – present). | | 67 | | |
STATE STREET MASTER FUNDS
STATE STREET INTERNATIONAL DEVELOPED EQUITY INDEX PORTFOLIO
OTHER INFORMATION (continued)
December 31, 2018 (Unaudited)
Name, Address
and Year of Birth | | Position(s) Held with Trust | | Term of
Office and
Length of
Time Served | | Principal Occupation During the Past Five Years and Relevant Experience | | Number of Funds in Fund Complex Overseen by Trustee† | | Other
Directorships
Held by Trustee
During the
Past Five Years |
Bruce D. Taber
c/o SSGA Funds
Management, Inc.
One Iron Street
Boston, MA 02210
YOB: 1943 | | Trustee and Co-
Chairperson of the Valuation Committee, Co-
Chairperson of the Nominating Committee and Co
-Chairperson of the Governance Committee | | Term: Indefinite
Elected: 1/14 | | Retired; 1999 to 2016, Partner, Zenergy LLC (a technology company providing Computer Modeling and System Analysis to the General Electric Power Generation Division); Until December 2008, Independent Director, SSGA Cash Management Fund plc; Until December 2008, Independent Director, State Street Global Advisers Ireland, Ltd. (investment companies). | | 49 | | None. |
Michael A. Jessee
c/o SSGA Funds
Management, Inc.
One Iron Street
Boston, MA 02210
YOB: 1946 | | Trustee and Co-
Chairperson
of the Valuation Committee | | Term: Indefinite
Appointed: 7/16 | | Retired; formerly, President and Chief Executive Officer of the Federal Home Loan Bank of Boston (1989 – 2009); Trustee, Randolph-Macon College (2004-2016). | | 67 | | None. |
Donna M. Rapaccioli
c/o SSGA Funds
Management, Inc.
One Iron Street
Boston, MA 02210
YOB: 1962 | | Trustee and Co-
Chairperson
of the Audit Committee | | Term: Indefinite
Elected: 12/18 | | Dean of the Gabelli School of Business (2007 – present) and Accounting Professor (1987 – present) at Fordham University. | | 67 | | Director- Graduate Management Admissions Council (2015 - present); Trustee of Emmanuel College (2010 – present). |
| Interested Trustees(1) | | | | | | | | | | |
James E. Ross(2)
SSGA Funds Management, Inc.
One Iron Street
Boston, MA 02210
YOB: 1965 | | Trustee | | Term: Indefinite
Appointed: 2/07 | | Chairman and Director, SSGA Funds Management, Inc. (2005-present); Executive Vice President, State Street Global Advisors (2012-present); Chief Executive Officer and Director, State Street Global Advisors Funds Distributors, LLC (May 2017 – present); Director, State Street Global Markets, LLC (2013 - April 2017); President, SSGA Funds Management, Inc. (2005 – 2012), Principal, State Street Global Advisors (2000-2005). | | 185 | | SSGA SPDR ETFs Europe I plc (Director) (November 2016 – present); SSGA SPDR ETFs Europe II plc (Director) (November 2016 – present). |
Ellen M. Needham(3)
SSGA Funds Management, Inc.
One Iron Street
Boston, MA 02210
YOB: 1967 | | Trustee and President | | Term: Indefinite
Elected 12/18 | | President and Director, SSGA FM (2001 – present)*; Senior Managing Director, State Street Global Advisors (1992 – present)*; Director, State Street Global Advisors Funds Distributors, LLC (May 2017 – present).* | | 67 | | None. |
| † For the purpose of determining the number of portfolios overseen by the Trustees, “Fund Complex” comprises registered investment companies for which SSGA Funds Management, Inc. serves as investment adviser. |
| (1) The individuals listed below are Trustees who are “interested persons,” as defined in the 1940 Act, of the Trusts (“Interested Trustees”). |
| (2) Mr. Ross is an Interested Trustee because of his employment by SSGA Funds Management, Inc., an affiliate of the Trust. |
| (3) Ms. Needham is an Interested Trustee because of her employment by SSGA Funds Management, Inc., an affiliate of the Trust. |
| * Served in various capacities and/or with various affiliated entities during noted time period. |
| The following lists the principal officers for the Trust, as well as their mailing addresses and ages, positions with the Trust and length of time served, and present and principal occupations: |
STATE STREET MASTER FUNDS
STATE STREET INTERNATIONAL DEVELOPED EQUITY INDEX PORTFOLIO
OTHER INFORMATION (continued)
December 31, 2018 (Unaudited)
Name, Address
and Year of Birth | | Position(s) Held with Trust | | Term of
Office and
Length of
Time Served | | Principal Occupation(s) During the Past 5 Years |
| Officers | | | | | | |
ELLEN M. NEEDHAM
SSGA Funds Management, Inc.
One Iron Street
Boston, MA 02210
YOB: 1967 | | President, Trustee | | Term: Indefinite
Elected: 10/12 | | President and Director, SSGA Funds Management, Inc. (2001 - present)*; Senior Managing Director, State Street Global Advisors (1992 - present); Director, State Street Global Advisors Funds Distributors, LLC (May 2017 - present).* |
BRUCE S. ROSENBERG
SSGA Funds Management, Inc.
One Iron Street
Boston, MA 02210
YOB: 1961 | | Treasurer | | Term: Indefinite
Elected: 2/16 | | Managing Director, State Street Global Advisors and SSGA Funds Management, Inc. (July 2015 - present); Director, Credit Suisse (April 2008 - July 2015). |
ANN M. CARPENTER
SSGA Funds Management, Inc.
One Iron Street
Boston, MA 02210
YOB: 1966 | | Vice
President
and Deputy
Treasurer | | Term: Indefinite
Elected: 10/12
Term: Indefinite
Elected: 2/16 | | Chief Operating Officer, SSGA Funds Management, Inc. (2005 - Present)*; Managing Director, State Street Global Advisors (2005 - present).* |
CHAD C. HALLETT
SSGA Funds Management, Inc.
One Iron Street
Boston, MA 02210
YOB: 1969 | | Deputy Treasurer | | Term: Indefinite
Elected: 2/16 | | Vice President, State Street Global Advisors and SSGA Funds Management, Inc. (November 2014 – present); Vice President, State Street Bank and Trust Company (2001 –November 2014).* |
DARLENE ANDERSON-VASQUEZ
SSGA Funds Management, Inc.
One Iron Street
Boston, MA 02210
YOB: 1968 | | Deputy Treasurer | | Term: Indefinite
Elected: 11/16 | | Managing Director, State Street Global Advisors and SSGA Funds Management, Inc. (May 2016 – present); Senior Vice President, John Hancock Investments (September 2007 – May 2016). |
ARTHUR A. JENSEN
SSGA Funds Management, Inc.
1600 Summer Street
Stamford, CT 06905
YOB: 1966 | | Deputy Treasurer | | Term: Indefinite
Elected: 11/16 | | Vice President at State Street Global Advisors (July 2016 – present); Deputy Treasurer of Elfun Funds (July 2016 – present); Treasurer of State Street Institutional Funds, State Street Variable Insurance Series Funds, Inc. and GE Retirement Savings Plan Funds (June 2011 – present); Treasurer of Elfun Funds (June 2011– July 2016); Mutual Funds Controller of GE Asset Management Incorporated (April 2011 – July 2016). |
SUJATA UPRETI
SSGA Funds Management, Inc.
One Iron Street
Boston, MA 02210
YOB: 1974 | | Assistant
Treasurer | | Term: Indefinite
Elected: 2/16 | | Vice President, State Street Global Advisors and SSGA Funds Management, Inc. (May 2015 – present); Assistant Director, Cambridge Associates, LLC (July 2014 – January 2015); Vice President, Bank of New York Mellon (July 2012 – August 2013); Manager, PricewaterhouseCoopers, LLP (September 2003 – July 2012). |
DANIEL FOLEY
SSGA Funds Management, Inc.
One Iron Street
Boston, MA 02210
YOB: 1972 | | Assistant
Treasurer | | Term: Indefinite
Elected: 2/16 | | Vice President, State Street Global Advisors and SSGA Funds Management, Inc. (April 2007 – present).* |
DANIEL G. PLOURDE
SSGA Funds Management, Inc.
One Iron Street
Boston, MA 02210
YOB: 1980 | | Assistant
Treasurer | | Term: Indefinite
Elected: 5/17 | | Vice President, State Street Global Advisors and SSGA Funds Management, Inc. (May 2015 – present); Officer, State Street Bank and Trust Company (March 2009 – May 2015). |
BRIAN HARRIS
SSGA Funds Management, Inc.
One Iron Street
Boston, MA 02210
YOB: 1973 | | Chief Compliance Officer, Anti-Money Laundering Officer and Code of Ethics Compliance Officer | | Term: Indefinite
Elected: 11/13
Term: Indefinite
Elected: 9/16 | | Managing Director, State Street Global Advisors and SSGA Funds Management, Inc. (2013—Present); Senior Vice President and Global Head of Investment Compliance, BofA Global Capital Management (September 2010 – May 2013). |
STATE STREET MASTER FUNDS
STATE STREET INTERNATIONAL DEVELOPED EQUITY INDEX PORTFOLIO
OTHER INFORMATION (continued)
December 31, 2018 (Unaudited)
Name, Address
and Year of Birth | | Position(s) Held with Trust | | Term of
Office and
Length of
Time Served | | Principal Occupation(s) During the Past 5 Years |
JOSHUA A. WEINBERG
SSGA Funds Management, Inc.
One Iron Street
Boston, MA 02210
YOB: 1978 | | Chief Legal Officer | | Term: Indefinite
Elected: 2/15 | | Managing Director and Managing Counsel, State Street Global Advisors (2011 – present)*; Clerk, SSGA Funds Management, Inc. (2013 – present); Associate, Financial Services Group, Dechert LLP (2005 – 2011). |
JESSE D. HALLEE
State Street Bank and Trust Company
100 Summer Street,
7th Floor
Boston, MA 02111-2900
YOB: 1976 | | Secretary | | Term: Indefinite
Elected: 9/16 | | Vice President and Managing Counsel, State Street Bank and Trust Company (2013 – present); Vice President and Counsel, Brown Brothers Harriman & Co. (2007-2013). |
KHIMMARA GREER
State Street Bank and Trust Company
100 Summer Street,
7th Floor
Boston, MA 02111-2900
YOB: 1983 | | Assistant Secretary | | Term: Indefinite
Elected: 5/16 | | Vice President and Counsel, State Street Bank and Trust Company (2015- present); Regulatory Advisor, JPMorgan (2014 – 2015); Claims Case Manager, Liberty Mutual Insurance (2012 – 2014); Contract Attorney, Various Law Firms (2011 – 2012). |
| * Served in various capacities and/or with various affiliated entities during noted time period. |
| Statement of Additional Information (SAI) includes additional information about Portfolio's directors and is available, without charge, upon request and by calling 1-877-521-4083. |
[This Page Intentionally Left Blank]
[This Page Intentionally Left Blank]
[This Page Intentionally Left Blank]
[This Page Intentionally Left Blank]
Trustees
John R. Costantino
Michael F. Holland
Michael A. Jessee
Ellen M. Needham
Donna M. Rapaccioli
Patrick J. Riley
James E. Ross
Richard D. Shirk
Rina K. Spence
Bruce D. Taber
Investment Adviser and Administrator
SSGA Funds Management, Inc.
One Iron Street
Boston, MA 02210
Custodian, Sub-Administrator and Transfer Agent of the Portfolio
State Street Bank and Trust Company
State Street Financial Center
One Lincoln Street
Boston, MA 02111
Independent Registered Public Accounting Firm
Ernst & Young LLP
200 Clarendon Street
Boston, MA 02116
Legal Counsel
Ropes & Gray LLP
800 Boylston Street
Boston, MA 02199
The information contained in this report is intended for the general information of shareholders of the Portfolio and shareholders of any fund invested in the Portfolio. Interests in the Portfolio are offered solely to eligible investors in private placement transactions that do not involve any “public offering” within the meaning of Section 4(a)(2) of the 1933 Act. This report is not authorized for distribution (i) to prospective investors in any fund invested in the Portfolio unless preceded or accompanied by a current offering document for such fund or (ii) to prospective eligible investors in the Portfolio unless preceded or accompanied by a current offering document of the Portfolio. Eligible investors in the Portfolio may obtain a current Portfolio offering document by calling 1-877-521-4083. Please read the offering document carefully before investing in the Portfolio.
As of the end of the period covered by this report, State Street Master Funds (the “Trust” or “Registrant”) has adopted a code of ethics, as defined in Item 2(b) of FormN-CSR, that applies to the Registrant’s principal executive officer, principal financial officer, principal accounting officer or controller, or persons performing similar functions, regardless of whether these individuals are employed by the Registrant or a third party (the “Code”). That Code comprises written standards that are reasonably designed to deter wrongdoing and to promote: (1) honest and ethical conduct, including the ethical handling of actual or apparent conflicts of interest between personal and professional relationships; (2) full, fair, accurate, timely and understandable disclosure in reports and documents that the Registrant files with, or submits to, the U.S. Securities Exchange Commission (the “SEC”) and in other public communications made by the Registrant; (3) compliance with applicable laws and governmental rules and regulations; (4) the prompt internal reporting to an appropriate person or persons identified in the Code of violations of the Code; and (5) accountability for adherence to the Code. For the period covered by the report, the Code was combined with other mutual funds advised by SSGA Funds Management, Inc. (“SSGA FM” or the “Adviser”). The Registrant has not made any amendments to the Code that relates to any element of the code of ethics definition set forth in Item 2(b) of FormN-CSR during the covered period. The Registrant has not granted any waivers from any provisions of the Code during the covered period. A copy of the Code is filed as Exhibit 13(a)(1) to this FormN-CSR.
| Item 3. | Audit Committee Financial Expert. |
The Trust’s Board of Trustees (the “Board”) has determined that the Trust has the following “audit committee financial experts” as defined in Item 3(b) of FormN-CSR serving on its audit committee (the “Audit Committee”): Messrs. Michael F. Holland, Richard D. Shirk and John R. Costantino and Ms. Donna M. Rapaccioli. Each of the “audit committee financial experts” is “independent” as that term is defined in Item 3(a)(2) of FormN-CSR.
An “audit committee financial expert” is not an “expert” for any purpose, including for purposes of Section 11 of the Securities Act of 1933, as amended, as a result of being designated as an “audit committee financial expert.” Further, the designation of a person as an “audit committee financial expert” does not mean that the person has any greater duties, obligations, or liability than those imposed on the person without the “audit committee financial expert” designation. Similarly, the designation of a person as an “audit committee financial expert” does not affect the duties, obligations, or liability of any other member of the Audit Committee or the Board.
| Item 4. | Principal Accountant Fees and Services. |
For the fiscal years ended December 31, 2018 and December 31, 2017, the aggregate audit fees billed for professional services rendered by Ernst & Young LLP (“E&Y”), the Trust’s principal accountant, for the audit of the Trust’s annual financial statements or services normally provided by E&Y in connection with the Trust’s statutory and regulatory filings and engagements were $187,052 and $180,177, respectively.
For the fiscal years ended December 31, 2018 and December 31, 2017, there were no fees for assurance and related services by E&Y reasonably related to the performance of the audit of the Trust’s financial statements that were not reported under paragraph (a) of this Item.
For the fiscal years ended December 31, 2018 and December 31, 2017, the aggregate tax fees billed for professional services rendered by E&Y for tax compliance, tax advice, and tax planning in the form of preparation of excise filings and income tax returns were $45,420 and $45,420, respectively.
For the fiscal years ended December 31, 2018 and December 31, 2017, there were no fees billed for professional services rendered by E&Y for products and services provided by E&Y to the Trust, other than the services reported in paragraphs (a) through (c).
For the fiscal years ended December 31, 2018 and December 31, 2017, the aggregate fees for professional services rendered by E&Y for products and services provided by E&Y to the Adviser and any entity controlling, controlled by, or under common control with the Adviser that provides ongoing services to the Trust that (i) relate directly to the operations and financial reporting of the Trust and (ii) werepre-approved by the Audit Committee were approximately $6,581,832 and $7,777,372, respectively.
| | (e)(1) | Audit CommitteePre-Approval Policies and Procedures |
The Trust’s Audit Committee Charter states the following with respect topre-approval procedures:
The Audit Committee shall have the following duties and powers:
| | • | | To pre-approve engagements by a Trust’s independent auditor fornon-audit services to be rendered to the Fund’s investment adviser (not including anysub-adviser whose role is primarily portfolio management and is subcontracted with or overseen by another investment adviser), and any entity controlling, controlled by, or under common control with the investment adviser that provides ongoing services to the Fund, if the engagement relates directly to the operations and financial reporting of the Fund; |
| | • | | To establish, if deemed necessary or appropriate as an alternative to Audit Committeepre-approval of services to be provided by the independent auditor as required by paragraph (b) above, policies and procedures to permit such services to bepre-approved by other means, such as by action of a designated member or members of the Audit Committee, subject to the requirement that the decision of any member to whom authority is delegated topre-approve an activity shall be presented to the full Audit Committee at its next scheduled meeting; |
AlternatePre-Approval Procedure:
| | • | | The Chairperson, or aCo-Chairperson, of the Audit Committee is authorized topre-approve any engagement involving the Trust’s independent auditors to the same extent as the Audit Committee. Anypre-approval decision by the Chairperson, or aCo-Chairperson, under the foregoing authority shall be presented to the Audit Committee at its next scheduled meeting. |
| | (e)(2) | Percentages of Services |
None of the services described in paragraphs (b) through (d) of this Item were performed in reliance on paragraph (c)(7)(i)(C) of Rule2-01 of RegulationS-X during the period of time for which such rule was effective.
| | (g) | Total Fees Paid By Adviser and Certain Affiliates |
For the fiscal years ended December 31, 2018 and December 31, 2017, the aggregatenon-audit fees billed by E&Y for services rendered to the Trust and the Adviser and any entity controlling, controlled by, or under common control with the Adviser that provided ongoing services to the Trust were approximately $36,297,003 and $40,983,185, respectively. The figure for the fiscal year ended December 31, 2017 was previously reported as $28,718,894 and has been restated to include certain other audit fees totaling $12,264,291, in the aggregate, primarily relating to statutory and financial statement audits, the requirement to opine on the design and operating effectiveness of internal control over financial reporting and accounting consultations.
| | (h) | E&Y notified the Trust’s Audit Committee of allnon-audit services that were rendered by E&Y to the Adviser and any entity controlling, controlled by, or under common control with the Adviser that provides services to the Trust, which services were not required to bepre-approved pursuant to paragraph (c)(7)(ii) of Rule2-01 of RegulationS-X, allowing the Trust’s Audit Committee to consider whether such services were compatible with maintaining E&Y’s independence. |
| Item 5. | Audit Committee of Listed Registrants. |
Not applicable to the Registrant.
(a) Schedules of Investments are included as part of the reports to shareholders filed under Item 1 of this FormN-CSR.
(b) Not applicable to the Registrant.
| Item 7. | Disclosure of Proxy Voting Policies and Procedures forClosed-End Management Investment Companies. |
Not applicable to the Registrant.
| Item 8. | Portfolio Managers ofClosed-End Management Investment Companies. |
Not applicable to the Registrant.
| Item 9. | Purchases of Equity Securities byClosed-End Management Investment Company and Affiliated Purchasers. |
Not applicable to the Registrant.
| Item 10. | Submission of Matters to a Vote of Security Holders. |
There were no material changes to the procedures by which shareholders may recommend nominees to the Registrant’s Board of Trustees.
| Item 11. | Controls and Procedures. |
(a) The Trust’s principal executive officer and principal financial officer have concluded that the Trust’s disclosure controls and procedures (as defined in Rule30a-3(c) under the Investment Company Act of 1940, as amended (the “1940 Act”)) are effective to provide reasonable assurance that information required to be disclosed by the Registrant on FormN-CSR is recorded, processed, summarized and reported as of a date within 90 days of the filing date of this report, based on their evaluation of these controls and procedures required by Rule30a-3(b) under the 1940 Act and Rules13a-15(b) or15d-15(b) under the Securities Exchange Act of 1934, as amended.
(b) There were no changes in the Trust’s internal control over financial reporting (as defined in Rule30a-3(d) under the 1940 Act) that occurred during the Trust’s last fiscal quarter of the period covered by this FormN-CSR filing that have materially affected, or are reasonably likely to materially affect, the Trust’s internal control over financial reporting.
| Item 12. | Disclosure of Securities Lending Activities forClosed-End Management Investment Companies. |
(a) Not applicable to the Registrant.
(b) Not applicable to the Registrant.
| | |
| |
| (a)(1) | | Code of Ethics pursuant to Item 2 of Form N-CSR is attached hereto. |
| |
| (a)(2) | | Certifications of principal executive officer and principal financial and accounting officer of the Trust as required by Rule30a-2(a) under the 1940 Act are attached hereto. |
| |
| (a)(3) | | Not applicable to the Registrant. |
| |
| (a)(4) | | Not applicable. |
| |
| (b) | | Certifications of principal executive officer and principal financial and accounting officer of the Trust as required by Rule30a-2(b) under the 1940 Act and Section 906 of the Sarbanes-Oxley Act of 2002 are attached hereto. |
SIGNATURES
Pursuant to the requirements of the Securities Exchange Act of 1934 and the Investment Company Act of 1940, the Registrant has duly caused this report to be signed on its behalf by the undersigned, thereunto duly authorized.
| | |
| Registrant: STATE STREET MASTER FUNDS |
| |
| By: | | /s/ Ellen M. Needham |
| | Ellen M. Needham |
| | President |
|
| Date: March 6, 2019 |
Pursuant to the requirements of the Securities Exchange Act of 1934 and the Investment Company Act of 1940, this report has been signed below by the following persons on behalf of the Registrant and in the capacities and on the dates indicated.
| | |
| By: | | /s/ Ellen M. Needham |
| | Ellen M. Needham |
| | President (Principal Executive Officer) |
|
| Date: March 6, 2019 |
| |
| By: | | /s/ Bruce S. Rosenberg |
| | Bruce S. Rosenberg |
| | Treasurer (Principal Financial and Accounting Officer) |
|
| Date: March 6, 2019 |