Table of Contents
UNITED STATES
SECURITIES AND EXCHANGE COMMISSION
Washington, D.C. 20549
Form6-K
Report Of Foreign Private Issuer
Pursuant To Rule13a-16 Or15d-16 Of
The Securities Exchange Act Of 1934
For the month of August, 2019
Commission File Number:001-14950
ULTRAPAR HOLDINGS INC.
(Translation of Registrant’s Name into English)
Avenida Brigadeiro Luis Antonio, 1343, 9º Andar
São Paulo, SP, Brazil01317-910
(Address of Principal Executive Offices)
Indicate by check mark whether the registrant files or will file annual reports under cover of Form20-F or Form40-F:
Form20-F X Form40-F
Indicate by check mark if the registrant is submitting the Form6-K in paper as permitted by RegulationS-T Rule 101(b)(1):
Yes No X
Indicate by check mark if the registrant is submitting the Form6-K in paper as permitted by RegulationS-T Rule 101(b)(7):
Yes No X
Table of Contents
TABLE OF CONTENTS
ITEM | ||
| 1. | ||
| 2. | ||
| 3. | ||
| 4. | ||
Table of Contents
(Convenience Translation into English from
the Original Previously Issued in Portuguese)
Ultrapar Participações S.A.
Parent and Consolidated
Interim Financial Information
as of and the Three-month period
Ended June 30, 2019 and
Report on Review of Interim
Financial Information
KPMG Auditores Independentes
Table of Contents
Ultrapar Participações S.A. and Subsidiaries
Parent and Consolidated
Interim Financial Information
as of and the Three-month period Ended June 30, 2019
Table of Contents
| 3 – 4 | ||||
| 5 – 6 | ||||
| 7 – 8 | ||||
| 9 – 10 | ||||
| 11 – 12 | ||||
| 13 – 14 | ||||
| 15 | ||||
| 16 – 99 | ||||
2
Table of Contents
(Convenience Translation into English from the Original Previously Issued in Portuguese)
Report on the review of quarterly information—ITR
To the Shareholders, Directors and Management of
Ultrapar Participações S.A.
São Paulo, SP
Introduction
We have reviewed the accompanying individual and consolidated interim financial information of Ultrapar Participações S.A. (“Company”), comprised in the Quarterly Financial Information—ITR Form for the quarter ended June 30, 2019, which comprise the balance sheet as of June 30, 2019 and related statements of income, comprehensive income for the three andsix-month period then ended and changes in shareholders’ equity and cash flows for thesix-month period then ended, including the explanatory notes.
The Company’s Management is responsible for the preparation of the interim financial information in accordance with Technical Pronouncement CPC 21 (R1) Interim Financial Information and with International Standard IAS 34—Interim Financial Reporting, issued by the International Accounting Standards Board—IASB, such as for the presentation of these information in a manner consistent with the standards issued by the Brazilian Securities Commission, applicable to the preparation of the Quarterly Financial Information—ITR. Our responsibility is to express a conclusion on these interim financial information based on our review.
Scope of the review
Our review was carried out in accordance with the Brazilian and international review standards for interim information (NBC TR 2410—Review of Interim Financial Information Performed by the Independent Auditor of the Entity and ISRE 2410—Review of Interim Financial Information Performed by the Independent Auditor of the Entity, respectively). A review of interim information consists of making inquiries, primarily of persons responsible for financial and accounting matters, and applying analytical and other review procedures. A review is substantially less in scope than an audit conducted in accordance with the auditing standards and consequently does not enable us to obtain assurance that we would become aware of all significant matters that might be identified in an audit. Accordingly, we do not express an audit opinion.
3
Table of Contents
Conclusion on the individual and consolidated interim financial information
Based on our review, nothing has come to our attention that causes us to believe that the individual and consolidated interim financial information included in the quarterly information referred to above was not prepared, in all material respects, in accordance with CPC 21 (R1) and IAS 34, issued by the Accouting Committee and by IASB applicable to the preparation of Quarterly Financial Information—ITR and presented in accordance with the standards issued by the Brazilian Securities Commission—CVM.
Other matters
Interim statements of value added
The individual and consolidated interim statements of value added (DVA) for thesix-month period ended June 30, 2019, prepared under the responsibility of the Company’s management, and presented as supplementary information for the purposes of IAS 34, were submitted to the same review procedures followed together with the review of the Company’s interim financial information. In order to form our conclusion, we evaluated whether these statements are reconciled to the interim financial information and to the accounting records, as applicable, and whether their form and content are in accordance with the criteria set on Technical Pronouncement CPC 09—Statement of Value Added. Based on our review, nothing has come to our attention that causes us to believe that the accompanying statements of value added are not prepared, in all material respects, in accordance with the individual and consolidated interim financial information taken as a whole.
São Paulo, August 14, 2019
KPMG Auditores Independentes
CRC2SP014428/O-6
Original report in Portuguese signed by
Marcio Serpejante Peppe
Accountant CRC1SP233011/O-8
4
Table of Contents
Ultrapar Participações S.A. and Subsidiaries
Statements of Financial Position
as of June 30, 2019 and December 31, 2018
(In thousands of Brazilian Reais)
| Parent | Consolidated | |||||||||||||||||||
Assets | Note | 06/30/2019 | 12/31/2018 | 06/30/2019 | 12/31/2018 | |||||||||||||||
Current assets | ||||||||||||||||||||
Cash and cash equivalents | 4.a | 69,883 | 172,315 | 2,909,302 | 3,938,951 | |||||||||||||||
Financial investments and hedging instruments | 4.b | 119,249 | 565,930 | 3,177,404 | 2,853,106 | |||||||||||||||
Trade receivables | 5.a | — | — | 3,843,723 | 4,069,307 | |||||||||||||||
Reseller financing | 5.b | — | — | 382,458 | 367,262 | |||||||||||||||
Inventories | 6 | — | — | 3,263,630 | 3,354,532 | |||||||||||||||
Recoverable taxes | 7.a | 35 | — | 758,240 | 639,699 | |||||||||||||||
Recoverable income and social contribution taxes | 7.b | 35,430 | 39,705 | 277,540 | 257,182 | |||||||||||||||
Dividends receivable | — | 260,483 | — | 1,064 | ||||||||||||||||
Other receivables | 3,296 | 1,527 | 86,802 | 58,561 | ||||||||||||||||
Prepaid expenses | 10 | 2,073 | 1,962 | 159,979 | 187,570 | |||||||||||||||
Contractual assets with customers – exclusive rights | 11 | — | — | 478,863 | 484,473 | |||||||||||||||
|
|
|
|
|
|
|
| |||||||||||||
Total current assets | 229.966 | 1,041,922 | 15,337,941 | 16,211,707 | ||||||||||||||||
Non-current assets | ||||||||||||||||||||
Financial investments and hedging instruments | 4.b | — | — | 334,810 | 202,349 | |||||||||||||||
Trade receivables | 5.a | — | — | 26,863 | 81,569 | |||||||||||||||
Reseller financing | 5.b | — | — | 348,245 | 348,268 | |||||||||||||||
Related parties | 8.a | 761,288 | 761,288 | 490 | 490 | |||||||||||||||
Deferred income and social contribution taxes | 9.a | 14,443 | 14,034 | 599,347 | 514,187 | |||||||||||||||
Recoverable taxes | 7.a | — | — | 747,161 | 747,180 | |||||||||||||||
Recoverable income and social contribution taxes | 7.b | 39,447 | 48,685 | 90,229 | 105,602 | |||||||||||||||
Escrow deposits | 22.a | — | — | 912,551 | 881,507 | |||||||||||||||
Indemnification asset – business combination | 22.c | — | — | 194,846 | 194,719 | |||||||||||||||
Other receivables | — | — | 1,299 | 1,411 | ||||||||||||||||
Prepaid expenses | 10 | 25 | 30 | 106,942 | 399,095 | |||||||||||||||
Contractual assets with customers – exclusive rights | 11 | — | — | 977,461 | 1,034,004 | |||||||||||||||
|
|
|
|
|
|
|
| |||||||||||||
Total long term assets | 815,203 | 824,037 | 4,340,244 | 4,510,381 | ||||||||||||||||
Investments | ||||||||||||||||||||
In subsidiaries | 12.a | 10,254,804 | 9,509,480 | — | — | |||||||||||||||
In joint-ventures | 12.a; 12.b | 17,049 | 20,118 | 94,324 | 101,954 | |||||||||||||||
In associates | 12.c | — | — | 25,256 | 24,338 | |||||||||||||||
Other | — | — | 2,792 | 2,795 | ||||||||||||||||
|
|
|
|
|
|
|
| |||||||||||||
| 10,271,853 | 9,529,598 | 122,372 | 129,087 | |||||||||||||||||
Right to use assets | 13 | — | — | 1,878,597 | — | |||||||||||||||
Property, plant, and equipment | 14 | — | — | 7,309,010 | 7,278,865 | |||||||||||||||
Intangible assets | 15 | 246,163 | 246,163 | 2,316,616 | 2,369,355 | |||||||||||||||
|
|
|
|
|
|
|
| |||||||||||||
Totalnon-current assets | 11,333,219 | 10,599,798 | 15,966,839 | 14,287,688 | ||||||||||||||||
|
|
|
|
|
|
|
| |||||||||||||
Total assets | 11,563,185 | 11,641,720 | 31,304,780 | 30,499,395 | ||||||||||||||||
|
|
|
|
|
|
|
| |||||||||||||
The accompanying notes are an integral part of the interim financial information.
5
Table of Contents
Ultrapar Participações S.A. and Subsidiaries
Statements of Financial Position
as of June 30, 2019 and December 31, 2018
(In thousands of Brazilian Reais)
| Parent | Consolidated | |||||||||||||||||||
Liabilities | Note | 06/30/2019 | 12/31/2018 | 06/30/2019 | 12/31/2018 | |||||||||||||||
Current liabilities | ||||||||||||||||||||
Loans and hedging instruments | 16 | — | — | 980,955 | 2,007,430 | |||||||||||||||
Debentures | 16.g | 34,921 | 34,504 | 315,198 | 263,718 | |||||||||||||||
Trade payables | 17 | 454 | 272 | 1,973,170 | 2,551,607 | |||||||||||||||
Trade payables—agreement | 17 | — | — | 533,139 | 180,070 | |||||||||||||||
Salaries and related charges | 18 | 928 | 228 | 369,323 | 428,192 | |||||||||||||||
Taxes payable | 19 | 593 | 11,563 | 229,223 | 268,005 | |||||||||||||||
Dividends payable | 26.h | 13,220 | 282,334 | 14,426 | 284,024 | |||||||||||||||
Income and social contribution taxes payable | — | 9,238 | 98,563 | 55,477 | ||||||||||||||||
Post-employment benefits | 20.b | — | — | 43,158 | 45,655 | |||||||||||||||
Provision for asset retirement obligation | 21 | — | — | 4,001 | 4,382 | |||||||||||||||
Provision for tax, civil, and labor risks | 22.a | — | — | 91,416 | 77,822 | |||||||||||||||
Trade payables—customers and third parties’ indemnification | 23 | — | — | — | 3,501 | |||||||||||||||
Leases payable | 13 | — | — | 203,469 | 2,849 | |||||||||||||||
Other payables | 1,540 | 3,975 | 206,659 | 137,494 | ||||||||||||||||
Deferred revenue | 24 | — | — | 36,238 | 26,572 | |||||||||||||||
|
|
|
|
|
|
|
| |||||||||||||
Total current liabilities | 51,656 | 342,114 | 5,098,938 | 6,336,798 | ||||||||||||||||
Non-current liabilities | ||||||||||||||||||||
Loans and hedging instruments | 16 | — | — | 7,010,836 | 6,487,400 | |||||||||||||||
Debentures | 16.g | 1,722,990 | 1,722,450 | 6,263,593 | 6,401,535 | |||||||||||||||
Related parties | 8.a | 5,472 | 5,158 | 4,023 | 4,071 | |||||||||||||||
Deferred income and social contribution taxes | 9.a | — | — | 100,660 | 9,297 | |||||||||||||||
Post-employment benefits | 20.b | — | — | 202,460 | 204,160 | |||||||||||||||
Provision for asset retirement obligation | 21 | — | — | 50,851 | 50,285 | |||||||||||||||
Provision for tax, civil, and labor risks | 22.a; 22.c | 399 | 798 | 848,844 | 865,249 | |||||||||||||||
Leases payable | 13 | — | — | 1,361,245 | 43,217 | |||||||||||||||
Deferred revenue | 24 | — | — | 9,720 | 11,850 | |||||||||||||||
Subscription warrants—indemnification | 25 | 90,567 | 123,095 | 90,567 | 123,095 | |||||||||||||||
Other payables | — | — | 194,913 | 162,409 | ||||||||||||||||
|
|
|
|
|
|
|
| |||||||||||||
Totalnon-current liabilities | 1,819,428 | 1,851,501 | 16,137,712 | 14,362,568 | ||||||||||||||||
Equity | ||||||||||||||||||||
Share capital | 26.a; 26.f | 5,171,752 | 5,171,752 | 5,171,752 | 5,171,752 | |||||||||||||||
Equity instrument granted | 26.b | 7,545 | 4,309 | 7,545 | 4,309 | |||||||||||||||
Capital reserve | 26.d | 542,400 | 542,400 | 542,400 | 542,400 | |||||||||||||||
Treasury shares | 26.c | (485,383 | ) | (485,383 | ) | (485,383 | ) | (485,383 | ) | |||||||||||
Revaluation reserve on subsidiaries | 26.e | 4,615 | 4,712 | 4,615 | 4,712 | |||||||||||||||
Profit reserves | 26.f | 4,099,092 | 4,099,092 | 4,099,092 | 4,099,092 | |||||||||||||||
Retained earnings | 342,542 | — | 342,542 | — | ||||||||||||||||
Valuation adjustments | 26.g.1 | (50,433 | ) | (63,989 | ) | (50,433 | ) | (63,989 | ) | |||||||||||
Cumulative translation adjustments | 26.g.2 | 59,971 | 65,857 | 59,971 | 65,857 | |||||||||||||||
Additional dividends to the minimum mandatory dividends | 26.h | — | 109,355 | — | 109,355 | |||||||||||||||
|
|
|
|
|
|
|
| |||||||||||||
Equity attributable to: | ||||||||||||||||||||
Shareholders of the Company | 9,692,101 | 9,448,105 | 9,692,101 | 9,448,105 | ||||||||||||||||
Non-controlling interests in subsidiaries | — | — | 376,029 | 351,924 | ||||||||||||||||
|
|
|
|
|
|
|
| |||||||||||||
Total equity | 9,692,101 | 9,448,105 | 10,068,130 | 9,800,029 | ||||||||||||||||
|
|
|
|
|
|
|
| |||||||||||||
Total liabilities and equity | 11,563,185 | 11,641,720 | 31,304,780 | 30,499,395 | ||||||||||||||||
|
|
|
|
|
|
|
| |||||||||||||
The accompanying notes are an integral part of the interim financial information.
6
Table of Contents
Ultrapar Participações S.A. and Subsidiaries
Statements of Profit or Loss
For thesix-month period ended June 30, 2019 and 2018
(In thousands of Brazilian Reais, except earnings per share)
| Parent | Consolidated | |||||||||||||||||||
| Note | 06/30/2019 | 06/30/2018 | 06/30/2019 | 06/30/2018 | ||||||||||||||||
Net revenue from sales and services | 27 | — | — | 42,431,898 | 43,396,707 | |||||||||||||||
Cost of products and services sold | 28 | — | — | (39,581,566 | ) | (40,416,361 | ) | |||||||||||||
|
|
|
|
|
|
|
| |||||||||||||
Gross profit | — | — | 2,850,332 | 2,980,346 | ||||||||||||||||
Operating income (expenses) | ||||||||||||||||||||
Selling and marketing | 28 | — | — | (1,375,059 | ) | (1,333,919 | ) | |||||||||||||
General and administrative | 28 | — | — | (799,474 | ) | (770,129 | ) | |||||||||||||
Loss on disposal of property, plant and equipment and intangibles | 29 | — | — | (1,055 | ) | (4,584 | ) | |||||||||||||
Other operating income, net | 30 | 420 | (255 | ) | 46,820 | (227,853 | ) | |||||||||||||
|
|
|
|
|
|
|
| |||||||||||||
Operating income before financial income (expenses) and share of profit (loss) of subsidiaries, joint ventures and associates | 420 | (255 | ) | 721,564 | 643,861 | |||||||||||||||
|
|
|
|
|
|
|
| |||||||||||||
Share of profit (loss) of subsidiaries, joint ventures and associates | 12 | 324,557 | 270,159 | (10,048 | ) | (6,377 | ) | |||||||||||||
|
|
|
|
|
|
|
| |||||||||||||
Operating income before financial income (expenses) and income and social contribution taxes | 324,977 | 269,904 | 711,516 | 637,484 | ||||||||||||||||
Financial income | 31 | 76,339 | 119,137 | 276,288 | 304,599 | |||||||||||||||
Financial expenses | 31 | (59,463 | ) | (49,275 | ) | (367,636 | ) | (475,983 | ) | |||||||||||
|
|
|
|
|
|
|
| |||||||||||||
Financial result, net | 16,876 | 69,862 | (91,348 | ) | (171,384 | ) | ||||||||||||||
|
|
|
|
|
|
|
| |||||||||||||
Income before income and social contribution taxes | 341,853 | 339,766 | 620,168 | 466,100 | ||||||||||||||||
|
|
|
|
|
|
|
| |||||||||||||
Income and social contribution taxes | ||||||||||||||||||||
Current | 9.b; 9c | — | (345 | ) | (259,448 | ) | (140,270 | ) | ||||||||||||
Deferred | 9.b | 409 | (23,977 | ) | 2,566 | (12,310 | ) | |||||||||||||
|
|
|
|
|
|
|
| |||||||||||||
| 409 | (24,322 | ) | (256,882 | ) | (152,580 | ) | ||||||||||||||
Net income for the period | 342,262 | 315,444 | 363,286 | 313,520 | ||||||||||||||||
|
|
|
|
|
|
|
| |||||||||||||
Net income for the period attributable to: | ||||||||||||||||||||
Shareholders of the Company | 342,262 | 315,444 | 342,262 | 315,444 | ||||||||||||||||
Non-controlling interests in subsidiaries | — | — | 21,024 | (1,924 | ) | |||||||||||||||
Earnings per share (based on weighted average number of shares outstanding)—R$ | ||||||||||||||||||||
Basic | 32 | 0.3156 | 0.2910 | 0.3156 | 0.2910 | |||||||||||||||
Diluted | 32 | 0.3136 | 0.2890 | 0.3136 | 0.2890 | |||||||||||||||
The accompanying notes are an integral part of the interim financial information.
7
Table of Contents
Ultrapar Participações S.A. and Subsidiaries
Statements of Profit or Loss
For the three-month period ended June 30, 2019 and 2018
(In thousands of Brazilian Reais, except earnings per share)
| Parent | Consolidated | |||||||||||||||||
| Note | 06/30/2019 | 06/30/2018 | 06/30/2019 | 06/30/2018 | ||||||||||||||
Net revenue from sales and services | 27 | — | — | 21,692,645 | 22,645,585 | |||||||||||||
Cost of products and services sold | 28 | — | — | (20,286,893 | ) | (21,186,536 | ) | |||||||||||
|
|
|
|
|
|
|
| |||||||||||
Gross profit | — | — | 1,405,752 | 1,459,049 | ||||||||||||||
Operating income (expenses) | ||||||||||||||||||
Selling and marketing | 28 | — | — | (696,557 | ) | (662,472 | ) | |||||||||||
General and administrative | 28 | — | — | (415,629 | ) | (397,561 | ) | |||||||||||
Gain (loss) on disposal of property, plant and equipment and intangibles | 29 | — | — | 1,027 | (2,354 | ) | ||||||||||||
Other operating income, net | 30 | (11 | ) | (287 | ) | 10,107 | 34,870 | |||||||||||
|
|
|
|
|
|
|
| |||||||||||
Operating income before financial income (expenses) and share of profit (loss) of subsidiaries, joint ventures and associates | (11 | ) | (287 | ) | 304,700 | 431,532 | ||||||||||||
|
|
|
|
|
|
|
| |||||||||||
Share of profit (loss) of subsidiaries, joint ventures and associates | 12 | 98,860 | 195,669 | (3,078 | ) | (3,396 | ) | |||||||||||
|
|
|
|
|
|
|
| |||||||||||
Operating income before financial income (expenses) and income and social contribution taxes | 98,849 | 195,382 | 301,622 | 428,136 | ||||||||||||||
Financial income | 31 | 35,172 | 99,524 | 132,139 | 192,155 | |||||||||||||
Financial expenses | 31 | (30,318 | ) | (28,762 | ) | (224,315 | ) | (256,574 | ) | |||||||||
|
|
|
|
|
|
|
| |||||||||||
Financial result, net | 4,854 | 70,762 | (92,176 | ) | (64,419 | ) | ||||||||||||
|
|
|
|
|
|
|
| |||||||||||
Income before income and social contribution taxes | 103,703 | 266,144 | 209,446 | 363,717 | ||||||||||||||
|
|
|
|
|
|
|
| |||||||||||
Income and social contribution taxes | ||||||||||||||||||
Current | 9.b; 9c | — | (256 | ) | (120,061 | ) | (18,207 | ) | ||||||||||
Deferred | 9.b | 4,898 | (24,299 | ) | 31,348 | (104,841 | ) | |||||||||||
|
|
|
|
|
|
|
| |||||||||||
| 4,898 | (24,555 | ) | (88,713 | ) | (123,048 | ) | ||||||||||||
Net income for the period | 108,601 | 241,589 | 120,733 | 240,669 | ||||||||||||||
|
|
|
|
|
|
|
| |||||||||||
Net income for the period attributable to: | ||||||||||||||||||
Shareholders of the Company | 108,601 | 241,589 | 108,601 | 241,589 | ||||||||||||||
Non-controlling interests in subsidiaries | — | — | 12,132 | (920 | ) | |||||||||||||
Earnings per share (based on weighted average number of shares outstanding)—R$ | ||||||||||||||||||
Basic | 32 | 0.0948 | 0.2228 | 0.0948 | 0.2228 | |||||||||||||
Diluted | 32 | 0.0942 | 0.2213 | 0.0942 | 0.2213 | |||||||||||||
The accompanying notes are an integral part of the interim financial information.
8
Table of Contents
Ultrapar Participações S.A. and Subsidiaries
Statements of Comprehensive Income
For thesix-month period ended June 30, 2019 and 2018
(In thousands of Brazilian Reais)
| Parent | Consolidated | |||||||||||||||||||
| Note | 06/30/2019 | 06/30/2018 | 06/30/2019 | 06/30/2018 | ||||||||||||||||
Net income for the period | 342,262 | 315,444 | 363,286 | 313,520 | ||||||||||||||||
Items that are subsequently reclassified to profit or loss: | ||||||||||||||||||||
Fair value adjustments of financial instruments of subsidiaries, net | 26.g.1 | 15,685 | (210,532 | ) | 15,706 | (210,532 | ) | |||||||||||||
Fair value adjustments of financial instruments of joint ventures, net | 26.g.1 | (2,367 | ) | 2,547 | (2,367 | ) | 2,547 | |||||||||||||
Cumulative translation adjustments, net of hedge of net investments in foreign operations and income and social contribution taxes | 26.g.2 | (5,886 | ) | 44,388 | (5,886 | ) | 44,388 | |||||||||||||
Items that are not subsequently reclassified to profit or loss: | ||||||||||||||||||||
Actuarial gain (losses) of post-employment benefits of subsidiaries, net | 26.g.1 | 238 | (299 | ) | 238 | (299 | ) | |||||||||||||
|
|
|
|
|
|
|
| |||||||||||||
Total comprehensive income for the period | 349,932 | 151,548 | 370,977 | 149,624 | ||||||||||||||||
|
|
|
|
|
|
|
| |||||||||||||
Total comprehensive income for the period attributable to shareholders of the Company | 349,932 | 151,548 | 349,932 | 151,548 | ||||||||||||||||
Total comprehensive income for the period attributable tonon-controlling interest in subsidiaries | — | — | 21,045 | (1,924 | ) | |||||||||||||||
The accompanying notes are an integral part of the interim financial information.
9
Table of Contents
Ultrapar Participações S.A. and Subsidiaries
Statements of Comprehensive Income
For the three-month period ended June 30, 2019 and 2018
(In thousands of Brazilian Reais)
| Parent | Consolidated | |||||||||||||||||||
| Note | 06/30/2019 | 06/30/2018 | 06/30/2019 | 06/30/2018 | ||||||||||||||||
Net income for the period | 108,601 | 241,589 | 120,733 | 240,669 | ||||||||||||||||
Items that are subsequently reclassified to profit or loss: | ||||||||||||||||||||
Fair value adjustments of financial instruments of subsidiaries, net | 26.g.1 | 21,605 | (198,560 | ) | 21,605 | (198,560 | ) | |||||||||||||
Fair value adjustments of financial instruments of joint ventures, net | 26.g.1 | (2,413 | ) | 1,861 | (2,413 | ) | 1,861 | |||||||||||||
Cumulative translation adjustments, net of hedge of net investments in foreign operations and income and social contribution taxes | 26.g.2 | (10,429 | ) | 63,784 | (10,429 | ) | 63,784 | |||||||||||||
Items that are not subsequently reclassified to profit or loss: | ||||||||||||||||||||
Actuarial gain (losses) of post-employment benefits of subsidiaries, net | 26.g.1 | — | — | — | — | |||||||||||||||
|
|
|
|
|
|
|
| |||||||||||||
Total comprehensive income for the period | 117,364 | 108,674 | 129,496 | 107,754 | ||||||||||||||||
|
|
|
|
|
|
|
| |||||||||||||
Total comprehensive income for the period attributable to shareholders of the Company | 117,364 | 108,674 | 117,364 | 108,674 | ||||||||||||||||
Total comprehensive income for the period attributable tonon-controlling interest in subsidiaries | — | — | 12,132 | (920 | ) | |||||||||||||||
The accompanying notes are an integral part of the interim financial information.
10
Table of Contents
Ultrapar Participações S.A. and Subsidiaries
Statements of Changes in Equity
For thesix-month period ended June 30, 2019 and 2018
(In thousands of Brazilian Reais)
| Profit reserve | Shareholders’ equity attributable to: | |||||||||||||||||||||||||||||||||||||||||||||||||||||||||||
| Note | Share capital | Equity instrument granted | Capital reserve | Treasury shares | Revaluation reserve on subsidiaries | Legal reserve | Investments statutory reserve | Valuation adjustments | Cumulative translation adjustments | Retained earnings | Additional dividends to the minimum mandatory dividends | Shareholders of the Company | Non-controlling interests in subsidiaries | Consolidated shareholders’ equity | ||||||||||||||||||||||||||||||||||||||||||||||
Balance as of December 31, 2018 | 5,171,752 | 4,309 | 542,400 | (485,383 | ) | 4,712 | 686,665 | 3,412,427 | (63,989 | ) | 65,857 | — | 109,355 | 9,448,105 | 351,924 | 9,800,029 | ||||||||||||||||||||||||||||||||||||||||||||
Net income for the period | — | — | — | — | — | — | — | — | — | 342,262 | — | 342,262 | 21,024 | 363,286 | ||||||||||||||||||||||||||||||||||||||||||||||
Other comprehensive income: | ||||||||||||||||||||||||||||||||||||||||||||||||||||||||||||
Fair value adjustments of available for sale, net of income taxes | 26.g.1 | — | — | — | — | — | — | — | 13,318 | — | — | — | 13,318 | 21 | 13,339 | |||||||||||||||||||||||||||||||||||||||||||||
Actuarial gain of post-employment benefits, net of income taxes | 26.g.1 | — | — | — | — | — | — | — | 238 | — | — | — | 238 | — | 238 | |||||||||||||||||||||||||||||||||||||||||||||
Currency translation of foreign subsidiaries, including the effect of net investments hedge | 26.g.2 | — | — | — | — | — | — | — | — | (5,886 | ) | — | — | (5,886 | ) | — | (5,886 | ) | ||||||||||||||||||||||||||||||||||||||||||
|
|
|
|
|
|
|
|
|
|
|
|
|
|
|
|
|
|
|
|
|
|
|
|
|
|
|
| |||||||||||||||||||||||||||||||||
Total comprehensive income for the period | — | — | — | — | — | — | — | 13,556 | (5,886 | ) | 342,262 | — | 349,932 | 21,045 | 370,977 | |||||||||||||||||||||||||||||||||||||||||||||
Shareholder transaction -gain in reimbursement of shares pref. B from Oxiteno Nordeste | 3.b.2 | — | — | — | — | — | — | — | — | — | 208 | — | 208 | (208 | ) | — | ||||||||||||||||||||||||||||||||||||||||||||
Equity instrument granted | 26.b | — | 3,236 | — | — | — | — | — | — | — | — | — | 3,236 | — | 3,236 | |||||||||||||||||||||||||||||||||||||||||||||
Realization of revaluation reserve of subsidiaries | 26.e | — | — | — | — | (97 | ) | — | — | — | — | 97 | — | — | — | — | ||||||||||||||||||||||||||||||||||||||||||||
Income and social contribution taxes on realization of revaluation reserve of subsidiaries | 26.e | — | — | — | — | — | — | — | — | — | (25 | ) | — | (25 | ) | — | (25 | ) | ||||||||||||||||||||||||||||||||||||||||||
Additional dividends attributable tonon-controlling interests | — | — | — | — | — | — | — | — | — | — | — | — | (1,548 | ) | (1,548 | ) | ||||||||||||||||||||||||||||||||||||||||||||
Redemption ofnon-controlling shares of Oxiteno Nordeste | — | — | — | — | — | — | — | — | — | — | — | — | (2,180 | ) | (2,180 | ) | ||||||||||||||||||||||||||||||||||||||||||||
Capital increase from Iconicnon-controlling shareholders | — | — | — | — | — | — | — | — | — | — | — | — | 6,996 | 6,996 | ||||||||||||||||||||||||||||||||||||||||||||||
Approval of additional dividends by the��Shareholders’ Meeting | 26.h | — | — | — | — | — | — | — | — | — | — | (109,355 | ) | (109,355 | ) | — | (109,355 | ) | ||||||||||||||||||||||||||||||||||||||||||
|
|
|
|
|
|
|
|
|
|
|
|
|
|
|
|
|
|
|
|
|
|
|
|
|
|
|
| |||||||||||||||||||||||||||||||||
Balance as of June 30, 2019 | 5,171,752 | 7,545 | 542,400 | (485,383 | ) | 4,615 | 686,665 | 3,412,427 | (50,433 | ) | 59,971 | 342,542 | — | 9,692,101 | 376,029 | 10,068,130 | ||||||||||||||||||||||||||||||||||||||||||||
|
|
|
|
|
|
|
|
|
|
|
|
|
|
|
|
|
|
|
|
|
|
|
|
|
|
|
| |||||||||||||||||||||||||||||||||
The accompanying notes are an integral part of the interim financial information.
11
Table of Contents
Ultrapar Participações S.A. and Subsidiaries
Statements of Changes in Equity
For thesix-month period ended June 30, 2019 and 2018
(In thousands of Brazilian Reais)
| Profit reserve | Shareholders’ equity attributable to: | |||||||||||||||||||||||||||||||||||||||||||||||||||||||||
| Note | Share capital | Equity instrument granted | Capital reserve | Treasury shares | Revaluation reserve on subsidiaries | Legal reserve | Investments statutory reserve | Valuation adjustments | Cumulative translation adjustments | Retained earnings | Additional dividends to the minimum mandatory dividends | Shareholders of the Company | Non-controlling interests in subsidiaries | Consolidated shareholders’ equity | ||||||||||||||||||||||||||||||||||||||||||||
Balance as of December 31, 2017 | 5,171,752 | 536 | 549,778 | (482,260 | ) | 4,930 | 629,144 | 3,000,707 | 159,643 | 53,061 | — | 163,742 | 9,251,033 | 339,288 | 9,590,321 | |||||||||||||||||||||||||||||||||||||||||||
Retrospective effect of business combination of Chevron | 26.g.1 | — | — | — | — | — | — | — | (4,819 | ) | — | — | — | (4,819 | ) | 38,536 | 33,717 | |||||||||||||||||||||||||||||||||||||||||
|
|
|
|
|
|
|
|
|
|
|
|
|
|
|
|
|
|
|
|
|
|
|
|
|
|
|
| |||||||||||||||||||||||||||||||
Balance as of December 31, 2017—restated | 5,171,752 | 536 | 549,778 | (482,260 | ) | 4,930 | 629,144 | 3,000,707 | 154,824 | 53,061 | — | 163,742 | 9,246,214 | 377,824 | 9,624,038 | |||||||||||||||||||||||||||||||||||||||||||
Net income for the period | — | — | — | — | — | — | — | — | — | 315,444 | — | 315,444 | (1,924 | ) | 313,520 | |||||||||||||||||||||||||||||||||||||||||||
Other comprehensive income: | ||||||||||||||||||||||||||||||||||||||||||||||||||||||||||
Fair value adjustments of available for sale, net of income taxes | 26.g.1 | — | — | — | — | — | — | — | (207,985 | ) | — | — | — | (207,985 | ) | — | (207,985 | ) | ||||||||||||||||||||||||||||||||||||||||
Actuarial losses of post-employment benefits, net of income taxes | 26.g.1 | — | — | — | — | — | — | — | (299 | ) | — | — | — | (299 | ) | — | (299 | ) | ||||||||||||||||||||||||||||||||||||||||
Currency translation of foreign subsidiaries, including the effect of net investments hedge | 26.g.2 | — | — | — | — | — | — | — | — | 44,388 | — | — | 44,388 | — | 44,388 | |||||||||||||||||||||||||||||||||||||||||||
|
|
|
|
|
|
|
|
|
|
|
|
|
|
|
|
|
|
|
|
|
|
|
|
|
|
|
| |||||||||||||||||||||||||||||||
Total comprehensive income for the period | — | — | — | — | — | — | — | (208,284 | ) | 44,388 | 315,444 | — | 151,548 | (1,924 | ) | 149,624 | ||||||||||||||||||||||||||||||||||||||||||
Equity instrument granted | 26.b | — | 1,644 | — | — | — | — | — | — | — | — | — | 1,644 | — | 1,644 | |||||||||||||||||||||||||||||||||||||||||||
Stock plan | — | — | (4,382 | ) | (1,825 | ) | — | — | — | — | — | — | — | (6,207 | ) | (6,207 | ) | |||||||||||||||||||||||||||||||||||||||||
Realization of revaluation reserve of subsidiaries | 26.e | — | — | — | — | (117 | ) | — | — | — | — | 117 | — | — | — | — | ||||||||||||||||||||||||||||||||||||||||||
Income and social contribution taxes on realization of revaluation reserve of subsidiaries | 26.e | — | — | — | — | — | — | — | — | — | (2 | ) | — | (2 | ) | — | (2 | ) | ||||||||||||||||||||||||||||||||||||||||
Additional dividends attributable tonon-controlling interests | — | — | — | — | — | — | — | — | — | — | — | — | (3,929 | ) | (3,929 | ) | ||||||||||||||||||||||||||||||||||||||||||
Approval of additional dividends by the Shareholders’ Meeting | 26.h | — | — | — | — | — | — | — | — | — | — | (163,742 | ) | (163,742 | ) | — | (163,742 | ) | ||||||||||||||||||||||||||||||||||||||||
|
|
|
|
|
|
|
|
|
|
|
|
|
|
|
|
|
|
|
|
|
|
|
|
|
|
|
| |||||||||||||||||||||||||||||||
Balance as of June 30, 2018—restated | 5,171,752 | 2,180 | 545,396 | (484,085 | ) | 4,813 | 629,144 | 3,000,707 | (53,460 | ) | 97,449 | 315,559 | — | 9,229,455 | 371,971 | 9,601,426 | ||||||||||||||||||||||||||||||||||||||||||
|
|
|
|
|
|
|
|
|
|
|
|
|
|
|
|
|
|
|
|
|
|
|
|
|
|
|
| |||||||||||||||||||||||||||||||
The accompanying notes are an integral part of the interim financial information.
12
Table of Contents
Ultrapar Participações S.A. and Subsidiaries
Statements of Cash Flows—Indirect Method
For thesix-month period ended June 30, 2019 and 2018
(In thousands of Brazilian Reais)
| Parent | Consolidated | |||||||||||||||||||
| Note | 06/30/2019 | 06/30/2018 | 06/30/2019 | 06/30/2018 | ||||||||||||||||
Cash flows from operating activities | ||||||||||||||||||||
Net income for the period | 342,262 | 315,444 | 363,286 | 313,520 | ||||||||||||||||
Adjustments to reconcile net income to cash provided by operating activities | ||||||||||||||||||||
Share of loss (profit) of subsidiaries, joint ventures and associates | 12 | (324,557 | ) | (270,159 | ) | 10,048 | 6,377 | |||||||||||||
Amortization of contractual assets with customers—exclusive rights | 11 | — | — | 177,818 | 196,680 | |||||||||||||||
Amortization of right to use assets | 13 | — | — | 153,257 | — | |||||||||||||||
Depreciation and amortization | 14;15 | — | — | 416,867 | 392,030 | |||||||||||||||
PIS and COFINS credits on depreciation | 14;15 | — | — | 7,330 | 8,079 | |||||||||||||||
Interest and foreign exchange rate variations | (2,755 | ) | (27,625 | ) | 547,849 | 523,658 | ||||||||||||||
Deferred income and social contribution taxes | 9.b | (409 | ) | 23,977 | (2,566 | ) | 12,310 | |||||||||||||
Loss on disposal of property, plant, and equipment and intangibles | 29 | — | — | 1,055 | 4,584 | |||||||||||||||
Estimated losses on doubtful accounts | 5 | — | — | 65,637 | 49,299 | |||||||||||||||
Provision for losses in inventories | 6 | — | — | 13,276 | 965 | |||||||||||||||
Provision for post-employment benefits | 20.b | — | — | (3,299 | ) | 8,878 | ||||||||||||||
Equity instrument granted | — | — | 3,237 | 1,644 | ||||||||||||||||
Other provisions and adjustments | (4 | ) | 3 | 2,449 | (1,960 | ) | ||||||||||||||
|
|
|
|
|
|
|
| |||||||||||||
| 14,537 | 41,640 | 1,756,244 | 1,516,064 | |||||||||||||||||
(Increase) decrease in current assets | ||||||||||||||||||||
Trade receivables and reseller financing | 5 | — | — | 155,421 | (305,592 | ) | ||||||||||||||
Inventories | 6 | — | — | 77,310 | 439,281 | |||||||||||||||
Recoverable taxes | 7 | 4,240 | (6,912 | ) | (138,899 | ) | (80,258 | ) | ||||||||||||
Dividends received from subsidiaries and joint-ventures | 1,303,209 | 504,934 | 3,729 | 37,515 | ||||||||||||||||
Insurance and other receivables | (1,769 | ) | (683 | ) | (28,242 | ) | (64,347 | ) | ||||||||||||
Prepaid expenses | 10 | (111 | ) | (6 | ) | (13,617 | ) | (5,146 | ) | |||||||||||
Contractual assets with customers—exclusive rights | 11 | — | — | — | (14,871 | ) | ||||||||||||||
Increase (decrease) in current liabilities | ||||||||||||||||||||
Trade payables | 17 | 181 | (378 | ) | (225,368 | ) | (504,503 | ) | ||||||||||||
Salaries and related charges | 18 | 700 | (9 | ) | (58,869 | ) | (44,111 | ) | ||||||||||||
Taxes payable | 19 | (10,970 | ) | 415 | (38,782 | ) | 35,906 | |||||||||||||
Income and social contribution taxes | (9,238 | ) | — | 122,922 | 24,929 | |||||||||||||||
Post-employment benefits | 20.b | — | — | (2,497 | ) | — | ||||||||||||||
Provision for tax, civil, and labor risks | 22.a | — | — | 13,594 | (3,661 | ) | ||||||||||||||
Insurance and other payables | (2,433 | ) | (7,439 | ) | 64,399 | (61,605 | ) | |||||||||||||
Deferred revenue | 24 | — | — | 9,666 | (663 | ) | ||||||||||||||
(Increase) decrease innon-current assets | ||||||||||||||||||||
Trade receivables and reseller financing | 5 | — | — | 54,730 | (20,829 | ) | ||||||||||||||
Recoverable taxes | 7 | 9,238 | — | 15,392 | (90,470 | ) | ||||||||||||||
Escrow deposits | — | 148 | (31,044 | ) | (16,504 | ) | ||||||||||||||
Other receivables | — | — | (14 | ) | 5,799 | |||||||||||||||
Prepaid expenses | 10 | 5 | (35 | ) | (18,463 | ) | (25,535 | ) | ||||||||||||
Contractual assets with customers—exclusive rights | 11 | — | — | — | 14,260 | |||||||||||||||
Increase (decrease) innon-current liabilities | ||||||||||||||||||||
Post-employment benefits | 20.b | — | — | 1,838 | 1,693 | |||||||||||||||
Provision for tax, civil, and labor risks | 22.a; 22.c | (399 | ) | — | (16,405 | ) | 10,108 | |||||||||||||
Other payables | 314 | — | 32,500 | 39,888 | ||||||||||||||||
Deferred revenue | 24 | — | — | (2,129 | ) | (192 | ) | |||||||||||||
Payments of contractual assets with customers—exclusive rights | 11 | — | — | (126,334 | ) | (177,008 | ) | |||||||||||||
Income and social contribution taxes paid | — | — | (79,836 | ) | (80,573 | ) | ||||||||||||||
|
|
|
|
|
|
|
| |||||||||||||
Net cash provided by (used in) operating activities | 1,307,504 | 531,675 | 1,527,246 | 629,575 | ||||||||||||||||
|
|
|
|
|
|
|
| |||||||||||||
The accompanying notes are an integral part of the interim financial information.
13
Table of Contents
Ultrapar Participações S.A. and Subsidiaries
Statements of Cash Flows—Indirect Method
For the six-month period ended June 30, 2019 and 2018
(In thousands of Brazilian Reais)
| Parent | Consolidated | |||||||||||||||||||
| Note | 06/30/2019 | 06/30/2018 | 06/30/2019 | 06/30/2018 | ||||||||||||||||
Cash flows from investing activities | ||||||||||||||||||||
Financial investments, net of redemptions | 446,681 | (557,834 | ) | (488,278 | ) | (794,682 | ) | |||||||||||||
Cash and cash equivalents of subsidiary acquired | 3.c | — | — | — | 3,662 | |||||||||||||||
Acquisition of property, plant, and equipment | 14 | — | — | (424,798 | ) | (575,436 | ) | |||||||||||||
Acquisition of intangible assets | 15 | — | — | (47,088 | ) | (125,317 | ) | |||||||||||||
Acquisition of companies | 3.c | — | — | — | (103,373 | ) | ||||||||||||||
Capital increase in subsidiary | 12.a | (1,450,000 | ) | — | — | — | ||||||||||||||
Capital increase in joint ventures | 12.b | — | — | (8,750 | ) | (16,000 | ) | |||||||||||||
Capital reduction in associates | 12.c | — | — | — | 1,250 | |||||||||||||||
Proceeds from disposal of property, plant, and equipment and intangibles | 29 | 662 | — | 15,312 | 10,884 | |||||||||||||||
|
|
|
|
|
|
|
| |||||||||||||
Net cash used in investing activities | (1,002,657 | ) | (557,834 | ) | (953,602 | ) | (1,599,012 | ) | ||||||||||||
|
|
|
|
|
|
|
| |||||||||||||
Cash flows from financing activities | ||||||||||||||||||||
Loans and debentures | ||||||||||||||||||||
Proceeds | 16 | — | 1,721,596 | 1,997,984 | 2,219,826 | |||||||||||||||
Repayments | 16 | — | (800,000 | ) | (2,063,895 | ) | (1,543,952 | ) | ||||||||||||
Interest paid | 16 | (55,385 | ) | (29,811 | ) | (1,003,282 | ) | (307,082 | ) | |||||||||||
Payments of lease | 13 | — | — | (155,148 | ) | (2,558 | ) | |||||||||||||
Dividends paid | 26.h | (378,469 | ) | (486,603 | ) | (380,573 | ) | (488,055 | ) | |||||||||||
Redemption ofnon-controlling shares of Oxiteno Nordeste | 3.b.2 | — | — | (2,180 | ) | — | ||||||||||||||
Capital increase from Iconicnon-controlling shareholders | — | — | 6,996 | — | ||||||||||||||||
Related parties | 8.a | 26,575 | 2,306 | (48 | ) | (46 | ) | |||||||||||||
|
|
|
|
|
|
|
| |||||||||||||
Net cash provided by (used in) financing activities | (407,279 | ) | 407,488 | (1,600,146 | ) | (121,867 | ) | |||||||||||||
|
|
|
|
|
|
|
| |||||||||||||
Effect of exchange rate changes on cash and cash equivalents in foreign currency | — | — | (3,147 | ) | 29,663 | |||||||||||||||
|
|
|
|
|
|
|
| |||||||||||||
Increase (decrease) in cash and cash equivalents | (102,432 | ) | 381,329 | (1,029,649 | ) | (1,061,641 | ) | |||||||||||||
|
|
|
|
|
|
|
| |||||||||||||
Cash and cash equivalents at the beginning of the period | 4 | 172,315 | 93,174 | 3,938,951 | 5,002,004 | |||||||||||||||
Cash and cash equivalents at the end of the period | 4 | 69,883 | 474,503 | 2,909,302 | 3,940,363 | |||||||||||||||
Transactions without cash effect: | ||||||||||||||||||||
Addition on right to use assets and leases payable | 13 | — | — | 257,021 | — | |||||||||||||||
The accompanying notes are an integral part of the interim financial information.
14
Table of Contents
Ultrapar Participações S.A. and Subsidiaries
Statements of Value Added
For thesix-month period ended June 30, 2019 and 2018
(In thousands of Brazilian Reais, except percentages)
| Parent | Consolidated | |||||||||||||||||||||||||||||||||||
| Note | 06/30/2019 | % | 06/30/2018 | % | 06/30/2019 | % | 06/30/2018 | % | ||||||||||||||||||||||||||||
Revenue | ||||||||||||||||||||||||||||||||||||
Gross revenue from sales and services, except rents and royalties | 27 | — | — | 45,179,967 | 45,271,365 | |||||||||||||||||||||||||||||||
Rebates, discounts, and returns | 27 | — | — | (756,582 | ) | (507,020 | ) | |||||||||||||||||||||||||||||
Estimated losses on doubtful accounts—allowance | — | — | (65,640 | ) | (49,299 | ) | ||||||||||||||||||||||||||||||
Amortization of contractual assets with customers—exclusive rights | 11 | — | — | (177,818 | ) | (196,680 | ) | |||||||||||||||||||||||||||||
Gain (loss) on disposal of property, plant, and equipment and intangibles and other operating income, net | 29;30 | — | — | 45,765 | (232,437 | ) | ||||||||||||||||||||||||||||||
|
|
|
|
|
|
|
| |||||||||||||||||||||||||||||
| — | — | 44,225,692 | 44,285,929 | |||||||||||||||||||||||||||||||||
Materials purchased from third parties | ||||||||||||||||||||||||||||||||||||
Raw materials used | — | — | (2,849,922 | ) | (2,995,333 | ) | ||||||||||||||||||||||||||||||
Cost of goods, products, and services sold | — | — | (36,838,490 | ) | (37,312,066 | ) | ||||||||||||||||||||||||||||||
Third-party materials, energy, services, and others | 4,848 | 3,600 | (1,289,611 | ) | (897,374 | ) | ||||||||||||||||||||||||||||||
Provisions for losses of assets | — | — | (9,361 | ) | (4,795 | ) | ||||||||||||||||||||||||||||||
|
|
|
|
|
|
|
| |||||||||||||||||||||||||||||
| 4,848 | 3,600 | (40,987,384 | ) | (41,209,568 | ) | |||||||||||||||||||||||||||||||
Gross value added | 4,848 | 3,600 | 3,238,308 | 3,076,361 | ||||||||||||||||||||||||||||||||
|
|
|
|
|
|
|
| |||||||||||||||||||||||||||||
Deductions | ||||||||||||||||||||||||||||||||||||
Depreciation and amortization | 14;15 | — | — | (570,124 | ) | (392,030 | ) | |||||||||||||||||||||||||||||
PIS and COFINS credits on depreciation | 14;15 | — | — | (7,330 | ) | (8,079 | ) | |||||||||||||||||||||||||||||
|
|
|
|
|
|
|
| |||||||||||||||||||||||||||||
| — | — | (577,454 | ) | (400,109 | ) | |||||||||||||||||||||||||||||||
Net value added by the Company | 4,848 | 3,600 | 2,660,854 | 2,676,252 | ||||||||||||||||||||||||||||||||
|
|
|
|
|
|
|
| |||||||||||||||||||||||||||||
Value added received in transfer | ||||||||||||||||||||||||||||||||||||
Share of profit (loss) of subsidiaries, joint-ventures, and associates | 12 | 324,557 | 270,159 | (10,048 | ) | (6,377 | ) | |||||||||||||||||||||||||||||
Rents and royalties | 27 | — | 67,824 | 70,393 | ||||||||||||||||||||||||||||||||
Financial income | 31 | 76,339 | 119,137 | 276,288 | 304,599 | |||||||||||||||||||||||||||||||
|
|
|
|
|
|
|
| |||||||||||||||||||||||||||||
| 400,896 | 389,296 | 334,064 | 368,615 | |||||||||||||||||||||||||||||||||
Total value added available for distribution | 405,744 | 392,896 | 2,994,918 | 3,044,867 | ||||||||||||||||||||||||||||||||
|
|
|
|
|
|
|
| |||||||||||||||||||||||||||||
Distribution of value added | ||||||||||||||||||||||||||||||||||||
Labor and benefits | 3,539 | 1 | 3,191 | 1 | 1,072,128 | 36 | 1,079,143 | 35 | ||||||||||||||||||||||||||||
Taxes, fees, and contributions | 2,248 | 1 | 26,521 | 7 | 1,204,467 | 40 | 1,056,730 | 35 | ||||||||||||||||||||||||||||
Financial expenses and rents | 57,695 | 14 | 47,740 | 12 | 355,037 | 12 | 595,474 | 20 | ||||||||||||||||||||||||||||
Retained earnings | 342,262 | 84 | 315,444 | 80 | 363,286 | 12 | 313,520 | 10 | ||||||||||||||||||||||||||||
|
|
|
|
|
|
|
|
|
|
|
|
|
|
|
| |||||||||||||||||||||
Value added distributed | 405,744 | 100 | 392,896 | 100 | 2,994,918 | 100 | 3,044,867 | 100 | ||||||||||||||||||||||||||||
|
|
|
|
|
|
|
|
|
|
|
|
|
|
|
| |||||||||||||||||||||
The accompanying notes are an integral part of the interim financial information.
15
Table of Contents
Ultrapar Participações S.A. and Subsidiaries
Notes to the Parent and Consolidated Interim financial information
(In thousands of Brazilian Reais, unless otherwise stated)
| 1. | Operations |
Ultrapar Participações S.A. (“Ultrapar” or “Company”) is a publicly-traded company headquartered at the Brigadeiro Luis Antônio Avenue, 1343 in the city of São Paulo—SP, Brazil, listed on B3 S.A.—Brasil, Bolsa, Balcão (“B3”), in the Novo Mercado listing segment under the ticker “UGPA3” and on the New York Stock Exchange (“NYSE”) in the form of level III American Depositary Receipts (“ADRs”) under the ticker “UGP”.
The Company engages in the investment of its own capital in services, commercial, and industrial activities, through the subscription or acquisition of shares of other companies. Through its subsidiaries, it operates in the segments of liquefied petroleum gas—LPG distribution (“Ultragaz”), fuel distribution and related businesses (“Ipiranga”), production and marketing of chemicals (“Oxiteno”), and storage services for liquid bulk (“Ultracargo”) and retail distribution of pharmaceutical, hygiene, beauty, and skincare products (“Extrafarma”). The information about segments are disclosed in Note 33.
| 2. | Presentation of Interim Financial Information and Summary of Significant Accounting Policies |
The Company’s parent and consolidated interim financial information (“interim financial information”) were prepared in accordance with the International Accounting Standard (“IAS”) 34—Interim Financial Reporting issued by the International Accounting Standards Board (“IASB”) and in accordance with the pronouncement CPC 21 (R1) issued by the Accounting Pronouncements Committee (“CPC”) and approved by the Brazilian Securities and Exchange Commission (“CVM”).
All relevant specific information of the interim financial information, and only this information, were presented and correspond to that used by the Company’s and its subsidiaries’ Management.
The presentation currency of the Company’s interim financial information is the Brazilian Real (“R$”), which is the Company’s functional currency.
The Company and its subsidiaries applied the accounting policies described below in a consistent manner for all periods presented in this interim financial information, except for the adoption of International Financial Reporting Standards (“IFRS”) 16/CPC 06 (R2), as of January 1, 2019 as described in Note 2.h and y.
| a. | Recognition of Revenue |
Revenue of sales and services rendered is measured at the value of the consideration that the Company’s subsidiaries expect to be entitled to, net of sales returns, discounts, amortization of contractual assets with customers and other deductions, if applicable, being recognized as the entity fulfills its performance obligation. At Ipiranga, the revenue from sales of fuels and lubricants is recognized when the products are delivered to gas stations and to large consumers. At Ultragaz, revenue from sales of LPG is recognized when the products are delivered to customers at home, to independent dealers and to industrial and commercial customers. At Extrafarma, the revenue from sales of pharmaceuticals is recognized when the products are delivered to end user customers in own drugstores and when the products are delivered to independent resellers. At Oxiteno, the revenue from sales of chemical products is recognized when the products are delivered to industrial customers, depending of the freight mode of delivery. At Ultracargo, the revenue provided from storage services is recognized as services are performed. The breakdowns of revenues from sales and services are shown in Notes 27 and 33.
Amortization of contractual assets with customers for the exclusive rights in Ipiranga’s reseller service stations and the bonuses paid in performance obligation sales are recognized in the income statement as a deduction of the revenue from sale according to the conditions established in the agreements which is reviewed as per the changes occurred in the agreements (see Notes 2.f and 11).
The am/pm franchising upfront fee received by Ipiranga is deferred and recognized in profit or loss on the straight-line accrual basis throughout the terms of the agreements with the franchisees. For more information, see Note 24.a.
16
Table of Contents
Ultrapar Participações S.A. and Subsidiaries
Notes to the Parent and Consolidated Interim financial information
(In thousands of Brazilian Reais, unless otherwise stated)
Deferred revenue from loyalty program is recognized in the income statement when the points are redeemed, on which occasion the costs incurred are also recognized in profit or loss. Deferred revenue of unredeemed points is also recognized in profit or loss when points expire. For more information, see Note 24.b.
Costs of products sold and services provided include goods (mainly fuels, lubricants, LPG, and pharmaceutical products), raw materials (chemicals and petrochemicals) and production, distribution, storage, and filling costs.
Exchange variations and the results of derivative financial instruments are presented in the statement of profit and loss on financial expenses.
Research and development expenses are recognized in the statements of profit or loss and amounted to R$ 30,654 for thesix-month period ended June 30, 2019 (R$ 23,987 for thesix-month period ended June 30, 2018).
| b. | Cash and Cash Equivalents |
Includes cash, banks deposits, and short-term, highly-liquid investments that are readily convertible into a known amount of cash and are subject to an insignificant risk of change in value. For further information on cash and cash equivalents of the Company and its subsidiaries, see Note 4.a.
| c. | Financial Assets |
The Company and its subsidiaries evaluated the classification and measurement of financial assets based on its business model of financial assets as follows:
| • | Amortized cost: financial assets held in order to collect contractual cash flows, solely principal and interest. The interest earned and the foreign currency exchange variation are recognized in profit or loss, and balances are stated at acquisition cost plus the interest earned, using the effective interest rate method. Financial investments in guarantee of loans are classified as amortized cost. |
| • | Measured at fair value through other comprehensive income: financial assets that are acquired or originated for the purpose of collecting contractual cash flows or selling financial assets. The balances are stated at fair value, and the interest earned, and the foreign currency exchange variation are recognized in profit or loss. Differences between fair value and initial amount of financial investments plus the interest earned are recognized in equity in other comprehensive income in the “Valuation adjustments”. Accumulated gains and losses recognized in equity are reclassified to profit or loss at the time of their settlement. Substantially the financial investments in Bank Certificates of Deposit (“CDB”) and repurchase agreements are classified as measured at fair value through other comprehensive income. |
| • | Measured at fair value through profit or loss: financial assets that were not classified as amortized cost or measured at fair value through other comprehensive income. The balances are stated at fair value and both the interest earned and the exchange variations and changes in fair value are recognized in the income statement. Investment funds and derivatives are classified as measured at fair value through profit or loss. |
The Company and its subsidiaries use financial instruments for hedging purposes, applying the concepts described below:
| • | Hedge accounting—fair value hedge: financial instruments used to hedge exposure to changes in the fair value of an item, attributable to a particular risk, which can affect the entity’s statements of profit or loss. In the initial designation of the fair value hedge, the relationship between the hedging instrument and the hedged item is documented, including the objectives of risk management, the strategy in conducting the transaction, and the methods to be used to evaluate its effectiveness. Once the fair value hedge has been qualified as effective, the hedge item is also measured at fair value. Gains and losses from hedge instruments and hedge items are recognized in the statements of profit or loss. The hedge accounting must be discontinued when the hedge becomes ineffective. |
17
Table of Contents
Ultrapar Participações S.A. and Subsidiaries
Notes to the Parent and Consolidated Interim financial information
(In thousands of Brazilian Reais, unless otherwise stated)
| • | Hedge accounting—cash flow hedge: financial instruments used to hedge the exposure to variability in cash flows that is attributable to a risk associated with an asset or liability or highly probable transaction or firm commitment that may affect the statements of profit or loss. The portion of the gain or loss on the hedging instrument that is determined to be effective relating to the effects of exchange rate effect, is recognized directly in equity in accumulated other comprehensive income as “Valuation adjustments” while the ineffective portion is recognized in the statements of profit or loss. Gains or losses on the hedging instrument relating to the effective portion of this hedge that had been recognized directly in accumulated other comprehensive income shall be recognized in profit or loss in the period in which the hedged item is recognized in profit or loss or as initial cost ofnon- financial assets, in the same line of the statement that the hedged item is recognized. The hedge accounting shall be discontinued when (i) the hedging relationship is canceled; (ii) the hedging instrument expires; and (iii) the hedging instrument no longer qualifies for hedge accounting. When hedge accounting is discontinued, gains and losses recognized in equity in other comprehensive income are reclassified to the statements of profit or loss in the period which the hedged item is recognized in profit or loss. If the transaction hedged is canceled or is not expected to occur, the cumulative gains and losses in equity in other comprehensive income shall be recognized immediately in profit or loss. |
| • | Hedge accounting—hedge of net investments in foreign operation: financial instruments used to hedge exposure on net investments in foreign subsidiaries due to the fact that the local functional currency is different from the functional currency of the Company. The portion of the gain or loss on the hedging instrument that is determined to be effective, referring to the exchange rate effect, is recognized directly in equity in accumulated other comprehensive income as cumulative translation adjustments, while the ineffective portion and the operating costs are recognized in the statements of profit or loss. The gain or loss on the hedging instrument that has been recognized directly in accumulated other comprehensive income shall be recognized in the statements of profit or loss when the disposal of the foreign subsidiary occurs. |
For further information on financial instruments, see Note 34.
| d. | Trade Receivables and Reseller Financing |
Trade receivables are recognized at the amount invoiced of the counterparty that the Company subsidiaries are entitled (see Notes 5 and 34.d.3). The estimated losses take into account, (i) at the initial recognition of the contract, the expected losses for the next 12 months or (ii) for the lifetime of the contract when the deterioration or improvement of the customers’ credit quality, considering the customers’ characteristics in each business segment. The amount of the expected credit losses is deemed by management to be sufficient to cover any probable loss on realization of trade receivables.
| e. | Inventories |
Inventories are stated at the lower of acquisition cost or net realizable value (see Note 6). The cost value of inventory is measured using the weighted average cost and includes the costs of acquisition and processing directly and indirectly related to the units produced based on the normal capacity of production. Estimates of net realizable value are based on the average selling prices at the end of the reporting period, net of applicable direct selling expenses. Subsequent events related to the fluctuation of prices and costs are also considered, if relevant. If net realizable values are below inventory costs, a provision corresponding to this difference is recognized. Provisions are also made for obsolescence of products, materials, or supplies that (i) do not meet its subsidiaries’ specifications, (ii) have exceeded their expiration date, or (iii) are considered slow-moving inventory. This classification is made by management with the support of its industrial and operations teams.
| f. | Contractual assets with customers—exclusive rights |
Exclusive rights disbursements as provided in Ipiranga’s agreements with reseller service stations and major consumers are recognized as contractual assets when paid and amortized according to the conditions established in the agreements (see Note 2.a and 11).
18
Table of Contents
Ultrapar Participações S.A. and Subsidiaries
Notes to the Parent and Consolidated Interim financial information
(In thousands of Brazilian Reais, unless otherwise stated)
| g. | Investments |
Investments in subsidiaries are accounted for under the equity method of accounting in the interim financial information of the parent company (see Notes 3.b and 12.a). A subsidiary is an investee in which the investor is entitled to variable returns on investment and has the ability to interfere in its financial and operational activities. Usually the equity interest in a subsidiary is more than 50%.
Investments in associates and joint ventures are accounted for under the equity method of accounting in the interim financial information (see Note 12 items b and c). An associate is an investment, in which an investor has significant influence, that is, has the power to participate in the financial and operating decisions of the investee but does not exercise control. A joint venture is an investment in which the shareholders have the right to net assets on behalf of a joint control. Joint control is the agreement, which establish that decisions about the relevant activities of the investee require the consent from the parties that share control.
Other investments are stated at acquisition cost less provision for losses, unless the loss is considered temporary.
| h. | Right to Use Assets and Lease |
The subsidiaries of the Company recognized in the financial position, a right to use assets and the respective lease liabilities initially measured at the present value of future lease payments, considering the related contract costs (see Note 13). The amortization expenses of right to use assets is recognized in statement of profit or loss over the lease contract term. The liability is increased for interest and net of payments. The charges are recognized in the statement of profit or loss using the effective interest rate method. The remeasurement of assets and liabilities based on the contractual index is recognized in the financial position, not having an effect in the result. In case of cancellation of the contract, the assets and respective liabilities are written off to the result.
The subsidiaries of the Company apply the exemptions for recognition of short-term leases of 12 months or less, and leases of low amount assets such. In these cases, the recognition of the lease expense in the statements of profit or loss is on a straight-line basis.
| i. | Property, Plant, and Equipment |
Property, plant, and equipment (“PP&E”) is recognized at acquisition or construction cost, including financial charges incurred on PP&E under construction, as well as qualifying maintenance costs resulting from scheduled plant outages and estimated costs to remove, to decommission, or to restore assets (see Notes 2.n and 21), less accumulated depreciation and, when applicable, less provision for losses (see Note 14).
Depreciation is calculated using the straight-line method, over the periods mentioned in Note 14, taking into account the estimated useful lives of the assets, which are reviewed annually.
Leasehold improvements are depreciated over the shorter of the lease contract term and useful life of the property.
| j. | Intangible Assets |
Intangible assets include assets acquired by the Company and its subsidiaries from third parties, according to the criteria below:
| • | Goodwill is shown as intangible assets corresponding to the positive difference between the amount paid or payable to the seller and the fair value of the identified assets and liabilities assumed of the acquired entity. Goodwill is tested annually for impairment. Goodwill is allocated to the business segments, which represent the lowest level that goodwill is monitored for impairment testing purposes (see Note 15.a). |
| • | Other intangible assets acquired from third parties, such as software, technology, and commercial property rights, are measured at the total acquisition cost and amortized using straight-line method, over the periods mentioned in Note 15, taking into account their useful lives, which are reviewed annually. |
19
Table of Contents
Ultrapar Participações S.A. and Subsidiaries
Notes to the Parent and Consolidated Interim financial information
(In thousands of Brazilian Reais, unless otherwise stated)
The Company and its subsidiaries have not recognized intangible assets that were generated internally. The Company and its subsidiaries have goodwill and brands acquired in business combinations, which are evaluated as intangible assets with indefinite useful life (see Note 15 items a and e).
| k. | Other Assets |
Other assets are stated at the lower of cost and realizable value, including, if applicable, interest earned, monetary changes and changes in exchange rates incurred or less a provision for loss and, if applicable, adjustment to present value.
| l. | Financial Liabilities |
The financial liabilities include trade payables and other payables, loans, debentures, leases payable and derivative financial instruments. Financial liabilities are classified as “financial liabilities at fair value through profit or loss” or “financial liabilities at amortized cost”. The financial liabilities at fair value through profit or loss refer to derivative financial instruments, subscription warrants—indemnification, and financial liabilities designated as hedged items in a fair value hedge relationship upon initial recognition (see Note 2.c—Fair Value Hedge). The financial liabilities at amortized cost are stated at the initial transaction amount plus related charges and net of amortization and transaction costs. The charges are recognized in the statement of profit or loss using the effective interest rate method.
Transaction costs incurred and directly attributable to the activities necessary for contracting loans or for issuing bonds, as well as premiums and discounts upon issuance of debentures and other debt, are allocated to the instrument and amortized in the statement of profit or loss over its term, using the effective interest rate method (see Note 16. h).
| m. | Income and Social Contribution Taxes on Income |
Current and deferred income tax (“IRPJ”) and social contribution on net income tax (“CSLL”) are calculated based on their current rates. For the calculation of current IRPJ, the value of tax incentives is also considered. Taxes are recognized based on the rates of IRPJ and CSLL provided for by the laws enacted on the last day of the interim financial information. The current rates in Brazil are 25% for IRPJ and 9% for CSLL. For further information about recognition and realization of IRPJ and CSLL, see Note 9.
For purposes of disclosure, deferred tax assets were offset against the deferred tax liability, IRPJ and CSLL, in the same taxable entity and the same tax authority.
| n. | Provision for Asset Retirement Obligation—Fuel Tanks |
The subsidiary Ipiranga has the legal obligation to remove the underground fuel tanks located at Ipiranga-branded service stations after a certain period. The estimated cost of the obligation to remove these fuel tanks is recognized as a liability when the tanks are installed. The estimated cost is recognized in PP&E and depreciated over the respective useful lives of the tanks. The amounts recognized as a liability accrue interest using the National Consumer Price Index (“IPCA”) until the tank is removed (see Note 21). The estimated removal cost is reviewed and updated annually or when there is significant change in its amount and change in the estimated costs are recognized in statements of profit or loss when they become known. An increase in the estimated cost of the obligation to remove the tanks could result in negative impact in future results.
20
Table of Contents
Ultrapar Participações S.A. and Subsidiaries
Notes to the Parent and Consolidated Interim financial information
(In thousands of Brazilian Reais, unless otherwise stated)
| o. | Provisions for Tax, Civil, and Labor Risks |
A provision for tax, civil and labor risks is recognized for quantifiable risks, when the chance of loss ismore-likely-than-not in the opinion of management and internal and external legal counsel, and the amounts are recognized based on the evaluation of the outcomes of the legal proceedings (see Note 22).
| p. | Post-Employment Benefits |
Post-employment benefits granted and to be granted to employees, retirees, and pensioners are based on an actuarial calculation prepared by an independent actuary and reviewed by management, using the projected unit credit method (see Note 20.b). The actuarial gains and losses are recognized in equity in cumulative other comprehensive income.
| q. | Other Liabilities |
Other liabilities are stated at known or measurable amounts plus, if applicable, related charges, and changes in exchange rates incurred. When applicable, other liabilities are recognized at present value, based on interest rates that reflect the term, currency, and risk of each transaction.
| r. | Foreign Currency Transactions |
Foreign currency transactions carried out by the Company or its subsidiaries are remeasured into their functional currency at the exchange rate prevailing at the date of each transaction. Outstanding monetary assets and liabilities of the Company and its subsidiaries are translated using the exchange rate at the date of the interim financial information. The effect of the difference between those exchange rates is recognized in financial results until the conclusion of each transaction.
| s. | Basis for Translation of Interim financial information of Foreign Subsidiaries |
| s.1. | Subsidiaries with administrative autonomy |
Assets and liabilities of the foreign subsidiaries, denominated in currencies other than Brazilian Real, which have administrative autonomy, are translated using the exchange rate at the date of the interim financial information. Revenues and expenses are translated using the average exchange rate of each period and equity is translated at the historical exchange rate of each transaction affecting equity. Gains and losses resulting from changes in these foreign investments are directly recognized in equity in cumulative other comprehensive income in the “cumulative translation adjustments” and will be recognized in profit or loss if these investments are disposed of. The balance in cumulative other comprehensive income on June 30, 2019 was a gain of R$ 59,971 (gain of R$ 65,857 on December 31, 2018)—see Note 26.g.2.
The foreign subsidiaries with functional currency different from the Company and which have administrative autonomy are listed below:
Subsidiary | Functional currency | Location | ||
Oxiteno México S.A. de C.V. | Mexican Peso | Mexico | ||
Oxiteno Servicios Corporativos S.A. de C.V. | Mexican Peso | Mexico | ||
Oxiteno Servicios Industriales S.A. de C.V. | Mexican Peso | Mexico | ||
Oxiteno USA LLC | U.S. Dollar | United States | ||
Oxiteno Uruguay S.A. (i) | U.S. Dollar | Uruguay | ||
Oxiteno Andina, C.A. (ii) | Bolivar Soberano | Venezuela |
| (i) | The subsidiary Oxiteno Uruguay S.A. (“Oxiteno Uruguay”) determined its functional currency as the U.S. dollar (“US$”), as its inventory sales, purchases of raw material inputs, and financing activities are performed substantially in this currency. |
| (ii) | According the definition and general guidance of IAS 29 (CPC 42), the characteristics of the economic environment of Venezuela indicate that this country is a hyperinflationary economy. As a result, the financial information of Oxiteno Andina, C.A. (“Oxiteno Andina”) was adjusted by the Venezuelan Consumer Price Index. As of June 30, 2019, the Bolivar Soberano (“VES”) are traded to 6,733.29 VES/US$ for sale and 6,716.46 VES/US$ for purchase. |
21
Table of Contents
Ultrapar Participações S.A. and Subsidiaries
Notes to the Parent and Consolidated Interim financial information
(In thousands of Brazilian Reais, unless otherwise stated)
| s.2. | Subsidiaries without self-administrative autonomy |
Assets and liabilities of the other foreign subsidiaries, which do not have administrative autonomy, are considered an extension of the activities of their parent company and are translated using the exchange rate at the date of the interim financial information. Gains and losses resulting from changes in these foreign investments are directly recognized as financial result. The loss recognized in statements of profit or loss for thesix-month period ended June 30, 2019 amounted to R$ 1,218 (loss of R$ 6,105 for thesix-month period ended June 30, 2018).
| t. | Use of Estimates, Assumptions and Judgments |
The preparation of the interim financial information requires the use of estimates, assumptions, and judgments for the accounting and disclosure of certain assets, liabilities, and profit or loss. Therefore, the Company and subsidiaries’ management use the best information available at the date of preparation of the interim financial information, as well as the experience of past and current events, also considering assumptions regarding future events. The estimates and assumptions are reviewed periodically.
| t.1 | Judgments |
Information on the judgments is included: in the determination of control in subsidiaries (Notes 2.g, 2.s.1, 3 and 12.a), the determination of joint control in joint venture (Notes 2.g, 12.a and 12.b) and the determination of significant influence in associates (Notes 2.g and 12.c).
| t.2 | Uncertainties related to the assumptions and estimates |
The information regarding uncertainties related to the assumptions and estimates are included: in determining the fair value of financial instruments (Notes 2.c, 2.l, 4, 16 and 34), the determination of the estimated losses on doubtful accounts (Notes 2.d, 5 and 34.d.3), the determination of provisions for losses of inventories (Notes 2.e and 6), the determination of deferred IRPJ and CSLL amounts (Notes 2.m and 9.a), , the determination of exchange rate used to translation of Oxiteno Andina’ information (Note 2.s.1.ii), the useful lives and discount rate of right to use assets (Notes 2.h and 13), the useful lives of PP&E (Notes 2.i and 14), the useful lives of intangible assets, and the determination of the recoverable amount of goodwill (Notes 2.j and 15.a), provisions for assets retirement obligations (Notes 2.n and 21), provisions for tax, civil, and labor risks (Notes 2.o and 22), estimates for the preparation of actuarial reports (Notes 2.p and 20.b) and the determination of fair value of subscription warrants—indemnification (Notes 25 and 34.j). The actual result of the transactions and information may differ from their estimates.
| u. | Impairment of Assets |
The Company and its subsidiaries review, in every report period, the existence of any indication that an asset may be impaired and annually test intangible assets with undefined useful life. If there is an indication, the Company and its subsidiaries estimate the recoverable amount of the asset. Assets that cannot be evaluated individually are grouped in the smallest group of assets that generate cash inflow from continuous use and that are largely independent of cash flows of other assets (cash generating units “CGU”). The recoverable amount of assets or CGUs corresponds to the greater of their fair value net of applicable direct selling costs and their value in use.
The fair value less costs to sell is determined by the price that would be received to sell an asset in an orderly transaction between market participants at the measurement date, net of costs of removing the asset, and direct incremental costs to bring an asset into condition for its sale, legal costs, and taxes.
22
Table of Contents
Ultrapar Participações S.A. and Subsidiaries
Notes to the Parent and Consolidated Interim financial information
(In thousands of Brazilian Reais, unless otherwise stated)
To assess the value in use, the projections of future cash flows, trends, and outlooks, as well as the effects of obsolescence, demand, competition, and other economic factors were considered. Such cash flows are discounted to their present values using the discount rate before tax that reflects market conditions for the period of impairment testing and the specific risks of the asset or CGU being evaluated. In cases where the expected discounted future cash flows are less than their carrying amount, an impairment loss is recognized for the amount by which the carrying value exceeds the fair value of these assets. Losses for impairment of assets are recognized in profit or loss. In case goodwill has been allocated to a CGU, the recognized losses are first allocated to reduce the corresponding goodwill. If the goodwill is not enough to absorb such losses, the surplus is allocated to the assets on apro-rata basis. An impairment of goodwill cannot be reversed. For other assets, impairment losses may be reversed only to the extent that the asset’s carrying amount does not exceed the carrying amount that would have been determined, net of depreciation or amortization, if the impairment had not been recognized.
No impairment was recognized for the three-month period ended June 30, 2019.
| v. | Business Combination |
A business combination is accounted applying the acquisition method. The cost of the acquisition is measured based on the consideration transferred and to be transferred, measured at fair value at the acquisition date. In a business combination, the assets acquired, and liabilities assumed are measured in order to classify and allocate them accordingly to the contractual terms, economic circumstances and relevant conditions on the acquisition date. Thenon-controlling interest in the acquiree is measured based on its interest in identifiable net assets acquired. Goodwill is measured as the excess of the consideration transferred and to be transferred over the fair value of net assets acquired (identifiable assets and liabilities assumed, net). After the initial recognition, goodwill is measured at cost less any accumulated impairment losses. For impairment testing purposes, goodwill is allocated to the Company’s operating segments. When the cost of the acquisition is lower than the fair value of net assets acquired, a gain is recognized directly in the statement of profit or loss. Costs related to the acquisition are recorded in the statement of profit or loss when incurred.
| w. | Statements of Value Added |
The statements of value added (“DVA”) are presented as an integral part of the interim financial information as applicable to publicly-traded companies, and as supplemental information for the IFRS, which does not require the presentation of DVA.
| x. | Statements of Cash Flows Indirect Method |
The Company and its subsidiaries present the interest paid on loans, debentures, and leases payable in financing activities. The Company and its subsidiaries present financial investments on a net basis of income and redemptions in the investing activities.
| y. | Adoption of the Pronouncements Issued by CPC and IASB |
The following standards, amendments, and interpretations to IFRS were issued by the IASB, which are effective as of January 1, 2019:
(i) IFRS 16/CPC 06 (R2)—Lease:
With the adoption of IFRS 16/CPC 06 (R2), the leases contracted by the Company’s subsidiaries, identified and effective at the date of transition and with maturities of more than 12 months, were accounted in the interim financial information:
- recognition of right to use assets and lease liabilities in financial position, initially measured at the present value of future lease payments; and
- recognition of amortization expenses of right to use assets and interest expenses on the lease payable in the financial result in the statements of profits or loss.
23
Table of Contents
Ultrapar Participações S.A. and Subsidiaries
Notes to the Parent and Consolidated Interim financial information
(In thousands of Brazilian Reais, unless otherwise stated)
The Company selected as transition method the modified retrospective approach, with the cumulative effect of initial application of this new pronouncement recorded as an adjustment to the opening balance of equity and without restatement of comparative periods.
In the analysis of the adoption, the Company’s management, with the assistance of specialized consulting, carried out the inventory of the contracts, evaluating whether or not each agreement contains a lease in accordance with IFRS 16/CPC 06 (R2). This analysis identified impacts mainly related to the lease of properties from third parties, port areas and lower amounts arising from other operations where the existence of leased assets individually or combined in service contracts was identified.
As allowed in the standard, short-term leases with a term of 12 months or less, variable amounts, indefinite term and leases of low amount assets such as computers and office furniture, are recognized as lease expenses on a straight-line basis in the statements of profit or loss.
In addition, the following practical expedients were used to transition to new lease accounting requirements:
| • | application of the IFRS 16/CPC 06 (R2) to all contracts initiated before January 1, 2019 that were identified as leases in accordance with IAS 7/ CPC 06 (R1) and IFRIC 4/ ICPC 03; |
| • | use of discount rate according to the lease term and similar characteristics; |
| • | contracts with a term of 12 months from the date of the initial adoption of the standard or with indefinite term were not recorded; |
| • | exclusion of the initial direct costs of the measurement of the opening balance from right to use asset; and |
| • | options for extension of the term or termination were considered, when applicable. |
The table below summarizes the effects on the initial adoption of the IFRS 16/CPC 06 (R2):
| 01/01/2019 | ||||
Current assets | ||||
Prepaid expenses | (39,066 | ) | ||
Non-current assets | ||||
Prepaid expenses | (288,630 | ) | ||
Right to use assets | 1,731,427 | |||
Intangible assets | (39,928 | ) | ||
|
| |||
Total assets | 1,363,803 | |||
|
| |||
Current liabilities | ||||
Leases payable | 13,827 | |||
Non-current liabilities | ||||
Leases payable | 1,349,976 | |||
|
| |||
Total liabilities | 1,363,803 | |||
|
| |||
24
Table of Contents
Ultrapar Participações S.A. and Subsidiaries
Notes to the Parent and Consolidated Interim financial information
(In thousands of Brazilian Reais, unless otherwise stated)
The analysis associated with the measurement and accounting of the lease agreements are substantially completed.
To measurement, the Company used a nominal discount rate, and estimated the payment flows for the gross portion of taxes.
(ii) IFRIC 23/ICPC 22—Uncertainty over income tax treatments:
IFRS 23 (ICPC 22) clarifies how to apply the recognition and measurement when there is uncertainty over income tax treatments, that means, there are doubts about acceptance of the treatments adopted by the fiscal authority, applying the requirements in IAS 12 (CPC 32).
In the evaluation of management, no significant impacts were identified as a result of the adoption of IFRIC 23/ICPC 22, since all the procedures adopted for the determination and collection of income taxes are supported by the legislation and precedents from Administrative and Judicial Courts.
| z. | Authorization for Issuance of the Interim financial information |
This interim financial information was authorized for issue by the Board of Directors on August 14, 2019.
| 3. | Principles of Consolidation and Investments in Subsidiaries |
| a. | Principles of Consolidation |
In the preparation of the consolidated interim financial information the investments of one company in another, balances of asset and liability accounts, revenues transactions, costs and expenses were eliminated, as well as the effects of transactions conducted between the companies.Non-controlling interests in subsidiaries are presented within consolidated equity and net income.
Consolidation of a subsidiary begins when the parent company obtains direct or indirect control over a company and ceases when the parent company loses control of a company. Income and expenses of a subsidiary acquired are included in the consolidated statement of profit or loss and comprehensive income from the date the parent company gains the control. Income and expenses of a subsidiary, in which the parent company loses control, are included in the consolidated statement of profit or loss and comprehensive income until the date the parent company loses control.
When necessary, adjustments are made to the interim financial information of subsidiaries to bring their accounting policies into line with the Company’s accounting policies.
25
Table of Contents
Ultrapar Participações S.A. and Subsidiaries
Notes to the Parent and Consolidated Interim financial information
(In thousands of Brazilian Reais, unless otherwise stated)
| b. | Investments in Subsidiaries |
The consolidated interim financial information includes the following direct and indirect subsidiaries:
| % interest in the share | ||||||||||||||||||||
| 06/30/2019 | 12/31/2018 | |||||||||||||||||||
| Control | Control | |||||||||||||||||||
| Location | Segment | Direct | Indirect | Direct | Indirect | |||||||||||||||
Ipiranga Produtos de Petróleo S.A. | Brazil | Ipiranga | 100 | — | 100 | — | ||||||||||||||
am/pm Comestíveis Ltda. | Brazil | Ipiranga | — | 100 | — | 100 | ||||||||||||||
Centro de Conveniências Millennium Ltda. | Brazil | Ipiranga | — | 100 | — | 100 | ||||||||||||||
Icorban—Correspondente Bancário Ltda. | Brazil | Ipiranga | — | 100 | — | 100 | ||||||||||||||
Ipiranga Trading Limited | Virgin Islands | Ipiranga | — | 100 | — | 100 | ||||||||||||||
Tropical Transportes Ipiranga Ltda. | Brazil | Ipiranga | — | 100 | — | 100 | ||||||||||||||
Ipiranga Imobiliária Ltda. | Brazil | Ipiranga | — | 100 | — | 100 | ||||||||||||||
Ipiranga Logística Ltda. | Brazil | Ipiranga | — | 100 | — | 100 | ||||||||||||||
Oil Trading Importadora e Exportadora Ltda. | Brazil | Ipiranga | — | 100 | — | 100 | ||||||||||||||
Iconic Lubrificantes S.A. | Brazil | Ipiranga | — | 56 | — | 56 | ||||||||||||||
Integra Frotas Ltda. | Brazil | Ipiranga | — | 100 | — | 100 | ||||||||||||||
Companhia Ultragaz S.A. | Brazil | Ultragaz | — | 99 | — | 99 | ||||||||||||||
Ultragaz Comercial Ltda. | Brazil | Ultragaz | — | 100 | — | 100 | ||||||||||||||
Nova Paraná Distribuidora de Gás Ltda.(1) | Brazil | Ultragaz | — | 100 | — | 100 | ||||||||||||||
Bahiana Distribuidora de Gás Ltda. | Brazil | Ultragaz | — | 100 | — | 100 | ||||||||||||||
Utingás Armazenadora S.A. | Brazil | Ultragaz | — | 57 | — | 57 | ||||||||||||||
LPG International Inc. | Cayman Islands | Ultragaz | — | 100 | — | 100 | ||||||||||||||
Imaven Imóveis Ltda. | Brazil | Others | — | 100 | — | 100 | ||||||||||||||
Imifarma Produtos Farmacêuticos e Cosméticos S.A. | Brazil | Extrafarma | — | 100 | — | 100 | ||||||||||||||
Oxiteno S.A. Indústria e Comércio | Brazil | Oxiteno | 100 | — | 100 | — | ||||||||||||||
Oxiteno Nordeste S.A. Indústria e Comércio(2) | Brazil | Oxiteno | — | 100 | — | 99 | ||||||||||||||
Oxiteno Argentina Sociedad de Responsabilidad Ltda. | Argentina | Oxiteno | — | 100 | — | 100 | ||||||||||||||
Oleoquímica Indústria e Comércio de Produtos Químicos Ltda. | Brazil | Oxiteno | — | 100 | — | 100 | ||||||||||||||
Oxiteno Uruguay S.A. | Uruguay | Oxiteno | — | 100 | — | 100 | ||||||||||||||
Oxiteno México S.A. de C.V. | Mexico | Oxiteno | — | 100 | — | 100 | ||||||||||||||
Oxiteno Servicios Corporativos S.A. de C.V. | Mexico | Oxiteno | — | 100 | — | 100 | ||||||||||||||
Oxiteno Servicios Industriales S.A. de C.V. | Mexico | Oxiteno | — | 100 | — | 100 | ||||||||||||||
Oxiteno USA LLC | United States | Oxiteno | — | 100 | — | 100 | ||||||||||||||
Global Petroleum Products Trading Corp. | Virgin Islands | Oxiteno | — | 100 | — | 100 | ||||||||||||||
Oxiteno Andina, C.A. | Venezuela | Oxiteno | — | 100 | — | 100 | ||||||||||||||
Oxiteno Europe SPRL | Belgium | Oxiteno | — | 100 | — | 100 | ||||||||||||||
Oxiteno Colombia S.A.S | Colombia | Oxiteno | — | 100 | — | 100 | ||||||||||||||
Oxiteno Shanghai LTD. | China | Oxiteno | — | 100 | — | 100 | ||||||||||||||
Empresa Carioca de Produtos Químicos S.A. | Brazil | Oxiteno | — | 100 | — | 100 | ||||||||||||||
Ultracargo—Operações Logísticas e Participações Ltda. | Brazil | Ultracargo | 100 | — | 100 | — | ||||||||||||||
Terminal Químico de Aratu S.A.—Tequimar | Brazil | Ultracargo | — | 99 | — | 99 | ||||||||||||||
TEAS—Terminal Exportador de Álcool de Santos Ltda. | Brazil | Ultracargo | — | 100 | — | 100 | ||||||||||||||
Tequimar Vila do Conde Logística Portuária S.A. | Brazil | Ultracargo | — | 100 | — | — | ||||||||||||||
Ultrapar International S.A. | Luxembourg | Others | 100 | — | 100 | — | ||||||||||||||
SERMA—Ass. dos usuários equip. proc. de dados | Brazil | Others | — | 100 | — | 100 | ||||||||||||||
The percentages in the table above are rounded.
| (1) | Non operating company in closing phase. |
| (2) | On April 30, 2019, the subsidiary Oxiteno Nordeste S.A. Indústria e Comércio (“Oxiteno Nordeste”) acquired all of its preferred shares class “B”, with consequent cancellation. |
| (3) | Company constituted on May 20, 2019 due the concession of the port of Vila do Conde (see Note 35.c). |
26
Table of Contents
Ultrapar Participações S.A. and Subsidiaries
Notes to the Parent and Consolidated Interim financial information
(In thousands of Brazilian Reais, unless otherwise stated)
| c. | TEAS – Terminal Exportador de Álcool de Santos Ltda. Acquisition |
The Company through its subsidiary Terminal Químico de Aratu S.A. – Tequimar (“Tequimar”) acquired 100% of the quotas of TEAS Terminal Exportador de Álcool de Santos Ltda. (“TEAS”). On March 29, 2018, the acquisition was concluded through the closing of the operation. For further details of TEAS business combination, see Note 3.d of financial statements as of and for the year ended December 31, 2018 filed on CVM on February 20, 2019.
| 4. | Cash and Cash Equivalents and Financial Investments |
Cash equivalents and financial investments, excluding cash and bank deposits, are substantially represented by investments: (i) in Brazil, in certificates of deposit of financial institutions linked to interest rate of the Interbank Certificate of Deposit (“CDI”), in repurchase agreement, financial bills, and in short term investments funds, whose portfolio comprised of Brazilian Federal Government bonds and in certificates of deposit of financial institutions; (ii) outside Brazil, in certificates of deposit of financial institutions and in short term investments funds, whose portfolio comprised of Federal Government bonds; and (iii) in currency and interest rate hedging instruments.
The financial assets were classified in Note 34.j, based on business model of financial assets of the Company and its subsidiaries.
Cash, cash equivalents and financial investments (consolidated) amounted to R$ 6,421,516 as of June 30, 2019 (R$ 6,994,406 as of December 31, 2018) are as follows:
| a. | Cash and Cash Equivalents |
Cash and cash equivalents of the Company and its subsidiaries are presented as follows:
| Parent | Consolidated | |||||||||||||||
| 06/30/2019 | 12/31/2018 | 06/30/2019 | 12/31/2018 | |||||||||||||
Cash and bank deposits | ||||||||||||||||
In local currency | 196 | 381 | 145,539 | 117,231 | ||||||||||||
In foreign currency | — | — | 62,112 | 88,251 | ||||||||||||
Financial investments considered cash equivalents | ||||||||||||||||
In local currency | ||||||||||||||||
Fixed-income securities | 69,687 | 171,934 | 2,683,000 | 3,722,308 | ||||||||||||
In foreign currency | ||||||||||||||||
Fixed-income securities | — | — | 18,651 | 11,161 | ||||||||||||
|
|
|
|
|
|
|
| |||||||||
Total cash and cash equivalents | 69,883 | 172,315 | 2,909,302 | 3,938,951 | ||||||||||||
|
|
|
|
|
|
|
| |||||||||
27
Table of Contents
Ultrapar Participações S.A. and Subsidiaries
Notes to the Parent and Consolidated Interim financial information
(In thousands of Brazilian Reais, unless otherwise stated)
| b. | Financial Investments and Currency and Interest Rate Hedging Instruments |
The financial investments, which are not classified as cash and cash equivalents, are presented as follows:
| Parent | Consolidated | |||||||||||||||
| 06/30/2019 | 12/31/2018 | 06/30/2019 | 12/31/2018 | |||||||||||||
Financial investments | ||||||||||||||||
In local currency | ||||||||||||||||
Fixed-income securities and funds | 119,249 | 565,930 | 2,775,408 | 2,537,315 | ||||||||||||
In foreign currency | ||||||||||||||||
Fixed-income securities and funds | — | — | 186,755 | 154,811 | ||||||||||||
Currency and interest rate hedging instruments (a) | — | — | 550,051 | 363,329 | ||||||||||||
|
|
|
|
|
|
|
| |||||||||
Total financial investments | 119,249 | 565,930 | 3,512,214 | 3,055,455 | ||||||||||||
|
|
|
|
|
|
|
| |||||||||
Current | 119,249 | 565,930 | 3,177,404 | 2,853,106 | ||||||||||||
Non-current | — | — | 334,810 | 202,349 | ||||||||||||
| (a) | Accumulated gains, net of income tax (see Note 34.j). |
| 5. | Trade Receivables and Reseller Financing (Consolidated) |
| a. | Trade Receivables |
The composition of trade receivables is as follows:
| 06/30/2019 | 12/31/2018 | |||||||
Domestic customers | 4,067,642 | 4,290,996 | ||||||
Foreign customers | 231,844 | 244,960 | ||||||
(-) Estimated losses on doubtful accounts | (428,900 | ) | (385,080 | ) | ||||
|
|
|
| |||||
| 3,870,586 | 4,150,876 | |||||||
|
|
|
| |||||
Current | 3,843,723 | 4,069,307 | ||||||
Non-current | 26,863 | 81,569 | ||||||
The breakdown of trade receivables, gross of estimated losses on doubtful accounts, is as follows:
| Past due | ||||||||||||||||||||||||||||
| Total | Current | less than 30 days | 31-60 days | 61-90 days | 91-180 days | more than 180 days | ||||||||||||||||||||||
06/30/2019 | 4,299,486 | 3,448,954 | 139,767 | 49,798 | 58,903 | 64,645 | 537,419 | |||||||||||||||||||||
12/31/2018 | 4,535,956 | 3,739,601 | 121,622 | 53,864 | 49,629 | 84,920 | 486,320 | |||||||||||||||||||||
The breakdown of estimated losses on doubtful accounts, is as follows:
| Past due | ||||||||||||||||||||||||||||
| Total | Current | less than 30 days | 31-60 days | 61-90 days | 91-180 days | more than 180 days | ||||||||||||||||||||||
06/30/2019 | 428,900 | 25,946 | 20,564 | 6,093 | 5,955 | 42,523 | 327,819 | |||||||||||||||||||||
12/31/2018 | 385,080 | 39,226 | 4,094 | 3,754 | 5,533 | 46,783 | 285,690 | |||||||||||||||||||||
28
Table of Contents
Ultrapar Participações S.A. and Subsidiaries
Notes to the Parent and Consolidated Interim financial information
(In thousands of Brazilian Reais, unless otherwise stated)
Movements in the allowance for estimated losses on doubtful accounts are as follows:
Balance as of December 31, 2018 | 385,080 | |||
Additions | 55,968 | |||
Write-offs | (12,148 | ) | ||
|
| |||
Balance as of June 30, 2019 | 428,900 | |||
|
|
For further information about the allowance for estimated losses on doubtful accounts, see Note 34.d.3.
| b. | Reseller financing |
The composition of reseller financing is as follows:
| 06/30/2019 | 12/31/2018 | |||||||
Reseller financing—Ipiranga | 895,090 | 855,229 | ||||||
(-) Estimated losses on doubtful accounts | (164,387 | ) | (139,699 | ) | ||||
|
|
|
| |||||
| 730,703 | 715,530 | |||||||
|
|
|
| |||||
Current | 382,458 | 367,262 | ||||||
Non-current | 348,245 | 348,268 | ||||||
Reseller financing is provided for renovation and upgrading of service stations, purchase of products, and development of the automotive fuels and lubricants distribution market. The terms of reseller financing range substantially from 12 months to 60 months, with an average term of 40 months. The minimum and maximum interest rates are 0% per month and 1% per month, respectively.
The breakdown of reseller financing, gross of estimated losses on doubtful accounts, is as follows:
| Past due | ||||||||||||||||||||||||||||
| Total | Current | less than 30 days | 31-60 days | 61-90 days | 91-180 days | more than 180 days | ||||||||||||||||||||||
06/30/2019 | 895,090 | 628,725 | 21,489 | 13,797 | 8,312 | 22,709 | 200,058 | |||||||||||||||||||||
12/31/2018 | 855,229 | 633,183 | 11,262 | 14,869 | 9,377 | 20,783 | 165,755 | |||||||||||||||||||||
The breakdown of estimated losses on doubtful accounts, is as follows:
| Past due | ||||||||||||||||||||||||||||
| Total | Current | less than 30 days | 31-60 days | 61-90 days | 91-180 days | more than 180 days | ||||||||||||||||||||||
06/30/2019 | 164,387 | 30,130 | 2,296 | 1,667 | 1,011 | 13,139 | 116,144 | |||||||||||||||||||||
12/31/2018 | 139,699 | 26,982 | 1,250 | 1,642 | 1,131 | 12,176 | 96,518 | |||||||||||||||||||||
Movements in the allowance for estimated losses on doubtful accounts are as follows:
Balance as of December 31, 2018 | 139,699 | |||
Additions | 25,393 | |||
Write-offs | (705 | ) | ||
|
| |||
Balance as of June 30, 2019 | 164,387 | |||
|
|
For further information about the allowance for estimated losses on doubtful accounts, see Note 34.d.3.
29
Table of Contents
Ultrapar Participações S.A. and Subsidiaries
Notes to the Parent and Consolidated Interim financial information
(In thousands of Brazilian Reais, unless otherwise stated)
6. Inventories (Consolidated)
The composition of inventories is as follows:
| 06/30/2019 | 12/31/2018 | |||||||||||||||||||||||
| Cost | Provision for losses | Net balance | Cost | Provision for losses | Net balance | |||||||||||||||||||
Fuels, lubricants and greases | 1,461,992 | (1,936 | ) | 1,460,056 | 1,367,015 | (1,804 | ) | 1,365,211 | ||||||||||||||||
Finished goods | 488,399 | (31,773 | ) | 456,626 | 581,504 | (20,923 | ) | 560,581 | ||||||||||||||||
Work in process | 3,650 | — | 3,650 | 1,412 | — | 1,412 | ||||||||||||||||||
Raw materials | 377,742 | (2,543 | ) | 375,199 | 383,161 | (1,894 | ) | 381,267 | ||||||||||||||||
Liquefied petroleum gas (LPG) | 99,173 | (5,761 | ) | 93,412 | 109,362 | (5,761 | ) | 103,601 | ||||||||||||||||
Consumable materials and other items for resale | 144,261 | (2,635 | ) | 141,626 | 150,188 | (3,770 | ) | 146,418 | ||||||||||||||||
Pharmaceutical, hygiene, and beauty products | 581,047 | (3,740 | ) | 577,307 | 583,060 | (5,364 | ) | 577,696 | ||||||||||||||||
Purchase for future delivery(1) | 129,552 | (2,964 | ) | 126,588 | 193,928 | (2,964 | ) | 190,964 | ||||||||||||||||
Properties for resale | 29,273 | (107 | ) | 29,166 | 27,489 | (107 | ) | 27,382 | ||||||||||||||||
|
|
|
|
|
|
|
|
|
|
|
| |||||||||||||
| 3,315,089 | (51,459 | ) | 3,263,630 | 3,397,119 | (42,587 | ) | 3,354,532 | |||||||||||||||||
|
|
|
|
|
|
|
|
|
|
|
| |||||||||||||
| (1) | Refers substantially to ethanol, biodiesel and advance of fuels. |
Movements in the provision for losses are as follows:
Balance as of December 31, 2018 | 42,587 | |||
Reversals to net realizable value adjustment | (410 | ) | ||
Additions of obsolescence and other losses | 9,282 | |||
|
| |||
Balance as of June 30, 2019 | 51,459 | |||
|
|
The breakdown of provisions for losses related to inventories is shown in the table below:
| 06/30/2019 | 12/31/2018 | |||||||
Net realizable value adjustment | 20,993 | 21,402 | ||||||
Obsolescence and other losses | 30,466 | 21,185 | ||||||
|
|
|
| |||||
Total | 51,459 | 42,587 | ||||||
|
|
|
| |||||
30
Table of Contents
Ultrapar Participações S.A. and Subsidiaries
Notes to the Parent and Consolidated Interim financial information
(In thousands of Brazilian Reais, unless otherwise stated)
| 7. | Taxes to Recover |
| a. | Recoverable Taxes (Consolidated) |
Recoverable taxes are substantially represented by credits of Tax on Goods and Services (“ICMS”, the Brazilian VAT), Contribution for Social Security Financing (“COFINS”) and Social Integration Program (“PIS”).
| 06/30/2019 | 12/31/2018 | |||||||
ICMS (a.1) | 811,118 | 710,669 | ||||||
Provision for ICMS losses (a.1) | (95,200 | ) | (99,187 | ) | ||||
PIS and COFINS (a.2) | 724,154 | 720,731 | ||||||
Value-Added Tax (IVA) of foreign subsidiaries | 30,693 | 31,678 | ||||||
Others | 34,636 | 22,988 | ||||||
|
|
|
| |||||
Total | 1,505,401 | 1,386,879 | ||||||
|
|
|
| |||||
Current | 758,240 | 639,699 | ||||||
Non-current | 747,161 | 747,180 | ||||||
| a.1 | The recoverable ICMS is substantially related to the following subsidiaries and operations: |
| (i) | The subsidiary Oxiteno Nordeste predominantly carries out export operations, interstate outflow or deferred ICMS of products purchased within the State of Bahia; |
| (ii) | The subsidiary Ipiranga Produtos de Petróleo S.A. (“IPP”) has credits arising from interstate outflows ofoil-related products, whose ICMS was prepaid by the supplier (Petróleo Brasileiro S.A. (“Petrobras”)), and credits arising from the difference between transactions of inflows and outflows of products subject to ICMS taxation (mainly ethanol); |
| (iii) | The subsidiary Extrafarma has credits of ICMS andICMS-ST (tax substitution) advances on the inflow and outflow of operations carried out by its distribution centers, mostly in the North and Northeast. |
Management estimates the realization of these credits within up to 10 years.
The provision for ICMS losses relates to tax credits that the subsidiaries estimate will not utilize or offset in the future.
| a.2 | Refers, mainly, to the PIS and COFINS credits recorded under Laws 10,637/2002 and 10,833/2003 by the subsidiaries IPP and Cia. Ultragaz, whose consumption will occur through the offset of debts administered by the Brazilian Federal Revenue Service (“RFB”) in an estimated term of 2 years by management. The subsidiary Oxiteno S.A. Indústria e Comércio (“Oxiteno S.A.”) has credits resulted from reimbursement the amounts unduly paid as PIS half-yearly. The subsidiaries Oxiteno S.A. and Extrafarma have credits resulting from a definitive favorable decision on the exclusion of ICMS from the calculation basis of PIS and COFINS. The subsidiaries Oxiteno S.A., Oxiteno Nordeste, Oleoquímica Indústria e Comércio de Produtos Químicos Ltda. (“Oleoquímica”) and Empresa Carioca de Produtos Químicos S.A. (“EMCA”) have credits resulted from a final favorable decision to the exclusion of ICMS from the calculation basis of PIS and COFINS-import. The credits of Oxiteno S.A. will be realized through corporate restructuring with Oxiteno Nordeste. For these cases, management estimates the realization of these credits within up to 5 years. |
| b. | Recoverable Income Tax and Social Contribution Taxes |
Represented by recoverable IRPJ and CSLL.
| Parent | Consolidated | |||||||||||||||
| 06/30/2019 | 12/31/2018 | 06/30/2019 | 12/31/2018 | |||||||||||||
IRPJ and CSLL | 74,877 | 88,390 | 367,769 | 362,784 | ||||||||||||
|
|
|
|
|
|
|
| |||||||||
Total | 74,877 | 88,390 | 367,769 | 362,784 | ||||||||||||
|
|
|
|
|
|
|
| |||||||||
Current | 35,430 | 39,705 | 277,540 | 257,182 | ||||||||||||
Non-current | 39,447 | 48,685 | 90,229 | 105,602 | ||||||||||||
31
Table of Contents
Ultrapar Participações S.A. and Subsidiaries
Notes to the Parent and Consolidated Interim financial information
(In thousands of Brazilian Reais, unless otherwise stated)
Relates to IRPJ and CSLL to be recovered by the Company and its subsidiaries arising from the tax advances of previous years, with management estimating the realization of these credits within up to 5 years for the subsidiaries Oxiteno S.A. and Oxiteno Nordeste and up to 2 years for the others.
| 8. | Related Parties |
| a. | Related Parties |
| a.1 | Parent |
| Assets | Liabilities | Financial income (1) | ||||||||||||||
| Debentures (1) | Other payables | Account payable | ||||||||||||||
Ipiranga Produtos de Petróleo S.A. | 761,288 | — | — | 26,575 | ||||||||||||
Companhia Ultragaz S.A. | — | 1,540 | — | — | ||||||||||||
Imifarma Produtos Farmacêuticos e Cosméticos S.A. | — | — | 5,472 | — | ||||||||||||
|
|
|
|
|
|
|
| |||||||||
Total as of June 30, 2019 | 761,288 | 1,540 | 5,472 | 26,575 | ||||||||||||
|
|
|
|
|
|
|
| |||||||||
| Assets | Liabilities | Financial income (1) | ||||||||||||||
| Debentures (1) | Other payables (2) | Account payable | ||||||||||||||
Ipiranga Produtos de Petróleo S.A. | 761,288 | — | — | 27,485 | ||||||||||||
Companhia Ultragaz S.A. | — | 3,975 | — | — | ||||||||||||
Imifarma Produtos Farmacêuticos e Cosméticos S.A. | — | — | 5,158 | — | ||||||||||||
|
|
|
|
|
|
|
| |||||||||
Total as of December 31, 2018 | 761,288 | 3,975 | 5,158 | |||||||||||||
|
|
|
|
|
| |||||||||||
Total as of June 30, 2018 | 27,485 | |||||||||||||||
|
| |||||||||||||||
| (1) | In March 2016, the subsidiary IPP made its second private offering in one single series of 75 debentures at face value of R$ 10,000,000.00 (ten million Brazilian Reais) each, nonconvertible into shares and unsecured. The Company subscribed the total debentures with maturity on March 31, 2021 and semiannual interest linked to CDI. |
| (2) | Refers to theDeferred Stock Plan (see Note 8.c). |
32
Table of Contents
Ultrapar Participações S.A. and Subsidiaries
Notes to the Parent and Consolidated Interim financial information
(In thousands of Brazilian Reais, unless otherwise stated)
| a.2 | Consolidated |
Balances and transactions between the Company and its subsidiaries and between subsidiaries have been eliminated in consolidation and are not disclosed in this note. The balances and transactions between the Company and its subsidiaries with other related parties are disclosed below:
| Loans | ||||||||
| Assets | Liabilities | |||||||
Química da Bahia Indústria e Comércio S.A. | — | 2,925 | ||||||
Others | 490 | 1,098 | ||||||
|
|
|
| |||||
Total as of June 30, 2019 | 490 | 4,023 | ||||||
|
|
|
| |||||
| Loans | ||||||||
| Assets | Liabilities | |||||||
Química da Bahia Indústria e Comércio S.A. | — | 2,925 | ||||||
Others | 490 | 1,146 | ||||||
|
|
|
| |||||
Total as of December 31, 2018 | 490 | 4,071 | ||||||
|
|
|
| |||||
Loans agreements have indeterminate terms and do not contain interest clauses. These are carried out due temporary excess or necessity cash of the Company, its subsidiaries, and its associates.
| Commercial transactions | ||||||||||||||||||||
| Receivables(1) | Payables(1) | Sales and services | Purchases | Expenses | ||||||||||||||||
Oxicap Indústria de Gases Ltda. | — | 1,603 | 1 | 9,547 | — | |||||||||||||||
Refinaria de Petróleo Riograndense S.A. | — | 220,039 | — | 509,073 | — | |||||||||||||||
ConectCar Soluções de Mobilidade Eletrônica S.A. | 3,481 | 113 | 1,174 | 50 | — | |||||||||||||||
LA’7 Participações e Empreend. Imob. Ltda. (a) | — | 124 | — | — | 735 | |||||||||||||||
|
|
|
|
|
|
|
|
|
| |||||||||||
Total as of June 30, 2019 | 3,481 | 221,879 | 1,175 | 518,670 | 735 | |||||||||||||||
|
|
|
|
|
|
|
|
|
| |||||||||||
| Commercial transactions | ||||||||||||||||||||
| Receivables(1) | Payables(1) | Sales and services | Purchases | Expenses | ||||||||||||||||
Oxicap Indústria de Gases Ltda. | — | 567 | 3 | 9,135 | — | |||||||||||||||
Refinaria de Petróleo Riograndense S.A. | — | 24,630 | — | 509,271 | — | |||||||||||||||
ConectCar Soluções de Mobilidade Eletrônica S.A. | 1,042 | 136 | 1,431 | 758 | — | |||||||||||||||
LA’7 Participações e Empreend. Imob. Ltda.(a) | — | 117 | — | — | 750 | |||||||||||||||
|
|
|
|
|
|
|
|
|
| |||||||||||
Total as of December 31, 2018 | 1,042 | 25,450 | ||||||||||||||||||
|
|
|
| |||||||||||||||||
Total as of June 30, 2018 | 1,434 | 519,164 | 750 | |||||||||||||||||
|
|
|
|
|
| |||||||||||||||
| (1) | Included in “domestic trade receivables”, “domestic trade payables” and “domestic trade payables—agreement”, respectively. |
| (a) | Refers to rental contracts of 15 drugstores owned by LA’7 as of June 30, 2019 (15 drugstores as of December 31, 2018), a company of the former shareholders of Extrafarma that are current shareholders of Ultrapar. |
Purchase and sale transactions relate substantially to the purchase of raw materials, feedstock, transportation, and storage services based on similar market prices and terms with customers and suppliers with comparable operational performance. The above operations related to ConectCar Soluções de Mobilidade Eletrônica S.A. (“ConectCar”) refer to services provided. In the opinion of the Company and its subsidiaries’ management, transactions with related parties are not subject to credit risk, which is why no an estimated loss or collateral is provided. Collateral provided by the Company in loans of subsidiaries and affiliates are mentioned in Note 16. i.
33
Table of Contents
Ultrapar Participações S.A. and Subsidiaries
Notes to the Parent and Consolidated Interim financial information
(In thousands of Brazilian Reais, unless otherwise stated)
| b. | Key executives (Consolidated) |
The Company’s compensation strategy combines short and long-term elements, following the principles of alignment of interests and of maintaining a competitive compensation, and is aimed at retaining key officers and remunerating them adequately according to their attributed responsibilities and the value created to the Company and its shareholders.
Short-term compensation is comprised of: (a) fixed monthly compensation paid with the objective of rewarding the executive’s experience, responsibility, and his/her position’s complexity, and includes salary and benefits such as medical coverage,check-up, life insurance, and others; (b) variable compensation paid annually with the objective of aligning the executive’s and the Company’s objectives, which is linked to: (i) the business performance measured through its economic value creation and (ii) the fulfillment of individual annual goals that are based on the strategic plan and are focused on expansion and operational excellence projects, people development and market positioning, among others. Further details about the Deferred Stock Plan are contained in Note 8.c and about post-employment benefits in Note 20.b.
The expenses for compensation of its key executives (Company’s directors and executive officers) as shown below:
| 06/30/2019 | 06/30/2018 | |||||||
Short-term compensation | 23,856 | 21,610 | ||||||
Stock compensation (*) | 3,879 | (2,112 | ) | |||||
Post-employment benefits | 1,335 | 1,187 | ||||||
Termination benefit | — | 905 | ||||||
|
|
|
| |||||
Total | 29,070 | 21,590 | ||||||
|
|
|
| |||||
| (*) | Includes the reversal of expenses for the cancellation of granted shares due to termination of executive employment (see Note 8.c). |
| c. | Deferred Stock Plan (Consolidated) |
Since 2003, Ultrapar has adopted a stock plan in which the executive has the usufruct of shares held in treasury until the transfer of the full ownership of the shares to those eligible members of management after five to seven years from the initial concession of the rights subject to uninterrupted employment of the participant during the period. The volume of shares and the executives eligible are determined by the Board of Directors, and there is no mandatory annual grant. The total number of shares to be used in the plan is subject to the number of shares in treasury. Ultrapar’s Board of Directors does not have a stock plan. The fair value of the awards were determined on the grant date based on the market value of the shares on the B3, the Brazilian Securities, Commodities and Futures Exchange and the amounts are amortized between five to seven years from the grant date.
The table below summarizes shares granted to the Company and its subsidiaries’ management:
Grant date | Balance of number of shares granted | Vesting period | Market price of shares on the grant date (in R$ per share) | Total grant costs, including taxes | Accumulated recognized grant costs | Accumulated unrecognized grant costs | ||||||||||||||||||
March 13, 2017 | 200,000 | 2022 to 2024 | 34.00 | 9,378 | (3,716 | ) | 5,662 | |||||||||||||||||
March 4, 2016 | 380,000 | 2021 to 2023 | 32.72 | 17,147 | (9,708 | ) | 7,439 | |||||||||||||||||
December 9, 2014 | 800,000 | 2019 to 2021 | 25.32 | 27,939 | (21,749 | ) | 6,190 | |||||||||||||||||
March 5, 2014 | 111,200 | 2019 to 2021 | 26.08 | 5,999 | (5,301 | ) | 698 | |||||||||||||||||
November 7, 2012 | 153,328 | 2017 to 2019 | 21.45 | 16,139 | (15,923 | ) | 216 | |||||||||||||||||
|
|
|
|
|
|
|
| |||||||||||||||||
| 1,644,528 | 76,602 | (56,397 | ) | 20,205 | ||||||||||||||||||||
|
|
|
|
|
|
|
| |||||||||||||||||
34
Table of Contents
Ultrapar Participações S.A. and Subsidiaries
Notes to the Parent and Consolidated Interim financial information
(In thousands of Brazilian Reais, unless otherwise stated)
For thesix-month period ended June 30, 2019, the amortization in the amount of R$ 5,325 (R$ 1,549 for thesix-month period ended June 30, 2018) was recognized as a general and administrative expense.
The table below summarizes the changes of number of shares granted:
Balance on December 31, 2018 | 1,700,128 | |||
Shares vested and transferred | (55,600 | ) | ||
|
| |||
Balance on June 30, 2019 | 1,644,528 | |||
|
|
The information above were adjusted retrospectively as disclosure in Note 26.a.
In addition, on April 19, 2017, the Ordinary and Extraordinary General Shareholders’ Meeting (“OEGM”) of approved a new incentive plan based on shares (”Plan”), which establishes the general terms and conditions for the concession of common shares issued by the Company and held in treasury, that may or may not involve the granting of usufruct of part of these shares for later transfer of the ownership of the shares, in periods of three to six years, to directors or employees of the Company or its subsidiaries.
As a result of the Plan, common shares representing at most 1% of the Company’s share capital may be delivered to the participants, which corresponds, at the date of approval of this Plan, to 11,128,102 common shares.
The table below summarizes the restricted and performance stock programs:
Program | Grant date | Balance of number of shares granted | Vesting period | Market price of shares on the grant date (in R$ per share) | Total grant costs, including taxes | Accumulated recognized grant costs | Accumulated unrecognized grant costs | |||||||||||||||||||
Restricted | October 1, 2017 | 240,000 | 2023 | 38.19 | 12,642 | (3,688 | ) | 8,954 | ||||||||||||||||||
Restricted and performance | November 8, 2017 | 75,876 | 2020 to 2022 | 38.19 | 5,014 | (2,199 | ) | 2,815 | ||||||||||||||||||
Restricted and performance | April 9, 2018 | 184,076 | 2021 to 2023 | 34.35 | 12,066 | (3,970 | ) | 8,096 | ||||||||||||||||||
Restricted | September 19, 2018 | 160,000 | 2024 | 19.58 | 4,321 | (540 | ) | 3,781 | ||||||||||||||||||
Restricted | September 24, 2018 | 80,000 | 2024 | 18.40 | 2,030 | (254 | ) | 1,776 | ||||||||||||||||||
Restricted and performance | April 3, 2019 | 567,876 | 2022 to 2024 | 23.25 | 24,491 | (1,602 | ) | 22,889 | ||||||||||||||||||
|
|
|
|
|
|
|
| |||||||||||||||||||
| 1,307,828 | 60,564 | (12,253 | ) | 48,311 | ||||||||||||||||||||||
|
|
|
|
|
|
|
| |||||||||||||||||||
For thesix-month period ended June 30, 2019, a general and administrative expense in the amount of R$ 5,404 was recognized in relation to the Plan (R$ 2,619 for thesix-month period ended June 30, 2018).
The information above were adjusted retrospectively as disclosure in Note 26.a.
35
Table of Contents
Ultrapar Participações S.A. and Subsidiaries
Notes to the Parent and Consolidated Interim financial information
(In thousands of Brazilian Reais, unless otherwise stated)
| 9. | Income and Social Contribution Taxes |
| a. | Deferred Income (IRPJ) and Social Contribution Taxes (CSLL) |
The Company and its subsidiaries recognize deferred tax assets and liabilities, which are not subject to the statute of limitations, resulting from tax loss carryforwards, temporary differences, negative tax bases and revaluation of PP&E, among others. Deferred tax assets are sustained by the continued profitability of their operations. Deferred IRPJ and CSLL are recognized under the following main categories:
| Parent | Consolidated | |||||||||||||||
| 06/30/2019 | 12/31/2018 | 06/30/2019 | 12/31/2018 | |||||||||||||
Assets—Deferred income and social contribution taxes on: | ||||||||||||||||
Provision for impairment of assets | — | — | 120,158 | 116,191 | ||||||||||||
Provisions for tax, civil, and labor risks | — | — | 154,324 | 154,516 | ||||||||||||
Provision for post-employment benefits | — | — | 84,030 | 85,575 | ||||||||||||
Provision for differences between cash and accrual basis | — | — | 182,628 | 147,376 | ||||||||||||
Goodwill | — | — | 10,488 | 12,258 | ||||||||||||
Business combination—fiscal basis vs. accounting basis of goodwill | — | — | 75,145 | 75,838 | ||||||||||||
Provision for asset retirement obligation | — | — | 15,914 | 15,801 | ||||||||||||
Other provisions | 10,032 | 14,034 | 157,617 | 144,354 | ||||||||||||
Tax losses and negative basis for social contribution carryforwards (d) | 4,411 | — | 246,861 | 208,036 | ||||||||||||
|
|
|
|
|
|
|
| |||||||||
Total | 14,443 | 14,034 | 1,047,165 | 959,945 | ||||||||||||
|
|
|
|
|
|
|
| |||||||||
Offset the liabilities balance | — | — | (447,818 | ) | (445,758 | ) | ||||||||||
|
|
|
|
|
|
|
| |||||||||
Net balance of deferred taxes assets | 14,443 | 14,034 | 599,347 | 514,187 | ||||||||||||
|
|
|
|
|
|
|
| |||||||||
Liabilities—Deferred income and social contribution taxes on: | ||||||||||||||||
Revaluation of PP&E | — | — | 1,915 | 1,981 | ||||||||||||
Lease payable | — | — | 2,606 | 2,858 | ||||||||||||
Provision for differences between cash and accrual basis | — | — | 204,196 | 138,332 | ||||||||||||
Provision for goodwill | — | — | 214,373 | 187,845 | ||||||||||||
Business combination—fair value of assets | — | — | 115,391 | 117,352 | ||||||||||||
Temporary differences of foreign subsidiaries | — | — | 1,886 | — | ||||||||||||
Other provisions | — | — | 8,111 | 6,687 | ||||||||||||
|
|
|
|
|
|
|
| |||||||||
Total | — | — | 548,478 | 455,055 | ||||||||||||
|
|
|
|
|
|
|
| |||||||||
Offset the assets balance | — | — | (447,818 | ) | (445,758 | ) | ||||||||||
|
|
|
|
|
|
|
| |||||||||
Net balance of deferred taxes liabilities | — | — | 100,660 | 9,297 | ||||||||||||
|
|
|
|
|
|
|
| |||||||||
Changes in the net balance of deferred IRPJ and CSLL are as follows:
| Parent | Consolidated | |||||||||||||||
| 06/30/2019 | 06/30/2018 | 06/30/2019 | 06/30/2018 | |||||||||||||
Initial balance | 14,034 | 29,158 | 504,890 | 530,419 | ||||||||||||
Deferred IRPJ and CSLL recognized in income of the period | 409 | (23,977 | ) | 2,566 | (12,310 | ) | ||||||||||
Deferred IRPJ and CSLL recognized in other comprehensive income | — | — | (9,025 | ) | 125,651 | |||||||||||
Others | — | — | 256 | 3,911 | ||||||||||||
|
|
|
|
|
|
|
| |||||||||
Final balance | 14,443 | 5,181 | 498,687 | 647,671 | ||||||||||||
|
|
|
|
|
|
|
| |||||||||
36
Table of Contents
Ultrapar Participações S.A. and Subsidiaries
Notes to the Parent and Consolidated Interim financial information
(In thousands of Brazilian Reais, unless otherwise stated)
The estimated recovery of deferred tax assets relating to IRPJ and CSLL is stated as follows:
| Parent | Consolidated | |||||||
Up to 1 Year | 6,967 | 218,560 | ||||||
From 1 to 2 Years | 2,089 | 140,374 | ||||||
From 2 to 3 Years | 2,089 | 190,955 | ||||||
From 3 to 5 Years | 2,712 | 192,114 | ||||||
From 5 to 7 Years | 586 | 200,269 | ||||||
From 7 to 10 Years | — | 104,893 | ||||||
|
|
|
| |||||
Total of deferred tax assets relating to IRPJ and CSLL | 14,443 | 1,047,165 | ||||||
|
|
|
| |||||
| b. | Reconciliation of Income and Social Contribution Taxes |
IRPJ and CSLL are reconciled to the statutory tax rates as follows:
| Parent | Consolidated | |||||||||||||||
| 06/30/2019 | 06/30/2018 | 06/30/2019 | 06/30/2018 | |||||||||||||
Income (loss) before taxes and share of profit (loss) of subsidiaries, joint ventures, and associates | 17,296 | 69,607 | 630,216 | 472,477 | ||||||||||||
Statutory tax rates—% | 34 | 34 | 34 | 34 | ||||||||||||
|
|
|
|
|
|
|
| |||||||||
Income and social contribution taxes at the statutory tax rates | (5,881 | ) | (23,666 | ) | (214,273 | ) | (160,642 | ) | ||||||||
|
|
|
|
|
|
|
| |||||||||
Adjustments to the statutory income and social contribution taxes: | ||||||||||||||||
Nondeductible expenses (i) | 6,342 | (143 | ) | (33,738 | ) | (39,685 | ) | |||||||||
Nontaxable revenues (ii) | 11 | 13 | 13,640 | 12,593 | ||||||||||||
Adjustment to estimated income (iii) | — | — | 5,303 | 4,758 | ||||||||||||
Interest on equity (iv) | — | (538 | ) | — | (538 | ) | ||||||||||
Unrecorded deferred Income and Social Contribution Taxes Carryforwards deferred (v) | — | — | (43,782 | ) | (16,885 | ) | ||||||||||
Other adjustments | (63 | ) | 12 | (3,503 | ) | 1,870 | ||||||||||
|
|
|
|
|
|
|
| |||||||||
Income and social contribution taxes before tax incentives | 409 | (24,322 | ) | (276,353 | ) | (198,529 | ) | |||||||||
|
|
|
|
|
|
|
| |||||||||
Tax incentives—SUDENE | — | — | 19,471 | 45,949 | ||||||||||||
|
|
|
|
|
|
|
| |||||||||
Income and social contribution taxes in the income statement | 409 | (24,322 | ) | (256,882 | ) | (152,580 | ) | |||||||||
|
|
|
|
|
|
|
| |||||||||
Current | — | (345 | ) | (259,448 | ) | (140,270 | ) | |||||||||
Deferred | 409 | (23,977 | ) | 2,566 | (12,310 | ) | ||||||||||
Effective IRPJ and CSLL rates—% | (2.4 | ) | 34.9 | 40.8 | 32.3 | |||||||||||
| (i) | Consist of certain expenses that cannot be deducted for tax purposes under applicable tax legislation, such as expenses with fines, donations, gifts, losses of assets, negative effects of foreign subsidiaries and certain provisions; |
| (ii) | Consist of certain gains and income that are not taxable under applicable tax legislation, such as the reimbursement of taxes and the reversal of certain provisions; |
| (iii) | Brazilian tax law allows for an alternative method of taxation for companies that generated gross revenues of up to R$ 78 million in their previous fiscal year. Certain subsidiaries of the Company adopted this alternative form of taxation, whereby income and social contribution taxes are calculated on a basis equal to 32% of operating revenues, as opposed to being calculated based on the effective taxable income of these subsidiaries. The adjustment to estimated income represents the difference between the taxation under this alternative method and the income and social contribution taxes that would have been paid based on the effective statutory rate applied to the taxable income of these subsidiaries; |
| (iv) | Interest on equity is an option foreseen in Brazilian corporate law to distribute profits to shareholders, calculated based on the long-term interest rate (“TJLP”), which does not affect the income statement, but is deductible for purposes of IRPJ and CSLL, being taxable to the beneficiary and deductible to the entity that pays; |
| (v) | See Note 9.d. |
37
Table of Contents
Ultrapar Participações S.A. and Subsidiaries
Notes to the Parent and Consolidated Interim financial information
(In thousands of Brazilian Reais, unless otherwise stated)
| c. | Tax Incentives—SUDENE |
The following subsidiaries are entitled to federal tax benefits providing for IRPJ reduction under the program for development of northeastern Brazil operated by the Superintendence for the Development of the Northeast (“SUDENE”), as shown below:
Subsidiary | Units | Incentive—% | Expiration | |||||||
Bahiana Distribuidora de Gás Ltda. | Aracaju base (1) | 75 | 2027 | |||||||
| Suape base(2) | 75 | 2027 | ||||||||
| Mataripe base | 75 | 2024 | ||||||||
| Caucaia base | 75 | 2025 | ||||||||
| Juazeiro base | 75 | 2026 | ||||||||
Terminal Químico de Aratu S.A. – Tequimar | Suape terminal | 75 | 2020 | |||||||
| Aratu terminal | 75 | 2022 | ||||||||
| Itaqui terminal | 75 | 2025 | ||||||||
Oleoquímica Indústria e Comércio de Produtos Químicos Ltda. | Camaçari plant | 75 | 2021 | |||||||
Oxiteno Nordeste S.A. Indústria e Comércio | Camaçari plant | 75 | 2026 | |||||||
Empresa Carioca de Produtos Químicos S.A. | Camaçari plant | 75 | 2026 | |||||||
| (1) | The subsidiary Bahiana Distribuidora de Gás Ltda. (“Bahiana”), obtained 75% income tax reduction incentive recognized by SUDENE, through an appraisal report on October 22, 2018, until 2027, due to the modernization for its Aracaju plant – Sergipe. On October 22, 2018, the constitutive benefit appraisal report was sent to the RFB for approval within a term of 120 days. As a result of the expiration of the statutes of limitation for the RFB to approve the constitutive benefit appraisal report setting the tacit approval of the application, the income tax reduction recognized by the subsidiary in the statement of profit or loss in 2019, with retroactive effect in January 2018 in the amount of R$ 1,067. |
| (2) | The subsidiary Bahiana had the 75% income tax reduction incentive recognized by SUDENE, through an appraisal report on January 14, 2019, until 2027, due to the modernization for its Suape plant – Pernambuco. On January 23, 2019, the constitutive benefit appraisal report was sent to the RFB, approved in May 2019. |
| d. | Income and Social Contribution Taxes Carryforwards |
As of June 30, 2019, the Company and certain subsidiaries had tax loss carryforwards related to income tax (IRPJ) of R$ 1,030,447 (R$ 873,718 as of December 31, 2018) and negative basis of CSLL of R$ 1,032,197 (R$ 876,315 as of December 31, 2018), whose compensations are limited to 30% of taxable income in a given tax year, which do not expire.
In addition, certain offshore subsidiaries had tax loss carryforwards of R$ 760,414 (R$ 620,906 as of December 31, 2018).
As of June 30, 2019, the amount of deferred income and social contribution tax assets recognized were R$ 246,861. As of December 31, 2018, the amount were R$ 208,036, supported by the technical study of the projection of taxable profits for the realization of deferred tax assets, reviewed by the Fiscal Council and approved by the Company’s Board of Directors.
The amount of deferred taxes assets not recognized due to the uncertainty of realization is R$ 264,667 as of June 30, 2019 (R$ 220,832 as of December 31, 2018).
38
Table of Contents
Ultrapar Participações S.A. and Subsidiaries
Notes to the Parent and Consolidated Interim financial information
(In thousands of Brazilian Reais, unless otherwise stated)
| 10. | Prepaid Expenses (Consolidated) |
| 06/30/2019 | 12/31/2018 | |||||||
Rents(1) | 92,945 | 413,799 | ||||||
Advertising and publicity | 49,700 | 54,011 | ||||||
Deferred Stock Plan, net (see Note 8.c) | 19,812 | 22,737 | ||||||
Insurance premiums | 63,755 | 52,607 | ||||||
Software maintenance | 15,814 | 21,667 | ||||||
Other prepaid expenses | 24,895 | 21,844 | ||||||
|
|
|
| |||||
| 266,921 | 586,665 | |||||||
|
|
|
| |||||
Current | 159,979 | 187,570 | ||||||
Non-current | 106,942 | 399,095 | ||||||
| (1) | After the adoption of IFRS16/CPC 06 (R2), some agreements were transferred to right to use assets (see Note 2.y). |
| 11. | Contractual Assets with Customers—Exclusive Rights (Consolidated) |
Refers to exclusive rights disbursements of Ipiranga’s agreements with reseller service stations and major consumers that are recognized at the time of their occurrence and recognized as a reduction of the revenue from sales and services in the statement of profit or loss according to the conditions established in the agreement (amortization in weighted average term of five years), being reviewed as changes occur under the terms of the agreements.
Balance and changes are shown below:
| 06/30/2019 | ||||
Balance as of December 31, 2018 | 1,518,477 | |||
Additions | 126,334 | |||
Amortization | (177,818 | ) | ||
Transfer | (10,669 | ) | ||
|
| |||
Balance as of June 30, 2019 | 1,456,324 | |||
|
| |||
Current | 478,863 | |||
Non-current | 977,461 | |||
| 06/30/2018 | ||||
Balance as of December 31, 2017 | 1,502,360 | |||
Additions | 177,008 | |||
Amortization | (196,680 | ) | ||
Transfer | 611 | |||
|
| |||
Balance as of June 30, 2018 | 1,483,299 | |||
|
| |||
Current | 471,084 | |||
Non-current | 1,012,215 | |||
39
Table of Contents
Ultrapar Participações S.A. and Subsidiaries
Notes to the Parent and Consolidated Interim financial information
(In thousands of Brazilian Reais, unless otherwise stated)
| 12. | Investments |
| a. | Subsidiaries and Joint Venture (Parent Company) |
The table below presents the full amounts of statements of financial position and statements of profit or loss of subsidiaries and joint venture:
| 06/30/2019 | ||||||||||||||||||||
| Subsidiaries | Joint-venture | |||||||||||||||||||
| Ultracargo – Operações Logísticas e Participações Ltda. | Oxiteno S.A. Indústria e Comércio | Ipiranga Produtos de Petróleo S.A. | Ultrapar International S.A. | Refinaria de Petróleo Riograndense S.A. | ||||||||||||||||
Number of shares or units held | 11,839,764 | 35,102,127 | 224,467,228,244 | 49,995 | 5,078,888 | |||||||||||||||
Assets | 1,229,987 | 6,187,898 | 18,359,582 | 3,989,486 | 565,007 | |||||||||||||||
Liabilities | 2,536 | 4,288,565 | 11,209,153 | 4,011,802 | 513,662 | |||||||||||||||
Equity | 1,227,451 | 1,899,333 | (*) | 7,150,429 | (*) | (22,316 | ) | 51,345 | ||||||||||||
Net revenue from sales and services | — | 678,828 | 34,784,070 | — | 1,010,002 | |||||||||||||||
Net income (loss) | (467 | ) | 74,844 | (*) | 281,596 | (*) | (31,907 | ) | 1,568 | |||||||||||
% of capital held | 100 | 100 | 100 | 100 | 33 | |||||||||||||||
| 12/31/2018 | ||||||||||||||||||||
| Subsidiaries | Joint-venture | |||||||||||||||||||
| Ultracargo – Operações Logísticas e Participações Ltda. | Oxiteno S.A. Indústria e Comércio | Ipiranga Produtos de Petróleo S.A. | Ultrapar International S.A. | Refinaria de Petróleo Riograndense S.A. | ||||||||||||||||
Number of shares or units held | 11,839,764 | 35,102,127 | 224,467,228,244 | 49,995 | 5,078,888 | |||||||||||||||
Assets | 1,279,932 | 6,222,795 | 17,850,422 | 2,904,188 | 517,304 | |||||||||||||||
Liabilities | 2,509 | 3,416,140 | 12,434,610 | 2,894,598 | 456,714 | |||||||||||||||
Equity | 1,277,423 | 2,806,655 | (*) | 5,412,812 | (*) | 9,590 | 60,590 | |||||||||||||
% of capital held | 100 | 100 | 100 | 100 | 33 | |||||||||||||||
| 06/30/2018 | ||||||||||||||||||||
| Subsidiaries | Joint-venture | |||||||||||||||||||
| Ultracargo – Operações Logísticas e Participações Ltda. | Oxiteno S.A. Indústria e Comércio | Ipiranga Produtos de Petróleo S.A. | Ultrapar International S.A. | Refinaria de Petróleo Riograndense S.A. | ||||||||||||||||
Number of shares or units held | 11,839,764 | 35,102,127 | 224,467,228,244 | 49,995 | 5,078,888 | |||||||||||||||
Net revenue from sales and services | — | 615,020 | 35,518,210 | — | 962,307 | |||||||||||||||
Net income (loss) | 62,527 | 70,824 | (*) | 141,822 | (*) | (4,506 | ) | 3,664 | ||||||||||||
% of capital held | 100 | 100 | 100 | 100 | 33 | |||||||||||||||
| (*) | adjusted for intercompany unrealized profits. |
The percentages in the table above are rounded.
The financial information from our business segments is detailed in Note 33.
40
Table of Contents
Ultrapar Participações S.A. and Subsidiaries
Notes to the Parent and Consolidated Interim financial information
(In thousands of Brazilian Reais, unless otherwise stated)
Balances and changes in subsidiaries and joint venture are as follows:
| Investments in subsidiaries | Joint-venture | |||||||||||||||||||||||||||
| Ultracargo – Operações Logísticas e Participações Ltda. | Oxiteno S.A. Indústria e Comércio | Ipiranga Produtos de Petróleo S.A. | Ultrapar International S.A. | Total | Refinaria de Petróleo Riograndense S.A. | Total | ||||||||||||||||||||||
Balance as of December 31, 2018 | 1,277,423 | 2,806,655 | 5,415,812 | 9,590 | 9,509,480 | 20,118 | 9,529,598 | |||||||||||||||||||||
Share of profit (loss) of subsidiaries and joint venture | (467 | ) | 74,844 | 281,563 | (31,904 | ) | 324,036 | 521 | 324,557 | |||||||||||||||||||
Dividends and interest on equity (gross) | (50,015 | ) | (991,490 | ) | — | — | (1,041,505 | ) | (1,221 | ) | (1,042,726 | ) | ||||||||||||||||
Tax liabilities on equity- method revaluation reserve | — | — | (25 | ) | — | (25 | ) | — | (25 | ) | ||||||||||||||||||
Equity instrument granted | 89 | 284 | 2,863 | — | 3,236 | — | 3,236 | |||||||||||||||||||||
Valuation adjustment of subsidiaries | 19 | 15,842 | 121 | — | 15,982 | (2,369 | ) | 13,613 | ||||||||||||||||||||
Translation adjustments of foreign-based subsidiaries | — | (5,946 | ) | — | — | (5,946 | ) | — | (5,946 | ) | ||||||||||||||||||
Capital increase in cash | — | — | 1,450,000 | — | 1,450,000 | — | 1,450,000 | |||||||||||||||||||||
Redemption ofnon-controlling shares of Oxiteno Nordeste | 402 | (856 | ) | — | — | (454 | ) | — | (454 | ) | ||||||||||||||||||
|
|
|
|
|
|
|
|
|
|
|
|
|
| |||||||||||||||
Balance as of June 30, 2019 | 1,227,451 | 1,899,333 | 7,150,334 | (22,314 | ) | 10,254,804 | 17,049 | 10,271,853 | ||||||||||||||||||||
|
|
|
|
|
|
|
|
|
|
|
|
|
| |||||||||||||||
| Investments in subsidiaries | Joint-venture |
| ||||||||||||||||||||||||||
| Ultracargo – Operações Logísticas e Participações Ltda. | Oxiteno S.A. Indústria e Comércio | Ipiranga Produtos de Petróleo S.A. | Ultrapar International S.A. | Total | Refinaria de Petróleo Riograndense S.A. | Total | ||||||||||||||||||||||
Balance as of December 31, 2017 | 1,165,426 | 2,682,015 | 5,407,699 | 13,121 | 9,268,261 | 54,739 | 9,323,000 | |||||||||||||||||||||
Share of profit (loss) of subsidiaries and joint venture | 62,527 | 70,824 | 141,837 | (4,506 | ) | 270,682 | (523 | ) | 270,159 | |||||||||||||||||||
Dividends and interest on equity (gross) | — | (97,849 | ) | (353,824 | ) | — | (451,673 | ) | (31,174 | ) | (482,847 | ) | ||||||||||||||||
Tax liabilities on equity- method revaluation reserve | — | — | (2 | ) | — | (2 | ) | — | (2 | ) | ||||||||||||||||||
Equity instrument granted | 27 | 103 | 1,514 | — | 1,644 | — | 1,644 | |||||||||||||||||||||
Valuation adjustment of subsidiaries | (115 | ) | (207,676 | ) | (1,855 | ) | 35 | (209,611 | ) | 2,547 | (207,064 | ) | ||||||||||||||||
Translation adjustments of foreign-based subsidiaries | — | 44,668 | (280 | ) | — | 44,388 | — | 44,388 | ||||||||||||||||||||
|
|
|
|
|
|
|
|
|
|
|
|
|
| |||||||||||||||
Balance as of June 30, 2018 | 1,227,865 | 2,492,085 | 5,195,089 | 8,650 | 8,923,689 | 25,589 | 8,949,278 | |||||||||||||||||||||
|
|
|
|
|
|
|
|
|
|
|
|
|
| |||||||||||||||
41
Table of Contents
Ultrapar Participações S.A. and Subsidiaries
Notes to the Parent and Consolidated Interim financial information
(In thousands of Brazilian Reais, unless otherwise stated)
| b. | Joint Ventures (Consolidated) |
The Company holds an interest in Refinaria de Petróleo Riograndense (“RPR”), which is primarily engaged in oil refining.
The subsidiary Ultracargo – Operações Logísticas e Participações Ltda. (“Ultracargo Participações”) holds an interest in União Vopak – Armazéns Gerais Ltda. (“União Vopak”), which is primarily engaged in liquid bulk storage in the port of Paranaguá.
The subsidiary IPP holds an interest in ConectCar, which is primarily engaged in automatic payment of tolls and parking in the States of Bahia, Ceará, Espírito Santo, Goiás, Mato Grosso, Mato Grosso do Sul, Minas Gerais, Paraná, Pernambuco, Rio de Janeiro, Rio Grande do Sul, Santa Catarina, São Paulo and Distrito Federal.
These investments are accounted for under the equity method of accounting based on their interim financial information as of June 30, 2019.
Balances and changes in joint ventures are as follows:
| União Vopak | RPR | ConectCar | Total | |||||||||||||
Balance as of December 31, 2018 | 7,446 | 20,118 | 74,390 | 101,954 | ||||||||||||
Capital increase | — | — | 8,750 | 8,750 | ||||||||||||
Valuation adjustments | — | (2,369 | ) | — | (2,369 | ) | ||||||||||
Dividends and interest on equity (gross) | (1,473 | ) | (1,221 | ) | — | (2,694 | ) | |||||||||
Share of profit (loss) of joint ventures | 1,082 | 521 | (12,920 | ) | (11,317 | ) | ||||||||||
|
|
|
|
|
|
|
| |||||||||
Balance as of June 30, 2019 | 7,055 | 17,049 | 70,220 | 94,324 | ||||||||||||
|
|
|
|
|
|
|
| |||||||||
| União Vopak | RPR | ConectCar | Total | |||||||||||||
Balance as of December 31, 2017 | 6,096 | 54,739 | 61,226 | 122,061 | ||||||||||||
Capital increase | — | — | 16,000 | 16,000 | ||||||||||||
Valuation adjustments | — | 2,547 | — | 2,547 | ||||||||||||
Dividends and interest on equity (gross) | — | (31,174 | ) | — | (31,174 | ) | ||||||||||
Share of profit (loss) of joint ventures | 1,383 | (523 | ) | (8,307 | ) | (7,447 | ) | |||||||||
|
|
|
|
|
|
|
| |||||||||
Balance as of June 30, 2018 | 7,479 | 25,589 | 68,919 | 101,987 | ||||||||||||
|
|
|
|
|
|
|
| |||||||||
The table below presents the statements of financial position and statements of profit or loss of joint ventures:
| 06/30/2019 | ||||||||||||
| União Vopak | RPR | ConectCar | ||||||||||
Current assets | 8,012 | 419,719 | 133,693 | |||||||||
Non-current assets | 8,103 | 145,288 | 154,242 | |||||||||
Current liabilities | 1,833 | 440,567 | 146,593 | |||||||||
Non-current liabilities | 172 | 73,095 | 904 | |||||||||
Equity | 14,110 | 51,345 | 140,438 | |||||||||
Net revenue from sales and services | 8,404 | 1,010,002 | 36,584 | |||||||||
Costs, operating expenses and income | (5,922 | ) | (1,007,683 | ) | (63,856 | ) | ||||||
Net financial income and income and social contribution taxes | (316 | ) | (751 | ) | 1,432 | |||||||
Net income (loss) | 2,166 | 1,568 | (25,840 | ) | ||||||||
Number of shares or units held | 29,995 | 5,078,888 | 193,768,000 | |||||||||
% of capital held | 50 | 33 | 50 | |||||||||
42
Table of Contents
Ultrapar Participações S.A. and Subsidiaries
Notes to the Parent and Consolidated Interim financial information
(In thousands of Brazilian Reais, unless otherwise stated)
| 12/31/2018 | ||||||||||||
| União Vopak | RPR | ConectCar | ||||||||||
Current assets | 8,432 | 370,250 | 129,152 | |||||||||
Non-current assets | 8,552 | 147,054 | 150,054 | |||||||||
Current liabilities | 1,814 | 385,079 | 130,414 | |||||||||
Non-current liabilities | 280 | 71,635 | 14 | |||||||||
Equity | 14,890 | 60,590 | 148,778 | |||||||||
Number of shares or units held | 29,995 | 5,078,888 | 193,768,000 | |||||||||
% of capital held | 50 | 33 | 50 | |||||||||
| 06/30/2018 | ||||||||||||
| União Vopak | RPR | ConectCar | ||||||||||
Net revenue from sales and services | 9,966 | 962,307 | 26,939 | |||||||||
Costs, operating expenses and income | (5,872 | ) | (960,859 | ) | (52,805 | ) | ||||||
Net financial income and income and social contribution taxes | (1,326 | ) | 2,216 | 9,254 | ||||||||
Net income (loss) | 2,768 | 3,664 | (16,612 | ) | ||||||||
Number of shares or units held | 29,995 | 5,078,888 | 193,768,000 | |||||||||
% of capital held | 50 | 33 | 50 | |||||||||
The percentages in the table above are rounded.
| c. | Associates (Consolidated) |
Subsidiary IPP holds an interest in Transportadora Sulbrasileira de Gás S.A., which is primarily engaged in natural gas transportation services.
Subsidiary Oxiteno S.A. holds an interest in Oxicap Indústria de Gases Ltda. (“Oxicap”), which is primarily engaged in the supply of nitrogen and oxygen for its shareholders in the Mauá petrochemical complex.
Subsidiary Oxiteno Nordeste holds an interest in Química da Bahia Indústria e Comércio S.A., which is primarily engaged in manufacturing, marketing, and processing of chemicals. The operations of this associate are currently suspended.
Subsidiary Cia. Ultragaz holds an interest in Metalúrgica Plus S.A., which is primarily engaged in the manufacture and trading of LPG containers. The operations of this associate are currently suspended.
Subsidiary IPP holds an interest in Plenogás Distribuidora de Gás S.A., which is primarily engaged in the marketing of LPG. The operations of this associate are currently suspended.
The investment of subsidiary Oxiteno S.A. in the associate Oxicap is accounted for under the equity method of accounting based on its financial information as of May 31, 2019, while the other associates are valued based on the interim financial information as of June 30, 2019.
Balances and changes in associates are as follows:
| Transportadora Sulbrasileira de Gás S.A. | Oxicap Indústria de Gases Ltda. | Química da Bahia Indústria e Comércio S.A. | Metalúrgica Plus S.A. | Plenogás Distribuidora de Gás S.A. | Total | |||||||||||||||||||
Balance as of December 31, 2018 | 4,689 | 15,366 | 3,590 | 228 | 465 | 24,338 | ||||||||||||||||||
Dividends | (381 | ) | — | — | — | 30 | (351 | ) | ||||||||||||||||
Share of profit (loss) of associates | 921 | 360 | (19 | ) | (46 | ) | 53 | 1,269 | ||||||||||||||||
|
|
|
|
|
|
|
|
|
|
|
| |||||||||||||
Balance as of June 30, 2019 | 5,229 | 15,726 | 3,571 | 182 | 548 | 25,256 | ||||||||||||||||||
|
|
|
|
|
|
|
|
|
|
|
| |||||||||||||
43
Table of Contents
Ultrapar Participações S.A. and Subsidiaries
Notes to the Parent and Consolidated Interim financial information
(In thousands of Brazilian Reais, unless otherwise stated)
| Transportadora Sulbrasileira de Gás S.A. | Oxicap Indústria de Gases Ltda. | Química da Bahia Indústria e Comércio S.A. | Metalúrgica Plus S.A. | Plenogás Distribuidora de Gás S.A. | Total | |||||||||||||||||||
Balance as of December 31, 2017 | 6,348 | 14,458 | 3,618 | 340 | 577 | 25,341 | ||||||||||||||||||
Capital reduction | (1,250 | ) | — | — | — | — | (1,250 | ) | ||||||||||||||||
Dividends | (839 | ) | — | — | — | (206 | ) | (1,045 | ) | |||||||||||||||
Share of profit (loss) of associates | 525 | 546 | (27 | ) | (69 | ) | 95 | 1,070 | ||||||||||||||||
|
|
|
|
|
|
|
|
|
|
|
| |||||||||||||
Balance as of June 30, 2018 | 4,784 | 15,004 | 3,591 | 271 | 466 | 24,116 | ||||||||||||||||||
|
|
|
|
|
|
|
|
|
|
|
| |||||||||||||
The table below presents the statements of financial position and statements of profit or loss of associates:
| 06/30/2019 | ||||||||||||||||||||
| Transportadora Sulbrasileira de Gás S.A. | Oxicap Indústria de Gases Ltda. | Química da Bahia Indústria e Comércio S.A. | Metalúrgica Plus S.A. | Plenogás Distribuidora de Gás S.A. | ||||||||||||||||
Current assets | 8,657 | 45,004 | 10 | 39 | 153 | |||||||||||||||
Non-current assets | 14,651 | 84,476 | 10,241 | 847 | 2,790 | |||||||||||||||
Current liabilities | 1,788 | 12,383 | — | 37 | 46 | |||||||||||||||
Non-current liabilities | 602 | 9,266 | 3,110 | 302 | 1,250 | |||||||||||||||
Equity | 20,918 | 107,831 | 7,141 | 547 | 1,647 | |||||||||||||||
Net revenue from sales and services | 6,530 | 27,566 | — | — | — | |||||||||||||||
Costs, operating expenses and income | (2,524 | ) | (23,799 | ) | (48 | ) | (111 | ) | 170 | |||||||||||
Net financial income and income and social contribution taxes | (107 | ) | (1,380 | ) | 10 | (28 | ) | (11 | ) | |||||||||||
Net income (loss) | 3,899 | 2,387 | (38 | ) | (139 | ) | 159 | |||||||||||||
Number of shares or units held | 20,124,996 | 1,987 | 1,493,120 | 3,000 | 1,384,308 | |||||||||||||||
% of capital held | 25 | 15 | 50 | 33 | 33 | |||||||||||||||
| 12/31/2018 | ||||||||||||||||||||
| Transportadora Sulbrasileira de Gás S.A. | Oxicap Indústria de Gases Ltda. | Química da Bahia Indústria e Comércio S.A. | Metalúrgica Plus S.A. | Plenogás Distribuidora de Gás S.A. | ||||||||||||||||
Current assets | 7,803 | 38,714 | 51 | 19 | 64 | |||||||||||||||
Non-current assets | 15,254 | 85,395 | 10,238 | 990 | 2,791 | |||||||||||||||
Current liabilities | 3,963 | 9,777 | — | 21 | 123 | |||||||||||||||
Non-current liabilities | 332 | 8,888 | 3,109 | 302 | 1,334 | |||||||||||||||
Equity | 18,762 | 105,444 | 7,180 | 686 | 1,398 | |||||||||||||||
Number of shares or units held | 20,124,996 | 1,987 | 1,493,120 | 3,000 | 1,384,308 | |||||||||||||||
% of capital held | 25 | 15 | 50 | 33 | 33 | |||||||||||||||
44
Table of Contents
Ultrapar Participações S.A. and Subsidiaries
Notes to the Parent and Consolidated Interim financial information
(In thousands of Brazilian Reais, unless otherwise stated)
| 06/30/2018 | ||||||||||||||||||||
| Transportadora Sulbrasileira de Gás S.A. | Oxicap Indústria de Gases Ltda. | Química da Bahia Indústria e Comércio S.A. | Metalúrgica Plus S.A. | Plenogás Distribuidora de Gás S.A. | ||||||||||||||||
Net revenue from sales and services | 5,214 | 25,962 | — | — | — | |||||||||||||||
Costs, operating expenses and income | (2,878 | ) | (20,387 | ) | (5 | ) | (199 | ) | 295 | |||||||||||
Net financial income and income and social contribution taxes | (116 | ) | (1,955 | ) | 6 | (8 | ) | (9 | ) | |||||||||||
Net income (loss) | 2,220 | 3,620 | 1 | (207 | ) | 286 | ||||||||||||||
Number of shares or units held | 20,124,996 | 1,987 | 1,493,120 | 3,000 | 1,384,308 | |||||||||||||||
% of capital held | 25 | 15 | 50 | 33 | 33 | |||||||||||||||
The percentages in the table above are rounded.
| 13. | Right to Use Assets and Leases payable (Consolidated) |
Some of the subsidiaries of the Company have real estate leases, substantially related to: (i) Ipiranga: fuel stations and distribution center; (ii) Extrafarma: pharmacies and distribution center; (iii) Ultragaz: points of sale and bottling base; (iv) Ultracargo: port areas; and (v) Oxiteno: industrial plant. Some subsidiaries also have lease agreements relating to vehicles.
| a. | Right to Use Assets |
| Weighted average useful life (years) | Adoption IFRS 16 / CPC 06 (R2) | Additions and remeasure- ment | Write- offs | Transfer | Effect of foreign currency exchange rate variation | Amortization | Balance on 06/30/2019 | |||||||||||||||||||||||||
Cost: | ||||||||||||||||||||||||||||||||
Real estate | 7 | 1,636,330 | 228,029 | (14,450 | ) | 26,106 | 30,320 | — | 1,906,335 | |||||||||||||||||||||||
Other | 4 | 95,097 | 16,403 | (1,044 | ) | 27,847 | 186 | — | 138,489 | |||||||||||||||||||||||
|
|
|
|
|
|
|
|
|
|
|
|
|
| |||||||||||||||||||
| 1,731,427 | 244,432 | (15,494 | ) | 53,953 | 30,506 | — | 2,044,824 | |||||||||||||||||||||||||
|
|
|
|
|
|
|
|
|
|
|
|
|
| |||||||||||||||||||
Accumulated amortization: | ||||||||||||||||||||||||||||||||
Real estate | — | — | 475 | — | — | (134,422 | ) | (133,947 | ) | |||||||||||||||||||||||
Other | — | — | 142 | (13,587 | ) | — | (18,835 | ) | (32,280 | ) | ||||||||||||||||||||||
|
|
|
|
|
|
|
|
|
|
|
|
|
| |||||||||||||||||||
| — | — | 617 | (13,587 | ) | — | (153,257 | ) | (166,227 | ) | |||||||||||||||||||||||
|
|
|
|
|
|
|
|
|
|
|
|
|
| |||||||||||||||||||
Net amount | 1,731,427 | 244,432 | (14,877 | ) | 40,366 | 30,506 | (153,257 | ) | 1,878,597 | |||||||||||||||||||||||
|
|
|
|
|
|
|
|
|
|
|
|
|
| |||||||||||||||||||
45
Table of Contents
Ultrapar Participações S.A. and Subsidiaries
Notes to the Parent and Consolidated Interim financial information
(In thousands of Brazilian Reais, unless otherwise stated)
| b. | Leases payable |
The changes in leases payable are shown below:
Balance as of December 31, 2018 | 46,066 | |||
Adoption IFRS 16/CPC 06 (R2) | 1,363,803 | |||
Interest accrued | 45,800 | |||
Payments | (155,148 | ) | ||
Additions and remeasurement | 244,432 | |||
Write-offs | (15,025 | ) | ||
Effect of foreign currency exchange rate variation | 34,786 | |||
|
| |||
Balance as of June 30, 2019 | 1,564,714 | |||
|
| |||
Current | 203,469 | |||
Non-current | 1,361,245 |
The future disbursements (installments) assumed under leases contracts are presented below:
| 06/30/2019 | ||||
Up to 1 year | 329,139 | |||
From 1 to 2 years | 556,972 | |||
From 2 to 3 years | 430,334 | |||
From 3 to 4 years | 362,889 | |||
From 4 to 5 years | 254,332 | |||
More than 5 years | 630,033 | |||
|
| |||
Total | 2,563,699 | |||
|
| |||
The contracts related to the leases payable are substantially indexed by theIGP-M (General Market Price Index is a measure of Brazilian inflation, calculated by the Getúlio Vargas Foundation).
| c. | Lease Contracts of Low Amount Assets |
Subsidiaries Cia. Ultragaz, Bahiana, Tequimar, Serma, and Oxiteno S.A. have operating lease contracts for the use of IT equipment. These contracts have terms from 36 to 48 months. The subsidiaries have the option to purchase the assets at a price equal to the fair market price on the date of option, and management does not intend to exercise such option. The future disbursements (installments), assumed under these contracts, amount approximately to:
| Up to 1 year | Between 1 and 5 years | More than 5 years | Total | |||||||||||||
06/30/2019 | 6,956 | 5,284 | — | 12,240 | ||||||||||||
The expense recognized for thesix-month period ended June 30, 2019 was R$ 4,063 (R$ 6,291 for thesix-month period ended June 30, 2018).
46
Table of Contents
Ultrapar Participações S.A. and Subsidiaries
Notes to the Parent and Consolidated Interim financial information
(In thousands of Brazilian Reais, unless otherwise stated)
| 14. | Property, Plant, and Equipment (Consolidated) |
Balances and changes in PP&E are as follows:
| Weighted average useful life (years) | Balance on 12/31/2018 | Additions | Depreciation | Transfer (i) | Write- offs and disposals | Effect of foreign currency exchange rate variation | Balance on 06/30/2019 | |||||||||||||||||||||||||
Cost: | ||||||||||||||||||||||||||||||||
Land | — | 620,879 | — | — | 4,784 | — | (808 | ) | 624,855 | |||||||||||||||||||||||
Buildings | 32 | 1,801,073 | 2,194 | — | 45,317 | (394 | ) | (4,871 | ) | 1,843,319 | ||||||||||||||||||||||
Leasehold improvements | 8 | 1,015,640 | 6,370 | — | 40,277 | (14,439 | ) | (7 | ) | 1,047,841 | ||||||||||||||||||||||
Machinery and equipment | 13 | 5,219,256 | 53,198 | — | 98,080 | (1,957 | ) | (29,186 | ) | 5,339,391 | ||||||||||||||||||||||
Automotive fuel/lubricant distribution equipment and facilities | 14 | 2,864,333 | 50,537 | — | 60,389 | (20,494 | ) | — | 2,954,765 | |||||||||||||||||||||||
LPG tanks and bottles | 10 | 743,016 | 23,487 | — | (6,993 | ) | (18,701 | ) | — | 740,809 | ||||||||||||||||||||||
Vehicles | 7 | 308,756 | 11,656 | — | 622 | (10,809 | ) | (176 | ) | 310,049 | ||||||||||||||||||||||
Furniture and utensils | 9 | 279,016 | 6,711 | — | 1,878 | (1,976 | ) | (596 | ) | 285,033 | ||||||||||||||||||||||
Construction in progress | — | 922,799 | 268,932 | — | (255,857 | ) | — | (2,243 | ) | 933,631 | ||||||||||||||||||||||
Advances to suppliers | — | 14,088 | 5,794 | — | (8,921 | ) | — | — | 10,961 | |||||||||||||||||||||||
Imports in progress | — | 41 | 3,248 | — | (384 | ) | — | (1 | ) | 2,904 | ||||||||||||||||||||||
IT equipment | 5 | 395,063 | 6,593 | — | 59 | (2,735 | ) | (37 | ) | 398,943 | ||||||||||||||||||||||
|
|
|
|
|
|
|
|
|
|
|
|
|
| |||||||||||||||||||
| 14,183,960 | 438,720 | — | (20,749 | ) | (71,505 | ) | (37,925 | ) | 14,492,501 | |||||||||||||||||||||||
|
|
|
|
|
|
|
|
|
|
|
|
|
| |||||||||||||||||||
Accumulated depreciation: | ||||||||||||||||||||||||||||||||
Buildings | (743,117 | ) | — | (27,503 | ) | 322 | 3,003 | (767,295 | ) | |||||||||||||||||||||||
Leasehold improvements | (558,042 | ) | — | (42,277 | ) | 2,224 | 13,678 | 2 | (584,415 | ) | ||||||||||||||||||||||
Machinery and equipment | (2,969,209 | ) | — | (146,767 | ) | 3,034 | 1,697 | 22,502 | (3,088,743 | ) | ||||||||||||||||||||||
Automotive fuel/lubricant distribution equipment and facilities | (1,657,608 | ) | — | (80,934 | ) | — | 17,726 | — | (1,720,816 | ) | ||||||||||||||||||||||
LPG tanks and bottles | (401,056 | ) | — | (31,787 | ) | 4,467 | 10,161 | — | (418,215 | ) | ||||||||||||||||||||||
Vehicles | (123,650 | ) | — | (13,806 | ) | 28 | 5,925 | 174 | (131,329 | ) | ||||||||||||||||||||||
Furniture and utensils | (155,339 | ) | — | (8,912 | ) | (12 | ) | 1,937 | 589 | (161,737 | ) | |||||||||||||||||||||
IT equipment | (288,083 | ) | — | (17,331 | ) | — | 2,656 | 23 | (302,735 | ) | ||||||||||||||||||||||
|
|
|
|
|
|
|
|
|
|
|
|
|
| |||||||||||||||||||
| (6,896,104 | ) | — | (369,317 | ) | 9,741 | 54,102 | 26,293 | (7,175,285 | ) | |||||||||||||||||||||||
|
|
|
|
|
|
|
|
|
|
|
|
|
| |||||||||||||||||||
47
Table of Contents
Ultrapar Participações S.A. and Subsidiaries
Notes to the Parent and Consolidated Interim financial information
(In thousands of Brazilian Reais, unless otherwise stated)
| Balance on 12/31/2018 | Additions | Depreciation | Transfer (i) | Write- offs and disposals | Effect of foreign currency exchange rate variation | Balance on 06/30/2019 | ||||||||||||||||||||||
Provision for losses: | ||||||||||||||||||||||||||||
Advances to suppliers | (83 | ) | (28 | ) | — | — | — | — | (111 | ) | ||||||||||||||||||
Buildings | (306 | ) | — | — | — | — | — | (306 | ) | |||||||||||||||||||
Land | (827 | ) | — | — | — | — | — | (827 | ) | |||||||||||||||||||
Leasehold improvements | (1,385 | ) | 729 | — | — | — | 7 | (649 | ) | |||||||||||||||||||
Machinery and equipment | (6,117 | ) | — | — | — | — | 23 | (6,094 | ) | |||||||||||||||||||
Automotive fuel/lubricant distribution equipment and facilities | (165 | ) | — | — | — | 54 | — | (111 | ) | |||||||||||||||||||
Construction in progress | (38 | ) | — | — | — | — | — | (38 | ) | |||||||||||||||||||
Furniture and utensils | (70 | ) | — | — | — | — | — | (70 | ) | |||||||||||||||||||
|
|
|
|
|
|
|
|
|
|
|
|
|
| |||||||||||||||
| (8,991 | ) | 701 | — | — | 54 | 30 | (8,206 | ) | ||||||||||||||||||||
|
|
|
|
|
|
|
|
|
|
|
|
|
| |||||||||||||||
Net amount | 7,278,865 | 439,421 | (369,317 | ) | (11,008 | ) | (17,349 | ) | (11,602 | ) | 7,309,010 | |||||||||||||||||
|
|
|
|
|
|
|
|
|
|
|
|
|
| |||||||||||||||
| (i) | Refers to amounts transferred to intangible assets and inventories. |
Construction in progress relates substantially to expansions, renovations, constructions and upgrade of industrial facilities, terminals, stores, service stations and distribution bases.
Advances to suppliers is related, basically, to manufacturing of assets for expansion of plants, terminals, stores and bases and acquisition of real estate.
48
Table of Contents
Ultrapar Participações S.A. and Subsidiaries
Notes to the Parent and Consolidated Interim financial information
(In thousands of Brazilian Reais, unless otherwise stated)
| 15. | Intangible Assets (Consolidated) |
Balances and changes in intangible assets are as follows:
| Weighted average useful life (years) | Balance on 12/31/2018 | Adoption IFRS 16 / CPC 06 (R2) | Additions | Amortization | Transfer (i) | Write-offs and disposals | Effect of foreign currency exchange rate variation | Balance on 06/30/2019 | ||||||||||||||||||||||||||||
Cost: | ||||||||||||||||||||||||||||||||||||
Goodwill (a) | — | 1,525,088 | — | — | — | — | — | — | 1,525,088 | |||||||||||||||||||||||||||
Software (b) | 5 | 1,062,486 | — | 41,739 | — | 2,370 | (94 | ) | (169 | ) | 1,106,332 | |||||||||||||||||||||||||
Technology (c) | 5 | 32,617 | — | — | — | — | — | — | 32,617 | |||||||||||||||||||||||||||
Commercial property rights | 10 | 64,032 | (56,813 | ) | 2,545 | — | (1,466 | ) | (461 | ) | — | 7,837 | ||||||||||||||||||||||||
Distribution rights | 6 | 142,989 | — | 1,504 | — | (10,895 | ) | — | — | 133,598 | ||||||||||||||||||||||||||
Brands (d) | — | 120,571 | — | — | — | — | — | (528 | ) | 120,043 | ||||||||||||||||||||||||||
Trademark rights (d) | 39 | 114,792 | — | — | — | — | — | — | 114,792 | |||||||||||||||||||||||||||
Others (e) | 10 | 43,281 | — | 1,300 | — | (355 | ) | — | (152 | ) | 44,074 | |||||||||||||||||||||||||
|
|
|
|
|
|
|
|
|
|
|
|
|
|
|
| |||||||||||||||||||||
| 3,105,856 | (56,813 | ) | 47,088 | — | (10,346 | ) | (555 | ) | (849 | ) | 3,084,381 | |||||||||||||||||||||||||
|
|
|
|
|
|
|
|
|
|
|
|
|
|
|
| |||||||||||||||||||||
Accumulated amortization: | ||||||||||||||||||||||||||||||||||||
Software | (537,438 | ) | — | — | (47,773 | ) | 13 | 88 | 267 | (584,843 | ) | |||||||||||||||||||||||||
Technology | (32,613 | ) | — | — | (3 | ) | — | — | — | (32,616 | ) | |||||||||||||||||||||||||
Commercial property rights | (23,931 | ) | 16,885 | — | (60 | ) | (512 | ) | 461 | — | (7,157 | ) | ||||||||||||||||||||||||
Distribution rights | (106,597 | ) | — | — | (3,424 | ) | 4,177 | — | — | (105,844 | ) | |||||||||||||||||||||||||
Trademark rights | (3,182 | ) | — | — | (1,469 | ) | — | — | — | (4,651 | ) | |||||||||||||||||||||||||
Others | (32,740 | ) | — | — | (52 | ) | 137 | — | 1 | (32,654 | ) | |||||||||||||||||||||||||
|
|
|
|
|
|
|
|
|
|
|
|
|
|
|
| |||||||||||||||||||||
| (736,501 | ) | 16,885 | — | (52,781 | ) | 3,815 | 549 | 268 | (767,765 | ) | ||||||||||||||||||||||||||
|
|
|
|
|
|
|
|
|
|
|
|
|
|
|
| |||||||||||||||||||||
Net amount | 2,369,355 | (39,928 | ) | 47,088 | (52,781 | ) | (6,531 | ) | (6 | ) | (581 | ) | 2,316,616 | |||||||||||||||||||||||
|
|
|
|
|
|
|
|
|
|
|
|
|
|
|
| |||||||||||||||||||||
| (i) | Refers to amounts transferred to PP&E and trade receivables. |
The amortization expenses were recognized in the interim financial information as shown below:
| 06/30/2019 | 06/30/2018 | |||||||
Inventories and cost of products and services sold | 5,731 | 5,618 | ||||||
Selling and marketing | 1,501 | 2,965 | ||||||
General and administrative | 45,549 | 33,372 | ||||||
|
|
|
| |||||
| 52,781 | 41,955 | |||||||
|
|
|
| |||||
49
Table of Contents
Ultrapar Participações S.A. and Subsidiaries
Notes to the Parent and Consolidated Interim financial information
(In thousands of Brazilian Reais, unless otherwise stated)
| a. | Goodwill |
The balance of the goodwill is tested annually for impairment and is represented by the following acquisitions:
| Segment | 06/30/2019 | 12/31/2018 | ||||||||||
Goodwill on the acquisition of: | ||||||||||||
Extrafarma | Extrafarma | 661,553 | 661,553 | |||||||||
Ipiranga(1) | Ipiranga | 276,724 | 276,724 | |||||||||
União Terminais | Ultracargo | 211,089 | 211,089 | |||||||||
Texaco | Ipiranga | 177,759 | 177,759 | |||||||||
CBLSA | Ipiranga | 69,807 | 69,807 | |||||||||
Oxiteno Uruguay | Oxiteno | 44,856 | 44,856 | |||||||||
Temmar | Ultracargo | 43,781 | 43,781 | |||||||||
DNP | Ipiranga | 24,736 | 24,736 | |||||||||
Repsol | Ultragaz | 13,403 | 13,403 | |||||||||
TEAS | Ultracargo | 797 | 797 | |||||||||
Others | Oxiteno | 583 | 583 | |||||||||
|
|
|
| |||||||||
| 1,525,088 | 1,525,088 | |||||||||||
|
|
|
| |||||||||
| (1) | Including R$ 246,163 at Ultrapar. |
On December 31, 2018, the Company tested the balances of goodwill shown in the table above for impairment. The determination of value in use involves assumptions, judgments, and estimates of cash flows, such as growth rates of revenues, costs and expenses, estimates of investments and working capital, and discount rates. The assumptions about growth projections and future cash flows are based on the Company’s business plan of its operating segments, as well as comparable market data, and represent management’s best estimate of the economic conditions that will exist over the economic life of the various CGUs, to which goodwill is related.
The mainkey-assumptions used by the Company to calculate the value in use are described below:
Period of evaluation: the evaluation of the value in use is calculated for a period of five years (except the Extrafarma segment), after which the Company calculated the perpetuity, considering the possibility of carrying the business on indefinitely. For the Extrafarma segment, a period of ten years was used due to a four-year period to maturity of new stores were considered.
Discount and real growth rates: on December 31, 2018, the discount and real growth rates used to extrapolate the projections ranged from 8.4% to 13.9% and from 0% to 1% p.a., respectively, depending on the CGU analyzed.
Revenue from sales and services, costs and expenses, and gross margin: considers the budget prepared for 2019 and the long-term strategic plan prepared by management and approved by the Board of Directors.
50
Table of Contents
Ultrapar Participações S.A. and Subsidiaries
Notes to the Parent and Consolidated Interim financial information
(In thousands of Brazilian Reais, unless otherwise stated)
The Company assessed a sensitivity analysis of discount and growth rate of perpetuity, due to their significant impact on cash flows and value in use. An increase of 0.5 percentage points in the discount rate or a decrease of 0.5 percentage points in the growth rate of the perpetuity of the cash flow of each business segment would not result in the recognition of impairment.
| b. | Software |
Includes user licenses and costs for the implementation of the various systems used by the Company and its subsidiaries, such as: integrated management and control, financial management, foreign trade, industrial automation, operational and storage management, accounting information, and other systems.
| c. | Technology |
The subsidiaries Oxiteno S.A., Oxiteno Nordeste and Oleoquímica recognize as technology certain rights of use held by them. Such licenses include the production of ethylene oxide, ethylene glycols, ethanolamines, glycol ethers, ethoxylates, solvents, fatty acids from vegetable oils, fatty alcohols, and specialty chemicals, which are products that are supplied to various industries.
| d. | Brands and Trademark rights |
Brands are represented by the acquisition cost of the ‘am/pm’ brand in Brazil and of the Extrafarma brand, acquired in the business combination, and Chevron and Texaco trademark rights.
| e. | Other intangibles |
Refers mainly to the loyalty program “Clube Extrafarma”.
51
Table of Contents
Ultrapar Participações S.A. and Subsidiaries
Notes to the Parent and Consolidated Interim financial information
(In thousands of Brazilian Reais, unless otherwise stated)
| 16. | Loans and Debentures |
| a. | Composition |
| a.1 | Parent |
Description | 06/30/2019 | 12/31/2018 | Index/ Currency | Weighted average financial charges 06/30/2019 – % p.a. | Maturity | |||||||||||||||
Brazilian Reais: | ||||||||||||||||||||
Debentures –6th issuance (g.5) | 1,757,911 | 1,756,954 | CDI | 105.3 | 2023 | |||||||||||||||
|
|
|
| |||||||||||||||||
Current | 34,921 | 34,504 | ||||||||||||||||||
Non-current | 1,722,990 | 1,722,450 | ||||||||||||||||||
| a.2 | Consolidated |
Description | 06/30/2019 | 12/31/2018 | Index/Currency | Weighted average financial charges 06/30/2019 – % p.a. | Maturity | |||||||||||||||
Foreign currency—denominated loans: | ||||||||||||||||||||
Notes in the foreign market (b) (*) | 4,000,024 | 2,889,631 | US$ | +5.3 | 2026 to 2029 | |||||||||||||||
Foreign loan (c.1) (*) | 1,025,693 | 985,268 | US$ | +3.9 | 2021 to 2023 | |||||||||||||||
Financial institutions (e) | 612,585 | 620,605 | US$ + LIBOR (1) | +2.1 | 2019 to 2023 | |||||||||||||||
Foreign loan (c.1) (*) | 589,536 | 582,106 | US$ + LIBOR (1) | +0.9 | 2022 to 2023 | |||||||||||||||
Foreign loan (c.2) | 231,979 | 234,363 | US$ + LIBOR (1) | +2.0 | 2020 | |||||||||||||||
Financial institutions (e) | 125,724 | 127,288 | US$ | +2.9 | 2019 to 2022 | |||||||||||||||
Financial institutions (e) | 20,192 | 27,845 | MX$ (2) | +9.6 | 2019 | |||||||||||||||
Financial institutions (e) | 18,056 | 3,950 | MX$ + TIIE (2) | +1.5 | 2019 | |||||||||||||||
BNDES (d) | 1,394 | 2,596 | US$ | +6.5 | 2019 to 2020 | |||||||||||||||
Foreign currency advances delivered | 119 | 1,485 | US$ | +3.6 | < 10 days | |||||||||||||||
Advances on foreign exchange contracts | — | 11,702 | US$ | |||||||||||||||||
|
| �� |
| |||||||||||||||||
Total foreign currency | 6,625,302 | 5,486,839 | ||||||||||||||||||
|
|
|
| |||||||||||||||||
52
Table of Contents
Ultrapar Participações S.A. and Subsidiaries
Notes to the Parent and Consolidated Interim financial information
(In thousands of Brazilian Reais, unless otherwise stated)
Description | 06/30/2019 | 12/31/2018 | Index/ Currency | Weighted average financial charges 06/30/2019 – % p.a. | Maturity | |||||||||||||||
Brazilian Reais – denominated loans: | ||||||||||||||||||||
Debentures – CRA (g.2, g.4 and g.6) | 2,036,040 | 2,029,545 | CDI | 95.8 | 2022 to 2023 | |||||||||||||||
Debêntures – Ipiranga (g.1 and g.3) | 1,923,198 | 2,039,743 | CDI | 105.0 | 2020 to 2022 | |||||||||||||||
Debentures –6th issuance (g.5) | 1,757,911 | 1,756,954 | CDI | 105.3 | 2023 | |||||||||||||||
Banco do Brasil floating rate (f) | 1,013,923 | 2,614,704 | CDI | 110.9 | 2020 to 2022 | |||||||||||||||
Debentures – CRA (g.2, g.4 and g.6) (*) | 902,811 | 833,213 | IPCA | +4.6 | 2024 to 2025 | |||||||||||||||
BNDES (d) | 103,663 | 147,922 | TJLP (3) | +2.4 | 2019 to 2023 | |||||||||||||||
Bank Credit Bill | 51,992 | 50,075 | CDI | 124.0 | 2019 | |||||||||||||||
FINEP | 47,184 | 53,245 | TJLP (3) | +1.6 | 2019 to 2023 | |||||||||||||||
BNDES (d) | 41,312 | 51,467 | SELIC (5) | +2.3 | 2019 to 2023 | |||||||||||||||
FINEP | 16,031 | 22,553 | R$ | +4.0 | 2019 to 2021 | |||||||||||||||
Banco do Nordeste do Brasil | 12,904 | 15,776 | R$ (4) | +8.5 | 2019 to 2021 | |||||||||||||||
BNDES (d) | 8,560 | 14,071 | R$ | +6.5 | 2019 to 2022 | |||||||||||||||
FINAME | 27 | 32 | TJLP (3) | +5.7 | 2019 to 2022 | |||||||||||||||
|
|
|
| |||||||||||||||||
Total Brazilian Reais | 7,915,556 | 9,629,300 | ||||||||||||||||||
|
|
|
| |||||||||||||||||
Total foreign currency and Brazilian Reais | 14,540,858 | 15,116,139 | ||||||||||||||||||
Currency and interest rate hedging instruments (**) | 29,724 | 43,944 | ||||||||||||||||||
|
|
|
| |||||||||||||||||
Total | 14,570,582 | 15,160,083 | ||||||||||||||||||
|
|
|
| |||||||||||||||||
Current | 1,296,153 | 2,271,148 | ||||||||||||||||||
Non-current | 13,274,429 | 12,888,935 | ||||||||||||||||||
| (*) | These transactions were designated for hedge accounting (see Note 34.h). |
| (**) | Accumulated losses (see Note 34.g). |
| (1) | LIBOR = London Interbank Offered Rate. |
| (2) | MX$ = Mexican Peso; TIIE = the Mexican interbank balance interest rate. |
| (3) | TJLP (Long-term Interest Rate) = set by the National Monetary Council, TJLP is the basic financing cost of Banco Nacional de Desenvolvimento Econômico e Social (“BNDES”), the Brazilian Development Bank. On June 30, 2019, TJLP was fixed at 6.26% p.a. |
| (4) | Contract linked to the rate of FNE (Northeast Constitutional Financing Fund) fund whose purpose is to promote the development of the industrial sector, managed by Banco do Nordeste do Brasil. On June 30, 2019, the FNE interest rate was 10% p.a. FNE grants a discount of 15% on the interest rate for timely payments. |
| (5) | SELIC = basic interest rate set by the Brazilian Central Bank. |
53
Table of Contents
Ultrapar Participações S.A. and Subsidiaries
Notes to the Parent and Consolidated Interim financial information
(In thousands of Brazilian Reais, unless otherwise stated)
The changes in loans and debentures are shown below:
Balance as of December 31, 2018 | 15,116,139 | |||
New loans and debentures with cash effect | 1,997,984 | |||
Interest accrued | 446,277 | |||
Principal payment | (2,063,895 | ) | ||
Interest payment | (1,003,282 | ) | ||
Monetary and exchange rate variation | (60,400 | ) | ||
Change in fair value | 108,035 | |||
|
| |||
Balance as of June 30, 2019 | 14,540,858 | |||
|
|
The long-term consolidated debt had the following principal maturity schedule:
| 06/30/2019 | 12/31/2018 | |||||||
From 1 to 2 years | 701,113 | 960,038 | ||||||
From 2 to 3 years | 2,571,726 | 1,548,092 | ||||||
From 3 to 4 years | 3,474,874 | 3,216,293 | ||||||
From 4 to 5 years | 2,024,910 | 3,428,130 | ||||||
More than 5 years | 4,501,806 | 3,736,382 | ||||||
|
|
|
| |||||
| 13,274,429 | 12,888,935 | |||||||
|
|
|
| |||||
The transaction costs and issuance premiums associated with debt issuance were added to their financial liabilities, as shown in Note 16.h.
The Company’s management entered into hedging instruments against foreign exchange and interest rate variations for a portion of its debt obligations (see Note 34.h).
| b. | Notes in the Foreign Market |
On October 6, 2016, the subsidiary Ultrapar International S.A. (“Ultrapar International”) issued US$ 750 million (equivalent to R$ 2,874.2 million as of June 30, 2019) in notes in the foreign market, maturing in October 2026, with interest rate of 5.25% p. a., paid semiannually. The issue price was 98.097% of the face value of the note. The notes were guaranteed by the Company and its subsidiary IPP. The Company has designated hedge relationships for this transaction (see Note 34.h.3).
On June 6, 2019, the subsidiary Ultrapar International issued US$ 500 million (equivalent to R$ 1,916.1 million as of June 30, 2019) in notes in the foreign market, maturing in June 2029, with interest rate of 5.25% p. a., paid semiannually. The issue price was 100% of the face value of the note. The notes were guaranteed by the Company and its subsidiary IPP. The Company has designated hedge relationships for part of this transaction (see Note 34.h.3).
54
Table of Contents
Ultrapar Participações S.A. and Subsidiaries
Notes to the Parent and Consolidated Interim financial information
(In thousands of Brazilian Reais, unless otherwise stated)
On June 21, 2019, the subsidiary Ultrapar International repurchased US$ 200 million (equivalent to R$ 766.4 million as of June 30, 2019) in notes in the foreign market maturing in October 2026.As a result of the issuance of the notes in the foreign market, the Company and its subsidiaries are required to perform certain obligations, including:
| • | Restriction on sale of all or substantially all assets of the Company and subsidiaries Ultrapar International and IPP. |
| • | Restriction on encumbrance of assets exceeding US$ 150 million (equivalent to R$ 574.8 million as of June 30, 2019) or 15% of the amount of the consolidated tangible assets. |
The Company and its subsidiaries are in compliance with the levels of covenants required by this debt. The restrictions imposed on the Company and its subsidiaries are customary in transactions of this nature and have not limited their ability to conduct their business to date.
| c. | Foreign Loans |
c.1 The subsidiary IPP has foreign loans in the amount of US$ 395 million (equivalent to R$ 1,513.6 million as of June 30, 2019). IPP also contracted hedging instruments with floating interest rate in U.S. dollar and exchange rate variation, changing the foreign loans charges, on average, to 104.3% of CDI. IPP designated these hedging instruments as a fair value hedge (see Note 34.h.1); therefore, loans and hedging instruments are both measured at fair value from inception, with changes in fair value recognized through profit or loss. The foreign loans are secured by the Company.
The foreign loans have the maturity distributed as follows:
Maturity | US$ (million) | R$ (million) | Cost in % of CDI | |||||||||
Charges (1) | 26.5 | 101.6 | — | |||||||||
Jun/2021 | 100.0 | 383.2 | 105.0 | |||||||||
Jul/2021 | 60.0 | 229.9 | 101.8 | |||||||||
Jul/2023 | 50.0 | 191.6 | 104.8 | |||||||||
Sep/2023 | 60.0 | 229.9 | 105.0 | |||||||||
Sep/2023 | 65.0 | 249.1 | 104.7 | |||||||||
Nov/2023 | 60.0 | 229.9 | 104.5 | |||||||||
|
|
|
|
|
| |||||||
Total / average cost | 421.5 | 1,615.2 | 104.3 | |||||||||
|
|
|
|
|
| |||||||
| (1) | Includes interest, transaction costs, mark to market and hedge initial recognition. |
55
Table of Contents
Ultrapar Participações S.A. and Subsidiaries
Notes to the Parent and Consolidated Interim financial information
(In thousands of Brazilian Reais, unless otherwise stated)
During these contracts, the Company shall maintain the following financial ratios, calculated based on its audited consolidated financial statements:
| • | Maintenance of a financial ratio, determined by the ratio between consolidated net debt and consolidated Earnings before Interest, Taxes, Depreciation, and Amortization (EBITDA), at less than or equal to 3.5. |
| • | Maintenance of a financial ratio determined by the ratio between consolidated EBITDA and consolidated net financial expenses, higher than or equal to 1.5. |
The Company complies with the levels of covenants required by these loans. The restrictions imposed on the Company and its subsidiaries are usual for this type of transaction and have not limited their ability to conduct their business to date.
c.2 The subsidiary Global Petroleum Products Trading Corporation has a foreign loan in the amount of US$ 60 million (equivalent to R$ 229.9 million as of June 30, 2019) with maturity on June 22, 2020 and interest of LIBOR + 2.0% p.a., paid quarterly. The Company, through the subsidiary Cia. Ultragaz, contracted hedging instruments subject to floating interest rates in dollar and exchange rate variation, changing the foreign loan charge to 105.9% of CDI. The foreign loan is guaranteed by the Company and its subsidiary Oxiteno Nordeste.
| d. | BNDES |
The subsidiaries have financing from BNDES for some of their investments and for working capital.
During the term of these agreements, the Company must maintain the following capitalization and current liquidity levels, as determined in the annual consolidated audited balance sheet:
| • | Capitalization level: equity / total assets equal to or above 0.3; and |
| • | Current liquidity level: current assets / current liabilities equal to or above 1.3. |
The Company complies with the levels of covenants required by these loans. The restrictions imposed on the Company and its subsidiaries are usual for this type of transaction and have not limited their ability to conduct their business to date.
56
Table of Contents
Ultrapar Participações S.A. and Subsidiaries
Notes to the Parent and Consolidated Interim financial information
(In thousands of Brazilian Reais, unless otherwise stated)
| e. | Financial Institutions |
The subsidiaries Oxiteno Mexico S.A. de C.V., Oxiteno USA LLC (“Oxiteno USA”) and Oxiteno Uruguay have loans for investments and working capital.
The subsidiary Oxiteno USA has loans with bearing interest of LIBOR + 2.1% and maturity as shown below:
Maturity | US$ Millions | R$ Millions | ||||||
Charges(1) | 0.2 | 0.8 | ||||||
Aug/2019 | 10.0 | 38.2 | ||||||
Feb/2020 | 10.0 | 38.2 | ||||||
Aug/2020 | 10.0 | 38.2 | ||||||
Sep/2020 | 20.0 | 76.5 | ||||||
Feb/2021 | 10.0 | 38.2 | ||||||
Mar/2022 | 30.0 | 114.7 | ||||||
Oct/2022 | 40.0 | 153.1 | ||||||
Mar/2023 | 30.0 | 114.7 | ||||||
|
|
|
| |||||
Total | 160.2 | 612.6 | ||||||
|
|
|
| |||||
| (1) | Includes interest and transaction costs. |
The proceeds of this loan were used in the working capital and to fund the construction of a new alkoxylation plant in the state of Texas.
| f. | Banco do Brasil |
The subsidiary IPP has floating interest rate loans with Banco do Brasil to marketing, processing, or manufacturing of agricultural goods (ethanol).
These loans mature, as follows (includes accrued interest through June 30, 2019):
Maturity | ||||
May/2020 | 337,974 | |||
May/2021 | 337,974 | |||
May/2022 | 337,975 | |||
|
| |||
Total | 1,013,923 | |||
|
| |||
57
Table of Contents
Ultrapar Participações S.A. and Subsidiaries
Notes to the Parent and Consolidated Interim financial information
(In thousands of Brazilian Reais, unless otherwise stated)
| g. | Debentures |
g.1.In May 2016, the subsidiary IPP made its fourth issuance of public debentures, in one single series of 500 simple, nominative, registered debentures, nonconvertible into shares and unsecured, which main characteristics are as follows:
| Face value unit: | R$ 1,000,000.00 | |
| Final maturity: | May 25, 2021 | |
| Payment of the face value: | Annual as from May 2019 | |
| Interest: | 105.0% of CDI | |
| Payment of interest: | Semiannually | |
| Reprice: | Not applicable |
g.2. In April 2017, the subsidiary IPP carried out its fifth issuance of debentures, in two series, being one of 660,139 and another of 352,361, simple, nonconvertible into shares, nominative, book-entry and unsecured debentures. The debentures have been subscribed by Eco Consult – Consultoria de Operações Financeiras Agropecuárias Ltda. The proceeds from this issuance were used exclusively for the purchase of ethanol by subsidiary IPP.
The debentures were later assigned and transferred to Eco Securitizadora de Direitos Creditórios do Agronegócio S.A. that acquired these agribusiness credit rights with the purpose to bind the issuance of Certificates of Agribusiness Receivables (CRA). The debentures have an additional guarantee from Ultrapar and the main characteristics of the debentures are as follows:
| Amount: | 660,139 | |
| Face value unit: | R$ 1,000.00 | |
| Final maturity: | April 18, 2022 | |
| Payment of the face value: | Lump sum at final maturity | |
| Interest: | 95% of CDI | |
| Payment of interest: | Semiannually | |
| Reprice: | Not applicable |
| Amount: | 352,361 | |
| Face value unit: | R$ 1,000.00 | |
| Final maturity: | April 15, 2024 | |
| Payment of the face value: | Lump sum at final maturity | |
| Interest: | IPCA + 4.68% | |
| Payment of interest: | Annually | |
| Reprice: | Not applicable |
The subsidiary IPP contracted hedging instruments subjected to IPCA variation, changing the debentures charges linked to IPCA to 93.9% of CDI. IPP designated these hedging instruments as fair value hedges; therefore, debentures and hedging instruments are both measured at fair value from inception, with changes in fair value recognized through profit or loss.
58
Table of Contents
Ultrapar Participações S.A. and Subsidiaries
Notes to the Parent and Consolidated Interim financial information
(In thousands of Brazilian Reais, unless otherwise stated)
g.3. In July 2017, the subsidiary IPP made its sixth issuance of public debentures, in one single series of 1,500,000 simple, nonconvertible into shares and unsecured debentures, which main characteristics are as follows:
| Face value unit: | R$ 1,000.00 | |
| Final maturity: | July 28, 2022 | |
| Payment of the face value: | Annual as from July 2021 | |
| Interest: | 105.0% of CDI | |
| Payment of interest: | Annually | |
| Reprice: | Not applicable |
g.4. In October 2017, the subsidiary IPP carried out its seventh issuance of debentures in the amount of R$ 944,077, in two series, being on of 730,384 and another of 213,693, simple, nonconvertible into shares, nominative, book-entry and unsecured debentures. The debentures have been subscribed by Vert Companhia Securitizadora. The proceeds from this issuance were used exclusively for the purchase of ethanol by subsidiary IPP.
The debentures were later assigned and transferred to Vert Créditos Ltda., that acquired these agribusiness credit rights with the purpose to bind the issuance of Certificates of Agribusiness Receivables (CRA). The financial settlement occurred on November 1, 2017. The debentures have an additional guarantee from Ultrapar and the main characteristics of the debentures are as follows:
| Amount: | 730,384 | |
| Face value unit: | R$ 1,000.00 | |
| Final maturity: | October 24, 2022 | |
| Payment of the face value: | Lump sum at final maturity | |
| Interest: | 95% of CDI | |
| Payment of interest: | Semiannually | |
| Reprice: | Not applicable |
| Amount: | 213,693 | |
| Face value unit: | R$ 1,000.00 | |
| Final maturity: | October 24, 2024 | |
| Payment of the face value: | Lump sum at final maturity | |
| Interest: | IPCA + 4.34% | |
| Payment of interest: | Annually | |
| Reprice: | Not applicable |
The subsidiary IPP contracted hedging instruments subjected to IPCA variation, changing the debentures charges linked to IPCA to 97.3% of CDI. IPP designated these hedging instruments as fair value hedges; therefore, debentures and hedging instruments are both measured at fair value from inception, with changes in fair value recognized through profit or loss.
59
Table of Contents
Ultrapar Participações S.A. and Subsidiaries
Notes to the Parent and Consolidated Interim financial information
(In thousands of Brazilian Reais, unless otherwise stated)
g.5. In March 2018, the Company made its sixth issuance of public debentures, in a single series of 1,725,000 simple, nonconvertible into shares and unsecured debentures, which main characteristics are as follows:
| Face value unit: | R$ 1,000.00 | |
| Final maturity: | March 5, 2023 | |
| Payment of the face value: | Lump sum at final maturity | |
| Interest: | 105.25% of CDI | |
| Payment of interest: | Semiannually | |
| Reprice: | Not applicable |
g.6. In December 2018, the subsidiary IPP carried out its eighth issuance of debentures in the amount of R$ 900,000, in two series, being one of 660,000 and another of 240,000, simple, nonconvertible into shares, nominative, book-entry and unsecured debentures. The debentures have been subscribed by Vert Companhia Securitizadora. The proceeds from this issuance were used exclusively for the purchase of ethanol by subsidiary IPP. The financial settlement occurred on December 21, 2018. The debentures have an additional guarantee from Ultrapar and the main characteristics of the debentures are as follows:
| Amount: | 660,000 | |
| Face value unit: | R$ 1,000.00 | |
| Final maturity: | December 18, 2023 | |
| Payment of the face value: | Lump sum at final maturity | |
| Interest: | 97.5% of CDI | |
| Payment of interest: | Semiannually | |
| Reprice: | Not applicable |
| Amount: | 240,000 | |
| Face value unit: | R$ 1,000.00 | |
| Final maturity: | December 15, 2025 | |
| Payment of the face value: | Lump sum at final maturity | |
| Interest: | IPCA + 4.61% | |
| Payment of interest: | Annually | |
| Reprice: | Not applicable |
The subsidiary IPP contracted hedging instruments subjected to IPCA variation, changing the debentures charges linked to IPCA to 97.1% of CDI. IPP designated these hedging instruments as fair value hedges; therefore, debentures and hedging instruments are both measured at fair value from inception, with changes in fair value recognized through profit or loss.
60
Table of Contents
Ultrapar Participações S.A. and Subsidiaries
Notes to the Parent and Consolidated Interim financial information
(In thousands of Brazilian Reais, unless otherwise stated)
The debentures have maturity dates distributed as shown below (includes accrued interest through June 30, 2019).
Maturity | ||||
May/2020 | 167,617 | |||
May/2021 | 166,100 | |||
Apr/2022 | 659,929 | |||
Jul/2022 | 1,589,481 | |||
Oct/2022 | 729,276 | |||
Mar/2023 | 1,757,911 | |||
Dec/2023 | 646,835 | |||
Apr/2024 | 399,296 | |||
Oct/2024 | 241,635 | |||
Dec/2025 | 261,880 | |||
|
| |||
Total | 6,619,960 | |||
|
| |||
| h. | Transaction Costs |
Transaction costs incurred in issuing debt were deducted from the value of the related financial instruments and are recognized as an expense according to the effective interest rate method, as follows:
| Effective rate of transaction costs (% p.a.) | Balance on 12/31/2018 | Incurred cost | Amortization | Balance on 06/30/2019 | ||||||||||||||||
Debentures (g) | 0.2 | 56,376 | — | (9,108 | ) | 47,268 | ||||||||||||||
Notes in the foreign market (b) | 0.0 | 13,881 | 18,442 | (2,489 | ) | 29,834 | ||||||||||||||
Banco do Brasil (f) | 0.2 | 3,437 | — | (2,280 | ) | 1,157 | ||||||||||||||
Foreign loans (c) | 0.1 | 331 | — | (147 | ) | 184 | ||||||||||||||
Other | 0.2 | 2,432 | — | (599 | ) | 1,833 | ||||||||||||||
|
|
|
|
|
|
|
| |||||||||||||
Total | 76,457 | 18,442 | (14,623 | ) | 80,276 | |||||||||||||||
|
|
|
|
|
|
|
| |||||||||||||
61
Table of Contents
Ultrapar Participações S.A. and Subsidiaries
Notes to the Parent and Consolidated Interim financial information
(In thousands of Brazilian Reais, unless otherwise stated)
The amount to be appropriated to profit or loss in the future is as follows:
| Up to 1 year | 1 to 2 years | 2 to 3 years | 3 to 4 years | 4 to 5 years | More than 5 years | Total | ||||||||||||||||||||||
Debentures (g) | 13,160 | 12,635 | 11,164 | 6,566 | 3,223 | 520 | 47,268 | |||||||||||||||||||||
Notes in the foreign market (b) | 3,427 | 3,420 | 3,422 | 3,424 | 3,435 | 12,706 | 29,834 | |||||||||||||||||||||
Banco do Brasil (f) | 587 | 385 | 185 | — | — | — | 1,157 | |||||||||||||||||||||
Foreign loans (c) | 184 | — | — | — | — | — | 184 | |||||||||||||||||||||
Other | 703 | 585 | 390 | 155 | — | — | 1,833 | |||||||||||||||||||||
|
|
|
|
|
|
|
|
|
|
|
|
|
| |||||||||||||||
Total | 18,061 | 17,025 | 15,161 | 10,145 | 6,658 | 13,226 | 80,276 | |||||||||||||||||||||
|
|
|
|
|
|
|
|
|
|
|
|
|
| |||||||||||||||
| i. | Guarantees |
The financings are guaranteed by collateral in the amount of R$ 71,820 as of June 30, 2019 (R$ 69,822 as of December 31, 2018) and by guarantees and promissory notes in the amount of R$ 11,606,499 as of June 30, 2019 (R$ 10,667,175 as of December 31, 2018).
The Company and its subsidiaries offer collateral in the form of letters of credit for commercial and legal proceedings in the amount of R$ 327,067 as of June 30, 2019 (R$ 271,162 as of December 31, 2018). In addition, the Company provides guarantees related to the supply of LPG by Petrobras up to the amount of R$ 45,000.
Some subsidiaries of Company issue collateral to financial institutions in connection with the amounts owed by some of their customers to such institutions (vendor financing) as follows:
| IPP | Oxiteno | |||||||||||||||
| 06/30/2019 | 12/31/2018 | 06/30/2019 | 12/31/2018 | |||||||||||||
Maximum amount of future payments related to these collaterals | 15,099 | — | 2,512 | 2,750 | ||||||||||||
Maturities of up to | 60 months | — | 3 months | 3 months | ||||||||||||
Fair value of collaterals | 179 | — | 63 | 68 | ||||||||||||
If a subsidiary is required to make any payment under these collaterals, this subsidiary may recover the amount paid directly from its customers through commercial collection. Until June 30, 2019, the subsidiaries did not have losses in connection with these collaterals. The fair value of collaterals is recognized in current liabilities as “other payables”, which is recognized in the statement of profit or loss as customers settle their obligations with the financial institutions.
62
Table of Contents
Ultrapar Participações S.A. and Subsidiaries
Notes to the Parent and Consolidated Interim financial information
(In thousands of Brazilian Reais, unless otherwise stated)
| 17. | Trade Payables (Consolidated) |
| 06/30/2019 | 12/31/2018 | |||||||
Domestic suppliers | 1,781,616 | 2,079,010 | ||||||
Domestic suppliers—agreement (i) | 406,090 | 73,169 | ||||||
Foreign suppliers | 191,554 | 472,597 | ||||||
Foreign suppliers—agreement (i) | 127,049 | 106,901 | ||||||
|
|
|
| |||||
| 2,506,309 | 2,731,677 | |||||||
|
|
|
| |||||
| (i) | Suppliers—agreement: some subsidiaries of the Company entered into an agreement with a financial institution, which consists of the anticipation of receipt of the trade payables by the supplier, in which the financial institution prepay a certain amount from the supplier, and receives on the maturity date the amount payable by the subsidiaries of the Company. The decision to join this transaction is solely and exclusively of the supplier. The agreement does not substantially change the main characteristics of the commercial conditions previously established between the subsidiaries of the Company and the suppliers. These operations are presented in operating activities in the statements of cash flow. |
Some Company’s subsidiaries acquireoil-based fuels and LPG from Petrobras and its subsidiaries and ethylene from Braskem S.A. These suppliers control almost all the markets for these products in Brazil.
| 18. | Salaries and Related Charges (Consolidated) |
| 06/30/2019 | 12/31/2018 | |||||||
Provisions on salaries | 214,105 | 186,200 | ||||||
Profit sharing, bonus and premium | 88,111 | 147,170 | ||||||
Social charges | 54,358 | 67,043 | ||||||
Others | 12,749 | 27,779 | ||||||
|
|
|
| |||||
| 369,323 | 428,192 | |||||||
|
|
|
| |||||
| 19. | Taxes Payable (Consolidated) |
| 06/30/2019 | 12/31/2018 | |||||||
ICMS | 147,095 | 166,038 | ||||||
PIS and COFINS | 20,553 | 38,055 | ||||||
ISS | 23,602 | 22,339 | ||||||
Value-Added Tax (IVA) of foreign subsidiaries | 20,099 | 21,306 | ||||||
Others | 17,874 | 20,267 | ||||||
|
|
|
| |||||
| 229,223 | 268,005 | |||||||
|
|
|
| |||||
63
Table of Contents
Ultrapar Participações S.A. and Subsidiaries
Notes to the Parent and Consolidated Interim financial information
(In thousands of Brazilian Reais, unless otherwise stated)
| 20. | Employee Benefits and Private Pension Plan (Consolidated) |
| a. | ULTRAPREV- Associaçăo de Previdência Complementar |
In February 2001, the Company’s Board of Directors approved the adoption of a defined contribution pension plan to be sponsored by the Company and each of its subsidiaries. Participating employees have been contributing to this plan, managed by Ultraprev—Associação de Previdência Complementar (“Ultraprev”), since August 2001. Under the terms of the plan, every year each participating employee chooses his or her basic contribution to the plan. Each sponsoring company provides a matching contribution in an amount equivalent to each basic contribution, up to a limit of 11% of the employee’s reference salary, according to the rules of the plan. As participating employees retire, they may choose to receive either (i) a monthly sum ranging between 0.3% and 1.0% of their respective accumulated fund in Ultraprev or (ii) a fixed monthly amount, which will exhaust their respective accumulated fund over a period of 5 to 35 years. The sponsoring company does not take responsibility for guaranteeing amounts or the duration of the benefits received by the retired employee. For thesix-month period ended June 30, 2019, the subsidiaries contributed R$ 10,842 (R$ 12,202 for thesix-month period ended June 30, 2018) to Ultraprev, which is recognized as expense in the income statement. The total number of participating employees as of June 30, 2019 was 8,346 active participants and 304 retired participants. In addition, Ultraprev had 26 former employees receiving benefits under the rules of a previous plan whose reserves are fully constituted.
| b. | Post-employment Benefits |
The subsidiaries recognized a provision for post-employment benefits mainly related to seniority bonus, payment of Government Severance Indemnity Fund (“FGTS”), and health, dental care, and life insurance plan for eligible retirees.
The amounts related to such benefits were determined based on a valuation conducted by an independent actuary and reviewed by management as of December 31, 2018.
| 06/30/2019 | 12/31/2018 | |||||||
Health and dental care plan(1) | 116,832 | 112,628 | ||||||
Indemnification of FGTS | 78,416 | 83,781 | ||||||
Seniority bonus | 33,698 | 37,397 | ||||||
Life insurance(1) | 16,672 | 16,009 | ||||||
|
|
|
| |||||
Total | 245,618 | 249,815 | ||||||
|
|
|
| |||||
Current | 43,158 | 45,655 | ||||||
Non-current | 202,460 | 204,160 | ||||||
| (1) | Only IPP and Iconic Lubrificantes S.A. (“Iconic”). |
| 21. | Provision for Asset Retirement Obligation – Fuel Tanks (Consolidated) |
The provision corresponds to the legal obligation to remove the subsidiary IPP’s underground fuel tanks located at Ipiranga-branded service stations after a certain use period (see Note 2.n).
Changes in the provision for asset retirement obligation are as follows:
Balance as of December 31, 2018 | 54,667 | |||
Additions (new tanks) | 164 | |||
Expense with tanks removed | (1,265 | ) | ||
Accretion expense | 1,286 | |||
|
| |||
Balance as of June 30, 2019 | 54,852 | |||
|
| |||
Current | 4,001 | |||
Non-current | 50,851 |
64
Table of Contents
Ultrapar Participações S.A. and Subsidiaries
Notes to the Parent and Consolidated Interim financial information
(In thousands of Brazilian Reais, unless otherwise stated)
| 22. | Provisions and Contingencies (Consolidated) |
| a. | Provisions for tax, civil, and labor risks |
The Company and its subsidiaries are parties in tax, civil, environmental, regulatory, and labor disputes at the administrative and judiciary levels, which, when applicable, are backed by escrow deposits. Provisions for losses are estimated and updated by management based on the opinion of the Company’s legal department and its external legal advisors.
The table below demonstrates the breakdown of provisions by nature and its movement:
Provisions | Balance on 12/31/2018 | Additions | Write-offs | Payments | Interest | Balance on 06/30/2019 | ||||||||||||||||||
IRPJ and CSLL (a.1.1) | 532,341 | — | — | — | 8,018 | 540,359 | ||||||||||||||||||
PIS and COFINS | 26,271 | — | (4,173 | ) | — | 358 | 22,456 | |||||||||||||||||
ICMS | 100,823 | 1,204 | (1,865 | ) | (233 | ) | 200 | 100,129 | ||||||||||||||||
Civil, environmental and regulatory claims (a.2.1) | 90,932 | 2,967 | (17,130 | ) | (2,395 | ) | 2,797 | 77,171 | ||||||||||||||||
Labor litigation (a.3.1) | 101,173 | 16,132 | (3,805 | ) | (7,332 | ) | 1,476 | 107,644 | ||||||||||||||||
Others | 91,531 | 802 | (1,077 | ) | — | 1,245 | 92,501 | |||||||||||||||||
|
|
|
|
|
|
|
|
|
|
|
| |||||||||||||
Total | 943,071 | 21,105 | (28,050 | ) | (9,960 | ) | 14,094 | 940,260 | ||||||||||||||||
|
|
|
|
|
|
|
|
|
|
|
| |||||||||||||
Current | 77,822 | 91,416 | ||||||||||||||||||||||
Non-current | 865,249 | 848,844 | ||||||||||||||||||||||
Some of the provisions above involve, in whole or in part, escrow deposits.
Balances of escrow deposits are as follows:
| 06/30/2019 | 12/31/2018 | |||||||
Tax matters | 741,986 | 727,493 | ||||||
Labor litigation | 73,873 | 69,978 | ||||||
Civil and other | 96,692 | 84,036 | ||||||
|
|
|
| |||||
Total—non-current assets | 912,551 | 881,507 | ||||||
|
|
|
| |||||
| a.1 | Provisions for Tax Matters and Social Security |
a.1.1 On October 7, 2005, the subsidiaries Cia. Ultragaz and Bahiana filed for and obtained a preliminary injunction to recognize and offset PIS and COFINS credits on LPG purchases, against other taxes levied by the RFB, notably IRPJ and CSLL. The decision was confirmed by a trial court on May 16, 2008. Under the preliminary injunction, the subsidiaries made escrow deposits for these debits which amounted to R$ 508,405 as of June 30, 2019 (R$ 500,260 as of December 31, 2018). On July 18, 2014, a second instance unfavorable decision was published, and the subsidiaries suspended the escrow deposits, and started to pay income taxes from that date. To revert the court decision, the subsidiaries presented a writ of prevention which was dismissed on December 30, 2014, and the subsidiaries appealed this decision on February 3, 2015. Appeals were also presented to the respective higher courts Superior Court of Justice (“STJ”) and Federal Supreme Court (“STF”) whose final trial are pending.
65
Table of Contents
Ultrapar Participações S.A. and Subsidiaries
Notes to the Parent and Consolidated Interim financial information
(In thousands of Brazilian Reais, unless otherwise stated)
| a.2 | Provisions for Civil, Environmental and Regulatory Claims |
a.2.1 The Company and its subsidiaries maintained provisions for lawsuits and administrative proceedings, mainly derived from contracts entered into with customers and former services providers, as well as proceedings related to environmental and regulatory issues in the amount of R$ 77,171 as of June 30, 2019 (R$ 90,932 as of December 31, 2018).
| a.3 | Provisions for Labor Matters |
a.3.1 The Company and its subsidiaries maintained provisions of R$ 107,644 as of June 30, 2019 (R$ 101,173 as of December 31, 2018) for labor litigation filed by former employees and by employees of our service providers, mainly, contesting thenon-payment of labor rights.
| b. | Contingent Liabilities (Possible) |
The Company and its subsidiaries are parties in tax, civil, environmental, regulatory, and labor claims whose loss prognosis is assessed as possible (proceedings whose chance of loss is more than 25% and less or equal than 50%) by the Company and its subsidiaries’ legal departments, based on the opinion of its external legal advisors and, based on this assessment, these claims were not recognized in the interim financial information. The estimated amount of this contingency is R$ 2,900,184 as of June 30, 2019 (R$ 2,839,219 as of December 31, 2018).
| b.1 | Contingent Liabilities for Tax Matters and Social Security |
The Company and its subsidiaries have contingent liabilities for tax matters and social security in the amount of R$ 2,011,401 as of June 30, 2019 (R$ 1,941,749 as of December 31, 2018), mainly represented by:
b.1.1 The subsidiary IPP and its subsidiaries have assessments invalidating the offset of excise tax (“IPI”) credits in connection with the purchase of raw materials used in the manufacturing of products which sales are not subject to IPI under the protection of tax immunity. The amount of this contingency is R$ 171,151 as of June 30, 2019 (R$ 168,391 as of December 31, 2018).
b.1.2 The subsidiary IPP and its subsidiaries have legal proceedings related to ICMS. The total amount involved in these proceedings, was R$ 883,838 as of June 30, 2019 (R$ 836,393 as of December 31, 2018), Such proceedings arise mostly of the disregard of ICMS credits amounting to R$ 330,413 as of June 30, 2019 (R$ 318,550 as of December 31, 2018), of which R$ 129,437 (R$ 126,639 as of December 31, 2018) refer to proportional reversal requirement of ICMS credits related to the acquisition of hydrated alcohol; of allegednon-payment in the amount of R$ 128,189 as of June 30, 2019 (R$ 125,703 as of December 31, 2018); of conditioned fruition of fiscal incentive in the amount of R$ 115,664 as of June 30, 2019 (R$ 121,745 as of December 31, 2018); and inventory differences in the amount of R$ 184,443 as of June 30, 2019 (R$ 185,512 as of December 31, 2018) related to the leftovers or faults due to temperature changes or product handling.
b.1.3 The Company and its subsidiaries are parties to administrative and judicial suits involving Income Tax, Social Security Contribution, PIS and COFINS, substantially about denials of offset claims and credits disallowance which total amount is R$ 720,649 as of June 30, 2019 (R$ 674,126 as of December 31, 2018), mainly represented by:
b.1.3.1 The subsidiary IPP received a tax assessment related to the IRPJ and CSLL resulting from the supposedly undue amortization of the goodwill paid on acquisition of a subsidiary, in the amount of R$ 203,817 as of June 30, 2019 (R$ 193,771 as of December 31, 2018), which includes the amount of the income taxes, interest and penalty. Management assessed the likelihood of the tax assessment, supported by the opinion of its legal advisors, as “possible”, and therefore did not recognize a provision for this contingent liability.
66
Table of Contents
Ultrapar Participações S.A. and Subsidiaries
Notes to the Parent and Consolidated Interim financial information
(In thousands of Brazilian Reais, unless otherwise stated)
| b.2 | Contingent Liabilities for Civil, Environmental and Regulatory Claims |
The Company and its subsidiaries have contingent liabilities for civil, environmental and regulatory claims in the amount of R$ 603,144, totaling 3,273 lawsuits as of June 30, 2019 (R$ 624,457, totaling 3,520 lawsuits as of December 31, 2018), mainly represented by:
b.2.1 The subsidiary Cia. Ultragaz is party to an administrative proceeding before CADE based on alleged anti-competitive practices in the State of Minas Gerais in 2001. The CADE entered a decision against Cia. Ultragaz and imposed a penalty of R$ 33,808 as of June 30, 2019 (R$ 32,983 as of December 31, 2018). The imposition of such administrative decision was suspended by a court order and its merit is being judicially reviewed.
b.2.2 In 2016, the subsidiary Cia. Ultragaz became party to two administrative proceedings filed by CADE, related to allegations of anti-competitive practices: i) one of the proceedings relate to practices in the State of Paraíba and other Northeast States, in which the subsidiary Bahiana is part along with Cia. Ultragaz. On this proceeding, Cia. Ultragaz and Bahiana signed a Cessation Commitment Agreement (“TCC”) with CADE, approved on November 22, 2017, in the amount of R$ 95,987, paid in 8 (eight) equal installments updated semiannually by SELIC, with maturity of the first one in 180 (one hundred and eighty) days from the date of publication of the approval. Three employees and one former employee signed TCC in the total amount of R$ 1,100. With the TCC, the administrative proceeding will be suspended in relation to the Cia. Ultragaz and Bahiana until final decision; ii) the second proceeding relate to practices in the Federal District and around, in which only Cia. Ultragaz is part. On this proceeding, Cia. Ultragaz signed a TCC with CADE, approved on September 6, 2017, in the amount of R$ 2,154, paid in a single installment in March 8, 2018. Two former employees signed TCC in the amount of R$ 50 each. With the TCC, the administrative proceeding will be suspended in relation to the Cia. Ultragaz until final decision.
b.2.3 The subsidiary IPP became party to two administrative proceedings filed by CADE, related to allegations of anti-competitive practices in the city of Joinville, State of Santa Catarina and around the city of Belo Horizonte, State of Minas Gerais, and for the latter, an administrative award was imposed for allegedly influencing uniform commercial conduct among fuel resellers, in the amount of R$ 40,693 (see Note 36.c). The subsidiary IPP will continue to exercise its defense by appealing in all administrative and judicial instances. Supported by the opinion of external legal counsel that classified the probability of loss as “remote”, Management did not recognize a provision for this contingency as of June 30, 2019.
b.2.4 On November 29, 2016, a technical opinion was issued by the Operational Support Center for Execution (Centro de Apoio Operacional à Execução—CAEX), a technical body linked to the São Paulo State Public Prosecutor (“MPE”), presenting a proposal of compensation for the alleged environmental damages caused by the fire on April 2nd, 2015 at the Santos Terminal of the subsidiary Tequimar. This technical opinion isnon-binding, with no condemnatory or sanctioning nature, and will still be evaluated by the authorities and parties. The subsidiary disagrees with the methodology and the assumptions adopted in the proposal and is negotiating an agreement with the MPE and the Brazilian Federal Public Prosecutor (“MPF”), since the beginning of the investigation and currently there is no civil lawsuit filed on the matter. The negotiations relate toin natura repair of the any damages. Thus, on May 15, 2019, the subsidiary Tequimar signed a Partial Conduct Adjustment Commitment Agreement (“TAC”) in the amount of R$ 67,539 with the MPE and MPF to compensate for diffuse and collective damages of any kind arising from the fish mortality and the damage caused to the ichthyofauna. The negotiations on compensation for other alleged damages are still ongoing and once concluded, the payments related to the project costs may affect the future Company’s interim financial information. In the criminal sphere, the MPF denounced the subsidiary Tequimar, which was summoned and replied to the complaint on June 19, 2018. In addition, as of June 30, 2019, there are contingent liabilities not recognized related to lawsuits in the amount of R$ 51,904 (R$ 62,930 as of December 31, 2018). On June 30, 2019 there are no extrajudicial lawsuits (R$ 3,426 as of December 31, 2018). For more information, see Note 23.
67
Table of Contents
Ultrapar Participações S.A. and Subsidiaries
Notes to the Parent and Consolidated Interim financial information
(In thousands of Brazilian Reais, unless otherwise stated)
| b.3 | Contingent Liabilities for Labor Matters |
The Company and its subsidiaries have contingent liabilities for labor matters in the amount of R$ 285,639, totaling 1,711 lawsuits as of June 30, 2019 (R$ 273,013, totaling 1,726 lawsuits as of December 31, 2018), mainly represented by:
b.3.1 In 1990, the Petrochemical Industry Labor Union (Sindiquímica), of which the employees of Oxiteno Nordeste and EMCA, companies located in the Camaçari Petrochemical Complex, are members, filed separate lawsuits against the subsidiaries demanding the compliance with the fourth section of the collective labor agreement, which provided for a salary adjustment in lieu of the salary policies practiced. In the same year, a collective labor dispute was also filed by the Union of Employers (SINPEQ) against Sindiquímica, requiring the recognition of the loss of effectiveness of such fourth section. The decisions rendered on the individual claims which were favorable to the subsidiaries Oxiteno Nordeste and EMCA are final and unappealable. The collective labor dispute remains pending final trial by STF. In 2010, some companies in the Camaçari Petrochemical Complex signed an agreement with Sindiquímica and reported the fact in the collective labor dispute. In October 2015, Sindiquímica filed enforcement lawsuits against all Camaçari Petrochemical Complex companies that have not yet made settlements, including Oxiteno Nordeste and EMCA. A favorable decision was issued for Oxiteno Nordeste, awaiting judgment by the Regional Labor Court of the 5th Region. For EMCA, the decision of 1st instance favorable to the company was reversed at the Regional Labor Court of the 5th Region, with opposing Statement of Appeal. In addition to collective actions, individual claims containing the same object have been filed.
| c. | Lubricants operation between IPP and Chevron |
In the process of transaction of the lubricants’ operation in Brazil between Chevron and subsidiary IPP (see Note 3.c), it was agreed that each shareholder is responsible for any claims arising out of acts, facts or omissions prior to the transaction. The liability provisions of the Chevron shareholder in the amount of R$ 3,736 (R$ 3,609 as of December 31, 2018) are reflected in the consolidation of these interim financial information. Additionally, in connection with the business combination, a provision in the amount of R$ 198,900 was recognized on December 1, 2017 due contingent liabilities, amounted to R$ 191,110 as of June 30, 2019 and as of December 31, 2018. The amounts of provisions of Chevron’s liability recognized in the business combination will be reimbursed to subsidiary Iconic in the event of losses and an indemnity asset was hereby constituted in the same amount, without the need to establish a provision for uncollectible amounts.
| d. | Contingent Assets |
d.1Exclusion of ICMS from the calculation basis of PIS and COFINS
All subsidiaries, whose legal thesis of exclusion of ICMS from the calculation basis of PIS and COFINS is applicable, have lawsuits aimed at obtaining this right. For the subsidiaries Oxiteno S.A. and Extrafarma, there is a final and unappealable lawsuit, and the respective subsidies of proof of the amounts to be refunded were duly confirmed by management. The amounts to be recovered from the other subsidiaries will be recognized to the extent that, at the same time, there is a transitory restraint of the individual claim and confirmation of the evidentiary subsidies by management.
68
Table of Contents
Ultrapar Participações S.A. and Subsidiaries
Notes to the Parent and Consolidated Interim financial information
(In thousands of Brazilian Reais, unless otherwise stated)
| 23. | Trade payables –customers and third parties’ indemnification |
In April 2015, a fire occurred in six ethanol and gasoline tanks operated by Ultracargo in Santos, which represented 4% of the subsidiary’s overall capacity as of December 31, 2014. The Civil and Federal Police investigated the accident and its impacts and concluded that it is not possible to determine the cause of the accident and neither to individualize active or passive conduct related to the cause, and there was no criminal charge against either individual or the subsidiary, by both authorities. Notwithstanding that, the MPF offered complaint the subsidiary Tequimar in the criminal sphere, which was summoned and replied to the complaint on June 19, 2018.
In June 2017, the licensing required for the return to operation of 67.5 thousand cubic meters from the total of 150 thousand cubic meters affected by the fire was obtained. The tanks remain idle c and in the process of recovery for subsequent licensing and start of operation.
The balance of customers and third parties’ indemnification as of December 31, 2018 in the amount of R$ 3,501 were settled on 2nd quarter of 2019.
| 24. | Deferred Revenue (Consolidated) |
The Company’s subsidiaries have recognized the following deferred revenue:
| 06/30/2019 | 12/31/2018 | |||||||
‘am/pm’ and Jet Oil franchising upfront fee (a) | 16,190 | 18,668 | ||||||
Loyalty program “Km de Vantagens” (b) | 28,435 | 18,465 | ||||||
Loyalty program “Clube Extrafarma” (b) | 1,333 | 1,289 | ||||||
|
|
|
| |||||
| 45,958 | 38,422 | |||||||
|
|
|
| |||||
Current | 36,238 | 26,572 | ||||||
Non-current | 9,720 | 11,850 | ||||||
| a. | Franchising Upfront Fee |
am/pm is the convenience stores chain of the Ipiranga service stations. Ipiranga ended June 30, 2019 with 2,409 stores (2,493 as of December 31, 2018). Jet Oil is Ipiranga’s lubricant-changing and automotive service specialized network. Ipiranga ended June 30, 2019 with 1,500 stores (1,772 stores as of December 31, 2018).
| b. | Loyalty Programs |
Subsidiary Ipiranga has a loyalty program called Km de Vantagens (www.kmdevantagens.com.br) under which registered customers are rewarded with points when they buy products at Ipiranga service stations or at its partners. The customers may exchange these points, during the period of one year, for discounts on products and services offered by Ipiranga and its partners. Points received by Ipiranga’s customers that may be used with the partner Multiplus Fidelidade and for discounts of fuel in Ipiranga’s website (www.postoipiranganaweb.com.br) and recognized as a reduction of revenue from sales and services.
Subsidiary Extrafarma has a loyalty program called Clube Extrafarma (www.clubeextrafarma.com.br) under which registered customers are rewarded with points when they buy products at its drugstore chain. The customers may exchange these points, during the period of six months, for discounts in products at its drugstore chain, recharge credit on a mobile phone, and prizes offered by partners Multiplus Fidelidade and Ipiranga, through Km de Vantagens. Points received by Extrafarma’s customers are recognized as a reduction of revenue from sales and services.
Deferred revenue is estimated based on the fair value of the points granted, considering the value of the prizes and the expected redemption of these points.
69
Table of Contents
Ultrapar Participações S.A. and Subsidiaries
Notes to the Parent and Consolidated Interim financial information
(In thousands of Brazilian Reais, unless otherwise stated)
| 25. | Subscription warrants—indemnification |
Because of the association between the Company and Extrafarma on January 31, 2014, 7 subscription warrants—indemnification were issued, corresponding to up to 6,411,244 shares of the Company. The subscription warrants—indemnification may be exercised beginning 2020 by the former shareholders of Extrafarma and are adjusted according to the changes in the amounts of provisions for tax, civil, and labor risks and contingent liabilities related to the period prior to January 31, 2014. The subscription warrants—indemnification’s fair value is measured based on the share price of Ultrapar (UGPA3) and is reduced by the dividend yield until 2020, since the exercise is possible only from 2020, and they are not entitled to dividends until that date. As of June 30, 2019, the subscription warrants—indemnification were represented by 4,633,552 shares and amounted to R$ 90,567 (as of December 31, 2018, they were represented by 4,824,238 that totaled R$ 123,095). Due to the final adverse decision of some of these lawsuits, on June 30, 2019, the maximum number of shares that could be issued related to the subscription warrants—indemnification was up to 5,946,218 (5,976,316 shares as of December 31, 2018).
The information above were adjusted retrospectively as disclosure in Note 26.a.
| 26. | Equity |
| a. | Share Capital |
On June 30, 2019, the subscribed andpaid-in capital stock consists of 1,112,810,192 common shares with no par value and the issuance of preferred shares and participation certificates is prohibited. Each common share entitles its holder to one vote at Shareholders’ Meetings.
The price of the shares issued by the Company as of June 30, 2019, on B3 was R$ 20.10 (R$ 26.60 as of December 31, 2018).
As of June 30, 2019, the Company is authorized to increase capital up to the limit of 1,600,000,000 common shares, without amendment to the Bylaws, by resolution of the Board of Directors.
As of June 30, 2019, there were 46,518,315 common shares outstanding abroad in the form of ADRs (55,725,974 shares as of December 31, 2018).
On April 10, 2019, the Company’s extraordinary and annual general meeting approved the stock split of common shares issued by Ultrapar, at a ratio of one currently existing share to two shares of the same class and type as well as the changing of the number of shares in which the capital stock of the Company is divided. The stock split approved herein shall not imply in any change in the Ultrapar’s capital stock. The new shares and ADRs resulting from the stock split approved herein are of the same class and type and granted to its holders the same rights of the current shares and ADRs. All information was adjusted retrospectively in this interim financial information.
| b. | Equity instrument granted |
The Company has a share-based incentive plan, which establishes the general terms and conditions for the concession of common shares issued by the Company held in treasury (see Note 8.c).
70
Table of Contents
Ultrapar Participações S.A. and Subsidiaries
Notes to the Parent and Consolidated Interim financial information
(In thousands of Brazilian Reais, unless otherwise stated)
| c. | Treasury Shares |
The Company acquired its own shares at market prices, without capital reduction, to be held in treasury and to be subsequently disposed of or cancelled, in accordance with CVM Instructions 10, issued on February 14, 1980 and 268, issued on November 13, 1997.
As of June 30, 2019, and December 31, 2018, 26,780,298 common shares were held in the Company’s treasury, acquired at an average cost of R$ 18.12.
| d. | Capital Reserve |
The capital reserve reflects the gain on the transfer of shares at market price used in the Deferred Stock Plan granted to executives of the subsidiaries of the Company, as mentioned in Note 8.c.
Because of Extrafarma’s association in 2014, the Company recognized an increase in the capital reserves in the amount of R$ 498,812, due to the difference between the value attributable to share capital and the market value of the Ultrapar shares on the date of issue, deducted by R$ 2,260 related to the incurred costs directly attributable to issuing new shares.
| e. | Revaluation Reserve |
The revaluation reserve, recognized prior to the adoption of the international accounting standards (CPC / IFRS) instituted by Law 11,638/07, reflects the revaluation of assets of subsidiaries and is based on depreciation,write-off, or disposal of the revalued assets of the subsidiaries, as well as the tax effects recognized by these subsidiaries.
| f. | Profit Reserves |
| f.1 | Legal Reserve |
Under Brazilian Corporate Law, the Company is required to allocate 5% of net annual earnings to a legal reserve, until the balance reaches 20% of capital stock. This reserve may be used to increase capital or to absorb losses but may not be distributed as dividends.
| f.2 | Investments Reserve |
In compliance with Article 194 of the Brazilian Corporate Law and Article 55.c) of the Bylaws this reserve is aimed to protect the integrity of the Company’s assets and to supplement its capital stock, in order to allow new investments to be made. As provided in its Bylaws, the Company may allocate up to 45% of the annual net income to the investments reserve, up to the limit of 100% of the share capital.
The investments reserve is free of distribution restrictions and totaled R$ 3,412,427 as of June 30, 2019 and December 31, 2018.
71
Table of Contents
Ultrapar Participações S.A. and Subsidiaries
Notes to the Parent and Consolidated Interim financial information
(In thousands of Brazilian Reais, unless otherwise stated)
| g. | Valuation Adjustments and Cumulative Translation Adjustments |
| g.1 | Valuation Adjustments |
| (i) | Actuarial gains and losses relating to post-employment benefits, calculated based on a valuation conducted by an independent actuary, are recognized in equity under the title “valuation adjustments”. Actuarial gains and losses recorded in equity are not reclassified to profit or loss in subsequent periods. |
| (ii) | Gains and losses on the hedging instruments of exchange rate related to firm commitment and highly probable transactions designated as cash flows hedges are recognized in equity as “valuation adjustments”. Gains and losses are reclassified to initial cost ofnon-financial assets. |
| (iii) | The differences between the fair value of financial investments measured at fair value through other comprehensive income and the initial amount of financial investments plus the interest earned and the foreign currency exchange variation are recognized in equity as valuation adjustments. Gains and losses are reclassified to statements of profit or loss when the financial investment is settled. |
| (iv) | The Company also recognizes in this item the effect of changes in thenon-controlling interest in subsidiaries that do not result in loss of control. This amount corresponds to the difference between the amount by which thenon-controlling interest was adjusted and the fair value of the consideration received or paid and represents a transaction with shareholders. |
Balance and changes in valuation adjustments of the Company are as follows:
| Valuation adjustments | ||||||||||||||||||||
| Fair value of cash flow hedging instruments | Fair value of financial instruments | Actuarial gains (losses) of post- employment benefits | Non-controlling shareholders interest change | Total | ||||||||||||||||
Balance as of December 31, 2018 | (243,336 | ) | (273 | ) | (17,749 | ) | 197,369 | (63,989 | ) | |||||||||||
Changes in fair value of financial instruments | 20,048 | 911 | — | — | 20,959 | |||||||||||||||
IRPJ and CSLL on fair value | (7,641 | ) | — | — | — | (7,641 | ) | |||||||||||||
Actuarial gain of post-employment benefits | — | — | 238 | — | 238 | |||||||||||||||
|
|
|
|
|
|
|
|
|
| |||||||||||
Balance as of June 30, 2019 | (230,929 | ) | 638 | (17,511 | ) | 197,369 | (50,433 | ) | ||||||||||||
|
|
|
|
|
|
|
|
|
| |||||||||||
| Valuation adjustments | ||||||||||||||||||||
| Fair value of cash flow hedging instruments | Fair value of financial instruments | Actuarial gains (losses) of post- employment benefits | Non-controlling shareholders interest change | Total | ||||||||||||||||
Balance as of December 31, 2017 | (27,364 | ) | — | (15,181 | ) | 202,188 | 159,643 | |||||||||||||
Retrospective effect of business combination of Chevron(1) | — | — | — | (4,819 | ) | (4,819 | ) | |||||||||||||
|
|
|
|
|
|
|
|
|
| |||||||||||
Balance as of December 31, 2017—restated | (27,364 | ) | — | (15,181 | ) | 197,369 | 154,824 | |||||||||||||
|
|
|
|
|
|
|
|
|
| |||||||||||
Changes in fair value of financial instruments | (310,590 | ) | (3,862 | ) | — | — | (314,452 | ) | ||||||||||||
Income and social contribution taxes on fair value | 106,467 | — | — | — | 106,467 | |||||||||||||||
Actuarial losses of post-employment benefits | — | — | (299 | ) | — | (299 | ) | |||||||||||||
|
|
|
|
|
|
|
|
|
| |||||||||||
Balance as of June 30, 2018—restated | (231,487 | ) | (3,862 | ) | (15,480 | ) | 197,369 | (53,460 | ) | |||||||||||
|
|
|
|
|
|
|
|
|
| |||||||||||
| (1) | For further details of Chevron business combination, see Note 3.c of financial statements filed on CVM on February 20, 2019. |
72
Table of Contents
Ultrapar Participações S.A. and Subsidiaries
Notes to the Parent and Consolidated Interim financial information
(In thousands of Brazilian Reais, unless otherwise stated)
| g.2 | Cumulative Translation Adjustments |
The change in exchange rates on assets, liabilities, and income of foreign subsidiaries that have functional currency other than the presentation currency of the Company and an independent administration (see Note 2.s.1) and the exchange rate variation on notes in the foreign market (see Note 34.h.3) is directly recognized in the equity. This accumulated effect is reflected in profit or loss as a gain or loss only in case of disposal orwrite-off of the investment.
Balance and changes in cumulative translation adjustments of the Company are as follows:
| 06/30/2019 | ||||
Balance as of December 31, 2018 | 65,857 | |||
Translation of foreign subsidiaries, net of IRPJ and CSLL | (5,886 | ) | ||
|
| |||
Balance as of June 30, 2019 | 59,971 | |||
|
| |||
| 06/30/2018 | ||||
Balance as of December 31, 2017 | 53,061 | |||
Translation of foreign subsidiaries, net of IRPJ and CSLL | 44,388 | |||
|
| |||
Balance as of June 30, 2018 | 97,449 | |||
|
| |||
| h. | Dividends and Allocation of Net Income |
The shareholders are entitled, under the Bylaws, to a minimum annual dividend of 50% of adjusted net income calculated in accordance with Brazilian Corporate Law. The dividends and interest on equity in excess of the obligation established in the Bylaws are recognized in equity until the Shareholders approve them. The proposed dividends payable as of December 31, 2018 in the amount of R$ 380,324 (R$ 0.70 – seventy cents of Brazilian Real per share), were approved by the Board of Directors on February 20, 2019, and paid beginning March 13, 2019.
Balances and changes in dividends payable are as follows:
| Parent | Consolidated | |||||||
Balance as of December 31, 2018 | 282,334 | 284,024 | ||||||
Provisions | 109,355 | 110,975 | ||||||
Payments | (378,469 | ) | (380,573 | ) | ||||
|
|
|
| |||||
Balance as of June 30, 2019 | 13,220 | 14,426 | ||||||
|
|
|
| |||||
73
Table of Contents
Ultrapar Participações S.A. and Subsidiaries
Notes to the Parent and Consolidated Interim financial information
(In thousands of Brazilian Reais, unless otherwise stated)
| 27. | Net Revenue from Sale and Services (Consolidated) |
| 06/30/2019 | 06/30/2018 | |||||||
Gross revenue from sale | 44,872,564 | 44,975,338 | ||||||
Gross revenue from services | 381,294 | 364,000 | ||||||
Sales taxes | (1,881,493 | ) | (1,241,351 | ) | ||||
Discounts and sales returns | (756,582 | ) | (507,020 | ) | ||||
Amortization of contractual assets with customers (see Note 11) | (177,818 | ) | (196,680 | ) | ||||
Deferred revenue (see Note 24) | (6,067 | ) | 2,420 | |||||
|
|
|
| |||||
Net revenue from sales and services | 42,431,898 | 43,396,707 | ||||||
|
|
|
| |||||
| 28. | Expenses by Nature (Consolidated) |
The Company presents its expenses by function in the consolidated statement of profit or loss and presents below its expenses by nature:
| 06/30/2019 | 06/30/2018 | |||||||
Raw materials and materials for use and consumption | 38,858,521 | 39,693,661 | ||||||
Personnel expenses | 1,225,145 | 1,236,066 | ||||||
Freight and storage | 568,780 | 591,096 | ||||||
Depreciation and amortization | 416,867 | 392,030 | ||||||
Amortization of right to use assets | 153,257 | — | ||||||
Advertising and marketing | 99,322 | 83,274 | ||||||
Services provided by third parties | 153,713 | 169,101 | ||||||
Other expenses | 280,494 | 355,181 | ||||||
|
|
|
| |||||
Total | 41,756,099 | 42,520,409 | ||||||
|
|
|
| |||||
Classified as: | ||||||||
Cost of products and services sold | 39,581,566 | 40,416,361 | ||||||
Selling and marketing | 1,375,059 | 1,333,919 | ||||||
General and administrative | 799,474 | 770,129 | ||||||
|
|
|
| |||||
Total | 41,756,099 | 42,520,409 | ||||||
|
|
|
| |||||
| 29. | Gain (loss) on Disposal of PP&E and Intangibles (Consolidated) |
The gain or loss is determined as the difference between the selling price and residual book value of the investment, PP&E, or intangible asset disposed of. For thesix-month period ended June 30, 2019, the loss was R$ 1,055 (loss of R$ 4,584 for thesix-month period ended June 30, 2018), represented primarily from disposal of PP&E.
74
Table of Contents
Ultrapar Participações S.A. and Subsidiaries
Notes to the Parent and Consolidated Interim financial information
(In thousands of Brazilian Reais, unless otherwise stated)
| 30. | Other Operating Income, Net (Consolidated) |
| 06/30/2019 | 06/30/2018 | |||||||
Commercial partnerships(1) | 24,374 | 24,835 | ||||||
Merchandising(2) | 10,412 | 16,293 | ||||||
Loyalty program(3) | 4,798 | 13,420 | ||||||
Ultracargo—fire accident in Santos(4) | — | (2,099 | ) | |||||
Fine for unrealized acquisition (5) | — | (286,160 | ) | |||||
Extraordinary credits of PIS and COFINS—exclusion of ICMS from PIS and COFINS tax bases(6) | 50,048 | — | ||||||
Conduct adjustment commitment—Tequimar(7) | (52,539 | ) | — | |||||
Others | 9,727 | 5,858 | ||||||
|
|
|
| |||||
Other operating income, net | 46,820 | (227,853 | ) | |||||
|
|
|
| |||||
| (1) | Refers to contracts with service providers and suppliers, which establish trade agreements for convenience stores and gas stations. |
| (2) | Refers to contracts with suppliers of convenience stores, which establish, among other agreements, promotional campaigns. |
| (3) | Refers to sales of “Km de Vantagens” to partners of the loyalty program. Revenue is recognized at the time that the partners transfer the points to their customers. |
| (4) | For more information about the fire accident in Ultracargo, see Notes 22.b.2.4 and 23. |
| (5) | Refers to a contractual fine paid in 2018 by Cia. Ultragaz in favor of Petrobras due to thenon-closing of the acquisition of Liquigás Distribuidora S.A (“Liquigás”) transaction rejected to the CADE. |
| (6) | Refers substantially to Extrafarma credits (see Note 7.a.2) and Iconic. |
| (7) | For more information see Note 22.b.2.4. |
| 31. | Financial Income (Expense) |
| Parent | Consolidated | |||||||||||||||
| 06/30/2019 | 06/30/2018 | 06/30/2019 | 06/30/2018 | |||||||||||||
Financial income: | ||||||||||||||||
Interest on financial investments | 44,660 | 49,011 | 165,057 | 162,935 | ||||||||||||
Interest from customers | — | — | 71,315 | 70,774 | ||||||||||||
Changes in subscription warranty—indemnification (see Note 25) | 31,679 | 70,126 | 31,679 | 70,126 | ||||||||||||
Other financial income | — | — | 8,237 | 764 | ||||||||||||
|
|
|
|
|
|
|
| |||||||||
| 76,339 | 119,137 | 276,288 | 304,599 | |||||||||||||
|
|
|
|
|
|
|
| |||||||||
Financial expenses: | ||||||||||||||||
Interest on loans | — | — | (167,192 | ) | (227,406 | ) | ||||||||||
Interest on debentures | (57,640 | ) | (47,667 | ) | (277,086 | ) | (215,773 | ) | ||||||||
Interest on leases payable | — | — | (49,520 | ) | (1,400 | ) | ||||||||||
Bank charges, financial transactions tax, and other charges | (1,823 | ) | (1,607 | ) | (33,314 | ) | (37,517 | ) | ||||||||
Exchange variation, net of gains and losses with derivative financial instruments | — | (1 | ) | 147,405 | (3,949 | ) | ||||||||||
Interest of provisions, net, and other financial expenses | — | — | 12,071 | 10,062 | ||||||||||||
|
|
|
|
|
|
|
| |||||||||
| (59,463 | ) | (49,275 | ) | (367,636 | ) | (475,983 | ) | |||||||||
|
|
|
|
|
|
|
| |||||||||
Financial income (expense) | 16,876 | 69,862 | (91,348 | ) | (171,384 | ) | ||||||||||
|
|
|
|
|
|
|
| |||||||||
75
Table of Contents
Ultrapar Participações S.A. and Subsidiaries
Notes to the Parent and Consolidated Interim financial information
(In thousands of Brazilian Reais, unless otherwise stated)
| 32. | Earnings per Share (Parent and Consolidated) |
The table below presents a reconciliation of numerators and denominators used in computing earnings per share. The Company has a deferred stock plan and subscription warrants—indemnification, as mentioned in Notes 8.c and 25, respectively.
Basic Earnings per Share | 06/30/2019 | 06/30/2018 | ||||||
Net income for the period of the Company | 342,262 | 315,444 | ||||||
Weighted average shares outstanding (in thousands) | 1,084,367 | 1,084,094 | ||||||
Basic earnings per share—R$ | 0.3156 | 0.2910 | ||||||
Diluted Earnings per Share | ||||||||
Net income for the period of the Company | 342,262 | 315,444 | ||||||
Weighted average shares outstanding (in thousands), including dilution effects | 1,091,430 | 1,091,580 | ||||||
Diluted earnings per share—R$ | 0.3136 | 0.2890 | ||||||
Weighted Average Shares Outstanding (in thousands) | ||||||||
Weighted average shares outstanding for basic per share calculation | 1,084,367 | 1,084,094 | ||||||
Dilution effect | ||||||||
Subscription warrants—indemnification | 4,651 | 4,824 | ||||||
Deferred Stock Plan | 2,412 | 2,662 | ||||||
|
|
|
| |||||
Weighted average shares outstanding for diluted per share calculation | 1,091,430 | 1,091,580 | ||||||
|
|
|
| |||||
Earnings per share were adjusted retrospectively as disclosure in Note 26.a.
76
Table of Contents
Ultrapar Participações S.A. and Subsidiaries
Notes to the Parent and Consolidated Interim financial information
(In thousands of Brazilian Reais, unless otherwise stated)
| 33. | Segment Information |
The Company operates five main business segments: gas distribution, fuel distribution, chemicals, storage and drugstores. The gas distribution segment (Ultragaz) distributes LPG to residential, commercial, and industrial consumers, especially in the South, Southeast, and Northeast regions of Brazil. The fuel distribution segment (Ipiranga) operates the distribution and marketing of gasoline, ethanol, diesel, fuel oil, kerosene, natural gas for vehicles, and lubricants and related activities throughout all the Brazilian territory. The chemicals segment (Oxiteno) produces ethylene oxide and its main derivatives and fatty alcohols, which are raw materials used in the home and personal care, agrochemical, paints, varnishes, and other industries. The storage segment (Ultracargo) operates liquid bulk terminals, especially in the Southeast and Northeast regions of Brazil. The drugstores segment (Extrafarma) trades pharmaceutical, hygiene, and beauty products through its own drugstore chain in the North, Northeast and Southeast regions of the country. The segments shown in the interim financial information are strategic business units supplying different products and services. Intersegment sales are at prices similar to those that would be charged to third parties.
| a. | Financial information related to segments |
The main financial information of each of the Company’s segments are stated as follows:
| 06/30/2019 | 06/30/2018 | |||||||
Net revenue from sales and services: | ||||||||
Ultragaz | 3,412,736 | 3,390,760 | ||||||
Ipiranga | 35,651,471 | 36,583,908 | ||||||
Oxiteno | 2,122,011 | 2,180,085 | ||||||
Ultracargo | 252,574 | 242,547 | ||||||
Extrafarma | 1,046,146 | 1,040,599 | ||||||
|
|
|
| |||||
| 42,484,938 | 43,437,899 | |||||||
Others(1) | 18,881 | 24,173 | ||||||
Intersegment sales | (71,921 | ) | (65,365 | ) | ||||
|
|
|
| |||||
Total | 42,431,898 | 43,396,707 | ||||||
|
|
|
| |||||
Intersegment sales: | ||||||||
Ultragaz | 1,824 | 1,102 | ||||||
Ipiranga | 332 | 398 | ||||||
Oxiteno | 12,011 | — | ||||||
Ultracargo | 38,919 | 39,736 | ||||||
Extrafarma | — | — | ||||||
|
|
|
| |||||
| 53,086 | 41,236 | |||||||
Others(1) | 18,835 | 24,129 | ||||||
|
|
|
| |||||
Total | 71,921 | 65,365 | ||||||
|
|
|
| |||||
77
Table of Contents
Ultrapar Participações S.A. and Subsidiaries
Notes to the Parent and Consolidated Interim financial information
(In thousands of Brazilian Reais, unless otherwise stated)
| 06/30/2019 | 06/30/2018 | |||||||
Net revenue from sales and services, excluding intersegment sales: | ||||||||
Ultragaz | 3,410,912 | 3,389,658 | ||||||
Ipiranga | 35,651,139 | 36,583,510 | ||||||
Oxiteno | 2,110,000 | 2,180,085 | ||||||
Ultracargo | 213,655 | 202,811 | ||||||
Extrafarma | 1,046,146 | 1,040,599 | ||||||
|
|
|
| |||||
| 42,431,852 | 43,396,663 | |||||||
Others(1) | 46 | 44 | ||||||
|
|
|
| |||||
Total | 42,431,898 | 43,396,707 | ||||||
|
|
|
| |||||
Operating income (expense): | ||||||||
Ultragaz | 118,246 | (133,580 | ) | |||||
Ipiranga | 694,752 | 656,458 | ||||||
Oxiteno | (22,864 | ) | 91,289 | |||||
Ultracargo | 23,913 | 68,551 | ||||||
Extrafarma | (60,056 | ) | (40,699 | ) | ||||
Corporation(2) | (34,589 | ) | — | |||||
|
|
|
| |||||
| 719,402 | 642,019 | |||||||
Others(1) | 2,162 | 1,842 | ||||||
|
|
|
| |||||
Total | 721,564 | 643,861 | ||||||
|
|
|
| |||||
Share of profit (loss) of joint-ventures and associates: | ||||||||
Ultragaz | 7 | 26 | ||||||
Ipiranga | (11,999 | ) | (7,782 | ) | ||||
Oxiteno | 341 | 519 | ||||||
Ultracargo | 1,082 | 1,383 | ||||||
|
|
|
| |||||
| (10,569 | ) | (5,854 | ) | |||||
Others(1) | 521 | (523 | ) | |||||
|
|
|
| |||||
Total | (10,048 | ) | (6,377 | ) | ||||
|
|
|
| |||||
Income before financial result, income and social contribution taxes | 711,516 | 637,484 | ||||||
|
|
|
| |||||
Financial result, net | (91,348 | ) | (171,384 | ) | ||||
|
|
|
| |||||
Income before income and social contribution taxes | 620,168 | 466,100 | ||||||
|
|
|
| |||||
78
Table of Contents
Ultrapar Participações S.A. and Subsidiaries
Notes to the Parent and Consolidated Interim financial information
(In thousands of Brazilian Reais, unless otherwise stated)
| 06/30/2019 | 06/30/2018 | |||||||
Additions to PP&E and intangible assets (excluding intersegment account balances): | ||||||||
Ultragaz | 92,684 | 123,772 | ||||||
Ipiranga | 145,588 | 196,664 | ||||||
Oxiteno | 122,531 | 293,533 | ||||||
Ultracargo | 80,637 | 51,759 | ||||||
Extrafarma | 39,431 | 39,240 | ||||||
|
|
|
| |||||
| 480,871 | 704,968 | |||||||
Others(1) | 4,937 | 6,471 | ||||||
|
|
|
| |||||
Total additions to PP&E and intangible assets (see Notes 14 and 15) | 485,808 | 711,439 | ||||||
Asset retirement obligation—fuel tanks (see Note 21) | (164 | ) | (188 | ) | ||||
Capitalized borrowing costs | (13,758 | ) | (10,498 | ) | ||||
|
|
|
| |||||
Total investments in PP&E and intangible assets (cash flow) | 471,886 | 700,753 | ||||||
|
|
|
| |||||
Payments of contractual assets with customers—exclusive rights (see Note 11): | ||||||||
Ipiranga | 126,334 | 177,008 | ||||||
|
|
|
| |||||
Depreciation of PP&E and amortization of intangible assets charges: | ||||||||
Ultragaz | 95,266 | 111,702 | ||||||
Ipiranga | 145,839 | 133,214 | ||||||
Oxiteno | 100,330 | 80,489 | ||||||
Ultracargo | 28,681 | 25,286 | ||||||
Extrafarma | 39,185 | 33,782 | ||||||
|
|
|
| |||||
| 409,301 | 384,473 | |||||||
Others(1) | 7,566 | 7,557 | ||||||
|
|
|
| |||||
Total | 416,867 | 392,030 | ||||||
|
|
|
| |||||
Amortization of contractual assets with customers—exclusive rights (see Note 11): | ||||||||
Ipiranga | 177,818 | 196,680 | ||||||
|
|
|
| |||||
Amortization of right to use assets: | ||||||||
Ultragaz | 15,246 | — | ||||||
Ipiranga | 82,584 | — | ||||||
Oxiteno | 4,591 | — | ||||||
Ultracargo | 11,812 | — | ||||||
Extrafarma | 39,024 | — | ||||||
|
|
|
| |||||
Total | 153,257 | — | ||||||
|
|
|
| |||||
79
Table of Contents
Ultrapar Participações S.A. and Subsidiaries
Notes to the Parent and Consolidated Interim financial information
(In thousands of Brazilian Reais, unless otherwise stated)
| 06/30/2019 | 12/31/2018 | |||||||
Total assets (excluding intersegment account balances): | ||||||||
Ultragaz | 2,903,742 | 2,719,425 | ||||||
Ipiranga | 16,168,485 | 15,381,887 | ||||||
Oxiteno | 7,357,615 | 7,452,331 | ||||||
Ultracargo | 1,704,233 | 1,478,697 | ||||||
Extrafarma | 2,641,692 | 2,107,901 | ||||||
|
|
|
| |||||
| 30,775,767 | 29,140,241 | |||||||
Others(1) | 529,013 | 1,359,154 | ||||||
|
|
|
| |||||
Total | 31,304,780 | 30,499,395 | ||||||
|
|
|
| |||||
| (1) | Composed of the parent company Ultrapar (including goodwill of certain acquisitions) and subsidiaries Serma—Associação dos Usuários de Equipamentos de Processamento de Dados e Serviços Correlatos (“Serma”) and Imaven Imóveis Ltda. |
| (2) | Expenses related to Ultrapar’s holding structure, including the Presidency, Board of Directors and, fiscal council, advisory committees to Board of Directors and Human Capital and Audit and Compliance directories. |
| b. | Geographic Area Information |
The fixed and intangible assets of the Company and its subsidiaries are located in Brazil, except those related to Oxiteno’ plants abroad, as shown below:
| 06/30/2019 | 12/31/2018 | |||||||
United States of America | 862,734 | 857,049 | ||||||
Mexico | 117,314 | 124,037 | ||||||
Uruguay | 69,408 | 72,345 | ||||||
Venezuela | 927 | 2,427 | ||||||
|
|
|
| |||||
| 1,050,383 | 1,055,858 | |||||||
|
|
|
| |||||
The subsidiaries generate revenue from operations in Brazil, United Stated of America, Mexico, Uruguay and Venezuela, as well as from exports of products to foreign customers, as disclosed below:
| 06/30/2019 | 06/30/2018 | |||||||
Net revenue from sale and services: | ||||||||
Brazil | 41,730,719 | 42,655,226 | ||||||
Mexico | 116,404 | 96,446 | ||||||
Uruguay | 25,950 | 23,041 | ||||||
Venezuela | 1,066 | 29,442 | ||||||
Other Latin American countries | 203,155 | 199,903 | ||||||
United States of America and Canada | 219,275 | 236,200 | ||||||
Far East | 40,834 | 48,215 | ||||||
Europe | 62,487 | 75,088 | ||||||
Others | 32,008 | 33,146 | ||||||
|
|
|
| |||||
Total | 42,431,898 | 43,396,707 | ||||||
|
|
|
| |||||
Sales to the foreign market are made substantially by the Oxiteno segment.
80
Table of Contents
Ultrapar Participações S.A. and Subsidiaries
Notes to the Parent and Consolidated Interim financial information
(In thousands of Brazilian Reais, unless otherwise stated)
| 34. | Risks and Financial Instruments (Consolidated) |
a. Risk Management and Financial Instruments—Governance
The main risks to which the Company and its subsidiaries are exposed reflect strategic/operational and economic/financial aspects. Operational/strategic risks (including, but not limited to, demand behavior, competition, technological innovation, and material changes in the industry structure) are addressed by the Company’s management model. Economic/financial risks primarily reflect default of customers, behavior of macroeconomic variables, such as exchange and interest rates, as well as the characteristics of the financial instruments used by the Company and its subsidiaries and their counterparties. These risks are managed through control policies, specific strategies, and the establishment of limits.
The Company has a policy for the management of resources, financial instruments, and risks approved by its Board of Directors (“Policy”). In accordance with the Policy, the main objectives of financial management are to preserve the value and liquidity of financial assets and ensure financial resources for the development of the business, including expansions. The main financial risks considered in the Policy are risks associated with currencies, interest rates, credit, and selection of financial instruments. Governance of the management of financial risks and financial instruments follows the segregation of duties below:
| • | Implementation of the management of financial assets, instruments, and risks is the responsibility of the financial area, through its treasury department, with the assistance of the tax and accounting departments. |
| • | Supervision and monitoring of compliance with the principles, guidelines, and standards of the Policy is the responsibility of the Risk and Investment Committee, which is composed of members of the Company’s Executive Board (“Committee”). The Committee holds regular meetings and is in charge, among other responsibilities, of discussing and monitoring the financial strategies, existing exposures, and significant transactions involving investment, fundraising, or risk mitigation. The Committee monitors the risk standards established by the Policy through a monitoring map on a monthly basis. |
| • | Changes in the Policy orrevisions of its standards are subject to the approval of the Board of Directors of Ultrapar. |
| • | Continuous improvement of the Policy is the joint responsibility of the Board of Directors, the Committee, and the financial area. |
| • | The internal audit departmentaudits the compliance with the requirements of the Policy. |
81
Table of Contents
Ultrapar Participações S.A. and Subsidiaries
Notes to the Parent and Consolidated Interim financial information
(In thousands of Brazilian Reais, unless otherwise stated)
| b. | Currency Risk |
Most transactions of the Company, through its subsidiaries, are located in Brazil and, therefore, the reference currency for risk management is the Brazilian Real. Currency risk management is guided by neutrality of currency exposures and considers the transactional, accounting, and operational risks of the Company and its subsidiaries and their exposure to changes in exchange rates. The Company considers as its main currency exposures the assets and liabilities in foreign currency and the short-term flow of net sales in foreign currency of Oxiteno.
The Company and its subsidiaries use exchange rate hedging instruments (especially between the Brazilian Real and the U.S. dollar) available in the financial market to protect their assets, liabilities, receipts, and disbursements in foreign currency and net investments in foreign operations. Hedge is used in order to reduce the effects of changes in exchange rates on the Company´s income and cash flows in Brazilian Reais within the exposure limits under its Policy. Such foreign exchange hedging instruments have amounts, periods, and rates substantially equivalent to those of assets, liabilities, receipts, and disbursements in foreign currencies to which they are related.
Assets and liabilities in foreign currencies are stated below, translated into Brazilian Reais:
| b.1 | Assets and Liabilities in Foreign Currencies |
In millions of Brazilian Reais | 06/30/2019 | 12/31/2018 | ||||||
Assets in foreign currency | ||||||||
Cash, cash equivalents and financial investments in foreign currency (except hedging instruments) | 267.5 | 254.2 | ||||||
Foreign trade receivables, net of allowance for doubtful accounts and advances to foreign customers | 222.7 | 235.1 | ||||||
Other net assets in foreign (except cash, cash equivalents, financial investments, trade receivables, financing, and payables) | 1,383.5 | 1,384.9 | ||||||
|
|
|
| |||||
| 1,873.7 | 1,874.2 | |||||||
|
|
|
| |||||
Liabilities in foreign currency | ||||||||
Financing in foreign currency, gross of transaction costs and discount | (6,597.6 | ) | (5,515.6 | ) | ||||
Payables arising from imports, net of advances to foreign suppliers | (308.4 | ) | (567.7 | ) | ||||
|
|
|
| |||||
| (6,906.0 | ) | (6,083.3 | ) | |||||
|
|
|
| |||||
Foreign currency hedging instruments | 3,490.4 | 2,483.0 | ||||||
|
|
|
| |||||
Net liability position—Total | (1,541.9 | ) | (1,726.1 | ) | ||||
Net asset (liability) position—Income statement effect | 364.9 | 282.7 | ||||||
Net liability position—Equity effect | (1,906.8 | ) | (2,008.8 | ) | ||||
82
Table of Contents
Ultrapar Participações S.A. and Subsidiaries
Notes to the Parent and Consolidated Interim financial information
(In thousands of Brazilian Reais, unless otherwise stated)
| b.2 | Sensitivity Analysis of Assets and Liabilities in Foreign Currency |
Scenarios I, II and III were based on 10%, 25% and 50% variations, respectively, applied on the net position of the Company exposed to the currency risk, simulating the effects of appreciation and devaluation of the Real in the income statement and the equity:
The table below shows, in the three scenarios, the effects of exchange rate changes on the net liability position of R$ 1,541.9 million in foreign currency as of June 30, 2019:
| In millions of Brazilian Reais | Risk | Scenario I | Scenario II | Scenario III | ||||||||||
| Likely | 25% | 50% | ||||||||||||
(1) Income statement effect | Real devaluation | 36.5 | 91.2 | 182.5 | ||||||||||
(2) Equity effect | (190.7 | ) | (476.7 | ) | (953.4 | ) | ||||||||
|
|
|
|
|
| |||||||||
(1) + (2) | Net effect | (154.2 | ) | (385.5 | ) | (770.9 | ) | |||||||
|
|
|
|
|
| |||||||||
(3) Income statement effect | Real appreciation | (36.5 | ) | (91.2 | ) | (182.5 | ) | |||||||
(4) Equity effect | 190.7 | 476.7 | 953.4 | |||||||||||
|
|
|
|
|
| |||||||||
(3) + (4) | Net effect | 154.2 | 385.5 | 770.9 | ||||||||||
|
|
|
|
|
| |||||||||
The table below shows, in the three scenarios, the effects of exchange rate changes on the net liability position of R$ 1,726.1 million in foreign currency as of December 31, 2018:
| In millions of Brazilian Reais | Risk | Scenario I | Scenario II | Scenario III | ||||||||||
| Likely | 25% | 50% | ||||||||||||
(1) Income statement effect | Real devaluation | 28.3 | 70.7 | 141.4 | ||||||||||
(2) Equity effect | (200.9 | ) | (502.2 | ) | (1,004.4 | ) | ||||||||
|
|
|
|
|
| |||||||||
(1) + (2) | Net effect | (172.6 | ) | (431.5 | ) | (863.0 | ) | |||||||
|
|
|
|
|
| |||||||||
(3) Income statement effect | Real appreciation | (28.3 | ) | (70.7 | ) | (141.4 | ) | |||||||
(4) Equity effect | 200.9 | 502.2 | 1,004.4 | |||||||||||
|
|
|
|
|
| |||||||||
(3) + (4) | Net effect | 172.6 | 431.5 | 863.0 | ||||||||||
|
|
|
|
|
| |||||||||
The equity effect refers to cumulative translation adjustments of changes in the exchange rate on equity of foreign subsidiaries (see Notes 2.s.1 and 26.g.2), net investments hedge in foreign entities, cash flow hedge of firm commitment and highly probable transaction (see Note 2.c and “h. Hedge Accounting” below).
| c. | Interest Rate Risk |
The Company and its subsidiaries adopt policies for borrowing and investing financial resources and for capital cost minimization. The financial investments of the Company and its subsidiaries are primarily held in transactions linked to the CDI, as set forth in Note 4. Borrowings primarily relate to financing from Banco do Brasil, as well as debentures and borrowings in foreign currency, as shown in Note 16.
The Company attempts to maintain its financial interest assets and liabilities at floating rates.
83
Table of Contents
Ultrapar Participações S.A. and Subsidiaries
Notes to the Parent and Consolidated Interim financial information
(In thousands of Brazilian Reais, unless otherwise stated)
| c.1 | Assets and liabilities exposed to floating interest rates |
The financial assets and liabilities exposed to floating interest rates are demonstrated below:
In millions of Brazilian Reais
| Note | 06/30/2019 | 12/31/2018 | ||||||||||
CDI | ||||||||||||
Cash equivalents | 4.a | 2,683.0 | 3,722.3 | |||||||||
Financial investments | 4.b | 2,775.4 | 2,537.3 | |||||||||
Asset position of foreign exchange hedging instruments—CDI | 34.g | 31.9 | 33.9 | |||||||||
Loans and debentures | 16.a | (6,783.1 | ) | (8,440.9 | ) | |||||||
Liability position of foreign exchange hedging instruments—CDI | 34.g | (3,099.5 | ) | (2,205.5 | ) | |||||||
Liability position of fixed interest instruments + IPCA—CDI | 34.g | (826.5 | ) | (823.5 | ) | |||||||
|
|
|
| |||||||||
Net liability position in CDI | (5,218.8 | ) | (5,176.4 | ) | ||||||||
|
|
|
| |||||||||
TJLP | ||||||||||||
Loans –TJLP | 16.a | (150.9 | ) | (201.2 | ) | |||||||
|
|
|
| |||||||||
Net liability position in TJLP | (150.9 | ) | (201.2 | ) | ||||||||
|
|
|
| |||||||||
LIBOR | ||||||||||||
Asset position of foreign exchange hedging instruments—LIBOR | 34.g | 833.3 | 811.6 | |||||||||
Loans—LIBOR | 16.a | (1,434.1 | ) | (1,437.1 | ) | |||||||
|
|
|
| |||||||||
Net liability position in LIBOR | (600.8 | ) | (625.5 | ) | ||||||||
|
|
|
| |||||||||
TIIE | ||||||||||||
Loans—TIIE | 16.a | (18.1 | ) | (4.0 | ) | |||||||
|
|
|
| |||||||||
Net liability position in TIIE | (18.1 | ) | (4.0 | ) | ||||||||
|
|
|
| |||||||||
SELIC | ||||||||||||
Loans—SELIC | 16.a | (41.3 | ) | (51.5 | ) | |||||||
|
|
|
| |||||||||
Net liability position in SELIC | (41.3 | ) | (51.5 | ) | ||||||||
|
|
|
| |||||||||
Total net liability position exposed to floating interest | (6,029.9 | ) | (6,058.6 | ) | ||||||||
|
|
|
| |||||||||
84
Table of Contents
Ultrapar Participações S.A. and Subsidiaries
Notes to the Parent and Consolidated Interim financial information
(In thousands of Brazilian Reais, unless otherwise stated)
| c.2 | Sensitivity Analysis of Floating Interest Rate Risk |
For sensitivity analysis of floating interest rate risk, the Company used the accumulated amount of the reference indexes (CDI, TJLP, LIBOR, TIIE and SELIC) as a base scenario. Scenarios I, II and III were based on 10%, 25% and 50% variations, respectively, applied in the floating interest rate of the base scenario:
The tables below show the incremental expenses and income that would be recognized in financial income, due to the effect of floating interest rate changes in different scenarios.
In millions of Brazilian Reais | 06/30/2019 | |||||||||||||||
| Risk | Scenario I | Scenario II | Scenario III | |||||||||||||
| Likely | 25% | 50% | ||||||||||||||
Exposure of interest rate risk | ||||||||||||||||
Interest effect on cash equivalents and financial investments | Increase in CDI | 16.0 | 40.2 | 80.3 | ||||||||||||
Foreign exchange hedging instruments (assets in CDI) effect | Increase in CDI | — | 0.1 | 0.2 | ||||||||||||
Interest effect on debt in CDI | Increase in CDI | (25.2 | ) | (62.9 | ) | (125.8 | ) | |||||||||
Interest rate hedging instruments (liabilities in CDI) effect | Increase in CDI | (15.7 | ) | (37.0 | ) | (72.4 | ) | |||||||||
|
|
|
|
|
| |||||||||||
Incremental expenses | (24.9 | ) | (59.6 | ) | (117.7 | ) | ||||||||||
|
|
|
|
|
| |||||||||||
Interest effect on debt in TJLP | Increase in TJLP | (0.3 | ) | (0.7 | ) | (1.4 | ) | |||||||||
|
|
|
|
|
| |||||||||||
Incremental expenses | (0.3 | ) | (0.7 | ) | (1.4 | ) | ||||||||||
|
|
|
|
|
| |||||||||||
Foreign exchange hedging instruments (assets in LIBOR) effect | Increase in LIBOR | 1.1 | 2.8 | 5.5 | ||||||||||||
Interest effect on debt in LIBOR | Increase in LIBOR | (1.9 | ) | (4.8 | ) | (9.6 | ) | |||||||||
|
|
|
|
|
| |||||||||||
Incremental expenses | (0.8 | ) | (2.0 | ) | (4.1 | ) | ||||||||||
|
|
|
|
|
| |||||||||||
Interest effect on debt in TIIE | Increase in TIIE | (0.1 | ) | (0.1 | ) | (0.2 | ) | |||||||||
|
|
|
|
|
| |||||||||||
Incremental expenses | (0.1 | ) | (0.1 | ) | (0.2 | ) | ||||||||||
|
|
|
|
|
| |||||||||||
Interest effect on debt in SELIC | Increase in SELIC | (0.3 | ) | (0.7 | ) | (1.5 | ) | |||||||||
|
|
|
|
|
| |||||||||||
Incremental expenses | (0.3 | ) | (0.7 | ) | (1.5 | ) | ||||||||||
|
|
|
|
|
| |||||||||||
85
Table of Contents
Ultrapar Participações S.A. and Subsidiaries
Notes to the Parent and Consolidated Interim financial information
(In thousands of Brazilian Reais, unless otherwise stated)
In millions of Brazilian Reais | 12/31/2018 | |||||||||||||||
| Risk | Scenario I | Scenario II | Scenario III | |||||||||||||
| Likely | 25% | 50% | ||||||||||||||
Exposure of interest rate risk | ||||||||||||||||
Interest effect on cash equivalents and financial investments | Increase in CDI | 32.7 | 81.7 | 163.3 | ||||||||||||
Foreign exchange hedging instruments (assets in CDI) effect | Increase in CDI | 0.1 | 0.2 | 0.5 | ||||||||||||
Interest effect on debt in CDI | Increase in CDI | (55.0 | ) | (137.4 | ) | (274.9 | ) | |||||||||
Interest rate hedging instruments (liabilities in CDI) effect | Increase in CDI | (33.7 | ) | (73.4 | ) | (139.6 | ) | |||||||||
|
|
|
|
|
| |||||||||||
Incremental expenses | (55.9 | ) | (128.9 | ) | (250.7 | ) | ||||||||||
|
|
|
|
|
| |||||||||||
Interest effect on debt in TJLP | Increase in TJLP | (1.7 | ) | (4.2 | ) | (8.3 | ) | |||||||||
|
|
|
|
|
| |||||||||||
Incremental expenses | (1.7 | ) | (4.2 | ) | (8.3 | ) | ||||||||||
|
|
|
|
|
| |||||||||||
Foreign exchange hedging instruments (assets in LIBOR) effect | Increase in LIBOR | 2.8 | 6.9 | 13.9 | ||||||||||||
Interest effect on debt in LIBOR | Increase in LIBOR | (3.6 | ) | (9.1 | ) | (18.1 | ) | |||||||||
|
|
|
|
|
| |||||||||||
Incremental expenses | (0.8 | ) | (2.2 | ) | (4.2 | ) | ||||||||||
|
|
|
|
|
| |||||||||||
Interest effect on debt in TIIE | Increase in TIIE | (0.1 | ) | (0.3 | ) | (0.5 | ) | |||||||||
|
|
|
|
|
| |||||||||||
Incremental expenses | (0.1 | ) | (0.3 | ) | (0.5 | ) | ||||||||||
|
|
|
|
|
| |||||||||||
Interest effect on debt in SELIC | Increase in SELIC | (0.4 | ) | (1.0 | ) | (2.0 | ) | |||||||||
|
|
|
|
|
| |||||||||||
Incremental expenses | (0.4 | ) | (1.0 | ) | (2.0 | ) | ||||||||||
|
|
|
|
|
| |||||||||||
| d. | Credit Risks |
The financial instruments that would expose the Company and its subsidiaries to credit risks of the counterparty are basically represented by cash and bank deposits, financial investments, hedging instruments (see Note 4), and trade receivables (see Note 5).
| d.1 | Credit risk of financial institutions |
Such risk results from the inability of financial institutions to comply with their financial obligations to the Company and its subsidiaries due to insolvency. The Company and its subsidiaries regularly conduct a credit review of the institutions with which they hold cash and cash equivalents, financial investments, and hedging instruments through various methodologies that assess liquidity, solvency, leverage, portfolio quality, etc. Cash and cash equivalents, financial investments, and hedging instruments are held only with institutions with a solid credit history, chosen for safety and soundness. The volume of cash and cash equivalents, financial investments, and hedging instruments are subject to maximum limits by each institution and, therefore, require diversification of counterparties.
| d.2 | Government credit risk |
The Company’s policy allows investments in government securities from countries classified as investment grade AAA or aaa by specialized credit rating agencies (S&P, Moody’s and Fitch) and in Brazilian government bonds. The volume of such financial investments is subject to maximum limits by each country and, therefore, requires diversification of counterparties.
The credit risk of cash, cash equivalents and financial investments is summarized below:
| Fair value | ||||||||
Counterparty credit rating | 06/30/2019 | 12/31/2018 | ||||||
AAA | 5,569,886 | 5,933,671 | ||||||
AA | 418,619 | 707,358 | ||||||
A | 260,847 | 262,553 | ||||||
BBB | 172,164 | 90,824 | ||||||
|
|
|
| |||||
Total | 6,421,516 | 6,994,406 | ||||||
|
|
|
| |||||
86
Table of Contents
Ultrapar Participações S.A. and Subsidiaries
Notes to the Parent and Consolidated Interim financial information
(In thousands of Brazilian Reais, unless otherwise stated)
d.3 Customer credit risk
The credit policy establishes the analysis of the profile of each new customer, individually, regarding their financial condition. The review carried out by the subsidiaries of the Company includes the evaluation of external ratings, when available, financial statements, credit bureau information, industry information and, when necessary, bank references. Credit limits are established for each customer and reviewed periodically, in a shorter period the greater the risk, depending on the approval of the responsible area in cases of sales that exceed these limits.
In monitoring credit risk, customers are grouped according to their credit characteristics and depending on the business the grouping takes into account, for example, whether they are natural or legal clients, whether they are wholesalers, resellers or final customers, considering also the geographic area.
The estimates of credit losses are calculated based on the probability of default rates. Loss rates are calculated on the basis of the average probability of a receivable amount to advance through successive stages of default until fullwrite-off. The probability of default calculation takes into account a credit risk score for each exposure, based on data considered to be capable of foreseeing the risk of loss (external classifications, audited financial statements, cash flow projections, customer information available in the press, for example), with addition of the credit assessment based on experience.
Such credit risks are managed by each business unit through specific criteria for acceptance of customers and their credit rating and are additionally mitigated by the diversification of sales. No single customer or group accounts for more than 10% of total revenue.
The subsidiaries of the Company maintained the following allowance for estimated losses on doubtful accounts balances on trade receivables:
| 06/30/2019 | 12/31/2018 | |||||||
Ipiranga | 486,861 | 442,486 | ||||||
Ultragaz | 85,580 | 61,975 | ||||||
Oxiteno | 12,708 | 12,371 | ||||||
Extrafarma | 6,093 | 5,858 | ||||||
Ultracargo | 2,045 | 2,089 | ||||||
|
|
|
| |||||
Total | 593,287 | 524,779 | ||||||
|
|
|
| |||||
For further information about the allowance for estimated losses on doubtful accounts, see Notes 5.a and 5.b.
| e. | Liquidity Risk |
The Company and its subsidiaries’ main sources of liquidity derive from (i) cash, cash equivalents, and financial investments, (ii) cash generated from operations and (iii) financing. The Company and its subsidiaries believe that these sources are sufficient to satisfy their current funding requirements, which include, but are not limited to, working capital, capital expenditures, amortization of debt, and payment of dividends.
The Company and its subsidiaries periodically examine opportunities for acquisitions and investments. They consider different types of investments, either directly, through joint ventures, or through associated companies, and finance such investments using cash generated from operations, debt financing, through capital increases, or through a combination of these methods.
The Company and its subsidiaries believe to have enough working capital and sources of financing to satisfy their current needs. The gross indebtedness due over the next twelve months totals R$ 1,588.8 million, including estimated interests on loans (for quantitative information, see Note 16.a). Furthermore, the investment plan for 2019 totals R$ 1,762 million, and until June 30, 2019, the amount of R$ 603.6 million had been realized. As of June 30, 2019, the Company and its subsidiaries had R$ 6,086.7 million in cash, cash equivalents, and short-term financial investments (for quantitative information, see Note 4).
87
Table of Contents
Ultrapar Participações S.A. and Subsidiaries
Notes to the Parent and Consolidated Interim financial information
(In thousands of Brazilian Reais, unless otherwise stated)
The table below presents a summary of financial liabilities as of June 30, 2019 by the Company and its subsidiaries, listed by maturity. The amounts disclosed in this table are the contractual undiscounted cash outflows, and, therefore, these amounts may be different from the amounts disclosed on the balance sheet.
| In millions of Brazilian Reais | ||||||||||||||||||||
Financial liabilities | Total | Less than 1 year | Between 1 and 3 years | Between 3 and 5 years | More than 5 years | |||||||||||||||
Loans including future contractual interest(1)(2) | 18,835.6 | 1,588.8 | 4,361.7 | 6,980.7 | 5,904.4 | |||||||||||||||
Currency and interest rate hedging instruments(3) | 642.3 | 75.3 | 173.7 | 158.7 | 234.6 | |||||||||||||||
Trade payables | 2,506.3 | 2,506.3 | — | — | — | |||||||||||||||
Leases payable | 2,563.7 | 329.1 | 987.3 | 617.2 | 630.1 | |||||||||||||||
| (1) | To calculate the estimated interest on loans some macroeconomic assumptions were used, including averaging for the period the following: (i) CDI of 6.03% from 2019 to 2020, 6.08% from 2021 to 2022, 6.78% from 2023, (ii) exchange rate of the Real against the U.S. dollar of R$ 3.87 in 2019, R$ 3.96 in 2020, R$ 4.12 in 2021, R$ 4.32 in 2022, R$ 4.53 in 2023, R$ 4.75 in 2024, R$ 5.00 in 2025, R$ 5.26 in 2026, R$ 5.52 in 2027, R$ 5.81 in 2028 and R$ 6.10 in 2029 (iii) TJLP of 5.95%, (iv)IGP-M of 5.83% in 2019, 4.13% in 2020, 3.75% in 2021, 3.50% as from 2022 and (v) IPCA of 3.80% from 2019 to 2025 (source: B3, Bulletin Focus and financial institutions). |
| (2) | Includes estimated interest payments on short-term and long-term loans until the payment date. |
| (3) | The currency and interest rate hedging instruments were estimated based on projected U.S dollar futures contracts and the futures curves of DI x Pre and Pre x IPCA contracts quoted on B3 on June 28, 2019 and on the futures curve of LIBOR (ICE—IntercontinentalExchange) andcommodities heating oil contracts and RBOB quoted onNew York Mercantile Exchange (“NYMEX”) on June 28, 2019. In the table above, only the hedging instruments with negative results at the time of settlement were considered. |
| f. | Capital Management |
The Company manages its capital structure based on indicators and benchmarks. The key performance indicators related to the capital structure management are the weighted average cost of capital, net debt / EBITDA, interest coverage, and indebtedness / equity ratios. Net debt is composed of cash, cash equivalents, and financial investments (see Note 4) and loans, including debentures (see Note 16). The Company can change its capital structure depending on the economic and financial conditions, in order to optimize its financial leverage and capital management. The Company seeks to improve its return on invested capital by implementing efficient working capital management and a selective investment program.
| g. | Selection and Use of Financial Instruments |
In selecting financial investments and hedging instruments, an analysis is conducted to estimate rates of return, risks involved, liquidity, calculation methodology for the carrying value and fair value, and a review is conducted of any documentation applicable to the financial instruments. The financial instruments used to manage the financial resources of the Company and its subsidiaries are intended to preserve value and liquidity.
The Policy contemplates the use of derivative financial instruments only to cover identified risks and in amounts consistent with the risk (limited to 100% of the identified risk). The risks identified in the Policy are described in the above sections, and are subject to risk management. In accordance with the Policy, the Company and its subsidiaries can use forward contracts, swaps, options, and futures contracts to manage identified risks. Leveraged derivative instruments are not permitted. Because the use of derivative financial instruments is limited to the coverage of identified risks, the Company and its subsidiaries use the term “hedging instruments” to refer to derivative financial instruments.
As mentioned in the section “a. Risk Management and Financial Instruments – Governance”, the Committee monitors compliance with the risk standards established by the Policy through a risk map, including the use of hedging instruments, on a monthly basis. In addition, the internal audit department verifies the compliance with the requirements of the Policy.
88
Table of Contents
Ultrapar Participações S.A. and Subsidiaries
Notes to the Parent and Consolidated Interim financial information
(In thousands of Brazilian Reais, unless otherwise stated)
The table below summarizes the position of hedging instruments entered by the Company and its subsidiaries:
Designated as hedge accounting | ||||||||||||||||||||||||||||||||
Product | Hedged object | Rates agreement | Maturity | Notional amount1 | Fair value | |||||||||||||||||||||||||||
| Assets | Liabilities | 06/30/2019 | 12/31/2018 | 06/30/2019 | 12/31/2018 | |||||||||||||||||||||||||||
| R$ million | R$ million | |||||||||||||||||||||||||||||||
Foreign exchange swap | Debt | USD + 4.51% | 104.0% CDI | nov 2023 | USD 245.0 | USD 245.0 | 33.1 | (10.3) | ||||||||||||||||||||||||
Foreign exchange swap | Debt | | USD + LIBOR-3M + 1.11%= 4.1% | | 105.0% CDI | jul 2023 | USD 150.0 | USD 150.0 | 52.1 | 45.6 | ||||||||||||||||||||||
Interest rate swap | Debt | 4.57% + IPCA | 95.8% CDI | oct 2024 | R$ 806.1 | R$ 806.1 | 102.6 | 35.6 | ||||||||||||||||||||||||
Zero Cost Collar | Operating margin | Put USD 3.60 | Call USD 4.60 | dec 2019 | USD 74.7 | USD 149.4 | 0.6 | 0.3 | ||||||||||||||||||||||||
| 188.4 | 71.2 | |||||||||||||||||||||||||||||||
Not designated as hedge accounting | ||||||||||||||||||||||||||||||||
Product | Hedged object | Rates agreement | Maturity | Notional amount1 | Fair value | |||||||||||||||||||||||||||
| Assets | Liabilities | 06/30/2019 | 12/31/2018 | 06/30/2019 | 12/31/2018 | |||||||||||||||||||||||||||
| R$ million | R$ million | |||||||||||||||||||||||||||||||
Foreign exchange swap | Debt | USD + 3,60% | 65.0% CDI | jun/2029 | USD 853.0 | USD 758.3 | 307.7 | 246.5 | ||||||||||||||||||||||||
Foreign exchange swap | Debt | | LIBOR-3M + 2.0% = 4.6% | | 105.9% CDI | jun 2020 | USD 60.0 | USD 60.0 | 48.1 | 38.0 | ||||||||||||||||||||||
Foreign exchange swap | Firm commitments | USD + 0.00% | 46,3% CDI | oct 2019 | USD 34.6 | USD 98.5 | (1.5) | (8.6) | ||||||||||||||||||||||||
Foreign exchange swap | Operating margin | 42,2% CDI | USD + 0.00% | sep 2019 | USD 8.1 | USD 8.9 | 1.0 | 0.1 | ||||||||||||||||||||||||
Term | Firm commitments | BRL | Heating Oil / RBOB | jul 2019 | USD 22.5 | — | 2.9 | — | ||||||||||||||||||||||||
|
|
|
| |||||||||||||||||||||||||||||
| 358.2 | 276.0 | |||||||||||||||||||||||||||||||
| (1) | In million. Currency as indicated. |
All transactions mentioned above were properly registered with CETIP S.A.
89
Table of Contents
Ultrapar Participações S.A. and Subsidiaries
Notes to the Parent and Consolidated Interim financial information
(In thousands of Brazilian Reais, unless otherwise stated)
| h. | Hedge Accounting |
The Company and its subsidiaries use derivative andnon-derivative financial instruments for hedging purposes and test, throughout the duration of the hedge, their effectiveness, as well as the changes in their fair value.
| h.1 | Fair value hedge |
The Company and its subsidiaries designate as fair value hedges certain financial instruments used to offset the variations in interest and exchange rates, which are based on the market value of financing contracted in Brazilian Reais and U.S. dollars.
The foreign exchange hedging instruments designated as fair value hedge are:
| In millions, except the CDI % | 06/30/2019 | 12/31/2018 | ||||||
Notional amount—US$ | 395.0 | 395.0 | ||||||
Result of hedging instruments—gain/(loss)—R$ | 36.9 | 149.2 | ||||||
Fair value adjustment of debt—R$ | (60.9 | ) | (28.5 | ) | ||||
Financial expense in the statements of profit or loss—R$ | (16.8 | ) | (215.9 | ) | ||||
Average effective cost—CDI % | 104.4 | 104.4 | ||||||
For more information, see Note 16.c.1.
The interest rate hedging instruments designated as fair value hedge are:
| In millions, except the CDI % | 06/30/2019 | 12/31/2018 | ||||||
Notional amount—R$ | 806.1 | 806.1 | ||||||
Result of hedging instruments—gain/(loss)—R$ | 63.6 | 25.8 | ||||||
Fair value adjustment of debt—R$ | (47.0 | ) | (13.3 | ) | ||||
Financial expense in the statements of profit or loss—R$ | (39.0 | ) | (50.2 | ) | ||||
Average effective cost—CDI % | 95.8 | 95.8 | ||||||
| h.2 | Cash flow hedge |
The Company and its subsidiaries designate, as cash flow hedge of firm commitment and highly probable transactions, derivative financial instruments to hedge “firm commitments” andnon-derivative financial instruments to hedge “highly probable future transactions”, to hedge against fluctuations arising from changes in exchange rate.
On June 30, 2019, the Company had no exchange rate and commodities hedging instruments of firm commitments designated as cash flow hedges. For the exchange rate and commodities hedging instruments settled in 2019, a loss of R$ 29.1 million (a gain of R$ 10.7 million for the period ended on June 30, 2018). was recognized in the statement of profit or loss.
On June 30, 2019, the notional amount of foreign exchange hedging instruments for highly probable future transactions designated as cash flow hedge, related to notes in the foreign market totaled US$ 550.0 million (US$ 570.0 million on December 31, 2018). On June 30, 2019, the unrealized loss of “Other comprehensive income” is R$ 229.1 million (loss of R$ 243.7 million on December 31, 2018), net of deferred IRPJ and CSLL.
On June 30, 2019, the notional amount of foreign exchange hedging instruments for highly probable future transactions designated as cash flow hedge, related to future sales revenues of Oxiteno (zero cost collars) totaled US$ 74.7 million (US$ 149.4 million on December 31, 2018). On June 30, 2019, the unrealized loss of “Other comprehensive income” is R$ 0.4 million (loss of R$ 0.2 million on December 31, 2018), net of deferred IRPJ and CSLL.
90
Table of Contents
Ultrapar Participações S.A. and Subsidiaries
Notes to the Parent and Consolidated Interim financial information
(In thousands of Brazilian Reais, unless otherwise stated)
| h.3 | Net investment hedge in foreign entities |
The Company and its subsidiaries designate, as net investment hedge in foreign entities, notes in the foreign market, for hedging net investment in foreign entities, to offset changes in exchange rates.
On June 30, 2019, the balance of foreign exchange hedging instruments designated as net investments hedge in foreign entities, related to part of the investments made in entities which functional currency is other than the Brazilian Real, totaled US$ 95.0 million (US$ 96.0 million on December 31, 2018). On June 30, 2019, the unrealized loss of “Other comprehensive income” is R$ 43.2 million (loss of R$ 45.9 million on December 31, 2018), net of deferred income and social contribution taxes. The effects of exchange rate changes on investments and hedging instruments were offset in equity.
| i. | Gains (losses) on Hedging Instruments |
The following tables summarize the value of gains (losses) recognized, which affected the equity of the Company and its subsidiaries:
| R$ million | ||||||||
| 06/30/2019 | ||||||||
| Profit or loss | Equity | |||||||
a – Exchange rate swaps receivable in U.S. dollars (i) (ii) | 206.6 | — | ||||||
b – Exchange rate swaps payable in U.S. dollars (ii) | — | 0.4 | ||||||
c – Interest rate swaps in R$ (iii) | 16.7 | — | ||||||
d –Non-derivative financial instruments (iv) | (54.0 | ) | (272.3 | ) | ||||
|
|
|
| |||||
Total | 169.3 | (271.9 | ) | |||||
|
|
|
| |||||
| R$ million | ||||||||
| 06/30/2018 | 12/31/2018 | |||||||
| Profit or loss | Equity | |||||||
a – Exchange rate swaps receivable in U.S. dollars (i) (ii) | 15.2 | — | ||||||
b – Exchange rate swaps payable in U.S. dollars (ii) | (4.6 | ) | 0.2 | |||||
c – Interest rate swaps in R$ (iii) | (3.9 | ) | — | |||||
d –Non-derivative financial instruments (iv) | (57.9 | ) | (289.6 | ) | ||||
|
|
|
| |||||
Total | (51.2 | ) | (289.4 | ) | ||||
|
|
|
| |||||
| (i) | Does not consider the effect of exchange rate variation of exchange swaps receivable in U.S. dollars when this effect is offset in the gain or loss of the hedged item (debt/firm commitments); |
| (ii) | Considers the designation effect of foreign exchange hedging; |
| (iii) | Considers the designation effect of interest rate hedging in Brazilian Reais; and |
| (iv) | Considers the results of notes in the foreign market (for further information see Note 16.b). |
91
Table of Contents
Ultrapar Participações S.A. and Subsidiaries
Notes to the Parent and Consolidated Interim financial information
(In thousands of Brazilian Reais, unless otherwise stated)
| j. | Fair Value of Financial Instruments |
The fair values and the carrying values of the financial instruments, including currency and interest rate hedging instruments, are stated below:
| 06/30/2019 | 12/31/2018 | |||||||||||||||||||||||
| Category | Note | Carrying value | Fair value | Carrying value | Fair value | |||||||||||||||||||
Financial assets: | ||||||||||||||||||||||||
Cash and cash equivalents | ||||||||||||||||||||||||
Cash and bank deposits | Measured at amortized cost | 4.a | 207,651 | 207,651 | 205,482 | 205,482 | ||||||||||||||||||
Financial investments in local currency | | Measured at fair value through other comprehensive income | | 4.a | 2,683,000 | 2,683,000 | 3,722,308 | 3,722,308 | ||||||||||||||||
Financial investments in foreign currency | | Measured at fair value through profit or loss | | 4.a | 18,651 | 18,651 | 11,161 | 11,161 | ||||||||||||||||
Financial investments: | ||||||||||||||||||||||||
Fixed-income securities and funds in local currency | | Measured at fair value through profit or loss | | 4.b | 2,368,865 | 2,368,865 | 2,462,018 | 2,462,018 | ||||||||||||||||
Fixed-income securities and funds in local currency | | Measured at fair value through other comprehensive income | | 4.b | 331,389 | 331,389 | 2,208 | 2,208 | ||||||||||||||||
Fixed-income securities and funds in local currency | Measured at amortized cost | 4.b | 75,154 | 75,154 | 73,089 | 73,089 | ||||||||||||||||||
Fixed-income securities and funds in foreign currency | | Measured at fair value through other comprehensive income | | 4.b | 186,755 | 186,755 | 154,811 | 154,811 | ||||||||||||||||
Currency and interest rate hedging instruments | | Measured at fair value through profit or loss | | 4.b | 550,051 | 550,051 | 363,329 | 363,329 | ||||||||||||||||
Reseller Financing | Measured at amortized cost | 5.b | 730,703 | 766,458 | 715,530 | 752,471 | ||||||||||||||||||
|
|
|
|
|
|
|
| |||||||||||||||||
Total | 7,152,219 | 7,187,974 | 7,709,936 | 7,746,877 | ||||||||||||||||||||
|
|
|
|
|
|
|
| |||||||||||||||||
Financial liabilities: | ||||||||||||||||||||||||
Financing | | Measured at fair value through profit or loss | | 16.a | 1,615,229 | 1,615,229 | 1,567,374 | 1,567,374 | ||||||||||||||||
Financing | Measured at amortized cost | 16.a | 6,305,669 | 6,308,696 | 6,889,310 | 6,840,079 | ||||||||||||||||||
Debentures | Measured at amortized cost | 16.a | 5,717,149 | 5,562,609 | 5,826,242 | 5,770,979 | ||||||||||||||||||
Debentures | | Measured at fair value through profit or loss | | 16.a | 902,811 | 902,811 | 833,213 | 833,213 | ||||||||||||||||
Leases payable | Measured at amortized cost | 13 | 1,564,714 | 1,564,714 | 46,066 | 46,066 | ||||||||||||||||||
Commodities, currency and interest rate hedging instruments | | Measured at fair value through profit or loss | | 16.a | 29,724 | 29,724 | 43,944 | 43,944 | ||||||||||||||||
Subscription warrants—indemnification | | Measured at fair value through profit or loss | | 25 | 90,567 | 90,567 | 123,095 | 123,095 | ||||||||||||||||
|
|
|
|
|
|
|
| |||||||||||||||||
Total | 16,225,863 | 16,074,350 | 15,329,244 | 15,224,750 | ||||||||||||||||||||
|
|
|
|
|
|
|
| |||||||||||||||||
92
Table of Contents
Ultrapar Participações S.A. and Subsidiaries
Notes to the Parent and Consolidated Interim financial information
(In thousands of Brazilian Reais, unless otherwise stated)
The fair value of financial instruments, including currency and interest hedging instruments, was determined as follows:
| • | The fair value of cash and bank deposit balances are identical to their carrying values. |
| • | Financial investments in investment funds are valued at the value of the fund unit as of the date of the interim financial information, which corresponds to their fair value. |
| • | Financial investments in CDBs (Bank Certificates of Deposit) and similar investments offer daily liquidity through repurchase at the “yield curve” and the Company calculates their fair value through methodologies commonly used for mark to the market. |
| • | The fair value of trade receivables and trade payables are approximate to their carrying values. |
| • | The subscription warrants—indemnification were measured based on the share price of Ultrapar (UGPA3) at the interim financial information date and are adjusted to the Company’s dividend yield, since the exercise is only possible starting in 2020 onwards and they are not entitled to dividends until then. The number of shares of subscription warrants—indemnification is also adjusted according to the changes in the amounts of provision for tax, civil, and labor risks and contingent liabilities related to the period prior to January 31, 2014. (See Note 25). |
The fair value calculation of notes in the foreign market (see Note 16.b) is based on the quoted price in an active market.
The fair value of other financial investments, financing and leases payable was determined using calculation methodologies commonly used formark-to-market reporting, which consist of calculating future cash flows associated with each instrument adopted and adjusting them to present value at the market rates as of the date of the interim financial information. For some cases where there is no active market for the financial instrument, the Company and its subsidiaries can use quotes provided by the transaction counterparties.
The interpretation of market information on the choice of calculation methodologies for the fair value requires considerable judgment and estimates to obtain a value deemed appropriate to each situation. Consequently, the estimates presented do not necessary indicate the amounts that may be realizable in the current market.
Financial instruments were classified as financial assets or liabilities measured at amortized cost, except (i) all exchange rate and interest rate hedging instruments, which are measured at fair value through profit or loss, financial investments classified as measured at fair value through profit or loss and financial investments that are classified as measured at fair value through other comprehensive income (see Note 4.b), (ii) loans and financing measured at fair value through profit or loss (see Note 16.a), (iii) guarantees to customers that have vendor arrangements (see Note 16.i), which are measured at fair value through profit or loss, and (iv) subscription warrants—indemnification, which are measured at fair value through profit or loss (see Note 25). Cash, banks, trade receivables and reseller financing are classified as measured at amortized cost. Trade payables, leases payable and other payables are classified as financial liabilities measured at amortized cost.
93
Table of Contents
Ultrapar Participações S.A. and Subsidiaries
Notes to the Parent and Consolidated Interim financial information
(In thousands of Brazilian Reais, unless otherwise stated)
j.1 Fair Value Hierarchy of Financial Instruments
The financial instruments are classified in the following categories:
(a) Level 1—prices negotiated (without adjustment) in active markets for identical assets or liabilities;
(b) Level 2—inputs other than prices negotiated in active markets included in Level 1 and observable for the asset or liability, either directly (as prices) or indirectly (derived from prices); and
(c) Level 3—inputs for the asset or liability which are not based on observable market variables (unobservable inputs).
The table below shows the categories of the financial assets and financial liabilities:
| Category | Note | 06/30/2019 | Level 1 | Level 2 | Level 3 | |||||||||||||||||||
Financial assets: | ||||||||||||||||||||||||
Cash equivalents | ||||||||||||||||||||||||
Cash and banks | Measured at amortized cost | 4.a | 207,651 | 207,651 | — | — | ||||||||||||||||||
Financial investments in local currency | | Measured at fair value through other comprehensive income | | 4.a | 2,683,000 | — | 2,683,000 | — | ||||||||||||||||
Financial investments in foreign currency | | Measured at fair value through profit or loss | | 4.a | 18,651 | 18,651 | — | — | ||||||||||||||||
Financial investments: | ||||||||||||||||||||||||
Fixed-income securities and funds in local currency | | Measured at fair value through profit or loss | | 4.b | 2,368,865 | 2,368,865 | — | — | ||||||||||||||||
Fixed-income securities and funds in local currency | | Measured at fair value through other comprehensive income | | 4.b | 331,389 | — | 331,389 | — | ||||||||||||||||
Fixed-income securities and funds in local currency | Measured at amortized cost | 4.b | 75,154 | — | 75,154 | — | ||||||||||||||||||
Fixed-income securities and funds in foreign currency | | Measured at fair value through other comprehensive income | | 4.b | 186,755 | 2,606 | 184,149 | — | ||||||||||||||||
Currency and interest rate hedging instruments | | Measured at fair value through profit or loss | | 4.b | 550,051 | — | 550,051 | — | ||||||||||||||||
Reseller Financing | Measured at amortized cost | 5.b | 766,458 | — | 766,458 | — | ||||||||||||||||||
|
|
|
|
|
|
|
| |||||||||||||||||
Total | 7,187,974 | 2,597,773 | 4,590,201 | — | ||||||||||||||||||||
|
|
|
|
|
|
|
| |||||||||||||||||
Financial liabilities: | ||||||||||||||||||||||||
Financing | | Measured at fair value through profit or loss | | 16.a | 1,615,229 | — | 1,615,229 | — | ||||||||||||||||
Financing | Measured at amortized cost | 16.a | 6,308,696 | 4,000,025 | 2,308,671 | — | ||||||||||||||||||
Debentures | Measured at amortized cost | 16.a | 5,562,609 | — | 5,562,609 | — | ||||||||||||||||||
Debentures | | Measured at fair value through profit or loss | | 16.a | 902,811 | — | 902,811 | — | ||||||||||||||||
Leases payable | Measured at amortized cost | 13 | 1,564,714 | — | 1,564,714 | — | ||||||||||||||||||
Currency and interest rate hedging instruments | | Measured at fair value through profit or loss | | 16.a | 29,724 | — | 29,724 | — | ||||||||||||||||
Subscription warrants – indemnification(1) | | Measured at fair value through profit or loss | | 25 | 90,567 | — | 90,567 | — | ||||||||||||||||
|
|
|
|
|
|
|
| |||||||||||||||||
Total | 16,074,350 | 4,000,025 | 12,074,325 | — | ||||||||||||||||||||
|
|
|
|
|
|
|
| |||||||||||||||||
94
Table of Contents
Ultrapar Participações S.A. and Subsidiaries
Notes to the Parent and Consolidated Interim financial information
(In thousands of Brazilian Reais, unless otherwise stated)
| Category | Note | 12/31/2018 | Level 1 | Level 2 | Level 3 | |||||||||||||||||||
Financial assets: | ||||||||||||||||||||||||
Cash equivalents | ||||||||||||||||||||||||
Cash and banks | Measured at amortized cost | 4.a | 205,482 | 205,482 | — | — | ||||||||||||||||||
Financial investments in local currency | | Measured at fair value through other comprehensive income | | 4.a | 3,722,308 | — | 3,722,308 | — | ||||||||||||||||
Financial investments in foreign currency | | Measured at fair value through profit or loss | | 4.a | 11,161 | 11,161 | — | — | ||||||||||||||||
Financial investments: | ||||||||||||||||||||||||
Fixed-income securities and funds in local currency | | Measured at fair value through profit or loss | | 4.b | 2,462,018 | 2,462,018 | — | — | ||||||||||||||||
Fixed-income securities and funds in local currency | | Measured at fair value through other comprehensive income | | 4.b | 2,208 | — | 2,208 | — | ||||||||||||||||
Fixed-income securities and funds in local currency | Measured at amortized cost | 4.b | 73,089 | — | 73,089 | — | ||||||||||||||||||
Fixed-income securities and funds in foreign currency | | Measured at fair value through other comprehensive income | | 4.b | 154,811 | 1,666 | 153,145 | — | ||||||||||||||||
Currency and interest rate hedging instruments | | Measured at fair value through profit or loss | | 4.b | 363,329 | — | 363,329 | — | ||||||||||||||||
Reseller Financing | Measured at amortized cost | 5.b | 752,471 | — | 752,471 | — | ||||||||||||||||||
|
|
|
|
|
|
|
| |||||||||||||||||
Total | 7,746,877 | 2,680,327 | 5,066,550 | — | ||||||||||||||||||||
|
|
|
|
|
|
|
| |||||||||||||||||
Financial liabilities: | ||||||||||||||||||||||||
Financing | | Measured at fair value through profit or loss | | 16.a | 1,567,374 | — | 1,567,374 | — | ||||||||||||||||
Financing | Measured at amortized cost | 16.a | 6,840,079 | 2,841,436 | 3,998,643 | — | ||||||||||||||||||
Debentures | Measured at amortized cost | 16.a | 5,770,979 | — | 5,770,979 | — | ||||||||||||||||||
Debentures | | Measured at fair value through profit or loss | | 16.a | 833,213 | — | 833,213 | — | ||||||||||||||||
Leases payable | Measured at amortized cost | 13 | 46,066 | — | 46,066 | — | ||||||||||||||||||
Currency and interest rate hedging instruments | | Measured at fair value through profit or loss | | 16.a | 43,944 | — | 43,944 | — | ||||||||||||||||
Subscription warrants—indemnification(1) | | Measured at fair value through profit or loss | | 25 | 123,095 | — | 123,095 | — | ||||||||||||||||
|
|
|
|
|
|
|
| |||||||||||||||||
Total | 15,224,750 | 2,841,436 | 12,383,314 | — | ||||||||||||||||||||
|
|
|
|
|
|
|
| |||||||||||||||||
| (1) | Refers to subscription warrants issued by the Company in the Extrafarma acquisition. |
The fair value of trade receivables and trade payables are classified as level 2.
95
Table of Contents
Ultrapar Participações S.A. and Subsidiaries
Notes to the Parent and Consolidated Interim financial information
(In thousands of Brazilian Reais, unless otherwise stated)
| k. | Sensitivity Analysis of Derivative Financial Instruments |
The Company and its subsidiaries use derivative financial instruments only to hedge against identified risks and in amounts consistent with the risk (limited to 100% of the identified risk). Thus, for purposes of sensitivity analysis of market risks associated with financial instruments, as required by CVM Instruction 475/08, the Company analyzes the hedging instrument and the hedged item together, as shown on the charts below.
For the sensitivity analysis of foreign exchange hedging instruments as of June 28, 2019 and December 2018, management adopted as a likely scenario the Real/U.S. dollar exchange rates at maturity of each swap, projected by U.S dollar futures contracts quoted on B3. As a reference, the exchange rate for the last maturity of foreign exchange hedging instruments is R$ 6.08 (R$ 5.86 as of December 31, 2018) in the likely scenario. Scenarios II and III were estimated with a 25% and 50% additional appreciation or depreciation of the Brazilian Real against the likely scenario, according to the risk to which the hedged item is exposed.
Based on the balances of the hedging instruments and hedged items as of June 30, 2019 and December 31, 2018, the exchange rates were replaced, and the changes between the new balance in Brazilian Reais and the original balance in Brazilian Reais were calculated in each of the three scenarios. The table below shows the change in the values of the main derivative instruments and their hedged items, considering the changes in the exchange rate in the different scenarios:
06/30/2019 | Risk | Scenario I Likely | Scenario II | Scenario III | ||||||||||||
Currency swaps receivable in U.S. dollars | ||||||||||||||||
(1) U.S. Dollar / Real swaps | Dollar | 947,986 | 1,972,680 | 2,997,374 | ||||||||||||
(2) Debts/firm commitments in dollars | appreciation | (947,984 | ) | (1,972,671 | ) | (2,997,358 | ) | |||||||||
|
|
|
|
|
| |||||||||||
(1)+(2) | Net effect | 2 | 9 | 16 | ||||||||||||
|
|
|
|
|
| |||||||||||
Currency swaps payable in U.S. dollars | ||||||||||||||||
(3) Real / U.S. Dollar swaps | Dollar | (116 | ) | 7,635 | 15,386 | |||||||||||
(4) Gross margin of Oxiteno | devaluation | 116 | (7,635 | ) | (15,386 | ) | ||||||||||
|
|
|
|
|
| |||||||||||
(3)+(4) | Net effect | — | — | — | ||||||||||||
|
|
|
|
|
| |||||||||||
Options | ||||||||||||||||
(5) Options Real / U.S. Dollar swaps | Dollar | — | 52,062 | 124,348 | ||||||||||||
(6) Gross margin of Oxiteno | Devaluation | — | (52,062 | ) | (124,348 | ) | ||||||||||
|
|
|
|
|
| |||||||||||
(5)+(6) | Net effect | — | — | — | ||||||||||||
|
|
|
|
|
| |||||||||||
12/31/2018 | Risk | Scenario I Likely | Scenario II | Scenario III | ||||||||||||
Currency swaps receivable in U.S. dollars | ||||||||||||||||
(1) U.S. Dollar / Real swaps | Dollar | 372,022 | 1,039,669 | 1,707,316 | ||||||||||||
(2) Debts/firm commitments in dollars | appreciation | (372,019 | ) | (1,039,661 | ) | (1,707,303 | ) | |||||||||
|
|
|
|
|
| |||||||||||
(1)+(2) | Net effect | 3 | 8 | 13 | ||||||||||||
|
|
|
|
|
| |||||||||||
Currency swaps payable in U.S. dollars | ||||||||||||||||
(3) Real / U.S. Dollar swaps | Dollar | (65 | ) | 8,545 | 17,154 | |||||||||||
(4) Gross margin of Oxiteno | devaluation | 65 | (8,545 | ) | (17,154 | ) | ||||||||||
|
|
|
|
|
| |||||||||||
(3)+(4) | Net effect | — | — | — | ||||||||||||
|
|
|
|
|
| |||||||||||
Options | ||||||||||||||||
(5) Options Real / U.S. Dollar swaps | Dollar | — | 97,938 | 244,572 | ||||||||||||
(6) Gross margin of Oxiteno | Devaluation | — | (97,938 | ) | (244,572 | ) | ||||||||||
|
|
|
|
|
| |||||||||||
(5)+(6) | Net effect | — | — | — | ||||||||||||
|
|
|
|
|
| |||||||||||
96
Table of Contents
Ultrapar Participações S.A. and Subsidiaries
Notes to the Parent and Consolidated Interim financial information
(In thousands of Brazilian Reais, unless otherwise stated)
For sensitivity analysis of hedging instruments for interest rates in Brazilian Reais as of June 30, 2019 and December 31, 2018, the Company used the futures curve of the DI x Pre contract quoted on B3 as of June 28, 2019 for each of the swap and debt (hedged item) maturities, to determine the likely scenarios. Scenarios II and III were estimated based on a 25% and 50% deterioration, respectively, of the likely scenariopre-fixed interest rate.
Based on the three scenarios of interest rates in Brazilian Reais, the Company estimated the values of its debt and hedging instruments according to the risk which is being hedged (variations in thepre-fixed interest rates in Brazilian Reais), by projecting them to future value at the contracted rates and bringing them to present value at the interest rates of the estimated scenarios. The results are shown in the table below:
06/30/2019 | Risk | Scenario I Likely | Scenario II | Scenario III | ||||||||||||
Interest rate swap (in Brazilian Reais) – Debentures—CRA | ||||||||||||||||
(1) Fixed rate swap—CDI | Decrease in | (333,126 | ) | (286,335 | ) | (234,317 | ) | |||||||||
(2) Fixed rate debt | Pre-fixed rate | 333,126 | 286,335 | 234,317 | ||||||||||||
|
|
|
|
|
| |||||||||||
(1) + (2) | Net effect | — | — | — | ||||||||||||
|
|
|
|
|
| |||||||||||
12/31/2018 | Risk | Scenario I Likely | Scenario II | Scenario III | ||||||||||||
Interest rate swap (in Brazilian Reais) – Debentures—CRA | ||||||||||||||||
(1) Fixed rate swap—CDI | Decrease in | (311,993 | ) | (254,409 | ) | (188,047 | ) | |||||||||
(2) Fixed rate debt | Pre-fixed rate | 311,993 | 254,409 | 188,047 | ||||||||||||
|
|
|
|
|
| |||||||||||
(1) + (2) | Net effect | — | — | — | ||||||||||||
|
|
|
|
|
| |||||||||||
For the sensitivity analysis of the commodity price swings hedging instruments on June 28, 2019, the Company used the futures heating oil and gasoline (RBOB) contracts quoted on NYMEX. Scenarios II and III were estimated based on 25% and 50% deterioration, respectively, of the likely scenario commodity price.
Based on the balances of the hedging instruments and the objects hedged on June 28, 2019, prices were substituted and the variations between the new balance in Reais and the balance in Reais in the report date were calculated in each of the three scenarios. The table below shows the variation of the amounts of the derivative instruments and their objects of hedge, considering the variations in commodity prices in the different scenarios:
06/30/2019 | Risk | Scenario I Likely | Scenario II | Scenario III | ||||||||||||
NDF Commodities | ||||||||||||||||
(1) NDF of Commodities | Decrease in | (7,509 | ) | 219,093 | 445,696 | |||||||||||
(2) Gross margin from Ipiranga | Commodities Price | 7,509 | (219,093 | ) | (445,696 | ) | ||||||||||
|
|
|
|
|
| |||||||||||
(1) + (2) | Net effect | — | — | — | ||||||||||||
|
|
|
|
|
| |||||||||||
97
Table of Contents
Ultrapar Participações S.A. and Subsidiaries
Notes to the Parent and Consolidated Interim financial information
(In thousands of Brazilian Reais, unless otherwise stated)
| 35. | Commitments (Consolidated) |
| a. | Contracts |
a.1 Subsidiary Tequimar has agreements with CODEBA and Complexo Industrial Portuário Governador Eraldo Gueiros, in connection with its port facilities in Aratu and Suape, respectively. Such agreements establish a minimum cargo movement of products, as shown below:
Port | Minimum movement in tons per year | Maturity | ||||||
Aratu | 397,000 | 2031 | ||||||
Aratu | 900,000 | 2022 | ||||||
Suape | 250,000 | 2027 | ||||||
Suape | 400,000 | 2029 | ||||||
If the annual movement is less than the minimum contractual movement, the subsidiary is liable to pay the difference between the effective movement and the minimum contractual movement, based on the port tariff rates in effect on the date established for payment. As of June 30, 2019, these rates were R$ 8.37 per ton for Aratu and R$ 2.54 per ton for Suape. The subsidiary has met the minimum cargo movement required since the beginning of the contractual agreements.
a.2 Subsidiary Oxiteno Nordeste has a supply agreement with Braskem S.A. which establishes a minimum annually consumption level of ethylene, and conditions for the supply of ethylene until 2021. The minimum purchase commitment clause provided for a minimum annual consumption of 205 thousand tons in 2019. Should the minimum purchase commitment not be met, the subsidiary would be liable for a fine based on the current ethylene price for the quantity not purchased. According to contractual conditions and tolerances, there are no material issues regarding the minimum purchase commitment.
a.3 Subsidiary Oxiteno S.A. has a supply agreement with Braskem S.A., valid until 2023, which establishes and regulates the conditions for supply of ethylene to Oxiteno based on the international market for this product. The minimum purchase is 44,100 tons of ethylene annually. Should the minimum purchase commitment not be met, the subsidiary would be liable for a fine based on the current ethylene price for the quantity not purchased. According to contractual conditions and tolerances, there are no material issues regarding the minimum purchase commitment.
| b. | Insurance Coverage |
The Company maintains insurance policies with the objective of covering several risks to which it is exposed, including loss of profits, losses and damage from fire, lightning, explosion of any kind, gale, aircraft crash, electric damage, and other risks, covering the industrial plants and distribution bases and branches of all subsidiaries. The maximum compensation values based on the risk analysis of certain locations are shown below:
| Maximum compensation value (*) | ||||||||
Oxiteno | US$ 1,142 | (equivalent to R$ 4,376 as of 06/30/2019) (*) | ||||||
Ipiranga | R$ 1,025 | |||||||
Ultracargo | R$ 949 | |||||||
Ultragaz | R$ 266 | |||||||
Extrafarma | R$ 160 | |||||||
| (*) | In millions. In accordance with policy conditions. |
98
Table of Contents
Ultrapar Participações S.A. and Subsidiaries
Notes to the Parent and Consolidated Interim financial information
(In thousands of Brazilian Reais, unless otherwise stated)
The General Liability Insurance program covers the Company and its subsidiaries with a maximum aggregate coverage of US$ 400 million (equivalent to R$ 1,533 million as of June 30, 2019), against losses caused to third parties as a result of accidents related to commercial and industrial operations and/or distribution and sale of products and services.
The Company maintains liability insurance policies for directors and executive officers to indemnify the members of the Board of Directors, fiscal council, directors and executive officers of Ultrapar and its subsidiaries (“Insured”) in the total amount of US$ 80 million (equivalent to R$ 307 million as of June 30, 2019), which cover any of the Insured liabilities resulting from wrongful acts, including any act or omission committed or attempted, except if the act, omission or the claim is consequence of gross negligence or willful misconduct.
In addition, group life and personal accident, health and national and international transportation and other insurance policies are also maintained.
The coverage and limit of the insurance policies are based on a careful study of risks and losses conducted by independent insurance advisors. The type of insurance is considered by management to be sufficient to cover potential losses based on the nature of the business conducted by the companies.
| c. | Port concessions |
On March 22, 2019, Ultrapar, through its subsidiary IPP, won the port concessions of three areas with minimum storage capacity of 64 thousand m³ located at the port of Cabedelo, in the state of Paraíba, and one area with minimum storage capacity of 66 thousand m³ at the port of Vitória, in the state of Espírito Santo, which will be designated for handling, storage and distribution of fuels. These concessions were carried out by two consortiums of which IPP holds one third of the total participation. The total investments regarding IPP’s stake sums up to R$160 million for a concession term of 25 years. These concessions had no effect on the financial positions, results of operations and cash flows of these quarterly information.
On April 5, 2019, Company, through its subsidiary IPP and Tequimar, also won three concessions. IPP won two concessions in the port of Miramar, in Belém, state of Pará: (i) area BEL02A, through a consortium 50% owned by IPP, that shall have minimum storage capacity of 41 thousand m³, and (ii) area BEL04A, which is currently operated by IPP with minimum storage capacity of 23 thousand m³. Such areas will be operated for at least 15 years, according to the auction notice. Tequimar won the concession of area VDC12 in the port of Vila do Conde, in Barcarena, state of Pará. The minimum storage capacity will be 59 thousand m³. The area will be operated by Tequimar for at least 25 years, according to the auction notice. The estimated investments regarding the participation of IPP and Tequimar sums up to R$ 450 million, approximately, to be disbursed throughout the next five years including the auction grants and the minimum investment required for these areas.
99
Table of Contents
MD&A – ANALYSIS OF CONSOLIDATED EARNINGS
Second quarter of 2019
| (R$ million) | 2Q19 Post- Adjustments¹ | 2Q19 | 2Q18 | 1Q19 | D 2Q19 x | D 2Q19 x 1Q19 | 1H19 | 1H18 | D 1H19 x | |||||||||||||||||||||||||||
Net revenue from sales and services | 21,692.6 | 21,692.6 | 22,645.6 | 20,739.3 | (4%) | 5% | 42,431.9 | 43,396.7 | (2%) | |||||||||||||||||||||||||||
Cost of products and services sold | (20,286.9) | (20,290.1) | (21,186.5) | (19,295.2) | (4%) | 5% | (39,585.3) | (40,416.4) | (2%) | |||||||||||||||||||||||||||
Gross profit | 1,405.8 | 1,402.5 | 1,459.0 | 1,444.0 | (4%) | (3%) | 2,846.6 | 2,980.3 | (4%) | |||||||||||||||||||||||||||
Selling, marketing, general and administrative expenses | (1,112.2) | (1,123.5) | (1,060.0) | (1,069.4) | 6% | 5% | (2,192.8) | (2,104.0) | 4% | |||||||||||||||||||||||||||
Other operating income, net | 10.1 | 10.1 | 34.9 | 36.7 | (71%) | (72%) | 46.8 | (227.9) | (121%) | |||||||||||||||||||||||||||
Income from disposal of assets | 1.0 | 0.9 | (2.4) | (2.1) | (137%) | (142%) | (1.2) | (4.6) | (74%) | |||||||||||||||||||||||||||
Operating income | 304.7 | 290.1 | 431.5 | 409.3 | (33%) | (29%) | 699.4 | 643.9 | 9% | |||||||||||||||||||||||||||
Financial expenses, net | (92.2) | (68.2) | (64.4) | 21.3 | 60% | (420%) | (46.8) | (171.4) | (73%) | |||||||||||||||||||||||||||
Share of profit (loss) of joint ventures and associates | (3.1) | (3.1) | (3.4) | (7.0) | (9%) | (56%) | (10.0) | (6.4) | 58% | |||||||||||||||||||||||||||
Income before income and social contribution taxes | 209.4 | 218.8 | 363.7 | 423.7 | (40%) | (48%) | 642.5 | 466.1 | 38% | |||||||||||||||||||||||||||
Current income and social contribution taxes | (94.6) | (97.8) | (152.5) | (186.1) | (36%) | (47%) | (283.9) | (198.5) | 43% | |||||||||||||||||||||||||||
Deferred income and social contribution taxes | 5.9 | 5.9 | 29.5 | 13.5 | (80%) | (56%) | 19.5 | 45.9 | (58%) | |||||||||||||||||||||||||||
Net income | 120.7 | 126.9 | 240.7 | 251.1 | (47%) | (49%) | 378.0 | 313.5 | 21% | |||||||||||||||||||||||||||
Net income attributable to shareholders of the company | 108.6 | 114.4 | 241.6 | 242.2 | (53%) | (53%) | 356.6 | 315.4 | 13% | |||||||||||||||||||||||||||
Net income attributable tonon-controlling interests in subsidiaries | 12.1 | 12.6 | (0.9) | 8.9 | (1,466%) | 41% | 21.4 | (1.9) | (1,215%) | |||||||||||||||||||||||||||
Adjusted EBITDA | 677.2 | 589.2 | 718.1 | 697.9 | (18%) | (16%) | 1,287.1 | 1,226.2 | 5% | |||||||||||||||||||||||||||
Sold GLP (000 tons) | 420.8 | 420.8 | 443.8 | 395.1 | (5%) | 7% | 815.9 | 853.9 | (4%) | |||||||||||||||||||||||||||
Fuel sold (000 m³) | 5,610.0 | 5,610.0 | 5,858.5 | 5,587.1 | (4%) | 0% | 11,197.1 | 11,319.6 | (1%) | |||||||||||||||||||||||||||
Chemical sold (000 tons) | 183.5 | 183.5 | 193.4 | 180.1 | (5%) | 2% | 363.5 | 373.4 | (3%) | |||||||||||||||||||||||||||
| ¹ | With the adoption of IFRS 16 regulation and reclassification of corporate expenses |
Table of Contents
Considerations on the financial and operational information
The financial information presented in this document has been prepared according to the International Financial Reporting Standards (IFRS). The financial information of Ultrapar corresponds to the Company’s consolidated information. The information on Ipiranga, Oxiteno, Ultragaz, Ultracargo, Extrafarma and Corporate is reported without the elimination of inter-segment transactions. Hence, the sum of such information may not correspond to Ultrapar’s consolidated information. Additionally, the financial and operational information presented in this document is subject to rounding and, consequently, the total amounts presented in the tables and charts may differ from the direct sum of the amounts that precede them.
As from 2019, two changes have been introduced in the presentation of Ultrapar’s financial information: (i) the adoption of IFRS 16 published by IASB – International Accounting Standards Board prospectively; and (ii) the segregation of certain corporate expenses, previously distributed among Ultrapar’s businesses, to a new line denominated “Corporate”.In order to provide comparability between 2Q19 and 1H19 with the information of 2Q18 and 1H18, the discussion of results is shown without adjustments related to IFRS 16 and the Corporate segment and references to “2Q19” adopt the same criterion. Any mention of information incorporating these changes will be identified as “Post adjustments”.
Information denominated EBITDA – Earnings Before Interest, Taxes, Depreciation and Amortization; Adjusted EBITDA – adjusted for amortization of contractual assets with clients – exclusive rights; and EBIT – Earnings Before Interest and Taxes is presented in accordance with Instruction 527, issued by the Brazilian Securities and Exchange Commission – CVM on October 04, 2012. The calculation of EBITDA based on net income is shown below:
| Quarter | Semester | |||||||||||||||||||||||
R$ million | 2Q19 Post Adjustments | 2Q19 | 2Q18 | 1Q19 | 1H19 | 1H18 | ||||||||||||||||||
Net income | 120.7 | 126.9 | 240.7 | 251.1 | 378.0 | 313.5 | ||||||||||||||||||
(+) Income and social contribution taxes | 88.7 | 91.9 | 123.0 | 172.6 | 264.5 | 152.6 | ||||||||||||||||||
(+) Financial (income) expenses, net | 92.2 | 68.2 | 64.4 | (21.3 | ) | 46.8 | 171.4 | |||||||||||||||||
(+) Depreciation and amortization | 281.3 | 208.0 | 197.8 | 211.9 | 419.9 | 392.0 | ||||||||||||||||||
EBITDA | 583.0 | 495.0 | 625.9 | 614.3 | 1,109.2 | 1,029.5 | ||||||||||||||||||
Adjustments | ||||||||||||||||||||||||
(+) Amortization of contractual assets withcustomers—exclusive rights (Ipiranga) | 94.2 | 94.2 | 92.2 | 83.6 | 177.8 | 196.7 | ||||||||||||||||||
Adjusted EBITDA | 677.2 | 589.2 | 718.1 | 697.9 | 1,287.1 | 1,226.2 | ||||||||||||||||||
Table of Contents
Ultrapar
| Amounts in R$ million | 2Q19 | 2Q18 | 1Q19 | D(%) 2Q19 v 2Q18 | D(%) 2Q19 v 1Q19 | 1H19 | 1H18 | D(%) 1H19 v 1H18 | ||||||||||||||||||||
Net revenues | 21,693 | 22,646 | 20,739 | (4%) | 5% | 42,432 | 43,397 | (2%) | ||||||||||||||||||||
Net income1 | 127 | 241 | 251 | (47%) | (49%) | 378 | 314 | 21% | ||||||||||||||||||||
Net income Post Adjustments | 121 | n/a | 243 | n/a | (50%) | 363 | n/a | n/a | ||||||||||||||||||||
Earnings per share attributable to shareholders2Post Adjustments | 0.10 | 0.22 | 0.22 | (55%) | (55%) | 0.32 | 0.29 | 8% | ||||||||||||||||||||
Adjusted EBITDA | 589 | 718 | 698 | (18%) | (16%) | 1,287 | 1,226 | 5% | ||||||||||||||||||||
Adjusted EBITDAex-non-recurring3 | 642 | 718 | 698 | (11%) | (8%) | 1,340 | 1,512 | (11%) | ||||||||||||||||||||
Adjusted EBITDA Post Adjustments | 677 | n/a | 782 | n/a | (13%) | 1,459 | n/a | n/a | ||||||||||||||||||||
Investments | 336 | 437 | 268 | (23%) | 25% | 604 | 1,041 | (42%) | ||||||||||||||||||||
Operating cash flow | 1,065 | 743 | 462 | 43% | 130% | 1,527 | 630 | 143% | ||||||||||||||||||||
| ¹ | According to the IFRS accounting standard, consolidated net income includes net income attributable tonon-controlling interests in subsidiaries |
| ² | Calculated in Reais based on the weighted average number of shares over the period net of shares held as treasury stock. These amounts consider the stock split in April 2019 |
| ³ | The Adjusted EBITDAex-non-recurring excludes the effects of the R$ 53 million for the TAC in 2Q19 and thebreak-up fee of R$ 286 million in 1H18 |
Net revenues – Total of R$ 21,693 million(-4%) due to the reduction in net revenues at Ipiranga and Oxiteno. In relation to 1Q19, net revenues increased by 5% as a consequence of the increase in net revenues at Ipiranga, Oxiteno, Ultragaz and Extrafarma.
Adjusted EBITDA – Total of R$ 589 million(-18%), impacted by Ultracargo’s TAC. Excluding the TAC, the Adjusted EBITDA was R$ 642 million, a reduction of 11% compared with 2Q18 due to lower EBITDA at Oxiteno, Ultragaz and Ultracargo. Compared with 1Q19, Adjusted EBITDAex-TAC fell by 8% due to the EBITDA reduction at Ipiranga and Ultracargo. Considering the IFRS 16 adjustments, the Adjusted EBITDA Post Adjustments for Ultrapar in 2Q19 and 1H19, was R$ 677 million and R$ 1,459 million, respectively.
Depreciation and amortization4 – Total of R$ 302 million (+4%) due to the depreciation of investments conducted over the past 12 months. Compared with 1Q19, total costs and expenses with depreciation and amortization were 2% higher, mainly the result of greater amortization of contractual assets with Ipiranga’s clients in the period.
Financial results – Ultrapar ended 2Q19 with net debt of R$ 8.1 billion (2.60x LTM Adjusted EBITDA) compared with R$ 8.6 million on March 31, 2019 (2.65x LTM Adjusted EBITDA), mainly due to greater operating cash generation post investments in the period. Ultrapar reported net financial expenses of R$ 68 million in 2Q19, an increase of R$ 4 million in relation to 2Q18. This increase reflects theone-off payment of the premium on the buyback of the 2026 notes, partially offset by the gains from marking to market of hedging instruments in the period. In 1Q19, Ultrapar reported net financial revenue of R$ 21 million, mainly due to higher gains from marking to market of hedging instruments in the period.
Net income – Total of R$ 127 million(-47%), largely due to the reduction in EBITDA. In relation to 1Q19, net income fell 49% due to the reduction in EBITDA and the increase in financial expenses in the period. Considering the adjustments of IFRS 16, Ultrapar’s Post Adjustment net income in 2Q19 and 1H19 was R$ 121 million and R$ 363 million, respectively.
Cash flow from operating activities – Generation of R$ 1,527 million in 1H19 compared with a cash generation of R$ 630 million in 1H18, benefiting from initiatives for optimizing working capital in 1H19.
| 4 | Includes amortization of contractual assets with clients – exclusive rights |
Table of Contents
Ipiranga
| 2Q19 | 2Q18 | 1Q19 | D(%) 2Q19 v 2Q18 | D(%) 2Q19 v 1Q19 | 1H19 | 1H18 | D(%) 1H19 v 1H18 | |||||||||||||||||||||
Total volume (000 m³) | 5,610 | 5,859 | 5,587 | (4%) | 0% | 11,197 | 11,320 | (1%) | ||||||||||||||||||||
Diesel | 2,787 | 3,067 | 2,674 | (9%) | 4% | 5,461 | 5,692 | (4%) | ||||||||||||||||||||
Otto cycle | 2,721 | 2,675 | 2,810 | 2% | (3%) | 5,532 | 5,398 | 2% | ||||||||||||||||||||
Others¹ | 102 | 117 | 102 | (13%) | 0% | 204 | 229 | (11%) | ||||||||||||||||||||
Adjusted EBITDA (R$ million) | 447 | 402 | 538 | 11% | (17%) | 986 | 987 | 0% | ||||||||||||||||||||
Adjusted EBITDA Post Adjustments (R$ million) | 508 | n/a | 594 | n/a | (14%) | 1,102 | n/a | n/a | ||||||||||||||||||||
| ¹ | Fuel oils, arla 32, kerosene, lubricants and greases |
Operational performance –Ipiranga’s sales volume in 2Q19 fell 4% compared with 2Q18 due to a more challenging competitive environment. Otto cycle volume rose 2% in relation to 2Q18, with a greater share of ethanol in the sales mix. Diesel volumes fell 9%, this decrease concentrated in sales to the TRR segment. In relation to 1Q19, volumes held steady, with a 4% increase in diesel and a decline of 3% in Otto cycle fuels, a reflection mainly of the seasonal differences between the periods and less sales to the TRR segment.
Net revenues –Total of R$ 18,223 million(-4.4%) due to lower sales volume. Compared with 1Q19, net revenues increased by 5%, driven by an increased average unit cost of fuels, particularly diesel and gasoline.
Cost of goods sold – Total of R$ 17,432 million(-4.8%), because of lower sales volume. In relation to 1Q19, cost of goods sold rose 5% on the back of higher fuel costs in the period.
Sales, general and administrative expenses (SG&A) – Total of R$ 551 million (+2%), due to the increase (i) in payroll expenses, (ii) service station maintenance expenses and (iii) provisioning for losses on doubtful accounts, albeit partially mitigated by lower expenses at ICONIC and with marketing programs. In relation to 1Q19, sales, general and administrative expenses increased 9% due to higher provisioning for losses on doubtful accounts, higher payroll expenses (principally involving post-employment benefits) and an increase in the unit price of freight, partially offset by lower expenditures with marketing programs.
Adjusted EBITDA – Total of R$ 447 million (+11%), mainly influenced by the impact in 2Q18 by the trucker’s strike, despite the reduction in sales volume. In relation to 1Q19, the Adjusted EBITDA was 17% lower due to variations in the cost of fuels, and the higher provisioning for losses on doubtful accounts in 2Q19. In view of IFRS 16 adjustments and the segregation of corporate expenses, Ipiranga’s Adjusted EBITDA Post Adjustments in 2Q19 and 1H19 was R$ 508 million and R$ 1,102 million, respectively.
Investments – Ipiranga invested a total of R$ 150 million, allocated mainly to maintenance and expansion of the service station and franchise network as well as expansion of the company’s logistics infrastructure. Out of total investments, R$ 75 million was expended on property, plant and equipment and on intangible assets, R$ 62 million on contractual assets with clients (exclusive rights) and R$ 13 million in the form of drawdown of financing to clients and advance payments of rentals, net of repayments. Ipiranga ended 2Q19 with 7,186 service stations (+1%), a net addition of 44 service stations over the last 12 months and a reduction of 32 service stations in relation to 1Q19.
Table of Contents
Oxiteno
| 2Q19 | 2Q18 | 1Q19 | D(%) 2Q19 v 2Q18 | D(%) 2Q19 v 1Q19 | 1H19 | 1H18 | D(%) 1H19 v 1H18 | |||||||||||||||||||||||||
Average exchange rate (R$/US$) | 3.92 | 3.61 | 3.77 | 9% | 4% | 3.84 | 3.42 | 12% | ||||||||||||||||||||||||
Total volume (000 tons) | 183 | 193 | 180 | (5%) | 2% | 364 | 373 | (3%) | ||||||||||||||||||||||||
Specialty Chemicals | 146 | 152 | 148 | (4%) | (2%) | 294 | 304 | (3%) | ||||||||||||||||||||||||
Commodities | 38 | 41 | 32 | (9%) | 19% | 70 | 70 | 0% | ||||||||||||||||||||||||
Sales in Brazil | 132 | 139 | 124 | (5%) | 7% | 256 | 265 | (3%) | ||||||||||||||||||||||||
International sales | 51 | 54 | 56 | (6%) | (9%) | 107 | 108 | (1%) | ||||||||||||||||||||||||
EBITDA (R$ million) | 39 | 121 | 34 | (68%) | 13% | 73 | 172 | (58%) | ||||||||||||||||||||||||
EBITDA Post Adjustments (R$ million) | 44 | n/a | 39 | n/a | 14% | 82 | n/a | n/a | ||||||||||||||||||||||||
Operational performance – Commodity sales volume dropped 9% year-over-year due to the comparative base in 2Q18, a quarter with a strong sales volume for the product. Specialty chemicals volume showed a 4% decrease, influenced by the weak performance of the domestic market, with lower sales across various segments, despite the effect of the truckers’ strike in the comparative period of 2Q18. In addition, exports fell to Mercosur and Asia. When compared with 1Q19, total sales volume increased by 2%, with 19% higher commodity volumes, mainly a reflection of the scheduled shutdown of Camaçari plant in 1Q19, partially offset by a decline of 2% in specialty chemical exports.
Net revenues – Total of R$ 1,066 million(-10%), due to a decline in sales volume and a reduction of 12% in average US Dollar prices for products sold, particularly a reflection of the fall in commodity prices on the international market, especially glycols. These factors were partially offset by a 9% devaluation in the Real against the US Dollar (R$ 0.31/US$). In relation to 1Q19, net revenues increased by 1%, due to greater sales volume and a 4% devaluation in the Real against the US Dollar, although partially compensated by the continued weaker commodity prices in line with the international market, and the greater share of commodities in the sales mix.
Cost of goods sold – Total of R$ 902 million(-2%) due to lower sales volume and the reduction in the US Dollar denominated costs of Oxiteno’s main raw materials, notably ethylene and palm kernel oil (“PKO”), partially offset by (i) the devaluation of the Real against the US Dollar, (ii) higher maintenance costs and (iii) increased provisions for inventory losses. Compared with 1Q19, cost of goods sold remained stable, reflecting stronger sales volume, increased provisions for inventory losses and a 4% devaluation in the Real in relation to the US Dollar neutralized by a fall in raw material costs, mainly palm kernel oil.
Sales, general and administrative expenses (SG&A) – Total of R$ 177 million (0%), with higher expenses in payroll (principally severance indemnities) and at the international units due to the weaker Real compared to the US Dollar, offset by lower international freight charges in line with the decline in volumes over the period, and initiatives taken to reduce expenses. In relation to 1Q19, sales, general and administrative expenses increased by 1%, mainly due to higher expenses in payroll and at the international units due to the weaker Real compared to the US Dollar, partially offset by lower IT service expenses.
EBITDA –Total of R$ 39 million(-68%) due to lower unit margins in US Dollars in the period as a result of the decline in petrochemical commodity prices on the international markets, especially glycols, and lower sales volume, partially offset by the weaker Realin relation to the US Dollar. The 13% increase in EBITDA over 1Q19 reflects stronger sales volume in the period, a devaluation in the Real and the improvement in contribution margins of specialty chemicals, although attenuated by narrower margins in commodity chemicals. Considering IFRS 16 adjustments and the segregation of the corporate expenses, Oxiteno’s EBITDA Post Adjustments in 2Q19 and in 1H19 was R$ 44 million and R$ 82 million, respectively.
Investments – Investments in the period were R$ 59 million, allocated mainly to maintenance of Oxiteno’s industrial units.
Table of Contents
Ultragaz
| 2Q19 | 2Q18 | 1Q19 | D(%) 2Q19 v 2Q18 | D(%) 2Q19 v 1Q19 | 1H19 | 1H18 | D(%) 1H19 v 1H18 | |||||||||||||||||||||
Total volume (000 tons) | 421 | 444 | 395 | (5% | ) | 7% | 816 | 854 | (4%) | |||||||||||||||||||
Bottled | 289 | 311 | 270 | (7% | ) | 7% | 559 | 592 | (6%) | |||||||||||||||||||
Bulk | 132 | 133 | 126 | (1% | ) | 5% | 257 | 262 | (2%) | |||||||||||||||||||
EBITDA¹ (R$ million) | 111 | 148 | 97 | (25% | ) | 14% | 208 | (22) | n/a | |||||||||||||||||||
EBITDA Post Adjustments (R$ million) | 121 | n/a | 108 | n/a | 11% | 229 | n/a | n/a | ||||||||||||||||||||
| ¹ | 1H18 figures include thebreak-up fee of R$ 286 million following the rejection of the Liquigás acquisition. Excluding this effect, EBITDA was R$ 264 million |
Operational performance –Volume declined 7% in the bottled segment compared with the same period in 2018 due to a 4% drop in domestic market demand, particularly in the states comprising Ultragaz main markets (the Southeast region) and the remaining impacts of the temporary interruption of LPG supply at some refineries. The bulk segment presented a 1% decrease in volume, aligned with the volume decline for the domestic market. Compared with 1Q19, sales volume increased by 7%, reflecting the seasonality between periods.
Net revenues – Total of R$ 1,773 million (0%) due to readjustments in LPG costs, offset by a reduction in sales volume. In relation to 1Q19, net revenues increased 8% on the back of 7% higher sales volume combined with a slight increase in the product costs.
Cost of goods sold – Total of R$ 1,550 million (0%) due to the readjustments in LPG costs, neutralized by a reduction in the sales volume and by lower costs with the amortization of contracts. Compared with 1Q19, the cost of goods sold rose 8%, reflecting seasonally higher sales volume as well a slight increase in the unit cost of the product.
Sales, general and administrative expenses (SG&A)– Total of R$ 158 million (+17%), mainly due to a rise in provisions for losses on doubtful accounts, compared to a reversal of provisions in 2Q18, and to higher freight expenses, partially attenuated by a reduction in marketing expenses. In relation to 1Q19, sales, general and administrative expenses fell by 4% due to lower provisions for losses on doubtful accounts, lower payroll expenses and tonon-recurring expenses with legal proceedings in 1Q19.
EBITDA – Total of R$ 111 million(-25%), due to the reduction in sales volume and increased expenses in the period as already described. When compared with 1Q19, Ultragaz’s EBITDA grew 14%, mainly a reflection of higher sales volume and the reduction of expenses. Considering IFRS 16 adjustments, and the segregation of the corporate expenses, Ultragaz’s EBITDA Post Adjustments in 2Q19 and in 1H19 was R$ 121 million and R$ 229 million, respectively.
Investments – Ultragaz invested R$ 53 million, focused on clients in the bulk segment, the replacement and acquisition of gas bottles and maintenance of logistics infrastructure and the company’s filling plants.
Table of Contents
Ultracargo
| 2Q19 | 2Q18 | 1Q19 | D (%) 2Q19 v 2Q18 | D (%) 2Q19 v 1Q19 | 1H19 | 1H18 | D (%) 1H19 v 1H18 | |||||||||||||||||||
Effective storage1 (000 m3) | 745 | 786 | 758 | (5%) | (2%) | 752 | 754 | 0% | ||||||||||||||||||
EBITDA (R$ million) | (3) | 54 | 52 | n/a | n/a | 50 | 95 | (48%) | ||||||||||||||||||
EBITDAex-non-recurring2 (R$ million) | 50 | 54 | 52 | (8%) | (4%) | 102 | 95 | 7% | ||||||||||||||||||
EBITDA Post Adjustments (R$ million) | 6 | n/a | 59 | n/a | (89%) | 65 | n/a | n/a | ||||||||||||||||||
| 1 | Monthly average |
| 2 | EBITDAex-non-recurring does not include the effect of the R$ 53 million relative to the Conduct Adjustment Agreement in 2Q19 and 1H19 |
Operational performance – Ultracargo’s average storage decreased 5% in relation to 2Q18, mainly due to a reduction in the number of spot operations for ethanol and fuel handling, attenuated by an increase of chemical products and corrosives handling. In relation to 1Q19, average storage at the port terminals declined by 2% with a reduction in the handling of fuels and ethanol, partially offset by the greater handling of corrosives and vegetable oils.
Net revenues –Total of R$ 126 million in 2Q19 (0%) due to the product mix handled and contractual readjustments, neutralized by lower handling activity in the period. In relation to 1Q19, net revenues were flat and influenced by the same factors for theyear-on-year comparison.
Cost of services provided – Total of R$ 63 million (+3%) due to higher costs with the depreciation and services linked to the completion of the capacity expansion in Santos, partially neutralized bynon-recurring retroactive payment of a municipal property tax (IPTU) in 2Q18. In relation to 1Q19, the cost of services provided increased by 7%, principally driven by higher expenditures with payroll and services associated with capacity expansion at the port of Santos.
Sales, general and administrative expenses (SG&A) – Total of R$ 31 million (+32%) due to thenon-recurring effect in 2Q18 of credits worth R$ 8 million on an improperly collected port management fee, attenuated by lower legal advisory expenses in 2Q19. In relation to 1Q19, sales, general and administrative expenses increased by 6%, mainly the result of increased project expenses.
Other operating results – Total of R$ 50 million negative in 2Q19, due to the provision for the payment of the Conduct Adjustment Agreement (“TAC”) entered into by Ultracargo and the Federal Public Prosecutor’s Office and the Public Prosecutor’s Office for the State of São Paulo on May 15, 2019 for the implementation of initiatives to compensate for impacts caused to the Santos estuary by the fire at the Ultracargo terminal in April 2015. The amount of the agreement was R$ 68 million, to be disbursed in full until September 2020. Ultracargo had previously recorded R$ 15 million to this end and in 2Q19, completed the remaining amount of R$ 53 million, thus affecting this quarter’s results.
EBITDA – Total of R$ 3 million negative, impacted by the R$ 53 million provision for the TAC. Excluding the effect of the TAC in 2Q19, Ultracargo’s EBITDA was R$ 50 million, a decline of 8% due to lower average storage and thenon-recurring retroactive payment in 2Q18, partially offset by contractual readjustments. Compared to 1Q19 and excluding the effect of the TAC, EBITDA declined by 4% due to the increase in the cost of services provided and reduced handling activity in the period. Considering IFRS 16 adjustments and the separation of corporate expenses, Ultracargo’s EBITDA Post Adjustments in 2Q19 and in 1H19 was R$ 6 million and R$ 65 million, respectively.
Investments – Ultracargo invested R$ 39 million in the period, allocated to expansion at Itaqui and Santos terminals, operational safety measures and maintenance.
Table of Contents
Extrafarma
| 2Q19 | 2Q18 | 1Q19 | D (%) 2Q19 v 2Q18 | D (%) 2Q19 v 1Q19 | 1H19 | 1H18 | D(%) 1H19 v 1H18 | |||||||||||||||||||
Drugstores (end of the period) | 433 | 406 | 440 | 7% | (2%) | 433 | 406 | 7% | ||||||||||||||||||
% of mature stores (+3 years) | 47% | 46% | 46% | 1.3 p.p. | 1.4 p.p. | 47% | 46% | 1.3 p.p. | ||||||||||||||||||
Gross revenues (R$ million) | 559 | 559 | 546 | 0% | 3% | 1,105 | 1,101 | 0% | ||||||||||||||||||
EBITDA (R$ million) | (5) | (7) | (21) | 30% | 78% | (26) | (7) | (274%) | ||||||||||||||||||
EBITDA Post Adjustments (R$ million) | 18 | n/a | 1 | n/a | n/a | 18 | n/a | n/a | ||||||||||||||||||
Operational performance – Extrafarma ended 2Q19 with 433 stores, 63 openings and 36 closures in the past 12 months, equivalent to an increase of 7% in its network. At 2Q19, stores still at the maturing stage (up to three years of operations) represented 53% of the network, a reflection of Extrafarma’s rate of expansion in recent years. In relation to 1Q19, Extrafarma opened 6 stores and closed 13, as a result of greater selectivity in investments and a more rigorous approach in relation to underperforming store operations.
Gross revenues – Total of R$ 559 million (0%) due to the intensified competitive environment and closing of underperforming stores in the period. These factors were offset by the larger number of stores and the annual readjustment in medicines prices. In relation to 1Q19, gross revenue increased 3% following the annual readjustment in the price of medicines and the recovery in sales due to promotional initiatives and instore healthcare activities.
Cost of goods sold and gross profit – The cost of goods sold totaled R$ 379 million (+3%), mainly due to the annual readjustment in medicines prices. Gross profit reached R$ 151 million(-5%), in large part a reflection of a continued challenging competitive environment and the network densification in new markets. In relation to 1Q19, the cost of goods sold rose 1% while gross profit increased 7%, mainly due to the annual price adjustment in medicines in April 2019 and the recovery in sales in the period with promotional initiatives and instore healthcare activities.
Sales, general and administrative expenses (SG&A) – Total of R$ 196 million (+7%) due to the larger number of stores. Excluding the effect of new stores, sales, general and administrative expenses decreased 1% in the light of reduced payroll, logistics and marketing expenses. In relation to 1Q19, sales, general and administrative expenses rose 4%, reflecting higher expenditures with the closing of poorly performing stores together with severance indemnifications.
Other operating income – Total of R$ 16 million in 2Q19, as a result of tax credits relating to previous fiscal years with respect to a judicial ruling on the exclusion of the ICMS sales tax from the calculation base for PIS/COFINS taxes and credits arising from social security contributions.
EBITDA –Total of R$ 5 million negative compared with the R$ 7 million negative in 2Q18, mainly due to a further intensification in the competitive environment. In relation to 1Q19, the improved result was mainly due to the recovery in sales and in gross margin in the period benefited by the constitution of tax credits. Considering IFRS 16 adjustments and the separation of corporate expenses, Extrafarma’s EBITDA Post Adjustments, in both 2Q19 and in 1H19, was R$ 18 million.
Investments – In 2Q19, Extrafarma invested R$ 24 million, allocated to the new distribution center in São Paulo, which will start its operations in August and provide improved logistics and service levels for the state-wide operations, stores opening and modernization and information technology with a focus on improving operations as well as the shopping experience for consumers.
Table of Contents
Debt (R$ million)
| Ultrapar consolidated | 2Q19 | 1Q19 | 2Q18 | |||||||||
Gross debt | (14,570.6 | ) | (15,112.0 | ) | (15,044.7 | ) | ||||||
Cash and cash equivalents | 6,421.5 | 6,492.0 | 6,119.3 | |||||||||
Net debt | (8,149.1 | ) | (8,620.0 | ) | (8,925.5 | ) | ||||||
Net debt/LTM Adjusted EBITDA | 2.60x | 2.65x | 2.55x | |||||||||
Average cost of debt (% CDI) | 97.6% | 97.5% | 95.7% | |||||||||
Average cash yield (% CDI) | 91.3% | 97.4% | 93.8% | |||||||||
Duration (years) | 5.0 | 4.3 | 4.3 | |||||||||
Debt amortization profile:
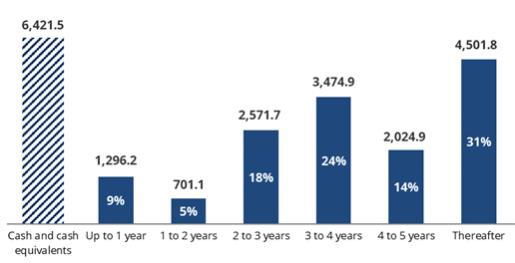
Debt breakdown:
Local currency | 7,915.6 | |||
Foreign currency | 6,625.3 | |||
Result from currency and interest hedging instruments | 29.7 | |||
Total | 14,570.6 |
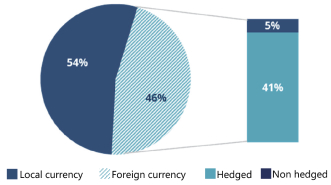
Table of Contents

São Paulo, August 14, 2019 –Ultrapar Participações S.A. (“Company”, B3: UGPA3/NYSE: UGP), a Company engaged in specialized distribution and retail (Ipiranga/Ultragaz/Extrafarma), specialty chemicals (Oxiteno) and storage for liquid bulk (Ultracargo), hereby reports its results for the second quarter of 2019.
Net Revenues
| Adjusted EBITDA | Net income | ||
R$22 billion
| R$677 million | R$121 million | ||
-4% YoY 5% QoQ
| -18% YoY1 -16% QoQ1 | -47% YoY1 -49% QoQ1 | ||
Investments
| Operating cash flow 1H19 | Market cap. | ||
R$336 million | R$1.5 billion | R$22 billion |
| 1 | The variations above do not consider the IFRS 16 and Corporate adjustments (see section “Considerations on the financial and operational information”) |
Highlights
| • | Cash generated from operating activities of R$ 1.5 billion in the first half of 2019, R$ 0.9 billion higher than the same period of 2018 |
| • | Approval for the payout of R$ 217 million in dividends for the 1H19 period, equivalent to R$ 0.20 per share |
| • | Offering of US$ 500 million in notes in the international market due in 2029 with a coupon of 5.25% per annum |
We reported a strong operating cash generation due to the greater selectivity of investments and the optimization of working capital, in order to counteract the more pressured operating results in the short term. In parallel, the restructuring and management changes promoted over the past 12 months are evolving towards projects and initiatives that strengthen our long-term competitiveness and open up new opportunities in all of our businesses, preparing Ultrapar for a new phase of growth and continuing to generate value for our shareholders and stakeholders.

Table of Contents

Conference Call 2Q19
Ultrapar will be holding a conference call for analysts and investors on August 15, 2019 to comment on the Company’s performance in the second quarter of 2019 and its outlook. The presentation will be available for download on the Company’s website 30 minutes prior to the conference call.
A WEBCAST live will be available via internet at ri.ultra.com.br. Please connect 15 minutes in advance.
Portuguese: 11 a.m. (Brasília time) / 10 a.m. (US EST)
Telephone for connection: +55 (11) 2188-0155
Code: Ultrapar
Replay: +55 (11) 2188-0400 (available for seven days)
Code: Ultrapar
English: 12:30 p.m. (Brasília time) / 11:30 a.m. (US EST)
International Participants: +1 (844)802-0962
Code:Ultrapar
Replay: +1 (412)317-0088 (available for seven days)
Code: 10132877
2
Table of Contents
Considerations on the financial and operational information
The financial information presented in this document has been prepared according to the International Financial Reporting Standards (IFRS). The financial information of Ultrapar corresponds to the Company’s consolidated information. The information on Ipiranga, Oxiteno, Ultragaz, Ultracargo, Extrafarma and Corporate is reported without the elimination of inter-segment transactions. Hence, the sum of such information may not correspond to Ultrapar’s consolidated information. Additionally, the financial and operational information presented in this document is subject to rounding and, consequently, the total amounts presented in the tables and charts may differ from the direct sum of the amounts that precede them.
As from 2019, two changes have been introduced in the presentation of Ultrapar’s financial information: (i) the adoption of IFRS 16 published by IASB – International Accounting Standards Board prospectively; and (ii) the segregation of certain corporate expenses, previously distributed among Ultrapar’s businesses, to a new line denominated “Corporate”.In order to provide comparability between 2Q19 and 1H19 with the information of 2Q18 and 1H18, the discussion of results is shown without adjustments related to IFRS 16 and the Corporate segment and references to “2Q19” adopt the same criterion. Any mention of information incorporating these changes will be identified as “Post adjustments”.
Information denominated EBITDA – Earnings Before Interest, Taxes, Depreciation and Amortization; Adjusted EBITDA – adjusted for amortization of contractual assets with clients – exclusive rights; and EBIT – Earnings Before Interest and Taxes is presented in accordance with Instruction 527, issued by the Brazilian Securities and Exchange Commission – CVM on October 04, 2012. The calculation of EBITDA based on net income is shown below:
R$ million | Quarter | Semester | ||||||||||||||||||||||
| 2Q19 Post Adjustments | 2Q19 | 2Q18 | 1Q19 | 1H19 | 1H18 | |||||||||||||||||||
Net income | 120.7 | 126.9 | 240.7 | 251.1 | 378.0 | 313.5 | ||||||||||||||||||
(+) Income and social contribution taxes | 88.7 | 91.9 | 123.0 | 172.6 | 264.5 | 152.6 | ||||||||||||||||||
(+) Financial (income) expenses, net | 92.2 | 68.2 | 64.4 | (21.3 | ) | 46.8 | 171.4 | |||||||||||||||||
(+) Depreciation and amortization | 281.3 | 208.0 | 197.8 | 211.9 | 419.9 | 392.0 | ||||||||||||||||||
EBITDA | 583.0 | 495.0 | 625.9 | 614.3 | 1,109.2 | 1,029.5 | ||||||||||||||||||
Adjustments | ||||||||||||||||||||||||
(+) Amortization of contractual assets with customers - exclusive rights (Ipiranga) | 94.2 | 94.2 | 92.2 | 83.6 | 177.8 | 196.7 | ||||||||||||||||||
Adjusted EBITDA | 677.2 | 589.2 | 718.1 | 697.9 | 1,287.1 | 1,226.2 | ||||||||||||||||||
3
Table of Contents
Ipiranga
|
| 2Q19 | 2Q18 | 1Q19 | D(%) 2Q19 v 2Q18 | D(%) 2Q19 v 1Q19 | 1H19 | 1H18 | D(%) 1H19 v 1H18 | |||||||||||||||||||||||||||
Total volume (000 m³) | 5,610 | 5,859 | 5,587 | (4%) | 0% | 11,197 | 11,320 | (1%) | ||||||||||||||||||||||||||
Diesel | 2,787 | 3,067 | 2,674 | (9%) | 4% | 5,461 | 5,692 | (4%) | ||||||||||||||||||||||||||
Otto cycle | 2,721 | 2,675 | 2,810 | 2% | (3%) | 5,532 | 5,398 | 2% | ||||||||||||||||||||||||||
Others¹ | 102 | 117 | 102 | (13%) | 0% | 204 | 229 | (11%) | ||||||||||||||||||||||||||
Adjusted EBITDA (R$ million) | 447 | 402 | 538 | 11% | (17%) | 986 | 987 | 0% | ||||||||||||||||||||||||||
Adjusted EBITDA Post Adjustments (R$ million) | 508 | n/a | 594 | n/a | (14%) | 1,102 | n/a | n/a | ||||||||||||||||||||||||||
| ¹ | Fuel oils, arla 32, kerosene, lubricants and greases |
Operational performance –Ipiranga’s sales volume in 2Q19 fell 4% compared with 2Q18 due to a more challenging competitive environment. Otto cycle volume rose 2% in relation to 2Q18, with a greater share of ethanol in the sales mix. Diesel volumes fell 9%, this decrease concentrated in sales to the TRR segment. In relation to 1Q19, volumes held steady, with a 4% increase in diesel and a decline of 3% in Otto cycle fuels, a reflection mainly of the seasonal differences between the periods and less sales to the TRR segment.
Net revenues –Total of R$ 18,223 million(-4.4%) due to lower sales volume. Compared with 1Q19, net revenues increased by 5%, driven by an increased average unit cost of fuels, particularly diesel and gasoline.
Cost of goods sold – Total of R$ 17,432 million(-4.8%), because of lower sales volume. In relation to 1Q19, cost of goods sold rose 5% on the back of higher fuel costs in the period.
Sales, general and administrative expenses (SG&A) – Total of R$ 551 million (+2%), due to the increase in (i) payroll expenses, (ii) service station maintenance expenses and (iii) provisioning for losses on doubtful accounts, albeit partially mitigated by lower expenses at ICONIC and with marketing programs. In relation to 1Q19, sales, general and administrative expenses increased 9% due to higher provisioning for losses on doubtful accounts, higher payroll expenses (principally involving post-employment benefits) and an increase in the unit price of freight, partially offset by lower expenditures with marketing programs.
Adjusted EBITDA – Total of R$ 447 million (+11%), mainly influenced by the impact in 2Q18 by the trucker’s strike, despite the reduction in sales volume. In relation to 1Q19, the Adjusted EBITDA was 17% lower due to variations in the cost of fuels, and the higher provisioning for losses on doubtful accounts in 2Q19. In view of IFRS 16 adjustments and the segregation of corporate expenses, Ipiranga’s Adjusted EBITDA Post Adjustments in 2Q19 and 1H19 was R$ 508 million and R$ 1,102 million, respectively.
Investments – Ipiranga invested a total of R$ 150 million, allocated mainly to maintenance and expansion of the service station and franchise network as well as expansion of the company’s logistics infrastructure. Out of total investments, R$ 75 million was expended on property, plant and equipment and on intangible assets, R$ 62 million on contractual assets with clients (exclusive rights) and R$ 13 million in the form of drawdown of financing to clients and advance payments of rentals, net of repayments. Ipiranga ended 2Q19 with 7,186 service stations (+1%), a net addition of 44 service stations over the last 12 months and a reduction of 32 service stations in relation to 1Q19.
4
Table of Contents
Oxiteno
| 2Q19 | 2Q18 | 1Q19 | D(%) 2Q19 v 2Q18 | D(%) 2Q19 v 1Q19 | 1H19 | 1H18 | D(%) 1H19 v 1H18 | |||||||||||||||||||||||||
Average exchange rate (R$/US$) | 3.92 | 3.61 | 3.77 | 9% | 4% | 3.84 | 3.42 | 12% | ||||||||||||||||||||||||
Total volume (000 tons) | 183 | 193 | 180 | (5% | ) | 2% | 364 | 373 | (3% | ) | ||||||||||||||||||||||
Specialty Chemicals | 146 | 152 | 148 | (4% | ) | (2% | ) | 294 | 304 | (3% | ) | |||||||||||||||||||||
Commodities | 38 | 41 | 32 | (9% | ) | 19% | 70 | 70 | 0% | |||||||||||||||||||||||
Sales in Brazil | 132 | 139 | 124 | (5% | ) | 7% | 256 | 265 | (3% | ) | ||||||||||||||||||||||
International sales | 51 | 54 | 56 | (6% | ) | (9% | ) | 107 | 108 | (1% | ) | |||||||||||||||||||||
EBITDA (R$ million) | 39 | 121 | 34 | (68% | ) | 13% | 73 | 172 | (58% | ) | ||||||||||||||||||||||
EBITDA Post Adjustments (R$ million) | 44 | n/a | 39 | n/a | 14% | 82 | n/a | �� | n/a | |||||||||||||||||||||||
Operational performance – Commodity sales volume dropped 9% year-over-year due to the comparative base in 2Q18, a quarter with a strong sales volume for the product. Specialty chemicals volume showed a 4% decrease, influenced by the weak performance of the domestic market, with lower sales across various segments, despite the effect of the truckers’ strike in the comparative period of 2Q18. In addition, exports fell to Mercosur and Asia. When compared with 1Q19, total sales volume increased by 2%, with 19% higher commodity volumes, mainly a reflection of the scheduled shutdown of Camaçari plant in 1Q19, partially offset by a decline of 2% in specialty chemical exports.
Net revenues – Total of R$ 1,066 million(-10%), due to a decline in sales volume and a reduction of 12% in average US Dollar prices for products sold, particularly a reflection of the fall in commodity prices on the international market, especially glycols. These factors were partially offset by a 9% devaluation in the Real against the US Dollar (R$ 0.31/US$). In relation to 1Q19, net revenues increased by 1%, due to greater sales volume and a 4% devaluation in the Real against the US Dollar, although partially compensated by the continued weaker commodity prices in line with the international market, and the greater share of commodities in the sales mix.
Cost of goods sold – Total of R$ 902 million(-2%) due to lower sales volume and the reduction in the US Dollar denominated costs of Oxiteno’s main raw materials, notably ethylene and palm kernel oil (“PKO”), partially offset by (i) the devaluation of the Real against the US Dollar, (ii) higher maintenance costs and (iii) increased provisions for inventory losses. Compared with 1Q19, cost of goods sold remained stable, reflecting stronger sales volume, increased provisions for inventory losses and a 4% devaluation in the Real in relation to the US Dollar neutralized by a fall in raw material costs, mainly palm kernel oil.
Sales, general and administrative expenses (SG&A) – Total of R$ 177 million (0%), with higher expenses in payroll (principally severance indemnities) and at the international units due to the weaker Real compared to the US Dollar, offset by lower international freight charges in line with the decline in volumes over the period, and initiatives taken to reduce expenses. In relation to 1Q19, sales, general and administrative expenses increased by 1%, mainly due to higher expenses in payroll and at the international units due to the weaker Real compared to the US Dollar, partially offset by lower IT service expenses.
EBITDA –Total of R$ 39 million(-68%) due to lower unit margins in US Dollars in the period as a result of the decline in petrochemical commodity prices on the international markets, especially glycols, and lower sales volume, partially offset by the weaker Realin relation to the US Dollar. The 13% increase in EBITDA over 1Q19 reflects stronger sales volume in the period, a devaluation in the Real and the improvement in contribution margins of specialty chemicals, although attenuated by narrower margins in commodity chemicals. Considering IFRS 16 adjustments and the segregation of the corporate expenses, Oxiteno’s EBITDA Post Adjustments in 2Q19 and in 1H19 was R$ 44 million and R$ 82 million, respectively.
Investments – Investments in the period were R$ 59 million, allocated mainly to maintenance of Oxiteno’s industrial units.
5
Table of Contents
Ultragaz
| 2Q19 | 2Q18 | 1Q19 | D(%) 2Q19 v 2Q18 | D(%) 2Q19 v 1Q19 | 1H19 | 1H18 | D(%) 1H19 v 1H18 | |||||||||||||||||||||
Total volume (000 tons) | 421 | 444 | 395 | (5%) | 7% | 816 | 854 | (4%) | ||||||||||||||||||||
Bottled | 289 | 311 | 270 | (7%) | 7% | 559 | 592 | (6%) | ||||||||||||||||||||
Bulk | 132 | 133 | 126 | (1%) | 5% | 257 | 262 | (2%) | ||||||||||||||||||||
EBITDA¹ (R$ million) | 111 | 148 | 97 | (25%) | 14% | 208 | (22) | n/a | ||||||||||||||||||||
EBITDA Post Adjustments (R$ million) | 121 | n/a | 108 | n/a | 11% | 229 | n/a | n/a | ||||||||||||||||||||
| ¹ | 1H18 figures include thebreak-up fee of R$ 286 million following the rejection of the Liquigás acquisition. Excluding this effect, EBITDA was R$ 264 million |
Operational performance –Volume declined 7% in the bottled segment compared with the same period in 2018 due to a 4% drop in domestic market demand, particularly in the states comprising Ultragaz main markets (the Southeast region) and the remaining impacts of the temporary interruption of LPG supply at some refineries. The bulk segment presented a 1% decrease in volume, aligned with the volume decline for the domestic market. Compared with 1Q19, sales volume increased by 7%, reflecting the seasonality between periods.
Net revenues – Total of R$ 1,773 million (0%) due to readjustments in LPG costs, offset by a reduction in sales volume. In relation to 1Q19, net revenues increased 8% on the back of 7% higher sales volume combined with a slight increase in the product costs.
Cost of goods sold – Total of R$ 1,550 million (0%) due to the readjustments in LPG costs, neutralized by a reduction in the sales volume and by lower costs with the amortization of contracts. Compared with 1Q19, the cost of goods sold rose 8%, reflecting seasonally higher sales volume as well a slight increase in the unit cost of the product.
Sales, general and administrative expenses (SG&A)– Total of R$ 158 million (+17%), mainly due to a rise in provisions for losses on doubtful accounts, compared to a reversal of provisions in 2Q18, and to higher freight expenses, partially attenuated by a reduction in marketing expenses. In relation to 1Q19, sales, general and administrative expenses fell by 4% due to lower provisions for losses on doubtful accounts, lower payroll expenses and tonon-recurring expenses with legal proceedings in 1Q19.
EBITDA – Total of R$ 111 million(-25%), due to the reduction in sales volume and increased expenses in the period as already described. When compared with 1Q19, Ultragaz’s EBITDA grew 14%, mainly a reflection of higher sales volume and the reduction of expenses. Considering IFRS 16 adjustments, and the segregation of the corporate expenses, Ultragaz’s EBITDA Post Adjustments in 2Q19 and in 1H19 was R$ 121 million and R$ 229 million, respectively.
Investments – Ultragaz invested R$ 53 million, focused on clients in the bulk segment, the replacement and acquisition of gas bottles and maintenance of logistics infrastructure and the company’s filling plants.
6
Table of Contents
Ultracargo
| 2Q19 | 2Q18 | 1Q19 | D(%) 2Q19 v 2Q18 | D(%) 2Q19 v 1Q19 | 1H19 | 1H18 | D(%) 1H19 v 1H18 | |||||||||||||||||||
Effective storage1 (000 m3) | 745 | 786 | 758 | (5%) | (2%) | 752 | 754 | 0% | ||||||||||||||||||
EBITDA (R$ million) | (3) | 54 | 52 | n/a | n/a | 50 | 95 | (48%) | ||||||||||||||||||
EBITDAex-non-recurring2 (R$ million) | 50 | 54 | 52 | (8%) | (4%) | 102 | 95 | 7% | ||||||||||||||||||
EBITDA Post Adjustments (R$ million) | 6 | n/a | 59 | n/a | (89%) | 65 | n/a | n/a | ||||||||||||||||||
| 1 | Monthly average |
| ² | EBITDAex-non-recurring does not include the effect of the R$ 53 million relative to the Conduct Adjustment Agreement in 2Q19 and 1H19 |
Operational performance – Ultracargo’s average storage decreased 5% in relation to 2Q18, mainly due to a reduction in the number of spot operations for ethanol and fuel handling, attenuated by an increase of chemical products and corrosives handling. In relation to 1Q19, average storage at the port terminals declined by 2% with a reduction in the handling of fuels and ethanol, partially offset by the greater handling of corrosives and vegetable oils.
Net revenues –Total of R$ 126 million in 2Q19 (0%) due to the product mix handled and contractual readjustments, neutralized by lower handling activity in the period. In relation to 1Q19, net revenues were flat and influenced by the same factors for theyear-on-year comparison.
Cost of services provided – Total of R$ 63 million (+3%) due to higher costs with the depreciation and services linked to the completion of the capacity expansion in Santos, partially neutralized bynon-recurring retroactive payment of a municipal property tax (IPTU) in 2Q18. In relation to 1Q19, the cost of services provided increased by 7%, principally driven by higher expenditures with payroll and services associated with capacity expansion at the port of Santos.
Sales, general and administrative expenses (SG&A) – Total of R$ 31 million (+32%) due to thenon-recurring effect in 2Q18 of credits worth R$ 8 million on an improperly collected port management fee, attenuated by lower legal advisory expenses in 2Q19. In relation to 1Q19, sales, general and administrative expenses increased by 6%, mainly the result of increased project expenses.
Other operating results – Total of R$ 50 million negative in 2Q19, due to the provision for the payment of the Conduct Adjustment Agreement (“TAC”) entered into by Ultracargo and the Federal Public Prosecutor’s Office and the Public Prosecutor’s Office for the State of São Paulo on May 15, 2019 for the implementation of initiatives to compensate for impacts caused to the Santos estuary by the fire at the Ultracargo terminal in April 2015. The amount of the agreement was R$ 68 million, to be disbursed in full until September 2020. Ultracargo had previously recorded R$ 15 million to this end and in 2Q19, completed the remaining amount of R$ 53 million, thus affecting this quarter’s results.
EBITDA – Total of R$ 3 million negative, impacted by the R$ 53 million provision for the TAC. Excluding the effect of the TAC in 2Q19, Ultracargo’s EBITDA was R$ 50 million, a decline of 8% due to lower average storage and thenon-recurring retroactive payment in 2Q18, partially offset by contractual readjustments. Compared to 1Q19 and excluding the effect of the TAC, EBITDA declined by 4% due to the increase in the cost of services provided and reduced handling activity in the period. Considering IFRS 16 adjustments and the separation of corporate expenses, Ultracargo’s EBITDA Post Adjustments in 2Q19 and in 1H19 was R$ 6 million and R$ 65 million, respectively.
Investments – Ultracargo invested R$ 39 million in the period, allocated to expansion at Itaqui and Santos terminals, operational safety measures and maintenance.
7
Table of Contents
Extrafarma
| 2Q19 | 2Q18 | 1Q19 | D(%) 2Q19 v 2Q18 | D(%) 2Q19 v 1Q19 | 1H19 | 1H18 | D(%) 1H19 v 1H18 | ||||||||||||||||||||||||
Drugstores (end of the period) | 433 | 406 | 440 | 7% | (2%) | 433 | 406 | 7% | |||||||||||||||||||||||
% of mature stores (+3 years) | 47% | 46% | 46% | 1.3 p.p. | 1.4 p.p. | 47% | 46% | 1.3 p.p. | |||||||||||||||||||||||
Gross revenues (R$ million) | 559 | 559 | 546 | 0% | 3% | 1,105 | 1,101 | 0% | |||||||||||||||||||||||
EBITDA (R$ million) | (5) | (7) | (21) | 30% | 78% | (26) | (7) | (274%) | |||||||||||||||||||||||
EBITDA Post Adjustments (R$ million) | 18 | n/a | 1 | n/a | n/a | 18 | n/a | n/a | |||||||||||||||||||||||
Operational performance – Extrafarma ended 2Q19 with 433 stores, 63 openings and 36 closures in the past 12 months, equivalent to an increase of 7% in its network. At 2Q19, stores still at the maturing stage (up to three years of operations) represented 53% of the network, a reflection of Extrafarma’s rate of expansion in recent years. In relation to 1Q19, Extrafarma opened 6 stores and closed 13, as a result of greater selectivity in investments and a more rigorous approach in relation to underperforming store operations.
Gross revenues – Total of R$ 559 million (0%) due to the intensified competitive environment and closing of underperforming stores in the period. These factors were offset by the larger number of stores and the annual readjustment in medicines prices. In relation to 1Q19, gross revenue increased 3% following the annual readjustment in the price of medicines and the recovery in sales due to promotional initiatives and instore healthcare activities.
Cost of goods sold and gross profit – The cost of goods sold totaled R$ 379 million (+3%), mainly due to the annual readjustment in medicines prices. Gross profit reached R$ 151 million(-5%), in large part a reflection of a continued challenging competitive environment and the network densification in new markets. In relation to 1Q19, the cost of goods sold rose 1% while gross profit increased 7%, mainly due to the annual price adjustment in medicines in April 2019 and the recovery in sales in the period with promotional initiatives and instore healthcare activities.
Sales, general and administrative expenses (SG&A) – Total of R$ 196 million (+7%) due to the larger number of stores. Excluding the effect of new stores, sales, general and administrative expenses decreased 1% in the light of reduced payroll, logistics and marketing expenses. In relation to 1Q19, sales, general and administrative expenses rose 4%, reflecting higher expenditures with the closing of poorly performing stores together with severance indemnifications.
Other operating income – Total of R$ 16 million in 2Q19, as a result of tax credits relating to previous fiscal years with respect to a judicial ruling on the exclusion of the ICMS sales tax from the calculation base for PIS/COFINS taxes and credits arising from social security contributions.
EBITDA –Total of R$ 5 million negative compared with the R$ 7 million negative in 2Q18, mainly due to a further intensification in the competitive environment. In relation to 1Q19, the improved result was mainly due to the recovery in sales and in gross margin in the period benefited by the constitution of tax credits. Considering IFRS 16 adjustments and the separation of corporate expenses, Extrafarma’s EBITDA Post Adjustments, in both 2Q19 and in 1H19, was R$ 18 million.
Investments – In 2Q19, Extrafarma invested R$ 24 million, allocated to the new distribution center in São Paulo, which will start its operations in August and provide improved logistics and service levels for the state-wide operations, stores opening and modernization and information technology with a focus on improving operations as well as the shopping experience for consumers.
8
Table of Contents
Ultrapar
| Amounts in R$ million | 2Q19 | 2Q18 | 1Q19 | D(%) 2Q19 v 2Q18 | D(%) 2Q19 v 1Q19 | 1H19 | 1H18 | D(%) 1H19 v 1H18 | ||||||||||||||||||||
Net revenues | 21,693 | 22,646 | 20,739 | (4%) | 5% | 42,432 | 43,397 | (2%) | ||||||||||||||||||||
Net income1 | 127 | 241 | 251 | (47%) | (49%) | 378 | 314 | 21% | ||||||||||||||||||||
Net income Post Adjustments | 121 | n/a | 243 | n/a | (50%) | 363 | n/a | n/a | ||||||||||||||||||||
Earnings per share attributable to shareholders2 Post Adjustments | 0.10 | 0.22 | 0.22 | (55%) | (55%) | 0.32 | 0.29 | 8% | ||||||||||||||||||||
Adjusted EBITDA | 589 | 718 | 698 | (18%) | (16%) | 1,287 | 1,226 | 5% | ||||||||||||||||||||
Adjusted EBITDAex-non-recurring3 | 642 | 718 | 698 | (11%) | (8%) | 1,340 | 1,512 | (11%) | ||||||||||||||||||||
Adjusted EBITDA Post Adjustments | 677 | n/a | 782 | n/a | (13%) | 1,459 | n/a | n/a | ||||||||||||||||||||
Investments | 336 | 437 | 268 | (23%) | 25% | 604 | 1,041 | (42%) | ||||||||||||||||||||
Operating cash flow | 1,065 | 743 | 462 | 43% | 130% | 1,527 | 630 | 143% | ||||||||||||||||||||
| 1 | According to the IFRS accounting standard, consolidated net income includes net income attributable tonon-controlling interests in subsidiaries |
| 2 | Calculated in Reais based on the weighted average number of shares over the period net of shares held as treasury stock. These amounts consider the stock split in April 2019 |
| 3 | The Adjusted EBITDAex-non-recurring excludes the effects of the R$ 53 million for the TAC in 2Q19 and thebreak-up fee of R$ 286 million in 1H18 |
Net revenues – Total of R$ 21,693 million(-4%) due to the reduction in net revenues at Ipiranga and Oxiteno. In relation to 1Q19, net revenues increased by 5% as a consequence of the increase in net revenues at Ipiranga, Oxiteno, Ultragaz and Extrafarma.
Adjusted EBITDA – Total of R$ 589 million(-18%), impacted by Ultracargo’s TAC. Excluding the TAC, the Adjusted EBITDA was R$ 642 million, a reduction of 11% compared with 2Q18 due to lower EBITDA at Oxiteno, Ultragaz and Ultracargo. Compared with 1Q19, Adjusted EBITDAex-TAC fell by 8% due to the EBITDA reduction at Ipiranga and Ultracargo. Considering the IFRS 16 adjustments, the Adjusted EBITDA Post Adjustments for Ultrapar in 2Q19 and 1H19, was R$ 677 million and R$ 1,459 million, respectively.
Depreciation and amortization4 – Total of R$ 302 million (+4%) due to the depreciation of investments conducted over the past 12 months. Compared with 1Q19, total costs and expenses with depreciation and amortization were 2% higher, mainly the result of greater amortization of contractual assets with Ipiranga’s clients in the period.
Financial results – Ultrapar ended 2Q19 with net debt of R$ 8.1 billion (2.60x LTM Adjusted EBITDA) compared with R$ 8.6 million on March 31, 2019 (2.65x LTM Adjusted EBITDA), mainly due to greater operating cash generation post investments in the period. Ultrapar reported net financial expenses of R$ 68 million in 2Q19, an increase of R$ 4 million in relation to 2Q18. This increase reflects theone-off payment of the premium on the buyback of the 2026 notes, partially offset by the gains from marking to market of hedging instruments in the period. In 1Q19, Ultrapar reported net financial revenue of R$ 21 million, mainly due to higher gains from marking to market of hedging instruments in the period.
Net income – Total of R$ 127 million(-47%), largely due to the reduction in EBITDA. In relation to 1Q19, net income fell 49% due to the reduction in EBITDA and the increase in financial expenses in the period. Considering the adjustments of IFRS 16, Ultrapar’s Post Adjustment net income in 2Q19 and 1H19 was R$ 121 million and R$ 363 million, respectively.
Cash flow from operating activities – Generation of R$ 1,527 million in 1H19 compared with a cash generation of R$ 630 million in 1H18, benefiting from initiatives for optimizing working capital in 1H19.
| 4 | Includes amortization of contractual assets with clients – exclusive rights |
9
Table of Contents
Capital markets
Ultrapar reported an average daily trading volume (ADTV) of R$ 130 million in 2Q19(-10%) including the trading on both B3 and NYSE. Ultrapar’s shares ended the quarter at R$ 20.10 on B3, a reduction of 14% in the quarter, compared to Ibovespa stock index’s appreciation of 6%. On the NYSE, the Company’s shares recorded a depreciation of 12% in 2Q19, while the Dow Jones Industrial Average for the same period advanced 3%. Ultrapar’s market capitalization at the end of 2Q19 was R$ 22 billion.
On April 10, 2019, the Company’s Extraordinary and Annual General Meeting approved a stock split of Ultrapar’s common shares, whereby one existing share now represents two shares of the same class and type. The stock split implies no alteration in Ultrapar’s capital stock and was effective on April 24, 2019.
The amounts of share prices, ADTV and ADRs traded presented in the table below were adjusted to reflect the stock split.
| Capital markets | 2Q19 | 2Q18 | 1Q19 | 1H19 | 1H18 | |||||||||||||||
Number of shares (000) | 1,112,810 | 1,112,810 | 1,112,810 | 1,112,810 | 1,112,810 | �� | ||||||||||||||
Market capitalization1 (R$ million) | 22,367 | 25,567 | 26,151 | 22,367 | 25,567 | |||||||||||||||
B3 | ||||||||||||||||||||
ADTV (shares) | 5,092,892 | 3,726,975 | 5,464,850 | 5,275,822 | 3,003,641 | |||||||||||||||
ADTV (R$ 000) | 107,834 | 101,427 | 143,814 | 125,529 | 93,621 | |||||||||||||||
Average share price (R$/share) | 21.17 | 27.21 | 26.32 | 23.79 | 31.17 | |||||||||||||||
NYSE | ||||||||||||||||||||
Quantity of ADRs² (000 ADRs) | 46,518 | 62,357 | 48,192 | 46,518 | 62,357 | |||||||||||||||
ADTV (ADRs) | 1,031,820 | 1,574,950 | 1,639,683 | 1,330,850 | 1,282,075 | |||||||||||||||
ADTV (US$ 000) | 5,637 | 11,883 | 11,507 | 8,524 | 11,711 | |||||||||||||||
Average share price (US$/ADR) | 5.46 | 7.55 | 7.02 | 6.41 | 9.13 | |||||||||||||||
Total | ||||||||||||||||||||
ADTV (shares) | 6,124,712 | 5,301,925 | 7,104,533 | 6,606,672 | 4,285,716 | |||||||||||||||
ADTV (R$ 000) | 129,913 | 144,205 | 187,235 | 158,107 | 133,755 | |||||||||||||||
| 1 | Calculated based on the closing price of the period |
| 2 | 1 ADR = 1 common share |
Performance UGPA3 x Ibovespa – 2Q19
(Mar 29, 2019 = 100)
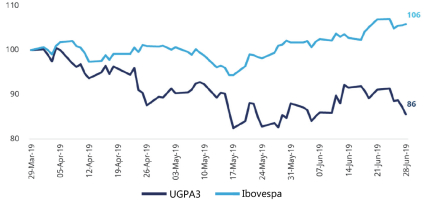
Source: Bloomberg
10
Table of Contents
Debt (R$ million)
| Ultrapar consolidated | 2Q19 | 1Q19 | 2Q18 | ||||||||||||
Gross debt | (14,570.6 | ) | (15,112.0 | ) | (15,044.7 | ) | |||||||||
Cash and cash equivalents | 6,421.5 | 6,492.0 | 6,119.3 | ||||||||||||
Net debt | (8,149.1 | ) | (8,620.0 | ) | (8,925.5 | ) | |||||||||
Net debt/LTM Adjusted EBITDA | 2.60x | 2.65x | 2.55x | ||||||||||||
Average cost of debt (% CDI) | 97.6% | 97.5% | 95.7% | ||||||||||||
Average cash yield (% CDI) | 91.3% | 97.4% | 93.8% | ||||||||||||
Duration (years) | 5.0 | 4.3 | 4.3 | ||||||||||||
Debt amortization profile:
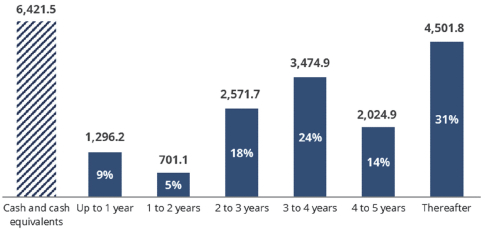
Debt breakdown:
Local currency | 7,915.6 | |||
Foreign currency | 6,625.3 | |||
Result from currency and interest hedging instruments | 29.7 | |||
Total | 14,570.6 |
11
Table of Contents
ULTRAPAR
CONSOLIDATED BALANCE SHEET
In millions of Reais | JUN 19 Post Adjustments | IFRS 16 Adjustments | JUN 19 | JUN 18 | MAR 19 | |||||||||||||||
ASSETS | ||||||||||||||||||||
Cash and cash equivalents | 2,909.3 | — | 2,909.3 | 3,940.4 | 3,446.3 | |||||||||||||||
Financial investments and hedging instruments | 3,177.4 | — | 3,177.4 | 2,029.7 | 2,791.1 | |||||||||||||||
Trade receivables and reseller financing | 4,226.2 | — | 4,226.2 | 4,403.6 | 4,183.8 | |||||||||||||||
Inventories | 3,263.6 | — | 3,263.6 | 3,076.5 | 3,243.4 | |||||||||||||||
Recoverable taxes | 1,035.8 | — | 1,035.8 | 965.7 | 958.5 | |||||||||||||||
Prepaid expenses | 160.0 | 21.4 | 181.4 | 155.2 | 202.0 | |||||||||||||||
Contractual assets with customers—exclusive rights | 478.9 | — | 478.9 | 471.1 | 489.6 | |||||||||||||||
Other receivable | 86.8 | — | 86.8 | 119.1 | 72.0 | |||||||||||||||
Total Current Assets | 15,337.9 | 21.4 | 15,359.3 | 15,161.2 | 15,386.6 | |||||||||||||||
Financial investments and hedging instruments | 334.8 | — | 334.8 | 149.2 | 254.6 | |||||||||||||||
Trade receivables and reseller financing | 375.1 | — | 375.1 | 350.8 | 384.3 | |||||||||||||||
Deferred income and social contribution taxes | 599.3 | (7.6 | ) | 591.8 | 727.9 | 496.4 | ||||||||||||||
Recoverable taxes | 837.4 | — | 837.4 | 403.7 | 829.6 | |||||||||||||||
Escrow deposits | 912.6 | — | 912.6 | 839.3 | 892.9 | |||||||||||||||
Prepaid expenses | 106.9 | 310.6 | 417.6 | 372.4 | 392.6 | |||||||||||||||
Contractual assets with customers—exclusive rights | 977.5 | — | 977.5 | 1,012.2 | 1,007.8 | |||||||||||||||
Other receivables | 196.6 | — | 196.6 | 205.0 | 196.5 | |||||||||||||||
Investments | 122.4 | — | 122.4 | 128.9 | 122.2 | |||||||||||||||
Right to use assets | 1,878.6 | (1,878.6 | ) | — | — | — | ||||||||||||||
Property, plant and equipment | 7,309.0 | 6.7 | 7,315.7 | 7,062.6 | 7,295.3 | |||||||||||||||
Intangible assets | 2,316.6 | 46.0 | 2,362.6 | 2,259.6 | 2,359.7 | |||||||||||||||
TotalNon-Current Assets | 15,966.8 | (1,522.9 | ) | 14,443.9 | 13,511.7 | 14,232.0 | ||||||||||||||
TOTAL ASSETS | 31,304.8 | (1,501.6 | ) | 29,803.2 | 28,672.9 | 29,618.6 | ||||||||||||||
LIABILITIES | ||||||||||||||||||||
Loans and hedging instruments | 981.0 | — | 981.0 | 3,013.3 | 1,937.3 | |||||||||||||||
Debentures | 315.2 | — | 315.2 | 1,112.5 | 308.5 | |||||||||||||||
Trade payables | 2,506.3 | — | 2,506.3 | 1,651.0 | 2,083.4 | |||||||||||||||
Salaries and related charges | 369.3 | — | 369.3 | 344.0 | 326.5 | |||||||||||||||
Taxes payable | 327.8 | — | 327.8 | 257.4 | 363.8 | |||||||||||||||
Leases payable | 203.5 | (200.3 | ) | 3.2 | 2.8 | 2.9 | ||||||||||||||
Other payables | 395.9 | — | 395.9 | 311.0 | 315.3 | |||||||||||||||
Total Current Liabilities | 5,098.9 | (200.3 | ) | 4,898.6 | 6,692.0 | 5,337.7 | ||||||||||||||
Loans and hedging instruments | 7,010.8 | — | 7,010.8 | 5,373.4 | 6,453.3 | |||||||||||||||
Debentures | 6,263.6 | — | 6,263.6 | 5,498.2 | 6,412.9 | |||||||||||||||
Provisions for tax, civil and labor risks | 848.8 | — | 848.8 | 871.3 | 864.0 | |||||||||||||||
Post-employment benefits | 202.5 | — | 202.5 | 218.3 | 200.2 | |||||||||||||||
Leases payable | 1,361.2 | (1,316.0 | ) | 45.3 | 44.6 | 42.5 | ||||||||||||||
Other payables | 450.7 | — | 450.7 | 407.4 | 369.5 | |||||||||||||||
TotalNon-Current Liabilities | 16,137.7 | (1,316.0 | ) | 14,821.7 | 12,413.2 | 14,342.5 | ||||||||||||||
TOTAL LIABILITIES | 21,236.6 | (1,516.3 | ) | 19,720.4 | 19,105.2 | 19,680.1 | ||||||||||||||
EQUITY | ||||||||||||||||||||
Share capital | 5,171.8 | — | 5,171.8 | 5,171.8 | 5,171.8 | |||||||||||||||
Reserves | 4,646.1 | — | 4,646.1 | 4,180.1 | 4,646.2 | |||||||||||||||
Treasury shares | (485.4 | ) | — | (485.4 | ) | (484.1 | ) | (485.4 | ) | |||||||||||
Other | 359.6 | 14.3 | 373.9 | 366.5 | 248.3 | |||||||||||||||
Non-controlling interests in subsidiaries | 376.0 | 0.4 | 376.5 | 333.4 | 357.6 | |||||||||||||||
Total equity | 10,068.1 | 14.7 | 10,082.9 | 9,567.7 | 9,938.5 | |||||||||||||||
TOTAL LIABILITIES AND EQUITY | 31,304.8 | (1,501.6 | ) | 29,803.2 | 28,672.9 | 29,618.6 | ||||||||||||||
Cash and financial investments | 6,421.5 | — | 6,421.5 | 6,119.3 | 6,492.0 | |||||||||||||||
Debt | (14,570.6 | ) | — | (14,570.6 | ) | (15,044.7 | ) | (15,112.0 | ) | |||||||||||
Net cash (debt) | (8,149.1 | ) | — | (8,149.1 | ) | (8,925.5 | ) | (8,620.0 | ) | |||||||||||
12
Table of Contents
ULTRAPAR
CONSOLIDATED INCOME STATEMENT
In millions of Reais | Quarter | Semester | ||||||||||||||||||||||||||
| 2Q19 Post Adjustments | IFRS 16 Adjustments | 2Q19 | 2Q18 | 1Q19 | 1H19 | 1H18 | ||||||||||||||||||||||
Net revenue from sales and services | 21,692.6 | — | 21,692.6 | 22,645.6 | 20,739.3 | 42,431.9 | 43,396.7 | |||||||||||||||||||||
Cost of products and services sold | (20,286.9 | ) | (3.2 | ) | (20,290.1 | ) | (21,186.5 | ) | (19,295.2 | ) | (39,585.3 | ) | (40,416.4 | ) | ||||||||||||||
Gross profit | 1,405.8 | (3.2 | ) | 1,402.5 | 1,459.0 | 1,444.0 | 2,846.6 | 2,980.3 | ||||||||||||||||||||
Operating expenses | ||||||||||||||||||||||||||||
Selling and marketing | (696.6 | ) | (11.2 | ) | (707.7 | ) | (662.5 | ) | (684.8 | ) | (1,392.5 | ) | (1,333.9 | ) | ||||||||||||||
General and administrative | (415.6 | ) | (0.1 | ) | (415.7 | ) | (397.6 | ) | (384.6 | ) | (800.3 | ) | (770.1 | ) | ||||||||||||||
Other operating income (expenses) | 10.1 | (0.0 | ) | 10.1 | 34.9 | 36.7 | 46.8 | (227.9 | ) | |||||||||||||||||||
Gain (loss) on disposal of property, plant and equipment and intangibles | 1.0 | (0.1 | ) | 0.9 | (2.4 | ) | (2.1 | ) | (1.2 | ) | (4.6 | ) | ||||||||||||||||
Operating income | 304.7 | (14.6 | ) | 290.1 | 431.5 | 409.3 | 699.4 | 643.9 | ||||||||||||||||||||
Financial result | ||||||||||||||||||||||||||||
Financial income | 132.1 | — | 132.1 | 192.2 | 144.1 | 276.3 | 304.6 | |||||||||||||||||||||
Financial expenses | (224.3 | ) | 24.0 | (200.3 | ) | (256.6 | ) | (122.8 | ) | (323.1 | ) | (476.0 | ) | |||||||||||||||
Share of profit (loss) of subsidiaries, joint ventures and associates | (3.1 | ) | — | (3.1 | ) | (3.4 | ) | (7.0 | ) | (10.0 | ) | (6.4 | ) | |||||||||||||||
Income before income and social contribution taxes | 209.4 | 9.4 | 218.8 | 363.7 | 423.7 | 642.5 | 466.1 | |||||||||||||||||||||
Provision for income and social contribution taxes | ||||||||||||||||||||||||||||
Current | (126.0 | ) | — | (126.0 | ) | (47.7 | ) | (152.9 | ) | (278.9 | ) | (186.2 | ) | |||||||||||||||
Deferred | 31.3 | (3.2 | ) | 28.2 | (104.8 | ) | (33.2 | ) | (5.0 | ) | (12.3 | ) | ||||||||||||||||
Benefit of tax holidays | 5.9 | — | 5.9 | 29.5 | 13.5 | 19.5 | 45.9 | |||||||||||||||||||||
Net income | 120.7 | 6.2 | 126.9 | 240.7 | 251.1 | 378.0 | 313.5 | |||||||||||||||||||||
Net income attributable to: | ||||||||||||||||||||||||||||
Shareholders of the Company | 108.6 | 5.8 | 114.4 | 241.6 | 242.2 | 356.6 | 315.4 | |||||||||||||||||||||
Non-controlling interests in subsidiaries | 12.1 | 0.4 | 12.6 | (0.9 | ) | 8.9 | 21.4 | (1.9 | ) | |||||||||||||||||||
Adjusted EBITDA | 677.2 | (88.0 | ) | 589.2 | 718.1 | 697.9 | 1,287.1 | 1,226.2 | ||||||||||||||||||||
Depreciation and amortization¹ | 375.5 | (73.4 | ) | 302.2 | 290.0 | 295.6 | 597.7 | 588.7 | ||||||||||||||||||||
Total investments² | 335.8 | — | 335.8 | 437.0 | 267.8 | 603.6 | 1,040.5 | |||||||||||||||||||||
RATIOS | ||||||||||||||||||||||||||||
Earnings per share—R$ | 0.10 | 0.11 | 0.22 | 0.22 | 0.33 | 0.29 | ||||||||||||||||||||||
Net debt / Stockholders’ equity | 0.81 | 0.81 | 0.93 | 0.87 | 0.81 | 0.93 | ||||||||||||||||||||||
Net debt / LTM Adjusted EBITDA | 2.60 | 2.60 | 2.55 | 2.65 | 2.60 | 2.55 | ||||||||||||||||||||||
Net interest expense / Adjusted EBITDA | 0.14 | 0.12 | 0.09 | n/a | 0.04 | 0.14 | ||||||||||||||||||||||
Gross margin | 6.5% | 6.5% | 6.4% | 7.0% | 6.7% | 6.9% | ||||||||||||||||||||||
Operating margin | 1.4% | 1.3% | 1.9% | 2.0% | 1.6% | 1.5% | ||||||||||||||||||||||
Adjusted EBITDA margin | 3.1% | 2.7% | 3.2% | 3.4% | 3.0% | 2.8% | ||||||||||||||||||||||
Number of employees | 16,916 | 16,916 | 16,965 | 17,027 | 16,916 | 16,965 | ||||||||||||||||||||||
| ¹ | Includes amortization with contractual assets with customers – exclusive rights |
| ² | Includes property, plant and equipment and additions to intangible assets, contractual assets with customers, financing of clients and rental advances (net of repayments) and acquisition of shareholdings |
13
Table of Contents
ULTRAPAR
CONSOLIDATED CASH FLOW
In millions of Reais | JAN—JUN | JAN—JUN | ||||||
| 2019 | 2018 | |||||||
Cash flows from operating activities | ||||||||
Net income for the period | 363.3 | 313.5 | ||||||
Adjustments to reconcile net income to cash provided by operating activities | ||||||||
Share of loss (profit) of subsidiaries, joint ventures and associates | 10.0 | 6.4 | ||||||
Amortization of contractual assets with customers—exclusive rights | 177.8 | 196.7 | ||||||
Amortization of right to use assets | 153.3 | — | ||||||
Depreciation and amortization | 416.9 | 392.0 | ||||||
PIS and COFINS credits on depreciation | 7.3 | 8.1 | ||||||
Interest and foreign exchange rate variations | 547.8 | 523.7 | ||||||
Deferred income and social contribution taxes | (2.6 | ) | 12.3 | |||||
(Gain) loss on disposal of property, plant and equipment and intangibles | 1.1 | 4.6 | ||||||
Estimated losses on doubtful accounts | 65.6 | 49.3 | ||||||
Provision for losses in inventories | 13.3 | 1.0 | ||||||
Provision for post-employment benefits | (3.3 | ) | 8.9 | |||||
Equity instrument granted | 3.2 | 1.6 | ||||||
Other provisions and adjustments | 2.4 | (2.0 | ) | |||||
| 1,756.2 | 1,516.1 | |||||||
(Increase) decrease in current assets | ||||||||
Trade receivables and reseller financing | 155.4 | (305.6 | ) | |||||
Inventories | 77.3 | 439.3 | ||||||
Recoverable taxes | (138.9 | ) | (80.3 | ) | ||||
Dividends received from subsidiaries and joint-ventures | 3.7 | 37.5 | ||||||
Insurance and other receivables | (28.2 | ) | (64.3 | ) | ||||
Prepaid expenses | (13.6 | ) | (5.1 | ) | ||||
Contractual assets with customers—exclusive rights | — | (14.9 | ) | |||||
Increase (decrease) in current liabilities | ||||||||
Trade payables | (225.4 | ) | (504.5 | ) | ||||
Salaries and related charges | (58.9 | ) | (44.1 | ) | ||||
Taxes payable | (38.8 | ) | 35.9 | |||||
Income and social contribution taxes | 122.9 | 24.9 | ||||||
Post-employment benefits | (2.5 | ) | — | |||||
Provision for tax, civil, and labor risks | 13.6 | (3.7 | ) | |||||
Insurance and other payables | 64.4 | (61.6 | ) | |||||
Deferred revenue | 9.7 | (0.7 | ) | |||||
(Increase) decrease innon-current assets | ||||||||
Trade receivables and reseller financing | 54.7 | (20.8 | ) | |||||
Recoverable taxes | 15.4 | (90.5 | ) | |||||
Escrow deposits | (31.0 | ) | (16.5 | ) | ||||
Other receivables | (0.0 | ) | 5.8 | |||||
Prepaid expenses | (18.5 | ) | (25.5 | ) | ||||
Contractual assets with customers—exclusive rights | — | 14.3 | ||||||
Increase (decrease) innon-current liabilities | ||||||||
Post-employment benefits | 1.8 | 1.7 | ||||||
Provision for tax, civil, and labor risks | (16.4 | ) | 10.1 | |||||
Other payables | 32.5 | 39.9 | ||||||
Deferred revenue | (2.1 | ) | (0.2 | ) | ||||
Payments of contractual assets with customers—exclusive rights | (126.3 | ) | (177.0 | ) | ||||
Income and social contribution taxes paid | (79.8 | ) | (80.6 | ) | ||||
Net cash provided by operating activities | 1,527.2 | 629.6 | ||||||
Cash flows from investing activities | ||||||||
Financial investments, net of redemptions | (488.3 | ) | (794.7 | ) | ||||
Cash and cash equivalents of subsidiary acquired | — | 3.7 | ||||||
Acquisition of property, plant, and equipment | (424.8 | ) | (575.4 | ) | ||||
Acquisition of intangible assets | (47.1 | ) | (125.3 | ) | ||||
Acquisiton of companies | — | (103.4 | ) | |||||
Capital increase in joint ventures | (8.8 | ) | (16.0 | ) | ||||
Capital reduction in associates | — | 1.3 | ||||||
Proceeds from disposal of property, plant and equipment and intangibles | 15.3 | 10.9 | ||||||
Net cash used in investing activities | (953.6 | ) | (1,599.0 | ) | ||||
Cash flows from financing activities | ||||||||
Loans and debentures | ||||||||
Proceeds | 1,998.0 | 2,219.8 | ||||||
Repayments | (2,063.9 | ) | (1,544.0 | ) | ||||
Interest paid | (1,003.3 | ) | (307.1 | ) | ||||
Payments of lease | (155.1 | ) | (2.6 | ) | ||||
Dividends paid | (380.6 | ) | (488.1 | ) | ||||
Redemption ofnon-controlling shares of Oxiteno Nordeste | (2.2 | ) | — | |||||
Capital increase from Iconicnon-controlling shareholders | 7.0 | — | ||||||
Related parties | (0.0 | ) | (0.0 | ) | ||||
Net cash provided by (used in) financing activities | (1,600.1 | ) | (121.9 | ) | ||||
Effect of exchange rate changes on cash and cash equivalents in foreign currency | (3.1 | ) | 29.7 | |||||
Increase (decrease) in cash and cash equivalents | (1,029.6 | ) | (1,061.6 | ) | ||||
Cash and cash equivalents at the beginning of the period | 3,939.0 | 5,002.0 | ||||||
Cash and cash equivalents at the end of the period | 2,909.3 | 3,940.4 | ||||||
Transactions without cash effect: | ||||||||
Addition on right to use assets and leases payable | 257 | — | ||||||
14
Table of Contents
IPIRANGA
BALANCE SHEET
In millions of Reais | JUN 19 Post Adjustments | IFRS 16 Adjustments | JUN 19 | JUN 18 | MAR 19 | |||||||||||||||
OPERATING ASSETS | ||||||||||||||||||||
Trade receivables | 3,012.3 | — | 3,012.3 | 3,186.2 | 2,995.9 | |||||||||||||||
Non-current trade receivables | 356.7 | — | 356.7 | 311.3 | 361.5 | |||||||||||||||
Inventories | 1,826.9 | — | 1,826.9 | 1,685.0 | 1,793.5 | |||||||||||||||
Taxes | 644.0 | — | 644.0 | 588.7 | 598.2 | |||||||||||||||
Contractual assets with customers—exclusive rights | 1,456.3 | — | 1,456.3 | 1,483.3 | 1,497.5 | |||||||||||||||
Other | 585.4 | 331.0 | 916.4 | 842.3 | 912.7 | |||||||||||||||
Right to use assets | 985.3 | (985.3 | ) | — | — | — | ||||||||||||||
Property, plant and equipment / Intangibles / Investments | 3,492.6 | — | 3,492.6 | 3,373.8 | 3,491.5 | |||||||||||||||
TOTAL OPERATING ASSETS | 12,359.5 | (654.3 | ) | 11,705.1 | 11,470.6 | 11,650.7 | ||||||||||||||
OPERATING LIABILITIES | ||||||||||||||||||||
Suppliers | 1,814.5 | — | 1,814.5 | 1,017.7 | 1,463.0 | |||||||||||||||
Salaries and related charges | 109.6 | — | 109.6 | 87.2 | 91.3 | |||||||||||||||
Post-employment benefits | 202.5 | — | 202.5 | 195.9 | 201.6 | |||||||||||||||
Taxes | 151.4 | — | 151.4 | 178.7 | 171.0 | |||||||||||||||
Judicial provisions | 332.9 | — | 332.9 | 329.6 | 330.0 | |||||||||||||||
Leases payable | 664.7 | (664.7 | ) | — | — | — | ||||||||||||||
Other accounts payable | 252.7 | — | 252.7 | 238.5 | 248.0 | |||||||||||||||
TOTAL OPERATING LIABILITIES | 3,528.4 | (664.7 | ) | 2,863.7 | 2,047.5 | 2,504.9 | ||||||||||||||
INCOME STATEMENT
In million of Reais | Quarter | Semester | ||||||||||||||||||||||||||||||
| 2Q19 Post Adjustments | IFRS 16 Adjustments | Corporate | 2Q19 | 2Q18 | 1Q19 | 1H19 | 1H18 | |||||||||||||||||||||||||
Net sales | 18,223.5 | — | — | 18,223.5 | 19,067.6 | 17,428.0 | 35,651.5 | 36,583.9 | ||||||||||||||||||||||||
Cost of products and services sold | (17,431.8 | ) | — | — | (17,431.8 | ) | (18,314.3 | ) | (16,565.5 | ) | (33,997.3 | ) | (34,888.4 | ) | ||||||||||||||||||
Gross profit | 791.7 | — | — | 791.7 | 753.3 | 862.5 | 1,654.2 | 1,695.6 | ||||||||||||||||||||||||
Operating expenses | ||||||||||||||||||||||||||||||||
Selling | (341.1 | ) | (7.2 | ) | — | (348.4 | ) | (334.7 | ) | (330.4 | ) | (678.8 | ) | (698.1 | ) | |||||||||||||||||
General and administrative | (189.9 | ) | — | (12.6 | ) | (202.6 | ) | (206.1 | ) | (174.1 | ) | (376.7 | ) | (391.5 | ) | |||||||||||||||||
Other operating income (expenses) | 41.1 | — | — | 41.1 | 30.9 | 24.1 | 65.2 | 52.1 | ||||||||||||||||||||||||
Gain (loss) on disposal of property, plant and equipment and intangibles | (1.8 | ) | (0.0 | ) | — | (1.9 | ) | (0.9 | ) | (0.9 | ) | (2.8 | ) | (1.7 | ) | |||||||||||||||||
Operating income | 299.9 | (7.3 | ) | (12.6 | ) | 279.9 | 242.5 | 381.1 | 661.1 | 656.5 | ||||||||||||||||||||||
Share of profit of subsidiaries, joint ventures and associates | 0.5 | — | — | 0.5 | 0.3 | 0.4 | 0.9 | 0.5 | ||||||||||||||||||||||||
Adjusted EBITDA | 508.1 | (48.1 | ) | (12.6 | ) | 447.3 | 401.5 | 538.4 | 985.6 | 986.9 | ||||||||||||||||||||||
Depreciation and amortization¹ | 207.7 | (40.8 | ) | — | 166.8 | 158.7 | 156.8 | 323.7 | 329.9 | |||||||||||||||||||||||
Ratios | ||||||||||||||||||||||||||||||||
Gross margin (R$/m³) | 141 | 141 | 129 | 154 | 148 | 150 | ||||||||||||||||||||||||||
Operating margin (R$/m³) | 53 | 50 | 41 | 68 | 59 | 58 | ||||||||||||||||||||||||||
Adjusted EBITDA margin (R$/m³) | 91 | 80 | 69 | 96 | 88 | 87 | ||||||||||||||||||||||||||
Adjusted EBITDA margin (%) | 2.8% | 2.5% | 2.1% | 3.1% | 2.8% | 2.7% | ||||||||||||||||||||||||||
Number of service stations | 7,186 | 7,186 | 7,142 | 7,218 | 7,186 | 7,142 | ||||||||||||||||||||||||||
Number of employees | 3,404 | 3,404 | 3,347 | 3,368 | 3,404 | 3,347 | ||||||||||||||||||||||||||
| ¹ | Includes amortization with contractual assets with customers—exclusive rights |
15
Table of Contents
OXITENO
BALANCE SHEET
In millions of Reais | JUN 19 Post Adjustments | IFRS 16 Adjustments | JUN 19 | JUN 18 | MAR 19 | |||||||||||||||
OPERATING ASSETS | ||||||||||||||||||||
Trade receivables | 579.7 | — | 579.7 | 654.5 | 560.4 | |||||||||||||||
Inventories | 732.1 | — | 732.1 | 811.5 | 778.7 | |||||||||||||||
Taxes | 577.7 | — | 577.7 | 162.1 | 582.5 | |||||||||||||||
Other | 161.3 | — | 161.3 | 142.2 | 137.3 | |||||||||||||||
Right to use assets | 35.5 | (35.5 | ) | — | — | — | ||||||||||||||
Property, plant and equipment / Intangibles / Investments | 2,563.7 | — | 2,563.7 | 2,450.5 | 2,577.1 | |||||||||||||||
TOTAL OPERATING ASSETS | 4,650.0 | (35.5 | ) | 4,614.6 | 4,220.9 | 4,636.0 | ||||||||||||||
OPERATING LIABILITIES | ||||||||||||||||||||
Suppliers | 379.7 | — | 379.7 | 394.9 | 356.9 | |||||||||||||||
Salaries and related charges | 88.9 | — | 88.9 | 85.9 | 89.3 | |||||||||||||||
Taxes | 36.1 | — | 36.1 | 38.1 | 28.6 | |||||||||||||||
Judicial provisions | 26.9 | — | 26.9 | 16.8 | 25.2 | |||||||||||||||
Leases payable | 35.9 | (35.9 | ) | — | — | — | ||||||||||||||
Other accounts payable | 52.3 | — | 52.3 | 33.7 | 30.6 | |||||||||||||||
TOTAL OPERATING LIABILITIES | 619.8 | (35.9 | ) | 583.8 | 569.5 | 530.5 | ||||||||||||||
INCOME STATEMENT
In million of Reais | Quarter | Semester | ||||||||||||||||||||||||||||||||||
| 2Q19 Post Adjustments | IFRS 16 Adjustments | Corporate | 2Q19 | 2Q18 | 1Q19 | 1H19 | 1H18 | |||||||||||||||||||||||||||||
Net sales | 1,066.3 | — | — | 1,066.3 | 1,180.8 | 1,055.7 | 2,122.0 | 2,180.1 | ||||||||||||||||||||||||||||
Cost of products and services sold | ||||||||||||||||||||||||||||||||||||
Variable | (723.5 | ) | — | — | (723.5 | ) | (775.0 | ) | (738.5 | ) | (1,462.0 | ) | (1,459.5 | ) | ||||||||||||||||||||||
Fixed | (132.1 | ) | (2.0 | ) | — | (134.1 | ) | (111.9 | ) | (113.6 | ) | (247.7 | ) | (215.1 | ) | |||||||||||||||||||||
Depreciation and amortization | (45.8 | ) | 1.8 | — | (44.0 | ) | (35.3 | ) | (46.7 | ) | (90.7 | ) | (71.6 | ) | ||||||||||||||||||||||
Gross profit | 165.0 | (0.2 | ) | — | 164.8 | 258.5 | 156.9 | 321.6 | 433.8 | |||||||||||||||||||||||||||
Operating expenses | ||||||||||||||||||||||||||||||||||||
Selling | (83.2 | ) | (0.0 | ) | — | (83.2 | ) | (82.6 | ) | (81.4 | ) | (164.6 | ) | (160.6 | ) | |||||||||||||||||||||
General and administrative | (90.9 | ) | (0.1 | ) | (2.5 | ) | (93.5 | ) | (95.0 | ) | (94.0 | ) | (187.6 | ) | (183.7 | ) | ||||||||||||||||||||
Other operating income (expenses) | 0.9 | — | — | 0.9 | 1.0 | 1.3 | 2.2 | 2.9 | ||||||||||||||||||||||||||||
Gain (loss) on disposal of property, plant and equipment and intangibles | 0.1 | — | — | 0.1 | (0.8 | ) | 0.3 | 0.4 | (1.2 | ) | ||||||||||||||||||||||||||
Operating income (loss) | (8.1 | ) | (0.4 | ) | (2.5 | ) | (10.9 | ) | 81.2 | (17.0 | ) | (28.0 | ) | 91.3 | ||||||||||||||||||||||
Share of profit of subsidiaries, joint ventures and associates | 0.3 | — | — | 0.3 | 0.2 | 0.0 | 0.3 | 0.5 | ||||||||||||||||||||||||||||
EBITDA | 43.8 | (2.8 | ) | (2.5 | ) | 38.6 | 121.1 | 34.1 | 72.7 | 172.3 | ||||||||||||||||||||||||||
Depreciation and amortization | 51.6 | (2.4 | ) | — | 49.2 | 39.7 | 51.2 | 100.3 | 80.5 | |||||||||||||||||||||||||||
Ratios | ||||||||||||||||||||||||||||||||||||
Gross margin (R$/ton) | 899 | 898 | 1,337 | 871 | 885 | 1,162 | ||||||||||||||||||||||||||||||
Gross margin (US$/ton) | 229 | 229 | 371 | 231 | 230 | 339 | ||||||||||||||||||||||||||||||
Operating margin (R$/ton) | (44 | ) | (60 | ) | 420 | (95 | ) | (77 | ) | 244 | ||||||||||||||||||||||||||
Operating margin (US$/ton) | (11 | ) | (15 | ) | 116 | (25 | ) | (20 | ) | 71 | ||||||||||||||||||||||||||
EBITDA margin (R$/ton) | 239 | 210 | 626 | 190 | 200 | 461 | ||||||||||||||||||||||||||||||
EBITDA margin (US$/ton) | 61 | 54 | 174 | 50 | 52 | 135 | ||||||||||||||||||||||||||||||
Number of employees | 1,884 | 1,884 | 1,918 | 1,941 | 1,884 | 1,918 | ||||||||||||||||||||||||||||||
16
Table of Contents
ULTRAGAZ
BALANCE SHEET
In millions of Reais | JUN 19 Post Adjustments | IFRS 16 Adjustments | JUN 19 | JUN 18 | MAR 19 | |||||||||||||||
OPERATING ASSETS | ||||||||||||||||||||
Trade receivables | 427.5 | — | 427.5 | 381.4 | 412.8 | |||||||||||||||
Non-current trade receivables | 18.1 | — | 18.1 | 39.2 | 22.5 | |||||||||||||||
Inventories | 120.4 | — | 120.4 | 108.3 | 102.9 | |||||||||||||||
Taxes | 84.9 | — | 84.9 | 86.5 | 89.5 | |||||||||||||||
Escrow deposits | 220.6 | — | 220.6 | 213.1 | 220.1 | |||||||||||||||
Other | 57.0 | — | 57.0 | 61.9 | 61.6 | |||||||||||||||
Right to use assets | 126.5 | (126.5 | ) | — | — | — | ||||||||||||||
Property, plant and equipment / Intangibles | 938.5 | 13.5 | 952.0 | 968.1 | 945.2 | |||||||||||||||
TOTAL OPERATING ASSETS | 1,993.5 | (113.0 | ) | 1,880.5 | 1,858.4 | 1,854.8 | ||||||||||||||
OPERATING LIABILITIES | ||||||||||||||||||||
Suppliers | 97.7 | — | 97.7 | 71.2 | 73.2 | |||||||||||||||
Salaries and related charges | 94.2 | — | 94.2 | 99.3 | 79.7 | |||||||||||||||
Taxes | 9.2 | — | 9.2 | 10.8 | 8.1 | |||||||||||||||
Judicial provisions | 117.9 | — | 117.9 | 111.1 | 115.3 | |||||||||||||||
Leases payable | 163.2 | (114.8 | ) | 48.4 | — | — | ||||||||||||||
Other accounts payable | 107.1 | — | 107.1 | 129.7 | 123.0 | |||||||||||||||
TOTAL OPERATING LIABILITIES | 589.4 | (114.8 | ) | 474.6 | 422.0 | 399.4 | ||||||||||||||
INCOME STATEMENT
In million of Reais | Quarter | Semester | ||||||||||||||||||||||||||||||
| 2Q19 Post Adjustments | IFRS 16 Adjustments | Corporate | 2Q19 | 2Q18 | 1Q19 | 1H19 | 1H18 | |||||||||||||||||||||||||
Net sales | 1,772.5 | — | — | 1,772.5 | 1,764.9 | 1,640.2 | 3,412.7 | 3,390.8 | ||||||||||||||||||||||||
Cost of products and services sold | (1,550.0 | ) | (0.3 | ) | — | (1,550.3 | ) | (1,543.6 | ) | (1,432.3 | ) | (2,982.6 | ) | (2,975.9 | ) | |||||||||||||||||
Gross profit | 222.5 | (0.3 | ) | — | 222.2 | 221.4 | 207.9 | 430.1 | 414.9 | |||||||||||||||||||||||
Operating expenses | ||||||||||||||||||||||||||||||||
Selling | (105.7 | ) | (0.1 | ) | — | (105.8 | ) | (83.7 | ) | (107.8 | ) | (213.5 | ) | (165.5 | ) | |||||||||||||||||
General and administrative | (49.3 | ) | 0.0 | (2.7 | ) | (52.0 | ) | (51.0 | ) | (56.8 | ) | (108.8 | ) | (100.4 | ) | |||||||||||||||||
Other operating income (expenses) | (0.5 | ) | — | — | (0.5 | ) | 3.8 | 3.4 | 3.0 | (281.1 | ) | |||||||||||||||||||||
Gain (loss) on disposal of property, plant and equipment and intangibles | 0.3 | (0.0 | ) | — | 0.3 | (0.6 | ) | 0.9 | 1.2 | (1.4 | ) | |||||||||||||||||||||
Operating income (loss) | 67.4 | (0.3 | ) | (2.7 | ) | 64.3 | 89.9 | 47.6 | 112.0 | (133.6 | ) | |||||||||||||||||||||
Share of profit of subsidiaries, joint ventures and associates | (0.0 | ) | — | — | (0.0 | ) | (0.0 | ) | 0.0 | 0.0 | 0.0 | |||||||||||||||||||||
EBITDA | 120.6 | (7.3 | ) | (2.7 | ) | 110.6 | 148.2 | 97.0 | 207.6 | (21.9 | ) | |||||||||||||||||||||
Depreciation and amortization | 53.2 | (6.9 | ) | — | 46.3 | 58.3 | 49.3 | 95.6 | 111.7 | |||||||||||||||||||||||
Ratios | ||||||||||||||||||||||||||||||||
Gross margin (R$/ton) | 529 | 528 | 499 | 526 | 527 | 486 | ||||||||||||||||||||||||||
Operating margin (R$/ton) | 160 | 153 | 202 | 121 | 137 | (156 | ) | |||||||||||||||||||||||||
EBITDA margin (R$/ton) | 287 | 263 | 334 | 245 | 254 | (26 | ) | |||||||||||||||||||||||||
Number of employees | 3,478 | 3,478 | 3,587 | 3,508 | 3,478 | 3,587 | ||||||||||||||||||||||||||
17
Table of Contents
ULTRACARGO
BALANCE SHEET
In millions of Reais | JUN 19 Post Adjustments | IFRS 16 Adjustments | JUN 19 | JUN 18 | MAR 19 | |||||||||||||||
OPERATING ASSETS | ||||||||||||||||||||
Trade receivables | 33.4 | — | 33.4 | 36.3 | 47.5 | |||||||||||||||
Inventories | 5.9 | — | 5.9 | 5.9 | 5.9 | |||||||||||||||
Taxes | 14.8 | — | 14.8 | 17.7 | 4.8 | |||||||||||||||
Other | 16.3 | 0.2 | 16.5 | 22.0 | 17.7 | |||||||||||||||
Right to use assets | 246.9 | (246.9 | ) | — | — | — | ||||||||||||||
Property, plant and equipment / Intangibles / Investments | 1,214.3 | 10.1 | 1,224.4 | 1,095.5 | 1,199.0 | |||||||||||||||
TOTAL OPERATING ASSETS | 1,531.7 | (236.6 | ) | 1,295.1 | 1,177.2 | 1,274.9 | ||||||||||||||
OPERATING LIABILITIES | ||||||||||||||||||||
Suppliers | 26.9 | — | 26.9 | 23.6 | 28.9 | |||||||||||||||
Salaries and related charges | 19.8 | — | 19.8 | 18.6 | 17.9 | |||||||||||||||
Taxes | 6.5 | — | 6.5 | 6.9 | 6.9 | |||||||||||||||
Judicial provisions | 9.5 | — | 9.5 | 25.3 | 24.0 | |||||||||||||||
Leases payable | 239.3 | (239.3 | ) | — | — | — | ||||||||||||||
Other accounts payable¹ | 137.9 | — | 137.9 | 101.9 | 61.7 | |||||||||||||||
TOTAL OPERATING LIABILITIES | 439.8 | (239.3 | ) | 200.5 | 176.4 | 139.3 | ||||||||||||||
| ¹ | Includes the long term obligations with clients account and the extra amount related to the acquisition of Temmar, in the port of Itaqui and payables—indemnification clients and third parties |
INCOME STATEMENT
In million of Reais | Quarter | Semester | ||||||||||||||||||||||||||||||
| 2Q19 Post Adjustments | IFRS 16 Adjustments | Corporate | 2Q19 | 2Q18 | 1Q19 | 1H19 | 1H18 | |||||||||||||||||||||||||
Net sales | 126.0 | — | — | 126.0 | 126.6 | 126.5 | 252.6 | 242.5 | ||||||||||||||||||||||||
Cost of products and services sold | (60.1 | ) | (2.7 | ) | — | (62.8 | ) | (60.8 | ) | (58.9 | ) | (121.7 | ) | (119.6 | ) | |||||||||||||||||
Gross profit | 66.0 | (2.7 | ) | — | 63.2 | 65.7 | 67.7 | 130.9 | 122.9 | |||||||||||||||||||||||
Operating expenses | ||||||||||||||||||||||||||||||||
Selling | (1.9 | ) | — | — | (1.9 | ) | (2.0 | ) | (1.7 | ) | (3.6 | ) | (3.8 | ) | ||||||||||||||||||
General and administrative | (28.5 | ) | — | (0.8 | ) | (29.4 | ) | (21.7 | ) | (27.7 | ) | (57.1 | ) | (48.5 | ) | |||||||||||||||||
Other operating income (expenses) | (49.7 | ) | — | — | (49.7 | ) | (1.3 | ) | (1.0 | ) | (50.6 | ) | (2.0 | ) | ||||||||||||||||||
Gain (loss) on disposal of property, plant and equipment and intangibles | 0.0 | (0.0 | ) | — | 0.0 | (0.0 | ) | 0.0 | 0.0 | (0.0 | ) | |||||||||||||||||||||
Operating income (loss) | (14.1 | ) | (2.7 | ) | (0.8 | ) | (17.7 | ) | 40.7 | 37.3 | 19.7 | 68.6 | ||||||||||||||||||||
Share of profit of subsidiaries, joint ventures and associates | 0.6 | — | — | 0.6 | 0.7 | 0.5 | 1.1 | 1.4 | ||||||||||||||||||||||||
EBITDA | 6.3 | (8.0 | ) | (0.8 | ) | (2.5 | ) | 54.2 | 52.2 | 49.7 | 95.2 | |||||||||||||||||||||
Depreciation and amortization | 19.8 | (5.2 | ) | — | 14.6 | 12.8 | 14.4 | 29.0 | 25.3 | |||||||||||||||||||||||
Ratios | ||||||||||||||||||||||||||||||||
Gross margin | 52.3% | 50.2% | 51.9% | 53.5% | 51.8% | 50.7% | ||||||||||||||||||||||||||
Operating margin | (11.2% | ) | (14.0% | ) | 32.2% | 29.5% | 7.8% | 28.3% | ||||||||||||||||||||||||
EBITDA margin | 5.0% | (2.0% | ) | 42.8% | 41.3% | 19.7% | 39.3% | |||||||||||||||||||||||||
Number of employees | 764 | 764 | 724 | 707 | 764 | 724 | ||||||||||||||||||||||||||
18
Table of Contents
EXTRAFARMA
BALANCE SHEET
In millions of Reais | JUN 19 Post Adjustments | IFRS 16 Adjustments | JUN 19 | JUN 18 | MAR 19 | |||||||||||||||
OPERATING ASSETS | ||||||||||||||||||||
Trade receivables | 176.1 | — | 176.1 | 154.2 | 176.9 | |||||||||||||||
Inventories | 578.2 | — | 578.2 | 465.8 | 562.3 | |||||||||||||||
Taxes | 181.3 | — | 181.3 | 109.2 | 155.0 | |||||||||||||||
Other | 23.5 | 0.8 | 24.3 | 19.5 | 27.0 | |||||||||||||||
Right to use assets | 484.4 | (484.4 | ) | — | — | — | ||||||||||||||
Property, plant and equipment / Intangibles | 1,137.8 | 29.0 | 1,166.9 | 1,136.3 | 1,162.7 | |||||||||||||||
TOTAL OPERATING ASSETS | 2,581.2 | (454.5 | ) | 2,126.7 | 1,885.1 | 2,084.0 | ||||||||||||||
OPERATING LIABILITIES | ||||||||||||||||||||
Suppliers | 180.4 | — | 180.4 | 150.5 | 171.8 | |||||||||||||||
Salaries and related charges | 55.9 | — | 55.9 | 52.7 | 48.2 | |||||||||||||||
Taxes | 25.4 | — | 25.4 | 21.9 | 24.7 | |||||||||||||||
Judicial provisions | 40.3 | — | 40.3 | 48.8 | 44.8 | |||||||||||||||
Leases payable | 461.6 | (461.6 | ) | — | — | — | ||||||||||||||
Other accounts payable | 16.1 | — | 16.1 | 12.3 | 13.6 | |||||||||||||||
TOTAL OPERATING LIABILITIES | 779.7 | (461.6 | ) | 318.1 | 286.2 | 303.0 | ||||||||||||||
INCOME STATEMENT
In million of Reais | Quarter | Semester | ||||||||||||||||||||||||||||||
| 2Q19 Post Adjustments | IFRS 16 Adjustments | Corporate | 2Q19 | 2Q18 | 1Q19 | 1H19 | 1H18 | |||||||||||||||||||||||||
Gross Revenues | 559.5 | — | — | 559.5 | 558.7 | 545.7 | 1,105.2 | 1,100.7 | ||||||||||||||||||||||||
Sales returns, discounts and taxes | (29.7 | ) | — | — | (29.7 | ) | (29.7 | ) | (29.3 | ) | (59.0 | ) | (60.1 | ) | ||||||||||||||||||
Net sales | 529.8 | — | — | 529.8 | 529.0 | 516.3 | 1,046.1 | 1,040.6 | ||||||||||||||||||||||||
Cost of products and services sold | (378.5 | ) | — | — | (378.5 | ) | (369.0 | ) | (374.8 | ) | (753.3 | ) | (727.5 | ) | ||||||||||||||||||
Gross profit | 151.3 | — | — | 151.3 | 160.1 | 141.5 | 292.8 | 313.1 | ||||||||||||||||||||||||
Operating expenses | (192.1 | ) | (3.8 | ) | (0.4 | ) | (196.4 | ) | (183.5 | ) | (189.1 | ) | (385.4 | ) | (353.2 | ) | ||||||||||||||||
Other operating income (expenses) | 16.4 | — | — | 16.4 | 0.1 | 8.8 | 25.2 | (0.1 | ) | |||||||||||||||||||||||
Gain (loss) on disposal of property, plant and equipment and intangibles | 2.4 | (0.1 | ) | — | 2.3 | (0.1 | ) | (2.4 | ) | (0.1 | ) | (0.4 | ) | |||||||||||||||||||
Operating loss | (22.0 | ) | (4.0 | ) | (0.4 | ) | (26.4 | ) | (23.5 | ) | (41.1 | ) | (67.5 | ) | (40.7 | ) | ||||||||||||||||
EBITDA | 17.6 | (21.9 | ) | (0.4 | ) | (4.7 | ) | (6.7 | ) | (21.2 | ) | (25.9 | ) | (6.9 | ) | |||||||||||||||||
Depreciation and amortization | 39.6 | (17.9 | ) | — | 21.7 | 16.8 | 20.0 | 41.6 | 33.8 | |||||||||||||||||||||||
Ratios¹ | ||||||||||||||||||||||||||||||||
Gross margin | 27.0% | 27.0% | 28.6% | 25.9% | 26.5% | 28.4% | ||||||||||||||||||||||||||
Operating margin | (3.9% | ) | (4.7% | ) | (4.2% | ) | (7.5% | ) | (6.1% | ) | (3.7% | ) | ||||||||||||||||||||
EBITDA margin | 3.1% | (0.8% | ) | (1.2% | ) | (3.9% | ) | (2.3% | ) | (0.6% | ) | |||||||||||||||||||||
Number of employees | 6,989 | 6,989 | 6,940 | 7,095 | 6,989 | 6,940 | ||||||||||||||||||||||||||
| ¹ | Calculated based on gross revenues |
19
Table of Contents
Publicly Traded Company
| CNPJ nr33.256.439/0001-39 | NIRE 35.300.109.724 |
MINUTES OF THE MEETING OF THE BOARD OF DIRECTORS
Date, Time and Location:
August 14, 2019, at 2:30 p.m., at the Company’s headquarters, located at Av. Brigadeiro Luís Antônio, nr 1,343—9th floor, in the City and State of São Paulo.
Attendance:
(i) Members of the Board of Directors undersigned; (ii) Chief Executive Officer, Mr. Frederico Pinheiro Fleury Curado; (iii) Investor Relations Officer, Mr. André Pires de Oliveira Dias; (iv) other executive officers of the Company; and (v) in relation to item 1 of the agenda, the coordinator of the Audit and Risks Committee, Mr. Flávio Cesar Maia Luz, and the president of the Fiscal Council, Mr. Geraldo Toffanello.
Agenda and Decisions:
| 1. | After having analyzed and discussed the performance of the Company in the second quarter of the current fiscal year, the respective financial statements were approved. |
| 2. | “Ad referendum” of the Annual General Shareholders’ Meeting that will analyze the balance sheet and financial statements of the fiscal year of 2019, the Directors approved the distribution of dividends, to be paid from the net income account of the current year, in the total amount of R$ 217,381,649.20 (two hundred and seventeen million, three hundred and eighty one thousand and six hundred forty nine Reais and twenty cents of Real). The holders of common shares of the Company are entitled to receive R$ 0.20 (twenty cents of Real) per share, excluding the shares held in treasury account at this date. |
| 3. | It has also been determined that dividends declared herein will be paid as of August 30, 2019 onwards, with no remuneration or monetary adjustment. The record date to establish the right to receive the approved dividends will be August 22, 2019 in Brazil and August 26, 2019 in the United States of America. |
| 4. | The members of the Board of Directors approved, in accordance with the stock-based compensation plan of the Company approved at the Company’s Extraordinary and Annual Shareholders’ General Meeting held on April 19, 2017 (“Plan”), on item 4.2 of the Plan: |
| (i) | the Company’s 3rd Restricted Share-based Compensation Program (“3r Restricted Shares Program”) which will be filed at the Company’s headquarters and stipulates, among other provisions, the institution of the usufruct of the equity rights of all shares, object of the 3rd Restricted Shares Program in favor of the participants; the vesting period of six years from the date of execution of the respective contract for the transfer of the ownership of the shares established in usufruct; and price and payment method to the participants; always in accordance with the provisions of the Plan. |
| (ii) | the list, which is filed at the Company’s headquarters, containing the participants designated to participate in the 3° Restricted Shares Program and the equivalent number of shares, as indicated by the Company’s People Committee, authorizing the execution of the agreements between the Company and each participant of the program hereby approved, according to the minutes filed at the Company’s headquarters, as well as the granting of usufruct, under the terms and conditions provided in each agreement. The members of the Board of Directors are not eligible for the approved program. |
| 5. | The members of the Board of Directors approved the fees proposal of KPMGAuditores Independentes to provide auditing services for the 2019 financial statements, as proposed by the Executive Board and the Company’s Audit and Risks Committee. |
| 6. | The Executive Officers of the Company are hereby authorized to practice all acts and to execute all and any document required to comply with the resolutions taken at this meeting. |
Table of Contents
(Minutes of the Meeting of the Board of Directors of Ultrapar Participações S.A., held on August 14, 2019)
As there were no further matters to be discussed, the meeting was closed, and the minutes of this meeting were written, read and approved by all the undersigned members present.
Pedro Wongtschowski– Chairman
Lucio de Castro Andrade Filho– Vice-chairman
Alexandre Gonçalves Silva
Ana Paula Janes Vescovi
Flávia Buarque de Almeida
Joaquim Pedro de Mello
Jorge Marques de Toledo Camargo
José Galló
José Maurício Pereira Coelho
Nildemar Secches
Table of Contents
 | ULTRAPAR PARTICIPAÇÕES S.A. Publicly-Traded Company CNPJ nº 33.256.439/0001- 39 NIRE 35.300.109.724 |
Distribution of dividends
Ultrapar Participações S.A. informs that the Board of Directors, at the meeting held today, approved the distribution of dividends, payable from the net earnings account for the fiscal year of 2019, in the amount of R$ 217,381,649.20 (two hundred and seventeen million, three hundred and eighty one thousand, six hundred and forty nine Reais and twenty cents), equivalent to R$ 0.20 per common share, to be paid from August 30, 2019 onwards, without remuneration or monetary adjustment.
The record date to establish the right to receive the dividend will be August 22, 2019 in Brazil, and August 26, 2019 in the United States. Therefore, from August 23, 2019 onwards, the shares will be traded“ex-dividend” on both the São Paulo Stock Exchange (B3 S.A. – Brasil, Bolsa, Balcão) and the New York Stock Exchange (NYSE).
São Paulo, August 14, 2019.
André Pires de Oliveira Dias
Chief Financial and Investor Relations Officer
ULTRAPAR PARTICIPAÇÕES S.A.
Table of Contents
SIGNATURES
Pursuant to the requirements of the Securities Exchange Act of 1934, the registrant has duly caused this report to be signed on its behalf by the undersigned, thereunto duly authorized.
Date: August 15, 2019
| ULTRAPAR HOLDINGS INC. | ||
| By: | /s/ Andre Pires de Oliveira Dias | |
Name: Andre Pires de Oliveira Dias Title: Chief Financial and Investor Relations Officer | ||
(Individual and Consolidated Interim Financial Information for the Three-Month Period Ended June 30, 2019 Report on Review of Interim Financial Information, 2Q19 Earnings release, Board of Directors Minutes, Notice to shareholders)