UNITED STATES SECURITIES AND EXCHANGE COMMISSION
Washington, D.C. 20549
Form 10-K
| þ | ANNUAL REPORT PURSUANT TO SECTION 13 OR 15(d) |
| | OF THE SECURITIES EXCHANGE ACT OF 1934 |
| | For the fiscal year ended December 31, 2013 |
or
| ¨ | TRANSITION REPORT PURSUANT TO SECTION 13 OR 15(d) |
| | OF THE SECURITIES EXCHANGE ACT OF 1934 |
Commission file number: 005-50580
INTERSECTIONS INC.
(Exact name of registrant as specified in the charter)
| | |
| Delaware | | 54-1956515 |
(State or other jurisdiction of incorporation or organization) | | (I.R.S. Employer Identification Number) |
| |
| 3901 Stonecroft Boulevard, | | 20151 |
| Chantilly, Virginia | | (Zip Code) |
| (Address of principal executive office) | | |
(703) 488-6100
(Registrant’s telephone number including area code)
Securities registered pursuant to Section 12(b) of the Act:
| | |
Title of Each Class | | Name of Exchange on Which Registered |
| Common Stock, $.01 par value | | The NASDAQ Stock Market LLC |
Securities registered pursuant to Section 12(g) of the Act:
None.
Indicate by check mark if the registrant is a well-known seasoned issuer, as defined in Rule 405 of the Securities Act. Yes ¨ No þ
Indicate by check mark if the registrant is not required to file reports pursuant to Section 13 or 15(d) of the Exchange Act. Yes ¨ No þ
Indicate by check mark whether the registrant (1) has filed all reports required to be filed by Section 13 or 15(d) of the Securities Exchange Act of 1934 during the preceding 12 months (or for such shorter period that the registrant was required to file such reports), and (2) has been subject to such filing requirements for the past 90 days. Yes þ No ¨
Indicate by check mark whether the registrant has submitted electronically and posted on its corporate Web site, if any, every Interactive Data File required to be submitted and posted pursuant to Rule 405 of Regulation S-T (§ 232.405 of this chapter) during the preceding 12 months (or for such shorter period that the registrant was required to submit and post such files). Yes þ No ¨
Indicate by check mark if disclosure of delinquent filers pursuant to Item 405 of Regulation S-K is not contained herein, and will not be contained, to the best of registrant’s knowledge, in definitive proxy or information statements incorporated by reference in Part III of this Form 10-K or any amendment to this Form 10-K. þ
Indicate by check mark whether the registrant is a large accelerated filer, an accelerated filer, a non-accelerated filer, or a smaller reporting company. See the definitions of “large accelerated filer,” “accelerated filer” and “smaller reporting company” in Rule 12b-2 of the Exchange Act. (Check one):
| | | | | | |
Large accelerated filer ¨ | | Accelerated filer þ | | Non-accelerated filer ¨ | | Smaller reporting company ¨ |
| | (Do not check if a smaller reporting company) |
Indicate by check mark whether the registrant is a shell company (as defined in Rule 12b-2 of the Act). Yes ¨ No þ
As of June 28, 2013, the aggregate market value of the common stock held by nonaffiliates of the registrant was approximately $83 million based on the last sales price quoted on The NASDAQ Global Market.
As of March 5, 2014, the registrant had 21,411,876 shares of common stock, $0.01 par value per share, issued and 18,231,445 shares outstanding, with 3,180,431 shares of treasury stock.
DOCUMENTS INCORPORATED BY REFERENCE
The information required by Part III of this report, to the extent not set forth herein, is incorporated herein by reference from Registrant’s definitive proxy statement to be filed within 120 days of December 31, 2013, pursuant to Regulation 14A under the Securities Exchange Act of 1934, for its 2014 annual meeting of stockholders to be held on or about May 14, 2014.
INTERSECTIONS INC.
TABLE OF CONTENTS
2
FORWARD-LOOKING STATEMENTS
Certain statements in this Annual Report on Form 10-K are forward-looking statements within the meaning of Section 27A of the Securities Act of 1933 and Section 21E of the Securities Exchange Act of 1934. These statements are subject to the safe harbor provisions of this legislation. We may, in some cases, use words such as “project,” “believe,” “anticipate,” “plan,” “expect,” “estimate,” “intend,” “should,” “would,” “could,” “will,” or “may,” or other words that convey uncertainty of future events or outcomes to identify these forward-looking statements.
These forward looking statements reflect current views about our plan, strategies and prospects, which are based upon the information currently available and on current assumptions. Even though we believe our expectations regarding future events are based on reasonable assumptions, forward-looking statements are not guarantees of future performance. Important factors could cause actual results to differ materially from our expectations contained in our forward-looking statements. These factors include, but are not limited to
| | • | | the impact of foreign, federal, state and local laws and regulation, specifically laws and regulation affecting consumer marketing, financial products and services, financial institutions, credit information and consumer credit; |
| | • | | the outcome and effect of the regulatory scrutiny of the sales, marketing and administration of add-on products by financial institutions, including the examinations of financial institutions by federal regulators and the investigation by the Consumer Financial Protection Bureau regarding our identity theft protection products; |
| | • | | whether financial institution clients continue to suspend billing of, or cancel, our subscribers; |
| | • | | whether our marketing with non-financial institution clients, our consumer direct marketing and our investments in new products and services will be successful in replacing the subscribers and revenue we continue to lose through cancellations and decreased marketing by financial institutions; |
| | • | | the concentration of our products and services; |
| | • | | the concentration of our suppliers and clients; |
| | • | | our ability to continue our business and operations strategy, including growth through existing channels, products and services, development of new channels, products and services, investments in new technology and acquisition, and investments; |
| | • | | the demand for our services; |
| | • | | our ability to maintain acceptable margins; |
| | • | | our ability to maintain secure systems; |
| | • | | our ability to control costs; |
| | • | | the impact of competition; |
| | • | | our ability to attract and retain qualified personnel; and |
| | • | | the possibility that we may not make further dividend payments. |
There are a number of important factors that could cause actual results to differ materially from the results anticipated by these forward-looking statements. These important factors include those that we discuss under the caption “Risk Factors.” You should read these factors and other cautionary statements as being applicable to all related forward-looking statements wherever they appear. If one or more of these factors materialize, or if any underlying assumptions prove incorrect, our actual results, performance or achievements may vary materially from any future results, performance or achievements expressed or implied by these forward-looking statements. We have no intention and undertake no obligation to publicly update any forward-looking statements, whether as a result of new information, future events or otherwise. See “Item 1A, Risk Factors” for further discussion.
3
PART I
We are a leading provider of subscription based consumer protection services in the United States and Canada. Our services help consumers understand and monitor their credit profiles and other personal information and protect themselves against identity theft or fraud. We also provide subscription based insurance and membership services. We have three reportable operating segments with continuing operations through the year ended December 31, 2013. Our Consumer Products and Services segment includes our identity theft protection and credit information management, data breach response, and insurance and membership products and services. Consumer Products and Services accounted for approximately 99% of our revenue in the year ended December 31, 2013. Our Bail Bonds Industry Solutions segment includes the software management solutions for the bail bond industry provided by our subsidiary Captira Analytical. Our Market Intelligence segment includes our market intelligence platform provided by our subsidiary Intersections Business Intelligence Services under the Zumetrics® brand. Prior to the second quarter of 2013, our Market Intelligence services were included in our Online Brand Protection segment along with our Net Enforcers subsidiary. In the three months ended June 30, 2013, we ceased operations at Net Enforcers. On March 10, 2014, we made the determination to cease ongoing operations at our subsidiary, Intersections Business Intelligence Services (D/B/A Zumetrics®). These operations are expected to wind down and cease during the three months ending June 30, 2014. We plan to classify Zumetrics® as a discontinued operation at the time it meets the requirements under U.S. GAAP and thereafter will no longer have a Market Intelligence segment.
Our consumer products and services historically have been offered primarily through relationships with clients. Most of our current subscribers for our products and services were acquired through our financial institution clients. We also offer our products and services through clients in other industries, including Internet service providers, retailers and e-commerce companies. In Canada, our products and services are offered through a marketing and distribution relationship with a Canadian company to the customers of financial institution and non-financial institution clients. In recent years, we have added a greater share of new subscribers by marketing directly to consumers through our IDENTITY GUARD® brand and other brands. We conduct our consumer direct marketing primarily through online affiliates, search engine marketing and broadcast media. We also may market through other channels, including direct mail, print marketing, telemarketing and email. We also market our IDENTITY GUARD® products in conjunction with relationships outside the financial services industry.
Through our subsidiary, i4c Innovations, we plan in 2014 to launch VOYCETM, a new platform and service for pet owners. VOYCETM is wearable technology for pets that contains patented technology designed to capture key vital signs and other wellness indicators. Subscribers to this platform will have access to the results, as well as expert content from leading pet experts, to allow them to make informed decisions when it comes to their pets’ health and well-being and share key wellness information with their veterinarians. We believe VOYCETM uniquely provides a combination of health data monitoring for pets and customized information for pet owners. To date, start up, research and development expenses for i4c and VOYCETM have been included in our Consumer Products and Services segment.
We were incorporated in Delaware in 1999. Through our predecessor companies, we have been offering consumer protection services since 1996. Intersections Insurance Services, through its predecessor companies, has been offering consumer products and services since 1982. Our principal executive offices are located at 3901 Stonecroft Boulevard, Chantilly, Virginia 20151 and our telephone number is (703) 488-6100. Our web site address is www.intersections.com. We make available on this web site at www.intersections.com, under “Investors and Media,” free of charge, our annual reports on Form 10-K, our quarterly reports on Form 10-Q, our current reports on Form 8-K, Forms 3, 4 and 5 filed by our directors and executive officers and various other SEC filings, including amendments to these reports, as soon as reasonably practicable after we electronically file or furnish such reports to the SEC.
We also make available on our web site our Corporate Governance Guidelines and Principles, Code of Business Conduct and Ethics, and Statement of Policy with Respect to Related Person Transactions, and the charters of our Audit Committee, Compensation Committee, Nominating and Corporate Governance Committee, and Risk Management Committee. This information is also available by written request to Investor Relations at
4
our executive office address listed above. The information on our web site, or on the site of our third-party service provider, is not incorporated by reference into this report. Our web site address is included here only as an inactive technical reference.
Consumer Products and Services
Our Services and Subscribers
Our identity theft protection and credit information management products and services provide multiple benefits to consumers, including access to their credit reports, credit monitoring, educational scores, credit education, reports and monitoring of additional information, identity theft recovery services, identity theft cost reimbursement insurance, and software and other technology tools and services. An individual consumer subscription may include access to some or all of these benefits. Our membership and insurance products and services are offered by our subsidiary, Intersections Insurance Services, and include accidental death and disability and property and casualty insurance and access or purchasing programs for healthcare, home, auto, financial and other services and information. We also offer breach response services to organizations responding to compromises of sensitive personal information. We help these clients notify the affected individuals and we provide the affected individuals with identity theft recovery and identity theft protection monitoring services.
Our products and services are offered to consumers by us or our clients principally on a monthly subscription basis. Subscription fees are generally billed directly to the subscriber’s credit card, debit card, mortgage bill or demand deposit account by our clients, but may be billed by us in our consumer direct business and in some other circumstances. The prices to subscribers of various configurations of our products and services range generally from $4.99 to $25.00 per month. As a means of allowing customers to become familiar with our services, our subscriptions typically are offered with trial, delayed billing or guaranteed refund periods.
A substantial number of subscriptions in our products and services are canceled each year. Because there is an investment cost to acquire a new subscriber and produce initial fulfillment materials, subscribers typically must be retained for a number of months in order to cover these costs. Not all subscribers are retained for a sufficient period of time to achieve positive cash flow returns on these investment costs.
The substantial majority of our subscribers historically have been obtained through relationships with financial institutions in the United States and Canada. In most of these relationships, we provided customized products, services, consumer experiences, and billing, delivery and other policy implementation to meet the requirements of our financial institution clients. We have invested significant time and money over the years in meeting these requirements. We also have made significant investments in the development of advanced product features, and worked to have our clients adopt these products. In recent years, a greater proportion of our subscribers have been obtained through consumer direct marketing under our IDENTITY GUARD® brand, where we have greater control over the product specifications. We believe that the products and services sold under our IDENTITY GUARD® brand typically represent some of the most feature rich products offered in our industry, at higher than industry average price points. We also market IDENTITY GUARD® products at lower price points, which we believe provide more extensive features than comparably priced offerings of our competitors.
Our Marketing
Our services are or have been marketed to potential subscribers and non-subscriber customers through a variety of marketing channels, including direct mail, outbound telemarketing, inbound telemarketing, inbound customer service and account activation calls, email, mass media and the Internet. Some of our marketing arrangements with our clients have called for us to fund marketing activity, and others have called for our clients to fund the marketing. The mix between our company-funded and client-funded marketing programs varies from year to year based upon our and our clients’ strategies, and may drive considerable period to period changes in our operating performance and metrics. Under our financial institution client arrangements, however, most marketing has been managed and conducted by our financial institution clients, even though in some cases we may have funded the marketing.
5
We historically have depended upon a few large financial institutions in the United States for a significant portion of our new subscriber additions and our revenue. In 2011 and 2012, approximately 70% of both our new subscribers and our Consumer Products and Services segment revenue were derived from agreements with U.S. financial institutions. In 2013, approximately 28% of our new subscribers and approximately 65% of our Consumer Products and Services segment revenue were derived from agreements with U.S. financial institutions. Revenue from subscribers obtained through our largest client, Bank of America, as a percentage of Consumer Products and Services segment revenue, constituted approximately 52% in 2011, 47% in 2012 and 43% in 2013. Bank of America and our other major financial institution clients have suspended or terminated their marketing of our products, and most other marketing through financial institutions has been reduced, suspended or terminated. We believe this is due to a number of factors, including regulatory scrutiny of the sales, marketing and administration of add-on products by financial institutions and changes in the financial institutions’ strategies. As a result, our new subscriber additions were 48% lower in 2013 as compared to 2012 despite growth in new subscriber additions from consumer direct and non-financial institution clients.
We have increased spending on consumer direct marketing in recent years, resulting in growth in revenue and new subscribers primarily for our IDENTITY GUARD® and other consumer direct brands. Revenue for our consumer direct business has grown at a compound annual growth rate in excess of 21% over the four years ending December 31, 2013, from $24.0 million in 2010 to over $42.0 million in 2013. We conduct our consumer direct marketing primarily through online affiliates, search engine marketing, and print and broadcast media. We also may market through other channels, including direct mail, outbound telemarketing, inbound telemarketing and email. We also market our IDENTITY GUARD® products in conjunction with relationships outside the financial services industry. In some cases, we market directly to the consumer using brands we own other than IDENTITY GUARD®. We anticipate continuing to devote an increasing proportion of our new product development, new business development and marketing resources to our consumer direct business, and specifically to the IDENTITY GUARD® brand, in an effort to sustain and increase the revenue growth rate for this unit. We also anticipate continuing to develop non-financial institution marketing and distribution relationships for our IDENTITY GUARD® brand and other brands.
Our Clients
Our client arrangements are distinguished from one another primarily by the allocation between us and the client of the economic risk and reward of the marketing campaigns. The general characteristics of each arrangement are described below, although the arrangements with particular clients may contain unique characteristics:
| | • | | Direct marketing arrangements: Under direct marketing arrangements, we bear most of the new subscriber marketing costs and pay our client a commission for revenue derived from subscribers. These commissions could be payable upfront in a lump sum on a per newly enrolled subscriber basis, periodically over the life of a subscriber, or through a combination of both. These arrangements generally result in negative cash flow over the first several months after a program is launched due to the upfront nature of the marketing investments. In some arrangements, we pay the client a service fee for access to the client’s customers or billing of the subscribers by the client, and we may reimburse the client for certain of its out-of-pocket marketing costs incurred in obtaining the subscriber. Even in a direct marketing arrangement, some marketing channels may entail limited or no marketing expenses. In those cases, we generally pay higher commissions to our clients compared to channels where we incur more substantial marketing expenses. In addition to these direct marketing arrangements with clients, the financial results we report under direct marketing includes our consumer direct marketing, which is independent of these client arrangements. |
| | • | | Indirect marketing arrangements: Under indirect marketing arrangements, our client bears the marketing expense and pays us a service fee or percentage of the revenue. Indirect marketing arrangements also include some clients who pay us fees for operational services including but not limited to fulfillment events, information technology development hours or customer service activities. Because the subscriber acquisition cost is borne by our client under these arrangements, our revenue per subscriber |
6
| | is typically lower than under direct marketing arrangements. Indirect marketing arrangements generally provide positive cash flow earlier than direct arrangements. The majority of our non-subscriber customers are acquired under indirect marketing relationships that primarily generate little or no revenue per customer for us. |
The classification of a client relationship as direct or indirect is based on whether we or the client pay the marketing expenses. Our accounting policies for revenue recognition, however, are not based on the classification of a client arrangement as direct or indirect. We look to the specific client arrangement to determine the appropriate revenue recognition policy, as discussed in detail in Note 2 to our consolidated financial statements. In the past, we have purchased from clients certain customer portfolios, including the rights to future cash flows. We typically classify the post-purchase customer portfolio as a direct marketing arrangement regardless of how it may have been characterized prior to purchase because we receive all future revenues and bear all associated risks and expenses for these customers following the purchase transaction.
Our typical contracts for direct marketing arrangements, and some indirect marketing arrangements, provide that after termination of the contract we may continue to provide our services to existing subscribers, for periods ranging from two years to indefinite, substantially under the applicable terms in effect at the time of termination. Under certain of our agreements, however, including most indirect marketing arrangements, the clients may require us at any time to cease providing services under existing subscriptions. Clients under most contracts may also require us to cease providing services to their customers under existing subscriptions if the contract is terminated for material breach by us or based on various events such as certain legal or regulatory changes, a party’s bankruptcy or insolvency, or other events. Even in contracts under which we have a right to continue to provide our services to existing subscribers after termination, we often are substantially dependent on those clients to cooperate in allowing continued servicing, including continued billing by those clients.
We expect ongoing regulatory review and scrutiny of sales of add-on and other consumer financial products and services, including identity theft protection products, to continue to be a focus of the federal Consumer Financial Protection Bureau and other regulators. As a result, marketing of our products by our major financial institution clients, and most marketing by our other financial institution clients, has been reduced, suspended or terminated, and we do not know whether the marketing of our products by financial institutions will be resumed, or whether, if resumed, they will return to prior levels. Some financial institution clients also have suspended billing of or cancelled certain subscribers, and may suspend billing of or cancel other subscribers. We believe that these cancellations and suspensions are principally a result of regulatory actions or changes in the regulatory environment, as well as changes in the marketing and customer relationship strategies of our financial institution clients.
Our consumer direct business involves clients that typically require a lesser degree of customization in branding, product specifications, billing and other operational processes and policies than our historical financial institution clients. Our consumer direct business model also involves business relationships with new categories of business partners, such as Internet service providers, search engine operators, affiliate networks, and marketing agencies, which were not a part of our historical financial institution-centered business model.
Operations
Our operations platform for our consumer products and services, which consists principally of customer service, fulfillment, information processing and technology, is designed to serve the needs of both our clients and our subscribers. Our services are tailored to meet both our subscribers’ needs for protection and our clients’ requirements for branding and presentation, service levels, accuracy and security. Many of our clients routinely test the security of our operations and suggest areas for improvement. We believe our ongoing investment in operations offer a significant competitive advantage for us in our ability to produce high quality services in both online and offline environments while delivering high levels of both customer and client service and data security. We continue to invest in our consumer products and services operations in order to support a broader array of product offerings, launch new products and partners more quickly, and adapt to changes in the overall economy, such as the growth in mobile commerce.
7
Customer Service
We have designed our customer service for our consumer products and services to achieve high customer satisfaction by responding quickly to subscriber requests with value-added responses and solutions, while following client requirements for areas such as sales approaches, retention strategies and scripting. In addition, we work to gain customer satisfaction through our policy of selective recruiting, hiring, training, retaining and management of customer service representatives who are focused exclusively on identity theft protection and credit education services. Prior to working with subscribers, service representatives are required to complete an in-depth training program that focuses on the fundamentals of the credit industry, regulation, credit reporting and our products and services. This classroom training is then followed by a closely monitored on-the-job training program with assigned mentors and call simulations. Service representatives then continue to be monitored and receive feedback based on the standards of our quality assurance program. In addition to call quality, we are bound by client-driven metrics specified by our client agreements.
We maintain in-house customer care centers in Virginia, Illinois and New Mexico. Additionally, we may utilize the services of outsourced vendors with capacity for additional customer service.
Fulfillment
Our in-house mail generation and delivery capabilities for our consumer products and services are designed to provide full color customizable and branded material for our clients with prompt, high quality, secure and cost-effective delivery of subscribers’ personal data. Proprietary software creates consumer friendly presentation, tracks delivery at the page and image level and stores the consolidated credit data for member servicing. For the purpose of ensuring accuracy and security of subscribers’ personal data, credit reports are electronically inspected upon receipt and again before final delivery. Operational auditing of fulfillment events is also conducted regularly. We also make our services available to most subscribers via the Internet.
Information Technology
We continue to make significant investments in technology to enable continued growth in our subscriber base. This also allows us to provide flexible solutions for our subscribers and clients with a secure and reliable platform. Our customer resource management platform, which is the basis for our service delivery, integrates certain industry and application specific software. Since inception, we have contracted a portion of our credit data processing to Digital Matrix Systems, Inc. A portion of our web development is contracted to other third parties.
We employ a range of information technology solutions, physical controls, procedures and processes to safeguard sensitive data, and regularly evaluate those solutions against the latest available technology, industry standards and environmental conditions. We use respected third parties to review and test our security controls, we continue to be audited by our clients with positive feedback, and we have obtained PCI level 1 and Experian’s EI3PA compliance as tested by an independent provider. We also adopted the Financial Services Roundtable’s FISAP “Shared assessment program” and contracted with a security firm to audit us against those controls.
We have undertaken several projects for the purpose of ensuring that our infrastructure expands with client and subscriber needs. Our primary production systems are hosted at a secure, high-availability third party tier 1 data center in the Northern Virginia area. Our back office and online environments are designed with high volume processing in mind and are constructed to optimize performance, reliability, and scalability.
Data and Analytics Providers
Under our agreements with Equifax, Experian and TransUnion, we purchase data for use in providing our services to consumers. The Experian and TransUnion contracts may be terminated by them on 30 days and 60 days’ notice, respectively. The contract with Equifax expires on January 1, 2015. Each of these credit reporting agencies is a competitor of ours in providing credit information and identity theft protection services to consumers.
8
We have entered into contracts with several additional providers of data and analytics for use in our identity theft and fraud protection services, including new data sources, advanced tools and analytical capabilities, more timely notification of activities and more useable content. In certain contractual arrangements, we pay non-refundable license fees in exchange for the limited exclusive rights to use the data. We routinely review the effectiveness and cost of these exclusivity agreements in conjunction with our projected data usage and business forecasts. Our other consumer products and services are delivered by third party providers, including insurance companies, discount service providers and software distributors.
Competition
The markets for our Consumer Products and Services segment are highly competitive. A number of divisions or subsidiaries of large, well-capitalized firms with strong brand names operate in the industry. We compete with these firms to provide our services to our clients’ customers and our direct subscribers. We compete for these clients on the basis of product features, technological capabilities, reputation in the market, ability to offer client-branded solutions, flexible service configurations, high quality standards and price.
We believe that our principal competitors for our Consumer Products and Services segment include the following companies and their subsidiaries or affiliates: Equifax; Experian; TransUnion; Affinion; Fair Isaac; and Lifelock. Other competitors that we believe to be smaller also are in the market, and others may enter the market. We also purchase credit data from our competitors Equifax, Experian and TransUnion. One or more of them may decline to provide us all of the data or features that they may provide to consumers, which could have an adverse effect on our ability to compete for those consumers.
Market Intelligence
Our Services
Through our subsidiary, Intersections Business Intelligence Services (D/B/A Zumetrics®), we provide a cloud-based market intelligence platform that automatically collects and analyzes product-level e-commerce data for retailers and brand owners. Our platform provides our clients visibility into how their channel presence stacks up against the competition and alerts them of strategic shifts in the marketplace. Our services utilize proprietary technology and third party data sources to search e-commerce retail sites for instances of specific brands and/or products, categorize each instance and report e-commerce market findings back to our clients. Our services are typically priced as monthly subscriptions for a defined set of monitoring services. Prices for our services vary based upon the specific configuration of services purchased by each client and range from several hundred dollars per month to thousands of dollars per month. Prior to the second quarter of 2013, our Market Intelligence services were included in our Online Brand Protection segment along with our Net Enforcers subsidiary. We have since discontinued support for certain legacy services and ceased all business operations at Net Enforcers.
Our Marketing
We primarily use an internal sales force to market the services to brand owners or retailers. Clients purchase services based upon the need to monitor e-commerce promotions associated with their brand and products, our positive reputation in the marketplace, our combination of technology and operational solutions to Internet monitoring challenges, and the cost, quality and scope of our service offerings.
Our Clients
Our clients are typically brand owners or retailers. Generally, client contracts have terms of one year with automatic annual renewals. This segment’s operating results do not significantly impact our consolidated financial results.
9
Operations, Information Technology & Customer Service
Our platform provides our clients visibility into how their channel presence stacks up against the competition and alerts them of strategic shifts in the marketplace. Our services utilize proprietary technology and third party data sources to search e-commerce retail sites for instances of specific brands and/or products, categorize each instance and report e-commerce market findings back to our clients. This segment’s primary offices are in Virginia.
Data and Analysis Providers
This segment primarily utilizes publicly available information in its service offerings, but also utilizes the services of data aggregators in some instances.
Competition
This segment has a number of competitors that offer brand protection services similar in whole or part its offerings. These competitors include Channel IQ, Revionics, and Upstream Commerce. In addition, this segment, at times, competes for business against internal client resources.
Bail Bonds Industry Solutions
Our Services
Through our subsidiary, Captira Analytical, we provide automated service solutions for the bail bonds industry. These services include data management, bookkeeping, accounting, reporting, and decision making tools which allow bail bondsmen, general agents and sureties to run their offices more efficiently, to exercise greater operational and financial control over their businesses, and to make better underwriting decisions. We believe these services are the only fully integrated suite of bail bonds management applications of comparable scope available in the marketplace today. These services are sold to retail bail bondsman on a “per seat” license basis plus additional transactional charges for various optional services. Additionally, this segment has developed a suite of services for bail bonds insurance companies, general agents and sureties which are sold on either a transactional or recurring revenue basis.
Our Marketing
This segment primarily markets its services through an internal sales force both directly to bail bondsmen and indirectly via bail bonds industry intermediaries such as trade associations, general agents, sureties and insurance companies. It has secured exclusive endorsements from the largest trade association in the bail bonds industry as well as several large general agents and sureties. The business is actively working with these industry intermediaries to market their services to affiliated retail bail bondsmen.
Our Clients
This segment’s clients are bail bonds industry participants including insurance companies, sureties, general agents and retail bail bondsmen. This segment’s operating results do not significantly impact our consolidated financial results.
Operations, Information Technology & Customer Service
This segment has custom developed its technology and operational processes based upon an in depth understanding of the operational activities of the bail bonds industry. The primary offices are located in New York and it outsources hosting and management of its operational technology platforms to a domestic third party data center provider located in Northern Virginia. Services are generally delivered to clients on a remote basis over the Internet via secure connections. Onsite support is sometimes provided to clients, particularly during initial data migration and account setup. This segment continues to invest in its operational and technology platforms to improve functionality, scalability and the security of its offerings.
10
Data and Analysis Providers
Among the functionality offered by this segment to its customers is the ability to retrieve reports and other data for use in evaluating and managing bail bonds and bail bond applications. To provide these reports, the business utilizes a combination of public and proprietary information and technology.
Competition
We believe that this segment is the only provider of an integrated suite of bail bonds industry office automation and decisioning tools of comparable scope. This segment competes in part with providers of a limited suite of bail bonds industry tools such as Creative Software Solutions, Bailbooks and others.
Government Regulation
Government laws and regulations that may affect our business include, but are not limited to, the following:
Our Consumer Products and Services
Our consumer products and services business is subject to the federal Fair Credit Reporting Act and similar state laws governing credit information. Our business also is subject to state and federal privacy laws, including the federal Gramm Leach Bliley Act and state laws governing the sharing or use of personal information. Our insurance products and services are subject to state insurance laws, and various other state laws also may apply to our consumer products and services.
Marketing and ongoing servicing of our consumer products and services are subject to various federal and state laws, depending on the circumstances, including the federal Telephone Consumer Protection Act, Telemarketing and Consumer Fraud and Abuse Prevention Act, CAN-SPAM Act, Electronic Fund Transfer Act, U.S. Card Act, and both federal and state laws prohibiting unfair, deceptive or abusive practices or requiring disclosure of information about various products and services. These laws may apply to us or our clients.
In addition, our credit reporting agency suppliers are subject to the federal Fair Credit Reporting Act, Gramm Leach Bliley Act, and other laws and regulations regarding credit information and privacy, and our other key suppliers also may be subject to those and other laws and regulations. In some cases our suppliers require us by contract to comply with these laws and regulations, which may directly or indirectly affect our ability to provide their data or technology as part of our products and services.
Our consumer business in Canada is subject to laws and regulations that are similar to but not the same as laws and regulations in the United States. Laws and regulations that may apply to our business in Canada include the federal Personal Information Protection and Electronic Documents Act and federal and provincial laws and regulations regarding credit information and marketing and other consumer protection laws and regulations.
Our financial institution clients are subject to federal laws and regulations that govern financial institutions and their affiliates, financial products, financial information privacy, financial accounts such as credit cards, debit cards, demand deposit accounts and mortgages, and payment systems and processes. Our financial institution clients are subject to oversight by the Office of the Comptroller of the Currency, Federal Deposit Insurance Corporation, Consumer Financial Protection Bureau and other federal or state regulatory agencies. In part based on the requirements of those regulatory agencies, our financial institution clients are required to exercise oversight of us, and often require us by contract to comply with certain of the laws and regulations that apply directly to them. We and some of our clients also are subject to state laws and regulations that primarily are enforced by individual state attorneys general, state banking agencies and state insurance departments.
For example, sales by financial institutions of add-on or ancillary products have been the subject of increasing scrutiny. We believe that the OCC, FDIC and CFPB are continuing to review financial institutions’ policies and practices with respect to add-on or ancillary products, and their management of third party suppliers
11
like us. The CFPB, OCC and FDIC have entered into public consent orders with Capital One Financial Corp., JP Morgan Chase Bank, N.A., Discover Bank and American Express, and their affiliates, regarding the sales of add-on products, including identity theft protection products. Some parts of these consent orders have focused on the sales and marketing of the products, and others have focused on billing practices with respect to certain consumers who were deemed to have received less than the full benefits of the products. Under these consent orders, financial institutions have agreed, among other things, to make restitution of fees collected from their customers, take other remedial actions and cease marketing of the applicable products until their compliance plans are approved by regulators. Although we were named as a product provider, along with other providers, in consent orders entered by the OCC with Capital One and Chase, the consent orders did not make any finding of wrongdoing by us. We expect that the regulators’ reviews of the sales of add-on products by financial institutions will continue, and may result in additional consent orders. We also believe that the CFPB is examining the sales of consumer direct products by our credit bureau suppliers. Certain state attorneys general also have brought enforcement actions against financial institutions regarding the sales of add-on products. We are not a party to those actions except for the single matter described in Item 3 below, “Legal Proceedings.”
On July 11, 2012, we received a Civil Investigative Demand from the CFPB requesting production of documents and answers to questions regarding the provision of “ancillary products related to credit card or deposit accounts.” We have been cooperating fully in the investigation, and have produced all or substantially all of the information requested by the CFPB. We also more recently received from the CFPB a request for voluntary production of certain additional information and are in the process of providing the requested information. The CFPB has not alleged a violation by us of any law or regulation.
Many of the laws in the United States and Canada that apply to us or our clients are the subject of revision and addition, the issuance of rules, regulations, guidance and interpretations by government agencies, and rulings and interpretations by courts and other tribunals. We incur significant costs to operate our business in compliance with these laws and regulations, and to make changes to our business as needed to comply with legal and regulatory changes. We have made and may continue to make changes to our business and operations as a result of changes with respect to these laws or regulations. These changes have increased our costs and reduced our revenue, and we may make further changes that have such effect. Further, scrutiny of the sales, marketing and administration of add-on products by regulators has resulted in the suspension or termination of most marketing of our products by financial institutions, suspension of billing of certain subscribers, and cancellation of certain subscribers.
Laws and Regulations Governing Our Other Segments
Our Market Intelligence business depends in part on federal and state laws and private policies governing intellectual property ownership and enforcement, access to information made available on the Internet, and competition. Changes in these laws or rules or how they are interpreted or implemented may adversely affect the ability of our Market Intelligence business to provide its services or result in expenses related to legal or regulatory enforcement.
Certain of Captira’s services are governed by various federal and state laws and regulations. These laws and regulations include the federal Fair Credit Reporting Act and similar state laws governing consumer reports, and the federal Gramm Leach Bliley Act and other federal and state privacy laws and regulations.
Intellectual Property
We consider certain of our processes, systems, methodologies, databases, tangible and intangible materials, software and trademarks to be proprietary. We rely on a combination of trade secret, patent, copyright, trademark and other laws, license agreements and non-disclosure, non-competition and other contractual provisions, and technical measures, to protect our proprietary and intellectual property rights. Certain features and functions of our products and services use intellectual property under license from several third parties, which we at times sub-license to our clients and others. We may depend on certain of those licenses to operate parts of our products. When we market our services in client-branded programs, we rely on licenses from our clients to use their trademarks.
12
Financial Information About Segments and Geographic Areas
See Note 23 to the consolidated financial statements in Item 8 of this Annual Report on Form 10-K for financial information about our segments and geographic areas.
Employees
As of December 31, 2013, we had 644 employees. Our future performance depends significantly on the continued service of our key personnel. None of our employees are covered by collective bargaining arrangements. We believe our employee relations are good.
We believe the following risk factors, as well as the other information contained in this Annual Report on Form 10-K, are material to an understanding of our company. Any of the following risks as well as other risks and uncertainties discussed in this Annual Report on Form 10-K could have a material adverse effect on our business, financial condition, results of operations or prospects and cause the value of our stock to decline. Additional risks and uncertainties that we are unaware of, or that are currently deemed immaterial, also may become important factors that affect us.
We are dependent upon our consumer products and services for substantially all of our revenue, and our revenue from those products and services is expected to continue to decrease.
Approximately 99% of our revenue in 2013 was derived from our Consumer Products and Services segment. We expect to remain dependent on revenue from our consumer products and services for the foreseeable future. Any significant loss of revenue from our Consumer Products and Services segment could have a material adverse impact on our business, results of operations and financial condition.
For example, marketing of our products by our major financial institution clients, and most marketing by our other financial institution clients, has been reduced, suspended or terminated, and some financial institution clients also have suspended billing of or cancelled certain subscribers, and may suspend billing of or cancel other subscribers. As a result, our revenue and earnings decreased in 2013, and we expect our revenue and earnings to continue to decrease in 2014 as compared to 2013.
We must replace the subscribers we lose and, if we fail to do so, our revenue and subscriber base will continue to decline.
We lose a substantial number of subscribers each year in the ordinary course of our business. We have lost subscribers in prior years, and may lose subscribers in future years, due to numerous factors, including:
| | • | | changing subscriber preferences; |
| | • | | subscriber dissatisfaction; |
| | • | | cancellations required by clients, or for regulatory or other reasons; |
| | • | | competitive price pressures; |
| | • | | general economic conditions; |
| | • | | credit card or other billing vehicle declines; and |
| | • | | credit card or other billing vehicle turnover. |
13
We depend upon a small number of large financial institutions in the United States to derive most of our revenue. A continued reduction in revenue derived from these large financial institutions will likely reduce our revenue and earnings in 2014.
We depend upon a small number of large financial institutions in the United States to derive a significant portion of our revenue. For example, in 2011 and 2012, approximately 70% of both our new subscribers and our Consumer Products and Services segment revenue were derived from agreements with U.S. financial institutions. In 2013, approximately 28% of our new subscribers and approximately 65% of our Consumer Products and Services segment revenue were derived from agreements with U.S. financial institutions.
Most marketing of our products by financial institution clients, however, has been reduced, suspended or terminated, and we do not know whether the marketing of our products by financial institutions will be resumed, or whether, if resumed, they will return to prior levels. Some financial institution clients also have suspended billing of or cancelled certain subscribers, and may suspend billing of or cancel other subscribers. As a result our total number of subscribers has declined, and we expect it to continue to decline. If we fail to replace these subscribers, our total number of subscribers and revenue will continue to decline, which could have a material adverse impact on our business, results of operations and financial condition.
We are also substantially dependent on these financial institutions to continue to service our subscribers. If those financial institutions do not perform their contractual obligations with respect to the servicing of existing subscribers, or otherwise do not cooperate in our continued servicing of those subscribers, including billing of those subscribers, or, where permitted under our contracts, they terminate our servicing of the subscribers, we could lose significant current sources of revenue, and those losses could have a material adverse effect on our business, financial condition and results of operations.
We derive most of our revenue from subscribers acquired under our contracts with our clients, and we could lose access to prospective subscribers and current subscribers if one or more of our clients were to reduce or cease the marketing of our services, cancel subscribers, terminate their contracts with us, or fail to support the ongoing servicing of the subscribers.
Under most of our client agreements, our clients may reduce or cease marketing of our products at their discretion. If one or more of our clients reduces or ceases the marketing of our products, we would lose access to additional subscribers and sources of revenue.
Our clients also may terminate their contracts with us. Our typical contracts for direct marketing arrangements, and some indirect marketing arrangements, provide that after termination of the contract we may continue to provide our services to existing subscribers, for periods ranging from two years to indefinite, substantially under the applicable terms in effect at the time of termination. Under certain of our agreements, however, including most indirect marketing arrangements, the clients may require us to cease providing services under existing subscriptions.
Clients under most contracts, whether direct or indirect, may also require us to cease providing services to their customers under existing subscriptions if the contract is terminated for material breach by us or based on various events such as certain legal or regulatory changes, a party’s bankruptcy or insolvency, or other events. Further, upon termination or expiration of a client contract, we may enter into a transition agreement or other agreement with the client that modifies the original terms of the agreement. In some cases our ability to continue our services and receive the related revenue may depend upon ongoing cooperation by our clients, including the use of certain billing systems or processes. Our clients or others could take certain actions or make changes after the termination or expiration of our agreements which could materially interfere with or limit our ability to continue to provide our services to those subscribers or receive the related revenue.
14
Our new subscriber additions were 48% lower in 2013 compared to 2012, due to the reduction, suspension or termination of most marketing of our products by our financial institution clients, and some financial institution clients also have suspended billing of certain subscribers, and may suspend billing of or cancel other subscribers. For example:
| | • | | Bank of America has ceased marketing of our services, and the portions of our agreement with Bank of America under which our identity theft protection services were being marketed to prospective subscribers expired on December 31, 2011. We continue to provide our services to the subscribers we acquired through Bank of America before December 31, 2011, subject to normal attrition. We believe that our agreement with Bank of America provides for us to continue to service those subscribers substantially under the applicable terms currently in effect. Under our agreement, however, Bank of America may require us to cease providing services to the existing subscribers if the agreement is terminated for material breach by us or based on various events such as certain legal or regulatory changes. We do not know whether Bank of America will agree with our interpretation of our agreement, and there can be no guarantee that Bank of America will continue to provide the cooperation necessary to continued servicing of the subscribers, including continued billing of the subscribers. Bank of America has indicated that it has been responding to inquiries from regulatory authorities regarding identity theft protection products, which we believe include our products and products from a different provider. |
| | • | | In October 2013, our servicing of subscribers under our indirect marketing agreement with Chase terminated. As a result, we ceased to service and receive revenue related to approximately 615 thousand subscribers and 216 thousand non-subscriber customers. |
| | • | | In January 2014, Capital One sent us a notice of its decision to terminate its indirect marketing agreement with us, effective no sooner than July 31, 2014. Under the notice, Capital One reserves the right to extend the date of termination of the agreement beyond July 31, 2014, and at a later time to notify us of the cancellation of existing subscriptions, which may occur before, on or after July 31, 2014. |
Our consumer products and services business is subject to a wide range of U.S. and foreign regulation and scrutiny, which could have a material adverse effect on our business, results of operations and financial condition.
Our consumer products and services business is subject to a wide variety of U.S. federal and state laws and regulations, including, among others, laws governing credit information, consumer privacy and marketing and servicing of consumer products and services. Our business in Canada is subject to similar laws.
Our financial institution clients are subject to federal laws and regulations that govern financial institutions and their affiliates, financial products, financial information privacy, financial accounts such as credit cards, debit cards, demand deposit accounts and mortgages, and payment systems and processes. Our financial institution clients are subject to oversight by the OCC, FDIC, CFPB and other federal or state regulatory agencies. In part based on the requirements of those regulatory agencies, our financial institution clients are required to exercise oversight of us, and often require us by contract to comply with certain of the laws and regulations that apply directly to them. We and some of our clients also are subject to state laws and regulations that primarily are enforced by individual state attorneys general, state banking agencies and state insurance departments.
Many of the laws in the United States and Canada that apply to us or our clients are the subject of revision and addition, the issuance of rules, regulations, guidance and interpretations by government agencies, and rulings and interpretations by courts and other tribunals. We incur significant costs to operate our business in compliance with these laws and regulations, and to make changes to our business as needed to comply with legal and regulatory changes. We have made and may continue to make changes to our business and operations as a result of changes with respect to these laws or regulations. These changes have increased our costs and reduced our revenue, and we may make further changes that have such effect. Further, scrutiny of the sales, marketing and administration of add-on products by regulators has resulted in the suspension or termination of most marketing of our products by financial institutions, suspension of billing of certain subscribers, and cancellation of certain subscribers.
15
The effect of this combination of laws, regulations, reviews and proceedings is difficult to estimate, and any or a combination of them, or changes to them, may have a material adverse effect on our business, results of operations or financial condition.
We and our financial institution clients are subject to legal actions and proceedings, including consumer class action litigation and government agency investigations and enforcement actions, which could require us to incur substantial expenses, pay damages, fines and penalties, lose subscribers and clients, and change our business practices, any of which could have a material adverse effect on our business, results of operations and financial condition.
Because we operate in a highly regulated industry and must comply with various foreign, federal, state and local laws, we may be subject to claims and legal proceedings in the ordinary course of our business. These legal actions may include private class action lawsuits, and investigations and enforcement actions by governmental authorities. We cannot predict the outcome of any actions or proceedings, and the cost of responding to investigations or claims and defending against private actions, investigations or government enforcement actions might be material. If we are found liable in any actions or proceedings, or are required to indemnify our clients or others for their expenses or liability, we may have to pay substantial damages, fines and penalties, lose subscribers or clients, suffer harm to our reputation, and be required change the way we conduct our business, any of which may have a material adverse effect on our business, results of operations and financial condition. In addition, as a result of these investigations, proceedings or actions, or other regulatory oversight, we or our financial institution clients may take remedial actions including the issuing of refunds or cancellations of subscribers, and our clients may seek indemnification or contribution from us relating to those remedial actions.
For example, sales by financial institutions of add-on or ancillary products have been the subject of increasing scrutiny by federal and state regulators. We believe that the OCC, FDIC and CFPB are continuing to review our financial institution clients’ policies and practices with respect to add-on or ancillary products, and their management of third party suppliers like us. The CFPB, OCC and FDIC have entered into public consent orders with Capital One, Chase, Discover and American Express regarding the sales of add-on products, including identity theft protection products. Some parts of these consent orders have focused on the sales and marketing of the products, and others have focused on billing practices with respect to certain consumers who were deemed to have received less than the full benefits of the products. Under these consent orders, financial institutions have agreed, among other things, to make restitution of fees collected from their customers, take other remedial actions and cease marketing of the applicable products until their compliance plans are approved by regulators. Although we were named as a product provider, along with other providers, in consent orders entered by the OCC with Capital One and Chase, the consent orders did not make any finding of wrongdoing by us.
We expect that the regulators’ reviews of the sales of add-on products by financial institutions will continue, and may result in additional consent orders. We also believe that the CFPB is examining the sales of consumer direct products by our credit bureau suppliers. Certain state attorneys general also have brought enforcement actions against financial institutions regarding the sales of add-on products. We are not a party to those actions except for the single matter described in Item 3 below, “Legal Proceedings.”
On July 11, 2012, we received a Civil Investigative Demand from the CFPB requesting production of documents and answers to questions regarding the provision of “ancillary products related to credit card or deposit accounts.” We have been cooperating fully in the investigation, and have produced all or substantially all of the information requested by the CFPB. We also more recently received from the CFPB a request for voluntary production of certain additional information and are in the process of providing the requested information. The CFPB has not alleged a violation by us of any law or regulation. The costs of responding to these investigations and requests may have an adverse effect on our financial condition, and any finding that we have violated a law or regulation, filing of an enforcement action against us, or entry by us into a consent order or settlement, may have a material adverse effect on our business, operations and financial condition.
16
Reserves we establish or charges we incur for private or governmental legal proceedings may adversely affect our results of operations, cash flow and financial condition.
We periodically analyze currently available information about current legal proceedings and make a determination of the probability of loss and provide a range of possible loss when we believe that sufficient and appropriate information is available. We accrue a liability for those contingencies where the incurrence of a loss is probable and the amount can be reasonably estimated. If a loss is probable and a range of amounts can be reasonably estimated but no amount within the range is a better estimate than any other amount in the range, then the minimum of the range is accrued. We do not accrue a liability when the likelihood that the liability has been incurred is believed to be probable but the amount cannot be reasonably estimated or when the likelihood that a liability has been incurred is believed to be only reasonably possible or remote. For contingencies where an unfavorable outcome is reasonably possible and the impact could potentially be material, we disclose the nature of the contingency and, where feasible, an estimate of the possible loss or range of loss.
We may determine in the future that we must establish a reserve or incur a charge for all or a portion of our legal proceedings for which we did not previously establish a reserve or take a charge. We also may determine that we are required to increase a reserve if we determine that the reserve we previously established was inadequate, or record an additional charge if we incur liabilities in excess of reserves that we have previously recorded. Such charges or reserves could be significant and could materially and adversely affect our results of operations, cash flow and financial condition.
If we lose our ability to purchase data from any of the three major credit reporting agencies, each of which is a competitor of ours, demand for our services could decrease.
We rely on the three major credit reporting agencies, Equifax, Experian and TransUnion, to provide us with essential data for our consumer identity theft protection and credit management services under short-term agreements. Each of the three major credit reporting agencies is a competitor of ours in providing credit information directly to consumers, and may decide to stop supplying data to us. Any interruption, deterioration or termination of our relationship with one or more of the three credit reporting agencies would be disruptive to our business and could cause us to lose subscribers, which could have a material adverse effect on our business or financial results.
We are substantially dependent on third party suppliers and service providers, and our clients and their service providers, to market and provide our products, and failures by those third parties or our clients could harm our business and prospects.
Our consumer products and services are substantially dependent on third party suppliers, including providers of credit and other data, analytics, and software and other technology. Our failure to develop and maintain these third party relationships could harm our ability to provide our products and services. We also rely on various third party service providers, including outsourced telemarketing vendors, customer service providers, network and systems hosts and other providers. In some arrangements we rely on our clients or their service providers, including the marketing of products, billing of subscribers and customer service.
Failure of any of our third party suppliers or service providers, or our clients or their service providers, to satisfy our contracts or requirements, or to comply with applicable laws and regulations, could cause us to lose subscribers or clients, expose us to private lawsuits or governmental investigations or proceedings, cause us to be liable for damages and fines, or harm our reputation. Any such event could have a material adverse impact on our business, results of operations or financial condition.
A failure of any of the insurance companies that underwrite the insurance products or related benefits provided as part of our consumer products and services, or refusal by those insurance companies to provide the expected insurance, could harm our business.
Certain of our consumer products and services include or depend on insurance products, or are dependent on group insurance policies under which the customers for our products and services are the insureds. The current
17
and expected economic climate may cause financial instability among one or more of those insurance companies. Any failure of any of those insurance companies, or refusal by them to provide the expected insurance, could require us to remove the affected insurance from our products and services, cause us to lose customers or clients, or expose us to liability claims by our customers or clients.
If we experience system failures or interruptions in our telecommunications or information technology infrastructure, our revenue could decrease and our reputation could be harmed.
Our operations depend upon our ability to protect our telecommunications and information technology systems against damage or system interruptions from natural disasters, technical failures and other events beyond our control. We receive credit and other data electronically, and this delivery method is susceptible to damage, delay or inaccuracy. A significant portion of our business involves telephonic customer service as well as mailings, both of which depend upon the data generated from our computer systems. Unanticipated problems with our telecommunications and information technology systems may result in a significant system outage or data loss, which could interrupt our operations and have a material adverse impact on our business, including the loss of revenue, clients or customers or exposure to liability claims.
Our failure to protect private data could cause us to expend capital and resources to protect against future security breaches or other unauthorized access, result in litigation costs, liability and damage to our reputation and business.
We collect, distribute and protect nonpublic and sensitive private data in delivering our services. We are subject to the risk that unauthorized users might access that data or human error might cause the wrongful dissemination of that data. If we experience a security breach or other unauthorized access to information, the integrity of our services may be affected. We continue to incur significant costs to protect against security breaches or other mishaps and to minimize problems if a data breach were to occur. Moreover, any public perception that we mishandle private information could adversely affect our ability to attract and retain clients and subscribers, or maintain key supplier relationships, and could subject us to legal claims and liability and damage to our reputation. In addition, unauthorized third parties might alter information in our databases, which would adversely affect both our ability to market our services and the credibility of our information.
Our business is dependent on the secure operation of our website and systems as well as the operation of the Internet generally. Our business involves the storage and transmission of users’ proprietary information, and security breaches could expose us to a risk of loss or misuse of this information, litigation, and potential liability. A number of large Internet companies have disclosed security breaches, some of which have involved intentional attacks. We may not have the resources or technical sophistication to anticipate or prevent rapidly evolving types of cyber attacks. Attacks may be targeted at us, our financial institution and other clients, or both. If an actual or perceived breach of our security occurs, client, customer and/or supplier perception of the effectiveness of our security measures could be harmed and we could lose clients, customers and/or suppliers. Actual or anticipated attacks and risks may cause us to incur increasing costs, including costs to deploy additional personnel and protection technologies, train employees, and engage third party experts and consultants.
A person who is able to circumvent our security measures could misappropriate our or our subscribers’ proprietary information, cause interruption in our operations, damage our computers or those of our users, or otherwise damage our reputation and business. Any compromise of our security could result in a violation of applicable privacy and other laws, significant legal and financial exposure, damage to our reputation, and a loss of confidence in our security measures, which could harm our business.
We rely on encryption and authentication technology licensed from third parties to provide the security and authentication to effectively secure transmission of confidential information, including customer payment card numbers. Advances in computer capabilities, new discoveries in the field of cryptography or other developments may result in the technology used by us to protect transaction data being breached or compromised. Data breaches can also occur as a result of non-technical issues.
18
Under payment card rules and our contracts with our card processors and clients, if there is a breach of payment card information that we store, we could be liable to the payment card issuing banks for their cost of issuing new cards and related expenses. In addition, if we fail to follow payment card industry security standards, even if there is no compromise of customer information, we could incur significant fines or lose our ability to give customers the option of using payment cards to fund their payments or pay their fees. If we were unable to accept payment cards, our business would be seriously damaged.
Our servers are also vulnerable to computer viruses, physical or electronic break-ins, and similar disruptions, including “denial-of-service” type attacks. We may need to expend significant resources to protect against security breaches or to address problems caused by breaches. Security breaches, including any breach by us or by persons with whom we have commercial relationships that result in the unauthorized release of our users’ personal information, could damage our reputation and expose us to a risk of loss or litigation and possible liability.
We expect to incur substantial expenses as we enter new businesses, develop new products or increase our consumer direct marketing, which will cause our expenses to increase and our earnings to decline on a quarterly basis.
We are committing significant resources to our strategic efforts to develop new products and services and increase our consumer direct marketing. For example, we plan in 2014 to launch VOYCETM, a new platform and service for pet owners, and may launch new identity theft protection, privacy, insurance and other products and services for consumers, and also intend to invest in increased marketing of our services directly to consumers through our IDENTITY GUARD® brand and other brands. As a result of the commitments and investments, as well as declining revenue due to a decrease in marketing by our financial institution clients, and suspension or cancellation of billing or subscribers, we expect our revenue and earnings to continue to decline in 2014. Our continued investment in the consumer direct business or new investment in other new businesses or products may not be successful in generating future revenue or profits on our projected timeframes or at all.
We may launch products and services in fields and markets that are new to us, and may be exposed to new risks that could impede the success of our efforts or result in unforeseen liabilities or expenses.
Our VOYCE™ product will require the manufacturing and distribution of electronic goods including wireless communications technology, which is not a form of product creation or distribution in which we previously have engaged. As a result, we will be required to learn and comply with laws and regulations that are new to us, and manage risks that are new to us, including manufacturing supply chain management and product distribution. We also are exploring or developing other new products and services, including new privacy and insurance products, which also may involve new risks. If we are unable to manage these new risks, our efforts to develop and launch new products and services may not be successful, or we may incur unforeseen liabilities or expenses, including product liability, regulatory violation, intellectual property infringement or contract claims, which may have a material adverse effect on our business and financial condition.
We may lose subscribers and customers and significant revenue if our existing products and services become obsolete, or if we fail to introduce new products and services with broad appeal or fail to do so in a timely or cost-effective manner.
Our growth depends upon developing and successfully introducing new products and services that generate client and consumer interest, including new data sources, advanced tools and analytical capabilities, more timely notification of activities and more useable content. We have made or may make significant investments in these new products and services, including development costs and prepayment of royalties and fees to third party providers. Although we have a limited history of developing and introducing products and services outside the areas of identity theft protection and consumer credit information, we are currently developing or introducing new products and services in other areas. Our failure to develop, introduce or expand successfully our products and services could have a material adverse effect on our business and prospects.
19
We may lose subscribers and significant revenue if our subscribers cease to maintain the accounts through which they are billed for our products and services, or our clients change their billing or credit practices or policies, including access to certain billing systems and processes.
Most of our subscribers are billed for our products and services through accounts with our clients, such as credit card, debit card, demand deposit and mortgage accounts. Market factors such as a refinancing or account cancellation could cause a loss of subscribers. Client decisions, such as changes in their credit card billing practices or policies, may result in our inability to bill for our products and services, which also may result in a loss of subscribers. These subscriber losses may have a material adverse impact on our revenue.
In addition, subscribers acquired through several of our clients, including Bank of America and certain of our other largest clients, are billed using certain systems and processes managed or supported by our clients. Changes by our clients to those billing systems or processes, or discontinuance of them, may cause us a material loss of revenue and subscribers.
Our senior secured credit agreement provides our lenders with a first-priority lien against substantially all of our assets and contains financial covenants and other restrictions on our actions, and it could therefore limit our operational flexibility or otherwise adversely affect our financial condition.
We may fail to comply with the covenants in our credit agreement as a result of, among other things, changes in our results of operations or general economic changes. These covenants may restrict our ability to engage in transactions that would otherwise be in our best interests. Failure to comply with any of the covenants under our credit agreement could result in a default under the facility, which could cause the lenders to accelerate the timing of payments and exercise their lien on substantially all of our assets, which would have a material adverse effect on our business, operations, financial condition and liquidity. In addition, because our credit agreement bears interest at variable interest rates, increases in interest rates would increase our cost of borrowing, resulting in a decline in our net income and cash flow, which could cause the price of our common stock to decline.
We may be unable to meet our future capital requirements to grow our business, which could adversely impact our financial condition and growth strategy.
We may need to raise additional funds in the future in order to operate and expand our business. There can be no assurance that additional funds will be available on terms favorable to us, or at all. Our inability to obtain additional financing could have a material adverse effect on our financial condition.
We depend on key members of our management and other key personnel.
We depend on key members of our management. We do not maintain key person life insurance on our senior management. Loss of one or more of these key individuals, particularly our chairman and chief executive officer or other executive officers, could have a material adverse effect on our business. We also believe that our future success will depend, in part, on our ability to attract, retain and motivate skilled managerial, marketing and other personnel, and a failure to attract and retain those personnel may have a material adverse impact on our business.
We may not be able to consummate acquisitions or investments that are accretive or which improve our financial condition.
A component of our strategy going forward includes selectively acquiring assets or businesses or making strategic investments in order to increase cash flow and earnings or diversify or expand our product offerings. This depends upon a number of factors, including our ability to identify acceptable acquisition or investment candidates, consummate transactions on favorable terms, successfully integrate acquired assets and obtain financing to support our growth and expansion, and many other factors beyond our control. We may encounter delays or other problems or incur substantial expenses in connection with seeking acquisitions that could
20
negatively impact our operating results. In connection with any acquisitions or investments, we could issue stock that would dilute our stockholders, incur substantial debt, assume known, contingent and unknown liabilities and/or reduce our cash reserves. Acquisitions may also require material infrequent charges and could result in adverse tax consequences, impairment of goodwill, substantial depreciation and amortization, increased interest expense, deferred compensation charges, and the amortization of amounts related to deferred compensation and identifiable purchased intangible assets, any of which could negatively impact our results of operations in one or more future periods.
We may not realize planned benefits of our acquisitions or investments.
In connection with our acquisitions, we may experience unforeseen operating difficulties as we integrate the acquired assets and businesses into our existing operations. These difficulties may require significant management attention and financial resources that would otherwise be available for the ongoing development or expansion of existing operations. Any acquisition or investments by us involves risks, including:
| | • | | unexpected losses of key employees, customers and suppliers of the acquired operations; |
| | • | | difficulties in integrating the financial, technological and management standards, processes, procedures and controls of the acquired businesses with those of our existing operations; |
| | • | | challenges in managing the increased scope, geographic diversity and complexity of our operations; |
| | • | | establishing the internal controls and procedures that we are required to maintain under the Sarbanes-Oxley Act of 2002; and |
| | • | | mitigating contingent or assumed liabilities or unexpected costs. |
We may not realize planned benefits of our membership agreement or other customer portfolio acquisitions, or be able to complete such acquisitions.
We may acquire membership agreements or other customer portfolios from our clients or others. Although we receive certain representations, warranties and covenants from the seller, we have no guarantee that attrition of customers will not exceed expected levels for reasons that do not require the seller to indemnify us. If attrition exceeds our expectations, the revenue expected from these portfolios or membership agreements otherwise is less than we expected, or our costs of servicing these customers are higher than we expected, we may lose some or all of our investment. In addition, legal or regulatory requirements, availability of financing or other factors may prevent us from consummating acquisitions of membership agreements or customer portfolios offered by our clients, which may have an adverse impact on our relationships with those clients or our continued receipt of revenue from those portfolios or agreements.
Fluctuations of foreign currency values may adversely affect our reported revenue, results of operations and financial condition
We provide our consumer products and services to consumers in Canada. The fluctuations of these foreign currencies relative to the U.S. Dollar may adversely affect our reported revenue, results of operations and financial condition, and there can be no guarantee that our strategies to reduce these risks will be successful.
Our stock price fluctuates and may continue to fluctuate significantly over a short period of time.
In the past, our stock price has declined in response to period-to-period fluctuations in our revenue, expenses and operating results. In certain periods where our historical operating results have been below the expectations of analysts and investors, the price of our common stock has decreased significantly following earnings announcements. In addition, our stock price may continue to fluctuate significantly in the future as a result of a number of factors, many of which are beyond our control, including:
| | • | | the timing and rate of subscription cancellations and additions; |
| | • | | the decrease in our revenue, earnings and subscriber base in 2013 and the anticipated reduction in our revenue and earnings in 2014; |
21
| | • | | the loss of a key client or a change by a key client in the marketing or servicing of our products and services; |
| | • | | enforcement actions or other proceedings against us or our client; |
| | • | | our ability to introduce new and improve existing products and services on a timely basis; |
| | • | | the success of competing products and services by our competitors; |
| | • | | the demand for consumer subscription services generally; |
| | • | | amount and frequency of future dividend payments and share repurchases, if any; |
| | • | | the ability of third parties to support our services; and |
| | • | | general economic conditions. |
We cannot assure you that we will continue to declare dividends or have the available cash to make dividend payments.
The declaration, amount and payment of any dividends is at the sole discretion of our board of directors. We are not obligated under any applicable laws, our governing documents or any contractual agreements or otherwise to declare or pay any dividends. Our board of directors may take into account, among other things, general economic conditions, our financial condition and operating results, our available cash and current and anticipated cash needs, capital requirements, plans for expansion, tax, legal, regulatory and contractual restrictions and implications, including under our outstanding debt documents, and such other factors as our board of directors may deem relevant in determining whether to declare or pay any dividend. As a result, if we do not declare or pay dividends you may not receive any return on an investment in our common stock unless you sell our common stock for a price greater than that which you paid for it.
Insiders have substantial control over us and could delay or prevent a change in corporate control, which may harm the market price of our common stock.
Loeb Holding Corp., which is controlled by two of our directors, owns approximately 40% of our outstanding common stock. In addition, our executive officers and other directors own shares of our outstanding common stock. These stockholders may have interests that conflict with the other public stockholders. If these stockholders act together, they could have the ability to significantly influence or control the management and affairs of our company and potentially determine the outcome of matters submitted to our stockholders for approval, including the election and removal of directors and any sale of the company. Accordingly, this concentration of ownership may harm the market price of our common stock by delaying, discouraging or preventing a change in control transaction.
We may be subject to assertions that taxes must be collected based on sales and use of our services in various states, which could expose us to liability and cause material harm to our business, financial condition and results of operations.
Whether sales of our services are subject to state sales and use taxes is uncertain, due in part to the nature of our services and the relationships through which our services are offered, as well as changing state laws and interpretations of those laws. One or more states may seek to impose sales or use tax or other tax collection obligations on us, whether based on sales by us or our resellers or clients, including for past sales. A successful assertion that we should be collecting sales or other related taxes on our services could result in substantial tax liabilities for past sales, discourage customers from purchasing our services, discourage clients from offering or billing for our services, or otherwise cause material harm to our business, financial condition and results of operations.
22
Our Market Intelligence and Bail Bonds Industry Solutions segments are subject to various laws and regulations that may have an adverse effect on our business.
Our Market Intelligence and Bail Bonds Industry Solutions segments subject to a wide variety of federal and state laws and regulations. These laws are subject to change and addition, and various governmental authorities in the United States and Canada have the authority to make and change regulations and rules under these laws. We incur significant costs to operate our business and monitor our compliance with these laws, regulations and rules, and these costs may be material. Any changes to the existing applicable laws, regulations or rules, or any determination that other laws, regulations or rules are applicable to us, could increase our costs or impede our ability to provide our products and services. These changes may have a material adverse effect on our business and results of operations. In addition, we may incur material costs in responding to government investigations or proceedings, or private actions, and if we are found to have violated any of these laws or regulations we could incur liability and lose customers, which may have a material adverse impact on our business and results of operations.
We may be subject to intellectual property rights claims, which may be costly to defend, could require the payment of damages and could limit our ability to use certain technologies.
Companies in the Internet, technology, data management, wireless communications, wearable technology and other industries own large numbers of patents, copyrights, trademarks and trade secrets, and frequently enter into litigation based on allegations of infringement or other violations of intellectual property rights. The technologies we own or license from others may not be able to withstand challenge by the owners of any third-party claims or rights. Any intellectual property claims, with or without merit, could be time consuming, and expensive to litigate or settle, and could divert management resources and attention. An adverse determination also could prevent us from offering our products and services to others and may require that we procure substitute products or services for these customers and clients and could require us to pay damages, which could have a material adverse impact on our business and results of operations.
With respect to any intellectual property rights claim, we may have to pay damages or stop using technology found to be in violation of a third party’s rights. We may have to seek a license for the technology, which may not be available on reasonable terms and may significantly increase our operating expenses. The technology also may not be available for license to us at all. As a result, we may also be required to develop alternative non-infringing technology, which could require significant effort and expense. If we cannot license or develop technology for the infringing aspects of our business, we may be forced to limit our product and service offerings and may be unable to compete effectively.
Competition could reduce our market share or decrease our revenue.
We operate in highly competitive businesses. Our competitors may provide products and services comparable or superior to those provided by us, or at lower prices, adapt more quickly to evolving industry trends or changing market requirements, increase their emphasis on products and services similar to ours, enter the markets in which we operate or introduce competing products and services. Any of these factors could reduce our market share or decrease our revenue. Many of our competitors have greater financial and other resources than we do.
Several of our competitors offer products and services that are similar to, or that directly compete with, our products and services. Competition for new subscribers for our consumer products and services is also intense. Even after developing a client relationship, we compete within the client organization with other consumer products and services for appropriately targeted customers because client organizations typically have only limited capacity to market third-party products and services like ours. We also compete directly with the credit reporting agencies that control the credit file data that we use to provide our services. One or more of these credit reporting agencies may not make available to us or our customers the same features that they may offer in direct competition with us.
23
| ITEM 1B. | UNRESOLVED STAFF COMMENTS |
None.
The following is a summary of our principal leased facilities:
| | | | | | | | | | |
Location | | Approx.
Square Feet | | | Segment | | Lease
Expiration | |
Chantilly, VA(1) | | | 98,310 | | | Consumer Products and Services | | | 2019 | |
Chantilly, VA | | | 7,349 | | | Consumer Products and Services | | | 2019 | |
Rio Rancho, NM | | | 28,000 | | | Consumer Products and Services | | | 2018 | |
Altavista, VA | | | 27,317 | | | Consumer Products and Services | | | 2015 | |
Albany, NY | | | 5,244 | | | Bail Bonds Industry Solutions | | | 2015 | |
Fairfax, VA | | | 6,373 | | | Market Intelligence | | | 2015 | |
| (1) | Includes expansion space. |
We also own a 2,670 square foot facility located in Arlington Heights, Illinois, which is used by our Consumer Products and Services segment for office space, an inbound call center and fulfillment center.
We believe that our facilities will support our future business requirements or that we will be able to lease additional or replacement space, if needed, on reasonable terms. Certain properties are utilized by all of our segments and in such cases the property is reported in the segment with highest usage.
On May 21, 2012, Intersections Insurance Services Inc. was served with a putative class action complaint (filed on May 14, 2012) against Intersections Insurance Services Inc. and Bank of America in the United States District Court for the Northern District of California. The complaint alleges various claims based on the sale of an accidental death and disability program. Intersections Insurance Services Inc. and Bank of America moved to dismiss the claims and to transfer the action to the United States District Court for the Central District of California. The motion to transfer to the Central District was granted, and Intersections Insurance Services Inc. and Bank of America then moved to dismiss the claims. The motion to dismiss was granted with prejudice on October 1, 2012. The plaintiffs filed a notice of appeal, which appeal remains pending before the United States Court of Appeals for the Ninth Circuit.
On January 14, 2013, Intersections Insurance Services Inc. was served with a complaint (filed on October 2, 2012) on behalf of the Office of the West Virginia Attorney General in the Circuit Court of Mason County, West Virginia. The complaint alleges violations of West Virginia consumer protection laws based on the marketing of unspecified products. Intersections Insurance Services Inc. filed a motion for a more definite statement of the claims, which motion was denied by the court in December 2013. On January 21, 2014, Intersections Insurance Services Inc. filed an answer.
In September 2013, a putative class action lawsuit was filed in Illinois in Cook County Circuit Court against Intersections Inc., Intersections Insurance Services Inc., and Ocwen Financial Corporation, alleging violations of the Telephone Consumer Protection Act. The case was removed to the United States District Court for the Northern District of Illinois, Eastern Division. On October 30, 2013, Plaintiffs filed a stipulation voluntarily dismissing, without prejudice, Intersections Inc. from the case. On November 14, 2013, the plaintiffs filed an amended complaint against Intersections Insurance Services Inc. and Ocwen Loan Servicing, LLC. On November 27, 2013, Intersections Insurance Services Inc. and Ocwen Loan Servicing, LLC jointly filed a Motion to Dismiss and to Strike Class Allegations. On March 5, 2014, the motion was granted in a part, and denied in part.
24
| ITEM 4. | MINE SAFETY DISCLOSURES |
Not applicable.
Executive Officers of the Registrant
Our executive officers are as follows:
| | | | | | |
Name | | Age | | | Position |
Michael R. Stanfield | | | 63 | | | Chairman, Chief Executive Officer and Director |
Madalyn C. Behneman | | | 50 | | | Senior Vice President, Chief Accounting Officer |
Dean Brown | | | 49 | | | Chief Information Officer |
Neal B. Dittersdorf | | | 54 | | | Executive Vice President, Chief Legal Officer |
John G. Scanlon | | | 46 | | | Executive Vice President, Chief Financial Officer |
Steven A. Schwartz | | | 53 | | | President, Identity Guard |
Steve Sjoblad | | | 64 | | | Chief Marketing Strategist |
Joseph F. Vacca | | | 43 | | | President, Partner Solutions |
Michael R. Stanfieldco-founded CreditComm, the predecessor to Intersections, in May 1996 and has been Chairman, Chief Executive Officer and a Director since that time. Mr. Stanfield joined Loeb Partners Corporation, an affiliate of Loeb Holding Corporation, in November 1993 and served as a Managing Director at the time of his resignation in August 1999. Mr. Stanfield has been involved in management information services and direct marketing through investments and management since 1982, and has served as a director of CCC Information Services Inc. and BWIA West Indies Airways. Prior to beginning his operational career, Mr. Stanfield was an investment banker with Loeb, Rhoades & Co. and Wertheim & Co. He holds a B.B.A. in Business Administration from Emory University and an M.B.A. from Columbia University.
Madalyn C. Behnemanhas served as our Senior Vice President of Finance and Accounting for more than five years and is our Chief Accounting Officer. Prior to joining Intersections, Ms. Behneman previously held various finance and accounting positions at other companies, including MCI, Inc. and NII Holdings, Inc. from April 1989 until June 2004. Ms. Behneman was employed on the audit staff of Ernst & Young and is a CPA. She earned her Bachelor of Science degree in Accounting from Virginia Tech.
Dean Brownhas served as our Chief Information Officer since August 2012. Mr. Brown previously served as the Chief Information Officer at Advance America from February 2009 until joining Intersections in August 2012. From 2005 to 2007 Mr. Brown held the role of Chief Information Officer at Upromise, Inc. and in 2006 assumed the responsibilities of COO and EVP. Prior to that Mr. Brown worked for Capital One Financial Corporation from 1996 to 2005, where he held various IT management responsibilities. Mr. Brown holds a B.S. in Business Information Systems from Virginia Commonwealth University, and a Masters of Project Management certificate from George Washington University.
Neal B. Dittersdorfhas served as our Executive Vice President and Chief Legal Officer since 2004. Mr. Dittersdorf served as our Senior Vice President and General Counsel from February 2003 until July 2004. Prior to joining Intersections, Mr. Dittersdorf was a law firm partner, General Counsel of Credit Management Solutions Inc. and a Trial Attorney with the U.S. Department of Justice, Civil Division. Mr. Dittersdorf holds a B.A. from Brandeis University and a J.D. from the New York University School of Law.
John G. Scanlonhas served as our Executive Vice President and Chief Financial Officer since November 2010. Mr. Scanlon served as Chief Operating Officer, Business Services from December 2007 until November 2010 and was promoted to Executive Vice President in January 2007. Mr. Scanlon joined Intersections in November 2006 from National Auto Inspections, LLC where he was President and Chief Operating Officer. Mr. Scanlon previously served as a senior executive at Capital One Financial Corporation from 2000 to 2006, where he held general management responsibility for the company’s direct banking business. Mr. Scanlon holds a B.S. in Business Administration from Georgetown University, and a Masters of Management degree from the J.L. Kellogg Graduate School of Management at Northwestern University.
25
Steven A. Schwartz has served as our President, Identity Guard since July of 2012. Mr. Schwartz has served as our Executive Vice President, Consumer Services and Senior Vice President, Consumer Services since joining Intersections in July of 2003. Prior to joining Intersections, Mr. Schwartz held senior marketing, client and business management positions at The Motley Fool and Time-Life Inc. Mr. Schwartz holds a B.S. from Syracuse University and an M.B.A. from Rutgers University.
Steve Sjoblad serves as our Chief Marketing Strategist and was President of our subsidiary Captira Analytical since 2005, prior to the acquisition of that company by Intersections. Prior to joining Intersections, Mr. Sjoblad held the position of Chief Marketing Officer at Fair Isaac Corporation, where he managed their Global Consumer Services division and was a member of the Fair Isaac Executive Committee.
Joseph F. Vaccahas served as our President of Partner Solutions since June 2013 after serving as Senior Vice President of Client Services since December 2009. Prior to that Mr. Vacca held a number of positions at Intersections, including Vice President Consumer Solutions. Prior to joining Intersections in 2000, Mr. Vacca has worked extensively in marketing and product management, including positions at EduCap, a leading private student loan company, and the Student Loan division of Wells Fargo. Mr. Vacca is a member of the Direct Marketing Association and the International Association of Privacy Professionals. Mr. Vacca holds a B.S. from Shepherd University and a M.B.A. from Frostburg State University.
26
PART II
| ITEM 5. | MARKET FOR REGISTRANT’S COMMON EQUITY, RELATED STOCKHOLDER MATTERS AND ISSUER PURCHASES OF EQUITY SECURITIES |
The Company’s common stock trades on The NASDAQ Global Market under the symbol “INTX.” As of February 28, 2014, the common stock was held by approximately 53 stockholders of record and an estimated 4,133 additional stockholders whose shares were held for them in street name or nominee accounts. Set forth below are the high and low closing sale prices per share and dividends declared on our common stock as reported on the NASDAQ Composite Tape.
| | | | | | | | | | | | |
| | | Sales Price
per Share | | | Dividends Paid
per Common Share | |
| | | High | | | Low | | |
2013 Quarter ended: | | | | | | | | | | | | |
March 31, 2013 | | $ | 11.05 | | | $ | 9.18 | | | $ | 0.20 | |
June 30, 2013 | | $ | 10.46 | | | $ | 8.54 | | | $ | 0.20 | |
September 30, 2013 | | $ | 10.03 | | | $ | 8.73 | | | $ | 0.20 | |
December 31, 2013 | | $ | 9.07 | | | $ | 7.18 | | | $ | 0.20 | |
| | | | | | | | | | | | |
| | | Sales Price
per Share | | | Dividends Paid
per Common Share | |
| | | High | | | Low | | |
2012 Quarter ended: | | | | | | | | | | | | |
March 31, 2012 | | $ | 13.61 | | | $ | 11.08 | | | $ | 0.20 | |
June 30, 2012 | | $ | 15.85 | | | $ | 10.84 | | | $ | 0.20 | |
September 30, 2012 | | $ | 16.52 | | | $ | 10.30 | | | $ | 0.20 | |
December 31, 2012 | | $ | 10.39 | | | $ | 8.15 | | | $ | 0.70 | |
On November 30, 2012, we paid a one-time special cash dividend of $0.50 per share, as well as our regular quarterly cash dividend of $0.20 per share, on our common stock. Our Board of Directors authorized a cash dividend of $0.20 per share on our common stock, payable on April 3, 2014, to stockholders of record as of March 20, 2014.
Dividends are considered quarterly by the board of directors and may be paid only when approved by the board of directors. Future dividends, if any, will depend on, among other things, our results of operations, capital requirements and such other factors as our board of directors may, in its discretion, consider relevant.
In April 2005, our Board of Directors authorized a share repurchase program under which we can repurchase our outstanding shares of common stock from time to time, depending on market conditions, share price and other factors. As of December 31, 2013, we had approximately $16.9 million remaining under our share repurchase program, all of which we are permitted to make under our amended Credit Agreement without lender consent (assuming compliance with the other covenants of the agreement). The repurchases may be made on the open market, in block trades, through privately negotiated transactions or otherwise, and the program may be suspended or discontinued at any time.
We did not repurchase any shares during the three months ended December 31, 2013.
27
The following graph shows the cumulative total return as of December 31, 2013 of a $100 investment made on December 31, 2008 in our common stock (with dividends, if any, reinvested), as compared with similar investments based on the value of the NASDAQ Composite and the Dow Jones US General Finance Index. The peer group was determined by our inclusion in the NASDAQ as a publicly traded company and the Dow Jones US General Finance Index covers companies that primarily provide commercial, industrial and professional services to businesses and governments not classified elsewhere. The stock performance shown below is not necessarily indicative of future performance.
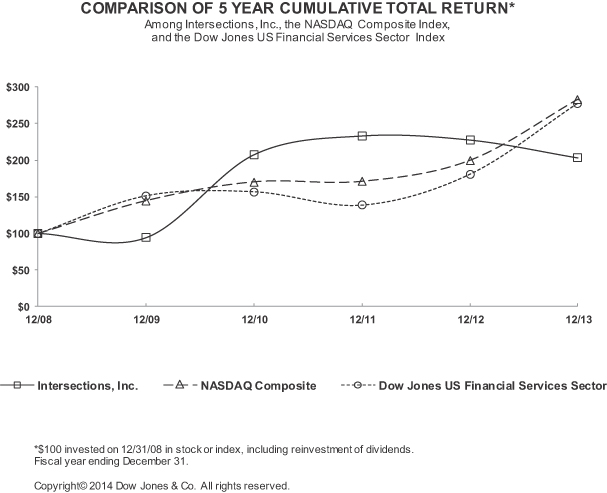
28
ITEM 6. SELECTED FINANCIAL DATA
SELECTED CONSOLIDATED FINANCIAL DATA
This section presents our historical financial data. The selected consolidated financial data is qualified by reference to and should be read carefully in conjunction with the consolidated financial statements and notes thereto and “Management’s Discussion and Analysis of Financial Condition and Results of Operations” included elsewhere in this Form 10-K. The selected consolidated financial data in this section is not intended to replace the consolidated financial statements.
| | | | | | | | | | | | | | | | | | | | |
| | | Years Ended December 31, | |
| | | 2009 | | | 2010 | | | 2011 | | | 2012 | | | 2013 | |
| | | (In thousands, except per share data) | |
Statements of Operations Data(1): | | | | | | | | | | | | | | | | | | | | |
Revenue | | $ | 344,037 | | | $ | 362,103 | | | $ | 370,702 | | | $ | 347,418 | | | $ | 310,273 | |
Operating expenses: | | | | | | | | | | | | | | | | | | | | |
Marketing | | | 65,268 | | | | 53,333 | | | | 36,960 | | | | 21,057 | | | | 23,502 | |
Commission | | | 110,349 | | | | 117,588 | | | | 107,199 | | | | 90,721 | | | | 76,654 | |
Cost of revenue | | | 90,205 | | | | 88,297 | | | | 110,033 | | | | 106,399 | | | | 105,159 | |
General and administrative | | | 54,649 | | | | 60,981 | | | | 72,102 | | | | 80,331 | | | | 83,497 | |
Goodwill, intangible and long-lived asset impairment charges(2) | | | 822 | | | | 0 | | | | 0 | | | | 1,804 | | | | 1,327 | |
Depreciation | | | 7,425 | | | | 8,099 | | | | 9,022 | | | | 9,702 | | | | 8,683 | |
Amortization | | | 9,009 | | | | 6,690 | | | | 3,801 | | | | 3,516 | | | | 3,457 | |
| | | | | | | | | | | | | | | | | | | | |
Total operating expenses | | | 337,727 | | | | 334,988 | | | | 339,117 | | | | 313,530 | | | | 302,279 | |
| | | | | | | | | | | | | | | | | | | | |
Income from operations | | | 6,310 | | | | 27,115 | | | | 31,585 | | | | 33,888 | | | | 7,994 | |
Interest (expense) income, net | | | (1,102 | ) | | | (1,675 | ) | | | (800 | ) | | | (407 | ) | | | (247 | ) |
Gain on settlement, net(3) | | | 0 | | | | 0 | | | | 1,842 | | | | 0 | | | | 0 | |
Other income (expense), net | | | 1,362 | | | | (442 | ) | | | 282 | | | | 412 | | | | (574 | ) |
| | | | | | | | | | | | | | | | | | | | |
Income from continuing operations before income taxes | | | 6,570 | | | | 24,998 | | | | 32,909 | | | | 33,893 | | | | 7,173 | |
Income tax expense | | | (1,782 | ) | | | (10,013 | ) | | | (13,655 | ) | | | (13,918 | ) | | | (4,754 | ) |
| | | | | | | | | | | | | | | | | | | | |
Income from continuing operations | | | 4,788 | | | | 14,985 | | | | 19,254 | | | | 19,975 | | | | 2,419 | |
Loss from discontinued operations, net of tax | | | (15,521 | ) | | | (488 | ) | | | (629 | ) | | | (275 | ) | | | (9 | ) |
Gain on disposal of discontinued operations | | | 0 | | | | 5,868 | | | | 0 | | | | 0 | | | | 0 | |
Net loss attributable to noncontrolling interest in discontinued operations | | | 4,380 | | | | 0 | | | | 0 | | | | 0 | | | | 0 | |
| | | | | | | | | | | | | | | | | | | | |
(Loss) income from discontinued operations | | | (11,141 | ) | | | 5,380 | | | | (629 | ) | | | (275 | ) | | | (9 | ) |
| | | | | | | | | | | | | | | | | | | | |
Net (loss) income attributable to Intersections Inc. | | $ | (6,353 | ) | | $ | 20,365 | | | $ | 18,625 | | | $ | 19,700 | | | $ | 2,410 | |
| | | | | | | | | | | | | | | | | | | | |
Basic (loss) earnings per common share: | | | | | | | | | | | | | | | | | | | | |
(Loss) income from continuing operations | | $ | 0.28 | | | $ | 0.85 | | | $ | 1.12 | | | $ | 1.12 | | | $ | 0.13 | |
| | | | | | | | | | | | | | | | | | | | |
(Loss) income from discontinued operations | | $ | (0.64 | ) | | $ | 0.30 | | | $ | (0.04 | ) | | $ | (0.01 | ) | | $ | 0 | |
| | | | | | | | | | | | | | | | | | | | |
Basic (loss) earnings per common share | | $ | (0.36 | ) | | $ | 1.15 | | | $ | 1.08 | | | $ | 1.11 | | | $ | 0.13 | |
| | | | | | | | | | | | | | | | | | | | |
Diluted (loss) earnings per common share: | | | | | | | | | | | | | | | | | | | | |
Income from continuing operations | | $ | 0.27 | | | $ | 0.81 | | | $ | 1.00 | | | $ | 1.05 | | | $ | 0.13 | |
| | | | | | | | | | | | | | | | | | | | |
(Loss) income from discontinued operations | | $ | (0.63 | ) | | $ | 0.30 | | | $ | (0.03 | ) | | $ | (0.01 | ) | | $ | 0 | |
| | | | | | | | | | | | | | | | | | | | |
Diluted (loss) earnings per common share | | $ | (0.36 | ) | | $ | 1.11 | | | $ | 0.97 | | | $ | 1.04 | | | $ | 0.13 | |
| | | | | | | | | | | | | | | | | | | | |
Weighted average shares outstanding: | | | | | | | | | | | | | | | | | | | | |
Basic | | | 17,503 | | | | 17,709 | | | | 17,214 | | | | 17,807 | | | | 18,072 | |
| | | | | | | | | | | | | | | | | | | | |
Diluted | | | 17,583 | | | | 18,412 | | | | 19,167 | | | | 19,011 | | | | 18,850 | |
| | | | | | | | | | | | | | | | | | | | |
Cash dividends paid per common share | | $ | 0 | | | $ | 0.30 | | | $ | 0.70 | | | $ | 1.30 | | | $ | 0.80 | |
| | | | | | | | | | | | | | | | | | | | |
29
| | | | | | | | | | | | | | | | | | | | |
| | | Years Ended December 31, | |
| | | 2009 | | | 2010 | | | 2011 | | | 2012 | | | 2013 | |
| | | (In thousands, except per share data) | |
Balance Sheet Data: | | | | | | | | | | | | | | | | | | | | |
Cash and cash equivalents | | $ | 12,394 | | | $ | 14,453 | | | $ | 30,834 | | | $ | 25,559 | | | $ | 20,920 | |
Deferred subscription solicitation costs | | | 34,256 | | | | 24,756 | | | | 14,463 | | | | 8,298 | | | | 7,086 | |
Working capital | | | 25,040 | | | | 30,519 | | | | 24,965 | | | | 31,651 | | | | 26,271 | |
Total assets | | | 192,171 | | | | 162,627 | | | | 166,751 | | | | 146,353 | | | | 131,089 | |
Long-term debt | | | 33,074 | | | | 3,399 | | | | 2,301 | | | | 1,464 | | | | 1,610 | |
Total stockholders’ equity | | $ | 96,407 | | | $ | 116,556 | | | $ | 107,887 | | | $ | 109,385 | | | $ | 97,463 | |
Statement of Cash Flow Data: | | | | | | | | | | | | | | | | | | | | |
Cash inflows (outflows) from: | | | | | | | | | | | | | | | | | | | | |
Operating activities | | $ | 17,359 | | | $ | 48,285 | | | $ | 35,548 | | | $ | 48,946 | | | $ | 23,087 | |
Investing activities | | | (6,992 | ) | | | 1,024 | | | | (3,579 | ) | | | (7,761 | ) | | | (6,354 | ) |
Financing activities | | $ | (8,551 | ) | | $ | (47,264 | ) | | $ | (15,588 | ) | | $ | (46,460 | ) | | $ | (21,372 | ) |
Other Data(4): | | | | | | | | | | | | | | | | | | | | |
Subscribers at beginning of period | | | 4,730 | | | | 4,301 | | | | 4,150 | | | | 4,945 | | | | 4,489 | |
Reclassified subscribers | | | | | | | | | | | 148 | | | | 0 | | | | (119 | ) |
New subscribers — indirect | | | 818 | | | | 934 | | | | 1,597 | | | | 575 | | | | 87 | |
New subscribers — direct | | | 2,230 | | | | 1,365 | | | | 1,100 | | | | 491 | | | | 465 | |
Cancelled subscribers within first 90 days of subscription | | | (933 | ) | | | (737 | ) | | | (560 | ) | | | (240 | ) | | | (176 | ) |
Cancelled subscribers after first 90 days of subscription | | | (2,544 | ) | | | (1,713 | ) | | | (1,490 | ) | | | (1,282 | ) | | | (1,875 | ) |
| | | | | | | | | | | | | | | | | | | | |
Subscribers at end of period | | | 4,301 | | | | 4,150 | | | | 4,945 | | | | 4,489 | | | | 2,871 | |
Non-subscriber customers | | | 3,377 | | | | 3,817 | | | | 4,525 | | | | 3,480 | | | | 8 | |
| | | | | | | | | | | | | | | | | | | | |
Total customers at end of period | | | 7,678 | | | | 7,967 | | | | 9,470 | | | | 7,969 | | | | 2,879 | |
| | | | | | | | | | | | | | | | | | | | |
Indirect subscribers | | | 39.0 | % | | | 40.9 | % | | | 50.9 | % | | | 51.5 | % | | | 33.2 | % |
Direct subscribers | | | 61.0 | | | | 59.1 | | | | 49.1 | | | | 48.5 | | | | 66.8 | |
| | | | | | | | | | | | | | | | | | | | |
| | | 100.0 | % | | | 100.0 | % | | | 100.0 | % | | | 100.0 | % | | | 100.0 | % |
| | | | | | | | | | | | | | | | | | | | |
Cancellations within first 90 days of subscription(5) | | | 30.6 | % | | | 32.0 | % | | | 20.8 | % | | | 22.5 | % | | | 31.9 | % |
Cancellations after first 90 days of subscription(6) | | | 37.2 | % | | | 29.2 | % | | | 23.7 | % | | | 22.2 | % | | | 38.5 | % |
Overall retention(7) | | | 55.3 | % | | | 62.9 | % | | | 72.2 | % | | | 74.7 | % | | | 56.9 | % |
| (1) | On July 19, 2010, we sold Screening International LLC for an aggregate purchase price of $15.0 million in cash plus adjustments for working capital and other items. Our background screening services ceased upon the sale of Screening International. In addition, in 2013, we ceased all business operations at Net Enforcers. Both entities qualified as discontinued operation as we did not have significant continuing involvement in the businesses and their operations and cash flows were eliminated from our continuing operations. Our consolidated financial results include Screening International, for the period June 1, 2006 through December 31, 2010 and Net Enforcers for the period January 1, 2009 through December 31, 2013 as discontinued operations. Our financial results also include Intersections Insurance Services, Captira Analytical, and Intersections Business Intelligence Services. |
| (2) | We impaired intangible and long-lived assets in our Bail Bonds Industry Solutions segments of $822 thousand in the year ended December 31, 2009. In addition, as part of our review of capitalized software projects in accordance with U.S. GAAP, we, together with our client, reassessed a development effort related to a web based platform prior to it being placed in service, and therefore recorded a fixed asset impairment charge of $1.2 million in the year ended December 31, 2012. In addition, we recorded non-cash impairments of $653 thousand and $1.3 million related to our long term investment in White Sky, LLC in the years ended December 31, 2012 and 2013, respectively. |
| (3) | Pursuant to a legal settlement in October 2011, we received a combination of cash and title to two office condominiums and one real property parcel. The cash and fair value of the properties were approximately $1.8 million. |
| (4) | We periodically refined the criteria we use to calculate and report the “Other Data” depicted in the table above. The changes in our criteria include, but are not limited to (1) adjustments to the definition of Subscribers, resulting in approximately 148 thousand and 119 thousand customers, respectively, being |
30
| | reclassified into our Subscriber count, (2) inclusion of a Non-Subscriber Customers count for all periods presented, and (3) inclusion of a total Customers count which adds together Subscribers and Non-Subscriber Customers for all periods presented. We further refined the presentation of Other Data above by removing the calculations of Customer revenue and Marketing and commissions associated with customer revenue. These changes were made as our level of revenue, marketing expense and commission expense not associated with Customer revenue has decreased to an immaterial amount as a result of our strategic focus on our core identity theft protection business. |
| | Non-Subscriber Customers include consumers who receive or are eligible for certain limited versions of our products and services as benefits of their accounts with our clients. Non-Subscriber Customers also includes consumers for whom we provide limited administrative services in connection with their transfer from a client’s prior service provider. We generate an immaterial percentage of our revenue from Non-Subscriber Customers. In the year ended December 31, 2013, Non-Subscriber Customers decreased significantly due to the cancellation by two of our financial institution clients of two portfolios totaling 3.5 million subscribers. In the year ended December 31, 2013, we generated $120 thousand in revenue from these subscribers. |
| | For the year ended December 31, 2011, both Subscribers and New Subscribers — indirect include Subscribers that are new to us and originally initiated their enrollments when a client was using a different service provider. As such, they may have different retention characteristics than our typical new Subscribers. |
| | During the years ended December 31, 2011, 2012 and 2013, certain of our clients changed their customer billing and cancellation practices related to our products. We believe these changes are a result of inquiries from the federal regulatory agencies that oversee these clients. As of December 31, 2013, we currently have 63 thousand subscribers on billing hold as a result of these changes. |
| (5) | Percentage of cancellation within the first 90 days to subscriber additions for the period. |
| (6) | Percentage of cancellations greater than 90 days to the number of subscribers at the beginning of the period plus new subscribers during the period less cancellations within the first 90 days on a rolling 12 month basis. |
| (7) | On a rolling 12 month basis by taking subscribers at the end of the period divided by the sum of the subscribers at the beginning of the period plus additions for the period. |
31
| ITEM 7. | MANAGEMENT’S DISCUSSION AND ANALYSIS OF FINANCIAL CONDITION AND RESULTS OF OPERATIONS |
The following discussion and analysis of our financial condition and results of operations should be read together with “Selected Consolidated Financial Data,” and our financial statements and accompanying notes appearing elsewhere in this Annual Report on Form 10-K. This discussion contains forward-looking statements, based on current expectations and related to future events and our future financial performance, that involve risks and uncertainties. Our actual results may differ materially from those anticipated in these forward-looking statements as a result of many important factors, including those set forth under “Risk Factors,”“Forward-Looking Statements” and elsewhere in this Annual Report on Form 10-K.
Overview
We have three reportable operating segments with continuing operations through the year ended December 31, 2013. Our Consumer Products and Services segment includes our identity theft protection and credit information management, data breach response, insurance and membership products and services and VOYCETM, our new platform and service for pet owners we are in the process of launching. This segment constituted approximately 99% of our revenue in 2013. Our Bail Bonds Industry Solutions segment includes the software management solutions for the bail bond industry provided by our subsidiary Captira Analytical. Our Market Intelligence segment includes our market intelligence platform provided by our subsidiary Intersections Business Intelligence Services under the Zumetrics® brand. Prior to the second quarter of 2013, our Market Intelligence services were included in our Online Brand Protection segment along with our Net Enforcers subsidiary. In the three months ended June 30, 2013, we ceased operations at Net Enforcers. In addition, on March 10, 2014 we made the determination to cease ongoing operations at our subsidiary, Intersections Business Intelligence Services (D/B/A Zumetrics®). These operations are expected to wind down and cease during the three months ending June 30, 2014. We plan to classify Zumetrics® as a discontinued operation at the time it meets the requirements under U.S. GAAP and thereafter will no longer have a Market Intelligence segment.
Consumer Products and Services
Our identity theft protection and credit information management products and services provide multiple benefits to consumers, including access to their credit reports, credit monitoring, educational scores, credit education, reports and monitoring of additional information, identity theft recovery services, identity theft cost reimbursement insurance, and software and other technology tools and services. An individual consumer subscription may include access to some or all of these benefits. Our membership and insurance products and services are offered by our subsidiary, Intersections Insurance Services, and include accidental death and disability and property and casualty insurance and access or purchasing programs for healthcare, home, auto, financial and other services and information.
We also offer breach response services to organizations responding to compromises of sensitive personal information. We help these clients notify the affected individuals and we provide the affected individuals with identity theft recovery and identity theft protection monitoring services.
Our consumer products and services historically have been offered primarily through relationships with clients. Most of our current subscribers for our products and services were acquired through our financial institution clients in the United States and Canada. We also offer our products and services through clients in other industries, including Internet service providers, retailers and e-commerce companies. In Canada, our products and services are offered through a marketing and distribution relationship with a Canadian company to the customers of financial institution and non-financial institution clients. In recent years, we have added a greater share of new subscribers by marketing directly to consumers through our IDENTITY GUARD® brand and other brands. We conduct our consumer direct marketing primarily through online affiliates, search engine marketing and broadcast media. We also may market through other channels, including direct mail, print marketing, telemarketing and email. We also market our IDENTITY GUARD® products in conjunction with relationships outside the financial services industry.
Through our subsidiary, i4c Innovations, we plan in 2014 to launch VOYCETM, a new platform and service for pet owners. VOYCETM is wearable technology for pets that contains patented technology designed to capture
32
key vital signs and other wellness indicators. Subscribers to this platform will have access to the results, as well as expert content from leading pet experts, to allow them to make informed decisions when it comes to their pets’ health and well-being and share key wellness information with their veterinarians. We believe VOYCE™ uniquely provides a combination of health data monitoring for pets and customized information for pet owners.
The substantial majority of our subscribers historically have been obtained through relationships with financial institutions in the United States and Canada. In most of these relationships, we provided customized products, services, consumer experiences, and billing, delivery and other policy implementation to meet the requirements of our financial institution clients. We have invested significant time and money over the years in meeting these requirements. We also have made significant investments in the development of advanced product features, and worked to have our clients adopt these products. In recent years, a greater proportion of our subscribers have been obtained through consumer direct marketing under our IDENTITY GUARD® brand, where we have greater control over the product specifications. We believe that the products and services sold under our IDENTITY GUARD® brand typically represent some of the most feature rich products offered in our industry, at higher than industry average price points. We also market IDENTITY GUARD® products at lower price points, which we believe provide more extensive features than comparably priced offerings of our competitors.
Our services are or have been marketed to potential subscribers and non-subscriber customers through a variety of marketing channels, including direct mail, outbound telemarketing, inbound telemarketing, inbound customer service and account activation calls, email, mass media and the Internet. Some of our marketing arrangements with our clients have called for us to fund marketing activity, and others have called for our clients to fund the marketing. The mix between our company-funded and client-funded marketing programs varies from year to year based upon our and our clients’ strategies, and may drive considerable period to period changes in our operating performance and metrics. Under our financial institution client arrangements, however, most marketing has been managed and conducted by our financial institution clients, even though in some cases we may have funded the marketing.
Our client arrangements are distinguished from one another primarily by the allocation between us and the client of the economic risk and reward of the marketing campaigns. The general characteristics of each arrangement are described below, although the arrangements with particular clients may contain unique characteristics:
| | • | | Direct marketing arrangements: Under direct marketing arrangements, we bear most of the new subscriber marketing costs and pay our client a commission for revenue derived from subscribers. These commissions could be payable upfront in a lump sum on a per newly enrolled subscriber basis, periodically over the life of a subscriber, or through a combination of both. These arrangements generally result in negative cash flow over the first several months after a program is launched due to the upfront nature of the marketing investments. In some arrangements, we pay the client a service fee for access to the client’s customers or billing of the subscribers by the client, and we may reimburse the client for certain of its out-of-pocket marketing costs incurred in obtaining the subscriber. Even in a direct marketing arrangement, some marketing channels may entail limited or no marketing expenses. In those cases, we generally pay higher commissions to our clients compared to channels where we incur more substantial marketing expenses. In addition to these direct marketing arrangements with clients, the financial results we report under direct marketing includes our consumer direct marketing, which is independent of these client arrangements. |
| | • | | Indirect marketing arrangements: Under indirect marketing arrangements, our client bears the marketing expense and pays us a service fee or percentage of the revenue. Indirect marketing arrangements also include some clients who pay us fees for operational services including but not limited to fulfillment events, information technology development hours or customer service activities. Because the subscriber acquisition cost is borne by our client under these arrangements, our revenue per subscriber is typically lower than under direct marketing arrangements. Indirect marketing arrangements generally provide positive cash flow earlier than direct arrangements. The majority of our non-subscriber customers are acquired under indirect marketing relationships that primarily generate little or no revenue per customer for us. |
33
The classification of a client relationship as direct or indirect is based on whether we or the client pay the marketing expenses. Our accounting policies for revenue recognition, however, are not based on the classification of a client arrangement as direct or indirect. We look to the specific client arrangement to determine the appropriate revenue recognition policy, as discussed in detail in Note 2 to our consolidated financial statements. In the past, we have purchased from clients certain customer portfolios, including the rights to future cash flows. We typically classify the post-purchase customer portfolio as a direct marketing arrangement regardless of how it may have been characterized prior to purchase because we receive all future revenues and bear all associated risks and expenses for these customers following the purchase transaction.
Our typical contracts for direct marketing arrangements, and some indirect marketing arrangements, provide that after termination of the contract we may continue to provide our services to existing subscribers for periods ranging from two years to indefinite, substantially under the applicable terms in effect at the time of termination. Under certain of our agreements, however, including most indirect marketing arrangements, the clients may require us at any time to cease providing services under existing subscriptions. Clients under most contracts may also require us to cease providing services to their customers under existing subscriptions if the contract is terminated for material breach by us or based on various events such as certain legal or regulatory changes, a party’s bankruptcy or insolvency, or other events. Even in contracts under which we have a right to provide our services to existing subscribers after termination, we often are substantially dependent on those clients to cooperate in allowing continued servicing, including continued billing by those clients. For example, in January 2014, Capital One sent us a notice of its decision to terminate its marketing agreement with us, effective no sooner than July 31, 2014. Under the notice, Capital One reserves the right to extend the date of termination of the agreement beyond July 31, 2014, and at a later time to notify us of the cancellation of existing subscriptions, which may occur before, on, or after July 31, 2014. We estimate the current monthly revenue derived under this agreement to be approximately $1.0 million per month as of December 31, 2013.
We historically have depended upon a few large financial institutions in the United States for a significant portion of our new subscriber additions and our revenue. In 2011 and 2012, approximately 70% of both our new subscribers and our Consumer Products and Services segment revenue were derived from agreements with U.S. financial institutions. In 2013, approximately 28% of our new subscribers and approximately 65% of our Consumer Products and Services segment revenue were derived from agreements with U.S. financial institutions. Revenue from subscribers obtained through our largest client, Bank of America, as a percentage of Consumer Products and Services segment revenue, constituted approximately 52% in 2011, 47% in 2012 and 43% in 2013. Bank of America and our other major financial institution clients have suspended or terminated their marketing of our products, and most other marketing through financial institutions has been reduced, suspended or terminated. We believe this is due to a number of factors, including regulatory scrutiny of the sales, marketing and administration of add-on products by financial institutions and changes in the financial institutions’ strategies. As a result, our new subscriber additions were 48% lower in 2013 as compared to 2012 despite growth in new subscriber additions from consumer direct and non-financial institution clients. We expect ongoing regulatory review and scrutiny of sales of add-on and other consumer financial products and services, including identity theft protection products, to continue to be a focus of the CFBP and other regulators. As a result, marketing of our products by our major financial institution clients, and most other marketing by our financial institution clients, has been reduced, suspended or terminated, and we do not know whether the marketing of our products by financial institutions will be resumed, or whether, if resumed, they will return to prior levels. Some financial institution clients also have suspended billing of or cancelled certain subscribers, and may suspend billing of or cancel other subscribers. We believe these cancellations and suspensions are based on regulatory actions or changes in the regulatory environment, and others are based on changes in the marketing and customer relationship strategies of our financial institution clients.
We are continuing to provide information to the federal CFBP in response to the previously reported Civil Investigative Demand regarding the provision of “ancillary products related to credit card or deposit accounts” and a subsequent request for information received in January 2014. Further, we have made, and may make additional changes to our practices and products, we may experience additional subscriber cancellations, and we,
34
or our clients, may be subject to further regulatory or legal actions. We expect to continue to incur material costs in as a result of this ongoing regulatory review and scrutiny. For example, in the years ended December 31, 2012 and 2013, we incurred a total of approximately $3.6 million in out-of-pocket costs to respond to the Civil Investigative Demand from the CFPB, and we expect to continue to incur significant out-of-pocket costs in 2014. We or our financial institution clients also may take remedial actions including the issuing of refunds or cancellation of subscribers, and our clients may seek indemnification or contribution from us relating to those remedial actions.
The following table shows the amount of our total subscribers between indirect marketing arrangements and direct marketing arrangements:
| | | | | | | | | | | | |
| | | As of December 31, | |
| | | 2011 | | | 2012 | | | 2013 | |
| | | (In thousands) | |
Indirect marketing arrangements | | | 2,517 | | | | 2,310 | | | | 953 | |
Direct marketing arrangements | | | 2,428 | | | | 2,179 | | | | 1,918 | |
| | | | | | | | | | | | |
Total subscribers | | | 4,945 | | | | 4,489 | | | | 2,871 | |
| | | | | | | | | | | | |
Over the last few years, subscribers in our Consumer Products and Services segment from direct marketing arrangements were 49% in 2011, 49% in 2012 and 67% in 2013. The increase in direct marketing arrangements in the year ended December 31, 2013 compared to the comparable period is due to increased subscribers from our consumer direct business, partially offset by a decline in subscribers from our indirect financial institution clients. In the year ended December 31, 2013, one of our financial institution clients under an indirect marketing arrangement cancelled its portfolio of approximately 650 thousand subscribers. The cancellation of these subscribers did not have a material incremental impact on our financial performance in the year ended December 31, 2013 and we do not expect it to have an impact on our future performance. We are increasing our level of marketing with non-financial institution clients and through our consumer direct marketing, but do not know whether we will be successful in replacing the subscribers and revenue we lose through cancellations and decreased marketing by financial institutions.
The number of cancellations within the first 90 days as a percentage of new subscribers was 21% in 2011, 23% in 2012 and 32% in 2013. We analyze subscriber cancellations during the first 90 days because we believe this time period affords the subscriber the opportunity to evaluate the service. The number of cancellations after the first 90 days, which are measured as a percentage of the number of subscribers at the beginning of the year plus new subscribers during the year less cancellations within the first 90 days, was 24% in 2011, 22% in 2012 and 39% in 2013. The total number of cancellations during the year as a percentage of the beginning of the year subscribers plus new subscriber additions was 28% in 2011, 25% in 2012, and 43% in 2013. Conversely, our retention rates, calculated by taking subscribers at the end of the year divided by subscribers at the beginning of the year plus additions for the year, was 72% in 2011, 75% in 2012 and 57% in 2013. The decrease in the retention rate is primarily due to the cancelled population discussed above.
Market Intelligence
Through our subsidiary, Intersections Business Intelligence Services (DBA Zumetrics®), we provide a cloud-based market intelligence platform that automatically collects and analyzes product-level e-commerce data for retailers and brand owners. Our platform provides our clients visibility into how their channel presence stacks up against the competition and alerts them of strategic shifts in the marketplace. Our services utilize proprietary technology and third party data sources to search e-commerce retail sites for instances of specific brands and/or products, categorize each instance and report e-commerce market findings back to our clients. Our services are
35
typically priced as monthly subscriptions for a defined set of monitoring services. Prices for our services vary based upon the specific configuration of services purchased by each client and range from several hundred dollars per month to thousands of dollars per month. Prior to the second quarter of 2013, our Market Intelligence services were included in our Online Brand Protection segment along with our Net Enforcers subsidiary. We have since discontinued support for certain legacy services and ceased all business operations at Net Enforcers.
Bail Bonds Industry Solutions
Through our subsidiary, Captira Analytical, we provide automated service solutions for the bail bonds industry. These services include data management, bookkeeping, accounting, reporting and decision making tools which allow bail bondsmen, general agents and sureties to run their offices more efficiently, to exercise greater operational and financial control over their businesses, and to make better underwriting decisions. We believe these services are the only fully integrated suite of bail bonds management applications of comparable scope available in the marketplace today. These services are sold to retail bail bondsman on a “per seat” license basis plus additional transactional charges for various optional services. Additionally, this segment has developed a suite of services for bail bonds insurance companies, general agents and sureties which are sold on either a transactional or recurring revenue basis.
Critical Accounting Policies
In preparing our consolidated financial statements, we make estimates and assumptions that can have a significant impact on our consolidated financial position and results of operations. The application of our critical accounting policies requires an evaluation of a number of complex criteria and significant accounting judgments by us. In applying those policies, our management uses its judgment to determine the appropriate assumptions to be used in the determination of certain estimates. Actual results may differ significantly from these estimates under different assumptions, judgments or conditions. We have identified the following policies as critical to our business operations and the understanding of our consolidated results of operations. For further information on our critical and other accounting policies, see Note 2 to our consolidated financial statements.
Revenue Recognition
We recognize revenue on 1) identity theft and credit management services, 2) accidental death insurance and 3) other monthly membership products.
Our products and services are offered to consumers principally on a monthly subscription basis. Subscription fees are generally billed directly to the subscriber’s credit card, debit card, mortgage bill or demand deposit accounts by our clients, but may be billed by us in some circumstances. The prices to subscribers of various configurations of our products and services range generally from $4.99 to $25.00 per month. As a means of allowing customers to become familiar with our services, our subscriptions typically are offered with trial, delayed billing or guaranteed refund periods. No revenues are recognized until applicable trial periods are completed.
Identity Theft and Credit Management Services
We recognize revenue from our services when: a) persuasive evidence of an arrangement exists as we maintain signed contracts with all of our large financial institution customers and paper and electronic confirmations with individual purchasers, b) delivery has occurred, c) the seller’s price to the buyer is fixed as sales are generally based on contract or list prices and payments from large financial institutions are collected within 30 to 45 days with no significant write-offs, and d) collectability is reasonably assured as individual customers pay by credit card which has limited our risk of non-collection. Revenue for monthly subscriptions is recognized in the month the subscription fee is earned. We also generate revenue through a collaborative arrangement which involves joint marketing and servicing activities. We recognize our share of revenues and expenses from this arrangement.
36
Revenue for annual subscription fees must be deferred if the subscriber has the right to cancel the service. Annual subscriptions include subscribers with full refund provisions at any time during the subscription period and pro-rata refund provisions. Revenue related to annual subscriptions with full refund provisions is recognized on the expiration of these refund provisions. Revenue related to annual subscribers with pro-rata provisions is recognized based on a pro rata share of revenue earned. An allowance for discretionary subscription refunds is established based on our historical experience. For subscriptions with refund provisions whereby only the prorated subscription fee is refunded upon cancellation by the subscriber, deferred subscription fees are recorded when billed and amortized as subscription fee revenue on a straight-line basis over the subscription period, generally one year.
We also provide services for which certain financial institution clients are the primary obligors directly to their customers. Revenue from these arrangements is recognized when earned, which is at the time we provide the service, generally on a monthly basis. In some instances, we recognize revenue for the delivery of operational services including but not limited to fulfillment events, information technology development hours or customer service minutes, rather than per customer fees.
We record revenue on a gross basis in the amount that we bill the subscriber when our arrangements with financial institution clients provide for us to serve as the primary obligor in the transaction, we have latitude in establishing price and we bear the credit risk for the amount billed to the subscriber. We record revenue in the amount that we bill our financial institution clients, and not the amount billed to their customers, when our financial institution client is the primary obligor, establishes price to the customer and bears the credit risk.
Accidental Death Insurance
We recognize revenue from our services when: a) persuasive evidence of an arrangement exists as we maintain paper and electronic confirmations with individual purchasers, b) delivery has occurred at the completion of a product trial period, c) the seller’s price to the buyer is fixed as the price of the product is agreed to by the customer as a condition of the sales transaction which established the sales arrangement, and d) collectability is reasonably assured as evidenced by our collection of revenue through the monthly mortgage payments of our customers or through checking account debits to our customers’ accounts. Revenues from insurance contracts are recognized when earned. Marketing of our insurance products generally involves a trial period during which time the product is made available at no cost to the customer. No revenues are recognized until applicable trial periods are completed.
For insurance products, we record revenue on a net basis as we perform as an agent or broker for the insurance products without assuming the risks of ownership of the insurance products.
We participate in agency relationships with insurance carriers that underwrite insurance products offered by us. Accordingly, insurance premiums collected from customers and remitted to insurance carriers are excluded from our revenues and operating expenses. Insurance premiums collected but not remitted to insurance carriers as of December 31, 2012 and 2013 totaled $725 thousand and $609 thousand, respectively, and are included in accrued expenses and other current liabilities in our consolidated balance sheets.
Other Membership Products
For membership products, we record revenue on a gross basis as we serve as the primary obligor in the transactions, have latitude in establishing price and bear credit risk for the amount billed to the subscriber.
We generate revenue from other types of subscription based products provided from our Market Intelligence and Bail Bonds Industry Solutions segments. We recognize revenue from business intelligence services on a monthly or transactional basis. We also recognize revenue from providing management service solutions on a monthly subscription or transactional basis.
37
Goodwill, Identifiable Intangibles and Other Long Lived Assets
We record, as goodwill, the excess of the purchase price over the fair value of the identifiable net assets acquired in purchase transactions. We review our goodwill for impairment annually, as of October 31, or more frequently if indicators of impairment exist. Goodwill has been assigned to our reporting units for purposes of impairment testing. As of December 31, 2013, goodwill of $43.2 million resides in our Consumer Products and Services reporting unit, resulting from our acquisition of Intersections Insurance Services Inc., which has been evaluated as part of our Consumer Products and Services reporting unit. There is no goodwill remaining in our other reporting units.
On January 1, 2012, we adopted an accounting standard update, commonly referred to as the step zero approach, that allows us to first assess qualitative factors to determine whether it is necessary to perform the two-step quantitative goodwill impairment test. For reporting units in which the qualitative assessment concludes it is more likely than not that the fair value is more than its carrying value, the amended guidance eliminates the requirement to perform further goodwill impairment testing. For those reporting units where a significant change or event occurs, and where potential impairment indicators exist, we continue to utilize a two-step quantitative assessment to testing goodwill for impairment. A significant amount of judgment is involved in determining if an indicator of impairment has occurred. Such indicators may include, among others (a) a significant decline in our expected future cash flows; (b) a sustained, significant decline in our stock price and market capitalization; (c) a significant adverse change in legal factors or in the business climate; (d) unanticipated competition; (e) the testing for recoverability of a significant asset group within a reporting unit; and (f) slower growth rates. Any adverse change in these factors could have a significant impact on the recoverability of these assets and could have a material impact in our consolidated financial statements.
The goodwill impairment test involves a two-step process. The first step is a comparison of each reporting unit’s fair value to its carrying value. We estimate fair value using the best information available, using a combined income approach (discounted cash flow) and market based approach. The market approach measures the value of an entity through an analysis of recent sales or offerings of comparable companies. The income approach measures the value of the reporting units by the present values of its economic benefits. These benefits can include revenue and cost savings. Value indications are developed by discounting expected cash flows to their present value at a rate of return that incorporates the risk-free rate for use of funds, trends within the industry, and risks associated with particular investments of similar type and quality as of the valuation date.
The estimated fair value of our reporting units is dependent on several significant assumptions, including our earnings projections, and cost of capital (discount rate). The projections use management’s best estimates of economic and market conditions over the projected period including business plans, growth rates in sales, costs, and estimates of future expected changes in operating margins and cash expenditures. Other significant estimates and assumptions include terminal value growth rates, estimates of future capital expenditures and changes in future working capital requirements. There are inherent uncertainties related to these factors and management’s judgment in applying each to the analysis of the recoverability of goodwill.
We estimate fair value giving consideration to both the income and market approaches. Consideration is given to the line of business and operating performance of the entities being valued relative to those of actual transactions, potentially subject to corresponding economic, environmental, and political factors considered to be reasonable investment alternatives.
If the estimated fair value of a reporting unit exceeds its carrying value, goodwill of the reporting unit is not impaired and the second step of the impairment test is not necessary. If the carrying value of the reporting unit exceeds its estimated fair value, then the second step of the goodwill impairment test must be performed. The second step of the goodwill impairment test compares the implied fair value of the reporting unit’s goodwill with its goodwill carrying value to measure the amount of impairment charge, if any. The implied fair value of goodwill is determined in the same manner as the amount of goodwill recognized in a business combination. In
38
other words, the estimated fair value of the reporting unit is allocated to all of the assets and liabilities of that unit (including any unrecognized intangible assets) as if the reporting unit had been acquired in a business combination and the fair value of that reporting unit was the purchase price paid. If the carrying value of the reporting unit’s goodwill exceeds the implied fair value of that goodwill, an impairment charge is recognized in an amount equal to that excess.
We review long-lived assets, including finite-lived intangible assets, property and equipment and other long term assets, for impairment whenever events or changes in circumstances indicate that the carrying amounts of the assets may not be fully recoverable. Significant judgments in this area involve determining whether a triggering event has occurred and determining the future cash flows for assets involved. In conducting our analysis, we would compare the undiscounted cash flows expected to be generated from the long-lived assets to the related net book values. If the undiscounted cash flows exceed the net book value, the long-lived assets are considered not to be impaired. If the net book value exceeds the undiscounted cash flows, an impairment charge is measured and recognized. An impairment charge is measured as the difference between the net book value and the fair value of the long-lived assets. Fair value is estimated by discounting the future cash flows associated with these assets.
Intangible assets subject to amortization may include customer, marketing and technology related intangibles, as well as trademarks. Such intangible assets, excluding customer related intangibles, are amortized on a straight-line basis over their estimated useful lives, which are generally three to ten years. Customer related intangible assets are amortized on either a straight-line or accelerated basis, dependent upon the pattern in which the economic benefits of the intangible asset are consumed or otherwise used up.
Deferred Subscription Solicitation and Advertising
Our deferred subscription solicitation costs consist of subscription acquisition costs, including telemarketing, web-based marketing expenses and direct mail such as printing and postage. We expense advertising costs the first time advertising takes place, except for direct-response marketing costs. Telemarketing, web-based marketing and direct mail expenses are direct response marketing costs, which are amortized on a cost pool basis over the period during which the future benefits are expected to be received, but no more than 12 months. The recoverability of amounts capitalized as deferred subscription solicitation costs are evaluated at each balance sheet date by comparing the carrying amounts of such assets on a cost pool basis to the probable remaining future benefit expected to result directly from such advertising costs. Probable remaining future benefit is estimated based upon historical subscriber patterns, and represents net revenues less costs to earn those revenues. In estimating probable future benefit (on a per subscriber basis) we deduct our contractual cost to service that subscriber from the known sales price. We then apply the future benefit (on a per subscriber basis) to the number of subscribers expected to be retained in the future to arrive at the total probable future benefit. In estimating the number of subscribers we will retain (i.e., factoring in expected cancellations), we utilize historical subscriber patterns maintained by us that show attrition rates by client, product and marketing channel. The total probable future benefit is then compared to the costs of a given marketing campaign (i.e., cost pools), and if the probable future benefit exceeds the cost pool, the amount is considered to be recoverable. If direct response advertising costs were to exceed the estimated probable remaining future benefit, an adjustment would be made to the deferred subscription costs to the extent of any shortfall.
Commission Costs
Commissions that relate to annual subscriptions with full refund provisions and monthly subscriptions are expensed when incurred, unless we are entitled to a refund of the commissions from our client. If annual subscriptions are cancelled prior to their initial terms, we are generally entitled to a full refund of the previously paid commission for those annual subscriptions with a full refund provision and a pro-rata refund, equal to the unused portion of the subscription, for those annual subscriptions with a pro-rata refund provision. Commissions that relate to annual subscriptions with full commission refund provisions are deferred until the earlier of
39
expiration of the refund privileges or cancellation. Once the refund privileges have expired, the commission costs are recognized ratably in the same pattern that the related revenue is recognized. Commissions that relate to annual subscriptions with pro-rata refund provisions are deferred and charged to operations as the corresponding revenue is recognized. If a subscription is cancelled, upon receipt of the refunded commission from our client, we record a reduction to the deferred commission.
Share-Based Compensation
We currently have three equity incentive plans, the 1999 and 2004 Stock Option Plans and the 2006 Stock Incentive Plan. The 2006 Stock Incentive Plan provides us with the opportunity to compensate selected employees with stock options, restricted stock and restricted stock units. A stock option entitles the recipient to purchase shares of common stock from us at the specified exercise price. Restricted stock and restricted stock units (“RSUs”) entitle the recipient to obtain stock or stock units, $.01 par value, which vests over a set period of time. RSUs are granted at no cost to the employee and employees do not need to pay an exercise price to obtain the underlying common stock. All grants or awards made under the Plans are governed by written agreements between us and the participants. The active period for the 1999 Plan expired on August 24, 2009 and the active period for the 2004 plan expires on May 5, 2014.
We use the Black-Scholes option-pricing model to value all options and the straight-line method to amortize this fair value as compensation cost over the requisite service period. The fair value of each option granted has been estimated as of the date of grant with the following weighted-average assumptions:
| | | | |
| | | 2011 | |
Expected dividend yield | | | 4.5 | % |
Expected volatility | | | 73.8 | % |
Risk-free interest rate | | | 2.48 | % |
Expected term of options | | | 6.2 years | |
In the years ended December 31, 2012 and 2013, respectively, we did not grant options.
Expected Dividend Yield. The Black-Scholes valuation model requires an expected dividend yield as an input. We apply a dividend yield based on our history and expectation of dividend payouts.
Expected Volatility. The expected volatility of options granted is estimated based solely upon our historical share price volatility. We will continue to review our estimate in the future.
Risk free Interest Rate. The yield on actively traded non-inflation indexed U.S. Treasury notes was used to extrapolate an average risk free interest rate based on the expected term of the underlying grants.
Expected Term. The expected term of options granted is based upon historical experience and represents the period of time that options granted are expected to be outstanding.
In addition, we estimate forfeitures based on historical stock option and restricted stock unit activity on a grant by grant basis. Therefore, we may make changes to that estimate throughout the vesting period based on actual activity.
Long-Term Investment
We account for investments in non-consolidated entities using the cost method of accounting, under U.S. GAAP. We have a long-term investment in convertible preferred stock of White Sky, Inc., a privately held company. We concluded that the convertible preferred stock does not meet the definition of in-substance common stock for reasons including, but not limited to, the substantive liquidation preferences and favorable redemption provisions as compared to other equity in White Sky. Therefore, we continue to account for our investment as a cost method investment.
40
We regularly review our investments for indications that fair value is less than the carrying value for reasons that are other than temporary. A significant amount of judgment is involved in determining if an indicator of impairment has occurred. Such indicators may include, among others (a) a significant deterioration in the earnings performance, credit rating, asset quality, or business prospects of the investee; (b) a significant adverse change in the regulatory, economic, or technological environment of the investee; (c) a significant adverse change in the general market conditions of either the geographic area or the industry in which the investee operates; (d) a bona fide offer to purchase, an offer by the investee to sell, or a completed auction process for the same or similar security for an amount less than the cost of the investment; (e) factors that raise significant concerns about the investee’s ability to continue as a going concern, such as negative cash flows from operations, working capital deficiencies, or noncompliance with statutory capital requirements or debt covenants. Any adverse change in these factors could have a significant impact on the recoverability of our investments and could have a material impact in our consolidated financial statements.
For purposes of our analysis, we take into consideration the features, if any, or varying provisions of each equity or debt security owned. For investments measured on a non-recurring basis, we estimate the fair value of our long-term investments by using the income approach based on discounted cash flows and the market based approach as appropriate. We use various assumptions when determining the expected discounted cash flows including earnings projections, an appropriate cost of capital, long-term growth rate and intentions for how long we will hold the investments. Our investments are impaired if the fair value of the investments is less than carrying value.
Income Taxes
We account for income taxes under the applicable provisions of U.S. GAAP, which requires an asset and liability approach to financial accounting and reporting for income taxes. Deferred tax assets and liabilities are recognized for future tax consequences attributable to differences between the financial statement carrying amounts of existing assets and liabilities and their respective tax bases. Valuation allowances are provided, if, based upon the weight of the available evidence, it is more likely than not that some or all of the deferred tax assets will not be realized.
We believe that our tax positions comply with applicable tax law. As a matter of course, we may be audited by various taxing authorities and these audits may result in proposed assessments where the ultimate resolution may result in us owing additional taxes. U.S. GAAP addresses the determination of whether tax benefits claimed or expected to be claimed on a tax return should be recorded in the financial statements. We may recognize the tax benefit from an uncertain tax position only if it is more likely than not that the tax position will be sustained on examination by the taxing authorities, based on the technical merits of the position. The tax benefits recognized in the financial statements from such a position should be measured based on the largest benefit that has a greater than fifty percent likelihood of being realized upon ultimate settlement. U.S. GAAP provides guidance on how an enterprise should determine whether a tax position is effectively settled for the purpose of recognizing previously unrecognized tax benefits.
Research and Development Costs
Our subsidiary, i4c Innovations, has incurred costs in developing their VOYCETM platform and service, which we consider to be research and development expenses. In accordance with U.S. GAAP, expenditures for research and development of our new products and services are expensed as incurred and are included in general and administrative expenses in our consolidated statements of operations. We include costs incurred for materials, rights to use intangible assets developed by others, outside contract services and a reasonable allocation of payroll costs. We expense research and development costs until the product or service has achieved specific functional and economic requirements and is ready for manufacture. For the years ended December 31, 2012 and 2013, we incurred research and development costs of $649 thousand and $4.3 million, respectively.
41
We plan to report the subsidiary’s results of operations as a separate operating segment if and when the subsidiary’s activities meet the requirements for segment reporting accordance with U.S. GAAP.
Accounting Standards Updates Recently Adopted
In December 2011, an update was made to “Balance Sheet”. This update requires an entity to disclose information about offsetting and related arrangements to enable users of financial statements to understand the effect of those arrangements. The amendments in this update are effective for annual reporting periods beginning on or after January 1, 2013, and interim periods within those annual periods. The disclosures required by this amendment will be applied retrospectively for all comparative periods. We have adopted the provisions of this update as of January 1, 2013 and there was no material impact to our consolidated financial statements.
In February 2013, an update was made to “Comprehensive Income”. The amendments in this Update require an entity to provide information about the amounts reclassified out of accumulated other comprehensive income by component. In addition, an entity is required to present, either on the face of the statement where net income is presented or in the notes, significant amounts reclassified out of accumulated other comprehensive income by the respective line items of net income but only if the amount reclassified is required under U.S. GAAP to be reclassified in their entirety to net income, an entity is required to cross-reference to other disclosures required under U.S. GAAP that provide additional detail about those amounts. The amendments in this update are effective prospectively for reporting periods beginning after December 15, 2012. We have adopted the provisions of this update as of January 1, 2013 and there was no material impact to our consolidated financial statements.
In December 2013, an update was made to the Master Glossary. The addition minimized the inconsistency and complexity of having multiple definitions of, or a diversity in practice as to what constitutes, a nonpublic entity and public entity within U.S. GAAP on a going-forward basis. The amendments in this update do not effect existing requirements and are effective prospectively for future financial accounting and reporting guidance. We have adopted the provisions of this update as of December 31, 2013 and there was no material impact to our consolidated financial statements.
Accounting Standards Updates Not Yet Effective
In February 2013, an update was made to “Liabilities”. The guidance in this Update requires an entity to measure obligations resulting from joint and several liability arrangements for which the total amount of the obligation within the scope of this guidance is fixed at the reporting date, as the sum of the following: the amount the reporting entity agreed to pay on the basis of its arrangement amount with its co-obligors and any additional amount the reporting entity expects to pay on behalf of its co-obligors. The guidance in this Update also requires an entity to disclose the nature and amount of the obligation as well as other information about those obligations. The amendments in this update are effective for fiscal years, and interim periods within those years, beginning after December 15, 2013. The amendments should be applied retrospectively to all periods presented. Early adoption is permitted. We will adopt the provisions of this update as of January 1, 2014 and do not anticipate a material impact to our consolidated financial statements.
In April 2013, an update was made to “Presentation of Financial Statements”. The guidance in this Update requires an entity to prepare its financial statements using the liquidation basis of accounting when liquidation is imminent. The amendments in this update are effective for entities that determine liquidation is imminent during annual reporting periods beginning after December 15, 2013, and interim reporting periods therein. We will adopt the provisions of this update as of January 1, 2014 and do not anticipate a material impact to our consolidated financial statements.
In July 2013, an update was made to “Income Taxes”. The guidance in this Update state that an unrecognized tax benefit should be presented in the financial statements as a reduction to a deferred tax asset for a net operating loss carryforward, a similar tax loss, or a tax credit carryforward, except as follows. To the extent
42
a net operating loss carryforward, a similar tax loss, or a tax credit carryforward is not available at the reporting date under the tax law of the applicable jurisdiction to settle any additional income taxes that would result from the disallowance of a tax position or the tax law of the applicable jurisdiction does not require the entity to use, and the entity does not intend to use, the deferred tax asset for such purpose, the unrecognized tax benefit should be presented in the financial statements as a liability and should not be combined with deferred tax assets. The amendments in this update are effective for fiscal years, and interim periods within those years, beginning after December 15, 2013. Early adoption is permitted. We will adopt the provisions of this update as of January 1, 2014 and do not anticipate a material impact to our consolidated financial statements.
43
Results of Continuing Operations
The following table sets forth, for the periods indicated, certain items on our consolidated statements of operations as a percentage of revenue:
| | | | | | | | | | | | |
| | | Year Ended December 31, | |
| | | 2011 | | | 2012 | | | 2013 | |
Revenue | | | 100.0 | % | | | 100.0 | % | | | 100.0 | % |
Operating expenses: | | | | | | | | | | | | |
Marketing | | | 10.0 | | | | 6.1 | | | | 7.6 | |
Commission | | | 28.9 | | | | 26.1 | | | | 24.7 | |
Cost of revenue | | | 29.7 | | | | 30.6 | | | | 33.9 | |
General and administrative | | | 19.5 | | | | 23.1 | | | | 26.9 | |
Goodwill, intangible and long-lived asset impairment charges | | | 0 | | | | 0.5 | | | | 0.4 | |
Depreciation | | | 2.4 | | | | 2.8 | | | | 2.8 | |
Amortization | | | 1.0 | | | | 1.0 | | | | 1.1 | |
| | | | | | | | | | | | |
Total operating expenses | | | 91.5 | | | | 90.2 | | | | 97.4 | |
| | | | | | | | | | | | |
Income from operations | | | 8.5 | | | | 9.8 | | | | 2.6 | |
Interest expense, net | | | (0.3 | ) | | | (0.1 | ) | | | (0.1 | ) |
Gain on settlement, net | | | 0.6 | | | | 0 | | | | 0 | |
Other income (expense), net | | | 0.1 | | | | 0.1 | | | | (0.2 | ) |
| | | | | | | | | | | | |
Income from continuing operations before income taxes | | | 8.9 | | | | 9.8 | | | | 2.3 | |
Income tax expense | | | (3.7 | ) | | | (4.0 | ) | | | (1.5 | ) |
| | | | | | | | | | | | |
Income from continuing operations | | | 5.2 | % | | | 5.8 | % | | | 0.8 | % |
| | | | | | | | | | | | |
We have three reportable operating segments with continuing operations through the year ended December 31, 2013. Our Consumer Products and Services segment includes our identity theft protection and credit information management, data breach response, insurance and membership products and services and VOYCETM, our new platform and service for pet owners we are in the process of launching. Our Bail Bonds Industry Solutions segment includes the software management solutions for the bail bond industry provided by our subsidiary Captira Analytical. Our Market Intelligence segment includes our market intelligence platform provided by our subsidiary Intersections Business Intelligence Services under the Zumetrics® brand. Prior to the second quarter of 2013, our Market Intelligence services were included in our Online Brand Protection segment along with our Net Enforcers subsidiary. In the three months ended June 30, 2013, we ceased operations at Net Enforcers.
44
Years Ended December 31, 2012 and 2013 (in thousands):
The consolidated results of continuing operations are as follows:
| | | | | | | | | | | | | | | | |
| | | Consumer
Products and
Services | | | Market
Intelligence | | | Bail Bonds
Industry
Solutions | | | Consolidated | |
Year Ended December 31, 2012 | | | | | | | | | | | | | | | | |
Revenue | | $ | 346,104 | | | $ | 0 | | | $ | 1,314 | | | $ | 347,418 | |
Operating expenses: | | | | | | | | | | | | | | | | |
Marketing | | | 21,057 | | | | 0 | | | | 0 | | | | 21,057 | |
Commission | | | 90,721 | | | | 0 | | | | 0 | | | | 90,721 | |
Cost of revenue | | | 106,302 | | | | 0 | | | | 97 | | | | 106,399 | |
General and administrative | | | 77,559 | | | | 329 | | | | 2,443 | | | | 80,331 | |
Goodwill, intangible and long-lived asset impairment charges | | | 1,804 | | | | 0 | | | | 0 | | | | 1,804 | |
Depreciation | | | 9,562 | | | | 0 | | | | 140 | | | | 9,702 | |
Amortization | | | 3,516 | | | | 0 | | | | 0 | | | | 3,516 | |
| | | | | | | | | | | | | | | | |
Total operating expenses | | | 310,521 | | | | 329 | | | | 2,680 | | | | 313,530 | |
| | | | | | | | | | | | | | | | |
Income (loss) from operations | | $ | 35,583 | | | $ | (329 | ) | | $ | (1,366 | ) | | $ | 33,888 | |
| | | | | | | | | | | | | | | | |
Year Ended December 31, 2013 | | | | | | | | | | | | | | | | |
Revenue | | $ | 308,284 | | | $ | 152 | | | $ | 1,837 | | | $ | 310,273 | |
Operating expenses: | | | | | | | | | | | | | | | | |
Marketing | | | 23,502 | | | | 0 | | | | 0 | | | | 23,502 | |
Commission | | | 76,654 | | | | 0 | | | | 0 | | | | 76,654 | |
Cost of revenue | | | 104,599 | | | | 385 | | | | 175 | | | | 105,159 | |
General and administrative | | | 78,283 | | | | 3,153 | | | | 2,061 | | | | 83,497 | |
Goodwill, intangible and long-lived asset impairment charges | | | 1,327 | | | | 0 | | | | 0 | | | | 1,327 | |
Depreciation | | | 8,210 | | | | 287 | | | | 186 | | | | 8,683 | |
Amortization | | | 3,457 | | | | 0 | | | | 0 | | | | 3,457 | |
| | | | | | | | | | | | | | | | |
Total operating expenses | | | 296,032 | | | | 3,825 | | | | 2,422 | | | | 302,279 | |
| | | | | | | | | | | | | | | | |
Income (loss) from operations | | $ | 12,252 | | | $ | (3,673 | ) | | $ | (585 | ) | | $ | 7,994 | |
| | | | | | | | | | | | | | | | |
45
Consumer Products and Services Segment
Income from operations in our Consumer Products and Services segment significantly decreased in the year ended December 31, 2013 as compared to the year ended December 31, 2012. The decrease in income from operations is primarily due to decreased revenue from our U.S. financial institution clients due both to decreased marketing and the cancellation of certain subscriber populations, partially offset by decreased commissions. Costs of revenue increased as a percentage of revenue due to increases in the effective rates for data. In the year ended December 31, 2013, our marketing expenses increased due primarily to our increased investment in our consumer direct business, which resulted in greater new consumer direct subscriber additions in 2013 compared to 2012. In addition, in the year ended December 31, 2013 we spent approximately $9.0 million on research, development and other operating costs associated with our subsidiary i4c Innovations’ VOYCETM platform and service, which we are in the process of launching. We also recorded a non-cash impairment charge of $1.3 million related to our long-term investment in White Sky.
| | | | | | | | | | | | | | | | |
| | | Years Ended December 31, | |
| | | 2012 | | | 2013 | | | Difference | | | % | |
Revenue | | $ | 346,104 | | | $ | 308,284 | | | $ | (37,820 | ) | | | (10.9 | )% |
Operating expenses: | | | | | | | | | | | | | | | | |
Marketing | | | 21,057 | | | | 23,502 | | | | 2,445 | | | | 11.6 | % |
Commissions | | | 90,721 | | | | 76,654 | | | | (14,067 | ) | | | (15.5 | )% |
Cost of revenue | | | 106,302 | | | | 104,599 | | | | (1,703 | ) | | | (1.6 | )% |
General and administrative | | | 77,559 | | | | 78,283 | | | | 724 | | | | 0.9 | % |
Goodwill, intangible and long-lived asset impairment charges | | | 1,804 | | | | 1,327 | | | | (477 | ) | | | (26.4 | )% |
Depreciation | | | 9,562 | | | | 8,210 | | | | (1,352 | ) | | | (14.1 | )% |
Amortization | | | 3,516 | | | | 3,457 | | | | (59 | ) | | | (1.7 | )% |
| | | | | | | | | | | | | | | | |
Total operating expenses | | | 310,521 | | | | 296,032 | | | | (14,489 | ) | | | (4.7 | )% |
| | | | | | | | | | | | | | | | |
Income from operations | | $ | 35,583 | | | $ | 12,252 | | | $ | (23,331 | ) | | | (65.6 | )% |
| | | | | | | | | | | | | | | | |
Revenue. The decrease in revenue continues to be primarily due to a reduction in new subscribers as a result of the decision by our financial institution clients to reduce, suspend or terminate marketing, as well as the cancellation of certain subscriber portfolios by the same financial institution clients, including our Chase portfolio. Financial institutions have ceased or significantly decreased their marketing of add-on or ancillary products, including our products, which we believe to be due at least in part to increased regulatory scrutiny of financial institution marketing of add-on products. As a result, our new subscriber additions were 48% lower in 2013 as compared to 2012. We do not know whether the marketing of our products by financial institutions will be resumed, or whether, if resumed, they will return to prior levels. For example, in January 2014, Capital One sent us a notice of its decision to terminate its marketing agreement with us, effective no sooner than July 31, 2014. Under the notice, Capital One reserves the right to extend the date of termination of the agreement beyond July 31, 2014, and at a later time to notify us of the cancellation of existing subscriptions, which may occur before, on or after July 31, 2014. We estimate the current monthly revenue derived under this agreement to be approximately $1.0 million per month as of December 31, 2013. Some financial institution clients also have suspended billing of certain subscribers, and may suspend billing of or cancel other subscribers, and we have suspended billing of certain other subscribers. As a result, our revenue and earnings decreased in 2013, and we expect our revenue and earnings to continue to decrease in 2014.
Revenue decreases from U.S. financial institution clients were partially offset by increased revenue from our consumer direct and Canadian business lines. These business areas combined to achieve $74.4 million in revenue in the year ended December 31, 2013, an increase of approximately 6.1% over the prior year. Revenue growth for these business areas was primarily driven by new subscriber additions of 377 thousand.
46
The following table provides details of our consumer products and services revenue and subscriber information for the years ended December 31, 2012 and 2013, respectively (in thousands):
Consumer Products and Services Revenue
| | | | | | | | | | | | | | | | |
| | | 2012 | | | 2013 | | | 2012 | | | 2013 | |
Direct marketing arrangements | | $ | 284,486 | | | $ | 252,186 | | | | 82.2 | % | | | 81.8 | % |
Indirect marketing arrangements | | | 61,618 | | | | 56,098 | | | | 17.8 | % | | | 18.2 | % |
| | | | | | | | | | | | | | | | |
Total Consumer Products and Services Revenue | | $ | 346,104 | | | $ | 308,284 | | | | 100.0 | % | | | 100.0 | % |
| | | | | | | | | | | | | | | | |
Bank of America | | $ | 161,834 | | | $ | 132,944 | | | | 46.8 | % | | | 43.1 | % |
Consumer Direct | | | 37,586 | | | | 42,011 | | | | 10.9 | % | | | 13.6 | % |
Canadian business lines | | | 32,565 | | | | 32,388 | | | | 9.4 | % | | | 10.5 | % |
All other clients | | | 114,119 | | | | 100,940 | | | | 33.0 | % | | | 32.7 | % |
| | | | | | | | | | | | | | | | |
Total Consumer Products and Services Revenue | | $ | 346,104 | | | $ | 308,284 | | | | 100.0 | % | | | 100.0 | % |
| | | | | | | | | | | | | | | | |
Consumer Products and Services Subscribers
| | | | | | | | | | | | | | | | |
| | | 2012 | | | 2013 | | | 2012 | | | 2013 | |
Bank of America | | | 1,176 | | | | 920 | | | | 26.2 | % | | | 32.1 | % |
Consumer Direct | | | 260 | | | | 301 | | | | 5.8 | % | | | 10.5 | % |
Canadian business lines | | | 347 | | | | 332 | | | | 7.7 | % | | | 11.6 | % |
All other clients | | | 2,706 | | | | 1,318 | | | | 60.3 | % | | | 45.9 | % |
| | | | | | | | | | | | | | | | |
Total Consumer Products and Services Subscribers | | | 4,489 | | | | 2,871 | | | | 100.0 | % | | | 100.0 | % |
| | | | | | | | | | | | | | | | |
Bank of America | | | 3 | | | | 2 | | | | 0.3 | % | | | 0.3 | % |
Consumer Direct | | | 175 | | | | 224 | | | | 16.4 | % | | | 40.6 | % |
Canadian business lines | | | 199 | | | | 153 | | | | 18.6 | % | | | 27.7 | % |
All other clients | | | 689 | | | | 173 | | | | 64.6 | % | | | 31.4 | % |
| | | | | | | | | | | | | | | | |
Total Consumer Products and Services New Subscribers | | | 1,066 | | | | 552 | | | | 100.0 | % | | | 100.0 | % |
| | | | | | | | | | | | | | | | |
Marketing Expenses. In the year ended December 31, 2013, approximately 98% of our consumer products and services marketing expense resulted from marketing activity for consumer direct, insurance services and Canadian subscriber acquisitions. Marketing expenses consist of subscriber acquisition costs, including affiliate marketing payments, search engine marketing, web-based marketing radio, television, telemarketing, print and direct mail expenses such as printing and postage. The increase is primarily a result of an increase in marketing expenses for our consumer direct business partially offset by the decrease in marketing expense for our direct subscription business with existing clients. In future quarters, we expect our consumer direct marketing to continue to increase. Amortization of deferred subscription solicitation costs related to marketing of our products for the years ended December 31, 2012 and 2013 were $16.4 million and $16.3 million, respectively. Marketing costs expensed as incurred for the years ended December 31, 2012 and 2013 were $4.6 million and $7.2 million, respectively, primarily related to broadcast media for our consumer direct business, which do not meet the criteria for capitalization.
As a percentage of revenue, marketing expenses increased to 7.6% for the year ended December 31, 2013 from 6.1% for the year ended December 31, 2012.
Commission Expenses. Commission expenses consist of commissions paid to clients. The decrease is related to a decrease in subscribers from our direct marketing arrangements. We expect our commission expenses to decline in future quarters primarily due to the cessation of new marketing with Bank of America and other clients.
47
As a percentage of revenue, commission expense decreased to 24.9% for year ended December 31, 2013 from 26.2% for year ended December 31, 2012.
Cost of Revenue. Cost of revenue consists of the costs of operating our customer service and information processing centers, data costs, and billing costs for subscribers and one-time transactional sales. The decrease is primarily the result of lower volumes of data fulfillment and services costs for subscribers, partially offset by an increase in the effective rates for data. We expect data rates to continue to increase.
As a percentage of revenue, cost of revenue increased to 33.9% for the year ended December 31, 2013 compared to 30.7% for the year ended December 31, 2012 primarily because of data rate increases.
General and Administrative Expenses. General and administrative expenses consist of personnel and facilities expenses associated with our executive, sales, marketing, information technology, finance, program and account management functions. The increase is primarily related to costs incurred to research and develop new and diversified businesses, partially offset by reductions to personnel related costs and legal fees. In the years ended December 31, 2012 and 2013, we incurred approximately $2.2 million and $1.4 million, respectively, in legal fees to respond to the Civil Investigative Demand from the CFPB, and we expect to continue to incur significant costs in 2014. We incurred expenses for severance and severance-related benefits for the years ended December 31, 2012 and 2013 of $790 thousand and $1.7 million.
We have included the research, development and start-up costs incurred by our subsidiary, i4c Innovations, as general and administrative expenses in this segment. Through our subsidiary, i4c Innovations, we plan in 2014 to launch VOYCETM, a new platform and service for pet owners. VOYCETMis wearable technology for pets that contains patented technology designed to capture key vital signs and other wellness indicators. Subscribers to this platform will have access to the results, as well as expert content from leading pet experts, to allow them to make informed decisions when it comes to their pets’ health and well-being and share key wellness information with their veterinarians.
Total share based compensation expense for the years ended December 31, 2012 and 2013 was $6.8 million and $6.4 million, respectively. In addition, for the years ended December 31, 2012 and 2013, we incurred compensation expense of $1.5 million and $1.4 million, respectively, for payments to restricted stock holders equivalent to the ordinary cash dividends that would have been received on these shares had they been fully vested. Additionally, in the year ended December 31, 2012, we incurred compensation expense of $1.7 million for payments to restricted stock and stock options holders equivalent to the one-time special $0.50 per share cash dividend that would have been received on these shares had they been fully vested and, if applicable, exercised.
As a percentage of revenue, general and administrative expenses increased to 25.4% for the year ended December 31, 2013 from 22.4% for the year ended December 31, 2012.
Goodwill, intangible and long-lived asset impairment charge. In accordance with U.S. GAAP, we regularly review our goodwill, intangible and long-lived assets, which include our long-term investment in White Sky, for indicators of impairments. In the year ended December 31, 2012 and December 31, 2013, we estimated the fair value of our long-term investment using the income approach with an appropriate cost of capital for the development stage investment and determined that the fair value of our cost basis investment was less than the carrying value and therefore recognized non-cash impairment charges of $653 thousand and $1.3 million, respectively. In addition, in the year ended December 31, 2012, as part of our review of capitalized software projects in accordance with U.S. GAAP, we, together with a particular client, reassessed a custom software development effort related to a web based platform prior to it being placed in service, and therefore recorded a charge of $1.2 million, which was the total capitalized balance.
As a percentage of revenue, goodwill, intangible and long-lived asset impairment charges was 0.4% for the year ended December 31, 2013 from 0.5% for the year ended December 31, 2012.
48
Depreciation. Depreciation expenses consist primarily of depreciation expenses related to our fixed assets and capitalized software. The decrease is primarily due to assets that were fully depreciated in prior periods, partially offset by depreciation on new asset additions acquired in 2013. In 2013, we accelerated depreciation on an asset due to a change in its estimated useful life, which resulted in additional depreciation expense in 2013.
As a percentage of revenue, depreciation expenses decreased to 2.7% for the year ended December 31, 2013 from 2.8% for the year ended December 31, 2012.
Amortization. Amortization expenses consist primarily of the amortization of our intangible assets. Amortization expense decreased in the year ended December 31, 2013 from the year ended December 31, 2012.
As a percentage of revenue, amortization expenses increased slightly to 1.1% for the year ended December 31, 2013 from 1.0% for the year ended December 31, 2012.
Market Intelligence segment
Prior to the second quarter of 2013, our Market Intelligence services were included in our Online Brand Protection segment along with our Net Enforcers subsidiary. We have since discontinued support for certain legacy services and ceased all business operations at Net Enforcers. In addition, in 2013, we launched a new operations platform and service which includes our market intelligence platform provided by our subsidiary Intersections Business Intelligence Services under the Zumetrics®.
| | | | | | | | | | | | | | | | |
| | | Years Ended December 31, | |
| | | 2012 | | | 2013 | | | Difference | | | % | |
Revenue | | $ | 0 | | | $ | 152 | | | $ | 152 | | | | 100.0 | % |
Operating expenses: | | | | | | | | | | | | | | | | |
Cost of revenue | | | 0 | | | | 385 | | | | 385 | | | | 100.0 | % |
General and administrative | | | 329 | | | | 3,153 | | | | 2,824 | | | | 858.4 | % |
Depreciation | | | 0 | | | | 287 | | | | 287 | | | | 100.0 | % |
| | | | | | | | | | | | | | | | |
Total operating expenses | | | 329 | | | | 3,825 | | | | 3,496 | | | | 1,062.6 | % |
| | | | | | | | | | | | | | | | |
Loss from operations | | $ | (329 | ) | | $ | (3,673 | ) | | $ | (3,344 | ) | | | (1,016.4 | )% |
| | | | | | | | | | | | | | | | |
Revenue. In 2013, we launched a new operations platform and new services under the Zumetrics® brand, and discontinued support for certain legacy services. We expect revenue to increase as we successfully onboard new clients. However, given the very early stage of commercial availability for these newly launched services, we cannot be certain of either market demand or our success in capturing market share for these services.
Cost of Revenue. Cost of revenue consists of the costs of operating our information processing centers, data costs and billing costs for subscribers. Cost of revenue increased for the year ended December 31, 2013 compared to the year ended December 31, 2012 primarily due to the launch of a new operations platform in 2013.
General and Administrative Expenses. General and administrative expenses consist of personnel and facilities expenses associated with our executive, sales, marketing, information technology, and program and account functions. The increase in general and administrative expenses is due to increased professional fees, payroll expenses and other startup costs associated with the new operating platform and service we launched in 2013.
Depreciation. Depreciation expenses consist primarily of depreciation expenses related to our fixed assets. Depreciation expenses increased for the year ended December 31, 2013 compared to the year ended December 31, 2012 primarily due to the acquisition of new assets associated with the launch of a new operations platform.
49
Bail Bonds Industry Solutions Segment
Our loss from operations in our Bail Bonds Industry Solutions Segment decreased in the year ended December 31, 2013 as compared to the year ended December 31, 2012. The decrease is due to a growth in revenue and decreased general and administrative expenses.
| | | | | | | | | | | | | | | | |
| | | Years Ended December 31, | |
| | | 2012 | | | 2013 | | | Difference | | | % | |
Revenue | | $ | 1,314 | | | $ | 1,837 | | | $ | 523 | | | | 39.8 | % |
Operating expenses: | | | | | | | | | | | | | | | | |
Cost of revenue | | | 97 | | | | 175 | | | | 78 | | | | 80.4 | % |
General and administrative | | | 2,443 | | | | 2,061 | | | | (382 | ) | | | (15.6 | )% |
Depreciation | | | 140 | | | | 186 | | | | 46 | | | | 32.9 | % |
| | | | | | | | | | | | | | | | |
Total operating expenses | | | 2,680 | | | | 2,422 | | | | (258 | ) | | | (9.6 | )% |
| | | | | | | | | | | | | | | | |
Loss from operations | | $ | (1,366 | ) | | $ | (585 | ) | | $ | 781 | | | | (57.2 | )% |
| | | | | | | | | | | | | | | | |
Revenue. The increase in revenue is the result of revenue from existing and new clients. Revenue from existing clients is due to additional transactional services and we expect revenue to continue to increase in 2014.
Cost of Revenue. Cost of revenue consists of monitoring and credit bureau expenses. Cost of revenue increased for the year ended December 31, 2013 compared to the year ended December 31, 2012.
As a percentage of revenue, cost of revenue increased to 9.5% for the year ended December 31, 2013 compared to 7.4% for the year ended December 31, 2012.
General and Administrative Expenses. General and administrative expenses consist of personnel and facilities expenses associated with our executive, sales, marketing, information technology, and program and account functions. The decrease is primarily due to decreased costs for software licensing and other expenses. In addition, the decrease is related to an accrual of an allowance for doubtful accounts that occurred in the year ended December 31, 2012.
As a percentage of revenue, general and administrative expenses decreased to 112.2% for the year ended December 31, 2013 from 185.9% for the year ended December 31, 2012.
Depreciation. Depreciation expenses consist primarily of depreciation expenses related to our fixed assets. Depreciation expense increased in the year ended December 31, 2013 as compared to December 31, 2012.
As a percentage of revenue, depreciation expenses decreased to 10.1% for the year ended December 31, 2013 from 10.7% for the year ended December 31, 2012.
Interest Expense
Interest expense decreased to $244 thousand for the year ended December 31, 2013 from $410 thousand for the year ended December 31, 2012. The decrease in interest expense is primarily attributable to a decrease in interest expense on our reduced outstanding debt balance and lease balances in the year ended December 31, 2013 as compared to the year ended December 31, 2012.
Other Income (Expense)
Other expense was $574 thousand in the year ended December 31, 2013 as compared to other income of $412 thousand in the year ended December 31, 2012. This decrease is primarily due to an expense associated with reducing the value of the long-term investment from the exercise of vested warrants in the year ended December 31, 2013. We paid $1.5 million, of which we increased our long-term investment by $787 thousand and recorded the remaining $677 thousand to other expense to more properly reflect the accounting fair value analysis of White Sky, which was performed in the year ended December 31, 2012.
50
Income Taxes
Our consolidated effective tax rate from continuing operations for the year ended December 31, 2013 was 66.3% as compared to 41.1% in the year ended December 31, 2012. The significant increase in the effective tax rate is primarily due to a significant decrease in income from continuing operations before income taxes as compared to increased book expenses which are not deductible for income tax purposes.
Years Ended December 31, 2011 and 2012 (in thousands):
The consolidated results of continuing operations are as follows:
| | | | | | | | | | | | | | | | |
| | | Consumer
Products and
Services | | | Market
Intelligence | | | Bail Bonds
Industry
Solutions | | | Consolidated | |
Year Ended December 31, 2011 | | | | | | | | | | | | | | | | |
Revenue | | $ | 369,703 | | | $ | 0 | | | $ | 999 | | | $ | 370,702 | |
Operating expenses: | | | | | | | | | | | | | | | | |
Marketing | | | 36,960 | | | | 0 | | | | 0 | | | | 36,960 | |
Commission | | | 107,199 | | | | 0 | | | | 0 | | | | 107,199 | |
Cost of revenue | | | 109,965 | | | | 0 | | | | 68 | | | | 110,033 | |
General and administrative | | | 70,005 | | | | 0 | | | | 2,097 | | | | 72,102 | |
Depreciation | | | 8,947 | | | | 0 | | | | 75 | | | | 9,022 | |
Amortization | | | 3,801 | | | | 0 | | | | 0 | | | | 3,801 | |
| | | | | | | | | | | | | | | | |
Total operating expenses | | | 336,877 | | | | 0 | | | | 2,240 | | | | 339,117 | |
| | | | | | | | | | | | | | | | |
Income (loss) from operations | | $ | 32,826 | | | $ | 0 | | | $ | (1,241 | ) | | $ | 31,585 | |
| | | | | | | | | | | | | | | | |
Year Ended December 31, 2012 | | | | | | | | | | | | | | | | |
Revenue | | $ | 346,104 | | | $ | 0 | | | $ | 1,314 | | | $ | 347,418 | |
Operating expenses: | | | | | | | | | | | | | | | | |
Marketing | | | 21,057 | | | | 0 | | | | 0 | | | | 21,057 | |
Commission | | | 90,721 | | | | 0 | | | | 0 | | | | 90,721 | |
Cost of revenue | | | 106,302 | | | | 0 | | | | 97 | | | | 106,399 | |
General and administrative | | | 77,559 | | | | 329 | | | | 2,443 | | | | 80,331 | |
Goodwill, intangible and long-lived asset impairment charges | | | 1,804 | | | | 0 | | | | 0 | | | | 1,804 | |
Depreciation | | | 9,562 | | | | 0 | | | | 140 | | | | 9,702 | |
Amortization | | | 3,516 | | | | 0 | | | | 0 | | | | 3,516 | |
| | | | | | | | | | | | | | | | |
Total operating expenses | | | 310,521 | | | | 329 | | | | 2,680 | | | | 313,530 | |
| | | | | | | | | | | | | | | | |
Income (loss) from operations | | $ | 35,583 | | | $ | (329 | ) | | $ | (1,366 | ) | | $ | 33,888 | |
| | | | | | | | | | | | | | | | |
51
Consumer Products and Services Segment
Our income from operations in our Consumer Products and Services segment increased in the year ended December 31, 2012 as compared to the year ended December 31, 2011. The increase in income from operations is primarily due to decreased marketing and commission expenses as a result of the cessation of marketing of our services by Bank of America. For 2012, we also reduced marketing expenses in our direct to consumer business. Cost of revenue also declined primarily due to lower new and ongoing subscribers, partially offset by increases in the effective rates for data. This decrease in expenses more than offset the decline in revenue, primarily from our direct marketing arrangements and the increase in our general and administrative expenses.
| | | | | | | | | | | | | | | | |
| | | Years Ended December 31, | |
| | | 2011 | | | 2012 | | | Difference | | | % | |
Revenue | | $ | 369,703 | | | $ | 346,104 | | | $ | (23,599 | ) | | | (6.4 | )% |
Operating expenses: | | | | | | | | | | | | | | | | |
Marketing | | | 36,960 | | | | 21,057 | | | | (15,903 | ) | | | (43.0 | )% |
Commission | | | 107,199 | | | | 90,721 | | | | (16,478 | ) | | | (15.4 | )% |
Cost of revenue | | | 109,965 | | | | 106,302 | | | | (3,663 | ) | | | (3.3 | )% |
General and administrative | | | 70,005 | | | | 77,559 | | | | 7,554 | | | | 10.8 | % |
Goodwill, intangible and long-lived asset impairment charges | | | 0 | | | | 1,804 | | | | 1,804 | | | | 100.0 | % |
Depreciation | | | 8,947 | | | | 9,562 | | | | 615 | | | | 6.9 | % |
Amortization | | | 3,801 | | | | 3,516 | | | | (285 | ) | | | (7.5 | )% |
| | | | | | | | | | | | | | | | |
Total operating expenses | | | 336,877 | | | | 310,521 | | | | (26,356 | ) | | | (7.8 | )% |
| | | | | | | | | | | | | | | | |
Income from operations | | $ | 32,826 | | | $ | 35,583 | | | $ | 2,757 | | | | 8.4 | % |
| | | | | | | | | | | | | | | | |
Revenue. The decrease in revenue is primarily due to a reduction in new subscribers as a result of the decision by Bank of America to stop marketing our services under our direct marketing arrangement and the decisions by other financial institutions to halt, reduce or delay marketing. This was partially offset by increased revenue from our direct to consumer business and growth in our indirect marketing arrangements. The growth in revenue from our direct to consumer business is primarily due to an increase in subscribers as well as new and ongoing subscribers converting to higher priced product offerings. The percentage of revenue from direct marketing arrangements, in which we recognize the gross amount billed to the subscriber, has decreased to 82.1% for the year ended December 31, 2012 from 85.0% in the year ended December 31, 2011, and we expect the percentage of revenue from direct marketing arrangements to continue to decrease in future periods. Further, financial institutions have ceased or significantly decreased their marketing of add-on or ancillary products, including our products, which we believe to be due at least in part to increased regulatory scrutiny of financial institution marketing of add-on products. As a result, our new subscriber additions were 61% lower in 2012 as compared to 2011. We do not know whether the marketing of our products by those financial institutions will be resumed, or whether, if resumed, they will return to prior levels. Some financial institution clients also have suspended billing of certain subscribers, and may suspend billing of or cancel other subscribers. We believe these cancellations and suspensions are based on regulatory actions or changes in the regulatory environment. As a result, our revenue decreased in 2012, and we expect our revenue and earnings to decrease in 2013 as compared to 2012.
Revenue decreases from U.S. financial institution clients were partially offset by increased revenue from our consumer direct and Canadian business lines. These business areas combined to achieve $70.1 million in revenue in the year ended December 31, 2012, an increase of approximately 7.7% over the prior year. Revenue growth for these business areas was primarily driven by new subscriber additions of 374 thousand.
52
The following table provides details of our consumer products and services revenue and subscriber information for the years ended December 31, 2011 and 2012, respectively (in thousands):
Consumer Products and Services Revenue
| | | | | | | | | | | | | | | | |
| | | 2011 | | | 2012 | | | 2011 | | | 2012 | |
Direct marketing arrangements | | $ | 314,386 | | | $ | 284,486 | | | | 85.0 | % | | | 82.2 | % |
Indirect marketing arrangements | | | 55,317 | | | | 61,618 | | | | 15.0 | % | | | 17.8 | % |
| | | | | | | | | | | | | | | | |
Total Consumer Products and Services Revenue | | $ | 369,703 | | | $ | 346,104 | | | | 100.0 | % | | | 100.0 | % |
| | | | | | | | | | | | | | | | |
Bank of America | | $ | 191,385 | | | $ | 161,834 | | | | 51.8 | % | | | 46.8 | % |
Consumer Direct | | | 31,653 | | | | 37,586 | | | | 8.6 | % | | | 10.9 | % |
Canadian business lines | | | 33,486 | | | | 32,565 | | | | 9.1 | % | | | 9.4 | % |
All other clients | | | 113,178 | | | | 114,119 | | | | 30.6 | % | | | 33.0 | % |
| | | | | | | | | | | | | | | | |
Total Consumer Products and Services Revenue | | $ | 369,703 | | | $ | 346,104 | | | | 100.0 | % | | | 100.0 | % |
| | | | | | | | | | | | | | | | |
Consumer Products and Services Subscribers
| | | | | | | | | | | | | | | | |
| | | 2011 | | | 2012 | | | 2011 | | | 2012 | |
Bank of America | | | 1,494 | | | | 1,176 | | | | 30.2 | % | | | 26.2 | % |
Consumer Direct | | | 239 | | | | 260 | | | | 4.8 | % | | | 5.8 | % |
Canadian business lines | | | 360 | | | | 347 | | | | 7.3 | % | | | 7.7 | % |
All other clients | | | 2,852 | | | | 2,706 | | | | 57.7 | % | | | 60.3 | % |
| | | | | | | | | | | | | | | | |
Total Consumer Products and Services Subscribers | | | 4,945 | | | | 4,489 | | | | 100.0 | % | | | 100.0 | % |
| | | | | | | | | | | | | | | | |
Bank of America | | | 573 | | | | 3 | | | | 21.2 | % | | | 0.3 | % |
Consumer Direct | | | 239 | | | | 175 | | | | 8.9 | % | | | 16.4 | % |
Canadian business lines | | | 231 | | | | 199 | | | | 8.5 | % | | | 18.6 | % |
All other clients | | | 1,658 | | | | 689 | | | | 61.4 | % | | | 64.6 | % |
| | | | | | | | | | | | | | | | |
Total Consumer Products and Services New Subscribers | | | 2,701 | | | | 1,066 | | | | 100.0 | % | | | 100.0 | % |
| | | | | | | | | | | | | | | | |
Marketing Expenses. Marketing expenses consist of subscriber acquisition costs, including radio, television, telemarketing, web-based marketing and direct mail expenses such as printing and postage. The decrease in marketing is primarily a result of a decrease in marketing expenses for our direct subscription business with existing clients, including Bank of America, and a decrease in marketing for our direct to consumer business. In future quarters, we expect our client related marketing expenses to decline and our direct to consumer marketing to increase. Amortization of deferred subscription solicitation costs related to marketing of our products for the years ended December 31, 2012 and 2011 were $16.4 million and $31.5 million, respectively. Marketing costs expensed as incurred for the years ended December 31, 2012 and 2011 were $4.6 million and $5.5 million, respectively, primarily related to broadcast media for our direct to consumer business, which do not meet the criteria for capitalization.
As a percentage of revenue, marketing expenses decreased to 6.1% for the year ended December 31, 2012 from 10.0% for the year ended December 31, 2011.
Commission Expenses. Commission expenses consist of commissions paid to clients. The decrease in commission expense is related to a decrease in subscribers from our direct marketing arrangements, which includes our prepaid commission arrangements. We expect our commission expenses to decline in future quarters primarily due to the cessation of new marketing with Bank of America and other clients.
As a percentage of revenue, commission expense decreased to 26.2% for year ended December 31, 2012 from 29.0% for year ended December 31, 2011.
53
Cost of Revenue. Cost of revenue consists of the costs of operating our customer service and information processing centers, data costs, and billing costs for subscribers and one-time transactional sales. The decrease in cost of revenue is primarily the result of lower volumes of data fulfillment and services costs for subscribers, partially offset by an increase in the effective rates for data. We expect data rates to continue to increase.
As a percentage of revenue, cost of revenue increased to 30.7% for the year ended December 31, 2012 compared to 29.7% for the year ended December 31, 2011 primarily because of an increase in the effective rates for data.
General and Administrative Expenses. General and administrative expenses consist of personnel and facilities expenses associated with our executive, sales, marketing, information technology, finance, program and account management functions. The increase in general and administrative expenses is primarily related to higher legal costs and higher payroll related costs. In addition, in the year ended December 31, 2012, we decreased our software development costs that were capitalized.
Total share based compensation expense for the years ended December 31, 2012 and 2011 was $6.8 million and $6.6 million, respectively. In addition, for the years ended December 31, 2012 and 2011, we incurred compensation expense of $1.5 million and $1.6 million, respectively, for payments to restricted stock holders equivalent to the ordinary cash dividends that would have been received on these shares had they been fully vested. Additionally, in the year ended December 31, 2012, we incurred compensation expense of $1.7 million for payments to restricted stock and stock options holders equivalent to the one-time special $0.50 per share cash dividend that would have been received on these shares had they been fully vested and, if applicable, exercised.
As a percentage of revenue, general and administrative expenses increased to 22.4% for the year ended December 31, 2012 from 18.9% for the year ended December 31, 2011.
Goodwill, intangible and long-lived asset impairment charge. In the year ended December 31, 2012, as part of our review of capitalized software projects in accordance with U.S. GAAP, we, together with a particular client, reassessed a custom software development effort related to a web based platform prior to it being placed in service, and therefore recorded a charge of $1.2 million, which was the total capitalized balance. In addition, we recorded an impairment of $653 thousand related to our long term investment in the year ended December 31, 2012.
As a percentage of revenue, goodwill, intangible and long-lived asset impairment charges was 0.5% for the year ended December 31, 2012. There were no impairment charges recognized in the year ended December 31, 2011.
Depreciation. Depreciation expenses consist primarily of depreciation expenses related to our fixed assets and capitalized software. The increase in depreciation expense is primarily due to new assets placed in service.
As a percentage of revenue, depreciation expenses increased to 2.8% for the year ended December 31, 2012 from 2.4% for the year ended December 31, 2011.
Amortization. Amortization expenses consist primarily of the amortization of our intangible assets. The decrease in amortization expense is due to a reduction in amortization of customer related intangible assets, which are amortized on an accelerated basis, from the comparable period.
As a percentage of revenue, amortization expenses were flat at 1.0% for the years ended December 31, 2012 and 2011.
54
Market Intelligence Segment
Prior to the second quarter of 2013, our Market Intelligence services were included in our Online Brand Protection segment along with our Net Enforcers subsidiary. We have since discontinued support for certain legacy services and ceased all business operations at Net Enforcers. In the year ended December 31, 2013, we recast our consolidated statements of operations for prior periods to reflect Net Enforcers as a discontinued operation. Beginning in the year ended December 31, 2012, we recognized expenses in this segment to develop a new operations platform and service we launched in early 2013, which is provided by our subsidiary, Intersections Business Intelligence Services.
| | | | | | | | | | | | | | | | |
| | | Years Ended December 31, | |
| | | 2011 | | | 2012 | | | Difference | | | % | |
Revenue | | $ | 0 | | | $ | 0 | | | $ | 0 | | | | 0.0 | % |
Operating expenses: | | | | | | | | | | | | | | | | |
Cost of revenue | | | 0 | | | | 0 | | | | 0 | | | | 0.0 | % |
General and administrative | | | 0 | | | | 329 | | | | 329 | | | | 100.0 | % |
Depreciation | | | 0 | | | | 0 | | | | 0 | | | | 0.0 | % |
Amortization | | | 0 | | | | 0 | | | | 0 | | | | 0.0 | % |
| | | | | | | | | | | | | | | | |
Total operating expenses | | | 0 | | | | 329 | | | | 329 | | | | 100.0 | % |
| | | | | | | | | | | | | | | | |
Loss from operations | | $ | 0 | | | $ | (329 | ) | | $ | (329 | ) | | | 100.0 | % |
| | | | | | | | | | | | | | | | |
Bail Bonds Industry Solutions Segment
Our loss from operations in our Bail Bonds Industry Solutions Segment increased in the year ended December 31, 2012 as compared to the year ended December 31, 2011 primarily due to increased general and administrative expenses partially offset by growth in revenue.
| | | | | | | | | | | | | | | | |
| | | Years Ended December 31, | |
| | | 2011 | | | 2012 | | | Difference | | | % | |
Revenue | | $ | 999 | | | $ | 1,314 | | | $ | 315 | | | | 31.5 | % |
Operating expenses: | | | | | | | | | | | | | | | | |
Cost of revenue | | | 68 | | | | 97 | | | | 29 | | | | 42.6 | % |
General and administrative | | | 2,097 | | | | 2,443 | | | | 346 | | | | 16.5 | % |
Depreciation | | | 75 | | | | 140 | | | | 65 | | | | 86.7 | % |
| | | | | | | | | | | | | | | | |
Total operating expenses | | | 2,240 | | | | 2,680 | | | | 440 | | | | 19.6 | % |
| | | | | | | | | | | | | | | | |
Loss from operations | | $ | (1,241 | ) | | $ | (1,366 | ) | | $ | 125 | | | | 10.1 | % |
| | | | | | | | | | | | | | | | |
Revenue. The increase in revenue is the result of revenue from new clients.
Cost of Revenue. Cost of revenue consists of monitoring and credit bureau expenses. Cost of revenue increased slightly for the year ended December 31, 2012 compared to the year ended December 31, 2011.
As a percentage of revenue, cost of revenue increased to 7.4% for the year ended December 31, 2012 compared to 6.8% for the year ended December 31, 2011
General and Administrative Expenses. General and administrative expenses consist of personnel and facilities expenses associated with our executive, sales, marketing, information technology, and program and account functions. The increase in general and administrative expenses is primarily due to increased payroll costs and an increase in the allowance for accounts receivable.
As a percentage of revenue, general and administrative expenses decreased to 185.9% for the year ended December 31, 2012 from 209.9% for the year ended December 31, 2011.
55
Depreciation. Depreciation expenses consist primarily of depreciation expenses related to our fixed assets. Depreciation expense increased in the year ended December 31, 2012 as compared to December 31, 2011.
As a percentage of revenue, depreciation expenses increased to 10.7% for the year ended December 31, 2012 from 7.5% for the year ended December 31, 2011.
Interest Expense
Interest expense decreased to $410 thousand for the year ended December 31, 2012 from $807 thousand for the year ended December 31, 2011. The decrease in interest expense is primarily attributable to a decrease in interest expense on our outstanding debt and lease balances in the year ended December 31, 2012 as compared to the year ended December 31, 2011.
Gain on Settlement, Net
On October 31, 2011, we received a legal settlement of approximately $450 thousand in cash, net of fees, and title for two office condominiums and one real property parcel in Arizona. In the year ended December 31, 2011, we recorded a gain of $1.8 million on the litigation settlement. In addition, we recorded a contingent loss on a separate loan guaranty made by Net Enforcers as a reduction to the settlement gain, which was settled in the year ended December 31, 2012 for approximately $376 thousand.
Other Income (Expense)
Other expense was $282 thousand in the year ended December 31, 2011 as compared to other income of $412 thousand in the year ended December 31, 2012. This change is primarily attributable to the decrease in foreign currency transaction gains resulting from exchange rate fluctuations over the period.
Income Taxes
Our consolidated effective tax rate from continuing operations for the year ended December 31, 2012 was 41.1% as compared to 41.5% in the year ended December 31, 2011. The slight decrease in the effective tax rate is primarily due to a decrease in state tax expense partially offset by an increase in book expenses which are not deductible for income tax purposes.
Results of Discontinued Operations
In the three months ended June 30, 2013, we ceased all business activities in our subsidiary Net Enforcers, which was included in our Market Intelligence segment. We determined that Net Enforcers met the requirements for classification as a discontinued operation under U.S. GAAP, as we do not have significant continuing involvement in the business and its operations and cash flows were eliminated from our ongoing operations.
The following table summarizes the operating results of the discontinued operations included in the consolidated statement of operations (in thousands):
| | | | | | | | | | | | |
| | | Year Ended
December 31,
2011 | | | Year Ended
December 31,
2012 | | | Year Ended
December 31,
2013 | |
Revenue | | $ | 2,299 | | | $ | 1,769 | | | $ | 185 | |
| | | | | | | | | | | | |
Loss from discontinued operations before income taxes | | $ | (1,052 | ) | | $ | (295 | ) | | $ | (9 | ) |
Income tax benefit | | | 423 | | | | 20 | | | | 0 | |
| | | | | | | | | | | | |
Loss from discontinued operations, net of tax | | $ | (629 | ) | | $ | (275 | ) | | $ | (9 | ) |
| | | | | | | | | | | | |
56
Liquidity and Capital Resources
Cash Flow
Cash and cash equivalents were $20.9 million as of December 31, 2013 compared to $25.6 million as of December 31, 2012. Our cash and cash equivalents are highly liquid investments and may include short-term U.S. Treasury securities with original maturity dates of less than or equal to 90 days.
Our accounts receivable balance as of December 31, 2013 was $21.1 million compared to $22.3 million as of December 31, 2012. Our accounts receivable balance consists primarily of credit card transactions that have been approved but not yet deposited into our account and several large balances with some of our top financial institutions clients. The likelihood of non-payment has historically been remote with respect to our consumer and products services clients billed, however, we do provide for an allowance for doubtful accounts with respect to bail bonds clients. We are continuing to monitor our allowance for doubtful accounts with respect to our financial institution obligors. In addition, we provide for a refund allowance, which is included in liabilities in our consolidated balance sheet, against transactions that may be refunded in subsequent months. This allowance is based on historical results. Our sources of capital include cash and cash equivalents, cash provided by continuing operations, amounts available, if any, under our Credit Agreement and other external sources of funds. Our short-term and long-term liquidity depends primarily upon our level of net income, cash balances, working capital management and bank borrowing capacity. We had a working capital surplus of $26.3 million as of December 31, 2013 compared to $31.7 million as of December 31, 2012.
We believe that we have sufficient cash provided by operations and cash on hand to fund our ongoing operating requirements. However, if there is a material change in our anticipated cash provided by operations or working capital needs at a time when we are not in compliant with all of the covenants in our credit agreement, our liquidity could be negatively affected.
| | | | | | | | | | | | |
| | | Years Ended December 31, | |
| | | 2012 | | | 2013 | | | Difference | |
| | | (In thousands) | |
Cash flows provided by operating activities | | $ | 48,946 | | | $ | 23,087 | | | $ | (25,859 | ) |
Cash flows used in investing activities | | | (7,761 | ) | | | (6,354 | ) | | | 1,407 | |
Cash flows used in financing activities | | | (46,460 | ) | | | (21,372 | ) | | | 25,088 | |
| | | | | | | | | | | | |
Decrease in cash and cash equivalents | | | (5,275 | ) | | | (4,639 | ) | | | 636 | |
Cash and cash equivalents, beginning of year | | | 30,834 | | | | 25,559 | | | | (5,275 | ) |
| | | | | | | | | | | | |
Cash and cash equivalents, end of year | | $ | 25,559 | | | $ | 20,920 | | | $ | (4,639 | ) |
| | | | | | | | | | | | |
The decrease in cash flows provided by operations was primarily the result of a decrease in revenue, an increase in expenses for data fulfillment, investments in our i4c Innovations subsidiary, and an increase in cash used for marketing for our consumer direct business. This was partially offset by a decrease in income tax payments and a reduction in cash paid for commissions. We expect in 2014 to continue to fund the growth and development of i4c Innovations and expand our consumer direct marketing.
In the year ended December 31, 2013 and 2012, we paid cash of $1.5 million and $2.3 million, respectively, for additional investments in White Sky, which contributed to the decrease in cash flows used in investing activities.
The decrease in cash flows used in financing activities for the year ended December 31, 2013 was primarily due to cash paid in the year ended December 31, 2012 for long-term debt repayments and a special cash dividend paid on common shares, partially offset by the cash distribution for the vesting of restricted stock units and the additional purchases of treasury stock.
57
Dividends
The following summarizes our dividend activity for the years ended December 31, 2013 and 2012:
| | | | | | | | |
Announcement Date | | Record Date | | Payment Date | | Cash Dividend Amount
(per share) | |
February 22, 2013 | | March 4, 2013 | | March 15, 2013 | | $ | 0.20 | |
May 9, 2013 | | May 29, 2013 | | June 7, 2013 | | $ | 0.20 | |
August 8, 2013 | | August 26, 2013 | | September 6, 2013 | | $ | 0.20 | |
November 12, 2013 | | November 22, 2013 | | December 9, 2013 | | $ | 0.20 | |
| | | | | | | | |
Announcement Date | | Record Date | | Payment Date | | Cash Dividend Amount
(per share) | |
February 2, 2012 | | February 29, 2012 | | March 9, 2012 | | $ | 0.20 | |
April 26, 2012 | | May 29, 2012 | | June 8, 2012 | | $ | 0.20 | |
August 8, 2012 | | August 31, 2012 | | September 10, 2012 | | $ | 0.20 | |
October 25, 2012 | | November 20, 2012 | | November 30, 2012 | | $ | 0.70 | |
On November 30, 2012, we paid a one-time special cash dividend of $0.50 per share on our common stock.
Our Board of Directors authorized a cash dividend of $0.20 per share on our common stock, payable on April 3, 2014, to stockholders of record as of March 20, 2014.
Credit Facility and Borrowing Capacity
On November 16, 2012, we entered into an amended and restated Credit Agreement with Bank of America, N.A., which has a maturity date of November 15, 2015. Our Credit Agreement currently consists of a revolving credit facility in the amount of $30.0 million and is secured by substantially all of our assets and a pledge by us of the equity interests we hold in certain of our subsidiaries. Our subsidiaries are co-borrowers under the Credit Agreement. We had no amounts outstanding in the year ended December 31, 2013. At December 31, 2013, we had borrowing capacity under the Credit Agreement of $30 million, and were in compliance with all of the covenants contained therein.
The amended Credit Agreement contains certain customary covenants, including among other things covenants that limit or restrict the following: the incurrence of liens; the making of investments; the incurrence of certain indebtedness; mergers, dissolutions, liquidations, or consolidations; acquisitions (other than certain permitted acquisitions); sales of substantially all of our or any of our subsidiaries’ assets; the declaration of certain dividends or distributions; transactions with affiliates (other than guarantors under the Credit Agreement) other than on fair and reasonable terms; and the creation or acquisition of any direct or indirect subsidiary of ours that is not a domestic subsidiary unless such subsidiary becomes a guarantor. We are also required to maintain compliance with certain financial covenants which include our consolidated leverage ratios, consolidated fixed charge coverage ratios, customary covenants, representations and warranties, funding conditions and events of default. In addition, the amended Credit Agreement permits us to make share repurchases under announced stock repurchase programs, without lender consent, so long as the total amount repurchased does not exceed a specified maximum dollar amount and we maintain a minimum liquidity at the time of the repurchase. We believe we are currently in compliance with all such covenants.
Our Credit Agreement contains customary financial maintenance covenants as of the last day of any fiscal quarter, including a consolidated leverage ratio not to exceed 2.00 to 1.00 and a fixed charge coverage ratio of not less than 1.25:1.00. Failure to comply with any of the covenants under our Credit Agreement could result in a default under the facility, which could cause the lenders to terminate their commitments and, to the extent we have outstanding borrowings, accelerate the timing of payments and exercise their lien on substantially all of our assets. We cannot provide assurance that we will maintain compliance with such covenants for future quarterly periods, or be able to amend the financial or restrictive covenants contained therein or enter into new credit arrangements to maintain borrowing capacity in the future. Our consolidated fixed charge coverage ratio as of
58
December 31, 2013 was 1.31, a decrease from 2.14 as of December 31, 2012. Our current forecasts of future operating results indicate we may be in violation of our fixed charge coverage ratio during the second quarter of 2014. We may take actions including but not limited to reducing fixed charge payments as defined in the credit agreement, delaying or forgoing capital investments, reducing marketing or other expenditures compared to current plans, and/or renegotiating the terms of our credit agreement as means of maintaining compliance with this fixed charge coverage ratio. Although we do not anticipate having any outstanding borrowings under the Credit Agreement at that time, our ability meet our future capital requirements and grow our business by investing in new products and services could be materially adversely affected if we are unable to borrow under our Credit Agreement.
Share Repurchase
In April 2005, our Board of Directors authorized a share repurchase program under which we can repurchase our outstanding shares of common stock from time to time, depending on market conditions, share price and other factors. As of December 31, 2013, we had approximately $16.9 million remaining under our share repurchase program, all of which we are permitted to make under our amended Credit Agreement, without lender consent, in any fiscal year (assuming compliance with the other covenants of the agreement). The repurchases may be made on the open market, in block trades, through privately negotiated transactions or otherwise, and the program may be suspended or discontinued at any time.
We entered into trading plans in accordance with Rule 10b5-1 under the Securities Exchange Act of 1934 to facilitate repurchases up to $3.0 million of common stock under our share repurchase program in 2012. The repurchase plans commenced on June 10, 2012 and December 1, 2012 and were completed in July 2012 and May 2013, respectively. During the year ended December 31, 2012, we repurchased approximately 71 thousand shares of common stock at a weighted average price of $10.37 per share resulting in an aggregate cost to us of $744 thousand. During the year ended December 31, 2013, we repurchased approximately 250 thousand shares of common stock at a weighted average price of $9.60 per share resulting in an aggregate cost to us of $2.4 million.
Contractual Obligations
The following table sets forth information regarding our contractual obligations at December 31, 2013 (in thousands):
| | | | | | | | | | | | | | | | | | | | | | | | | | | | |
| | | Year Ending December 31, | |
| | | Total | | | 2014 | | | 2015 | | | 2016 | | | 2017 | | | 2018 | | | Thereafter | |
Contractual Obligations at December 31, 2013: | | | | | | | | | | | | | | | | | | | | | | | | | | | | |
Capital leases(1)(2) | | $ | 2,747 | | | $ | 959 | | | $ | 712 | | | $ | 439 | | | $ | 332 | | | $ | 305 | | | $ | 0 | |
Operating leases | | | 15,847 | | | | 3,099 | | | | 2,933 | | | | 2,805 | | | | 2,790 | | | | 2,896 | | | | 1,324 | |
Software license & other arrangements(3) | | | 17,609 | | | | 15,154 | | | | 1,555 | | | | 300 | | | | 300 | | | | 300 | | | | 0 | |
| | | | | | | | | | | | | | | | | | | | | | | | | | | | |
| | $ | 36,203 | | | $ | 19,212 | | | $ | 5,200 | | | $ | 3,544 | | | $ | 3,422 | | | $ | 3,501 | | | $ | 1,324 | |
| | | | | | | | | | | | | | | | | | | | | | | | | | | | |
| (1) | Includes interest expense and sales tax |
| (2) | During the year ended December 31, 2013 we entered into additional capital lease agreements for approximately $1.7 million. We recorded the lease liability at the fair market value of the underlying assets in our consolidated balance sheet. |
| (3) | In January 2013, we entered into a new contract with a credit reporting agency to which we agreed to pay non-refundable minimum payments of up to $25.0 million and $25.9 million in the years ending December 31, 2013 and 2014, respectively. In December 2013, we exercised our option in accordance with the contract, to be charged at the lower pricing tier, which resulted in a revised non-refundable minimum |
59
| | payment of $9.9 million for the year ended December 31, 2014. Other arrangements include payments related to agreements to a service provider under which we receive data and other information for use in our services. Under these arrangements we pay based on usage of the data or analytics, and make certain minimum payments in exchange for defined limited exclusivity rights. The amounts in the table represent only the noncancelable portion of each respective arrangement. In general, contracts can be terminated with a 60 or 90 day notice. |
In addition to the obligations in the table above, approximately $310 thousand of unrecognized tax benefits, including interest and penalties, have been recorded as liabilities in accordance with U.S. GAAP and we are uncertain as to when such amounts may be settled.
We may be subject to certain non-income (or indirect) taxes in various state jurisdictions. We continue to analyze what obligations, if any, we have to these state taxing authorities. In most cases, it is not possible to predict the maximum potential amount of future payments or determine if a collection obligation is probable due to the unique facts and circumstances involved, including the delivery nature of our services, the relationship through which our services are offered, as well as changing state laws and interpretations of those laws. In a minority of cases, based on certain state provisions and/or active discussions with states, we believe we are liable for a non-income business tax and have recorded a total estimated liability of $553 thousand, which includes interest and penalties. This amount is included in general and administrative expenses in our consolidated statements of operations. To date, we have not been required to make any payments, nor have we received any formal assessments.
Off-Balance Sheet Arrangements
As of December 31, 2013, we did not have any off-balance sheet arrangements.
| ITEM 7A. QUANTITATIVE | AND QUALITATIVE DISCLOSURES ABOUT MARKET RISK |
Interest Rate
Market risks related to our operations result primarily from changes in interest rates. Our interest rate exposure is primarily related to our Credit Agreement, which is at a variable rate. In addition to not having an outstanding balance under our Credit Agreement as of December 31, 2013, we also believe that a near term 10% change in the benchmark interest rate would have an insignificant effect on our consolidated financial position.
Foreign Currency
We have international sales in Canada and, therefore, are subject to foreign currency rate exposure. We collect fees from subscriptions in Canadian currency and pay a portion of the related expenses in Canadian currency, which mitigates our exposure to currency exchange rate risk. As a result, our financial results could be affected by factors such as changes in foreign currency exchange rates or weak economic conditions. During the year ended December 31, 2013, the U.S. dollar has generally been weaker relative to the Canadian dollar, which favorably impacted our results of operations as Canadian dollars are translating into more U.S. dollars.
Fair Value
We may make certain withholding tax payments upon vesting of restricted stock units and stock option exercises. These payments are directly impacted by the market price of our shares on the vesting or exercise date. For the years ended December 31, 2012 and 2013, payments for withholding tax upon vesting of restricted stock units and stock option exercises were $3.4 million and $2.7 million, respectively.
We do not have material exposure to market risk with respect to our investments. We do not use derivative financial instruments for speculative or trading purposes; however, this does not preclude our adoption of specific hedging strategies in the future.
60
| ITEM 8. FINANCIAL | STATEMENTS AND SUPPLEMENTARY DATA |
The information required by this item is set forth beginning on page F-1 of this Annual Report onForm 10-K.
| ITEM 9. | CHANGES IN AND DISAGREEMENTS WITH ACCOUNTANTS ON ACCOUNTING AND FINANCIAL DISCLOSURE |
None
| ITEM 9A. CONTROLS | AND PROCEDURES |
Disclosure Controls and Procedures
The Company, under the supervision and with the participation of its management, including the Chief Executive Officer and Chief Financial Officer, evaluated the effectiveness of the design and operation of its “disclosure controls and procedures” (as such term is defined in Rule 13a-15(e) under the Securities Exchange Act of 1934) as of the end of the period covered by this report. Our officers have concluded that our disclosure controls and procedures are effective to ensure that information required to be disclosed in the reports we file or submit under the Securities Exchange Act of 1934 is accumulated and communicated to our management, including our chief executive officer and principal financial officer, to allow timely decisions regarding required disclosure. Our disclosure controls and procedures are designed, and are effective, to give reasonable assurance that the information required to be disclosed by us in reports that we file under the Securities Exchange Act of 1934 is recorded, processed, summarized and reported within the time periods specified in the rules and forms of the Securities and Exchange Commission.
Management’s Report on Internal Control Over Financial Reporting
Management of the Company is responsible for establishing and maintaining adequate internal control over financial reporting (as such term is defined in Rule 13a-15(f) under the Securities Exchange Act of 1934). Our internal control over financial reporting includes those policies and procedures that (i) pertain to the maintenance of records that, in reasonable detail, accurately and fairly reflect the transactions and dispositions of the assets of the Company; (ii) provide reasonable assurance that transactions are recorded as necessary to permit preparation of financial statements in accordance with generally accepted accounting principles, and that receipts and expenditures of the Company are being made only in accordance with authorizations of management and directors of the Company; and (iii) provide reasonable assurance regarding prevention or timely detection of unauthorized acquisition, use, or disposition of the Company’s assets that could have a material effect on the financial statements.
Internal control over financial reporting is designed to provide reasonable assurance to the Company’s management and Board of Directors regarding the preparation of reliable financial statements for external purposes in accordance with generally accepted accounting principles. Internal control over financial reporting includes self-monitoring mechanisms and actions taken to correct deficiencies as they are identified. Because of the inherent limitations in any internal control, no matter how well designed, misstatements may occur and not be prevented or detected. Accordingly, even effective internal control over financial reporting can provide only reasonable assurance with respect to financial statement preparation. Further, the evaluation of the effectiveness of internal control over financial reporting was made as of a specific date, and continued effectiveness in future periods is subject to the risks that controls may become inadequate because of changes in conditions or that the degree of compliance with the policies and procedures may decline.
Management conducted an evaluation of the effectiveness of the Company’s system of internal control over financial reporting as of December 31, 2013 based on the framework set forth in “Internal Control — Integrated Framework (1992)” issued by the Committee of Sponsoring Organizations of the Treadway Commission. Based on its evaluation, management concluded that, as of December 31, 2013, the Company’s internal control over financial reporting is effective based on the specified criteria.
61
Attestation Report of Registered Public Accounting Firm
The information required by this item is set forth beginning on page F-3 of this Annual Report onForm 10-K.
Changes in Internal Control over Financial Reporting
There have not been any changes in our internal control over financial reporting during the quarter ended December 31, 2013 that have materially affected, or are reasonably likely to materially affect, our internal control over financial reporting.
| ITEM 9B. OTHER | INFORMATION |
None.
PART III
| ITEM 10. DIRECTORS, | EXECUTIVE OFFICERS AND CORPORATE GOVERNANCE |
The information required by Item 10 as to executive officers of the Company is disclosed in Part I under the caption “Executive Officers of the Registrant.” The other information required by Item 10 as to the directors of the Company is incorporated herein by reference to the definitive Proxy Statement to be filed pursuant to Regulation 14A.
| ITEM 11. EXECUTIVE | COMPENSATION |
The information required by Item 11 is incorporated herein by reference to the definitive Proxy Statement to be filed pursuant to Regulation 14A.
| ITEM 12. | SECURITY OWNERSHIP OF CERTAIN BENEFICIAL OWNERS AND MANAGEMENT AND RELATED STOCKHOLDER MATTERS |
The information required by Item 12 regarding security ownership of certain beneficial owners and executive officers and directors is incorporated herein by reference to the definitive Proxy Statement to be filed pursuant to Regulation 14A.
| ITEM 13. | CERTAIN RELATIONSHIPS AND RELATED TRANSACTIONS, AND DIRECTOR INDEPENDENCE |
The information required by Item 13 is incorporated herein by reference to the definitive Proxy Statement to be filed pursuant to Regulation 14A.
| ITEM 14. PRINCIPAL | ACCOUNTING FEES AND SERVICES |
The information required by Item 14 is incorporated herein by reference to the definitive Proxy Statement to be filed pursuant to Regulation 14A.
| ITEM 15. EXHIBITS | AND FINANCIAL STATEMENT SCHEDULES |
(a) 1. and 2. Financial Statements and Financial Statement Schedules
62
The consolidated financial statements and financial statement schedules of Intersections Inc. required by Part II, Item 8, are included in Part IV of this report. See Index to Consolidated Financial Statements and Financial Statement Schedules beginning on page F-1.
3. Exhibits
| | |
Exhibit Number | | Description |
| |
| 3.1 | | Restated Certificate of Incorporation (Incorporated by reference to Exhibit 3.1, filed with the Registrant’s Registration Statement on Form S-1 (File No. 333-111194) (the “Form S-1”)) |
| |
| 3.2 | | Amended and Restated Bylaws (Incorporated by reference to Exhibit 3.1, filed with the Form 8-K dated October 14, 2007) |
| |
| 10.1.1† | | Broker Agreement for Consumer Disclosure Service, dated as of January 19, 2012, between the Registrant and Equifax Information Services LLC (Incorporated by reference to Exhibit 10.1, filed with the Registrant’s Form 8-K filed on January 24, 2012). |
| |
| 10.1.2† | | Amendment effective January 1, 2013, to the Broker Agreement for Consumer Disclosure Service, dated as of January 19, 2012, between the Registrant and Equifax Information Services LLC. (Incorporated by reference to Exhibit 10.1.1, filed with the Registrant’s Form 10-Q for the quarter ended March 31, 2013). |
| |
| 10.2.1† | | Consumer Review Service Reseller Service Agreement between the Registrant and Experian Information Solutions, Inc. (Incorporated by reference to Exhibit 10.12, filed with the Form S-1) |
| |
| 10.2.2† | | Amendment, dated November 15, 2006, to the Pricing Schedule to the Consumer Review Services Reseller Agreement, dated July 1, 2003 between the Registrant and Experian Information Solutions, Inc. (Incorporated by reference to Exhibit 10.12.2 filed with the Form 10-K for the year ended December 31, 2006). |
| |
| 10.3† | | Service Agreement for Consumer Resale, dated as of August 31, 1999 by and between CreditComm Services LLC and TransUnion Corporation. (Incorporated by reference to Exhibit 10.14, filed with the Form S-1) |
| |
| 10.4.1 | | Master Agreement dated March 8, 2007 by and between Digital Matrix Systems, Inc. and the Registrant. (Incorporated by reference to Exhibit 10.3 filed with the Form 10-Q for the quarter ended March 31, 2007). |
| |
| 10.4.2 | | Data Services Agreement For Credit Bureau Simulator, effective as of September 1, 2004, between Digital Matrix Systems, Inc. and the Registrant. (Incorporated by reference to Exhibit 10.1, filed with the Registrant’s Quarterly Report on Form 10-Q for the quarter ended September 30, 2005) |
| |
| 10.4.3 | | Professional Services Agreement, dated November 11, 2005, between Digital Matrix Systems, Inc. and the Registrant. (Incorporated by reference to Exhibit 10.15.4 filed with the Form 10-K for the year ended December 31, 2006). |
| |
| 10.4.4 | | Disaster Recovery Site Agreement, by and among the Registrant and Digital Matrix Systems, dated as of March 16, 2006 (Incorporated by reference to Exhibit 10.1, filed with the Form 10-Q dated May 5, 2006) |
| |
| 10.5 | | Data Services Agreement for Credit Browser, dated as of December 17, 2004, by and between Digital Matrix Systems, Inc. and the Registrant (Incorporated by reference to Exhibit 10.21, filed with the 2004 10-K) |
| |
| 10.6 | | Amended and Restated Credit Agreement dated November 15, 2012 by and among Intersections Inc., Bank of America, N.A., as Administrative Agent, Swing Line Lender, and I/C Issuer, and the other lenders party thereto from time to time (Incorporated by reference to Exhibit 10.1, filed with the Registrant’s Form 8-K filed on November 20, 2012) |
63
| | |
Exhibit Number | | Description |
| |
| 10.7 | | Amended and Restated Employment Agreement dated as of December 23, 2010 between the Company and Michael R. Stanfield (Incorporated by reference to Exhibit 10.1 filed with the Registrant’s Form 8-K dated December 23, 2010) |
| |
| 10.8 | | Amended and Restated Employment Agreement dated as of December 23, 2010 between the Company and Neal B. Dittersdorf (Incorporated by reference to Exhibit 10.2 filed with the Registrant’s Form 8-K dated December 23, 2010) |
| |
| 10.19 | | Amended and Restated Employment Agreement dated as of December 23, 2010 between the Company and John G. Scanlon (Incorporated by reference to Exhibit 10.3 filed with the Registrant’s Form 8-K dated December 23, 2010) |
| |
| 10.10 | | Amended and Restated Employment Agreement dated as of December 23, 2010 between the Company and Steven A. Schwartz (Incorporated by reference to Exhibit 10.4 filed with the Registrant’s Form 8-K dated December 23, 2010) |
| |
| 10.11* | | Employment Agreement dated as of July 15, 2009 by and among the Company, Captira Analytical, LLC, and Steven Sjoblad |
| |
| 14.1 | | Code of Ethics of the Registrant (Incorporated by reference to Exhibit 14.1, filed with the2004 10-K). |
| |
| 21.1* | | Subsidiaries of the Registrant. |
| |
| 23.1* | | Consent of Deloitte & Touche LLP |
| |
| 31.1* | | Certification of Michael R. Stanfield, President and Chief Executive Officer, pursuant to Section 302 of the Sarbanes-Oxley Act of 2002. |
| |
| 31.2* | | Certification of John Scanlon, Chief Financial Officer, pursuant to Section 302 of the Sarbanes-Oxley Act of 2002. |
| |
| 32.1* | | Certification of Michael R. Stanfield, Chief Executive Officer, pursuant to 18 U.S.C. Section 1350, as adopted pursuant to Section 906 of the Sarbanes-Oxley Act of 2002. |
| |
| 32.2* | | Certification of John Scanlon, Chief Financial Officer, pursuant to 18 U.S.C. Section 1350, as adopted pursuant to Section 906 of the Sarbanes-Oxley Act of 2002. |
| |
| 101.INS | | XBRL Instance Document |
| |
| 101.SCH | | XBRL Taxonomy Extension Schema Document |
| |
| 101.CAL | | XBRL Taxonomy Extension Calculation Linkbase Document |
| |
| 101.LAB | | XBRL Taxonomy Extension Labels Linkbase Document |
| |
| 101.PRE | | XBRL Taxonomy Extension Presentation Linkbase Document |
| |
| 101.DEF | | XBRL Taxonomy Extension Definition Linkbase Document |
| † | Confidential treatment requested as to certain portions, which portions are omitted and filed separately with the Securities and Exchange Commission. |
64
INDEX TO FINANCIAL STATEMENTS AND SCHEDULE
INTERSECTIONS INC.
65
REPORT OF INDEPENDENT REGISTERED PUBLIC ACCOUNTING FIRM
To the Board of Directors and Stockholders of
Intersections Inc.
Chantilly, Virginia
We have audited the accompanying consolidated balance sheets of Intersections Inc. and subsidiaries (the “Company”) as of December 31, 2013 and 2012, and the related consolidated statements of operations, changes in stockholders’ equity, and cash flows for each of the three years in the period ended December 31, 2013. Our audits also included the financial statement schedule listed in the Index to the Financial Statements. We also have audited the Company’s internal control over financial reporting as of December 31, 2013, based on criteria established inInternal Control — Integrated Framework (1992) issued by the Committee of Sponsoring Organizations of the Treadway Commission. The Company’s management is responsible for these financial statements and financial statement schedule, for maintaining effective internal control over financial reporting, and for its assessment of the effectiveness of internal control over financial reporting, included in the accompanying Management’s Report on Internal Control over Financial Reporting. Our responsibility is to express an opinion on these financial statements and financial statement schedule and an opinion on the Company’s internal control over financial reporting based on our audits.
We conducted our audits in accordance with the standards of the Public Company Accounting Oversight Board (United States). Those standards require that we plan and perform the audit to obtain reasonable assurance about whether the financial statements are free of material misstatement and whether effective internal control over financial reporting was maintained in all material respects. Our audits of the financial statements included examining, on a test basis, evidence supporting the amounts and disclosures in the financial statements, assessing the accounting principles used and significant estimates made by management, and evaluating the overall financial statement presentation. Our audit of internal control over financial reporting included obtaining an understanding of internal control over financial reporting, assessing the risk that a material weakness exists, testing and evaluating the design and operating effectiveness of internal control based on the assessed risk. Our audits also included performing such other procedures as we considered necessary in the circumstances. We believe that our audits provide a reasonable basis for our opinions.
A company’s internal control over financial reporting is a process designed by, or under the supervision of, the company’s principal executive and principal financial officers, or persons performing similar functions, and effected by the company’s board of directors, management, and other personnel to provide reasonable assurance regarding the reliability of financial reporting and the preparation of financial statements for external purposes in accordance with generally accepted accounting principles. A company’s internal control over financial reporting includes those policies and procedures that (1) pertain to the maintenance of records that, in reasonable detail, accurately and fairly reflect the transactions and dispositions of the assets of the company; (2) provide reasonable assurance that transactions are recorded as necessary to permit preparation of financial statements in accordance with generally accepted accounting principles and that receipts and expenditures of the company are being made only in accordance with authorizations of management and directors of the company; and (3) provide reasonable assurance regarding prevention or timely detection of unauthorized acquisition, use, or disposition of the company’s assets that could have a material effect on the financial statements.
Because of the inherent limitations of internal control over financial reporting, including the possibility of collusion or improper management override of controls, material misstatements due to error or fraud may not be prevented or detected on a timely basis. Also, projections of any evaluation of the effectiveness of the internal control over financial reporting to future periods are subject to the risk that the controls may become inadequate because of changes in conditions, or that the degree of compliance with the policies or procedures may deteriorate.
In our opinion, the consolidated financial statements referred to above present fairly, in all material respects, the financial position of Intersections Inc. and subsidiaries as of December 31, 2013 and 2012, and the results of their operations and their cash flows for each of the three years in the period ended December 31, 2013, in conformity with accounting principles generally accepted in the United States of America. Also, in our opinion, such financial statement schedule, when considered in relation to the basic consolidated financial statements taken as a whole, present fairly, in all material respects, the information set forth therein. Also, in our opinion, the Company maintained, in all material respects, effective internal control over financial reporting as of December 31, 2013, based on the criteria established inInternal Control — Integrated Framework (1992) issued by the Committee of Sponsoring Organizations of the Treadway Commission.
/s/ DELOITTE & TOUCHE LLP
McLean, Virginia
March 17, 2014
F-1
INTERSECTIONS INC.
CONSOLIDATED BALANCE SHEETS
December 31, 2012 and 2013
(In thousands, except par value)
| | | | | | | | |
| | | December 31, | |
| | | 2012 | | | 2013 | |
| ASSETS | |
CURRENT ASSETS: | | | | | | | | |
Cash and cash equivalents | | $ | 25,559 | | | $ | 20,920 | |
Accounts receivable, net of allowance for doubtful accounts of $35 (2012) and $26 (2013) | | | 22,265 | | | | 21,070 | |
Prepaid expenses and other current assets | | | 5,140 | | | | 5,515 | |
Income tax receivable | | | 946 | | | | 0 | |
Deferred subscription solicitation costs | | | 8,298 | | | | 7,086 | |
| | | | | | | | |
Total current assets | | | 62,208 | | | | 54,591 | |
| | | | | | | | |
PROPERTY AND EQUIPMENT, net | | | 17,316 | | | | 14,490 | |
DEFERRED TAX ASSET, net | | | 3,014 | | | | 4,864 | |
LONG-TERM INVESTMENT | | | 8,924 | | | | 8,384 | |
GOODWILL | | | 43,235 | | | | 43,235 | |
INTANGIBLE ASSETS, net | | | 7,527 | | | | 4,020 | |
OTHER ASSETS | | | 4,129 | | | | 1,505 | |
| | | | | | | | |
TOTAL ASSETS | | $ | 146,353 | | | $ | 131,089 | |
| | | | | | | | |
| LIABILITIES AND STOCKHOLDERS’ EQUITY | |
CURRENT LIABILITIES: | | | | | | | | |
Capital leases, current portion | | $ | 766 | | | $ | 817 | |
Accounts payable | | | 3,889 | | | | 955 | |
Accrued expenses and other current liabilities | | | 14,082 | | | | 13,508 | |
Accrued payroll and employee benefits | | | 2,940 | | | | 3,197 | |
Commissions payable | | | 665 | | | | 502 | |
Deferred revenue | | | 6,025 | | | | 4,287 | |
Deferred tax liability, net, current portion | | | 2,190 | | | | 1,905 | |
Current tax payable | | | 0 | | | | 3,149 | |
| | | | | | | | |
Total current liabilities | | | 30,557 | | | | 28,320 | |
| | | | | | | | |
OBLIGATIONS UNDER CAPITAL LEASES, less current portion | | | 1,464 | | | | 1,610 | |
OTHER LONG-TERM LIABILITIES | | | 4,947 | | | | 3,696 | |
| | | | | | | | |
TOTAL LIABILITIES | | | 36,968 | | | | 33,626 | |
| | | | | | | | |
COMMITMENTS AND CONTINGENCIES (see notes 16 and 17) | | | | | | | | |
STOCKHOLDERS’ EQUITY: | | | | | | | | |
Common stock at $0.01 par value, shares authorized 50,000; shares issued 20,880 (2012) and 21,272 (2013); shares outstanding 17,950 (2012) and 18,092 (2013) | | | 209 | | | | 213 | |
Additional paid-in capital | | | 119,443 | | | | 121,952 | |
Treasury stock, shares at cost; 2,930 (2012) and 3,180 (2013) | | | (30,295 | ) | | | (32,696 | ) |
Retained earnings | | | 20,028 | | | | 7,994 | |
| | | | | | | | |
TOTAL STOCKHOLDERS’ EQUITY | | | 109,385 | | | | 97,463 | |
| | | | | | | | |
TOTAL LIABILITIES AND STOCKHOLDERS’ EQUITY | | $ | 146,353 | | | $ | 131,089 | |
| | | | | | | | |
See Notes to Consolidated Financial Statements.
F-2
INTERSECTIONS INC.
CONSOLIDATED STATEMENTS OF OPERATIONS
Years Ended December 31, 2011, 2012 and 2013
| | | | | | | | | | | | |
| | | 2011 | | | 2012 | | | 2013 | |
| | | (In thousands, except per share amounts) | |
REVENUE | | $ | 370,702 | | | $ | 347,418 | | | $ | 310,273 | |
OPERATING EXPENSES: | | | | | | | | | | | | |
Marketing | | | 36,960 | | | | 21,057 | | | | 23,502 | |
Commission | | | 107,199 | | | | 90,721 | | | | 76,654 | |
Cost of revenue | | | 110,033 | | | | 106,399 | | | | 105,159 | |
General and administrative | | | 72,102 | | | | 80,331 | | | | 83,497 | |
Goodwill, intangible and long-lived asset impairment charges | | | 0 | | | | 1,804 | | | | 1,327 | |
Depreciation | | | 9,022 | | | | 9,702 | | | | 8,683 | |
Amortization | | | 3,801 | | | | 3,516 | | | | 3,457 | |
| | | | | | | | | | | | |
Total operating expenses | | | 339,117 | | | | 313,530 | | | | 302,279 | |
| | | | | | | | | | | | |
INCOME FROM OPERATIONS | | | 31,585 | | | | 33,888 | | | | 7,994 | |
Interest income | | | 6 | | | | 3 | | | | 0 | |
Interest expense | | | (806 | ) | | | (410 | ) | | | (247 | ) |
Gain on settlement, net | | | 1,842 | | | | 0 | | | | 0 | |
Other income (expense), net | | | 282 | | | | 412 | | | | (574 | ) |
| | | | | | | | | | | | |
INCOME FROM CONTINUING OPERATIONS BEFORE INCOME TAXES | | | 32,909 | | | | 33,893 | | | | 7,173 | |
INCOME TAX EXPENSE | | | (13,655 | ) | | | (13,918 | ) | | | (4,754 | ) |
| | | | | | | | | | | | |
INCOME FROM CONTINUING OPERATIONS | | | 19,254 | | | | 19,975 | | | | 2,419 | |
LOSS FROM DISCONTINUED OPERATIONS, NET OF TAX | | | (629 | ) | | | (275 | ) | | | (9 | ) |
| | | | | | | | | | | | |
NET INCOME | | $ | 18,625 | | | $ | 19,700 | | | $ | 2,410 | |
| | | | | | | | | | | | |
Basic earnings per common share: | | | | | | | | | | | | |
Income from continuing operations | | $ | 1.12 | | | $ | 1.12 | | | $ | 0.13 | |
Loss from discontinued operations | | | (0.04 | ) | | | (0.01 | ) | | | 0.00 | |
| | | | | | | | | | | | |
Basic earnings per common share | | $ | 1.08 | | | $ | 1.11 | | | $ | 0.13 | |
| | | | | | | | | | | | |
Diluted earnings per common share: | | | | | | | | | | | | |
Income from continuing operations | | $ | 1.00 | | | $ | 1.05 | | | $ | 0.13 | |
Loss from discontinued operations | | | (0.03 | ) | | | (0.01 | ) | | | 0.00 | |
| | | | | | | | | | | | |
Diluted earnings per common share | | $ | 0.97 | | | $ | 1.04 | | | $ | 0.13 | |
| | | | | | | | | | | | |
Weighted average shares outstanding: | | | | | | | | | | | | |
Basic | | | 17,214 | | | | 17,807 | | | | 18,072 | |
Diluted | | | 19,167 | | | | 19,011 | | | | 18,850 | |
See Notes to Consolidated Financial Statements.
F-3
INTERSECTIONS INC.
CONSOLIDATED STATEMENTS OF CHANGES IN STOCKHOLDERS’ EQUITY
Years Ended December 31, 2011, 2012 and 2013
| | | | | | | | | | | | | | | | | | | | | | | | | | | | | | | | | | | | |
| | | Common
Stock | | | Additional
Paid-in
Capital | | | Treasury
Stock | | | Retained
Income
(Loss) | | | Accumulated
Other
Comprehensive
(Loss)
Income | | | Compre-
hensive
Income
(Loss) | | | Total
Stock-
holders’
Equity | |
| | | Shares | | | Amount | | | | Shares | | | Amount | | | | | |
| | | (In thousands) | |
BALANCE, DECEMBER 31, 2010 | | | 18,912 | | | $ | 189 | | | $ | 109,250 | | | | 1,117 | | | $ | (9,948 | ) | | $ | 17,060 | | | $ | 5 | | | | | | | $ | 116,556 | |
| | | | | | | | | | | | | | | | | | | | | | | | | | | | | | | | | | | | |
Issuance of common stock upon exercise of stock options and vesting of restricted stock units | | | 1,223 | | | | 12 | | | | (9,420 | ) | | | 0 | | | | 0 | | | | 0 | | | | 0 | | | | 0 | | | | (9,408 | ) |
Share based compensation | | | 0 | | | | 0 | | | | 6,590 | | | | 0 | | | | 0 | | | | 0 | | | | 0 | | | | 0 | | | | 6,590 | |
Tax benefit of stock options exercised and vesting of restricted stock units | | | 0 | | | | 0 | | | | 7,214 | | | | 0 | | | | 0 | | | | 0 | | | | 0 | | | | 0 | | | | 7,214 | |
Cash dividends, $0.70 per share | | | 0 | | | | 0 | | | | 0 | | | | 0 | | | | 0 | | | | (12,082 | ) | | | 0 | | | | 0 | | | | (12,082 | ) |
Purchase of treasury stock | | | 0 | | | | 0 | | | | 0 | | | | 1,742 | | | | (19,603 | ) | | | 0 | | | | 0 | | | | 0 | | | | (19,603 | ) |
Net income | | | 0 | | | | 0 | | | | 0 | | | | 0 | | | | 0 | | | | 18,625 | | | | 0 | | | | 18,625 | | | | 18,625 | |
Foreign currency translation adjustments | | | 0 | | | | 0 | | | | 0 | | | | 0 | | | | 0 | | | | 0 | | | | (5 | ) | | | (5 | ) | | | (5 | ) |
| | | | | | | | | | | | | | | | | | | | | | | | | | | | | | | | | | | | |
Comprehensive Income | | | | | | | | | | | | | | | | | | | | | | | | | | | | | | $ | 18,620 | | | | | |
| | | | | | | | | | | | | | | | | | | | | | | | | | | | | | | | | | | | |
BALANCE, DECEMBER 31, 2011 | | | 20,135 | | | $ | 201 | | | $ | 113,634 | | | | 2,859 | | | $ | (29,551 | ) | | $ | 23,603 | | | $ | 0 | | | | | | | $ | 107,887 | |
| | | | | | | | | | | | | | | | | | | | | | | | | | | | | | | | | | | | |
Issuance of common stock upon exercise of stock options and vesting of restricted stock units | | | 745 | | | | 8 | | | | (2,363 | ) | | | 0 | | | | 0 | | | | 0 | | | | 0 | | | | 0 | | | | (2,355 | ) |
Share based compensation | | | 0 | | | | 0 | | | | 6,835 | | | | 0 | | | | 0 | | | | 0 | | | | 0 | | | | 0 | | | | 6,835 | |
Tax benefit of stock options exercised and vesting of restricted stock units | | | 0 | | | | 0 | | | | 1,337 | | | | 0 | | | | 0 | | | | 0 | | | | 0 | | | | 0 | | | | 1,337 | |
Cash dividends, $1.30 per share | | | 0 | | | | 0 | | | | 0 | | | | 0 | | | | 0 | | | | (23,275 | ) | | | 0 | | | | 0 | | | | (23,275 | ) |
Purchase of treasury stock | | | 0 | | | | 0 | | | | 0 | | | | 71 | | | | (744 | ) | | | 0 | | | | 0 | | | | 0 | | | | (744 | ) |
Net income | | | 0 | | | | 0 | | | | 0 | | | | 0 | | | | 0 | | | | 19,700 | | | | 0 | | | | 19,700 | | | | 19,700 | |
| | | | | | | | | | | | | | | | | | | | | | | | | | | | | | | | | | | | |
Comprehensive Income | | | | | | | | | | | | | | | | | | | | | | | | | | | | | | $ | 19,700 | | | | | |
| | | | | | | | | | | | | | | | | | | | | | | | | | | | | | | | | | | | |
BALANCE, DECEMBER 31, 2012 | | | 20,880 | | | $ | 209 | | | $ | 119,443 | | | | 2,930 | | | $ | (30,295 | ) | | $ | 20,028 | | | $ | 0 | | | | | | | $ | 109,385 | |
| | | | | | | | | | | | | | | | | | | | | | | | | | | | | | | | | | | | |
Issuance of common stock upon exercise of stock options and vesting of restricted stock units | | | 392 | | | | 4 | | | | (4,350 | ) | | | 0 | | | | 0 | | | | 0 | | | | 0 | | | | 0 | | | | (4,346 | ) |
Share based compensation | | | 0 | | | | 0 | | | | 6,368 | | | | 0 | | | | 0 | | | | 0 | | | | 0 | | | | 0 | | | | 6,368 | |
Tax benefit of stock options exercised and vesting of restricted stock units | | | 0 | | | | 0 | | | | 491 | | | | 0 | | | | 0 | | | | 0 | | | | 0 | | | | 0 | | | | 491 | |
Cash dividends, $0.80 per share | | | 0 | | | | 0 | | | | 0 | | | | 0 | | | | 0 | | | | (14,444 | ) | | | 0 | | | | 0 | | | | (14,444 | ) |
Purchase of treasury stock | | | 0 | | | | 0 | | | | 0 | | | | 250 | | | | (2,401 | ) | | | 0 | | | | 0 | | | | 0 | | | | (2,401 | ) |
Net income | | | 0 | | | | 0 | | | | 0 | | | | 0 | | | | 0 | | | | 2,410 | | | | 0 | | | | 2,410 | | | | 2,410 | |
| | | | | | | | | | | | | | | | | | | | | | | | | | | | | | | | | | | | |
Comprehensive Income | | | | | | | | | | | | | | | | | | | | | | | | | | | | | | $ | 2,410 | | | | | |
| | | | | | | | | | | | | | | | | | | | | | | | | | | | | | | | | | | | |
BALANCE, DECEMBER 31, 2013 | | | 21,272 | | | $ | 213 | | | $ | 121,952 | | | | 3,180 | | | $ | (32,696 | ) | | $ | 7,994 | | | $ | 0 | | | | | | | $ | 97,463 | |
| | | | | | | | | | | | | | | | | | | | | | | | | | | | | | | | | | | | |
See Notes to Consolidated Financial Statements.
F-4
INTERSECTIONS INC.
CONSOLIDATED STATEMENTS OF CASH FLOWS
Years Ended December 31, 2011, 2012 and 2013
| | | | | | | | | | | | |
| | | 2011 | | | 2012 | | | 2013 | |
| | | (In thousands) | |
CASH FLOWS FROM OPERATING ACTIVITIES: | | | | | | | | | | | | |
Net income | | $ | 18,625 | | | $ | 19,700 | | | $ | 2,410 | |
Adjustments to reconcile net income to cash flows provided by operating activities: | | | | | | | | | | | | |
Depreciation | | | 9,041 | | | | 9,713 | | | | 8,685 | |
Amortization | | | 3,828 | | | | 3,542 | | | | 3,507 | |
Net gain on legal settlement, net of cash | | | (981 | ) | | | 0 | | | | 0 | |
Amortization of debt issuance cost | | | 0 | | | | 73 | | | | 74 | |
Gain on disposal of fixed assets | | | 0 | | | | 0 | | | | (28 | ) |
Non-cash reduction to value of long-term investment | | | 0 | | | | 0 | | | | 677 | |
Provision for doubtful accounts | | | (27 | ) | | | 22 | | | | (9 | ) |
Share based compensation | | | 6,590 | | | | 6,835 | | | | 6,368 | |
Excess tax benefit upon vesting of restricted stock units and stock option exercises | | | (7,214 | ) | | | (1,337 | ) | | | (522 | ) |
Amortization of non-cash consideration exchanged for additional investment | | | 0 | | | | (1,146 | ) | | | (1,236 | ) |
Amortization of deferred subscription solicitation costs | | | 44,918 | | | | 24,201 | | | | 19,276 | |
Foreign currency transaction gains, net | | | (94 | ) | | | (463 | ) | | | 0 | |
Goodwill, intangible and long-lived asset impairment charges | | | 0 | | | | 1,804 | | | | 1,327 | |
Changes in assets and liabilities, net of businesses acquired: | | | | | | | | | | | | |
Accounts receivable | | | (6,300 | ) | | | 2,082 | | | | 1,204 | |
Prepaid expenses and other current assets | | | (1,180 | ) | | | 1,300 | | | | (374 | ) |
Income tax, net | | | (2,027 | ) | | | (702 | ) | | | 4,096 | |
Deferred subscription solicitation costs | | | (32,454 | ) | | | (16,418 | ) | | | (17,825 | ) |
Other assets | | | 455 | | | | 908 | | | | 2,310 | |
Accounts payable | | | (3,431 | ) | | | 2,360 | | | | (2,866 | ) |
Accrued expenses and other current liabilities | | | (1,368 | ) | | | 950 | | | | (685 | ) |
Accrued payroll and employee benefits | | | 2,865 | | | | (2,267 | ) | | | 257 | |
Commissions payable | | | (92 | ) | | | (31 | ) | | | (162 | ) |
Deferred revenue | | | (116 | ) | | | 49 | | | | (1,120 | ) |
Deferred income tax, net | | | 3,168 | | | | (1,805 | ) | | | (1,645 | ) |
Other long-term liabilities | | | 1,342 | | | | (424 | ) | | | (632 | ) |
| | | | | | | | | | | | |
Cash flows provided by operating activities | | | 35,548 | | | | 48,946 | | | | 23,087 | |
| | | | | | | | | | | | |
CASH FLOWS USED IN INVESTING ACTIVITIES: | | | | | | | | | | | | |
Acquisition of property and equipment | | | (11,543 | ) | | | (5,168 | ) | | | (4,890 | ) |
Proceeds from reimbursements for property and equipment | | | 1,220 | | | | 157 | | | | 0 | |
Proceeds from sale of short-term investments | | | 4,994 | | | | 0 | | | | 0 | |
Note receivable | | | 0 | | | | (500 | ) | | | 0 | |
Purchase of additional interest in long-term investment | | | 0 | | | | (2,250 | ) | | | (1,464 | ) |
Proceeds from the sale of discontinued operations | | | 1,750 | | | | 0 | | | | 0 | |
| | | | | | | | | | | | |
Cash flows used in investing activities | | | (3,579 | ) | | | (7,761 | ) | | | (6,354 | ) |
| | | | | | | | | | | | |
CASH FLOWS USED IN FINANCING ACTIVITIES: | | | | | | | | | | | | |
Borrowings under Credit Agreement | | | 20,000 | | | | 0 | | | | 0 | |
Repayments under Credit Agreement | | | 0 | | | | (20,000 | ) | | | 0 | |
Capital lease payments | | | (1,709 | ) | | | (1,423 | ) | | | (701 | ) |
Cash dividends paid on common shares | | | (12,082 | ) | | | (23,275 | ) | | | (14,444 | ) |
Cash distribution on vesting of restricted stock units | | | 0 | | | | 0 | | | | (1,849 | ) |
Cash proceeds from stock option exercises | | | 933 | | | | 1,061 | | | | 212 | |
Excess tax benefit upon vesting of restricted stock units and stock option exercises | | | 7,214 | | | | 1,337 | | | | 522 | |
Withholding tax payment on vesting of restricted stock units and stock option exercises | | | (10,341 | ) | | | (3,416 | ) | | | (2,711 | ) |
Purchase of treasury stock | | | (19,603 | ) | | | (744 | ) | | | (2,401 | ) |
| | | | | | | | | | | | |
Cash flows used in financing activities | | | (15,588 | ) | | | (46,460 | ) | | | (21,372 | ) |
| | | | | | | | | | | | |
INCREASE (DECREASE) IN CASH AND CASH EQUIVALENTS | | | 16,381 | | | | (5,275 | ) | | | (4,639 | ) |
CASH AND CASH EQUIVALENTS — Beginning of period | | | 14,453 | | | | 30,834 | | | | 25,559 | |
| | | | | | | | | | | | |
CASH AND CASH EQUIVALENTS — End of period | | $ | 30,834 | | | $ | 25,559 | | | $ | 20,920 | |
| | | | | | | | | | | | |
SUPPLEMENTAL DISCLOSURES OF CASH FLOW INFORMATION: | | | | | | | | | | | | |
Cash paid for interest | | $ | 622 | | | $ | 313 | | | $ | 131 | |
| | | | | | | | | | | | |
Cash paid for taxes | | $ | 12,339 | | | $ | 16,587 | | | $ | 2,847 | |
| | | | | | | | | | | | |
SUPPLEMENTAL DISCLOSURE OF NONCASH FINANCING AND INVESTING ACTIVITIES: | | | | | | | | | | | | |
Equipment obtained under capital lease | | $ | 318 | | | $ | 0 | | | $ | 1,688 | |
| | | | | | | | | | | | |
Equipment additions accrued but not paid | | $ | 935 | | | $ | 289 | | | $ | 331 | |
| | | | | | | | | | | | |
Non-cash consideration exchanged for additional investment | | $ | 0 | | | $ | 3,000 | | | $ | 0 | |
| | | | | | | | | | | | |
See notes to consolidated financial statements.
F-5
INTERSECTIONS INC.
NOTES TO CONSOLIDATED FINANCIAL STATEMENTS
Years Ended December 31, 2011, 2012 and 2013
| 1. | Organization and Business |
Our identity theft protection and credit information management products and services provide multiple benefits to consumers, including access to their credit reports, credit monitoring, educational scores, credit education, reports and monitoring of additional information, identity theft recovery services, identity theft cost reimbursement insurance, and software and other technology tools and services. An individual consumer subscription may include access to some or all of these benefits. Our membership and insurance products and services are offered by our subsidiary, Intersections Insurance Services, and include accidental death and disability insurance and access or purchasing programs for healthcare, home, auto, financial and other services and information. Our consumer products and services historically have been offered primarily through relationships with clients, including many of the largest financial institutions in the United States and Canada, and clients in other industries.
In addition, we also offer many of our services directly to consumers. We conduct our consumer direct marketing primarily through online affiliates, search engine marketing and broadcast media. We also may market through other channels, including direct mail, print marketing, telemarketing and email. We also market our IDENTITY GUARD® products in conjunction with relationships outside the financial services industry.
We have three reportable operating segments with continuing operations through the year ended December 31, 2013. Our Consumer Products and Services segment includes our identity theft protection and credit information management, data breach response, insurance and membership products and services and VOYCETM, our new platform and service for pet owners we are in the process of launching. Our Bail Bonds Industry Solutions segment includes the software management solutions for the bail bond industry provided by our subsidiary Captira Analytical. Our Market Intelligence segment includes our market intelligence platform provided by our subsidiary Intersections Business Intelligence Services under the Zumetrics® brand. Prior to the second quarter of 2013, our Market Intelligence services were included in our Online Brand Protection segment along with our Net Enforcers subsidiary. In the three months ended June 30, 2013, we ceased operations at Net Enforcers.
| 2. | Basis of Presentation and Summary of Significant Accounting Policies |
Basis of Presentation and Consolidation
The accompanying consolidated financial statements have been prepared by us in accordance with accounting principles generally accepted in the United States of America (U.S. GAAP) and applicable rules and regulations of the Securities and Exchange Commission and in management’s opinion reflect all adjustments necessary for a fair presentation of results of operations, financial position and cash flows for the periods presented. They include the accounts of the company and our subsidiaries. The results of Net Enforcers, a subsidiary which ceased operations in the three months ended June 30, 2013, are presented in discontinued operations for all prior periods in our consolidated statements of operations. We have not recast our consolidated balance sheets or our consolidated statements of cash flows. See Note 20 for additional information. Our decision to consolidate an entity is based on our assessment that we have a controlling financial interest in such entity. All intercompany transactions have been eliminated.
During the year ended December 31, 2011, we revised our statement of changes in stockholders’ equity for all prior periods to remove equity items that should not have been included in the presentation of comprehensive income or loss. Based upon an evaluation of all relevant quantitative and qualitative factors, and after considering the applicable provisions within U.S. GAAP, we do not believe this revision was material to our consolidated statement of changes in stockholders’ equity for any period. We have adopted the provisions of an update to
F-6
INTERSECTIONS INC.
NOTES TO CONSOLIDATED FINANCIAL STATEMENTS — (Continued)
“Comprehensive Income” as of January 1, 2012 and due to immateriality of comprehensive income historically and in the years ended December 31, 2011, 2012 and 2013, we are not required to present comprehensive income and therefore, have not adjusted our financial statement presentation or the related notes.
Use of Estimates
The preparation of financial statements in conformity with U.S. GAAP requires management to make estimates and assumptions that affect reported amounts of assets and liabilities and disclosure of contingent assets and liabilities at the date of the financial statements and the reported amounts of revenues and expenses during the reporting period. Actual results could differ materially from those estimates.
Revenue Recognition
We recognize revenue on 1) identity theft and credit management services, 2) accidental death insurance and 3) other monthly membership products.
Our products and services are offered to consumers principally on a monthly subscription basis. Subscription fees are generally billed directly to the subscriber’s credit card, debit card, mortgage bill or demand deposit accounts by our clients, but may be billed by us in some circumstances. The prices to subscribers of various configurations of our products and services range generally from $4.99 to $25.00 per month. As a means of allowing customers to become familiar with our services, our subscriptions typically are offered with trial, delayed billing or guaranteed refund periods. No revenues are recognized until applicable trial periods are completed.
Identity Theft and Credit Management Services
We recognize revenue from our services when: a) persuasive evidence of an arrangement exists as we maintain signed contracts with all of our large financial institution customers and paper and electronic confirmations with individual purchasers, b) delivery has occurred, c) the seller’s price to the buyer is fixed as sales are generally based on contract or list prices and payments from large financial institutions are collected within 30 to 45 days with no significant write-offs, and d) collectability is reasonably assured as individual customers pay by credit card which has limited our risk of non-collection. Revenue for monthly subscriptions is recognized in the month the subscription fee is earned. We also generate revenue through a collaborative arrangement which involves joint marketing and servicing activities. We recognize our share of revenues and expenses from this arrangement.
Revenue for annual subscription fees must be deferred if the subscriber has the right to cancel the service. Annual subscriptions include subscribers with full refund provisions at any time during the subscription period and pro-rata refund provisions. Revenue related to annual subscriptions with full refund provisions is recognized on the expiration of these refund provisions. Revenue related to annual subscribers with pro-rata provisions is recognized based on a pro rata share of revenue earned. An allowance for discretionary subscription refunds is established based on our historical experience. For subscriptions with refund provisions whereby only the prorated subscription fee is refunded upon cancellation by the subscriber, deferred subscription fees are recorded when billed and amortized as subscription fee revenue on a straight-line basis over the subscription period, generally one year.
We also provide services for which certain financial institution clients are the primary obligors directly to their customers. Revenue from these arrangements is recognized when earned, which is at the time we provide the service, generally on a monthly basis. In some instances, we recognize revenue for the delivery of operational services including but not limited to fulfillment events, information technology development hours or customer service minutes, rather than per customer fees.
F-7
INTERSECTIONS INC.
NOTES TO CONSOLIDATED FINANCIAL STATEMENTS — (Continued)
We record revenue on a gross basis in the amount that we bill the subscriber when our arrangements with financial institution clients provide for us to serve as the primary obligor in the transaction, we have latitude in establishing price and we bear the credit risk for the amount billed to the subscriber. We record revenue in the amount that we bill our financial institution clients, and not the amount billed to their customers, when our financial institution client is the primary obligor, establishes price to the customer and bears the credit risk.
Accidental Death Insurance
We recognize revenue from our services when: a) persuasive evidence of an arrangement exists as we maintain paper and electronic confirmations with individual purchasers, b) delivery has occurred at the completion of a product trial period, c) the seller’s price to the buyer is fixed as the price of the product is agreed to by the customer as a condition of the sales transaction which established the sales arrangement, and d) collectability is reasonably assured as evidenced by our collection of revenue through the monthly mortgage payments of our customers or through checking account debits to our customers’ accounts. Revenues from insurance contracts are recognized when earned. Marketing of our insurance products generally involves a trial period during which time the product is made available at no cost to the customer. No revenues are recognized until applicable trial periods are completed.
For insurance products, we record revenue on a net basis as we perform as an agent or broker for the insurance products without assuming the risks of ownership of the insurance products.
We participate in agency relationships with insurance carriers that underwrite insurance products offered by us. Accordingly, insurance premiums collected from customers and remitted to insurance carriers are excluded from our revenues and operating expenses. Insurance premiums collected but not remitted to insurance carriers as of December 31, 2012 and 2013 totaled $725 thousand and $609 thousand, respectively, and are included in accrued expenses and other current liabilities in our consolidated balance sheets.
Other Membership Products
For membership products, we record revenue on a gross basis as we serve as the primary obligor in the transactions, have latitude in establishing price and bear credit risk for the amount billed to the subscriber.
We generate revenue from other types of subscription based products provided from our Market Intelligence and Bail Bonds Industry Solutions segments. We recognize revenue from business intelligence services on a monthly or transactional basis. We also recognize revenue from providing management service solutions on a monthly subscription or transactional basis.
Goodwill, Identifiable Intangibles and Other Long Lived Assets
We record, as goodwill, the excess of the purchase price over the fair value of the identifiable net assets acquired in purchase transactions. We review our goodwill for impairment annually, as of October 31, or more frequently if indicators of impairment exist. Goodwill has been assigned to our reporting units for purposes of impairment testing. As of December 31, 2013, goodwill of $43.2 million resides in our Consumer Products and Services reporting unit, resulting from our acquisition of Intersections Insurance Services Inc., which has been evaluated as part of our Consumer Products and Services reporting unit. There is no goodwill remaining in our other reporting units.
On January 1, 2012, we adopted an accounting standard update, commonly referred to as the step zero approach, that allows us to first assess qualitative factors to determine whether it is necessary to perform the two-step quantitative goodwill impairment test. For reporting units in which the qualitative assessment concludes it is
F-8
INTERSECTIONS INC.
NOTES TO CONSOLIDATED FINANCIAL STATEMENTS — (Continued)
more likely than not that the fair value is more than its carrying value, the amended guidance eliminates the requirement to perform further goodwill impairment testing. For those reporting units where a significant change or event occurs, and where potential impairment indicators exist, we continue to utilize a two-step quantitative assessment to testing goodwill for impairment. A significant amount of judgment is involved in determining if an indicator of impairment has occurred. Such indicators may include, among others (a) a significant decline in our expected future cash flows; (b) a sustained, significant decline in our stock price and market capitalization; (c) a significant adverse change in legal factors or in the business climate; (d) unanticipated competition; (e) the testing for recoverability of a significant asset group within a reporting unit; and (f) slower growth rates. Any adverse change in these factors could have a significant impact on the recoverability of these assets and could have a material impact in our consolidated financial statements.
The goodwill impairment test involves a two-step process. The first step is a comparison of each reporting unit’s fair value to its carrying value. We estimate fair value using the best information available, using a combined income approach (discounted cash flow) and market based approach. The market approach measures the value of an entity through an analysis of recent sales or offerings of comparable companies. The income approach measures the value of the reporting units by the present values of its economic benefits. These benefits can include revenue and cost savings. Value indications are developed by discounting expected cash flows to their present value at a rate of return that incorporates the risk-free rate for use of funds, trends within the industry, and risks associated with particular investments of similar type and quality as of the valuation date.
The estimated fair value of our reporting units is dependent on several significant assumptions, including our earnings projections, and cost of capital (discount rate). The projections use management’s best estimates of economic and market conditions over the projected period including business plans, growth rates in sales, costs, and estimates of future expected changes in operating margins and cash expenditures. Other significant estimates and assumptions include terminal value growth rates, estimates of future capital expenditures and changes in future working capital requirements. There are inherent uncertainties related to these factors and management’s judgment in applying each to the analysis of the recoverability of goodwill.
We estimate fair value giving consideration to both the income and market approaches. Consideration is given to the line of business and operating performance of the entities being valued relative to those of actual transactions, potentially subject to corresponding economic, environmental, and political factors considered to be reasonable investment alternatives.
If the estimated fair value of a reporting unit exceeds its carrying value, goodwill of the reporting unit is not impaired and the second step of the impairment test is not necessary. If the carrying value of the reporting unit exceeds its estimated fair value, then the second step of the goodwill impairment test must be performed. The second step of the goodwill impairment test compares the implied fair value of the reporting unit’s goodwill with its goodwill carrying value to measure the amount of impairment charge, if any. The implied fair value of goodwill is determined in the same manner as the amount of goodwill recognized in a business combination. In other words, the estimated fair value of the reporting unit is allocated to all of the assets and liabilities of that unit (including any unrecognized intangible assets) as if the reporting unit had been acquired in a business combination and the fair value of that reporting unit was the purchase price paid. If the carrying value of the reporting unit’s goodwill exceeds the implied fair value of that goodwill, an impairment charge is recognized in an amount equal to that excess.
We review long-lived assets, including finite-lived intangible assets, property and equipment and other long term assets, for impairment whenever events or changes in circumstances indicate that the carrying amounts of the assets may not be fully recoverable. Significant judgments in this area involve determining whether a triggering event has occurred and determining the future cash flows for assets involved. In conducting our analysis, we would compare the
F-9
INTERSECTIONS INC.
NOTES TO CONSOLIDATED FINANCIAL STATEMENTS — (Continued)
undiscounted cash flows expected to be generated from the long-lived assets to the related net book values. If the undiscounted cash flows exceed the net book value, the long-lived assets are considered not to be impaired. If the net book value exceeds the undiscounted cash flows, an impairment charge is measured and recognized. An impairment charge is measured as the difference between the net book value and the fair value of the long-lived assets. Fair value is estimated by discounting the future cash flows associated with these assets.
Intangible assets subject to amortization may include customer, marketing and technology related intangibles, as well as trademarks. Such intangible assets, excluding customer related intangibles, are amortized on a straight-line basis over their estimated useful lives, which are generally three to ten years. Customer related intangible assets are amortized on either a straight-line or accelerated basis, dependent upon the pattern in which the economic benefits of the intangible asset are consumed or otherwise used up.
Deferred Subscription Solicitation and Advertising
Our deferred subscription solicitation costs consist of subscription acquisition costs, including telemarketing, web-based marketing expenses and direct mail such as printing and postage. We expense advertising costs the first time advertising takes place, except for direct-response marketing costs. Telemarketing, web-based marketing and direct mail expenses are direct response marketing costs, which are amortized on a cost pool basis over the period during which the future benefits are expected to be received, but no more than 12 months. The recoverability of amounts capitalized as deferred subscription solicitation costs are evaluated at each balance sheet date by comparing the carrying amounts of such assets on a cost pool basis to the probable remaining future benefit expected to result directly from such advertising costs. Probable remaining future benefit is estimated based upon historical subscriber patterns, and represents net revenues less costs to earn those revenues. In estimating probable future benefit (on a per subscriber basis) we deduct our contractual cost to service that subscriber from the known sales price. We then apply the future benefit (on a per subscriber basis) to the number of subscribers expected to be retained in the future to arrive at the total probable future benefit. In estimating the number of subscribers we will retain (i.e., factoring in expected cancellations), we utilize historical subscriber patterns maintained by us that show attrition rates by client, product and marketing channel. The total probable future benefit is then compared to the costs of a given marketing campaign (i.e., cost pools), and if the probable future benefit exceeds the cost pool, the amount is considered to be recoverable. If direct response advertising costs were to exceed the estimated probable remaining future benefit, an adjustment would be made to the deferred subscription costs to the extent of any shortfall.
Commission Costs
Commissions that relate to annual subscriptions with full refund provisions and monthly subscriptions are expensed when incurred, unless we are entitled to a refund of the commissions from our client. If annual subscriptions are cancelled prior to their initial terms, we are generally entitled to a full refund of the previously paid commission for those annual subscriptions with a full refund provision and a pro-rata refund, equal to the unused portion of the subscription, for those annual subscriptions with a pro-rata refund provision. Commissions that relate to annual subscriptions with full commission refund provisions are deferred until the earlier of expiration of the refund privileges or cancellation. Once the refund privileges have expired, the commission costs are recognized ratably in the same pattern that the related revenue is recognized. Commissions that relate to annual subscriptions with pro-rata refund provisions are deferred and charged to operations as the corresponding revenue is recognized. If a subscription is cancelled, upon receipt of the refunded commission from our client, we record a reduction to the deferred commission.
Share-Based Compensation
We currently have three equity incentive plans, the 1999 and 2004 Stock Option Plans and the 2006 Stock Incentive Plan. The 2006 Stock Incentive Plan provides us with the opportunity to compensate selected
F-10
INTERSECTIONS INC.
NOTES TO CONSOLIDATED FINANCIAL STATEMENTS — (Continued)
employees with stock options, restricted stock and restricted stock units. A stock option entitles the recipient to purchase shares of common stock from us at the specified exercise price. Restricted stock and restricted stock units (“RSUs”) entitle the recipient to obtain stock or stock units, $.01 par value, which vests over a set period of time. RSUs are granted at no cost to the employee and employees do not need to pay an exercise price to obtain the underlying common stock. All grants or awards made under the Plans are governed by written agreements between us and the participants. The active period for the 1999 Plan expired on August 24, 2009 and the active period for the 2004 Plan expires on May 5, 2014.
We use the Black-Scholes option-pricing model to value all options and the straight-line method to amortize this fair value as compensation cost over the requisite service period. The fair value of each option granted has been estimated as of the date of grant with the following weighted-average assumptions:
| | | | |
| | | 2011 | |
Expected dividend yield | | | 4.5 | % |
Expected volatility | | | 73.8 | % |
Risk-free interest rate | | | 2.48 | % |
Expected term of options | | | 6.2 years | |
In the years ended December 31, 2012 and 2013, respectively, we did not grant options.
Expected Dividend Yield. The Black-Scholes valuation model requires an expected dividend yield as an input. We apply a dividend yield based on our history and expectation of dividend payouts.
Expected Volatility. The expected volatility of options granted is estimated based solely upon our historical share price volatility. We will continue to review our estimate in the future.
Risk free Interest Rate. The yield on actively traded non-inflation indexed U.S. Treasury notes was used to extrapolate an average risk free interest rate based on the expected term of the underlying grants.
Expected Term. The expected term of options granted is based upon historical experience and represents the period of time that options granted are expected to be outstanding.
In addition, we estimate forfeitures based on historical stock option and restricted stock unit activity on a grant by grant basis. Therefore, we may make changes to that estimate throughout the vesting period based on actual activity.
Long-Term Investment
We account for investments in non-consolidated entities using the cost method of accounting under U.S. GAAP. We have a long-term investment in convertible preferred stock of White Sky, Inc., a privately held company. We concluded that the convertible preferred stock does not meet the definition of in-substance common stock for reasons including, but not limited to, the substantive liquidation preferences and favorable redemption provisions as compared to other equity in White Sky. Therefore, we continue to account for our investment as a cost method investment.
We regularly review our investments for indications that fair value is less than the carrying value for reasons that are other than temporary. A significant amount of judgment is involved in determining if an indicator of impairment has occurred. Such indicators may include, among others (a) a significant deterioration in the earnings performance, credit rating, asset quality, or business prospects of the investee; (b) a significant adverse change in the regulatory, economic, or technological environment of the investee; (c) a significant adverse
F-11
INTERSECTIONS INC.
NOTES TO CONSOLIDATED FINANCIAL STATEMENTS — (Continued)
change in the general market conditions of either the geographic area or the industry in which the investee operates; (d) a bona fide offer to purchase, an offer by the investee to sell, or a completed auction process for the same or similar security for an amount less than the cost of the investment; (e) factors that raise significant concerns about the investee’s ability to continue as a going concern, such as negative cash flows from operations, working capital deficiencies, or noncompliance with statutory capital requirements or debt covenants. Any adverse change in these factors could have a significant impact on the recoverability of our investments and could have a material impact in our consolidated financial statements.
For purposes of our analysis, we take into consideration the features, if any, or varying provisions of each equity or debt security owned. For investments measured on a non-recurring basis, we estimate the fair value of our long-term investments by using the income approach based on discounted cash flows and the market based approach as appropriate. We use various assumptions when determining the expected discounted cash flows including earnings projections, an appropriate cost of capital, long-term growth rate and intentions for how long we will hold the investments. Our investments are impaired if the fair value of the investments is less than carrying value.
Income Taxes
We account for income taxes under the applicable provisions of U.S. GAAP, which requires an asset and liability approach to financial accounting and reporting for income taxes. Deferred tax assets and liabilities are recognized for future tax consequences attributable to differences between the financial statement carrying amounts of existing assets and liabilities and their respective tax bases. Valuation allowances are provided, if, based upon the weight of the available evidence, it is more likely than not that some or all of the deferred tax assets will not be realized.
We believe that our tax positions comply with applicable tax law. As a matter of course, we may be audited by various taxing authorities and these audits may result in proposed assessments where the ultimate resolution may result in us owing additional taxes. U.S. GAAP addresses the determination of whether tax benefits claimed or expected to be claimed on a tax return should be recorded in the financial statements. We may recognize the tax benefit from an uncertain tax position only if it is more likely than not that the tax position will be sustained on examination by the taxing authorities, based on the technical merits of the position. The tax benefits recognized in the financial statements from such a position should be measured based on the largest benefit that has a greater than fifty percent likelihood of being realized upon ultimate settlement. U.S. GAAP provides guidance on how an enterprise should determine whether a tax position is effectively settled for the purpose of recognizing previously unrecognized tax benefits.
Cash and Cash Equivalents
We consider all highly liquid investments, including those with an original maturity of 90 days or less, to be cash equivalents. Cash and cash equivalents consist primarily of interest-bearing accounts and short-term U.S. treasury securities with original maturities less than or equal to 90 days. Interest income on these short-term investments is recognized when earned.
F-12
INTERSECTIONS INC.
NOTES TO CONSOLIDATED FINANCIAL STATEMENTS — (Continued)
Property and Equipment
Property and equipment, including property and equipment under finance leases, are recorded at cost and are depreciated on a straight-line basis over the following estimated useful lives:
| | |
| | | Life |
| | | (In years) |
Machinery and equipment | | 3-5 |
Software | | 3-5 |
Furniture and fixtures | | 5 |
Leasehold improvements | | Remaining lease term |
Building | | 30 |
Fair Value Measurements
We account for certain assets and liabilities at fair value in accordance with U.S. GAAP. Fair value is defined as the price that would be received to sell an asset or paid to transfer a liability in an orderly transaction between market participants. The framework for measuring fair value provides a hierarchy that prioritizes the inputs to valuation techniques used in measuring fair value. The hierarchy gives the highest priority to unadjusted quoted prices in active markets for identical assets or liabilities and the lowest priority to unobservable inputs. The three levels of the fair value hierarchy are as follows:
Level 1 — Inputs to the valuation methodology are unadjusted quoted prices for identical assets or liabilities in active markets.
Level 2 — Inputs to the valuation methodology include: quoted prices for similar assets or liabilities in active markets; quoted prices for identical or similar assets or liabilities in inactive markets; inputs other than quoted prices that are observable for the asset or liability; inputs that are derived principally from or corroborated by observable market data by correlation or other means.
Level 3 — Inputs to the valuation methodology are unobservable and significant to the fair value measurement.
We account for derivative instruments and short-term U.S. treasury securities using recurring fair value measures. Our goodwill, intangible and long-lived assets, which includes our long term investment, are subject to non-recurring fair value measures.
For financial instruments such as cash and cash equivalents, short-term government debt instruments, trade accounts receivables, notes receivable notes payable, leases payable, accounts payable and short-term and long-term debt, we consider the recorded value of the financial instruments to approximate the fair value based on the liquidity of these financial instruments.
Software Development Costs
We develop software for our internal use and capitalize these software development costs incurred during the application development stage in accordance with U.S. GAAP. Costs incurred prior to and after the application development stage are charged to expense. When the software is ready for its intended use, capitalization ceases and such costs are amortized on a straight-line basis over the estimated life, which is generally three to five years.
We regularly review our capitalized software projects for impairment. We had no impairments in the years ended December 31, 2011 and 2013. During the year ended December 31, 2012, as part of our regular review of
F-13
INTERSECTIONS INC.
NOTES TO CONSOLIDATED FINANCIAL STATEMENTS — (Continued)
capitalized software projects in accordance with U.S. GAAP, we, together with a particular client, reassessed a custom software development effort related to a web based platform prior to it being placed in service, and therefore recorded a charge of $1.2 million, which was the total capitalized balance.
Research and Development Costs
Our subsidiary, i4c Innovations, has incurred costs in developing their VOYCETM platform and service, which we consider to be research and development expenses. In accordance with U.S. GAAP, expenditures for research and development of our new products and services are expensed as incurred and are included in general and administrative expenses in our consolidated statements of operations. We include costs incurred for materials, rights to use intangible assets developed by others, outside contract services and a reasonable allocation of payroll costs. We expense research and development costs until the product or service has achieved specific functional and economic requirements and is ready for manufacture. For the years ended December 31, 2012 and 2013, we incurred research and development costs of $649 thousand and $4.3 million, respectively.
Treasury Stock
We account for treasury stock under the cost method and include treasury stock as a component of stockholders’ equity. In the years ended December 31, 2011, 2012 and 2013, we repurchased 1.7 million, 71 thousand and 250 thousand shares, respectively, of our common stock.
Segment Reporting
We have three reportable operating segments with continuing operations through the year ended December 31, 2013. Our Consumer Products and Services segment includes our identity theft protection and credit information management, data breach response, insurance and membership products and services and VOYCETM, our new platform and service for pet owners we are in the process of launching. Our Bail Bonds Industry Solutions segment includes the software management solutions for the bail bond industry provided by our subsidiary Captira Analytical. Our Market Intelligence segment includes our market intelligence platform provided by our subsidiary Intersections Business Intelligence Services under the Zumetrics® brand. Prior to the second quarter of 2013, our Market Intelligence services were included in our Online Brand Protection segment along with our Net Enforcers subsidiary. In the three months ended June 30, 2013, we ceased operations at Net Enforcers.
| 3. | Accounting Standards Updates |
Accounting Standards Updates Recently Adopted
In December 2011, an update was made to “Balance Sheet”. This update requires an entity to disclose information about offsetting and related arrangements to enable users of financial statements to understand the effect of those arrangements. The amendments in this update are effective for annual reporting periods beginning on or after January 1, 2013, and interim periods within those annual periods. The disclosures required by this amendment will be applied retrospectively for all comparative periods. We have adopted the provisions of this update as of January 1, 2013 and there was no material impact to our consolidated financial statements.
In February 2013, an update was made to “Comprehensive Income”. The amendments in this Update require an entity to provide information about the amounts reclassified out of accumulated other comprehensive income by component. In addition, an entity is required to present, either on the face of the statement where net income is presented or in the notes, significant amounts reclassified out of accumulated other comprehensive income by the respective line items of net income but only if the amount reclassified is required under U.S. GAAP to be
F-14
INTERSECTIONS INC.
NOTES TO CONSOLIDATED FINANCIAL STATEMENTS — (Continued)
reclassified in their entirety to net income, an entity is required to cross-reference to other disclosures required under U.S. GAAP that provide additional detail about those amounts. The amendments in this update are effective prospectively for reporting periods beginning after December 15, 2012. We have adopted the provisions of this update as of January 1, 2013 and there was no material impact to our consolidated financial statements.
In December 2013, an update was made to the Master Glossary. The addition minimized the inconsistency and complexity of having multiple definitions of, or a diversity in practice as to what constitutes, a nonpublic entity and public entity within U.S. GAAP on a going-forward basis. The amendments in this update do not effect existing requirements and are effective prospectively for future financial accounting and reporting guidance. We have adopted the provisions of this update as of December 31, 2013 and there was no material impact to our consolidated financial statements.
Accounting Standards Updates Not Yet Effective
In February 2013, an update was made to “Liabilities”. The guidance in this Update requires an entity to measure obligations resulting from joint and several liability arrangements for which the total amount of the obligation within the scope of this guidance is fixed at the reporting date, as the sum of the following: the amount the reporting entity agreed to pay on the basis of its arrangement amount with its co-obligors and any additional amount the reporting entity expects to pay on behalf of its co-obligors. The guidance in this Update also requires an entity to disclose the nature and amount of the obligation as well as other information about those obligations. The amendments in this update are effective for fiscal years, and interim periods within those years, beginning after December 15, 2013. The amendments should be applied retrospectively to all periods presented. Early adoption is permitted. We will adopt the provisions of this update as of January 1, 2014 and do not anticipate a material impact to our consolidated financial statements.
In April 2013, an update was made to “Presentation of Financial Statements”. The guidance in this Update requires an entity to prepare its financial statements using the liquidation basis of accounting when liquidation is imminent. The amendments in this update are effective for entities that determine liquidation is imminent during annual reporting periods beginning after December 15, 2013, and interim reporting periods therein. We will adopt the provisions of this update as of January 1, 2014 and do not anticipate a material impact to our consolidated financial statements.
In July 2013, an update was made to “Income Taxes”. The guidance in this Update state that an unrecognized tax benefit should be presented in the financial statements as a reduction to a deferred tax asset for a net operating loss carryforward, a similar tax loss, or a tax credit carryforward, except as follows. To the extent a net operating loss carryforward, a similar tax loss, or a tax credit carryforward is not available at the reporting date under the tax law of the applicable jurisdiction to settle any additional income taxes that would result from the disallowance of a tax position or the tax law of the applicable jurisdiction does not require the entity to use, and the entity does not intend to use, the deferred tax asset for such purpose, the unrecognized tax benefit should be presented in the financial statements as a liability and should not be combined with deferred tax assets. The amendments in this update are effective for fiscal years, and interim periods within those years, beginning after December 15, 2013. Early adoption is permitted. We will adopt the provisions of this update as of January 1, 2014 and do not anticipate a material impact to our consolidated financial statements.
| 4. | Earnings Per Common Share |
Basic and diluted earnings per common share is determined in accordance with the applicable provisions of U.S. GAAP. Basic earnings per common share is computed using the weighted average number of shares of common stock outstanding for the period. Diluted earnings per common share is computed using the weighted
F-15
INTERSECTIONS INC.
NOTES TO CONSOLIDATED FINANCIAL STATEMENTS — (Continued)
average number of shares of common stock, adjusted for the dilutive effect of potential common stock. Potential common stock, computed using the treasury stock method or the if-converted method, includes the potential exercise of stock options under our share-based employee compensation plans and our restricted stock units.
For the years ended December 31, 2011, 2012 and 2013, options to purchase 263 thousand, 318 thousand and 385 thousand shares of common stock, respectively, were excluded from the computation of diluted income per common share as their effect would be anti-dilutive. These shares could dilute earnings per common share in the future.
A reconciliation of basic earnings per common share to diluted earnings per common share is as follows (in thousands, except per share data):
| | | | | | | | | | | | |
| | | 2011 | | | 2012 | | | 2013 | |
Income from continuing operations | | $ | 19,254 | | | $ | 19,975 | | | $ | 2,419 | |
Loss from discontinued operations | | | (629 | ) | | | (275 | ) | | | (9 | ) |
| | | | | | | | | | | | |
Net income available to common shareholders — basic and diluted | | $ | 18,625 | | | $ | 19,700 | | | $ | 2,410 | |
| | | | | | | | | | | | |
Weighted average common shares outstanding — basic | | | 17,214 | | | | 17,807 | | | | 18,072 | |
Dilutive effect of common stock equivalents | | | 1,953 | | | | 1,204 | | | | 778 | |
| | | | | | | | | | | | |
Weighted average common shares outstanding — diluted | | | 19,167 | | | | 19,011 | | | | 18,850 | |
| | | | | | | | | | | | |
Basic earnings per common share: | | | | | | | | | | | | |
Income from continuing operations | | $ | 1.12 | | | $ | 1.12 | | | $ | 0.13 | |
Loss from discontinued operations | | $ | (0.04 | ) | | $ | (0.01 | ) | | $ | 0.00 | |
| | | | | | | | | | | | |
Basic earnings per common share | | $ | 1.08 | | | $ | 1.11 | | | $ | 0.13 | |
Diluted earnings per common share: | | | | | | | | | | | | |
Income from continuing operations | | $ | 1.00 | | | $ | 1.05 | | | $ | 0.13 | |
Loss from discontinued operations | | $ | (0.03 | ) | | $ | (0.01 | ) | | $ | 0.00 | |
| | | | | | | | | | | | |
Diluted earnings per common share | | $ | 0.97 | | | $ | 1.04 | | | $ | 0.13 | |
Our cash and any investment instruments are classified within Level 1 or Level 2 of the fair value hierarchy as they are valued using quoted market prices, broker or dealer quotations, or alternative pricing sources with reasonable levels of price transparency. The types of instruments valued are based on quoted market prices in active markets and are primarily U.S. government and agency securities and money market securities. Such instruments are generally classified within Level 1 of the fair value hierarchy.
For financial instruments such as cash and cash equivalents, short-term government debt instruments, trade accounts receivables, notes receivable notes payable, leases payable, accounts payable and short-term and long-term debt, we consider the recorded value of the financial instruments to approximate the fair value based on the liquidity of these financial instruments. We did not have any transfers in or out of Level 1 and Level 2 in the years ended December 31, 2012 or 2013.
F-16
INTERSECTIONS INC.
NOTES TO CONSOLIDATED FINANCIAL STATEMENTS — (Continued)
We did not hold any instruments that are measured at fair value on a recurring basis as of December 31, 2012 or 2013. The fair value of our instruments measured on a non-recurring basis during the years ended December 31, 2012 and 2013, are as follows (in thousands):
| | | | | | | | | | | | | | | | | | | | |
| | | Fair Value Measurements Using: | |
| | | Fair Value | | | Quoted Prices
in Active
Markets for
Identical Assets
(Level 1) | | | Significant
Other
Observable
Inputs (Level 2) | | | Significant
Unobservable
Inputs (Level 3) | | | Total
Gains
(Losses) | |
Assets: | | | | | | | | | | | | | | | | | | | | |
Long-Term Investment | | | | | | | | | | | | | | | | | | | | |
December 31, 2012 | | $ | 8,924 | | | $ | 0 | | | $ | 0 | | | $ | 8,924 | | | $ | (653 | ) |
December 31, 2013 | | $ | 8,384 | | | $ | 0 | | | $ | 0 | | | $ | 8,384 | | | $ | (1,327 | ) |
The following is quantitative information about our significant unobservable inputs used in our Level 3 fair value measurements (dollars in thousands):
Quantitative Information about Level 3 Fair Value Measurements
| | | | | | | | | | | | | | | | | | | | | | | | |
| | | | | | Unobservable Quantitative Inputs Used | |
| | | Fair Value | | | Weighted
average cost of
capital | | | Long-term revenue
growth rate | | | Volatility | | | Risk free rate | | | Term until
liquidation event | |
Long-Term Investment | | | | | | | | | | | | | | | | | | | | | | | | |
December 31, 2012 | | $ | 8,924 | | | | 35 | % | | | 3 | % | | | 55 | % | | | 0.55 | % | | | 4.00 | |
December 31, 2013 | | $ | 8,384 | | | | 35 | % | | | 3 | % | | | 55 | % | | | 3.3 | % | | | 4.00 | |
During the years ended December 31, 2012 and 2013, we estimated the fair value of our long-term investment in White Sky, Inc. using the income approach based on discounted cash flows to derive the fair value of equity of White Sky. We do not believe the market or cost approach is appropriate for the investment in an early-stage development entity. In order to allocate the fair value between all the security holders of White Sky’s equity, we then used the option pricing model to determine the fair value of our investment. Based on this analysis, we determined that the fair value of our cost basis investment was less than the carrying value and therefore, we recognized an impairment charge for the years ended December 31, 2012 and 2013 of approximately $653 thousand and $1.3 million, respectively, which is included in goodwill, intangible and long-lived asset impairment charges in our consolidated statements of operations. The estimated fair value of our investment is dependent on several significant assumptions, including earnings projections, cost of capital, estimates of the volatility of White Sky’s equity and how long we will hold the investment. Changes to any of these assumptions could have a significant impact in the estimated fair value and in our consolidated financial statements and result in a fair value estimate either higher or lower than our carrying value.
At December 31, 2012 and 2013, we had no amounts outstanding under our revolving credit facility, which is a variable rate loan and therefore, fair value approximates book value.
F-17
INTERSECTIONS INC.
NOTES TO CONSOLIDATED FINANCIAL STATEMENTS — (Continued)
| 6. | Prepaid Expenses and Other Current Assets |
The components of our prepaid expenses and other current assets are as follows:
| | | | | | | | |
| | | December 31,
2012 | | | December 31,
2013 | |
| | | (In thousands) | |
Prepaid services | | $ | 1,026 | | | $ | 809 | |
Other prepaid contracts | | | 2,372 | | | | 2,813 | |
Other | | | 1,742 | | | | 1,893 | |
| | | | | | | | |
| | $ | 5,140 | | | $ | 5,515 | |
| | | | | | | | |
| 7. | Deferred Subscription Solicitation Costs |
Total deferred subscription solicitation costs included in the accompanying consolidated balance sheet as of December 31, 2012 and December 31, 2013 was $8.5 million and $7.1 million, respectively. The long-term portion, if any, of the deferred subscription solicitation costs are reported in other assets in our consolidated balance sheets and include $240 thousand for the year ended December 31, 2012. We did not have a long-term portion as of December 31, 2013. The current portion of prepaid commissions are included in the deferred subscription solicitation costs, and were $1.4 million and $7 thousand as of December 31, 2012 and 2013, respectively. Amortization of deferred subscription solicitation and commission costs, which are included in either marketing or commissions expense in our consolidated statements of operations, for the years ended December 31, 2011, 2012 and 2013 were $44.9 million, $24.2 million and $19.3 million, respectively. Marketing costs, which are included in marketing expenses in our consolidated statements of operations, as they did not meet the criteria for deferral for the years ended December 31, 2011, 2012 and 2013 were $5.5 million, $4.6 million and $7.2 million, respectively.
Property and equipment consist of the following as of:
| | | | | | | | |
| | | December 31,
2012 | | | December 31,
2013 | |
| | | (In thousands) | |
Machinery and equipment | | $ | 25,362 | | | $ | 20,741 | |
Software | | | 39,396 | | | | 36,302 | |
Software development-in-progress | | | 1,733 | | | | 2,444 | |
Furniture and fixtures | | | 1,607 | | | | 1,732 | |
Leasehold improvements | | | 4,447 | | | | 4,274 | |
Building | | | 725 | | | | 725 | |
Land | | | 25 | | | | 25 | |
| | | | | | | | |
| | | 73,295 | | | | 66,243 | |
Less: accumulated depreciation | | | (55,979 | ) | | | (51,753 | ) |
| | | | | | | | |
Property and equipment — net | | $ | 17,316 | | | $ | 14,490 | |
| | | | | | | | |
Depreciation of fixed assets and software for the years ended December 31, 2011, 2012 and 2013 were $9.0 million, $9.7 million and $8.7 million, respectively. During the years ended December 31, 2012 and 2013, we had retirements that impacted our property and equipment and accumulated depreciation balances by $4.8 million and $13.0 million, respectively.
F-18
INTERSECTIONS INC.
NOTES TO CONSOLIDATED FINANCIAL STATEMENTS — (Continued)
We regularly review our capitalized software projects for impairment. We had no impairments in the years ended December 31, 2011 and 2013. During the year ended December 31, 2012, as part of our regular review of capitalized software projects in accordance with U.S. GAAP, we, together with a particular client reassessed a custom software development effort related to a web based platform prior to it being placed in service, and therefore recorded a charge of $1.2 million, which was the total capitalized balance.
Leased property held under capital leases and included in property and equipment consists of the following as of:
| | | | | | | | |
| | | December 31,
2012 | | | December 31,
2013 | |
| | | (In thousands) | |
Leased property consisting of machinery and equipment | | $ | 3,747 | | | $ | 3,654 | |
Leased property consisting of software | | | 778 | | | | 778 | |
| | | | | | | | |
Leased property | | | 4,525 | | | | 4,432 | |
Less: accumulated depreciation | | | (2,390 | ) | | | (2,123 | ) |
| | | | | | | | |
Leased property, net | | $ | 2,135 | | | $ | 2,309 | |
| | | | | | | | |
During the year ended December 31, 2013, we disposed of fixed assets, primarily fulfillment equipment, subject to capital lease with an acquisition value of $1.8 million and accumulated depreciation of $1.1 million. In addition, we entered into new capital leases for fixed assets with an acquisition value of $1.7 million. We did not enter into any capital leases in the year ended December 31, 2012.
Our long-term investment consists of an investment in convertible preferred stock of White Sky, a privately held company. We concluded that the convertible preferred stock does not meet the definition of in-substance common stock due to substantive liquidation preferences and favorable redemption provisions as compared to other equity in White Sky. Therefore, we continue to account for our investment under the cost basis method of accounting. The following is a summary of activity in our long-term investment:
| | | | | | | | | | | | | | | | | | | | |
| | | Beginning of
Year
Carrying
Value | | | Additional Cash
Investments | | | Impairments | | | Other | | | End of Year
Carrying
Value | |
| | | (In thousands) | |
December 31, 2012 | | $ | 4,327 | | | $ | 2,250 | | | $ | (653 | ) | | $ | 3,000 | | | $ | 8,924 | |
December 31, 2013 | | $ | 8,924 | | | $ | 1,464 | | | $ | (1,327 | ) | | $ | (677 | ) | | $ | 8,384 | |
During the year ended December 31, 2012, we purchased additional shares of preferred stock in White Sky, for which we paid $2.3 million in cash and $3.0 million in additional non-cash consideration. The non-cash consideration consisted of the cancellation of an existing joint marketing arrangement. Based on our analysis, we accounted for this non-cash consideration as deferred revenue and determined that it should be amortized on a straight line basis over two years. During the year ended December 31, 2013, we exercised 1.4 million vested warrants, at a total cost of $1.5 million, in order to purchase additional shares of convertible preferred stock in White Sky. In the year ended December 31, 2013, to record the warrant payment of $1.5 million, we increased our long-term investment by $787 thousand and recorded the remaining $677 thousand to other (expense) income, net in our consolidated financial statements to more properly reflect the fair value analysis of White Sky, which was performed in the year ended December 31, 2012. As of December 31, 2013, we own 10.5 million convertible preferred shares of White Sky.
F-19
INTERSECTIONS INC.
NOTES TO CONSOLIDATED FINANCIAL STATEMENTS — (Continued)
During the years ended December 31, 2012 and 2013, we estimated the fair value of our long-term investment in White Sky, Inc. using the income approach with an appropriate cost of capital for the development stage investment. We determined that the fair value of our cost basis investment was less than the carrying value at each testing date and therefore, we recognized impairment charges of approximately $653 thousand and $1.3 million, respectively, which is included in goodwill, intangible and long-lived asset impairment charges in our consolidated statements of operations.
We have no remaining warrants to purchase equity in White Sky. However, we may elect to participate in future rounds of funding.
| 10. | Goodwill and Intangibles |
Changes in the carrying amount of goodwill are as follows (in thousands):
| | | | | | | | | | | | | | | | | | | | |
| | | December 31, 2012 | |
| | | Gross
Carrying
Amount | | | Accumulated
Impairment
Losses | | | Net Carrying
Amount at
January 1,
2012 | | | Impairment | | | Net Carrying
Amount at
December 31,
2012 | |
Consumer Products and Services | | $ | 43,235 | | | $ | 0 | | | $ | 43,235 | | | $ | 0 | | | $ | 43,235 | |
Market Intelligence | | | 11,242 | | | | (11,242 | ) | | | 0 | | | | 0 | | | | 0 | |
Bail Bonds Industry Solutions | | | 1,390 | | | | (1,390 | ) | | | 0 | | | | 0 | | | | 0 | |
| | | | | | | | | | | | | | | | | | | | |
Total goodwill | | $ | 55,867 | | | $ | (12,632 | ) | | $ | 43,235 | | | $ | 0 | | | $ | 43,235 | |
| | | | | | | | | | | | | | | | | | | | |
| | | | | | | | | | | | | | | | | | | | |
| | | December 31, 2013 | |
| | | Gross
Carrying
Amount | | | Accumulated
Impairment
Losses | | | Net Carrying
Amount at
January 1,
2013 | | | Impairment | | | Net Carrying
Amount at
December 31,
2013 | |
Consumer Products and Services | | $ | 43,235 | | | $ | 0 | | | $ | 43,235 | | | $ | 0 | | | $ | 43,235 | |
Bail Bonds Industry Solutions | | | 1,390 | | | | (1,390 | ) | | | 0 | | | | 0 | | | | 0 | |
| | | | | | | | | | | | | | | | | | | | |
Total goodwill | | $ | 44,625 | | | $ | (1,390 | ) | | $ | 43,235 | | | $ | 0 | | | $ | 43,235 | |
| | | | | | | | | | | | | | | | | | | | |
As of December 31, 2012, the $11.2 million of goodwill attributable to Net Enforcers was fully impaired. As a result of the discontinued operations accounting for Net Enforcers in the year ended December 31, 2013, we reduced both the gross carrying amount and accumulated impairment losses on our goodwill by $11.2 million.
We performed our required annual impairment test as of October 31, 2013 for our Consumer Products and Services. In the year ended December 31, 2013, this reporting unit excluded financial results of VOYCETM in accordance with U.S. GAAP. We estimated fair value using a weighting between the income and market based approaches. The implied fair value of the reporting units, at October 31, 2013, was in excess of the carrying value. Therefore, goodwill in the reporting unit was not impaired and the second step of the impairment test was not necessary. We will continue to monitor our market capitalization, along with other operational performance measures and general economic conditions. A downward trend in one or more of these factors could cause us to reduce the estimated fair value of our reporting units and recognize a corresponding impairment of our goodwill in connection with a future goodwill impairment test.
We may not be able to take sufficient cost containment actions to maintain our current operating margins in the future. In addition, due to the concentration of our significant clients in the financial industry, any significant impact to a contract held by a major client may have an effect on future revenue which could lead to additional impairment charges.
F-20
INTERSECTIONS INC.
NOTES TO CONSOLIDATED FINANCIAL STATEMENTS — (Continued)
Our intangible assets consisted of the following (in thousands):
| | | | | | | | | | | | | | | | |
| | | December 31, 2012 | |
| | | Gross
Carrying
Amount | | | Accumulated
Amortization | | | Impairment | | | Net
Carrying
Amount | |
Amortizable intangible assets: | | | | | | | | | | | | | | | | |
Customer related | | $ | 38,846 | | | $ | (31,319 | ) | | $ | 0 | | | $ | 7,527 | |
Marketing related | | | 3,192 | | | | (3,192 | ) | | | 0 | | | | 0 | |
Technology related | | | 2,796 | | | | (2,796 | ) | | | 0 | | | | 0 | |
| | | | | | | | | | | | | | | | |
Total amortizable intangible assets | | $ | 44,834 | | | $ | (37,307 | ) | | $ | 0 | | | $ | 7,527 | |
| | | | | | | | | | | | | | | | |
| | | | | | | | | | | | | | | | |
| | | December 31, 2013 | |
| | | Gross
Carrying
Amount | | | Accumulated
Amortization | | | Impairment | | | Net
Carrying
Amount | |
Amortizable intangible assets: | | | | | | | | | | | | | | | | |
Customer related | | $ | 38,691 | | | $ | (34,671 | ) | | $ | 0 | | | $ | 4,020 | |
Marketing related | | | 3,024 | | | | (3,024 | ) | | | 0 | | | | 0 | |
Technology related | | | 2,796 | | | | (2,796 | ) | | | 0 | | | | 0 | |
| | | | | | | | | | | | | | | | |
Total amortizable intangible assets | | $ | 44,511 | | | $ | (40,491 | ) | | $ | 0 | | | $ | 4,020 | |
| | | | | | | | | | | | | | | | |
As a result of the discontinued operations accounting for Net Enforcers in the year ended December 31, 2013, we reduced both the gross carrying amount and accumulated amortization on our intangible assets by $323 thousand. The intangible assets held by Net Enforcers were fully amortized.
During the years ended December 31, 2012 and 2013, there were no adverse changes in our long-lived assets, which would cause a need for an impairment analysis.
Intangible assets are generally amortized over a period of three to ten years. For the years ended December 31, 2011, 2012 and 2013 we had an aggregate amortization expense of $3.8 million, $3.5 million and $3.5 million, respectively, which was included in amortization expense in our consolidated statements of operations. We estimate that we will have the following amortization expense for the future periods indicated below (in thousands):
| | | | |
| For the years ending December 31, | | | |
2014 | | $ | 3,413 | |
2015 | | | 428 | |
2016 | | | 179 | |
| | | | |
| | $ | 4,020 | |
| | | | |
F-21
INTERSECTIONS INC.
NOTES TO CONSOLIDATED FINANCIAL STATEMENTS — (Continued)
The components of our other assets are as follows:
| | | | | | | | |
| | | December 31,
2012 | | | December 31,
2013 | |
| | | (In thousands) | |
Prepaid contracts | | $ | 318 | | | $ | 188 | |
Prepaid commissions | | | 239 | | | | 0 | |
Assets held for use | | | 1,397 | | | | 0 | |
Other | | | 2,175 | | | | 1,317 | |
| | | | | | | | |
| | $ | 4,129 | | | $ | 1,505 | |
| | | | | | | | |
In the year ended December 31, 2013, we reclassified $950 thousand of real estate assets to assets held for sale as they are actively marketed for sale and we expect to sell them within the next year. In addition, we sold the remaining real estate assets with an original acquisition value of $460 thousand for a net loss of $151 thousand in the year ended December 31, 2013, which was recorded in other income in our consolidated statements of operations. In addition, the decrease in other is partially due to forgiveness of a note receivable due from an unrelated third party in exchange for other non-cash consideration. This transaction was part of an acquisition of an intangible asset developed by others for our new products that we determined are in research and development and in accordance with U.S. GAAP, was expensed as incurred.
| 12. | Accrued Expenses and Other Current Liabilities |
The components of our accrued expenses and other liabilities are as follows:
| | | | | | | | |
| | | December 31,
2012 | | | December 31,
2013 | |
| | | (In thousands) | |
Accrued marketing | | $ | 1,880 | | | $ | 1,060 | |
Accrued cost of sales, including credit bureau costs | | | 6,598 | | | | 7,317 | |
Accrued general and administrative expense and professional fees | | | 3,764 | | | | 3,609 | |
Insurance premiums | | | 725 | | | | 609 | |
Other | | | 1,115 | | | | 913 | |
| | | | | | | | |
| | $ | 14,082 | | | $ | 13,508 | |
| | | | | | | | |
| 13. | Accrued Payroll and Employee Benefits |
The components of our accrued payroll and employee benefits are as follows:
| | | | | | | | |
| | | December 31,
2012 | | | December 31,
2013 | |
| | | (In thousands) | |
Accrued payroll | | $ | 397 | | | $ | 511 | |
Accrued benefits | | | 2,247 | | | | 2,141 | |
Accrued severance | | | 296 | | | | 545 | |
| | | | | | | | |
| | $ | 2,940 | | | $ | 3,197 | |
| | | | | | | | |
In the year ended December 31, 2012, we paid severance and severance related benefits of $2.8 million and recorded approximately $839 thousand of additional expense for severance and severance related benefits for
F-22
INTERSECTIONS INC.
NOTES TO CONSOLIDATED FINANCIAL STATEMENTS — (Continued)
involuntary terminations. In the year ended December 31, 2013, we paid severance and severance related benefits of $1.5 million and recorded approximately $1.8 million of additional expense for severance and severance related benefits for involuntary terminations.
The components of income tax benefit (expense) from continuing operations for the three years ended December 31, 2011, 2012 and 2013 are as follows:
| | | | | | | | | | | | |
| | | 2011 | | | 2012 | | | 2013 | |
| | | (In thousands) | |
Current: | | | | | | | | | | | | |
Federal | | $ | (15,050 | ) | | $ | (15,241 | ) | | $ | (5,825 | ) |
State | | | (2,835 | ) | | | (2,461 | ) | | | (1,064 | ) |
| | | | | | | | | | | | |
Total current income tax expense | | | (17,885 | ) | | | (17,702 | ) | | | (6,889 | ) |
| | | | | | | | | | | | |
Deferred: | | | | | | | | | | | | |
Federal | | | 3,637 | | | | 3,406 | | | | 1,966 | |
State | | | 593 | | | | 378 | | | | 169 | |
| | | | | | | | | | | | |
Total deferred income tax benefit | | | 4,230 | | | | 3,784 | | | | 2,135 | |
| | | | | | | | | | | | |
Total income tax expense | | $ | (13,655 | ) | | $ | (13,918 | ) | | $ | (4,754 | ) |
| | | | | | | | | | | | |
Deferred tax assets and liabilities as of December 31, 2012 and 2013, consist of the following:
| | | | | | | | |
| | | 2012 | | | 2013 | |
| | | (In thousands) | |
Deferred tax assets: | | | | | | | | |
Reserves and accrued expenses | | $ | 7,027 | | | $ | 6,309 | |
Intangible assets | | | 523 | | | | 1,796 | |
Non-deductible impairments on cost basis investments | | | 0 | | | | 1,038 | |
Net operating loss and capital loss carryforwards | | | 4,748 | | | | 4,855 | |
| | | | | | | | |
Total deferred tax assets | | | 12,298 | | | | 13,998 | |
Valuation allowance | | | (4,551 | ) | | | (5,703 | ) |
| | | | | | | | |
Net deferred tax assets | | | 7,747 | | | | 8,295 | |
Deferred tax liabilities: | | | | | | | | |
Prepaid expenses | | | (3,307 | ) | | | (2,764 | ) |
Property, plant, and equipment | | | (3,616 | ) | | | (2,572 | ) |
| | | | | | | | |
Total deferred tax liabilities | | | (6,923 | ) | | | (5,336 | ) |
| | | | | | | | |
Net deferred tax asset | | $ | 824 | | | $ | 2,959 | |
| | | | | | | | |
We have state net operating loss carryforwards of approximately $450 thousand, which have begun to expire. We also have a capital loss carryforward generated in 2010 from the sale of a subsidiary of $3.9 million, which will expire in 2015. Realization of deferred tax assets related to net operating losses is dependent on generating sufficient taxable income prior to expiration of the loss carryforwards. We have established a valuation allowance against certain deferred tax assets, primarily our capital loss carryforwards, impairments taken for book purposes on our cost basis investment in White Sky, as well as $244 thousand of our state net operating loss carryforwards, that we believe cannot be utilized in the foreseeable future. Although realization is not assured, management believes it is more likely than not that the remaining net deferred tax assets will be realized.
F-23
INTERSECTIONS INC.
NOTES TO CONSOLIDATED FINANCIAL STATEMENTS — (Continued)
As a result of certain realization requirements of U.S. GAAP, the table of deferred tax assets and liabilities shown above does not include certain deferred tax assets as of December 31, 2013 and December 31, 2012 that arose directly from tax deductions related to equity compensation that are greater than the compensation recognized for financial reporting. When realized, the excess tax benefits will result in a credit to additional paid in capital.
The reconciliation of income tax from continuing operations from the statutory rate is as follows (in thousands):
| | | | | | | | | | | | |
| | | December 31, | |
| | | 2011 | | | 2012 | | | 2013 | |
Income tax expense at statutory rate | | $ | (11,518 | ) | | $ | (11,863 | ) | | $ | (2,508 | ) |
State income tax, net of federal benefit | | | (1,411 | ) | | | (1,172 | ) | | | (431 | ) |
Nondeductible executive compensation | | | (393 | ) | | | (872 | ) | | | (739 | ) |
Change in valuation allowances | | | (6 | ) | | | 26 | | | | (1,151 | ) |
Change in uncertain tax positions | | | 0 | | | | 61 | | | | 0 | |
Estimated tax credit | | | 0 | | | | 0 | | | | 150 | |
Other | | | (327 | ) | | | (98 | ) | | | (75 | ) |
| | | | | | | | | | | | |
Net income tax expense | | $ | (13,655 | ) | | $ | (13,918 | ) | | $ | (4,754 | ) |
| | | | | | | | | | | | |
Our consolidated effective tax rate from continuing operations for the year ended December 31, 2013 was 66.3% as compared to 41.1% in the year ended December 31, 2012. The significant increase in the effective tax rate is primarily due to a significant decrease in the income from continuing operations before income taxes as compared to increased book expenses which are not deductible for income tax purposes.
The following table summarizes the activity related to our unrecognized tax benefits for the years ended December 31, 2011, 2012 and 2013 (in thousands):
| | | | | | | | | | | | |
| | | December 31, | |
| | | 2011 | | | 2012 | | | 2013 | |
Unrecognized tax benefit -January 1 | | $ | 181 | | | $ | 860 | | | $ | 679 | |
Gross increases, tax positions in current period | | | 0 | | | | 0 | | | | 0 | |
Gross increases, tax positions in prior period | | | 711 | | | | 0 | | | | 155 | |
Gross decreases, tax positions in prior period | | | (32 | ) | | | 0 | | | | 0 | |
Decreases related to settlements with taxing authorities | | | 0 | | | | (144 | ) | | | 0 | |
Lapse of the statute of limitations | | | 0 | | | | (37 | ) | | | (525 | ) |
| | | | | | | | | | | | |
Unrecognized tax benefit -December 31 | | $ | 860 | | | $ | 679 | | | $ | 309 | |
| | | | | | | | | | | | |
The balance of the unrecognized tax benefits as of December 31, 2013, if recognized, would not have a significant impact on our annual effective rate.
During the year ended December 31, 2013, we decreased our gross unrecognized tax benefits primarily related to the removal of an uncertain tax position due to the lapse in the statue of limitations. During the year ended December 31, 2012, we decreased our gross unrecognized tax benefits primarily related to settlement with a state taxing authority. During the year ended December 31, 2011, we increased our gross unrecognized tax benefits primarily related to an uncertain tax position on the timing of deductions for certain legal expenses.
We have elected to include income tax penalties related to uncertain tax positions as part of our income tax expense in the consolidated financial statements. The accrual for estimated penalties is included as a component
F-24
INTERSECTIONS INC.
NOTES TO CONSOLIDATED FINANCIAL STATEMENTS — (Continued)
of other long-term liabilities in our consolidated balance sheet. In the year ended December 31, 2011, we increased penalties and subsequently, paid penalties of $10 thousand. We did not accrue penalties in the years ended December 31, 2012 and 2013.
We have elected to include interest expense related to uncertain tax positions as part of interest expense in the consolidated financial statements. The accrued interest is included as a component of other long-term liabilities in our consolidated balance sheet. In the years ended December 31, 2011, 2012 and 2013, we have interest expense of $54 thousand, $25 thousand and $15 thousand, respectively. In the years ended December 31, 2012 and 2013, we decreased interest expense $52 thousand and $67 thousand, respectively as a result of our gross decreases to our unrecognized tax benefit. We did not have a decrease to interest expense in the year ended December 31, 2011.
The company is subject to taxation in the U.S. and various state jurisdictions. As of December 31, 2013, we were subject to examination in the U.S. federal tax jurisdiction for the 2010-2012 tax years and various state jurisdictions for the 2002-2012 tax years. We are not currently under audit in any federal or state jurisdiction.
In the year ended December 31, 2014, we do not expect our unrecognized tax benefits to change by a material amount.
| 15. | Related Party Transactions |
Digital Matrix Systems, Inc. — The chief executive officer and president of Digital Matrix Systems, Inc. (“DMS”) serves as one of our board members.
We have service agreements with DMS for monitoring credit on a daily and quarterly basis, along with certain credit analysis services. In connection with these agreements, we paid monthly installments totaling $878 thousand, $865 thousand and $973 thousand for the years ended December 31, 2011, 2012 and 2013, respectively. These amounts are included within cost of revenue and general and administrative expense in the accompanying consolidated statements of operations.
We have a separate professional services agreement with DMS under which DMS provides additional development and consulting services pursuant to work orders that are agreed upon by the parties from time to time. As of December 31, 2012 and 2013, we owed $176 thousand and $69 thousand to DMS, respectively.
White Sky, Inc. We have an investment in White Sky and a commercial agreement to incorporate and market their service into our fraud and identity theft protection product offerings. In addition, we have an agreement with White Sky for them to provide various software development costs. For the year ended December 31, 2011, we paid $2.6 million to White Sky to satisfy remaining required royalties. In the year ended December 31, 2012, we did not remit any payments to White Sky. For the year ended December 31, 2013, we remitted $150 thousand to White Sky related to software development costs.
During the year ended December 31, 2012, we purchased additional shares of preferred stock in White Sky, for which we paid $2.3 million. In addition, during the year ended December 31, 2013, we exercised 1.4 million vested warrants in order to purchase additional shares of convertible preferred stock in White Sky, for which we paid $1.5 million. See Note 9 for further information. As of December 31, 2012 and 2013, there were no amounts due to White Sky.
F-25
INTERSECTIONS INC.
NOTES TO CONSOLIDATED FINANCIAL STATEMENTS — (Continued)
| 16. | Debt and Other Financing |
On November 16, 2012, we entered into an amended and restated Credit Agreement with Bank of America, N.A., which has a maturity date of November 15, 2015. Our Credit Agreement currently consists of a revolving credit facility in the amount of $30.0 million and is secured by substantially all of our assets and a pledge by us of stock in membership interests we hold in certain of our subsidiaries. Our subsidiaries are co-borrowers under the Credit Agreement.
The amended Credit Agreement contains certain customary covenants, including among other things covenants that limit or restrict the following: the incurrence of liens; the making of investments; the incurrence of certain indebtedness; mergers, dissolutions, liquidations, or consolidations; acquisitions (other than certain permitted acquisitions); sales of substantially all of our or any of our subsidiaries’ assets; the declaration of certain dividends or distributions; transactions with affiliates (other than guarantors under the Credit Agreement) other than on fair and reasonable terms; and the creation or acquisition of any direct or indirect subsidiary of ours that is not a domestic subsidiary unless such subsidiary becomes a guarantor. We are also required to maintain compliance with certain financial covenants which include our consolidated leverage ratios, consolidated fixed charge coverage ratios, customary covenants, representations and warranties, funding conditions and events of default. In addition, the amended Credit Agreement permits us to make share repurchases under announced stock repurchase programs, without lender consent, so long as the total amount repurchased does not exceed a specified maximum dollar amount and we maintain a minimum liquidity at the time of the repurchase. We believe we are currently in compliance with all such covenants.
| 17. | Commitments and Contingencies |
Leases
We have entered into long-term operating lease agreements for office space and capital leases for certain fixed assets. The minimum fixed commitments related to all noncancelable leases are as follows:
| | | | | | | | |
Years Ending December 31, | | Operating
Leases | | | Capital
Leases | |
| | | (In thousands) | |
2014 | | $ | 3,099 | | | $ | 959 | |
2015 | | | 2,933 | | | | 712 | |
2016 | | | 2,805 | | | | 439 | |
2017 | | | 2,790 | | | | 332 | |
2018 | | | 2,896 | | | | 305 | |
Thereafter | | | 1,324 | | | | 0 | |
| | | | | | | | |
Total minimum lease payments | | $ | 15,847 | | | | 2,747 | |
| | | | | | | | |
Less: amount representing interest | | | | | | | (320 | ) |
| | | | | | | | |
Present value of minimum lease payments | | | | | | | 2,427 | |
Less: current obligation | | | | | | | (817 | ) |
| | | | | | | | |
Long term obligations under capital lease | | | | | | $ | 1,610 | |
| | | | | | | | |
During the year ended December 31, 2013 we entered into additional capital lease agreements for approximately $1.7 million. We recorded the lease liability at the fair market value of the underlying assets in our consolidated balance sheet. Rental expenses included in general and administrative expenses were $2.9 million, $2.9 million and $3.0 million for the years ended December 31, 2011, 2012 and 2013, respectively.
F-26
INTERSECTIONS INC.
NOTES TO CONSOLIDATED FINANCIAL STATEMENTS — (Continued)
Legal Proceedings
On May 21, 2012, Intersections Insurance Services Inc. was served with a putative class action complaint (filed on May 14, 2012) against Intersections Insurance Services Inc. and Bank of America in the United States District Court for the Northern District of California. The complaint alleges various claims based on the sale of an accidental death and disability program. Intersections Insurance Services Inc. and Bank of America moved to dismiss the claims and to transfer the action to the United States District Court for the Central District of California. The motion to transfer to the Central District was granted, and Intersections Insurance Services Inc. and Bank of America then moved to dismiss the claims. The motion to dismiss was granted with prejudice on October 1, 2012. The plaintiffs filed a notice of appeal, which appeal remains pending before the United States Court of Appeals for the Ninth Circuit.
On January 14, 2013, Intersections Insurance Services Inc. was served with a complaint (filed on October 2, 2012) on behalf of the Office of the West Virginia Attorney General in the Circuit Court of Mason County, West Virginia. The complaint alleges violations of West Virginia consumer protection laws based on the marketing of unspecified products. Intersections Insurance Services Inc. filed a motion for a more definite statement of the claims, which motion was denied by the court in December 2013. On January 21, 2014, Intersections Insurance Services Inc. filed an answer.
In September 2013, a putative class action lawsuit was filed in Illinois in Cook County Circuit Court against Intersections Inc., Intersections Insurance Services Inc., and Ocwen Financial Corporation, alleging violations of the Telephone Consumer Protection Act. The case was removed to the United States District Court for the Northern District of Illinois, Eastern Division. On October 30, 2013, Plaintiffs filed a stipulation voluntarily dismissing, without prejudice, Intersections Inc. from the case. On November 14, 2013, the plaintiffs filed an amended complaint against Intersections Insurance Services Inc. and Ocwen Loan Servicing, LLC. On November 27, 2013, Intersections Insurance Services Inc. and Ocwen Loan Servicing, LLC jointly filed a Motion to Dismiss and to Strike Class Allegations. On March 5, 2014, the motion was granted in a part, and denied in part.
The company may become involved in litigation as a result of our normal business operations. We periodically analyze currently available information and make a determination of the probability of loss and provide a range of possible loss when we believe that sufficient and appropriate information is available. We accrue a liability for those contingencies where the incurrence of a loss is probable and the amount can be reasonably estimated. If a loss is probable and a range of amounts can be reasonably estimated but no amount within the range is a better estimate than any other amount in the range, then the minimum of the range is accrued. We do not accrue a liability when the likelihood that the liability has been incurred is believed to be probable but the amount cannot be reasonably estimated or when the likelihood that a liability has been incurred is believed to be only reasonably possible or remote. For contingencies where an unfavorable outcome is reasonably possible and the impact could potentially be material, we disclose the nature of the contingency and, where feasible, an estimate of the possible loss or range of loss. As of December 31, 2013, we do not have any significant liabilities accrued for any of the lawsuits mentioned above.
Other
We have entered into various software licenses, marketing and operational commitments for several years totaling $17.6 million as of December 31, 2013. In January 2013, we entered into a new contract with a credit reporting agency, to which we agreed to pay non-refundable minimum payments of up to $25.0 million and $25.9 million in the years ending December 31, 2013 and December 31, 2014. In December 2013, we exercised our option in accordance with the contract to be charged at the lower pricing tier, which resulted in a revised non-refundable minimum payment of $9.9 million for the year ended December 31, 2014.
F-27
INTERSECTIONS INC.
NOTES TO CONSOLIDATED FINANCIAL STATEMENTS — (Continued)
We may be subject to certain non-income (or indirect) taxes in various state jurisdictions. We continue to analyze what obligations, if any, we have to these state taxing authorities. In most cases, it is not possible to predict the maximum potential amount of future payments or determine if a collection obligation is probable due to the unique facts and circumstances involved, including the delivery nature of our services, the relationship through which our services are offered, as well as changing state laws and interpretations of those laws. In a minority of cases, based on certain state provisions and/or active discussions with states, we believe we are liable for a non-income business tax and have recorded a total estimated liability of $553 thousand, which includes interest and penalties. This amount is included in general and administrative expenses in our consolidated statements of operations. To date, we have not been required to make any payments, nor have we received any formal assessments.
| 18. | Other Long-Term Liabilities |
The components of our other long-term liabilities are as follows:
| | | | | | | | |
| | | December 31,
2012 | | | December 31,
2013 | |
| | | (In thousands) | |
Deferred rent | | $ | 3,581 | | | $ | 3,190 | |
Unamortized portion of non-cash consideration exchanged for additional investment | | | 618 | | | | 0 | |
Uncertain tax positions, interest and penalties not recognized | | | 748 | | | | 335 | |
Accrued general and administrative expenses | | | 0 | | | | 171 | |
| | | | | | | | |
| | $ | 4,947 | | | $ | 3,696 | |
| | | | | | | | |
As part of the additional investment in White Sky that took place in the year ended December 31, 2012, we recorded $1.2 million related to the long-term portion of non-cash consideration, which was recorded as deferred revenue. In the year ended December 31, 2013, we recognized the remaining amount of the non-cash consideration as revenue, which amounted to $618 thousand. See Note 9 for additional information.
Outstanding Securities
Our authorized capital stock consists of 50 million shares of common stock, par value $.01 per share, and 5 million shares of preferred stock, par value $.01 per share. As of December 31, 2012 and 2013, there were approximately 18.0 and 18.1 million shares of our common stock outstanding and no shares of preferred stock outstanding. The board of directors has the authority to issue up to 5 million shares of preferred stock and to fix the price, rights, preferences, privileges, and restrictions, including voting rights, of those shares without any further vote or action by the stockholders. We do not have any outstanding warrants to purchase common shares. Holders of common stock are entitled to one vote per share in the election of directors and on all other matters on which stockholders are entitled or permitted to vote. Holders of common stock are not entitled to cumulative voting rights. Therefore, holders of a majority of the shares voting for the election of directors can elect all the directors. Holders of common stock are entitled to dividends in amounts and at times as may be declared by the Board of Directors out of funds legally available. Upon liquidation or dissolution, holders of common stock are entitled to share ratably in all net assets available for distribution to stockholders after payment of any liquidation preferences to holders of preferred stock. Holders of common stock have no redemption, conversion or preemptive rights.
F-28
INTERSECTIONS INC.
NOTES TO CONSOLIDATED FINANCIAL STATEMENTS — (Continued)
Share Repurchase
In April 2005, our Board of Directors authorized a share repurchase program under which we can repurchase our outstanding shares of common stock from time to time, depending on market conditions, share price and other factors. As of December 31, 2013, we had approximately $16.9 million remaining under our share repurchase program, all of which we are permitted to make under our amended Credit Agreement, without lender consent, in any fiscal year. The repurchases may be made on the open market, in block trades, through privately negotiated transactions or otherwise, and the program may be suspended or discontinued at any time.
On November 28, 2012 we entered into a trading plan, in accordance with Rule 10b5-1 under the Securities Exchange Act of 1934 to facilitate repurchases of up to $3.0 million of our common stock. The repurchase plan commenced on December 1, 2012 and ended on May 31, 2013. On May 18, 2012, we entered into a trading plan, in accordance with Rule 10b5-1 under the Securities Exchange Act of 1934, to facilitate repurchases of up to $2.5 million of our common stock. The repurchase plan commenced on June 10, 2012 and ended on July 31, 2012. During the year ended December 31, 2013, we repurchased approximately 250 thousand shares of common stock at a weighted average price of $9.60 per share resulting in an aggregate cost to us of $2.4 million. During the year ended December 31, 2012, we repurchased 71 thousand shares of common stock at a weighted average price of $10.37 per share resulting in an aggregate cost to us of $744 thousand.
Dividends
The following summarizes our dividend activity for the years ended December 31, 2013 and 2012:
| | | | | | | | |
Announcement Date | | Record Date | | Payment Date | | Cash Dividend
Amount (per share) | |
February 22, 2013 | | March 4, 2013 | | March 15, 2013 | | $ | 0.20 | |
May 9, 2013 | | May 29, 2013 | | June 7, 2013 | | $ | 0.20 | |
August 8, 2013 | | August 26, 2013 | | September 6, 2013 | | $ | 0.20 | |
November 12, 2013 | | November 22, 2013 | | December 9, 2013 | | $ | 0.20 | |
| | | | | | | | |
Announcement Date | | Record Date | | Payment Date | | Cash Dividend
Amount (per share) | |
February 2, 2012 | | February 29, 2012 | | March 9, 2012 | | $ | 0.20 | |
April 26, 2012 | | May 29, 2012 | | June 8, 2012 | | $ | 0.20 | |
August 8, 2012 | | August 31, 2012 | | September 10, 2012 | | $ | 0.20 | |
October 25, 2012 | | November 20, 2012 | | November 30, 2012 | | $ | 0.70 | |
On November 30, 2012, we paid a one-time special cash dividend of $0.50 per share on our common stock.
Our Board of Directors authorized a cash dividend of $0.20 per share on our common stock, payable on April 3, 2014, to stockholders of record as of March 20, 2014.
Share Based Compensation
On August 24, 1999, the Board of Directors and stockholders approved the 1999 Stock Option Plan (the “1999 Plan”). The active period for this plan expired on August 24, 2009. The number of shares of common stock that have been issued under the 1999 Plan could not exceed 4.2 million shares pursuant to an amendment to the plan executed in November 2001. As of December 31, 2013, options to purchase 7 thousand shares were outstanding under the 1999 Plan. Individual awards under the 1999 Plan took the form of incentive stock options and nonqualified stock options.
F-29
INTERSECTIONS INC.
NOTES TO CONSOLIDATED FINANCIAL STATEMENTS — (Continued)
On March 12, 2004 and May 5, 2004, the Board of Directors and stockholders, respectively, approved the 2004 Stock Option Plan (the “2004 Plan”) to be effective immediately prior to the consummation of the initial public offering. The 2004 Plan provides for the authorization to issue 2.8 million shares of common stock, and options to purchase 494 thousand shares are remaining to be granted. As of December 31, 2013, options to purchase 924 thousand shares are outstanding under the 2004 Plan. Individual awards under the 2004 Plan may take the form of incentive stock options and nonqualified stock options. Option awards are granted with an exercise price equal to the market price of our stock at the date of grant; those option awards generally vest over three and four years of continuous service and have ten year contractual terms.
On March 8, 2006 and May 24, 2006, the Board of Directors and stockholders, respectively, approved the 2006 Stock Incentive Plan (the “2006 Plan”). The number of shares of common stock that may be issued under the 2006 Plan may not exceed 7.1 million, pursuant to an amendment approved by the Board of Directors and Stockholders in May 2011. As of December 31, 2013, we have 1.0 million shares of common stock available for future grants of awards under the 2006 Plan, and awards for approximately 2.3 million shares outstanding. Individual awards under the 2006 Plan may take the form of incentive stock options, nonqualified stock options, restricted stock awards and/or restricted stock units. These awards generally vest over four years of continuous service.
The Compensation Committee administers the Plans, selects the individuals who will receive awards and establishes the terms and conditions of those awards. Shares of common stock subject to unvested awards that have expired, terminated, or been canceled or forfeited may be available for issuance or use in connection with future awards.
The 1999 Plan active period expired on August 24, 2009, the 2004 Plan will remain in effect until May 5, 2014, and the 2006 Plan will remain in effect until March 7, 2016, unless terminated by the Board of Directors.
Stock Options
Total stock based compensation expense recognized for stock options, which was included in general and administrative expense in our consolidated statements of operations, for the years ended December 31, 2011, 2012 and 2013 was $2.3 million, $2.0 million and $903 thousand, respectively. We reduced our share-based compensation expense for stock options by $227 thousand for involuntary terminations in the year ended December 31, 2011.
The following table summarizes the Company’s stock option activity:
| | | | | | | | | | | | | | | | | | | | | | | | | | | | | | | | |
| | | 2011 | | | 2012 | | | 2013 | | | | | | Weighted
Average
Remaining
Contractual
Term | |
| | | Number of
Shares | | | Weighted
Average
Exercise
Price | | | Number
of Shares | | | Weighted
Average
Exercise
Price | | | Number of
Shares | | | Weighted
Average
Exercise
Price | | | Aggregate
Intrinsic Value | | |
| | | | | | | | | | | | | | | | | | | | | (In thousands) | | | (In years) | |
Outstanding, beginning of year | | | 3,795,057 | | | $ | 5.79 | | | | 2,071,606 | | | $ | 6.14 | | | | 1,520,266 | | | $ | 6.33 | | | | | | | | | |
Granted | | | 150,000 | | | | 13.74 | | | | 0 | | | | 0.0 | | | | 0 | | | | 0.0 | | | | | | | | | |
Canceled | | | (1,079,559 | ) | | | 6.43 | | | | (258,554 | ) | | | 6.62 | | | | (94,377 | ) | | | 5.83 | | | | | | | | | |
Exercised | | | (793,892 | ) | | | 5.50 | | | | (292,826 | ) | | | 4.74 | | | | (70,691 | ) | | | 4.02 | | | | | | | | | |
| | | | | | | | | | | | | | | | | | | | | | | | | | | | | | | | |
Outstanding, end of year | | | 2,071,606 | | | $ | 6.14 | | | | 1,520,226 | | | $ | 6.33 | | | | 1,355,158 | | | $ | 6.49 | | | $ | 3,797 | | | | 4.84 | |
| | | | | | | | | | | | | | | | | | | | | | | | | | | | | | | | |
Exercisable at end of the year | | | 479,618 | | | $ | 10.19 | | | | 700,169 | | | $ | 7.66 | | | | 1,169,364 | | | $ | 6.35 | | | $ | 3,369 | | | | 4.68 | |
| | | | | | | | | | | | | | | | | | | | | | | | | | | | | | | | |
There were no options granted during the years ended December 31, 2012 and 2013. The weighted average grant date fair value of options granted, based on the Black Scholes method, during the year December 31, 2011 was $6.53.
F-30
INTERSECTIONS INC.
NOTES TO CONSOLIDATED FINANCIAL STATEMENTS — (Continued)
For options exercised, intrinsic value is calculated as the difference between the market price on the date of exercise and the exercise price. The total intrinsic value of options exercised during the years ended December 31, 2011, 2012 and 2013 was $21.5 million, $3.0 million and $567 thousand, respectively.
In the year ended December 31, 2013, certain participants utilized a net withhold option exercise method, in which options were surrendered to cover payroll withholding tax, if applicable, and exercise price. Approximately 50 thousand shares were exercised, of which the cumulative net shares issued to the participants were 18 thousand and 32 thousand were surrendered and subsequently cancelled. The total pre-tax cash outflow, as included in withholding tax payments in our consolidated statement of cash flows, for this net withhold option exercise method was $104 thousand.
In the year ended December 31, 2012, certain participants utilized a net withhold option exercise method, in which options were surrendered to cover payroll withholding tax, if applicable, and exercise price. Approximately 202 thousand shares were exercised, of which the cumulative net shares issued to the participants were 66 thousand and 136 thousand were surrendered and subsequently cancelled. The total pre-tax cash outflow, as included in withholding tax payments in our consolidated statement of cash flows, for this net withhold option exercise method was $426 thousand.
In the year ended December 31, 2011, certain participants utilized a net withhold option exercise method, in which options were surrendered to cover payroll withholding tax, if applicable, and exercise price. Approximately 1.5 million shares were exercised, of which the cumulative net shares issued to the participants were 630 thousand and 883 thousand were surrendered and subsequently cancelled. The total pre-tax cash outflow, as included in withholding tax payments in our consolidated statement of cash flows, for this net withhold option exercise method was $7.9 million.
As of December 31, 2013, there was $279 thousand of total unrecognized compensation cost related to nonvested stock option arrangements granted under the Plans. That cost is expected to be recognized over a weighted-average period of 0.3 years.
The following table summarizes information about employee stock options outstanding at December 31, 2013:
| | | | | | | | | | | | | | | | | | | | |
| | | Options Outstanding | | | Options Exercisable | |
Exercise Price | | Shares | | | Weighted Average
Remaining
Contractual Term | | | Weighted
Average Exercise
Price | | | Shares | | | Weighted
Average
Exercise Price | |
| | | | | | (In years) | | | | | | | | | | |
$0 — $5.00 | | | 801,576 | | | | 5.30 | | | $ | 3.63 | | | | 678,282 | | | $ | 3.50 | |
$5.01 — $10.00 | | | 290,034 | | | | 5.17 | | | | 6.65 | | | | 272,534 | | | | 6.45 | |
$10.01 — $15.00 | | | 162,750 | | | | 4.69 | | | | 13.88 | | | | 117,750 | | | | 13.48 | |
$15.01 — $20.00 | | | 100,798 | | | | 0.53 | | | | 16.84 | | | | 100,798 | | | | 16.84 | |
Greater than $20.00 | | | 0 | | | | 0 | | | | 0 | | | | 0 | | | | 0 | |
| | | | | | | | | | | | | | | | | | | | |
| | | 1,355,158 | | | | 4.84 | | | $ | 6.49 | | | | 1,169,364 | | | $ | 6.35 | |
| | | | | | | | | | | | | | | | | | | | |
F-31
INTERSECTIONS INC.
NOTES TO CONSOLIDATED FINANCIAL STATEMENTS — (Continued)
Restricted Stock Units
The following table summarizes our restricted stock unit activity:
| | | | | | | | | | | | | | | | | | | | | | | | |
| | | 2011 | | | 2012 | | | 2013 | |
| | | Number of
RSUs | | | Weighted
Average
Grant Date
Fair Value | | | Number of
RSUs | | | Weighted
Average
Grant Date
Fair Value | | | Number of
RSUs | | | Weighted
Average
Grant Date
Fair Value | |
Outstanding, beginning of year | | | 1,943,808 | | | $ | 4.62 | | | | 2,018,285 | | | $ | 6.83 | | | | 1,872,342 | | | $ | 7.74 | |
Granted | | | 959,189 | | | | 10.15 | | | | 655,491 | | | | 10.24 | | | | 881,922 | | | | 7.62 | |
Canceled | | | (462,072 | ) | | | 5.99 | | | | (348,861 | ) | | | 6.08 | | | | (343,399 | ) | | | 6.47 | |
Vested | | | (422,640 | ) | | | 5.13 | | | | (452,573 | ) | | | 5.84 | | | | (525,952 | ) | | | 6.91 | |
| | | | | | | | | | | | | | | | | | | | | | | | |
Outstanding, end of year | | | 2,018,285 | | | $ | 6.83 | | | | 1,872,342 | | | $ | 7.74 | | | | 1,884,913 | | | $ | 8.14 | |
| | | | | | | | | | | | | | | | | | | | | | | | |
The weighted average contractual life for restricted stock units for the years ended December 31, 2011, 2012 and 2013 was 2.3 years, 2.0 years and 2.2 years, respectively.
Total stock based compensation recognized for restricted stock units in our consolidated statements of operations for the years ended December 31, 2011, 2012 and 2013 was $4.3 million, $4.8 million and $5.5 million, respectively. We reduced our share-based compensation expense for restricted stock units by $500 thousand for involuntary terminations in the year ended December 31, 2011.
In the year ended December 31, 2013, a single restricted stock unit grant, at the vesting date, was paid in cash rather than stock, to recipients at the election of the company. The total cash paid was $1.8 million, which did not exceed the fair value on the settlement date.
As of December 31, 2013, there was $10.1 million of total unrecognized compensation cost related to unvested restricted stock units compensation arrangements granted under the Plans. That cost is expected to be recognized over a weighted-average period of 2.2 years.
| 20. | Discontinued Operations |
In the three months ended June 30, 2013, we ceased all business activities in our subsidiary Net Enforcers, which was included in our Market Intelligence segment. We determined that Net Enforcers met the requirements for classification as a discontinued operation under U.S. GAAP, as we do not have significant continuing involvement in the business and its operations and cash flows were eliminated from our ongoing operations.
The following table summarizes the operating results of the discontinued operations included in the consolidated statement of operations (in thousands):
| | | | | | | | | | | | |
| | | Year Ended
December 31,
2011 | | | Year Ended
December 31,
2012 | | | Year Ended
December 31,
2013 | |
Revenue | | $ | 2,299 | | | $ | 1,769 | | | $ | 185 | |
| | | | | | | | | | | | |
Loss from discontinued operations before income taxes | | $ | (1,052 | ) | | $ | (295 | ) | | $ | (9 | ) |
Income tax benefit | | | 423 | | | | 20 | | | | 0 | |
| | | | | | | | | | | | |
Loss from discontinued operations, net of tax | | $ | (629 | ) | | $ | (275 | ) | | $ | (9 | ) |
| | | | | | | | | | | | |
F-32
INTERSECTIONS INC.
NOTES TO CONSOLIDATED FINANCIAL STATEMENTS — (Continued)
The following table summarizes the carrying values of the major assets and liabilities of discontinued operations as reported as of December 31, 2012 (in thousands):
| | | | |
| | | As of
December 31,
2012 | |
Cash and cash equivalents | | $ | 1,158 | |
Accounts receivable | | | 216 | |
Prepaid expenses and other current assets | | | 10 | |
Other assets | | | 56 | |
Accrued expenses and other current liabilities | | $ | 110 | |
Accrued payroll and employee benefits | | | 41 | |
In February 1998, we adopted a 401(k) profit-sharing plan (the “401(k) Plan”) that covered substantially all full-time employees. Employees are eligible to participate upon completion of one month of service and may contribute up to 25% of their annual compensation, not to exceed the maximum contribution provided by statutory limitations. The 401(k) Plan provides for matching $0.50 per dollar on the first 3% of the employee’s contribution. The employer matching was suspended and there were no expenses under the 401(k) Plan for the year ended December 31, 2011. In the year ended December 31, 2012, the program was reinstated and we had expenses of $505 thousand and we had expenses of $398 thousand in the year ended December 31, 2013. Eligible employees vested in employer contributions 20% per year of service and are fully vested after five years of service.
As discussed in Notes 1 and 2, we market credit and personal information and identity theft protection services to consumers through our relationships with our financial institution clients. Revenue from subscribers obtained through our largest financial institution clients, as a percentage of total consolidated revenue, is as follows:
| | | | | | | | | | | | |
| | | 2011 | | | 2012 | | | 2013 | |
Bank of America (includes MBNA) | | | 52 | % | | | 47 | % | | | 43 | % |
Accounts receivable related to this client totaled $6.6 million and $9.5 million at December 31, 2012 and 2013, respectively.
| 23. | Segment and Geographic Information |
We have three reportable operating segments with continuing operations through the year ended December 31, 2013. Our Consumer Products and Services segment includes our identity theft protection and credit information management, data breach response, insurance and membership products and services and VOYCETM, our new platform and service for pet owners we are in the process of launching. Our Bail Bonds Industry Solutions segment includes the software management solutions for the bail bond industry provided by our subsidiary Captira Analytical. Our Market Intelligence segment includes our market intelligence platform provided by our subsidiary Intersections Business Intelligence Services under the Zumetrics® brand. Prior to the second quarter of 2013, our Market Intelligence services were included in our Online Brand Protection segment along with our Net Enforcers subsidiary. In the three months ended June 30, 2013, we ceased operations at Net Enforcers.
F-33
INTERSECTIONS INC.
NOTES TO CONSOLIDATED FINANCIAL STATEMENTS — (Continued)
We plan to report the results of operations of our subsidiary, i4c Innovations, as a separate operating segment if and when the subsidiary’s activities meet the requirements for segment reporting accordance with U.S. GAAP.
The following table sets forth segment information for the years ended December 31, 2011, 2012 and 2013.
| | | | | | | | | | | | | | | | |
| | | Consumer Products
and Services | | | Market
Intelligence | | | Bail Bonds
Industry
Solutions | | | Consolidated | |
| | | (In thousands) | |
Year Ended December 31, 2011 | | | | | | | | | | | | | | | | |
Revenue | | $ | 369,703 | | | $ | 0 | | | $ | 999 | | | $ | 370,702 | |
Depreciation | | | 8,947 | | | | 0 | | | | 75 | | | | 9,022 | |
Amortization | | | 3,801 | | | | 0 | | | | 0 | | | | 3,801 | |
Income (loss) from continuing operations before income taxes | | | 34,150 | | | | 0 | | | | (1,241 | ) | | | 32,909 | |
| | | | | | | | | | | | | | | | |
Year Ended December 31, 2012 | | | | | | | | | | | | | | | | |
Revenue | | $ | 346,104 | | | $ | 0 | | | $ | 1,314 | | | $ | 347,418 | |
Depreciation | | | 9,562 | | | | 0 | | | | 140 | | | | 9,702 | |
Amortization | | | 3,516 | | | | 0 | | | | 0 | | | | 3,516 | |
Income (loss) from continuing operations before income taxes | | | 35,588 | | | | (329 | ) | | | (1,366 | ) | | | 33,893 | |
| | | | | | | | | | | | | | | | |
Year Ended December 31, 2013 | | | | | | | | | | | | | | | | |
Revenue | | $ | 308,284 | | | $ | 152 | | | $ | 1,837 | | | $ | 310,273 | |
Depreciation | | | 8,210 | | | | 287 | | | | 186 | | | | 8,683 | |
Amortization | | | 3,457 | | | | 0 | | | | 0 | | | | 3,457 | |
Income (loss) from continuing operations before income taxes | | | 11,431 | | | | (3,672 | ) | | | (586 | ) | | | 7,173 | |
| | | | | | | | | | | | | | | | |
| | | | | | | | | | | | | | | | |
| | | Consumer Products
and Services | | | Online Brand
Protection | | | Bail Bonds
Industry
Solutions | | | Consolidated | |
As of December 31, 2012 | | | | | | | | | | | | | | | | |
Property, plant and equipment, net | | $ | 15,931 | | | $ | 1,037 | | | $ | 348 | | | $ | 17,316 | |
| | | | | | | | | | | | | | | | |
Total assets | | $ | 140,097 | | | $ | 5,365 | | | $ | 891 | | | $ | 146,353 | |
| | | | | | | | | | | | | | | | |
| | | | | | | | | | | | | | | | |
| | | Consumer Products
and Services | | | Online Brand
Protection | | | Bail Bonds
Industry
Solutions | | | Consolidated | |
As of December 31, 2013 | | | | | | | | | | | | | | | | |
Property, plant and equipment, net | | $ | 13,247 | | | $ | 1,009 | | | $ | 234 | | | $ | 14,490 | |
| | | | | | | | | | | | | | | | |
Total assets | | $ | 128,822 | | | $ | 1,469 | | | $ | 798 | | | $ | 131,089 | |
| | | | | | | | | | | | | | | | |
We generate revenue, in our Consumer Products and Services segment, in the following geographic areas:
| | | | | | | | | | | | |
| | | United States | | | Canada | | | Consolidated | |
| | | (in thousands) | |
Revenue | | | | | | | | | | | | |
For the year ended December 31, 2011 | | $ | 337,216 | | | $ | 33,486 | | | $ | 370,702 | |
For the year ended December 31, 2012 | | | 314,853 | | | | 32,565 | | | | 347,418 | |
For the year ended December 31, 2013 | | | 277,885 | | | | 32,388 | | | | 310,273 | |
F-34
INTERSECTIONS INC.
NOTES TO CONSOLIDATED FINANCIAL STATEMENTS — (Continued)
| 24. | Quarterly Financial Data (Unaudited) |
| | | | | | | | | | | | | | | | |
| | | First
Quarter | | | Second
Quarter | | | Third
Quarter | | | Fourth
Quarter | |
| | | (In thousands) | |
Year ended December 31, 2011: | | | | | | | | | | | | | | | | |
Revenue | | $ | 89,903 | | | $ | 93,534 | | | $ | 93,724 | | | $ | 93,541 | |
Income from operations | | | 8,427 | | | | 9,285 | | | | 7,575 | | | | 6,298 | |
Income from continuing operations before income taxes | | | 8,279 | | | | 9,249 | | | | 7,511 | | | | 7,870 | |
Net income | | $ | 4,584 | | | $ | 5,185 | | | $ | 4,622 | | | $ | 4,234 | |
Basic earnings per common share | | $ | 0.26 | | | $ | 0.31 | | | $ | 0.27 | | | $ | 0.25 | |
Diluted earnings per common share | | $ | 0.23 | | | $ | 0.28 | | | $ | 0.24 | | | $ | 0.22 | |
Year ended December 31, 2012: | | | | | | | | | | | | | | | | |
Revenue | | $ | 89,668 | | | $ | 87,497 | | | $ | 86,232 | | | $ | 84,021 | |
Income from operations | | | 10,698 | | | | 10,793 | | | | 9,331 | | | | 3,066 | |
Income from continuing operations before income taxes | | | 10,594 | | | | 10,692 | | | | 9,433 | | | | 3,174 | |
Net income | | $ | 6,226 | | | $ | 6,203 | | | $ | 5,661 | | | $ | 1,610 | |
Basic earnings per common share | | $ | 0.36 | | | $ | 0.35 | | | $ | 0.32 | | | $ | 0.09 | |
Diluted earnings per common share | | $ | 0.33 | | | $ | 0.33 | | | $ | 0.30 | | | $ | 0.08 | |
Year ended December 31, 2013: | | | | | | | | | | | | | | | | |
Revenue | | $ | 81,556 | | | $ | 80,765 | | | $ | 75,868 | | | $ | 72,084 | |
Income (loss) from operations | | | 5,144 | | | | 3,715 | | | | (1,351 | ) | | | 486 | |
Income (loss) from continuing operations before income taxes | | | 4,796 | | | | 3,209 | | | | (1,384 | ) | | | 552 | |
Net income (loss) | | $ | 2,205 | | | $ | 1,571 | | | $ | (1,485 | ) | | $ | 119 | |
Basic earnings (loss) per common share | | $ | 0.12 | | | $ | 0.09 | | | $ | (0.08 | ) | | $ | 0.00 | |
Diluted earnings (loss) per common share | | $ | 0.12 | | | $ | 0.08 | | | $ | (0.08 | ) | | $ | 0.01 | |
Pursuant to a legal settlement in October 2011, we received a combination of cash and title to two office condominiums and one real property parcel. The cash and fair value of the properties were approximately $1.8 million.
As part of our review of capitalized software projects in accordance with U.S. GAAP, we, together with our client, reassessed a development effort related to a web based platform prior to it being placed in service, and therefore recorded a fixed asset impairment charge of $1.2 million in the year ended December 31, 2012. In addition, we recorded non-cash impairments of $653 thousand and $1.3 million related to our long term investment in White Sky, LLC in the years ended December 31, 2012 and 2013, respectively, which contributed to the loss from continuing operations.
Our Board of Directors authorized a cash dividend of $0.20 per share on our common stock, payable on April 3, 2014, to stockholders of record as of March 20, 2014.
In January 2014, we were notified by Capital One Services, LLC of its decision to terminate its indirect marketing agreement with us no sooner than July 31, 2014, and to subsequently notify us of the cancellation of subscribers, which may occur before, on, or after July 31, 2014. We estimate the current monthly revenue derived under this agreement to be approximately $1.0 million per month as of December 31, 2013.
On March 10, 2014, we made the determination to cease ongoing operations at our subsidiary, Intersections Business Intelligence Services (D/B/A Zumetrics®). These operations are expected to wind down and cease during the three months ending June 30, 2014. We plan to classify Zumetrics® as a discontinued operation at the time it meets the requirements under U.S. GAAP and thereafter will no longer have a Market Intelligence segment.
F-35
SCHEDULE II — VALUATION AND QUALIFYING ACCOUNTS
| | | | | | | | | | | | | | | | |
Description | | Balance at
Beginning of
Period | | | Additions
Charged to
Costs and
Expenses | | | Deductions
from
Allowance(1) | | | Balance at
End of
Period | |
| | | (In thousands) | |
Year Ended December 31, 2013 | | | | | | | | | | | | | | | | |
Allowance for doubtful accounts | | $ | 35 | | | $ | 25 | | | $ | 34 | | | $ | 26 | |
Year Ended December 31, 2012 | | | | | | | | | | | | | | | | |
Allowance for doubtful accounts | | $ | 14 | | | $ | 171 | | | $ | 150 | | | $ | 35 | |
Year Ended December 31, 2011 | | | | | | | | | | | | | | | | |
Allowance for doubtful accounts | | $ | 42 | | | $ | 19 | | | $ | 47 | | | $ | 14 | |
| (1) | The year ended December 31, 2013 includes a reduction of $30 thousand related to Net Enforcers, which we ceased operations in the three months ended June 30, 2013. |
F-36
SIGNATURES
Pursuant to the requirements of Section 13 or 15(d) of the Securities Exchange Act of 1934, the registrant has duly caused this report to be signed on its behalf by the undersigned, thereunto duly authorized.
| | |
| INTERSECTIONS INC. |
| (Registrant) |
| |
| By: | | /s/ Michael R. Stanfield |
| | Name: Michael R. Stanfield |
| | Title: Chief Executive Officer |
Date: March 17, 2014
Pursuant to the requirements of the Securities Exchange Act of 1934, this report has been signed below by the following persons on behalf of the registrant and in the capacities indicated.
| | | | |
Signature | | Title | | Date |
| | |
/s/ Michael R. Stanfield Michael R. Stanfield | | Chairman, Chief Executive Officer and
Director (Principal Executive Officer) | | March 17, 2014 |
| | |
/s/ John G. Scanlon John G. Scanlon | | Executive Vice President (Chief Financial Officer) | | March 17, 2014 |
| | |
/s/ Madalyn C. Behneman Madalyn C. Behneman | | Senior Vice President (Principal Accounting Officer) | | March 17, 2014 |
| | |
/s/ John M. Albertine John M. Albertine | | Director | | March 17, 2014 |
| | |
/s/ Thomas G. Amato Thomas G. Amato | | Director | | March 17, 2014 |
| | |
/s/ James L. Kempner James L. Kempner | | Director | | March 17, 2014 |
| | |
/s/ Thomas L. Kempner Thomas L. Kempner | | Director | | March 17, 2014 |
| | |
/s/ David A. McGough David A. McGough | | Director | | March 17, 2014 |
| | |
/s/ Norman N. Mintz Norman N. Mintz | | Director | | March 17, 2014 |
| | |
/s/ William J. Wilson William J. Wilson | | Director | | March 17, 2014 |