UNITED STATES
SECURITIES AND EXCHANGE COMMISSION
Washington, D.C. 20549
FORM N-CSR
CERTIFIED SHAREHOLDER REPORT OF REGISTERED
MANAGEMENT INVESTMENT COMPANIES
Investment Company Act File Number: 811-09597
LORD ABBETT LARGE-CAP GROWTH FUND
(Exact name of Registrant as specified in charter)
90 Hudson Street, Jersey City, NJ 07302
(Address of principal executive offices) (Zip code)
Thomas R. Phillips, Esq., Vice President & Assistant Secretary
90 Hudson Street, Jersey City, NJ 07302
(Name and address of agent for service)
Registrant’s telephone number, including area code: (800) 201-6984
Date of fiscal year end: 7/31
Date of reporting period: 7/31/2008
Item 1: Report(s) to Shareholders.
2008
LORD ABBETT
ANNUAL REPORT

Lord Abbett Large Cap Growth Fund
For the fiscal year ended July 31, 2008

Lord Abbett Large Cap Growth Fund
Annual Report
For the fiscal year ended July 31, 2008
Dear Shareholders: We are pleased to provide you with this overview of the Lord Abbett Large Cap Growth Fund's performance for the fiscal year ended July 31, 2008. On this and the following pages, we discuss the major factors that influenced performance. For detailed and more timely information about the Fund, please visit our Website at www.lordabbett.com, where you also can access the quarterly commentaries of the Fund's portfolio managers.
General information about Lord Abbett mutual funds, as well as in-depth discussion of market trends and investment strategies, is also provided in Lord Abbett Insights, a newsletter accompanying your quarterly account statements. We also encourage you to call Lord Abbett at 888-522-2388 and speak to one of our professionals if you would like more information.
Thank you for investing in Lord Abbett mutual funds. We value the trust that you place in us and look forward to serving your investment needs in the years to come.
Best regards,

Robert S. Dow
Chairman

From left to right: Robert S. Dow, Director and Chairman of the Lord Abbett Funds; E. Thayer Bigelow, Independent Lead Director of the Lord Abbett Funds; and Daria L. Foster, Director and President of the Lord Abbett Funds.
Q: What were the overall market conditions during the fiscal year ended July 31, 2008?
A: The 12-month period was marked by considerable volatility and, in the last half of the fiscal year, by an overall downward trend in the equity markets, as measured by the S&P 500® Index,1 which fell 11.09% in the 12-month period ended July 31, 2008.
Overall, growth stocks (as represented by the Russell 3000® Growth Index2) fared better than value stocks (as represented by the Russell 3000 Value Index3). Small cap stocks (as measured by the Russell 2000® Index4) lost 6.71%, but performed better than either mid caps (as represented by the Russell Midcap® Index5) or lar ge caps (as represented by the
1
Russell 1000® Index6), which fell 10.10% and 10.62%, respectively.
The period was marked by a depressed housing market, a weak dollar, skyrocketing oil prices, rising commodity prices, a weak labor market, inflation fears, and constraints on credit. Between September 18, 2007, and April 30, 2008, the Federal Reserve Board cut the fed funds rate seven times, lowering rates from 4.75% to 2.00% – a level last seen in November 2004.
Q: How did the Fund perform during the fiscal year ended July 31, 2008?
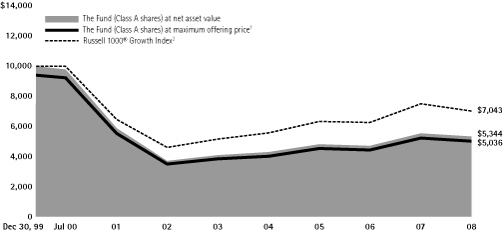
A: The Fund returned -4.01%, reflecting performance at the net asset value (NAV) of Class A shares, with all distributions reinvested, compared to its benchmark, the Russell 1000 Growth Index,7 which had a total return of -6.29% over the same period.
Q: What were the most significant factors affecting performance?
A: The greatest contributors to the Fund's performance relative to the benchmark for the one-year period were the healthcare, financial services, and the materials and processing sectors.
Among the individual holdings that contributed to performance were materials and processing holdings The Mosaic Co. (the Fund's number-one contributor), a producer of crop nutrients to the agricultural communities, and Monsanto Co., a provider of technology-based solutions and agricultural products for growers and downstream customers in the agricultural markets; and technology holding Research In Motion Ltd., a maker of wireless solutions for the worldwide mobile communications market.
The greatest detractors from the Fund's performance relative to the benchmark for the one-year period were the technology, utilities, and producer durables sectors.
Among the individual holdings that detracted from performance were three technology holdings: Ciena Corp. (the Fund's number-one detractor), a developer of communications network platforms and software, and provider of professional services; Microsoft Corp., a developer and manufacturer of software products; and NVIDIA Corp., a designer of three-dimensional (3D) graphics processors and related software.
The Fund's portfolio is actively managed and, therefore, its holdings and the weightings of a particular issuer or particular sector as a percentage of portfolio assets are subject to change. Sectors may include many industries.
2
A prospectus contains important information about a fund, including its investment objectives, risks, charges, and ongoing expenses, which an investor should carefully consider before investing. To obtain a prospectus on any Lord Abbett mutual fund, please contact your investment professional or Lord Abbett Distributor LLC at 888-522-2388 or visit our Website at www.lordabbett.com. Read the prospectus carefully before investing.
1 The S&P 500® Index is widely regarded as the standard for measuring large cap U.S. stock market performance and includes a representative sample of leading companies in leading industries.
2 The Russell 3000® Growth Index measures the performance of those Russell 3000 Index companies with higher price-to-book ratios and higher forecasted growth values. The stocks in this index are also members of either the Russell 1000® Growth or the Russell 2000® Growth indexes.
3 The Russell 3000 Value Index measures the performance of those Russell 3000 Index companies with lower price-to-book ratios and lower forecasted growth values.
4 The Russell 2000 Index measures the performance of the 2,000 smallest companies in the Russell 3000 Index, which represents approximately 10% of the total market capitalization of the Russell 3000 Index.
5 The Russell Midcap® Index measures the performance of the 800 smallest companies in the Russell 1000 Index, which represent approximately 31% of the total market capitalization of the Russell 1000 Index.
6 The Russell 1000 Index measures the performance of the 1,000 largest companies in the Russell 3000 Index, which represents approximately 90% of the total market capitalization of the Russell 3000 Index.
7 The Russell 1000 Growth Index measures the performance of those Russell 1000 companies with higher price-to-book ratios and higher forecasted growth values.
Indexes are unmanaged, do not reflect the deduction of fees or expenses, and are not available for direct investment.
Important Performance and Other Information
Performance data quoted reflect past performance and are no guarantee of future results. Current performance may be higher or lower than the performance quoted. The investment return and principal value of an investment in the Fund will fluctuate so that shares, on any given day or when redeemed, may be worth more or less than their original cost. You can obtain performance data current to the most recent month end by calling Lord Abbett at 888-522-2388 or referring to our Website at www.lordabbett.com.
Except where noted, comparative fund performance does not account for the deduction of sales charges and would be different if sales charges were included. The Fund offers several classes of shares with distinct pricing options. For a full description of the differences in pricing alternatives, please see the Fund's prospectus.
During certain periods shown, expense reimbursements were in place. Without such expense reimbursements, the Fund's returns would have been lower.
The views of the Fund's management and the portfolio holdings described in this report are as of July 31, 2008; these views and portfolio holdings may have changed subsequent to this date, and they do not guarantee the future performance of the markets or the Fund. Information provided in this report should not be considered a recommendation to purchase or sell securities.
A Note about Risk: See Notes to Financial Statements for a discussion of investment risks. For a more detailed discussion of the risks associated with the Fund, please see the Fund's prospectus.
Mutual funds are not insured by the Federal Deposit Insurance Corporation, are not deposits or other obligations of, or guaranteed by, banks, and are subject to investment risks, including possible loss of principal amount invested.
3
Investment Comparison
Below is a comparison of a $10,000 investment in Class A shares with the same investment in the Russell 1000® Growth Index (the "Index"), assuming reinvestment of all dividends and distributions. The performance of other classes will be greater than or less than the performance shown in the graph below due to different sales loads and expenses applicable to such classes. The graph and performance table below do not reflect the deduction of taxes that a shareholder would pay on Fund distributions or the redemption of Fund shares. During certain periods, expenses of the Fund have been reimbursed by Lord Abbett; without such reimbursement of expenses, the Fund's returns would have been lower. Past performance is no guarantee of future results.
Average Annual Total Return at Maximum Applicable Sales Charge for the Periods Ended July 31, 2008
| | | 1 Year | | 5 Years | | Life of
Class | |
| Class A3 | | | -9.46 | % | | | 4.17 | % | | | -7.68 | % | |
| Class B4 | | | -8.55 | % | | | 4.56 | % | | | -7.60 | % | |
| Class C5 | | | -4.57 | % | | | 4.73 | % | | | -7.64 | % | |
| Class F6 | | | — | | | | — | | | | -11.94 | %* | |
| | | 1 Year | | 5 Years | | Life of
Class | |
| Class I7 | | | -3.66 | % | | | 5.89 | % | | | -6.95 | % | |
| Class P8 | | | -4.15 | % | | | 5.43 | % | | | -6.98 | % | |
| Class R29 | | | — | | | | — | | | | -11.94 | %* | |
| Class R310 | | | — | | | | — | | | | -12.25 | %* | |
1 Reflects the deduction of the maximum initial sales charge of 5.75%.
2 Performance of the unmanaged index does not reflect transaction costs, management fees or sales charges. The performance of the index is not necessarily representative of the Fund's performance.
3 The Class A shares were first offered to the public on December 30, 1999. Total return, which is the percentage change in net asset value, after deduction of the maximum initial sales charge of 5.75% applicable to Class A shares, with all dividends and distributions reinvested for the periods shown ended July 31, 2008, is calculated using the SEC-required uniform method to compute such return.
4 Class B shares were first offered on December 30, 1999. Performance reflects the deduction of a CDSC of 4% for 1 year, 1% for 5 years and 0% for the life of the class. Class B shares automatically convert to Class A shares after approximately 8 years. (There is no initial sales charge for automatic conversions.) All returns for periods greater than 8 years reflect this conversion.
5 Class C shares were first offered on December 30, 1999. The 1% CDSC for Class C shares normally applies before the first anniversary of the purchase date. Performance is at net asset value.
6 Class F shares commenced operations and performance for the class began on September 28, 2007. Performance is at net asset value.
7 Class I shares were first offered on December 30, 1999. Performance is at net asset value.
8 Class P shares were first offered on December 30, 1999. Performance is at net asset value.
9 Class R2 shares commenced operations and performance for the class began on September 28, 2008. Performance is at net asset value.
10 Class R3 shares commenced operations and performance for the class began on September 28, 2007. Performance is at net asset value.
* Because Class F, R2 and R3 shares have existed for less than one year, average annual returns are not provided.
4
Expense Example
As a shareholder of the Fund, you incur two types of costs: (1) transaction costs, including sales charges (loads) on purchase payments (these charges vary among the share classes); and (2) ongoing costs, including management fees; distribution and service (12b-1) fees (these charges vary among the share classes); and other Fund expenses. This Example is intended to help you understand your ongoing costs (in dollars) of investing in the Fund and to compare these costs with the ongoing costs of investing in other mutual funds.
The Example is based on an investment of $1,000 invested at the beginning of the period and held for the entire period (February 1, 2008 through July 31, 2008).
Actual Expenses
For each class of the Fund, the first line of the table on the following page provides information about actual account values and actual expenses. You may use the information in this line, together with the amount you invested, to estimate the expenses that you paid over the period. Simply divide your account value by $1,000 (for example, an $8,600 account value divided by $1,000 = 8.6), then multiply the result by the number in the first line under the heading entitled "Expenses Paid During the Period 2/1/08 – 7/31/08" to estimate the expenses you paid on your account during this period.
Hypothetical Example for Comparison Purposes
For each class of the Fund, the second line of the table on the following page provides information about hypothetical account values and hypothetical expenses based on the Fund's actual expense ratio and an assumed rate of return of 5% per year before expenses, which is not the Fund's actual return. The hypothetical account values and expenses may not be used to estimate the actual ending account balance or expenses you paid for the period. You may use this information to compare the ongoing costs of investing in the Fund and other funds. To do so, compare this 5% hypothetical example with the 5% hypothetical examples that appear in the shareholder reports of the other funds.
5
Please note that the expenses shown in the table are meant to highlight your ongoing costs only and do not reflect any transactional costs, such as sales charges (loads). Therefore, the second line of the table is useful in comparing ongoing costs only, and will not help you determine the relative total costs of owning different funds. In addition, if these transactional costs were included, your costs would have been higher.
| | | Beginning
Account
Value | | Ending
Account
Value | | Expenses
Paid During
Period† | |
| | | 2/1/08 | | 7/31/08 | | 2/1/08 -
7/31/08 | |
| Class A | |
| Actual | | $ | 1,000.00 | | | $ | 977.90 | | | $ | 7.38 | | |
| Hypothetical (5% Return Before Expenses) | | $ | 1,000.00 | | | $ | 1,017.40 | | | $ | 7.52 | | |
| Class B | |
| Actual | | $ | 1,000.00 | | | $ | 974.90 | | | $ | 10.56 | | |
| Hypothetical (5% Return Before Expenses) | | $ | 1,000.00 | | | $ | 1,014.16 | | | $ | 10.77 | | |
| Class C | |
| Actual | | $ | 1,000.00 | | | $ | 974.90 | | | $ | 10.56 | | |
| Hypothetical (5% Return Before Expenses) | | $ | 1,000.00 | | | $ | 1,014.16 | | | $ | 10.77 | | |
| Class F | |
| Actual | | $ | 1,000.00 | | | $ | 979.60 | | | $ | 6.00 | | |
| Hypothetical (5% Return Before Expenses) | | $ | 1,000.00 | | | $ | 1,018.81 | | | $ | 6.12 | | |
| Class I | |
| Actual | | $ | 1,000.00 | | | $ | 979.70 | | | $ | 5.66 | | |
| Hypothetical (5% Return Before Expenses) | | $ | 1,000.00 | | | $ | 1,019.14 | | | $ | 5.77 | | |
| Class P | |
| Actual | | $ | 1,000.00 | | | $ | 978.00 | | | $ | 6.98 | | |
| Hypothetical (5% Return Before Expenses) | | $ | 1,000.00 | | | $ | 1,017.80 | | | $ | 7.12 | | |
| Class R2 | |
| Actual | | $ | 1,000.00 | | | $ | 981.20 | | | $ | 3.84 | | |
| Hypothetical (5% Return Before Expenses) | | $ | 1,000.00 | | | $ | 1,020.97 | | | $ | 3.92 | | |
| Class R3 | |
| Actual | | $ | 1,000.00 | | | $ | 977.80 | | | $ | 7.13 | | |
| Hypothetical (5% Return Before Expenses) | | $ | 1,000.00 | | | $ | 1,017.66 | | | $ | 7.27 | | |
† For each class of the Fund, expenses are equal to the annualized expense ratio for such class (1.50% Class A, 2.15% for Classes B and C, 1.22% for Class F, 1.15% for Class I, 1.42% for Class P, 0.78% for Class R2 and 1.45% for Class R3) multiplied by the average account value over the period, multiplied by 182/366 for all classes (to reflect one-half year period).
Portfolio Holdings Presented by Sector
July 31, 2008
| Sector* | | %** | |
| Auto & Transportation | | | 2.54 | % | |
| Consumer Discretionary | | | 13.12 | % | |
| Consumer Staples | | | 6.92 | % | |
| Financial Services | | | 7.43 | % | |
| Healthcare | | | 21.06 | % | |
| Integrated Oils | | | 1.34 | % | |
| Materials & Processing | | | 4.10 | % | |
| Sector* | | %** | |
| Other | | | 0.98 | % | |
| Other Energy | | | 8.56 | % | |
| Producer Durables | | | 6.36 | % | |
| Technology | | | 20.56 | % | |
| Utilities | | | 1.08 | % | |
| Short-Term Investment | | | 5.95 | % | |
| Total | | | 100.00 | % | |
* A sector may comprise several industries.
** Represents percent of total investments.
6
Schedule of Investments
July 31, 2008
| Investments | | Shares | | Value
(000) | |
| COMMON STOCKS 94.84% | |
| Aerospace 2.83% | |
| Boeing Co. (The) | | | 12,067 | | | $ | 737 | | |
| Lockheed Martin Corp. | | | 37,214 | | | | 3,883 | | |
| United Technologies Corp. | | | 27,882 | | | | 1,784 | | |
| Total | | | 6,404 | | |
| Agriculture, Fishing & Ranching 1.29% | |
| Monsanto Co. | | | 24,576 | | | | 2,927 | | |
| Banks 2.69% | |
| Northern Trust Corp. | | | 43,000 | | | | 3,361 | | |
| State Street Corp. | | | 37,994 | | | | 2,722 | | |
| Total | | | 6,083 | | |
| Beverage: Soft Drinks 1.53% | |
| PepsiCo, Inc. | | | 51,971 | | | | 3,459 | | |
| Biotechnology Research & Production 12.26% | |
Alexion
Pharmaceuticals, Inc.* | | | 26,000 | | | | 2,438 | | |
| Baxter International, Inc. | | | 98,376 | | | | 6,750 | | |
| Celgene Corp.* | | | 96,293 | | | | 7,269 | | |
| Genentech, Inc.* | | | 23,500 | | | | 2,238 | | |
| Genzyme Corp.* | | | 76,000 | | | | 5,825 | | |
| ImClone Systems Inc.* | | | 50,000 | | | | 3,197 | | |
| Total | | | 27,717 | | |
| Chemicals 1.32% | |
Energy Conversion
Devices, Inc.* | | | 9,000 | | | | 630 | | |
| Praxair, Inc. | | | 25,000 | | | | 2,343 | | |
| Total | | | 2,973 | | |
| Communications Technology 6.67% | |
| Ciena Corp.* | | | 88,125 | | | | 1,822 | | |
| Cisco Systems, Inc.* | | | 151,938 | | | | 3,341 | | |
| Corning, Inc. | | | 57,564 | | | | 1,152 | | |
| Juniper Networks, Inc.* | | | 63,252 | | | | 1,646 | | |
| QUALCOMM Inc. | | | 77,000 | | | | 4,261 | | |
| Investments | | Shares | | Value
(000) | |
Research In Motion Ltd.
(Canada)*(a) | | | 23,226 | | | $ | 2,853 | | |
| Total | | | 15,075 | | |
| Computer Services, Software & Systems 4.85% | |
| Microsoft Corp. | | | 193,095 | | | | 4,966 | | |
| Oracle Corp.* | | | 130,000 | | | | 2,799 | | |
| Salesforce.com, Inc.* | | | 50,200 | | | | 3,202 | | |
| Total | | | 10,967 | | |
| Computer Technology 4.53% | |
| Apple, Inc.* | | | 13,630 | | | | 2,166 | | |
International Business
Machines Corp. | | | 54,000 | | | | 6,911 | | |
| NetApp, Inc.* | | | 45,399 | | | | 1,160 | | |
| Total | | | 10,237 | | |
| Consumer Electronics 3.07% | |
| Activision Blizzard, Inc.* | | | 16,000 | | | | 576 | | |
| Electronic Arts Inc.* | | | 12,000 | | | | 518 | | |
| Google, Inc. Class A* | | | 12,326 | | | | 5,839 | | |
| Total | | | 6,933 | | |
| Copper 0.57% | |
Freeport-McMoRan
Copper & Gold, Inc. | | | 13,290 | | | | 1,286 | | |
| Cosmetics 0.45% | |
| Avon Products, Inc. | | | 24,000 | | | | 1,018 | | |
| Diversified Financial Services 1.74% | |
Bank of New York
Mellon Corp. | | | 38,000 | | | | 1,349 | | |
Goldman Sachs
Group, Inc. (The) | | | 7,879 | | | | 1,450 | | |
| Visa Inc.* | | | 15,369 | | | | 1,123 | | |
| Total | | | 3,922 | | |
| Diversified Production 1.81% | |
| Danaher Corp. | | | 51,417 | | | | 4,095 | | |
See Notes to Financial Statements.
7
Schedule of Investments (continued)
July 31, 2008
| Investments | | Shares | | Value
(000) | |
| Drug & Grocery Store Chains 1.45% | |
| Kroger Co. (The) | | | 116,000 | | | $ | 3,280 | | |
| Drugs & Pharmaceuticals 7.45% | |
| Abbott Laboratories | | | 59,000 | | | | 3,324 | | |
BioMarin
Pharmaceutical Inc.* | | | 29,000 | | | | 944 | | |
| Elan Corp. plc ADR* | | | 29,000 | | | | 581 | | |
| Gilead Sciences, Inc.* | | | 135,942 | | | | 7,338 | | |
| United Therapeutics Corp.* | | | 18,572 | | | | 2,106 | | |
| Wyeth | | | 63,000 | | | | 2,553 | | |
| Total | | | 16,846 | | |
| Electrical Equipment & Components 1.02% | |
| Emerson Electric Co. | | | 47,196 | | | | 2,298 | | |
| Electronics: Medical Systems 0.99% | |
| Illumina, Inc.* | | | 24,000 | | | | 2,238 | | |
| Electronics: Semi-Conductors/Components 4.68% | |
| First Solar, Inc.* | | | 9,000 | | | | 2,566 | | |
| Intel Corp. | | | 181,000 | | | | 4,016 | | |
Marvell Technology
Group Ltd. (Bermuda)*(a) | | | 147,000 | | | | 2,174 | | |
| SunPower Corp. Class A* | | | 23,000 | | | | 1,812 | | |
| Total | | | 10,568 | | |
| Fertilizers 0.96% | |
| Mosaic Co. (The)* | | | 17,000 | | | | 2,163 | | |
Financial Data Processing Services &
Systems 0.49% | |
| Western Union Co. (The) | | | 40,000 | | | | 1,106 | | |
| Foods 1.68% | |
| General Mills, Inc. | | | 59,000 | | | | 3,799 | | |
| Insurance: Multi-Line 1.22% | |
| Aon Corp. | | | 60,000 | | | | 2,748 | | |
| Machinery: Construction & Handling 0.53% | |
| Caterpillar Inc. | | | 17,069 | | | | 1,187 | | |
| Investments | | Shares | | Value
(000) | |
| Machinery: Industrial/Specialty 0.23% | |
| Illinois Tool Works Inc. | | | 11,000 | | | $ | 515 | | |
| Machinery: Oil Well Equipment & Services 7.42% | |
Cameron
International Corp.* | | | 32,378 | | | | 1,546 | | |
| Halliburton Co. | | | 36,800 | | | | 1,650 | | |
Nabors Industries Ltd.
(Bermuda)*(a) | | | 50,500 | | | | 1,841 | | |
National-Oilwell
Varco, Inc.* | | | 26,826 | | | | 2,109 | | |
| Schlumberger Ltd. | | | 39,600 | | | | 4,023 | | |
| Tenaris SA ADR | | | 63,000 | | | | 3,796 | | |
Weatherford
International, Ltd.* | | | 48,000 | | | | 1,811 | | |
| Total | | | 16,776 | | |
| Medical & Dental Instruments & Supplies 0.53% | |
| Becton, Dickinson & Co. | | | 14,000 | | | | 1,189 | | |
| Multi-Sector Companies 0.99% | |
Honeywell
International, Inc. | | | 44,133 | | | | 2,244 | | |
| Offshore Drilling 0.71% | |
Transocean Inc.
(Cayman Islands)*(a) | | | 11,810 | | | | 1,606 | | |
| Oil: Crude Producers 0.50% | |
| Devon Energy Corp. | | | 11,846 | | | | 1,124 | | |
| Oil: Integrated Domestic 0.88% | |
| Hess Corp. | | | 9,591 | | | | 973 | | |
| Occidental Petroleum Corp. | | | 13,015 | | | | 1,026 | | |
| Total | | | 1,999 | | |
| Oil: Integrated International 0.47% | |
| Exxon Mobil Corp. | | | 13,165 | | | | 1,059 | | |
| Railroads 2.26% | |
| Union Pacific Corp. | | | 62,000 | | | | 5,111 | | |
See Notes to Financial Statements.
8
Schedule of Investments (concluded)
July 31, 2008
| Investments | | Shares | | Value
(000) | |
| Restaurants 3.37% | |
| Darden Restaurants, Inc. | | | 37,000 | | | $ | 1,205 | | |
| McDonald's Corp. | | | 78,397 | | | | 4,687 | | |
| Yum! Brands, Inc. | | | 48,000 | | | | 1,720 | | |
| Total | | | 7,612 | | |
| Retail 4.98% | |
| Kohl's Corp.* | | | 40,000 | | | | 1,676 | | |
| Ross Stores, Inc. | | | 47,000 | | | | 1,784 | | |
| Wal-Mart Stores, Inc. | | | 133,000 | | | | 7,797 | | |
| Total | | | 11,257 | | |
| Securities Brokerage & Services 1.36% | |
Charles Schwab
Corp. (The) | | | 134,115 | | | | 3,070 | | |
| Services: Commercial 1.36% | |
Accenture Ltd. Class A
(Bermuda)(a) | | | 73,600 | | | | 3,074 | | |
| Soaps & Household Chemicals 2.31% | |
| Colgate-Palmolive Co. | | | 34,283 | | | | 2,546 | | |
Procter & Gamble
Co. (The) | | | 41,000 | | | | 2,685 | | |
| Total | | | 5,231 | | |
| Transportation: Miscellaneous 0.30% | |
Expeditors International
of Washington, Inc. | | | 19,000 | | | | 675 | | |
| Utilities: Electrical 1.09% | |
| Entergy Corp. | | | 23,000 | | | | 2,459 | | |
Total Common Stocks
(cost $212,776,021) | | | 214,330 | | |
| Investments | | Principal
Amount
(000) | | Value
(000) | |
| SHORT-TERM INVESTMENT 6.00% | |
| Repurchase Agreement | |
Repurchase Agreement
dated 7/31/2008, 1.65%
due 8/1/2008 with State
Street Bank & Trust Co.
collateralized by
$13,650,000 of Federal
Home Loan Bank at
5.25% due 01/16/2009;
value: $13,837,688;
proceeds: $13,562,572
(cost $13,561,950) | | $ | 13,562 | | | $ | 13,562 | | |
Total Investments in Securities 100.84%
(cost $226,337,971) | | | 227,892 | | |
Liabilities in Excess of
Other Assets (0.84%) | | | (1,896 | ) | |
| Net Assets 100% | | $ | 225,996 | | |
ADR American Depositary Receipt.
* Non income-producing security
(a) Foreign security traded in U.S. dollars.
Industry classifications have not been audited by Deloitte & Touche LLP.
See Notes to Financial Statements.
9
Statement of Assets and Liabilities
July 31, 2008
| ASSETS: | |
| Investments in securities, at value (cost $226,337,971) | | $ | 227,891,606 | | |
| Receivables: | |
| Investment securities sold | | | 5,726,098 | | |
| Capital shares sold | | | 214,323 | | |
| Interest and dividends | | | 151,633 | | |
| From advisor (See Note 3) | | | 11,145 | | |
| Prepaid expenses and other assets | | | 43,985 | | |
| Total assets | | | 234,038,790 | | |
| LIABILITIES: | |
| Payables: | |
| Investment securities purchased | | | 7,200,324 | | |
| Capital shares reacquired | | | 307,201 | | |
| Management fee | | | 144,971 | | |
| 12b-1 distribution fees | | | 137,502 | | |
| Trustees' fees | | | 21,898 | | |
| To affiliates (See Note 3) | | | 12,560 | | |
| Fund administration | | | 12,461 | | |
| Accrued expenses and other liabilities | | | 206,015 | | |
| Total liabilities | | | 8,042,932 | | |
| NET ASSETS | | $ | 225,995,858 | | |
| COMPOSITION OF NET ASSETS: | |
| Paid-in capital | | $ | 257,683,738 | | |
| Accumulated net investment loss | | | (28,816 | ) | |
| Accumulated net realized loss on investments and foreign currency related transactions | | | (33,212,130 | ) | |
Net unrealized appreciation on investments and translation of assets and
liabilities denominated in foreign currencies | | | 1,553,066 | | |
| Net Assets | | $ | 225,995,858 | | |
See Notes to Financial Statements.
10
Statement of Assets and Liabilities (concluded)
July 31, 2008
| Net assets by class: | |
| Class A Shares | | $ | 119,320,677 | | |
| Class B Shares | | $ | 31,989,324 | | |
| Class C Shares | | $ | 50,103,437 | | |
| Class F Shares | | $ | 653,846 | | |
| Class I Shares | | $ | 23,882,581 | | |
| Class P Shares | | $ | 2,693 | | |
| Class R2 Shares | | $ | 8,808 | | |
| Class R3 Shares | | $ | 34,492 | | |
Outstanding shares by class
(unlimited number of authorized shares of beneficial interest): | | | | | |
| Class A Shares | | | 20,789,857 | | |
| Class B Shares | | | 5,890,037 | | |
| Class C Shares | | | 9,234,797 | | |
| Class F Shares | | | 113,798 | | |
| Class I Shares | | | 4,125,079 | | |
| Class P Shares | | | 467 | | |
| Class R2 Shares | | | 1,531 | | |
| Class R3 Shares | | | 6,018 | | |
Net asset value, offering and redemption price per share
(Net assets divided by outstanding shares): | | | | | |
| Class A Shares-Net asset value | | $ | 5.74 | | |
Class A Shares-Maximum offering price
(Net asset value plus sales charge of 5.75%) | | $ | 6.09 | | |
| Class B Shares-Net asset value | | $ | 5.43 | | |
| Class C Shares-Net asset value | | $ | 5.43 | | |
| Class F Shares-Net asset value | | $ | 5.75 | | |
| Class I Shares-Net asset value | | $ | 5.79 | | |
| Class P Shares-Net asset value | | $ | 5.77 | | |
| Class R2 Shares-Net asset value | | $ | 5.75 | | |
| Class R3 Shares-Net asset value | | $ | 5.73 | | |
See Notes to Financial Statements.
11
Statement of Operations
For the Year Ended July 31, 2008
| Investment income: | |
| Dividends (net of foreign withholding taxes of $15,389) | | $ | 2,107,975 | | |
| Interest | | | 296,899 | | |
| Total investment income | | | 2,404,874 | | |
| Expenses: | |
| Management fee | | | 1,814,738 | | |
| 12b-1 distribution plan-Class A | | | 449,571 | | |
| 12b-1 distribution plan-Class B | | | 353,185 | | |
| 12b-1 distribution plan-Class C | | | 510,738 | | |
| 12b-1 distribution plan-Class F | | | 75 | | |
| 12b-1 distribution plan-Class P | | | 23 | | |
| 12b-1 distribution plan-Class R2 | | | 47 | | |
| 12b-1 distribution plan-Class R3 | | | 71 | | |
| Shareholder servicing | | | 641,824 | | |
| Reports to shareholders | | | 109,040 | | |
| Registration | | | 104,466 | | |
| Fund administration | | | 96,786 | | |
| Subsidy (See Note 3) | | | 84,127 | | |
| Professional | | | 61,512 | | |
| Custody | | | 8,252 | | |
| Trustees' fees | | | 7,100 | | |
| Other | | | 11,911 | | |
| Gross expenses | | | 4,253,466 | | |
| Expense reductions (See Note 7) | | | (6,096 | ) | |
| Expenses assumed by advisor (See Note 3) | | | (154,580 | ) | |
| Net expenses | | | 4,092,790 | | |
| Net investment loss | | | (1,687,916 | ) | |
| Net realized and unrealized loss: | |
| Net realized gain on investments and foreign currency related transactions | | | 9,445,411 | | |
Net change in unrealized appreciation on investments and
translation of assets and liabilities denominated in foreign currencies | | | (17,019,071 | ) | |
| Net realized and unrealized loss | | | (7,573,660 | ) | |
| Net Decrease in Net Assets Resulting From Operations | | $ | (9,261,576 | ) | |
See Notes to Financial Statements.
12
Statements of Changes in Net Assets
| INCREASE (DECREASE) IN NET ASSETS | | For the Year Ended
July 31, 2008 | | For the Year Ended
July 31, 2007 | |
| Operations: | |
| Net investment loss | | $ | (1,687,916 | ) | | $ | (1,818,648 | ) | |
Net realized gain on investments and foreign currency
related transactions | | | 9,445,411 | | | | 18,357,155 | | |
Net change in unrealized appreciation on investments
and translation of assets and liabilities denominated
in foreign currencies | | | (17,019,071 | ) | | | 20,389,342 | | |
| Net increase (decrease) in net assets resulting from operations | | | (9,261,576 | ) | | | 36,927,849 | | |
| Capital share transactions (Net of share conversions) (See Note 11): | |
| Net proceeds from sales of shares | | | 79,437,449 | | | | 77,297,471 | | |
| Cost of shares reacquired | | | (98,359,890 | ) | | | (61,134,783 | ) | |
Net increase (decrease) in net assets resulting
from capital share transactions | | | (18,922,441 | ) | | | 16,162,688 | | |
| Net increase (decrease) in net assets | | | (28,184,017 | ) | | | 53,090,537 | | |
| NET ASSETS: | |
| Beginning of year | | $ | 254,179,875 | | | $ | 201,089,338 | | |
| End of year | | $ | 225,995,858 | | | $ | 254,179,875 | | |
| Accumulated net investment loss | | $ | (28,816 | ) | | $ | (39,937 | ) | |
See Notes to Financial Statements.
13
Financial Highlights
| | | Class A Shares | |
| | | Year Ended 7/31 | |
| | | 2008 | | 2007 | | 2006 | | 2005 | | 2004 | |
| Per Share Operating Performance | |
| Net asset value, beginning of year | | $ | 5.98 | | | $ | 5.07 | | | $ | 5.19 | | | $ | 4.62 | | | $ | 4.41 | | |
| Investment operations: | |
| Net investment loss(a) | | | (.03 | ) | | | (.04 | ) | | | (.03 | ) | | | (.01 | ) | | | (.05 | ) | |
| Net realized and unrealized gain (loss) | | | (.21 | ) | | | .95 | | | | (.09 | ) | | | .58 | | | | .26 | | |
| Total from investment operations | | | (.24 | ) | | | .91 | | | | (.12 | ) | | | .57 | | | | .21 | | |
| Net asset value, end of year | | $ | 5.74 | | | $ | 5.98 | | | $ | 5.07 | | | $ | 5.19 | | | $ | 4.62 | | |
| Total Return(b) | | | (4.01 | )% | | | 17.95 | % | | | (2.31 | )% | | | 12.34 | % | | | 4.76 | % | |
| Ratios to Average Net Assets: | |
Expenses, excluding expense
reductions and including
expenses assumed | | | 1.50 | % | | | 1.50 | % | | | 1.49 | % | | | 1.65 | % | | | 1.90 | % | |
Expenses, including expense
reductions and expenses assumed | | | 1.50 | % | | | 1.50 | % | | | 1.49 | % | | | 1.65 | % | | | 1.90 | % | |
Expenses, excluding expense
reductions and expenses assumed | | | 1.56 | % | | | 1.61 | % | | | 1.68 | % | | | 1.85 | % | | | 1.90 | % | |
| Net investment loss | | | (.50 | )% | | | (.62 | )% | | | (.61 | )% | | | (.25 | )% | | | (.98 | )% | |
| Supplemental Data: | |
| Net assets, end of year (000) | | $ | 119,321 | | | $ | 120,513 | | | $ | 110,300 | | | $ | 88,882 | | | $ | 79,114 | | |
| Portfolio turnover rate | | | 174.14 | % | | | 158.74 | % | | | 188.26 | % | | | 103.08 | % | | | 28.15 | % | |
(a) Calculated using average shares outstanding during the year.
(b) Total return does not consider the effects of sales loads and assumes the reinvestment of all distributions.
See Notes to Financial Statements.
14
Financial Highlights (continued)
| | | Class B Shares | |
| | | Year Ended 7/31 | |
| | | 2008 | | 2007 | | 2006 | | 2005 | | 2004 | |
| Per Share Operating Performance | |
| Net asset value, beginning of year | | $ | 5.70 | | | $ | 4.86 | | | $ | 5.01 | | | $ | 4.48 | | | $ | 4.31 | | |
| Investment operations: | |
| Net investment loss(a) | | | (.07 | ) | | | (.07 | ) | | | (.07 | ) | | | (.04 | ) | | | (.07 | ) | |
| Net realized and unrealized gain (loss) | | | (.20 | ) | | | .91 | | | | (.08 | ) | | | .57 | | | | .24 | | |
| Total from investment operations | | | (.27 | ) | | | .84 | | | | (.15 | ) | | | .53 | | | | .17 | | |
| Net asset value, end of year | | $ | 5.43 | | | $ | 5.70 | | | $ | 4.86 | | | $ | 5.01 | | | $ | 4.48 | | |
| Total Return(b) | | | (4.74 | )% | | | 17.28 | % | | | (2.99 | )% | | | 11.83 | % | | | 3.94 | % | |
Expenses, excluding expense
reductions and including
expenses assumed | | | 2.15 | % | | | 2.15 | % | | | 2.14 | % | | | 2.29 | % | | | 2.52 | % | |
Expenses, including expense
reductions and expenses assumed | | | 2.15 | % | | | 2.15 | % | | | 2.14 | % | | | 2.29 | % | | | 2.52 | % | |
Expenses, excluding expense
reductions and expenses assumed | | | 2.21 | % | | | 2.26 | % | | | 2.33 | % | | | 2.49 | % | | | 2.52 | % | |
| Net investment loss | | | (1.16 | )% | | | (1.27 | )% | | | (1.26 | )% | | | (.90 | )% | | | (1.60 | )% | |
| Supplemental Data: | |
| Net assets, end of year (000) | | $ | 31,989 | | | $ | 34,012 | | | $ | 30,200 | | | $ | 25,924 | | | $ | 20,731 | | |
| Portfolio turnover rate | | | 174.14 | % | | | 158.74 | % | | | 188.26 | % | | | 103.08 | % | | | 28.15 | % | |
(a) Calculated using average shares outstanding during the year.
(b) Total return does not consider the effects of sales loads and assumes the reinvestment of all distributions.
See Notes to Financial Statements.
15
Financial Highlights (continued)
| | | Class C Shares | |
| | | Year Ended 7/31 | |
| | | 2008 | | 2007 | | 2006 | | 2005 | | 2004 | |
| Per Share Operating Performance | |
| Net asset value, beginning of year | | $ | 5.69 | | | $ | 4.86 | | | $ | 5.00 | | | $ | 4.48 | | | $ | 4.31 | | |
| Investment from operations: | |
| Net investment loss(a) | | | (.07 | ) | | | (.07 | ) | | | (.07 | ) | | | (.04 | ) | | | (.08 | ) | |
| Net realized and unrealized gain (loss) | | | (.19 | ) | | | .90 | | | | (.07 | ) | | | .56 | | | | .25 | | |
| Total from investment operations | | | (.26 | ) | | | .83 | | | | (.14 | ) | | | .52 | | | | .17 | | |
| Net asset value, end of year | | $ | 5.43 | | | $ | 5.69 | | | $ | 4.86 | | | $ | 5.00 | | | $ | 4.48 | | |
| Total Return(b) | | | (4.57 | )% | | | 17.08 | % | | | (2.80 | )% | | | 11.61 | % | | | 3.94 | % | |
| Ratios to Average Net Assets: | |
Expenses, excluding expense
reductions and including
expenses assumed | | | 2.15 | % | | | 2.15 | % | | | 2.14 | % | | | 2.29 | % | | | 2.52 | % | |
Expenses, including expense
reductions and expenses assumed | | | 2.15 | % | | | 2.15 | % | | | 2.14 | % | | | 2.29 | % | | | 2.52 | % | |
Expenses, excluding expense
reductions and expenses assumed | | | 2.21 | % | | | 2.26 | % | | | 2.33 | % | | | 2.49 | % | | | 2.52 | % | |
| Net investment loss | | | (1.15 | )% | | | (1.28 | )% | | | (1.26 | )% | | | (.90 | )% | | | (1.60 | )% | |
| Supplemental Data: | |
| Net assets, end of year (000) | | $ | 50,103 | | | $ | 45,041 | | | $ | 33,206 | | | $ | 22,867 | | | $ | 16,648 | | |
| Portfolio turnover rate | | | 174.14 | % | | | 158.74 | % | | | 188.26 | % | | | 103.08 | % | | | 28.15 | % | |
(a) Calculated using average shares outstanding during the year.
(b) Total return does not consider the effects of sales loads and assumes the reinvestment of all distributions.
See Notes to Financial Statements.
16
Financial Highlights (continued)
| | | Class F Shares | |
| | | 9/28/2007(a)
to
7/31/2008 | |
| Per Share Operating Performance | |
| Net asset value, beginning of period | | $ | 6.53 | | |
| Investment operations: | |
| Net investment loss(b) | | | (.02 | ) | |
| Net realized and unrealized loss | | | (.76 | ) | |
| Total from investment operations | | | (.78 | ) | |
| Net asset value, end of period | | $ | 5.75 | | |
| Total Return(c) | | | (11.94 | )%(d) | |
| Ratio to Average Net Assets: | |
| Expenses, excluding expense reductions and including expenses assumed | | | 1.02 | %(d) | |
| Expenses, including expense reductions and expenses assumed | | | 1.02 | %(d) | |
| Expenses, excluding expense reductions and expenses assumed | | | 1.10 | %(d) | |
| Net investment loss | | | (.33 | )%(d) | |
| Supplemental Data: | |
| Net assets, end of period (000) | | $ | 654 | | |
| Portfolio turnover rate | | | 174.14 | % | |
(a) Commencement of investment operations was September 28, 2007, SEC effective date was September 14, 2007 and date shares first became available to the public was October 1, 2007.
(b) Calculated using average shares outstanding during the period.
(c) Total return does not consider the effects of sales loads and assumes the reinvestments of all distributions.
(d) Not annualized.
See Notes to Financial Statements.
17
Financial Highlights (continued)
| | | Class I Shares | |
| | | Year Ended 7/31 | |
| | | 2008 | | 2007 | | 2006 | | 2005 | | 2004 | |
| Per Share Operating Performance | |
| Net asset value, beginning of year | | $ | 6.01 | | | $ | 5.08 | | | $ | 5.18 | | | $ | 4.59 | | | $ | 4.35 | | |
| Investment from operations: | |
| Net investment loss(a) | | | (.01 | ) | | | (.02 | ) | | | (.01 | ) | | | .01 | | | | (.01 | ) | |
| Net realized and unrealized gain (loss) | | | (.21 | ) | | | .95 | | | | (.09 | ) | | | .58 | | | | .25 | | |
| Total from investment operations | | | (.22 | ) | | | .93 | | | | (.10 | ) | | | .59 | | | | .24 | | |
| Net asset value, end of year | | $ | 5.79 | | | $ | 6.01 | | | $ | 5.08 | | | $ | 5.18 | | | $ | 4.59 | | |
| Total Return(b) | | | (3.66 | )% | | | 18.31 | % | | | (1.93 | )% | | | 12.85 | % | | | 5.52 | % | |
| Ratio to Average Net Assets: | |
Expenses, excluding expense
reductions and including
expenses assumed | | | 1.15 | % | | | 1.15 | % | | | 1.14 | % | | | 1.26 | % | | | 1.52 | %† | |
Expenses, including expense
reductions and expenses assumed | | | 1.15 | % | | | 1.15 | % | | | 1.14 | % | | | 1.26 | % | | | 1.52 | %† | |
Expenses, excluding expense
reductions and expenses assumed | | | 1.21 | % | | | 1.25 | % | | | 1.30 | % | | | 1.52 | % | | | 1.52 | %† | |
| Net investment income (loss) | | | (.16 | )% | | | (.29 | )% | | | (.19 | )% | | | .23 | % | | | (.60 | )%† | |
| Supplemental Data: | |
| Net assets, end of year (000) | | $ | 23,883 | | | $ | 54,603 | | | $ | 27,371 | | | $ | 1,676 | | | $ | 1 | | |
| Portfolio turnover rate | | | 174.14 | % | | | 158.74 | % | | | 188.26 | % | | | 103.08 | % | | | 28.15 | % | |
† The ratios have been determined on a Fund basis.
(a) Calculated using average shares outstanding during the year.
(b) Total return does not consider the effects of sales loads and assumes the reinvestment of all distributions.
See Notes to Financial Statements.
18
Financial Highlights (continued)
| | | Class P Shares | |
| | | Year Ended 7/31 | |
| | | 2008 | | 2007 | | 2006 | | 2005 | | 2004 | |
| Per Share Operating Performance | |
| Net asset value, beginning of year | | $ | 6.02 | | | $ | 5.11 | | | $ | 5.23 | | | $ | 4.65 | | | $ | 4.43 | | |
| Investment operations: | |
| Net investment loss(a) | | | (.04 | ) | | | (.04 | ) | | | (.03 | ) | | | (.01 | ) | | | (.04 | ) | |
| Net realized and unrealized gain (loss) | | | (.21 | ) | | | .95 | | | | (.09 | ) | | | .59 | | | | .26 | | |
| Total from investment operations | | | (.25 | ) | | | .91 | | | | (.12 | ) | | | .58 | | | | .22 | | |
| Net asset value, end of year | | $ | 5.77 | | | $ | 6.02 | | | $ | 5.11 | | | $ | 5.23 | | | $ | 4.65 | | |
| Total Return(b) | | | (4.15 | )% | | | 17.81 | % | | | (2.29 | )% | | | 12.47 | % | | | 4.97 | % | |
| Ratios to Average Net Assets: | |
Expenses, excluding expense
reductions and including
expenses assumed | | | 1.55 | % | | | 1.60 | % | | | 1.57 | % | | | 1.53 | % | | | 1.97 | %† | |
Expenses, including expense
reductions and expenses assumed | | | 1.55 | % | | | 1.60 | % | | | 1.57 | % | | | 1.53 | % | | | 1.97 | %† | |
Expenses, excluding expense
reductions and expenses assumed | | | 1.61 | % | | | 1.70 | % | | | 1.70 | % | | | 1.64 | % | | | 1.97 | %† | |
| Net investment loss | | | (.67 | )% | | | (.72 | )% | | | (.60 | )% | | | (.17 | )% | | | (1.05 | )%† | |
| Supplemental Data: | |
| Net assets, end of year (000) | | $ | 3 | | | $ | 11 | | | $ | 12 | | | $ | 1 | | | $ | 1 | | |
| Portfolio turnover rate | | | 174.14 | % | | | 158.74 | % | | | 188.26 | % | | | 103.08 | % | | | 28.15 | % | |
† The ratios have been determined on a Fund basis.
(a) Calculated using average shares outstanding during the year.
(b) Total return does not consider the effects of sales loads and assumes the reinvestment of all distributions.
See Notes to Financial Statements.
19
Financial Highlights (continued)
| | | Class R2 Shares | |
| | | 9/28/2007(a)
to
7/31/2008 | |
| Per Share Operating Performance | |
| Net asset value, beginning of period | | $ | 6.53 | | |
| Investment operations: | |
| Net investment loss(b) | | | (.01 | ) | |
| Net realized and unrealized loss | | | (.77 | ) | |
| Total from investment operations | | | (.78 | ) | |
| Net asset value, end of period | | $ | 5.75 | | |
| Total Return(c) | | | (11.94 | )%(d) | |
| Ratio to Average Net Assets: | |
| Expenses, excluding expense reductions and including expenses assumed | | | .98 | %(d) | |
| Expenses, including expense reductions and expenses assumed | | | .98 | %(d) | |
| Expenses, excluding expense reductions and expenses assumed | | | 1.03 | %(d) | |
| Net investment loss | | | (.12 | )%(d) | |
| Supplemental Data: | |
| Net assets, end of period (000) | | $ | 9 | | |
| Portfolio turnover rate | | | 174.14 | % | |
(a) Commencement of investment operations was September 28, 2007, SEC effective date was September 14, 2007 and date shares first became available to the public was October 1, 2007.
(b) Calculated using average shares outstanding during the period.
(c) Total return does not consider the effects of sales loads and assumes the reinvestments of all distributions.
(d) Not annualized.
See Notes to Financial Statements.
20
Financial Highlights (concluded)
| | | Class R3 Shares | |
| | | 9/28/2007(a)
to
7/31/2008 | |
| Per Share Operating Performance | |
| Net asset value, beginning of period | | $ | 6.53 | | |
| Investment operations: | |
| Net investment loss(b) | | | (.02 | ) | |
| Net realized and unrealized loss | | | (.78 | ) | |
| Total from investment operations | | | (.80 | ) | |
| Net asset value, end of period | | $ | 5.73 | | |
| Total Return(c) | | | (12.25 | )%(d) | |
| Ratio to Average Net Assets: | |
| Expenses, excluding expense reductions and including expenses assumed | | | 1.24 | %(d) | |
| Expenses, including expense reductions and expenses assumed | | | 1.24 | %(d) | |
| Expenses, excluding expense reductions and expenses assumed | | | 1.30 | %(d) | |
| Net investment loss | | | (.40 | )%(d) | |
| Supplemental Data: | |
| Net assets, end of period (000) | | $ | 34 | | |
| Portfolio turnover rate | | | 174.14 | % | |
(a) Commencement of investment operations was September 28, 2007, SEC effective date was September 14, 2007 and date shares first became available to the public was October 1, 2007.
(b) Calculated using average shares outstanding during the period.
(c) Total return does not consider the effects of sales loads and assumes the reinvestments of all distributions.
(d) Not annualized.
See Notes to Financial Statements.
21
Notes to Financial Statements
1. ORGANIZATION
Lord Abbett Large-Cap Growth Fund (the "Fund") is registered under the Investment Company Act of 1940, as amended (the "Act"), as a diversified, open-end management investment company. The Fund was organized as a Delaware Statutory Trust on September 29, 1999. The Fund commenced operations on December 15, 1999, and the Securities and Exchange Commission declared the Fund effective and became available to the public on December 30, 1999.
The Fund's investment objective is long-term capital growth. The Fund offers eight classes of shares: Class A, B, C, F, I, P, R2, and R3, each with different expenses and dividends. A front-end sales charge is normally added to the Net Asset Value ("NAV") for Class A shares. There is no front-end sales charge in the case of the Class B, C, F, I, P, R2, and R3 shares, although there may be a contingent deferred sales charge ("CDSC") as follows: Class A shares purchased without a sales charge and redeemed before the first day of the month in which the one-year anniversary of the purchase falls (subject to certain exceptions); Class B shares redeemed before the sixth anniversary of purchase; and Class C shares redeemed before the first anniversary of purchase. Class B shares will automatically convert to Class A shares on the 25th day of the month (or the next business day thereafter) following the eighth anniversary of the original purchase of Class B shares. Effective September 28, 2007, Class Y shares were renamed Class I shares. As of October 1, 2007, the Fund's Class P shares were closed to substantially all new retirement and benefit plans and fee-based programs, with certain exceptions as set forth in the Fund's Prospectus. Class F, R2 and R3 shares commenced investment operations on September 28, 2007, and shares first became available to the public on October 1, 2007.
The preparation of financial statements in conformity with accounting principles generally accepted in the United States of America requires management to make certain estimates and assumptions that affect the reported amounts of assets and liabilities and disclosure of contingent assets and liabilities at the date of the financial statements and the reported amounts of increases and decreases in net assets from operations during the reporting period. Actual results could differ from those estimates.
2. SIGNIFICANT ACCOUNTING POLICIES
(a) Investment Valuation–Securities traded on any recognized U.S. or non-U.S. exchange or on The NASDAQ Stock Market LLC are valued at the last sale price or official closing price on the exchange or system on which they are principally traded. Events occurring after the close of trading on non-U.S. exchanges may result in adjustments to the valuation of foreign securities to more accurately reflect their fair value as of the close of regular trading on the New York Stock Exchange LLC. The Fund may rely on an independent fair valuation service in adjusting the valuations of foreign securities. Unlisted equity securities are valued at the last quoted sale price or, if no sale price is available, at the mean between the most recently quoted bid and asked prices. Securities for wh ich market quotations are not readily available are valued at fair value as determined by management and approved in good faith by the Board of Trustees. Short-term securities with 60 days or less remaining to maturity are valued using the amortized cost method, which approximates current market value.
22
Notes to Financial Statements (continued)
(b) Security Transactions–Security transactions are recorded as of the date that the securities are purchased or sold (trade date). Realized gains and losses on sales of portfolio securities are calculated using the identified-cost method. Realized and unrealized gains (losses) are allocated to each class of shares based upon the relative proportion of net assets at the beginning of the day.
(c) Investment Income–Dividend income is recorded on the ex-dividend date. Interest income is recorded on the accrual basis. Discounts are accreted and premiums are amortized using the effective interest method. Withholding taxes on foreign dividends have been provided for in accordance with the applicable country's tax rules and rates. Investment income is allocated to each class of shares based upon the relative proportion of net assets at the beginning of the day.
(d) Federal Taxes–It is the policy of the Fund to meet the requirements of Subchapter M of the Internal Revenue Code applicable to regulated investment companies and to distribute substantially all taxable income and capital gains to its shareholders. Therefore, no federal income tax provision is required.
(e) Expenses–Expenses, excluding class specific expenses, are allocated to each class of shares based upon the relative proportion of net assets at the beginning of the day. Class A, B, C, F, P, R2, and R3 shares bear their class specific share of all expenses and fees relating to the Fund's 12b-1 Distribution Plan.
(f) Foreign Transactions–The books and records of the Fund are maintained in U.S. dollars and transactions denominated in foreign currencies are recorded in the Fund's records at the rate prevailing when earned or recorded. Asset and liability accounts that are denominated in foreign currencies are adjusted to reflect current exchange rates. The resultant exchange gains and losses are included in Net realized gain on investments and foreign currency related transactions on the Fund's Statement of Operations. The Fund does not isolate that portion of the results of operations arising as a result of changes in the foreign exchange rates from the changes in market prices of the securities.
(g) Repurchase Agreements–The Fund may enter into repurchase agreements with respect to securities. A repurchase agreement is a transaction in which the Fund acquires a security and simultaneously commits to resell that security to the seller (a bank or securities dealer) at an agreed-upon price on an agreed-upon date. The Fund requires at all times that the repurchase agreement be collateralized by cash, or by securities of the U.S. Government, its agencies, its instrumentalities, or U.S. Government sponsored enterprises having a value equal to, or in excess of, the value of the repurchase agreement (including accrued interest). If the seller of the agreement defaults on its obligation to repurchase the underlying securities at a time when the value of those securities has dec lined, the Fund may incur a loss upon disposition of the securities.
3. MANAGEMENT FEE AND OTHER TRANSACTIONS WITH AFFILIATES
Management Fee
The Fund has a management agreement with Lord, Abbett & Co. LLC ("Lord Abbett") pursuant to which Lord Abbett supplies the Fund with investment management services and executive and other personnel, pays the remuneration of officers, provides office space and pays for ordinary
23
Notes to Financial Statements (continued)
and necessary office and clerical expenses relating to research and statistical work and supervision of the Fund's investment portfolio.
The management fee is based on average daily net assets at the following annual rates:
| First $1 billion | | | .75 | % | |
| Next $1 billion | | | .70 | % | |
| Over $2 billion | | | .65 | % | |
For the year ended July 31, 2008, the effective management fee paid to Lord Abbett was at an annualized rate of .75% of the Fund's average daily net assets.
Lord Abbett provides certain administrative services to the Fund pursuant to an Administrative Services Agreement at an annual rate of .04% of the Fund's average daily net assets.
For the period from August 1, 2007 through November 30, 2008, Lord Abbett contractually agreed to reimburse the Fund to the extent necessary so that each class' total annual operating expenses do not exceed the following annual rates:
| Class | | % of Average
Daily Net Assets | |
| A | | | 1.50 | % | |
| B | | | 2.15 | % | |
| C | | | 2.15 | % | |
| F | | | 1.25 | %(1) | |
| I | | | 1.15 | % | |
| P | | | 1.60 | % | |
| R2 | | | 1.75 | %(1) | |
| R3 | | | 1.65 | %(1) | |
(1) The contractual expense reimbursement agreement for Class F, R2 and R3 shares began on September 14, 2007.
The Fund, along with certain other funds managed by Lord Abbett (the "Underlying Funds"), has entered into a Servicing Arrangement with Lord Abbett Growth & Income Strategy Fund and Lord Abbett Diversified Equity Strategy Fund of Lord Abbett Investment Trust (each, a "Fund of Funds"), pursuant to which each Underlying Fund pays a portion of the expenses (excluding management fees and distribution and service fees) of each Fund of Funds in proportion to the average daily value of Underlying Fund shares owned by each Fund of Funds. Amounts paid pursuant to the Servicing Arrangement are included in Subsidy expense on the Fund's Statement of Operations and Payable to affiliates on the Fund's Statement of Assets and Liabilities.
12b-1 Distribution Plan
The Fund has adopted a distribution plan with respect to Class A, B, C, F, P, R2, and R3 shares pursuant to Rule 12b-1 under the Act, which provides for the payment of ongoing distribution and service fees to Lord Abbett Distributor LLC ("Distributor"), an affiliate of Lord Abbett. The fees are accrued daily at annual rates based upon average daily net assets as follows:
| Fee* | | Class A | | Class B | | Class C | | Class F | | Class P | | Class R2 | | Class R3 | |
| Service | | | .25 | % | | | .25 | % | | | .25 | % | | | - | | | | .20 | % | | | .25 | % | | | .25 | % | |
| Distribution | | | .10 | % | | | .75 | % | | | .75 | % | | | .10 | % | | | .25 | % | | | .35 | % | | | .25 | % | |
* The Fund may designate a portion of the aggregate fee as attributable to service activities for purposes of calculating Financial Industry Regulatory Authority, Inc. ("FINRA") sales charge limitations.
24
Notes to Financial Statements (continued)
Class I does not have a distribution plan.
Commissions
Distributor received the following commissions on sales of shares of the Fund, after concessions were paid to authorized dealers, for the year ended July 31, 2008:
Distributor
Commissions | | Dealers'
Concessions | |
| $ | 71,998 | | | $ | 391,973 | | |
Distributor received CDSCs of $2,563 and $4,154 for Class A and Class C shares, respectively, for the year ended July 31, 2008.
Two Trustees and certain of the Fund's officers have an interest in Lord Abbett.
4. DISTRIBUTIONS AND CAPITAL LOSS CARRYFORWARDS
Dividends from net investment income, if any, are declared and paid at least annually. Taxable net realized gains from investment transactions, reduced by capital loss carryforwards, if any, are declared and distributed to shareholders at least annually. The capital loss carryforward amount, if any, is available to offset future net capital gains. Dividends and distributions to shareholders are recorded on the ex-dividend date. The amount of dividends and distributions from net investment income and net realized capital gains are determined in accordance with federal income tax regulations which may differ from accounting principles generally accepted in the United States of America. These book/tax differences are either considered temporary or permanent in nature. To the extent these differences are permanent in nature, such amounts are reclassified within the components of net assets based on their federal tax basis treatment; temporary di fferences do not require reclassification. Dividends and distributions, which exceed earnings and profits for tax purposes, are reported as a tax return of capital.
As of July 31, 2008, the components of accumulated earnings (losses) on a tax-basis were as follows:
| Capital loss carryforwards* | | $ | (29,737,812 | ) | |
| Temporary differences | | | (1,068,728 | ) | |
| Unrealized losses - net | | | (881,340 | ) | |
| Total accumulated losses - net | | $ | (31,687,880 | ) | |
* As of July 31, 2008, the capital loss carryforwards along with the related expiration dates were as follows:
| 2011 | | 2012 | | Total | |
| $ | 26,241,370 | | | $ | 3,496,442 | | | $ | 29,737,812 | | |
Certain losses incurred after October 31 ("Post-October losses") within the taxable year are deemed to arise on the first business day of the Fund's next taxable year. The Fund incurred and will elect to defer net capital losses of $1,039,912 and net ordinary losses of $6,918 during fiscal 2008.
25
Notes to Financial Statements (continued)
As of July 31, 2008, the aggregate unrealized security gains and losses based on cost for U.S. federal income tax purposes were as follows:
| Tax cost | | $ | 228,772,377 | | |
| Gross unrealized gain | | | 13,163,334 | | |
| Gross unrealized loss | | | (14,044,105 | ) | |
| Net unrealized security loss | | $ | (880,771 | ) | |
The difference between book-basis and tax-basis unrealized gains (losses) is attributable to wash sales.
Permanent items identified during the fiscal year ended July 31, 2008, have been reclassified among the components of net assets based on their tax basis treatment as follows:
Accumulated
Net Investment
Loss | | Accumulated
Net Realized
Loss | | Paid-in
Capital | |
| $ | 1,699,037 | | | $ | 16,569 | | | $ | (1,715,606 | ) | |
The permanent differences are primarily attributable to the tax treatment of net investment losses.
5. PORTFOLIO SECURITIES TRANSACTIONS
Purchases and sales of investment securities (excluding short-term investments) for the year ended July 31, 2008 are as follows:
| Purchases | | Sales | |
| $ | 407,041,461 | | | $ | 438,916,982 | | |
There were no purchases or sales of U.S. Government securities for the year ended July 31, 2008.
6. TRUSTEES' REMUNERATION
The Fund's officers and the two Trustees who are associated with Lord Abbett do not receive any compensation from the Fund for serving in such capacities. Outside Trustees' fees are allocated among all Lord Abbett-sponsored funds based on the net assets of each fund. There is an equity-based plan available to all outside Trustees under which outside Trustees must defer receipt of a portion of, and may elect to defer receipt of an additional portion of, Trustees' fees. The deferred amounts are treated as though equivalent dollar amounts have been invested in the funds. Such amounts and earnings accrued thereon are included in Trustees' fees on the Statement of Operations and in Trustees' fees payable on the Statement of Assets and Liabilities and are not deductible for U.S. federal income tax purposes until such amounts are paid.
7. EXPENSE REDUCTIONS
The Fund has entered into arrangements with the Fund's transfer agent and custodian, whereby credits realized as a result of uninvested cash balances are used to reduce a portion of the Fund's expenses.
26
Notes to Financial Statements (continued)
8. LINE OF CREDIT
The Fund, along with certain other funds managed by Lord Abbett, has available a $250,000,000 unsecured revolving credit facility ("Facility") from a consortium of banks, to be used for temporary or emergency purposes as an additional source of liquidity to fund redemptions of investor shares. Any borrowings under this Facility will bear interest at current market rates as defined in the agreement. The fee for this Facility is at an annual rate of .08% of the available amount. As of July 31, 2008, there were no loans outstanding pursuant to this Facility nor was the Facility utilized at any time during the year ended July 31, 2008.
9. CUSTODIAN AND ACCOUNTING AGENT
State Street Bank & Trust Company ("SSB") is the Fund's custodian and accounting agent. SSB performs custodial, accounting and recordkeeping functions relating to portfolio transactions and calculating the Fund's NAV.
10. INVESTMENT RISKS
The Fund is subject to the general risks and considerations associated with equity investing, as well as the particular risks associated with growth stocks. The value of an investment in the Fund will fluctuate in response to movements in the equity securities markets in general, and to the changing prospects of individual companies in which the Fund invests. Large growth stocks may perform differently than the market as a whole and other types of stocks, such as small company stocks and bargain stocks. Different types of stocks tend to shift in and out of favor depending on market and economic conditions. Growth stocks tend to be more volatile than other stocks. In addition, if the Fund's assessment of a company's value or prospects for meeting or exceeding earnings expectations or market conditions is wrong, it could suffer losses or produce poor performance relative to other funds, even in a rising market.
These factors can affect the Fund's performance.
11. SUMMARY OF CAPITAL TRANSACTIONS
Transactions in shares of beneficial interest are as follows:
| | | Year Ended
July 31, 2008 | | Year Ended
July 31, 2007 | |
| Class A Shares | | Shares | | Amount | | Shares | | Amount | |
| Shares sold | | | 6,002,465 | | | $ | 37,242,878 | | | | 4,958,829 | | | $ | 28,249,001 | | |
| Converted from Class B* | | | 144,225 | | | | 870,220 | | | | 77,682 | | | | 453,191 | | |
| Shares reacquired | | | (5,508,544 | ) | | | (33,434,342 | ) | | | (6,631,114 | ) | | | (37,747,165 | ) | |
| Increase (decrease) | | | 638,146 | | | $ | 4,678,756 | | | | (1,594,603 | ) | | $ | (9,044,973 | ) | |
| Class B Shares | |
| Shares sold | | | 1,388,173 | | | $ | 8,187,617 | | | | 1,254,520 | | | $ | 6,796,985 | | |
| Shares reacquired | | | (1,317,145 | ) | | | (7,611,694 | ) | | | (1,413,509 | ) | | | (7,732,919 | ) | |
| Converted to Class A* | | | (152,014 | ) | | | (870,220 | ) | | | (81,364 | ) | | | (453,191 | ) | |
| Decrease | | | (80,986 | ) | | $ | (294,297 | ) | | | (240,353 | ) | | $ | (1,389,125 | ) | |
* Automatic conversion of Class B shares occurs approximately eight years after the initial purchase date.
27
Notes to Financial Statements (continued)
| | | Year Ended
July 31, 2008 | | Year Ended
July 31, 2007 | |
| Class C Shares | | Shares | | Amount | | Shares | | Amount | |
| Shares sold | | | 3,471,477 | | | $ | 20,489,460 | | | | 3,057,291 | | | $ | 16,635,253 | | |
| Shares reacquired | | | (2,151,661 | ) | | | (12,513,013 | ) | | | (1,977,721 | ) | | | (10,812,124 | ) | |
| Increase | | | 1,319,816 | | | $ | 7,976,447 | | | | 1,079,570 | | | $ | 5,823,129 | | |
| | | Period Ended
July 31, 2008† | | | |
| Class F Shares | | Shares | | Amount | | | | | |
| Shares sold | | | 122,230 | | | $ | 731,978 | | | | | | | | | | |
| Shares reacquired | | | (8,432 | ) | | | (48,993 | ) | | | | | | | | | |
| Increase | | | 113,798 | | | $ | 682,985 | | | | | | | | | | |
| | | Year Ended
July 31, 2008 | | Year Ended
July 31, 2007 | |
| Class I Shares | | Shares | | Amount | | Shares | | Amount | |
| Shares sold | | | 2,032,960 | | | $ | 12,732,760 | | | | 4,494,646 | | | $ | 25,605,912 | | |
| Shares reacquired | | | (6,990,784 | ) | | | (44,738,061 | ) | | | (798,727 | ) | | | (4,,828,089 | ) | |
| Increase (decrease) | | | (4,957,824 | ) | | $ | (32,005,301 | ) | | | 3,695,919 | | | $ | 20,777,823 | | |
| Class P Shares | |
| Shares sold | | | 553 | | | $ | 3,455 | | | | 1,841 | | | $ | 10,320 | | |
| Shares reacquired | | | (1,862 | ) | | | (11,808 | ) | | | (2,497 | ) | | | (14,486 | ) | |
| Decrease | | | (1,309 | ) | | $ | (8,353 | ) | | | (656 | ) | | $ | (4,166 | ) | |
| | | Period Ended
July 31, 2008† | | | |
| Class R2 Shares | | Shares | | Amount | | | | | |
| Shares sold | | | 1,531 | | | $ | 10,000 | | | | | | | | | | |
| Increase | | | 1,531 | | | $ | 10,000 | | | | | | | | | | |
| Class R3 Shares | |
| Shares sold | | | 6,343 | | | $ | 39,301 | | | | | | | | | | |
| Shares reacquired | | | (325 | ) | | | (1,979 | ) | | | | | | | | | |
| Increase | | | 6,018 | | | $ | 37,322 | | | | | | | | | | |
† For the period September 28, 2007 (commencement of investment operations) to July 31, 2008.
12. RECENT ACCOUNTING PRONOUNCEMENTS
In June 2006, the Financial Accounting Standards Board ("FASB") issued Interpretation No. 48, Accounting for Uncertainty in Income Taxes – an interpretation of FASB Statement No. 109 ("FIN 48"). FIN 48 clarifies the accounting for income taxes by prescribing the minimum recognition threshold a tax position must meet before being recognized in the financial statements. Effective January 31, 2008, the Fund adopted FIN 48. The adoption of FIN 48 did not result in a material impact on the Fund's net assets, results of operations and financial statement disclosures. The Fund files U.S. federal and various state tax returns. No income tax returns are currently under examination. The Fund's U.S. federal tax returns remain open for the years ended July 31, 2005 through July 31, 2008.
28
Notes to Financial Statements (concluded)
In September 2006, FASB issued Statement of Financial Accounting Standards No. 157, Fair Value Measurements ("SFAS 157"), which is effective for fiscal years beginning after November 15, 2007. SFAS 157 defines fair value, establishes a framework for measuring fair value and expands disclosures about fair value measurements. Management is currently evaluating the impact the adoption of SFAS 157 will have on the Fund's financial statements and disclosures.
In March 2008, FASB issued Statement of Financial Accounting Standards No. 161, Disclosures about Derivative Instruments and Hedging Activities ("SFAS 161"). SFAS 161 is intended to improve financial reporting about derivative instruments and hedging activities by requiring enhanced disclosures to enable investors to better understand their effects on an entity's financial position, financial performance and cash flows. SFAS 161 is effective for fiscal years and interim periods beginning after November 15, 2008. Management is currently evaluating the impact the adoption of SFAS 161 will have on the Fund's financial statements and disclosures.
29
Report of Independent Registered Public Accounting Firm
The Board of Trustees and Shareholders,
Lord Abbett Large-Cap Growth Fund:
We have audited the accompanying statement of assets and liabilities of Lord Abbett Large-Cap Growth Fund (the "Fund"), including the schedule of investments, as of July 31, 2008, and the related statement of operations for the year then ended, the statements of changes in net assets for each of the two years in the period then ended, and the financial highlights for each of the periods presented. These financial statements and financial highlights are the responsibility of the Fund's management. Our responsibility is to express an opinion on these financial statements and financial highlights based on our audits.
We conducted our audits in accordance with standards of the Public Company Accounting Oversight Board (United States). Those standards require that we plan and perform the audit to obtain reasonable assurance about whether the financial statements and financial highlights are free of material misstatement. The Fund is not required to have, nor were we engaged to perform, an audit of its internal control over financial reporting. Our audits included consideration of internal control over financial reporting as a basis for designing audit procedures that are appropriate in the circumstances, but not for the purpose of expressing an opinion on the effectiveness of the Fund's internal control over financial reporting. Accordingly, we express no such opinion. An audit also includes examining, on a test basis, evidence supporting the amounts and disclosures in the financial statements, assessing the accounting principles used and significant estim ates made by management, as well as evaluating the overall financial statement presentation. Our procedures included confirmation of securities owned as of July 31, 2008 by correspondence with the custodian and brokers; where replies were not received from brokers, we performed other auditing procedures. We believe that our audits provide a reasonable basis for our opinion.
In our opinion, the financial statements and financial highlights referred to above present fairly, in all material respects, the financial position of Lord Abbett Large-Cap Growth Fund as of July 31, 2008, the results of its operations for the year then ended, the changes in its net assets for each of the two years in the period then ended, and the financial highlights for each of the periods presented, in conformity with accounting principles generally accepted in the United States of America.
Deloitte & Touche LLP
New York, New York
September 23, 2008
30
Basic Information About Management
The Board of Trustees (the "Board") is responsible for the management of the business and affairs of the Fund in accordance with the laws of the State of Delaware. The Board appoints officers who are responsible for the day-to-day operations of the Fund and who execute policies authorized by the Board. The Board also approves an investment adviser to the Fund and continues to monitor the cost and quality of the services provided by the investment adviser, and annually considers whether to renew the contract with the adviser. Generally, each Trustee holds office until his/her successor is elected and qualified or until his/her earlier resignation or removal, as provided in the Fund's organizational documents.
Lord, Abbett & Co. LLC ("Lord Abbett"), a Delaware limited liability company, is the Fund's investment adviser.
Interested Trustees
The following Trustees are Partners of Lord Abbett and are "interested persons" of the Fund as defined in the Act. Mr. Dow and Ms. Foster are officers, directors, or trustees of each of the fourteen Lord Abbett-sponsored funds, which consist of 52 portfolios or series.
Name, Address and
Year of Birth | | Current Position
Length of Service
with Fund | | Principal Occupation
During Past Five Years | | Other
Directorships | |
Robert S. Dow
Lord, Abbett & Co. LLC
90 Hudson Street
Jersey City, NJ 07302
(1945) | | Trustee and Chairman since 1999 | | Senior Partner since 2007 and Chief Executive Officer of Lord Abbett since 1996, formerly Managing Partner of Lord Abbett (1996 - 2007). | | N/A | |
|
Daria L. Foster
Lord, Abbett & Co. LLC 90 Hudson Street
Jersey City, NJ 07302
(1954) | | Trustee since 2006 | | Managing Partner of Lord Abbett since 2007, formerly Director of Marketing and Client Service of Lord Abbett (1990 - 2007). | | N/A | |
|
Independent Trustees
The following independent or outside Trustees ("Independent Trustees") are also directors or trustees of each of the fourteen Lord Abbett-sponsored funds, which consist of 52 portfolios or series.
Name, Address and
Year of Birth | | Current Position
Length of Service
with Fund | | Principal Occupation
During Past Five Years | | Other
Directorships | |
E. Thayer Bigelow
Lord, Abbett & Co. LLC c/o Legal Dept.
90 Hudson Street
Jersey City, NJ 07302
(1941) | | Trustee since 1999 | | Managing General Partner, Bigelow Media, LLC (since 2000), Senior Adviser, Time Warner Inc. (1998 - 2000), Acting Chief Executive Officer of Courtroom Television Network (1997 - 1998), President and Chief Executive Officer of Time Warner Cable Programming, Inc. (1991 - 1997). | | Currently serves as director of Crane Co. and Huttig Building Products Inc. | |
|
31
Basic Information About Management (continued)
Name, Address and
Year of Birth | | Current Position
Length of Service
with Fund | | Principal Occupation
During Past Five Years | | Other
Directorships | |
William H.T. Bush
Lord, Abbett & Co. LLC c/o Legal Dept.
90 Hudson Street
Jersey City, NJ 07302
(1938) | | Trustee since 1999 | | Co-founder and Chairman of the Board of the financial advisory firm of Bush– O'Donnell & Company (since 1986). | | Currently serves as director of WellPoint, Inc., a health benefits company (since 2002). | |
|
Robert B. Calhoun, Jr.
Lord, Abbett & Co. LLC
c/o Legal Dept.
90 Hudson Street
Jersey City, NJ 07302
(1942) | | Trustee since 1999 | | Managing Director of Monitor Clipper Partners (since 1997) and President of Clipper Asset Management Corp. (since 1991), both private equity investment funds. | | Currently serves as director of Avondale, Inc. and Interstate Bakeries Corp. | |
|
Julie A. Hill
Lord, Abbett & Co. LLC c/o Legal Dept.
90 Hudson Street
Jersey City, NJ 07302
(1946) | | Trustee since 2004 | | Owner and CEO of The Hill Company, a business consulting firm (since 1998); Founder, President and Owner of the Hiram-Hill and Hillsdale Development Company, a residential real estate development firm (1998 - 2000). | | Currently serves as director of WellPoint, Inc., a health benefits company (since 1994) and Lend Lease Corporation Limited (since 2005). | |
|
Franklin W. Hobbs
Lord, Abbett & Co. LLC c/o Legal Dept.
90 Hudson Street
Jersey City, NJ 07302
(1947) | | Trustee since 2000 | | Advisor of One Equity Partners, a private equity firm (since 2004), Chief Executive Officer of Houlihan Lokey Howard & Zukin, an investment bank (2002 - 2003), Chairman of Warburg Dillon Read, an investment bank (1999 - 2001), Global Head of Corporate Finance of SBC Warburg Dillon Read (1997 - 1999), Chief Executive Officer of Dillon, Read & Co. (1994 - 1997). | | Currently serves as director of Molson Coors Brewing Company. | |
|
Thomas J. Neff
Lord, Abbett & Co. LLC
c/o Legal Dept.
90 Hudson Street
Jersey City, NJ 07302
(1937) | | Trustee since 1999 | | Chairman of Spencer Stuart (U.S.), an executive search consulting firm (since 1996), President of Spencer Stuart (1979 - 1996). | | Currently serves as director of Ace, Ltd. (since 1997) and Hewitt Associates, Inc. | |
|
James L.L. Tullis
Lord, Abbett & Co. LLC
c/o Legal Dept.
90 Hudson Street
Jersey City, NJ 07302
(1947) | | Trustee since 2006 | | CEO of Tullis-Dickerson and Co. Inc, a venture capital management firm (since 1990). | | Currently serves as director of Crane Co. (since 1998). | |
|
32
Basic Information About Management (continued)
Officers
None of the officers listed below have received compensation from the Fund. All the officers of the Fund may also be officers of the other Lord Abbett-sponsored funds and maintain offices at 90 Hudson Street, Jersey City, NJ 07302.
Name and
Year of Birth | | Current Position
with Fund | | Length of Service
of Current Position | | Principal Occupation
During Past Five Years | |
Robert S. Dow
(1945) | | Chief Executive Officer and Chairman | | Elected in 1999 | | Senior Partner since 2007 and Chief Executive Officer of Lord Abbett since 1996, formerly Managing Partner of Lord Abbett (1996 - 2007). | |
|
Daria L. Foster
(1954) | | President | | Elected in 2006 | | Managing Partner of Lord Abbett since 2007, formerly Director of Marketing and Client Service of Lord Abbett (1990 - 2007). | |
|
Bruce L. Bartlett
(1950) | | Executive Vice President | | Elected in 2005 | | Partner and Director, joined Lord Abbett in 2005, formerly Director of Growth Equities, Senior Vice President and Portfolio Manager at Oppenheimer Funds Inc. | |
|
Robert I. Gerber
(1954) | | Executive Vice President | | Elected in 2007 | | Partner and Chief Investment Officer, joined Lord Abbett in 1997. | |
|
James Bernaiche
(1956) | | Chief Compliance Officer | | Elected in 2004 | | Chief Compliance Officer, joined Lord Abbett in 2001. | |
|
Joan A. Binstock
(1954) | | Chief Financial Officer and Vice President | | Elected in 1999 | | Partner and Chief Operations Officer, joined Lord Abbett in 1999. | |
|
John K. Forst
(1960) | | Vice President and Assistant Secretary | | Elected in 2005 | | Deputy General Counsel, joined Lord Abbett in 2004, formerly Managing Director and Associate General Counsel at New York Life Investment Management LLC (2002 - 2003). | |
|
Lawrence H. Kaplan
(1957) | | Vice President and Secretary | | Elected in 1999 | | Partner and General Counsel, joined Lord Abbett in 1997. | |
|
A. Edward Oberhaus, III
(1959) | | Vice President | | Elected in 1999 | | Partner and Director, joined Lord Abbett in 1983. | |
|
33
Basic Information About Management (concluded)
Name and
Year of Birth | | Current Position
with Fund | | Length of Service
of Current Position | | Principal Occupation
During Past Five Years | |
Thomas R. Phillips
(1960) | | Vice President and Assistant Secretary | | Elected in 2008 | | Assistant General Counsel, joined Lord Abbett in 2006, formerly attorney at Morgan, Lewis & Bockius LLP (2005 - 2006), and Stradley Ronon Stevens & Young, LLP (2000 - 2005). | |
|
Lawrence B. Stoller
(1963) | | Vice President and Assistant Secretary | | Elected in 2007 | | Senior Deputy General Counsel, joined Lord Abbett in 2007, formerly Executive Vice President and General Counsel at Cohen & Steers Capital Management, Inc. | |
|
Christopher M. Yates
(1962) | | Vice President | | Elected in 2008 | | Portfolio Manager, joined Lord Abbett in 2004, formerly Director, Senior Portfolio Manager and Analyst at New York Life Investment Management, LLC (1994 - 2004). | |
|
Bernard J. Grzelak
(1971) | | Treasurer | | Elected in 2003 | | Director of Fund Administration, joined Lord Abbett in 2003, formerly Vice President, Lazard Asset Management LLC. | |
|
Please call 888-522-2388 for a copy of the Statement of Additional Information (SAI), which contains further information about the Fund's Trustees. It is available free upon request.
34
Householding
The Fund has adopted a policy that allows it to send only one copy of the Fund's Prospectus, proxy material, annual report and semiannual report to certain shareholders residing at the same "household." This reduces Fund expenses, which benefits you and other shareholders. If you need additional copies or do not want your mailings to be "householded," please call Lord Abbett at 888-522-2388 or send a written request with your name, the name of your fund or funds and your account number or numbers to Lord Abbett Family of Funds, P.O. Box 219336, Kansas City, MO 64121.
Proxy Voting Policies, Procedures and Records
A description of the policies and procedures that Lord Abbett uses to vote proxies related to the Fund's portfolio securities, and information on how Lord Abbett voted each Fund's proxies during the 12-month period ended June 30 are available without charge, upon request, (i) by calling 888-522-2388; (ii) on Lord Abbett's website at www.lordabbett.com; and (iii) on the Securities and Exchange Commission's ("SEC") website at www.sec.gov.
Shareholder Reports and Quarterly Portfolio Disclosure
The Fund is required to file its complete schedule of portfolio holdings with the SEC for its first and third fiscal quarters on Form N-Q. Copies of the filings are available without charge, upon request on the SEC's website at www.sec.gov and may be available by calling Lord Abbett at 888-522-2388. You can also obtain copies of Form N-Q by (i) visiting the SEC's Public Reference Room in Washington, DC (information on the operation of the Public Reference Room may be obtained by calling 800-SEC-0330); (ii) sending your request and duplicating fee to the SEC's Public Reference Section, Washington, DC 20549-0102; or (iii) sending your request electronically, after paying a duplicating fee, to publicinfo@sec.gov.
35
This page is intentionally left blank.
This page is intentionally left blank.
This page is intentionally left blank.
This page is intentionally left blank.
This page is intentionally left blank.

This report, when not used for the general information of shareholders of the fund, is to be distributed only if preceded or accompanied by a current fund prospectus.
Lord Abbett mutual fund shares are distributed by
LORD ABBETT DISTRIBUTOR LLC.
Lord Abbett Large-Cap Growth Fund
LALCG-2-0708
(09/08)
Item 2: Code of Ethics.
(a) In accordance with applicable requirements, the Registrant adopted a Sarbanes-Oxley Code of Ethics on June 19, 2003 that applies to the principal executive officer and senior financial officers of the Registrant (“Code of Ethics”). The Code of Ethics was in effect during the fiscal year ended July 31, 2008 (the “Period”).
(b) Not applicable.
(c) The Registrant has not amended the Code of Ethics as described in Form N-CSR during the Period.
(d) The Registrant has not granted any waiver, including an implicit waiver, from a provision of the Code of Ethics as described in Form N-CSR during the Period.
(e) Not applicable.
(f) See Item 12(a)(1) concerning the filing of the Code of Ethics. The Registrant will provide a copy of the Code of Ethics to any person without charge, upon request. To obtain a copy, please call Lord Abbett at 888-522-2388.
Item 3: Audit Committee Financial Expert.
The Registrant’s board of trustees has determined that each of the following independent trustees who are members of the audit committee are audit committee financial experts: E. Thayer Bigelow, Robert B. Calhoun, Franklin W. Hobbs and James L.L. Tullis. Each of these persons is independent within the meaning of the Form N-CSR.
Item 4: Principal Accountant Fees and Services.
In response to sections (a), (b), (c) and (d) of Item 4, the aggregate fees billed to the Registrant for the fiscal years ended July 31, 2008 and 2007 by the Registrant’s principal accounting firm, Deloitte & Touche LLP, the member firms of Deloitte Touche Tohmatsu and their respective affiliates (collectively, “Deloitte”) were as follows:
| Fiscal year ended: |
| 2008 | 2007 |
Audit Fees {a} | $39,000 | $37,000 |
Audit-Related Fees | - 0 - | - 0 - |
Total audit and audit-related fees | 39,000 | 37,000 |
| | |
Tax Fees {b} | 7,056 | 6,830 |
All Other Fees | - 0 - | - 0 - |
| | |
Total Fees | $46,056 | $43,830 |
{a} Consists of fees for audits of the Registrant’s annual financial statements.
{b} Fees for the fiscal year ended July 31, 2008 and 2007 consist of fees for preparing the U.S. Income Tax Return for Regulated Investment Companies, New Jersey Corporation Business Tax Return, New Jersey Annual Report Form, U.S. Return of Excise Tax on Undistributed Income of Investment Companies, IRS Forms 1099-MISC and 1096 Annual Summary and Transmittal of U.S. Information Returns.
(e) (1) Pursuant to Rule 2-01(c) (7) of Regulation S-X, the Registrant’s Audit Committee has adopted pre-approval policies and procedures. Such policies and procedures generally provide that the Audit Committee must pre-approve:
· any audit, audit-related, tax, and other services to be provided to the Lord Abbett Funds, including the Registrant, and
· any audit-related, tax, and other services to be provided to the Registrant’s investment adviser and any entity controlling, controlled by or under common control with the investment adviser that provides ongoing services to one or more Funds comprising the Registrant if the engagement relates directly to operations and financial reporting of a Fund, by the independent auditor to assure that the provision of such services does not impair the auditor’s independence.
The Audit Committee has delegated pre-approval authority to its Chairman, subject to a fee limit of $10,000 per event, and not to exceed $25,000 annually. The Chairman will report any pre-approval decisions to the Audit Committee at its next scheduled meeting. Unless a type of service to be provided by the independent auditor has received general pre-approval, it must be pre-approved by the Audit Committee. Any proposed services exceeding pre-approved cost levels will require specific pre-approval by the Audit Committee.
(e) (2) The Registrant’s Audit Committee has approved 100% of the services described in this Item 4 (b) through (d).
(f) Not applicable.
(g) The aggregate non-audit fees billed by Deloitte for services rendered to the Registrant are shown above in the response to Item 4 (a), (b), (c) and (d) as “All Other Fees”.
The aggregate non-audit fees billed by Deloitte for services rendered to the Registrant’s investment adviser, Lord, Abbett & Co. LLC (“Lord Abbett”), for the fiscal years ended July 31, 2008 and 2007 were:
| Fiscal year ended: |
| 2008 | 2007 |
All Other Fees {a} | $147,700 | $170,000 |
{a} Consist of fees for Independent Services Auditors’ Report on Controls Placed in Operation and Tests of Operating Effectiveness related to Lord Abbett’s Asset Management Services (“SAS 70 Report”).
The aggregate non-audit fees billed by Deloitte for services rendered to entities under the common control of Lord Abbett for the fiscal years ended July 31, 2008 and 2007 were:
| Fiscal year ended: |
| 2008 | 2007 |
All Other Fees | $ - 0 - | $ - 0- |
(h) The Registrant’s Audit Committee has considered the provision of non-audit services that were rendered to the Registrant’s investment adviser, and any entity controlling, controlled by or under common control with the investment adviser that provides ongoing services to the Registrant, that were not pre-approved pursuant to Rule 2-01 (c)(7)(ii) of Regulation S-X and has determined that the provision of such services is compatible with maintaining Deloitte’s independence.
Item 5: Audit Committee of Listed Registrants.
Not applicable.
Item 6: Investments.
Not applicable.
Item 7: Disclosure of Proxy Voting Policies and Procedures for Closed-End Management Investment Companies.
Not applicable.
Item 8: Portfolio Managers of Closed-End Management Investment Companies.
Not applicable.
Item 9: Purchases of Equity Securities by Closed-End Management Investment Company and Affiliated Purchasers.
Not applicable.
Item 10: Submission of Matters to a Vote of Security Holders.
Not applicable.
Item 11: Controls and Procedures.
(a) Based on their evaluation of the Registrant’s disclosure controls and procedures (as defined in Rule 30a-3(c) under the Investment Company Act of 1940) as of a date within 90 days prior to the filing date of this report, the Chief Executive Officer and Chief Financial Officer of the Registrant have concluded that such disclosure controls and procedures are reasonably designed and effective to ensure that material information relating to the Registrant, including its consolidated subsidiaries, is made known to them by others within those entities.
(b) There were no changes in the Registrant’s internal control over financial reporting (as defined in Rule 30a-3(d) under the Investment Company Act of 1940) that occurred during the second fiscal quarter of the period covered by this report that have materially affected, or are reasonably likely to materially affect, the Registrant’s internal control over financial reporting.
Item 12: Exhibits.
(a)(1) Amendments to Code of Ethics – Not applicable.
(a)(2) Certification of each principal executive officer and principal financial officer of the Registrant as required by Rule 30a-2 under the Investment Company Act of 1940 is attached hereto as a part of EX-99.CERT.
(a)(3) Not applicable.
(b) Certification of each principal executive officer and principal financial officer of the Registrant as required by Section 906 of the Sarbanes-Oxley Act of 2002 is provided as a part of EX-99.906CERT.
SIGNATURES
Pursuant to the requirements of the Securities Exchange Act of 1934 and the Investment Company Act of 1940, the Registrant has duly caused this report to be signed on its behalf by the undersigned, thereunto duly authorized.
| LORD ABBETT LARGE-CAP GROWTH FUND |
| |
| |
| By: | /s/ Robert S. Dow |
| | Robert S. Dow |
| | Chief Executive Officer and Chairman |
Date: September 23, 2008 | |
| |
| |
| By: | /s/ Joan A. Binstock |
| | Joan A. Binstock |
| | Chief Financial Officer and Vice President |
Date: September 23, 2008
Pursuant to the requirements of the Securities Exchange Act of 1934 and the Investment Company Act of 1940, this report has been signed below by the following persons on behalf of the Registrant and in the capacities and on the dates indicated.
| By: | /s/ Robert S. Dow |
| | Robert S. Dow |
| | Chief Executive Officer and Chairman |
Date: September 23, 2008 | |
| |
| |
| By: | /s/ Joan A. Binstock |
| | Joan A. Binstock |
| | Chief Financial Officer and Vice President |
Date: September 23, 2008