UNITED STATES
SECURITIES AND EXCHANGE COMMISSION
Washington, D.C. 20549
FORM N-CSR
CERTIFIED SHAREHOLDER REPORT OF REGISTERED MANAGEMENT INVESTMENT COMPANIES
Investment Company Act file number 811-02405, 811-09739 and 811-21434
Name of Fund: BlackRock Balanced Capital Fund, Inc., Master Large Cap Core Portfolio of Master Large Cap Series LLC and Master Total Return Portfolio of Master Bond LLC
Fund Address: 100 Bellevue Parkway, Wilmington, DE 19809
Name and address of agent for service: John M. Perlowski, Chief Executive Officer, BlackRock Balanced Capital Fund, Inc., Master Large Cap Core Portfolio of Master Large Cap Series LLC and Master Total Return Portfolio of Master Bond LLC, 55 East 52nd Street, New York, NY 10055
Registrants’ telephone number, including area code: (800) 441-7762
Date of fiscal year end: 09/30/2013
Date of reporting period: 03/31/2013
Item 1 – Report to Stockholders

Table of Contents
| | | | |
| | | | | |
| 2 | | BLACKROCK BALANCED CAPITAL FUND, INC. | | MARCH 31, 2013 |
Dear Shareholder
Despite continued global headwinds, risk assets (such as equities) have generated strong performance as investors sought meaningful yields in the ongoing low-interest-rate environment. About this time one year ago, concerns about Europe’s debt crisis dominated the markets as political instability in Greece and severe deficit and liquidity problems in Spain raised the specter of a full-blown euro collapse. Investors were also discouraged by gloomy economic reports from various parts of the world, particularly in China. As the outlook for the global economy worsened, however, investors grew increasingly optimistic that the world’s largest central banks would intervene to stimulate growth. This theme, along with the European Central Bank’s (“ECB’s”) firm commitment to preserve the euro currency bloc, drove most asset classes higher through the summer of 2012. In early September, the ECB announced it would purchase unlimited amounts of short term sovereign bonds to support the region’s debt-laden countries. Days later, the US Federal Reserve announced its own much-anticipated stimulus package.
Although financial markets world-wide were buoyed by these aggressive policy actions, risk assets weakened in the fall of 2012. Global trade began to slow as many European countries fell into recession and growth continued to decelerate in China. In the United States, stocks slid on lackluster corporate earnings and volatility rose in advance of the US Presidential election. In the post-election environment, investors grew increasingly concerned over the “fiscal cliff,” the automatic tax increases and spending cuts that had been scheduled to take effect at the beginning of 2013. There was widespread fear that the fiscal cliff would push the United States into recession unless politicians could agree upon alternate measures to reduce the nation’s deficit. Worries that bipartisan gridlock would preclude a timely budget deal triggered high levels of volatility in financial markets around the world in the months leading up to the last day of the year. Ultimately, the worst of the fiscal cliff was averted with a last-minute tax deal, although the postponement of decisions relating to spending cuts and the debt ceiling left some lingering uncertainty.
Investors shook off the nerve-wracking finale to 2012 and the New Year began with a powerful relief rally in risk assets. Money that had been pulled to the sidelines amid year-end tax-rate uncertainty poured back into the markets in January. Key indicators signaling modest but broad-based improvements in the world’s major economies underpinned the rally. Underlying this aura of comfort was the absence of negative headlines out of Europe. Against this backdrop, global equities surged through January while rising US Treasury yields pressured high quality fixed income assets (as prices move in the opposite direction as yields).
However, bond markets regained strength in February when economic momentum slowed and investors toned down their risk appetite. US stocks continued to rise, but at a more moderate pace. Uncertainty about how long the Federal Reserve would maintain its monetary easing bias drove high levels of volatility later in the month, but these fears abated as the budget sequester (automatic spending cuts scheduled to take effect March 1) began to appear imminent and was deemed likely to deter any near-term changes in the central bank’s policy stance. Improving labor market data and rising home prices pushed US stocks higher at the end of the period, with major indices reaching new all-time highs. Outside the United States, equity prices weakened in the final two months of the period due to a resurgence of macro risk out of Europe. Italy’s February presidential election ended in a stalemate, further propagating the ongoing theme of political instability in the eurozone. In March, a severe banking crisis in Cyprus underscored the fragility of the broader European banking system.
For the 6- and 12-month periods ended March 31, 2013, US and international stocks and high yield bonds posted strong gains, while emerging market equities lagged as the pace of global growth failed to impress investors. US Treasury yields were highly volatile over the past 12 months. While remaining relatively low from a historical standpoint, yields began inching higher in the later part of the period, pressuring Treasuries and investment-grade bonds. Tax-exempt municipal bonds, however, benefited from favorable supply-and-demand dynamics. Near-zero short term interest rates continued to keep yields on money market securities near their all-time lows.
Markets have always been unpredictable, but that does not mean investors can delay taking action. At BlackRock, we believe it’s time for a different approach to investing. One that seeks out more opportunities in more places across a broader array of investments in a portfolio designed to move freely as the markets move up and down. People everywhere are asking, “So what do I do with my money?” Visit www.blackrock.com for answers.
Sincerely,

Rob Kapito
President, BlackRock Advisors, LLC

“Despite continued global headwinds, risk assets (such as equities) have generated strong performance as investors sought meaningful yields in the ongoing low-interest-rate environment.”
Rob Kapito
President, BlackRock Advisors, LLC
Total Returns as of March 31, 2013
| | | | |
| | | 6-month | | 12-month |
US large cap equities | | 10.19% | | 13.96% |
(S&P 500® Index) | | | | |
US small cap equities | | 14.48 | | 16.30 |
(Russell 2000® Index) | | | | |
International equities | | 12.04 | | 11.25 |
(MSCI Europe, Australasia, | | | | |
Far East Index) | | | | |
Emerging market | | 3.87 | | 1.96 |
equities (MSCI Emerging | | | | |
Markets Index) | | | | |
3-month Treasury | | 0.06 | | 0.12 |
bill (BofA Merrill Lynch | | | | |
3-Month US Treasury | | | | |
Bill Index) | | | | |
US Treasury securities | | (0.55) | | 6.19 |
(BofA Merrill Lynch 10- | | | | |
Year US Treasury Index) | | | | |
US investment grade | | 0.09 | | 3.77 |
bonds (Barclays US | | | | |
Aggregate Bond Index) | | | | |
Tax-exempt municipal | | 1.26 | | 5.82 |
bonds (S&P Municipal | | | | |
Bond Index) | | | | |
US high yield bonds | | 6.28 | | 13.08 |
(Barclays US Corporate | | | | |
High Yield 2% Issuer | | | | |
Capped Index) | | | | |
Past performance is no guarantee of future results. Index performance is shown for illustrative purposes only. You cannot invest directly in an index.
| | | | | | |
| | | | | | | |
| | THIS PAGE NOT PART OF YOUR FUND REPORT | | | 3 |
Fund Summary as of March 31, 2013
|
|
Investment Objective |
|
BlackRock Balanced Capital Fund, Inc.’s (the “Fund”) investment objective is to seek the highest total investment return through a fully managed investment policy utilizing equity, debt (including money market) and convertible securities. |
|
Portfolio Management Commentary |
|
How did the Fund perform?
| — | | For the six-month period ended March 31, 2013, through their investments in Master Large Cap Core Portfolio of Master Large Cap Series LLC (the “equity allocation” or the “Master Large Cap Core Portfolio”) and Master Total Return Portfolio of Master Bond LLC (the “fixed income allocation” or the “Master Total Return Portfolio”) (collectively, the “Master Portfolios”) the Fund’s Institutional, Investor A and R Class Shares outperformed the blended reference benchmark (60% Russell 1000® Index/40% Barclays U.S. Aggregate Bond Index), while the Fund’s Investor B Shares underperformed and Investor C Shares performed in line with the blended reference benchmark. For the same period, all of the Fund’s share classes outperformed the fixed income benchmark, the Barclays U.S. Aggregate Bond Index, and underperformed the equity benchmark, the Russell 1000® Index. |
What factors influenced performance?
| — | | From an asset allocation perspective, the Fund benefited from its overweight in equities relative to the blended reference benchmark as equity markets rallied significantly during the period. The Master Large Cap Core Portfolio underperformed the Russell 1000® Index, while the Master Total Return Portfolio outperformed the Barclays U.S. Aggregate Bond Index. |
| — | | Relative to the Russell 1000® Index, the Master Large Cap Core Portfolio’s positioning in the information technology (“IT”) and health care sectors detracted from performance during the period. Within IT, an overweight in Apple, Inc. and data storage provider EMC Corp. hurt results. Holdings of IT services companies, including data analytics firm Teradata Corp. and money transfer company The Western Union Co., also had a negative impact. In health care, a lack of exposure to biotechnology names hindered returns as the industry was the best performer in the sector. Elsewhere in the sector, stock selection detracted from results. Positive performance in the Master Large Cap Core Portfolio came from stock selection in industrials, where an overweight to airlines boosted returns, and financials, where an overweight to US money center banks had a positive impact. In the materials sector, an overweight in containerboard manufacturers enhanced results. |
| — | | The Master Total Return Portfolio outperformed the Barclays US Aggregate Bond Index due to its overweight exposure to credit sectors. In particular, |
| | | allocations to securitized assets, including commercial mortgage-backed securities (“CMBS”), asset-backed securities (“ABS”) and non-agency residential mortgage-backed securities (“MBS”) had a positive impact. An out-of-benchmark allocation to high yield credit also boosted returns, as did security selection within industrials. Detracting from performance in the Master Total Return Portfolio was an overweight allocation to US agency debentures and security selection within US Treasuries. |
Describe recent portfolio activity.
| — | | From a broad asset allocation perspective, the Fund’s equity allocation drifted higher due to strong market value appreciation during the six-month period. Within equities, the Master Large Cap Core Portfolio significantly increased exposure to the industrials, financials and IT sectors and reduced its weightings in health care and utilities. In fixed income, the Master Total Return Portfolio decreased exposure to US Treasury inflation-protected securities (“US TIPS”) and investment grade credit, and added slightly to high yield and emerging market debt. Within securitized sectors, the Master Total Return Portfolio increased exposure to ABS, CMBS, non-agency residential MBS and collateralized loan obligations. |
Describe portfolio positioning at period end.
| — | | At period end, the Fund was slightly overweight in equities and underweight in fixed income relative to the blended reference benchmark. In equities, the Master Large Cap Core Portfolio held its largest sector overweights relative to the Russell 1000® Index in IT and financials, while consumer staples and utilities were the most significant underweights. Relative to the Barclays US Aggregate Bond Index, the Master Total Return Portfolio remained generally underweight to government-related sectors in favor of non-government credit sectors, with overweights in CMBS, ABS and investment grade credit. Within the government space, the Master Total Return Portfolio maintained an underweight in agency debentures, while holding overweight exposures to US Treasuries and agency MBS. Outside of its benchmark index, the Master Total Return Portfolio held positions in non-agency residential MBS, high yield debt and US TIPS. The Master Total Return Portfolio ended the period with a neutral duration position versus the Barclays U.S. Aggregate Bond Index. |
The views expressed reflect the opinions of BlackRock as of the date of this report and are subject to change based on changes in market, economic or other conditions. These views are not intended to be a forecast of future events and are no guarantee of future results.
| | | | |
| | | | | |
| 4 | | BLACKROCK BALANCED CAPITAL FUND, INC. | | MARCH 31, 2013 |
|
|
Total Return Based on a $10,000 Investment |
|
| | | | |
| | | 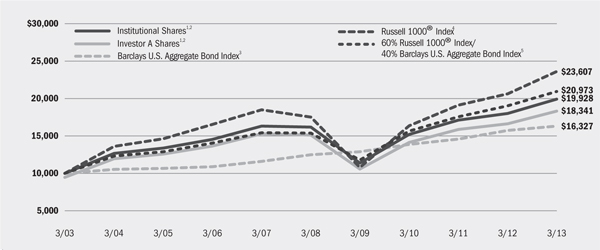 |
| | | 1 | | Assuming maximum sales charges, if any, transaction costs and other operating expenses, including investment
advisory and administration fees. Institutional Shares do not have a sales charge. |
| | | 2 | | The Fund invests in equity securities (including common stock, preferred stock, securities convertible into common
stock, or securities or other instruments whose price is linked to the value of common stock) and fixed-income
securities (including debt securities, convertible securities and short term securities). |
| | | 3 | | This unmanaged market-weighted index is comprised of investment grade corporate bonds (rated BBB or better),
mortgages and US Treasury and government agency issues with at least one year to maturity. |
| | | 4 | | This unmanaged broad-based index measures the performance of the 1,000 largest companies in the Russell 3000®
Index, which represents approximately 90% of the total market capitalization of the Russell 3000® Index. |
| | | 5 | | The Fund compares its performance to that of a customized weighted index comprised of the returns of the Russell
1000® Index (60%) and Barclays U.S. Aggregate Bond Index (40%). |
|
|
Performance Summary for the Period Ended March 31, 2013 |
|
| | | | | | | | | | | | | | | | | | | | | | | | | | | | |
| | | | | | Average Annual Total Returns6 | |
| | | | | | 1 Year | | | 5 Years | | | 10 Years | |
| | | 6-Month
Total Returns | | | w/o sales
charge | | | w/sales
charge | | | w/o sales
charge | | | w/ sales
charge | | | w/o sales
charge | | | w/ sales
charge | |
Institutional | | | 7.25% | | | | 10.48% | | | | N/A | | | | 4.25% | | | | N/A | | | | 7.14% | | | | N/A | |
Investor A | | | 7.10 | | | | 10.11 | | | | 4.33% | | | | 3.92 | | | | 2.80% | | | | 6.83 | | | | 6.25% | |
Investor B | | | 6.54 | | | | 9.12 | | | | 4.62 | | | | 2.94 | | | | 2.59 | | | | 6.11 | | | | 6.11 | |
Investor C | | | 6.66 | | | | 9.30 | | | | 8.30 | | | | 3.10 | | | | 3.10 | | | | 5.99 | | | | 5.99 | |
Class R | | | 6.85 | | | | 9.74 | | | | N/A | | | | 3.48 | | | | N/A | | | | 6.49 | | | | N/A | |
Barclays U.S. Aggregate Bond Index | | | 0.09 | | | | 3.77 | | | | N/A | | | | 5.47 | | | | N/A | | | | 5.02 | | | | N/A | |
Russell 1000® Index | | | 11.10 | | | | 14.43 | | | | N/A | | | | 6.15 | | | | N/A | | | | 8.97 | | | | N/A | |
60% Russell 1000® Index/40% Barclays U.S. Aggregate Bond Index | | | 6.63 | | | | 10.22 | | | | N/A | | | | 6.36 | | | | N/A | | | | 7.69 | | | | N/A | |
| |
| | 6 | Assuming maximum sales charges, if any. Average annual total returns with and without sales charges reflect reductions for distribution and service fees. See “About Fund Performance” on page 6 for a detailed description of share classes, including any related sales charges and fees. |
N/A – Not applicable as share class and index do not have a sales charge.
Past performance is not indicative of future results.
| | | | | | | | | | | | | | | | |
| | | Actual | | Hypothetical8 | | | |
| | | Beginning
Account Value
October 1, 2012 | | Ending
Account Value
March 31, 2013 | | Expenses Paid
During the Period7 | | Beginning
Account Value
October 1, 2012 | | Ending
Account Value
March 31, 2013 | | Expenses Paid
During the Period7 | | Annualized
Expense
Ratio | |
| |
Institutional | | $1,000.00 | | $1,072.50 | | $ 3.41 | | $1,000.00 | | $1,021.64 | | $ 3.33 | | | 0.66% | |
Investor A | | $1,000.00 | | $1,071.00 | | $ 5.01 | | $1,000.00 | | $1,020.09 | | $ 4.89 | | | 0.97% | |
Investor B | | $1,000.00 | | $1,065.40 | | $10.56 | | $1,000.00 | | $1,014.71 | | $10.30 | | | 2.05% | |
Investor C | | $1,000.00 | | $1,066.60 | | $ 9.02 | | $1,000.00 | | $1,016.21 | | $ 8.80 | | | 1.75% | |
Class R | | $1,000.00 | | $1,068.50 | | $ 7.07 | | $1,000.00 | | $1,018.10 | | $ 6.89 | | | 1.37% | |
| |
| | 7 | For each class of the Fund, expenses are equal to the annualized expense ratio for the class, multiplied by the average account value over the period, multiplied by 182/365 (to reflect the one-half year period shown). Because the Fund invests significantly in the Master LLC, the expense table example reflects the net expenses of both the Fund and the Master LLC in which it invests. |
| | 8 | Hypothetical 5% annual return before expenses is calculated by pro rating the number of days in the most recent fiscal half year divided by 365. |
See “Disclosure of Expenses” on page 6 for further information on how expenses were calculated.
| | | | | | |
| | | | | | | |
| | BLACKROCK BALANCED CAPITAL FUND, INC. | | MARCH 31, 2013 | | 5 |
About Fund Performance
| — | | Institutional Shares are not subject to any sales charge. These shares bear no ongoing distribution or service fees and are available only to eligible investors. |
| — | | Investor A Shares incur a maximum initial sales charge (front-end load) of 5.25% and a service fee of 0.25% per year (but no distribution fee). |
| — | | Investor B Shares are subject to a maximum contingent deferred sales charge (“CDSC”) of 4.50% declining to 0% after six years. In addition, Investor B Shares are subject to a distribution fee of 0.75% per year and a service fee of 0.25% per year. Investor B Shares automatically convert to Investor A Shares after approximately eight years. (There is no initial sales charge for automatic share conversions.) All returns for periods greater than eight years reflect this conversion. Investor B Shares of the Fund are only available through exchanges and dividend reinvestments by existing shareholders and for purchase by certain employer-sponsored retirement plans. |
| — | | Investor C Shares are subject to a distribution fee of 0.75% and a service fee of 0.25% per year. In addition, these shares are subject to a 1.00% CDSC if redeemed within one year of purchase. |
| — | | Class R Shares do not incur a maximum initial sales charge (front-end load) or CDSC. These shares are subject to a distribution fee of 0.25% per year and a service fee of 0.25% per year. These shares are available only to certain employer-sponsored retirement plans. |
Performance information reflects past performance and does not guarantee future results. The performance information for periods prior to
October 1, 2003 does not reflect any investment by the Fund in the Master Total Return Portfolio, and the performance information for periods prior to February 2009 does not reflect any investment by the Fund in the Master Large Cap Core Portfolio. Current performance may be lower or higher than the performance data quoted. Refer to www.blackrock.com/funds to obtain performance data current to the most recent month end. Performance results do not reflect the deduction of taxes that a shareholder would pay on Fund distributions or the redemption of Fund shares. Figures shown in the performance table on the previous page assume reinvestment of all dividends and distributions, if any, at net asset value (“NAV”) on the ex-dividend date. Investment return and principal value of shares will fluctuate so that shares, when redeemed, may be worth more or less than their original cost.
BlackRock Advisors, LLC (the “Manager”), the Fund’s investment advisor, waived and/or reimbursed a portion of the Fund’s expenses. Without such waiver and/or reimbursement, a Fund’s performance would have been lower. The Manager is under no obligation to waive or reimburse or to continue waiving or reimbursing its fees after the applicable termination date. See Note 2 of the Notes to Financial Statements for additional information on waivers and reimbursements. Dividends paid to each class of shares will vary because of the different levels of service, distribution and transfer agency fees applicable to each class, which are deducted from the income available to be paid to shareholders.
Disclosure of Expenses
Shareholders of the Fund may incur the following charges: (a) transactional expenses such as sales charges; and (b) operating expenses, including investment advisory fees, service and distribution fees, including 12b-1 fees, acquired fund fees and expenses and other Fund expenses. The expense example on the previous page (which is based on a hypothetical investment of $1,000 invested on October 1, 2012 and held through March 31, 2013) is intended to assist shareholders both in calculating expenses based on an investment in the Fund and in comparing these expenses with similar costs of investing in other mutual funds.
The expense example provides information about actual account values and actual expenses. In order to estimate the expenses a shareholder paid during the period covered by this report, shareholders can divide their account value by $1,000 and then multiply the result by the number corresponding to their share class under the heading entitled “Expenses Paid During the Period.”
The expense example also provides information about hypothetical account values and hypothetical expenses based on the Fund’s actual expense ratio and an assumed rate of return of 5% per year before expenses. In order to assist shareholders in comparing the ongoing expenses of investing in the Fund and other funds, compare the 5% hypothetical examples with the 5% hypothetical examples that appear in other funds’ shareholder reports.
The expenses shown in the expense example are intended to highlight shareholders’ ongoing costs only and do not reflect any transactional expenses, such as sales charges, if any. Therefore, the hypothetical example is useful in comparing ongoing expenses only, and will not help shareholders determine the relative total expenses of owning different funds. If these transactional expenses were included, shareholder expenses would have been higher.
| | | | |
| | | | | |
| 6 | | BLACKROCK BALANCED CAPITAL FUND, INC. | | MARCH 31, 2013 |
The Benefits and Risks of Leveraging
The Master Total Return Portfolio may utilize leverage to seek to enhance its yield and NAV. However, these objectives cannot be achieved in all interest rate environments.
The Master Total Return Portfolio may utilize leverage by entering into reverse repurchase agreements and/or treasury roll transactions. In general, the concept of leveraging is based on the premise that the financing cost of assets to be obtained from leverage, which will be based on short-term interest rates, will normally be lower than the income earned by the Master Total Return Portfolio on its longer-term portfolio investments. To the extent that the total assets of the Master Total Return Portfolio (including the assets obtained through leverage) are invested in higher-yielding portfolio investments, the Master Total Return Portfolio’s shareholders will benefit from the incremental net income.
The interest earned on securities purchased with the proceeds from leverage is paid to shareholders in the form of dividends, and the value of these portfolio holdings is reflected in the per share NAV. However, in order to benefit shareholders, the yield curve must be positively sloped; that is, short-term interest rates must be lower than long-term interest rates. If the yield curve becomes negatively sloped, meaning short-term interest rates exceed long-term interest rates, income to shareholders will be lower than if the Master Total Return Portfolio had not used leverage.
If short-term interest rates rise, narrowing the differential between short-term and long-term interest rates, the incremental net income pickup will be reduced or eliminated completely. Furthermore, if prevailing short-term interest rates rise above long-term interest rates, the yield curve has a negative slope. In this case, the Master Total Return Portfolio pays higher short-term interest rates whereas the Master Total Return Portfolio’s total portfolio earns income based on lower long-term interest rates.
Furthermore, the value of the Master Total Return Portfolio’s portfolio investments generally varies inversely with the direction of long-term interest rates, although other factors can influence the value of portfolio investments. As a result, changes in interest rates can influence the Master Total Return Portfolio’s NAV positively or negatively in addition to the impact on the Master Total Return Portfolio’s performance from leverage and borrowings discussed above.
The use of leverage may enhance opportunities for increased income to the Master Total Return Portfolio, but as described above, it also creates risks as short- or long-term interest rates fluctuate. Leverage also will generally cause greater changes in the Master Total Return Portfolio’s NAVs and dividend rates than comparable portfolios without leverage. If the income derived from securities purchased with assets received from leverage exceeds the cost of leverage, the Master Total Return Portfolio’s net income will be greater than if leverage had not been used. Conversely, if the income from the securities purchased is not sufficient to cover the cost of leverage, the Master Total Return Portfolio’s net income will be less than if leverage had not been used, and therefore the amount available for distribution to shareholders will be reduced. The Master Total Return Portfolio may be required to sell portfolio securities at inopportune times or at distressed values in order to comply with regulatory requirements applicable to the use of leverage or as required by the terms of leverage instruments, which may cause the Master Total Return Portfolio to incur losses. The use of leverage may limit the Master Total Return Portfolio’s ability to invest in certain types of securities or use certain types of hedging strategies. The Master Total Return Portfolio will incur expenses in connection with the use of leverage, all of which are borne by the Master Total Return Portfolio shareholders and may reduce income.
Derivative Financial Instruments
The Master Total Return Portfolio may invest in various derivative financial instruments, including financial futures contracts, foreign currency exchange contracts, options and swaps, as specified in Note 2 of the Master Total Return Portfolio’s Notes to Consolidated Financial Statements, which may constitute forms of economic leverage. Such derivative financial instruments are used to obtain exposure to a security, index and/or market without owning or taking physical custody of securities or to hedge market, equity, credit, interest rate and/or foreign currency exchange rate risks. Derivative financial instruments involve risks, including the imperfect correlation between the value of a derivative financial instrument and the underlying asset, possible default of the counterparty to the transaction or illiquidity of the derivative financial instrument. The Master Total Return Portfolio’s ability to use a derivative financial
instrument successfully depends on the investment advisor’s ability to predict pertinent market movements accurately, which cannot be assured. The use of derivative financial instruments may result in losses greater than if they had not been used, may require the Master Total Return Portfolio to sell or purchase portfolio investments at inopportune times or for distressed values, may limit the amount of appreciation the Master Total Return Portfolio can realize on an investment, may result in lower dividends paid to shareholders or may cause the Master Total Return Portfolio to hold an investment that it might otherwise sell. The Master Total Return Portfolio’s investments in these instruments are discussed in detail in the Master Total Return Portfolio’s Notes to Consolidated Financial Statements.
| | | | | | |
| | | | | | | |
| | BLACKROCK BALANCED CAPITAL FUND, INC. | | MARCH 31, 2013 | | 7 |
Statement of Assets and Liabilities
| | | | |
March 31, 2013 (Unaudited) | | | |
| |
Assets | | | | |
| |
Investments at value – Master Large Cap Core Portfolio (cost – $425,242,805) | | $ | 531,826,371 | |
Investments at value – Master Total Return Portfolio (cost – $300,014,218) | | | 312,444,165 | |
Capital shares sold receivable | | | 159,110 | |
Dividends receivable – affiliated | | | 293 | |
Prepaid expenses | | | 39,762 | |
| | | | |
Total assets | | | 844,469,701 | |
| | | | |
|
| |
Liabilities | | | | |
| |
Bank overdraft | | | 755,281 | |
Capital shares redeemed payable | | | 2,847,685 | |
Investment advisory fees payable | | | 84,252 | |
Service and distribution fees payable | | | 154,127 | |
Officer’s fees payable | | | 3,697 | |
Other accrued expenses payable | | | 378,653 | |
| | | | |
Total liabilities | | | 4,223,695 | |
| | | | |
Net Assets | | $ | 840,246,006 | |
| | | | |
|
| |
Net Assets Consist of | | | | |
| |
Paid-in capital | | $ | 674,035,399 | |
Undistributed net investment income | | | 3,235,776 | |
Accumulated net realized gain | | | 43,961,318 | |
Net unrealized appreciation/depreciation | | | 119,013,513 | |
| | | | |
Net Assets | | $ | 840,246,006 | |
| | | | |
|
| |
Net Asset Value | | | | |
| |
Institutional – Based on net assets of $319,306,745 and 13,164,710 shares outstanding, 400 million shares authorized, $0.10 par value | | $ | 24.25 | |
| | | | |
Investor A – Based on net assets of $444,213,776 and 18,383,197 shares outstanding, 200 million shares authorized, $0.10 par value | | $ | 24.16 | |
| | | | |
Investor B – Based on net assets of $5,950,703 and 253,265 shares outstanding, 500 million shares authorized, $0.10 par value | | $ | 23.50 | |
| | | | |
Investor C – Based on net assets of $62,885,680 and 2,823,852 shares outstanding, 200 million shares authorized, $0.10 par value | | $ | 22.27 | |
| | | | |
Class R – Based on net assets of $7,889,102 and 342,646 shares outstanding, 500 million shares authorized, $0.10 par value | | $ | 23.02 | |
| | | | |
See Notes to Financial Statements.
| | | | |
| | | | | |
| 8 | | BLACKROCK BALANCED CAPITAL FUND, INC. | | MARCH 31, 2013 |
Statement of Operations
| | | | |
Six Months Ended March 31, 2013 (Unaudited) | | | |
| |
Investment Income | | | | |
| |
Dividends – affiliated | | $ | 424 | |
Net investment income allocated from the Master Portfolios: | | | | |
Interest – unaffiliated | | | 7,201,737 | |
Dividends – unaffiliated | | | 5,599,127 | |
Foreign taxes withheld | | | (24,118) | |
Securities lending – affiliated | | | 2,822 | |
Dividends – affiliated | | | 1,938 | |
Total expenses | | | (1,958,609) | |
Fees waived | | | 2,002 | |
| | | | |
Total income | | | 10,825,323 | |
| | | | |
|
| |
Fund Expenses | | | | |
| |
Investment advisory | | | 1,992,303 | |
Service – Investor A | | | 551,773 | |
Service and distribution – Investor B | | | 32,253 | |
Service and distribution – Investor C | | | 305,748 | |
Service and distribution – Class R | | | 21,224 | |
Transfer agent – Institutional | | | 172,307 | |
Transfer agent – Investor A | | | 321,682 | |
Transfer agent – Investor B | | | 15,102 | |
Transfer agent – Investor C | | | 53,475 | |
Transfer agent – Class R | | | 12,599 | |
Registration | | | 34,682 | |
Printing | | | 37,510 | |
Professional | | | 49,218 | |
Officer | | | 17,714 | |
Custodian | | | 666 | |
Miscellaneous | | | 14,067 | |
| | | | |
Total expenses | | | 3,632,323 | |
Less fees waived by Manager | | | (1,449,767) | |
| | | | |
Total expenses after fees waived | | | 2,182,556 | |
| | | | |
Net investment income | | | 8,642,767 | |
| | | | |
|
| |
Realized and Unrealized Gain Allocated from the Master Portfolios | | | | |
| |
Net realized gain from investments, financial futures contracts, options written, swaps, borrowed bonds and foreign currency transactions | | | 35,143,823 | |
Net change in unrealized appreciation/depreciation on investments, financial futures contracts, options written, swaps, borrowed bonds and foreign currency translations | | | 18,825,614 | |
| | | | |
Total realized and unrealized gain. | | | 53,969,437 | |
| | | | |
Net Increase in Net Assets Resulting from Operations | | $ | 62,612,204 | |
| | | | |
See Notes to Financial Statements.
| | | | | | |
| | | | | | | |
| | BLACKROCK BALANCED CAPITAL FUND, INC. | | MARCH 31, 2013 | | 9 |
Statements of Changes in Net Assets
| | | | | | | | |
Decrease in Net Assets: | | Six Months Ended
March 31, 2013
(Unaudited) | | | Year Ended
September 30, 2012 | |
| |
Operations | | | | | | | | |
| |
Net investment income | | $ | 8,642,767 | | | $ | 22,260,482 | |
Net realized gain | | | 35,143,823 | | | | 36,492,085 | |
Net change in unrealized appreciation/depreciation | | | 18,825,614 | | | | 133,899,018 | |
| | | | |
Net increase in net assets resulting from operations | | | 62,612,204 | | | | 192,651,585 | |
| | | | |
|
| |
Dividends and Distributions to Shareholders From | | | | | | | | |
| |
Net investment income: | | | | | | | | |
Institutional | | | (4,739,255 | ) | | | (10,752,228) | 1 |
Investor A | | | (4,243,409 | ) | | | (8,660,377) | 1 |
Investor B | | | (33,652 | ) | | | (66,562) | 1 |
Investor C | | | (407,630 | ) | | | (825,009) | 1 |
Class R | | | (76,066 | ) | | | (145,892) | 1 |
Net realized gain: | | | | | | | | |
Institutional | | | (15,801,809 | ) | | | – | |
Investor A | | | (16,530,590 | ) | | | – | |
Investor B | | | (255,878 | ) | | | – | |
Investor C | | | (2,479,925 | ) | | | – | |
Class R | | | (352,601 | ) | | | – | |
| | | | |
Decrease in net assets resulting from dividends and distributions to shareholders | | | (44,920,815 | ) | | | (20,450,068) | |
| | | | |
|
| |
Capital Share Transactions | | | | | | | | |
| |
Net decrease in net assets derived from capital share transactions | | | (128,725,342 | ) | | | (232,710,814) | |
| | | | |
|
| |
Net Assets | | | | | | | | |
| |
Total decrease in net assets | | | (111,033,953 | ) | | | (60,509,297) | |
Beginning of period | | | 951,279,959 | | | | 1,011,789,256 | |
| | | | |
End of period | | $ | 840,246,006 | | | $ | 951,279,959 | |
| | | | |
Undistributed net investment income | | $ | 3,235,776 | | | $ | 4,093,021 | |
| | | | |
| | 1 | Dividends are determined in accordance with federal income tax regulations. |
See Notes to Financial Statements.
| | | | |
| | | | | |
| 10 | | BLACKROCK BALANCED CAPITAL FUND, INC. | | MARCH 31, 2013 |
Financial Highlights
| | | | | | | | | | | | | | | | | | | | | | | | | | | | | | | | | | | | | | | | | | | | | | | | |
| | | Institutional | | | Investor A | |
| | | Six Months
Ended March 31, 2012 (Unaudited} | | | | | | | | | | | | | | | | | | Six Months
Ended March 31, 2012 (Unaudited} | | | | | | | | | | | | | | | | |
| | | | Year Ended September 30, | | | | Year Ended September 30, | |
| | | | 2012 | | | 2011 | | | 2010 | | | 2009 | | | 2008 | | | | 2012 | | | 2011 | | | 2010 | | | 2009 | | | 2008 | |
| |
| |
Per Share Operating Performance | | | | | | | | | | | | | | | | | | | | | | | | | | | | | | | | | | | | | | | | | |
| |
Net asset value, beginning of period. | | $ | 23.77 | | | $ | 20.18 | | | $ | 20.28 | | | $ | 19.17 | | | $ | 21.96 | | | $ | 29.29 | | | $ | 23.68 | | | $ | 20.10 | | | $ | 20.21 | | | $ | 19.11 | | | $ | 21.88 | | | $ | 29.19 | |
| | | | | | | | |
Net investment income1 | | | 0.25 | | | | 0.55 | | | | 0.51 | | | | 0.46 | | | | 0.54 | | | | 0.71 | | | | 0.21 | | | | 0.47 | | | | 0.40 | | | | 0.39 | | | | 0.48 | | | | 0.62 | |
Net realized and unrealized gain (loss) | | | 1.40 | | | | 3.55 | | | | (0.13 | ) | | | 1.20 | | | | (1.60 | ) | | | (5.31 | ) | | | 1.40 | | | | 3.55 | | | | (0.10 | ) | | | 1.19 | | | | (1.58 | ) | | | (5.28) | |
| | | | | | | | |
Net increase (decrease) from investment operations | | | 1.65 | | | | 4.10 | | | | 0.38 | | | | 1.66 | | | | (1.06 | ) | | | (4.60 | ) | | | 1.61 | | | | 4.02 | | | | 0.30 | | | | 1.58 | | | | (1.10 | ) | | | (4.66) | |
| | | | | | | | |
Dividends and distributions from: | | | | | | | | | | | | | | | | | | | | | | | | | | | | | | | | | | | | | | | | | | | | | | | | |
Net investment income | | | (0.27 | ) | | | (0.51 | )2 | | | (0.48 | )2 | | | (0.55 | )2 | | | (0.62 | )2 | | | (0.76 | )2 | | | (0.23 | ) | | | (0.44 | )2 | | | (0.41) | 2 | | | (0.48) | 2 | | | (0.56 | )2 | | | (0.68)2 | |
Net realized gain | | | (0.90 | ) | | | – | | | | – | | | | – | | | | (1.11 | )2 | | | (1.97 | )2 | | | (0.90 | ) | | | – | | | | – | | | | – | | | | (1.11 | )2 | | | (1.97)2 | |
| | | | | | | | |
Total dividends and distributions | | | (1.17 | ) | | | (0.51 | ) | | | (0.48 | ) | | | (0.55 | ) | | | (1.73 | ) | | | (2.73 | ) | | | (1.13 | ) | | | (0.44 | ) | | | (0.41 | ) | | | (0.48) | | | | (1.67 | ) | | | (2.65) | |
| | | | | | | | |
Net asset value, end of period | | $ | 24.25 | | | $ | 23.77 | | | $ | 20.18 | | | $ | 20.28 | | | $ | 19.17 | | | $ | 21.96 | | | $ | 24.16 | | | $ | 23.68 | | | $ | 20.10 | | | $ | 20.21 | | | $ | 19.11 | | | $ | 21.88 | |
| | | | | | | | |
| |
Total Investment Return3 | | | | | | | | | | | | | | | | | | | | | | | | | | | | | | | | | | | | | | | | | | | | | | | | |
| |
Based on net asset value | | | 7.25% | 4 | | | 20.52% | | | | 1.67% | | | | 8.75% | 5 | | | (3.53)% | 6 | | | (16.99)% | | | | 7.10% | 4 | | | 20.16% | | | | 1.31% | | | | 8.38% | 7 | | | (3.79)% | 8 | | | (17.25)% | |
| | | | | | | | |
| |
Ratios to Average Net Assets9 | | | | | | | | | | | | | | | | | | | | | | | | | | | | | | | | | | | | | | | | | | | | | | | | |
| |
Total expenses | | | 0.98% | 10 | | | 0.96% | | | | 1.07% | | | | 1.08% | | | | 0.85% | | | | 0.58% | | | | 1.29% | 10 | | | 1.28% | | | | 1.39% | | | | 1.40% | | | | 1.17% | | | | 0.88% | |
| | | | | | | | |
Total expenses after fees waived | | | 0.66% | 10 | | | 0.66% | | | | 0.76% | | | | 0.76% | | | | 0.64% | | | | 0.56% | | | | 0.97% | 10 | | | 0.97% | | | | 1.07% | | | | 1.08% | | | | 0.95% | | | | 0.85% | |
| | | | | | | | |
Net investment income | | | 2.12% | 10 | | | 2.45% | | | | 2.33% | | | | 2.28% | | | | 3.12% | | | | 2.72% | | | | 1.80% | 10 | | | 2.12% | | | | 1.83% | | | | 1.96% | | | | 2.80% | | | | 2.42% | |
| | | | | | | | |
| |
Supplemental Data | | | | | | | | | | | | | | | | | | | | | | | | | | | | | | | | | | | | | | | | | | | | | | | | |
| |
Net assets, end of period (000) | | $ | 319,307 | | | $ | 426,027 | | | $ | 511,458 | | | $ | 547,721 | | | $ | 626,711 | | | $ | 806,612 | | | $ | 444,214 | | | $ | 447,620 | | | $ | 426,819 | | | $ | 488,087 | | | $ | 529,120 | | | $ | 655,429 | |
| | | | | | | | |
Portfolio turnover of the Fund11 | | | – | | | | – | | | | – | | | | – | | | | 94% | 12 | | | 27% | | | | – | | | | – | | | | – | | | | – | | | | 94% | 12 | | | 27% | |
| | | | | | | | |
Portfolio turnover of the Master Total Return Portfolio | | | 473% | 13 | | | 1,346% | 14 | | | 1,771% | 15 | | | 1,754% | 16 | | | 708% | 17 | | | – | | | | 473% | 13 | | | 1,346% | 14 | | | 1,771% | 15 | | | 1,754% | 16 | | | 708% | 17 | | | – | |
| | | | | | | | |
Portfolio turnover of the Master Large Cap Core Portfolio | | | 29% | | | | 128% | | | | 129% | | | | 173% | | | | 168% | 18 | | | – | | | | 29% | | | | 128% | | | | 129% | | | | 173% | | | | 168% | 18 | | | – | |
| | | | | | | | |
| | 1 | Based on average shares outstanding. |
| | 2 | Dividends and distributions are determined in accordance with federal income tax regulations. |
| | 3 | Where applicable, total investment returns exclude the effects of any sales charges and include the reinvestment of dividends and distributions. |
| | 4 | Aggregate total investment return. |
| | 5 | Includes proceeds received from a settlement of litigation, through its investment in Master Large Cap Core Portfolio, which impacted the Fund’s total return. Excluding these proceeds, the Fund’s total return would have been 8.32%. |
| | 6 | Includes proceeds received from a settlement of litigation, through its investment in Master Large Cap Core Portfolio, which impacted the Fund’s total return. Excluding these proceeds, the Fund’s total return would have been (3.88)%. |
| | 7 | Includes proceeds received from a settlement of litigation, through its investment in Master Large Cap Core Portfolio, which impacted the Fund’s total return. Excluding these proceeds, the Fund’s total return would have been 7.95%. |
| | 8 | Includes proceeds received from a settlement of litigation, through its investment in Master Large Cap Core Portfolio, which impacted the Fund’s total return. Excluding these proceeds, the Fund’s total return would have been (4.19)%. |
| | 9 | Includes the Fund’s share of the Master Portfolio’s allocated expenses and/or net investment income. |
| | 11 | Excludes transactions in the Master Portfolios. |
| | 12 | Represents portfolio turnover for the period October 1, 2008 to January 30, 2009. |
| | 13 | Includes mortgage dollar roll transactions; excluding these transactions the portfolio turnover would have been 321%. |
| | 14 | Includes mortgage dollar roll transactions; excluding these transactions the portfolio turnover would have been 752%. |
| | 15 | Includes mortgage dollar roll transactions; excluding these transactions the portfolio turnover would have been 1,379%. |
| | 16 | Includes mortgage dollar roll transactions; excluding these transactions the portfolio turnover would have been 1,248%. |
| | 17 | Includes mortgage dollar roll transactions; excluding these transactions the portfolio turnover would have been 469%. |
| | 18 | Represents portfolio turnover for the period November 1, 2008 to September 30, 2009. |
See Notes to Financial Statements.
| | | | | | |
| | | | | | | |
| | BLACKROCK BALANCED CAPITAL FUND, INC. | | MARCH 31, 2013 | | 11 |
Financial Highlights (continued)
| | | | | | | | | | | | | | | | | | | | | | | | | | | | | | | | | | | | | | | | | | | | | | | | |
| | | Investor B | | | Investor C | |
| | | Six Months
Ended
March 31, | | | Year Ended September 30, | | | Six Months
Ended
March 31, | | | Year Ended September 30, | |
| | | 2013 | | | | | | | | | | | | | | | | | | 2013 | | | | | | | | | | | | | | | | |
| | | (Unaudited} | | | 2012 | | | 2011 | | | 2010 | | | 2009 | | | 2008 | | | (Unaudited} | | | 2012 | | | 2011 | | | 2010 | | | 2009 | | | 2008 | |
| |
Per Share Operating Performance | | | | | | | | | | | | | | | | | | | | | | | | | | | | | | | | | | | | | | | | | | | | | | | | |
| |
Net asset value, beginning of period | | | $ 23.07 | | | $ | 19.55 | | | $ | 19.65 | | | $ | 18.56 | | | $ | 21.24 | | | $ | 28.36 | | | $ | 21.92 | | | $ | 18.64 | | | $ | 18.77 | | | $ | 17.79 | | | $ | 20.51 | | | $ | 27.52 | |
| | | | | | | | |
Net investment income1 | | | 0.08 | | | | 0.24 | | | | 0.18 | | | | 0.20 | | | | 0.32 | | | | 0.39 | | | | 0.11 | | | | 0.28 | | | | 0.21 | | | | 0.21 | | | | 0.32 | | | | 0.39 | |
Net realized and unrealized gain (loss) | | | 1.37 | | | | 3.46 | | | | (0.10 | ) | | | 1.16 | | | | (1.55 | ) | | | (5.13) | | | | 1.29 | | | | 3.28 | | | | (0.08 | ) | | | 1.12 | | | | (1.50 | ) | | | (4.95) | |
| | | | | | | | |
Net increase (decrease) from investment operations | | | 1.45 | | | | 3.70 | | | | 0.08 | | | | 1.36 | | | | (1.23 | ) | | | (4.74) | | | | 1.40 | | | | 3.56 | | | | 0.13 | | | | 1.33 | | | | (1.18 | ) | | | (4.56) | |
| | | | | | | | |
Dividends and distributions from: | | | | | | | | | | | | | | | | | | | | | | | | | | | | | | | | | | | | | | | | | | | | | | | | |
Net investment income | | | (0.12) | | | | (0.18 | )2 | | | (0.18 | )2 | | | (0.27 | )2 | | | (0.34 | )2 | | | (0.41)2 | | | | (0.15) | | | | (0.28 | )2 | | | (0.26 | )2 | | | (0.35 | )2 | | | (0.43 | )2 | | | (0.48)2 | |
Net realized gain | | | (0.90) | | | | – | | | | – | | | | – | | | | (1.11 | )2 | | | (1.97)2 | | | | (0.90) | | | | – | | | | – | | | | – | | | | (1.11 | )2 | | | (1.97)2 | |
| | | | | | | | |
Total dividends and distributions | | | (1.02) | | | | (0.18 | ) | | | (0.18 | ) | | | (0.27 | ) | | | (1.45 | ) | | | (2.38) | | | | (1.05) | | | | (0.28 | ) | | | (0.26 | ) | | | (0.35 | ) | | | (1.54 | ) | | | (2.45) | |
| | | | | | | | |
Net asset value, end of period | | | $ 23.50 | | | $ | 23.07 | | | $ | 19.55 | | | $ | 19.65 | | | $ | 18.56 | | | $ | 21.24 | | | $ | 22.27 | | | $ | 21.92 | | | $ | 18.64 | | | $ | 18.77 | | | $ | 17.79 | | | $ | 20.51 | |
| | | | | | | | |
|
| |
Total Investment Return3 | | | | | | | | | | | | | | | | | | | | | | | | | | | | | | | | | | | | | | | | | | | | | | | | |
| |
Based on net asset value | | | 6.54%4 | | | | 19.01% | | | | 0.34% | | | | 7.37% | 5 | | | (4.69)% | 6 | | | (17.96)% | | | | 6.66%4 | | | | 19.22% | | | | 0.55% | | | | 7.53% | 7 | | | (4.56)% | 8 | | | (17.90)% | |
| | | | | | | | |
|
| |
Ratios to Average Net Assets9 | | | | | | | | | | | | | | | | | | | | | | | | | | | | | | | | | | | | | | | | | | | | | | | | |
| |
Total expenses | | | 2.36%10 | | | | 2.29% | | | | 2.36% | | | | 2.34% | | | | 2.09% | | | | 1.75% | | | | 2.07%10 | | | | 2.06% | | | | 2.18% | | | | 2.20% | | | | 1.97% | | | | 1.67% | |
| | | | | | | | |
Total expenses after fees waived | | | 2.05%10 | | | | 1.98% | | | | 2.04% | | | | 2.02% | | | | 1.90% | | | | 1.73% | | | | 1.75%10 | | | | 1.75% | | | | 1.87% | | | | 1.88% | | | | 1.76% | | | | 1.65% | |
| | | | | | | | |
Net investment income | | | 0.74%10 | | | | 1.13% | | | | 0.86% | | | | 1.03% | | | | 1.93% | | | | 1.56% | | | | 1.02%10 | | | | 1.33% | | | | 1.04% | | | | 1.16% | | | | 2.00% | | | | 1.63% | |
| | | | | | | | |
|
| |
Supplemental Data | | | | | | | | | | | | | | | | | | | | | | | | | | | | | | | | | | | | | | | | | | | | | | | | |
| |
Net assets, end of period (000) | | | $ 5,951 | | | $ | 7,128 | | | $ | 8,786 | | | $ | 14,374 | | | $ | 23,963 | | | $ | 51,371 | | | $ | 62,886 | | | $ | 61,541 | | | $ | 56,608 | | | $ | 61,017 | | | $ | 60,461 | | | $ | 72,694 | |
| | | | | | | | |
Portfolio turnover of the Fund11 | | | – | | | | – | | | | – | | | | – | | | | 94% | 12 | | | 27% | | | | – | | | | – | | | | – | | | | – | | | | 94% | 12 | | | 27% | |
| | | | | | | | |
Portfolio turnover of the Master Total Return Portfolio | | | 473%13 | | | | 1,346% | 14 | | | 1,771% | 15 | | | 1,754% | 16 | | | 708% | 17 | | | – | | | | 473%13 | | | | 1,346% | 14 | | | 1,771% | 15 | | | 1,754% | 16 | | | 708% | 17 | | | – | |
| | | | | | | | |
Portfolio turnover of the Master Large Cap Core Portfolio | | | 29% | | | | 128% | | | | 129% | | | | 173% | | | | 168% | 18 | | | – | | | | 29% | | | | 128% | | | | 129% | | | | 173% | | | | 168% | 18 | | | – | |
| | | | | | | | |
| | 1 | Based on average shares outstanding. |
| | 2 | Dividends and distributions are determined in accordance with federal income tax regulations. |
| | 3 | Where applicable, total investment returns exclude the effects of any sales charges and include the reinvestment of dividends and distributions. |
| | 4 | Aggregate total investment return. |
| | 5 | Includes proceeds received from a settlement of litigation, through its investment in Master Large Cap Core Portfolio, which impacted the Fund’s total return. Excluding these proceeds, the Fund’s total return would have been 6.82%. |
| | 6 | Includes proceeds received from a settlement of litigation, through its investment in Master Large Cap Core Portfolio, which impacted the Fund’s total return. Excluding these proceeds, the Fund’s total return would have been (5.10)%. |
| | 7 | Includes proceeds received from a settlement of litigation, through its investment in Master Large Cap Core Portfolio, which impacted the Fund’s total return. Excluding these proceeds, the Fund’s total return would have been 7.12%. |
| | 8 | Includes proceeds received from a settlement of litigation, through its investment in Master Large Cap Core Portfolio, which impacted the Fund’s total return. Excluding these proceeds, the Fund’s total return would have been (4.94)%. |
| | 9 | Includes the Fund’s share of the Master Portfolio’s allocated expenses and/or net investment income. |
| | 11 | Excludes transactions in the Master Portfolios. |
| | 12 | Represents portfolio turnover for the period October 1, 2008 to January 30, 2009. |
| | 13 | Includes mortgage dollar roll transactions; excluding these transactions the portfolio turnover would have been 321%. |
| | 14 | Includes mortgage dollar roll transactions; excluding these transactions the portfolio turnover would have been 752%. |
| | 15 | Includes mortgage dollar roll transactions; excluding these transactions the portfolio turnover would have been 1,379%. |
| | 16 | Includes mortgage dollar roll transactions; excluding these transactions the portfolio turnover would have been 1,248%. |
| | 17 | Includes mortgage dollar roll transactions; excluding these transactions the portfolio turnover would have been 469%. |
| | 18 | Represents portfolio turnover for the period November 1, 2008 to September 30, 2009. |
See Notes to Financial Statements.
| | | | |
| | | | | |
| 12 | | BLACKROCK BALANCED CAPITAL FUND, INC. | | MARCH 31, 2013 |
Financial Highlights (concluded)
| | | | | | | | | | | | | | | | | | | | | | | | |
| | | Class R | |
| | | Six Months
Ended
March 31, 2012 (Unaudited) | | | Year Ended September 30, | |
| | | | 2012 | | | 2011 | | | 2010 | | | 2009 | | | 2008 | |
| |
Per Share Operating Performance | | | | | | | | | | | | | | | | | | | | | | | | |
| |
Net asset value, beginning of period | | $ | 22.63 | | | $ | 19.22 | | | $ | 19.33 | | | $ | 18.31 | | | $ | 21.06 | | | $ | 28.22 | |
| | | | |
Net investment income1 | | | 0.16 | | | | 0.37 | | | | 0.30 | | | | 0.29 | | | | 0.38 | | | | 0.49 | |
Net realized and unrealized gain (loss) | | | 1.32 | | | | 3.39 | | | | (0.09 | ) | | | 1.14 | | | | (1.54 | ) | | | (5.08) | |
| | | | |
Net increase (decrease) from investment operations | | | 1.48 | | | | 3.76 | | | | 0.21 | | | | 1.43 | | | | (1.16 | ) | | | (4.59) | |
| | | | |
Dividends and distributions from: | | | | | | | | | | | | | | | | | | | | | | | | |
Net investment income | | | (0.19) | | | | (0.35 | )2 | | | (0.32 | )2 | | | (0.41 | )2 | | | (0.48 | )2 | | | (0.60)2 | |
Net realized gain | | | (0.90) | | | | – | | | | – | | | | – | | | | (1.11 | )2 | | | (1.97)2 | |
| | | | |
Total dividends and distributions | | | (1.09) | | | | (0.35 | ) | | | (0.32 | ) | | | (0.41 | ) | | | (1.59) | | | | (2.57) | |
| | | | |
Net asset value, end of period | | $ | 23.02 | | | $ | 22.63 | | | $ | 19.22 | | | $ | 19.33 | | | $ | 18.31 | | | $ | 21.06 | |
| | | | |
|
| |
Total Investment Return3 | | | | | | | | | | | | | | | | | | | | | | | | |
| |
Based on net asset value | | | 6.85%4 | | | | 19.73% | | | | 0.96% | | | | 7.87% | 5 | | | (4.25)% | 6 | | | (17.59)% | |
| | | | |
|
| |
Ratios to Average Net Assets7 | | | | | | | | | | | | | | | | | | | | | | | | |
| |
Total expenses | | | 1.69%8 | | | | 1.67% | | | | 1.77% | | | | 1.84% | | | | 1.64% | | | | 1.31% | |
| | | | |
Total expenses after fees waived | | | 1.37%8 | | | | 1.36% | | | | 1.46% | | | | 1.52% | | | | 1.42% | | | | 1.29% | |
| | | | |
Net investment income | | | 1.41%8 | | | | 1.73% | | | | 1.44% | | | | 1.51% | | | | 2.29% | | | | 1.98% | |
| | | | |
|
| |
Supplemental Data | | | | | | | | | | | | | | | | | | | | | | | | |
| |
Net assets, end of period (000) | | $ | 7,889 | | | $ | 8,963 | | | $ | 8,118 | | | $ | 9,737 | | | $ | 10,194 | | | $ | 9,655 | |
| | | | |
Portfolio turnover of the Fund9 | | | – | | | | – | | | | – | | | | – | | | | 94% | 10 | | | 27% | |
| | | | |
Portfolio turnover of the Master Total Return Portfolio | | | 473%11 | | | | 1,346% | 12 | | | 1,771% | 13 | | | 1,754% | 14 | | | 708% | 15 | | | – | |
| | | | |
Portfolio turnover of the Master Large Cap Core Portfolio | | | 29% | | | | 128% | | | | 129% | | | | 173% | | | | 168% | 16 | | | – | |
| | | | |
| | 1 | Based on average shares outstanding. |
| | 2 | Dividends and distributions are determined in accordance with federal income tax regulations. |
| | 3 | Where applicable, total investment returns include the reinvestment of dividends and distributions. |
| | 4 | Aggregate total investment return. |
| | 5 | Includes proceeds received from a settlement of litigation, through its investment in Master Large Cap Core Portfolio, which impacted the Fund’s total return. Excluding these proceeds, the Fund’s total return would have been 7.53%. |
| | 6 | Includes proceeds received from a settlement of litigation, through its investment in Master Large Cap Core Portfolio, which impacted the Fund’s total return. Excluding these proceeds, the Fund’s total return would have been (4.62)%. |
| | 7 | Includes the Fund’s share of the Master Portfolio’s allocated expenses and/or net investment income. |
| | 9 | Excludes transactions in the Master Portfolios. |
| | 10 | Represents portfolio turnover for the period October 1, 2008 to January 30, 2009. |
| | 11 | Includes mortgage dollar roll transactions; excluding these transactions the portfolio turnover would have been 321%. |
| | 12 | Includes mortgage dollar roll transactions; excluding these transactions the portfolio turnover would have been 752%. |
| | 13 | Includes mortgage dollar roll transactions; excluding these transactions the portfolio turnover would have been 1,379%. |
| | 14 | Includes mortgage dollar roll transactions; excluding these transactions the portfolio turnover would have been 1,248%. |
| | 15 | Includes mortgage dollar roll transactions; excluding these transactions the portfolio turnover would have been 469%. |
| | 16 | Represents portfolio turnover for the period November 1, 2008 to September 30, 2009. |
See Notes to Financial Statements.
| | | | | | |
| | | | | | | |
| | BLACKROCK BALANCED CAPITAL FUND, INC. | | MARCH 31, 2013 | | 13 |
Notes to Financial Statements (Unaudited)
1. Organization and Significant Accounting Policies:
BlackRock Balanced Capital Fund, Inc. (the “Fund”) is registered under the Investment Company Act of 1940, as amended (the “1940 Act”), as a diversified, open-end management investment company. The Fund is organized as a Maryland corporation. The Fund seeks to achieve its investment objective by investing the fixed income portion of its assets in Master Total Return Portfolio (the “Master Total Return Portfolio”) of Master Bond LLC, a mutual fund that has an investment objective and strategy consistent with that of the fixed income portion of the Fund, and investing the equity portion of its assets in Master Large Cap Core Portfolio (the “Master Large Cap Core Portfolio”) of Master Large Cap Series LLC, a mutual fund that has an investment objective and strategy consistent with that of the equity portion of the Fund. Master Total Return Portfolio and Master Large Cap Core Portfolio, both affiliates of the Fund, are collectively referred to as the “Master Portfolios.” The value of the Fund’s investment in the Master Portfolios reflects the Fund’s proportionate interest in the net assets of the Master Portfolios. The percentages of the Master Large Cap Core Portfolio and Master Total Return Portfolio owned by the Fund at March 31, 2013 were 23.8% and 9.1%, respectively. The performance of the Fund is directly affected by the performance of the Master Portfolios. The financial statements of the Master Portfolios, including the Schedules of Investments, are included elsewhere in this report and should be read in conjunction with the Fund’s financial statements. The Fund’s financial statements are prepared in conformity with accounting principles generally accepted in the United States of America (“US GAAP”), which may require management to make estimates and assumptions that affect the reported amounts and disclosures in the financial statements. Actual results could differ from those estimates. The Fund offers multiple classes of shares. Institutional Shares are sold without a sales charge and only to certain eligible investors. Investor A Shares are generally sold with a front-end sales charge. Investor B and Investor C Shares may be subject to a CDSC. Class R Shares are sold without a sales charge and only to certain employer-sponsored retirement plans. All classes of shares have identical voting, dividend, liquidation and other rights and the same terms and conditions, except that Investor A, Investor B, Investor C and Class R Shares bear certain expenses related to the shareholder servicing of such shares, and Investor B, Investor C and Class R Shares also bear certain expenses related to the distribution of such shares. Investor B Shares automatically convert to Investor A Shares after approximately eight years. Investor B Shares are only available through exchanges and dividend reinvestments by existing shareholders and for purchase by certain employer-sponsored retirement plans. Each class has exclusive voting rights with respect to matters relating to its shareholder servicing and distribution expenditures (except that Investor B shareholders may vote on material changes to the Investor A distribution plan).
The following is a summary of significant accounting policies followed by the Fund:
Valuation: US GAAP defines fair value as the price the Fund would receive to sell an asset or pay to transfer a liability in an orderly transaction between market participants at the measurement date. The Fund’s policy is to fair value its financial instruments at market value. The Fund records its investment in the Master Portfolios at fair value based on the Fund’s proportionate interest in the net assets of the Master Portfolios.
Valuation of securities held by the Master Portfolios is discussed in Note 1 of the Master Portfolios’ Notes to Financial Statements, which are included elsewhere in this report. Investments in open-end registered investment companies are valued at NAV each business day.
Investment Transactions and Investment Income: For financial reporting purposes, contributions to and withdrawals from the Master Portfolios are accounted on a trade date basis. The Fund records daily its proportionate share of the Master Portfolios’ income, expenses and realized and unrealized gains and losses. In addition, the Fund accrues its own expenses. Income, expenses, and realized and unrealized gains and losses are allocated daily to each class based on its relative net assets.
Dividends and Distributions: Dividends and distributions paid by the Fund are recorded on the ex-dividend dates. The portion of distributions that exceeds a Fund’s current and accumulated earnings and profits, which are measured on a tax basis, will constitute a nontaxable return of capital. Distributions in excess of a Fund’s taxable income and net capital gains, but not in excess of a Fund’s earnings and profits, will be taxable to shareholders as ordinary income and will not constitute a non-taxable return of capital. The character and timing of dividends and distributions are determined in accordance with federal income tax regulations, which may differ from US GAAP.
Income Taxes: It is the Fund’s policy to comply with the requirements of the Internal Revenue Code of 1986, as amended, applicable to regulated investment companies and to distribute substantially all of its taxable income to its shareholders. Therefore, no federal income tax provision is required.
The Fund files US federal and various state and local tax returns. No income tax returns are currently under examination. The statute of limitations on the Fund’s US federal tax returns remains open for each of the four years ended September 30, 2012. The statutes of limitations on the Fund’s state and local tax returns may remain open for an additional year depending upon the jurisdiction. Management does not believe there are any uncertain tax positions that require recognition of a tax liability.
Other: Expenses directly related to the Fund or its classes are charged to the Fund or class. Other operating expenses shared by several funds are pro rated among those funds on the basis of relative net assets or other appropriate methods. Expenses directly related to the Fund and other shared expenses pro rated to the Fund are allocated daily to each class based on its relative net assets or other appropriate methods.
The Fund has an arrangement with the custodian whereby fees may be reduced by credits earned on uninvested cash balances, which, if applicable, are shown as fees paid indirectly in the Statement of Operations. The custodian imposes fees on overdrawn cash balances, which can be offset by accumulated credits earned or may result in additional custody charges.
2. Investment Advisory Agreement and Other Transactions with Affiliates:
The PNC Financial Services Group, Inc. (“PNC”) is the largest stockholder and an affiliate, for 1940 Act purposes, of BlackRock, Inc. (“BlackRock”).
| | | | |
| | | | | |
| 14 | | BLACKROCK BALANCED CAPITAL FUND, INC. | | MARCH 31, 2013 |
Notes to Financial Statements (continued)
The Fund entered into an Investment Advisory Agreement with the Manager, the Fund’s investment advisor, an indirect, wholly owned subsidiary of BlackRock, to provide investment advisory and administration services. The Manager is responsible for the management of the Fund’s portfolio and provides the necessary personnel, facilities, equipment and certain other services necessary to the operations of the Fund. For such services, the Fund paid the Manager a monthly fee based on a percentage of the Fund’s average daily net assets at the following annual rates:
| | | | |
| |
| Average Daily Net Assets | | Investment
Advisory Fee | |
| |
First $250 million | | | 0.500% | |
$250 million – $ 300 million | | | 0.450% | |
$300 million – $ 400 million | | | 0.425% | |
Greater than $400 million | | | 0.400% | |
| |
The Fund also pays an investment advisory fee to the Manager, which is the investment advisor of Master Total Return Portfolio and Master Large Cap Core Portfolio, to the extent it invests in the Master Total Return Portfolio and Master Large Cap Core Portfolio. The Manager has contractually agreed to waive its investment advisory fee by the amount the Fund pays in connection with its investments in the Master Portfolios. For the six months ended March 31, 2013, the Manager waived $1,449,762, which is included in fees waived by Manager in the Statement of Operations.
Investments in companies considered to be an affiliate of the Fund, for purposes of Section 2(a)(3) of the Investment Company Act of 1940, were as follows:
| | | | | | | | | | |
| |
| Affiliate | | Shares Held at
September 30,
2012 | | Net Activity | | Shares Held at March 31, 2013 | | Income | |
| |
BlackRock Liquidity Funds, TempFund, Institutional Class | | 6,285,043 | | (6,285,043) | | – | | | $424 | |
| |
The Manager voluntarily agreed to waive its investment advisory fees by the amount of investment advisory fees the Fund pays to the Manager indirectly through its investment in affiliated money market funds. However, the Manager does not waive its investment advisory fees by the amount of investment advisory fees paid in connection with the Fund’s investment in other affiliated investment companies, if any. For the six months ended March 31, 2013, the Manager waived $5, which is included in fees waived by Manager in the Statement of Operations.
The Manager entered into a sub-advisory agreement with BlackRock Investment Management, LLC (“BIM”), an affiliate of the Manager. The Manager pays BIM, for services it provides, a monthly fee that is a percentage of the investment advisory fees paid by the Fund to the Manager.
The Fund entered into a Distribution Agreement and Distribution and Service Plan with BlackRock Investments, LLC (“BRIL”), an affiliate of the Manager. Pursuant to the Distribution and Service Plan and in accordance with Rule 12b-1 under the 1940 Act, the Fund pays BRIL ongoing service and distribution fees. The fees are accrued daily and paid monthly at annual rates based upon the average daily net assets of the shares of the Fund as follows:
| | | | | | | | |
| |
| | | Service
Fee | | | Distribution
Fee | |
| |
Investor A | | | 0.25% | | | | – | |
Investor B | | | 0.25% | | | | 0.75% | |
Investor C | | | 0.25% | | | | 0.75% | |
Class R | | | 0.25% | | | | 0.25% | |
| |
Pursuant to sub-agreements with BRIL, broker-dealers and BRIL provide shareholder servicing and distribution services to the Fund. The ongoing service and/or distribution fee compensates BRIL and each broker-dealer for providing shareholder servicing and/or distribution related services to Investor A, Investor B, Investor C and Class R shareholders.
The Manager maintains a call center, which is responsible for providing certain shareholder services to the Fund, such as responding to shareholder inquiries and processing transactions based upon instructions from shareholders with respect to the subscription and redemption of Fund shares. For the six months ended March 31, 2013, the Fund reimbursed the Manager the following amounts for costs incurred in running the call center, which are included in transfer agent – class specific in the Statement of Operations:
| | | | |
| |
Institutional | | $ | 5,168 | |
Investor A | | $ | 7,420 | |
Investor B | | $ | 372 | |
Investor C | | $ | 1,101 | |
Class R | | $ | 47 | |
| |
Certain officers and/or directors of the Fund are officers and/or directors of BlackRock or its affiliates. The Fund reimburses the Manager for a portion of the compensation paid to the Fund’s Chief Compliance Officer.
For the six months ended March 31, 2013, affiliates earned underwriting discounts, direct commissions and dealer concessions on sales of the Fund’s Investor A Shares, which totaled $6,317.
For the six months ended March 31, 2013, affiliates received CDSCs as follows:
| | | | |
| |
Investor B | | $ | 2,104 | |
Investor C | | $ | 2,003 | |
| |
3. Borrowings:
The Fund, along with certain other funds managed by the Manager and its affiliates, is a party to a $500 million credit agreement with a group of lenders. The Fund may borrow under the credit agreement to fund shareholder redemptions. Effective November 2011 to November 2012, the credit agreement had the following terms: a commitment fee of 0.065% per annum based on the Fund’s pro rata share of the unused portion of the credit agreement and interest at a rate equal to the higher of (a) the one-month LIBOR plus 0.80% per annum or (b) the Fed Funds rate plus 0.80% per annum on amounts borrowed. In addition, the Fund paid administration and arrangement fees which were allocated to the Fund based on their net assets as of October 31, 2011. The credit agreement, which expired in November 2012, was renewed with the same terms until November 2013. Effective November 2012 to November 2013, the credit agreement has the following terms: a commitment fee of 0.065% per annum based on the Fund’s pro rata share of the unused portion of the credit agreement and interest at a rate
| | | | | | |
| | | | | MARCH 31, 2013 | | |
| | BLACKROCK BALANCED CAPITAL FUND, INC. | | | 15 |
Notes to Financial Statements (continued)
equal to the higher of (a) the one-month LIBOR plus 0.80% per annum or (b) the Fed Funds rate plus 0.80% per annum on amounts borrowed. In addition, the Fund paid administration and arrangement fees which
were allocated to the Fund based on its net assets as of October 31, 2012. The Fund did not borrow under the credit agreement during the six months ended March 31, 2013.
4. Capital Share Transactions:
Transactions in capital shares for each class were as follows:
| | | | | | | | | | | | | | | | |
| | | Six Months Ended | | | Year Ended | |
| | | March 31, 2013 | | | September 30, 2012 | |
| | | Shares | | | Amount | | | Shares | | | Amount | |
| |
Institutional | | | | | | | | | | | | | | | | |
| |
Shares sold | | | 420,299 | | | $ | 9,900,584 | | | | 1,073,577 | | | $ | 24,117,916 | |
Shares issued to shareholders in reinvestment of dividends and distributions | | | 759,778 | | | | 17,338,157 | | | | 416,633 | | | | 9,131,872 | |
Shares redeemed | | | (5,935,854 | ) | | | (140,864,433) | | | | (8,919,131 | ) | | | (205,195,951) | |
| | | | | | | | |
Net decrease | | | (4,755,777 | ) | | $ | (113,625,692) | | | | (7,428,921 | ) | | $ | (171,946,163) | |
| | | | | | | | |
|
| |
Investor A | | | | | | | | | | | | | | | | |
| |
Shares sold and automatic conversion of shares | | | 388,120 | | | $ | 9,118,227 | | | | 652,208 | | | $ | 14,663,133 | |
Shares issued to shareholders in reinvestment of dividends and distributions | | | 792,557 | | | | 18,038,677 | | | | 339,412 | | | | 7,454,026 | |
Shares redeemed | | | (1,696,536 | ) | | | (40,049,063) | | | | (3,323,937 | ) | | | (74,381,031) | |
| | | | | | | | |
Net decrease | | | (515,859 | ) | | $ | (12,892,159) | | | | (2,332,317 | ) | | $ | (52,263,872) | |
| | | | | | | | |
Investor B | | | | | | | | | | | | | | | | |
| |
Shares sold | | | 6,315 | | | $ | 145,749 | | | | 19,198 | | | $ | 418,334 | |
Shares issued to shareholders in reinvestment of dividends and distributions | | | 10,919 | | | | 242,309 | | | | 2,546 | | | | 54,515 | |
Shares redeemed and automatic conversion of shares | | | (72,958 | ) | | | (1,666,504) | | | | (162,078 | ) | | | (3,515,240) | |
| | | | | | | | |
Net decrease | | | (55,724 | ) | | $ | (1,278,446) | | | | (140,334 | ) | | $ | (3,042,391) | |
| | | | | | | | |
|
| |
Investor C | | | | | | | | | | | | | | | | |
| |
Shares sold | | | 173,794 | | | $ | 3,788,231 | | | | 378,641 | | | $ | 7,719,246 | |
Shares issued to shareholders in reinvestment of dividends and distributions | | | 119,176 | | | | 2,505,104 | | | | 34,624 | | | | 706,396 | |
Shares redeemed | | | (277,161 | ) | | | (6,032,993) | | | | (642,851 | ) | | | (13,310,001) | |
| | | | | | | | |
Net increase (decrease) | | | 15,809 | | | $ | 260,342 | | | | (229,586 | ) | | $ | (4,884,359) | |
| | | | | | | | |
|
| |
Class R | | | | | | | | | | | | | | | | |
| |
Shares sold | | | 33,935 | | | $ | 764,504 | | | | 111,890 | | | $ | 2,378,885 | |
Shares issued to shareholders in reinvestment of dividends and distributions | | | 19,745 | | | | 428,667 | | | | 6,922 | | | | 145,567 | |
Shares redeemed | | | (107,146 | ) | | | (2,382,558) | | | | (145,021 | ) | | | (3,098,481) | |
| | | | | | | | |
Net decrease | | | (53,466 | ) | | $ | (1,189,387) | | | | (26,209 | ) | | $ | (574,029) | |
|
| |
Total net decrease | | | (5,365,017 | ) | | $ | (128,725,342) | | | | (10,157,367 | ) | | $ | (232,710,814) | |
| | | | | | | | |
| | | | | | |
| | | | | | | |
| 16 | | BLACKROCK BALANCED CAPITAL FUND, INC. | | MARCH 31, 2013 | | |
Notes to Financial Statements (concluded)
5. Subsequent Events:
Management’s evaluation of the impact of all subsequent events on the Funds’ financial statements was completed through the date the financial statements were issued and the following items were noted:
Effective April 25, 2013, the credit agreement was terminated and a new agreement was entered into. The Fund became a party to a 364-day, $800 million credit agreement, which expires in April 2014. Excluding commitments designated for a certain individual fund, the Fund can borrow up to an aggregate commitment amount of $500 million, subject to asset coverage and other limitations as specified in the agreement. The credit agreement has the following terms: a fee of 0.065% per annum on unused commitment amounts and interest at a rate equal to the higher of (a) the one-month LIBOR plus 0.80% per annum or (b) the Fed Funds rate plus 0.80% per annum on amounts borrowed.
| | | | | | |
| | | | | MARCH 31, 2013 | | |
| | BLACKROCK BALANCED CAPITAL FUND, INC. | | | 17 |
| | |
| Portfolio Summary | | Master Large Cap Core Portfolio |
|
|
| As of March 31, 2013 | | |
|
| | | | |
| | | Percent of | |
| | | Long-Term | |
| Ten Largest Holdings | | Investments | |
| |
Google, Inc., Class A | | | 4% | |
Pfizer, Inc. | | | 3 | |
JPMorgan Chase & Co. | | | 3 | |
Merck & Co., Inc. | | | 3 | |
Apple, Inc. | | | 3 | |
Bank of America Corp. | | | 3 | |
News Corp., Class A | | | 3 | |
3M Co. | | | 3 | |
Citigroup, Inc. | | | 3 | |
CVS Caremark Corp. | | | 3 | |
| |
| | | | |
| | | Percent of | |
| | | Long-Term | |
| Sector Allocations | | Investments | |
| |
Information Technology | | | 21% | |
Financials | | | 20 | |
Health Care | | | 12 | |
Industrials | | | 12 | |
Energy | | | 12 | |
Consumer Discretionary | | | 12 | |
Consumer Staples | | | 6 | |
Materials | | | 4 | |
Telecommunication Services | | | 1 | |
| |
For Portfolio compliance purposes, the Portfolio’s sector classifications refer to any one or more of the sector sub-classifications used by one or more widely recognized market indexes or ratings group indexes, and/or as defined by Portfolio management. These definitions may not apply for purposes of this report, which may combine sector sub-classifications for reporting ease.
| | | | | | |
| | | | | | | |
| 18 | | BLACKROCK BALANCED CAPITAL FUND, INC. | | MARCH 31, 2013 | | |
| | |
| Schedule of Investments March 31, 2013 (Unaudited) | | Master Large Cap Core Portfolio (Percentages shown are based on Net Assets) |
| | | | | | | | |
| Common Stocks | | Shares | | | Value | |
| |
Aerospace & Defense – 0.9% | | | | | | | | |
The Boeing Co. | | | 246,900 | | | $ | 21,196,365 | |
| |
Airlines – 3.7% | | | | | | | | |
Copa Holdings SA, Class A | | | 113,100 | | | | 13,527,891 | |
Delta Air Lines, Inc. (a) | | | 1,303,925 | | | | 21,527,802 | |
United Continental Holdings, Inc. (a)(b) | | | 1,531,920 | | | | 49,036,759 | |
| | | | | | | | |
| | | | | | | 84,092,452 | |
| |
Auto Components – 1.0% | | | | | | | | |
TRW Automotive Holdings Corp. (a) | | | 429,393 | | | | 23,616,615 | |
| |
Beverages – 1.5% | | | | | | | | |
The Coca-Cola Co. | | | 851,575 | | | | 34,437,693 | |
| |
Capital Markets – 1.5% | | | | | | | | |
The Goldman Sachs Group, Inc. | | | 227,131 | | | | 33,422,327 | |
| |
Chemicals – 0.3% | | | | | | | | |
Cabot Corp. | | | 203,874 | | | | 6,972,491 | |
| |
Commercial Banks – 3.5% | | | | | | | | |
SunTrust Banks, Inc. (a) | | | 852,700 | | | | 24,566,287 | |
U.S. Bancorp | | | 1,650,775 | | | | 56,010,796 | |
| | | | | | | | |
| | | | | | | 80,577,083 | |
| |
Commercial Services & Supplies – 0.7% | |
Tyco International Ltd. | | | 468,900 | | | | 15,004,800 | |
| |
Computers & Peripherals – 4.1% | | | | | | | | |
Apple, Inc. | | | 145,750 | | | | 64,513,323 | |
EMC Corp. (a) | | | 1,210,900 | | | | 28,928,401 | |
| | | | | | | | |
| | | | | | | 93,441,724 | |
| |
Construction & Engineering – 1.1% | | | | | | | | |
KBR, Inc. | | | 799,900 | | | | 25,660,792 | |
| |
Consumer Finance – 1.8% | | | | | | | | |
Discover Financial Services | | | 938,300 | | | | 42,073,372 | |
| |
Containers & Packaging – 1.8% | | | | | | | | |
Packaging Corp. of America | | | 627,613 | | | | 28,160,995 | |
Rock-Tenn Co., Class A | | | 136,694 | | | | 12,683,836 | |
| | | | | | | | |
| | | | | | | 40,844,831 | |
| |
Diversified Financial Services – 8.6% | |
Bank of America Corp. | | | 5,296,300 | | | | 64,508,934 | |
Citigroup, Inc. | | | 1,395,018 | | | | 61,715,596 | |
JPMorgan Chase & Co. | | | 1,450,024 | | | | 68,818,139 | |
| | | | | | | | |
| | | | | | | 195,042,669 | |
| |
Diversified Telecommunication Services – 1.1% | |
Verizon Communications, Inc. | | | 492,900 | | | | 24,226,035 | |
| |
Electronic Equipment, Instruments & Components – 0.7% | |
Avnet, Inc. (a) | | | 434,200 | | | | 15,718,040 | |
| |
Energy Equipment & Services – 0.7% | |
Oceaneering International, Inc. | | | 223,800 | | | | 14,862,558 | |
| |
Food & Staples Retailing – 4.1% | | | | | | | | |
CVS Caremark Corp. | | | 1,056,825 | | | | 58,114,807 | |
Wal-Mart Stores, Inc. | | | 473,050 | | | | 35,398,331 | |
| | | | | | | | |
| | | | | | | 93,513,138 | |
| |
Health Care Equipment & Supplies – 0.9% | |
Abbott Laboratories | | | 554,900 | | | | 19,599,068 | |
| |
Health Care Providers & Services – 1.4% | |
McKesson Corp. | | | 294,425 | | | | 31,786,123 | |
| |
Industrial Conglomerates – 3.4% | | | | | | | | |
3M Co. | | | 585,975 | | | | 62,295,002 | |
| | | | | | | | |
| Common Stocks | | Shares | | | Value | |
| |
Industrial Conglomerates (concluded) | |
General Electric Co. | | | 605,250 | | | $ | 13,993,380 | |
| | | | | | | | |
| | | | | | | 76,288,382 | |
| |
Insurance – 4.6% | | | | | | | | |
Allied World Assurance Co. Holdings AG | | | 75,500 | | | | 7,000,360 | |
American Financial Group, Inc. | | | 106,700 | | | | 5,055,446 | |
American International Group, Inc. (a) | | | 765,500 | | | | 29,716,710 | |
The Chubb Corp. | | | 171,700 | | | | 15,028,901 | |
Everest Re Group Ltd. | | | 9,500 | | | | 1,233,670 | |
PartnerRe Ltd. (b) | | | 141,500 | | | | 13,175,065 | |
The Travelers Cos., Inc. | | | 405,900 | | | | 34,172,721 | |
| | | | | | | | |
| | | | | | | 105,382,873 | |
| |
Internet Software & Services – 3.8% | | | | | | | | |
Google, Inc., Class A (a) | | | 110,275 | | | | 87,561,658 | |
| |
IT Services – 5.4% | | | | | | | | |
International Business Machines Corp. | | | 105,150 | | | | 22,428,495 | |
Mastercard, Inc., Class A | | | 107,250 | | | | 58,036,193 | |
Teradata Corp. (a) | | | 709,200 | | | | 41,495,292 | |
| | | | | | | | |
| | | | | | | 121,959,980 | |
| |
Life Sciences Tools & Services – 1.2% | |
Agilent Technologies, Inc. | | | 641,500 | | | | 26,923,755 | |
| |
Machinery – 2.0% | | | | | | | | |
Ingersoll-Rand Plc | | | 535,900 | | | | 29,479,859 | |
Oshkosh Corp. (a) | | | 387,800 | | | | 16,477,622 | |
| | | | | | | | |
| | | | | | | 45,957,481 | |
| |
Media – 6.3% | | | | | | | | |
Comcast Corp., Class A | | | 1,241,200 | | | | 52,142,812 | |
News Corp., Class A | | | 2,050,250 | | | | 62,573,630 | |
Time Warner Cable, Inc. | | | 306,180 | | | | 29,411,651 | |
| | | | | | | | |
| | | | | | | 144,128,093 | |
| |
Multiline Retail – 0.9% | | | | | | | | |
Dillard’s, Inc., Class A | | | 257,065 | | | | 20,192,456 | |
| |
Oil, Gas & Consumable Fuels – 10.9% | |
Chevron Corp. | | | 405,775 | | | | 48,214,186 | |
Exxon Mobil Corp. | | | 546,100 | | | | 49,209,071 | |
Marathon Oil Corp. | | | 787,075 | | | | 26,540,169 | |
Marathon Petroleum Corp. | | | 547,050 | | | | 49,015,680 | |
PBF Energy, Inc. | | | 555,238 | | | | 20,638,196 | |
Suncor Energy, Inc. | | | 1,345,940 | | | | 40,391,659 | |
Tesoro Corp. | | | 242,093 | | | | 14,174,545 | |
| | | | | | | | |
| | | | | | | 248,183,506 | |
| |
Paper & Forest Products – 2.3% | | | | | | | | |
Domtar Corp. | | | 168,300 | | | | 13,063,446 | |
International Paper Co. | | | 841,300 | | | | 39,187,754 | |
| | | | | | | | |
| | | | | | | 52,251,200 | |
| |
Pharmaceuticals – 8.7% | | | | | | | | |
AbbVie, Inc. | | | 532,900 | | | | 21,731,662 | |
Eli Lilly & Co. | | | 402,175 | | | | 22,839,518 | |
Johnson & Johnson | | | 124,225 | | | | 10,128,064 | |
Merck & Co., Inc. | | | 1,483,650 | | | | 65,621,839 | |
Pfizer, Inc. | | | 2,582,175 | | | | 74,521,571 | |
Zoetis, Inc. | | | 99,300 | | | | 3,316,620 | |
| | | | | | | | |
| | | | | | | 198,159,274 | |
| |
Semiconductors & Semiconductor Equipment – 1.8% | |
KLA-Tencor Corp. | | | 565,475 | | | | 29,823,151 | |
See Notes to Financial Statements.
| | | | | | |
| | | | | | | |
| | BLACKROCK BALANCED CAPITAL FUND, INC. | | MARCH 31, 2013 | | 19 |
| | |
| Schedule of Investments (continued) | | Master Large Cap Core Portfolio (Percentages shown are based on Net Assets) |
| | | | | | | | |
| Common Stocks | | Shares | | | Value | |
| |
Semiconductors & Semiconductor Equipment (concluded) | |
Teradyne, Inc. (a)(b) | | | 716,600 | | | $ | 11,623,252 | |
| | | | | | | | |
| | | | | | | 41,446,403 | |
| |
Software – 5.2% | |
Activision Blizzard, Inc. | | | 1,604,900 | | | | 23,383,393 | |
Microsoft Corp. | | | 1,859,650 | | | | 53,204,587 | |
Oracle Corp. | | | 1,321,600 | | | | 42,740,544 | |
| | | | | | | | |
| | | | | | | 119,328,524 | |
| |
Specialty Retail – 2.2% | |
PetSmart, Inc. | | | 195,835 | | | | 12,161,354 | |
Ross Stores, Inc. | | | 636,900 | | | | 38,608,878 | |
| | | | | | | | |
| | | | | | | 50,770,232 | |
| |
Textiles, Apparel & Luxury Goods – 0.9% | |
NIKE, Inc., Class B | | | 328,974 | | | | 19,412,756 | |
| |
Tobacco – 0.1% | | | | | | | | |
Philip Morris International, Inc. | | | 35,775 | | | | 3,316,700 | |
| |
Total Long-Term Investments | | | | | | | | |
(Cost – $1,758,631,284) – 99.1% | | | | | | | 2,257,351,449 | |
| |
| | | | | | | | |
| Short-Term Securities | | Shares | | | Value | |
| |
BlackRock Liquidity Funds, TempFund, Institutional Class, 0.09% (c)(d) | | | 22,119,874 | | | $ | 22,119,874 | |
| |
| | | Beneficial | | | | |
| | | Interest | | | | |
| | | (000) | | | | |
| |
BlackRock Liquidity Series, LLC Money Market
Series, 0.23% (c)(d)(e) | | | $ 15,024 | | | | 15,023,875 | |
| |
| | |
| | | Par | | | | |
| | | (000) | | | | |
| |
Time Deposits – 0.0% | | | | | | | | |
Brown Brothers Harriman & Co., 0.08%, 4/01/13 | | | 441 | | | | 440,968 | |
| |
Total Short-Term Securities | | | | | | | | |
(Cost – $37,584,717) – 1.6% | | | | | | | 37,584,717 | |
| |
Total Investments (Cost – $1,796,216,001*)
– 100.7% | | | | 2,294,936,166 | |
Liabilities in Excess of Other Assets – (0.7)% | | | | (16,032,358 | ) |
| | | | | | | | |
Net Assets – 100.0% | | | $ | 2,278,903,808 | |
| | | | | | | | |
|
| |
Notes to Schedule of Investments
| * | As of March 31, 2013, gross unrealized appreciation and gross unrealized depreciation based on cost for federal income tax purposes were as follows: |
| | | | |
| |
Tax cost | | $ | 1,794,329,467 | |
| | | | |
Gross unrealized appreciation | | $ | 509,780,530 | |
Gross unrealized depreciation | | | (9,173,831 | ) |
| | | | |
Net unrealized appreciation | | $ | 500,606,699 | |
| | | | |
| (a) | Non-income producing security. |
| (b) | Security, or a portion of security, is on loan. |
| (c) | Investments in issuers considered to be an affiliate of the Portfolio during the period ended March 31, 2013, for purposes of Section 2(a)(3) of the Investment Company Act of 1940, as amended, were as follows: |
| | | | | | | | | | | | | | | | |
| |
| | | Shares/Beneficial | | | | | | Shares/Beneficial | | | | |
| | | Interest Held at | | | Net | | | Interest Held at | | | | |
| Affiliate | | September 30, 2012 | | | Activity | | | March 31, 2013 | | | Income | |
| |
BlackRock Liquidity Funds, TempFund, Institutional Class | | | 40,033,302 | | | | (17,913,428 | ) | | | 22,119,874 | | | | $10,394 | |
BlackRock Liquidity Series, LLC Money Market Series | | | $22,802,709 | | | | $ (7,778,834 | ) | | | $15,023,875 | | | | $11,443 | |
| |
| (d) | Represents the current yield as of report date. |
| (e) | Security was purchased with the cash collateral from loaned securities. The Portfolio may withdraw up to 25% of its investment daily, although the manager of the BlackRock Liquidity Series, LLC Money Market Series, in its sole discretion, may permit an investor to withdraw more than 25% on any one day. |
| — | | For Portfolio compliance purposes, the Portfolio’s industry classifications refer to any one or more of the industry sub-classifications used by one or more widely recognized market indexes or ratings group indexes, and/or as defined by Portfolio management. These definitions may not apply for purposes of this report, which may combine such industry sub-classifications for reporting ease. |
| — | | Fair Value Measurements – Various inputs are used in determining the fair value of investments. These inputs to valuation techniques are categorized into a disclosure hierarchy consisting of three broad levels for financial statement purposes as follows: |
| | — | | Level 1 - unadjusted price quotations in active markets/exchanges for identical assets and liabilities that the Portfolio has the ability to access |
| | — | | Level 2 - other observable inputs (including, but not limited to, quoted prices for similar assets or liabilities in markets that are active, quoted prices for identical or similar assets or liabilities in markets that are not active, inputs other than quoted prices that are observable for the assets or liabilities (such as interest rates, yield curves, volatilities, prepayment speeds, loss severities, credit risks and default rates) or other market–corroborated inputs) |
| | — | | Level 3 - unobservable inputs based on the best information available in the circumstances, to the extent observable inputs are not available (including the Portfolio’s own assumptions used in determining the fair value of investments) |
See Notes to Financial Statements.
| | | | | | |
| | | | | | | |
| 20 | | BLACKROCK BALANCED CAPITAL FUND, INC. | | MARCH 31, 2013 | | |
| | |
| Schedule of Investments (concluded) | | Master Large Cap Core Portfolio |
The hierarchy gives the highest priority to unadjusted quoted prices in active markets for identical assets or liabilities (Level 1 measurements) and the lowest priority to unobservable inputs (Level 3 measurements). Accordingly, the degree of judgment exercised in determining fair value is greatest for instruments categorized in Level 3. The inputs used to measure fair value may fall into different levels of the fair value hierarchy. In such cases, for disclosure purposes, the level in the fair value hierarchy within which the fair value measurement falls in its entirety is determined based on the lowest level input that is significant to the fair value measurement in its entirety.
Changes in valuation techniques may result in transfers into or out of an assigned level within the disclosure hierarchy. In accordance with the Portfolio’s policy, transfers between different levels of the fair value disclosure hierarchy are deemed to have occurred as of the beginning of the reporting period. The categorization of a value determined for investments is based on the pricing transparency of the investment and is not necessarily an indication of the risks associated with investing in those securities. For information about the Portfolio’s policy regarding valuation of investments and other significant accounting policies, please refer to Note 1 of the Notes to Financial Statements.
The following table summarizes the Portfolio’s investments categorized in the disclosure hierarchy as of March 31, 2013:
| | | | | | | | | | | | | | |
| |
| | | Level 1 | | | Level 2 | | | Level 3 | | Total | |
| |
Assets: | | | | | | | | | | | | | | |
Investments: | | | | | | | | | | | | | | |
Long-Term Investments1 | | $ | 2,257,351,449 | | | | – | | | – | | $ | 2,257,351,449 | |
Short-Term Securities | | | 22,560,842 | | | $ | 15,023,875 | | | – | | | 37,584,717 | |
| |
| | | | |
Total | | $ | 2,279,912,291 | | | $ | 15,023,875 | | | – | | $ | 2,294,936,166 | |
| | | | |
1 See above Schedule of Investments for values in each industry.
Certain of the Portfolio’s liabilities are held at carrying amount, which approximates fair value for financial statement purposes. As of March 31, 2013, collateral on securities loaned at value of $15,023,875 is categorized as Level 2 within the disclosure hierarchy.
There were no transfers between levels during the period ended March 31, 2013.
See Notes to Financial Statements.
| | | | | | |
| | | | | | | |
| | BLACKROCK BALANCED CAPITAL FUND, INC. | | MARCH 31, 2013 | | 21 |
| | |
| Statement of Assets and Liabilities | | Master Large Cap Core Portfolio |
| | | | |
| March 31, 2013 (Unaudited) | | | |
| |
Assets | | | | |
| |
Investments at value – unaffiliated1,2 | | $ | 2,257,792,417 | |
Investments at value – affiliated3 | | | 37,143,749 | |
Investments sold receivable | | | 3,708,883 | |
Dividends receivable | | | 2,788,754 | |
Securities lending income receivable – affiliated | | | 2,647 | |
Prepaid expenses | | | 31,962 | |
| | | | |
Total assets | | | 2,301,468,412 | |
| | | | |
|
| |
Liabilities | | | | |
| |
Collateral on securities loaned at value | | | 15,023,875 | |
Withdrawals payable to investors | | | 1,432,709 | |
Investments purchased payable | | | 4,906,208 | |
Investment advisory fees payable | | | 906,337 | |
Directors’ fees payable | | | 13,451 | |
Other affiliates payable | | | 15,086 | |
Other accrued expenses payable | | | 266,938 | |
| | | | |
Total liabilities | | | 22,564,604 | |
| | | | |
Net Assets | | $ | 2,278,903,808 | |
| | | | |
|
| |
Net Assets Consist of | | | | |
| |
Investors’ capital | | $ | 1,780,183,642 | |
Net unrealized appreciation/depreciation | | | 498,720,166 | |
| | | | |
Net Assets | | $ | 2,278,903,808 | |
| | | | |
| |
1 Investments at cost – unaffiliated | | $ | 1,759,072,252 | |
2 Securities loaned at value | | $ | 14,806,262 | |
3 Investments at cost – affiliated | | $ | 37,143,749 | |
See Notes to Financial Statements.
| | | | |
| | | | | |
| 22 | | BLACKROCK BALANCED CAPITAL FUND, INC. | | MARCH 31, 2013 |
| | |
| Statement of Operations | | Master Large Cap Core Portfolio |
| | | | |
Six Months Ended March 31, 2013 (Unaudited) | | | |
| |
Investment Income | | | | |
| |
Dividends – unaffiliated | | $ | 22,317,958 | |
Foreign taxes withheld | | | (53,324) | |
Securities lending – affiliated – net | | | 11,443 | |
Dividends – affiliated | | | 10,394 | |
| | | | |
Total income | | | 22,286,471 | |
| | | | |
|
| |
Expenses | | | | |
| |
Investment advisory | | | 5,328,032 | |
Accounting services | | | 207,547 | |
Custodian | | | 53,134 | |
Professional | | | 35,310 | |
Directors | | | 31,723 | |
Printing | | | 4,482 | |
Miscellaneous | | | 18,089 | |
| | | | |
Total expenses excluding federal income tax | | | 5,678,317 | |
Federal income tax | | | 100 | |
| | | | |
Total expenses | | | 5,678,417 | |
Less fees waived by Manager | | | (5,581) | |
| | | | |
Total expenses after fees waived | | | 5,672,836 | |
| | | | |
Net investment income | | | 16,613,635 | |
| | | | |
|
| |
Realized and Unrealized Gain (Loss) | | | | |
| |
Net realized gain (loss) from: | | | | |
Investments | | | 132,801,231 | |
Foreign currency transactions | | | (18,284) | |
| | | | |
| | | 132,782,947 | |
| | | | |
Net change in unrealized appreciation/depreciation on investments | | | 78,655,682 | |
| | | | |
Total realized and unrealized gain | | | 211,438,629 | |
| | | | |
Net Increase in Net Assets Resulting from Operations | | $ | 228,052,264 | |
| | | | |
See Notes to Financial Statements.
| | | | | | |
| | | | | | | |
| | BLACKROCK BALANCED CAPITAL FUND, INC. | | MARCH 31, 2013 | | 23 |
| | |
| Statements of Changes in Net Assets | | Master Large Cap Core Portfolio |
| | | | | | | | |
Increase (Decrease) in Net Assets: | | Six Months Ended March 31, 2013 (Unaudited) | | | Year Ended September 30, 2012 | |
| |
Operations | | | | | | | | |
| |
Net investment income | | $ | 16,613,635 | | | $ | 40,780,497 | |
Net realized gain | | | 132,782,947 | | | | 115,001,657 | |
Net change in unrealized appreciation/depreciation | | | 78,655,682 | | | | 492,381,340 | |
| | | | |
Net increase in net assets resulting from operations | | | 228,052,264 | | | | 648,163,494 | |
| | | | |
|
| |
Capital Share Transactions | | | | | | | | |
| |
Proceeds from contributions | | | 89,026,973 | | | | 328,459,593 | |
Value of withdrawals | | | (357,026,182) | | | | (964,485,911) | |
| | | | |
Net decrease in net assets derived from capital share transactions | | | (267,999,209) | | | | (636,026,318) | |
| | | | |
|
| |
Net Assets | | | | | | | | |
| |
Total increase (decrease) in net assets | | | (39,946,945) | | | | 12,137,176 | |
Beginning of period | | | 2,318,850,753 | | | | 2,306,713,577 | |
| | | | |
End of period | | $ | 2,278,903,808 | | | $ | 2,318,850,753 | |
| | | | |
See Notes to Financial Statements.
| | | | |
| | | | | |
| 24 | | BLACKROCK BALANCED CAPITAL FUND, INC. | | MARCH 31, 2013 |
| | |
| Financial Highlights | | Master Large Cap Core Portfolio |
| | | | | | | | | | | | | | | | | | | | | | | | | | | | |
| | | Master Large Cap Core Portfolio | |
| | | Six Months Ended March 31, 2013 (Unaudited) | | | Year Ended September 30, | | | Period November 1, 2008 to September 30, 2009 | | | Year Ended
October 31, | |
| | | 2012 | | | 2011 | | | 2010 | | | | 2008 | | | 2007 | |
| |
Total Investment Return | | | | | | | | | | | | | | | | | | | | | | | | | | | | |
| |
Total investment return | | | 10.66% | 1 | | | 29.97% | | | | (1.61)% | | | | 6.16% | | | | 12.63% | 12 | | | (38.84)% | | | | 13.94% | |
| | | | |
|
| |
Ratios to Average Net Assets | | | | | | | | | | | | | | | | | | | | | | | | | | | | |
| |
Total expenses | | | 0.50% | 3 | | | 0.50% | | | | 0.49% | | | | 0.49% | | | | 0.50% | 3 | | | 0.50% | | | | 0.49% | |
| | | | |
Total expenses after fees waived | | | 0.50% | 3 | | | 0.50% | | | | 0.49% | | | | 0.49% | | | | 0.50% | 3 | | | 0.50% | | | | 0.49% | |
| | | | |
Net investment income | | | 1.47% | 3 | | | 1.67% | | | | 1.13% | | | | 1.11% | | | | 1.56% | 3 | | | 0.93% | | | | 0.63% | |
| | | | |
|
| |
Supplemental Data | | | | | | | | | | | | | | | | | | | | | | | | | | | | |
| |
Net assets, end of period (000) | | | $2,278,904 | | | | $2,318,851 | | | | $2,306,714 | | | | $3,209,486 | | | | $3,946,322 | | | | $2,843,515 | | | | $5,649,731 | |
| | | | |
Portfolio turnover | | | 29% | | | | 128% | | | | 129% | | | | 173% | | | | 168% | | | | 109% | | | | 96% | |
| | | | |
| | 1 | Aggregate total investment return. |
| | 2 | Includes proceeds received from a settlement of litigation, which impacted the Portfolio’s total investment return. Not including these proceeds, the Portfolio’s total investment return would have been 12.39%. |
See Notes to Financial Statements.
| | | | | | |
| | | | | | | |
| | BLACKROCK BALANCED CAPITAL FUND, INC. | | MARCH 31, 2013 | | 25 |
| | |
Notes to Financial Statements (Unaudited) | | Master Large Cap Core Portfolio |
1. Organization and Significant Accounting Policies:
Master Large Cap Core Portfolio (the “Portfolio”) is a series of Master Large Cap Series LLC (the “Master LLC”). The Master LLC is registered under the Investment Company Act of 1940, as amended (the “1940 Act”), as an open-end management investment company and is organized as a Delaware limited liability company. The Portfolio is classified as diversified. The Limited Liability Company Agreement permits the Board of Directors of the Master LLC (the “Board”) to issue nontransferable interests in the Master LLC, subject to certain limitations. The Portfolio’s financial statements are prepared in conformity with accounting principles generally accepted in the United States of America (“US GAAP”), which may require management to make estimates and assumptions that affect the reported amounts of assets and liabilities in the financial statements and the reported amount of increases and decreases in net assets from operations during the reporting period. Actual results could differ from those estimates.
The following is a summary of significant accounting policies followed by the Portfolio:
Valuation: US GAAP defines fair value as the price the Portfolio would receive to sell an asset or pay to transfer a liability in an orderly transaction between market participants at the measurement date. The Portfolio determines the fair value of their financial instruments at market value using independent dealers or pricing services under policies approved by the Board. The BlackRock Global Valuation Methodologies Committee (the “Global Valuation Committee”) is the committee formed by management to develop global pricing policies and procedures and to provide oversight of the pricing function for the Portfolio for all financial instruments.
Equity investments traded on a recognized securities exchange or the NASDAQ Global Market System (“NASDAQ”) are valued at the last reported sale price that day or the NASDAQ official closing price, if applicable. For equity investments traded on more than one exchange, the last reported sale price on the exchange where the stock is primarily traded is used. Equity investments traded on a recognized exchange for which there were no sales on that day are valued at the last available bid (long positions) or ask (short positions) price. If no bid or ask price is available, the prior day’s price will be used, unless it is determined that such prior day’s price no longer reflects the fair value of the security. Investments in open-end registered investment companies are valued at NAV each business day. Short-term securities with remaining maturities of 60 days or less may be valued at amortized cost, which approximates fair value.
The Portfolio values its investments in BlackRock Liquidity Series, LLC Money Market Series (the “Money Market Series”) at fair value, which is ordinarily based upon their pro rata ownership in the underlying fund’s net assets. The Money Market Series seeks current income consistent with maintaining liquidity and preserving capital. Although the Money Market Series is not registered under the 1940 Act, its investments will follow the parameters of investments by a money market fund that is subject to Rule 2a-7 under the 1940 Act. The Portfolio may withdraw up to 25% of its investment daily, although the manager of the Money Market
Series, in its sole discretion, may permit an investor to withdraw more than 25% on any one day.
In the event that application of these methods of valuation results in a price for an investment which is deemed not to be representative of the market value of such investment or if a price is not available, the investment will be valued by the Global Valuation Committee, or its delegate, in accordance with a policy approved by the Board as reflecting fair value (“Fair Value Assets”). When determining the price for Fair Value Assets, the Global Valuation Committee, or its delegate, seeks to determine the price that the Portfolio might reasonably expect to receive from the current sale of that asset in an arm’s-length transaction. Fair value determinations shall be based upon all available factors that the Global Valuation Committee, or its delegate, deem relevant consistent with the principles of fair value measurement which include the market approach, income approach and/or in the case of recent investments, the cost approach, as appropriate. A market approach generally consists of using comparable market transactions. The income approach generally is used to discount future cash flows to present value and adjusted for liquidity as appropriate. These factors include but are not limited to (i) attributes specific to the investment or asset; (ii) the principal market for the investment or asset; (iii) the customary participants in the principal market for the investment or asset; (iv) data assumptions by market participants for the investment or asset, if reasonably available; (v) quoted prices for similar investments or assets in active markets; and (vi) other factors, such as future cash flows, interest rates, yield curves, volatilities, prepayment speeds, loss severities, credit risks, recovery rates, liquidation amounts and/or default rates. Due to the inherent uncertainty of valuations of such investments, the fair values may differ from the values that would have been used had an active market existed. The Global Valuation Committee, or its delegate, employs various methods for calibrating valuation approaches for investments where an active market does not exist including regular due diligence of the Portfolio’s pricing vendors, a regular review of key inputs and assumptions, transactional back-testing or disposition analysis to compare unrealized gains and losses to realized gains and losses, reviews of missing or stale prices and large movements in market values and reviews of any market related activity. The pricing of all Fair Value Assets is subsequently reported to the Board or a committee thereof on a quarterly basis.
Foreign Currency: The Portfolio’s books and records are maintained in US dollars. Purchases and sales of investment securities are recorded at the rates of exchange prevailing on the respective date of such transactions. Generally, when the US dollar rises in value against a foreign currency, the Portfolio’s investments denominated in that currency will lose value because that currency is worth fewer US dollars; the opposite effect occurs if the US dollar falls in relative value.
The Portfolio does not isolate the portion of the results of operations arising as a result of changes in the foreign exchange rates from the changes in the market prices of investments held or sold for financial reporting purposes. Accordingly, the effects of changes in foreign currency exchange rates on investments are not segregated in the Statement of Operations from the effects of changes in market prices of those investments but are included as a component of net realized and unrealized gain (loss) from investments. The Portfolio reports realized currency
| | | | |
| | | | | |
| 26 | | BLACKROCK BALANCED CAPITAL FUND, INC. | | MARCH 31, 2013 |
| | |
| Notes to Financial Statements (continued) | | Master Large Cap Core Portfolio |
gains (losses) on foreign currency related transactions as components of net realized gain (loss) for financial reporting purposes, whereas such components are treated as ordinary income for federal income tax purposes.
Segregation and Collateralization: In cases in which the 1940 Act and the interpretive positions of the Securities and Exchange Commission (“SEC”) require that the Portfolio either delivers collateral or segregate assets in connection with certain investments (e.g., foreign currency exchange contracts), the Portfolio will, consistent with SEC rules and/or certain interpretive letters issued by the SEC, segregate collateral or designate on its books and records cash or liquid securities having a market value at least equal to the amount that would otherwise be required to be physically segregated. Furthermore, based on requirements and agreements with certain exchanges and third party broker-dealers, each party to the Portfolio engaging in such transactions may have requirements to deliver/deposit securities to/with an exchange or broker-dealer as collateral for certain investments.
Investment Transactions and Investment Income: For financial reporting purposes, investment transactions are recorded on the dates the transactions are entered into (the trade dates). Realized gains and losses on investment transactions are determined on the identified cost basis. Dividend income is recorded on the ex-dividend dates. Dividends from foreign securities where the ex-dividend date may have passed are subsequently recorded when the Portfolio is informed of the ex-dividend date. Under the applicable foreign tax laws, a withholding tax at various rates may be imposed on capital gains, dividends and interest. Upon notification from issuers, some of the dividend income received from a real estate investment trust may be redesignated as a reduction of cost of the related investment and/or realized gain. Interest income, including amortization and accretion of premiums and discounts on debt securities, is recognized on the accrual basis.
Securities Lending: The Portfolio may lend securities to approved borrowers, such as banks, brokers and other financial institutions. The borrower pledges cash, securities issued or guaranteed by the US government or irrevocable letters of credit issued by a bank as collateral. The initial collateral received by the Portfolio has a value of at least 102% of the current value of the loaned securities for securities traded on U.S. exchanges and a value of at least 105% for all other securities. The collateral is maintained thereafter at all times in an amount equal to at least 100% of the current market value of the loaned securities. The market value of the loaned securities is determined at the close of business of the Portfolio and any additional required collateral is delivered to the Portfolio on the next business day. Securities lending income, as disclosed in the Statements of Operations, represents the income earned from the investment of the cash collateral, net of rebates paid to, or fees paid by, borrowers and less the fees paid to the securities lending agent. During the term of the loan, the Portfolio earns dividend or interest income on the securities loaned but do not receive interest income on the securities received as collateral. Loans of securities are terminable at any time and the borrower, after notice, is required to return borrowed securities within the standard time period for settlement of securities transactions. The risks of securities lending include the risk that the borrower may not provide additional collateral when required or
may not return the securities when due. To mitigate this risk, the Portfolio benefits from a borrower default indemnity provided by BlackRock, Inc. (“BlackRock”). BlackRock’s indemnity allows for full replacement of securities lent. The Portfolio also could suffer a loss if the value of an investment purchased with cash collateral falls below the market value of loaned securities or if the value of an investment purchased with cash collateral falls below the value of the original cash collateral received. During the six months ended March 31, 2013, any securities on loan were collateralized by cash.
Income Taxes: The Portfolio is classified as a partnership for federal income tax purposes. As such, each investor in the Portfolio is treated as the owner of its proportionate share of net assets, income, expenses and realized and unrealized gains and losses of the Portfolio. Therefore, no federal income tax provision is required. It is intended that the Portfolio’s assets will be managed so an investor in the Portfolio can satisfy the requirements of Subchapter M of the Internal Revenue Code of 1986, as amended.
The Portfolio files US federal and various state and local tax returns. No income tax returns are currently are currently under examination. The statute of limitations on the Portfolio’s US federal tax returns remains open for each of the three years ended September 30, 2012 and the period ended September 30, 2009. The statutes of limitations on the Portfolio’s state and local tax returns may remain open for an additional year depending upon the jurisdiction. Management does not believe there are any uncertain tax positions that require recognition of a tax liability.
Recent Accounting Standards: In December 2011, the Financial Accounting Standards Board (the “FASB”) issued guidance that will expand current disclosure requirements on the offsetting of certain assets and liabilities. The new disclosures will be required for investments and derivative financial instruments subject to master netting or similar agreements which are eligible for offset in the Statements of Assets and Liabilities and will require an entity to disclose both gross and net information about such investments and transactions in the financial statements. In January 2013, the FASB issued guidance that clarifies which investments and transactions are subject to the offsetting disclosure requirements. The scope of the disclosure requirements for offsetting will be limited to derivative instruments, repurchase agreements and reverse repurchase agreements, and securities borrowing and securities lending transactions. The guidance is effective for financial statements with fiscal years beginning on or after January 1, 2013, and interim periods within those fiscal years. Management is evaluating the impact of this guidance on the Portfolio’s financial statement disclosures.
Other: Expenses directly related to the Portfolio are charged to the Portfolio. Other operating expenses shared by several funds are pro rated among those funds on the basis of relative net assets or other appropriate methods.
The Portfolio has an arrangement with the custodian whereby fees may be reduced by credits earned on uninvested cash balances, which, if
| | | | | | |
| | | | | MARCH 31, 2013 | | |
| | BLACKROCK BALANCED CAPITAL FUND, INC. | | | 27 |
| | |
| Notes to Financial Statements (continued) | | Master Large Cap Core Portfolio |
applicable, are shown as fees paid indirectly in the Statement of Operations. The custodian imposes fees on overdrawn cash balances, which can be offset by accumulated credits earned or may result in additional custody charges.
2. Derivative Financial Instruments:
The Portfolio engages in various portfolio investment strategies using derivative contracts both to increase the returns of the Portfolio and/or to economically hedge, or protect, its exposure to certain risks such as equity risk, interest rate risk and foreign currency exchange rate risk. These contracts may be transacted on an exchange or over-the-counter (“OTC”).
Losses may arise if the value of the contract decreases due to an unfavorable change in the market rates or values of the underlying instrument or if the counterparty does not perform under the contract. The Portfolio’s maximum risk of loss from counterparty credit risk on OTC derivatives is generally the aggregate unrealized gain netted against any collateral pledged by the counterparty.
The Portfolio may mitigate counterparty risk by procuring collateral and through netting provisions included within an International Swaps and Derivatives Association, Inc. master agreement (“ISDA Master Agreement”) implemented between the Portfolio and each of its respective counterparties. An ISDA Master Agreement allows the Portfolio to offset with each separate counterparty certain derivative financial instrument’s payables and/or receivables with collateral held. The amount of collateral moved to/from applicable counterparties is generally based upon minimum transfer amounts of up to $500,000. To the extent amounts due to the Portfolio from their counterparties are not fully collateralized, contractually or otherwise, the Portfolio bears the risk of loss from counterparty non-performance. See Note 1 “Segregation and Collateralization” for information with respect to collateral practices. In addition, the Portfolio manages counterparty risk by entering into agreements only with counterparties that it believes have the financial resources to honor their obligations and by monitoring the financial stability of those counterparties.
Certain ISDA Master Agreements allow counterparties to OTC derivatives to terminate derivative contracts prior to maturity in the event the Portfolio’s net assets decline by a stated percentage or the Portfolio fails to meet the terms of its ISDA Master Agreements, which would cause the Portfolio to accelerate payment of any net liability owed to the counterparty.
Foreign Currency Exchange Contracts: The Portfolio enters into foreign currency exchange contracts as an economic hedge against either specific transactions or portfolio instruments or to obtain exposure to foreign currencies (foreign currency exchange rate risk). A foreign currency exchange contract is an agreement between two parties to buy and sell a currency at a set exchange rate on a future date. Foreign currency exchange contracts, when used by the Portfolio, help to manage the overall exposure to the currencies in which some of the investments held by the Portfolio are denominated. The contract is marked-to-market daily and the change in market value is recorded by the Portfolio as an unrealized gain or loss. When the contract is closed, the Portfolio records a
realized gain or loss equal to the difference between the value at the time it was opened and the value at the time it was closed. The use of foreign currency exchange contracts involves the risk that the value of a foreign currency exchange contract changes unfavorably due to movements in the value of the referenced foreign currencies and the risk that the counterparty to the contract does not perform its obligations under the agreement.
Derivative Financial Instruments Categorized by Risk Exposure:
| | | | |
| | |
The Effect of Derivative Financial Instruments in the Statements of Operations Six Months Ended March 31, 2013 |
| | |
| | | Net Realized Gain (Loss) From | | |
| | |
Foreign currency exchange contracts: | | | | |
Foreign currency exchange contracts | | $(18,377) | | |
| | | | |
3. Investment Advisory Agreement and Other Transactions with Affiliates:
The PNC Financial Services Group, Inc. (“PNC”) is the largest stockholder and an affiliate, for 1940 Act purposes, of BlackRock.
The Master LLC, on behalf of the Portfolio, entered into an Investment Advisory Agreement with BlackRock Advisors, LLC (the “Manager”), the Portfolio’s investment advisor, an indirect, wholly owned subsidiary of BlackRock, to provide investment advisory and administration services. The Manager is responsible for the management of the Portfolio and provides the necessary personnel, facilities, equipment and certain other services necessary to the operations of the Portfolio. For such services, the Portfolio pays the Manager a monthly fee based on a percentage of the Portfolio’s average daily net assets at the following annual rates:
| | | | |
| |
| Average Daily Net Assets | | Rate | |
| |
Not exceeding $1 Billion | | | 0.50 | % |
In excess of $1 Billion, but not exceeding $5 Billion | | | 0.45 | % |
In excess of $5 Billion | | | 0.40 | % |
| |
The Manager voluntarily agreed to waive its investment advisory fees by the amount of investment advisory fees the Portfolio pays to the Manager indirectly through its investment in affiliated money market funds. However, the Manager does not waive its investment advisory fees by the amount of investment advisory fees paid in connection with the Portfolio’s investment in other affiliated investment companies, if any. These amounts are included in fees waived by Manager in the Statement of Operations.
The Manager entered into a sub-advisory agreement with BlackRock Investment Management LLC (“BIM”), an affiliate of the Manager. The Manager pays BIM, for services it provides, a monthly fee that is a percentage of the investment advisory fees paid by the Portfolio to the Manager.
For the six months ended March 31, 2013, the Portfolio reimbursed the Manager $13,284 for certain accounting services, which is included in accounting services in the Statements of Operations.
| | | | | | |
| | | | | | | |
| 28 | | BLACKROCK BALANCED CAPITAL FUND, INC. | | MARCH 31, 2013 | | |
| | |
Notes to Financial Statements (concluded) | | Master Large Cap Core Portfolio |
The Portfolio received an exemptive order from the SEC permitting it, among other things, to pay an affiliated securities lending agent a fee based on a share of the income derived from the securities lending activities and has retained BIM as the securities lending agent. BIM may, on behalf of the Portfolio, invest cash collateral received by the Portfolio for such loans in a private investment company managed by the Manager or in registered money market funds advised by the Manager or its affiliates. The market value of securities on loan and the value of the related collateral, if applicable, is shown in the Statement of Assets and Liabilities as securities loaned at value and collateral on securities loaned at value, respectively. The cash collateral invested by BIM, if any, is disclosed in the Schedule of Investments. Securities lending income is equal to the total of income earned from the reinvestment of cash collateral, net of rebates paid to, or fees paid by, borrowers of securities. The Portfolio retains 65% of securities lending income and pay a fee to BIM equal to 35% of such income. The Portfolio benefits from a borrower default indemnity provided by BlackRock. As a securities lending agent, BIM bears all operational costs directly related to securities lending as well as the cost of the borrower default indemnification. BIM does not receive any fees for managing cash collateral. The share of income earned by the Portfolio on the reinvestment of cash collateral is shown as securities lending – affiliated – net in the Statement of Operations. For the six months ended March 31, 2013, BIM received $7,305 in securities lending agent fees related to securities lending activities for the Portfolio.
Certain officers and/or directors of the Master LLC are officers and/or directors of BlackRock or its affiliates.
4. Investments:
Purchases and sales of investments, excluding short-term securities, for the six months ended March 31, 2013, were $643,917,891 and $869,655,664, respectively.
5. Borrowings:
The Master LLC, on behalf of the Portfolio, along with certain other funds managed by the Manager and its affiliates, is a party to a $500 million credit agreement with a group of lenders. The Portfolio may borrow under the credit agreement to fund shareholder redemptions. Effective November 2011 to November 2012, the credit agreement had the following terms: a commitment fee of 0.065% per annum based on the Portfolio’s pro rata share of the unused portion of the credit agreement and interest at a rate equal to the higher of (a) the one-month London Interbank Offered Rate (“LIBOR”) plus 0.80% per annum or (b) the Fed Funds rate plus 0.80% per annum on amounts borrowed. In addition, the Portfolio paid administration and arrangement fees which were allocated to the Portfolio based on its net assets as of October 31, 2011. The credit agreement, which expired in November 2012, was renewed with the same terms until November 2013. Effective November 2012 to November 2013, the credit agreement has the following terms: a commitment fee of 0.065% per annum based on the Portfolio’s pro rata share of the unused portion of the credit agreement and interest at a rate equal to the higher of (a) the one-month LIBOR plus 0.80% per annum or (b) the Fed Funds rate plus 0.80% per annum on amounts borrowed. In addition,
the Portfolio paid administration and arrangement fees which were allocated to the Portfolio based on its net assets as of October 31, 2012. The Portfolio did not borrow under the credit agreement during the six months ended March 31, 2013.
6. Concentration, Market and Credit Risk:
In the normal course of business, the Portfolio invests in securities and enters into transactions where risks exist due to fluctuations in the market (market risk) or failure of the issuer of a security to meet all its obligations (issuer credit risk). The value of securities held by the Portfolio may decline in response to certain events, including those directly involving the issuers whose securities are owned by the Portfolio; conditions affecting the general economy; overall market changes; local, regional or global political, social or economic instability; and currency and interest rate and price fluctuations. Similar to issuer credit risk, the Portfolio may be exposed to counterparty credit risk, or the risk that an entity with which the Portfolio has unsettled or open transactions may fail to or be unable to perform on its commitments. The Portfolio manages counterparty credit risk by entering into transactions only with counterparties that it believes have the financial resources to honor their obligations and by monitoring the financial stability of those counterparties. Financial assets, which potentially expose the Portfolio to market, issuer and counterparty credit risks, consist principally of financial instruments and receivables due from counterparties. The extent of the Portfolio’s exposure to market, issuer and counterparty credit risks with respect to these financial assets is generally approximated by their value recorded in the Statement of Assets and Liabilities, less any collateral held by the Portfolio.
As of March 31, 2013, the Portfolio invested a significant portion of its assets in securities in the information technology and financials sectors. Changes in economic conditions affecting the information technology and financials sectors would have a greater impact on the Fund and could affect the value, income and/or liquidity of positions in such securities.
7. Subsequent Events
Management’s evaluation of the impact of all subsequent events on the Portfolio’s financial statements was completed through the date the financial statements were issued and the following item was noted:
Effective April 25, 2013, the credit agreement was terminated and a new agreement was entered into. The Portfolio became a party to a 364- day, $800 million credit agreement, which expires in April 2014. Excluding commitments designated for a certain individual fund, the Portfolio can borrow up to an aggregate commitment amount of $500 million, subject to asset coverage and other limitations as specified in the agreement. The credit agreement has the following terms: a fee of 0.065% per annum on unused commitment amounts and interest at a rate equal to the higher of (a) the one-month LIBOR plus 0.80% per annum or (b) the Fed Funds rate plus 0.80% per annum on amounts borrowed.
| | | | | | |
| | | | | | | |
| | BLACKROCK BALANCED CAPITAL FUND, INC. | | MARCH 31, 2013 | | 29 |
Officers and Directors of Master Large Cap Series LLC
| | |
Robert W. Forbes, Co-Chairman of the Board and Director Rodney D. Johnson, Co-Chairman of the Board and Director Paul L. Audet, Director David O. Beim, Director Henry Gabbay, Director Dr. Martina S. Horner, Director Herbert I. London, Director Ian A. MacKinnon, Director Cynthia A. Montgomery, Director Joseph P. Platt, Director Robert C. Robb, Jr., Director Toby Rosenblatt, Director Kenneth L. Urish, Director Frederick W. Winter, Director John M. Perlowski, President and Chief Executive Officer Brendan Kyne, Vice President Neal Andrews, Chief Financial Officer Jay Fife, Treasurer Brian Kindelan, Chief Compliance Officer and Anti-Money Laundering Officer Benjamin Archibald, Secretary | | Investment Advisor BlackRock Advisors, LLC Wilmington, DE 19809 Sub-Advisor BlackRock Investment Management, LLC Princeton, NJ 08540 Accounting Agent and Transfer Agent BNY Mellon Investment Servicing (US) Inc. Wilmington, DE 19809 Custodian Brown Brothers Harriman & Co. Boston, MA 02109 Distributor BlackRock Investments, LLC New York, NY 10022 Legal Counsel Sidley Austin LLP New York, NY 10019 Independent Registered Public Accounting Firm Deloitte & Touche LLP Philadelphia, PA 19103 Address of the Fund 100 Bellevue Parkway Wilmington, DE 19809 |
| | | | | | |
| | | | | | | |
| 30 | | BLACKROCK BALANCED CAPITAL FUND, INC. | | MARCH 31, 2013 | | |
| | |
Master Portfolio Information | | Master Total Return Portfolio |
| | |
| Portfolio Composition | | Percent of Long-Term Investments |
|
U.S. Government Sponsored Agency Securities | | 41% |
Corporate Bonds | | 17 |
U.S. Treasury Obligations | | 13 |
Non-Agency Mortgage-Backed Securities | | 9 |
Asset-Backed Securities | | 9 |
Foreign Government Obligations | | 6 |
Foreign Agency Obligations | | 2 |
Floating Rate Loan Interests | | 2 |
Preferred Securities | | 1 |
|
| | |
| Credit Quality Allocation1 | | Percent of Long-Term Investments |
|
AAA/Aaa2 | | 62% |
AA/Aa | | 4 |
A | | 9 |
BBB/Baa | | 9 |
BB/Ba | | 4 |
B | | 3 |
CCC/Caa | | 1 |
Not Rated | | 8 |
|
| | |
| 1 | | Using the higher of Standard & Poor’s (“S&P’s”) or Moody’s Investor Service ratings. |
| 2 | | Includes US Government Sponsored Agency Securities and US Treasury Obligations which are deemed AAA/Aaa by the investment advisor. |
| | | | | | |
| | | | | | | |
| | BLACKROCK BALANCED CAPITAL FUND, INC. | | MARCH 31, 2013 | | 31 |
| | |
| Consolidated Schedule of Investments March 31, 2013 (Unaudited) | | Master Total Return Portfolio (Percentages shown are based on Net Assets) |
| | | | | | | | | | |
| Asset-Backed Securities | | | | Par (000) | | | Value | |
| |
ACE Securities Corp. Home Equity Loan Trust: | | | | | | | | | | |
Series 2003-OP1, Class A2, 0.92%, 12/25/33 (a) | | USD | | | 581 | | | $ | 518,083 | |
Series 2006-CW1, Class A2C, 0.34%, 7/25/36 (a) | | | | | 1,605 | | | | 1,056,445 | |
Alm Loan Funding, Series 2012-7A, Class A1, 1.72%, 10/19/24 (a)(b) | | | | | 9,870 | | | | 9,889,740 | |
AmeriCredit Automobile Receivables Trust: | | | | | | | | | | |
Series 2011-5, Class C, 3.44%, 10/08/17 | | | | | 4,050 | | | | 4,240,289 | |
Series 2012-2, Class C, 2.64%, 10/10/17 | | | | | 3,080 | | | | 3,174,168 | |
Series 2012-3, Class C, 2.42%, 5/08/18 | | | | | 2,880 | | | | 2,963,742 | |
Series 2012-4, Class B, 1.31%, 11/08/17 | | | | | 1,825 | | | | 1,835,430 | |
Series 2012-4, Class C, 1.93%, 8/08/18 | | | | | 2,865 | | | | 2,902,219 | |
Series 2012-5, Class C, 1.69%, 11/08/18 | | | | | 3,440 | | | | 3,468,807 | |
ARES CLO Ltd., Series 2012-2A, Class B1, 3.43%, 10/12/23 (a)(b) | | | | | 3,015 | | | | 3,041,532 | |
AUTO ABS, Series 2012-2, Class A, 2.80%, 4/27/25 | | EUR | | | 5,456 | | | | 7,079,127 | |
Bear Stearns Asset-Backed Securities I Trust, Series 2006-HE10, Class 21A1, 0.27%, 12/25/36 (a) | | USD | | | 1,493 | | | | 1,453,133 | |
BlueMountain CLO Ltd., Series 2012-2A, Class B1, 2.37%, 11/20/24 (a)(b) | | | | | 3,150 | | | | 3,150,000 | |
Capital Auto Receivables Asset Trust, Series 2013-1, Class B, 1.29%, 4/20/18 | | | | | 3,660 | | | | 3,657,211 | |
Capital Auto Receivables Asset Trust 2013-1, Series 2013-1, Class D, 2.19%, 9/20/21 | | | | | 6,420 | | | | 6,411,699 | |
Capital One Multi-Asset Execution Trust, Series 2004-3C, Class 3C, 6.63%, 4/19/17 (a) | | GBP | | | 3,400 | | | | 5,422,322 | |
Carlyle Global Market Strategies CLO Ltd., Series 2012-4A, Class A, 1.78%, 1/20/25 (a)(b) | | USD | | | 13,730 | | | | 13,730,000 | |
CarMax Auto Owner Trust, Series 2012-1, Class D, 3.09%, 8/15/18 | | | | | 1,430 | | | | 1,478,068 | |
Cavalry CLO Ltd., Series 2A, Class B1, 2.38%, 1/17/24 (a)(b) | | | | | 7,090 | | | | 7,019,100 | |
Chesapeake Funding LLC: | | | | | | | | | | |
Series 2012-1A, Class B, 1.80%, 11/07/23 (a)(b) | | | | | 2,630 | | | | 2,653,978 | |
Series 2012-1A, Class C, 2.20%, 11/07/23 (a)(b) | | | | | 1,690 | | | | 1,705,342 | |
CIFC Funding Ltd.: | | | | | | | | | | |
Series 2012-3A, Class A1L, 1.72%, 1/29/25 (a)(b) | | | | | 5,000 | | | | 5,000,000 | |
Series 2012-3A, Class A2L, 2.59%, 1/29/25 (a)(b) | | | | | 4,480 | | | | 4,502,400 | |
Countrywide Asset-Backed Certificates: | | | | | | | | | | |
Series 2003-BC3, Class A2, 0.82%, 9/25/33 (a) | | | | | 672 | | | | 628,119 | |
| | | | | | | | | | |
| Asset-Backed Securities | | | | Par (000) | | | Value | |
| |
Series 2004-5, Class A, 1.10%, 10/25/34 (a) | | USD | | | 752 | | | $ | 738,820 | |
Series 2006-17, Class 2A2, 0.35%, 3/25/47 (a) | | | | | 912 | | | | 766,940 | |
Series 2007-12, Class 2A1, 0.55%, 8/25/47 (a) | | | | | 18 | | | | 17,692 | |
Credit Acceptance Auto Loan Trust, Series 2012-2A, Class A, 1.52%, 3/16/20 (b) | | | | | 4,165 | | | | 4,191,277 | |
CT CDO IV Ltd., Series 2006-4A, Class A1, 0.51%, 10/20/43 (a)(b) | | | | | 4,539 | | | | 4,212,565 | |
DT Auto Owner Trust: | | | | | | | | | | |
Series 2011-3A, Class C, 4.03%, 2/15/17 (b) | | | | | 2,460 | | | | 2,499,633 | |
Series 2012-1A, Class B, 2.26%, 10/16/17 (b) | | | | | 2,700 | | | | 2,714,855 | |
Series 2012-1A, Class C, 3.38%, 10/16/17 (b) | | | | | 1,780 | | | | 1,802,985 | |
Series 2012-1A, Class D, 4.94%, 7/16/18 (b) | | | | | 3,885 | | | | 4,007,498 | |
Series 2012-2A, Class B, 1.85%, 4/17/17 (b) | | | | | 530 | | | | 531,862 | |
Series 2012-2A, Class C, 2.72%, 4/17/17 (b) | | | | | 200 | | | | 202,629 | |
ECP CLO Ltd., Series 2012-4A, Class A1, 1.63%, 6/19/24 (a)(b) | | | | | 4,910 | | | | 4,922,422 | |
Fannie Mae REMIC Trust, Series 2003-W5, Class A, 0.42%, 4/25/33 (a) | | | | | 8 | | | | 7,382 | |
Ford Credit Floorplan Master Owner Trust: | | | | | | | | | | |
Series 2010-5, Class D, 2.41%, 9/15/15 (b) | | | | | 1,620 | | | | 1,628,304 | |
Series 2011-2, Class C, 2.37%, 9/15/15 | | | | | 3,860 | | | | 3,881,743 | |
Series 2011-2, Class D, 2.86%, 9/15/15 | | | | | 2,685 | | | | 2,704,968 | |
Series 2012-1, Class C, 1.70%, 1/15/16 (a) | | | | | 4,380 | | | | 4,408,404 | |
Series 2012-1, Class D, 2.30%, 1/15/16 (a) | | | | | 4,100 | | | | 4,124,850 | |
Series 2012-2, Class C, 2.86%, 1/15/19 | | | | | 1,030 | | | | 1,080,895 | |
Series 2012-2, Class D, 3.50%, 1/15/19 | | | | | 1,820 | | | | 1,917,952 | |
Series 2012-4, Class C, 1.39%, 9/15/16 | | | | | 2,125 | | | | 2,136,216 | |
Series 2012-4, Class D, 2.09%, 9/15/16 | | | | | 3,710 | | | | 3,729,689 | |
GoldenTree Loan Opportunities VII Ltd., Series 2013-7A, Class A, 1.43%, 4/25/25 (a)(b) | | | | | 5,810 | | | | 5,762,794 | |
GSAA Home Equity Trust, Series 2006-5, Class 2A1, 0.27%, 3/25/36 (a) | | | | | 29 | | | | 16,443 | |
HLSS Servicer Advance Receivables Backed Notes: | | | | | | | | | | |
Series 2012-T2, Class A1, 1.34%, 10/15/43 (b) | | | | | 1,535 | | | | 1,538,837 | |
| | | | | | | | | | |
| To simplify the listings of portfolio holdings in the Consolidated Schedules of Investments, the names and descriptions of many of the securities have been abbreviated according to the following list: | | | | AUD | | Australian Dollar | | KRW | | South Korean Won |
| | | | CAD | | Canadian Dollar | | LIBOR | | London Interbank Offered Rate |
| | | | CHF | | Swiss Franc | | MXN | | Mexican Peso |
| | | | CNY | | Chinese Yuan | | NOK | | Norwegian Krone |
| | | | EUR | | Euro | | RB | | Revenue Bonds |
| | | | FKA | | Formerly Known As | | SEK | | Swedish Krona |
| | | | GBP | | British Pound | | TBA | | To-be-announced |
| | | | JPY | | Japanese Yen | | USD | | US Dollar |
See Notes to Consolidated Financial Statements.
| | | | | | |
| | | | | | | |
| 32 | | BLACKROCK BALANCED CAPITAL FUND, INC. | | MARCH 31, 2013 | | |
| | |
| Consolidated Schedule of Investments (continued) | | Master Total Return Portfolio (Percentages shown are based on Net Assets) |
| | | | | | | | | | |
| Asset-Backed Securities | | | | Par (000) | | | Value | |
| |
Series 2012-T2, Class A2, 1.99%, 10/15/45 (b) | | USD | | | 3,135 | | | $ | 3,195,819 | |
Series 2013-T1, Class A2, 1.50%, 1/16/46 (b) | | | | | 11,230 | | | | 11,306,364 | |
Series 2013-T1, Class B2, 1.74%, 1/16/46 (b) | | | | | 1,000 | | | | 1,003,750 | |
Home Equity Asset Trust, Series 2007-2, Class 2A1, 0.31%, 7/25/37 (a) | | | | | 26 | | | | 25,592 | |
Hyundai Auto Receivables Trust, Series 2012-A, Class D, 2.61%, 5/15/18 | | | | | 2,555 | | | | 2,609,396 | |
ING Investment Management Co.: | | | | | | | | | | |
Series 2012-2A, Class A, 1.83%, 10/15/22 (a)(b) | | | | | 7,045 | | | | 7,071,771 | |
Series 2012-3A, Class A, 1.75%, 10/15/22 (a)(b) | | | | | 12,895 | | | | 12,920,790 | |
JG Wentworth XX LLC, Series 2010-1A, Class A, 5.56%, 7/15/59 (b) | | | | | 7,753 | | | | 9,167,177 | |
JG Wentworth XXI LLC, Series 2010-2A, Class A, 4.07%, 1/15/48 (b) | | | | | 3,826 | | | | 4,219,498 | |
JG Wentworth XXII LLC, Series 2010-3A, Class A, 3.82%, 12/15/48 (b) | | | | | 7,478 | | | | 8,088,019 | |
JGWPT XXVII LLC, Series 2012-3A, Class A, 3.22%, 9/15/65 (b) | | | | | 4,222 | | | | 4,295,176 | |
KKR Financial CLO Corp., Series 2007-AA, Class A, 1.03%, 10/15/17 (a)(b) | | | | | 9,087 | | | | 9,029,737 | |
Morgan Stanley ABS Capital I, Inc. Trust, Series 2005-HE1, Class A2MZ, 0.80%, 12/25/34 (a) | | | | | 820 | | | | 784,493 | |
Nelnet Student Loan Trust: | | | | | | | | | | |
Series 2006-1, Class A5, 0.40%, 8/23/27 (a) | | | | | 6,505 | | | | 6,378,588 | |
Series 2008-3, Class A4, 1.94%, 11/25/24 (a) | | | | | 5,600 | | | | 5,961,922 | |
New Century Home Equity Loan Trust, Series 2005-2, Class A2MZ, 0.46%, 6/25/35 (a) | | | | | 2,543 | | | | 2,523,812 | |
Northwoods Capital Corp./Northwoods Capital Ltd.: | | | | | | | | | | |
Series 2012-9A, Class A, 1.79%, 1/18/24 (a)(b) | | | | | 4,300 | | | | 4,305,375 | |
Series 2012-9A, Class B1, 2.62%, 1/18/24 (a)(b) | | | | | 4,090 | | | | 4,090,000 | |
Option One Mortgage Acceptance Corp. Asset Back Certificates, Series 2003-4, Class A2, 0.84%, 7/25/33 (a) | | | | | 1,398 | | | | 1,280,269 | |
OZLM Funding Ltd., Series 2012-2A, Class A1, 2.21%, 10/30/23 (a)(b) | | | | | 7,530 | | | | 7,673,070 | |
PFS Financing Corp., Series 2012-AA, Class A, 1.40%, 2/15/16 (a)(b) | | | | | 4,400 | | | | 4,428,741 | |
RAAC Trust, Series 2005-SP2, Class 2A, 0.50%, 6/25/44 (a) | | | | | 5,346 | | | | 4,668,854 | |
RASC Trust, Series 2003-KS5, Class AIIB, 0.78%, 7/25/33 (a) | | | | | 680 | | | | 533,381 | |
Santander Drive Auto Receivables Trust: | | | | | | | | | | |
Series 2011-S1A, Class B, 1.48%, 5/15/17 (b) | | | | | 2,905 | | | | 2,917,261 | |
Series 2012-4, Class C, 2.94%, 12/15/17 | | | | | 4,600 | | | | 4,778,167 | |
Series 2012-5, Class B, 1.56%, 8/15/18 | | | | | 4,090 | | | | 4,129,914 | |
Series 2012-5, Class C, 2.70%, 8/15/18 | | | | | 1,950 | | | | 2,035,172 | |
Series 2012-6, Class B, 1.33%, 5/15/17 | | | | | 3,565 | | | | 3,584,404 | |
Series 2012-6, Class C, 1.94%, 3/15/18 | | | | | 2,460 | | | | 2,489,530 | |
Series 2012-AA, Class B, 1.21%, 10/16/17 (b) | | | | | 9,060 | | | | 9,074,632 | |
Series 2012-AA, Class C, 1.78%, 11/15/18 (b) | | | | | 16,880 | | | | 16,995,797 | |
Series 2013-2, Class B, 1.33%, 3/15/18 | | | | | 8,700 | | | | 8,694,606 | |
| | | | | | | | | | |
| Asset-Backed Securities | | | | Par (000) | | | Value | |
| |
Series 2013-2, Class C, 1.95%, 3/15/19 | | USD | | | 14,280 | | | $ | 14,273,417 | |
Series 2012-1, Class B, 2.72%, 5/16/16 | | | | | 2,260 | | | | 2,315,610 | |
Series 2012-1, Class C, 3.78%, 11/15/17 | | | | | 3,045 | | | | 3,186,318 | |
Series 2012-2, Class C, 3.20%, 2/15/18 | | | | | 6,490 | | | | 6,748,386 | |
Series 2012-3, Class B, 1.94%, 12/15/16 | | | | | 6,245 | | | | 6,340,530 | |
Series 2012-3, Class C, 3.01%, 4/16/18 | | | | | 8,515 | | | | 8,838,459 | |
SASCO Mortgage Loan Trust, Series 2005-GEL2, Class A, 0.48%, 4/25/35 (a) | | | | | 473 | | | | 454,189 | |
Scholar Funding Trust, Series 2011-A, Class A, 1.20%, 10/28/43 (a)(b) | | | | | 4,465 | | | | 4,479,905 | |
SLM Student Loan Trust: | | | | | | | | | | |
Series 2004-B, Class A2, 0.48%, 6/15/21 (a) | | | | | 4,809 | | | | 4,733,554 | |
Series 2008-5, Class A4, 2.00%, 7/25/23 (a) | | | | | 4,690 | | | | 4,944,798 | |
Series 2011-B, Class A2, 3.74%, 2/15/29 (b) | | | | | 1,420 | | | | 1,543,945 | |
Series 2011-C, Class A2B, 4.54%, 10/17/44 (b) | | | | | 4,120 | | | | 4,628,803 | |
Series 2012-A, Class A1, 1.60%, 8/15/25 (a)(b) | | | | | 2,634 | | | | 2,674,655 | |
Series 2012-A, Class A2, 3.83%, 1/17/45 (b) | | | | | 2,750 | | | | 3,010,516 | |
Series 2012-B, Class A2, 3.48%, 10/15/30 (b) | | | | | 730 | | | | 781,642 | |
Series 2012-C, Class A1, 1.30%, 8/15/23 (a)(b) | | | | | 5,166 | | | | 5,216,421 | |
Series 2012-C, Class A2, 3.31%, 10/15/46 (b) | | | | | 10,125 | | | | 10,809,025 | |
Series 2012-D, Class A2, 2.95%, 2/15/46 (b) | | | | | 12,220 | | | | 12,844,699 | |
Series 2012-E, Class A1, 0.95%, 10/16/23 (a)(b) | | | | | 5,048 | | | | 5,071,665 | |
Series 2013-A, Class A2A, 1.77%, 5/17/27 (b) | | | | | 12,960 | | | | 12,956,371 | |
Series 2013-A, Class A2B, 1.25%, 5/17/27 (a)(b) | | | | | 11,170 | | | | 11,179,718 | |
Series 2013-A, Class B, 2.50%, 3/15/47 (b) | | | | | 4,990 | | | | 4,735,565 | |
Structured Asset Securities Corp. Assistance Loan Trust, Series 2003-AL2, Class A, 3.36%, 1/25/31 (b) | | | | | 1,139 | | | | 1,116,731 | |
Structured Asset Securities Corp. Mortgage Loan Trust, Series 2007-BC1, Class A2, 0.25%, 2/25/37 (a) | | | | | 76 | | | | 75,993 | |
Structured Asset Securities Corp. Mortgage Pass-Through Certificates, Series 2004-23XS, Class 2A1, 0.50%, 1/25/35 (a) | | | | | 1,893 | | | | 1,669,949 | |
Vibrant CLO Ltd.: | | | | | | | | | | |
Series 2012-1A, Class A1, 1.79%, 7/17/24 (a)(b) | | | | | 13,740 | | | | 13,837,691 | |
Series 2012-1A, Class A2, 2.71%, 7/17/24 (a)(b) | | | | | 2,600 | | | | 2,628,548 | |
World Financial Network Credit Card Master Trust: | | | | | | | | | | |
Series 2012-C, Class A, 2.23%, 8/15/22 | | | | | 8,570 | | | | 8,824,846 | |
Series 2012-C, Class B, 3.57%, 8/15/22 | | | | | 3,000 | | | | 3,151,734 | |
Series 2012-C, Class C, 4.55%, 8/15/22 | | | | | 5,030 | | | | 5,474,345 | |
Series 2012-D, Class A, 2.15%, 4/17/23 | | | | | 11,030 | | | | 11,216,219 | |
Series 2012-D, Class B, 3.34%, 4/17/23 | | | | | 3,551 | | | | 3,520,536 | |
Series 2012-D, Class M, 3.09%, 4/17/23 | | | | | 2,725 | | | | 2,746,465 | |
| |
Total Asset-Backed Securities – 14.9% | | | | 512,820,934 | |
| |
|
| |
| | | | | | | | | | |
|
| See Notes to Consolidated Financial Statements. |
| | | | | | |
| | | | | | | |
| | BLACKROCK BALANCED CAPITAL FUND, INC. | | MARCH 31, 2013 | | 33 |
| | |
| Consolidated Schedule of Investments (continued) | | Master Total Return Portfolio (Percentages shown are based on Net Assets) |
| | | | | | | | | | |
| Corporate Bonds | | | | Par (000) | | | Value | |
| |
Aerospace & Defense – 0.1% | |
Meccanica Holdings USA, Inc.: | | | | | | | | | | |
6.25%, 7/15/19 (b) | | USD | | | 2,254 | | | $ | 2,322,060 | |
6.25%, 1/15/40 (b) | | | | | 1,380 | | | | 1,213,326 | |
| | | | | | | | | | |
| | | |
| | | | | | | | | 3,535,386 | |
| |
Airlines – 0.0% | |
Scandinavian Airlines System Denmark-Norway-Sweden: | | | | | | | | | | |
9.65%, 6/16/14 | | EUR | | | 800 | | | | 1,045,859 | |
10.50%, 6/16/14 | | SEK | | | 1,000 | | | | 153,125 | |
| | | | | | | | | | |
| | | |
| | | | | | | | | 1,198,984 | |
| |
Auto Components – 0.4% | |
BorgWarner, Inc., 4.63%, 9/15/20 | | USD | | | 2,925 | | | | 3,217,822 | |
Continental Rubber of America Corp., 4.50%, 9/15/19 (b) | | | | | 6,640 | | | | 6,790,130 | |
GKN Holdings Plc, 5.38%, 9/19/22 | | GBP | | | 2,110 | | | | 3,374,140 | |
| | | | | | | | | | |
| | | |
| | | | | | | | | 13,382,092 | |
| |
Automobiles – 0.1% | |
Ford Motor Co., 4.75%, 1/15/43 | | USD | | | 4,640 | | | | 4,318,462 | |
Jaguar Land Rover Automotive Plc, 8.25%, 3/15/20 | | GBP | | | 290 | | | | 494,771 | |
| | | | | | | | | | |
| | | |
| | | | | | | | | 4,813,233 | |
| |
Beverages – 0.1% | |
Pernod-Ricard SA, 4.45%, 1/15/22 (b) | | USD | | | 2,994 | | | | 3,288,328 | |
| |
Biotechnology – 0.1% | |
Amgen, Inc., 4.38%, 12/05/18 | | EUR | | | 1,600 | | | | 2,371,660 | |
| |
Building Products – 0.1% | |
Buzzi Unicem SpA, 6.25%, 9/28/18 | | | | | 2,517 | | | | 3,467,943 | |
| |
Capital Markets – 0.5% | |
The Goldman Sachs Group, Inc.: | | | | | | | | | | |
5.75%, 1/24/22 | | USD | | | 2,001 | | | | 2,326,611 | |
3.63%, 1/22/23 | | | | | 13,415 | | | | 13,509,348 | |
| | | | | | | | | | |
| | | |
| | | | | | | | | 15,835,959 | |
| |
Chemicals – 0.6% | |
Evonik Industries AG, 1.88%, 4/08/20 | | EUR | | | 1,495 | | | | 1,911,094 | |
INEOS Finance Plc, 7.50%, 5/01/20 (b) | | USD | | | 565 | | | | 615,144 | |
LyondellBasell Industries NV, 5.00%, 4/15/19 | | | | | 5,110 | | | | 5,774,300 | |
Momentive Performance Materials, Inc., 8.88%, 10/15/20 | | | | | 2,035 | | | | 2,096,050 | |
Rain CII Carbon LLC/CII Carbon Corp., 8.50%, 1/15/21 | | EUR | | | 1,190 | | | | 1,586,356 | |
Rockwood Specialties Group, Inc., 4.63%, 10/15/20 | | USD | | | 2,355 | | | | 2,413,875 | |
Tronox Finance LLC, 6.38%, 8/15/20 (b) | | | | | 4,242 | | | | 4,114,740 | |
US Coatings Acquisition, Inc./Flash Dutch 2 BV, 7.38%, 5/01/21 (b) | | | | | 630 | | | | 663,075 | |
| | | | | | | | | | |
| | | |
| | | | | | | | | 19,174,634 | |
| |
Commercial Banks – 1.8% | |
Abbey National Treasury Services Plc, 1.75%, 1/15/18 | | EUR | | | 2,120 | | | | 2,691,590 | |
ABN AMRO Bank NV, 7.13%, 7/06/22 | | | | | 323 | | | | 470,201 | |
AIB Mortgage Bank, 2.63%, 7/28/17 | | | | | 1,260 | | | | 1,630,686 | |
Banco Espirito Santo SA, 4.75%, 1/15/18 | | | | | 600 | | | | 744,015 | |
Banco Santander SA, 3.25%, 2/17/15 | | | | | 2,100 | | | | 2,747,101 | |
Bankinter SA, 3.88%, 10/30/15 | | | | | 1,550 | | | | 2,047,860 | |
Banque Federative du Credit Mutuel SA, 1.63%, 1/11/18 | | | | | 3,000 | | | | 3,814,141 | |
Barclays Bank Plc: | | | | | | | | | | |
6.63%, 3/30/22 | | | | | 930 | | | | 1,359,969 | |
4.88%, 12/29/49 (a) | | | | | 500 | | | | 466,255 | |
Canadian Imperial Bank of Commerce, 2.60%, 7/02/15 (b) | | USD | | | 5,910 | | | | 6,180,678 | |
| | | | | | | | | | |
| Corporate Bonds | | | | Par (000) | | | Value | |
| |
Commercial Banks (concluded) | |
HSBC Bank Brasil SA - Banco Multiplo, 4.00%, 5/11/16 (b) | | USD | | | 15,610 | | | $ | 16,214,887 | |
ICICI Bank Ltd., 4.75%, 11/25/16 (b) | | | | | 6,450 | | | | 6,904,415 | |
ING Bank NV, 0.99%, 5/23/16 (a) | | | | | 600 | | | | 570,000 | |
Kutxabank SA, 3.00%, 2/01/17 | | EUR | | | 1,400 | | | | 1,813,691 | |
Lloyds TSB Bank Plc, 6.50%, 9/17/40 | | GBP | | | 350 | | | | 656,610 | |
Oversea-Chinese Banking Corp. Ltd., 3.75%, 11/15/22 (a) | | USD | | | 10,000 | | | | 10,515,390 | |
Wells Fargo & Co., 3.45%, 2/13/23 | | | | | 4,809 | | | | 4,841,316 | |
| | | | | | | | | | |
| | | |
| | | | | | | | | 63,668,805 | |
| |
Commercial Services & Supplies – 0.2% | |
Algeco Scotsman Global Finance Plc, 9.00%, 10/15/18 | | EUR | | | 1,750 | | | | 2,333,325 | |
GCL Holdings SCA, 9.38%, 4/15/18 | | | | | 982 | | | | 1,359,426 | |
IVS Group, 7.13%, 4/01/20 | | | | | 1,957 | | | | 2,511,995 | |
La Financiere Atalian SA, 7.25%, 1/15/20 | | | | | 820 | | | | 1,068,944 | |
Verisure Holding AB, 8.75%, 12/01/18 | | | | | 300 | | | | 397,999 | |
| | | | | | | | | | |
| | | |
| | | | | | | | | 7,671,689 | |
| |
Communications Equipment – 0.1% | |
Nokia Oyj, 5.00%, 10/26/17 | | | | | 1,100 | | | | 1,741,466 | |
| |
Construction Materials – 0.1% | |
CRH Finance Ltd., 3.13%, 4/03/23 | | | | | 1,590 | | | | 2,067,553 | |
| |
Consumer Finance – 0.2% | |
Discover Bank: | | | | | | | | | | |
8.70%, 11/18/19 | | USD | | | 470 | | | | 628,010 | |
7.00%, 4/15/20 | | | | | 3,335 | | | | 4,151,468 | |
Discover Financial Services, 3.85%, 11/21/22 | | | | | 1,510 | | | | 1,554,225 | |
| | | | | | | | | | |
| | | |
| | | | | | | | | 6,333,703 | |
| |
Containers & Packaging – 0.2% | |
Ardagh Glass Finance Plc, 8.75%, 2/01/20 | | EUR | | | 171 | | | | 229,051 | |
Ardagh Packaging Finance Plc, 9.25%, 10/15/20 | | | | | 146 | | | | 202,114 | |
Ardagh Packaging Finance Plc/Ardagh MP Holdings USA, Inc., 4.88%, 11/15/22 (b) | | USD | | | 475 | | | | 469,063 | |
Rock Tenn Co., 4.00%, 3/01/23 | | | | | 5,293 | | | | 5,352,742 | |
| | | | | | | | | | |
| | | |
| | | | | | | | | 6,252,970 | |
| |
Distributors – 0.1% | |
VWR Funding, Inc., 7.25%, 9/15/17 (b) | | | | | 3,926 | | | | 4,156,652 | |
| |
Diversified Financial Services – 5.2% | |
Annington Finance No. 4 Plc, 1.48%, 1/10/23 (a) | | GBP | | | 3,018 | | | | 4,435,887 | |
AyT Cedulas Cajas Global: | | | | | | | | | | |
4.00%, 3/21/17 | | EUR | | | 1,600 | | | | 2,021,758 | |
4.00%, 3/24/21 | | | | | 800 | | | | 923,098 | |
AyT Cedulas Cajas IX Fondo de Titulizacion, 3.75%, 3/31/15 | | | | | 3,200 | | | | 4,128,323 | |
AyT Cedulas Cajas X Fondo de Titulizacion: | | | | | | | | | | |
0.28%, 6/30/15 (a) | | | | | 600 | | | | 705,676 | |
3.75%, 6/30/25 | | | | | 2,900 | | | | 2,919,813 | |
Bank of America Corp.: | | | | | | | | | | |
6.50%, 8/01/16 | | USD | | | 2,325 | | | | 2,677,661 | |
3.88%, 3/22/17 | | | | | 5,130 | | | | 5,518,654 | |
2.00%, 1/11/18 | | | | | 11,710 | | | | 11,654,296 | |
5.65%, 5/01/18 | | | | | 25,135 | | | | 29,076,344 | |
5.70%, 1/24/22 | | | | | 10,127 | | | | 11,862,170 | |
3.30%, 1/11/23 | | | | | 5,330 | | | | 5,255,694 | |
Cedulas TDA 6 Fondo de Titulizacion de Activos: | | | | | | | | | | |
3.88%, 5/23/25 | | EUR | | | 900 | | | | 928,692 | |
4.25%, 4/10/31 | | | | | 800 | | | | 772,281 | |
Cedulas TDA 7 Fondo de Titulizacion de Activos, 3.50%, 6/20/17 | | | | | 100 | | | | 121,145 | |
See Notes to Consolidated Financial Statements.
| | | | | | |
| | | | | | | |
| 34 | | BLACKROCK BALANCED CAPITAL FUND, INC. | | MARCH 31, 2013 | | |
| | |
| Consolidated Schedule of Investments (continued) | | Master Total Return Portfolio (Percentages shown are based on Net Assets) |
| | | | | | | | | | |
| Corporate Bonds | | | | Par (000) | | | Value | |
| |
Diversified Financial Services (concluded) | |
Citigroup, Inc.: | | | | | | | | | | |
4.59%, 12/15/15 | | USD | | | 27,331 | | | $ | 29,625,957 | |
4.45%, 1/10/17 | | | | | 1,900 | | | | 2,091,778 | |
EC Finance Plc, 9.75%, 8/01/17 | | EUR | | | 329 | | | | 457,558 | |
Ford Motor Credit Co. LLC: | | | | | | | | | | |
5.00%, 5/15/18 | | USD | | | 7,622 | | | | 8,394,947 | |
4.25%, 9/20/22 | | | | | 5,950 | | | | 6,152,003 | |
General Electric Capital Corp., 3.10%, 1/09/23 | | | | | 7,015 | | | | 6,945,292 | |
JPMorgan Chase & Co.: | | | | | | | | | | |
3.25%, 9/23/22 | | | | | 2,651 | | | | 2,646,907 | |
3.20%, 1/25/23 | | | | | 5,535 | | | | 5,526,044 | |
Northern Rock Asset Management Plc, 5.63%, 6/22/17 (b) | | | | | 4,145 | | | | 4,803,537 | |
Novus USA Trust, Series 2013-1, 1.59%, 2/28/14 (a)(b) | | | | | 6,940 | | | | 6,940,000 | |
Tiers Trust, Series 2012-01, 2.04%, 5/12/14 (a)(b) | | | | | 18,466 | | | | 18,489,082 | |
TMX Finance LLC/TitleMax Finance Corp., 13.25%, 7/15/15 | | | | | 4,000 | | | | 4,380,000 | |
| | | | | | | | | | |
| | | |
| | | | | | | | | 179,454,597 | |
| |
Diversified Telecommunication Services – 0.6% | |
AT&T, Inc., 5.35%, 9/01/40 | | | | | 4,235 | | | | 4,533,894 | |
Intelsat Jackson Holdings SA, 7.25%, 4/01/19 | | | | | 4,072 | | | | 4,448,660 | |
Level 3 Financing, Inc., 8.13%, 7/01/19 | | | | | 4,474 | | | | 4,921,400 | |
Sprint Capital Corp., 6.88%, 11/15/28 | | | | | 2,003 | | | | 2,048,067 | |
Telenet Finance III Luxembourg SCA, 6.63%, 2/15/21 | | EUR | | | 200 | | | | 267,255 | |
Telenet Finance Luxembourg SCA, 6.38%, 11/15/20 | | | | | 200 | | | | 266,640 | |
Verizon Communications, Inc., 3.85%, 11/01/42 | | USD | | | 4,018 | | | | 3,475,132 | |
Ziggo NV, 3.63%, 3/27/20 | | EUR | | | 488 | | | | 626,300 | |
| | | | | | | | | | |
| | | |
| | | | | | | | | 20,587,348 | |
| |
Electric Utilities – 1.3% | | | | | | | | | | |
The Cleveland Electric Illuminating Co.: | | | | | | | | | | |
8.88%, 11/15/18 | | USD | | | 1,199 | | | | 1,593,087 | |
5.95%, 12/15/36 | | | | | 2,175 | | | | 2,466,415 | |
Duke Energy Carolinas LLC, 4.25%, 12/15/41 | | | | | 3,915 | | | | 4,013,345 | |
Enel Finance International NV, 4.88%, 4/17/23 | | EUR | | | 969 | | | | 1,274,307 | |
Energy Future Intermediate Holding Co. LLC/EFIH Finance, Inc., 10.00%, 12/01/20 | | USD | | | 7,690 | | | | 8,718,537 | |
Florida Power & Light Co., 5.95%, 2/01/38 | | | | | 3,645 | | | | 4,736,455 | |
Florida Power Corp., 6.40%, 6/15/38 | | | | | 2,646 | | | | 3,530,481 | |
Georgia Power Co., 3.00%, 4/15/16 | | | | | 8,985 | | | | 9,575,081 | |
Jersey Central Power & Light Co., 7.35%, 2/01/19 | | | | | 2,730 | | | | 3,476,931 | |
MidAmerican Energy Holdings Co., 6.50%, 9/15/37 | | | | | 25 | | | | 32,456 | |
Southern California Edison Co., Series 2008-A, 5.95%, 2/01/38 | | | | | 2,825 | | | | 3,655,092 | |
Trans-Allegheny Interstate Line Co., 4.00%, 1/15/15 (b) | | | | | 2,815 | | | | 2,953,822 | |
| | | | | | | | | | |
| | | |
| | | | | | | | | 46,026,009 | |
| |
Energy Equipment & Services – 1.0% | |
Transocean, Inc.: | | | | | | | | | | |
5.05%, 12/15/16 | | | | | 5,700 | | | | 6,333,253 | |
2.50%, 10/15/17 | | | | | 8,495 | | | | 8,602,504 | |
6.00%, 3/15/18 | | | | | 16,018 | | | | 18,142,035 | |
| | | | | | | | | | |
| | | |
| | | | | | | | | 33,077,792 | |
| |
Food & Staples Retailing – 0.2% | |
Co-Operative Group Holdings: | | | | | | | | | | |
5.63%, 7/08/20 (c) | | GBP | | | 1,150 | | | | 1,800,186 | |
6.25%, 7/08/26 (c) | | | | | 1,270 | | | | 2,018,919 | |
| | | | | | | | | | |
| Corporate Bonds | | | | Par (000) | | | Value | |
| |
Food & Staples Retailing (concluded) | |
WM Treasury Plc, 4.63%, 12/03/42 | | USD | | | 1,140 | | | $ | 1,760,728 | |
| | | | | | | | | | |
| | | |
| | | | | | | | | 5,579,833 | |
| |
Food Products – 0.3% | |
Bakkavor Finance 2 Plc, 8.25%, 2/15/18 | | GBP | | | 280 | | | | 438,310 | |
Kraft Foods Group, Inc., 5.00%, 6/04/42 | | USD | | | 3,505 | | | | 3,758,114 | |
Mondelez International, Inc., 6.50%, 8/11/17 | | | | | 6,049 | | | | 7,303,841 | |
| | | | | | | | | | |
| | | |
| | | | | | | | | 11,500,265 | |
| |
Gas Utilities – 0.1% | |
Snam SpA, 3.88%, 3/19/18 | | EUR | | | 2,483 | | | | 3,369,770 | |
| |
Health Care Equipment & Supplies – 0.5% | |
Boston Scientific Corp.: | | | | | | | | | | |
6.25%, 11/15/15 | | USD | | | 13,154 | | | | 14,752,566 | |
6.00%, 1/15/20 | | | | | 2,720 | | | | 3,179,316 | |
Ontex IV SA, 9.00%, 4/15/19 | | EUR | | | 680 | | | | 904,310 | |
| | | | | | | | | | |
| | | |
| | | | | | | | | 18,836,192 | |
| |
Health Care Providers & Services – 0.8% | |
Care UK Health & Social Care Plc, 9.75%, 8/01/17 | | GBP | | | 334 | | | | 520,304 | |
Coventry Health Care, Inc., 5.45%, 6/15/21 | | USD | | | 3,862 | | | | 4,551,568 | |
HCA, Inc., 7.25%, 9/15/20 | | | | | 3,925 | | | | 4,342,031 | |
Priory Group No. 3 Plc, 7.00%, 2/15/18 | | GBP | | | 360 | | | | 563,542 | |
Tenet Healthcare Corp.: | | | | | | | | | | |
6.25%, 11/01/18 | | USD | | | 4,905 | | | | 5,444,550 | |
8.88%, 7/01/19 | | | | | 2,660 | | | | 2,992,500 | |
4.75%, 6/01/20 (b) | | | | | 1,977 | | | | 1,986,885 | |
UnitedHealth Group, Inc., 3.38%, 11/15/21 | | | | | 1,630 | | | | 1,720,798 | |
Voyage Care Bondco Plc, 11.00%, 2/01/19 | | GBP | | | 1,800 | | | | 2,735,640 | |
WellPoint, Inc., Series A, 3.70%, 8/15/21 | | USD | | | 2,595 | | | | 2,740,528 | |
| | | | | | | | | | |
| | | |
| | | | | | | | | 27,598,346 | |
| |
Hotels, Restaurants & Leisure – 0.1% | |
Accor SA, 2.88%, 6/19/17 | | EUR | | | 400 | | | | 530,778 | |
Cirsa Funding Luxembourg SA, 8.75%, 5/15/18 | | | | | 348 | | | | 436,030 | |
Enterprise Inns Plc, 6.50%, 12/06/18 | | GBP | | | 574 | | | | 863,467 | |
Gala Group Finance Plc, 8.88%, 9/01/18 | | | | | 280 | | | | 452,141 | |
Lottomatica Group SpA, 3.50%, 3/05/20 | | EUR | | | 1,300 | | | | 1,709,831 | |
| | | | | | | | | | |
| | | |
| | | | | | | | | 3,992,247 | |
| |
Household Durables – 0.2% | |
K Hovnanian Enterprises, Inc., 7.25%, 10/15/20 (b) | | USD | | | 3,615 | | | | 4,003,612 | |
Together Housing Finance Plc, 4.50%, 12/17/42 | | GBP | | | 1,185 | | | | 1,802,438 | |
| | | | | | | | | | |
| | | |
| | | | | | | | | 5,806,050 | |
| |
Household Products – 0.1% | |
Reynolds Group Issuer, Inc./Reynolds Group Issuer LLC/Reynolds Group Issuer Luxembourg SA, 6.88%, 2/15/21 | | USD | | | 3,120 | | | | 3,322,800 | |
| |
Independent Power Producers & Energy Traders – 0.1% | |
NRG Energy, Inc., 6.63%, 3/15/23 (b) | | | | | 2,105 | | | | 2,231,300 | |
| |
Industrial Conglomerates – 0.1% | |
Siemens Financieringsmaatschappij NV, 2.75%, 9/10/25 | | GBP | | | 2,600 | | | | 3,835,524 | |
| |
Insurance – 1.5% | |
Achmea BV, 6.00%, 4/04/43 (a) | | EUR | | | 1,160 | | | | 1,500,270 | |
Allianz Finance II BV, 5.75%, 7/08/41 (a) | | | | | 4,400 | | | | 6,288,629 | |
American International Group, Inc.: | | | | | | | | | | |
3.80%, 3/22/17 | | USD | | | 8,028 | | | | 8,686,898 | |
5.45%, 5/18/17 | | | | | 4,150 | | | | 4,753,962 | |
4.88%, 6/01/22 | | | | | 7,189 | | | | 8,132,837 | |
Lincoln National Corp., 7.00%, 6/15/40 | | | | | 740 | | | | 974,783 | |
|
| See Notes to Consolidated Financial Statements. |
| | | | | | |
| | | | | | | |
| | BLACKROCK BALANCED CAPITAL FUND, INC. | | MARCH 31, 2013 | | 35 |
| | |
| Consolidated Schedule of Investments (continued) | | Master Total Return Portfolio (Percentages shown are based on Net Assets) |
| | | | | | | | | | |
| Corporate Bonds | | | | Par (000) | | | Value | |
| |
Insurance (concluded) | |
Manulife Financial Corp., 3.40%, 9/17/15 | | USD | | | 3,185 | | | $ | 3,350,391 | |
Metropolitan Life Global Funding I, 5.13%, 6/10/14 (b) | | | | | 1,600 | | | | 1,686,488 | |
Muenchener Rueckversicherungs AG, 6.00%, 5/26/41 (a) | | EUR | | | 900 | | | | 1,339,785 | |
Prudential Financial, Inc.: | | | | | | | | | | |
4.75%, 9/17/15 | | USD | | | 8,549 | | | | 9,313,802 | |
7.38%, 6/15/19 | | | | | 3,690 | | | | 4,737,831 | |
5.38%, 6/21/20 | | | | | 2,085 | | | | 2,459,034 | |
| | | | | | | | | | |
| | | |
| | | | | | | | | 53,224,710 | |
| |
IT Services – 0.1% | |
313 Group, Inc., 6.38%, 12/01/19 (b) | | | | | 2,282 | | | | 2,264,885 | |
Cerved Technologies SpA: | | | | | | | | | | |
6.38%, 1/15/20 | | EUR | | | 938 | | | | 1,184,534 | |
8.00%, 1/15/21 | | | | | 953 | | | | 1,179,045 | |
| | | | | | | | | | |
| | | |
| | | | | | | | | 4,628,464 | |
| |
Life Sciences Tools & Services – 0.1% | |
Life Technologies Corp., 5.00%, 1/15/21 | | USD | | | 2,630 | | | | 2,845,431 | |
| |
Machinery – 0.1% | |
Atlas Copco AB, 2.50%, 2/28/23 | | EUR | | | 1,635 | | | | 2,157,505 | |
| |
Media – 2.7% | |
CBS Corp.: | | | | | | | | | | |
4.63%, 5/15/18 | | USD | | | 1,785 | | | | 1,994,725 | |
8.88%, 5/15/19 | | | | | 3,440 | | | | 4,594,533 | |
5.75%, 4/15/20 | | | | | 2,820 | | | | 3,320,344 | |
Clear Channel Worldwide Holdings, Inc., 6.50%, 11/15/22 (b) | | | | | 4,844 | | | | 5,110,420 | |
Comcast Cable Communications Holdings, Inc., 9.46%, 11/15/22 | | | | | 2,225 | | | | 3,371,712 | |
Comcast Corp.: | | | | | | | | | | |
5.88%, 2/15/18 | | | | | 6,350 | | | | 7,660,627 | |
4.65%, 7/15/42 | | | | | 5,577 | | | | 5,675,479 | |
COX Communications, Inc.: | | | | | | | | | | |
3.25%, 12/15/22 (b) | | | | | 13,075 | | | | 13,282,736 | |
8.38%, 3/01/39 (b) | | | | | 6,180 | | | | 9,154,836 | |
4.70%, 12/15/42 (b) | | | | | 2,159 | | | | 2,124,829 | |
Eutelsat SA, 3.13%, 10/10/22 | | EUR | | | 1,800 | | | | 2,386,125 | |
Lynx I Corp., 6.00%, 4/15/21 | | GBP | | | 310 | | | | 484,212 | |
NBCUniversal Media LLC: | | | | | | | | | | |
5.15%, 4/30/20 | | USD | | | 3,508 | | | | 4,157,545 | |
2.88%, 1/15/23 | | | | | 6,903 | | | | 6,842,281 | |
The New York Times Co., 6.63%, 12/15/16 | | | | | 4,100 | | | | 4,504,875 | |
Odeon & UCI Finco Plc, 9.00%, 8/01/18 | | GBP | | | 272 | | | | 440,256 | |
Time Warner Cable, Inc., 4.50%, 9/15/42 | | USD | | | 7,278 | | | | 6,615,884 | |
Time Warner, Inc., 4.70%, 1/15/21 | | | | | 2,080 | | | | 2,345,437 | |
Unitymedia KabelBW GmbH, 9.50%, 3/15/21 | | EUR | | | 340 | | | | 497,915 | |
Virgin Media Finance Plc: | | | | | | | | | | |
4.88%, 2/15/22 | | USD | | | 1,124 | | | | 1,138,050 | |
5.13%, 2/15/22 | | GBP | | | 2,105 | | | | 3,223,173 | |
Virgin Media Secured Finance Plc, 6.50%, 1/15/18 | | USD | | | 3,740 | | | | 3,983,100 | |
| | | | | | | | | | |
| | | |
| | | | | | | | | 92,909,094 | |
| |
Metals & Mining – 1.0% | |
Eco-Bat Finance Plc, 7.75%, 2/15/17 | | EUR | | | 300 | | | | 396,076 | |
Freeport-McMoRan Copper & Gold, Inc.: | | | | | | | | | | |
3.10%, 3/15/20 (b) | | USD | | | 5,952 | | | | 5,971,880 | |
3.55%, 3/01/22 | | | | | 2,002 | | | | 1,990,004 | |
3.88%, 3/15/23 (b) | | | | | 6,926 | | | | 6,946,037 | |
5.45%, 3/15/43 (b) | | | | | 3,991 | | | | 3,944,285 | |
New Gold, Inc., 7.00%, 4/15/20 (b) | | | | | 690 | | | | 741,750 | |
Novelis, Inc., 8.75%, 12/15/20 | | | | | 6,865 | | | | 7,740,287 | |
| | | | | | | | | | |
| Corporate Bonds | | | | Par (000) | | | Value | |
| |
Metals & Mining (concluded) | |
Steel Dynamics, Inc., 6.38%, 8/15/22 (b) | | USD | | | 1,345 | | | $ | 1,452,600 | |
ThyssenKrupp AG: | | | | | | | | | | |
4.00%, 8/27/18 | | EUR | | | 2,370 | | | | 3,090,716 | |
4.00%, 8/27/18 | | | | | 1,000 | | | | 1,304,680 | |
| | | | | | | | | | |
| | | |
| | | | | | | | | 33,578,315 | |
| |
Multiline Retail – 0.4% | |
Macy’s Retail Holdings, Inc.: | | | | | | | | | | |
7.45%, 7/15/17 | | USD | | | 5,847 | | | | 7,187,811 | |
2.88%, 2/15/23 | | | | | 5,400 | | | | 5,226,115 | |
| | | | | | | | | | |
| | | |
| | | | | | | | | 12,413,926 | |
| |
Multi-Utilities – 0.2% | |
CMS Energy Corp., 4.70%, 3/31/43 | | | | | 435 | | | | 434,988 | |
Dominion Resources, Inc., 1.95%, 8/15/16 | | | | | 6,345 | | | | 6,543,186 | |
| | | | | | | | | | |
| | | |
| | | | | | | | | 6,978,174 | |
| |
Oil, Gas & Consumable Fuels – 3.4% | |
Access Midstream Partners LP/ACMP Finance Corp., 4.88%, 5/15/23 | | | | | 1,345 | | | | 1,328,187 | |
CONSOL Energy, Inc., 8.25%, 4/01/20 | | | | | 549 | | | | 608,017 | |
Denbury Resources, Inc., 4.63%, 7/15/23 | | | | | 4,184 | | | | 4,037,560 | |
Energy Transfer Partners LP: | | | | | | | | | | |
3.60%, 2/01/23 | | | | | 6,325 | | | | 6,294,128 | |
6.50%, 2/01/42 | | | | | 3,872 | | | | 4,424,236 | |
Enterprise Products Operating LLC, 4.45%, 2/15/43 | | | | | 2,420 | | | | 2,327,053 | |
EP Energy LLC/Everest Acquisition Finance, Inc.: | | | | | | | | | | |
6.88%, 5/01/19 | | | | | 1,260 | | | | 1,379,700 | |
7.75%, 9/01/22 | | | | | 1,525 | | | | 1,685,125 | |
IVG Finance BV, 1.75%, 3/29/17 | | EUR | | | 1,400 | | | | 1,112,602 | |
Laredo Petroleum, Inc.: | | | | | | | | | | |
9.50%, 2/15/19 | | USD | | | 1,925 | | | | 2,175,250 | |
7.38%, 5/01/22 | | | | | 655 | | | | 717,225 | |
Linn Energy LLC/Linn Energy Finance Corp., 6.25%, 11/01/19 (b) | | | | | 6,000 | | | | 6,135,000 | |
MarkWest Energy Partners LP/MarkWest Energy Finance Corp., 4.50%, 7/15/23 | | | | | 1,105 | | | | 1,081,519 | |
MEG Energy Corp., 6.38%, 1/30/23 (b) | | | | | 1,580 | | | | 1,643,200 | |
Murphy Oil Corp.: | | | | | | | | | | |
2.50%, 12/01/17 | | | | | 6,364 | | | | 6,390,404 | |
4.00%, 6/01/22 | | | | | 1,217 | | | | 1,213,343 | |
3.70%, 12/01/22 | | | | | 11,438 | | | | 11,112,051 | |
5.13%, 12/01/42 | | | | | 910 | | | | 850,229 | |
New World Resources NV, 7.88%, 1/15/21 | | EUR | | | 326 | | | | 376,080 | |
Noble Holding International Ltd., 3.95%, 3/15/22 | | USD | | | 2,395 | | | | 2,466,201 | |
Novatek OAO via Novatek Finance Ltd., 4.42%, 12/13/22 (b) | | | | | 2,725 | | | | 2,701,156 | |
Peabody Energy Corp.: | | | | | | | | | | |
6.00%, 11/15/18 | | | | | 614 | | | | 652,375 | |
6.25%, 11/15/21 | | | | | 3,926 | | | | 4,083,040 | |
Pride International, Inc., 6.88%, 8/15/20 | | | | | 2,650 | | | | 3,322,276 | |
Range Resources Corp., 7.25%, 5/01/18 | | | | | 7,335 | | | | 7,628,400 | |
Sabine Pass Liquefaction LLC, 5.63%, 2/01/21 (b) | | | | | 5,036 | | | | 5,224,850 | |
Sabine Pass LNG LP: | | | | | | | | | | |
7.50%, 11/30/16 | | | | | 5,000 | | | | 5,525,000 | |
6.50%, 11/01/20 (b) | | | | | 1,225 | | | | 1,289,313 | |
Sibur Securities Ltd., 3.91%, 1/31/18 (b) | | | | | 2,150 | | | | 2,112,375 | |
Valero Energy Corp., 6.63%, 6/15/37 | | | | | 2,851 | | | | 3,473,926 | |
Western Gas Partners LP: | | | | | | | | | | |
5.38%, 6/01/21 | | | | | 10,607 | | | | 11,997,069 | |
4.00%, 7/01/22 | | | | | 2,516 | | | | 2,602,694 | |
See Notes to Consolidated Financial Statements.
| | | | | | |
| | | | | | | |
| 36 | | BLACKROCK BALANCED CAPITAL FUND, INC. | | MARCH 31, 2013 | | |
| | |
| Consolidated Schedule of Investments (continued) | | Master Total Return Portfolio (Percentages shown are based on Net Assets) |
| | | | | | | | | | |
| Corporate Bonds | | | | Par (000) | | | Value | |
| |
Oil, Gas & Consumable Fuels (concluded) | |
The Williams Cos., Inc.: | | | | | | | | | | |
7.88%, 9/01/21 | | USD | | | 3,694 | | | $ | 4,720,134 | |
3.70%, 1/15/23 | | | | | 5,645 | | | | 5,603,842 | |
| | | | | | | | | | |
| | | |
| | | | | | | | | 118,293,560 | |
| |
Paper & Forest Products – 0.7% | |
Fibria Overseas Finance Ltd., 6.75%, 3/03/21 | | | | | 1,260 | | | | 1,391,670 | |
International Paper Co.: | | | | | | | | | | |
4.75%, 2/15/22 | | | | | 13,396 | | | | 15,078,859 | |
6.00%, 11/15/41 | | | | | 3,420 | | | | 3,979,091 | |
Mondi Finance Plc, 5.75%, 4/03/17 | | EUR | | | 1,600 | | | | 2,327,634 | |
| | | | | | | | | | |
| | | |
| | | | | | | | | 22,777,254 | |
| |
Pharmaceuticals – 0.4% | |
Teva Pharmaceutical Finance Co. BV: | | | | | | | | | | |
3.65%, 11/10/21 | | USD | | | 2,120 | | | | 2,256,104 | |
2.95%, 12/18/22 | | | | | 5,683 | | | | 5,697,651 | |
Teva Pharmaceutical Finance IV BV, 3.65%, 11/10/21 | | | | | 5,000 | | | | 5,321,000 | |
| | | | | | | | | | |
| | | |
| | | | | | | | | 13,274,755 | |
| |
Professional Services – 0.0% | |
TMF Group Holding BV, 9.88%, 12/01/19 | | EUR | | | 1,056 | | | | 1,394,188 | |
| |
Real Estate Investment Trusts (REITs) – 0.5% | |
GELF Bond Issuer I SA, 3.13%, 4/03/18 | | | | | 2,395 | | | | 3,081,423 | |
Ventas Realty LP/Ventas Capital Corp.: | | | | | | | | | | |
2.70%, 4/01/20 | | USD | | | 1,272 | | | | 1,276,226 | |
4.75%, 6/01/21 | | | | | 3,040 | | | | 3,378,471 | |
Vornado Realty LP, 5.00%, 1/15/22 | | | | | 8,255 | | | | 9,145,104 | |
| | | | | | | | | | |
| | | |
| | | | | | | | | 16,881,224 | |
| |
Real Estate Management & Development – 0.5% | |
Great Places Housing Group Ltd., 4.75%, 10/22/42 | | GBP | | | 1,086 | | | | 1,716,178 | |
IVG Immobilien AG, 0.00%, 5/29/49 (a) | | EUR | | | 2,100 | | | | 901,746 | |
Realogy Group LLC, 7.88%, 2/15/19 (b)(d) | | USD | | | 4,210 | | | | 4,609,950 | |
The Unique Pub Finance Co. Plc: | | | | | | | | | | |
Series A3, 6.54%, 3/30/21 | | GBP | | | 500 | | | | 761,800 | |
Series A4, 5.66%, 6/30/27 | | | | | 6,752 | | | | 9,620,334 | |
| | | | | | | | | | |
| | | |
| | | | | | | | | 17,610,008 | |
| |
Road & Rail – 0.3% | |
Autoroutes du Sud de la France SA: | | | | | | | | | | |
4.13%, 4/13/20 | | EUR | | | 2,250 | | | | 3,276,209 | |
2.88%, 1/18/23 | | | | | 1,800 | | | | 2,368,620 | |
Burlington Northern Santa Fe LLC, 3.00%, 3/15/23 | | USD | | | 5,675 | | | | 5,718,414 | |
| | | | | | | | | | |
| | | |
| | | | | | | | | 11,363,243 | |
| |
Software – 0.1% | |
First Data Corp.: | | | | | | | | | | |
7.38%, 6/15/19 (b) | | | | | 2,290 | | | | 2,435,987 | |
8.25%, 1/15/21 (b) | | | | | 140 | | | | 145,600 | |
| | | | | | | | | | |
| | | |
| | | | | | | | | 2,581,587 | |
| |
Specialty Retail – 0.4% | |
DFS Furniture Holdings Plc, 7.63%, 8/15/18 | | GBP | | | 278 | | | | 426,609 | |
Dufry Finance SCA, 5.50%, 10/15/20 (b) | | USD | | | 1,760 | | | | 1,826,060 | |
House of Fraser Funding Plc, 8.88%, 8/15/18 | | GBP | | | 842 | | | | 1,330,858 | |
Marks & Spencer Plc, 4.75%, 6/12/25 | | | | | 630 | | | | 980,085 | |
Punch Taverns Finance B Ltd.: | | | | | | | | | | |
Series A6, 5.94%, 12/30/24 | | | | | 176 | | | | 254,111 | |
Series A7, 4.77%, 6/30/33 | | | | | 934 | | | | 1,298,195 | |
QVC, Inc.: | | | | | | | | | | |
7.50%, 10/01/19 (b) | | USD | | | 4,225 | | | | 4,669,297 | |
| | | | | | | | | | |
| Corporate Bonds | | | | Par (000) | | | Value | |
| |
Specialty Retail (concluded) | |
4.38%, 3/15/23 (b) | | USD | | | 725 | | | $ | 732,927 | |
5.95%, 3/15/43 (b) | | | | | 850 | | | | 846,444 | |
| | | | | | | | | | |
| | | |
| | | | | | | | | 12,364,586 | |
| |
Tobacco – 0.0% | |
Imperial Tobacco Finance Plc, 4.50%, 7/05/18 | | EUR | | | 941 | | | | 1,373,222 | |
| |
Trading Companies & Distributors – 0.4% | |
Aircastle Ltd., 6.25%, 12/01/19 | | USD | | | 2,100 | | | | 2,294,250 | |
H&E Equipment Services, Inc., 7.00%, 9/01/22 (b) | | | | | 1,605 | | | | 1,765,500 | |
Rexel SA, 5.13%, 6/15/20 | | EUR | | | 1,999 | | | | 2,600,753 | |
United Rentals North America, Inc.: | | | | | | | | | | |
5.75%, 7/15/18 | | USD | | | 753 | | | | 816,064 | |
7.38%, 5/15/20 | | | | | 4,565 | | | | 5,067,150 | |
7.63%, 4/15/22 | | | | | 1,874 | | | | 2,094,195 | |
| | | | | | | | | | |
| | | |
| | | | | | | | | 14,637,912 | |
| |
Transportation Infrastructure – 0.0% | |
Gategroup Finance Luxembourg SA, 6.75%, 3/01/19 | | EUR | | | 300 | | | | 386,463 | |
| |
Water Utilities – 0.0% | |
Affinity Water Programme Finance Ltd., 4.50%, 3/31/36 | | GBP | | | 820 | | | | 1,275,747 | |
| |
Wireless Telecommunication Services – 2.0% | |
America Movil SAB de CV: | | | | | | | | | | |
2.38%, 9/08/16 | | USD | | | 8,025 | | | | 8,255,093 | |
3.13%, 7/16/22 | | | | | 5,109 | | | | 5,010,141 | |
4.38%, 7/16/42 (d) | | | | | 1,512 | | | | 1,393,559 | |
CC Holdings GS V LLC, 3.85%, 4/15/23 (b) | | | | | 3,706 | | | | 3,733,658 | |
Cricket Communications, Inc., 7.75%, 5/15/16 | | | | | 3,869 | | | | 4,038,269 | |
Crown Castle International Corp., 5.25%, 1/15/23 | | | | | 2,235 | | | | 2,274,113 | |
Crown Castle Towers LLC, 6.11%, 1/15/40 (b) | | | | | 16,500 | | | | 20,186,051 | |
Phones4u Finance Plc, 9.50%, 4/01/18 | | GBP | | | 1,280 | | | | 2,008,568 | |
SBA Tower Trust, 5.10%, 4/15/42 (b) | | USD | | | 3,700 | | | | 4,161,560 | |
Sprint Nextel Corp., 9.00%, 11/15/18 (b) | | | | | 10,660 | | | | 13,178,425 | |
VimpelCom Holdings BV, 7.50%, 3/01/22 | | | | | 845 | | | | 940,316 | |
Vodafone Group Plc, 8.13%, 11/26/18 | | GBP | | | 2,300 | | | | 4,634,128 | |
| | | | | | | | | | |
| | | |
| | | | | | | | | 69,813,881 | |
| |
Total Corporate Bonds – 30.1% | | | | 1,036,942,379 | |
| |
| | | | | | | | | | |
| | | | | | | | | | |
|
Floating Rate Loan Interests (a) | |
| |
Diversified Financial Services – 0.2% | |
Nuveen Investments, Inc., Term Loan A, 5/13/17 | | USD | | | 3,000 | | | | 3,054,120 | |
Springleaf Financial Funding Co. (FKA American General Finance Corp.), Initial Loan, 5.50%, 5/10/17 | | | | | 4,000 | | | | 4,020,840 | |
| | | | | | | | | | |
| | | |
| | | | | | | | | 7,074,960 | |
| |
Diversified Telecommunication Services – 0.6% | |
Intelsat Jackson Holdings SA (FKA Intelsat Jackson Holdings Ltd.), Tranche B-1 Term Loan, 4.50%, 4/02/18 | | | | | 12,485 | | | | 12,653,822 | |
Level 3 Financing, Inc., Tranche B-II 2019 Term Loan, 4.75%, 8/01/19 | | | | | 8,000 | | | | 8,088,320 | |
| | | | | | | | | | |
| | | |
| | | | | | | | | 20,742,142 | |
| |
Food Products – 0.1% | |
Del Monte Foods Co., Initial Term Loan, 4.00%, 3/08/18 | | | | | 2,391 | | | | 2,410,703 | |
| |
|
| See Notes to Consolidated Financial Statements. |
| | | | | | |
| | | | | | | |
| | BLACKROCK BALANCED CAPITAL FUND, INC. | | MARCH 31, 2013 | | 37 |
| | |
| Consolidated Schedule of Investments (continued) | | Master Total Return Portfolio (Percentages shown are based on Net Assets) |
| | | | | | | | | | |
| Floating Rate Loan Interests (a) | | | | Par (000) | | | Value | |
| |
Health Care Providers & Services – 0.0% | |
Emdeon, Inc., Term B-1 Loan, 5.00%, 11/02/18 | | USD | | | 924 | | | $ | 935,657 | |
| |
Hotels, Restaurants & Leisure – 0.9% | |
Hilton Fort Lauderdale, Term Loan A Notes, 7.40%, 2/22/16 | | | | | 6,540 | | | | 6,504,731 | |
Hilton Worldwide, Inc. (FKA Hilton Hotels Corp.): | | | | | | | | | | |
Mezzanine F Loan, 4.45%, 11/15/15 | | | | | 9,981 | | | | 9,731,514 | |
Mezzanine G Loan, 4.70%, 11/12/15 | | | | | 9,981 | | | | 9,781,419 | |
Motel 6, Term Loan, 10.00%, 10/15/17 (b) | | | | | 6,030 | | | | 6,030,000 | |
| | | | | | | | | | |
| | | |
| | | | | | | | | 32,047,664 | |
| |
Independent Power Producers & Energy Traders – 0.1% | |
Dynegy Midwest Generation LLC, Term Loan, 9.25%, 8/05/16 | | | | | 2,228 | | | | 2,317,129 | |
| |
Life Sciences Tools & Services – 0.0% | |
Pharmaceutical Product Development, Inc. (Jaguar Holdings LLC), 2013 Term Loan, 4.25%, 12/05/18 | | | | | 988 | | | | 998,220 | |
| |
Machinery – 0.0% | |
Terex Corp., New U.S. Term Loan, 4.50%, 4/28/17 | | | | | 985 | | | | 1,002,288 | |
| |
Oil, Gas & Consumable Fuels – 0.4% | |
Dynegy Power LLC, Term Loan, 9.25%, 8/05/16 | | | | | 3,778 | | | | 3,929,636 | |
Obsidian Natural Gas Trust, Term Loan, 7.00%, 11/02/15 | | | | | 8,316 | | | | 8,357,147 | |
| | | | | | | | | | |
| | | |
| | | | | | | | | 12,286,783 | |
| |
Pharmaceuticals – 0.1% | |
inVentiv Health, Inc. (FKA Ventive Health, Inc.), Consolidated Term Loan, 7.50%, 8/04/16 | | | | | 2,649 | | | | 2,622,231 | |
| |
Real Estate Investment Trusts (REITs) – 0.0% | |
iStar Financial, Inc., Term Loan, 4.50%, 10/15/17 | | | | | 524 | | | | 528,059 | |
| |
Real Estate Management & Development – 0.0% | |
Realogy Corp., Extended Synthetic Commitment, 0.05% - 4.40%, 10/10/16 | | | | | 179 | | | | 181,058 | |
| |
Software – 0.2% | |
First Data Corp., 2018 Dollar Term Loan, 4.20%, 3/23/18 | | | | | 6,090 | | | | 6,063,278 | |
| |
Wireless Telecommunication Services – 0.2% | |
Vodafone Americas Finance 2, Inc., New Series A Loan,, 6.25%, 7/11/16 (e) | | | | | 7,219 | | | | 7,417,266 | |
| |
| |
Total Floating Rate Loan Interests – 2.8% | | | | 96,627,438 | |
| |
| | | | | | | | | | |
| | | | | | | | | | |
|
Foreign Agency Obligations | |
| |
Bank of India, 6.25%, 2/16/21 | | | | | 4,670 | | | | 5,276,021 | |
Caixa Economica Federal: | | | | | | | | | | |
2.38%, 11/06/17 (b) | | | | | 3,950 | | | | 3,837,425 | |
3.50%, 11/07/22 (b) | | | | | 2,110 | | | | 2,015,050 | |
Caixa Geral de Depositos SA, 5.63%, 12/04/15 | | EUR | | | 2,000 | | | | 2,635,099 | |
China Resources Land Ltd., 4.63%, 5/19/16 | | USD | | | 3,000 | | | | 3,195,450 | |
DP World Sukuk Ltd., 6.25%, 7/02/17 | | | | | 5,740 | | | | 6,414,450 | |
Eksportfinans ASA: | | | | | | | | | | |
5.50%, 5/25/16 | | | | | 1,310 | | | | 1,360,787 | |
5.50%, 6/26/17 | | | | | 275 | | | | 285,175 | |
Electricite de France SA, 2.75%, 3/10/23 | | EUR | | | 2,500 | | | | 3,277,675 | |
Hydro-Quebec: | | | | | | | | | | |
8.40%, 1/15/22 | | USD | | | 8,220 | | | | 11,735,439 | |
8.05%, 7/07/24 | | | | | 21,145 | | | | 30,880,496 | |
National Agricultural Cooperative Federation, 3.50%, 2/08/17 (b) | | | | | 8,300 | | | | 8,820,476 | |
| | | | | | | | | | |
| Foreign Agency Obligations | | | | Par (000) | | | Value | |
| |
Nexen, Inc.: | | | | | | | | | | |
5.88%, 3/10/35 | | USD | | | 240 | | | $ | 289,860 | |
6.40%, 5/15/37 | | | | | 7,445 | | | | 9,617,615 | |
7.50%, 7/30/39 | | | | | 3,565 | | | | 5,183,207 | |
Petrobras International Finance Co., 3.88%, 1/27/16 | | | | | 15,335 | | | | 16,047,863 | |
Rosneft Oil Co. via Rosneft International Finance Ltd., 4.20%, 3/06/22 (b) | | | | | 2,770 | | | | 2,745,763 | |
Sberbank of Russia Via SB Capital SA, 6.13%, 2/07/22 | | | | | 3,260 | | | | 3,643,050 | |
| |
| |
Total Foreign Agency Obligations – 3.4% | | | | 117,260,901 | |
| |
| | | | | | | | | | |
| | | | | | | | | | |
|
Foreign Government Obligations | |
| |
Argentina – 0.0% | |
Republic of Argentina, 2.50%, 12/31/38 (c) | | | | | 3,185 | | | | 995,313 | |
| |
Belgium – 0.1% | |
Kingdom of Belgium, 4.00%, 3/28/18 | | EUR | | | 1,920 | | | | 2,827,384 | |
| |
Brazil – 0.1% | |
Federative Republic of Brazil, 7.13%, 1/20/37 | | USD | | | 1,725 | | | | 2,393,437 | |
| |
Cyprus – 0.1% | |
Republic of Cyprus: | | | | | | | | | | |
3.75%, 6/03/13 | | | | | 650 | | | | 758,185 | |
4.38%, 7/15/14 | | EUR | | | 830 | | | | 813,898 | |
| | | | | | | | | | |
| | | |
| | | | | | | | | 1,572,083 | |
| |
Germany – 2.1% | |
Bundesobligation, 0.50%, 4/07/17 | | | | | 5,700 | | | | 7,409,644 | |
Deutsche Bundesrepublik Inflation Linked Bond, 0.10%, 4/15/23 | | | | | 33,500 | | | | 46,604,608 | |
Federal Republic of Germany: | | | | | | | | | | |
4.25%, 7/04/18 | | | | | 4,960 | | | | 7,643,731 | |
3.25%, 1/04/20 | | | | | 4,250 | | | | 6,396,255 | |
2.00%, 1/04/22 | | | | | 2,750 | | | | 3,797,157 | |
| | | | | | | | | | |
| | | |
| | | | | | | | | 71,851,395 | |
| |
Ireland – 0.2% | |
Republic of Ireland, 3.90%, 3/20/23 | | | | | 6,545 | | | | 8,133,413 | |
| |
Italy – 1.4% | |
Buoni Poliennali Del Tesoro: | | | | | | | | | | |
4.75%, 6/01/17 | | | | | 2,850 | | | | 3,839,779 | |
5.25%, 8/01/17 | | | | | 14,615 | | | | 20,110,420 | |
3.50%, 11/01/17 | | | | | 6,620 | | | | 8,488,944 | |
5.50%, 9/01/22 | | | | | 1,920 | | | | 2,615,561 | |
5.50%, 11/01/22 | | | | | 8,800 | | | | 11,980,882 | |
4.50%, 5/01/23 | | | | | 1,410 | | | | 1,780,680 | |
| | | | | | | | | | |
| | | |
| | | | | | | | | 48,816,266 | |
| |
Mexico – 0.5% | |
United Mexican States: | | | | | | | | | | |
5.63%, 1/15/17 | | USD | | | 3,840 | | | | 4,416,000 | |
7.75%, 12/14/17 | | MXN | | | 19,087 | | | | 1,751,987 | |
5.13%, 1/15/20 | | USD | | | 8,275 | | | | 9,690,025 | |
8.50%, 11/18/38 | | MXN | | | 26,940 | | | | 2,952,483 | |
| | | | | | | | | | |
| | | |
| | | | | | | | | 18,810,495 | |
| |
Netherlands – 4.6% | |
Kingdom of the Netherlands, 4.50%, 7/15/17 | | EUR | | | 106,860 | | | | 159,542,763 | |
| |
Poland – 0.2% | |
Republic of Poland: | | | | | | | | | | |
6.38%, 7/15/19 | | USD | | | 1,280 | | | | 1,572,544 | |
5.13%, 4/21/21 | | | | | 4,130 | | | | 4,770,150 | |
| | | | | | | | | | |
| | | |
| | | | | | | | | 6,342,694 | |
| |
|
| See Notes to Consolidated Financial Statements. |
| | | | | | |
| | | | | | | |
| 38 | | BLACKROCK BALANCED CAPITAL FUND, INC. | | MARCH 31, 2013 | | |
| | |
| Consolidated Schedule of Investments (continued) | | Master Total Return Portfolio (Percentages shown are based on Net Assets) |
| | | | | | | | | | |
| Foreign Government Obligations | | | | Par (000) | | | Value | |
| |
Portugal – 0.4% | |
Republic of Portugal, 3.50%, 3/25/15 | | USD | | | 12,800 | | | $ | 12,480,000 | |
| |
Russia – 0.5% | |
Russian Federation, 7.50%, 3/31/30 (c) | | | | | 13,388 | | | | 16,584,540 | |
| |
South Africa – 0.1% | |
Republic of South Africa, 5.50%, 3/09/20 | | | | | 3,165 | | | | 3,616,013 | |
| |
Spain – 0.6% | |
Autonomous Community of Madrid Spain: | | | | | | | | | | |
3.00%, 11/05/13 | | CHF | | | 1,250 | | | | 1,312,503 | |
3.00%, 7/29/14 | | | | | 410 | | | | 426,107 | |
Autonomous Community of Valencia Spain: | | | | | | | | | | |
5.50%, 4/26/13 | | EUR | | | 200 | | | | 256,052 | |
4.75%, 3/20/14 | | | | | 1,700 | | | | 2,171,985 | |
3.25%, 7/06/15 | | | | | 1,280 | | | | 1,559,942 | |
4.38%, 7/16/15 | | | | | 1,860 | | | | 2,308,029 | |
Kingdom of Spain: | | | | | | | | | | |
4.50%, 1/31/18 | | | | | 2,300 | | | | 3,033,654 | |
4.00%, 3/06/18 (b) | | USD | | | 4,360 | | | | 4,319,016 | |
Spain Letras del Tesoro, 1.76%, 4/16/14 (f) | | EUR | | | 5,200 | | | | 6,545,044 | |
| | | | | | | | | | |
| | | |
| | | | | | | | | 21,932,332 | |
| |
Turkey – 0.3% | |
Republic of Turkey: | | | | | | | | | | |
7.00%, 3/11/19 | | USD | | | 2,670 | | | | 3,224,025 | |
5.63%, 3/30/21 | | | | | 3,870 | | | | 4,413,735 | |
6.25%, 9/26/22 | | | | | 2,760 | | | | 3,270,600 | |
| | | | | | | | | | |
| | | |
| | | | | | | | | 10,908,360 | |
| |
Total Foreign Government Obligations – 11.2% | | | | 386,806,488 | |
| |
| | | | | | | | | | |
| | | | | | | | | | |
| | | |
| Investment Companies – 0.4% | | | | Shares | | | | |
| |
iShares JPMorgan USD Emerging Markets Bond Fund (g) | | | | | 114,500 | | | | 13,450,315 | |
| |
| | | | | | | | | | |
| | | | | | | | | | |
| | | |
Non-Agency Mortgage-Backed
Securities | | | | Par (000) | | | | |
| |
Collateralized Mortgage Obligations – 4.8% | |
Citigroup Mortgage Loan Trust, Series 2007-2, Class 2A, 6.00%, 11/25/36 | | USD | | | 246 | | | | 247,288 | |
Collateralized Mortgage Obligation Trust, Series 57, Class D, 9.90%, 2/01/19 | | | | | 8 | | | | 9,231 | |
Countrywide Alternative Loan Trust: | | | | | | | | | | |
Series 2005-21CB, Class A17, 6.00%, 6/25/35 | | | | | 13,885 | | | | 13,884,947 | |
Series 2006-43CB, Class 1A10, 6.00%, 2/25/37 | | | | | 5,851 | | | | 4,668,619 | |
Series 2006-J4, Class 2A8, 6.00%, 7/25/36 | | | | | 11,292 | | | | 9,068,201 | |
Series 2006-OA10, Class 1A1, 1.00%, 8/25/46 (a) | | | | | 2,329 | | | | 1,593,331 | |
Series 2006-OA21, Class A1, 0.39%, 3/20/47 (a) | | | | | 22,499 | | | | 15,468,407 | |
Series 2007-22, Class 2A16, 6.50%, 9/25/37 | | | | | 25,749 | | | | 20,131,940 | |
Countrywide Home Loan Mortgage Pass-Through Trust: | | | | | | | | | | |
Series 2004-29, Class 1A1, 0.74%, 2/25/35 (a) | | | | | 855 | | | | 814,541 | |
Series 2006-OA4, Class A1, 1.14%, 4/25/46 (a) | | | | | 11,376 | | | | 6,144,946 | |
Series 2006-OA5, Class 2A1, 0.40%, 4/25/46 (a) | | | | | 3,741 | | | | 2,546,988 | |
| | | | | | | | | | |
Non-Agency Mortgage-Backed
Securities | | | | Par (000) | | | Value | |
| |
Collateralized Mortgage Obligations (concluded) | |
Series 2006-OA5, Class 3A1, 0.40%, 4/25/46 (a) | | USD | | | 5,569 | | | $ | 4,279,309 | |
Credit Suisse Mortgage Capital Certificates: | | | | | | | | | | |
Series 2010-20R, Class 9A1, 2.99%, 1/27/36 (a)(b) | | | | | 7,146 | | | | 7,049,795 | |
Series 2011-2R, Class 1A1, 2.73%, 3/27/37 (a)(b) | | | | | 4,071 | | | | 3,928,911 | |
Series 2011-2R, Class 2A1, 2.63%, 7/27/36 (a)(b) | | | | | 13,575 | | | | 13,331,848 | |
Series 2011-5R, Class 3A1, 5.42%, 9/27/47 (a)(b) | | | | | 5,868 | | | | 5,829,411 | |
Deutsche Alt-A Securities Mortgage Loan Trust, Series 2007-RMP1, Class A2, 0.35%, 12/25/36 (a) | | | | | 5,456 | | | | 4,212,007 | |
First Horizon Mortgage Pass-Through Trust, Series 2005-AR3, Class 3A1, 2.60%, 8/25/35 (a) | | | | | 1,948 | | | | 1,837,739 | |
Fosse Master Issuer Plc, Series 2012-1A, Class 2A2, 1.70%, 10/18/54 (a)(b) | | | | | 3,645 | | | | 3,726,247 | |
Gemgarto, Series 2012-1, Class A1, 3.46%, 5/14/45 (a) | | GBP | | | 1,767 | | | | 2,793,425 | |
GSR Mortgage Loan Trust, Series 2005-AR2, Class 2A1, 2.82%, 4/25/35 (a) | | USD | | | 5,256 | | | | 5,184,594 | |
HomeBanc Mortgage Trust: | | | | | | | | | | |
Series 2005-4, Class A1, 0.47%, 10/25/35 (a) | | | | | 22,233 | | | | 18,667,152 | |
Series 2006-2, Class A1, 0.38%, 12/25/36 (a) | | | | | 6,263 | | | | 5,203,699 | |
Impac Secured Assets CMN Owner Trust, Series 2004-3, Class 1A4, 1.00%, 11/25/34 (a) | | | | | 948 | | | | 923,888 | |
JPMorgan Mortgage Trust: | | | | | | | | | | |
Series 2006-S2, Class 2A2, 5.88%, 6/25/21 | | | | | 3,460 | | | | 3,374,047 | |
Series 2007-S1, Class 1A2, 5.50%, 3/25/22 | | | | | 961 | | | | 955,285 | |
Lanark Master Issuer Plc, Series 2012-2X, Class 2A, 2.14%, 12/22/54 (a) | | GBP | | | 2,673 | | | | 4,212,699 | |
Residential Mortgage Securities Ltd., Series 26, Class A1, 2.76%, 2/14/41 (a) | | | | | 2,019 | | | | 3,217,699 | |
Silk Road Finance Number Three Plc, Series 2012-1, Class A, 1.86%, 6/21/55 (a) | | | | | 1,828 | | | | 2,830,974 | |
| | | | | | | | | | |
| | | |
| | | | | | | | | 166,137,168 | |
| |
Commercial Mortgage-Backed Securities – 10.0% | |
Banc of America Commercial Mortgage Trust, Series 2007-3, Class A4, 5.80%, 6/10/49 (a) | | USD | | | 2,730 | | | | 3,126,107 | |
Banc of America Large Loan Trust, Series 2010-HLTN, Class HLTN, 2.50%, 11/15/15 (a)(b) | | | | | 15,692 | | | | 15,777,425 | |
Banc of America Merrill Lynch Commercial Mortgage, Inc., Series 2005-3, Class A3A, 4.62%, 7/10/43 | | | | | 850 | | | | 862,755 | |
Bear Stearns Commercial Mortgage Securities Trust, Series 2005-PW10, Class AM, 5.45%, 12/11/40 (a) | | | | | 1,350 | | | | 1,485,652 | |
Citigroup/Deutsche Bank Commercial Mortgage Trust, Series 2007-CD4, Class A2B, 5.21%, 12/11/49 | | | | | 1,374 | | | | 1,390,881 | |
Commercial Mortgage Pass-Through Certificates: | | | | | | | | | | |
Series 2010-RR1, Class GEB, 5.54%, 12/11/49 (a)(b) | | | | | 2,260 | | | | 2,530,775 | |
Series 2012-LTRT, Class A2, 3.40%, 10/05/30 (b) | | | | | 5,485 | | | | 5,541,819 | |
Series 2013-GAM, Class A2, 3.37%, 2/10/28 (b) | | | | | 4,900 | | | | 5,022,288 | |
|
| See Notes to Consolidated Financial Statements. |
| | | | | | |
| | | | | | | |
| | BLACKROCK BALANCED CAPITAL FUND, INC. | | MARCH 31, 2013 | | 39 |
| | |
| Consolidated Schedule of Investments (continued) | | Master Total Return Portfolio (Percentages shown are based on Net Assets) |
| | | | | | | | | | |
Non-Agency Mortgage-Backed
Securities | | | | Par (000) | | | Value | |
| |
Commercial Mortgage-Backed Securities (continued) | | | | | |
Credit Suisse First Boston Mortgage Securities Corp., Series 2005-C3, Class AJ, 4.77%, 7/15/37 | | USD | | | 920 | | | $ | 949,066 | |
Credit Suisse Mortgage Capital Certificates, Series 2010-RR1, Class 2A, 5.70%, 9/15/40 (a)(b) | | | | | 4,730 | | | | 5,454,120 | |
Deutsche Bank ReREMIC Trust: | | | | | | | | | | |
Series 2011-C32, Class A3A, 5.73%, 6/17/49 (a)(b) | | | | | 3,800 | | | | 4,376,836 | |
Series 2012-EZ1, Class A, 0.95%, 9/25/45 (b) | | | | | 15,319 | | | | 15,360,402 | |
Extended Stay America Trust, Series 2013-ESH7, Class A27, 2.96%, 12/05/31 (b) | | | | | 3,850 | | | | 3,893,817 | |
GE Capital Commercial Mortgage Corp. Trust, Series 2007-C1, Class A2, 5.42%, 12/10/49 | | | | | 18,098 | | | | 18,058,992 | |
GMAC Commercial Mortgage Securities, Inc., Series 2003-C2, Class A2, 5.60%, 5/10/40 (a) | | | | | 1,958 | | | | 1,972,896 | |
Greenwich Capital Commercial Funding Corp.: | | | | | | | | | | |
Series 2005-GG3, Class A3, 4.57%, 8/10/42 | | | | | 694 | | | | 693,420 | |
Series 2006-GG7, Class AJ, 5.87%, 7/10/38 (a) | | | | | 3,370 | | | | 3,379,699 | |
Series 2007-GG11, Class A4, 5.74%, 12/10/49 | | | | | 1,850 | | | | 2,136,424 | |
Series 2007-GG11, Class AM, 5.87%, 12/10/49 (a) | | | | | 3,340 | | | | 3,778,772 | |
Series 2007-GG9, Class AM, 5.48%, 3/10/39 | | | | | 1,500 | | | | 1,654,482 | |
GS Mortgage Securities Corp. II, Series 2005-GG4, Class A4, 4.76%, 7/10/39 | | | | | 13,351 | | | | 14,241,805 | |
GS Mortgage Securities Trust: | | | | | | | | | | |
Series 2006-GG8, Class AJ, 5.62%, 11/10/39 | | | | | 3,580 | | | | 3,500,628 | |
Series 2006-GG8, Class AM, 5.59%, 11/10/39 | | | | | 1,470 | | | | 1,656,124 | |
Series 2007-GG10, Class A4, 5.98%, 8/10/45 (a)(d) | | | | | 4,400 | | | | 5,034,788 | |
Series 2012-SHOP, Class C, 3.63%, 6/05/31 (b) | | | | | 820 | | | | 858,598 | |
JPMorgan Chase Commercial Mortgage Securities Corp.: | | | | | | | | | | |
Series 2007-LD11, Class A2, 5.80%, 6/15/49 (a) | | | | | 16,145 | | | | 16,638,192 | |
Series 2013-C10, Class C, 4.30%, 12/15/47 (a) | | | | | 3,740 | | | | 3,808,304 | |
JPMorgan Chase Commercial Mortgage Securities Trust: | | | | | | | | | | |
Series 2006-CB14, Class AM, 5.45%, 12/12/44 (a) | | | | | 5,065 | | | | 5,463,068 | |
Series 2006-LDP8, Class AJ, 5.48%, 5/15/45 (a) | | | | | 2,000 | | | | 2,134,920 | |
Series 2007-CB20, Class AJ, 6.08%, 2/12/51 (a) | | | | | 11,095 | | | | 11,324,223 | |
Series 2007-CB20, Class AM, 6.08%, 2/12/51 (a) | | | | | 1,000 | | | | 1,174,655 | |
Series 2008-C2, Class ASB, 6.13%, 2/12/51 (a) | | | | | 2,325 | | | | 2,521,071 | |
Series 2012-HSBC, Class D, 4.67%, 7/05/32 (a)(b) | | | | | 4,000 | | | | 4,254,516 | |
| | | | | | | | | | |
Non-Agency Mortgage-Backed
Securities | | | | Par
(000) | | | Value | |
| |
Commercial Mortgage-Backed Securities (continued) | |
LB-UBS Commercial Mortgage Trust: | | | | | | | | | | |
Series 2005-C2, Class AJ, 5.21%, 4/15/30 (a) | | USD | | | 3,055 | | | $ | 3,225,090 | |
Series 2007-C6, Class A4, 5.86%, 7/15/40 (a) | | | | | 5,000 | | | | 5,731,305 | |
Series 2007-C7, Class A3, 5.87%, 9/15/45 (a) | | | | | 3,800 | | | | 4,373,713 | |
Merrill Lynch Mortgage Trust, Series 2005-CKI1, Class AJ, 5.27%, 11/12/37 (a) | | | | | 4,160 | | | | 4,453,176 | |
ML-CFC Commercial Mortgage Trust: | | | | | | | | | | |
Series 2006-1, Class AJ, 5.58%, 2/12/39 (a) | | | | | 3,100 | | | | 3,234,401 | |
Series 2006-2, Class A2, 5.88%, 6/12/46 (a) | | | | | 1,100 | | | | 1,100,561 | |
Series 2007-9, Class ASB, 5.64%, 9/12/49 | | | | | 22,755 | | | | 23,768,561 | |
Morgan Stanley, Series 2007-XLC1, Class A2 0.47%, 7/17/17 (a) | | | | | 1,052 | | | | 1,015,002 | |
Morgan Stanley Bank of America Merrill Lynch Trust, Series 2012-CKSV, Class CK, 4.30%, 10/15/30 (b) | | | | | 8,496 | | | | 7,628,479 | |
Morgan Stanley Capital I Trust: | | | | | | | | | | |
Series 2007-HQ11, Class A2, 5.36%, 2/12/44 | | | | | 162 | | | | 162,026 | |
Series 2007-HQ12, Class A2FX, 5.59%, 4/12/49 (a) | | | | | 782 | | | | 814,851 | |
Series 2007-HQ12, Class AM, 5.57%, 4/12/49 (a) | | | | | 8,025 | | | | 8,756,703 | |
Series 2007-IQ13, Class AM, 5.41%, 3/15/44 | | | | | 2,580 | | | | 2,867,275 | |
Series 2007-IQ15, Class AM, 6.09%, 6/11/49 (a) | | | | | 4,505 | | | | 4,978,354 | |
Morgan Stanley Capital I, Inc., Series 1998-WF2, Class G, 6.34%, 7/15/30 (a)(b) | | | | | 1,962 | | | | 1,989,757 | |
Morgan Stanley ReREMIC Trust: | | | | | | | | | | |
Series 2009-IO, Class B, 4.19%, 7/17/56 (b)(f) | | | | | 6,500 | | | | 6,075,550 | |
Series 2011-IO, Class A, 2.50%, 3/23/51 (b) | | | | | 1,962 | | | | 1,981,929 | |
Series 2012-IO, Class AXB1, 1.00%, 12/01/42 | | | | | 3,081 | | | | 3,074,441 | |
Series 2012-IO, Class AXB2, 1.00%, 12/01/42 | | | | | 2,680 | | | | 2,591,935 | |
Series 2012-XA, Class A, 2.00%, 7/27/49 (b) | | | | | 5,747 | | | | 5,818,642 | |
Motel 6 Trust, Series 2012-MTL6, Class B, 2.74%, 10/05/25 (b) | | | | | 2,655 | | | | 2,666,409 | |
New York Securitization Trust, Series 2012-1, Class A, 6.70%, 12/27/47 (a)(b) | | | | | 12,069 | | | | 12,069,000 | |
ORES NPL LLC, Series 2012-LV1, Class A, 4.00%, 9/25/44 (b) | | | | | 1,702 | | | | 1,703,778 | |
RBSCF Trust, Series 2010-RR3, Class WBTA, 5.93%, 2/16/51 (a)(b) | | | | | 14,186 | | | | 16,339,844 | |
RCMC LLC, Series 2012-CRE1, Class A, 5.62%, 11/15/44 (b) | | | | | 7,035 | | | | 7,034,415 | |
SMA Issuer I LLC, Series 2012-LV1, Class A, 3.50%, 8/20/25 (b) | | | | | 5,713 | | | | 5,737,424 | |
STRIPs Ltd., Series 2012-1A, Class A, 1.50%, 12/25/44 (b) | | | | | 9,342 | | | | 9,233,099 | |
See Notes to Consolidated Financial Statements.
| | | | | | |
| | | | | | | |
| 40 | | BLACKROCK BALANCED CAPITAL FUND, INC. | | MARCH 31, 2013 | | |
| | |
| Consolidated Schedule of Investments (continued) | | Master Total Return Portfolio (Percentages shown are based on Net Assets) |
| | | | | | | | | | |
Non-Agency Mortgage-
Backed Securities | | | | Par (000) | | | Value | |
| |
Commercial Mortgage-Backed Securities (concluded) | |
Wachovia Bank Commercial Mortgage Trust: | | | | | | | | | | |
Series 2006-C28, Class A2, 5.50%, 10/15/48 | | USD | | | 4,257 | | | $ | 4,301,802 | |
Series 2007-C33, Class A4, 5.93%, 2/15/51 (a) | | | | | 4,310 | | | | 4,940,906 | |
Series 2007-C33, Class AM, 5.93%, 2/15/51 (a) | | | | | 3,791 | | | | 4,225,809 | |
Wells Fargo Resecuritization Trust, Series 2012-IO, Class A, 1.75%, 8/20/21 (b) | | | | | 5,502 | | | | 5,507,493 | |
WF-RBS Commercial Mortgage Trust, Series 2013-C11, Class A4, 3.04%, 3/15/45 | | | | | 5,745 | | | | 5,878,751 | |
| | | | | | | | | | |
| | | |
| | | | | | | | | 343,338,001 | |
| |
Interest Only Commercial Mortgage-Backed Securities – 0.8% | |
Commercial Mortgage Pass-Through Certificates: | | | | | | | | | | |
Series 2012-CR1, Class XA, 2.25%, 5/15/45 (a) | | | | | 43,725 | | | | 5,995,070 | |
Series 2013-CR6, Class XA, 1.71%, 3/10/46 (a) | | | | | 55,280 | | | | 4,988,203 | |
GS Mortgage Securities Corp. II, Series 2013-KYO, Class XB1, 3.25%, 11/08/29 (a)(b) | | | | | 30,760 | | | | 2,150,124 | |
JPMorgan Chase Commercial Mortgage Securities Trust, Series 2012-CBX, Class XA, 2.04%, 6/15/45 (a) | | | | | 20,889 | | | | 2,385,937 | |
Morgan Stanley Capital I Trust, Series 2012-C4, Class XA, 2.69%, 3/15/45 (a)(b) | | | | | 41,684 | | | | 5,974,970 | |
WaMu Commercial Mortgage Securities Trust, Series 2005-C1A, Class X, 0.87%, 5/25/36 (a)(b) | | | | | 1,865 | | | | 29,108 | |
WF-RBS Commercial Mortgage Trust, Series 2012-C10, Class XA, 1.85%, 12/15/45 (a)(b) | | | | | 47,379 | | | | 5,831,408 | |
| | | | | | | | | | |
| | | |
| | | | | | | | | 27,354,820 | |
| |
Total Non-Agency Mortgage-Backed Securities – 15.6% | | | | 536,829,989 | |
| |
| | | | | | | | | | |
| | | | | | | | | | |
| Other Interests (h) | | | | Beneficial Interest (000) | | | | |
| |
Capital Markets – 0.0% | |
Lehman Brothers Holdings Capital Trust VII (i)(j) | | | | | 1,888 | | | | – | |
Lehman Brothers Holdings, Inc. (j) | | | | | 7,360 | | | | 1 | |
| |
| |
Total Other Interests – 0.0% | | | | 1 | |
| |
| | | | | | | | | | |
| | | | | | | | | | |
| | | |
| Preferred Securities | | | | | | | | |
| |
| Capital Trusts | | | | Par (000) | | | | |
| |
Capital Markets – 0.0% | |
State Street Capital Trust IV, 1.28%, 6/01/77 (a) | | | | | 770 | | | | 618,887 | |
| |
Diversified Financial Services – 0.1% | |
ZFS Finance USA Trust V, 6.50%, 5/09/67 (a)(b) | | | | | 2,513 | | | | 2,688,910 | |
| |
Electric Utilities — 0.1% | |
Electricite de France SA, 5.25%, 1/29/49 (a)(b) | | | | | 2,875 | | | | 2,856,140 | |
| |
| | | | | | | | | | |
| Preferred Securities | | | | Par (000) | | | Value | |
| |
Insurance – 0.6% | |
Aviva Plc, 5.90%, 11/29/49 (a) | | GBP | | | 1,160 | | | $ | 1,630,745 | |
MetLife Capital Trust IV, 7.88%, 12/15/67 (b) | | USD | | | 6,045 | | | | 7,571,363 | |
Prudential Financial, Inc.: | | | | | | | | | | |
5.88%, 9/15/42 (a) | | | | | 7,704 | | | | 8,204,760 | |
5.20%, 3/15/44 (a) | | | | | 215 | | | | 215,537 | |
XL Group Plc, 6.50%, 12/29/49 (a)(k) | | | | | 4,885 | | | | 4,775,087 | |
| | | | | | | | | | |
| | | |
| | | | | | | | | 22,397,492 | |
| |
Media – 0.1% | |
NBCUniversal Enterprise, Inc., 5.25% (b)(k) | | | | | 3,600 | | | | 3,636,360 | |
| |
| |
Total Capital Trusts – 0.9% | | | | 32,197,789 | |
| |
| | | | | | | | | | |
| | | | | | | | | | |
| | | |
| Preferred Stocks | | | | Shares | | | | |
| |
Insurance – 0.2% | |
The Allstate Corp., 5.25%, 1/15/53 | | | | | 187,770 | | | | 4,915,819 | |
| |
Thrifts & Mortgage Finance – 0.0% | |
Fannie Mae, 8.25% | | | | | 110,000 | | | | 361,900 | |
Freddie Mac, 8.38% | | | | | 120,000 | | | | 398,280 | |
| | | | | | | | | | |
| | | |
| | | | | | | | | 760,180 | |
| |
Total Preferred Stocks – 0.2% | | | | 5,675,999 | |
| |
| | | | | | | | | | |
| | | | | | | | | | |
| | | |
| Trust Preferreds | | | | | | | | |
| |
Diversified Financial Services – 0.1% | |
Citigroup Capital XIII, 7.88%, 10/30/40 | | | | | 149,440 | | | | 4,272,490 | |
| |
Total Preferred Securities – 1.2% | | | | 42,146,278 | |
| |
| | | | | | | | | | |
| | | | | | | | | | |
| Taxable Municipal Bonds | | | | Par (000) | | | | |
| |
New York City Municipal Water Finance Authority RB: | | | | | | | | | | |
5.38%, 6/15/43 | | USD | | | 4,410 | | | | 5,100,077 | |
5.50%, 6/15/43 | | | | | 5,285 | | | | 6,162,627 | |
| |
| |
Total Taxable Municipal Bonds – 0.3% | | | | 11,262,704 | |
| |
| | | | | | | | | | |
| | | | | | | | | | |
| | | |
U.S. Government Sponsored Agency
Securities | | | | | | | | |
| |
Agency Obligations – 1.3% | |
Fannie Mae: | | | | | | | | | | |
1.75%, 5/07/13 (d) | | | | | 3,450 | | | | 3,455,713 | |
1.86%, 10/09/19 (d)(f) | | | | | 13,295 | | | | 11,782,215 | |
6.63%, 11/15/30 (d) | | | | | 1,450 | | | | 2,158,911 | |
Freddie Mac: | | | | | | | | | | |
2.50%, 4/23/14 (d) | | | | | 6,100 | | | | 6,251,500 | |
3.75%, 3/27/19 | | | | | 3,650 | | | | 4,184,732 | |
4.38%, 7/17/15 (d) | | | | | 7,950 | | | | 8,680,724 | |
4.88%, 6/13/18 (d) | | | | | 4,300 | | | | 5,147,797 | |
FREMF Mortgage Trust: | | | | | | | | | | |
Series 2012-K23, Class B, 3.66%, | | | | | | | 3,075,679 | |
10/25/45 (a)(b) | | | | | 3,060 | | | | | |
|
| See Notes to Consolidated Financial Statements. |
| | | | | | |
| | | | | | | |
| | BLACKROCK BALANCED CAPITAL FUND, INC. | | MARCH 31, 2013 | | 41 |
| | |
| Consolidated Schedule of Investments (continued) | | Master Total Return Portfolio (Percentages shown are based on Net Assets) |
| | | | | | | | | | |
U.S. Government Sponsored
Agency Securities | | | | Par (000) | | | Value | |
| |
Agency Obligations (concluded) | |
Series 2012-K706, Class C, 4.02%, 11/25/44 (a)(b) | | USD | | | 1,520 | | | $ | 1,550,965 | |
U.S. Small Business Administration, Series 2004-P10A, Class 1, 4.50%, 2/10/14 | | | | | 90 | | | | 92,374 | |
| | | | | | | | | | |
| | | |
| | | | | | | | | 46,380,610 | |
| |
Collateralized Mortgage Obligations – 0.1% | |
Fannie Mae, Series 2005-48, Class AR, 5.50%, 2/25/35 | | | | | 31 | | | | 33,501 | |
Freddie Mac, Series 2825, Class VP, 5.50%, 6/15/15 | | | | | 582 | | | | 600,856 | |
Ginnie Mae, Series 2009-63, Class AC, 4.18%, 1/16/38 | | | | | 4,350 | | | | 4,554,833 | |
| | | | | | | | | | |
| | | |
| | | | | | | | | 5,189,190 | |
| |
Commercial Mortgage-Backed Securities – 0.5% | |
Fannie Mae, Series 2006-M2, Class A2A, 5.27%, 10/25/32 (a) | | | | | 4,298 | | | | 5,258,227 | |
Freddie Mac: | | | | | | | | | | |
Series K013, Class A2, 3.97%, 1/25/21 (a) | | | | | 4,530 | | | | 5,109,210 | |
Series K025, Class A2, 2.68%, 10/25/22 | | | | | 6,180 | | | | 6,349,226 | |
| | | | | | | | | | |
| | | |
| | | | | | | | | 16,716,663 | |
| |
Interest Only Collateralized Mortgage Obligations – 0.2% | |
Fannie Mae: | | | | | | | | | | |
Series 2011-123, Class CS, 6.41%, 10/25/41 (a) | | | | | 19,685 | | | | 2,462,604 | |
Series 2012-94, Class IK, 4.00%, 9/25/42 | | | | | 20,089 | | | | 2,724,108 | |
Freddie Mac, Series 3990, Class SN, 6.40%, 2/15/40 (a) | | | | | 3,753 | | | | 181,221 | |
| | | | | | | | | | |
| | | |
| | | | | | | | | 5,367,933 | |
| |
Interest Only Commercial Mortgage-Backed Securities – 0.4% | |
Freddie Mac: | | | | | | | | | | |
Series K019, Class X1, 1.75%, 3/25/22 (a) | | | | | 10,246 | | | | 1,258,811 | |
Series K023, Class X1, 1.32%, 8/25/22 (a) | | | | | 28,127 | | | | 2,749,014 | |
Series K707, Class X1, 1.56%, 1/25/47 (a) | | | | | 22,957 | | | | 1,763,222 | |
Series K710, Class X1, 1.78%, 5/25/19 (a) | | | | | 17,068 | | | | 1,586,480 | |
Series K009, Class X1, 1.50%, 8/25/20 (a) | | | | | 43,757 | | | | 3,544,048 | |
Ginnie Mae, Series 2012-120, Class IO, 1.01%, 2/16/53 (a) | | | | | 23,945 | | | | 2,073,527 | |
| | | | | | | | | | |
| | | |
| | | | | | | | | 12,975,102 | |
| |
Mortgage-Backed Securities – 69.3% | |
Fannie Mae Mortgage-Backed Securities: | | | | | | | | | | |
2.24%, 10/01/42 (a) | | | | | 6,896 | | | | 7,178,405 | |
2.50%, 4/01/27-4/01/28 (d)(l) | | | | | 60,313 | | | | 62,722,530 | |
2.96%, 3/01/41 (a) | | | | | 2,821 | | | | 2,970,482 | |
3.00%, 9/01/27-4/01/43 (d)(l) | | | | | 325,406 | | | | 336,729,305 | |
3.15%, 3/01/41 (a) | | | | | 3,684 | | | | 3,868,651 | |
3.27%, 12/01/40 (a) | | | | | 5,354 | | | | 5,674,378 | |
3.50%, 7/01/26-4/01/43 (d)(l) | | | | | 290,212 | | | | 306,807,699 | |
4.00%, 1/01/25-4/01/43 (d)(l) | | | | | 305,454 | | | | 326,210,900 | |
4.50%, 2/01/25-4/01/43 (d)(l) | | | | | 266,484 | | | | 287,223,040 | |
5.00%, 9/01/33-4/01/43 (a)(l) | | | | | 149,303 | | | | 161,959,081 | |
5.50%, 12/01/32-4/01/43 (l) | | | | | 124,127 | | | | 135,720,485 | |
5.53%, 10/01/38 (a) | | | | | 33 | | | | 35,124 | |
6.00%, 2/01/34-4/01/43 (d)(l) | | | | | 52,836 | | | | 58,410,033 | |
6.50%, 5/01/40 (d) | | | | | 23,033 | | | | 25,830,585 | |
| | | | | | | | | | |
U.S. Government Sponsored
Agency Securities | | | | Par (000) | | | Value | |
| |
Mortgage-Backed Securities (concluded) | |
Freddie Mac Mortgage-Backed Securities: | | | | | | | | | | |
2.31%, 10/01/36 (a) | | USD | | | 50 | | | $ | 53,438 | |
2.66%, 2/01/37 (a) | | | | | 141 | | | | 150,104 | |
2.92%, 6/01/42 (a) | | | | | 6,402 | | | | 6,735,610 | |
3.00%, 4/01/28-4/01/43 (d)(l) | | | | | 66,680 | | | | 68,760,018 | |
3.03%, 2/01/41 (a) | | | | | 4,874 | | | | 5,142,169 | |
3.50%, 4/01/28-4/01/43 (d)(l) | | | | | 35,594 | | | | 37,556,898 | |
4.00%, 4/01/28-4/01/43 (l) | | | | | 103,699 | | | | 110,148,584 | |
4.50%, 10/01/41-4/01/43 (d)(l) | | | | | 66,270 | | | | 70,889,823 | |
5.00%, 10/01/36-5/01/39 (d) | | | | | 34,769 | | | | 37,485,901 | |
5.50%, 4/01/38-1/01/40 (d) | | | | | 21,874 | | | | 23,690,045 | |
Ginnie Mae Mortgage-Backed Securities: | | | | | | | | | | |
1.75%, 5/20/34 (a) | | | | | 1,303 | | | | 1,369,490 | |
3.00%, 4/15/43 (l) | | | | | 24,600 | | | | 25,695,467 | |
3.50%, 1/20/43-4/15/43 (d)(l) | | | | | 47,173 | | | | 50,519,128 | |
4.00%, 10/15/40-4/15/43 (d)(l) | | | | | 89,783 | | | | 97,391,332 | |
4.50%, 5/20/41-4/15/43 (d)(l) | | | | | 79,842 | | | | 87,816,937 | |
5.00%, 4/20/41-4/15/43 (d)(l) | | | | | 42,863 | | | | 46,908,483 | |
| | | | | | | | | | |
| | | |
| | | | | | | | | 2,391,654,125 | |
| |
Total U.S. Government Sponsored Agency Securities – 71.8% | | | | 2,478,283,623 | |
| |
| | | | | | | | | | |
| | | | | | | | | | |
| | | |
| U.S. Treasury Obligations | | | | | | | | |
| |
U.S. Treasury Bonds: | | | | | | | | | | |
2.75%, 8/15/42 | | | | | 45 | | | | 41,752 | |
3.13%, 2/15/43 (d) | | | | | 290,351 | | | | 290,895,408 | |
U.S. Treasury Inflation Indexed Bonds, 0.75%, 2/15/42 (d) | | | | | 22,632 | | | | 23,620,838 | |
U.S. Treasury Notes: | | | | | | | | | | |
0.25%, 2/28/15 (d) | | | | | 50,304 | | | | 50,307,924 | |
0.38%, 3/15/16 (d) | | | | | 245,580 | | | | 245,733,487 | |
0.75%, 12/31/17-2/28/18 (d) | | | | | 3,813 | | | | 3,812,857 | |
0.88%, 1/31/18 | | | | | 5,529 | | | | 5,564,850 | |
1.38%, 1/31/20 (d) | | | | | 32,062 | | | | 32,427,699 | |
2.00%, 2/15/23 (d) | | | | | 118,535 | | | | 120,035,179 | |
| |
| |
Total U.S. Treasury Obligations – 22.4% | | | | 772,439,994 | |
| |
Total Long-Term Investments (Cost – $5,910,426,282) – 174.1% | | | | 6,004,871,044 | |
| |
| | | | | | | | | | |
| | | | | | | | | | |
| | | |
| Short-Term Securities | | | | | | | | |
| |
Borrowed Bond Agreements – 9.2% | |
Barclays Plc, (1.87)%, Open | | EUR | | | 827 | | | | 1,060,469 | |
(Purchased on 5/23/12 to be repurchased at EUR 797,159, collateralized by Kingdom of Spain, 3.40% due at 4/30/14, par and fair value of EUR 805,000 and $1,050,216, respectively) | | | | | | | | | | |
Barclays Plc, (0.75)%, Open | | | | | 2,081 | | | | 2,667,982 | |
(Purchased on 3/18/13 to be repurchased at EUR 1,996,572, collateralized by Kingdom of Spain, 4.10% due at 7/30/18, par and fair value of EUR 1,920,000 and $2,490,016, respectively) | | | | | | | | | | |
Barclays Plc, (0.50)%, Open | | | | | 1,934 | | | | 2,478,828 | |
(Purchased on 2/20/13 to be repurchased at EUR 1,851,165, collateralized by Buoni Poliennali Del Tesoro, 3.75% due at 8/01/21, par and fair value of EUR 1,870,000 and $2,348,595, respectively) | | | | | | | | | | |
|
| See Notes to Consolidated Financial Statements. |
| | | | | | |
| | | | | | | |
| 42 | | BLACKROCK BALANCED CAPITAL FUND, INC. | | MARCH 31, 2013 | | |
| | |
| Consolidated Schedule of Investments (continued) | | Master Total Return Portfolio (Percentages shown are based on Net Assets) |
| | | | | | | | | | |
| Short-Term Securities | | | | Par (000) | | | Value | |
| |
Borrowed Bond Agreements (continued) | |
Barclays Plc, (0.45)%, Open | | EUR | | | 2,120 | | | $ | 2,717,769 | |
(Purchased on 2/20/13 to be repurchased at EUR 1,990,329, collateralized by Kingdom of Spain, 5.90% due at 7/30/26, par and fair value of EUR 1,870,000 and $2,510,343, respectively) | | | | | | | | | | |
Barclays Plc, (0.25)%, Open | | | | | 192 | | | | 246,718 | |
(Purchased on 3/21/13 to be repurchased at EUR 190,356, collateralized by Kingdom of Spain, 5.50% due at 7/30/17, par and fair value of EUR 165,000 and $227,211, respectively) | | | | | | | | | | |
Barclays Plc, (0.22)%, Open | | | | | 2,753 | | | | 3,529,276 | |
(Purchased on 2/06/13 to be repurchased at EUR 2,673,182, collateralized by Buoni Poliennali Del Tesoro, 4.50% due at 3/01/26, par and fair value of EUR 2,600,000 and $3,267,526, respectively) | | | | | | | | | | |
Barclays Plc, (0.16)%, Open | | | | | 7,541 | | | | 9,666,524 | |
(Purchased on 1/16/13 to be repurchased at EUR 7,435,955, collateralized by Buoni Poliennali Del Tesoro, 4.75% due at 9/01/21, par and fair value of EUR 6,620,000 and $8,821,535, respectively) | | | | | | | | | | |
Barclays Plc, (0.10)%, Open | | | | | 5,793 | | | | 7,425,191 | |
(Purchased on 8/23/12 to be repurchased at EUR 5,759,540, collateralized by Republic of France, 4.00% due at 4/25/18, par and fair value of EUR 4,960,000 and $7,350,615, respectively) | | | | | | | | | | |
Barclays Plc, (0.09)%, Open | | | | | 3,844 | | | | 4,926,942 | |
(Purchased on 2/06/13 to be repurchased at EUR 3,813,748, collateralized by Buoni Poliennali Del Tesoro, 4.75% due at 9/01/21, par and fair value of EUR 3,460,000 and $4,496,259, respectively) | | | | | | | | | | |
Barclays Plc, (0.09)%, Open | | | | | 2,164 | | | | 2,774,328 | |
(Purchased on 3/01/13 to be repurchased at EUR 2,153,730, collateralized by Kingdom of Spain, 4.10% due at 7/30/18, par and fair value of EUR 2,010,000 and $2,589,269, respectively) | | | | | | | | | | |
Barclays Plc, (0.08)%, Open | | | | | 2,883 | | | | 3,695,228 | |
(Purchased on 1/28/13 to be repurchased at EUR 2,862,759, collateralized by Buoni Poliennali Del Tesoro, 4.75% due at 9/01/21, par and fair value of EUR 2,550,000 and $3,372,214, respectively) | | | | | | | | | | |
Barclays Plc, (0.08)%, Open | | | | | 733 | | | | 939,565 | |
(Purchased on 1/29/13 to be repurchased at EUR 727,899, collateralized by Buoni Poliennali Del Tesoro, 4.75% due at 9/01/21, par and fair value of EUR 650,000 and $857,434, respectively) | | | | | | | | | | |
Barclays Plc, (0.08)%, Open | | | | | 29,578 | | | | 37,912,665 | |
(Purchased on 11/14/12 to be repurchased at EUR 29,465,149, collateralized by French Treasury Notes, 1.00% due at 7/25/17, par and fair value of EUR 29,115,000 and $37,814,440, respectively) | | | | | | | | | | |
Barclays Plc, (0.08)%, Open | | | | | 29,584 | | | | 37,920,151 | |
(Purchased on 11/14/12 to be repurchased at EUR 29,470,967, collateralized by French Treasury Notes, 1.00% due at 7/25/17, par and fair value of EUR 29,115,000 and $37,821,907, respectively) | | | | | | | | | | |
| | | | | | | | | | |
| Short-Term Securities | | | | Par (000) | | | Value | |
| |
Borrowed Bond Agreements (continued) | |
Barclays Plc, (0.07)%, Open | | EUR | | | 2,284 | | | $ | 2,927,934 | |
(Purchased on 2/27/13 to be repurchased at EUR 2,271,005, collateralized by Kingdom of Spain, 5.50% due at 4/30/21, par and fair value of EUR 2,030,000 and $2,736,320, respectively) | | | | | | | | | | |
Barclays Plc, (0.06)%, Open | | | | | 5,114 | | | | 6,555,740 | |
(Purchased on 1/29/13 to be repurchased at EUR 5,093,536, collateralized by Republic of France, 3.75% due at 10/25/19, par and fair value of EUR 4,450,000 and $6,614,769, respectively) | | | | | | | | | | |
Citigroup, Inc., (0.10)%, Open | | | | | 59,609 | | | | 76,406,176 | |
(Purchased on 11/15/12 to be repurchased at EUR 59,325,691, collateralized by French Treasury Notes, 1.00% due at 7/25/17, par and fair value of EUR 58,800,000 and $76,208,221, respectively) | | | | | | | | | | |
Citigroup, Inc., (0.02)%, Open | | | | | 1,980 | | | | 2,538,349 | |
(Purchased on 10/25/12 to be repurchased at EUR 1,978,326, collateralized by Kingdom of Belgium, 5.50% due at 9/28/17, par and fair value of EUR 1,640,000 and $2,534,397, respectively) | | | | | | | | | | |
Citigroup, Inc., (0.02)%, Open | | | | | 2,138 | | | | 2,740,849 | |
(Purchased on 10/25/12 to be repurchased at EUR 2,136,584, collateralized by Kingdom of Belgium, 3.25% due at 9/28/16, par and fair value of EUR 1,955,000 and $2,738,719, respectively) | | | | | | | | | | |
Citigroup, Inc., (0.02)%, Open | | | | | 3,908 | | | | 5,008,770 | |
(Purchased on 10/25/12 to be repurchased at EUR 3,900,540, collateralized by Kingdom of Belgium, 4.25% due at 9/28/21, par and fair value of EUR 3,365,000 and $5,133,897, respectively) | | | | | | | | | | |
Credit Suisse Group AG, (0.50)%, Open | | USD | | | 29,029 | | | | 29,028,656 | |
(Purchased on 2/15/13 to be repurchased at $27,568,757, collateralized by U.S. Treasury Inflation Indexed Notes, 0.13% due at 1/15/23, par and fair value of USD 27,225,000 and $29,295,190, respectively) | | | | | | | | | | |
Credit Suisse Group AG, (0.12)%, Open | | | | | 1,255 | | | | 1,255,275 | |
(Purchased on 3/19/13 to be repurchased at $1,244,655, collateralized by U.S. Treasury Notes, 1.25% due at 2/29/20, par and fair value of USD 1,260,000 and $1,261,968, respectively) | | | | | | | | | | |
Credit Suisse Group AG, (0.01)%, Open | | | | | 678 | | | | 677,554 | |
(Purchased on 2/27/13 to be repurchased at $676,886, collateralized by U.S. Treasury Notes, 1.63% due at 11/15/22, par and fair value of USD 687,000 and $674,817, respectively) | | | | | | | | | | |
Credit Suisse Group AG, 0.00%, Open | | | | | 54,521 | | | | 54,520,725 | |
(Purchased on 3/27/13 to be repurchased at $54,520,725, collateralized by U.S. Treasury Notes, 0.88% due at 4/30/17, par and fair value of USD 53,715,000 and $55,172,411, respectively) | | | | | | | | | | |
Credit Suisse Group AG, 0.03%, Open | | | | | 15,177 | | | | 15,177,172 | |
(Purchased on 3/27/13 to be repurchased at $15,314,083, collateralized by U.S. Treasury Bonds, 2.75% due at 11/15/42, par and fair value of USD 16,254,000 and $15,065,426, respectively) | | | | | | | | | | |
See Notes to Consolidated Financial Statements.
| | | | | | |
| | | | | | | |
| | BLACKROCK BALANCED CAPITAL FUND, INC. | | MARCH 31, 2013 | | 43 |
| | |
| Consolidated Schedule of Investments (continued) | | Master Total Return Portfolio (Percentages shown are based on Net Assets) |
| | | | | | | | | | |
| Short-Term Securities | | | | Par (000) | | | Value | |
| |
Borrowed Bond Agreements (concluded) | |
Credit Suisse Group AG, 0.08%, Open | | USD | | | 103 | | | $ | 102,600 | |
(Purchased on 1/29/13 to be repurchased at $103,388, collateralized by U.S. Treasury Inflation Indexed Notes, 0.13% due at 7/15/22, par and fair value of USD 95,000 and $103,660, respectively) | | | | | | | | | | |
Morgan Stanley, (0.05)%, Open | | EUR | | | 2,811 | | | | 3,603,380 | |
(Purchased on 3/04/13 to be repurchased at EUR 2,798,482, collateralized by Kingdom of Spain, 5.85% due at 1/31/22, par and fair value of EUR 2,585,000 and $3,513,917, respectively) | | | | | | | | | | |
| | | | | | | | | | |
| | | |
| | | | | | | | | 318,504,816 | |
| |
| | | |
| | | | | Shares | | | | |
| |
Money Market Funds – 0.4% | |
BlackRock Liquidity Funds, TempFund, Institutional Class, 0.09% (g)(m) | | 12,522,057 | | | | 12,522,057 | |
| |
| |
Total Short-Term Securities (Cost – $331,733,120) – 9.6% | | | | 331,026,873 | |
| |
| | | | | | | | | | |
| | | | | | | | | | |
| | | |
| Options Purchased | | | | | | | | |
| |
(Cost – $29,176,189) – 1.5% | | | | 53,534,885 | |
| |
Total Investments Before TBA Sale Commitments, Options Written and Borrowed Bonds (Cost – $6,271,335,591*) – 185.2% | | | | 6,389,432,802 | |
| |
| | | | | | | | | | |
| | | | | | | | | | |
| TBA Sale Commitments (l) | | | | Par (000) | | | | |
| |
Fannie Mae Mortgage-Backed Securities: | | | | | | | | | | |
2.50%, 4/01/28 | | USD | | | 31,700 | | | | (32,883,798 | ) |
3.00%, 4/01/28-4/01/43 | | | | | 212,500 | | | | (219,415,345 | ) |
3.50%, 4/01/28-4/01/43 | | | | | 176,200 | | | | (186,203,656 | ) |
4.00%, 4/01/28-4/01/43 | | | | | 254,500 | | | | (271,309,133 | ) |
4.50%, 4/01/43 | | | | | 202,200 | | | | (217,886,416 | ) |
5.00%, 4/01/43 | | | | | 115,900 | | | | (125,543,541 | ) |
5.50%, 4/01/43 | | | | | 82,700 | | | | (90,172,814 | ) |
6.00%, 4/01/43 | | | | | 16,900 | | | | (18,510,781 | ) |
6.50%, 4/01/43 | | | | | 5,600 | | | | (6,226,500 | ) |
Freddie Mac Mortgage-Backed Securities: | | | | | | | | | | |
3.00%, 4/01/28-4/01/43 | | | | | 42,200 | | | | (43,730,688 | ) |
3.50%, 4/01/43 | | | | | 300 | | | | (315,692 | ) |
4.00%, 4/01/43 | | | | | 46,300 | | | | (49,208,219 | ) |
4.50%, 4/01/43 | | | | | 15,200 | | | | (16,259,250 | ) |
Ginnie Mae Mortgage-Backed Securities: | | | | | | | | | | |
3.50%, 4/15/43 | | | | | 5,600 | | | | (6,023,500 | ) |
4.00%, 4/15/43 | | | | | 46,500 | | | | (50,319,613 | ) |
4.50%, 4/15/43 | | | | | 13,000 | | | | (14,223,280 | ) |
| |
| |
Total TBA Sale Commitments (Proceeds – $1,345,382,833) – (39.1)% | | | | (1,348,232,226 | ) |
| |
| | | | | | | | | | |
| | | | | | | | | | |
| | | | | | | | | | |
Options Written | | | | | | | Value | |
| |
(Premiums Received – $ 20,046,436) – (1.1)% | | | $ | (39,164,364 | ) |
| |
| | | | | | | | | | |
| | | | | | | | | | |
| | | |
| Borrowed Bonds | | | | Par
(000) | | | | |
| |
Foreign Government Obligations – (6.2)% | |
Buoni Poliennali Del Tesoro, | | | | | | | | | | |
3.75%, 8/01/21 | | EUR | | | 1,870 | | | | (2,348,595 | ) |
4.75%, 9/01/21 | | | | | 13,280 | | | | (17,547,442 | ) |
4.50%, 3/01/26 | | | | | 2,600 | | | | (3,267,526 | ) |
French Treasury Notes, | | | | | | | | | | |
1.00%, 7/25/17 | | | | | 117,030 | | | | (151,844,567 | ) |
Kingdom of Belgium, | | | | | | | | | | |
3.25%, 9/28/16 | | | | | 1,955 | | | | (2,738,719 | ) |
5.50%, 9/28/17 | | | | | 1,640 | | | | (2,534,397 | ) |
4.25%, 9/28/21 | | | | | 3,365 | | | | (5,133,897 | ) |
Kingdom of Spain, | | | | | | | | | | |
3.40%, 4/30/14 | | | | | 805 | | | | (1,050,216 | ) |
5.50%, 7/30/17-4/30/21 | | | | | 2,195 | | | | (2,963,531 | ) |
4.10%, 7/30/18 | | | | | 3,930 | | | | (5,079,285 | ) |
5.85%, 1/31/22 | | | | | 2,585 | | | | (3,513,917 | ) |
5.90%, 7/30/26 | | | | | 1,870 | | | | (2,510,343 | ) |
Republic of France, | | | | | | | | | | |
4.00%, 4/25/18 | | | | | 4,960 | | | | (7,350,615 | ) |
3.75%, 10/25/19 | | | | | 4,450 | | | | (6,614,769 | ) |
| | | | | | | | | | |
| | | |
| | | | | | | | | (214,497,819 | ) |
| |
U.S. Treasury Obligations – (1.4)% | |
U.S. Treasury Bonds, | | | | | | | | | | |
2.75%, 11/15/42 | | USD | | | 16,254 | | | | (15,065,426 | ) |
U.S. Treasury Inflation Indexed Notes, | | | | | | | | | | |
0.13%, 4/15/17-1/15/23 (d) | | | | | 27,467 | | | | (29,628,457 | ) |
U.S. Treasury Notes, | | | | | | | | | | |
1.25%, 2/29/20 | | | | | 1,260 | | | | (1,261,968 | ) |
1.63%, 11/15/22 | | | | | 687 | | | | (674,817 | ) |
| | | | | | | | | | |
| | | |
| | | | | | | | | (46,630,668 | ) |
| |
Total Borrowed Bonds (Proceeds – $261,837,012) – (7.6)% | | | | (261,128,487 | ) |
| |
Total Investments Net of TBA Sale Commitments, Options Written and Borrowed Bonds – 137.4% | | | | 4,740,907,725 | |
Liabilities in Excess of Other Assets – (37.4)% | | | | (1,291,351,477 | ) |
| | | | | | | | | | |
| |
Net Assets – 100.0% | | | $ | 3,449,556,248 | |
| | | | | | | | | | |
|
|
Notes to Consolidated Schedule of Investments |
|
| * | | As of March 31, 2013, gross unrealized appreciation and gross unrealized depreciation based on cost for federal income tax purposes were as follows: |
| | | | |
Tax cost | | $ | 6,279,868,542 | |
| | | | |
Gross unrealized appreciation | | $ | 133,734,616 | |
Gross unrealized depreciation | | | (24,170,356 | ) |
| | | | |
Net unrealized appreciation | | $ | 109,564,260 | |
| | | | |
See Notes to Consolidated Financial Statements.
| | | | | | |
| | | | | | | |
| 44 | | BLACKROCK BALANCED CAPITAL FUND, INC. | | MARCH 31, 2013 | | |
| | |
| Consolidated Schedule of Investments (continued) | | Master Total Return Portfolio |
| (a) | Variable rate security. Rate shown is as of report date. |
| (b) | Security exempt from registration pursuant to Rule 144A under the Securities Act of 1933, as amended. These securities may be resold in transactions exempt from registration to qualified institutional investors. |
| (c) | Represents a step-up bond that pays an initial coupon rate for the first period and then a higher coupon rate for the following periods. Rate shown is as of report date. |
| (d) | All or a portion of security has been pledged as collateral in connection with open reverse repurchase agreements. |
| (e) | Represents a payment-in-kind security which may pay interest/dividends in additional par/shares. |
| (f) | Represents a zero-coupon bond. Rate shown reflects the current yield as of report date. |
| (g) | Investments in issuers considered to be an affiliate of the Master Portfolio during the six months ended March 31, 2013, for purposes of Section 2(a)(3) of the Investment Company Act of 1940, as amended, were as follows: |
| | | | | | | | | | | | | | | | | | | | | | | | |
| |
| Affiliate | | Par/Shares Held at September 30, 2012 | | | Par/Shares Purchased | | | Par/Shares
Sold | | | Par/Shares
Held at March 31, 2013 | | | Value at March 31, 2013 | | | Income | |
| |
BlackRock Capital Finance LP, Series 1997-R2, Class AP, 1.24%, 12/25/35 | | | $ 8,543 | | | | – | | | | $(8,543 | ) | | | – | | | | – | | | $ | 52 | |
BlackRock Liquidity Funds, TempFund, Institutional Class | | | 9,146,877 | | | | 3,375,1801 | | | | – | | | | 12,522,057 | | | $ | 12,522,057 | | | $ | 53 | |
iShares JPMorgan USD Emerging Markets Bond Fund | | | 114,500 | | | | – | | | | – | | | | 114,500 | | | $ | 13,450,315 | | | $ | 281,225 | |
| |
1 Represents net shares purchased. | | | | | | | | | | | | | | | | | | | | | | | | |
| (h) | Other interests represent beneficial interests in liquidation trusts and other reorganization or private entities. |
| (i) | Non-income producing security. |
| (j) | Issuer filed for bankruptcy and/or is in default of principal and/or interest payments. |
| (k) | Security is perpetual in nature and has no stated maturity date. |
| (l) | Represents or includes a TBA transaction. Unsettled TBA transactions as of March 31, 2013 were as follows: |
| | | | | | | | | | |
| | | |
| Counterparty | | Value | | | Unrealized
Appreciation
(Depreciation) | | | |
| | | |
Bank of America Corp. | | $ | (24,245,107 | ) | | | $(110,045 | ) | | |
BNP Paribas SA | | $ | (13,605,765 | ) | | | $ (76,296 | ) | | |
Citigroup, Inc. | | $ | (16,814,917 | ) | | | $ 28,692 | | | |
Credit Suisse Group AG | | $ | 45,610,631 | | | | $ 385,393 | | | |
Deutsche Bank AG | | $ | (134,844,523 | ) | | | $(150,982 | ) | | |
Goldman Sachs Group, Inc. | | $ | (86,831,090 | ) | | | $(464,580 | ) | | |
JPMorgan Chase & Co. | | $ | 35,877,331 | | | | $ (22,525 | ) | | |
Morgan Stanley | | $ | 125,461,552 | | | | $ 112,448 | | | |
Nomura Securities International, Inc. | | $ | (15,274,218 | ) | | | $(142,968 | ) | | |
Royal Bank of Scotland Group Plc | | $ | (3,624,719 | ) | | | $ (11,953 | ) | | |
Wells Fargo & Co. | | $ | 4,125,625 | | | | $ 16,250 | | | |
| | | |
| (m) | Represents the current yield as of report date. |
| — | | For Master Portfolio compliance purposes, the Master Portfolio’s industry classifications refer to any one or more of the industry sub-classifications used by one or more widely recognized market indexes or ratings group indexes, and/or as defined by the Master Portfolio management. These definitions may not apply for purposes of this report, which may combine such industry sub-classifications for reporting ease. |
| — | | Reverse repurchase agreements outstanding as of March 31, 2013 were as follows: |
| | | | | | | | | | | | | | |
| |
| Counterparty | | Interest Rate | | Trade Date | | Maturity Date | | Face Value | | | Face Value
Including
Accrued
Interest | |
| |
Deutsche Bank AG | | 0.17% | | 7/25/12 | | Open | | $ | 6,374,500 | | | $ | 6,382,026 | |
Deutsche Bank AG | | 0.17% | | 7/25/12 | | Open | | | 3,506,062 | | | | 3,510,202 | |
Deutsche Bank AG | | 0.17% | | 7/25/12 | | Open | | | 8,874,187 | | | | 8,884,664 | |
Deutsche Bank AG | | 0.17% | | 10/10/12 | | Open | | | 11,616,506 | | | | 11,625,996 | |
Deutsche Bank AG | | 0.17% | | 10/10/12 | | Open | | | 5,294,375 | | | | 5,298,700 | |
Deutsche Bank AG | | 0.17% | | 10/10/12 | | Open | | | 2,245,687 | | | | 2,247,522 | |
Deutsche Bank AG | | (0.63)% | | 10/24/12 | | Open | | | 3,888,987 | | | | 3,878,252 | |
Morgan Stanley | | 0.32% | | 2/11/13 | | 4/11/13 | | | 198,022,501 | | | | 198,124,592 | |
Credit Suisse Group AG | | 0.12% | | 2/27/13 | | Open | | | 21,887,751 | | | | 21,890,158 | |
Credit Suisse Group AG | | 0.12% | | 2/27/13 | | Open | | | 40,578,597 | | | | 40,583,061 | |
HSBC Holdings Plc | | 0.29% | | 3/11/13 | | 4/11/13 | | | 156,558,789 | | | | 156,596,624 | |
HSBC Holdings Plc | | 0.29% | | 3/11/13 | | 4/11/13 | | | 98,800,737 | | | | 98,824,614 | |
Credit Suisse Group AG | | 0.12% | | 3/11/13 | | Open | | | 33,035,979 | | | | 33,038,181 | |
Credit Suisse Group AG | | 0.12% | | 3/11/13 | | Open | | | 10,665,710 | | | | 10,666,421 | |
Credit Suisse Group AG | | 0.12% | | 3/11/13 | | Open | | | 27,907,503 | | | | 27,909,363 | |
See Notes to Consolidated Financial Statements.
| | | | | | |
| | | | | | | |
| | BLACKROCK BALANCED CAPITAL FUND, INC. | | MARCH 31, 2013 | | 45 |
| | |
| Consolidated Schedule of Investments (continued) | | Master Total Return Portfolio |
| — | | Reverse repurchase agreements outstanding as of March 31, 2013 were as follows: (concluded) |
| | | | | | | | | | | | | | |
| |
| Counterparty | | Interest
Rate | | Trade
Date | | Maturity
Date | | Face Value | | | Face Value
Including Accrued Interest | |
| |
Credit Suisse Group AG | | 0.12% | | 3/11/13 | | Open | | $ | 7,401,569 | | | $ | 7,402,062 | |
JPMorgan Chase & Co. | | 0.00% | | 3/14/13 | | Open | | | 1,270,080 | | | | 1,270,080 | |
Citigroup, Inc. | | 0.00% | | 3/20/13 | | Open | | | 4,554,000 | | | | 4,554,000 | |
BNP Paribas SA | | 0.10% | | 3/22/13 | | Open | | | 32,320,000 | | | | 32,320,898 | |
BNP Paribas SA | | 0.14% | | 3/22/13 | | Open | | | 42,793,369 | | | | 42,795,033 | |
BNP Paribas SA | | 0.14% | | 3/22/13 | | Open | | | 23,487,075 | | | | 23,487,989 | |
Bank of America Corp. | | 0.03% | | 3/28/13 | | 4/01/13 | | | 3,337,166 | | | | 3,337,177 | |
Bank of America Corp. | | 0.18% | | 3/28/13 | | 4/01/13 | | | 50,304,000 | | | | 50,305,006 | |
Credit Suisse Group AG | | 0.00% | | 3/28/13 | | 4/01/13 | | | 116,680,744 | | | | 116,680,744 | |
Deutsche Bank AG | | 0.11% | | 3/28/13 | | 4/01/13 | | | 245,886,975 | | | | 245,889,980 | |
Morgan Stanley | | 0.25% | | 3/28/13 | | 4/01/13 | | | 222,200,000 | | | | 222,206,172 | |
| |
Total | | | | | | | | $ | 1,379,492,849 | | | $ | 1,379,709,517 | |
| | | | | | | | | | |
| — | | Financial futures contracts as of March 31, 2013 were as follows: |
| | | | | | | | | | | | | | | | |
| |
Contracts Purchased/(Sold) | | Issue | | Exchange | | Expiration | | Notional Value | | | Unrealized
Appreciation
(Depreciation) | |
| |
| | Euro-Bund 8.5 to 10.5-Year | | | | | | | | | | | | | | |
| | Bond Futures Put Options, | | | | | | | | | | | | | | |
92 | | Strike Price EUR 143.50 | | Eurex | | April 2013 | | USD | | | 61,321 | | | | $ 2,255 | |
| | Canadian Government Bonds | | | | | | | | | | | | | | |
86 | | (10 Year) | | Montreal | | June 2013 | | USD | | | 11,414,253 | | | | 50,538 | |
354 | | Euro Dollar Futures | | Chicago Mercantile | | June 2013 | | USD | | | 88,207,950 | | | | (6,368 | ) |
124 | | EURO STOXX 50 Index | | Eurex | | June 2013 | | USD | | | 4,059,409 | | | | (20,930 | ) |
509 | | U.S. Treasury Notes (2 Year) | | Chicago Board of Trade | | June 2013 | | USD | | | 112,210,641 | | | | (5,932 | ) |
2,229 | | U.S. Treasury Notes (5 Year) | | Chicago Board of Trade | | June 2013 | | USD | | | 276,517,900 | | | | 632,386 | |
341 | | U.S. Treasury Bonds (30 Year) | | Chicago Board of Trade | | June 2013 | | USD | | | 49,263,844 | | | | 287,173 | |
354 | | Euro Dollar Futures | | Chicago Mercantile | | September 2013 | | USD | | | 88,172,550 | | | | (8,262 | ) |
981 | | Euro Dollar Futures | | Chicago Mercantile | | December 2013 | | USD | | | 244,269,000 | | | | (33,148 | ) |
354 | | Euro Dollar Futures | | Chicago Mercantile | | March 2015 | | USD | | | 88,128,300 | | | | (10,537 | ) |
| | Euro-Bund 8.5 to 10.5-Year | | | | | | | | | | | | | | |
| | Bond Futures Put Options, | | | | | | | | | | | | | | |
(92) | | Strike Price EUR 142.00 | | Eurex | | April 2013 | | USD | | | (28,302 | ) | | | (8,359 | ) |
(508) | | Euro-Bobl | | Eurex | | June 2013 | | USD | | | (82,514,287 | ) | | | (455,086 | ) |
(1,547) | | Euro-Bund | | Eurex | | June 2013 | | USD | | | (288,498,614 | ) | | | (933,968 | ) |
(18) | | Euro-Schatz | | Eurex | | June 2013 | | USD | | | (2,556,883 | ) | | | (3,366 | ) |
(133) | | Gilt British | | Chicago Mercantile | | June 2013 | | USD | | | (24,009,405 | ) | | | (542,327 | ) |
(62) | | S&P 500 E-Mini Index | | Chicago Mercantile | | June 2013 | | USD | | | (4,844,525 | ) | | | (15,639 | ) |
(1,026) | | U.S. Treasury Notes (10 Year) | | Chicago Board of Trade | | June 2013 | | USD | | | (135,415,969 | ) | | | (715,620 | ) |
(181) | | Ultra Treasury Bonds | | Chicago Board of Trade | | June 2013 | | USD | | | (28,524,469 | ) | | | 145,660 | |
| | Canadian Bank Acceptance | | | | | | | | | | | | | | |
(627) | | Future | | Montreal | | September 2014 | | USD | | | (151,973,385 | ) | | | 14,065 | |
(320) | | 3-month EURIBOR | | London | | December 2014 | | USD | | | (102,046,663 | ) | | | (72,203 | ) |
(354) | | Euro Dollar Futures | | Chicago Mercantile | | June 2016 | | USD | | | (87,438,000 | ) | | | (49,596 | ) |
(787) | | Euro Dollar Futures | | Chicago Mercantile | | September 2016 | | USD | | | (194,064,363 | ) | | | (77,711 | ) |
(354) | | Euro Dollar Futures | | Chicago Mercantile | | December 2016 | | USD | | | (87,137,100 | ) | | | (53,858 | ) |
(354) | | Euro Dollar Futures | | Chicago Mercantile | | March 2017 | | USD | | | (86,982,225 | ) | | | (54,291 | ) |
| |
Total | | | | | | | | | | | | | | | $(1,935,124 | ) |
| | | | | | | | | | | | | | | | |
| — | | Foreign currency exchange contracts as of March 31, 2013 were as follows: |
| | | | | | | | | | | | | | |
| |
Currency Purchased | | Currency Sold | | | | Counterparty | | Settlement
Date | | Unrealized
Appreciation
(Depreciation) | |
| |
GBP | | 2,643,000 | | USD | | 4,041,636 | | Bank of New York Mellon Corp. | | 4/17/13 | | | $ (26,160 | ) |
GBP | | 11,269,000 | | USD | | 18,086,914 | | Deutsche Bank AG | | 4/17/13 | | | (966,065 | ) |
USD | | 1,494,556 | | GBP | | 1,005,000 | | BNP Paribas SA | | 4/17/13 | | | (32,328 | ) |
See Notes to Consolidated Financial Statements.
| | | | | | |
| | | | | | | |
| 46 | | BLACKROCK BALANCED CAPITAL FUND, INC. | | MARCH 31, 2013 | | |
| | |
| Consolidated Schedule of Investments (continued) | | Master Total Return Portfolio |
| — | | Foreign currency exchange contracts as of March 31, 2013 were as follows: (continued) |
| | | | | | | | | | | | | | |
| |
Currency Purchased | | | | Currency Sold | | | | Counterparty | | Settlement Date | | Unrealized
Appreciation
(Depreciation) | |
| |
USD | | 1,237,782 | | GBP | | 789,000 | | BNP Paribas SA | | 4/17/13 | | $ | 39,065 | |
USD | | 239,992 | | GBP | | 158,367 | | Citigroup, Inc. | | 4/17/13 | | | (613 | ) |
USD | | 3,921,836 | | GBP | | 2,473,756 | | Citigroup, Inc. | | 4/17/13 | | | 163,490 | |
USD | | 861,952 | | GBP | | 574,000 | | Credit Suisse Group AG | | 4/17/13 | | | (10,119 | ) |
USD | | 2,392,710 | | GBP | | 1,589,000 | | Deutsche Bank AG | | 4/17/13 | | | (21,438 | ) |
USD | | 916,027 | | GBP | | 615,000 | | Deutsche Bank AG | | 4/17/13 | | | (18,335 | ) |
USD | | 81,442,999 | | GBP | | 50,448,000 | | Deutsche Bank AG | | 4/17/13 | | | 4,797,993 | |
USD | | 391,692 | | GBP | | 259,000 | | Royal Bank of Scotland Group Plc | | 4/17/13 | | | (1,803 | ) |
USD | | 150,531 | | SEK | | 981,770 | | BNP Paribas SA | | 4/17/13 | | | (61 | ) |
EUR | | 8,246,000 | | USD | | 10,681,225 | | Bank of New York Mellon Corp. | | 4/23/13 | | | (109,295 | ) |
EUR | | 18,201,000 | | USD | | 24,698,466 | | Deutsche Bank AG | | 4/23/13 | | | (1,363,551 | ) |
EUR | | 7,052,000 | | USD | | 9,237,020 | | Deutsche Bank AG | | 4/23/13 | | | (195,878 | ) |
EUR | | 18,651,000 | | USD | | 24,218,081 | | UBS AG | | 4/23/13 | | | (306,236 | ) |
USD | | 1,314,843 | | EUR | | 1,004,000 | | BNP Paribas SA | | 4/23/13 | | | 27,647 | |
USD | | 2,626,483 | | EUR | | 1,969,000 | | BNP Paribas SA | | 4/23/13 | | | 102,091 | |
USD | | 3,587,744 | | EUR | | 2,667,000 | | BNP Paribas SA | | 4/23/13 | | | 168,470 | |
USD | | 3,586,103 | | EUR | | 2,758,000 | | Citigroup, Inc. | | 4/23/13 | | | 50,161 | |
USD | | 439,126,708 | | EUR | | 329,551,000 | | Citigroup, Inc. | | 4/23/13 | | | 16,620,009 | |
USD | | 750,173 | | EUR | | 560,000 | | Deutsche Bank AG | | 4/23/13 | | | 32,215 | |
USD | | 1,604,003 | | EUR | | 1,199,000 | | Deutsche Bank AG | | 4/23/13 | | | 66,804 | |
USD | | 4,529,943 | | EUR | | 3,448,327 | | Deutsche Bank AG | | 4/23/13 | | | 108,954 | |
USD | | 256,632 | | EUR | | 192,000 | | Royal Bank of Scotland Group Plc | | 4/23/13 | | | 10,475 | |
USD | | 329,659 | | EUR | | 247,000 | | Royal Bank of Scotland Group Plc | | 4/23/13 | | | 12,988 | |
USD | | 1,804,412 | | EUR | | 1,387,000 | | Royal Bank of Scotland Group Plc | | 4/23/13 | | | 26,184 | |
USD | | 1,214,883 | | EUR | | 912,000 | | Royal Bank of Scotland Group Plc | | 4/23/13 | | | 45,637 | |
USD | | 6,966,053 | | EUR | | 5,371,000 | | Royal Bank of Scotland Group Plc | | 4/23/13 | | | 80,067 | |
USD | | 8,684,690 | | EUR | | 6,627,000 | | Royal Bank of Scotland Group Plc | | 4/23/13 | | | 188,427 | |
USD | | 13,687,901 | | EUR | | 10,278,000 | | Royal Bank of Scotland Group Plc | | 4/23/13 | | | 510,809 | |
USD | | 2,255,073 | | EUR | | 1,694,000 | | UBS AG | | 4/23/13 | | | 83,250 | |
USD | | 6,712,102 | | EUR | | 5,041,000 | | UBS AG | | 4/23/13 | | | 249,198 | |
EUR | | 2,000,000 | | USD | | 2,584,310 | | BNP Paribas SA | | 4/25/13 | | | (20,142 | ) |
USD | | 2,573,520 | | EUR | | 2,000,000 | | JPMorgan Chase & Co. | | 4/25/13 | | | 9,352 | |
CNY | | 51,320,000 | | USD | | 8,097,830 | | HSBC Holdings Plc | | 6/07/13 | | | 127,102 | |
CNY | | 51,320,000 | | USD | | 8,102,305 | | Standard Chartered Plc | | 6/07/13 | | | 122,627 | |
USD | | 7,973,897 | | CNY | | 51,320,000 | | Standard Chartered Plc | | 6/07/13 | | | (251,035 | ) |
USD | | 7,987,549 | | CNY | | 51,320,000 | | Standard Chartered Plc | | 6/07/13 | | | (237,384 | ) |
AUD | | 16,530,000 | | USD | | 17,122,105 | | Barclays Plc | | 6/19/13 | | | (19,970 | ) |
CAD | | 6,440,933 | | USD | | 6,260,000 | | Deutsche Bank AG | | 6/19/13 | | | 68,429 | |
CHF | | 31,157,450 | | EUR | | 25,530,000 | | UBS AG | | 6/19/13 | | | 112,004 | |
EUR | | 25,530,000 | | CHF | | 31,248,899 | | Bank of America Corp. | | 6/19/13 | | | (208,442 | ) |
EUR | | 33,260,000 | | USD | | 42,969,193 | | Citigroup, Inc. | | 6/19/13 | | | (309,030 | ) |
GBP | | 3,350,000 | | USD | | 5,091,183 | | Deutsche Bank AG | | 6/19/13 | | | (3,228 | ) |
JPY | | 411,940,000 | | USD | | 4,300,000 | | Deutsche Bank AG | | 6/19/13 | | | 78,640 | |
JPY | | 3,566,287,500 | | USD | | 37,500,000 | | Standard Chartered Plc | | 6/19/13 | | | 407,195 | |
KRW | | 7,057,550,000 | | USD | | 6,460,000 | | Morgan Stanley | | 6/19/13 | | | (144,802 | ) |
NOK | | 18,930,000 | | SEK | | 21,016,540 | | Citigroup, Inc. | | 6/19/13 | | | 11,020 | |
USD | | 51,428,908 | | AUD | | 49,800,000 | | Westpac Banking Corp. | | 6/19/13 | | | (94,764 | ) |
USD | | 6,260,000 | | CAD | | 6,430,341 | | BNP Paribas SA | | 6/19/13 | | | (58,022 | ) |
See Notes to Consolidated Financial Statements.
| | | | | | |
| | | | | | | |
| | BLACKROCK BALANCED CAPITAL FUND, INC. | | MARCH 31, 2013 | | 47 |
| | |
| Consolidated Schedule of Investments (continued) | | Master Total Return Portfolio |
| — | | Foreign currency exchange contracts as of March 31, 2013 were as follows: (concluded) |
| | | | | | | | | | | | | | | | | | |
| |
Currency Purchased | | | | | Currency
Sold | | | | | Counterparty | | Settlement Date | | Unrealized
Appreciation
(Depreciation) | |
| |
USD | | | 34,316,777 | | | EUR | | | 26,830,000 | | | Deutsche Bank AG | | 6/19/13 | | $ | (96,096 | ) |
USD | | | 42,806,618 | | | EUR | | | 33,260,000 | | | Goldman Sachs Group, Inc. | | 6/19/13 | | | 146,455 | |
USD | | | 25,632,557 | | | GBP | | | 16,970,000 | | | Bank of America Corp. | | 6/19/13 | | | (141,352 | ) |
USD | | | 5,051,730 | | | GBP | | | 3,350,000 | | | Royal Bank of Scotland Group Plc | | 6/19/13 | | | (36,225 | ) |
USD | | | 53,594,000 | | | JPY | | | 5,087,051,370 | | | Bank of America Corp. | | 6/19/13 | | | (477,874 | ) |
USD | | | 8,710,000 | | | JPY | | | 826,738,393 | | | Bank of America Corp. | | 6/19/13 | | | (77,663 | ) |
USD | | | 4,170,000 | | | JPY | | | 396,105,381 | | | BNP Paribas SA | | 6/19/13 | | | (40,329 | ) |
USD | | | 6,460,000 | | | KRW | | | 7,053,028,000 | | | Deutsche Bank AG | | 6/19/13 | | | 148,848 | |
KRW | | | 2,385,174,000 | | | USD | | | 2,130,000 | | | Standard Chartered Plc | | 6/20/13 | | | 4,193 | |
KRW | | | 4,768,218,000 | | | USD | | | 4,260,000 | | | Standard Chartered Plc | | 6/20/13 | | | 6,480 | |
USD | | | 6,390,000 | | | KRW | | | 7,038,585,000 | | | BNP Paribas SA | | 6/20/13 | | | 92,054 | |
CNY | | | 53,305,000 | | | USD | | | 8,393,166 | | | Standard Chartered Plc | | 8/19/13 | | | 118,000 | |
USD | | | 8,273,320 | | | CNY | | | 53,305,000 | | | Credit Suisse Group AG | | 8/19/13 | | | (237,847 | ) |
| |
Total | | | | | | | | | | | | | | | | $ | 19,330,246 | |
| | | | | | | | | | | | | | | | | | |
| — | | Exchange-traded options purchased as of March 31, 2013 were as follows: |
| | | | | | | | | | | | | | | | | | |
|
| Description | | Put/
Call | | Strike Price | | | Expiration
Date | | Contracts | | | Market
Value |
|
EURO STOXX 50 Index | | Put | | | EUR | | | | 2,650.00 | | | 4/19/13 | | | 97 | | | $ 83,926 |
Euro Dollar (2 Year) Mid-Curve | | Put | | | USD | | | | 98.75 | | | 9/13/13 | | | 2,837 | | | 283,700 |
Euro Dollar (2 Year) Mid-Curve | | Put | | | USD | | | | 99.25 | | | 9/13/13 | | | 992 | | | 372,000 |
|
Total | | | | | | | | | | | | | | | | | | $739,626 |
| | | | | | | | | | | | | | | | | | |
| — | | Over-the-counter options purchased as of March 31, 2013 were as follows: |
| | | | | | | | | | | | | | | | | | | | | | | | |
|
| Description | | Counterparty | | Put/
Call | | Strike Price | | | Expiration
Date | | Notional Amount (000) | | | Market Value |
|
USD Currency | | Barclays Plc | | Call | | | JPY | | | | 84.00 | | | 4/03/13 | | | USD | | | | 138,670 | | | $14,828,108 |
USD Currency | | Citigroup, Inc. | | Call | | | JPY | | | | 81.50 | | | 4/03/13 | | | USD | | | | 70,135 | | | 9,363,324 |
USD Currency | | Credit Suisse Group AG | | Call | | | JPY | | | | 94.00 | | | 4/03/13 | | | USD | | | | 125,665 | | | 945,931 |
USD Currency | | Deutsche Bank AG | | Call | | | JPY | | | | 88.00 | | | 4/03/13 | | | USD | | | | 94,380 | | | 6,078,912 |
USD Currency | | Deutsche Bank AG | | Call | | | JPY | | | | 90.00 | | | 4/03/13 | | | USD | | | | 94,380 | | | 4,082,426 |
USD Currency | | Goldman Sachs Group, Inc. | | Call | | | JPY | | | | 90.00 | | | 4/03/13 | | | USD | | | | 31,285 | | | 1,353,239 |
USD Currency | | Deutsche Bank AG | | Call | | | JPY | | | | 100.30 | | | 9/12/13 | | | USD | | | | 32,650 | | | 326,304 |
AUD Currency | | Goldman Sachs Group, Inc. | | Put | | | USD | | | | 1.00 | | | 5/24/13 | | | AUD | | | | 32,930 | | | 79,646 |
AUD Currency | | JPMorgan Chase & Co. | | Put | | | USD | | | | 1.01 | | | 6/12/13 | | | AUD | | | | 44,990 | | | 252,056 |
|
Total | | | | | | | | | | | | | | | | | | | | | | | | $37,309,946 |
| | | | | | | | | | | | | | | | | | | | | | | | |
| — | | Over-the-counter credit default swaptions purchased as of March 31, 2013 were as follows: |
| | | | | | | | | | | | | | | | | | | | | | | | | | | | | | |
| |
| Description | | Counterparty | | Put/
Call | | Strike Price | | | Pay/Receive
Floating
Rate Index | | Floating Rate
Index | | Expiration
Date | | Notional Amount (000) | | | Market
Value | |
| |
Sold protection on 5-Year Credit Default Swaps | | JPMorgan Chase &
Co. | | Call | | | USD | | | | 160.00 | | | Pay | | iTraxx Sub
Financials Series 18
Version 1 | | 4/17/13 | | | EUR | | | | 9,620 | | | | $12,856 | |
| |
See Notes to Consolidated Financial Statements.
| | | | | | |
| | | | | | | |
| 48 | | BLACKROCK BALANCED CAPITAL FUND, INC. | | MARCH 31, 2013 | | |
| | |
| Consolidated Schedule of Investments (continued) | | Master Total Return Portfolio |
| — | | Over-the-counter interest rate swaptions purchased as of March 31, 2013 were as follows: |
| | | | | | | | | | | | | | | | | | | | | | |
|
| Description | | Counterparty | | Put/
Call | | Exercise Rate | | | Pay/Receive
Exercise Rate | | Floating Rate
Index | | Expiration
Date | | Notional Amount (000) | | | Market Value |
|
7-Year Interest Rate Swap | | Citigroup, Inc. | | Call | | | 1.23% | | | Receive | | 3-month LIBOR | | 8/27/13 | | USD | | | 33,690 | | | $ 58,314 |
10-Year Interest Rate Swap | | Citigroup, Inc. | | Call | | | 2.42% | | | Receive | | 3-month LIBOR | | 3/07/14 | | USD | | | 71,200 | | | 2,325,442 |
10-Year Interest Rate Swap | | Barclays Plc | | Call | | | 2.43% | | | Receive | | 3-month LIBOR | | 3/07/14 | | USD | | | 187,000 | | | 6,211,523 |
7-Year Interest Rate Swap | | Citigroup, Inc. | | Put | | | 1.73% | | | Pay | | 3-month LIBOR | | 8/27/13 | | USD | | | 43,750 | | | 347,484 |
| | | | | | | | | | | | 6-month JPY | | | | | | | | | | |
20-Year Interest Rate Swap | | Citigroup, Inc. | | Put | | | 1.88% | | | Pay | | LIBOR | | 11/18/13 | | JPY | | | 2,722,145 | | | 384,777 |
10-Year Interest Rate Swap | | Citigroup, Inc. | | Put | | | 2.42% | | | Pay | | 3-month LIBOR | | 3/07/14 | | USD | | | 71,200 | | | 1,712,830 |
10-Year Interest Rate Swap | | Barclays Plc | | Put | | | 2.43% | | | Pay | | 3-month LIBOR | | 3/07/14 | | USD | | | 187,000 | | | 4,432,087 |
|
Total | | | | | | | | | | | | | | | | | | | | | | $15,472,457 |
| | | | | | | | | | | | | | | | | | | | | | |
| — | | Exchange-traded options written as of March 31, 2013 were as follows: |
| | | | | | | | | | | | | | | | | | | | |
| |
| Description | | Put/
Call | | Strike Price | | | Expiration
Date | | Contracts | | | Market
Value | |
| |
U.S. Treasury Notes (10 Year) | | Call | | USD | | | 131.00 | | | 4/26/13 | | | 558 | | | | | $ | (680,062 | ) |
U.S. Treasury Notes (10 Year) | | Put | | USD | | | 129.00 | | | 4/26/13 | | | 558 | | | | | | (17,438 | ) |
Euro Dollar (3 Year) Mid-Curve | | Put | | USD | | | 98.13 | | | 9/13/13 | | | 1,419 | | | | | | (257,194 | ) |
| |
Total | | | | | | | | | | | | | | | | | | $ | (954,694 | ) |
| | | | | | | | | | | | | | | | | | | | |
| — | | Over-the-counter options written as of March 31, 2013 were as follows: |
| | | | | | | | | | | | | | | | | | | | | | | | |
| |
| Description | | Counterparty | | Put/
Call | | Strike Price | | | Expiration
Date | | Notional Amount (000) | | | Market Value | |
| |
USD Currency | | Barclays Plc | | Call | | JPY | | | 81.50 | | | 4/03/13 | | | USD | | | | 70,135 | | | $ | (9,363,703 | ) |
USD Currency | | Barclays Plc | | Call | | JPY | | | 88.00 | | | 4/03/13 | | | USD | | | | 94,380 | | | | (6,078,912 | ) |
USD Currency | | Credit Suisse Group AG | | Call | | JPY | | | 90.00 | | | 4/03/13 | | | USD | | | | 125,665 | | | | (5,435,665 | ) |
USD Currency | | Deutsche Bank AG | | Call | | JPY | | | 94.00 | | | 4/03/13 | | | USD | | | | 94,380 | | | | (710,436 | ) |
USD Currency | | Deutsche Bank AG | | Call | | JPY | | | 84.00 | | | 4/03/13 | | | USD | | | | 94,380 | | | | (10,092,138 | ) |
USD Currency | | Goldman Sachs Group, Inc. | | Call | | JPY | | | 94.00 | | | 4/03/13 | | | USD | | | | 31,285 | | | | (235,495 | ) |
USD Currency | | HSBC Holdings Plc | | Call | | JPY | | | 84.00 | | | 4/03/13 | | | USD | | | | 44,290 | | | | (4,735,730 | ) |
USD Currency | | Deutsche Bank AG | | Call | | JPY | | | 97.00 | | | 6/07/13 | | | USD | | | | 8,710 | | | | (80,146 | ) |
AUD Currency | | JPMorgan Chase & Co. | | Put | | USD | | | 0.97 | | | 6/12/13 | | | AUD | | | | 44,990 | | | | (66,241 | ) |
USD Currency | | Deutsche Bank AG | | Put | | JPY | | | 91.40 | | | 9/12/13 | | | USD | | | | 32,650 | | | | (646,770 | ) |
| |
Total | | | | | | | | | | | | | | | | | | | | | | $ | (37,445,236 | ) |
| | | | | | | | | | | | | | | | | | | | | | | | |
| — | | Over-the-counter credit default swaptions written as of March 31, 2013 were as follows: |
| | | | | | | | | | | | | | | | | | | | | | | | | | | | | | | | |
| |
| Description | | Counterparty | | Put/
Call | | Strike Price | | | Pay/Receive
Floating
Rate Index | | Floating Rate Index | | Rating1 | | Expiration
Date | | Notional Amount2 (000) | | | Market
Value | |
| |
Bought protection on 5-Year Credit Default Swaps | | Credit Suisse Group
AG | | Call | | USD | | | 90.00 | | | Receive | | CDX.NA.IG Series
20 Version 1 | | BBB+ | | 5/15/13 | | | USD | | | | 39,000 | | | | | $ | (73,702 | ) |
Bought protection on 5-Year Credit Default Swaps | | Credit Suisse Group
AG | | Call | | USD | | | 95.00 | | | Receive | | CDX.NA.IG Series
20 Version 1 | | BBB+ | | 5/15/13 | | | USD | | | | 39,000 | | | | | | (125,856 | ) |
Sold protection on 5-Year Credit Default Swaps | | Credit Suisse Group
AG | | Put | | USD | | | 100.00 | | | Pay | | CDX.NA.IG Series
20 Version 1 | | BBB+ | | 5/15/13 | | | USD | | | | 39,000 | | | | | | (66,444 | ) |
Sold protection on 5-Year Credit Default Swaps | | Credit Suisse Group
AG | | Put | | USD | | | 95.00 | | | Pay | | CDX.NA.IG Series
20 Version 1 | | BBB+ | | 5/15/13 | | | USD | | | | 39,000 | | | | | | (94,365 | ) |
| |
Total | | | | | | | | | | | | | | | | | | | | | | | | | | | | | | $ | (360,367 | ) |
| | | | | | | | | | | | | | | | | | | | | | | | | | | | | | | | |
| | 1 | Using S&P’s rating of the issuer or the underlying securities of the index, as applicable. |
| | 2 | The maximum potential amount the Fund may pay should a negative credit event take place as defined under the terms of the agreement. |
See Notes to Consolidated Financial Statements.
| | | | | | |
| | | | | | | |
| | BLACKROCK BALANCED CAPITAL FUND, INC. | | MARCH 31, 2013 | | 49 |
| | |
| Consolidated Schedule of Investments (continued) | | Master Total Return Portfolio |
| — | | Over-the-counter interest rate swaptions written as of March 31, 2013 were as follows: |
| | | | | | | | | | | | | | | | | | | | | | | | |
| |
| Description | | Counterparty | | Put/
Call | | Exercise Rate | | Pay/Receive
Exercise Rate | | Floating Rate
Index | | Expiration
Date | | Notional Amount (000) | | | Market
Value | |
| |
7-Year Interest Rate Swap | | Citigroup, Inc. | | Call | | 1.48% | | Pay | | 3-month LIBOR | | 8/27/13 | | | USD | | | | 33,690 | | | $ | (226,757 | ) |
7-Year Interest Rate Swap | | Citigroup, Inc. | | Put | | 1.98% | | Receive | | 3-month LIBOR | | 8/27/13 | | | USD | | | | 43,750 | | | | (177,310 | ) |
| |
Total | | | | | | | | | | | | | | | | | | | | | | $ | (404,067 | ) |
| | | | | | | | | | | | | | | | | | | | | | | | |
| — | | Credit default swaps - buy protection outstanding as of March 31, 2013 were as follows: |
| | | | | | | | | | | | | | | | | | |
| |
| Issuer/Index | | Pay
Fixed
Rate | | | Counterparty | | Expiration
Date | | Notional Amount (000) | | | Unrealized Appreciation (Depreciation) | |
| |
Kingdom of Spain | | | 1.00% | | | JPMorgan Chase & Co. | | 6/20/14 | | USD | | | 6,720 | | | $ | (57,572 | ) |
iTraxx Europe Series 9 3-6% | | | 5.00% | | | JPMorgan Chase & Co. | | 6/20/15 | | EUR | | | 5,915 | | | | (564,736 | ) |
Republic of Portugal | | | 1.00% | | | JPMorgan Chase & Co. | | 6/20/15 | | USD | | | 12,800 | | | | (338,683 | ) |
iTraxx Europe Series 18 Version 1 | | | 1.00% | | | JPMorgan Chase & Co. | | 12/20/15 | | EUR | | | 55,200 | | | | 31,965 | |
iTraxx Europe Series 18 Version 1 | | | 1.00% | | | JPMorgan Chase & Co. | | 12/20/15 | | EUR | | | 53,486 | | | | 30,973 | |
Republic of Portugal | | | 1.00% | | | Barclays Plc | | 12/20/15 | | USD | | | 1,200 | | | | (36,704 | ) |
Republic of Portugal | | | 1.00% | | | Deutsche Bank AG | | 12/20/15 | | USD | | | 1,350 | | | | (41,292 | ) |
Banca Monte dei Paschi di Siena SpA | | | 5.00% | | | Deutsche Bank AG | | 12/20/16 | | EUR | | | 750 | | | | 68,605 | |
The New York Times Co. | | | 1.00% | | | Barclays Plc | | 12/20/16 | | USD | | | 3,100 | | | | (79,049 | ) |
Republic of Ireland | | | 1.00% | | | Citigroup, Inc. | | 12/20/16 | | USD | | | 4,000 | | | | (611,038 | ) |
Transocean Worldwide, Inc. | | | 1.00% | | | Goldman Sachs Group, Inc. | | 12/20/16 | | USD | | | 5,750 | | | | (122,069 | ) |
Banca Monte dei Paschi di Siena SpA | | | 5.00% | | | JPMorgan Chase & Co. | | 3/20/17 | | EUR | | | 3,800 | | | | 504,063 | |
Republic of Ireland | | | 1.00% | | | Citigroup, Inc. | | 3/20/17 | | USD | | | 2,000 | | | | (255,782 | ) |
Republic of Ireland | | | 1.00% | | | Goldman Sachs Group, Inc. | | 3/20/17 | | USD | | | 11,000 | | | | (1,668,464 | ) |
Banco de Sabadell SA | | | 5.00% | | | BNP Paribas SA | | 6/20/17 | | EUR | | | 720 | | | | (50,291 | ) |
Caja de Ahorros Y Pensiones de Barcelona | | | 3.00% | | | BNP Paribas SA | | 6/20/17 | | EUR | | | 720 | | | | (11,519 | ) |
Caja de Ahorros Y Pensiones de Barcelona | | | 3.00% | | | BNP Paribas SA | | 6/20/17 | | EUR | | | 540 | | | | (9,962 | ) |
CDX.NA.IG Series 18 Version 1 | | | 1.00% | | | Credit Suisse Group AG | | 6/20/17 | | USD | | | 103,800 | | | | (1,253,526 | ) |
Republic of Portugal | | | 1.00% | | | Citigroup, Inc. | | 6/20/17 | | USD | | | 6,000 | | | | (1,082,803 | ) |
Banco Bilbao Vizcaya Argentaria SA | | | 3.00% | | | Citigroup, Inc. | | 9/20/17 | | EUR | | | 2,230 | | | | (72,042 | ) |
Kingdom of Spain | | | 1.00% | | | Barclays Plc | | 9/20/17 | | USD | | | 1,400 | | | | (128,926 | ) |
Kingdom of Spain | | | 1.00% | | | Barclays Plc | | 9/20/17 | | USD | | | 985 | | | | (96,315 | ) |
Kingdom of Spain | | | 1.00% | | | BNP Paribas SA | | 9/20/17 | | USD | | | 130 | | | | (10,605 | ) |
Peugeot SA | | | 5.00% | | | BNP Paribas SA | | 9/20/17 | | EUR | | | 5,950 | | | | (194,071 | ) |
CDX.NA.HY Series 19 Version 1 | | | 5.00% | | | Credit Suisse Group AG | | 12/20/17 | | USD | | | 17,540 | | | | (703,036 | ) |
CDX.NA.IG Series 19 Version 1 | | | 1.00% | | | Credit Suisse Group AG | | 12/20/17 | | USD | | | 12,500 | | | | (36,292 | ) |
CDX.NA.IG Series 19 Version 1 | | | 1.00% | | | Credit Suisse Group AG | | 12/20/17 | | USD | | | 11,635 | | | | 1,700 | |
CDX.NA.IG Series 19 Version 1 | | | 1.00% | | | Credit Suisse Group AG | | 12/20/17 | | USD | | | 10,000 | | | | (18,416 | ) |
Clariant AG | | | 1.00% | | | BNP Paribas SA | | 12/20/17 | | EUR | | | 1,300 | | | | (86,275 | ) |
Clariant AG | | | 1.00% | | | JPMorgan Chase & Co. | | 12/20/17 | | EUR | | | 2,070 | | | | (207,695 | ) |
Compagnie de Saint-Gobain SA | | | 1.00% | | | Goldman Sachs Group, Inc. | | 12/20/17 | | EUR | | | 750 | | | | (9,354 | ) |
Compagnie de Saint-Gobain SA | | | 1.00% | | | JPMorgan Chase & Co. | | 12/20/17 | | EUR | | | 555 | | | | (11,642 | ) |
Diageo Plc | | | 1.00% | | | Deutsche Bank AG | | 12/20/17 | | EUR | | | 3,650 | | | | (6,244 | ) |
Henkel AG & Co. KGaA | | | 1.00% | | | Credit Suisse Group AG | | 12/20/17 | | EUR | | | 1,950 | | | | (9,089 | ) |
iTraxx Sub Financials Series 18 Version 1 | | | 1.00% | | | Citigroup, Inc. | | 12/20/17 | | EUR | | | 4,700 | | | | 84,051 | |
Lafarge SA | | | 1.00% | | | Credit Suisse Group AG | | 12/20/17 | | EUR | | | 250 | | | | (9,646 | ) |
Banco de Sabadell SA | | | 5.00% | | | Barclays Plc | | 3/20/18 | | EUR | | | 620 | | | | 15,631 | |
Banco de Sabadell SA | | | 5.00% | | | JPMorgan Chase & Co. | | 3/20/18 | | EUR | | | 620 | | | | 22,903 | |
Banco Popular Espanol SA | | | 5.00% | | | Barclays Plc | | 3/20/18 | | EUR | | | 1,320 | | | | 59,182 | |
Banco Popular Espanol SA | | | 5.00% | | | JPMorgan Chase & Co. | | 3/20/18 | | EUR | | | 620 | | | | 22,373 | |
Commerzbank AG | | | 1.00% | | | Barclays Plc | | 3/20/18 | | EUR | | | 3,100 | | | | 60,432 | |
Compagnie de Saint-Gobain SA | | | 1.00% | | | JPMorgan Chase & Co. | | 3/20/18 | | EUR | | | 620 | | | | (8,996 | ) |
Deutsche Bank AG | | | 1.00% | | | Barclays Plc | | 3/20/18 | | EUR | | | 3,200 | | | | 54,505 | |
Deutsche Bank AG | | | 1.00% | | | Citigroup, Inc. | | 3/20/18 | | EUR | | | 1,250 | | | | 22,001 | |
Finmeccanica SpA | | | 5.00% | | | Bank of America Corp. | | 3/20/18 | | EUR | | | 470 | | | | 10,750 | |
See Notes to Consolidated Financial Statements.
| | | | | | |
| | | | | | | |
| 50 | | BLACKROCK BALANCED CAPITAL FUND, INC. | | MARCH 31, 2013 | | |
| | |
| Consolidated Schedule of Investments (continued) | | Master Total Return Portfolio |
| — | | Credit default swaps - buy protection outstanding as of March 31, 2013 were as follows: (concluded) |
| | | | | | | | | | | | | | | | | | | | | | | | | | | | |
| |
| Issuer/Index | | Pay
Fixed
Rate | | | Counterparty | | Expiration
Date | | Notional
Amount (000) | | | Unrealized Appreciation (Depreciation) | |
| |
Kingdom of Spain | | | 1.00% | | | Citigroup, Inc. | | 3/20/18 | | USD | 3,000 | | | | | | | | | | | | | | | $ | 412 | |
Kingdom of Spain | | | 1.00% | | | Citigroup, Inc. | | 3/20/18 | | USD | 2,180 | | | | | | | | | | | | | | | | 31,319 | |
Kingdom of Spain | | | 1.00% | | | JPMorgan Chase & Co. | | 3/20/18 | | USD | 2,180 | | | | | | | | | | | | | | | | 31,319 | |
Marks & Spencer Plc | | | 1.00% | | | Credit Suisse Group AG | | 3/20/18 | | EUR | 1,330 | | | | | | | | | | | | | | | | 23,860 | |
Republic of Ireland | | | 1.00% | | | Bank of America Corp. | | 3/20/18 | | USD | 800 | | | | | | | | | | | | | | | | 652 | |
Republic of Ireland | | | 1.00% | | | Deutsche Bank AG | | 3/20/18 | | USD | 900 | | | | | | | | | | | | | | | | 734 | |
Republic of Italy | | | 1.00% | | | Barclays Plc | | 3/20/18 | | USD | 6,000 | | | | | | | | | | | | | | | | 156,937 | |
Xstrata Plc | | | 1.00% | | | JPMorgan Chase & Co. | | 3/20/18 | | EUR | 2,690 | | | | | | | | | | | | | | | | 3,120 | |
Apache Corp. | | | 1.00% | | | Barclays Plc | | 6/20/18 | | USD | 1,579 | | | | | | | | | | | | | | | | 2,087 | |
AXA SA | | | 1.00% | | | BNP Paribas SA | | 6/20/18 | | EUR | 925 | | | | | | | | | | | | | | | | 5,799 | |
AXA SA | | | 1.00% | | | Credit Suisse Group AG | | 6/20/18 | | EUR | 995 | | | | | | | | | | | | | | | | 5,065 | |
CDX.NA.IG.20 Version 1 | | | 1.00% | | | Credit Suisse Group AG | | 6/20/18 | | USD | 5,300 | | | | | | | | | | | | | | | | (2,592 | ) |
Credit Agricole SA | | | 3.00% | | | JPMorgan Chase & Co. | | 6/20/18 | | EUR | 960 | | | | | | | | | | | | | | | | 3,463 | |
Renault SA | | | 1.00% | | | Credit Suisse Group AG | | 6/20/18 | | EUR | 1,250 | | | | | | | | | | | | | | | | 14,352 | |
Societe Generale SA | | | 3.00% | | | JPMorgan Chase & Co. | | 6/20/18 | | EUR | 960 | | | | | | | | | | | | | | | | 3,855 | |
CMBX.NA Series 6 AAA | | | 0.50% | | | JPMorgan Chase & Co. | | 5/11/63 | | USD | 4,260 | | | | | | | | | | | | | | | | 61,017 | |
CMBX.NA Series 6 AAA | | | 0.50% | | | Morgan Stanley | | 5/11/63 | | USD | 8,860 | | | | | | | | | | | | | | | | 194,323 | |
| |
| | | | | | | | | | | |
Total | | | | | | | | | | | | | | | | | | | | | | | | | | $ | (6,267,278 | ) |
| | | | | | | | | | | | | | | | | | | | | | | | | | | | |
| — | | Credit default swaps - sold protection outstanding as of March 31, 2013 were as follows: |
| | | | | | | | | | | | | | | | | | |
| |
| Issuer/Index | | Receive
Fixed
Rate | | | Counterparty | | Expiration
Date | | Credit
Rating1 | | Notional Amount (000)2 | | | Unrealized
Appreciation
(Depreciation) | |
| |
iTraxx Europe Series 9 0-3% | | | 5.00% | | | JPMorgan Chase & Co. | | 6/20/13 | | BBB+ | | EUR | 3,020 | | | | $ 136,349 | |
iTraxx Europe Series 9 0-3% | | | 5.00% | | | Morgan Stanley | | 6/20/13 | | BBB+ | | EUR | 1,185 | | | | 84,514 | |
ARAMARK Corp. | | | 5.00% | | | JPMorgan Chase & Co. | | 6/20/16 | | B- | | USD | 1,850 | | | | 165,699 | |
Banca Monte dei Paschi di Siena SpA | | | 3.00% | | | BNP Paribas SA | | 9/20/16 | | CCC+ | | EUR | 2,000 | | | | (387,954 | ) |
Banca Monte dei Paschi di Siena SpA | | | 3.00% | | | JPMorgan Chase & Co. | | 9/20/16 | | CCC+ | | EUR | 2,200 | | | | (542,137 | ) |
Banca Monte dei Paschi di Siena SpA | | | 5.00% | | | Deutsche Bank AG | | 9/20/16 | | CCC+ | | EUR | 750 | | | | (157,501 | ) |
Republic of Italy | | | 1.00% | | | Citigroup, Inc. | | 12/20/16 | | Not Rated | | USD | 4,000 | | | | 244,617 | |
Anadarko Petroleum Corp. | | | 1.00% | | | Credit Suisse Group AG | | 6/20/17 | | BBB- | | USD | 11,580 | | | | 556,017 | |
Anadarko Petroleum Corp. | | | 1.00% | | | Morgan Stanley | | 6/20/17 | | BBB- | | USD | 3,700 | | | | 194,167 | |
Anadarko Petroleum Corp. | | | 1.00% | | | UBS AG | | 6/20/17 | | BBB- | | USD | 2,931 | | | | 151,582 | |
CDX.NA.IG Series 18 Version 1 | | | 1.00% | | | Citigroup, Inc. | | 6/20/17 | | BBB+ | | USD | 103,800 | | | | 1,164,967 | |
Sunrise Communications Holdings SA | | | 5.00% | | | Citigroup, Inc. | | 6/20/17 | | B- | | EUR | 1,160 | | | | 151,482 | |
Anadarko Petroleum Corp. | | | 1.00% | | | Citigroup, Inc. | | 9/20/17 | | BBB- | | USD | 5,000 | | | | 112,526 | |
Ardagh Packaging Finance Plc | | | 5.00% | | | Barclays Plc | | 9/20/17 | | CCC+ | | EUR | 370 | | | | 41,629 | |
Ardagh Packaging Finance Plc | | | 5.00% | | | Credit Suisse Group AG | | 9/20/17 | | CCC+ | | EUR | 550 | | | | 63,315 | |
Repsol International Finance BV | | | 1.00% | | | Barclays Plc | | 9/20/17 | | BBB- | | EUR | 750 | | | | 115,082 | |
CDX.NA.HY Series 19 Version 1 | | | 5.00% | | | Credit Suisse Group AG | | 12/20/17 | | B+ | | USD | 22,880 | | | | 1,128,049 | |
Deutsche Telekom AG | | | 1.00% | | | Deutsche Bank AG | | 12/20/17 | | BBB+ | | EUR | 1,500 | | | | (2,650 | ) |
E.ON AG | | | 1.00% | | | JPMorgan Chase & Co. | | 12/20/17 | | A- | | EUR | 3,250 | | | | 1,179 | |
Gas Natural SDG SA | | | 1.00% | | | JPMorgan Chase & Co. | | 12/20/17 | | BBB | | EUR | 1,135 | | | | 47,088 | |
Holcim Ltd. | | | 1.00% | | | Goldman Sachs Group, Inc. | | 12/20/17 | | BBB | | EUR | 700 | | | | 16,363 | |
Holcim Ltd. | | | 1.00% | | | JPMorgan Chase & Co. | | 12/20/17 | | BBB | | EUR | 1,370 | | | | 32,025 | |
Imperial Tobacco Group Plc | | | 1.00% | | | Deutsche Bank AG | | 12/20/17 | | BBB | | EUR | 1,500 | | | | 6,353 | |
iTraxx Europe Series 18 Version 1 | | | 1.00% | | | JPMorgan Chase & Co. | | 12/20/17 | | A- | | EUR | 41,400 | | | | (62,759 | ) |
iTraxx Europe Series 18 Version 1 | | | 1.00% | | | JPMorgan Chase & Co. | | 12/20/17 | | A- | | EUR | 27,600 | | | | (41,840 | ) |
iTraxx Sub Financials Series 18 Version 1 | | | 1.00% | | | Citigroup, Inc. | | 12/20/17 | | A | | EUR | 4,930 | | | | (92,939 | ) |
iTraxx Sub Financials Series 18 Version 1 | | | 1.00% | | | Citigroup, Inc. | | 12/20/17 | | A | | EUR | 4,700 | | | | (76,090 | ) |
iTraxx Sub Financials Series 18 Version 1 | | | 1.00% | | | Citigroup, Inc. | | 12/20/17 | | A | | EUR | 2,360 | | | | (36,492 | ) |
iTraxx Sub Financials Series 18 Version 1 | | | 1.00% | | | Deutsche Bank AG | | 12/20/17 | | A | | EUR | 2,350 | | | | (40,034 | ) |
See Notes to Consolidated Financial Statements.
| | | | | | |
| | | | | MARCH 31, 2013 | | |
| | BLACKROCK BALANCED CAPITAL FUND, INC. | | | 51 |
| | |
| Consolidated Schedule of Investments (continued) | | Master Total Return Portfolio |
| — | | Credit default swaps - sold protection outstanding as of March 31, 2013 were as follows: (concluded) |
| | | | | | | | | | | | | | | | | | |
| |
| Issuer/Index | | Receive
Fixed
Rate | | | Counterparty | | Expiration
Date | | Credit
Rating1 | | Notional
Amount
(000)2 | | | Unrealized
Appreciation
(Depreciation) | |
| |
iTraxx Sub Financials Series 18 Version 1 | | | 1.00% | | | Deutsche Bank AG | | 12/20/17 | | A | | EUR | 340 | | | | $ (7,991 | ) |
iTraxx Sub Financials Series 18 Version 1 | | | 1.00% | | | Deutsche Bank AG | | 12/20/17 | | A | | EUR | 50 | | | | (817 | ) |
iTraxx Sub Financials Series 18 Version 1 | | | 1.00% | | | JPMorgan Chase & Co. | | 12/20/17 | | A | | EUR | 5,775 | | | | (107,644 | ) |
iTraxx Sub Financials Series 18 Version 1 | | | 1.00% | | | JPMorgan Chase & Co. | | 12/20/17 | | A | | EUR | 3,100 | | | | (64,583 | ) |
Sunrise Communications Holdings SA | | | 5.00% | | | Credit Suisse Group AG | | 12/20/17 | | B- | | EUR | 610 | | | | 696 | |
Sunrise Communications Holdings SA | | | 5.00% | | | Goldman Sachs Group, Inc. | | 12/20/17 | | B- | | EUR | 710 | | | | 7,460 | |
ThyssenKrupp AG | | | 1.00% | | | Credit Suisse Group AG | | 12/20/17 | | BB | | EUR | 1,500 | | | | 31,381 | |
ThyssenKrupp AG | | | 1.00% | | | Goldman Sachs Group, Inc. | | 12/20/17 | | BB | | EUR | 725 | | | | 17,867 | |
ThyssenKrupp AG | | | 1.00% | | | JPMorgan Chase & Co. | | 12/20/17 | | BB | | EUR | 705 | | | | 17,374 | |
Advanced Micro Devices, Inc. | | | 5.00% | | | Barclays Plc | | 3/20/18 | | B | | USD | 1,500 | | | | 63,868 | |
Ardagh Packaging Finance Plc | | | 5.00% | | | Credit Suisse Group AG | | 3/20/18 | | CCC+ | | EUR | 300 | | | | (4,018 | ) |
Ardagh Packaging Finance Plc | | | 5.00% | | | Deutsche Bank AG | | 3/20/18 | | CCC+ | | EUR | 310 | | | | (4,319 | ) |
Glencore International AG | | | 1.00% | | | JPMorgan Chase & Co. | | 3/20/18 | | BBB | | EUR | 2,690 | | | | 18,375 | |
HeidelbergCement AG | | | 5.00% | | | JPMorgan Chase & Co. | | 3/20/18 | | Not Rated | | EUR | 630 | | | | 17,103 | |
Intesa Sanpaolo SpA | | | 1.00% | | | Bank of America Corp. | | 3/20/18 | | BBB+ | | EUR | 2,230 | | | | (128,787 | ) |
Metsa Board Oyj | | | 5.00% | | | Citigroup, Inc. | | 3/20/18 | | B- | | EUR | 510 | | | | 12,693 | |
Republic of Italy | | | 1.00% | | | Barclays Plc | | 3/20/18 | | Not Rated | | EUR | 4,500 | | | | (112,171 | ) |
Republic of Italy | | | 1.00% | | | Barclays Plc | | 3/20/18 | | Not Rated | | USD | 37 | | | | (266 | ) |
Schaeffler Finance BV | | | 5.00% | | | Barclays Plc | | 3/20/18 | | B | | EUR | 660 | | | | 34,992 | |
Schaeffler Finance BV | | | 5.00% | | | Barclays Plc | | 3/20/18 | | B | | EUR | 650 | | | | 43,064 | |
Schaeffler Finance BV | | | 5.00% | | | Credit Suisse Group AG | | 3/20/18 | | B | | EUR | 700 | | | | 43,213 | |
Schaeffler Finance BV | | | 5.00% | | | Credit Suisse Group AG | | 3/20/18 | | B | | EUR | 660 | | | | 34,992 | |
Sunrise Communications Holdings SA | | | 5.00% | | | Citigroup, Inc. | | 3/20/18 | | B- | | EUR | 480 | | | | (3,476 | ) |
Sunrise Communications Holdings SA | | | 5.00% | | | Goldman Sachs Group, Inc. | | 3/20/18 | | B- | | EUR | 500 | | | | (6,429 | ) |
Swiss Reinsurance Co. Ltd. | | | 1.00% | | | Barclays Plc | | 3/20/18 | | AA- | | EUR | 3,200 | | | | (52,353 | ) |
Swiss Reinsurance Co. Ltd. | | | 1.00% | | | Citigroup, Inc. | | 3/20/18 | | AA- | | EUR | 1,250 | | | | (19,966 | ) |
ThyssenKrupp AG | | | 1.00% | | | Credit Suisse Group AG | | 3/20/18 | | BB | | EUR | 1,300 | | | | (9,749 | ) |
Ttmtin | | | 5.00% | | | Credit Suisse Group AG | | 3/20/18 | | BB- | | EUR | 1,000 | | | | (12,935 | ) |
UniCredit SpA | | | 3.00% | | | Barclays Plc | | 3/20/18 | | BBB+ | | EUR | 1,100 | | | | (63,435 | ) |
UniCredit SpA | | | 3.00% | | | JPMorgan Chase & Co. | | 3/20/18 | | BBB+ | | EUR | 2,230 | | | | (135,201 | ) |
Allianz SE | | | 1.00% | | | JPMorgan Chase & Co. | | 6/20/18 | | AA | | EUR | 2,110 | | | | (14,159 | ) |
Aviva Plc | | | 1.00% | | | BNP Paribas SA | | 6/20/18 | | Not Rated | | EUR | 925 | | | | (5,708 | ) |
Aviva Plc | | | 1.00% | | | Credit Suisse Group AG | | 6/20/18 | | Not Rated | | EUR | 995 | | | | (6,433 | ) |
iTraxx Europe Crossover Series 19 Version 1 | | | 5.00% | | | Deutsche Bank AG | | 6/20/18 | | B+ | | EUR | 4,850 | | | | (51,368 | ) |
iTraxx Sub Financials Series 19 Version 1 | | | 1.00% | | | Deutsche Bank AG | | 6/20/18 | | A | | EUR | 4,500 | | | | 3,081 | |
Muenchener Rueckversicherungs AG | | | 1.00% | | | JPMorgan Chase & Co. | | 6/20/18 | | A | | EUR | 2,110 | | | | (8,371 | ) |
CMBX.NA Series 2 AM | | | 0.50% | | | Deutsche Bank AG | | 3/15/49 | | A- | | USD | 4,830 | | | | 450,495 | |
CMBX.NA Series 4 AM | | | 0.50% | | | Deutsche Bank AG | | 2/17/51 | | BB- | | USD | 2,000 | | | | 85,397 | |
| |
Total | | | | | | | | | | | | | | | | | $3,034,479 | |
| | | | | | | | | | | | | | | | | | |
| | 1 | Using S&P’s rating of the issuer or the underlying securities of the index, as applicable. |
| | 2 | The maximum potential amount the Master Portfolio may pay should a negative credit event take place as defined under the terms of the agreement. |
See Notes to Consolidated Financial Statements.
| | | | |
| | | | | |
| 52 | | BLACKROCK BALANCED CAPITAL FUND, INC. | | MARCH 31, 2013 |
| | |
| Consolidated Schedule of Investments (continued) | | Master Total Return Portfolio |
| — | | Interest rate swaps outstanding as of March 31, 2013 were as follows: |
| | | | | | | | | | | | | | |
| |
Fixed Rate | | Floating Rate | | Counterparty/ Exchange | | Expiration
Date | | Notional
Amount (000) | | | Unrealized
Appreciation
(Depreciation) | |
| |
3.27%1 | | 3-month LIBOR | | Deutsche Bank AG | | 5/16/21 | | USD | 9,510 | | | | $(1,274,983 | ) |
1.75%2 | | 3-month LIBOR | | Citigroup, Inc. | | 12/14/22 | | USD | 4,600 | | | | (69,808 | ) |
2.89%1 | | 3-month LIBOR | | Bank of America Corp. | | 1/14/43 | | USD | 48,090 | | | | 762,083 | |
3.02%1 | | 3-month LIBOR | | Credit Suisse Group AG | | 2/06/43 | | USD | 17,672 | | | | (138,410 | ) |
3.00%1 | | 3-month LIBOR | | Goldman Sachs Group, Inc. | | 2/11/43 | | USD | 28,200 | | | | (132,852 | ) |
3.03%1 | | 3-month LIBOR | | Credit Suisse Group AG | | 2/19/43 | | USD | 8,800 | | | | (82,880 | ) |
| |
| | | | | |
Total | | | | | | | | | | | | | $ (936,850 | ) |
| | | | | | | | | | | | | | |
| | 1 | Master Portfolio pays the fixed rate and receives the floating rate. |
| | 2 | Master Portfolio pays the floating rate and receives the fixed rate. |
| — | | Total return swaps outstanding as of March 31, 2013 were as follows: |
| | | | | | | | | | | | | | | | | | | | | | | | |
| |
| Reference Entity | | Floating Rate | | Counterparty | | Expiration
Date | | Notional
Amount
(000) | | | Unrealized
Appreciation
(Depreciation) | |
| |
TRX.II.AAA Series 1 | | 2.61%1 | | Credit Suisse Group AG | | 4/01/13 | | USD | 2,385 | | | | | | | | | | | | | $ | 14,413 | |
TRX.II.AAA Series 1 | | 2.61%1 | | Credit Suisse Group AG | | 7/01/13 | | USD | 6,475 | | | | | | | | | | | | | | 36,905 | |
TRX.II.AAA Series 1 | | 2.61%1 | | Deutsche Bank AG | | 7/01/13 | | USD | 4,260 | | | | | | | | | | | | | | 13,911 | |
Return on Markit IOS 3.50%, 30-year, fixed rate Fannie Mae | | 1-month LIBOR2 | | Citigroup, Inc. | | 1/12/41 | | USD | 7,548 | | | | | | | | | | | | | | (151,191 | ) |
Return on Markit IOS 3.50%, 30-year, fixed rate Fannie Mae | | 1-month LIBOR3 | | Citigroup, Inc. | | 1/12/41 | | USD | 6,377 | | | | | | | | | | | | | | 43,219 | |
Return on Markit IOS 3.50%, 30-year, fixed rate Fannie Mae | | 1-month LIBOR2 | | Goldman Sachs Group, Inc. | | 1/12/41 | | USD | 4,034 | | | | | | | | | | | | | | 3,782 | |
Return on Markit IOS 3.50%, 30-year, fixed rate Fannie Mae | | 1-month LIBOR3 | | JPMorgan Chase & Co. | | 1/12/41 | | USD | 11,583 | | | | | | | | | | | | | | 121,179 | |
Return on Markit IOS 3.50%, 30-year, fixed rate Fannie Mae | | 1-month LIBOR2 | | Citigroup, Inc. | | 1/12/43 | | USD | 2,258 | | | | | | | | | | | | | | (516 | ) |
Return on Markit IOS 3.50%, 30-year, fixed rate Fannie Mae | | 1-month LIBOR2 | | Credit Suisse Group AG | | 1/12/43 | | USD | 3,252 | | | | | | | | | | | | | | (4,496 | ) |
Return on Markit IOS 3.50%, 30-year, fixed rate Fannie Mae | | 1-month LIBOR2 | | Goldman Sachs Group, Inc. | | 1/12/43 | | USD | 1,987 | | | | | | | | | | | | | | (920 | ) |
Return on Markit IOS 3.50%, 30-year, fixed rate Fannie Mae | | 1-month LIBOR3 | | JPMorgan Chase & Co. | | 1/12/43 | | USD | 7,497 | | | | | | | | | | | | | | 74,825 | |
| |
| | | | | | | | | | |
Total | | | | | | | | | | | | | | | | | | | | | | $ | 151,111 | |
| | | | | | | | | | | | | | | | | | | | | | | | |
| | 1 | Master Portfolio receives the total return of the reference entity and pays the fixed rate. Net payment made at termination. |
| | 2 | Master Portfolio pays the floating rate and receives the total return of the reference entity. |
| | 3 | Master Portfolio pays the total return of the reference entity and receives the floating rate. |
| — | | Fair Value Measurements – Various inputs are used in determining the fair value of investments and derivative financial instruments. These inputs to valuation techniques are categorized into a disclosure hierarchy consisting of three broad levels for financial statement purposes as follows: |
| | — | | Level 1 - unadjusted price quotations in active markets/exchanges for identical assets and liabilities that the Master Portfolio has the ability to access |
| | — | | Level 2 - other observable inputs (including, but not limited to, quoted prices for similar assets or liabilities in markets that are active, quoted prices for identical or similar assets or liabilities in markets that are not active, inputs other than quoted prices that are observable for the assets or liabilities (such as interest rates, yield curves, volatilities, prepayment speeds, loss severities, credit risks and default rates) or other market-corroborated inputs) |
| | — | | Level 3 - unobservable inputs based on the best information available in the circumstances, to the extent observable inputs are not available (including the Master Portfolio’s own assumptions used in determining the fair value of investments and derivative financial instruments) |
The hierarchy gives the highest priority to unadjusted quoted prices in active markets for identical assets or liabilities (Level 1 measurements) and the lowest priority to unobservable inputs (Level 3 measurements). Accordingly, the degree of judgment exercised in determining fair value is greatest for instruments categorized in Level 3. The inputs used to measure fair value may fall into different levels of the fair value hierarchy. In such cases, for disclosure purposes, the level in the fair value hierarchy within which the fair value measurement falls in its entirety is determined based on the lowest level input that is significant to the fair value measurement in its entirety.
See Notes to Consolidated Financial Statements.
| | | | | | |
| | | | | MARCH 31, 2013 | | |
| | BLACKROCK BALANCED CAPITAL FUND, INC. | | | 53 |
| | |
| Consolidated Schedule of Investments (continued) | | Master Total Return Portfolio |
Changes in valuation techniques may result in transfers into or out of an assigned level within the disclosure hierarchy. In accordance with the Master Portfolio’s policy, transfers between different levels of the fair value disclosure hierarchy are deemed to have occurred as of the beginning of the year. The categorization of a value determined for investments and derivative financial instruments is based on the pricing transparency of the investment and derivative financial instrument and is not necessarily an indication of the risks associated with investing in those securities. For information about the Master Portfolio’s policy regarding valuation of investments and derivative financial instruments and other significant accounting policies, please refer to Note 1 of the Notes to Financial Statements.
The following tables summarize the Master Portfolio’s investments and derivative financial instruments categorized in the disclosure hierarchy as of March 31, 2013:
| | | | | | | | | | | | | | | | | | | | |
| | | | | Level 1 | | | | | Level 2 | | | | | Level 3 | | | | | Total | |
Assets: | | | | | | | | | | | | | | | | | | | | |
Investments: | | | | | | | | | | | | | | | | | | | | |
Long-Term Investments: | | | | | | | | | | | | | | | | | | | | |
Asset-Backed Securities | | | | – | | | | $ | 404,931,180 | | | | $ | 107,889,754 | | | | $ | 512,820,934 | |
Corporate Bonds | | | | – | | | | | 1,011,513,297 | | | | | 25,429,082 | | | | | 1,036,942,379 | |
Floating Rate Loan Interests | | | | – | | | | | 68,318,294 | | | | | 28,309,144 | | | | | 96,627,438 | |
Foreign Agency Obligations | | | | – | | | | | 117,260,901 | | | | | – | | | | | 117,260,901 | |
Foreign Government Obligations | | | | – | | | | | 386,806,488 | | | | | – | | | | | 386,806,488 | |
Investment Companies | | | $ | 13,450,315 | | | | | – | | | | | – | | | | | 13,450,315 | |
Non-Agency Mortgage-Backed Securities | | | | – | | | | | 490,856,486 | | | | | 45,973,503 | | | | | 536,829,989 | |
Other Interests | | | | – | | | | | – | | | | | 1 | | | | | 1 | |
Preferred Securities | | | | 9,948,489 | | | | | 32,197,789 | | | | | – | | | | | 42,146,278 | |
Taxable Municipal Bonds | | | | – | | | | | 11,262,704 | | | | | – | | | | | 11,262,704 | |
U.S. Government Sponsored Agency Securities | | | | – | | | | | 2,478,283,623 | | | | | – | | | | | 2,478,283,623 | |
U.S. Treasury Obligations | | | | – | | | | | 772,439,994 | | | | | – | | | | | 772,439,994 | |
Short-Term Securities: | | | | | | | | | | | | | | | | | | | | |
Borrowed Bond Agreements | | | | – | | | | | 318,504,816 | | | | | – | | | | | 318,504,816 | |
Money Market Fund | | | | 12,522,057 | | | | | – | | | | | – | | | | | 12,522,057 | |
Options Purchased: | | | | | | | | | | | | | | | | | | | | |
Credit Contracts | | | | – | | | | | 12,856 | | | | | – | | | | | 12,856 | |
Equity Contracts | | | | – | | | | | 83,926 | | | | | – | | | | | 83,926 | |
Foreign Currency Exchange Contracts | | | | – | | | | | 37,309,946 | | | | | – | | | | | 37,309,946 | |
Interest Rate Contracts | | | | 655,700 | | | | | 15,472,457 | | | | | – | | | | | 16,128,157 | |
Liabilities: | | | | | | | | | | | | | | | | | | | | |
Investments in Securities: | | | | | | | | | | | | | | | | | | | | |
TBA Sale Commitments | | | | – | | | | | (1,348,232,226 | ) | | | | – | | | | | (1,348,232,226) | |
Borrowed Bonds | | | | – | | | | | (261,128,487 | ) | | | | – | | | | | (261,128,487) | |
Total | | | $ | 36,576,561 | | | | $ | 4,535,894,044 | | | | $ | 207,601,484 | | | | $ | 4,780,072,089 | |
| | | | | | | | | | | | | | | | | | | | |
| | | | | Level 1 | | | | | Level 2 | | | | | Level 3 | | | | | Total | |
Derivative Financial Instruments1 | | | | | | | | | | | | | | | | | | | | |
Assets: | | | | | | | | | | | | | | | | | | | | |
Credit contracts | | | | – | | | | $ | 6,822,502 | | | | | – | | | | $ | 6,822,502 | |
Foreign currency exchange contracts | | | | – | | | | | 24,836,333 | | | | | – | | | | | 24,836,333 | |
Interest rate contracts | | | $ | 1,132,077 | | | | | 1,070,317 | | | | | – | | | | | 2,202,394 | |
Liabilities: | | | | | | | | | | | | | | | | | | | | |
Credit contracts | | | | – | | | | | (10,415,668 | ) | | | | – | | | | | (10,415,668) | |
Equity contracts | | | | (36,569 | ) | | | | – | | | | | – | | | | | (36,569) | |
Foreign currency exchange contracts | | | | – | | | | | (42,951,323 | ) | | | | – | | | | | (42,951,323) | |
Interest rate contracts | | | | (3,728,132 | ) | | | | (2,517,317 | ) | | | | – | | | | | (6,245,449) | |
Total | | | $ | (2,632,624 | ) | | | $ | (23,155,156 | ) | | | | – | | | | $ | (25,787,780) | |
| | 1 | Derivative financial instruments are swaps, financial futures contracts, foreign currency exchange contracts and options written. Swaps, financial futures contracts and foreign currency exchange contracts are valued at the unrealized appreciation/depreciation on the instrument and options written are shown at value. |
See Notes to Consolidated Financial Statements.
| | | | |
| | | | | |
| 54 | | BLACKROCK BALANCED CAPITAL FUND, INC. | | MARCH 31, 2013 |
| | |
| Consolidated Schedule of Investments (concluded) | | Master Total Return Portfolio |
Certain of the Master Portfolio’s assets and liabilities are held at carrying amount or face value, which approximates fair value for financial statement purposes. As of March 31, 2013, such assets and liabilities are categorized within the disclosure hierarchy as follows:
| | | | | | | | | | | | | | |
| |
| | | Level 1 | | | Level 2 | | | Level 3 | | Total | |
| |
Assets: | | | | | | | | | | | | | | |
Foreign currency at value | | | $ 1,320,844 | | | | – | | | – | | $ | 1,320,844 | |
Cash pledged as collateral for financial futures contracts | | | 5,931,000 | | | | – | | | – | | | 5,931,000 | |
Cash pledged as collateral for swaps | | | 3,777,000 | | | | – | | | – | | | 3,777,000 | |
Liabilities: | | | | | | | | | | | | | | |
Reverse repurchase agreements | | | – | | | | $(1,379,492,849) | | | – | | | (1,379,492,849) | |
Bank overdraft | | | – | | | | (1,811,813) | | | – | | | (1,811,813) | |
Cash received as collateral for swaps | | | – | | | | (9,256,650) | | | – | | | (9,256,650) | |
| |
Total | | | $ 11,028,844 | | | | $(1,390,561,312) | | | – | | $ | (1,379,532,468) | |
| | | | |
There were no transfers between Level 1 and Level 2 during the six months ended March 31, 2013.
A reconciliation of Level 3 investments is presented when the Master Portfolio had a significant amount of Level 3 investments at the beginning and/or end of the period in relation to net assets. The following table is a reconciliation of Level 3 investments for which significant unobservable inputs were used in determining fair value:
| | | | | | | | | | | | | | | | | | | | | | | | |
| |
| | | Asset-Backed
Securities | | | Corporate
Bonds | | | Floating Rate
Loan Interests | | | Non-Agency
Mortgage-Backed
Securities | | | Other
Interests | | | Total | |
| |
Assets: | | | | | | | | | | | | | | | | | | | | | | | | |
Opening Balance, as of September 30, 2012 | | $ | 11,209,292 | | | | $18,466,000 | | | | $29,123,026 | | | | $ 48,132,409 | | | | – | | | | $106,930,727 | |
Transfers into Level 32 | | | 12,851,918 | | | | – | | | | – | | | | – | | | | – | | | | 12,851,918 | |
Transfers out of Level 32 | | | (4,164,292 | ) | | | – | | | | (5,698,397 | ) | | | (34,564,259 | ) | | | – | | | | (44,426,948 | ) |
Accrued discounts/premiums | | | 8,582 | | | | (673 | ) | | | 5,332 | | | | 7,861 | | | | $ 1 | | | | 21,103 | |
Net realized gain (loss) | | | – | | | | – | | | | – | | | | 215,321 | | | | – | | | | 215,321 | |
Net change in unrealized appreciation/depreciation3 | | | 704,771 | | | | 23,755 | | | | (1,625,548 | ) | | | (668,825 | ) | | | (93 | ) | | | (1,565,940 | ) |
Purchases | | | 87,279,483 | | | | 6,940,000 | | | | 6,504,731 | | | | 40,630,625 | | | | 93 | | | | 141,354,932 | |
Sales | | | – | | | | – | | | | – | | | | (7,779,629 | ) | | | – | | | | (7,779,629 | ) |
| |
Closing Balance, as of March 31, 2013 | | $ | 107,889,754 | | | | $25,429,082 | | | | $28,309,144 | | | | $ 45,973,503 | | | | $ 1 | | | | $207,601,484 | |
| | | | |
| | 2 | Transfers into and transfers out of Level 3 represent the values as of the beginning of the reporting period. As of September 30, 2012, the Fund used significant unobservable inputs in determining the value of certain investments. As of March 31, 2013, the Fund used observable inputs in determining the value of the same investments. As a result, investments with a beginning of period value of $44,426,948 transferred from Level 3 to Level 2 in the disclosure hierarchy. |
| | 3 | Included in the related net change in unrealized appreciation/depreciation in the Consolidated Statement of Operations. The change in unrealized appreciation/depreciation on investments still held as of March 31, 2013 was $(2,137,412). |
Certain of the Master Portfolio’s investments that are categorized as Level 3 were valued utilizing transaction prices or third party pricing information without adjustment. Such valuations are based on unobservable inputs. A significant change in third party information could result in a significantly lower or higher value in such Level 3 investments.
See Notes to Consolidated Financial Statements.
| | | | | | |
| | | | | | | |
| | BLACKROCK BALANCED CAPITAL FUND, INC. | | MARCH 31, 2013 | | 55 |
| | |
Consolidated Statement of Assets and Liabilities | | Master Total Return Portfolio |
| | | | |
March 31, 2013 (Unaudited) | | | |
| |
Assets | | | | |
| |
Investments at value – unaffiliated (cost – $6,246,289,856) | | $ | 6,363,460,430 | |
Investments at value – affiliated (cost – $25,045,735) | | | 25,972,372 | |
Cash pledged as collateral for financial futures contracts | | | 5,931,000 | |
Cash pledged as collateral for swaps | | | 3,777,000 | |
Foreign currency at value (cost – $1,296,100) | | | 1,320,844 | |
Variation margin receivable | | | 346,035 | |
Investments sold receivable | | | 194,593,322 | |
TBA sale commitments receivable | | | 1,345,382,833 | |
Swap premiums paid | | | 11,535,673 | |
Unrealized appreciation on foreign currency exchange contracts | | | 24,836,333 | |
Unrealized appreciation on swaps | | | 7,892,819 | |
Contributions receivable from investors | | | 14,293,594 | |
Principal paydown receivable | | | 125,636 | |
Dividends receivable – unaffiliated | | | 63,196 | |
Interest receivable | | | 31,288,376 | |
Prepaid expenses | | | 31,528 | |
Other assets | | | 701,608 | |
| | | | |
Total assets | | | 8,031,552,599 | |
| | | | |
|
| |
Liabilities | | | | |
| |
Bank overdraft | | | 1,811,813 | |
Options written at value (premiums received – $20,046,436) | | | 39,164,364 | |
Borrowed bonds at value (proceeds – $261,837,012) | | | 261,128,487 | |
TBA sale commitments at value (proceeds – $1,345,382,833) | | | 1,348,232,226 | |
Reverse repurchase agreements | | | 1,379,492,849 | |
Cash received as collateral for swaps | | | 9,256,650 | |
Investments purchased payable | | | 1,503,341,357 | |
Swap premiums received | | | 8,796,790 | |
Unrealized depreciation on foreign currency exchange contracts | | | 5,506,087 | |
Unrealized depreciation on swaps | | | 11,911,357 | |
Interest expense payable | | | 2,508,400 | |
Withdrawals payable to investors | | | 10,126,799 | |
Investment advisory fees payable | | | 208,428 | |
Other affiliates payable | | | 23,096 | |
Directors’ fees payable | | | 5,872 | |
Other accrued expenses payable | | | 481,776 | |
| | | | |
Total liabilities | | | 4,581,996,351 | |
| | | | |
Net Assets | | $ | 3,449,556,248 | |
| | | | |
|
| |
Net Assets Consist of | | | | |
| |
Investors’ capital | | $ | 3,338,678,533 | |
Net unrealized appreciation/depreciation | | | 110,877,715 | |
| | | | |
Net Assets | | $ | 3,449,556,248 | |
| | | | |
See Notes to Consolidated Financial Statements.
| | | | |
| | | | | |
| 56 | | BLACKROCK BALANCED CAPITAL FUND, INC. | | MARCH 31, 2013 |
| | |
Consolidated Statement of Operations | | Master Total Return Portfolio |
| | | | |
Six Months Ended March 31, 2013 (Unaudited) | | | |
| |
Investment Income | | | | |
| |
Interest – unaffiliated | | $ | 69,167,204 | |
Dividends – affiliated | | | 281,278 | |
Foreign taxes withheld | | | (118,286) | |
Dividends – unaffiliated | | | 114,763 | |
Interest – affiliated | | | 52 | |
| | | | |
Total income | | | 69,445,011 | |
| | | | |
|
| |
Expenses | | | | |
| |
Investment advisory | | | 1,238,302 | |
Custodian | | | 354,484 | |
Accounting services | | | 307,347 | |
Professional | | | 81,180 | |
Directors | | | 40,227 | |
Printing | | | 3,285 | |
Miscellaneous | | | 68,767 | |
| | | | |
Total expenses excluding interest expense | | | 2,093,592 | |
Interest expense1 | | | 3,681,026 | |
| | | | |
Total expenses excluding interest expense | | | 5,774,618 | |
Less fees waived by Manager | | | (5,729) | |
| | | | |
Total expenses after fees waived | | | 5,768,889 | |
| | | | |
Net investment income | | | 63,676,122 | |
| | | | |
|
| |
Realized and Unrealized Gain (Loss) | | | | |
| |
Net realized gain (loss) from: | | | | |
Investments – unaffiliated | | | 50,428,403 | |
Options written | | | (2,428,665) | |
Financial futures contracts | | | 3,219,218 | |
Swaps | | | (2,020,122) | |
Foreign currency transactions | | | (19,304,234) | |
Borrowed bonds | | | (4,470,443) | |
| | | | |
| | | 25,424,157 | |
| | | | |
Net change in unrealized appreciation/depreciation on: | | | | |
Investments – unaffiliated | | | (17,461,445) | |
Investments – affiliated | | | (434,008) | |
Options written | | | (17,385,275) | |
Financial futures contracts | | | (1,560,115) | |
Swaps | | | 352,541 | |
Foreign currency translations | | | 30,934,310 | |
Borrowed bonds | | | 4,356,852 | |
| | | | |
| | | (1,197,140) | |
| | | | |
Total realized and unrealized gain | | | 24,227,017 | |
| | | | |
Net Increase in Net Assets Resulting from Operations | | $ | 87,903,139 | |
| | | | |
1 See Note 5 of the Notes to Financial Statements for details of borrowings.
See Notes to Consolidated Financial Statements.
| | | | | | |
| | | | | MARCH 31, 2013 | | |
| | BLACKROCK BALANCED CAPITAL FUND, INC. | | | 57 |
| | |
Consolidated Statements of Changes in Net Assets | | Master Total Return Portfolio |
| | | | | | | | |
| | | Six Months | | | | |
| | | Ended | | | Year Ended | |
| | | March 31, 2013 | | | September 30, | |
Decrease in Net Assets: | | (Unaudited) | | | 2012 | |
| |
Operations | | | | | | | | |
| |
Net investment income | | $ | 63,676,122 | | | $ | 148,152,164 | |
Net realized gain | | | 25,424,157 | | | | 60,887,390 | |
Net change in unrealized appreciation/depreciation | | | (1,197,140 | ) | | | 122,434,923 | |
| | | | |
Net increase in net assets resulting from operations | | | 87,903,139 | | | | 331,474,477 | |
| | | | |
|
| |
Capital Share Transactions | | | | | | | | |
| |
Proceeds from contributions | | | 339,461,736 | | | | 890,293,273 | |
Value of withdrawals | | | (447,959,178 | ) | | | (1,650,981,268) | |
| | | | |
Net decrease in net assets derived from capital share transactions | | | (108,497,442 | ) | | | (760,687,995) | |
| | | | |
|
| |
Net Assets | | | | | | | | |
| |
Total decrease in net assets | | | (20,594,303 | ) | | | (429,213,518) | |
Beginning of period | | | 3,470,150,551 | | | | 3,899,364,069 | |
| | | | |
End of period | | $ | 3,449,556,248 | | | $ | 3,470,150,551 | |
| | | | |
See Notes to Consolidated Financial Statements.
| | | | |
| | | | | |
| 58 | | BLACKROCK BALANCED CAPITAL FUND, INC. | | MARCH 31, 2013 |
| | |
Consolidated Statement of Cash Flows | | Master Total Return Portfolio |
| | | | |
Six Months Ended March 31, 2013 (Unaudited) | | | |
| |
Cash Used for Operating Activities | | | | |
| |
Net increase in net assets resulting from operations | | $ | 87,903,139 | |
Adjustments to reconcile net increase in net assets resulting from operations to net cash used for operating activities: | | | | |
Increase in cash pledged as collateral for financial futures contracts | | | (2,759,000) | |
Decrease in cash pledged as collateral for swaps | | | 11,733,000 | |
Decrease in cash pledged as collateral for reverse repurchase agreements | | | 3,646,600 | |
Decrease in swaps receivable | | | 1,622,768 | |
Decrease in options written receivable | | | 170,854 | |
Increase in interest receivable | | | (4,016,393) | |
Increase in dividends receivable | | | (63,196) | |
Decrease in TBA sale commitments receivable | | | 1,216,774,631 | |
Decrease in variation margin payable | | | (463,558) | |
Decrease in receivable from principal paydown | | | 507,686 | |
Increase in prepaid expenses | | | (5,917) | |
Increase in other assets | | | (699,479) | |
Increase in collateral received for swaps | | | 5,707,650 | |
Decrease in swaps payable | | | (2,535,294) | |
Increase in variation margin receivable | | | (293,728) | |
Decrease in TBA sale commitments at value | | | (1,220,733,688) | |
Decrease in other affiliates payable | | | (9,276) | |
Increase in Officer’s and Trustees’ fees payable | | | 3,481 | |
Decrease in interest expense payable | | | (303,720) | |
Increase in investment advisory fees payable | | | 6,322 | |
Increase in other accrued expenses payable | | | 39,286 | |
Net realized and unrealized gain on investments, options written, swaps, borrowed bonds and foreign currency translations | | | (22,974,428) | |
Net periodic and termination payment of swaps | | | (1,956,232) | |
Premiums received from options written | | | 39,964,250 | |
Premiums paid on closing options written | | | (32,823,308) | |
Amortization of premium and accretion of discount on investments | | | 9,172,459 | |
Proceeds from sales of long-term investments | | | 26,105,832,383 | |
Proceeds from borrowed bonds transactions | | | 1,173,452,230 | |
Payments from borrowed bonds transactions | | | (1,101,160,026) | |
Purchases of long-term investments | | | (26,578,358,267) | |
Net proceeds from sales of short-term securities | | | 60,454,960 | |
| | | | |
Cash used for operating activities | | | (252,163,811) | |
| | | | |
|
| |
Cash Provided by Financing Activities | | | | |
| |
Net cash receipts from reverse repurchase agreements and treasury roll transactions | | | 350,698,004 | |
Cash receipts from contributions | | | 329,612,153 | |
Cash payments on withdrawals | | | (437,832,379) | |
Increase in bank overdraft | | | 1,811,813 | |
| | | | |
Cash provided by financing activities | | | 244,289,591 | |
| | | | |
|
| |
Cash Impact from Foreign Exchange Fluctuations | | | | |
| |
Cash impact from foreign exchange fluctuations | | | 33,639 | |
| | | | |
|
| |
Cash and Foreign Currency | | | | |
| |
Net decrease in cash | | | (7,840,581) | |
Cash and foreign currency at beginning of period | | | 9,161,425 | |
| | | | |
Cash and foreign currency at end of period | | $ | 1,320,844 | |
| | | | |
|
| |
Cash Flow Information | | | | |
| |
Cash paid during the period for interest | | $ | 3,984,746 | |
See Notes to Consolidated Financial Statements.
| | | | | | |
| | | | | MARCH 31, 2013 | | |
| | BLACKROCK BALANCED CAPITAL FUND, INC. | | | 59 |
| | |
Financial Highlights | | Master Total Return Portfolio |
| | | | | | | | | | | | | | | | | | | | | | | | |
| | | Six Months
Ended
March 31, 2013
(Unaudited)1 | | | Year Ended
September 30, | |
| | | | 20121 | | | 2011 | | | 2010 | | | 2009 | | | 2008 | |
| |
Total Investment Return | | | | | | | | | | | | | | | | | | | | | | | | |
| |
Total investment return | | | 2.58%2 | | | | 10.04% | | | | 2.82% | | | | 13.05% | | | | 10.95% | | | | (5.76)% | |
| | | | |
|
| |
Ratios to Average Net Assets | | | | | | | | | | | | | | | | | | | | | | | | |
| |
Total expenses | | | 0.33%3 | | | | 0.29% | | | | 0.56% | | | | 0.58% | | | | 0.17% | | | | 0.15% | |
| | | | |
Total expenses after fees waived and paid indirectly | | | 0.33%3 | | | | 0.29% | | | | 0.56% | | | | 0.58% | | | | 0.17% | | | | 0.15% | |
| | | | |
Total expenses after fees waived and paid indirectly and excluding interest expense | | | 0.12%3 | | | | 0.12% | | | | 0.11% | | | | 0.13% | | | | 0.13% | | | | 0.10% | |
| | | | |
Net investment income | | | 3.68%3 | | | | 4.20% | | | | 4.67% | | | | 4.97% | | | | 6.10% | | | | 5.59% | |
| | | | |
|
| |
Supplemental Data | | | | | | | | | | | | | | | | | | | | | | | | |
| |
Net assets, end of period (000) | | | $3,449,556 | | | $ | 3,470,151 | | | $ | 3,899,364 | | | $ | 3,591,890 | | | $ | 3,123,655 | | | $ | 3,244,949 | |
| | | | |
Portfolio turnover | | | 473%4 | | | | 1,346%5 | | | | 1,771%6 | | | | 1,754%7 | | | | 708%8 | | | | 1,081%9 | |
| | | | |
| | 1 | Consolidated Financial Highlights. |
| | 2 | Aggregate total investment return. |
| | 4 | Includes mortgage dollar roll transactions; excluding these transactions the portfolio turnover would have been 321%. |
| | 5 | Includes mortgage dollar roll transactions; excluding these transactions the portfolio turnover would have been 752%. |
| | 6 | Includes mortgage dollar roll transactions; excluding these transactions the portfolio turnover would have been 1,379%. |
| | 7 | Includes mortgage dollar roll transactions; excluding these transactions the portfolio turnover would have been 1,248%. |
| | 8 | Includes mortgage dollar roll transactions; excluding these transactions the portfolio turnover would have been 469%. |
| | 9 | Includes TBA transactions; excluding these transactions the portfolio turnover would have been 418%. |
See Notes to Consolidated Financial Statements.
| | | | |
| | | | | |
| 60 | | BLACKROCK BALANCED CAPITAL FUND, INC. | | MARCH 31, 2013 |
| | |
Notes to Consolidated Financial Statements (Unaudited) | | Master Total Return Portfolio |
1. Organization and Significant Accounting Policies:
Master Total Return Portfolio (the “Master Portfolio”), a series of Master Bond LLC (the “Master LLC”), is registered under the Investment Company Act of 1940, as amended (the “1940 Act”), as a diversified, open-end management investment company. The Master LLC is organized as a Delaware limited liability company. The Limited Liability Company Agreement of the Master LLC permits the Board of Directors of the Master LLC (the “Board”) to issue nontransferable interests in the Master LLC, subject to certain limitations. The Master Portfolio’s consolidated financial statements are prepared in conformity with accounting principles generally accepted in the United States of America (“US GAAP”), which may require management to make estimates and assumptions that affect the reported amounts of assets and liabilities in the consolidated financial statements and the reported amounts of increases and decreases in net assets from operations during the reporting period. Actual results could differ from those estimates.
The following is a summary of significant accounting policies followed by the Master Portfolio:
Basis of Consolidation: The accompanying consolidated financial statements include the accounts of BlackRock Cayman Master Total Return Portfolio I, Ltd. (the “Subsidiary”), which is a wholly owned subsidiary of the Master Portfolio and primarily invests in commodity-related instruments. The Subsidiary enables the Master Portfolio to hold these commodity-related instruments and an investor in the Master Portfolio to satisfy Regulated Investment Company (“RIC”) tax requirements. Inter-company accounts and transactions, if any, have been eliminated. During the six months ended March 31, 2013, there were no transactions in the Subsidiary. The Subsidiary is subject to the same investment policies and restrictions that apply to the Master Portfolio.
Valuation: US GAAP defines fair value as the price the Master Portfolio would receive to sell an asset or pay to transfer a liability in an orderly transaction between market participants at the measurement date. The Master Portfolio determines the fair values of its financial instruments at market value using independent dealers or pricing services under policies approved by the Board. The BlackRock Global Valuation Methodologies Committee (the “Global Valuation Committee”) is the committee formed by management to develop global pricing policies and procedures and to provide oversight of the pricing function for the Master Portfolio for all financial instruments.
The Master Portfolio values its bond investments on the basis of last available bid prices or current market quotations provided by dealers or pricing services. Floating rate loan interests are valued at the mean of the bid prices from one or more brokers or dealers as obtained from a pricing service. In determining the value of a particular investment, pricing services may use certain information with respect to transactions in such investments, quotations from dealers, pricing matrixes, market transactions in comparable investments, various relationships observed in the market between investments and calculated yield measures. Asset-backed and mortgage-backed securities are valued by independent pricing services using models that consider estimated cash flows of each tranche of the security, establish a benchmark yield and develop an estimated tranche specific spread to the benchmark yield based on
the unique attributes of the tranche. Financial futures contracts traded on exchanges are valued at their last sale price. To-be-announced (“TBA”) commitments are valued on the basis of last available bid prices or current market quotations provided by pricing services. Swap agreements are valued utilizing quotes received daily by the Master Portfolio’s pricing service or through brokers, which are derived using daily swap curves and models that incorporate a number of market data factors, such as discounted cash flows, trades and values of the underlying reference instruments. Investments in open-end registered investment companies are valued at NAV each business day. Short-term securities with remaining maturities of 60 days or less may be valued at amortized cost, which approximates fair value.
Municipal investments (including commitments to purchase such investments on a “when-issued” basis) are valued on the basis of prices provided by dealers or pricing services. In determining the value of a particular investment, pricing services may use certain information with respect to transactions in such investments, quotations from dealers, pricing matrixes, market transactions in comparable investments and information with respect to various relationships between investments.
Equity investments traded on a recognized securities exchange or the NASDAQ Global Market System (“NASDAQ”) are valued at the last reported sale price that day or the NASDAQ official closing price, if applicable. For equity investments traded on more than one exchange, the last reported sale price on the exchange where the stock is primarily traded is used. Equity investments traded on a recognized exchange for which there were no sales on that day are valued at the last available bid (long positions) or ask (short positions) price. If no bid or ask price is available, the prior day’s price will be used, unless it is determined that such prior day’s price no longer reflects the fair value of the security.
Securities and other assets and liabilities denominated in foreign currencies are translated into US dollars using exchange rates determined as of the close of business on the New York Stock Exchange (“NYSE”). Foreign currency exchange contracts are valued at the mean between the bid and ask prices and are determined as of the close of business on the NYSE. Interpolated values are derived when the settlement date of the contract is an interim date for which quotations are not available.
Exchange-traded options are valued at the mean between the last bid and ask prices at the close of the options market in which the options trade. An exchange-traded option for which there is no mean price is valued at the last bid (long positions) or ask (short positions) price. If no bid or ask price is available, the prior day’s price will be used, unless it is determined that the prior day’s price no longer reflects the fair value of the option. Over-the-counter (“OTC”) options and swaptions are valued by an independent pricing service using a mathematical model which incorporates a number of market data factors, such as the trades and prices of the underlying instruments.
In the event that application of these methods of valuation results in a price for an investment that is deemed not to be representative of the market value of such investment, or if a price is not available, the investment will be valued by the Global Valuation Committee, or its delegate, in accordance with a policy approved by the Board as reflecting fair
| | | | | | |
| | | | | | | |
| | BLACKROCK BALANCED CAPITAL FUND, INC. | | MARCH 31, 2013 | | 61 |
| | |
| Notes to Consolidated Financial Statements (continued) | | Master Total Return Portfolio |
value (“Fair Value Assets”). When determining the price for Fair Value Assets, the Global Valuation Committee, or its delegate, seeks to determine the price that the Master Portfolio might reasonably expect to receive from the current sale of that asset in an arm’s-length transaction. Fair value determinations shall be based upon all available factors that the Global Valuation Committee, or its delegate, deem relevant consistent with the principles of fair value measurement which include the market approach, income approach and/or in the case of recent investments, the cost approach, as appropriate. A market approach generally consists of using comparable market transactions. The income approach generally is used to discount future cash flows to present value and adjusted for liquidity as appropriate. These factors include but are not limited to (i) attributes specific to the investment or asset; (ii) the principal market for the investment or asset; (iii) the customary participants in the principal market for the investment or asset; (iv) data assumptions by market participants for the investment or asset, if reasonably available; (v) quoted prices for similar investments or assets in active markets; and (vi) other factors, such as future cash flows, interest rates, yield curves, volatilities, prepayment speeds, loss severities, credit risks, recovery rates, liquidation amounts and/or default rates. Due to the inherent uncertainty of valuations of such investments, the fair values may differ from the values that would have been used had an active market existed. The Global Valuation Committee, or its delegate, employs various methods for calibrating valuation approaches for investments where an active market does not exist, including regular due diligence of the Master Portfolio’s pricing vendors, a regular review of key inputs and assumptions, transactional back-testing or disposition analysis to compare unrealized gains and losses to realized gains and losses, reviews of missing or stale prices and large movements in market values and reviews of any market related activity. The pricing of all Fair Value Assets is subsequently reported to the Board or a committee thereof on a quarterly basis.
Generally, trading in foreign instruments is substantially completed each day at various times prior to the close of business on the NYSE. Occasionally, events affecting the values of such instruments may occur between the foreign market close and the close of business on the NYSE that may not be reflected in the computation of the Master Portfolio’s net assets. If events (for example, a company announcement, market volatility or a natural disaster) occur during such periods that are expected to affect the value of such instruments materially, those instruments may be Fair Value Assets and be valued at their fair value, as determined in good faith by the Global Valuation Committee using a pricing service and/or policies approved by the Board.
Foreign Currency: The Master Portfolio’s books and records are maintained in US dollars. Purchases and sales of investment securities are recorded at the rates of exchange prevailing on the respective date of such transactions. Generally, when the US dollar rises in value against a foreign currency, the Master Portfolio’s investments denominated in that currency will lose value because that currency is worth fewer US dollars; the opposite effect occurs if the US dollar falls in relative value.
The Master Portfolio does not isolate the portion of the results of operations arising as a result of changes in the foreign exchange rates from the changes in the market prices of investments held or sold for financial
reporting purposes. Accordingly, the effects of changes in foreign currency exchange rates on investments are not segregated on the Consolidated Statement of Operations from the effects of changes in market prices of those investments but are included as a component of net realized and unrealized gain (loss) from investments. The Master Portfolio reports realized currency gains (losses) on foreign currency related transactions as components of net realized gain (loss) for financial reporting purposes, whereas such components are treated as ordinary income for federal income tax purposes.
Asset-Backed and Mortgage-Backed Securities: The Master Portfolio may invest in asset-backed securities. Asset-backed securities are generally issued as pass-through certificates, which represent undivided fractional ownership interests in an underlying pool of assets, or as debt instruments, which are also known as collateralized obligations, and are generally issued as the debt of a special purpose entity organized solely for the purpose of owning such assets and issuing such debt. Asset-backed securities are often backed by a pool of assets representing the obligations of a number of different parties. The yield characteristics of certain asset-backed securities may differ from traditional debt securities. One such major difference is that all or a principal part of the obligations may be prepaid at any time because the underlying assets (i.e., loans) may be prepaid at any time. As a result, a decrease in interest rates in the market may result in increases in the level of prepayments as borrowers, particularly mortgagors, refinance and repay their loans. An increased prepayment rate with respect to an asset-backed security subject to such a prepayment feature will have the effect of shortening the maturity of the security. In addition, the Master Portfolio may have to subsequently reinvest the proceeds at lower interest rates. If the Master Portfolio has purchased such an asset-backed security at a premium, a faster than anticipated prepayment rate could result in a loss of principal to the extent of the premium paid.
The Master Portfolio may purchase certain mortgage pass-through securities. There are a number of important differences among the agencies and instrumentalities of the US government that issue mortgage-related securities and among the securities that they issue. For example, mortgage-related securities guaranteed by Ginnie Mae are guaranteed as to the timely payment of principal and interest by Ginnie Mae and such guarantee is backed by the full faith and credit of the United States. However, mortgage-related securities issued by Freddie Mac and Fannie Mae, including Freddie Mac and Fannie Mae guaranteed Mortgage Pass-Through Certificates, which are solely the obligations of Freddie Mac and Fannie Mae, are not backed by or entitled to the full faith and credit of the United States but are supported by the right of the issuer to borrow from the Treasury.
Collateralized Debt Obligations: The Master Portfolio may invest in collateralized debt obligations (“CDOs”), which include collateralized bond obligations (“CBOs”) and collateralized loan obligations (“CLOs”). CBOs and CLOs are types of asset-backed securities. A CDO is an entity which is backed by a diversified pool of debt securities (CBOs) or syndicated bank loans (CLOs). The cash flows of the CDO can be split into multiple segments, called “tranches”, which will vary in risk profile and yield. The riskiest segment is the subordinated or “equity” tranche. This tranche bears the greatest risk of defaults from the underlying assets in the CDO
| | | | | | |
| | | | | | | |
| 62 | | BLACKROCK BALANCED CAPITAL FUND, INC. | | MARCH 31, 2013 | | |
| | |
| Notes to Consolidated Financial Statements (continued) | | Master Total Return Portfolio |
and serves to protect the other, more senior, tranches from default in all but the most severe circumstances. Since it is shielded from defaults by the more junior tranches, a “senior” tranche will typically have higher credit ratings and lower yields than their underlying securities, and often receive investment grade ratings from one or more of the nationally recognized rating agencies. Despite the protection from the more junior tranches, senior tranches can experience substantial losses due to actual defaults, increased sensitivity to future defaults and the disappearance of one or more protecting tranches as a result of changes in the credit profile of the underlying pool of assets.
Inflation-Indexed Bonds: The Master Portfolio may invest in inflation-indexed bonds. Inflation-indexed bonds are fixed income securities whose principal value is periodically adjusted according to the rate of inflation. If the index measuring inflation rises or falls, the principal value of inflation-indexed bonds will be adjusted upward or downward, and consequently the interest payable on these securities (calculated with respect to a larger or smaller principal amount) will be increased or reduced, respectively. Any upward or downward adjustment in the principal amount of an inflation-indexed bond will be included as interest income in the Consolidated Statement of Operations, even though investors do not receive their principal until maturity. Repayment of the original bond principal upon maturity (as adjusted for inflation) is guaranteed in the case of US Treasury inflation-indexed bonds. For bonds that do not provide a similar guarantee, the adjusted principal value of the bond repaid at maturity may be less than the original principal.
Multiple Class Pass-Through Securities: The Master Portfolio may invest in multiple class pass-through securities, including collateralized mortgage obligations (“CMOs”) and commercial mortgage-backed securities. These multiple class securities may be issued by Ginnie Mae, US government agencies or instrumentalities or by trusts formed by private originators of, or investors in, mortgage loans. In general, CMOs are debt obligations of a legal entity that are collateralized by, and multiple class pass-through securities represent direct ownership interests in, a pool of residential or commercial mortgage loans or mortgage pass-through securities (the “Mortgage Assets”), the payments on which are used to make payments on the CMOs or multiple pass-through securities. Classes of CMOs include interest only (“IOs”), principal only (“POs”), planned amortization classes and targeted amortization classes. IOs and POs are stripped mortgage-backed securities representing interests in a pool of mortgages, the cash flow from which has been separated into interest and principal components. IOs receive the interest portion of the cash flow while POs receive the principal portion. IOs and POs can be extremely volatile in response to changes in interest rates. As interest rates rise and fall, the value of IOs tends to move in the same direction as interest rates. POs perform best when prepayments on the underlying mortgages rise since this increases the rate at which the principal is returned and the yield to maturity on the PO. When payments on mortgages underlying a PO are slower than anticipated, the life of the PO is lengthened and the yield to maturity is reduced. If the underlying Mortgage Assets experience greater than anticipated pre-payments of principal, the Master Portfolio may not fully recoup its initial investment in IOs.
Stripped Mortgage-Backed Securities: The Master Portfolio may invest in stripped mortgage-backed securities issued by the US government, its
agencies and instrumentalities. Stripped mortgage-backed securities are usually structured with two classes that receive different proportions of the interest (IOs) and principal (POs) distributions on a pool of Mortgage Assets. The Master Portfolio also may invest in stripped mortgage-backed securities that are privately issued.
Zero-Coupon Bonds: The Master Portfolio may invest in zero-coupon bonds, which are normally issued at a significant discount from face value and do not provide for periodic interest payments. Zero-coupon bonds may experience greater volatility in market value than similar maturity debt obligations which provide for regular interest payments.
Capital Trusts: The Master Portfolio may invest in capital trusts. These securities are typically issued by corporations, generally in the form of interest bearing notes with preferred securities characteristics, or by an affiliated business trust of a corporation, generally in the form of beneficial interests in subordinated debentures or similarly structured securities. The securities can be structured as either fixed or adjustable coupon securities that can have either a perpetual or stated maturity date. Dividends can be deferred without creating an event of default or acceleration, although maturity cannot take place unless all cumulative payment obligations have been met. The deferral of payments does not affect the purchase or sale of these securities in the open market. Payments on these securities are treated as interest rather than dividends for federal income tax purposes. These securities generally are rated below that of the issuing company’s senior debt securities.
Preferred Stock: The Master Portfolio may invest in preferred stocks. Preferred stock has a preference over common stock in liquidation (and generally in receiving dividends as well) but is subordinated to the liabilities of the issuer in all respects. As a general rule, the market value of preferred stock with a fixed dividend rate and no conversion element varies inversely with interest rates and perceived credit risk, while the market price of convertible preferred stock generally also reflects some element of conversion value. Because preferred stock is junior to debt securities and other obligations of the issuer, deterioration in the credit quality of the issuer will cause greater changes in the value of a preferred stock than in a more senior debt security with similar stated yield characteristics. Unlike interest payments on debt securities, preferred stock dividends are payable only if declared by the issuer’s board of directors. Preferred stock also may be subject to optional or mandatory redemption provisions.
Floating Rate Loan Interests: The Master Portfolio may invest in floating rate loan interests. The floating rate loan interests the Master Portfolio holds are typically issued to companies (the “borrower”) by banks, other financial institutions, and privately and publicly offered corporations (the “lender”). Floating rate loan interests are generally non-investment grade, often involve borrowers whose financial condition is troubled or uncertain and companies that are highly leveraged. The Master Portfolio may invest in obligations of borrowers who are in bankruptcy proceedings. Floating rate loan interests may include fully funded term loans or revolving lines of credit. Floating rate loan interests are typically senior in the corporate capital structure of the borrower. Floating rate loan interests generally pay interest at rates that are periodically determined by reference to a base lending rate plus a premium. The base lending rates
| | | | | | |
| | | | | | | |
| | BLACKROCK BALANCED CAPITAL FUND, INC. | | MARCH 31, 2013 | | 63 |
| | |
| Notes to Consolidated Financial Statements (continued) | | Master Total Return Portfolio |
are generally the lending rate offered by one or more European banks, such as the London Interbank Offered Rate (“LIBOR”), the prime rate offered by one or more US banks or the certificate of deposit rate. Floating rate loan interests may involve foreign borrowers, and investments may be denominated in foreign currencies. The Master Portfolio considers these investments to be investments in debt securities for purposes of its investment policies.
When the Master Portfolio purchases a floating rate loan interest it may receive a facility fee and when it sells a floating rate loan interest it may pay a facility fee. On an ongoing basis, the Master Portfolio may receive a commitment fee based on the undrawn portion of the underlying line of credit amount of a floating rate loan interest. Facility and commitment fees are typically amortized to income over the term of the loan or term of the commitment, respectively. Consent and amendment fees are recorded to income as earned. Prepayment penalty fees, which may be received by the Master Portfolio upon the prepayment of a floating rate loan interest by a borrower, are recorded as realized gains. The Master Portfolio may invest in multiple series or tranches of a loan. A different series or tranche may have varying terms and carry different associated risks.
Floating rate loan interests are usually freely callable at the borrower’s option. The Master Portfolio may invest in such loans in the form of participations in loans (“Participations”) or assignments (“Assignments”) of all or a portion of loans from third parties. Participations typically will result in the Master Portfolio having a contractual relationship only with the lender, not with the borrower. The Master Portfolio will have the right to receive payments of principal, interest and any fees to which it is entitled only from the lender selling the Participation and only upon receipt by the lender of the payments from the borrower. In connection with purchasing Participations, the Master Portfolio generally will have no right to enforce compliance by the borrower with the terms of the loan agreement, nor any rights of offset against the borrower, and the Master Portfolio may not benefit directly from any collateral supporting the loan in which it has purchased the Participation. As a result, the Master Portfolio will assume the credit risk of both the borrower and the lender that is selling the Participation. The Master Portfolio’s investment in loan participation interests involves the risk of insolvency of the financial intermediaries who are parties to the transactions. In the event of the insolvency of the lender selling the Participation, the Master Portfolio may be treated as a general creditor of the lender and may not benefit from any offset between the lender and the borrower. Assignments typically result in the Master Portfolio having a direct contractual relationship with the borrower, and the Master Portfolio may enforce compliance by the borrower with the terms of the loan agreement.
Borrowed Bond Agreements: The Master Portfolio may enter into borrowed bond agreements. In a borrowed bond agreement, the Master Portfolio borrows a bond from a counterparty in exchange for cash collateral with the commitment that the security and the cash will be returned to the counterparty and the Master Portfolio, respectively, at a mutually agreed upon rate and date. Certain agreements have no stated maturity and can be terminated by either party at any time. Borrowed bond agreements are entered into primarily in connection with short sales of bonds. Earnings on cash collateral and compensation to the
lender of the bond are based on agreed upon rates between the Master Portfolio and the counterparty. The value of the underlying cash collateral approximates the market value and accrued interest of the borrowed bond. To the extent that a borrowed bond transaction exceeds one business day, the value of the cash collateral in the possession of the counterparty is monitored on a daily basis to ensure the adequacy of the collateral. As the market value of the borrowed bond changes, the cash collateral is periodically increased or decreased with a frequency and in amounts prescribed in the borrowed bond agreement. Full realization of the collateral by the Master Portfolio may be limited if the value of an investment purchased with the cash collateral by the lender decreases. The Master Portfolio may also experience delays in gaining access to the collateral.
Short Sales: The Master Portfolio may enter into short sale transactions in which the Master Portfolio sells a security it does not hold in anticipation of a decline in the market price of that security. When the Master Portfolio makes a short sale, it will borrow the security sold short (borrowed bond) and deliver the security to the counterparty to which it sold the security short. An amount equal to the proceeds received by the Master Portfolio is reflected as an asset and an equivalent liability. The amount of the liability is subsequently marked-to-market to reflect the market value of the short sale. The Master Portfolio is required to repay the counterparty interest on the security sold short, which is shown as interest expense in the Consolidated Statement of Operations. The Master Portfolio is exposed to market risk based on the amount, if any, that the market value of the security increases beyond the market value at which the position was sold. Thus, a short sale of a security involves the risk that instead of declining, the price of the security sold short will rise. The short sale of securities involves the possibility of a theoretically unlimited loss since there is a theoretically unlimited potential for the market price of the security sold short to increase. A gain, limited to the price at which the Master Portfolio sold the security short, or a loss, unlimited as to the dollar amount, will be recognized upon the termination of a short sale if the market price is either less than or greater than the proceeds originally received. There is no assurance the Master Portfolio will be able to close out a short position at a particular time or at an acceptable price.
Forward Commitments and When-Issued Delayed Delivery Securities: The Master Portfolio may purchase securities on a when-issued basis and may purchase or sell securities on a forward commitment basis. Settlement of such transactions normally occurs within a month or more after the purchase or sale commitment is made. The Master Portfolio may purchase securities under such conditions with the intention of actually acquiring them, but may enter into a separate agreement to sell the securities before the settlement date. Since the value of securities purchased may fluctuate prior to settlement, the Master Portfolio may be required to pay more at settlement than the security is worth. In addition, the Master Portfolio is not entitled to any of the interest earned prior to settlement. When purchasing a security on a delayed delivery basis, the Master Portfolio assumes the rights and risks of ownership of the security, including the risk of price and yield fluctuations. In the event of default by the counterparty, the Master Portfolio’s maximum amount of loss is the unrealized appreciation of unsettled when-issued transactions, which is shown in the Consolidated Schedule of Investments.
| | | | | | |
| | | | | | | |
| 64 | | BLACKROCK BALANCED CAPITAL FUND, INC. | | MARCH 31, 2013 | | |
| | |
| Notes to Consolidated Financial Statements (continued) | | Master Total Return Portfolio |
TBA Commitments: The Master Portfolio may enter into TBA commitments. TBA commitments are forward agreements for the purchase or sale of mortgage-backed securities for a fixed price, with payment and delivery on an agreed upon future settlement date. The specific securities to be delivered are not identified at the trade date. However, delivered securities must meet specified terms, including issuer, rate and mortgage terms. The Master Portfolio generally enters into TBA commitments with the intent to take possession of or deliver the underlying mortgage-backed securities but can extend the settlement or roll the transaction. TBA commitments involve a risk of loss if the value of the security to be purchased or sold declines or increases, respectively, prior to settlement date.
Mortgage Dollar Roll Transactions: The Master Portfolio may sell TBA mortgage-backed securities and simultaneously contract to repurchase substantially similar (same type, coupon and maturity) securities on a specific future date at an agreed upon price. During the period between the sale and repurchase, the Master Portfolio will not be entitled to receive interest and principal payments on the securities sold. The Master Portfolio accounts for mortgage dollar roll transactions as purchases and sales and realizes gains and losses on these transactions. These transactions may increase the Master Portfolio’s portfolio turnover rate. Mortgage dollar rolls involve the risk that the market value of the securities that the Master Portfolio is required to purchase may decline below the agreed upon repurchase price of those securities.
Treasury Roll Transactions: The Master Portfolio may enter into treasury roll transactions. In a treasury roll transaction the Master Portfolio sells a Treasury security to a counterparty with a simultaneous agreement to repurchase the same security at an agreed upon price and future settlement date. The Master Portfolio receives cash from the sale of the Treasury security to use for other investment purposes. The difference between the sale price and repurchase price represents net interest income or net interest expense reflective of an agreed upon rate between the Master Portfolio and the counterparty over the term of the borrowing. For US GAAP purposes, a treasury roll transaction is accounted for as a secured borrowing and not as a purchase or sale. During the term of the borrowing, interest income from the Treasury security and the related interest expense on the secured borrowing is recorded by the Master Portfolio on an accrual basis. The Master Portfolio will benefit from the transaction if the income earned on the investment purchased with the cash received in the treasury roll transaction exceeds the interest expense incurred by the Master Portfolio. If the interest expense exceeds the income earned, the Master Portfolio’s net investment income and dividends to shareholders may be adversely impacted. Treasury roll transactions involve the risk that the market value of the securities that the Master Portfolio is required to repurchase may decline below the agreed upon repurchase price of those securities.
Reverse Repurchase Agreements: The Master Portfolio may enter into reverse repurchase agreements with qualified third party broker-dealers. In a reverse repurchase agreement, the Master Portfolio sells securities to a bank or broker-dealer and agrees to repurchase the same securities at a mutually agreed upon date and price. Securities sold under reverse repurchase agreements are recorded as a liability in the Consolidated Statement of Assets and Liabilities. Due to the short term nature of the
reverse repurchase agreements, face value approximates fair value. During the term of the reverse repurchase agreement, the Master Portfolio continues to receive the principal and interest payments on these securities. Certain agreements have no stated maturity and can be terminated by either party at any time. Interest on the value of the reverse repurchase agreements issued and outstanding is based upon competitive market rates determined at the time of issuance. The Master Portfolio may utilize reverse repurchase agreements when it is anticipated that the interest income to be earned from the investment of the proceeds of the transaction is greater than the interest expense of the transaction. Reverse repurchase agreements involve leverage risk and also the risk that the market value of the securities that the Master Portfolio is obligated to repurchase under the agreement may decline below the repurchase price. In the event the buyer of securities under a reverse repurchase agreement files for bankruptcy or becomes insolvent, the Master Portfolio’s use of the proceeds of the agreement may be restricted while the other party, or its trustee or receiver, determines whether or not to enforce the Master Portfolio’s obligation to repurchase the securities.
Segregation and Collateralization: In cases in which the 1940 Act and the interpretive positions of the Securities and Exchange Commission (“SEC”) require that the Master Portfolio either deliver collateral or segregate assets in connection with certain investments (e.g., dollar rolls, TBA sale commitments, financial futures contracts, foreign currency exchange contracts, swaps, short sales and options written), or certain borrowings (e.g., reverse repurchase agreements and treasury roll transactions), the Master Portfolio will, consistent with SEC rules and/or certain interpretive letters issued by the SEC, segregate collateral or designate on its books and records cash or liquid securities having a market value at least equal to the amount that would otherwise be required to be physically segregated. Furthermore, based on requirements and agreements with certain exchanges and third party broker-dealers, the Master Portfolio engaging in such transactions may have requirements to deliver/deposit securities to/with an exchange or broker-dealer as collateral for certain investments.
Investment Transactions and Investment Income: For financial reporting purposes, investment transactions are recorded on the dates the transactions are entered into (the trade dates). Realized gains and losses on investment transactions are determined on the identified cost basis. Dividend income is recorded on the ex-dividend dates. Dividends from foreign securities where the ex-dividend date may have passed are subsequently recorded when the Master Portfolio is informed of the ex-dividend date. Under the applicable foreign tax laws, a withholding tax at various rates may be imposed on capital gains, dividends and interest. Upon notification from issuers, some of the dividend income received from a real estate investment trust may be redesignated as a reduction of cost of the related investment and/or realized gain. Interest income, including amortization and accretion of premiums and discounts on debt securities, is recognized on the accrual basis.
Income Taxes: The Master Portfolio is classified as a partnership for federal income tax purposes. As such, each investor in the Master Portfolio is treated as the owner of its proportionate share of net assets, income, expenses and realized and unrealized gains and losses of the Master Portfolio. Therefore, no federal income tax provision is required. It is
| | | | | | |
| | | | | | | |
| | BLACKROCK BALANCED CAPITAL FUND, INC. | | MARCH 31, 2013 | | 65 |
| | |
| Notes to Consolidated Financial Statements (continued) | | Master Total Return Portfolio |
intended that the Master Portfolio’s assets will be managed so an investor in the Master Portfolio can satisfy the requirements of Subchapter M of the Internal Revenue Code of 1986, as amended.
The Master Portfolio files US federal and various state and local tax returns. No income tax returns are currently under examination. The statute of limitations on the Master Portfolio’s US federal tax returns remains open for each of the four years ended September 30, 2012. The statutes of limitations on the Master Portfolio’s state and local tax returns may remain open for an additional year depending upon the jurisdiction. Management does not believe there are any uncertain tax positions that require recognition of a tax liability.
Recent Accounting Standards: In December 2011, the Financial Accounting Standards Board (the “FASB”) issued guidance that will expand current disclosure requirements on the offsetting of certain assets and liabilities. The new disclosures will be required for investments and derivative financial instruments subject to master netting or similar agreements which are eligible for offset in the Statements of Assets and Liabilities and will require an entity to disclose both gross and net information about such investments and transactions in the financial statements. In January 2013, the FASB issued guidance that clarifies which investments and transactions are subject to the offsetting disclosure requirements. The scope of the disclosure requirements for offsetting will be limited to derivative instruments, repurchase agreements and reverse repurchase agreements, and securities borrowing and securities lending transactions. The guidance is effective for financial statements with fiscal years beginning on or after January 1, 2013, and interim periods within those fiscal years. Management is evaluating the impact of this guidance on the Master Portfolio’s financial statement disclosures.
Other: Expenses directly related to the Master Portfolio are charged to the Master Portfolio. Other operating expenses shared by several funds are pro rated among those funds on the basis of relative net assets or other appropriate methods. Expenses directly related to the Master Portfolio and other shared expenses pro rated to the Master Portfolio are allocated daily to each class based on its relative net assets or other appropriate methods.
The Master Portfolio has an arrangement with the custodian whereby fees may be reduced by credits earned on uninvested cash balances, which, if applicable, are shown as fees paid indirectly in the Consolidated Statement of Operations. The custodian imposes fees on overdrawn cash balances, which can be offset by accumulated credits earned or may result in additional custody charges.
2. Derivative Financial Instruments:
The Master Portfolio engages in various portfolio investment strategies using derivative contracts both to increase the returns of the Master Portfolio and/or to economically hedge, or protect, its exposure to certain risks such as credit risk, equity risk, interest rate risk, foreign currency exchange rate risk or other risk (inflation risk). These contracts may be transacted on an exchange or OTC.
Losses may arise if the value of the contract decreases due to an unfavorable change in the market rates or values of the underlying instrument or if the counterparty does not perform under the contract. The Master Portfolio’s maximum risk of loss from counterparty credit risk on OTC derivatives is generally the aggregate unrealized gain netted against any collateral pledged by the counterparty. For OTC options purchased, the Master Portfolio bears the risk of loss in the amount of the premiums paid plus the positive change in market values net of any collateral received on the options should the counterparty fail to perform under the contracts. Options written by the Master Portfolio do not give rise to counterparty credit risk, as options written obligate the Master Portfolio and not the counterparty to perform. Counterparty risk related to exchange-traded financial futures contracts and options and centrally cleared swaps is deemed to be minimal due to the protection against defaults provided by the exchange on which these contracts trade.
The Master Portfolio may mitigate counterparty risk by procuring collateral and through netting provisions included within an International Swaps and Derivatives Association, Inc. master agreement (“ISDA Master Agreement”) implemented between the Master Portfolio and each of its respective counterparties. An ISDA Master Agreement allows the Master Portfolio to offset with each separate counterparty certain derivative financial instrument’s payables and/or receivables with collateral held. The amount of collateral moved to/from applicable counterparties is generally based upon minimum transfer amounts of up to $500,000. To the extent amounts due to the Master Portfolio from its counterparties are not fully collateralized contractually or otherwise, the Master Portfolio bears the risk of loss from counterparty non-performance. See Note 1 “Segregation and Collateralization” for information with respect to collateral practices. In addition, the Master Portfolio manages counterparty risk by entering into agreements only with counterparties that it believes have the financial resources to honor their obligations and by monitoring the financial stability of those counterparties.
Certain ISDA Master Agreements allow counterparties to OTC derivatives to terminate derivative contracts prior to maturity in the event the Master Portfolio’s net assets decline by a stated percentage or the Master Portfolio fails to meet the terms of its ISDA Master Agreements, which would cause the Master Portfolio to accelerate payment of any net liability owed to the counterparty.
Financial Futures Contracts: The Master Portfolio purchases and/or sells financial futures contracts and options on financial futures contracts to gain exposure to, or economically hedge against, changes in interest rates (interest rate risk), changes in the value of equity securities (equity risk) or foreign currencies (foreign currency exchange rate risk). Financial futures contracts are agreements between the Master Portfolio and a counterparty to buy or sell a specific quantity of an underlying instrument at a specified price and at a specified date. Depending on the terms of the particular contract, financial futures contracts are settled either through physical delivery of the underlying instrument on the settlement date or by payment of a cash settlement amount on the settlement date. Pursuant to the contract, the Master Portfolio agrees to receive from or pay to the broker an amount of cash equal to the daily fluctuation in value of the contract. Such receipts or payments are known
| | | | | | |
| | | | | | | |
| 66 | | BLACKROCK BALANCED CAPITAL FUND, INC. | | MARCH 31, 2013 | | |
| | |
| Notes to Consolidated Financial Statements (continued) | | Master Total Return Portfolio |
as variation margin and are recorded by the Master Portfolio as unrealized appreciation or depreciation. When the contract is closed, the Master Portfolio records a realized gain or loss equal to the difference between the value of the contract at the time it was opened and the value at the time it was closed. The use of financial futures contracts involves the risk of an imperfect correlation in the movements in the price of financial futures contracts, interest or foreign currency exchange rates and the underlying assets.
Foreign Currency Exchange Contracts: The Master Portfolio enters into foreign currency exchange contracts as an economic hedge against either specific transactions or portfolio instruments or to obtain exposure to foreign currencies (foreign currency exchange rate risk). A foreign currency exchange contract is an agreement between two parties to buy and sell a currency at a set exchange rate on a future date. Foreign currency exchange contracts, when used by the Master Portfolio, help to manage the overall exposure to the currencies in which some of the investments held by the Master Portfolio are denominated. The contract is marked-to-market daily and the change in market value is recorded by the Master Portfolio as an unrealized gain or loss. When the contract is closed, the Master Portfolio records a realized gain or loss equal to the difference between the value at the time it was opened and the value at the time it was closed. The use of foreign currency exchange contracts involves the risk that the value of a foreign currency exchange contract changes unfavorably due to movements in the value of the referenced foreign currencies and the risk that the counterparty to the contract does not perform its obligations under the agreement.
Options: The Master Portfolio purchases and writes call and put options to increase or decrease its exposure to underlying instruments (including credit risk, foreign currency exchange rate risk, equity risk and interest rate risk) and/or, in the case of options written, to generate gains from options premiums. A call option gives the purchaser (holder) of the option the right (but not the obligation) to buy, and obligates the seller (writer) to sell (when the option is exercised), the underlying instrument at the exercise or strike price at any time or at a specified time during the option period. A put option gives the holder the right to sell and obligates the writer to buy the underlying instrument at the exercise or strike price at any time or at a specified time during the option period. When the Master Portfolio purchases (writes) an option, an amount equal to the premium paid (received) by the Master Portfolio is reflected as an asset (liability). The amount of the asset (liability) is subsequently marked-to-market to reflect the current market value of the option purchased (written). When an instrument is purchased or sold through an exercise of an option, the related premium paid (or received) is added to (or deducted from) the basis of the instrument acquired or deducted from (or added to) the proceeds of the instrument sold. When an option expires (or the Master Portfolio enters into a closing transaction), the Master Portfolio realizes a gain or loss on the option to the extent of the premiums received or paid (or gain or loss to the extent the cost of the closing transaction exceeds the premiums received or paid). When the Master Portfolio writes a call option, such option is “covered,” meaning that the Master Portfolio holds the underlying instrument subject to being called by the option counterparty. When the Master Portfolio writes a put option, such option is covered by cash in an amount sufficient to cover the obligation.
Options on swaps (swaptions) are similar to options on securities except that instead of selling or purchasing the right to buy or sell a security, the writer or purchaser of the swap option is granting or buying the right to enter into a previously agreed upon interest rate or credit default swap agreement (interest rate risk and/or credit risk) at any time before the expiration of the option.
The Master Portfolio also purchases or sells listed or OTC foreign currency options, foreign currency futures and related options on foreign currency futures as a short or long hedge against possible variations in foreign exchange rates or to gain exposure to foreign currencies (foreign currency exchange rate risk). When foreign currency is purchased or sold through an exercise of a foreign currency option, the related premium paid (or received) is added to (or deducted from) the basis of the foreign currency acquired or deducted from (or added to) the proceeds of the foreign currency sold (receipts from the foreign currency purchased). Such transactions may be effected with respect to hedges on non-US dollar denominated instruments owned by the Master Portfolio but not yet delivered, or committed or anticipated to be purchased by the Master Portfolio.
The Master Portfolio may also purchase and write a variety of options with non-standard payout structures or other features (“barrier options”). Barrier options are generally traded OTC. The Master Portfolio may invest in various types of barrier options including down-and-out options, down-and-in options, double no-touch options and one-touch options. Down-and-out options are similar to standard options, except that the option expires worthless to the purchaser of the option if the price of the underlying instrument reaches a specific barrier price level prior to the option’s expiration date. Down-and-in options expire worthless to the purchaser of the option unless the price of the underlying instrument falls below a specific barrier price level prior to the option’s expiration date. Double no-touch options provide the purchaser of the option an agreed-upon payout if the price of the underlying instrument does not reach or surpass predetermined barrier price levels prior to the option’s expiration date. One-touch options provide the purchaser of the option an agreed-upon payout if the price of the underlying instrument reaches or surpasses predetermined barrier price level prior to the option’s expiration date.
In purchasing and writing options, the Master Portfolio bears the risk of an unfavorable change in the value of the underlying instrument or the risk that the Master Portfolio may not be able to enter into a closing transaction due to an illiquid market. Exercise of a written option could result in the Master Portfolio purchasing or selling a security at a price different from the current market value.
Swaps: The Master Portfolio enters into swap agreements, in which the Master Portfolio and a counterparty agree either to make periodic net payments on a specified notional amount or a net payment upon termination. These payments received or made by the Master Portfolio are recorded in the Consolidated Statement of Operations as realized gains or losses, respectively. Any upfront fees paid are recorded as assets and any upfront fees received are recorded as liabilities and are shown as swap premiums paid and swap premiums received, respectively in the Consolidated Statement of Assets and Liabilities and amortized over the
| | | | | | |
| | | | | | | |
| | BLACKROCK BALANCED CAPITAL FUND, INC. | | MARCH 31, 2013 | | 67 |
| | |
| Notes to Consolidated Financial Statements (continued) | | Master Total Return Portfolio |
term of the swap. Swap agreements are privately negotiated in the OTC market and may be entered into as a bilateral contract or centrally cleared (“centrally cleared swaps”). In a centrally cleared swap, immediately following execution of the swap agreement, the swap agreement is novated to a central counterparty (the “CCP”) and the Fund faces the CCP through a future commission merchant. Unlike a bilateral swap agreement, for centrally cleared swaps, the Master Portfolio has no credit exposure to the counterparty as the CCP stands between the Master Portfolio and the counterparty. Swaps are marked-to-market daily and changes in value are recorded as unrealized appreciation (depreciation). The daily change in valuation of centrally cleared swaps, if any, is recorded as a receivable or payable for variation margin in the Consolidated Statement of Assets and Liabilities. When the swap is terminated, the Master Portfolio will record a realized gain or loss equal to the difference between the proceeds from (or cost of) the closing transaction and the Master Portfolio’s basis in the contract, if any. Generally, the basis of the contracts is the premium received or paid. Swap transactions involve, to varying degrees, elements of interest rate, credit and market risk in excess of the amounts recognized in the Consolidated Statement of Assets and Liabilities. Such risks involve the possibility that there will be no liquid market for these agreements, that the counterparty to the agreements may default on its obligation to perform or disagree as to the meaning of the contractual terms in the agreements, and that there may be unfavorable changes in interest rates and/or market values associated with these transactions.
• Credit default swaps – The Master Portfolio enters into credit default swaps to manage its exposure to the market or certain sectors of the market, to reduce its risk exposure to defaults of corporate and/or sovereign issuers or to create exposure to corporate and/or sovereign issuers to which it is not otherwise exposed (credit risk). The Master Portfolio may either buy or sell (write) credit default swaps on single-name issuers (corporate or sovereign), a combination or basket of single-name issuers or traded indexes. Credit default swaps on single-name issuers are agreements in which the protection buyer pays fixed periodic payments to the seller in consideration for a guarantee from the protection seller to make a specific payment should a negative credit event take place with respect to the referenced entity (e.g., bankruptcy, failure to pay, obligation accelerators, repudiation, moratorium or restructuring). Credit default swaps on traded indexes are agreements in which the buyer pays fixed periodic payments to the seller in consideration for a guarantee from the seller to make a specific payment should a write-down, principal or interest shortfall or default of all or individual underlying securities included in the index occurs. As a buyer, if an underlying credit event occurs, the Master Portfolio will either receive from the seller an amount equal to the notional amount of the swap and deliver the referenced security or underlying securities comprising the index or receive a net settlement of cash equal to the notional amount of the swap less the recovery value of the security or underlying securities comprising the index. As a seller (writer), if an underlying credit event occurs, the Master Portfolio will either pay the buyer an amount equal to the notional amount of the swap and take delivery of the referenced security or underlying securities comprising the index or pay a net settlement of cash equal to the notional amount of the swap less the recovery value of the security or underlying securities comprising the index.
• Total return swaps – The Master Portfolio enters into total return swaps to obtain exposure to a security or market without owning such security or investing directly in that market or to transfer the risk/return of one market (e.g., fixed income) to another market (e.g., equity) (equity risk and/or interest rate risk). Total return swaps are agreements in which there is an exchange of cash flows whereby one party commits to make payments based on the total return (coupons plus capital gains/losses) of an underlying instrument in exchange for fixed or floating rate interest payments. To the extent the total return of the instrument or index underlying the transaction exceeds or falls short of the offsetting interest rate obligation, the Master Portfolio will receive a payment from or make a payment to the counterparty.
• Interest rate swaps – The Master Portfolio enters into interest rate swaps to gain or reduce exposure to interest rates or to manage duration, the yield curve or interest rate risk by economically hedging the value of the fixed rate bonds which may decrease when interest rates rise (interest rate risk). Interest rate swaps are agreements in which one party pays a stream of interest payments, either fixed or floating, for another party’s stream of interest payments, either fixed or floating, on the same notional amount for a specified period of time. Interest rate floors, which are a type of interest rate swap, are agreements in which one party agrees to make payments to the other party to the extent that interest rates fall below a specified rate or floor in return for a premium. In more complex swaps, the notional principal amount may decline (or amortize) over time.
Derivative Financial Instruments Categorized by Risk Exposure:
| | | | | | |
| |
| Fair Values of Derivative Financial Instruments as of March 31, 2013 | |
| |
| | | Asset Derivatives | |
| | | |
| | | Consolidated Statement of Assets
and Liabilities Location | | Value | |
| | | |
Interest rate contracts | | Net unrealized appreciation/depreciation1; Unrealized appreciation on swaps; Swap premiums paid; Investments at value – unaffiliated2 | | | $18,443,833 | |
| | | |
Foreign currency exchange contracts | | Net unrealized appreciation/depreciation1; Unrealized appreciation on foreign currency exchange contracts; Investments at value – unaffiliated2 | | | 62,146,279 | |
| | | |
Credit contracts | | Unrealized appreciation on swaps; Swap premiums paid; Investments at value – unaffiliated2 | | | 18,257,749 | |
| | | |
Equity contracts | | Investments at value – unaffiliated2 | | | 83,926 | |
| | | |
Total | | | | | $98,931,787 | |
| |
| | | | | | |
| | | | | | | |
| 68 | | BLACKROCK BALANCED CAPITAL FUND, INC. | | MARCH 31, 2013 | | |
| | |
| Notes to Consolidated Financial Statements (continued) | | Master Total Return Portfolio |
| | | | | | |
| |
| | | Liability Derivatives | |
| | | |
| | | Consolidated Statement of Assets and Liabilities Location | | Value | |
| | | |
Interest rate contracts | | Net unrealized appreciation/depreciation1 Unrealized depreciation on swaps; Swap premiums received; Options written at value | | | $ 6,521,999 | |
| | | |
Foreign currency exchange contracts | | Unrealized depreciation on foreign currency exchange contracts; Options written at value | | | 42,951,323 | |
| | | |
Credit contracts | | Unrealized depreciation on swaps; Swap premiums received Options written at value | | | 18,935,908 | |
| | | |
Equity contracts | | Net unrealized appreciation/depreciation1 | | | 36,569 | |
| | | |
Total | | | | | $68,445,799 | |
| |
| | 1 | Includes cumulative appreciation/depreciation on financial futures contracts and centrally cleared swaps as reported in the Consolidated Schedule of Investments. Only current day’s variation margin is reported within the Consolidated Statement of Assets and Liabilities. |
| | 2 | Includes options purchased at value as reported within the Consolidated Statement of Assets and Liabilities. |
| | | | |
| |
The Effect of Derivative Financial Instruments in the Consolidated
Statement of Operations | |
| Six Months Ended March 31, 2013 | |
| |
| Net Realized Gain (Loss) From | |
| |
Interest rate contracts: | | | | |
Financial futures contracts | | $ | 4,152,384 | |
Swaps | | | (2,490,744 | ) |
Options3 | | | (1,883,430 | ) |
Foreign currency exchange contracts: | | | | |
Financial futures contracts | | | (275,303 | ) |
Foreign currency transactions. | | | (22,696,173 | ) |
Options3 | | | (184,747 | ) |
Credit contracts: | | | | |
Swaps | | | 477,819 | |
Options3 | | | (316,192 | ) |
Equity contracts: | | | | |
Financial futures contracts | | | (657,863 | ) |
Swaps | | | (7,197 | ) |
Options3 | | | (2,213,981 | ) |
| | | | |
Total | | $ | (26,095,427 | ) |
| | | | |
|
| |
| | | | |
| |
| Net Change in Unrealized Appreciation/Depreciation on | |
| |
Interest rate contracts: | | | | |
Financial futures contracts | | $ | (1,563,793 | ) |
Swaps | | | 2,308,584 | |
Options3 | | | 2,112,819 | |
Foreign currency exchange contracts: | | | | |
Foreign currency translations | | | 31,005,090 | |
Options3 | | | 7,134,047 | |
Credit contracts: | | | | |
Swaps | | | (2,617,318 | ) |
Options3 | | | (79,486 | ) |
Equity contracts: | | | | |
Financial futures contracts | | | 3,678 | |
Options3 | | | 645,025 | |
Other contracts: | | | | |
Swaps | | | 661,275 | |
| | | | |
Total | | $ | 39,609,921 | |
| | | | |
|
| |
| | 3 | Options purchased are included in the net realized gain (loss) from investments and net change in unrealized appreciation/depreciation on investments. |
For the six months ended March 31, 2013, the average quarterly balances of outstanding derivative financial instruments were as follows:.
| | | | |
| |
Financial futures contracts: | | | | |
Average number of contracts purchased | | | 5,121 | |
Average number of contracts sold | | | 5,720 | |
Average notional value of contracts purchased | | $ | 902,128,822 | |
Average notional value of contracts sold | | $ | 1,077,192,773 | |
Foreign currency exchange contracts: | | | | |
Average number of contracts - US dollars purchased | | | 46 | |
Average number of contracts - US dollars sold | | | 27 | |
Average US dollar amounts purchased | | $ | 898,037,159 | |
Average US dollar amounts sold | | $ | 273,286,665 | |
Options: | | | | |
Average number of option contracts purchased | | | 4,172 | |
Average number of option contracts written | | | 2,524 | |
Average notional value of option contracts purchased | | $ | 1,066,857,573 | |
Average notional value of option contracts written | | $ | 694,221,385 | |
Average number of swaption contracts purchased | | | 8 | |
Average number of swaption contracts written | | | 11 | |
Average notional value of swaption contracts purchased | | $ | 1,209,947,702 | |
Average notional value of swaption contracts written | | $ | 342,605,000 | |
Credit default swaps: | | | | |
Average number of contracts - buy protection | | | 65 | |
Average number of contracts - sell protection | | | 62 | |
Average notional value - buy protection | | $ | 506,624,672 | |
Average notional value - sell protection | | $ | 381,909,117 | |
Interest rate swaps: | | | | |
Average number of contracts - pays fixed rate | | | 4 | |
Average number of contracts - receives fixed rate | | | 4 | |
Average notional value - pays fixed rate | | $ | 90,991,000 | |
Average notional value - receives fixed rate | | $ | 375,100,000 | |
Total return swaps: | | | | |
Average number of contracts | | | 7 | |
Average notional value | | $ | 38,730,067 | |
| |
3. Investment Advisory Agreement and Other Transactions with Affiliates:
The PNC Financial Services Group, Inc. (“PNC”) is the largest stockholder and an affiliate, for 1940 Act purposes, of BlackRock, Inc. (“BlackRock”).
The Master LLC, on behalf of the Master Portfolio, entered into an Investment Advisory Agreement with BlackRock Advisors, LLC (the “Manager”), the Master LLC’s investment advisor, an indirect, wholly owned subsidiary of BlackRock, to provide investment advisory and administration services. The Manager is responsible for the management of the Master Portfolio’s portfolio and provides the necessary personnel, facilities, equipment and certain other services necessary to the operations of the Master Portfolio. For such services, the Master Portfolio pays the Manager a monthly fee based on the percentage of the Master Portfolio’s average daily net assets at the following annual rates:
| | | | |
| |
| Average Daily Net Assets | | Investment
Advisory Fee | |
| |
First $250 Million | | | 0.20% | |
$250 Million - $500 Million | | | 0.15% | |
$500 Million - $750 Million | | | 0.10% | |
Greater than $750 Million | | | 0.05% | |
| |
The Manager voluntarily agreed to waive its investment advisory fees by the amount of investment advisory fees the Master Portfolio pays to the Manager indirectly through its investment in affiliated money market funds. However the Manager does not waive its investment advisory fees by the amount of investment advisory fees paid in connection with the
| | | | | | |
| | | | | | | |
| | BLACKROCK BALANCED CAPITAL FUND, INC. | | MARCH 31, 2013 | | 69 |
| | |
| Notes to Consolidated Financial Statements (continued) | | Master Total Return Portfolio |
Master Portfolio’s investment in other affiliated investment companies, if any. This amount is shown as fees waived by Manager in the Consolidated Statement of Operations.
The Manager provides investment management and other services to the Subsidiary. The Manager does not receive separate compensation from the Subsidiary for providing investment management or administrative services. However, the Master Portfolio pays the Manager based on the Master Portfolio’s net assets which includes the assets of the Subsidiary.
The Manager entered into sub-advisory agreements with BlackRock Financial Management, Inc. (“BFM”), BlackRock International Limited (“BIL”) and BlackRock (Singapore) Limited (“BRS”), each an affiliate of the Manager. The Manager pays BFM, BIL and BRS for services they provide, a monthly fee that is a percentage of the investment advisory fees paid by the Master Portfolio to the Manager.
For the six months ended March 31, 2013, the Master LLC reimbursed the Manager $5,729 for certain accounting services, which is included in accounting services in the Consolidated Statement of Operations.
Certain officers and/or directors of the Master LLC are officers and/or directors of BlackRock or its affiliates. The Master Portfolio reimburses the Manager for compensation paid to the Master LLC’s Chief Compliance Officer.
4. Investments:
Purchases and sales of investments, including paydowns, mortgage dollar roll and TBA transactions and excluding short-term securities and US government securities for the six months ended March 31, 2013, were $22,967,064,527 and $24,528,229,756, respectively.
Purchases and sales of US government securities, for the six months ended March 31, 2013, were $1,625,472,234 and $1,371,938,739, respectively.
For the six months ended March 31, 2013, purchases and sales of mortgage dollar rolls were $7,932,310,442 and $7,931,742,756, respectively.
Transactions in options written for the six months ended March 31, 2013, were as follows:
| | | | | | | | | | | | | | | | | | | | | | | | | | |
| |
| | | Calls | | | | | Puts | |
| |
| | | Contracts | | | Notional1
(000) | | | Premiums
Received | | | | | Contracts | | | Notional1
(000) | | | Premiums
Received | |
| | | | | | | |
Outstanding options, beginning of period | | | 2,235 | | | | 257,850,000 | | | $ | 4,387,271 | | | | | | – | | | | 403,130,135 | | | $ | 6,265,484 | |
Options written | | | 21,494 | | | | 1,043,460,000 | | | | 20,947,864 | | | | | | 5,112 | | | | 1,252,082,757 | | | | 19,016,386 | |
Options exercised | | | – | | | | (158,840,000 | ) | | | (506,754) | | | | | | – | | | | (3,578,716 | ) | | | (40,798 | ) |
Options expired | | | (4,451) | | | | (146,065,000 | ) | | | (220,908) | | | | | | (375) | | | | (934,620,135 | ) | | | (2,741,718 | ) |
Options closed | | | (18,720) | | | | (321,490,000 | ) | | | (6,336,523) | | | | | | (2,760) | | | | (517,624,041 | ) | | | (20,723,868 | ) |
| | | | | | | | | | |
Outstanding options, end of period | | | 558 | | | | 674,915,000 | | | $ | 18,270,950 | | | | | | 1,977 | | | | 199,390,000 | | | $ | 1,775,486 | |
| | | | | | | | | | |
| | 1 | Amount shown is in the currency in which the transaction was denominated. |
5. Borrowings:
The Master LLC, on behalf of the Master Portfolio, along with certain other funds managed by the Manager and its affiliates, is a party to a $500 million credit agreement with a group of lenders. The Master Portfolio may borrow under the credit agreement to fund shareholder redemptions. Effective November 2011 to November 2012, the credit agreement had the following terms: a commitment fee of 0.065% per annum based on the Funds’ pro rata share of the unused portion of the credit agreement and interest at a rate equal to the higher of (a) the one-month LIBOR plus 0.80% per annum or (b) the Fed Funds rate plus 0.80% per annum on amounts borrowed. In addition, the Master Portfolio paid administration and arrangement fees which were allocated to the Master Portfolio based on its net assets as of October 31, 2011. The credit agreement, which expired in November 2012, was renewed with the same terms until November 2013. Effective November 2012 to November 2013, the credit agreement has the following terms: a commitment fee of 0.065% per annum based on the Fund’s pro rata share of the unused portion of the credit agreement and interest at a rate equal to the higher of (a) the one-month LIBOR plus 0.80% per annum or (b) the Fed Funds rate plus 0.80% per annum on amounts borrowed.
In addition, the Master Portfolio paid administration and arrangement fees which were allocated to the Master Portfolio based on its net assets as of October 31, 2012. The Master Portfolio did not borrow under the credit agreement during the six months ended March 31, 2013.
For the six months ended March 31, 2013, the average amount of transactions considered as borrowings and the daily weighted average interest rate from reverse repurchase agreements and treasury roll transactions were $1,226,309,695 and 0.21%, respectively.
6. Concentration, Market and Credit Risk:
In the normal course of business, the Master Portfolio invests in securities and enters into transactions where risks exist due to fluctuations in the market (market risk) or failure of the issuer of a security to meet all its obligations (issuer credit risk). The value of securities held by the Master Portfolio may decline in response to certain events, including those directly involving the issuers whose securities are owned by the Master Portfolio; conditions affecting the general economy; overall market changes; local, regional or global political, social or economic instability; and currency and interest rate and price fluctuations. Similar to
| | | | | | |
| | | | | | | |
| 70 | | BLACKROCK BALANCED CAPITAL FUND, INC. | | MARCH 31, 2013 | | |
| | |
| Notes to Consolidated Financial Statements (concluded) | | Master Total Return Portfolio |
issuer credit risk, the Master Portfolio may be exposed to counterparty credit risk, or the risk that an entity with which the Master Portfolio has unsettled or open transactions may fail to or be unable to perform on its commitments. The Master Portfolio manages counterparty credit risk by entering into transactions only with counterparties that it believes have the financial resources to honor their obligations and by monitoring the financial stability of those counterparties. Financial assets, which potentially expose the Master Portfolio to market, issuer and counterparty credit risks, consist principally of financial instruments and receivables due from counterparties. The extent of the Master Portfolio’s exposure to market, issuer and counterparty credit risks with respect to these financial assets is generally approximated by their value recorded in the Consolidated Statement of Assets and Liabilities, less any collateral held by the Master Portfolio.
The Master Portfolio invests a significant portion of its assets in securities backed by commercial or residential mortgage loans or in issuers that hold mortgage and other asset-backed securities. Please see the Consolidated Schedule of Investments for these securities. Changes in economic conditions, including delinquencies and/or defaults on assets
underlying these securities, can affect the value, income and/or liquidity of such positions.
7. Subsequent Events:
Management’s evaluation of the impact of all subsequent events on the Master Portfolio’s financial statements was completed through the date the financial statements were issued and the following items were noted:
Effective April 25, 2013, the credit agreement was terminated and a new agreement was entered into. The Master Portfolio became a party to a 364-day, $800 million credit agreement, which expires in April 2014. Excluding commitments designated for a certain individual fund, the Master Portfolio can borrow up to an aggregate commitment amount of $500 million, subject to asset coverage and other limitations as specified in the agreement. The credit agreement has the following terms: a fee of 0.065% per annum on unused commitment amounts and interest at a rate equal to the higher of (a) the one-month LIBOR plus 0.80% per annum or (b) the Fed Funds rate plus 0.80% per annum on amounts borrowed.
| | | | | | |
| | | | | | | |
| | BLACKROCK BALANCED CAPITAL FUND, INC. | | MARCH 31, 2013 | | 71 |
Officers and Directors of the Fund and Master Bond LLC
|
Robert M. Hernandez, Chairman of the Board and Director Fred G. Weiss, Vice Chairman of the Board and Director Paul L. Audet, Director James H. Bodurtha, Director Bruce R. Bond, Director Donald W. Burton, Director Honorable Stuart E. Eizenstat, Director Laurence D. Fink, Director Kenneth A. Froot, Director Henry Gabbay, Director John F. O’Brien, Director Roberta Cooper Ramo, Director David H. Walsh, Director John M. Perlowski, President and Chief Executive Officer Brendan Kyne, Vice President Neal Andrews, Chief Financial Officer Jay Fife, Treasurer Brian Kindelan, Chief Compliance Officer and Anti-Money Laundering Officer Benjamin Archibald, Secretary |
Investment Advisor
BlackRock Advisors, LLC
Wilmington, DE 19809
Sub-Advisors
BlackRock Investments Management, LLC
Princeton, NJ 08540
Custodian and Accounting Agent
Bank of New York Mellon
New York, NY 10286
Transfer Agent
BNY Mellon Investment Servicing (US) Inc.
Wilmington, DE 19809
Distributor
BlackRock Investments, LLC
New York, NY 10022
Independent Registered Public Accounting Firm
Deloitte & Touche LLP
Philadelphia, PA 19103
Legal Counsel
Willkie Farr & Gallagher LLP
New York, NY 10019
Address of the Fund
100 Bellevue Parkway
Wilmington, DE 19809
| | | | | | |
| | | | | | | |
| 72 | | BLACKROCK BALANCED CAPITAL FUND, INC. | | MARCH 31, 2013 | | |
Additional Information
Electronic Delivery
Electronic copies of most financial reports and prospectuses are available on the Fund’s website or shareholders can sign up for e-mail notifications of quarterly statements, annual and semi-annual reports and prospectuses by enrolling in the Fund’s electronic delivery program.
To enroll:
Shareholders Who Hold Accounts with Investment Advisors, Banks or Brokerages:
Please contact your financial advisor. Please note that not all investment advisors, banks or brokerages may offer this service.
Shareholders Who Hold Accounts Directly With BlackRock:
| 1) | Access the BlackRock website at http://www.blackrock.com/edelivery |
| 2) | Select “eDelivery” under the “More Information” section |
Householding
The Fund will mail only one copy of shareholder documents, including prospectuses, annual and semi-annual reports and proxy statements, to shareholders with multiple accounts at the same address. This practice is commonly called “householding” and is intended to reduce expenses and eliminate duplicate mailings of shareholder documents. Mailings of your shareholder documents may be householded indefinitely unless you instruct us otherwise. If you do not want the mailing of these documents to be combined with those for other members of your household, please contact the Fund at (800) 441-7762.
Availability of Quarterly Schedule of Investments
The Fund files its complete schedule of portfolio holdings with the SEC for the first and third quarters of each fiscal year on Form N-Q. The Fund’s Forms N-Q are available on the SEC’s website at http:// www.sec.gov and may also be reviewed and copied at the SEC’s Public Reference Room in Washington, D.C. Information on how to access documents on the SEC’s website without charge may be obtained by calling (800) SEC-0330. The Fund’s Forms N-Q may also be obtained upon request and without charge by calling (800) 441-7762.
Availability of Proxy Voting Policies and Procedures
A description of the policies and procedures that the Fund uses to determine how to vote proxies relating to portfolio securities is available (1) without charge, upon request, by calling (800) 441-7762; (2) at http://www.blackrock.com; and (3) on the SEC’s website at http:// www.sec.gov.
Availability of Proxy Voting Record
Information about how the Fund voted proxies relating to securities held in the Fund’s portfolios during the most recent 12-month period ended June 30 is available, upon request and without charge (1) at http:// www.blackrock.com or by calling (800) 441-7762 and (2) on the SEC’s website at http://www.sec.gov.
Account Information
Call us at (800) 441-7762 from 8:00 AM to 6:00 PM EST on any business day to get information about your account balances, recent transactions and share prices. You can also reach us on the Web at http:// www.blackrock.com/funds.
Automatic Investment Plans
Investor Class shareholders who want to invest regularly can arrange to have $50 or more automatically deducted from their checking or savings account and invested in any of the BlackRock funds.
Systematic Withdrawal Plan
Investor Class shareholders can establish a systematic withdrawal plan and receive periodic payments of $50 or more from their BlackRock portfolios, as long as their account balance is at least $10,000.
Retirement Plans
Shareholders may make investments in conjunction with Traditional, Rollover, Roth, Coverdell, Simple IRAs, SEP IRAs and 403(b) Plans.
| | | | | | |
| | | | | | | |
| | BLACKROCK BALANCED CAPITAL FUND, INC. | | MARCH 31, 2013 | | 73 |
Additional Information (concluded)
|
|
BlackRock Privacy Principles |
|
BlackRock is committed to maintaining the privacy of its current and former fund investors and individual clients (collectively, “Clients”) and to safeguarding their non-public personal information. The following information is provided to help you understand what personal information BlackRock collects, how we protect that information and why in certain cases we share such information with select parties.
If you are located in a jurisdiction where specific laws, rules or regulations require BlackRock to provide you with additional or different privacy-related rights beyond what is set forth below, then BlackRock will comply with those specific laws, rules or regulations.
BlackRock obtains or verifies personal non-public information from and about you from different sources, including the following: (i) information we receive from you or, if applicable, your financial intermediary, on applications, forms or other documents; (ii) information about your transactions with us, our affiliates, or others; (iii) information we receive from a consumer reporting agency; and (iv) from visits to our websites.
BlackRock does not sell or disclose to non-affiliated third parties any non-public personal information about its Clients, except as permitted by law or as is necessary to respond to regulatory requests or to service Client accounts. These non-affiliated third parties are required to protect the confidentiality and security of this information and to use it only for its intended purpose.
We may share information with our affiliates to service your account or to provide you with information about other BlackRock products or services that may be of interest to you. In addition, BlackRock restricts access to non-public personal information about its Clients to those BlackRock employees with a legitimate business need for the information. BlackRock maintains physical, electronic and procedural safeguards that are designed to protect the non-public personal information of its Clients, including procedures relating to the proper storage and disposal of such information.
| | | | | | |
| | | | | | | |
| 74 | | BLACKROCK BALANCED CAPITAL FUND, INC. | | MARCH 31, 2013 | | |
A World-Class Mutual Fund Family
BlackRock offers a diverse lineup of open-end mutual funds crossing all investment styles and managed by experts in equity, fixed income and tax-exempt investing.
| | | | | | | | |
|
Equity Funds | | |
|
BlackRock ACWI ex-US Index Fund BlackRock All-Cap Energy & Resources Portfolio BlackRock Basic Value Fund BlackRock Capital Appreciation Fund BlackRock China Fund BlackRock Commodity Strategies Fund BlackRock Disciplined Small Cap Core Fund BlackRock Emerging Markets Fund BlackRock Emerging Markets Long/Short Equity Fund BlackRock Energy & Resources Portfolio BlackRock Equity Dividend Fund BlackRock EuroFund BlackRock Flexible Equity Fund BlackRock Focus Growth Fund | | BlackRock Global Dividend Income Portfolio BlackRock Global Long/Short Equity Fund BlackRock Global Opportunities Portfolio BlackRock Global SmallCap Fund BlackRock Health Sciences Opportunities Portfolio BlackRock India Fund BlackRock International Fund BlackRock International Index Fund BlackRock International Opportunities Portfolio BlackRock Large Cap Core Fund BlackRock Large Cap Core Plus Fund BlackRock Large Cap Growth Fund BlackRock Large Cap Value Fund BlackRock Latin America Fund BlackRock Long-Horizon Equity Fund | | BlackRock Mid-Cap Growth Equity Portfolio BlackRock Mid-Cap Value Opportunities Fund BlackRock Natural Resources Trust BlackRock Pacific Fund BlackRock Real Estate Securities Fund BlackRock Russell 1000 Index Fund BlackRock Science & Technology Opportunities Portfolio BlackRock Small Cap Growth Equity Portfolio BlackRock Small Cap Growth Fund II BlackRock Small Cap Index Fund BlackRock S&P 500 Stock Fund BlackRock U.S. Opportunities Portfolio BlackRock Value Opportunities Fund BlackRock World Gold Fund |
|
Taxable Fixed Income Funds | | |
|
BlackRock Bond Index Fund BlackRock Core Bond Portfolio BlackRock CoreAlpha Bond Fund BlackRock Emerging Market Local Debt Portfolio BlackRock Floating Rate Income Portfolio BlackRock Global Long/Short Credit Fund BlackRock GNMA Portfolio BlackRock High Yield Bond Portfolio | | BlackRock Inflation Protected Bond Portfolio BlackRock International Bond Portfolio BlackRock Long Duration Bond Portfolio BlackRock Low Duration Bond Portfolio BlackRock Secured Credit Portfolio BlackRock Short Obligations Fund BlackRock Short-Term Treasury Fund | | BlackRock Strategic Income Opportunities Portfolio BlackRock Total Return Fund BlackRock U.S. Government Bond Portfolio BlackRock U.S. Mortgage Portfolio BlackRock Ultra-Short Obligations Fund BlackRock World Income Fund |
|
Municipal Fixed Income Funds | | |
|
BlackRock California Municipal Bond Fund BlackRock High Yield Municipal Fund BlackRock Intermediate Municipal Fund | | BlackRock National Municipal Fund BlackRock New Jersey Municipal Bond Fund BlackRock New York Municipal Bond Fund | | BlackRock Pennsylvania Municipal Bond Fund BlackRock Short-Term Municipal Fund |
|
Mixed Asset Funds | | |
|
BlackRock Balanced Capital Fund | | LifePath Active Portfolios | | LifePath Index Portfolios |
BlackRock Emerging Market Allocation Portfolio BlackRock Global Allocation Fund BlackRock Managed Volatility Portfolio BlackRock Multi-Asset Income Portfolio BlackRock Multi-Asset Real Return Fund BlackRock Strategic Risk Allocation Fund | | 2015 2020 2025 2030 2035 | | 2040 2045 2050 2055 | | Retirement 2020 2025 2030 2035 | | 2040 2045 2050 2055 |
| | | | |
BlackRock Prepared Portfolios Conservative Prepared Portfolio Moderate Prepared Portfolio Growth Prepared Portfolio Aggressive Growth Prepared Portfolio | | LifePath Portfolios Retirement 2020 2025 2030 2035 | | 2040 2045 2050 2055 | | | | |
BlackRock mutual funds are currently distributed by BlackRock Investments, LLC. You should consider the investment objectives, risks, charges and expenses of the funds under consideration carefully before investing. Each fund’s prospectus contains this and other information and is available at www.blackrock.com or by calling (800) 441-7762 or from your financial advisor. The prospectus should be read carefully before investing.
| | | | | | |
| | | | | | | |
| | BLACKROCK BALANCED CAPITAL FUND, INC. | | MARCH 31, 2013 | | 75 |

| Item 2 – | Code of Ethics – Not Applicable to this semi-annual report |
| Item 3 – | Audit Committee Financial Expert – Not Applicable to this semi-annual report |
| Item 4 – | Principal Accountant Fees and Services – Not Applicable to this semi-annual report |
| Item 5 – | Audit Committee of Listed Registrants – Not Applicable |
(a) The registrants’ Schedules of Investments are included as part of the Report to Stockholders filed under Item 1 of this Form.
(b) Not Applicable due to no such divestments during the semi-annual period covered since the previous Form N-CSR filing.
| Item 7 – | Disclosure of Proxy Voting Policies and Procedures for Closed-End Management Investment Companies – Not Applicable |
| Item 8 – | Portfolio Managers of Closed-End Management Investment Companies – Not Applicable |
| Item 9 – | Purchases of Equity Securities by Closed-End Management Investment Company and Affiliated Purchasers – Not Applicable |
| Item 10 – | Submission of Matters to a Vote of Security Holders – There have been no material changes to these procedures. |
| Item 11 – | Controls and Procedures |
(a) – The registrants’ principal executive and principal financial officers, or persons performing similar functions, have concluded that the registrants’ disclosure controls and procedures (as defined in Rule 30a-3(c) under the Investment Company Act of 1940, as amended (the “1940 Act”)) are effective as of a date within 90 days of the filing of this report based on the evaluation of these controls and procedures required by Rule 30a-3(b) under the 1940 Act and Rule 15d-15(b) under the Securities Exchange Act of 1934, as amended.
(b) – There were no changes in the registrants’ internal control over financial reporting (as defined in Rule 30a-3(d) under the 1940 Act) that occurred during the second fiscal quarter of the period covered by this report that have materially affected, or are reasonably likely to materially affect, the registrants’ internal control over financial reporting.
| Item 12 – | Exhibits attached hereto |
(a)(1) – Code of Ethics – Not Applicable to this semi-annual report
(a)(2) – Certifications – Attached hereto
(a)(3) – Not Applicable
(b) – Certifications – Attached hereto
2
Pursuant to the requirements of the Securities Exchange Act of 1934 and the Investment Company Act of 1940, each registrant has duly caused this report to be signed on its behalf by the undersigned, thereunto duly authorized.
BlackRock Balanced Capital Fund, Inc., Master Large Cap Core Portfolio of Master Large Cap Series LLC and Master Total Return Portfolio of Master Bond LLC
| | |
| By: | | /s/ John M. Perlowski |
| | John M. Perlowski |
Chief Executive Officer (principal executive officer) of
BlackRock Balanced Capital Fund, Inc., Master Large Cap Core Portfolio of Master Large Cap Series LLC and Master Total Return Portfolio of Master Bond LLC
Date: June 3, 2013
Pursuant to the requirements of the Securities Exchange Act of 1934 and the Investment Company Act of 1940, this report has been signed below by the following persons on behalf of each registrant and in the capacities and on the dates indicated.
| | |
| By: | | /s/ John M. Perlowski |
| | John M. Perlowski |
Chief Executive Officer (principal executive officer) of
BlackRock Balanced Capital Fund, Inc., Master Large Cap Core Portfolio of Master Large Cap Series LLC and Master Total Return Portfolio of Master Bond LLC
Date: June 3, 2013
| | |
| By: | | /s/ Neal J. Andrews |
| | Neal J. Andrews |
Chief Financial Officer (principal financial officer) of
BlackRock Balanced Capital Fund, Inc., Master Large Cap Core Portfolio of Master Large Cap Series LLC and Master Total Return Portfolio of Master Bond LLC
Date: June 3, 2013
3