UNITED STATES
SECURITIES AND EXCHANGE COMMISSION
Washington, D.C. 20549
FORM N-CSR
CERTIFIED SHAREHOLDER REPORT OF REGISTERED MANAGEMENT INVESTMENT COMPANIES
Investment Company Act file number: 811-02405, 811-09739 and 811-21434
Name of Fund: BlackRock Balanced Capital Fund, Inc., Master Large Cap Core Portfolio of Master Large Cap Series LLC and Master Total Return Portfolio of Master Bond LLC
Fund Address: 100 Bellevue Parkway, Wilmington, DE 19809
Name and address of agent for service: John M. Perlowski, Chief Executive Officer, BlackRock Balanced Capital Fund, Inc., Master Large Cap Core Portfolio of Master Large Cap Series LLC and Master Total Return Portfolio of Master Bond LLC, 55 East 52nd Street, New York, NY 10055
Registrants’ telephone number, including area code: (800) 441-7762
Date of fiscal year end: 09/30/2015
Date of reporting period: 03/31/2015
Item 1 – Report to Stockholders
MARCH 31, 2015
| | | | |
SEMI-ANNUAL REPORT (UNAUDITED) | | | | BLACKROCK® |
BlackRock Balanced Capital Fund, Inc.
| | |
| Not FDIC Insured ¡ May Lose Value ¡ No Bank Guarantee | | |
| | | | | | |
| | | 
| | Shareholders can sign up for e-mail notifications of quarterly statements, annual and semi-annual shareholder reports and prospectuses by enrolling in the electronic delivery program. Electronic copies of shareholder reports and prospectuses are also available on BlackRock’s website. TO ENROLL IN ELECTRONIC DELIVERY: Shareholders Who Hold Accounts with Investment Advisors, Banks or Brokerages: Please contact your financial advisor. Please note that not all investment advisors, banks or brokerages may offer this service. Shareholders Who Hold Accounts Directly with BlackRock: 1. Access the BlackRock website at blackrock.com 2. Select “Access Your Account” 3. Next, select “eDelivery” in the “Related Resources” box and follow the sign-up instructions | | |
| | | | | | |
| 2 | | BLACKROCK BALANCED CAPITAL FUND, INC. | | MARCH 31, 2015 | | |
Dear Shareholder,
Market volatility has remained low from a long-term perspective, but increased over the course of 2014 amid higher valuations in risk assets (such as equities and high yield bonds), geopolitical risks, uneven global economic growth and uncertainty around policy moves from the world’s largest central banks. As the U.S. Federal Reserve (the “Fed”) gradually reduced its bond buying program (which ultimately ended in October 2014), U.S. interest rates surprisingly trended lower and stock prices forged ahead despite high valuations on the back of a multi-year bull market. Geopolitical tensions intensified in Ukraine and the Middle East and oil prices became highly volatile in the middle of the summer, stoking worries about economic growth outside the United States. As the U.S. economy continued to show steady improvement, the stronger data caused concern among investors that the Fed would raise short-term rates sooner than previously anticipated. The U.S. dollar appreciated and global credit markets tightened, ultimately putting a strain on investor flows, and financial markets broadly weakened in the third quarter.
U.S. economic growth picked up considerably in the fourth quarter while the broader global economy showed signs of slowing. U.S. markets significantly outperformed international markets even as the European Central Bank (“ECB”) and the Bank of Japan eased monetary policy, which drove further strengthening in the U.S. dollar. Oil prices plummeted in the fourth quarter due to a global supply-and-demand imbalance, sparking a selloff in energy-related assets and stress in emerging markets. Fixed income investors piled into U.S. Treasuries as their persistently low yields became relatively attractive as compared to international sovereign debt.
Equity markets reversed in the first quarter of 2015 and U.S. stocks underperformed international markets, notably Europe and Japan, but also emerging markets. Investors had held high expectations for the U.S. economy, but after a harsh winter, first-quarter data disappointed and high valuations took their toll on U.S. stocks. Meanwhile, economic reports in Europe and Asia easily beat investors’ very low expectations for those economies, and accommodative policies from global central banks helped international equities rebound. The ECB’s asset purchase program (announced in January and commenced in March) was the largest in scale and effect on the markets. Overall, market volatility decreased in the first quarter as global risks abated, with a ceasefire in Ukraine and an improving outlook for Greece’s continued membership in the Eurozone.
At BlackRock, we believe investors need to think globally, extend their scope across a broad array of asset classes and be prepared to move freely as market conditions change over time. We encourage you to talk with your financial advisor and visit blackrock.com for further insight about investing in today’s markets.
Sincerely,

Rob Kapito
President, BlackRock Advisors, LLC

Rob Kapito
President, BlackRock Advisors, LLC
| | | | | | | | |
| Total Returns as of March 31, 2015 | |
| | | 6-month | | | 12-month | |
U.S. large cap equities
(S&P 500® Index) | | | 5.93 | % | | | 12.73 | % |
U.S. small cap equities
(Russell 2000® Index) | | | 14.46 | | | | 8.21 | |
International equities
(MSCI Europe, Australasia, Far East Index) | | | 1.13 | | | | (0.92 | ) |
Emerging market equities
(MSCI Emerging Markets Index) | | | (2.37 | ) | | | 0.44 | |
3-month Treasury bills
(BofA Merrill Lynch
3-Month U.S. Treasury Bill Index) | | | 0.01 | | | | 0.03 | |
U.S. Treasury securities
(BofA Merrill Lynch
10-Year U.S. Treasury Index) | | | 6.25 | | | | 9.88 | |
U.S. investment-grade
bonds (Barclays U.S.
Aggregate Bond Index) | | | 3.43 | | | | 5.72 | |
Tax-exempt municipal
bonds (S&P Municipal
Bond Index) | | | 2.29 | | | | 6.60 | |
U.S. high yield bonds
(Barclays U.S. Corporate
High Yield 2% Issuer
Capped Index) | | | 1.50 | | | | 2.00 | |
|
| Past performance is no guarantee of future results. Index performance is shown for illustrative purposes only. You cannot invest directly in an index. | |
| | | | | | |
| | | THIS PAGE NOT PART OF YOUR FUND REPORT | | | | 3 |
| | |
| Fund Summary as of March 31, 2015 | | |
BlackRock Balanced Capital Fund, Inc.’s (the “Fund”) investment objective is to seek the highest total investment return through a fully managed investment policy utilizing equity, debt (including money market) and convertible securities.
|
| Portfolio Management Commentary |
How did the Fund perform?
| • | | For the six-month period ended March 31, 2015, through its investments in Master Large Cap Core Portfolio of Master Large Cap Series LLC (the “equity allocation” or the “Master Large Cap Core Portfolio”) and Master Total Return Portfolio of Master Bond LLC (the “fixed income allocation” or the “Master Total Return Portfolio”) (collectively, the “Master Portfolios”), each of the Fund’s share classes underperformed the blended reference benchmark (60% Russell 1000® Index/40% Barclays U.S. Aggregate Bond Index) with the exception of the Fund’s Institutional Shares, which performed in line with the benchmark. For the same period, the Fund outperformed the fixed income portion of the benchmark, the Barclays U.S. Aggregate Bond Index, and underperformed the equity portion of the benchmark, the Russell 1000® Index. |
What factors influenced performance?
| • | | From an asset allocation perspective, the Fund benefited from its overweight position in equities relative to the blended reference benchmark as equities outperformed fixed income over the six-month period. |
| • | | Within these allocations, relative to the Russell 1000® Index, the primary detractor from performance in the Master Large Cap Core Portfolio was the information technology (“IT”) sector, largely owing to a tilt toward enterprise hardware and PC-focused semiconductor companies. Financials were a second source of underperformance, as the most interest-rate-sensitive bank holdings lagged amid a further decline in long-term U.S. Treasury rates. Elsewhere in the sector, an underweight stance in real estate investment trusts (“REITs”) detracted, as the industry benefited from declining interest rates. Weakness in the energy sector over the period impacted performance as well, notably through exposure to energy services companies. Conversely, the equity allocation benefited from strong selection in the health care sector, especially in managed-care companies. Strong earnings from several bellwether stocks boosted sentiment across the group, with better-than-feared preliminary Medicare Advantage payment rates from the Centers for Medicare & Medicaid Services providing an additional lift. Market speculation about further consolidation in the industry boosted returns as well. |
| • | | The Master Total Return Portfolio’s most significant contributions to performance relative to the Barclays U.S. Aggregate Bond Index were its macro-related hedging strategies, led by long U.S. dollar exposure. There was also a positive contribution from tactical high-yield exposure as spreads narrowed in the first quarter of 2015. Also, within the fixed income allocation, exposure to structured products and investment grade corporate credit added to performance. The main detractor from performance in the fixed income allocation was from overall portfolio |
| | | duration (a measure of sensitivity to changes in market interest rate levels) and yield curve positioning. |
Describe recent portfolio activity.
| • | | Within the equity allocation, due to a combination of portfolio trading activity and market movement during the six-month period, the weighting in the health care sector increased, specifically within the health care providers & services industry. The allocation to consumer staples increased as well, mainly within food & staples retailing. The weighting in the energy sector decreased, both in oil, gas & consumable fuels and energy equipment & services. Exposure to financials also declined, largely with respect to banks and insurance. |
| • | | In the fixed income allocation, the allocation to high yield was tactically increased through the use of index exposure given an improvement in valuations, while exposure to investment grade corporates was reduced on their relative lack of value and low yields. Exposure was added to securitized assets as a source of income with relatively low credit risk. More recently, U.S. dollar exposure was scaled back with the intention of re-entering at more favorable levels. |
Describe portfolio positioning at period end.
| • | | At period end, the Fund was modestly overweight in equities and underweight in fixed income relative to the blended reference benchmark, given a generally constructive view on the broader economic recovery and a cautious view on fixed income overall and the direction of interest rates. |
| • | | In equities, the Master Large Cap Core Portfolio held its largest sector overweight positions relative to the Russell 1000® Index in IT and health care, while consumer staples and utilities, telecommunication services and consumer staples were the most notable underweights. |
| • | | Relative to the Barclays U.S. Aggregate Bond Index, the Master Total Return Portfolio remained generally underweight in government-related sectors in favor of non-government spread sectors. Within spread sectors, the fixed income allocation was most significantly overweight in commercial mortgage-backed securities and asset-backed securities, while maintaining an underweight in investment grade corporate credit. The Master Total Return Portfolio also held non-benchmark allocations to non-agency residential MBS, high yield bonds, non-U.S. sovereign bonds and U.S. Treasury inflation-protected securities. The fixed income allocation ended the period with a slight underweight in duration relative to that of the Barclays U.S. Aggregate Bond Index. |
The views expressed reflect the opinions of BlackRock as of the date of this report and are subject to change based on changes in market, economic or other conditions. These views are not intended to be a forecast of future events and are no guarantee of future results.
| | | | | | |
4 | | BLACKROCK BALANCED CAPITAL FUND, INC. | | MARCH 31, 2015 | | |
|
| Total Return Based on a $10,000 Investment |
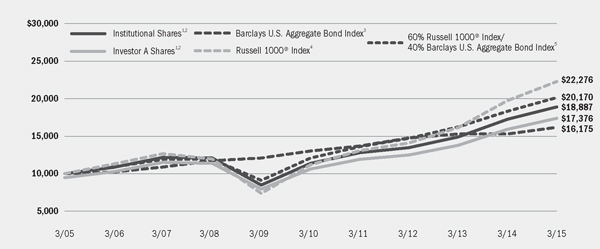
| | 1 | Assuming maximum sales charges, if any, transaction costs and other operating expenses, including investment advisory and administration fees. Institutional Shares do not have a sales charge. |
| | 2 | The Fund invests in equity securities (including common stock, preferred stock, securities convertible into common stock, or securities or other instruments whose price is linked to the value of common stock) and fixed-income securities (including debt securities, convertible securities and short term securities). |
| | 3 | A widely recognized unmanaged market-weighted index, comprised of investment-grade corporate bonds rated BBB or better, mortgages and U.S. Treasury and U.S. Government agency issues with at least one year to maturity. |
| | 4 | An index that measures the performance of the large cap segment of the U.S. equity universe. It is a subset of the Russell 3000® Index and includes approximately 1,000 of the largest securities based on a combination of their market capitalization and current index membership. The index represents approximately 92% of the total market capitalization of the Russell 3000® Index. |
| | 5 | A customized weighted index comprised of the returns of the Russell 1000® Index (60%) and Barclays U.S. Aggregate Bond Index (40%). |
| | | | | | | | | | | | | | | | | | | | | | | | | | | | |
| Performance Summary for the Period Ended March 31, 2015 | |
| | | | | | Average Annual Total Returns6 | |
| | | | | | 1 Year | | | 5 Years | | | 10 Years | |
| | | 6-Month
Total Returns | | | w/o sales
charge | | | w/ sales
charge | | | w/o sales
charge | | | w/ sales
charge | | | w/o sales
charge | | | w/ sales
charge | |
Institutional | | | 5.39 | % | | | 9.35 | % | | | N/A | | | | 10.67 | % | | | N/A | | | | 6.57 | % | | | N/A | |
Investor A | | | 5.24 | | | | 9.05 | | | | 3.33 | % | | | 10.32 | | | | 9.14 | % | | | 6.25 | | | | 5.68 | % |
Investor B | | | 4.64 | | | | 7.94 | | | | 3.64 | | | | 9.22 | | | | 8.94 | | | | 5.49 | | | | 5.49 | |
Investor C | | | 4.85 | | | | 8.21 | | | | 7.27 | | | | 9.46 | | | | 9.46 | | | | 5.42 | | | | 5.42 | |
Class R | | | 5.03 | | | | 8.64 | | | | N/A | | | | 9.90 | | | | N/A | | | | 5.86 | | | | N/A | |
60% Russell 1000® Index/40% Barclays U.S. Aggregate Bond Index | | | 5.39 | | | | 10.00 | | | | N/A | | | | 10.76 | | | | N/A | | | | 7.27 | | | | N/A | |
Barclays U.S. Aggregate Bond Index | | | 3.43 | | | | 5.72 | | | | N/A | | | | 4.41 | | | | N/A | | | | 4.93 | | | | N/A | |
Russell 1000® Index | | | 6.55 | | | | 12.73 | | | | N/A | | | | 14.73 | | | | N/A | | | | 8.34 | | | | N/A | |
| | 6 | | Assuming maximum sales charges, if any. Average annual total returns with and without sales charges reflect reductions for distribution and service fees. See “About Fund Performance” on page 6 for a detailed description of share classes, including any related sales charges and fees. |
| | | | N/A—Not applicable as share class and index do not have a sales charge. |
| | | | Past performance is not indicative of future results. |
| | | | | | | | | | | | | | |
| Expense Example |
| | | Actual | | Hypothetical8 | | |
| | | Beginning Account Value
October 1, 2014 | | Ending Account Value
March 31, 2015 | | Expenses Paid
During the Period7 | | Beginning Account Value
October 1, 2014 | | Ending Account Value
March 31, 2015 | | Expenses Paid
During the Period7 | | Annualized Expense Ratio |
Institutional | | $1,000.00 | | $1,053.90 | | $2.92 | | $1,000.00 | | $1,022.09 | | $2.87 | | 0.57% |
Investor A | | $1,000.00 | | $1,052.40 | | $4.40 | | $1,000.00 | | $1,020.64 | | $4.33 | | 0.86% |
Investor B | | $1,000.00 | | $1,046.40 | | $10.20 | | $1,000.00 | | $1,014.96 | | $10.05 | | 2.00% |
Investor C | | $1,000.00 | | $1,048.50 | | $8.27 | | $1,000.00 | | $1,016.85 | | $8.15 | | 1.62% |
Class R | | $1,000.00 | | $1,050.30 | | $6.24 | | $1,000.00 | | $1,018.85 | | $6.14 | | 1.22% |
| | 7 | | For each class of the Fund, expenses are equal to the annualized expense ratio for the class, multiplied by the average account value over the period, multiplied by 182/365 (to reflect the one-half year period shown). Because the Fund invests significantly in the Master Portfolios, the expense table example reflects the net expenses of both the Fund and the Master Portfolios in which it invests. |
| | 8 | | Hypothetical 5% annual return before expenses is calculated by pro rating the number of days in the most recent fiscal half year divided by 365. |
| | | | See “Disclosure of Expenses” on page 6 for further information on how expenses were calculated. |
| | | | | | |
| | | BLACKROCK BALANCED CAPITAL FUND, INC. | | MARCH 31, 2015 | | 5 |
| • | | Institutional Shares are not subject to any sales charge. These shares bear no ongoing distribution or service fees and are available only to eligible investors. |
| • | | Investor A Shares incur a maximum initial sales charge (front-end load) of 5.25% and a service fee of 0.25% per year (but no distribution fee). Certain redemptions of these shares may be subject to a contingent deferred sales charge (“CDSC”) where no initial sales charge was paid at the time of purchase. |
| • | | Investor B Shares are subject to a maximum CDSC of 4.50% declining to 0% after six years. In addition, Investor B Shares are subject to a distribution fee of 0.75% per year and a service fee of 0.25% per year. Investor B Shares automatically convert to Investor A Shares after approximately eight years. (There is no initial sales charge for automatic share conversions.) All returns for periods greater than eight years reflect this conversion. Investor B Shares of the Fund are only available through exchanges and distribution reinvestments by existing shareholders and for purchase by certain employer-sponsored retirement plans. |
| • | | Investor C Shares are subject to a distribution fee of 0.75% per year and a service fee of 0.25% per year. In addition, these shares are subject to a 1.00% CDSC if redeemed within one year of purchase. |
| • | | Class R Shares do not incur a maximum initial sales charge (front-end load) or CDSC. These shares are subject to a distribution fee of 0.25% per year and a service fee of 0.25% per year. These shares are available only to certain employer-sponsored retirement plans. |
Performance information reflects past performance and does not guarantee future results. The performance information for periods prior to February 2009 does not reflect any investment by the Fund in the Master Large Cap Core Portfolio. Current performance may be lower or higher than the performance data quoted. Refer to www.blackrock.com/funds to obtain performance data current to the most recent month end. Performance results do not reflect the deduction of taxes that a shareholder would pay on Fund distributions or the redemption of Fund shares. Figures shown in the performance table on the previous page assume reinvestment of all distributions, if any, at net asset value (“NAV”) on the ex-dividend dates. Investment return and principal value of shares will fluctuate so that shares, when redeemed, may be worth more or less than their original cost. Distributions paid to each class of shares will vary because of the different levels of service, distribution and transfer agency fees applicable to each class, which are deducted from the income available to be paid to shareholders.
BlackRock Advisors, LLC (the “Manager”), the Fund’s investment advisor, waived and/or reimbursed a portion of the Fund’s expenses. Without such waiver and/or reimbursement, the Fund’s performance would have been lower. The Manager is under no obligation to waive or reimburse or to continue waiving or reimbursing its fees after the applicable termination date. See Note 3 of the Notes to Financial Statements for additional information on waivers and reimbursements.
Shareholders of the Fund may incur the following charges: (a) transactional expenses, such as sales charges; and (b) operating expenses, including investment advisory fees, service and distribution fees, including 12b-1 fees, acquired fund fees and expenses and other Fund expenses. The expense example on the previous page (which is based on a hypothetical investment of $1,000 invested on October 1, 2014 and held through March 31, 2015) is intended to assist shareholders both in calculating expenses based on an investment in the Fund and in comparing these expenses with similar costs of investing in other mutual funds.
The expense example provides information about actual account values and actual expenses. In order to estimate the expenses a shareholder paid during the period covered by this report, shareholders can divide their account value by $1,000 and then multiply the result by the number corresponding to their share class under the heading entitled “Expenses Paid During the Period.”
The expense example also provides information about hypothetical account values and hypothetical expenses based on the Fund’s actual expense ratio and an assumed rate of return of 5% per year before expenses. In order to assist shareholders in comparing the ongoing expenses of investing in the Fund and other funds, compare the 5% hypothetical examples with the 5% hypothetical examples that appear in shareholder reports of other funds.
The expenses shown in the expense example are intended to highlight shareholders’ ongoing costs only and do not reflect any transactional expenses, such as sales charges, if any. Therefore, the hypothetical example is useful in comparing ongoing expenses only, and will not help shareholders determine the relative total expenses of owning different funds. If these transactional expenses were included, shareholder expenses would have been higher.
| | | | | | |
| 6 | | BLACKROCK BALANCED CAPITAL FUND, INC. | | MARCH 31, 2015 | | |
| | |
| The Benefits and Risks of Leveraging | | |
The Master Portfolio may utilize leverage to seek to enhance its yield and NAV. However, these objectives cannot be achieved in all interest rate environments.
The Master Portfolio may utilize leverage by entering into reverse repurchase agreements and/or treasury roll transactions. In general, the concept of leveraging is based on the premise that the financing cost of leverage, which is based on short-term interest rates, is normally lower than the income earned by the Master Portfolio on its longer-term portfolio investments purchased with the proceeds from leverage. To the extent that the total assets of the Master Portfolio (including the assets obtained from leverage) are invested in higher-yielding portfolio investments, the Master Portfolio’s investors benefit from the incremental net income.
The interest earned on securities purchased with the proceeds from leverage is distributed to shareholders, and the value of these portfolio holdings is reflected in the Master Portfolio’s per share NAV. However, in order to benefit shareholders, the return on assets purchased with leverage proceeds must exceed the ongoing costs associated with the leverage. If interest and other ongoing costs of leverage exceed the Master Portfolio’s return on assets purchased with leverage proceeds, income to shareholders is lower than if the Master Portfolio had not used leverage.
Furthermore, the value of the Master Portfolio’s investments generally varies inversely with the direction of long-term interest rates, although other factors can influence the value of portfolio investments. As a result, changes in interest rates can influence the Master Portfolio’s NAV positively or negatively in addition to the impact on the Master Portfolio’s performance from leverage. Changes in the direction of interest rates are difficult to predict accurately, and there is no assurance that the Master Portfolio’s leveraging strategy will be successful.
The use of leverage also generally causes greater changes in the Master Portfolio’s NAV and distribution rates than a comparable fund that does not use leverage. In a declining market, leverage is likely to cause a greater decline in the NAV of the Master Portfolio’s shares than if the Master Portfolio were not leveraged. In addition, the Master Portfolio may be required to sell portfolio securities at inopportune times or at distressed values in order to comply with regulatory requirements applicable to the use of leverage or as required by the terms of leverage instruments, which may cause the Master Portfolio to incur losses. The use of leverage may limit the Master Portfolio’s ability to invest in certain types of securities or use certain types of hedging strategies. The Master Portfolio incurs expenses in connection with the use of leverage, all of which are borne by Master Portfolio investors and may reduce income.
|
| Derivative Financial Instruments |
The Master Portfolio may invest in various derivative financial instruments. Derivative financial instruments are used to obtain exposure to a security, index and/or market without owning or taking physical custody of securities or to manage market, equity, credit, interest rate, foreign currency exchange rate, commodity and/or other risks. Derivative financial instruments may give rise to a form of economic leverage. Derivative financial instruments also involve risks, including the imperfect correlation between the value of a derivative financial instrument and the underlying asset, possible default of the counterparty to the transaction or illiquidity of the derivative financial instrument. The Master Portfolio’s
ability to use a derivative financial instrument successfully depends on the investment advisor’s ability to predict pertinent market movements accurately, which cannot be assured. The use of derivative financial instruments may result in losses greater than if they had not been used, may limit the amount of appreciation the Master Portfolio can realize on an investment and/or may result in lower distributions paid to shareholders. The Master Portfolio’s investments in these instruments are discussed in detail in the Master Portfolio’s Notes to Consolidated Financial Statements.
| | | | | | |
| | | BLACKROCK BALANCED CAPITAL FUND, INC. | | MARCH 31, 2015 | | 7 |
| | | | |
| Statement of Assets and Liabilities | | | BlackRock Balanced Capital Fund, Inc. | |
| | | | |
| March 31, 2015 (Unaudited) | | | |
| | | | |
| Assets | | | | |
Investments at value — Master Large Cap Core Portfolio (cost — $470,980,965) | | $ | 597,285,996 | |
Investments at value — Master Total Return Portfolio (cost — $353,236,023) | | | 359,457,169 | |
Investments in BlackRock Liquidity Funds, TempFund, Institutional Class, 0.06% (shares — 39,561,551; cost — $39,561,551) | | | 39,561,551 | |
Capital shares sold receivable | | | 1,403,000 | |
Dividends receivable — affiliated | | | 2,269 | |
Prepaid expenses | | | 61,494 | |
| | | | |
Total assets | | | 997,771,479 | |
| | | | |
| | | | |
| Liabilities | | | | |
Capital shares redeemed payable | | | 1,106,759 | |
Service and distribution fees payable | | | 190,515 | |
Transfer agent fees payable | | | 286,583 | |
Investment advisory fees payable | | | 102,313 | |
Officer’s fees payable | | | 7,308 | |
Other accrued expenses payable | | | 32,469 | |
| | | | |
Total liabilities | | | 1,725,947 | |
| | | | |
Net Assets | | $ | 996,045,532 | |
| | | | |
| | | | |
| Net Assets Consist of | | | | |
Paid-in capital | | $ | 830,149,807 | |
Distributions in excess of net investment income | | | (3,786,217 | ) |
Accumulated net realized gain | | | 37,155,765 | |
Net unrealized appreciation/depreciation | | | 132,526,177 | |
| | | | |
Net Assets | | $ | 996,045,532 | |
| | | | |
| | | | |
| Net Asset Value | | | | |
Institutional — Based on net assets of $385,144,689 and 15,877,551 shares outstanding, 400 million shares authorized, $0.10 par value | | $ | 24.26 | |
| | | | |
Investor A — Based on net assets of $506,537,695 and 20,942,392 shares outstanding, 200 million shares authorized, $0.10 par value | | $ | 24.19 | |
| | | | |
Investor B — Based on net assets of $2,927,039 and 124,737 shares outstanding, 500 million shares authorized, $0.10 par value | | $ | 23.47 | |
| | | | |
Investor C — Based on net assets of $91,463,374 and 4,182,807 shares outstanding, 200 million shares authorized, $0.10 par value | | $ | 21.87 | |
| | | | |
Class R — Based on net assets of $9,972,735 and 437,341 shares outstanding, 500 million shares authorized, $0.10 par value | | $ | 22.80 | |
| | | | |
See Notes to Financial Statements.
| | | | | | |
| 8 | | BLACKROCK BALANCED CAPITAL FUND, INC. | | MARCH 31, 2015 | | |
| | | | |
| Statement of Operations | | | BlackRock Balanced Capital Fund, Inc. | |
| | | | |
| Six Months Ended March 31, 2015 (Unaudited) | | | |
| | | | |
| Investment Income | | | | |
Dividends — affiliated | | $ | 11,032 | |
Net investment income allocated from the Master Portfolios: | | | | |
Interest — unaffiliated | | | 4,862,204 | |
Dividends — unaffiliated | | | 5,099,190 | |
Foreign taxes withheld | | | (43,589 | ) |
Securities lending — affiliated | | | 2,709 | |
Dividends — affiliated | | | 1,666 | |
Total expenses | | | (1,719,626 | ) |
Fees waived | | | 5,754 | |
| | | | |
Total income | | | 8,219,340 | |
| | | | |
| | | | |
| Fund Expenses | | | | |
Investment advisory | | | 2,062,522 | |
Service — Investor A | | | 615,595 | |
Service and distribution — Investor B | | | 15,550 | |
Service and distribution — Investor C | | | 416,061 | |
Service and distribution — Class R | | | 23,105 | |
Transfer agent — Institutional | | | 141,881 | |
Transfer agent — Investor A | | | 287,086 | |
Transfer agent — Investor B | | | 7,916 | |
Transfer agent — Investor C | | | 52,909 | |
Transfer agent — Class R | | | 10,367 | |
Printing | | | 34,377 | |
Professional | | | 42,996 | |
Registration | | | 45,688 | |
Officer | | | 13,917 | |
Custodian | | | 1,120 | |
Miscellaneous | | | 13,721 | |
| | | | |
Total expenses | | | 3,784,811 | |
Less fees waived by Manager | | | (1,559,938 | ) |
| | | | |
Total expenses after fees waived | | | 2,224,873 | |
| | | | |
Net investment income | | | 5,994,467 | |
| | | | |
| | | | |
| Realized and Unrealized Gain Allocated from the Master Portfolios | | | | |
Net realized gain from investments, financial futures contracts, options written, structured options, swaps, foreign currency transactions and borrowed bonds | | | 31,744,072 | |
Net change in unrealized appreciation/depreciation on investments, financial futures contracts, options written, interest rate floors, short sales, structured options, swaps, foreign currency translations and borrowed bonds | | | 11,467,730 | |
| | | | |
Total realized and unrealized gain | | | 43,211,802 | |
| | | | |
Net Increase in Net Assets Resulting from Operations | | $ | 49,206,269 | |
| | | | |
See Notes to Financial Statements.
| | | | | | |
| | | BLACKROCK BALANCED CAPITAL FUND, INC. | | MARCH 31, 2015 | | 9 |
| | | | |
| Statements of Changes in Net Assets | | | BlackRock Balanced Capital Fund, Inc. | |
| | | | | | | | |
| Increase (Decrease) in Net Assets: | | Six Months Ended March 31, 2015 (Unaudited) | | | Year Ended September 30, 2014 | |
| | | | | | | | |
| Operations | | | | | | | | |
Net investment income | | $ | 5,994,467 | | | $ | 14,392,764 | |
Net realized gain | | | 31,744,072 | | | | 97,047,934 | |
Net change in unrealized appreciation/depreciation | | | 11,467,730 | | | | 6,881,016 | |
| | | | |
Net increase in net assets resulting from operations | | | 49,206,269 | | | | 118,321,714 | |
| | | | |
| | | | | | | | |
| Distributions to Shareholders From1 | | | | | | | | |
Net investment income: | | | | | | | | |
Institutional | | | (4,291,841 | ) | | | (7,103,520 | ) |
Investor A | | | (4,984,095 | ) | | | (8,592,906 | ) |
Investor B | | | (13,241 | ) | | | (37,523 | ) |
Investor C | | | (631,873 | ) | | | (915,737 | ) |
Class R | | | (78,974 | ) | | | (150,374 | ) |
Net realized gain: | | | | | | | | |
Institutional | | | (40,073,427 | ) | | | (25,527,071 | ) |
Investor A | | | (53,303,235 | ) | | | (35,924,272 | ) |
Investor B | | | (346,522 | ) | | | (379,669 | ) |
Investor C | | | (9,717,422 | ) | | | (5,751,000 | ) |
Class R | | | (1,028,941 | ) | | | (740,627 | ) |
| | | | |
Decrease in net assets resulting from distributions to shareholders | | | (114,469,571 | ) | | | (85,122,699 | ) |
| | | | |
| | | | | | | | |
| Capital Share Transactions | | | | | | | | |
Net increase in net assets derived from capital share transactions | | | 148,181,461 | | | | 39,640,238 | |
| | | | |
| | | | | | | | |
| Net Assets | | | | | | | | |
Total increase in net assets | | | 82,918,159 | | | | 72,839,253 | |
Beginning of period | | | 913,127,373 | | | | 840,288,120 | |
| | | | |
End of period | | $ | 996,045,532 | | | $ | 913,127,373 | |
| | | | |
Undistributed (distributions in excess of) net investment income, end of period | | $ | (3,786,217 | ) | | $ | 219,340 | |
| | | | |
| | 1 | | Distributions for annual periods determined in accordance with federal income tax regulations. |
See Notes to Financial Statements.
| | | | | | |
| 10 | | BLACKROCK BALANCED CAPITAL FUND, INC. | | MARCH 31, 2015 | | |
| | | | |
| Financial Highlights | | | BlackRock Balanced Capital Fund, Inc. | |
| | | | | | | | | | | | | | | | | | | | | | | | |
| | | Institutional | |
| | | Six Months
Ended March 31,
2015 (Unaudited) | | | Year Ended September 30, | |
| | | | 2014 | | | 2013 | | | 2012 | | | 2011 | | | 2010 | |
| Per Share Operating Performance | | | | | | | | | | | | | | | | | | | | | | | | |
Net asset value, beginning of period | | $ | 26.07 | | | $ | 25.16 | | | $ | 23.77 | | | $ | 20.18 | | | $ | 20.28 | | | $ | 19.17 | |
| | | | |
Net investment income1 | | | 0.19 | | | | 0.48 | | | | 0.47 | | | | 0.55 | | | | 0.51 | | | | 0.46 | |
Net realized and unrealized gain (loss) | | | 1.20 | | | | 3.05 | | | | 2.35 | | | | 3.55 | | | | (0.13 | ) | | | 1.20 | |
| | | | |
Net increase from investment operations | | | 1.39 | | | | 3.53 | | | | 2.82 | | | | 4.10 | | | | 0.38 | | | | 1.66 | |
| | | | |
Distributions from:2 | | | | | | | | | | | | | | | | | | | | | | | | |
Net investment income | | | (0.31 | ) | | | (0.56 | ) | | | (0.53 | ) | | | (0.51 | ) | | | (0.48 | ) | | | (0.55 | ) |
Net realized gain | | | (2.89 | ) | | | (2.06 | ) | | | (0.90 | ) | | | — | | | | — | | | | — | |
| | | | |
Total distributions | | | (3.20 | ) | | | (2.62 | ) | | | (1.43 | ) | | | (0.51 | ) | | | (0.48 | ) | | | (0.55 | ) |
| | | | |
Net asset value, end of period | | $ | 24.26 | | | $ | 26.07 | | | $ | 25.16 | | | $ | 23.77 | | | $ | 20.18 | | | $ | 20.28 | |
| | | | |
| | | | | | | | | | | | | | | | | | | | | | | | |
| Total Return3 | | | | | | | | | | | | | | | | | | | | | | | | |
Based on net asset value | | | 5.39 | %4 | | | 14.77 | % | | | 12.42 | % | | | 20.52 | % | | | 1.67 | % | | | 8.75 | %5 |
| | | | |
| | | | | | | | | | | | | | | | | | | | | | | | |
| Ratios to Average Net Assets6 | | | | | | | | | | | | | | | | | | | | | | | | |
Total expenses | | | 0.90 | %7 | | | 0.95 | % | | | 0.98 | % | | | 0.96 | % | | | 1.07 | % | | | 1.08 | % |
| | | | |
Total expenses after fees waived and/or reimbursed | | | 0.57 | %7 | | | 0.63 | % | | | 0.66 | % | | | 0.66 | % | | | 0.76 | % | | | 0.76 | % |
| | | | |
Net investment income | | | 1.51 | %7 | | | 1.88 | % | | | 1.87 | % | | | 2.45 | % | | | 2.33 | % | | | 2.28 | % |
| | | | |
| | | | | | | | | | | | | | | | | | | | | | | | |
| Supplemental Data | | | | | | | | | | | | | | | | | | | | | | | | |
Net assets, end of period (000) | | $ | 385,145 | | | $ | 348,345 | | | $ | 317,572 | | | $ | 426,027 | | | $ | 511,458 | | | $ | 547,721 | |
| | | | |
Portfolio turnover rate of the Fund8 | | | — | | | | — | | | | — | | | | — | | | | — | | | | — | |
| | | | |
Portfolio turnover rate of the Master Total Return Portfolio9 | | | 529 | % | | | 750 | % | | | 777 | % | | | 1,346 | % | | | 1,771 | % | | | 1,754 | % |
| | | | |
Portfolio turnover rate of the Master Large Cap Core Portfolio | | | 23 | % | | | 40 | % | | | 50 | % | | | 128 | % | | | 129 | % | | | 173 | % |
| | | | |
| | 1 | | Based on average shares outstanding. |
| | 2 | | Distributions for annual periods determined in accordance with federal income tax regulations. |
| | 3 | | Where applicable, assumes the reinvestment of distributions. |
| | 4 | | Aggregate total return. |
| | 5 | | Includes proceeds received from a settlement of litigation, through its investment in Master Large Cap Core Portfolio, which impacted the Fund’s total return. Excluding these proceeds, the Fund’s total return would have been 8.32%. |
| | 6 | | Includes the Fund’s share of the Master Portfolio’s allocated expenses and/or net investment income. |
| | 8 | | Excludes transactions in the Master Portfolios. |
| | 9 | | Includes mortgage dollar roll transactions. Additional information regarding portfolio turnover rate is as follows: |
| | | | | | | | | | | | | | | | | | | | | | | | | | | | | | | | | | |
| | | Six Months Ended
March 31,
2015 (Unaudited) | | | | | Year Ended September 30, | |
| | | | 2014 | | | | | 2013 | | | | | 2012 | | | | | 2011 | | | | | 2010 | |
Portfolio turnover rate (excluding mortgage dollar roll transactions) | | | 468 | % | | | | | 529 | % | | | | | 450 | % | | | | | 752 | % | | | | | 1,379 | % | | | | | 1,248% | |
See Notes to Financial Statements.
| | | | | | |
| | | BLACKROCK BALANCED CAPITAL FUND, INC. | | MARCH 31, 2015 | | 11 |
| | | | |
| Financial Highlights (continued) | | | BlackRock Balanced Capital Fund, Inc. | |
| | | | | | | | | | | | | | | | | | | | | | | | |
| | | Investor A | |
| | | Six Months
Ended
March 31,
2015 (Unaudited) | | | Year Ended September 30, | |
| | | | 2014 | | | 2013 | | | 2012 | | | 2011 | | | 2010 | |
| Per Share Operating Performance | | | | | | | | | | | | | | | | | | | | | | | | |
Net asset value, beginning of period | | $ | 26.00 | | | $ | 25.11 | | | $ | 23.68 | | | $ | 20.10 | | | $ | 20.21 | | | $ | 19.11 | |
| | | | |
Net investment income1 | | | 0.15 | | | | 0.40 | | | | 0.38 | | | | 0.47 | | | | 0.40 | | | | 0.39 | |
Net realized and unrealized gain (loss) | | | 1.20 | | | | 3.03 | | | | 2.37 | | | | 3.55 | | | | (0.10 | ) | | | 1.19 | |
| | | | |
Net increase from investment operations | | | 1.35 | | | | 3.43 | | | | 2.75 | | | | 4.02 | | | | 0.30 | | | | 1.58 | |
| | | | |
Distributions from:2 | | | | | | | | | | | | | | | | | | | | | | | | |
Net investment income | | | (0.27 | ) | | | (0.48 | ) | | | (0.42 | ) | | | (0.44 | ) | | | (0.41 | ) | | | (0.48 | ) |
Net realized gain | | | (2.89 | ) | | | (2.06 | ) | | | (0.90 | ) | | | — | | | | — | | | | — | |
| | | | |
Total distributions | | | (3.16 | ) | | | (2.54 | ) | | | (1.32 | ) | | | (0.44 | ) | | | (0.41 | ) | | | (0.48 | ) |
| | | | |
Net asset value, end of period | | $ | 24.19 | | | $ | 26.00 | | | $ | 25.11 | | | $ | 23.68 | | | $ | 20.10 | | | $ | 20.21 | |
| | | | |
| | | | | | | | | | | | | | | | | | | | | | | | |
| Total Return3 | | | | | | | | | | | | | | | | | | | | | | | | |
Based on net asset value | | | 5.24 | %4 | | | 14.39 | % | | | 12.14 | % | | | 20.16 | % | | | 1.31 | % | | | 8.38 | %5 |
| | | | |
| | | | | | | | | | | | | | | | | | | | | | | | |
| Ratios to Average Net Assets6 | | | | | | | | | | | | | | | | | | | | | | | | |
Total expenses | | | 1.19 | %7 | | | 1.25 | % | | | 1.29 | % | | | 1.28 | % | | | 1.39 | % | | | 1.40 | % |
| | | | |
Total expenses after fees waived and/or reimbursed | | | 0.86 | %7 | | | 0.92 | % | | | 0.97 | % | | | 0.97 | % | | | 1.07 | % | | | 1.08 | % |
| | | | |
Net investment income | | | 1.22 | %7 | | | 1.58 | % | | | 1.51 | % | | | 2.12 | % | | | 1.83 | % | | | 1.96 | % |
| | | | |
| | | | | | | | | | | | | | | | | | | | | | | | |
| Supplemental Data | | | | | | | | | | | | | | | | | | | | | | | | |
Net assets, end of period (000) | | $ | 506,538 | | | $ | 476,919 | | | $ | 445,295 | | | $ | 447,620 | | | $ | 426,819 | | | $ | 488,087 | |
| | | | |
Portfolio turnover rate of the Fund8 | | | — | | | | — | | | | — | | | | — | | | | — | | | | — | |
| | | | |
Portfolio turnover rate of the Master Total Return Portfolio9 | | | 529 | % | | | 750 | % | | | 777 | % | | | 1,346 | % | | | 1,771 | % | | | 1,754 | % |
| | | | |
Portfolio turnover rate of the Master Large Cap Core Portfolio | | | 23 | % | | | 40 | % | | | 50 | % | | | 128 | % | | | 129 | % | | | 173 | % |
| | | | |
| | 1 | | Based on average shares outstanding. |
| | 2 | | Distributions for annual periods determined in accordance with federal income tax regulations. |
| | 3 | | Where applicable, excludes the effects of any sales charges and assumes the reinvestment of distributions. |
| | 4 | | Aggregate total return. |
| | 5 | | Includes proceeds received from a settlement of litigation, through its investment in Master Large Cap Core Portfolio, which impacted the Fund’s total return. Excluding these proceeds, the Fund’s total return would have been 7.95%. |
| | 6 | | Includes the Fund’s share of the Master Portfolio’s allocated expenses and/or net investment income. |
| | 8 | | Excludes transactions in the Master Portfolios. |
| | 9 | | Includes mortgage dollar roll transactions. Additional information regarding portfolio turnover rate is as follows: |
| | | | | | | | | | | | | | | | | | | | | | | | | | | | | | | | | | |
| | | Six Months
Ended
March 31,
2015 (Unaudited) | | | | | Year Ended September 30, | |
| | | | 2014 | | | | | 2013 | | | | | 2012 | | | | | 2011 | | | | | 2010 | |
Portfolio turnover rate (excluding mortgage dollar roll transactions) | | | 468 | % | | | | | 529 | % | | | | | 450 | % | | | | | 752 | % | | | | | 1,379 | % | | | | | 1,248% | |
See Notes to Financial Statements.
| | | | | | |
| 12 | | BLACKROCK BALANCED CAPITAL FUND, INC. | | MARCH 31, 2015 | | |
| | | | |
| Financial Highlights (continued) | | | BlackRock Balanced Capital Fund, Inc. | |
| | | | | | | | | | | | | | | | | | | | | | | | |
| | | Investor B | |
| | | Six Months
Ended
March 31,
2015 (Unaudited) | | | Year Ended September 30, | |
| | | 2014 | | | 2013 | | | 2012 | | | 2011 | | | 2010 | |
| Per Share Operating Performance | | | | | | | | | | | | | | | | | | | | | | | | |
Net asset value, beginning of period | | $ | 25.30 | | | $ | 24.47 | | | $ | 23.07 | | | $ | 19.55 | | | $ | 19.65 | | | $ | 18.56 | |
| | | | |
Net investment income1 | | | 0.01 | | | | 0.14 | | | | 0.13 | | | | 0.24 | | | | 0.18 | | | | 0.20 | |
Net realized and unrealized gain (loss) | | | 1.16 | | | | 2.96 | | | | 2.29 | | | | 3.46 | | | | (0.10 | ) | | | 1.16 | |
| | | | |
Net increase from investment operations | | | 1.17 | | | | 3.10 | | | | 2.42 | | | | 3.70 | | | | 0.08 | | | | 1.36 | |
| | | | |
Distributions from:2 | | | | | | | | | | | | | | | | | | | | | | | | |
Net investment income | | | (0.11 | ) | | | (0.21 | ) | | | (0.12 | ) | | | (0.18 | ) | | | (0.18 | ) | | | (0.27 | ) |
Net realized gain | | | (2.89 | ) | | | (2.06 | ) | | | (0.90 | ) | | | — | | | | — | | | | — | |
| | | | |
Total distributions | | | (3.00 | ) | | | (2.27 | ) | | | (1.02 | ) | | | (0.18 | ) | | | (0.18 | ) | | | (0.27 | ) |
| | | | |
Net asset value, end of period | | $ | 23.47 | | | $ | 25.30 | | | $ | 24.47 | | | $ | 23.07 | | | $ | 19.55 | | | $ | 19.65 | |
| | | | |
| | | | | | | | | | | | | | | | | | | | | | | | |
| Total Return3 | | | | | | | | | | | | | | | | | | | | | | | | |
Based on net asset value | | | 4.64 | %4 | | | 13.27 | % | | | 10.94 | % | | | 19.01 | % | | | 0.34 | % | | | 7.37 | %5 |
| | | | |
| | | | | | | | | | | | | | | | | | | | | | | | |
| Ratios to Average Net Assets6 | | | | | | | | | | | | | | | | | | | | | | | | |
Total expenses | | | 2.33 | %7 | | | 2.26 | % | | | 2.33 | % | | | 2.29 | % | | | 2.36 | % | | | 2.34 | % |
| | | | |
Total expenses after fees waived and/or reimbursed | | | 2.00 | %7 | | | 1.93 | % | | | 2.01 | % | | | 1.98 | % | | | 2.04 | % | | | 2.02 | % |
| | | | |
Net investment income | | | 0.07 | %7 | | | 0.56 | % | | | 0.51 | % | | | 1.13 | % | | | 0.86 | % | | | 1.03 | % |
| | | | |
| | | | | | | | | | | | | | | | | | | | | | | | |
| Supplemental Data | | | | | | | | | | | | | | | | | | | | | | | | |
Net assets, end of period (000) | | $ | 2,927 | | | $ | 3,633 | | | $ | 4,926 | | | $ | 7,128 | | | $ | 8,786 | | | $ | 14,374 | |
| | | | |
Portfolio turnover rate of the Fund8 | | | — | | | | — | | | | — | | | | — | | | | — | | | | — | |
| | | | |
Portfolio turnover rate of the Master Total Return Portfolio9 | | | 529 | % | | | 750 | % | | | 777 | % | | | 1,346 | % | | | 1,771 | % | | | 1,754 | % |
| | | | |
Portfolio turnover rate of the Master Large Cap Core Portfolio | | | 23 | % | | | 40 | % | | | 50 | % | | | 128 | % | | | 129 | % | | | 173 | % |
| | | | |
| | 1 | | Based on average shares outstanding. |
| | 2 | | Distributions for annual periods determined in accordance with federal income tax regulations. |
| | 3 | | Where applicable, excludes the effects of any sales charges and assumes the reinvestment of distributions. |
| | 4 | | Aggregate total return. |
| | 5 | | Includes proceeds received from a settlement of litigation, through its investment in Master Large Cap Core Portfolio, which impacted the Fund’s total return. Excluding these proceeds, the Fund’s total return would have been 6.82%. |
| | 6 | | Includes the Fund’s share of the Master Portfolio’s allocated expenses and/or net investment income. |
| | 8 | | Excludes transactions in the Master Portfolios. |
| | 9 | | Includes mortgage dollar roll transactions. Additional information regarding portfolio turnover rate is as follows: |
| | | | | | | | | | | | | | | | | | | | | | | | | | | | | | | | | | |
| | | Six Months
Ended
March 31,
2015 (Unaudited) | | | | | Year Ended September 30, | |
| | | | 2014 | | | | | 2013 | | | | | 2012 | | | | | 2011 | | | | | 2010 | |
Portfolio turnover rate (excluding mortgage dollar roll transactions) | | | 468 | % | | | | | 529 | % | | | | | 450 | % | | | | | 752 | % | | | | | 1,379 | % | | | | | 1,248% | |
See Notes to Financial Statements.
| | | | | | |
| | | BLACKROCK BALANCED CAPITAL FUND, INC. | | MARCH 31, 2015 | | 13 |
| | | | |
| Financial Highlights (continued) | | | BlackRock Balanced Capital Fund, Inc. | |
| | | | | | | | | | | | | | | | | | | | | | | | |
| | | Investor C | |
| | | Six Months
Ended
March 31,
2015 (Unaudited) | | | Year Ended September 30, | |
| | | | 2014 | | | 2013 | | | 2012 | | | 2011 | | | 2010 | |
| Per Share Operating Performance | | | | | | | | | | | | | | | | | | | | | | | | |
Net asset value, beginning of period | | $ | 23.80 | | | $ | 23.20 | | | $ | 21.92 | | | $ | 18.64 | | | $ | 18.77 | | | $ | 17.79 | |
| | | | |
Net investment income1 | | | 0.06 | | | | 0.19 | | | | 0.18 | | | | 0.28 | | | | 0.21 | | | | 0.21 | |
Net realized and unrealized gain (loss) | | | 1.09 | | | | 2.79 | | | | 2.17 | | | | 3.28 | | | | (0.08 | ) | | | 1.12 | |
| | | | |
Net increase from investment operations | | | 1.15 | | | | 2.98 | | | | 2.35 | | | | 3.56 | | | | 0.13 | | | | 1.33 | |
| | | | |
Distributions from:2 | | | | | | | | | | | | | | | | | | | | | | | | |
Net investment income | | | (0.19 | ) | | | (0.32 | ) | | | (0.17 | ) | | | (0.28 | ) | | | (0.26 | ) | | | (0.35 | ) |
Net realized gain | | | (2.89 | ) | | | (2.06 | ) | | | (0.90 | ) | | | — | | | | — | | | | — | |
| | | | |
Total distributions | | | (3.08 | ) | | | (2.38 | ) | | | (1.07 | ) | | | (0.28 | ) | | | (0.26 | ) | | | (0.35 | ) |
| | | | |
Net asset value, end of period | | $ | 21.87 | | | $ | 23.80 | | | $ | 23.20 | | | $ | 21.92 | | | $ | 18.64 | | | $ | 18.77 | |
| | | | |
| | | | | | | | | | | | | | | | | | | | | | | | |
| Total Return3 | | | | | | | | | | | | | | | | �� | | | | | | | | |
Based on net asset value | | | 4.85 | %4 | | | 13.51 | % | | | 11.22 | % | | | 19.22 | % | | | 0.55 | % | | | 7.53 | %5 |
| | | | |
| | | | | | | | | | | | | | | | | | | | | | | | |
| Ratios to Average Net Assets6 | | | | | | | | | | | | | | | | | | | | | | | | |
Total expenses | | | 1.95 | %7 | | | 2.02 | % | | | 2.07 | % | | | 2.06 | % | | | 2.18 | % | | | 2.20 | % |
| | | | |
Total expenses after fees waived and/or reimbursed | | | 1.62 | %7 | | | 1.69 | % | | | 1.75 | % | | | 1.75 | % | | | 1.87 | % | | | 1.88 | % |
| | | | |
Net investment income | | | 0.46 | %7 | | | 0.81 | % | | | 0.72 | % | | | 1.33 | % | | | 1.04 | % | | | 1.16 | % |
| | | | |
| | | | | | | | | | | | | | | | | | | | | | | | |
| Supplemental Data | | | | | | | | | | | | | | | | | | | | | | | | |
Net assets, end of period (000) | | $ | 91,463 | | | $ | 74,908 | | | $ | 63,952 | | | $ | 61,541 | | | $ | 56,608 | | | $ | 61,017 | |
| | | | |
Portfolio turnover rate of the Fund8 | | | — | | | | — | | | | — | | | | — | | | | — | | | | — | |
| | | | |
Portfolio turnover rate of the Master Total Return Portfolio9 | | | 529 | % | | | 750 | % | | | 777 | % | | | 1,346 | % | | | 1,771 | % | | | 1,754 | % |
| | | | |
Portfolio turnover rate of the Master Large Cap Core Portfolio | | | 23 | % | | | 40 | % | | | 50 | % | | | 128 | % | | | 129 | % | | | 173 | % |
| | | | |
| | 1 | | Based on average shares outstanding. |
| | 2 | | Distributions for annual periods determined in accordance with federal income tax regulations. |
| | 3 | | Where applicable, excludes the effects of any sales charges and assumes the reinvestment of distributions. |
| | 4 | | Aggregate total return. |
| | 5 | | Includes proceeds received from a settlement of litigation, through its investment in Master Large Cap Core Portfolio, which impacted the Fund’s total return. Excluding these proceeds, the Fund’s total return would have been 7.12%. |
| | 6 | | Includes the Fund’s share of the Master Portfolio’s allocated expenses and/or net investment income. |
| | 8 | | Excludes transactions in the Master Portfolios. |
| | 9 | | Includes mortgage dollar roll transactions. Additional information regarding portfolio turnover rate is as follows: |
| | | | | | | | | | | | | | | | | | | | | | | | | | | | | | | | | | |
| | | Six Months Ended
March 31,
2015 (Unaudited) | | | | | Year Ended September 30, | |
| | | | 2014 | | | | | 2013 | | | | | 2012 | | | | | 2011 | | | | | 2010 | |
Portfolio turnover rate (excluding mortgage dollar roll transactions) | | | 468 | % | | | | | 529 | % | | | | | 450 | % | | | | | 752 | % | | | | | 1,379 | % | | | | | 1,248% | |
See Notes to Financial Statements.
| | | | | | |
| 14 | | BLACKROCK BALANCED CAPITAL FUND, INC. | | MARCH 31, 2015 | | |
| | | | |
| Financial Highlights (concluded) | | | BlackRock Balanced Capital Fund, Inc. | |
| | | | | | | | | | | | | | | | | | | | | | | | |
| | | Class R | |
| | | Six Months
Ended
March 31,
2015 (Unaudited) | | | Year Ended September 30, | |
| | | | 2014 | | | 2013 | | | 2012 | | | 2011 | | | 2010 | |
| Per Share Operating Performance | | | | | | | | | | | | | | | | | | | | | | | | |
Net asset value, beginning of period | | $ | 24.68 | | | $ | 23.96 | | | $ | 22.63 | | | $ | 19.22 | | | $ | 19.33 | | | $ | 18.31 | |
| | | | |
Net investment income1 | | | 0.10 | | | | 0.30 | | | | 0.28 | | | | 0.37 | | | | 0.30 | | | | 0.29 | |
Net realized and unrealized gain (loss) | | | 1.13 | | | | 2.89 | | | | 2.24 | | | | 3.39 | | | | (0.09 | ) | | | 1.14 | |
| | | | |
Net increase from investment operations | | | 1.23 | | | | 3.19 | | | | 2.52 | | | | 3.76 | | | | 0.21 | | | | 1.43 | |
| | | | |
Distributions from:2 | | | | | | | | | | | | | | | | | | | | | | | | |
Net investment income | | | (0.22 | ) | | | (0.41 | ) | | | (0.29 | ) | | | (0.35 | ) | | | (0.32 | ) | | | (0.41 | ) |
Net realized gain | | | (2.89 | ) | | | (2.06 | ) | | | (0.90 | ) | | | — | | | | — | | | | — | |
| | | | |
Total distributions | | | (3.11 | ) | | | (2.47 | ) | | | (1.19 | ) | | | (0.35 | ) | | | (0.32 | ) | | | (0.41 | ) |
| | | | |
Net asset value, end of period | | $ | 22.80 | | | $ | 24.68 | | | $ | 23.96 | | | $ | 22.63 | | | $ | 19.22 | | | $ | 19.33 | |
| | | | |
| | | | | | | | | | | | | | | | | | | | | | | | |
| Total Return3 | | | | | | | | | | | | | | | | | | | | | | | | |
Based on net asset value | | | 5.03 | %4 | | | 14.03 | % | | | 11.66 | % | | | 19.73 | % | | | 0.96 | % | | | 7.87 | %5 |
| | | | |
| | | | | | | | | | | | | | | | | | | | | | | | |
| Ratios to Average Net Assets6 | | | | | | | | | | | | | | | | | | | | | | | | |
Total expenses | | | 1.55 | %7 | | | 1.59 | % | | | 1.66 | % | | | 1.67 | % | | | 1.77 | % | | | 1.84 | % |
| | | | |
Total expenses after fees waived and/or reimbursed | | | 1.22 | %7 | | | 1.27 | % | | | 1.33 | % | | | 1.36 | % | | | 1.46 | % | | | 1.52 | % |
| | | | |
Net investment income | | | 0.86 | %7 | | | 1.23 | % | | | 1.16 | % | | | 1.73 | % | | | 1.44 | % | | | 1.51 | % |
| | | | |
| | | | | | | | | | | | | | | | | | | | | | | | |
| Supplemental Data | | | | | | | | | | | | | | | | | | | | | | | | |
Net assets, end of period (000) | | $ | 9,973 | | | $ | 9,322 | | | $ | 8,542 | | | $ | 8,963 | | | $ | 8,118 | | | $ | 9,737 | |
| | | | |
Portfolio turnover rate of the Fund8 | | | — | | | | — | | | | — | | | | — | | | | — | | | | — | |
| | | | |
Portfolio turnover rate of the Master Total Return Portfolio9 | | | 529 | % | | | 750 | % | | | 777 | % | | | 1,346 | % | | | 1,771 | % | | | 1,754 | % |
| | | | |
Portfolio turnover rate of the Master Large Cap Core Portfolio | | | 23 | % | | | 40 | % | | | 50 | % | | | 128 | % | | | 129 | % | | | 173 | % |
| | | | |
| | 1 | | Based on average shares outstanding. |
| | 2 | | Distributions for annual periods determined in accordance with federal income tax regulations. |
| | 3 | | Where applicable, assumes the reinvestment of distributions. |
| | 4 | | Aggregate total return. |
| | 5 | | Includes proceeds received from a settlement of litigation, through its investment in Master Large Cap Core Portfolio, which impacted the Fund’s total return. Excluding these proceeds, the Fund’s total return would have been 7.53%. |
| | 6 | | Includes the Fund’s share of the Master Portfolio’s allocated expenses and/or net investment income. |
| | 8 | | Excludes transactions in the Master Portfolios. |
| | 9 | | Includes mortgage dollar roll transactions. Additional information regarding portfolio turnover rate is as follows: |
| | | | | | | | | | | | | | | | | | | | | | | | | | | | | | | | | | |
| | | Six Months Ended
March 31,
2015 (Unaudited) | | | | | Year Ended September 30, | |
| | | | 2014 | | | | | 2013 | | | | | 2012 | | | | | 2011 | | | | | 2010 | |
Portfolio turnover rate (excluding mortgage dollar roll transactions) | | | 468 | % | | | | | 529 | % | | | | | 450 | % | | | | | 752 | % | | | | | 1,379 | % | | | | | 1,248% | |
See Notes to Financial Statements.
| | | | | | |
| | | BLACKROCK BALANCED CAPITAL FUND, INC. | | MARCH 31, 2015 | | 15 |
| | | | |
| Notes to Financial Statements (Unaudited) | | | BlackRock Balanced Capital Fund, Inc. | |
1. Organization:
BlackRock Balanced Capital Fund, Inc. (the “Fund”) is registered under the Investment Company Act of 1940, as amended (the “1940 Act”), as a diversified, open-end management investment company. The Fund is organized as a Maryland corporation. The Fund seeks to achieve its investment objective by investing the fixed income portion of its assets in Master Total Return Portfolio (the “Master Total Return Portfolio”) of Master Bond LLC, a mutual fund that has an investment objective and strategy consistent with that of the fixed income portion of the Fund, and investing the equity portion of its assets in Master Large Cap Core Portfolio (the “Master Large Cap Core Portfolio”) of Master Large Cap Series LLC, a mutual fund that has an investment objective and strategy consistent with that of the equity portion of the Fund. Master Total Return Portfolio and Master Large Cap Core Portfolio, both affiliates of the Fund, are collectively referred to as the “Master Portfolios.” The value of the Fund’s investment in the Master Portfolios reflects the Fund’s proportionate interest in the net assets of the Master Portfolios. The performance of the Fund is directly affected by the performance of the Master Portfolios. At March 31, 2015, the percentages of the Master Large Cap Core Portfolio and Master Total Return Portfolio owned by the Fund were 25.2% and 5.4%, respectively. The financial statements of the Master Portfolios, including the Schedules of Investments, are included elsewhere in this report and should be read in conjunction with the Fund’s financial statements.
The Fund offers multiple classes of shares. All classes of shares have identical voting, dividend, liquidation and other rights and are subject to the same terms and conditions, except that certain classes bear expenses related to the shareholder servicing and distribution of such shares. Institutional Shares are sold only to certain eligible investors. Investor B and Class R Shares are only available through exchanges and distribution reinvestments by current holders and for purchase by certain employer-sponsored retirement plans. Investor A and Investor C Shares are generally available through financial intermediaries. Each class has exclusive voting rights with respect to matters relating to its shareholder servicing and distribution expenditures (except that Investor B shareholders may vote on material changes to the Investor A distribution and service plan).
| | | | | | |
| Share Class | | Initial Sales Charge | | CDSC | | Conversion Privilege |
Institutional and Class R Shares | | No | | No | | None |
Investor A Shares | | Yes | | No1 | | None |
Investor B Shares | | No | | Yes | | To Investor A Shares after approximately 8 years |
Investor C Shares | | No | | Yes | | None |
| | 1 | | Investor A Shares may be subject to a CDSC where no initial sales charge was paid at the time of purchase. |
The Fund, together with certain other registered investment companies advised by the Manager or its affiliates, is included in a complex of open-end funds referred to as the Equity-Bond Complex.
2. Significant Accounting Policies:
The Fund’s financial statements are prepared in conformity with accounting principles generally accepted in the United States of America (“U.S. GAAP”), which may require management to make estimates and assumptions that affect the reported amounts of assets and liabilities in the financial statements and the reported amounts of increases and decreases in net assets from operations during the reporting period. Actual results could differ from those estimates. The Fund is considered an investment company under U.S. GAAP and follows the accounting and reporting guidance applicable to investment companies. The following is a summary of significant accounting policies followed by the Fund:
Valuation: U.S. GAAP defines fair value as the price the Fund would receive to sell an asset or pay to transfer a liability in an orderly transaction between market participants at the measurement date. The Fund’s policy is to fair value its financial instruments at market value. The Fund records its investment in the Master Portfolios at fair value based on the Fund’s proportionate interest in the net assets of the Master Portfolios. Valuation of securities held by the Master Portfolios is discussed in Note 2 of each Master Portfolio’s Notes to Financial Statements, which are included elsewhere in this report. Investments in open-end registered investment companies are valued at NAV each business day.
| • | | Fair Value Measurements — Various inputs are used in determining the fair value of investments and derivative financial instruments. These inputs to valuation techniques are categorized into a disclosure hierarchy consisting of three broad levels for financial statement purposes. The hierarchy gives the highest priority to unadjusted quoted prices in active markets for identical assets or liabilities (Level 1 measurements) and the lowest priority to unobservable inputs (Level 3 measurements). Accordingly, the degree of judgment exercised in determining fair value is greatest for instruments categorized in Level 3. The inputs used to measure fair value may fall into different levels of the fair value hierarchy. In such cases, for disclosure purposes, the fair value hierarchy classification is determined based on the lowest level input that is significant to the fair value measurement in its entirety. The categorization of a value determined for investments and derivative financial instruments is based on the pricing transparency of the investment and derivative financial instruments and is not necessarily an indication of the risks associated with investing in those securities. The three levels of the fair value hierarchy are as follows: |
| | • | | Level 1 — unadjusted quoted prices in active markets/exchanges for identical assets or liabilities that the Fund has the ability to access |
| | | | | | |
| 16 | | BLACKROCK BALANCED CAPITAL FUND, INC. | | MARCH 31, 2015 | | |
| | | | |
| Notes to Financial Statements (continued) | | | BlackRock Balanced Capital Fund, Inc. | |
| | • | | Level 2 — other observable inputs (including, but not limited to, quoted prices for similar assets or liabilities in markets that are active, quoted prices for identical or similar assets or liabilities in markets that are not active, inputs other than quoted prices that are observable for the assets or liabilities (such as interest rates, yield curves, volatilities, prepayment speeds, loss severities, credit risks and default rates) or other market–corroborated inputs) |
| | • | | Level 3 — unobservable inputs based on the best information available in the circumstances, to the extent observable inputs are not available (including the Fund’s own assumptions used in determining the fair value of investments and derivative financial instruments) |
Changes in valuation techniques may result in transfers into or out of an assigned level within the disclosure hierarchy. In accordance with the Fund’s policy, transfers between different levels of the fair value disclosure hierarchy are deemed to have occurred as of the beginning of the reporting period. The categorization of a value determined for investments and derivative financial instruments is based on the pricing transparency of the investment and derivative financial instruments and is not necessarily an indication of the risks associated with investing in those securities.
As of March 31, 2015, the following table summarizes the Fund’s investments categorized in the disclosure hierarchy:
| | | | | | | | | | | | |
| | | Level 1 | | | Level 2 | | Level 3 | | Total | |
BlackRock Liquidity Funds, TempFund, Institutional Class | | $ | 39,561,551 | | | — | | — | | $ | 39,561,551 | |
During the six months ended March 31, 2015, there were no transfers between levels.
Investment Transactions and Investment Income: For financial reporting purposes, contributions to and withdrawals from the Master Portfolios are accounted on a trade date basis. The Fund records daily its proportionate share of the Master Portfolios’ income, expenses and realized and unrealized gains and losses. In addition, the Fund accrues its own expenses. Income, expenses and realized and unrealized gains and losses are allocated daily to each class based on its relative net assets.
Distributions: Distributions paid by the Fund are recorded on the ex-dividend date. The character and timing of distributions are determined in accordance with federal income tax regulations, which may differ from U.S. GAAP.
Net income and realized gains from investments held by the Master Portfolio’s investment in BlackRock Cayman Master Total Return Portfolio I, Ltd. (the “Subsidiary”) are treated as ordinary income for tax purposes. Accordingly, the net investment income (loss) and realized gains (losses) reported in the Fund’s financial statements presented under U.S. GAAP for such investments held by the Subsidiary may differ significantly from distributions. As such, any net gain will pass through to the Fund as ordinary income for federal income tax purposes. If a net loss is realized by Subsidiary in any taxable year, the loss will generally not be available to offset the Fund’s ordinary income and/or capital gains for that year.
Other: Expenses directly related to the Fund or its classes are charged to the Fund or the applicable class. Other operating expenses shared by several funds are prorated among those funds on the basis of relative net assets or other appropriate methods. Expenses directly related to the Fund and other shared expenses prorated to the Fund are allocated daily to each class based on its relative net assets or other appropriate methods.
The Fund has an arrangement with its custodian whereby fees may be reduced by credits earned on uninvested cash balances, which, if applicable, are shown as fees paid indirectly in the Statement of Operations. The custodian imposes fees on overdrawn cash balances, which can be offset by accumulated credits earned or may result in additional custody charges.
3. Investment Advisory Agreement and Other Transactions with Affiliates:
The PNC Financial Services Group, Inc. is the largest stockholder and an affiliate of BlackRock, Inc. (“BlackRock”), for 1940 Act purposes.
The Fund entered into an Investment Advisory Agreement with the Manager, the Fund’s investment advisor, an indirect, wholly owned subsidiary of BlackRock, to provide investment advisory and administration services. The Manager is responsible for the management of the Fund’s portfolio and provides the necessary personnel, facilities, equipment and certain other services to the operations of the Fund. For such services, the Fund pays the Manager a monthly fee based on a percentage of the Fund’s average daily net assets at the following annual rates:
| | | | |
| Average Daily Net Assets | | Investment
Advisory Fee | |
First $250 million | | | 0.500 | % |
$250 million — $ 300 million | | | 0.450 | % |
$300 million — $ 400 million | | | 0.425 | % |
Greater than $400 million | | | 0.400 | % |
The Fund also pays an investment advisory fee to the Manager, which is the investment advisor of Master Total Return Portfolio and Master Large Cap Core Portfolio, to the extent it invests in the Master Total Return Portfolio and Master Large Cap Core Portfolio. The Manager has contractually agreed to
| | | | | | |
| | | BLACKROCK BALANCED CAPITAL FUND, INC. | | MARCH 31, 2015 | | 17 |
| | | | |
| Notes to Financial Statements (continued) | | | BlackRock Balanced Capital Fund, Inc. | |
waive its investment advisory fee by the amount the Fund pays in connection with its investments in the Master Portfolios. For the six months ended March 31, 2015, the Manager waived $1,548,922, which is included in fees waived by the Manager in the Statement of Operations.
Investments in companies considered to be an affiliate of the Fund, for purposes of Section 2(a)(3) of the Investment Company Act of 1940, were as follows:
| | | | | | | | | | | | | | | | |
| Affiliate | | Shares Held at
September 30, 2014 | | | Net
Activity | | | Shares Held at
March 31, 2015 | | | Income | |
BlackRock Liquidity Funds, TempFund, Institutional Class | | | 11,246,786 | | | | 28,314,765 | | | | 39,561,551 | | | $ | 11,032 | |
The Manager voluntarily agreed to waive its investment advisory fees by the amount of investment advisory fees the Fund pays to the Manager indirectly through its investment in affiliated money market funds. However, the Manager does not waive its investment advisory fees by the amount of investment advisory fees paid in connection with the Fund’s investment in other affiliated investment companies except to the extent noted above with respect to Master Total Return Portfolio and Master Large Cap Core Portfolio, if any. For the six months ended March 31, 2015, the Manager waived $11,016, which is included in fees waived by the Manager in the Statement of Operations.
The Manager, on behalf of each Fund, entered into a sub-advisory agreement with BlackRock Investment Management, LLC (“BIM”), an affiliate of the Manager. The Manager pays BIM, for services it provides, a monthly fee that is a percentage of the investment advisory fees paid by the Fund to the Manager.
The Manager, on behalf of the Fund, entered into a Distribution Agreement and a Distribution and Service Plan with BlackRock Investments, LLC (“BRIL”), an affiliate of the Manager. Pursuant to the Distribution and Service Plan and in accordance with Rule 12b-1 under the 1940 Act, the Fund pays BRIL ongoing service and distribution fees. The fees are accrued daily and paid monthly at annual rates based upon the average daily net assets of the relevant share class of the Fund as follows:
| | | | | | | | |
| | | Service
Fee | | | Distribution
Fee | |
Investor A | | | 0.25 | % | | | — | |
Investor B | | | 0.25 | % | | | 0.75 | % |
Investor C | | | 0.25 | % | | | 0.75 | % |
Class R | | | 0.25 | % | | | 0.25 | % |
Pursuant to sub-agreements with BRIL, broker-dealers and BRIL provide shareholder servicing and distribution services to the Fund. The ongoing service and/or distribution fee compensates BRIL and each broker-dealer for providing shareholder servicing and/or distribution related services to Investor A, Investor B, Investor C and Class R shareholders.
Pursuant to written agreements, certain financial intermediaries, some of which may be affiliates, provide the Fund with sub-accounting, recordkeeping, sub-transfer agency and other administrative services with respect to sub-accounts they service. For these services, these entities receive an asset-based fee or annual fee per shareholder account, which will vary depending on share class and/or net assets. For the six months ended March 31, 2015, the Fund paid the following amounts to affiliates of BlackRock in return for these services, which are included in transfer agent — class specific in the Statement of Operations:
| | | | |
Institutional | | $ | 15 | |
Investor A | | $ | 13 | |
The Manager maintains a call center, which is responsible for providing certain shareholder services to the Fund, such as responding to shareholder inquiries and processing transactions based upon instructions from shareholders with respect to the subscription and redemption of Fund shares. For the six months ended March 31, 2015, the Fund reimbursed the Manager the following amounts for costs incurred in running the call center, which are included in transfer agent — class specific in the Statement of Operations:
| | | | |
Institutional | | $ | 9,663 | |
Investor A | | $ | 13,001 | |
Investor B | | $ | 473 | |
Investor C | | $ | 2,491 | |
Class R | | $ | 18 | |
| | | | | | |
| 18 | | BLACKROCK BALANCED CAPITAL FUND, INC. | | MARCH 31, 2015 | | |
| | | | |
| Notes to Financial Statements (continued) | | | BlackRock Balanced Capital Fund, Inc. | |
For the six months ended March 31, 2015, affiliates earned underwriting discounts, direct commissions and dealer concessions on sales of the Fund’s Investor A Shares, which totaled $22,729.
For the six months ended March 31, 2015, affiliates received CDSCs as follows:
| | | | |
Investor B | | $ | 97 | |
Investor C | | $ | 4,567 | |
Certain officers and/or directors of the Fund are officers and/or directors of BlackRock or its affiliates. The Fund reimburses the Manager for a portion of the compensation paid to the Fund’s Chief Compliance Officer, which is included in officer in the Statement of Operations.
4. Income Tax Information:
It is the Fund’s policy to comply with the requirements of the Internal Revenue Code of 1986, as amended, applicable to regulated investment companies, and to distribute substantially all of its taxable income to its shareholders. Therefore, no federal income tax provision is required.
The Fund files U.S. federal and various state and local tax returns. No income tax returns are currently under examination. The statute of limitations on the Fund’s U.S. federal tax returns remains open for each of the four years ended September 30, 2014. The statutes of limitations on the Fund’s state and local tax returns may remain open for an additional year depending upon the jurisdiction.
Management has analyzed tax laws and regulations and their application to the Fund as of March 31, 2015, and does not believe there are any uncertain tax positions that require recognition of a tax liability in the Fund’s financial statements.
5. Bank Borrowings:
The Fund, along with certain other funds managed by the Manager and its affiliates (“Participating Funds”), was a party to a 364-day, $1.1 billion credit agreement with a group of lenders, under which the Fund may borrow to fund shareholder redemptions. Excluding commitments designated for a certain individual fund, the Participating Funds, including the Fund, could borrow up to an aggregate commitment amount of $650 million, subject to asset coverage and other limitations as specified in the agreement. Effective November 25, 2014, the credit agreement was amended to an aggregate commitment amount of $2.1 billion, of which the Participating Funds, including the Fund, can borrow up to $1.6 billion at any time outstanding, subject to asset coverage and other limitations as specified in the agreement. The agreement terminates on April 23, 2015, unless otherwise extended to November 24, 2015 or renewed for a period of 364 days from April 23, 2015. The amended agreement has the following terms: a fee of 0.06% per annum on unused commitment amounts and interest at a rate equal to the higher of (a) one-month LIBOR (but, in any event, not less than 0.00%) on the date the loan is made plus 0.80% per annum or (b) Fed Funds rate (but, in any event, not less than 0.00%) in effect from time to time plus 0.80% per annum on amounts borrowed. Participating Funds paid administration, legal and arrangement fees, which are included in miscellaneous expenses in the Statement of Operations, and along with commitment fees, were allocated among such funds based upon portions of the aggregate commitment available to them and relative net assets of Participating Funds. During the six months ended March 31, 2015, the Fund did not borrow under the credit agreement.
| | | | | | |
| | | BLACKROCK BALANCED CAPITAL FUND, INC. | | MARCH 31, 2015 | | 19 |
| | | | |
| Notes to Financial Statements (concluded) | | | BlackRock Balanced Capital Fund, Inc. | |
6. Capital Share Transactions:
Transactions in capital shares for each class were as follows:
| | | | | | | | | | | | | | | | | | |
| | | Six Months Ended
March 31, 2015 | | | | | Year Ended
September 30, 2014 | |
| | | Shares | | | Amount | | | | | Shares | | | Amount | |
Institutional | | | | | | | | | | | | | | | | | | |
Shares sold | | | 2,388,231 | | | $ | 60,157,358 | | | | | | 980,571 | | | $ | 25,081,312 | |
Shares issued to shareholders in reinvestment of distributions | | | 1,519,124 | | | | 36,641,250 | | | | | | 1,058,374 | | | | 25,988,038 | |
Shares redeemed | | | (1,392,312 | ) | | | (35,300,685 | ) | | | | | (1,296,288 | ) | | | (33,207,672 | ) |
| | | | | | | | | | |
Net increase | | | 2,515,043 | | | $ | 61,497,923 | | | | | | 742,657 | | | $ | 17,861,678 | |
| | | | | | | | | | |
| | | | | | | | | | | | | | | | | | |
Investor A | | | | | | | | | | | | | | | | | | |
Shares sold and automatic conversion of shares | | | 2,050,306 | | | $ | 50,892,313 | | | | | | 1,724,599 | | | $ | 43,864,042 | |
Shares issued to shareholders in reinvestment of distributions | | | 2,147,804 | | | | 51,697,578 | | | | | | 1,585,357 | | | | 38,831,120 | |
Shares redeemed | | | (1,598,916 | ) | | | (39,816,745 | ) | | | | | (2,703,341 | ) | | | (68,793,610 | ) |
| | | | | | | | | | |
Net increase | | | 2,599,194 | | | $ | 62,773,146 | | | | | | 606,615 | | | $ | 13,901,552 | |
| | | | | | | | | | |
| | | | | | | | | | | | | | | | | | |
Investor B | | | | | | | | | | | | | | | | | | |
Shares sold | | | 8,988 | | | $ | 217,497 | | | | | | 8,370 | | | $ | 206,975 | |
Shares issued to shareholders in reinvestment of distributions | | | 12,134 | | | | 284,294 | | | | | | 14,354 | | | | 341,728 | |
Shares redeemed and automatic conversion of shares | | | (39,992 | ) | | | (983,245 | ) | | | | | (80,436 | ) | | | (1,998,619 | ) |
| | | | | | | | | | |
Net decrease | | | (18,870 | ) | | $ | (481,454 | ) | | | | | (57,712 | ) | | $ | (1,449,916 | ) |
| | | | | | | | | | |
| | | | | | | | | | | | | | | | | | |
Investor C | | | | | | | | | | | | | | | | | | |
Shares sold | | | 949,623 | | | $ | 21,440,327 | | | | | | 579,939 | | | $ | 13,558,206 | |
Shares issued to shareholders in reinvestment of distributions | | | 428,262 | | | | 9,340,381 | | | | | | 262,991 | | | | 5,906,750 | |
Shares redeemed | | | (342,538 | ) | | | (7,701,673 | ) | | | | | (452,565 | ) | | | (10,607,564 | ) |
| | | | | | | | | | |
Net increase | | | 1,035,347 | | | $ | 23,079,035 | | | | | | 390,365 | | | $ | 8,857,392 | |
| | | | | | | | | | |
| | | | | | | | | | | | | | | | | | |
Class R | | | | | | | | | | | | | | | | | | |
Shares sold | | | 88,711 | | | $ | 2,075,999 | | | | | | 150,010 | | | $ | 3,643,101 | |
Shares issued to shareholders in reinvestment of distributions | | | 48,763 | | | | 1,107,910 | | | | | | 38,306 | | | | 891,000 | |
Shares redeemed | | | (77,872 | ) | | | (1,871,098 | ) | | | | | (167,052 | ) | | | (4,064,569 | ) |
| | | | | | | | | | |
Net increase | | | 59,602 | | | $ | 1,312,811 | | | | | | 21,264 | | | $ | 469,532 | |
| | | | | | | | | | | | | | | | | | | |
Total Net Increase | | | 6,190,316 | | | $ | 148,181,461 | | | | | | 1,703,189 | | | $ | 39,640,238 | |
| | | | | | | | | | |
7. Subsequent Events:
Management’s evaluation of the impact of all subsequent events on the Fund’s financial statements was completed through the date the financial statements were issued and the following items were noted:
Effective April 23, 2015, the 364-day, $2.1 billion credit agreement to which the Fund is a party, was further amended to expire on April 21, 2016, unless otherwise extended or renewed.
| | | | | | |
| 20 | | BLACKROCK BALANCED CAPITAL FUND, INC. | | MARCH 31, 2015 | | |
| | | | |
| Portfolio Information as of March 31, 2015 (Unaudited) | | | Master Large Cap Core Portfolio | |
| | |
| Ten Largest Holdings | | Percent of Long-Term Investments |
| | | | |
CVS Health Corp. | | | 3 | % |
JPMorgan Chase & Co. | | | 3 | |
Comcast Corp., Class A | | | 3 | |
Lowe’s Cos., Inc. | | | 3 | |
3M Co. | | | 3 | |
U.S. Bancorp | | | 3 | |
Bank of America Corp. | | | 2 | |
American International Group, Inc. | | | 2 | |
Aetna, Inc. | | | 2 | |
Citigroup, Inc. | | | 2 | |
| | |
| Sector Allocations | | Percent of Long-Term Investments |
| | | | |
Information Technology | | | 24 | % |
Financials | | | 19 | |
Health Care | | | 19 | |
Consumer Discretionary | | | 12 | |
Industrials | | | 10 | |
Consumer Staples | | | 7 | |
Energy | | | 7 | |
Materials | | | 2 | |
For Portfolio compliance purposes, the Portfolio’s sector classifications refer to any one or more of the sector sub-classifications used by one or more widely recognized market indexes or ratings group indexes, and/or as defined by Portfolio management. These definitions may not apply for purposes of this report, which may combine sector sub-classifications for reporting ease.
| | | | | | |
| | | BLACKROCK BALANCED CAPITAL FUND, INC. | | MARCH 31, 2015 | | 21 |
| | | | |
| Schedule of Investments March 31, 2015 (Unaudited) | | | Master Large Cap Core Portfolio | |
| | | (Percentages shown are based on Net Assets) | |
| | | | | | | | |
| Common Stocks | | Shares | | | Value | |
Aerospace & Defense — 1.2% | | | | | | | | |
Honeywell International, Inc. | | | 34,400 | | | $ | 3,588,264 | |
Raytheon Co. | | | 225,920 | | | | 24,681,760 | |
| | | | | | | | |
| | | | | | | | 28,270,024 | |
Air Freight & Logistics — 1.1% | | | | | | | | |
FedEx Corp. | | | 161,600 | | | | 26,736,720 | |
Airlines — 1.7% | | | | | | | | |
Southwest Airlines Co. | | | 372,400 | | | | 16,497,320 | |
United Continental Holdings, Inc. (a) | | | 371,700 | | | | 24,996,825 | |
| | | | | | | | |
| | | | | | | | 41,494,145 | |
Auto Components — 0.5% | | | | | | | | |
Lear Corp. | | | 118,200 | | | | 13,098,924 | |
Banks — 11.8% | | | | | | | | |
Bank of America Corp. | | | 3,758,536 | | | | 57,843,869 | |
Citigroup, Inc. | | | 1,011,418 | | | | 52,108,255 | |
JPMorgan Chase & Co. | | | 1,112,024 | | | | 67,366,414 | |
SunTrust Banks, Inc. | | | 765,640 | | | | 31,460,148 | |
U.S. Bancorp | | | 1,347,625 | | | | 58,850,784 | |
Wells Fargo & Co. | | | 209,930 | | | | 11,420,192 | |
| | | | | | | | |
| | | | | | | | 279,049,662 | |
Beverages — 2.7% | | | | | | | | |
Dr Pepper Snapple Group, Inc. | | | 491,400 | | | | 38,565,072 | |
Molson Coors Brewing Co., Class B | | | 344,300 | | | | 25,633,135 | |
| | | | | | | | |
| | | | | | | | 64,198,207 | |
Biotechnology — 1.9% | | | | | | | | |
Amgen, Inc. | | | 280,200 | | | | 44,789,970 | |
Capital Markets — 1.1% | | | | | | | | |
The Goldman Sachs Group, Inc. | | | 136,480 | | | | 25,654,146 | |
Chemicals — 0.6% | | | | | | | | |
Cabot Corp. | | | 139,874 | | | | 6,294,330 | |
The Dow Chemical Co. | | | 165,500 | | | | 7,940,690 | |
| | | | | | | | |
| | | | | | | | 14,235,020 | |
Communications Equipment — 3.2% | | | | | | | | |
Brocade Communications Systems, Inc. | | | 1,684,342 | | | | 19,984,718 | |
Cisco Systems, Inc. | | | 1,408,720 | | | | 38,775,018 | |
QUALCOMM, Inc. | | | 255,690 | | | | 17,729,545 | |
| | | | | | | | |
| | | | | | | | 76,489,281 | |
Construction & Engineering — 0.7% | | | | | | | | |
AECOM (a) | | | 558,500 | | | | 17,212,970 | |
Consumer Finance — 2.5% | | | | | | | | |
Discover Financial Services | | | 687,770 | | | | 38,755,839 | |
SLM Corp. | | | 2,106,040 | | | | 19,544,051 | |
| | | | | | | | |
| | | | | | | | 58,299,890 | |
Containers & Packaging — 0.7% | | | | | | | | |
Packaging Corp. of America | | | 218,413 | | | | 17,077,712 | |
| | | | | | | | |
| Common Stocks | | Shares | | | Value | |
Electronic Equipment, Instruments & Components — 0.6% | |
TE Connectivity Ltd. | | | 33,370 | | | $ | 2,389,959 | |
Zebra Technologies Corp., Class A (a) | | | 133,203 | | | | 12,083,510 | |
| | | | | | | | |
| | | | | | | | 14,473,469 | |
Energy Equipment & Services — 2.3% | | | | | | | | |
Atwood Oceanics, Inc. | | | 211,300 | | | | 5,939,643 | |
Halliburton Co. | | | 102,110 | | | | 4,480,587 | |
Schlumberger Ltd. | | | 443,320 | | | | 36,990,621 | |
Weatherford International PLC (a) | | | 593,890 | | | | 7,304,847 | |
| | | | | | | | |
| | | | | | | | 54,715,698 | |
Food & Staples Retailing — 4.1% | | | | | | | | |
CVS Health Corp. | | | 744,025 | | | | 76,790,820 | |
The Kroger Co. | | | 34,600 | | | | 2,652,436 | |
Wal-Mart Stores, Inc. | | | 218,040 | | | | 17,933,790 | |
| | | | | | | | |
| | | | | | | | 97,377,046 | |
Food Products — 0.4% | | | | | | | | |
Pilgrim’s Pride Corp. (b) | | | 158,300 | | | | 3,575,997 | |
Tyson Foods, Inc., Class A | | | 170,000 | | | | 6,511,000 | |
| | | | | | | | |
| | | | | | | | 10,086,997 | |
Health Care Equipment & Supplies — 0.1% | | | | | | | | |
Medtronic PLC | | | 32,140 | | | | 2,506,599 | |
Health Care Providers & Services — 11.7% | | | | | | | | |
Aetna, Inc. | | | 498,100 | | | | 53,062,593 | |
Centene Corp. (a) | | | 419,600 | | | | 29,661,524 | |
Cigna Corp. | | | 284,100 | | | | 36,773,904 | |
Express Scripts Holding Co. (a) | | | 82,500 | | | | 7,158,525 | |
Humana, Inc. | | | 112,800 | | | | 20,080,656 | |
Laboratory Corp. of America Holdings (a) | | | 214,040 | | | | 26,988,304 | |
McKesson Corp. | | | 142,525 | | | | 32,239,155 | |
UnitedHealth Group, Inc. | | | 357,500 | | | | 42,288,675 | |
Universal Health Services, Inc., Class B | | | 247,450 | | | | 29,127,339 | |
| | | | | | | | |
| | | | | | | | 277,380,675 | |
Hotels, Restaurants & Leisure — 1.7% | | | | | | | | |
Carnival Corp. | | | 576,038 | | | | 27,557,658 | |
Las Vegas Sands Corp. | | | 213,400 | | | | 11,745,536 | |
| | | | | | | | |
| | | | | | | | 39,303,194 | |
Industrial Conglomerates — 2.5% | | | | | | | | |
3M Co. | | | 357,175 | | | | 58,916,016 | |
Insurance — 3.5% | | | | | | | | |
American International Group, Inc. | | | 980,400 | | | | 53,716,116 | |
The Travelers Cos., Inc. | | | 276,730 | | | | 29,922,815 | |
| | | | | | | | |
| | | | | | | | 83,638,931 | |
Internet & Catalog Retail — 0.5% | | | | | | | | |
The Priceline Group, Inc. (a) | | | 9,420 | | | | 10,966,293 | |
| | |
| ADR | | American Depositary Receipts |
| SPDR | | Standard & Poor’s Depositary Receipts |
See Notes to Financial Statements.
| | | | | | |
| 22 | | BLACKROCK BALANCED CAPITAL FUND, INC. | | MARCH 31, 2015 | | |
| | | | |
| Schedule of Investments (continued) | | | Master Large Cap Core Portfolio | |
| | | (Percentages shown are based on Net Assets) | |
| | | | | | | | |
| Common Stocks | | Shares | | | Value | |
Internet Software & Services — 3.9% | | | | | | | | |
Facebook, Inc., Class A (a) | | | 402,100 | | | $ | 33,058,651 | |
Google, Inc., Class A (a) | | | 53,285 | | | | 29,557,190 | |
Google, Inc., Class C (a) | | | 54,445 | | | | 29,835,860 | |
| | | | | | | | |
| | | | | | | | 92,451,701 | |
IT Services — 3.9% | | | | | | | | |
Alliance Data Systems Corp. (a) | | | 15,640 | | | | 4,633,350 | |
Amdocs Ltd. | | | 310,279 | | | | 16,879,178 | |
Cognizant Technology Solutions Corp., Class A (a) | | | 165,500 | | | | 10,325,545 | |
DST Systems, Inc. | | | 46,044 | | | | 5,097,531 | |
MasterCard, Inc., Class A | | | 479,160 | | | | 41,394,632 | |
Total System Services, Inc. | | | 349,354 | | | | 13,327,855 | |
| | | | | | | | |
| | | | | | | | 91,658,091 | |
Machinery — 1.5% | | | | | | | | |
Parker Hannifin Corp. | | | 147,266 | | | | 17,492,255 | |
WABCO Holdings, Inc. (a) | | | 138,300 | | | | 16,994,304 | |
| | | | | | | | |
| | | | | | | | 34,486,559 | |
Media — 3.1% | | | | | | | | |
Comcast Corp., Class A | | | 1,136,000 | | | | 64,149,920 | |
Omnicom Group, Inc. | | | 130,500 | | | | 10,176,390 | |
| | | | | | | | |
| | | | | | | | 74,326,310 | |
Multiline Retail — 0.7% | | | | | | | | |
Macy’s, Inc. | | | 258,400 | | | | 16,772,744 | |
Multi-Utilities — 0.4% | | | | | | | | |
Public Service Enterprise Group, Inc. | | | 204,500 | | | | 8,572,640 | |
Oil, Gas & Consumable Fuels — 4.4% | | | | | | | | |
BP PLC — ADR | | | 678,410 | | | | 26,532,615 | |
Exxon Mobil Corp. | | | 90,770 | | | | 7,715,450 | |
Hess Corp. | | | 231,552 | | | | 15,715,434 | |
Marathon Petroleum Corp. | | | 110,053 | | | | 11,268,327 | |
PBF Energy, Inc., Class A | | | 176,240 | | | | 5,978,061 | |
Suncor Energy, Inc. | | | 1,014,410 | | | | 29,671,493 | |
Tesoro Corp. | | | 71,893 | | | | 6,563,112 | |
| | | | | | | | |
| | | | | | | | 103,444,492 | |
Paper & Forest Products — 0.7% | | | | | | | | |
Domtar Corp. | | | 360,100 | | | | 16,643,822 | |
Pharmaceuticals — 4.7% | | | | | | | | |
AstraZeneca PLC — ADR | | | 348,800 | | | | 23,868,384 | |
Johnson & Johnson | | | 80,095 | | | | 8,057,557 | |
Merck & Co., Inc. | | | 103,243 | | | | 5,934,408 | |
Pfizer, Inc. | | | 72,690 | | | | 2,528,885 | |
Shire PLC — ADR | | | 95,400 | | | | 22,828,266 | |
Teva Pharmaceutical Industries Ltd. — ADR | | | 767,036 | | | | 47,786,343 | |
| | | | | | | | |
| | | | | | | | 111,003,843 | |
Road & Rail — 0.9% | | | | | | | | |
Norfolk Southern Corp. | | | 146,700 | | | | 15,098,364 | |
Union Pacific Corp. | | | 60,700 | | | | 6,574,417 | |
| | | | | | | | |
| | | | | | | | 21,672,781 | |
Semiconductors & Semiconductor Equipment — 4.1% | | | | | |
Intel Corp. | | | 1,467,970 | | | | 45,903,422 | |
Micron Technology, Inc. (a) | | | 1,538,870 | | | | 41,749,543 | |
NVIDIA Corp. | | | 479,900 | | | | 10,041,907 | |
| | | | | | | | |
| | | | | | | | 97,694,872 | |
Software — 2.1% | | | | | | | | |
Microsoft Corp. | | | 754,940 | | | | 30,692,086 | |
Oracle Corp. | | | 459,450 | | | | 19,825,267 | |
| | | | | | | | |
| | | | | | | | 50,517,353 | |
| | | | | | | | |
| Common Stocks | | Shares | | | Value | |
Specialty Retail — 5.0% | | | | | | | | |
The Home Depot, Inc. | | | 330,800 | | | $ | 37,582,188 | |
Lowe’s Cos., Inc. | | | 840,800 | | | | 62,547,112 | |
Ross Stores, Inc. | | | 187,139 | | | | 19,716,965 | |
| | | | | | | | |
| | | | | | | | 119,846,265 | |
Technology Hardware, Storage & Peripherals — 5.4% | | | | | |
Apple Inc. | | | 270,870 | | | | 33,704,354 | |
EMC Corp. | | | 1,216,070 | | | | 31,082,749 | |
Hewlett-Packard Co. | | | 751,966 | | | | 23,431,261 | |
Western Digital Corp. | | | 449,110 | | | | 40,873,501 | |
| | | | | | | | |
| | | | | | | | 129,091,865 | |
Textiles, Apparel & Luxury Goods — 0.6% | | | | | | | | |
Deckers Outdoor Corp. (a) | | | 62,500 | | | | 4,554,375 | |
Fossil Group, Inc. (a) | | | 105,300 | | | | 8,681,985 | |
| | | | | | | | |
| | | | | | | | 13,236,360 | |
Total Common Stocks — 98.5% | | | | | | | 2,337,391,287 | |
| | | | | | | | |
| Investment Companies — 0.1% | | | | | | |
Utilities Select Sector SPDR Fund | | | 81,300 | | | | 3,612,159 | |
Total Long-Term Investments
(Cost — $1,761,376,729) — 98.6% | | | | 2,341,003,446 | |
| | | | | | | | |
| Short-Term Securities | | | | | | |
BlackRock Liquidity Funds, TempFund, Institutional Class, 0.06% (c)(d) | | | 25,332,154 | | | | 25,332,154 | |
| | | Beneficial
Interest
(000) | | | | |
BlackRock Liquidity Series, LLC, Money Market Series, 0.22% (c)(d)(e) | | $ | 2,699 | | | | 2,698,794 | |
Total Short-Term Securities
(Cost — $28,030,948) — 1.2% | | | | 28,030,948 | |
Total Investments (Cost — $1,789,407,677) — 99.8% | | | | 2,369,034,394 | |
Other Assets Less Liabilities — 0.2% | | | | 4,076,177 | |
| | | | | | | | |
Net Assets — 100.0% | | | | | | $ | 2,373,110,571 | |
| | | | | | | | |
See Notes to Financial Statements.
| | | | | | |
| | | BLACKROCK BALANCED CAPITAL FUND, INC. | | MARCH 31, 2015 | | 23 |
| | | | |
| Schedule of Investments (concluded) | | | Master Large Cap Core Portfolio | |
|
| Notes to Schedule of Investments |
| (a) | Non-income producing security. |
| (b) | Security, or a portion of security, is on loan. |
| (c) | During the six months ended March 31, 2015, investments in issuers considered to be affiliates of the Portfolio for purposes of Section 2(a)(3) of the Investment Company Act of 1940, as amended, were as follows: |
| | | | | | | | | | | | | | | | | | | | |
| Affiliate | | Shares/Beneficial
Interest Held at
September 30, 2014 | | | Net Activity | | | Shares/Beneficial
Interest Held at
March 31, 2015 | | | Income | | | Realized
Gain | |
BlackRock Liquidity Funds, TempFund, Institutional Class | | | 11,267,596 | | | | 14,064,558 | | | | 25,332,154 | | | $ | 13,477 | | | $ | 6,359 | |
BlackRock Liquidity Series, LLC, Money Market Series | | | — | | | $ | 2,698,794 | | | $ | 2,698,794 | | | $ | 10,580 | | | | — | |
| (d) | Represents the current yield as of report date. |
| (e) | Security was purchased with the cash collateral from loaned securities. The Portfolio may withdraw up to 25% of its investment daily, although the manager of the BlackRock Liquidity Series, LLC, Money Market Series, in its sole discretion, may permit an investor to withdraw more than 25% on any one day. |
| • | | For Portfolio compliance purposes, the Portfolio’s industry classifications refer to any one or more of the industry sub-classifications used by one or more widely recognized market indexes or ratings group indexes, and/or as defined by the investment advisor. These definitions may not apply for purposes of this report, which may combine such industry sub-classifications for reporting ease. |
| • | | Fair Value Measurements — Various inputs are used in determining the fair value of investments. These inputs to valuation techniques are categorized into a disclosure hierarchy consisting of three broad levels for financial statement purposes. The hierarchy gives the highest priority to unadjusted quoted prices in active markets for identical assets or liabilities (Level 1 measurements) and the lowest priority to unobservable inputs (Level 3 measurements). Accordingly, the degree of judgment exercised in determining fair value is greatest for instruments categorized in Level 3. The inputs used to measure fair value may fall into different levels of the fair value hierarchy. In such cases, for disclosure purposes, the fair value hierarchy classification is determined based on the lowest level input that is significant to the fair value measurement in its entirety. The categorization of a value determined for investments is based on the pricing transparency of the investment and is not necessarily an indication of the risks associated with investing in those securities. The three levels of the fair value hierarchy are as follows: |
| | • | | Level 1 — unadjusted quoted prices in active markets/exchanges for identical assets or liabilities that the Portfolio has the ability to access |
| | • | | Level 2 — other observable inputs (including, but not limited to, quoted prices for similar assets or liabilities in markets that are active, quoted prices for identical or similar assets or liabilities in markets that are not active, inputs other than quoted prices that are observable for the assets or liabilities (such as interest rates, yield curves, volatilities, prepayment speeds, loss severities, credit risks and default rates) or other market–corroborated inputs) |
| | • | | Level 3 — unobservable inputs based on the best information available in the circumstances, to the extent observable inputs are not available (including the Portfolio’s own assumptions used in determining the fair value of investments) |
Changes in valuation techniques may result in transfers into or out of an assigned level within the disclosure hierarchy. In accordance with the Portfolio’s policy, transfers between different levels of the fair value disclosure hierarchy are deemed to have occurred as of the beginning of the reporting period. For information about the Portfolio’s policy regarding valuation of investments, refer to Note 2 of the Notes to Financial Statements.
As of March 31, 2015, the following table summarizes the Portfolio’s investments categorized in the disclosure hierarchy:
| | | | | | | | | | | | | | |
| | | Level 1 | | | Level 2 | | | Level 3 | | Total | |
Assets: | | | | | | | | | | | | | | |
Investments: | | | | | | | | | | | | | | |
Long-Term Investments: | | | | | | | | | | | | | | |
Common Stocks1 | | $ | 2,337,391,287 | | | | — | | | — | | $ | 2,337,391,287 | |
Investment Companies | | | 3,612,159 | | | | — | | | — | | | 3,612,159 | |
Short-Term Securities | | | 25,332,154 | | | $ | 2,698,794 | | | — | | | 28,030,948 | |
| | | | |
Total | | $ | 2,366,335,600 | | | $ | 2,698,794 | | | — | | $ | 2,369,034,394 | |
| | | | |
| | 1 | | See above Schedule of Investments for values in each industry. |
The Portfolio may hold liabilities in which the fair value approximates the carrying amount for financial statement purposes. As of March 31, 2015, collateral on securities loaned at value of $2,698,794 is categorized as Level 2 within the disclosure hierarchy.
During the six months ended March 31, 2015, there were no transfers between levels.
See Notes to Financial Statements.
| | | | | | |
| 24 | | BLACKROCK BALANCED CAPITAL FUND, INC. | | MARCH 31, 2015 | | |
| | | | |
| Statement of Assets and Liabilities | | | Master Large Cap Core Portfolio | |
| | | | |
| March 31, 2015 (Unaudited) | | | |
| | | | |
| Assets | | | | |
Investments at value — unaffiliated (including securities loaned at value of $2,556,217) (cost — $1,761,376,729) | | $ | 2,341,003,446 | |
Investments at value — affiliated (cost — $28,030,948) | | | 28,030,948 | |
Investments sold receivable | | | 5,832,425 | |
Contributions receivable from investors | | | 1,723,734 | |
Dividends receivable — unaffiliated | | | 3,074,189 | |
Securities lending income receivable — affiliated | | | 6,185 | |
Dividends receivable — affiliated | | | 2,211 | |
Prepaid expenses | | | 8,664 | |
| | | | |
Total assets | | | 2,379,681,802 | |
| | | | |
| | | | |
| Liabilities | | | | |
Collateral on securities loaned at value | | | 2,698,794 | |
Withdrawals payable to investors | | | 2,800,189 | |
Investment advisory fees payable | | | 956,450 | |
Directors’ fees payable | | | 14,955 | |
Other affiliates payable | | | 11,724 | |
Other accrued expenses payable | | | 89,119 | |
| | | | |
Total liabilities | | | 6,571,231 | |
| | | | |
Net Assets | | $ | 2,373,110,571 | |
| | | | |
| | | | |
| Net Assets Consist of | | | | |
Investors’ capital | | $ | 1,793,483,854 | |
Net unrealized appreciation/depreciation | | | 579,626,717 | |
| | | | |
Net Assets | | $ | 2,373,110,571 | |
| | | | |
See Notes to Financial Statements.
| | | | | | |
| | | BLACKROCK BALANCED CAPITAL FUND, INC. | | MARCH 31, 2015 | | 25 |
| | | | |
| Statement of Operations | | | Master Large Cap Core Portfolio | |
| | | | |
| Six Months Ended March 31, 2015 (Unaudited) | | | |
| | | | |
| Investment Income | |
Dividends — unaffiliated | | $ | 19,571,853 | |
Dividends — affiliated | | | 13,477 | |
Securities lending — affiliated — net | | | 10,580 | |
Foreign taxes withheld | | | (166,414 | ) |
| | | | |
Total income | | | 19,429,496 | |
| | | | |
| | | | |
| Expenses | | | | |
Investment advisory | | | 5,632,982 | |
Accounting services | | | 210,438 | |
Professional | | | 36,902 | |
Directors | | | 34,924 | |
Custodian | | | 34,458 | |
Printing | | | 1,095 | |
Miscellaneous | | | 14,813 | |
| | | | |
Total expenses | | | 5,965,612 | |
Less fees waived by the Manager | | | (19,973 | ) |
| | | | |
Total expenses after fees waived | | | 5,945,639 | |
| | | | |
Net investment income | | | 13,483,857 | |
| | | | |
| | | | |
| Realized and Unrealized Gain | | | | |
Net realized gain (loss) from: | | | | |
Investments | | | 96,916,681 | |
Capital gain distributions received from affiliated investment companies | | | 6,359 | |
| | | | |
| | | 96,923,040 | |
| | | | |
Net change in unrealized appreciation/depreciation on investments | | | 24,169,516 | |
| | | | |
Total realized and unrealized gain | | | 121,092,556 | |
| | | | |
Net Increase in Net Assets Resulting from Operations | | $ | 134,576,413 | |
| | | | |
See Notes to Financial Statements.
| | | | | | |
| 26 | | BLACKROCK BALANCED CAPITAL FUND, INC. | | MARCH 31, 2015 | | |
| | | | |
| Statements of Changes in Net Assets | | | Master Large Cap Core Portfolio | |
| | | | | | | | |
| Increase (Decrease) in Net Assets: | | Six Months Ended March 31, 2014 (Unaudited) | | | Year Ended
September 30, 2014 | |
| | | | | | | | |
| Operations | | | | | | | | |
Net investment income | | $ | 13,483,857 | | | $ | 25,125,980 | |
Net realized gain | | | 96,923,040 | | | | 363,322,933 | |
Net change in unrealized appreciation/depreciation | | | 24,169,516 | | | | 28,704,584 | |
| | | | |
Net increase in net assets resulting from operations | | | 134,576,413 | | | | 417,153,497 | |
| | | | |
| | | | | | | | |
| Capital Transactions | | | | | | | | |
Proceeds from contributions | | | 133,313,097 | | | | 155,850,428 | |
Value of withdrawals | | | (230,282,109 | ) | | | (546,397,150 | ) |
| | | | |
Net decrease in net assets derived from capital transactions | | | (96,969,012 | ) | | | (390,546,722 | ) |
| | | | |
| | | | | | | | |
| Net Assets | | | | | | | | |
Total increase in net assets | | | 37,607,401 | | | | 26,606,775 | |
Beginning of period | | | 2,335,503,170 | | | | 2,308,896,395 | |
| | | | |
End of period | | $ | 2,373,110,571 | | | $ | 2,335,503,170 | |
| | | | |
See Notes to Financial Statements.
| | | | | | |
| | | BLACKROCK BALANCED CAPITAL FUND, INC. | | MARCH 31, 2015 | | 27 |
| | | | |
| Financial Highlights | | | Master Large Cap Core Portfolio | |
| | | | | | | | | | | | | | | | | | | | | | | | |
| | | Six Months
Ended
March 31,
2015 (Unaudited) | | | Year Ended September 30, | |
| | | | 2014 | | | 2013 | | | 2012 | | | 2011 | | | 2010 | |
| Total Return | | | | | | | | | | | | | | | | | | | | | | | | |
Total return | | | 5.59 | %1 | | | 19.44 | % | | | 20.39 | % | | | 29.97 | % | | | (1.61 | )% | | | 6.16 | % |
| | | | |
| | | | | | | | | | | | | | | | | | | | | | | | |
| Ratios to Average Net Assets | | | | | | | | | | | | | | | | | | | | | | | | |
Total expenses | | | 0.50 | %2 | | | 0.50 | % | | | 0.50 | % | | | 0.50 | % | | | 0.49 | % | | | 0.49 | % |
| | | | |
Total expenses after fees waived | | | 0.50 | %2 | | | 0.50 | % | | | 0.50 | % | | | 0.50 | % | | | 0.49 | % | | | 0.49 | % |
| | | | |
Net investment income | | | 1.13 | %2 | | | 1.08 | % | | | 1.29 | % | | | 1.67 | % | | | 1.13 | % | | | 1.11 | % |
| | | | |
| | | | | | | | | | | | | | | | | | | | | | | | |
| Supplemental Data | | | | | | | | | | | | | | | | | | | | | | | | |
Net assets, end of period (000) | | $ | 2,373,111 | | | $ | 2,335,503 | | | $ | 2,308,896 | | | $ | 2,318,851 | | | $ | 2,306,714 | | | $ | 3,209,486 | |
| | | | |
Portfolio turnover rate | | | 23 | % | | | 40 | % | | | 50 | % | | | 128 | % | | | 129 | % | | | 173 | % |
| | | | |
| | 1 | | Aggregate total return. |
See Notes to Financial Statements.
| | | | | | |
| 28 | | BLACKROCK BALANCED CAPITAL FUND, INC. | | MARCH 31, 2015 | | |
| | | | |
| Notes to Financial Statements (Unaudited) | | | Master Large Cap Core Portfolio | |
1. Organization:
Master Large Cap Core Portfolio (the “Portfolio”) is a series of Master Large Cap Series LLC (the “Master LLC”). The Master LLC is registered under the Investment Company Act of 1940, as amended (the “1940 Act”), as an open-end management investment company and is organized as a Delaware limited liability company. The Portfolio is classified as diversified. The Limited Liability Company Agreement of the Master LLC permits the Board of Directors of the Master LLC (the “Board”) to issue non-transferable interests in the Master LLC, subject to certain limitations.
The Portfolio, together with certain other registered investment companies advised by BlackRock Advisors, LLC (the “Manager”) or its affiliates, is included in a complex of open-end funds referred to as the Equity-Liquidity Complex.
2. Significant Accounting Policies:
The Portfolio’s financial statements are prepared in conformity with accounting principles generally accepted in the United States of America (“U.S. GAAP”), which may require management to make estimates and assumptions that affect the reported amounts of assets and liabilities in the financial statements and the reported amount of increases and decreases in net assets from operations during the reporting period. Actual results could differ from those estimates. The Portfolio is considered an investment company under U.S. GAAP and follows the accounting and reporting guidance applicable to investment companies. The following is a summary of significant accounting policies followed by the Portfolio:
Valuation: The Portfolio’s investments are valued at fair value as of the close of trading on the New York Stock Exchange (“NYSE”) (generally 4:00 p.m., Eastern time). U.S. GAAP defines fair value as the price the Portfolio would receive to sell an asset or pay to transfer a liability in an orderly transaction between market participants at the measurement date. The Portfolio determines the fair value of its financial instruments at market value using independent dealers or pricing services under policies approved by the Board. The BlackRock Global Valuation Methodologies Committee (the “Global Valuation Committee”) is the committee formed by management to develop global pricing policies and procedures and to provide oversight of the pricing function for the Portfolio for all financial instruments.
Equity investments traded on a recognized securities exchange are valued at the official close price each day, if available. For equity investments traded on more than one exchange, the official close price on the exchange where the stock is primarily traded is used. Equity investments traded on a recognized exchange for which there were no sales on that day may be valued at the last available bid (long positions) or ask (short positions) price. Investments in open-end registered investment companies are valued at NAV each business day.
The Portfolio values its investment in BlackRock Liquidity Series, LLC, Money Market Series (the “Money Market Series”) at fair value, which is ordinarily based upon its pro rata ownership in the underlying fund’s net assets. The Money Market Series seeks current income consistent with maintaining liquidity and preserving capital. Although the Money Market Series is not registered under the 1940 Act, its investments will follow the parameters of investments by a money market fund that is subject to Rule 2a-7 under the 1940 Act. The Portfolio may withdraw up to 25% of its investment daily, although the Manager of the Money Market Series, in its sole discretion, may permit an investor to withdraw more than 25% on any one day.
In the event that the application of these methods of valuation results in a price for an investment which is deemed not to be representative of the market value of such investment, or if a price is not available, the investment will be valued by the Global Valuation Committee, or its delegate, in accordance with a policy approved by the Board as reflecting fair value (“Fair Value Investments”). When determining the price for Fair Value Investments, the Global Valuation Committee, or its delegate, seeks to determine the price that the Portfolio might reasonably expect to receive or pay from the current sale or purchase of that asset or liability in an arm’s-length transaction. Fair value determinations shall be based upon all available factors that the Global Valuation Committee, or its delegate, deems relevant consistent with the principles of fair value measurement. The pricing of all Fair Value Investments is subsequently reported to the Board or a committee thereof on a quarterly basis.
Investment Transactions and Investment Income: For financial reporting purposes, investment transactions are recorded on the dates the transactions are entered into (the trade dates). Realized gains and losses on investment transactions are determined on the identified cost basis. Dividend income is recorded on the ex-dividend dates. Dividends from foreign securities where the ex-dividend date may have passed are subsequently recorded when the Portfolio is informed of the ex-dividend date. Under the applicable foreign tax laws, a withholding tax at various rates may be imposed on capital gains, dividends and interest. Upon notification from issuers, some of the dividend income received from a real estate investment trust may be redesignated as a reduction of cost of the related investment and/or realized gain.
Recent Accounting Standard: In June 2014, the Financial Accounting Standards Board issued guidance to improve the financial reporting of reverse repurchase agreements and other similar transactions. The guidance will require expanded disclosure for entities that enter into reverse repurchase agreements and similar transactions accounted for as secured borrowings. It is effective for financial statements with fiscal years beginning on or after December 15, 2014 and for interim periods beginning after March 31, 2015. Management is evaluating the impact, if any, of this guidance on the Portfolio’s financial statement disclosures.
Other: Expenses directly related to the Portfolio are charged to the Portfolio. Other operating expenses shared by several funds are prorated among those funds on the basis of relative net assets or other appropriate methods.
| | | | | | |
| | | BLACKROCK BALANCED CAPITAL FUND, INC. | | MARCH 31, 2015 | | 29 |
| | | | |
| Notes to Financial Statements (continued) | | | Master Large Cap Core Portfolio | |
The Portfolio has an arrangement with its custodian whereby fees may be reduced by credits earned on uninvested cash balances, which, if applicable, are shown as fees paid indirectly in the Statement of Operations. The custodian imposes fees on overdrawn cash balances, which can be offset by accumulated credits earned or may result in additional custody charges.
3. Securities and Other Investments:
Securities Lending: The Portfolio may lend its securities to approved borrowers, such as brokers, dealers and other financial institutions. The borrower pledges and maintains with the Portfolio collateral consisting of cash, an irrevocable letter of credit issued by a bank, or securities issued or guaranteed by the U.S. Government. The initial collateral received by the Portfolio is required to have a value of at least 102% of the current value of the loaned securities for securities traded on U.S. exchanges and a value of at least 105% for all other securities. The collateral is maintained thereafter at a value equal to at least 100% of the current market value of the securities on loan. The market value of the loaned securities is determined at the close of each business day of the Portfolio and any additional required collateral is delivered to the Portfolio on the next business day. During the term of the loan, the Portfolio is entitled to all distributions made on or in respect of the loaned securities. Loans of securities are terminable at any time and the borrower, after notice, is required to return borrowed securities within the standard time period for settlement of securities transactions.
The market value of securities on loan and the value of the related collateral are shown separately in the Statement of Assets and Liabilities as a component of investments at value — unaffiliated, and collateral on securities loaned at value, respectively. As of March 31, 2015, any securities on loan were collateralized by cash. The cash collateral invested by the securities lending agent, BlackRock Investment Management, LLC (“BIM”), if any, is disclosed in the Schedule of Investments.
Securities lending transactions are entered into by the Portfolio under Master Securities Lending Agreement (the “MSLA”) which provide the right, in the event of default (including bankruptcy or insolvency), for the non-defaulting party to liquidate the collateral and calculate a net exposure to the defaulting party or request additional collateral. In the event that a borrower defaults, the Portfolio, as lender, would offset the market value of the collateral received against the market value of the securities loaned. When the value of the collateral is greater than that of the market value of the securities loaned, the lender is left with a net amount payable to the defaulting party. However, bankruptcy or insolvency laws of a particular jurisdiction may impose restrictions on or prohibitions against such a right of offset in the event of an MSLA counterparty’s bankruptcy or insolvency. Under the MSLA, the borrower can resell or re-pledge the loaned securities, and the Portfolio can reinvest cash collateral, or, upon an event of default, resell or re-pledge the collateral.
As of March 31, 2015, the following table is a summary of the Portfolio’s securities lending agreements by counterparty, which are subject to offset under an MSLA:
| | | | | | | | | | |
| | | Securities
Loaned
at Value | | | Cash Collateral
Received1 | | | Net Amount |
Master Large Cap Core Portfolio | | | | | | | | | | |
Counterparty | | | | | | | | | | |
Citigroup Global Markets, Inc. | | $ | 2,556,217 | | | $ | (2,556,217 | ) | | — |
| | | |
| | 1 | | Collateral with a value of $2,698,794 has been received in connection with securities lending agreements. Collateral received in excess of the value of securities loaned from the individual counterparty is not shown for financial reporting purposes. |
The risks of securities lending include the risk that the borrower may not provide additional collateral when required or may not return the securities when due. To mitigate these risks, the Portfolio benefits from a borrower default indemnity provided by BIM. BIM’s indemnity allows for full replacement of the securities loaned if the collateral received does not cover the value on the securities loaned in the event of borrower default. The Portfolio could suffer a loss if the value of an investment purchased with cash collateral falls below the market value of loaned securities or if the value of an investment purchased with cash collateral falls below the value of the original cash collateral received.
4. Investment Advisory Agreement and Other Transactions with Affiliates:
The PNC Financial Services Group, Inc. is the largest stockholder and an affiliate of BlackRock, Inc. (“BlackRock”) for 1940 Act purposes.
The Master LLC, on behalf of the Portfolio, entered into an Investment Advisory Agreement with the Manager, the Portfolio’s investment advisor, an indirect, wholly owned subsidiary of BlackRock, to provide investment advisory and administration services. The Manager is responsible for the management of the Portfolio and provides the necessary personnel, facilities, equipment and certain other services to the operations of the Portfolio. For such services, the Portfolio pays the Manager a monthly fee based on a percentage of the Portfolio’s average daily net assets at the following annual rates:
| | | | | | |
| 30 | | BLACKROCK BALANCED CAPITAL FUND, INC. | | MARCH 31, 2015 | | |
| | | | |
| Notes to Financial Statements (continued) | | | Master Large Cap Core Portfolio | |
| | | | |
| Average Daily Net Assets | | Investment
Advisory Fee | |
Not exceeding $1 Billion | | | 0.50 | % |
In excess of $1 Billion, but not exceeding $5 Billion | | | 0.45 | % |
In excess of $5 Billion | | | 0.40 | % |
The Manager voluntarily agreed to waive its investment advisory fees by the amount of investment advisory fees the Portfolio pays to the Manager indirectly through its investment in affiliated money market funds. However, the Manager does not waive its investment advisory fees by the amount of investment advisory fees paid in connection with the Portfolio’s investment in other affiliated investment companies, if any. This amount is shown as fees waived by the Manager in the Statement of Operations.
For the six months ended March 31, 2015, the Portfolio reimbursed the Manager $11,802 for certain accounting services, which are included in accounting services in the Statement of Operations.
The U.S. Securities and Exchange Commission has issued an exemptive order which permits BIM, an affiliate of the Manager, to serve as securities lending agent for the Portfolio, subject to applicable conditions. As securities lending agent, BIM bears all operational costs directly related to securities lending. The Portfolio is responsible for expenses in connection with the investment of cash collateral received for securities on loan (the “collateral investment expenses”). The cash collateral is invested in a private investment company managed by the Manager or its affiliates. However, BIM has agreed to cap the collateral investment expenses of the private investment company to an annual rate of 0.04%. The investment advisor to the private investment company will not charge any advisory fees with respect to shares purchased by the Portfolio.
Securities lending income is equal to the total of income earned from the reinvestment of cash collateral, net of fees and other payments to and from borrowers of securities, and less the collateral investment expenses. The Portfolio retains a portion of securities lending income and remits a remaining portion to BIM as compensation for its services as securities lending agent. Pursuant to a securities lending agreement, BIM may lend securities only when the difference between the borrower rebate rate and the risk free rate exceeds a certain level (such securities, the “specials only securities”).
Pursuant to such agreement, the Portfolio retains 80% of securities lending income. In addition, commencing the business day following the date that the aggregate securities lending income earned across certain funds in the Equity-Liquidity Complex in a calendar year exceeds a specified threshold, the Portfolio, pursuant to the securities lending agreement, will retain for the remainder of the calendar year securities lending income in an amount equal to 85% of securities lending income.
The share of securities lending income earned by the Portfolio is shown as securities lending — affiliated — net in the Statement of Operations. For the six months ended March 31, 2015, the Portfolio paid BIM $2,645 for securities lending agent services.
Certain officers and/or directors of the Master LLC are officers and/or directors of BlackRock or its affiliates.
The Portfolio may purchase securities from, or sell securities to, an affiliated fund provided the affiliation is due solely to having a common investment advisor, common officers, or common trustees. For the six months ended March 31, 2015, the sale transactions with an affiliated fund in compliance with Rule 17a-7 under the 1940 Act were $12,220,775.
5. Purchases and Sales:
Purchases and sales of investments, excluding short-term securities, for the six months ended March 31, 2015, were $537,653,919 and $638,573,778, respectively.
6. Income Tax Information
The Portfolio is classified as a partnership for federal income tax purposes. As such, each investor in the Portfolio is treated as the owner of its proportionate share of net assets, income, expenses and realized and unrealized gains and losses of the Portfolio. Therefore, no federal income tax provision is required. It is intended that the Portfolio’s assets will be managed so an investor in the Portfolio can satisfy the requirements of Subchapter M of the Internal Revenue Code of 1986, as amended.
The Portfolio files U.S. federal and various state and local tax returns. No income tax returns are currently under examination. The statute of limitations on the Portfolio’s U.S. federal tax returns remains open for each of the four years ended September 30, 2014. The statutes of limitations on the Portfolio’s state and local tax returns may remain open for an additional year depending upon the jurisdiction.
Management has analyzed tax laws and regulations and their application to the Portfolio as of March 31, 2015, inclusive of the open tax return years and does not believe that there are any uncertain tax positions that require recognition of a tax liability in the Portfolio’s financial statements.
| | | | | | |
| | | BLACKROCK BALANCED CAPITAL FUND, INC. | | MARCH 31, 2015 | | 31 |
| | | | |
| Notes to Financial Statements (concluded) | | | Master Large Cap Core Portfolio | |
As of March 31, 2015, gross unrealized appreciation and depreciation based on cost for federal income tax purposes were as follows:
| | | | |
Tax cost | | $ | 1,793,001,400 | |
| | | | |
Gross unrealized appreciation | | $ | 619,590,193 | |
Gross unrealized depreciation | | | (43,557,199 | ) |
| | | | |
Net unrealized appreciation | | $ | 576,032,994 | |
7. Bank Borrowings:
The Master LLC, on behalf of the Portfolio, along with certain other funds managed by the Manager and its affiliates (“Participating Funds”), was a party to a 364-day, $1.1 billion credit agreement with a group of lenders, under which the Portfolio may borrow to fund shareholder redemptions. Excluding commitments designated for a certain individual fund, the Participating Funds, including the Portfolio, could borrow up to an aggregate commitment amount of $650 million, subject to asset coverage and other limitations as specified in the agreement. Effective November 25, 2014, the credit agreement was amended to an aggregate commitment amount of $2.1 billion, of which the Participating Funds, including the Fund, can borrow up to $1.6 billion at any time outstanding, subject to asset coverage and other limitations as specified in the agreement. The agreement terminates on April 23, 2015, unless otherwise extended to November 24, 2015 or renewed for a period of 364 days from April 23, 2015. The amended agreement has the following terms: a fee of 0.06% per annum on unused commitment amounts and interest at a rate equal to the higher of (a) one-month LIBOR (but, in any event, not less than 0.00%) on the date the loan is made plus 0.80% per annum or (b) the Fed Funds rate (but, in any event, not less than 0.00%) in effect from time to time plus 0.80% per annum on amounts borrowed. Participating Funds paid administration, legal and arrangement fees, which are included in miscellaneous expenses in the Statement of Operations, and along with commitment fees, were allocated among such funds based upon portions of the aggregate commitment available to them and relative net assets of Participating Funds. During the six months ended March 31, 2015, the Portfolio did not borrow under the credit agreement.
8. Principal Risks:
In the normal course of business, the Portfolio invests in securities and enters into transactions where risks exist due to fluctuations in the market (market risk) or failure of the issuer of a security to meet all its obligations (issuer credit risk). The value of securities held by the Portfolio may decline in response to certain events, including those directly involving the issuers whose securities are owned by the Portfolio; conditions affecting the general economy; overall market changes; local, regional or global political, social or economic instability; and currency, interest rate and price fluctuations. Similar to issuer credit risk, the Portfolio may be exposed to counterparty credit risk, or the risk that an entity with which the Portfolio has unsettled or open transactions may fail to or be unable to perform on its commitments. The Portfolio manages counterparty credit risk by entering into transactions only with counterparties that it believes have the financial resources to honor their obligations and by monitoring the financial stability of those counterparties. Financial assets, which potentially expose the Portfolio to market, issuer and counterparty credit risks, consist principally of financial instruments and receivables due from counterparties. The extent of the Portfolio’s exposure to market, issuer and counterparty credit risks with respect to these financial assets is generally approximated by their value recorded in the Statement of Assets and Liabilities, less any collateral held by the Portfolio.
As of March 31, 2015, the Portfolio invested a significant portion of its assets in securities in the Information Technology sector. Changes in economic conditions affecting such sector would have a greater impact on the Portfolio and could affect the value, income and/or liquidity of positions in such securities.
9. Subsequent Events:
Management’s evaluation of the impact of all subsequent events on the Portfolio’s financial statements was completed through the date the financial statements were issued and the following item was noted:
Effective April 23, 2015, the 364-day, $2.1 billion credit agreement to which the Master LLC is a party, was further amended to expire on April 21, 2016, unless otherwise extended or renewed.
| | | | | | |
| 32 | | BLACKROCK BALANCED CAPITAL FUND, INC. | | MARCH 31, 2015 | | |
| | | | |
| Master Portfolio Information | | | Master Total Return Portfolio | |
| | |
| Portfolio Composition | | Percent of Long-Term Investments |
| | | | |
U.S. Government Sponsored Agency Securities | | | 44 | % |
U.S. Treasury Obligations | | | 18 | |
Corporate Bonds | | | 18 | |
Asset-Backed Securities | | | 8 | |
Non-Agency Mortgage-Backed Securities | | | 5 | |
Taxable Municipal Bonds | | | 3 | |
Foreign Government Obligations | | | 2 | |
Preferred Securities | | | 1 | |
Floating Rate Loan Interests | | | 1 | |
| | |
Credit Quality Allocation1 | | Percent of Long-Term Investments |
| | | | |
AAA/Aaa2 | | | 68 | % |
AA/Aa | | | 4 | |
A | | | 9 | |
BBB/Baa | | | 8 | |
BB/Ba | | | 3 | |
B | | | 2 | |
CCC/Caa | | | 1 | |
CC/Ca | | | 1 | |
N/R | | | 4 | |
| | 1 | | For financial reporting purposes, credit quality ratings shown above reflect the highest rating assigned by either Standard & Poor’s (“S&P”) or Moody’s Investors Service (“Moody’s”) if ratings differ. These rating agencies are independent, nationally recognized statistical rating organizations and are widely used. Investment grade ratings are credit ratings of BBB/Baa or higher. Below investment grade ratings are credit ratings of BB/Ba or lower. Investments designated N/R are not rated by either rating agency. Unrated investments do not necessarily indicate low credit quality. Credit quality ratings are subject to change. |
| | 2 | | The investment advisor evaluates the credit quality of not-rated investments based upon certain factors including, but not limited to, credit ratings for similar investments and financial analysis of sectors, individual investments and/or issuers. Using this approach, the investment advisor has deemed U.S. Government Sponsored Agency Securities and U.S. Treasury Obligations as AAA/Aaa. |
| | | | | | |
| | | BLACKROCK BALANCED CAPITAL FUND, INC. | | MARCH 31, 2015 | | 33 |
| | | | |
| Consolidated Schedule of Investments March 31, 2015 (Unaudited) | | | Master Total Return Portfolio | |
| | | (Percentages shown are based on Net Assets) | |
| | | | | | | | | | | | |
| Asset-Backed Securities | | | | | Par (000) | | | Value | |
ACE Securities Corp. Home Equity Loan Trust: | | | | | | | | | | | | |
Series 2003-OP1, Class A2,
0.89%, 12/25/33 (a) | | | USD | | | | 581 | | | $ | 525,894 | |
Series 2006-CW1, Class A2C,
0.31%, 7/25/36 (a) | | | | | | | 1,328 | | | | 977,346 | |
Series 2006-CW1, Class A2D,
0.43%, 7/25/36 (a) | | | | | | | 13,114 | | | | 7,507,037 | |
ALM V Ltd., Series 2012-5A, Class A1R, 1.49%, 2/13/23 (a)(b) | | | | | | | 3,400 | | | | 3,395,639 | |
ALM VII R Ltd., Series 2013-7RA, Class A2, 2.11%, 4/24/24 (a)(b) | | | | | | | 2,253 | | | | 2,248,012 | |
ALM VII R-2 Ltd., Series 2013-7R2A, Class A2, 2.11%, 4/24/24 (a)(b) | | | | | | | 3,187 | | | | 3,179,941 | |
ALME Loan Funding II Ltd.: | | | | | | | | | | | | |
Series 2X, Class A, 1.48%, 8/15/27 (a) | | | EUR | | | | 1,740 | | | | 1,872,050 | |
Series 2X, Class E, 5.18%, 8/15/27 (a) | | | | | | | 395 | | | | 399,628 | |
Series 2X, Class F, 5.93%, 8/15/27 (a) | | | | | | | 250 | | | | 233,320 | |
American Homes 4 Rent: | | | | | | | | | | | | |
Series 2014-SFR1, Class A, 1.25%, 6/17/31 (a)(b) | | | USD | | | | 2,171 | | | | 2,147,042 | |
Series 2014-SFR3, Class A, 3.68%, 12/16/24 (b) | | | | | | | 5,227 | | | | 5,395,073 | |
Anchorage Capital CLO 6 Ltd.: | | | | | | | | | | | | |
Series 2015-6A, Class A1,
1.80%, 4/15/27 (a)(b) | | | | | | | 2,020 | | | | 2,014,950 | |
Series 2015-6A, Class B,
2.31%, 4/15/27 (a)(b) | | | | | | | 250 | | | | 245,450 | |
Apidos CDO, Series 2012-9AR, Class BR, 2.12%, 7/15/23 (a)(b) | | | | | | | 3,035 | | | | 3,035,000 | |
Arbour CLO Ltd.: | | | | | | | | | | | | |
Series 2014-1X, Class E, 5.07%, 6/16/27 (a) | | | EUR | | | | 338 | | | | 341,535 | |
Series 2014-1X, Class F, 6.11%, 6/16/27 (a) | | | | | | | 336 | | | | 313,155 | |
Arianna SPV Srl, Series 1, Class A, 3.60%, 10/20/30 | | | | | | | 1,936 | | | | 2,168,915 | |
Auto ABS, Series 2012-2, Class A, 2.80%, 4/27/25 | | | | | | | 859 | | | | 929,265 | |
Avoca CLO XI Ltd., Series 11X, Class A, 1.47%, 7/15/27 (a) | | | | | | | 1,300 | | | | 1,397,842 | |
Avoca CLO XIII Ltd., Series 13X, Class E, 5.69%, 1/21/28 (a)(b) | | | | | | | 430 | | | | 444,555 | |
Battalion CLO IV Ltd., Series 2013-4A, Class A1, 1.63%, 10/22/25 (a)(b) | | | USD | | | | 4,715 | | | | 4,683,971 | |
| | | | | | | | | | | | |
| Asset-Backed Securities | | | | | Par (000) | | | Value | |
Bayview Opportunity Master Fund IIA Trust, Series 2012-4NR3, Class A, 3.72%, 2/28/35 (a)(b) | | | USD | | | | 1,979 | | | $ | 1,980,045 | |
Bayview Opportunity Master Fund IIIa Trust, Series 2014-16RP, Class A, 3.84%, 11/28/29 (a)(b) | | | | | | | 3,927 | | | | 3,946,488 | |
BCMSC Trust: | | | | | | | | | | | | |
Series 2000-A, Class A2, 7.58%, 6/15/30 (a) | | | | | | | 1,714 | | | | 955,156 | |
Series 2000-A, Class A3, 7.83%, 6/15/30 (a) | | | | | | | 1,591 | | | | 915,212 | |
Series 2000-A, Class A4, 8.29%, 6/15/30 (a) | | | | | | | 2,725 | | | | 1,655,972 | |
Bear Stearns Asset-Backed Securities I Trust: | | | | | | | | | | | | |
Series 2006-HE10, Class 21A1, 0.24%, 12/25/36 (a) | | | | | | | 98 | | | | 108,580 | |
Series 2006-HE10, Class 22A, 0.31%, 12/25/36 (a) | | | | | | | 4,060 | | | | 3,132,959 | |
Series 2006-HE7, Class 1A2, 0.34%, 9/25/36 (a) | | | | | | | 6,585 | | | | 5,288,272 | |
Series 2007-AQ2, Class A2, 0.34%, 1/25/37 (a) | | | | | | | 1,730 | | | | 1,439,105 | |
Series 2007-HE1, Class 21A2, 0.33%, 1/25/37 (a) | | | | | | | 1,331 | | | | 1,200,065 | |
Series 2007-HE2, Class 22A, 0.31%, 3/25/37 (a) | | | | | | | 1,567 | | | | 1,252,052 | |
Benefit Street Partners CLO II Ltd., Series 2013-IIA, Class A1, 1.43%, 7/15/24 (a)(b) | | | | | | | 2,090 | | | | 2,055,097 | |
BlueMountain CLO Ltd.: | | | | | | | | | | | | |
Series 2012-2A, Class B1,
2.29%, 11/20/24 (a)(b) | | | | | | | 3,150 | | | | 3,149,960 | |
Series 2013-1A, Class A1,
1.46%, 5/15/25 (a)(b) | | | | | | | 1,025 | | | | 1,012,323 | |
Canyon Capital CLO Ltd., Series 2015-1A, Class B, 2.47%, 4/15/27 (a)(b) | | | | | | | 250 | | | | 245,625 | |
Carlyle Global Market Strategies CLO Ltd., Series 2012-4A, Class A, 1.65%, 1/20/25 (a)(b) | | | | | | | 6,630 | | | | 6,612,668 | |
Carrington Mortgage Loan Trust: | | | | | | | | | | | | |
Series 2006-NC3, Class A4, 0.41%, 8/25/36 (a) | | | | | | | 2,003 | | | | 1,225,037 | |
Series 2006-NC5, Class A3, 0.32%, 1/25/37 (a) | | | | | | | 7,250 | | | | 4,503,163 | |
Series 2006-NC5, Class A4, 0.39%, 1/25/37 (a) | | | | | | | 803 | | | | 492,366 | |
| | | | | | | | | | |
| Portfolio Abbreviations |
| ABS | | Asset-Backed Security | | EURIBOR | | Euro Interbank Offered Rate | | MXN | | Mexican Peso |
| AKA | | Also Known As | | FKA | | Formerly Known As | | NOK | | Norwegian Krone |
| AMBAC | | American Municipal Bond Assurance Corporation | | GBP | | British Pound | | OTC | | Over-the-counter |
| AUD | | Australian Dollar | | GO | | General Obligation | | PIK | | Payment-in-kind |
| BRL | | Brazilian Real | | HKD | | Hong Kong Dollar | | PLN | | Polish Zloty |
| BZDIOVER | | Overnight Brazil CETIP - Interbank Rate | | IDR | | Indonesian Rupiah | | RB | | Revenue Bonds |
| CAD | | Canadian Dollar | | INR | | Indian Rupee | | SGD | | Singapore Dollar |
| CDO | | Collateralized Debt Obligation | | JIBAR | | Johannesburg Interbank | | S&P | | Standard & Poor’s |
| CHF | | Swiss Franc | | | | Offered Rate | | TBA | | To-be-announced |
| CNH | | Chinese Yuan | | JPY | | Japanese Yen | | TRY | | Turkish Lira |
| CLO | | Collateralized Loan Obligation | | KRW | | South Korean Won | | USD | | U.S. Dollar |
| COP | | Columbian Peso | | LIBOR | | London Interbank Offered Rate | | TWD | | Taiwan Dollar |
| ETF | | Exchange-Traded Fund | | MXIBTIIE | | Mexico Interbank TIIE 28-Day Rate | | ZAR | | South African Rand |
| EUR | | Euro | | MYR | | Malaysian Ringgit | | | | |
See Consolidated Notes to Financial Statements.
| | | | | | |
| 34 | | BLACKROCK BALANCED CAPITAL FUND, INC. | | MARCH 31, 2015 | | |
| | | | |
| Consolidated Schedule of Investments (continued) | | | Master Total Return Portfolio | |
| | | (Percentages shown are based on Net Assets) | |
| | | | | | | | | | | | |
| Asset-Backed Securities | | | | | Par (000) | | | Value | |
CHLUPA Trust, Series 2013-VM, Class A, 3.33%, 8/15/20 (b) | | | USD | | | | 3,424 | | | $ | 3,428,142 | |
Chrysler Capital Auto Receivables Trust: | | | | | | | | | | | | |
Series 2013-BA, Class A2, 0.56%, 12/15/16 (b) | | | | | | | 430 | | | | 430,363 | |
Series 2013-BA, Class A4, 1.27%, 3/15/19 (b) | | | | | | | 2,710 | | | | 2,716,252 | |
Series 2013-BA, Class B, 1.78%, 6/17/19 (b) | | | | | | | 1,240 | | | | 1,250,503 | |
Series 2013-BA, Class C, 2.24%, 9/16/19 (b) | | | | | | | 1,285 | | | | 1,297,431 | |
Series 2014-AA, Class B, 1.76%, 8/15/19 (b) | | | | | | | 1,435 | | | | 1,444,104 | |
Series 2014-AA, Class C, 2.28%, 11/15/19 (b) | | | | | | | 1,850 | | | | 1,866,569 | |
CIFC Funding Ltd.: | | | | | | | | | | | | |
Series 2011-1AR, Class A1R, 1.55%, 1/19/23 (a)(b) | | | | | | | 22,425 | | | | 22,425,000 | |
Series 2012-3A, Class A1L, 1.61%, 1/29/25 (a)(b) | | | | | | | 5,000 | | | | 4,971,818 | |
Series 2012-3A, Class A2L, 2.48%, 1/29/25 (a)(b) | | | | | | | 4,480 | | | | 4,480,543 | |
Series 2014-2A, Class A1L, 1.74%, 5/24/26 (a)(b) | | | | | | | 2,365 | | | | 2,357,596 | |
Series 2014-5A, Class A1, 1.82%, 1/17/27 (a)(b) | | | | | | | 4,565 | | | | 4,570,921 | |
Colombo Srl, Series 1, Class B, 0.23%, 8/28/26 (a) | | | EUR | | | | 376 | | | | 396,452 | |
Countrywide Asset-Backed Certificates: | | | | | | | | | | | | |
Series 2003-BC3, Class A2, 0.79%, 9/25/33 (a) | | | USD | | | | 672 | | | | 639,408 | |
Series 2004-5, Class A, 1.07%, 10/25/34 (a) | | | | | | | 752 | | | | 738,921 | |
Series 2006-12, Class 2A2, 0.32%, 12/25/36 (a) | | | | | | | 1,711 | | | | 1,595,039 | |
Series 2006-14, Class 2A2, 0.32%, 2/25/37 (a) | | | | | | | 2,407 | | | | 2,257,438 | |
Series 2006-17, Class 2A2, 0.32%, 3/25/47 (a) | | | | | | | 770 | | | | 645,833 | |
Series 2006-25, Class 2A4, 0.39%, 6/25/47 (a) | | | | | | | 8,142 | | | | 5,131,870 | |
Series 2006-8, Class 2A3, 0.33%, 1/25/46 (a) | | | | | | | 2,264 | | | | 2,015,698 | |
Series 2006-SPS1, Class A, 0.39%, 12/25/25 (a) | | | | | | | 473 | | | | 1,306,896 | |
Series 2007-7, Class 2A4, 0.46%, 10/25/47 (a) | | | | | | | 1,840 | | | | 1,024,162 | |
Series 2007-BC3, Class 2A4, 0.42%, 11/25/47 (a) | | | | | | | 2,690 | | | | 1,293,219 | |
CT CDO IV Ltd., Series 2006-4A, Class A1, 0.49%, 10/20/43 (a)(b) | | | | | | | 2,651 | | | | 2,640,213 | |
CVC Cordatus Loan Fund III Ltd., Series 3X, Class A1, 1.85%, 7/08/27 (a) | | | EUR | | | | 1,640 | | | | 1,763,776 | |
DCP Rights LLC, Series 2014-1A, Class A, 5.46%, 10/25/44 (b) | | | USD | | | | 8,249 | | | | 8,394,324 | |
Dryden XXV Senior Loan Fund, Series 2012-25A, Class A, 1.61%, 1/15/25 (a)(b) | | | | | | | 2,000 | | | | 1,998,527 | |
Dryden XXVIII Senior Loan Fund, Series 2013-28A, Class A1L, 1.33%, 8/15/25 (a)(b) | | | | | | | 2,090 | | | | 2,056,774 | |
ECP CLO Ltd., Series 2012-4A, Class A1, 1.62%, 6/19/24 (a)(b) | | | | | | | 4,910 | | | | 4,885,116 | |
Fannie Mae REMIC Trust, Series 2003-W5, Class A, 0.39%, 4/25/33 (a) | | | | | | | 5 | | | | 4,605 | |
GFT Mortgage Loan Trust, Series 2015-GFT1, Class A, 3.72%, 1/25/55 (b)(c) | | | | | | | 2,694 | | | | 2,697,001 | |
GSAA Home Equity Trust, Series 2006-5, Class 2A1, 0.24%, 3/25/36 (a) | | | | | | | 25 | | | | 14,917 | |
| | | | | | | | | | | | |
| Asset-Backed Securities | | | | | Par (000) | | | Value | |
GT Loan Financing I Ltd., Series 2013-1A, Class A, 1.51%, 10/28/24 (a)(b) | | | USD | | | | 5,105 | | | $ | 5,059,115 | |
Harvest CLO: | | | | | | | | | | | | |
Series 11X, Class A1, 1.34%, 3/26/29 (a) | | | EUR | | | | 5,190 | | | | 5,565,458 | |
Series 11X, Class E, 5.34%, 3/26/29 (a) | | | | | | | 970 | | | | 972,378 | |
Series 11X, Class SUB, 0.00%, 3/26/29 (a) | | | | | | | 4,040 | | | | 3,754,947 | |
Home Loan Mortgage Loan Trust, Series 2005-1, Class A3, 0.53%, 4/15/36 (a) | | | USD | | | | 2,274 | | | | 2,002,831 | |
ING IM CLO Ltd., Series 2012-4A, Class A1, 1.62%, 10/15/23 (a)(b) | | | | | | | 1,210 | | | | 1,206,980 | |
ING Investment Management CLO Ltd.: | | | | | | | | | | | | |
Series 2012-2A, Class A, 1.76%, 10/15/22 (a)(b) | | | | | | | 2,850 | | | | 2,850,849 | |
Series 2013-2A, Class A1, 1.38%, 4/25/25 (a)(b) | | | | | | | 1,815 | | | | 1,790,946 | |
Series 2013-3A, Class A1, 1.68%, 1/18/26 (a)(b) | | | | | | | 2,685 | | | | 2,677,114 | |
Invitation Homes Trust: | | | | | | | | | | | | |
Series 2013-SFR1, Class A, 1.40%, 12/17/30 (a)(b) | | | | | | | 2,786 | | | | 2,776,344 | |
Series 2014-SFR1, Class A, 1.18%, 6/17/31 (a)(b) | | | | | | | 1,730 | �� | | | 1,710,399 | |
Series 2014-SFR2, Class A, 1.27%, 9/17/31 (a)(b) | | | | | | | 3,079 | | | | 3,047,505 | |
Series 2014-SFR3, Class A, 1.37%, 12/17/31 (a)(b) | | | | | | | 2,517 | | | | 2,508,039 | |
Series 2015-SFR1, Class A, 1.62%, 3/17/32 (a)(b) | | | | | | | 2,002 | | | | 2,011,750 | |
Series 2015-SFR2, Class A,
1.53%, 6/17/32 | | | | | | | 1,600 | | | | 1,600,000 | |
Jubilee CDO BV, Series 2014-11X, Class A, 1.48%, 4/15/27 (a) | | | EUR | | | | 1,330 | | | | 1,430,100 | |
Jubilee CDO VIII BV, Series VIII-X, Class SUB, 5.30%, 1/15/24 (a) | | | | | | | 880 | | | | 424,229 | |
KKR Financial CLO Ltd., Series 2013-1A, Class A1, 1.38%, 7/15/25 (a)(b) | | | USD | | | | 4,515 | | | | 4,431,473 | |
Lehman XS Trust, Series 2007-1, Class 2A1, 5.60%, 2/25/37 (a) | | | | | | | 5,436 | | | | 5,009,973 | |
Long Beach Mortgage Loan Trust: | | | | | | | | | | | | |
Series 2006-10, Class 2A3, 0.33%, 11/25/36 (a) | | | | | | | 4,843 | | | | 2,445,244 | |
Series 2006-10, Class 2A4, 0.39%, 11/25/36 (a) | | | | | | | 942 | | | | 480,554 | |
Series 2006-11, Class 1A, 0.33%, 12/25/36 (a) | | | | | | | 4,855 | | | | 3,221,185 | |
Series 2006-2, Class 1A,
0.35%, 3/25/46 (a) | | | | | | | 4,743 | | | | 3,340,341 | |
Series 2006-3, Class 2A3, 0.35%, 5/25/46 (a) | | | | | | | 2,137 | | | | 1,024,191 | |
Series 2006-3, Class 2A4, 0.44%, 5/25/46 (a) | | | | | | | 1,288 | | | | 616,921 | |
Morgan Stanley ABS Capital I, Inc., Trust, Series 2005-HE1, Class A2MZ, 0.77%, 12/25/34 (a) | | | | | | | 820 | | | | 778,984 | |
MSCC Heloc Trust, Series 2007-1, Class A, 0.27%, 12/25/31 (a) | | | | | | | 369 | | | | 348,814 | |
Muir Woods CLO Ltd., Series 2012-1A, Class B, 2.84%, 9/14/23 (a)(b) | | | | | | | 500 | | | | 500,144 | |
Navient Private Education Loan Trust: | | | | | | | | | | | | |
Series 2014-AA, Class A2A, 2.74%, 2/15/29 (b) | | | | | | | 5,000 | | | | 5,039,705 | |
Series 2014-AA, Class A2B, 1.42%, 2/15/29 (a)(b) | | | | | | | 6,500 | | | | 6,555,023 | |
Series 2014-AA, Class A3, 1.77%, 10/15/31 (a)(b) | | | | | | | 8,500 | | | | 8,551,229 | |
See Consolidated Notes to Financial Statements.
| | | | | | |
| | | BLACKROCK BALANCED CAPITAL FUND, INC. | | MARCH 31, 2015 | | 35 |
| | | | |
| Consolidated Schedule of Investments (continued) | | | Master Total Return Portfolio | |
| | | (Percentages shown are based on Net Assets) | |
| | | | | | | | | | | | |
| Asset-Backed Securities | | | | | Par (000) | | | Value | |
Series 2014-AA, Class B, 3.50%, 8/15/44 (b) | | | USD | | | | 6,000 | | | $ | 5,689,098 | |
Series 2014-CTA, Class A, 0.86%, 9/16/24 (a)(b) | | | | | | | 3,094 | | | | 3,087,398 | |
Series 2014-CTA, Class B, 1.91%, 10/17/44 (a)(b) | | | | | | | 8,550 | | | | 8,455,651 | |
Series 2015-AA, Class A2A, 2.65%, 12/15/28 (b) | | | | | | | 6,068 | | | | 6,086,174 | |
Series 2015-AA, Class A2B, 1.36%, 12/15/28 (a)(b) | | | | | | | 16,203 | | | | 16,281,423 | |
Series 2015-AA, Class A3, 1.86%, 11/15/30 (a)(b) | | | | | | | 4,476 | | | | 4,484,285 | |
Nelnet Student Loan Trust: | | | | | | | | | | | | |
Series 2006-1, Class A6, 0.71%, 8/23/36 (a)(b) | | | | | | | 3,160 | | | | 3,086,148 | |
Series 2008-3, Class A4, 1.88%, 11/25/24 (a) | | | | | | | 5,600 | | | | 5,796,487 | |
NextGear Floorplan Master Owner Trust, Series 2014-1A, Class A, 1.92%, 10/15/19 (b) | | | | | | | 7,655 | | | | 7,687,641 | |
North Westerly CLO BV, Series IV-X, Class A-1, 1.79%, 1/15/26 (a) | | | EUR | | | | 2,500 | | | | 2,691,730 | |
Northwoods Capital Corp./Northwoods Capital Ltd., Series 2012-9A, Class A, 1.65%, 1/18/24 (a)(b) | | | USD | | | | 4,300 | | | | 4,282,258 | |
Oaktree EIF II Ltd.: | | | | | | | | | | | | |
Series 2013-2A, Class A, 1.43%, 4/20/23 (a)(b) | | | | | | | 709 | | | | 705,682 | |
Series 2014-A2, Class B, 2.53%, 11/15/25 (a)(b) | | | | | | | 1,900 | | | | 1,899,908 | |
Octagon Investment Partners XIX Ltd., Series 2014-1A, Class A,
1.75%, 4/15/26 (a)(b) | | | | | | | 1,500 | | | | 1,498,022 | |
Octagon Investment Partners XVI Ltd., Series 2013-1A, Class A,
1.35%, 7/17/25 (a)(b) | | | | | | | 5,195 | | | | 5,119,673 | |
OHA Loan Funding Ltd., Series 2013-2A, Class A, 1.53%, 8/23/24 (a)(b) | | | | | | | 5,315 | | | | 5,264,847 | |
OneMain Financial Issuance Trust: | | | | | | | | | | | | |
Series 2014-1A, Class A, 2.43%, 6/18/24 (b) | | | | | | | 8,825 | | | | 8,838,326 | |
Series 2014-2A, Class A, 2.47%, 9/18/24 (b) | | | | | | | 10,667 | | | | 10,639,586 | |
Series 2014-2A, Class B, 3.02%, 9/18/24 (b) | | | | | | | 1,030 | | | | 1,021,451 | |
Series 2014-2A, Class C, 4.33%, 9/18/24 (b) | | | | | | | 2,400 | | | | 2,372,808 | |
Series 2015-1A, Class A, 3.19%, 3/18/26 (b) | | | | | | | 7,540 | | | | 7,608,312 | |
Series 2015-1A, Class B, 3.97%, 3/18/26 (b) | | | | | | | 5,857 | | | | 5,889,916 | |
Series 2015-1A, Class C, 5.26%, 3/18/26 (b) | | | | | | | 1,536 | | | | 1,535,846 | |
Series 2015-1A, Class D, 6.81%, 3/18/26 (b) | | | | | | | 2,135 | | | | 2,134,573 | |
Option One Mortgage Acceptance Corp. Asset Back Certificates, Series 2003-4, Class A2, 0.81%, 7/25/33 (a) | | | | | | | 1,294 | | | | 1,204,198 | |
OZLM Funding IV Ltd., Series 2013-4A, Class A1, 1.38%, 7/22/25 (a)(b) | | | | | | | 8,895 | | | | 8,762,465 | |
OZLM Funding Ltd., Series 2012-2A, Class A1, 1.71%, 10/30/23 (a)(b) | | | | | | | 7,530 | | | | 7,525,196 | |
OZLM XI Ltd., Series 2015-11A, Class A1A, 1.81%, 1/30/27 (a)(b) | | | | | | | 9,258 | | | | 9,248,742 | |
PFS Financing Corp., Series 2014-BA, Class A, 0.77%, 10/15/19 (a)(b) | | | | | | | 18,000 | | | | 18,009,522 | |
Progress Residential Trust, Series 2015-SFR1, Class A, 1.57%, 2/17/32 (a)(b) | | | | | | | 3,011 | | | | 3,019,536 | |
| | | | | | | | | | | | |
| Asset-Backed Securities | | | | | Par (000) | | | Value | |
Race Point VIII CLO Ltd., Series 2013-8A, Class A, 1.48%, 2/20/25 (a)(b) | | | USD | | | | 1,665 | | | $ | 1,648,350 | |
RASC Trust, Series 2003-KS5, Class AIIB, 0.75%, 7/25/33 (a) | | | | | | | 543 | | | | 476,167 | |
SACO I Trust, Series 2006-9, Class A1, 0.47%, 8/25/36 (a) | | | | | | | 1,460 | | | | 1,808,590 | |
Santander Drive Auto Receivables Trust: | | | | | | | | | | | | |
Series 2014-S1, Class R, 1.42%, 8/16/18 (b) | | | | | | | 473 | | | | 470,501 | |
Series 2014-S2, Class R, 1.43%, 11/16/18 (b) | | | | | | | 1,041 | | | | 1,044,229 | |
Series 2014-S3, Class R, 1.43%, 2/19/19 (b) | | | | | | | 590 | | | | 592,312 | |
Series 2014-S4, Class R, 1.43%, 4/16/19 (b) | | | | | | | 939 | | | | 935,002 | |
Series 2014-S5, Class R, 1.43%, 6/18/19 (b) | | | | | | | 969 | | | | 968,820 | |
Series 2014-S6, Class R, 1.43%, 12/17/19 (b) | | | | | | | 1,821 | | | | 1,826,997 | |
SASCO Mortgage Loan Trust, Series 2005-GEL2, Class A, 0.73%, 4/25/35 (a) | | | | | | | 140 | | | | 138,216 | |
Scholar Funding Trust, Series 2011-A, Class A, 1.14%, 10/28/43 (a)(b) | | | | | | | 3,058 | | | | 3,074,985 | |
Silvermore CLO Ltd., Series 2014-1A, Class A1, 1.71%, 5/15/26 (a)(b) | | | | | | | 3,700 | | | | 3,667,109 | |
SLC Private Student Loan Trust: | | | | | | | | | | | | |
Series 2006-A, Class A5, 0.40%, 7/15/36 (a) | | | | | | | 6,830 | | | | 6,780,032 | |
Series 2010-B, Class A2, 3.67%, 7/15/42 (a)(b) | | | | | | | 2,871 | | | | 2,997,772 | |
SLM Private Credit Student Loan Trust: | | | | | | | | | | | | |
Series 2002-A, Class A2, 0.79%, 12/16/30 (a) | | | | | | | 3,589 | | | | 3,539,112 | |
Series 2004-A, Class A3, 0.63%, 6/15/33 (a) | | | | | | | 4,515 | | | | 4,314,200 | |
Series 2004-B, Class A2, 0.43%, 6/15/21 (a) | | | | | | | 2,378 | | | | 2,363,332 | |
Series 2004-B, Class A3, 0.56%, 3/15/24 (a) | | | | | | | 17,980 | | | | 17,211,409 | |
Series 2005-B, Class A2, 0.41%, 3/15/23 (a) | | | | | | | 3,387 | | | | 3,361,707 | |
Series 2006-A, Class A4, 0.43%, 12/15/23 (a) | | | | | | | 9,932 | | | | 9,831,372 | |
Series 2006-B, Class A5, 0.54%, 12/15/39 (a) | | | | | | | 830 | | | | 756,040 | |
Series 2006-C, Class A4, 0.40%, 3/15/23 (a) | | | | | | | 913 | | | | 901,839 | |
Series 2007-A, Class A2, 0.35%, 9/15/25 (a) | | | | | | | 2,395 | | | | 2,368,026 | |
SLM Private Education Loan Trust: | | | | | | | | | | | | |
Series 2011-A, Class A3, 2.67%, 1/15/43 (a)(b) | | | | | | | 4,425 | | | | 4,702,881 | |
Series 2011-B, Class A2, 3.74%, 2/15/29 (b) | | | | | | | 1,420 | | | | 1,496,379 | |
Series 2011-B, Class A3, 2.40%, 6/16/42 (a)(b) | | | | | | | 2,817 | | | | 2,978,721 | |
Series 2011-C, Class A2A, 3.42%, 10/17/44 (a)(b) | | | | | | | 2,920 | | | | 3,137,560 | |
Series 2011-C, Class A2B, 4.54%, 10/17/44 (b) | | | | | | | 4,120 | | | | 4,438,282 | |
Series 2012-A, Class A1, 1.55%, 8/15/25 (a)(b) | | | | | | | 9,761 | | | | 9,852,083 | |
Series 2012-A, Class A2, 3.83%, 1/17/45 (b) | | | | | | | 10,954 | | | | 11,580,251 | |
See Consolidated Notes to Financial Statements.
| | | | | | |
| 36 | | BLACKROCK BALANCED CAPITAL FUND, INC. | | MARCH 31, 2015 | | |
| | | | |
| Consolidated Schedule of Investments (continued) | | | Master Total Return Portfolio | |
| | | (Percentages shown are based on Net Assets) | |
| | | | | | | | | | | | |
| Asset-Backed Securities | | | | | Par (000) | | | Value | |
Series 2012-B, Class A2, 3.48%, 10/15/30 (b) | | | USD | | | | 4,730 | | | $ | 4,918,774 | |
Series 2013-A, Class A1,
0.76%, 8/15/22 (a)(b) | | | | | | | 4,300 | | | | 4,303,456 | |
Series 2013-A, Class A2A, 1.77%, 5/17/27 (b) | | | | | | | 18,455 | | | | 18,412,646 | |
Series 2013-A, Class A2B, 1.22%, 5/17/27 (a)(b) | | | | | | | 11,170 | | | | 11,249,151 | |
Series 2013-A, Class B, 2.50%, 3/15/47 (b) | | | | | | | 620 | | | | 601,819 | |
Series 2013-B, Class A2A, 1.85%, 6/17/30 (b) | | | | | | | 18,000 | | | | 17,878,446 | |
Series 2013-B, Class A2B, 1.27%, 6/17/30 (a)(b) | | | | | | | 1,400 | | | | 1,414,279 | |
Series 2013-B, Class B, 3.00%, 5/16/44 (b) | | | | | | | 2,095 | | | | 2,065,014 | |
Series 2013-C, Class A2A, 2.94%, 10/15/31 (b) | | | | | | | 10,120 | | | | 10,416,202 | |
Series 2014-A, Class A2A, 2.59%, 1/15/26 (b) | | | | | | | 500 | | | | 511,033 | |
SLM Student Loan Trust: | | | | | | | | | | | | |
Series 2008-5, Class A4, 1.93%, 7/25/23 (a) | | | | | | | 10,866 | | | | 11,308,616 | |
Series 2008-7, Class A4, 1.16%, 7/25/23 (a) | | | | | | | 4,660 | | | | 4,736,974 | |
Series 2008-9, Class A, 1.76%, 4/25/23 (a) | | | | | | | 4,522 | | | | 4,637,083 | |
SMB Private Education Loan Trust: | | | | | | | | | | | | |
Series 2014-A, Class A1,
0.67%, 9/15/21 (a)(b) | | | | | | | 7,270 | | | | 7,266,433 | |
Series 2014-A, Class A2B, 1.30%, 5/15/26 (a)(b) | | | | | | | 3,405 | | | | 3,405,909 | |
SoFi Professional Loan Program LLC: | | | | | | | | | | | | |
Series 2014-B, Class A2, 2.55%, 8/25/29 (b) | | | | | | | 1,448 | | | | 1,456,546 | |
Series 2015-A, Class A2, 2.40%, 3/25/30 (b) | | | | | | | 8,068 | | | | 8,066,286 | |
Sorrento Park CLO Ltd., Series 1X, Class E, 6.46%, 11/16/27 (a)(b) | | | EUR | | | | 340 | | | | 327,274 | |
Sound Point CLO IV Ltd., Series 2013-3A, Class A, 1.60%, 1/21/26 (a)(b) | | | USD | | | | 1,865 | | | | 1,845,359 | |
Sound Point CLO Ltd., Series 2014-3A, Class A, 1.73%, 1/23/27 (a)(b) | | | | | | | 6,225 | | | | 6,200,100 | |
Sound Point CLO VI Ltd., Series 2014-2A, Class A1, 1.62%, 10/20/26 (a)(b) | | | | | | | 1,250 | | | | 1,235,625 | |
SpringCastle America Funding LLC: | | | | | | | | | | | | |
Series 2014-AA, Class A, 2.70%, 5/25/23 (b) | | | | | | | 9,634 | | | | 9,659,014 | |
Series 2014-AA, Class B, 4.61%, 10/25/27 (b) | | | | | | | 8,236 | | | | 8,372,932 | |
Springleaf Funding Trust: | | | | | | | | | | | | |
Series 2014-AA, Class B, 3.45%, 12/15/22 (b) | | | | | | | 2,335 | | | | 2,343,037 | |
Series 2015-AA, Class A, 3.16%, 11/15/24 (b) | | | | | | | 16,237 | | | | 16,390,911 | |
Series 2015-AA, Class B, 3.62%, 11/15/24 (b) | | | | | | | 770 | | | | 777,926 | |
St. Pauls CLO, Series 4X, Class A1, 1.46%, 4/25/28 (a) | | | EUR | | | | 2,000 | | | | 2,145,545 | |
Structured Asset Investment Loan Trust, Series 2005-HE3, Class M1, 0.65%, 9/25/35 (a) | | | USD | | | | 1,388 | | | | 1,235,564 | |
Structured Asset Securities Corp. Assistance Loan Trust, Series 2003-AL2, Class A, 3.36%, 1/25/31 (b) | | | | | | | 828 | | | | 803,729 | |
Structured Asset Securities Corp. Mortgage Pass-Through Certificates, Series 2004-23XS, Class 2A1, 0.47%, 1/25/35 (a) | | | | | | | 1,405 | | | | 1,294,722 | |
Sunset Mortgage Loan Co. LLC, Series 2014-NPL2, Class A, 3.72%, 11/16/44 (b)(c) | | | | | | | 2,888 | | | | 2,875,718 | |
| | | | | | | | | | | | |
| Asset-Backed Securities | | | | | Par (000) | | | Value | |
SWAY Residential Trust, Series 2014-1, Class A, 1.47%, 1/17/20 (a)(b) | | | USD | | | | 9,913 | | | $ | 9,899,839 | |
Symphony CLO XII Ltd., Series 2013-12A, Class A, 1.53%, 10/15/25 (a)(b) | | | | | | | 3,000 | | | | 2,974,025 | |
Symphony CLO XV Ltd., Series 2014-15A, Class B1, 2.43%, 10/17/26 (a)(b) | | | | | | | 6,230 | | | | 6,229,707 | |
TAGUS-Sociedade de Titularizacao de Creditos SA/Volta II Electricity Receivables, Series 2, Class SNR, 2.98%, 2/16/21 | | | EUR | | | | 1,851 | | | | 2,024,234 | |
TICP CLO III Ltd.: | | | | | | | | | | | | |
Series 2014-3A, Class A, 1.78%, 1/20/27 (a)(b) | | | USD | | | | 1,960 | | | | 1,959,022 | |
Series 2014-3A, Class B1, 2.35%, 1/20/27 (a)(b) | | | | | | | 374 | | | | 375,157 | |
U.S. Residential Opportunity Fund Trust, Series 2015-1III, Class A, 3.72%, 1/27/35- 2/27/35 (b) | | | | | | | 10,812 | | | | 10,840,807 | |
Venture XIX CLO Ltd., Series 2014-19A, Class A, 1.84%, 1/15/26 (a)(b) | | | | | | | 1,940 | | | | 1,944,402 | |
Venture XX CLO Ltd., Series 2015-20A, Class B1, 2.37%, 4/15/27 (a)(b) | | | | | | | 250 | | | | 246,925 | |
Vibrant CLO Ltd.: | | | | | | | | | | | | |
Series 2012-1A, Class A1, 1.71%, 7/17/24 (a)(b) | | | | | | | 13,740 | | | | 13,672,674 | |
Series 2012-1A, Class A2, 2.63%, 7/17/24 (a)(b) | | | | | | | 2,600 | | | | 2,600,832 | |
Voya CLO Ltd.: | | | | | | | | | | | | |
Series 2012-2RA, Class BR, 2.22%, 10/15/22 (a)(b) | | | | | | | 2,470 | | | | 2,470,000 | |
Series 2012-3AR, Class AR, 1.61%, 10/15/22 (a)(b) | | | | | | | 1,700 | | | | 1,700,000 | |
Series 2014-4A, Class A1, 1.73%, 10/14/26 (a)(b) | | | | | | | 4,740 | | | | 4,735,471 | |
Wachovia Asset Securitization Issuance II LLC Trust, Series 2007-HE2A, Class A, 0.30%, 7/25/37 (a)(b) | | | | | | | 723 | | | | 636,609 | |
World Financial Network Credit Card Master Trust: | | | | | | | | | | | | |
Series 2012-C, Class B, 3.57%, 8/15/22 | | | | | | | 3,000 | | | | 3,131,784 | |
Series 2012-C, Class C, 4.55%, 8/15/22 | | | | | | | 5,030 | | | | 5,271,028 | |
Series 2012-D, Class B, 3.34%, 4/17/23 | | | | | | | 3,551 | | | | 3,680,988 | |
Series 2012-D, Class M, 3.09%, 4/17/23 | | | | | | | 2,725 | | | | 2,808,499 | |
Ziggurat CLO I Ltd., Series 2014-1A, Class A1, 1.81%, 10/17/26 (a)(b) | | | | | | | 12,445 | | | | 12,462,423 | |
Total Asset-Backed Securities — 12.0% | | | | | | | | | | | 798,107,688 | |
| | | | | | | | | | | | |
| Common Stocks | | | | | Shares | | | | |
Airlines — 0.0% | | | | | | | | | | | | |
United Continental Holdings, Inc. (d) | | | | | | | 19,086 | | | | 1,283,534 | |
Automobiles — 0.1% | | | | | | | | | | | | |
Tesla Motors, Inc. (d) | | | | | | | 4,153 | | | | 783,962 | |
Volkswagen AG, Preference Shares | | | | | | | 6,887 | | | | 1,826,442 | |
| | | | | | | | | | | | |
| | | | | | | | | | | | 2,610,404 | |
Banks — 0.0% | | | | | | | | | | | | |
Banco Popular Espanol SA | | | | | | | 225,831 | | | | 1,106,791 | |
Barclays PLC | | | | | | | 308,919 | | | | 1,115,046 | |
Commerzbank AG (e) | | | | | | | 11,142 | | | | 153,948 | |
| | | | | | | | | | | | |
| | | | | | | | | | | | 2,375,785 | |
Building Products — 0.0% | | | | | | | | | | | | |
Wienerberger AG | | | | | | | 31,439 | | | | 501,678 | |
Chemicals — 0.1% | | | | | | | | | | | | |
LyondellBasell Industries NV, Class A (d) | | | | | | | 28,332 | | | | 2,487,550 | |
See Consolidated Notes to Financial Statements.
| | | | | | |
| | | BLACKROCK BALANCED CAPITAL FUND, INC. | | MARCH 31, 2015 | | 37 |
| | | | |
| Consolidated Schedule of Investments (continued) | | | Master Total Return Portfolio | |
| | | (Percentages shown are based on Net Assets) | |
| | | | | | | | | | | | |
| Common Stocks | | | | | Shares | | | Value | |
Commercial Services & Supplies — 0.0% | | | | | | | | | |
AA PLC | | | | | | | 170,234 | | | $ | 972,217 | |
Diversified Financial Services — 0.0% | | | | | | | | | |
Concrete Investment II SCA — Stapled (f) | | | | | | | 12,471 | | | | — | |
Diversified Telecommunication Services — 0.0% | | | | | | | | | |
Telecom Italia SpA | | | | | | | 906,430 | | | | 1,061,337 | |
Energy Equipment & Services — 0.0% | | | | | | | | | | | | |
Vantage Drilling Co. (e) | | | | | | | 311,000 | | | | 101,853 | |
Independent Power and Renewable Electricity Producers — 0.0% | | | | | |
Abengoa Yield PLC | | | | | | | 28,392 | | | | 959,082 | |
Media — 0.0% | | | | | | | | | | | | |
CBS Corp., Class B, Non-Voting Shares | | | | | | | 15,442 | | | | 936,248 | |
Time Warner Cable, Inc. | | | | | | | 7,962 | | | | 1,193,345 | |
| | | | | | | | | | | | |
| | | | | | | | | | | | 2,129,593 | |
Metals & Mining — 0.0% | | | | | | | | | | | | |
Freeport-McMoRan, Inc. | | | | | | | 32,745 | | | | 620,518 | |
Northern Graphite Corp. | | | | | | | 22,986 | | | | 12,704 | |
| | | | | | | | | | | | |
| | | | | | | | | | | | 633,222 | |
Oil, Gas & Consumable Fuels — 0.0% | | | | | |
Matador Resources Co. | | | | | | | 21,712 | | | | 475,927 | |
The Williams Cos., Inc. (d) | | | | | | | 26,768 | | | | 1,354,193 | |
| | | | | | | | | | | | |
| | | | | | | | | | | | 1,830,120 | |
Real Estate Investment Trusts (REITs) — 0.0% | | | | | | | | | |
American Realty Capital Properties, Inc. | | | | | | | 129,390 | | | | 1,274,492 | |
Technology Hardware, Storage & Peripherals — 0.1% | | | | | |
Apple Inc. (d) | | | | | | | 21,528 | | | | 2,678,729 | |
Trading Companies & Distributors — 0.0% | | | | | | | | | |
United Rentals, Inc. | | | | | | | 12,354 | | | | 1,126,191 | |
Total Common Stocks — 0.3% | | | | | | | | | | | 22,025,787 | |
| | | | | | | | | | | | |
| Corporate Bonds | | | | | Par (000) | | | | |
Aerospace & Defense — 0.2% | | | | | | | | | | | | |
The Boeing Co., 2.35%, 10/30/21 | | | USD | | | | 1,291 | | | | 1,312,144 | |
Lockheed Martin Corp.: | | | | | | | | | | | | |
2.90%, 3/01/25 | | | | | | | 866 | | | | 872,236 | |
3.60%, 3/01/35 | | | | | | | 1,727 | | | | 1,726,116 | |
4.07%, 12/15/42 | | | | | | | 1,711 | | | | 1,787,124 | |
Meccanica Holdings USA, Inc.: | | | | | | | | | | | | |
6.25%, 7/15/19 (b) | | | | | | | 2,254 | | | | 2,507,575 | |
7.38%, 7/15/39 (b) | | | | | | | 150 | | | | 168,000 | |
6.25%, 1/15/40 (b) | | | | | | | 2,560 | | | | 2,604,800 | |
Northrop Grumman Corp., 3.85%, 4/15/45 | | | | | | | 2,712 | | | | 2,669,652 | |
Raytheon Co., 3.15%, 12/15/24 | | | | | | | 932 | | | | 967,589 | |
TA Manufacturing Ltd., 3.63%, 4/15/23 | | | EUR | | | | 350 | | | | 381,537 | |
| | | | | | | | | | | | |
| | | | | | | | | | | | 14,996,773 | |
Air Freight & Logistics — 0.1% | | | | | | | | | | | | |
FedEx Corp.: | | | | | | | | | | | | |
4.90%, 1/15/34 | | | USD | | | | 4,140 | | | | 4,661,640 | |
4.10%, 2/01/45 | | | | | | | 2,406 | | | | 2,402,377 | |
| | | | | | | | | | | | |
| | | | | | | | | | | | 7,064,017 | |
Airlines — 0.2% | | | | | | | | | | | | |
American Airlines Group, Inc., 4.63%, 3/01/20 (b) | | | | | | | 3,144 | | | | 3,079,155 | |
American Airlines Pass-Through Trust, Series 2015-1, Class A, 3.38%, 5/01/27 | | | | | | | 7,615 | | | | 7,672,113 | |
Southwest Airlines Co., 2.75%, 11/06/19 | | | | | | | 1,341 | | | | 1,371,527 | |
| | | | | | | | | | | | |
| Corporate Bonds | | | | | Par (000) | | | Value | |
Airlines (concluded) | | | | | | | | | | | | |
Turkish Airlines Pass-Through Trust, Series 2015-1, Class A, 4.20%, 3/15/27 (b) | | | USD | | | | 2,020 | | | $ | 2,050,300 | |
United Airlines Pass-Through Trust, Series 2014-1, Class B, 4.75%, 10/11/23 | | | | | | | 477 | | | | 484,155 | |
United Continental Holdings, Inc., 6.00%, 7/15/28 | | | | | | | 1,815 | | | | 1,815,000 | |
| | | | | | | | | | | | |
| | | | | | | | | | | | 16,472,250 | |
Auto Components — 0.2% | | | | | | | | | | | | |
AA Bond Co. Ltd., 5.50%, 7/31/22 | | | GBP | | | | 2,075 | | | | 3,108,821 | |
BorgWarner, Inc., 3.38%, 3/15/25 | | | USD | | | | 2,612 | | | | 2,688,505 | |
Faurecia, 3.13%, 6/15/22 | | | EUR | | | | 575 | | | | 619,039 | |
FTE Verwaltungs GmbH, 9.00%, 7/15/20 | | | | | | | 520 | | | | 591,278 | |
Icahn Enterprises LP/Icahn Enterprises Finance Corp.: | | | | | | | | | | | | |
3.50%, 3/15/17 | | | USD | | | | 877 | | | | 883,577 | |
4.88%, 3/15/19 | | | | | | | 1,195 | | | | 1,217,406 | |
6.00%, 8/01/20 | | | | | | | 1,415 | | | | 1,469,902 | |
Mahle GmbH, 2.50%, 5/14/21 | | | EUR | | | | 325 | | | | 361,909 | |
Nexteer Automotive Group Ltd., 5.88%, 11/15/21 (b) | | | USD | | | | 200 | | | | 205,000 | |
Samvardhana Motherson Automotive Systems Group BV, 4.13%, 7/15/21 | | | EUR | | | | 433 | | | | 474,858 | |
Schaeffler Finance BV, 3.25%, 5/15/25 | | | | | | | 875 | | | | 938,704 | |
Servus Luxembourg Holding SCA, 7.75%, 6/15/18 | | | | | | | 150 | | | | 168,708 | |
| | | | | | | | | | | | |
| | | | | | | | | | | | 12,727,707 | |
Automobiles — 0.5% | | | | | | | | | | | | |
Daimler Finance North America LLC, 2.25%, 3/02/20 (b) | | | USD | | | | 12,042 | | | | 12,124,692 | |
Ford Motor Credit Co. LLC, 2.15%, 1/09/18 | | | | | | | 4,224 | | | | 4,272,251 | |
General Motors Co.: | | | | | | | | | | | | |
4.88%, 10/02/23 | | | | | | | 3,375 | | | | 3,654,160 | |
4.00%, 4/01/25 | | | | | | | 1,785 | | | | 1,813,058 | |
6.25%, 10/02/43 | | | | | | | 1,565 | | | | 1,917,222 | |
Volkswagen International Finance NV: | | | | | | | | | | | | |
5.50%, 11/09/15 (g) | | | | | | | 3,800 | | | | 5,770,155 | |
5.50%, 11/09/15 (b)(g) | | | EUR | | | | 400 | | | | 616,262 | |
| | | | | | | | | | | | |
| | | | | | | | | | | | 30,167,800 | |
Banks — 6.0% | | | | | | | | | | | | |
Abbey National Treasury Services PLC, 2.38%, 3/16/20 | | | USD | | | | 8,000 | | | | 8,057,056 | |
Allied Irish Banks PLC, 2.75%, 4/16/19 | | | EUR | | | | 3,550 | | | | 4,015,681 | |
Banca Monte dei Paschi di Siena SpA: | | | | | | | | | | | | |
3.63%, 4/01/19 | | | | | | | 125 | | | | 139,792 | |
2.88%, 4/16/22 | | | | | | | 1,475 | | | | 1,779,708 | |
2.88%, 7/16/24 | | | | | | | 5,250 | | | | 6,423,169 | |
Banco Popolare SC, 3.50%, 3/14/19 | | | | | | | 8,106 | | | | 9,231,045 | |
Bank of America Corp.: | | | | | | | | | | | | |
2.60%, 1/15/19 | | | USD | | | | 28,505 | | | | 29,012,161 | |
3.30%, 1/11/23 | | | | | | | 12,651 | | | | 12,815,956 | |
4.00%, 1/22/25 | �� | | | | | | 5,884 | | | | 5,931,619 | |
4.88%, 4/01/44 | | | | | | | 734 | | | | 826,138 | |
Bank of Ireland: | | | | | | | | | | | | |
3.25%, 1/15/19 | | | EUR | | | | 1,930 | | | | 2,229,432 | |
1.25%, 4/09/20 | | | | | | | 2,250 | | | | 2,406,481 | |
4.25%, 6/11/24 (a) | | | | | | | 8,266 | | | | 9,175,845 | |
The Bank of Nova Scotia: | | | | | | | | | | | | |
1.30%, 7/21/17 | | | USD | | | | 13,088 | | | | 13,109,059 | |
2.80%, 7/21/21 | | | | | | | 6,701 | | | | 6,845,319 | |
Bankia SA: | | | | | | | | | | | | |
3.50%, 1/17/19 | | | EUR | | | | 3,100 | | | | 3,630,692 | |
4.00%, 5/22/24 (a) | | | | | | | 8,400 | | | | 9,177,480 | |
Barclays Bank PLC, 7.63%, 11/21/22 | | | USD | | | | 226 | | | | 264,561 | |
See Consolidated Notes to Financial Statements.
| | | | | | |
| 38 | | BLACKROCK BALANCED CAPITAL FUND, INC. | | MARCH 31, 2015 | | |
| | | | |
| Consolidated Schedule of Investments (continued) | | | Master Total Return Portfolio | |
| | | (Percentages shown are based on Net Assets) | |
| | | | | | | | | | | | |
| Corporate Bonds | | | | | Par (000) | | | Value | |
Banks (continued) | | | | | | | | | | | | |
Barclays PLC: | | | | | | | | | | | | |
2.75%, 11/08/19 | | | USD | | | | 4,935 | | | $ | 4,983,620 | |
3.65%, 3/16/25 | | | | | | | 3,330 | | | | 3,340,160 | |
BB&T Corp., 2.45%, 1/15/20 | | | | | | | 3,418 | | | | 3,476,981 | |
BNP Paribas SA, 2.63%, 10/14/27 (a) | | | EUR | | | | 1,300 | | | | 1,446,785 | |
Branch Banking & Trust Co., 2.30%, 10/15/18 | | | USD | | | | 1,605 | | | | 1,642,258 | |
CaixaBank SA: | | | | | | | | | | | | |
4.50%, 11/22/16 (g) | | | EUR | | | | 1,200 | | | | 1,219,071 | |
5.00%, 11/14/23 (a) | | | | | | | 1,300 | | | | 1,517,534 | |
CIT Group, Inc.: | | | | | | | | | | | | |
5.00%, 5/15/17 | | | USD | | | | 710 | | | | 730,192 | |
4.25%, 8/15/17 | | | | | | | 2,490 | | | | 2,521,125 | |
Citigroup, Inc.: | | | | | | | | | | | | |
1.85%, 11/24/17 | | | | | | | 6,316 | | | | 6,360,383 | |
1.80%, 2/05/18 | | | | | | | 5,666 | | | | 5,677,831 | |
2.50%, 9/26/18 | | | | | | | 6,565 | | | | 6,693,674 | |
2.50%, 7/29/19 | | | | | | | 14,050 | | | | 14,250,325 | |
2.40%, 2/18/20 | | | | | | | 10,010 | | | | 10,045,716 | |
3.88%, 3/26/25 | | | | | | | 3,860 | | | | 3,874,498 | |
Commerzbank AG, 7.75%, 3/16/21 | | | EUR | | | | 6,900 | | | | 9,310,170 | |
Commonwealth Bank of Australia, 2.42%, 3/12/20 | | | USD | | | | 7,565 | | | | 7,633,108 | |
Cooperatieve Centrale Raiffeisen-Boerenleenbank BA, 2.25%, 1/14/20 | | | | | | | 3,594 | | | | 3,630,418 | |
Credit Agricole SA, 2.63%, 3/17/27 | | | EUR | | | | 1,425 | | | | 1,577,993 | |
DEPFA Bank PLC, 0.73%, 12/15/15 (a) | | | | | | | 307 | | | | 321,848 | |
HSBC Bank Brasil SA — Banco Multiplo, 4.00%, 5/11/16 (b) | | | USD | | | | 15,610 | | | | 15,844,150 | |
HSBC Holdings PLC, 4.25%, 3/14/24 | | | | | | | 12,518 | | | | 13,135,726 | |
HSBC USA, Inc., 2.35%, 3/05/20 | | | | | | | 14,937 | | | | 15,025,651 | |
Intesa Sanpaolo SpA: | | | | | | | | | | | | |
3.50%, 1/17/22 | | | EUR | | | | 790 | | | | 977,601 | |
6.63%, 9/13/23 | | | | | | | 2,575 | | | | 3,556,101 | |
4.10%, 9/15/26 | | | | | | | 1,980 | | | | 2,343,795 | |
JPMorgan Chase & Co.: | | | | | | | | | | | | |
1.35%, 2/15/17 | | | USD | | | | 15,097 | | | | 15,155,335 | |
2.35%, 1/28/19 | | | | | | | 9,333 | | | | 9,485,977 | |
2.20%, 10/22/19 | | | | | | | 3,008 | | | | 3,016,185 | |
2.25%, 1/23/20 | | | | | | | 10,655 | | | | 10,677,823 | |
3.88%, 9/10/24 | | | | | | | 7,282 | | | | 7,470,531 | |
KeyBank NA, 2.25%, 3/16/20 | | | | | | | 2,728 | | | | 2,746,829 | |
Macquarie Bank Ltd.: | | | | | | | | | | | | |
1.65%, 3/24/17 (b) | | | | | | | 3,857 | | | | 3,876,524 | |
1.60%, 10/27/17 (b) | | | | | | | 5,410 | | | | 5,407,484 | |
Mizuho Bank Ltd., 3.31%, 3/26/25 | | | | | | | 500 | | | | 500,250 | |
Novo Banco SA: | | | | | | | | | | | | |
2.63%, 5/08/17 | | | EUR | | | | 400 | | | | 416,120 | |
4.75%, 1/15/18 | | | | | | | 1,400 | | | | 1,532,184 | |
4.00%, 1/21/19 | | | | | | | 2,100 | | | | 2,280,531 | |
Oversea-Chinese Banking Corp. Ltd., 3.75%, 11/15/22 (a) | | | USD | | | | 800 | | | | 829,440 | |
Rizal Commercial Banking Corp., 4.25%, 1/22/20 | | | | | | | 300 | | | | 313,110 | |
Royal Bank of Canada, 2.15%, 3/06/20 | | | | | | | 7,525 | | | | 7,589,888 | |
Societe Generale SA, 2.63%, 2/27/25 | | | EUR | | | | 2,000 | | | | 2,189,458 | |
Standard Chartered PLC, 6.73%, 12/31/49 (a) | | | USD | | | | 200 | | | | 201,939 | |
Swedbank AB, 2.20%, 3/04/20 (b) | | | | | | | 10,889 | | | | 10,938,578 | |
TMB Bank PCL, 5.50%, 3/09/18 | | | CNH | | | | 2,000 | | | | 323,907 | |
U.S. Bancorp, 2.95%, 7/15/22 | | | USD | | | | 5,896 | | | | 5,997,794 | |
UniCredit SpA: | | | | | | | | | | | | |
3.25%, 1/14/21 | | | EUR | | | | 1,850 | | | | 2,229,500 | |
5.75%, 10/28/25 (a) | | | | | | | 7,540 | | | | 9,127,744 | |
Unione di Banche Italiane SCpA, 2.88%, 2/18/19 | | | | | | | 1,175 | | | | 1,353,974 | |
United Overseas Bank Ltd., 3.75%, 9/19/24 (a) | | | USD | | | | 600 | | | | 620,466 | |
| | | | | | | | | | | | |
| Corporate Bonds | | | | | Par (000) | | | Value | |
Banks (concluded) | | | | | | | | | | | | |
Vietnam Joint Stock Commercial Bank for Industry and Trade, 8.00%, 5/17/17 | | | USD | | | | 200 | | | $ | 210,500 | |
Wells Fargo & Co.: | | | | | | | | | | | | |
1.50%, 7/01/15 | | | | | | | 2,575 | | | | 2,581,772 | |
2.13%, 4/22/19 | | | | | | | 7,298 | | | | 7,386,736 | |
2.15%, 1/30/20 | | | | | | | 5,783 | | | | 5,812,835 | |
3.30%, 9/09/24 | | | | | | | 2,233 | | | | 2,306,312 | |
3.00%, 2/19/25 | | | | | | | 8,309 | | | | 8,344,729 | |
Woori Bank: | | | | | | | | | | | | |
2.86%, 7/22/20 | | | | | | | 700 | | | | 696,269 | |
4.75%, 4/30/24 | | | | | | | 1,800 | | | | 1,923,062 | |
| | | | | | | | | | | | |
| | | | | | | | | | | | 399,751,694 | |
Beverages — 0.0% | | | | | | | | | | | | |
Anheuser-Busch InBev Finance, Inc., 3.70%, 2/01/24 | | | | | | | 1,465 | | | | 1,550,991 | |
Anheuser-Busch InBev Worldwide, Inc., 3.75%, 7/15/42 | | | | | | | 1,321 | | | | 1,288,213 | |
| | | | | | | | | | | | |
| | | | | | | | | | | | 2,839,204 | |
Biotechnology — 0.2% | | | | | | | | | | | | |
Amgen, Inc., 5.65%, 6/15/42 | | | | | | | 3,271 | | | | 4,008,476 | |
Celgene Corp.: | | | | | | | | | | | | |
2.25%, 5/15/19 | | | | | | | 2,883 | | | | 2,912,202 | |
3.25%, 8/15/22 | | | | | | | 3,562 | | | | 3,641,803 | |
Gilead Sciences, Inc.: | | | | | | | | | | | | |
2.35%, 2/01/20 | | | | | | | 982 | | | | 1,009,000 | |
4.50%, 2/01/45 | | | | | | | 2,094 | | | | 2,312,649 | |
| | | | | | | | | | | | |
| | | | | | | | | | | | 13,884,130 | |
Building Products — 0.0% | | | | | | | | | | | | |
Pfleiderer GmbH, 7.88%, 8/01/19 | | | EUR | | | | 1,413 | | | | 1,549,709 | |
Capital Markets — 1.5% | | | | | | | | | | | | |
The Bank of New York Mellon Corp.: | | | | | | | | | | | | |
2.10%, 1/15/19 | | | USD | | | | 5,837 | | | | 5,908,492 | |
3.00%, 2/24/25 | | | | | | | 4,698 | | | | 4,766,215 | |
Beijing Capital Polaris Investment Co. Ltd., 2.88%, 4/01/18 | | | | | | | 800 | | | | 802,320 | |
Credit Suisse, 3.00%, 10/29/21 | | | | | | | 2,565 | | | | 2,614,376 | |
Credit Suisse AG, 5.75%, 9/18/25 (a) | | | EUR | | | | 315 | | | | 392,006 | |
Credit Suisse Group Funding Guernsey Ltd., 2.75%, 3/26/20 (b) | | | USD | | | | 6,186 | | | | 6,221,291 | |
Deutsche Bank AG: | | | | | | | | | | | | |
1.88%, 2/13/18 | | | | | | | 3,603 | | | | 3,608,077 | |
2.75%, 2/17/25 | | | EUR | | | | 1,250 | | | | 1,379,415 | |
4.50%, 4/01/25 | | | USD | | | | 4,325 | | | | 4,320,294 | |
The Goldman Sachs Group, Inc.: | | | | | | | | | | | | |
3.63%, 2/07/16 | | | | | | | 4,147 | | | | 4,235,733 | |
2.90%, 7/19/18 | | | | | | | 7,652 | | | | 7,908,434 | |
2.63%, 1/31/19 | | | | | | | 8,303 | | | | 8,482,893 | |
2.55%, 10/23/19 | | | | | | | 12,534 | | | | 12,708,223 | |
3.50%, 1/23/25 | | | | | | | 3,247 | | | | 3,303,998 | |
4.80%, 7/08/44 | | | | | | | 1,464 | | | | 1,625,904 | |
Haitong International Finance 2015 Ltd., 4.64%, 7/22/20 | | | | | | | 300 | | | | 305,477 | |
Haitong International Securities Group Ltd., 1.25%, 11/04/19 (g) | | | HKD | | | | 3,000 | | | | 418,889 | |
Jefferies Group LLC, 6.50%, 1/20/43 | | | USD | | | | 1,009 | | | | 1,003,946 | |
Mediobanca SpA, 2.25%, 3/18/19 | | | EUR | �� | | | 1,175 | | | | 1,325,857 | |
Morgan Stanley: | | | | | | | | | | | | |
2.65%, 1/27/20 | | | USD | | | | 5,538 | | | | 5,615,100 | |
3.75%, 2/25/23 | | | | | | | 9,697 | | | | 10,156,046 | |
4.30%, 1/27/45 | | | | | | | 6,871 | | | | 7,119,916 | |
UBS AG: | | | | | | | | | | | | |
4.75%, 5/22/23 (a) | | | | | | | 1,340 | | | | 1,385,754 | |
.
See Consolidated Notes to Financial Statements.
| | | | | | |
| | | BLACKROCK BALANCED CAPITAL FUND, INC. | | MARCH 31, 2015 | | 39 |
| | | | |
| Consolidated Schedule of Investments (continued) | | | Master Total Return Portfolio | |
| | | (Percentages shown are based on Net Assets) | |
| | | | | | | | | | | | |
| Corporate Bonds | | | | | Par (000) | | | Value | |
Capital Markets (concluded) | | | | | | | | | | | | |
5.10%, 5/15/24 | | | USD | | | | 1,050 | | | $ | 1,091,287 | |
4.75%, 2/12/26 (a) | | | EUR | | | | 3,865 | | | | 4,622,790 | |
| | | | | | | | | | | | |
| | | | | | | | | | | | 101,322,733 | |
Chemicals — 0.5% | | | | | | | | | | | | |
Agrium, Inc.: | | | | | | | | | | | | |
3.15%, 10/01/22 | | | USD | | | | 2,371 | | | | 2,377,406 | |
4.13%, 3/15/35 | | | | | | | 1,763 | | | | 1,747,919 | |
Axalta Coating Systems U.S. Holdings, Inc./Axalta Coating Systems Dutch Holding B BV, 7.38%, 5/01/21 (b) | | | | | | | 630 | | | | 677,250 | |
The Dow Chemical Co.: | | | | | | | | | | | | |
4.38%, 11/15/42 | | | | | | | 1,117 | | | | 1,120,784 | |
4.63%, 10/01/44 | | | | | | | 1,711 | | | | 1,788,565 | |
Eastman Chemical Co.: | | | | | | | | | | | | |
2.70%, 1/15/20 | | | | | | | 3,138 | | | | 3,183,366 | |
3.60%, 8/15/22 | | | | | | | 3,664 | | | | 3,808,743 | |
4.80%, 9/01/42 | | | | | | | 1,821 | | | | 1,900,321 | |
Ecolab, Inc., 2.25%, 1/12/20 | | | | | | | 2,434 | | | | 2,449,217 | |
INEOS Group Holdings SA, 5.75%, 2/15/19 | | | EUR | | | | 150 | | | | 162,469 | |
LYB International Finance BV, 4.00%, 7/15/23 | | | USD | | | | 8,497 | | | | 9,000,617 | |
Monsanto Co., 3.60%, 7/15/42 | | | | | | | 1,188 | | | | 1,124,926 | |
PSPC Escrow Corp., 6.00%, 1/02/23 | | | EUR | | | | 1,167 | | | | 1,311,278 | |
Rockwood Specialties Group, Inc., 4.63%, 10/15/20 | | | USD | | | | 2,875 | | | | 2,993,594 | |
The Sherwin-Williams Co., 4.00%, 12/15/42 | | | | | | | 847 | | | | 862,749 | |
| | | | | | | | | | | | |
| | | | | | | | | | | | 34,509,204 | |
Commercial Services & Supplies — 0.2% | | | | | | | | | |
The ADT Corp., 4.88%, 7/15/42 | | | | | | | 587 | | | | 469,600 | |
Bilbao Luxembourg SA, 10.50% (10.50% Cash or 11.25% PIK), 12/01/18 (h) | | | EUR | | | | 745 | | | | 845,464 | |
GCL Holdings SCA, 9.38%, 4/15/18 | | | | | | | 290 | | | | 325,853 | |
IVS F. SpA, 7.13%, 4/01/20 | | | | | | | 110 | | | | 124,191 | |
Republic Services, Inc., 3.20%, 3/15/25 | | | USD | | | | 3,915 | | | | 3,931,788 | |
Transfield Services Ltd., 8.38%, 5/15/20 (b) | | | | | | | 200 | | | | 213,000 | |
Verisure Holding AB, 8.75%, 12/01/18 | | | EUR | | | | 300 | | | | 344,347 | |
Waste Management, Inc.: | | | | | | | | | | | | |
3.13%, 3/01/25 | | | USD | | | | 1,850 | | | | 1,867,827 | |
3.90%, 3/01/35 | | | | | | | 2,086 | | | | 2,137,975 | |
| | | | | | | | | | | | |
| | | | | | | | | | | | 10,260,045 | |
Communications Equipment — 0.1% | | | | | | | | | | | | |
Cisco Systems, Inc., 2.13%, 3/01/19 | | | | | | | 1,564 | | | | 1,596,024 | |
Juniper Networks, Inc., 3.30%, 6/15/20 | | | | | | | 2,303 | | | | 2,330,560 | |
| | | | | | | | | | | | |
| | | | | | | | | | | | 3,926,584 | |
Construction & Engineering — 0.1% | | | | | | | | | | | | |
Abengoa Finance SAU, 6.00%, 3/31/21 | | | EUR | | | | 3,126 | | | | 3,143,411 | |
Abengoa Greenfield SA, 5.50%, 10/01/19 | | | | | | | 450 | | | | 448,781 | |
Aldesa Financial Services SA, 7.25%, 4/01/21 | | | | | | | 255 | | | | 250,882 | |
Astaldi SpA, 7.13%, 12/01/20 | | | | | | | 565 | | | | 653,235 | |
Obrascon Huarte Lain SA, 5.50%, 3/30/23 | | | | | | | 2,150 | | | | 2,212,164 | |
Pratama Agung Pte Ltd., 6.50%, 2/24/20 | | | USD | | | | 800 | | | | 782,950 | |
| | | | | | | | | | | | |
| | | | | | | | | | | | 7,491,423 | |
Construction Materials — 0.1% | | | | | | | | | | | | |
Cemex Finance LLC, 5.25%, 4/01/21 | | | EUR | | | | 1,150 | | | | 1,289,085 | |
Cemex SAB de CV: | | | | | | | | | | | | |
4.75%, 1/11/22 | | | | | | | 665 | | | | 729,697 | |
4.38%, 3/05/23 | | | | | | | 679 | | | | 731,004 | |
Kerneos Corporate SAS: | | | | | | | | | | | | |
4.83%, 3/01/21 (a) | | | | | | | 180 | | | | 193,730 | |
5.75%, 3/01/21 | | | | | | | 244 | | | | 278,319 | |
Xefin Lux SCA, 3.79%, 6/01/19 (a) | | | | | | | 880 | | | | 947,399 | |
| | | | | | | | | | | | |
| | | | | | | | | | | | 4,169,234 | |
| | | | | | | | | | | | |
| Corporate Bonds | | | | | Par (000) | | | Value | |
Consumer Finance — 1.0% | | | | | | | | | | | | |
Ally Financial, Inc.: | | | | | | | | | | | | |
3.50%, 1/27/19 | | | USD | | | | 2,300 | | | $ | 2,271,250 | |
4.13%, 3/30/20 | | | | | | | 1,200 | | | | 1,192,500 | |
5.13%, 9/30/24 | | | | | | | 4,205 | | | | 4,336,406 | |
American Express Credit Corp.: | | | | | | | | | | | | |
1.13%, 6/05/17 | | | | | | | 8,159 | | | | 8,157,393 | |
2.25%, 8/15/19 | | | | | | | 5,094 | | | | 5,167,807 | |
Capital One NA/Mclean VA, 2.95%, 7/23/21 | | | | | | | 8,704 | | | | 8,828,398 | |
Discover Financial Services, 3.75%, 3/04/25 | | | | | | | 2,143 | | | | 2,158,723 | |
Ford Motor Credit Co. LLC: | | | | | | | | | | | | |
1.72%, 12/06/17 | | | | | | | 20,068 | | | | 20,023,569 | |
4.25%, 9/20/22 | | | | | | | 3,600 | | | | 3,881,315 | |
Hyundai Capital Services, Inc., 2.63%, 9/29/20 | | | | | | | 800 | | | | 803,360 | |
Synchrony Financial, 2.70%, 2/03/20 | | | | | | | 1,613 | | | | 1,620,010 | |
Toyota Motor Credit Corp., 2.75%, 5/17/21 | | | | | | | 10,343 | | | | 10,688,167 | |
| | | | | | | | | | | | |
| | | | | | | | | | | | 69,128,898 | |
Containers & Packaging — 0.1% | | | | | | | | | | | | |
Ardagh Packaging Finance PLC, 9.25%, 10/15/20 | | | EUR | | | | 146 | | | | 167,975 | |
Ardagh Packaging Finance PLC/Ardagh Holdings USA, Inc., 4.25%, 1/15/22 | | | | | | | 1,456 | | | | 1,596,869 | |
Reynolds Group Issuer, Inc./Reynolds Group Issuer LLC/Reynolds Group Issuer Luxembourg SA, 6.88%, 2/15/21 | | | USD | | | | 3,810 | | | | 4,010,025 | |
SGD Group SAS, 5.63%, 5/15/19 | | | EUR | | | | 526 | | | | 578,729 | |
SIG Combibloc Holdings SCA, 7.75%, 2/15/23 | | | | | | | 282 | | | | 320,533 | |
| | | | | | | | | | | | |
| | | | | | | | | | | | 6,674,131 | |
Distributors — 0.1% | | | | | | | | | | | | |
Rhino Bondco SpA, 7.25%, 11/15/20 | | | | | | | 2,668 | | | | 3,060,962 | |
VWR Funding, Inc., 7.25%, 9/15/17 | | | USD | | | | 4,651 | | | | 4,854,481 | |
| | | | | | | | | | | | |
| | | | | | | | | | | | 7,915,443 | |
Diversified Consumer Services — 0.0% | | | | | | | | | | | | |
Massachusetts Institute of Technology, 3.96%, 7/01/38 | | | | | | | 1,385 | | | | 1,488,642 | |
Diversified Financial Services — 0.9% | | | | | | | | | | | | |
Annington Finance No. 4 PLC, 1.53%, 1/10/23 (a) | | | GBP | | | | 1,016 | | | | 1,493,469 | |
APT Pipelines Ltd., 4.20%, 3/23/25 | | | USD | | | | 600 | | | | 607,219 | |
BP Capital Markets PLC, 2.24%, 5/10/19 | | | | | | | 6,977 | | | | 7,052,142 | |
BPE Financiaciones SA, 2.00%, 2/03/20 | | | EUR | | | | 9,900 | | | | 10,728,878 | |
FGA Capital Ireland PLC, 2.63%, 4/17/19 | | | | | | | 525 | | | | 595,528 | |
Fresenius Finance BV, 3.00%, 2/01/21 | | | | | | | 1,470 | | | | 1,728,793 | |
Gala Electric Casinos PLC, 11.50%, 6/01/19 | | | GBP | | | | 300 | | | | 467,287 | |
General Electric Capital Corp.: | | | | | | | | | | | | |
3.15%, 9/07/22 | | | USD | | | | 4,695 | | | | 4,855,569 | |
3.10%, 1/09/23 | | | | | | | 6,671 | | | | 6,871,017 | |
General Motors Financial Co., Inc.: | | | | | | | | | | | | |
2.75%, 5/15/16 | | | | | | | 3,270 | | | | 3,306,493 | |
2.63%, 7/10/17 | | | | | | | 6,640 | | | | 6,706,500 | |
4.75%, 8/15/17 | | | | | | | 4,115 | | | | 4,333,918 | |
Moody’s Corp., 4.50%, 9/01/22 | | | | | | | 2,830 | | | | 3,069,367 | |
Santander Issuances SAU, 2.50%, 3/18/25 | | | EUR | | | | 2,200 | | | | 2,420,142 | |
Shell International Finance BV, 3.63%, 8/21/42 | | | USD | | | | 1,738 | | | | 1,714,646 | |
Volvo Treasury AB, 4.50%, 6/10/75 (a) | | | EUR | | | | 875 | | | | 971,417 | |
Woodside Finance Ltd., 3.65%, 3/05/25 (b) | | | USD | | | | 3,905 | | | | 3,855,762 | |
| | | | | | | | | | | | |
| | | | | | | | | | | | 60,778,147 | |
Diversified Telecommunication Services — 1.3% | | | | | | | | | |
Altice Financing SA: | | | | | | | | | | | | |
5.25%, 2/15/23 | | | EUR | | | | 1,626 | | | | 1,851,065 | |
6.63%, 2/15/23 (b) | | | USD | | | | 350 | | | | 360,500 | |
See Consolidated Notes to Financial Statements.
| | | | | | |
| 40 | | BLACKROCK BALANCED CAPITAL FUND, INC. | | MARCH 31, 2015 | | |
| | | | |
| Consolidated Schedule of Investments (continued) | | | Master Total Return Portfolio | |
| | | (Percentages shown are based on Net Assets) | |
| | | | | | | | | | | | |
| Corporate Bonds | | | | | Par (000) | | | Value | |
Diversified Telecommunication Services (concluded) | | | | | |
AT&T Inc.: | | | | | | | | | | | | |
2.38%, 11/27/18 | | | USD | | | | 2,592 | | | $ | 2,625,364 | |
2.30%, 3/11/19 | | | | | | | 6,289 | | | | 6,337,155 | |
3.88%, 8/15/21 | | | | | | | 3,695 | | | | 3,914,450 | |
3.00%, 2/15/22 | | | | | | | 2,920 | | | | 2,929,983 | |
4.30%, 12/15/42 | | | | | | | 6,120 | | | | 5,853,811 | |
4.80%, 6/15/44 | | | | | | | 1,170 | | | | 1,198,116 | |
Level 3 Financing, Inc., 8.13%, 7/01/19 | | | | | | | 5,304 | | | | 5,575,830 | |
PCCW-HKT Capital No. 5 Ltd., 3.75%, 3/08/23 | | | | | | | 400 | | | | 405,435 | |
Telecom Italia Capital SA: | | | | | | | | | | | | |
6.38%, 11/15/33 | | | | | | | 709 | | | | 758,630 | |
6.00%, 9/30/34 | | | | | | | 595 | | | | 614,337 | |
7.72%, 6/04/38 | | | | | | | 400 | | | | 467,000 | |
Telecom Italia Finance SA: | | | | | | | | | | | | |
6.13%, 11/15/16 (g) | | | EUR | | | | 3,400 | | | | 5,114,514 | |
7.75%, 1/24/33 | | | | | | | 785 | | | | 1,264,329 | |
Telecom Italia SpA: | | | | | | | | | | | | |
4.88%, 9/25/20 | | | | | | | 600 | | | | 736,191 | |
4.50%, 1/25/21 | | | | | | | 1,190 | | | | 1,435,931 | |
3.50%, 1/16/23 | | | | | | | 840 | | | | 957,297 | |
5.88%, 5/19/23 | | | GBP | | | | 650 | | | | 1,078,750 | |
Telefonica SA, 5.50%, 7/24/17 (g) | | | EUR | | | | 1,200 | | | | 1,535,967 | |
Telenet Finance V Luxembourg SCA: | | | | | | | | | | | | |
6.25%, 8/15/22 | | | | | | | 100 | | | | 117,202 | |
6.75%, 8/15/24 | | | | | | | 200 | | | | 240,855 | |
Verizon Communications, Inc.: | | | | | | | | | | | | |
2.63%, 2/21/20 | | | USD | | | | 6,890 | | | | 7,009,610 | |
3.45%, 3/15/21 | | | | | | | 5,201 | | | | 5,439,445 | |
4.40%, 11/01/34 | | | | | | | 6,814 | | | | 6,941,108 | |
3.85%, 11/01/42 | | | | | | | 5,299 | | | | 4,813,696 | |
4.86%, 8/21/46 | | | | | | | 5,855 | | | | 6,129,804 | |
Wind Acquisition Finance SA: | | | | | | | | | | | | |
4.00%, 7/15/20 | | | EUR | | | | 4,643 | �� | | | 5,030,707 | |
4.08%, 7/15/20 (a) | | | | | | | 1,532 | | | | 1,643,158 | |
Ziggo Bond Finance BV, 4.63%, 1/15/25 | | | | | | | 2,725 | | | | 3,036,552 | |
| | | | | | | | | | | | |
| | | | | | | | | | | | 85,416,792 | |
Electric Utilities — 0.7% | | | | | | | | | | | | |
CE Energy AS, 7.00%, 2/01/21 | | | | | | | 735 | | | | 810,063 | |
The Chugoku Electric Power Co., Inc.: | | | | | | | | | | | | |
0.00%, 3/23/18 (g)(i) | | | JPY | | | | 20,000 | | | | 173,344 | |
0.00%, 3/25/20 (g)(i) | | | | | | | 10,000 | | | | 87,881 | |
Commonwealth Edison Co., 4.70%, 1/15/44 | | | USD | | | | 2,083 | | | | 2,479,512 | |
Duke Energy Carolinas LLC, 4.25%, 12/15/41 | | | | | | | 4,364 | | | | 4,801,412 | |
Duke Energy Corp., 3.75%, 4/15/24 | | | | | | | 1,040 | | | | 1,113,228 | |
Entergy Arkansas, Inc., 3.70%, 6/01/24 | | | | | | | 5,773 | | | | 6,180,528 | |
Florida Power & Light Co., 3.80%, 12/15/42 | | | | | | | 1,372 | | | | 1,430,038 | |
Georgia Power Co., 3.00%, 4/15/16 | | | | | | | 10,948 | | | | 11,219,795 | |
PacifiCorp, 3.60%, 4/01/24 | | | | | | | 8,349 | | | | 8,945,519 | |
Progress Energy, Inc., 4.88%, 12/01/19 | | | | | | | 671 | | | | 752,650 | |
Public Service Co. of Colorado, 2.50%, 3/15/23 | | | | | | | 3,670 | | | | 3,683,348 | |
Southern California Edison Co., 1.25%, 11/01/17 | | | | | | | 1,306 | | | | 1,307,772 | |
Trans-Allegheny Interstate Line Co., 3.85%, 6/01/25 (b) | | | | | | | 2,074 | | | | 2,166,347 | |
Viridian Group FundCo II Ltd., 7.50%, 3/01/20 | | | EUR | | | | 830 | | | | 914,542 | |
| | | | | | | | | | | | |
| | | | | | | | | | | | 46,065,979 | |
Electrical Equipment — 0.1% | | | | | | | | | | | | |
AE-Rotor Holding BV, 4.97%, 3/28/18 | | | USD | | | | 400 | | | | 411,814 | |
Rockwell Automation, Inc., 2.88%, 3/01/25 | | | | | | | 2,904 | | | | 2,927,383 | |
Trionista Holdco GmbH, 5.00%, 4/30/20 | | | EUR | | | | 405 | | | | 455,006 | |
| | | | | | | | | | | | |
| | | | | | | | | | | | 3,794,203 | |
Electronic Equipment, Instruments & Components — 0.0% | | | | | |
Belden, Inc., 5.50%, 4/15/23 | | | | | | | 676 | | | | 778,655 | |
| | | | | | | | | | | | |
| Corporate Bonds | | | | | Par (000) | | | Value | |
Energy Equipment & Services — 0.0% | | | | | | | | | | | | |
Ensco PLC, 5.75%, 10/01/44 | | | USD | | | | 653 | | | $ | 632,443 | |
Transocean, Inc.: | | | | | | | | | | | | |
6.50%, 11/15/20 | | | | | | | 800 | | | | 671,000 | |
6.80%, 3/15/38 | | | | | | | 673 | | | | 482,877 | |
| | | | | | | | | | | | |
| | | | | | | | | | | | 1,786,320 | |
Food & Staples Retailing — 0.1% | | | | | | | | | | | | |
Brakes Capital, 7.13%, 12/15/18 | | | GBP | | | | 350 | | | | 527,017 | |
CVS Health Corp., 5.30%, 12/05/43 | | | USD | | | | 1,515 | | | | 1,850,789 | |
Wal-Mart Stores, Inc.: | | | | | | | | | | | | |
2.55%, 4/11/23 | | | | | | | 2,283 | | | | 2,300,823 | |
4.00%, 4/11/43 | | | | | | | 1,644 | | | | 1,743,855 | |
| | | | | | | | | | | | |
| | | | | | | | | | | | 6,422,484 | |
Food Products — 0.0% | | | | | | | | | | | | |
Bakkavor Finance 2 PLC, 8.25%, 2/15/18 | | | GBP | | | | 300 | | | | 463,375 | |
Boparan Finance PLC: | | | | | | | | | | | | |
4.38%, 7/15/21 | | | EUR | | | | 124 | | | | 121,997 | |
5.50%, 7/15/21 | | | GBP | | | | 208 | | | | 272,292 | |
| | | | | | | | | | | | |
| | | | | | | | | | | | 857,664 | |
Health Care Equipment & Supplies — 0.7% | | | | | |
Abbott Laboratories, 2.95%, 3/15/25 | | | USD | | | | 7,513 | | | | 7,602,224 | |
Baxter International, Inc., 2.40%, 8/15/22 | | | | | | | 2,740 | | | | 2,645,475 | |
Becton Dickinson and Co.: | | | | | | | | | | | | |
1.80%, 12/15/17 | | | | | | | 1,287 | | | | 1,296,861 | |
2.68%, 12/15/19 | | | | | | | 4,315 | | | | 4,407,414 | |
3.13%, 11/08/21 | | | | | | | 2,365 | | | | 2,429,333 | |
4.69%, 12/15/44 | | | | | | | 600 | | | | 652,032 | |
Boston Scientific Corp., 2.65%, 10/01/18 | | | | | | | 3,150 | | | | 3,184,672 | |
CareFusion Corp., 1.45%, 5/15/17 | | | | | | | 3,277 | | | | 3,279,468 | |
Medtronic, Inc.: | | | | | | | | | | | | |
2.50%, 3/15/20 (b) | | | | | | | 2,901 | | | | 2,965,228 | |
3.13%, 3/15/22 | | | | | | | 2,665 | | | | 2,763,269 | |
3.63%, 3/15/24 | | | | | | | 3,363 | | | | 3,570,645 | |
4.63%, 3/15/44 | | | | | | | 3,910 | | | | 4,373,992 | |
Zimmer Holdings, Inc.: | | | | | | | | | | | | |
3.55%, 4/01/25 | | | | | | | 4,413 | | | | 4,504,534 | |
4.25%, 8/15/35 | | | | | | | 3,336 | | | | 3,441,094 | |
| | | | | | | | | | | | |
| | | | | | | | | | | | 47,116,241 | |
Health Care Providers & Services — 1.0% | | | | | |
Aetna, Inc.: | | | | | | | | | | | | |
4.50%, 5/15/42 | | | | | | | 2,295 | | | | 2,546,681 | |
4.13%, 11/07/42 | | | | | | | 1,120 | | | | 1,179,600 | |
AmerisourceBergen Corp.: | | | | | | | | | | | | |
1.15%, 5/15/17 | | | | | | | 8,885 | | | | 8,853,911 | |
3.25%, 3/01/25 | | | | | | | 960 | | | | 972,790 | |
4.25%, 3/01/45 | | | | | | | 960 | | | | 1,008,344 | |
Anthem, Inc.: | | | | | | | | | | | | |
1.88%, 1/15/18 (j) | | | | | | | 8,094 | | | | 8,139,003 | |
2.30%, 7/15/18 | | | | | | | 8,719 | | | | 8,846,132 | |
3.30%, 1/15/23 | | | | | | | 5,477 | | | | 5,563,674 | |
Care UK Health & Social Care PLC, 5.56%, 7/15/19 (a) | | | GBP | | | | 200 | | | | 280,361 | |
Cigna Corp., 3.30%, 4/15/25 | | | USD | | | | 5,763 | | | | 5,879,724 | |
Express Scripts Holding Co.: | | | | | | | | | | | | |
1.25%, 6/02/17 | | | | | | | 3,267 | | | | 3,263,936 | |
3.90%, 2/15/22 | | | | | | | 1,890 | | | | 2,006,823 | |
HCA, Inc., 5.25%, 4/15/25 | | | | | | | 4,205 | | | | 4,541,400 | |
IDH Finance PLC, 6.00%, 12/01/18 | | | GBP | | | | 309 | | | | 462,379 | |
Laboratory Corp. of America Holdings, 2.63%, 2/01/20 | | | USD | | | | 2,405 | | | | 2,420,060 | |
Priory Group No. 3 PLC, 7.00%, 2/15/18 | | | GBP | | | | 220 | | | | 339,287 | |
Tenet Healthcare Corp., 4.75%, 6/01/20 | | | USD | | | | 1,977 | | | | 2,003,571 | |
UnitedHealth Group, Inc.: | | | | | | | | | | | | |
2.88%, 12/15/21 | | | | | | | 2,559 | | | | 2,627,005 | |
See Consolidated Notes to Financial Statements.
| | | | | | |
| | | BLACKROCK BALANCED CAPITAL FUND, INC. | | MARCH 31, 2015 | | 41 |
| | | | |
| Consolidated Schedule of Investments (continued) | | | Master Total Return Portfolio | |
| | | (Percentages shown are based on Net Assets) | |
| | | | | | | | | | | | |
| Corporate Bonds | | | | | Par (000) | | | Value | |
Health Care Providers & Services (concluded) | | | | | | | | | | | | |
3.95%, 10/15/42 | | | USD | | | | 3,470 | | | $ | 3,552,482 | |
Voyage Care BondCo PLC, 11.00%, 2/01/19 | | | GBP | | | | 1,800 | | | | 2,870,365 | |
| | | | | | | | | | | | |
| | | | | | | | | | | | 67,357,528 | |
Hotels, Restaurants & Leisure — 0.3% | | | | | | | | | | | | |
Cirsa Funding Luxembourg SA, 8.75%, 5/15/18 | | | EUR | | | | 464 | | | | 512,010 | |
Gala Group Finance PLC, 8.88%, 9/01/18 | | | GBP | | | | 252 | | | | 392,031 | |
Intralot Capital Luxembourg SA, 6.00%, 5/15/21 | | | EUR | | | | 2,800 | | | | 2,649,405 | |
Intralot Finance Luxembourg SA, 9.75%, 8/15/18 | | | | | | | 1,575 | | | | 1,708,330 | |
Merlin Entertainments PLC, 2.75%, 3/15/22 | | | | | | | 525 | | | | 568,738 | |
PortAventura Entertainment Barcelona BV, 7.25%, 12/01/20 | | | | | | | 1,986 | | | | 2,242,415 | |
Punch Taverns Finance PLC: | | | | | | | | | | | | |
0.56%, 7/15/21 (a) | | | GBP | | | | 923 | | | | 1,218,057 | |
6.06%, 10/15/27 (a)(b) | | | | | | | 1,055 | | | | 1,515,230 | |
Stonegate Pub Co. Financing PLC, 5.75%, 4/15/19 | | | | | | | 400 | | | | 593,357 | |
The Unique Pub Finance Co. PLC: | | | | | | | | | | | | |
Series A3, 6.54%, 3/30/21 | | | | | | | 418 | | | | 647,214 | |
Series M, 7.40%, 3/28/24 | | | | | | | 650 | | | | 985,382 | |
Series A4, 5.66%, 6/30/27 | | | | | | | 3,361 | | | | 4,943,985 | |
Vougeot Bidco PLC, 7.88%, 7/15/20 | | | | | | | 1,800 | | | | 2,803,613 | |
| | | | | | | | | | | | |
| | | | | | | | | | | | 20,779,767 | |
Household Durables — 0.2% | | | | | | | | | | | | |
K. Hovnanian Enterprises, Inc., 7.25%, 10/15/20 (b) | | | USD | | | | 4,285 | | | | 4,499,250 | |
Magnolia BC SA, 9.00%, 8/01/20 | | | EUR | | | | 300 | | | | 333,864 | |
Newell Rubbermaid, Inc., 2.88%, 12/01/19 | | | USD | | | | 6,986 | | | | 7,119,146 | |
| | | | | | | | | | | | |
| | | | | | | | | | | | 11,952,260 | |
Household Products — 0.1% | | | | | | | | | | | | |
Kimberly-Clark Corp.: | | | | | | | | | | | | |
1.90%, 5/22/19 | | | | | | | 6,140 | | | | 6,204,445 | |
2.65%, 3/01/25 | | | | | | | 1,256 | | | | 1,258,242 | |
| | | | | | | | | | | | |
| | | | | | | | | | | | 7,462,687 | |
Independent Power and Renewable Electricity Producers — 0.0% | | | | | |
Abengoa Yield PLC, 7.00%, 11/15/19 (b) | | | | | | | 210 | | | | 216,300 | |
Greenko Dutch BV, 8.00%, 8/01/19 | | | | | | | 800 | | | | 738,000 | |
| | | | | | | | | | | | |
| | | | | | | | | | | | 954,300 | |
Industrial Conglomerates — 0.2% | | | | | | | | | | | | |
CITIC Ltd.: | | | | | | | | | | | | |
6.63%, 4/15/21 | | | | | | | 600 | | | | 698,214 | |
6.80%, 1/17/23 | | | | | | | 1,000 | | | | 1,185,000 | |
Eaton Corp., 2.75%, 11/02/22 | | | | | | | 4,683 | | | | 4,692,750 | |
General Electric Co., 4.50%, 3/11/44 | | | | | | | 6,192 | | | | 6,950,563 | |
| | | | | | | | | | | | |
| | | | | | | | | | | | 13,526,527 | |
Insurance — 1.2% | | | | | | | | | | | | |
Achmea BV, 6.00%, 4/04/43 (a) | | | EUR | | | | 769 | | | | 995,167 | |
Aflac, Inc., 3.63%, 6/15/23 | | | USD | | | | 1,688 | | | | 1,775,450 | |
The Allstate Corp., 3.15%, 6/15/23 | | | | | | | 1,906 | | | | 1,968,719 | |
American International Group, Inc.: | | | | | | | | | | | | |
3.88%, 1/15/35 | | | | | | | 1,705 | | | | 1,713,530 | |
4.50%, 7/16/44 | | | | | | | 2,294 | | | | 2,462,419 | |
4.38%, 1/15/55 | | | | | | | 1,556 | | | | 1,568,152 | |
Berkshire Hathaway Finance Corp., 4.30%, 5/15/43 | | | | | | | 1,582 | | | | 1,726,990 | |
Lincoln National Corp., 3.35%, 3/09/25 | | | | | | | 991 | | | | 1,002,340 | |
Loews Corp., 2.63%, 5/15/23 | | | | | | | 1,906 | | | | 1,861,018 | |
Manulife Financial Corp., 3.40%, 9/17/15 | | | | | | | 3,420 | | | | 3,462,124 | |
MassMutual Global Funding II, 2.35%, 4/09/19 (b) | | | | | | | 5,289 | | | | 5,391,601 | |
| | | | | | | | | | | | |
| Corporate Bonds | | | | | Par (000) | | | Value | |
Insurance (concluded) | | | | | | | | | | | | |
MetLife, Inc., 4.05%, 3/01/45 | | | USD | | | | 4,084 | | | $ | 4,229,464 | |
Metropolitan Life Global Funding I: | | | | | | | | | | | | |
1.30%, 4/10/17 (b) | | | | | | | 19,582 | | | | 19,691,228 | |
2.30%, 4/10/19 (b) | | | | | | | 9,169 | | | | 9,307,589 | |
Nippon Life Insurance Co., 5.10%, 10/16/44 (a) | | | | | | | 1,200 | | | | 1,300,500 | |
Pension Insurance Corp. PLC, 6.63%, 7/03/24 | | | GBP | | | | 225 | | | | 346,057 | |
Prudential Financial, Inc.: | | | | | | | | | | | | |
4.75%, 9/17/15 | | | USD | | | | 9,169 | | | | 9,332,621 | |
4.60%, 5/15/44 | | | | | | | 3,500 | | | | 3,710,913 | |
The Travelers Cos., Inc., 4.60%, 8/01/43 | | | | | | | 2,680 | | | | 3,117,389 | |
XLIT Ltd., 2.30%, 12/15/18 | | | | | | | 2,700 | | | | 2,742,619 | |
| | | | | | | | | | | | |
| | | | | | | | | | | | 77,705,890 | |
Internet & Catalog Retail — 0.1% | | | | | | | | | | | | |
Amazon.com, Inc., 2.60%, 12/05/19 | | | | | | | 4,271 | | | | 4,374,730 | |
Internet Software & Services — 0.0% | | | | | | | | | | | | |
Alibaba Group Holding Ltd., 3.60%, 11/28/24 | | | | | | | 1,100 | | | | 1,103,551 | |
Baidu, Inc., 3.50%, 11/28/22 | | | | | | | 800 | | | | 812,188 | |
Tencent Holdings Ltd., 3.80%, 2/11/25 | | | | | | | 500 | | | | 510,953 | |
United Group BV, 7.88%, 11/15/20 | | | EUR | | | | 300 | | | | 346,767 | |
| | | | | | | | | | | | |
| | | | | | | | | | | | 2,773,459 | |
IT Services — 0.1% | | | | | | | | | | | | |
MasterCard Inc., 3.38%, 4/01/24 | | | USD | | | | 3,836 | | | | 4,038,479 | |
Rolta Americas LLC, 8.88%, 7/24/19 (b) | | | | | | | 200 | | | | 191,500 | |
| | | | | | | | | | | | |
| | | | | | | | | | | | 4,229,979 | |
Life Sciences Tools & Services — 0.2% | | | | | | | | | | | | |
Thermo Fisher Scientific, Inc.: | | | | | | | | | | | | |
3.60%, 8/15/21 | | | | | | | 7,100 | | | | 7,411,001 | |
3.30%, 2/15/22 | | | | | | | 2,678 | | | | 2,745,935 | |
| | | | | | | | | | | | |
| | | | | | | | | | | | 10,156,936 | |
Machinery — 0.2% | | | | | | | | | | | | |
Caterpillar, Inc., 4.75%, 5/15/64 | | | | | | | 3,935 | | | | 4,321,885 | |
CNH Industrial Finance Europe SA, 2.75%, 3/18/19 | | | EUR | | | | 730 | | | | 803,383 | |
Gates Global LLC/Gates Global Co., 5.75%, 7/15/22 | | | | | | | 1,300 | | | | 1,289,488 | |
Ingersoll-Rand Luxembourg Finance SA, 2.63%, 5/01/20 | | | USD | | | | 2,795 | | | | 2,822,958 | |
John Deere Capital Corp., 3.35%, 6/12/24 | | | | | | | 4,843 | | | | 5,107,810 | |
Schaeffler Holding Finance BV, 5.75% (5.75% Cash or 6.50% PIK), 10/15/21 (h) | | | EUR | | | | 955 | | | | 1,107,725 | |
| | | | | | | | | | | | |
| | | | | | | | | | | | 15,453,249 | |
Media — 1.7% | | | | | | | | | | | | |
Altice SA: | | | | | | | | | | | | |
7.25%, 5/15/22 | | | | | | | 1,800 | | | | 2,016,731 | |
6.25%, 2/15/25 | | | | | | | 2,322 | | | | 2,496,096 | |
7.63%, 2/15/25 (b) | | | USD | | | | 200 | | | | 200,375 | |
CBS Corp.: | | | | | | | | | | | | |
2.30%, 8/15/19 | | | | | | | 3,620 | | | | 3,620,550 | |
3.50%, 1/15/25 | | | | | | | 2,248 | | | | 2,269,929 | |
Clear Channel Worldwide Holdings, Inc., 6.50%, 11/15/22 | | | | | | | 5,914 | | | | 6,224,485 | |
Cleopatra Finance Ltd.: | | | | | | | | | | | | |
6.25%, 2/15/22 (b) | | | | | | | 900 | | | | 879,750 | |
6.50%, 2/15/25 (b) | | | | | | | 350 | | | | 337,750 | |
Comcast Corp., 4.75%, 3/01/44 | | | | | | | 6,321 | | | | 7,273,347 | |
DIRECTV Holdings LLC/DIRECTV Financing Co., Inc.: | | | | | | | | | | | | |
4.60%, 2/15/21 | | | | | | | 8,186 | | | | 8,951,203 | |
6.38%, 3/01/41 | | | | | | | 1,621 | | | | 1,908,802 | |
5.15%, 3/15/42 | | | | | | | 1,950 | | | | 2,037,890 | |
See Consolidated Notes to Financial Statements.
| | | | | | |
| 42 | | BLACKROCK BALANCED CAPITAL FUND, INC. | | MARCH 31, 2015 | | |
| | | | |
| Consolidated Schedule of Investments (continued) | | | Master Total Return Portfolio | |
| | | (Percentages shown are based on Net Assets) | |
| | | | | | | | | | | | |
| Corporate Bonds | | | | | Par (000) | | | Value | |
Media (concluded) | | | | | | | | | | | | |
Discovery Communications LLC, 3.45%, 3/15/25 | | | USD | | | | 2,101 | | | $ | 2,099,311 | |
The Interpublic Group of Cos., Inc.: | | | | | | | | | | | | |
4.00%, 3/15/22 | | | | | | | 2,564 | | | | 2,685,980 | |
3.75%, 2/15/23 | | | | | | | 1,774 | | | | 1,837,617 | |
LGE HoldCo VI BV, 7.13%, 5/15/24 | | | EUR | | | | 3,586 | | | | 4,371,934 | |
NBCUniversal Media LLC, 4.45%, 1/15/43 | | | USD | | | | 4,967 | | | | 5,393,606 | |
Numericable-SFR, 5.38%, 5/15/22 | | | EUR | | | | 3,739 | | | | 4,201,661 | |
Numericable-SFR SAS, 5.63%, 5/15/24 | | | | | | | 2,933 | | | | 3,327,464 | |
Omnicom Group, Inc., 3.65%, 11/01/24 | | | USD | | | | 1,298 | | | | 1,342,724 | |
Scripps Networks Interactive, Inc., 2.75%, 11/15/19 | | | | | | | 4,520 | | | | 4,558,226 | |
Time Warner Cable, Inc.: | | | | | | | | | | | | |
6.55%, 5/01/37 | | | | | | | 3,534 | | | | 4,438,163 | |
5.50%, 9/01/41 | | | | | | | 5,569 | | | | 6,397,344 | |
4.50%, 9/15/42 | | | | | | | 3,687 | | | | 3,781,992 | |
Time Warner, Inc.: | | | | | | | | | | | | |
2.10%, 6/01/19 | | | | | | | 7,557 | | | | 7,595,382 | |
4.65%, 6/01/44 | | | | | | | 4,320 | | | | 4,653,737 | |
Unitymedia Hessen GmbH & Co. KG/Unitymedia NRW GmbH: | | | | | | | | | | | | |
5.13%, 1/21/23 | | | EUR | | | | 90 | | | | 103,769 | |
5.63%, 4/15/23 | | | | | | | 180 | | | | 209,995 | |
4.00%, 1/15/25 | | | | | | | 2,974 | | | | 3,329,561 | |
6.25%, 1/15/29 | | | | | | | 370 | | | | 449,560 | |
Unitymedia KabelBW GmbH, 9.50%, 3/15/21 | | | | | | | 340 | | | | 415,029 | |
Viacom, Inc.: | | | | | | | | | | | | |
2.75%, 12/15/19 | | | USD | | | | 5,064 | | | | 5,143,768 | |
4.50%, 3/01/21 | | | | | | | 2,920 | | | | 3,164,246 | |
4.85%, 12/15/34 | | | | | | | 1,254 | | | | 1,295,482 | |
Virgin Media Secured Finance PLC, 6.00%, 4/15/21 | | | GBP | | | | 1,746 | | | | 2,715,360 | |
| | | | | | | | | | | | |
| | | | | | | | | | | | 111,728,819 | |
Metals & Mining — 0.4% | | | | | | | | | | | | |
APERAM, 0.63%, 7/08/21 (g) | | | USD | | | | 1,000 | | | | 1,193,750 | |
Eco-Bat Finance PLC, 7.75%, 2/15/17 | | | EUR | | | | 300 | | | | 314,664 | |
Freeport-McMoRan, Inc.: | | | | | | | | | | | | |
4.00%, 11/14/21 | | | USD | | | | 4,195 | | | | 4,094,450 | |
5.40%, 11/14/34 | | | | | | | 3,860 | | | | 3,529,140 | |
JSW Steel Ltd., 4.88%, 11/12/19 | | | | | | | 600 | | | | 577,500 | |
Newmont Mining Corp., 3.50%, 3/15/22 | | | | | | | 2,982 | | | | 2,896,011 | |
Novelis, Inc., 8.75%, 12/15/20 | | | | | | | 8,380 | | | | 8,977,075 | |
Nucor Corp., 5.20%, 8/01/43 | | | | | | | 1,431 | | | | 1,610,251 | |
Steel Dynamics, Inc., 6.38%, 8/15/22 | | | | | | | 1,345 | | | | 1,435,787 | |
| | | | | | | | | | | | |
| | | | | | | | | | | | 24,628,628 | |
Multiline Retail — 0.1% | | | | | | | | | | | | |
Debenhams PLC, 5.25%, 7/15/21 | | | GBP | | | | 180 | | | | 264,299 | |
Hema Bondco I BV: | | | | | | | | | | | | |
5.28%, 6/15/19 (a) | | | EUR | | | | 675 | | | | 573,230 | |
6.25%, 6/15/19 | | | | | | | 1,400 | | | | 1,270,134 | |
Macy’s Retail Holdings, Inc., 4.50%, 12/15/34 | | | USD | | | | 2,201 | | | | 2,329,569 | |
Target Corp.: | | | | | | | | | | | | |
3.50%, 7/01/24 | | | | | | | 1,431 | | | | 1,519,267 | |
4.00%, 7/01/42 | | | | | | | 1,930 | | | | 2,044,733 | |
| | | | | | | | | | | | |
| | | | | | | | | | | | 8,001,232 | |
Multi-Utilities — 0.6% | | | | | | | | | | | | |
Berkshire Hathaway Energy Co.: | | | | | | | | | | | | |
2.40%, 2/01/20 | | | | | | | 1,702 | | | | 1,726,648 | |
3.50%, 2/01/25 | | | | | | | 1,790 | | | | 1,864,059 | |
CenterPoint Energy Houston Electric LLC, 4.50%, 4/01/44 | | | | | | | 1,585 | | | | 1,812,871 | |
CMS Energy Corp., 3.88%, 3/01/24 | | | | | | | 2,011 | | | | 2,150,201 | |
| | | | | | | | | | | | |
| Corporate Bonds | | | | | Par (000) | | | Value | |
Multi-Utilities (concluded) | | | | | | | | | | | | |
Consumers Energy Co., 3.95%, 5/15/43 | | | USD | | | | 1,442 | | | $ | 1,525,894 | |
Dominion Resources, Inc.: | | | | | | | | | | | | |
1.95%, 8/15/16 | | | | | | | 4,299 | | | | 4,350,051 | |
2.50%, 12/01/19 | | | | | | | 4,104 | | | | 4,170,719 | |
DTE Energy Co.: | | | | | | | | | | | | |
2.40%, 12/01/19 | | | | | | | 1,251 | | | | 1,271,336 | |
3.50%, 6/01/24 | | | | | | | 5,101 | | | | 5,299,852 | |
NiSource Finance Corp., 3.85%, 2/15/23 | | | | | | | 2,935 | | | | 3,097,602 | |
Pacific Gas & Electric Co.: | | | | | | | | | | | | |
4.75%, 2/15/44 | | | | | | | 1,921 | | | | 2,213,828 | |
4.30%, 3/15/45 | | | | | | | 1,348 | | | | 1,450,630 | |
PG&E Corp., 2.40%, 3/01/19 | | | | | | | 2,718 | | | | 2,752,380 | |
Sempra Energy, 2.88%, 10/01/22 | | | | | | | 1,470 | | | | 1,469,581 | |
Virginia Electric & Power Co.: | | | | | | | | | | | | |
3.45%, 2/15/24 | | | | | | | 1,023 | | | | 1,085,619 | |
4.45%, 2/15/44 | | | | | | | 1,442 | | | | 1,624,936 | |
| | | | | | | | | | | | |
| | | | | | | | | | | | 37,866,207 | |
Oil, Gas & Consumable Fuels — 2.9% | | | | | | | | | | | | |
Anadarko Petroleum Corp., 3.45%, 7/15/24 | | | | | | | 1,487 | | | | 1,489,367 | |
Berau Capital Resources Pte Ltd., 12.50%, 7/08/15 | | | | | | | 1,400 | | | | 980,000 | |
Chevron Corp.: | | | | | | | | | | | | |
2.19%, 11/15/19 | | | | | | | 1,277 | | | | 1,303,647 | |
1.96%, 3/03/20 | | | | | | | 13,610 | | | | 13,697,145 | |
Continental Resources, Inc.: | | | | | | | | | | | | |
3.80%, 6/01/24 | | | | | | | 1,900 | | | | 1,751,306 | |
4.90%, 6/01/44 | | | | | | | 2,809 | | | | 2,477,282 | |
Energy Transfer Partners LP: | | | | | | | | | | | | |
4.15%, 10/01/20 | | | | | | | 2,322 | | | | 2,437,670 | |
4.65%, 6/01/21 | | | | | | | 6,818 | | | | 7,284,658 | |
Enterprise Products Operating LLC: | | | | | | | | | | | | |
3.90%, 2/15/24 | | | | | | | 2,149 | | | | 2,248,348 | |
4.45%, 2/15/43 | | | | | | | 4,650 | | | | 4,721,243 | |
EOG Resources, Inc., 3.90%, 4/01/35 | | | | | | | 7,552 | | | | 7,744,040 | |
EP Energy LLC/Everest Acquisition Finance, Inc., 6.88%, 5/01/19 | | | | | | | 1,260 | | | | 1,291,500 | |
Exxon Mobil Corp., 1.82%, 3/15/19 | | | | | | | 6,236 | | | | 6,316,937 | |
Galp Energia SGPS SA, 3.00%, 1/14/21 | | | EUR | | | | 400 | | | | 444,808 | |
Indo Energy Finance II BV, 6.38%, 1/24/23 | | | USD | | | | 200 | | | | 132,000 | |
Kinder Morgan Energy Partners LP, 3.50%, 3/01/21 | | | | | | | 23,936 | | | | 24,126,100 | |
Kinder Morgan, Inc., 3.05%, 12/01/19 | | | | | | | 11,024 | | | | 11,133,402 | |
Laredo Petroleum, Inc.: | | | | | | | | | | | | |
9.50%, 2/15/19 | | | | | | | 2,280 | | | | 2,388,300 | |
7.38%, 5/01/22 | | | | | | | 655 | | | | 675,469 | |
Linn Energy LLC/Linn Energy Finance Corp., 6.25%, 11/01/19 | | | | | | | 4,880 | | | | 3,855,200 | |
Marathon Petroleum Corp., 4.75%, 9/15/44 | | | | | | | 1,512 | | | | 1,538,703 | |
MarkWest Energy Partners LP/MarkWest Energy Finance Corp., 4.50%, 7/15/23 | | | | | | | 1,105 | | | | 1,093,950 | |
MEG Energy Corp., 6.50%, 3/15/21 (b) | | | | | | | 910 | | | | 841,750 | |
MIE Holdings Corp.: | | | | | | | | | | | | |
6.88%, 2/06/18 | | | | | | | 200 | | | | 127,100 | |
7.50%, 4/25/19 | | | | | | | 400 | | | | 238,500 | |
Noble Energy, Inc., 4.15%, 12/15/21 | | | | | | | 7,397 | | | | 7,834,496 | |
Noble Holding International Ltd., 3.95%, 3/15/22 (k) | | | | | | | 1,681 | | | | 1,492,973 | |
Occidental Petroleum Corp., 3.13%, 2/15/22 | | | | | | | 3,548 | | | | 3,654,071 | |
Peabody Energy Corp., 6.00%, 11/15/18 | | | | | | | 614 | | | | 485,060 | |
Phillips 66, 4.88%, 11/15/44 | | | | | | | 1,717 | | | | 1,838,780 | |
Pioneer Natural Resources Co., 3.95%, 7/15/22 | | | | | | | 4,327 | | | | 4,450,237 | |
See Consolidated Notes to Financial Statements.
| | | | | | |
| | | BLACKROCK BALANCED CAPITAL FUND, INC. | | MARCH 31, 2015 | | 43 |
| | | | |
| Consolidated Schedule of Investments (continued) | | | Master Total Return Portfolio | |
| | | (Percentages shown are based on Net Assets) | |
| | | | | | | | | | | | |
| Corporate Bonds | | | | | Par (000) | | | Value | |
Oil, Gas & Consumable Fuels (concluded) | | | | | | | | | | | | |
Plains All American Pipeline LP/PAA Finance Corp.: | | | | | | | | | | | | |
2.60%, 12/15/19 | | | USD | | | | 7,302 | | | $ | 7,336,392 | |
2.85%, 1/31/23 | | | | | | | 2,648 | | | | 2,580,839 | |
4.90%, 2/15/45 | | | | | | | 1,885 | | | | 1,981,996 | |
Sabine Pass Liquefaction LLC: | | | | | | | | | | | | |
5.63%, 2/01/21 | | | | | | | 4,890 | | | | 4,922,078 | |
5.63%, 4/15/23 | | | | | | | 1,053 | | | | 1,050,367 | |
Sabine Pass LNG LP, 7.50%, 11/30/16 | | | | | | | 6,105 | | | | 6,486,563 | |
Southwestern Energy Co., 4.95%, 1/23/25 | | | | | | | 1,835 | | | | 1,866,347 | |
Spectra Energy Partners LP, 3.50%, 3/15/25 | | | | | | | 7,915 | | | | 7,954,425 | |
Sunoco Logistics Partners Operations LP, 3.45%, 1/15/23 | | | | | | | 3,573 | | | | 3,515,543 | |
TransCanada PipeLines Ltd.: | | | | | | | | | | | | |
1.88%, 1/12/18 | | | | | | | 1,793 | | | | 1,809,981 | |
2.50%, 8/01/22 | | | | | | | 2,210 | | | | 2,157,859 | |
4.63%, 3/01/34 | | | | | | | 1,804 | | | | 1,941,737 | |
Valero Energy Corp., 3.65%, 3/15/25 | | | | | | | 6,437 | | | | 6,583,023 | |
Western Gas Partners LP, 4.00%, 7/01/22 | | | | | | | 6,486 | | | | 6,593,077 | |
Williams Partners LP: | | | | | | | | | | | | |
4.00%, 11/15/21 | | | | | | | 7,196 | | | | 7,386,831 | |
3.60%, 3/15/22 | | | | | | | 3,915 | | | | 3,902,773 | |
4.50%, 11/15/23 | | | | | | | 1,195 | | | | 1,239,060 | |
4.90%, 1/15/45 | | | | | | | 4,668 | | | | 4,377,389 | |
Williams Partners LP/ACMP Finance Corp., 4.88%, 5/15/23 | | | | | | | 1,345 | | | | 1,355,087 | |
| | | | | | | | | | | | |
| | | | | | | | | | | | 195,135,409 | |
Paper & Forest Products — 0.1% | | | | | | | | | | | | |
International Paper Co.: | | | | | | | | | | | | |
3.65%, 6/15/24 | | | | | | | 2,271 | | | | 2,315,459 | |
4.80%, 6/15/44 | | | | | | | 3,262 | | | | 3,350,224 | |
| | | | | | | | | | | | |
| | | | | | | | | | | | 5,665,683 | |
Pharmaceuticals — 1.5% | | | | | | | | | | | | |
AbbVie, Inc.: | | | | | | | | | | | | |
2.90%, 11/06/22 | | | | | | | 3,301 | | | | 3,274,453 | |
4.40%, 11/06/42 | | | | | | | 3,664 | | | | 3,771,784 | |
Actavis Funding SCS: | | | | | | | | | | | | |
2.35%, 3/12/18 | | | | | | | 28,510 | | | | 28,895,569 | |
3.00%, 3/12/20 | | | | | | | 21,407 | | | | 21,901,181 | |
Bristol-Myers Squibb Co., 4.50%, 3/01/44 | | | | | | | 2,122 | | | | 2,411,354 | |
Eli Lilly & Co.: | | | | | | | | | | | | |
2.75%, 6/01/25 | | | | | | | 647 | | | | 649,856 | |
3.70%, 3/01/45 | | | | | | | 1,564 | | | | 1,564,433 | |
GlaxoSmithKline Capital PLC, 2.85%, 5/08/22 | | | | | | | 2,752 | | | | 2,794,595 | |
Merck & Co., Inc., 3.70%, 2/10/45 | | | | | | | 5,081 | | | | 5,105,028 | |
Merck KGaA, 3.00%, 12/12/74 (a) | | | EUR | | | | 775 | | | | 854,336 | |
Mylan, Inc., 3.13%, 1/15/23 (b) | | | USD | | | | 3,805 | | | | 3,757,171 | |
Novartis Capital Corp., 4.40%, 4/24/20 | | | | | | | 4,127 | | | | 4,620,536 | |
Pfizer, Inc.: | | | | | | | | | | | | |
4.30%, 6/15/43 | | | | | | | 2,014 | | | | 2,175,023 | |
4.40%, 5/15/44 | | | | | | | 1,591 | | | | 1,749,740 | |
Roche Holdings, Inc., 2.88%, 9/29/21 (b) | | | | | | | 2,845 | | | | 2,945,537 | |
Teva Pharmaceutical Finance Co. BV, 3.65%, 11/10/21 | | | | | | | 1,007 | | | | 1,060,569 | |
VRX Escrow Corp.: | | | | | | | | | | | | |
4.50%, 5/15/23 | | | EUR | | | | 3,725 | | | | 4,030,323 | |
6.13%, 4/15/25 (b) | | | USD | | | | 5,294 | | | | 5,479,290 | |
Zoetis, Inc., 3.25%, 2/01/23 | | | | | | | 1,835 | | | | 1,828,765 | |
| | | | | | | | | | | | |
| | | | | | | | | | | | 98,869,543 | |
Professional Services — 0.0% | | | | | | | | | | | | |
TMF Group Holding BV, 9.88%, 12/01/19 | | | EUR | | | | 1,326 | | | | 1,525,865 | |
Real Estate Investment Trusts (REITs) — 0.2% | | | | | | | | | | | | |
American Tower Corp.: | | | | | | | | | | | | |
3.45%, 9/15/21 | | | USD | | | | 4,650 | | | | 4,746,562 | |
| | | | | | | | | | | | |
| Corporate Bonds | | | | | Par (000) | | | Value | |
Real Estate Investment Trusts (REITs) (concluded) | | | | | | | | | |
5.90%, 11/01/21 | | | USD | | | | 623 | | | $ | 718,079 | |
3.50%, 1/31/23 | | | | | | | 657 | | | | 651,243 | |
5.00%, 2/15/24 | | | | | | | 659 | | | | 720,613 | |
ARC Properties Operating Partnership LP, 2.00%, 2/06/17 | | | | | | | 920 | | | | 891,940 | |
The Link Finance Cayman 2009 Ltd., 3.60%, 9/03/24 | | | | | | | 800 | | | | 819,040 | |
Omega Healthcare Investors, Inc., 4.50%, 4/01/27 (b) | | | | | | | 1,552 | | | | 1,517,080 | |
Simon Property Group LP, 4.25%, 10/01/44 | | | | | | | 2,073 | | | | 2,173,022 | |
Ventas Realty LP, 3.75%, 5/01/24 | | | | | | | 3,107 | | | | 3,191,871 | |
| | | | | | | | | | | | |
| | | | | | | | | | | | 15,429,450 | |
Real Estate Management & Development — 0.3% | | | | | | | | | |
Agile Property Holdings Ltd., 9.88%, 3/20/17 | | | | | | | 800 | | | | 793,600 | |
Annington Finance No. 5 PLC, 13.00% (13.00% Cash or 13.50% PIK), 1/15/23 (h) | | | GBP | | | | 266 | | | | 492,668 | |
Caifu Holdings Ltd., 8.75%, 1/24/20 | | | USD | | | | 600 | | | | 540,321 | |
Central Plaza Development Ltd., 7.13%, 12/31/49 (a) | | | | | | | 350 | | | | 355,233 | |
CIFI Holdings Group Co. Ltd., 8.88%, 1/27/19 | | | | | | | 200 | | | | 196,017 | |
Country Garden Holdings Co. Ltd.: | | | | | | | | | | | | |
7.88%, 5/27/19 | | | | | | | 600 | | | | 623,250 | |
7.88%, 3/09/20 | | | | | | | 1,000 | | | | 1,001,250 | |
7.25%, 4/04/21 | | | | | | | 600 | | | | 598,800 | |
Double Rosy Ltd., 3.97%, 11/18/19 | | | | | | | 1,400 | | | | 1,407,350 | |
Evergrande Real Estate Group Ltd., 8.75%, 10/30/18 | | | | | | | 400 | | | | 364,000 | |
Fantasia Holdings Group Co. Ltd.: | | | | | | | | | | | | |
13.75%, 9/27/17 | | | | | | | 400 | | | | 379,500 | |
10.63%, 1/23/19 | | | | | | | 1,000 | | | | 808,616 | |
Filinvest Development, 4.25%, 4/02/20 | | | | | | | 600 | | | | 577,608 | |
Greenland Global Investment Ltd., 3.50%, 10/17/17 | | | | | | | 800 | | | | 800,786 | |
KWG Property Holding Ltd., 8.25%, 8/05/19 | | | | | | | 600 | | | | 574,080 | |
Lodha Developers International Ltd., 12.00%, 3/13/20 | | | | | | | 550 | | | | 536,250 | |
Pakuwon Prima Pte Ltd., 7.13%, 7/02/19 | | | | | | | 200 | | | | 199,506 | |
RPG Byty Sro, 6.75%, 5/01/20 | | | EUR | | | | 1,280 | | | | 1,449,947 | |
Shui On Development Holding Ltd.: | | | | | | | | | | | | |
9.00%, 11/24/17 | | | USD | | | | 400 | | | | 398,745 | |
9.63%, 6/10/19 | | | | | | | 200 | | | | 198,500 | |
Sparkle Assets Ltd., 6.88%, 1/30/20 | | | | | | | 600 | | | | 613,500 | |
Sunac China Holdings Ltd., 9.38%, 4/05/18 | | | | | | | 800 | | | | 792,000 | |
Trillion Chance Ltd., 8.50%, 1/10/19 | | | | | | | 1,000 | | | | 907,695 | |
Vingroup JSC, 11.63%, 5/07/18 | | | | | | | 1,210 | | | | 1,276,550 | |
Wanda Properties International Co. Ltd., 7.25%, 1/29/24 | | | | | | | 2,400 | | | | 2,610,703 | |
| | | | | | | | | | | | |
| | | | | | | | | | | | 18,496,475 | |
Road & Rail — 0.4% | | | | | | | | | | | | |
Burlington Northern Santa Fe LLC: | | | | | | | | | | | | |
3.00%, 3/15/23 | | | | | | | 2,685 | | | | 2,738,909 | |
4.15%, 4/01/45 | | | | | | | 1,161 | | | | 1,207,720 | |
CSX Corp., 4.10%, 3/15/44 | | | | | | | 1,910 | | | | 1,989,248 | |
EC Finance PLC, 5.13%, 7/15/21 | | | EUR | | | | 300 | | | | 339,844 | |
Penske Truck Leasing Co. LP/PTL Finance Corp., 3.38%, 2/01/22 (b) | | | USD | | | | 4,197 | | | | 4,195,707 | |
Ryder System, Inc., 2.45%, 9/03/19 | | | | | | | 6,080 | | | | 6,090,676 | |
Union Pacific Corp.: | | | | | | | | | | | | |
3.38%, 2/01/35 | | | | | | | 519 | | | | 506,978 | |
4.82%, 2/01/44 | | | | | | | 2,327 | | | | 2,764,716 | |
3.88%, 2/01/55 | | | | | | | 650 | | | | 634,064 | |
Union Pacific Railroad Co. Pass-Through Trust, Series 2014-1, 3.23%, 5/14/26 | | | | | | | 3,355 | | | | 3,398,951 | |
| | | | | | | | | | | | |
| | | | | | | | | | | | 23,866,813 | |
See Consolidated Notes to Financial Statements.
| | | | | | |
| 44 | | BLACKROCK BALANCED CAPITAL FUND, INC. | | MARCH 31, 2015 | | |
| | | | |
| Consolidated Schedule of Investments (continued) | | | Master Total Return Portfolio | |
| | | (Percentages shown are based on Net Assets) | |
| | | | | | | | | | | | |
| Corporate Bonds | | | | | Par (000) | | | Value | |
Semiconductors & Semiconductor Equipment — 0.0% | | | | | | | | | |
Global A&T Electronics Ltd., 10.00%, 2/01/19 | | | USD | | | | 345 | | | $ | 337,238 | |
Semiconductor Manufacturing International Corp., 4.13%, 10/07/19 | | | | | | | 1,000 | | | | 1,008,800 | |
| | | | | | | | | | | | |
| | | | | | | | | | | | 1,346,038 | |
Software — 0.4% | | | | | | | | | | | | |
Adobe Systems, Inc., 3.25%, 2/01/25 | | | | | | | 1,987 | | | | 2,008,336 | |
First Data Corp., 7.38%, 6/15/19 (b) | | | | | | | 2,715 | | | | 2,837,175 | |
Microsoft Corp.: | | | | | | | | | | | | |
3.50%, 2/12/35 | | | | | | | 4,377 | | | | 4,365,467 | |
3.75%, 2/12/45 | | | | | | | 4,575 | | | | 4,592,431 | |
Oracle Corp.: | | | | | | | | | | | | |
2.80%, 7/08/21 | | | | | | | 10,087 | | | | 10,447,953 | |
4.30%, 7/08/34 | | | | | | | 3,518 | | | | 3,817,255 | |
| | | | | | | | | | | | |
| | | | | | | | | | | | 28,068,617 | |
Specialty Retail — 0.2% | | | | | | | | | | | | |
3AB Optique Developpement SAS, 5.63%, 4/15/19 | | | EUR | | | | 265 | | | | 272,830 | |
The Home Depot, Inc., 4.40%, 3/15/45 | | | USD | | | | 949 | | | | 1,059,591 | |
House of Fraser Funding PLC, 8.88%, 8/15/18 | | | GBP | | | | 491 | | | | 771,726 | |
Lion/Seneca France 2, 7.88%, 4/15/19 | | | EUR | | | | 690 | | | | 615,793 | |
Lowe’s Cos., Inc., 4.25%, 9/15/44 | | | USD | | | | 1,747 | | | | 1,894,470 | |
Marks & Spencer PLC, 4.75%, 6/12/25 | | | GBP | | | | 800 | | | | 1,338,555 | |
Punch Taverns Finance B Ltd., 5.94%, 9/30/22 | | | | | | | 1,092 | | | | 1,602,656 | |
QVC, Inc., 3.13%, 4/01/19 | | | USD | | | | 1,780 | | | | 1,792,239 | |
THOM Europe SAS, 7.38%, 7/15/19 | | | EUR | | | | 1,194 | | | | 1,341,616 | |
| | | | | | | | | | | | |
| | | | | | | | | | | | 10,689,476 | |
Technology Hardware, Storage & Peripherals — 0.4% | | | | | | | | | |
Apple Inc.: | | | | | | | | | | | | |
2.10%, 5/06/19 (l) | | | USD | | | | 19,801 | | | | 20,244,622 | |
3.45%, 2/09/45 | | | | | | | 1,581 | | | | 1,500,747 | |
Hewlett-Packard Co., 3.75%, 12/01/20 | | | | | | | 7,408 | | | | 7,788,527 | |
| | | | | | | | | | | | |
| | | | | | | | | | | | 29,533,896 | |
Thrifts & Mortgage Finance — 0.0% | | | | | | | | | | | | |
Achmea Bank NV, 2.75%, 2/18/21 | | | EUR | | | | 625 | | | | 738,315 | |
Tobacco — 0.3% | | | | | | | | | | | | |
Altria Group, Inc.: | | | | | | | | | | | | |
2.63%, 1/14/20 | | | USD | | | | 2,809 | | | | 2,854,054 | |
2.85%, 8/09/22 | | | | | | | 1,829 | | | | 1,818,253 | |
Lorillard Tobacco Co., 3.75%, 5/20/23 | | | | | | | 899 | | | | 915,329 | |
Philip Morris International, Inc.: | | | | | | | | | | | | |
1.13%, 8/21/17 | | | | | | | 5,933 | | | | 5,937,966 | |
4.88%, 11/15/43 | | | | | | | 2,729 | | | | 3,109,095 | |
Reynolds American, Inc.: | | | | | | | | | | | | |
3.25%, 11/01/22 | | | | | | | 2,642 | | | | 2,628,930 | |
4.75%, 11/01/42 | | | | | | | 2,357 | | | | 2,431,184 | |
| | | | | | | | | | | | |
| | | | | | | | | | | | 19,694,811 | |
Trading Companies & Distributors — 0.3% | | | | | | | | | | | | |
Air Lease Corp., 3.75%, 2/01/22 | | | | | | | 3,519 | | | | 3,576,057 | |
Aircastle Ltd., 6.25%, 12/01/19 | | | | | | | 2,565 | | | | 2,819,910 | |
GATX Corp., 2.60%, 3/30/20 | | | | | | | 2,415 | | | | 2,421,458 | |
H&E Equipment Services, Inc., 7.00%, 9/01/22 | | | | | | | 1,605 | | | | 1,653,150 | |
Monitchem HoldCo 2 SA, 6.88%, 6/15/22 | | | EUR | | | | 270 | | | | 271,446 | |
Noble Group Ltd., 6.75%, 1/29/20 | | | USD | | | | 350 | | | | 364,875 | |
United Rentals North America, Inc.: | | | | | | | | | | | | |
5.75%, 7/15/18 | | | | | | | 753 | | | | 785,003 | |
7.38%, 5/15/20 | | | | | | | 4,315 | | | | 4,662,897 | |
7.63%, 4/15/22 | | | | | | | 1,874 | | | | 2,050,156 | |
5.50%, 7/15/25 | | | | | | | 1,184 | | | | 1,206,200 | |
| | | | | | | | | | | | |
| | | | | | | | | | | | 19,811,152 | |
| | | | | | | | | | | | |
| Corporate Bonds | | | | | Par (000) | | | Value | |
Transportation Infrastructure — 0.1% | | | | | | | | | | | | |
Delhi International Airport Pvt Ltd., 6.50%, 2/03/22 | | | USD | | | | 275 | | | $ | 288,613 | |
Deutsche Raststaetten Gruppe IV GmbH, 6.75%, 12/30/20 | | | EUR | | | | 207 | | | | 240,382 | |
Gategroup Finance Luxembourg SA, 6.75%, 3/01/19 | | | | | | | 300 | | | | 340,315 | |
Goodman HK Finance, 4.38%, 6/19/24 | | | USD | | | | 400 | | | | 417,524 | |
HPHT Finance 15 Ltd., 2.88%, 3/17/20 | | | | | | | 1,200 | | | | 1,212,248 | |
Silk Bidco AS, 7.50%, 2/01/22 | | | EUR | | | | 2,110 | | | | 2,348,175 | |
| | | | | | | | | | | | |
| | | | | | | | | | | | 4,847,257 | |
Wireless Telecommunication Services — 0.6% | | | | | |
America Movil SAB de CV, 2.38%, 9/08/16 | | | USD | | | | 8,225 | | | | 8,359,808 | |
Crown Castle International Corp., 5.25%, 1/15/23 | | | | | | | 2,730 | | | | 2,866,500 | |
Orange SA, 4.00%, 12/31/49 (a) | | | EUR | | | | 575 | | | | 661,019 | |
Play Finance 1 SA, 6.50%, 8/01/19 | | | | | | | 905 | | | | 1,028,321 | |
Play Finance 2 SA, 5.25%, 2/01/19 | | | | | | | 710 | | | | 791,595 | |
Sprint Communications, Inc., 9.00%, 11/15/18 (b) | | | USD | | | | 13,015 | | | | 14,934,713 | |
Sprint Corp., 7.88%, 9/15/23 | | | | | | | 3,895 | | | | 3,972,900 | |
T-Mobile USA, Inc.: | | | | | | | | | | | | |
6.63%, 4/28/21 | | | | | | | 1,230 | | | | 1,288,425 | |
6.73%, 4/28/22 | | | | | | | 1,180 | | | | 1,241,950 | |
Vodafone Group PLC, 2.50%, 9/26/22 | | | | | | | 2,280 | | | | 2,205,045 | |
| | | | | | | | | | | | |
| | | | | | | | | | | | 37,350,276 | |
Total Corporate Bonds — 29.0% | | | | | | | | | | | 1,929,377,380 | |
| | | | | | | | | | | | |
| Floating Rate Loan Interests (a) | | | | | | | | | |
Capital Markets — 0.0% | | | | | | | | | | | | |
Yellow Maple Holding BV: | | | | | | | | | | | | |
Facility B3, 5.06%, 9/23/21 | | | GBP | | | | 320 | | | | 476,228 | |
Term Loan B (First Lien), 4.02%, 9/17/21 | | | EUR | | | | 560 | | | | 605,985 | |
| | | | | | | | | | | | |
| | | | | | | | | | | | 1,082,213 | |
Containers & Packaging — 0.0% | | | | | | | | | | | | |
Ardagh Holdings USA, Inc. (Ardagh Packaging Finance SA), New Term Loan, 4.00%, 12/17/19 | | | USD | | | | 505 | | | | 506,162 | |
Constantia Flexibles Group GmbH (AKA Constantinople Acquisition GmbH), Term Loan B1 Euro, 3.75%, 4/29/22 | | | EUR | | | | 1,994 | | | | 2,163,987 | |
| | | | | | | | | | | | |
| | | | | | | | | | | | 2,670,149 | |
Diversified Consumer Services — 0.1% | | | | | | | | | | | | |
Nelson Bidco Ltd.: | | | | | | | | | | | | |
Initial Term Loan (First Lien),
5.28% - 5.43%, 12/10/21 | | | GBP | | | | 1,461 | | | | 2,174,523 | |
Initial Term Loan (Second Lien), 8.25%, 12/09/22 | | | | | | | 730 | | | | 1,082,877 | |
| | | | | | | | | | | | |
| | | | | | | | | | | | 3,257,400 | |
Diversified Telecommunication Services — 0.4% | | | | | | | | | |
Altice Financing SA, Euro Denominated Tranche Loan, 5.25%, 2/04/22 | | | EUR | | | | 1,785 | | | | 1,939,307 | |
Intelsat Jackson Holdings SA, Tranche B-2 Term Loan, 3.75%, 6/30/19 | | | USD | | | | 12,002 | | | | 11,951,432 | |
Level 3 Financing, Inc., Tranche B 2020 Term Loan, 4.00%, 1/15/20 | | | | | | | 8,090 | | | | 8,103,510 | |
Livister Investments S.L.U., Facility B, 4.79%, 6/28/21 | | | EUR | | | | 930 | | | | 1,004,148 | |
Virgin Media Investment Holdings Ltd., E Facility, 4.25%, 6/30/23 | | | GBP | | | | 810 | | | | 1,202,546 | |
See Consolidated Notes to Financial Statements.
| | | | | | |
| | | BLACKROCK BALANCED CAPITAL FUND, INC. | | MARCH 31, 2015 | | 45 |
| | | | |
| Consolidated Schedule of Investments (continued) | | | Master Total Return Portfolio | |
| | | (Percentages shown are based on Net Assets) | |
| | | | | | | | | | | | |
| Floating Rate Loan Interests (a) | | | | | Par (000) | | | Value | |
Diversified Telecommunication Services (concluded) | | | | | |
Ziggo BV: | | | | | | | | | | | | |
EUR B1 Facility, 3.75%, 1/15/22 | | | EUR | | | | 631 | | | $ | 677,940 | |
EUR B2 Facility, 3.50% - 3.75%, 1/15/22 | | | | | | | 407 | | | | 436,739 | |
EUR B3 Facility, 2.75% - 3.75%, 1/15/22 | | | | | | | 1,142 | | | | 1,227,083 | |
| | | | | | | | | | | | |
| | | | | | | | | | | | 26,542,705 | |
Food & Staples Retailing — 0.0% | | | | | | | | | | | | |
Bestway UK Holdco Ltd., Facility B, 5.26%, 10/06/21 | | | GBP | | | | 700 | | | | 1,043,089 | |
Food Products — 0.0% | | | | | | | | | | | | |
Charger OpCo BV, Term B-1 EUR Loan,
0.00% - 3.50%, 7/23/21 | | | EUR | | | | 1,470 | | | | 1,586,760 | |
Iglo Foods Midco Ltd., Facility B2, 5.26%, 6/30/20 | | | GBP | | | | 435 | | | | 646,992 | |
| | | | | | | | | | | | |
| | | | | | | | | | | | 2,233,752 | |
Health Care Equipment & Supplies — 0.0% | | | | | | | | | |
Auris Luxembourg III S.à r.l. (AKA Siemens Audiology), Facility B1 (EUR), 5.50%, 1/17/22 | | | EUR | | | | 680 | | | | 740,614 | |
Health Care Providers & Services — 0.0% | | | | | | | | | |
Emdeon, Inc., Term B-2 Loan, 3.75%, 11/02/18 | | | USD | | | | 911 | | | | 912,037 | |
Hotels, Restaurants & Leisure — 0.3% | | | | | | | | | |
Caesars Entertainment Resort Properties LLC, Term B Loan, 7.00%, 10/11/20 | | | | | | | 5,713 | | | | 5,401,689 | |
Hilton Worldwide Finance LLC, Initial Term Loan, 3.50%, 10/26/20 | | | | | | | 10,619 | | | | 10,628,279 | |
| | | | | | | | | | | | |
| | | | | | | | | | | | 16,029,968 | |
Insurance — 0.0% | | | | | | | | | | | | |
Saga Mid Co. Ltd., Facility A, 2.81%, 4/25/19 | | | GBP | | | | 680 | | | | 965,212 | |
Internet Software & Services — 0.0% | | | | | | | | | | | | |
Nassa Midco AS, Facility B (EUR), 4.25%, 7/09/21 | | | EUR | | | | 1,300 | | | | 1,402,768 | |
Leisure Products — 0.0% | | | | | | | | | | | | |
PAW Luxco II S.à r.l. (Jack Wolfskin), Facility B, 5.00%, 7/29/18 | | | | | | | 1,000 | | | | 990,796 | |
Life Sciences Tools & Services — 0.0% | | | | | | | | | | | | |
Pharmaceutical Product Development, Inc. (Jaguar Holdings LLC), 2013 Term Loan, 4.00%, 12/05/18 | | | USD | | | | 968 | | | | 967,319 | |
Machinery — 0.1% | | | | | | | | | | | | |
Onex Wizard Acquisition Co. II SCA, Initial Euro Term Loan, 5.25%, 3/11/22 | | | EUR | | | | 5,720 | | | | 6,206,559 | |
Schaeffler AG (FKA named INA Beteiligungsge-sellschaft mit beschränkter Haftung), Facility B-EUR, 4.25%, 5/15/20 | | | | | | | 860 | | | | 932,174 | |
| | | | | | | | | | | | |
| | | | | | | | | | | | 7,138,733 | |
Media — 0.2% | | | | | | | | | | | | |
Charter Communications Operating LLC (AKA CCO Safari LLC), Term G Loan, 4.25%, 9/10/21 | | | USD | | | | 6,055 | | | | 6,102,108 | |
Numericable Group SA, Euro Denominated Tranche B-1 Loan, 4.50%, 5/21/20 | | | EUR | | | | 918 | | | | 991,480 | |
Springer Science+Business Media Deutschland GmbH, Term Loan B8, 4.75%, 8/14/20 | | | | | | | 3,070 | | | | 3,324,937 | |
| | | | | | | | | | | | |
| | | | | | | | | | | | 10,418,525 | |
Oil, Gas & Consumable Fuels — 0.0% | | | | | | | | | | | | |
Obsidian Natural Gas Trust, Loan, 7.00%, 11/02/15 | | | USD | | | | 2,043 | | | | 2,052,766 | |
| | | | | | | | | | | | |
| Floating Rate Loan Interests (a) | | | | | Par (000) | | | Value | |
Professional Services — 0.1% | | | | | | | | | | | | |
Wood Mackenzie Ltd: Tl-C 1210083, Term Loan, 5.00%, 8/15/19 | | | GBP | | | | 2,750 | | | $ | 4,079,331 | |
Real Estate Management & Development — 0.0% | | | | | |
Realogy Group LLC (FKA Realogy Corp.), Extended Synthetic Commitment, 0.03% - 4.40%, 10/10/16 | | | USD | | | | 82 | | | | 81,350 | |
Road & Rail — 0.1% | | | | | | | | | | | | |
Car Rentals Subsidiary SLU (AKA Goldcar), Facility B, 6.50%, 6/18/20 | | | EUR | | | | 3,580 | | | | 3,706,645 | |
Software — 0.1% | | | | | | | | | | | | |
First Data Corp., 2018 New Dollar Term Loan, 3.67%, 3/23/18 | | | USD | | | | 6,090 | | | | 6,083,801 | |
Specialty Retail — 0.0% | | | | | | | | | | | | |
Action Holding BV (FKA Peer Holdings BV), Term B (A2), 4.78%, 1/13/21 | | | EUR | | | | 1,100 | | | | 1,192,008 | |
Textiles, Apparel & Luxury Goods — 0.0% | | | | | | | | | | | | |
Vivarte Sas, Term Loan, 4.00%, 10/20/19 | | | | | | | 1,000 | | | | 1,016,107 | |
Total Floating Rate Loan Interests — 1.4% | | | | | | | | 94,607,288 | |
| | | | | | | | | | | | |
| Foreign Agency Obligations | | | | | | | | | |
Brazil — 0.1% | | | | | | | | | | | | |
Petrobras Global Finance BV: | | | | | | | | | | | | |
6.25%, 12/14/26 | | | GBP | | | | 800 | | | | 1,023,080 | |
5.38%, 10/01/29 | | | | | | | 185 | | | | 227,311 | |
6.63%, 1/16/34 | | | | | | | 530 | | | | 658,712 | |
7.25%, 3/17/44 | | | USD | | | | 2,187 | | | | 2,053,549 | |
| | | | | | | | | | | | |
| | | | | | | | | | | | 3,962,652 | |
British Virgin Islands — 0.1% | | | | | | | | | | | | |
China Cinda Finance 2014 Ltd., 5.63%, 5/14/24 | | | | | | | 400 | | | | 437,329 | |
CNOOC Finance 2012 Ltd., 5.00%, 5/02/42 | | | | | | | 300 | | | | 332,963 | |
Huarong Finance II Co. Ltd., 5.50%, 1/16/25 | | | | | | | 1,800 | | | | 1,917,659 | |
| | | | | | | | | | | | |
| | | | | | | | | | | | 2,687,951 | |
China — 0.1% | | | | | | | | | | | | |
CDBL Funding 1, 4.25%, 12/02/24 | | | USD | | | | 1,400 | | | | 1,427,042 | |
CNOOC Nexen Finance 2014 ULC, 4.25%, 4/30/24 | | | | | | | 1,549 | | | | 1,646,703 | |
COSCO Finance 2011 Ltd., 4.00%, 12/03/22 | | | | | | | 200 | | | | 206,094 | |
Eastern Creation II Investment Holdings Ltd., 3.25%, 1/20/20 | | | | | | | 1,200 | | | | 1,222,440 | |
Huarong Finance II Co. Ltd., 4.70%, 1/16/20 | | | | | | | 1,000 | | | | 1,045,923 | |
| | | | | | | | | | | | |
| | | | | | | | | | | | 5,548,202 | |
Germany — 0.1% | | | | | | | | | | | | |
HSH Nordbank AG: | | | | | | | | | | | | |
0.88%, 2/14/17 (a) | | | EUR | | | | 4,090 | | | | 3,710,606 | |
0.92%, 2/14/17 (a) | | | | | | | 1,993 | | | | 1,810,805 | |
| | | | | | | | | | | | |
| | | | | | | | | | | | 5,521,411 | |
India — 0.0% | | | | | | | | | | | | |
IDBI Bank Ltd., 4.44%, 4/23/20 | | | USD | | | | 400 | | | | 406,442 | |
Syndicate Bank, 3.88%, 12/04/19 | | | | | | | 200 | | | | 204,435 | |
| | | | | | | | | | | | |
| | | | | | | | | | | | 610,877 | |
See Consolidated Notes to Financial Statements.
| | | | | | |
| 46 | | BLACKROCK BALANCED CAPITAL FUND, INC. | | MARCH 31, 2015 | | |
| | | | |
| Consolidated Schedule of Investments (continued) | | | Master Total Return Portfolio | |
| | | (Percentages shown are based on Net Assets) | |
| | | | | | | | | | | | |
| Foreign Agency Obligations | | | | | Par (000) | | | Value | |
Indonesia — 0.0% | | | | | | | | | | | | |
Pertamina Persero PT, 6.45%, 5/30/44 | | | USD | | | | 200 | | | $ | 215,420 | |
Malaysia — 0.0% | | | | | | | | | | | | |
1MDB Global Investments Ltd., 4.40%, 3/09/23 | | | | | | | 1,800 | | | | 1,633,770 | |
Cagamas Global PLC, 2.75%, 12/10/19 | | | | | | | 400 | | | | 404,180 | |
Petronas Capital Ltd., 3.50%, 3/18/25 | | | | | | | 200 | | | | 202,447 | |
| | | | | | | | | | | | |
| | | | | | | | | | | | 2,240,397 | |
Norway — 0.1% | | | | | | | | | | | | |
Eksportfinans ASA, 5.50%, 6/26/17 | | | | | | | 275 | | | | 292,875 | |
Statoil ASA, 2.90%, 11/08/20 | | | | | | | 6,595 | | | | 6,908,896 | |
| | | | | | | | | | | | |
| | | | | | | | | | | | 7,201,771 | |
Singapore — 0.0% | | | | | | | | | | | | |
BOC Aviation Pte Ltd., 3.00%, 3/30/20 | | | | | | | 400 | | | | 399,274 | |
South Korea — 0.0% | | | | | | | | | | | | |
Korea East-West Power Co. Ltd., 2.50%, 6/02/20 | | | | | | | 800 | | | | 808,115 | |
Sri Lanka — 0.0% | | | | | | | | | | | | |
SriLankan Airlines Ltd., 5.30%, 6/27/19 | | | | | | | 400 | | | | 392,000 | |
United Arab Emirates — 0.0% | | | | | | | | | | | | |
Abu Dhabi National Energy Co. PJSC, 3.63%, 1/12/23 | | | | | | | 600 | | | | 609,750 | |
United States — 0.0% | | | | | | | | | | | | |
Export-Import Bank of India, 2.75%, 4/01/20 | | | | | | | 800 | | | | 796,248 | |
Petronas Capital Ltd., 4.50%, 3/18/45 | | | | | | | 500 | | | | 501,467 | |
| | | | | | | | | | | | |
| | | | | | | | | | | | 1,297,715 | |
Total Foreign Agency Obligations — 0.5% | | | | | | | | | | | 31,495,535 | |
| | | | | | | | | | | | |
| Foreign Government Obligations | | | | | | | | | |
Brazil — 0.2% | | | | | | | | | | | | |
Federative Republic of Brazil, 4.25%, 1/07/25 | | | | | | | 11,595 | | | | 11,363,100 | |
Colombia — 0.1% | | | | | | | | | | | | |
Republic of Colombia: | | | | | | | | | | | | |
4.38%, 3/21/23 | | | COP | | | | 813,000 | | | | 284,412 | |
4.00%, 2/26/24 | | | USD | | | | 7,250 | | | | 7,474,750 | |
| | | | | | | | | | | | |
| | | | | | | | | | | | 7,759,162 | |
Germany — 0.1% | | | | | | | | | | | | |
Deutsche Bundesrepublik Inflation Linked Bond, 0.10%, 4/15/23 | | | EUR | | | | 1,800 | | | | 2,170,871 | |
Greece — 0.0% | | | | | | | | | | | | |
Hellenic Republic: | | | | | | | | | | | | |
3.38%, 7/17/17 | | | | | | | 1,529 | | | | 1,148,156 | |
3.00%, 2/24/24 (c) | | | | | | | 1,610 | | | | 946,604 | |
| | | | | | | | | | | | |
| | | | | | | | | | | | 2,094,760 | |
Indonesia — 0.2% | | | | | | | | | | | | |
Republic of Indonesia: | | | | | | | | | | | | |
5.38%, 10/17/23 (b) | | | | | | | 1,480 | | | | 1,655,750 | |
5.38%, 10/17/23 | | | USD | | | | 1,200 | | | | 1,348,920 | |
5.88%, 1/15/24 (b) | | | | | | | 2,720 | | | | 3,145,000 | |
8.38%, 3/15/24 | | | IDR | | | | 53,992,000 | | | | 4,383,366 | |
4.13%, 1/15/25 | | | USD | | | | 1,200 | | | | 1,237,440 | |
8.38%, 3/15/34 | | | IDR | | | | 32,158,000 | | | | 2,609,533 | |
5.13%, 1/15/45 | | | USD | | | | 400 | | | | 420,000 | |
| | | | | | | | | | | | |
| | | | | | | | | | | | 14,800,009 | |
| | | | | | | | | | | | |
| Foreign Government Obligations | | | | | Par (000) | | | Value | |
Italy — 0.7% | | | | | | | | | | | | |
Buoni Poliennali Del Tesoro: | | | | | | | | | | | | |
5.50%, 9/01/22 | | | USD | | | | 7,480 | | | $ | 10,617,125 | |
5.50%, 11/01/22 | | | | | | | 6,200 | | | | 8,839,457 | |
3.10%, 9/15/26 | | | | | | | 1,800 | | | | 2,701,557 | |
Buoni Poliennali Del Tesoro Inflation Linked Bond: | | | | | | | | | | | | |
2.35%, 9/15/19 | | | EUR | | | | 11,677 | | | | 15,382,264 | |
2.10%, 9/15/21 | | | | | | | 7,055 | | | | 9,313,810 | |
| | | | | | | | | | | | |
| | | | | | | | | | | | 46,854,213 | |
Mexico — 1.0% | | | | | | | | | | | | |
United Mexican States: | | | | | | | | | | | | |
4.75%, 6/14/18 | | | MXN | | | | 202,600 | | | | 13,289,118 | |
5.00%, 12/11/19 | | | | | | | 49,600 | | | | 3,212,773 | |
6.50%, 6/09/22 | | | | | | | 116,000 | | | | 7,949,333 | |
4.00%, 10/02/23 | | | USD | | | | 27,891 | | | | 29,508,678 | |
8.00%, 12/07/23 | | | MXN | | | | 105,000 | | | | 7,853,354 | |
4.60%, 1/23/46 | | | USD | | | | 2,870 | | | | 2,934,575 | |
| | | | | | | | | | | | |
| | | | | | | | | | | | 64,747,831 | |
Peru — 0.1% | | | | | | | | | | | | |
Republic of Peru, 7.35%, 7/21/25 | | | | | | | 4,020 | | | | 5,467,200 | |
Portugal — 0.0% | | | | | | | | | | | | |
Republic of Portugal, 5.13%, 10/15/24 | | | | | | | 875 | | | | 967,995 | |
Slovenia — 0.1% | | | | | | | | | | | | |
Republic of Slovenia: | | | | | | | | | | | | |
4.13%, 2/18/19 (b) | | | | | | | 1,556 | | | | 1,645,069 | |
5.50%, 10/26/22 (b) | | | | | | | 2,189 | | | | 2,522,910 | |
5.25%, 2/18/24 (b) | | | | | | | 1,346 | | | | 1,544,871 | |
| | | | | | | | | | | | |
| | | | | | | | | | | | 5,712,850 | |
South Africa — 0.1% | | | | | | | | | | | | |
Republic of South Africa: | | | | | | | | | | | | |
7.75%, 2/28/23 | | | ZAR | | | | 67,545 | | | | 5,621,789 | |
8.00%, 1/31/30 | | | | | | | 37,525 | | | | 3,050,202 | |
| | | | | | | | | | | | |
| | | | | | | | | | | | 8,671,991 | |
Spain — 0.3% | | | | | | | | | | | | |
Kingdom of Spain: | | | | | | | | | | | | |
5.40%, 1/31/23 | | | EUR | | | | 14,140 | | | | 20,222,806 | |
4.40%, 10/31/23 | | | | | | | 907 | | | | 1,239,205 | |
| | | | | | | | | | | | |
| | | | | | | | | | | | 21,462,011 | |
Sri Lanka — 0.0% | | | | | | | | | | | | |
Republic of Sri Lanka, 6.25%, 10/04/20 | | | USD | | | | 700 | | | | 722,750 | |
Turkey — 0.2% | | | | | | | | | | | | |
Turkey Government International Bond, 5.75%, 3/22/24 | | | | | | | 12,910 | | | | 14,357,211 | |
Vietnam — 0.0% | | | | | | | | | | | | |
Socialist Republic of Vietnam, 5.13%, 11/19/24 | | | | | | | 200 | | | | 208,250 | |
Total Foreign Government Obligations — 3.1% | | | | | | | | | | | 207,360,204 | |
| | | | | | | | | | | | |
| | | | | | | | | | |
See Consolidated Notes to Financial Statements.
| | | | | | |
| | | BLACKROCK BALANCED CAPITAL FUND, INC. | | MARCH 31, 2015 | | 47 |
| | | | |
| Consolidated Schedule of Investments (continued) | | | Master Total Return Portfolio | |
| | | (Percentages shown are based on Net Assets) | |
| | | | | | | | | | | | |
| Non-Agency Mortgage-Backed Securities | | | | | Par
(000) | | | Value | |
Collateralized Mortgage Obligations — 2.5% | | | | | | | | | | | | |
Bear Stearns Mortgage Funding Trust, Series 2007-AR1, Class 2A3, 0.37%, 2/25/37 (a) | | | USD | | | | 3,587 | | | $ | 2,706,906 | |
Berica 8 Residential Mbs Srl, Series 8, Class A, 0.62%, 3/31/48 (a) | | | EUR | | | | 403 | | | | 425,968 | |
BlackRock Capital Finance LP, Series 1997-R2, Class AP, 1.36%, 12/25/35 (a)(b)(m) | | | USD | | | | 7 | | | | 7,089 | |
Citigroup Mortgage Loan Trust, Series 2007-2, Class 2A, 6.00%, 11/25/36 | | | | | | | 155 | | | | 144,891 | |
Collateralized Mortgage Obligation Trust, Series 57, Class D, 9.90%, 2/01/19 | | | | | | | 4 | | | | 4,299 | |
Countrywide Alternative Loan Trust: | | | | | | | | | | | | |
Series 2005-56, Class 4A1, 0.48%, 11/25/35 (a) | | | | | | | 3,968 | | | | 3,300,212 | |
Series 2005-72, Class A3, 0.47%, 1/25/36 (a) | | | | | | | 1,379 | | | | 1,107,465 | |
Series 2006-23CB, Class 2A5, 0.57%, 8/25/36 (a) | | | | | | | 10,921 | | | | 5,514,094 | |
Series 2006-OA14, Class 1A1, 1.84%, 11/25/46 (a) | | | | | | | 6,804 | | | | 5,782,367 | |
Series 2006-OA21, Class A1, 0.37%, 3/20/47 (a) | | | | | | | 19,321 | | | | 15,214,883 | |
Series 2006-OA6, Class 1A2, 0.38%, 7/25/46 (a) | | | | | | | 7,638 | | | | 6,543,591 | |
Series 2007-22, Class 2A16, 6.50%, 9/25/37 | | | | | | | 19,567 | | | | 15,681,859 | |
Countrywide Home Loan Mortgage Pass-Through Trust: | | | | | | | | | | | | |
Series 2004-29, Class 1A1,
0.71%, 2/25/35 (a) | | | | | | | 684 | | | | 645,529 | |
Series 2006-OA4, Class A1, 1.07%, 4/25/46 (a) | | | | | | | 2,280 | | | | 1,270,484 | |
Credit Suisse Mortgage Capital Certificates: | | | | | | | | | | | | |
Series 2010-20R, Class 9A1,
2.54%, 1/27/36 (a)(b) | | | | | | | 5,746 | | | | 5,666,977 | |
Series 2011-2R, Class 1A1,
2.44%, 3/27/37 (a)(b) | | | | | | | 2,671 | | | | 2,622,602 | |
Series 2011-2R, Class 2A1,
2.61%, 7/27/36 (a)(b) | | | | | | | 10,181 | | | | 10,269,016 | |
Series 2011-5R, Class 3A1,
2.87%, 9/27/47 (a)(b) | | | | | | | 3,597 | | | | 3,423,643 | |
Series 2014-11R, Class 16A1,
2.13%, 9/27/47 (a)(b) | | | | | | | 3,658 | | | | 3,534,789 | |
Series 2015-PR1, Class A-1,
0.00%, 2/25/55 (a)(b) | | | | | | | 3,110 | | | | 3,032,250 | |
Deutsche Alt-A Securities Mortgage Loan Trust: | | | | | | | | | | | | |
Series 2007-OA4, Class 1A1B, 0.30%, 8/25/47 (a) | | | | | | | 1,398 | | | | 1,140,499 | |
Series 2007-RMP1, Class A2, 0.32%, 12/25/36 (a) | | | | | | | 4,256 | | | | 3,630,075 | |
Deutsche ALT-A Securities, Inc., Series 2007-RS1, Class A2, 0.67%, 1/27/37 (a)(b) | | | | | | | 1,397 | | | | 2,108,986 | |
Gemgarto, Series 2012-1, Class A1, 3.51%, 5/14/45 (a) | | | GBP | | | | 609 | | | | 923,860 | |
Grifonas Finance PLC, Series 1, Class A, 0.39%, 8/28/39 (a) | | | EUR | | | | 1,661 | | | | 1,239,581 | |
HomeBanc Mortgage Trust: | | | | | | | | | | | | |
Series 2005-4, Class A1, 0.44%, 10/25/35 (a) | | | USD | | | | 18,296 | | | | 16,215,009 | |
Series 2006-2, Class A1, 0.35%, 12/25/36 (a) | | | | | | | 4,931 | | | | 4,240,906 | |
Impac Secured Assets CMN Owner Trust, Series 2004-3, Class 1A4, 0.97%, 11/25/34 (a) | | | | | | | 763 | | | | 757,021 | |
JPMorgan Alternative Loan Trust, Series 2007-A2, Class 2A1, 3.34%, 5/25/37 (a) | | | | | | | 822 | | | | 656,607 | |
| | | | | | | | | | | | |
| Non-Agency Mortgage-Backed Securities | | | | | Par
(000) | | | Value | |
Collateralized Mortgage Obligations (concluded) | | | | | | | | | | | | |
JPMorgan Madison Avenue Securities Trust, Series 2014-1, Class M1, 2.42%, 11/25/24 (a)(b) | | | USD | | | | 2,236 | | | $ | 2,243,620 | |
LSTAR Securities Investment Trust: | | | | | | | | | | | | |
Series 2014-1, Class Note,
3.27%, 9/01/21 (a)(b) | | | | | | | 7,395 | | | | 7,413,556 | |
Series 2014-2, Class A,
2.16%, 12/01/21 (a)(b) | | | | | | | 8,484 | | | | 8,381,813 | |
Series 2015-1, Class A,
2.17%, 1/01/20 (a)(b) | | | | | | | 3,429 | | | | 3,379,685 | |
Series 2015-2, Class A,
2.17%, 1/01/20 (a)(b) | | | | | | | 2,406 | | | | 2,372,307 | |
Series 2015-3, Class A,
2.18%, 3/01/20 (a)(b) | | | | | | | 4,110 | | | | 4,056,500 | |
MASTR Resecuritization Trust, Series 2008-3, Class A1, 0.68%, 8/25/37 (a)(b) | | | | | | | 3,159 | | | | 2,226,927 | |
Merrill Lynch Mortgage Investors Trust, Series 2006-A3, Class 6A1, 5.34%, 5/25/36 (a) | | | | | | | 5,165 | | | | 4,878,819 | |
Morgan Stanley Re-REMIC Trust, Series 2010-R9, Class 3B, 5.00%, 11/26/36 (b) | | | | | | | 792 | | | | 821,708 | |
Paragon Mortgages No. 13 PLC, Series 13X, Class A2C, 0.41%, 1/15/39 (a) | | | | | | | 464 | | | | 432,793 | |
Reperforming Loan REMIC Trust, Series 2005-R2, Class 1AF1, 0.51%, 6/25/35 (a)(b) | | | | | | | 1,310 | | | | 1,148,347 | |
Residential Mortgage Securities PLC, Series 26, Class A1, 2.81%, 2/14/41 (a) | | | GBP | | | | 1,577 | | | | 2,422,002 | |
Silk Road Finance Number Three PLC, Series 2012-1, Class A, 1.91%, 6/21/55 (a) | | | | | | | 551 | | | | 823,329 | |
Structured Asset Mortgage Investments II Trust, Series 2005-AR8, Class A1A, 0.45%, 2/25/36 (a) | | | USD | | | | 2,310 | | | | 1,852,328 | |
Thornburg Mortgage Securities Trust, Series 2007-3, Class 4A1, 5.92%, 6/25/47 (a) | | | | | | | 2,966 | | | | 2,885,202 | |
| | | | | | | | | | | | |
| | | | | | | | | | | | 163,150,394 | |
Commercial Mortgage-Backed Securities — 5.6% | | | | | | | | | | | | |
American Homes 4 Rent Pass-Through Certificates, Series 2014-SFR2, Class A, 3.79%, 10/17/36 (b) | | | | | | | 1,866 | | | | 1,943,339 | |
Banc of America Commercial Mortgage Trust: | | | | | | | | | | | | |
Series 2006-6, Class AJ, 5.42%, 10/10/45 | | | | | | | 6,069 | | | | 6,289,481 | |
Series 2007-3, Class A1A, 5.55%, 6/10/49 (a) | | | | | | | 5,993 | | | | 6,437,738 | |
Series 2007-3, Class A4, 5.55%, 6/10/49 (a) | | | | | | | 2,730 | | | | 2,913,330 | |
Series 2007-3, Class AJ, 5.55%, 6/10/49 (a) | | | | | | | 1,765 | | | | 1,815,964 | |
Series 2007-5, Class AM, 5.77%, 2/10/51 (a) | | | | | | | 2,030 | | | | 2,164,983 | |
Banc of America Merrill Lynch Commercial Mortgage Securities Trust, Series 2014-FL1, Class A, 1.57%, 12/15/31 (a)(b) | | | | | | | 2,840 | | | | 2,844,447 | |
Banc of America Merrill Lynch Commercial Mortgage, Inc., Series 2005-4, Class A5B, 5.00%, 7/10/45 (a) | | | | | | | 300 | | | | 301,958 | |
Barclays Commercial Mortgage Trust: | | | | | | | | | | | | |
Series 2015-SLP, Class D,
3.38%, 2/15/28 (a)(b) | | | | | | | 2,030 | | | | 2,030,000 | |
Series 2015-VFM, Class A2,
3.38%, 3/15/36 (a)(b) | | | | | | | 2,460 | | | | 2,532,004 | |
Bayview Commercial Asset Trust, Series 2008-4, Class A3, 2.92%, 7/25/38 (a)(b) | | | | | | | 2,618 | | | | 2,578,302 | |
See Consolidated Notes to Financial Statements.
| | | | | | |
| 48 | | BLACKROCK BALANCED CAPITAL FUND, INC. | | MARCH 31, 2015 | | |
| | | | |
| Consolidated Schedule of Investments (continued) | | | Master Total Return Portfolio | |
| | | (Percentages shown are based on Net Assets) | |
| | | | | | | | | | | | |
| Non-Agency Mortgage-Backed Securities | | | | | Par
(000) | | | Value | |
Commercial Mortgage-Backed Securities (continued) | | | | | | | | | |
Bear Stearns Commercial Mortgage Securities Trust: | | | | | | | | | | | | |
Series 2007-PW15, Class A1A, 5.32%, 2/11/44 | | | USD | | | | 4,769 | | | $ | 5,044,578 | |
Series 2007-PW16, Class AM, 5.90%, 6/11/40 (a) | | | | | | | 3,071 | | | | 3,343,094 | |
Series 2007-PW18, Class A1A, 5.60%, 6/11/50 | | | | | | | 171 | | | | 183,304 | |
Series 2007-PW18, Class AMA, 6.09%, 6/11/50 (a) | | | | | | | 4,033 | | | | 4,436,256 | |
BHMS Mortgage Trust, Series 2014-ATLS, Class AFL, 1.67%, 7/05/33 (a)(b) | | | | | | | 2,075 | | | | 2,111,333 | |
Carefree Portfolio Trust: | | | | | | | | | | | | |
Series 2014-CARE, Class A, 1.47%, 11/15/19 (a)(b) | | | | | | | 1,550 | | | | 1,546,348 | |
Series 2014-CARE, Class D, 3.40%, 11/15/19 (a)(b) | | | | | | | 2,510 | | | | 2,517,530 | |
CDGJ Commercial Mortgage Trust, Series 2014-BXCH, Class A, 1.57%, 12/15/27 (a)(b) | | | | | | | 4,271 | | | | 4,274,852 | |
Citigroup Commercial Mortgage Trust: | | | | | | | | | | | | |
Series 2012-GC8, Class D,
4.88%, 9/10/45 (a)(b) | | | | | | | 3,637 | | | | 3,722,164 | |
Series 2013-375P, Class E, 3.63%, 5/10/35 (a)(b) | | | | | | | 2,200 | | | | 2,058,899 | |
Series 2013-GC11, Class D, 4.46%, 4/10/46 (a)(b) | | | | | | | 3,200 | | | | 3,165,114 | |
Series 2014-388G, Class A, 0.92%, 6/15/33 (a)(b) | | | | | | | 2,344 | | | | 2,332,854 | |
Series 2014-388G, Class E, 2.52%, 6/15/33 (a)(b) | | | | | | | 2,200 | | | | 2,191,356 | |
Series 2015-SSHP, Class A, 1.32%, 9/15/27 (a)(b) | | | | | | | 4,370 | | | | 4,364,651 | |
Citigroup/Deutsche Bank Commercial Mortgage Trust: | | | | | | | | | | | | |
Series 2007-CD4, Class AMFX, 5.37%, 12/11/49 (a) | | | | | | | 956 | | | | 999,960 | |
Series 2007-CD5, Class AMA, 6.12%, 11/15/44 (a) | | | | | | | 640 | | | | 701,290 | |
COBALT CMBS Commercial Mortgage Trust, Series 2007-C3, Class AM, 5.77%, 5/15/46 (a) | | | | | | | 3,819 | | | | 4,122,553 | |
Commercial Mortgage Pass-Through Certificates: | | | | | | | | | | | | |
Series 2010-RR1, Class GEB, 5.54%, 12/11/49 (a)(b) | | | | | | | 2,260 | | | | 2,394,050 | |
Series 2012-LTRT, Class A2, 3.40%, 10/05/30 (b) | | | | | | | 3,755 | | | | 3,850,985 | |
Series 2013-FL3, Class A,
1.52%, 10/13/28 (a)(b) | | | | | | | 5,029 | | | | 5,040,097 | |
Series 2013-FL3, Class RRI1, 3.42%, 11/13/28 (a)(b) | | | | | | | 4,914 | | | | 4,914,253 | |
Series 2013-GAM, Class A2, 3.37%, 2/10/28 (b) | | | | | | | 3,196 | | | | 3,311,772 | |
Series 2014-277P, Class A, 3.61%, 8/10/49 (a)(b) | | | | | | | 1,300 | | | | 1,384,321 | |
Series 2014-CR20, Class A4, 3.59%, 11/10/47 | | | | | | | 336 | | | | 357,446 | |
Series 2014-CR21, Class B, 4.34%, 12/10/47 | | | | | | | 630 | | | | 674,528 | |
Series 2014-FL5, Class D, 2.15%, 10/15/31 (a)(b) | | | | | | | 3,095 | | | | 2,849,517 | |
Series 2014-KYO, Class F,
3.66%, 6/11/27 (a)(b) | | | | | | | 5,390 | | | | 5,376,622 | |
| | | | | | | | | | | | |
| Non-Agency Mortgage-Backed Securities | | | | | Par
(000) | | | Value | |
Commercial Mortgage-Backed Securities (continued) | | | | | | | | | |
Series 2015-CR22, Class A5, 3.31%, 3/10/48 | | | USD | | | | 5,670 | | | $ | 5,839,648 | |
Series 2015-DC1, Class A5, 3.35%, 2/04/48 | | | | | | | 1,340 | | | | 1,397,284 | |
Credit Suisse Commercial Mortgage Trust: | | | | | | | | | | | | |
Series 2006-C5, Class AM, 5.34%, 12/15/39 | | | | | | | 11,696 | | | | 12,269,691 | |
Series 2007-C4, Class A1AM, 6.10%, 9/15/39 (a) | | | | | | | 3,146 | | | | 3,406,294 | |
Credit Suisse First Boston Mortgage Securities Corp., Series 2005-C3, Class AJ, 4.77%, 7/15/37 | | | | | | | 920 | | | | 921,063 | |
Credit Suisse Mortgage Capital Certificates: | | | | | | | | | | | | |
Series 2006-C3, Class AM, 5.81%, 6/15/38 (a) | | | | | | | 3,122 | | | | 3,270,595 | |
Series 2010-RR1, Class 2A, 5.70%, 9/15/40 (a)(b) | | | | | | | 4,730 | | | | 4,946,222 | |
Series 2014-SURF, Class E, 3.27%, 2/15/29 (a)(b) | | | | | | | 1,300 | | | | 1,298,482 | |
CSAIL Commercial Mortgage Trust, Series 2015-C1, Class A4, 3.51%, 4/17/50 | | | | | | | 1,050 | | | | 1,109,112 | |
Del Coronado Trust, Series 2013-HDMZ, Class M, 5.15%, 3/15/18 (a)(b) | | | | | | | 2,388 | | | | 2,393,970 | |
Deutsche Bank Re-REMIC Trust, Series 2011-C32, Class A3A, 5.72%, 6/17/49 (a)(b) | | | | | | | 3,400 | | | | 3,642,185 | |
Extended Stay America Trust, Series 2013-ESH7, Class A27, 2.96%, 12/05/31 (b) | | | | | | | 3,850 | | | | 3,936,675 | |
GAHR Commericial Mortgage Trust: | | | | | | | | | | | | |
Series 2015-NRF, Class AFL1, 1.47%, 12/15/16 (a)(b) | | | | | | | 6,000 | | | | 5,998,452 | |
Series 2015-NRF, Class GFX, 8.12%, 12/15/34 (b) | | | | | | | 7,142 | | | | 6,396,075 | |
German Residential Funding Ltd., Series 2013-1, Class E, 4.19%, 8/27/24 (a) | | | EUR | | | | 1,143 | | | | 1,297,034 | |
Greenwich Capital Commercial Funding Corp., Series 2007-GG11, Class AM, 5.87%, 12/10/49 (a) | | | USD | | | | 2,870 | | | | 3,106,864 | |
GS Mortgage Securities Trust: | | | | | | | | | | | | |
Series 2006-GG6, Class AJ, 5.52%, 4/10/38 (a) | | | | | | | 1,275 | | | | 1,303,221 | |
Series 2006-GG8, Class AM, 5.59%, 11/10/39 | | | | | | | 735 | | | | 776,736 | |
Series 2010-C1, Class A1, 3.68%, 8/10/43 (b) | | | | | | | 1,664 | | | | 1,724,434 | |
Series 2014-GC18, Class B, 4.89%, 1/10/47 (a) | | | | | | | 1,314 | | | | 1,461,751 | |
Hilton USA Trust, Series 2013-HLT, Class EFX, 5.22%, 11/05/30 (a)(b) | | | | | | | 5,763 | | | | 5,919,506 | |
Houston Galleria Mall Trust, Series 2015-HGLR, Class A1A2, 3.22%, 3/05/37 (b) | | | | | | | 4,030 | | | | 4,076,345 | |
JPMorgan Chase Commercial Mortgage Securities Trust: | | | | | | | | | | | | |
Series 2006-LDP7, Class A4, 5.88%, 4/15/45 (a) | | | | | | | 7,240 | | | | 7,481,085 | |
Series 2006-LDP8, Class AJ, 5.48%, 5/15/45 (a) | | | | | | | 2,000 | | | | 2,090,172 | |
Series 2006-LDP8, Class D, 5.62%, 5/15/45 (a) | | | | | | | 4,323 | | | | 4,360,212 | |
Series 2007-CB20, Class AJ, 6.08%, 2/12/51 (a) | | | | | | | 11,429 | | | | 12,027,491 | |
Series 2007-CB20, Class AM, 5.88%, 2/12/51 (a) | | | | | | | 1,000 | | | | 1,096,133 | |
Series 2007-LDPX, Class A1A, 5.44%, 1/15/49 | | | | | | | 1,937 | | | | 2,074,548 | |
Series 2007-LDPX, Class AM, 5.46%, 1/15/49 (a) | | | | | | | 5,463 | | | | 5,703,345 | |
See Consolidated Notes to Financial Statements.
| | | | | | |
| | | BLACKROCK BALANCED CAPITAL FUND, INC. | | MARCH 31, 2015 | | 49 |
| | | | |
| Consolidated Schedule of Investments (continued) | | | Master Total Return Portfolio | |
| | | (Percentages shown are based on Net Assets) | |
| | | | | | | | | | | | |
| Non-Agency Mortgage-Backed Securities | | | | | Par
(000) | | | Value | |
Commercial Mortgage-Backed Securities (continued) | |
Series 2008-C2, Class A4FL, 1.68%, 2/12/51 (a) | | | USD | | | | 1,873 | | | $ | 1,841,878 | |
Series 2008-C2, Class ASB, 6.13%, 2/12/51 (a) | | | | | | | 1,255 | | | | 1,316,121 | |
Series 2014-C20, Class A5,
3.80%, 7/15/47 | | | | | | | 1,620 | | | | 1,753,890 | |
Series 2014-C21, Class D, 4.66%, 8/15/47 (a) | | | | | | | 1,250 | | | | 1,204,780 | |
Series 2014-C26, Class A4, 3.49%, 1/15/48 | | | | | | | 1,247 | | | | 1,316,088 | |
Series 2014-DSTY, Class A, 3.43%, 6/10/27 (b) | | | | | | | 885 | | | | 921,760 | |
Series 2014-DSTY, Class D, 3.80%, 6/10/27 (a)(b) | | | | | | | 2,680 | | | | 2,610,435 | |
Series 2014-FL6, Class A,
1.57%, 11/15/31 (a)(b) | | | | | | | 3,670 | | | | 3,674,353 | |
Series 2015-CSMO, Class A, 1.43%, 1/15/32 (a)(b) | | | | | | | 5,400 | | | | 5,395,680 | |
Series 2015-CSMO, Class D,
3.48%, 1/15/32 (a)(b) | | | | | | | 2,900 | | | | 2,901,740 | |
LB-UBS Commercial Mortgage Trust: | | | | | | | | | | | | |
Series 2006-C4, Class AJ, 5.85%, 6/15/38 (a) | | | | | | | 985 | | | | 1,032,570 | |
Series 2007-C1, Class AJ, 5.48%, 2/15/40 | | | | | | | 3,720 | | | | 3,881,548 | |
Series 2007-C7, Class A1A, 5.68%, 9/15/45 (a) | | | | | | | 591 | | | | 644,198 | |
Merrill Lynch Mortgage Investors Trust, Series 1998-C3, Class G, 6.00%, 12/15/30 (b) | | | | | | | 2,606 | | | | 2,593,382 | |
Merrill Lynch Mortgage Trust: | | | | | | | | | | | | |
Series 2005-CKI1, Class AJ, 5.28%, 11/12/37 (a) | | | | | | | 4,160 | | | | 4,241,178 | |
Series 2007-C1, Class A1A, 5.84%, 6/12/50 (a) | | | | | | | 2,555 | | | | 2,676,241 | |
ML-CFC Commercial Mortgage Trust, Series 2007-9, Class ASB, 5.64%, 9/12/49 | | | | | | | 9,842 | | | | 9,840,887 | |
Morgan Stanley Bank of America Merrill Lynch Trust, Series 2014-C19, Class A2, 3.10%, 12/15/47 | | | | | | | 1,152 | | | | 1,208,751 | |
Morgan Stanley Capital I Trust: | | | | | | | | | | | | |
Series 2007-HQ11, Class AMFL, 0.35%, 2/12/44 (a) | | | | | | | 746 | | | | 723,239 | |
Series 2007-HQ12, Class A2FX, 5.67%, 4/12/49 (a) | | | | | | | 187 | | | | 186,363 | |
Series 2007-HQ12, Class AM, 5.67%, 4/12/49 (a) | | | | | | | 6,695 | | | | 7,134,239 | |
Series 2007-IQ13, Class A1A, 5.31%, 3/15/44 | | | | | | | 1,811 | | | | 1,917,872 | |
Series 2007-IQ13, Class AM, 5.41%, 3/15/44 | | | | | | | 1,547 | | | | 1,648,203 | |
Series 2007-IQ14, Class A1A, 5.67%, 4/15/49 (a) | | | | | | | 3,513 | | | | 3,780,477 | |
Series 2007-IQ15, Class AM, 5.91%, 6/11/49 (a) | | | | | | | 7,480 | | | | 8,018,410 | |
Morgan Stanley Re-REMIC Trust: | | | | | | | | | | | | |
Series 2009-GG10 5.80%, 8/12/45 (a)(b) | | | | | | | 6,666 | | | | 7,150,913 | |
Series 2010-GG10, Class A4B, 5.80%, 8/15/45 (a)(b) | | | | | | | 6,998 | | | | 7,507,461 | |
Series 2011-IO, Class B, 0.00%, 3/23/51 (b)(i) | | | | | | | 400 | | | | 396,882 | |
Series 2011-IO, Class C, 0.00%, 3/23/51 (b)(i) | | | | | | | 1,735 | | | | 1,639,575 | |
Series 2012-IO, Class AXB2, 1.00%, 3/27/51 (b) | | | | | | | 2,294 | | | | 2,287,935 | |
Series 2012-XA, Class A, 2.00%, 7/27/49 (b) | | | | | | | 2,831 | | | | 2,832,836 | |
| | | | | | | | | | | | |
| Non-Agency Mortgage-Backed Securities | | | | | Par (000) | | | Value | |
Commercial Mortgage-Backed Securities (concluded) | |
RBSCF Trust, Series 2010-RR3, Class WBTA, 5.94%, 2/16/51 (a)(b) | | | USD | | | | 14,055 | | | $ | 14,635,702 | |
RCMC LLC, Series 2012-CRE1, Class A, 5.62%, 11/15/44 (b) | | | | | | | 3,039 | | | | 3,116,877 | |
Resource Capital Corp. Ltd., Series 2014-CRE2, Class A, 1.22%, 4/15/32 (a)(b) | | | | | | | 2,645 | | | | 2,629,535 | |
SCG Trust, Series 2013-SRP1, Class AJ, 2.11%, 11/15/26 (a)(b) | | | | | | | 2,775 | | | | 2,783,589 | |
SFAVE Commercial Mortgage Securities Trust, Series 2015-5AVE, Class A2B,
4.14%, 1/05/35 (a)(b) | | | | | | | 1,219 | | | | 1,273,144 | |
STRIPs Ltd.: | | | | | | | | | | | | |
Series 2012-1A, Class A,
1.50%, 12/25/44 (b) | | | | | | | 3,508 | | | | 3,508,065 | |
Series 2012-1A, Class B,
0.50%, 12/25/44 (b) | | | | | | | 3,480 | | | | 3,158,100 | |
Taurus IT Srl, Series 2015-IT1, Class A, 1.56%, 2/18/27 (a) | | | EUR | | | | 310 | | | | 333,493 | |
Wachovia Bank Commercial Mortgage Trust: | | | | | | | | | | | | |
Series 2006-C28, Class AJ, 5.63%, 10/15/48 (a) | | | USD | | | | 326 | | | | 334,483 | |
Series 2006-C29, Class AM, 5.34%, 11/15/48 | | | | | | | 955 | | | | 1,012,717 | |
Series 2006-WL7A, Class H, 0.55%, 9/15/21 (a)(b) | | | | | | | 3,690 | | | | 3,604,953 | |
Series 2007-C32, Class AMFX, 5.70%, 6/15/49 (b) | | | | | | | 3,263 | | | | 3,508,541 | |
Series 2007-C33, Class AJ, 5.94%, 2/15/51 (a) | | | | | | | 1,772 | | | | 1,868,726 | |
Series 2007-C33, Class B, 5.94%, 2/15/51 (a) | | | | | | | 200 | | | | 204,337 | |
Wells Fargo Commercial Mortgage Trust: | | | | | | | | | | | | |
Series 2014-TISH, Class SCH1, 2.91%, 1/15/27 (a)(b) | | | | | | | 8,224 | | | | 8,157,863 | |
Series 2015-C27, Class A5, 3.45%, 2/15/48 | | | | | | | 2,016 | | | | 2,116,516 | |
Series 2015-C27, Class C, 3.89%, 2/15/48 | | | | | | | 1,402 | | | | 1,369,318 | |
Wells Fargo Resecuritization Trust, Series 2012-IO, Class A, 1.75%, 8/20/21 (b) | | | | | | | 1,707 | | | | 1,707,271 | |
WFRBS Commercial Mortgage Trust, Series 2014-LC14, Class D, 4.59%, 3/15/47 (a)(b) | | | | | | | 513 | | | | 490,023 | |
| | | | | | | | | | | | |
| | | | | | | | | | | | 370,539,036 | |
Interest Only Collateralized Mortgage Obligations — 0.0% | |
American Home Mortgage Investment Trust, Series 2007-1, Class GIOP, 2.08%, 5/25/47 | | | | | | | 4,059 | | | | 726,617 | |
Interest Only Commercial Mortgage-Backed Securities — 0.4% | |
BWAY Mortgage Trust, Series 2015-1740, Class XA, 0.90%, 1/10/35 (a)(b) | | | | | | | 56,320 | | | | 3,310,653 | |
Commercial Mortgage Pass-Through Certificates: | | | | | | | | | | | | |
Series 2013-CR6, Class XA, 1.52%, 3/10/46 (a) | | | | | | | 31,726 | | | | 2,012,434 | |
Series 2015-3BP, Class XA, 0.05%, 2/10/35 (a)(b) | | | | | | | 133,078 | | | | 1,184,394 | |
Series 2015-CR22, Class XA, 1.17%, 3/10/48 (a) | | | | | | | 28,980 | | | | 2,046,772 | |
Commercial Mortgage Trust, Series 2015-LC19, Class XA, 1.24%, 2/10/48 (a) | | | | | | | 40,178 | | | | 3,664,231 | |
GS Mortgage Securities Trust, Series 2014-GC20, Class XA, 1.21%, 4/10/47 (a) | | | | | | | 9,659 | | | | 723,044 | |
Hilton USA Trust, Series 2013-HLT, Class X1FX, 0.09%, 11/05/30 (a)(b) | | | | | | | 54,590 | | | | 34,119 | |
JPMBB Commercial Mortgage Securities Trust, Series 2014-C24, Class XA,
1.09%, 11/15/47 (a) | | | | | | | 29,943 | | | | 2,019,770 | |
See Consolidated Notes to Financial Statements.
| | | | | | |
| 50 | | BLACKROCK BALANCED CAPITAL FUND, INC. | | MARCH 31, 2015 | | |
| | | | |
| Consolidated Schedule of Investments (continued) | | | Master Total Return Portfolio | |
| | | (Percentages shown are based on Net Assets) | |
| | | | | | | | | | | | |
| Non-Agency Mortgage-Backed Securities | | | | | Par (000) | | | Value | |
Interest Only Commercial Mortgage-Backed Securities (concluded) | |
JPMorgan Chase Commercial Mortgage Securities Trust: | | | | | | | | | | | | |
Series 2013-LC11, Class XA, 1.57%, 4/15/46 (a) | | | USD | | | | 25,714 | | | $ | 2,176,015 | |
Series 2013-LC11, Class XB, 0.58%, 4/15/46 (a) | | | | | | | 4,570 | | | | 186,374 | |
Series 2015-C27, Class XA, 1.40%, 2/15/48 (a) | | | | | | | 38,310 | | | | 3,459,397 | |
Morgan Stanley Bank of America Merrill Lynch Trust, Series 2014-C19, Class XA, 1.17%, 12/15/47 (a) | | | | | | | 14,504 | | | | 1,074,607 | |
WaMu Commercial Mortgage Securities Trust, Series 2005-C1A, Class X, 0.86%, 5/25/36 (a)(b) | | | | | | | 441 | | | | 5,729 | |
Wells Fargo Commercial Mortgage Trust, Series 2015-C27, Class XA, 1.15%, 2/15/48 (a) | | | | | | | 12,790 | | | | 946,575 | |
WF-RBS Commercial Mortgage Trust: | | | | | | | | | | | | |
Series 2012-C10, Class XA, 1.79%, 12/15/45 (a)(b) | | | | | | | 17,725 | | | | 1,694,230 | |
Series 2012-C8, Class XA, 2.19%, 8/15/45 (a)(b) | | | | | | | 1,190 | | | | 118,450 | |
Series 2014-C24, Class XA, 0.99%, 11/15/47 (a) | | | | | | | 26,448 | | | | 1,810,818 | |
Series 2014-LC14, Class XA, 1.46%, 3/15/47 (a) | | | | | | | 23,456 | | | | 1,932,928 | |
| | | | | | | | | | | | |
| | | | | | | | | | | | 28,400,540 | |
Total Non-Agency Mortgage-Backed Securities — 8.5% | | | | 562,816,587 | |
| | | | | | | | | | | | |
| Other Interests (n) | | | | | Beneficial
Interest
(000) | | | | |
Capital Markets — 0.0% | | | | | | | | | | | | |
Lehman Brothers Holdings Capital Trust VII (e)(o) | | | | | | | 1,888 | | | | — | |
Lehman Brothers Holdings, Inc. (e)(o) | | | | | | | 7,360 | | | | 1 | |
Total Other Interests — 0.0% | | | | | | | | | | | 1 | |
| | | | | | | | | | | | |
| Preferred Securities | | | | | Par (000) | | | | |
| Capital Trusts | | | | | | | | | |
Automobiles — 0.1% | | | | | | | | | | | | |
Volkswagen International Finance NV, 3.63%, 12/31/45 (a) | | | EUR | | | | 4,725 | | | | 5,172,595 | |
Banks — 0.4% | | | | | | | | | | | | |
Banco Bilbao Vizcaya Argentaria SA: | | | | | | | | | | | | |
6.57% (a)(p) | | | | | | | 1,800 | | | | 1,983,983 | |
7.00% (a)(p) | | | | | | | 1,400 | | | | 1,548,623 | |
9.00% (a)(p) | | | USD | | | | 2,800 | | | | 3,045,000 | |
Banco Popular Espanol SA: | | | | | | | | | | | | |
8.25% (a)(p) | | | EUR | | | | 1,800 | | | | 2,010,247 | |
11.50% (a)(p) | | | | | | | 2,100 | | | | 2,627,766 | |
Banco Santander SA, 6.25% (a)(p) | | | | | | | 1,600 | | | | 1,736,479 | |
Bank of America Corp., 6.25% (a)(p) | | | USD | | | | 3,852 | | | | 3,907,373 | |
Barclays PLC, 8.00% (a)(p) | | | EUR | | | | 378 | | | | 451,711 | |
Citigroup, Inc.: | | | | | | | | | | | | |
5.80% (a)(p) | | | USD | | | | 1,841 | | | | 1,845,603 | |
5.88% (a)(p) | | | | | | | 3,309 | | | | 3,342,090 | |
| | | | | | | | | | | | |
| Capital Trusts | | | | | Par
(000) | | | Value | |
Banks (concluded) | | | | | | | | | | | | |
HSH Nordbank AG, 7.25% (a)(p) | | | USD | | | | 1,871 | | | $ | 611,514 | |
Industrial & Commercial Bank of China Ltd.,
6.00% (a)(p) | | | | | | | 1,200 | | | | 1,252,800 | |
JPMorgan Chase & Co., 6.75% (a)(p) | | | | | | | 380 | | | | 412,300 | |
Lloyds Banking Group PLC, 6.38% (a)(p) | | | EUR | | | | 1,266 | | | | 1,451,649 | |
Swedbank AB, 5.75% (a)(p) | | | USD | | | | 400 | | | | 400,397 | |
UniCredit SpA, 6.75% (a)(p) | | | EUR | | | | 1,200 | | | | 1,316,101 | |
| | | | | | | | | | | | |
| | | | | | | | | | | | 27,943,636 | |
Capital Markets — 0.1% | | | | | | | | | | | | |
Credit Suisse Group AG, 6.25% (a)(b)(p) | | | USD | | | | 2,200 | | | | 2,161,500 | |
State Street Capital Trust IV, 1.24%, 6/01/77 (a) | | | | | | | 946 | | | | 799,370 | |
UBS Group AG: | | | | | | | | | | | | |
5.13% (a)(p) | | | EUR | | | | 2,525 | | | | 2,848,980 | |
7.13% (a)(p) | | | USD | | | | 2,650 | | | | 2,760,505 | |
| | | | | | | | | | | | |
| | | | | | | | | | | | 8,570,355 | |
Construction & Engineering — 0.0% | | | | | | | | | | | | |
CRCC Yupeng Ltd., 3.95% (a)(p) | | | | | | | 1,200 | | | | 1,231,860 | |
Dianjian Haixing Ltd., 4.05% (a)(p) | | | | | | | 200 | | | | 205,240 | |
| | | | | | | | | | | | |
| | | | | | | | | | | | 1,437,100 | |
Diversified Financial Services — 0.0% | | | | | | | | | | | | |
Far East Horizon Ltd., 5.50% (a)(p) | | | | | | | 800 | | | | 820,960 | |
HBOS Capital Funding LP, 6.85% (p) | | | | | | | 346 | | | | 355,947 | |
| | | | | | | | | | | | |
| | | | | | | | | | | | 1,176,907 | |
Electric Utilities — 0.2% | | | | | | | | | | | | |
Electricite de France SA: | | | | | | | | | | | | |
4.25% (a)(p) | | | EUR | | | | 700 | | | | 815,595 | |
5.00% (a)(p) | | | | | | | 1,600 | | | | 1,974,770 | |
5.88% (a)(p) | | | GBP | | | | 1,500 | | | | 2,415,112 | |
EnBW Energie Baden-Wuerttemberg AG, 4.00%, 4/02/76 | | | EUR | | | | 900 | | | | 999,689 | |
Enel SpA: | | | | | | | | | | | | |
6.50%, 1/10/74 (a) | | | | | | | 700 | | | | 850,512 | |
5.00%, 1/15/75 (a) | | | | | | | 1,119 | | | | 1,317,198 | |
Gas Natural Fenosa Finance BV, 4.13% (a)(p) | | | | | | | 2,600 | | | | 2,970,366 | |
SSE PLC, 4.13% (a)(p) | | | GBP | | | | 950 | | | | 1,402,787 | |
| | | | | | | | | | | | |
| | | | | | | | | | | | 12,746,029 | |
Industrial Conglomerates — 0.0% | | | | | | | | | | | | |
CITIC Ltd., 8.63% (a)(p) | | | USD | | | | 200 | | | | 231,500 | |
Insurance — 0.1% | | | | | | | | | | | | |
AXA SA, 3.88% (a)(p) | | | EUR | | | | 750 | | | | 888,344 | |
BNP Paribas Cardif SA, 4.00% (a)(p) | | | | | | | 1,100 | | | | 1,256,846 | |
Credit Agricole Assurances SA, 4.35% (a)(p) | | | | | | | 2,700 | | | | 3,062,837 | |
| | | | | | | | | | | | |
| | | | | | | | | | | | 5,208,027 | |
Oil, Gas & Consumable Fuels — 0.1% | | | | | | | | | | | | |
TOTAL SA: | | | | | | | | | | | | |
2.40% (a)(p) | | | EUR | | | | 1,925 | | | | 2,083,302 | |
2.85% (a)(p) | | | | | | | 1,575 | | | | 1,716,798 | |
| | | | | | | | | | | | |
| | | | | | | | | | | | 3,800,100 | |
Pharmaceuticals — 0.1% | | | | | | | | | | | | |
Bayer AG, 2.63%, 4/02/75 (a) | | | | | | | 2,150 | | | | 2,301,838 | |
Real Estate Management & Development — 0.0% | | | | | | | | | | | | |
Deutsche Annington Finance BV, 4.13% (a)(p) | | | | | | | 900 | | | | 1,020,462 | |
Thrifts & Mortgage Finance — 0.0% | | | | | | | | | | | | |
Coventry Building Society, 6.38% (a)(p) | | | GBP | | | | 250 | | | | 365,471 | |
Transportation Infrastructure — 0.0% | | | | | | | | | | | | |
Royal Capital BV, 6.38% (a)(p) | | | USD | | | | 550 | | | | 574,063 | |
See Consolidated Notes to Financial Statements.
| | | | | | |
| | | BLACKROCK BALANCED CAPITAL FUND, INC. | | MARCH 31, 2015 | | 51 |
| | | | |
| Consolidated Schedule of Investments (continued) | | | Master Total Return Portfolio | |
| | | (Percentages shown are based on Net Assets) | |
| | | | | | | | | | | | |
| Capital Trusts | | | | | Par (000) | | | Value | |
Wireless Telecommunication Services — 0.1% | |
Orange SA: | | | | | | | | | | | | |
4.25% (a)(p) | | | EUR | | | | 558 | | | $ | 642,586 | |
5.25% (a)(p) | | | | | | | 1,950 | | | | 2,388,233 | |
Telefonica Europe BV: | | | | | | | | | | | | |
4.20% (a)(p) | | | | | | | 1,200 | | | | 1,361,906 | |
5.00% (a)(p) | | | | | | | 700 | | | | 815,448 | |
5.88% (a)(p) | | | | | | | 1,600 | | | | 1,978,452 | |
6.50% (a)(p) | | | | | | | 300 | | | | 362,329 | |
| | | | | | | | | | | | |
| | | | | | | | | | | | 7,548,954 | |
Total Capital Trusts — 1.2% | | | | 78,097,037 | |
| | | | | | | | | | | | |
| Preferred Stocks | | | | | Shares | | | | |
Banks — 0.0% | | | | | | | | | | | | |
Royal Bank of Scotland Group PLC, 6.13% | | | | | | | 1,919 | | | | 47,227 | |
Royal Bank of Scotland Group PLC, 6.60% | | | | | | | 9,596 | | | | 240,092 | |
| | | | | | | | | | | | |
| | | | | | | | | | | | 287,319 | |
Diversified Financial Services — 0.0% | | | | | | | | | | | | |
Concrete Investment II SCA, 0.00% (e) | | | | | | | 12,471 | | | | 1,810,268 | |
Media — 0.1% | | | | | | | | | | | | |
NBCUniversal Enterprise, Inc., 5.25% (b)(p) | | | | 3,770,000 | | | | 3,996,954 | |
Total Preferred Stocks — 0.1% | | | | 6,094,541 | |
| | | | | | | | | | | | |
| Trust Preferreds | | | | | | | | | |
Banks — 0.0% | | | | | | | | | | | | |
RBS Capital Funding Trust V, Series E, 5.90% (p) | | | | 32,000 | | | | 785,600 | |
Consumer Finance — 0.1% | | | | | | | | | | | | |
GMAC Capital Trust I, 8.13%, 2/15/40 (a) | | | | | | | 325,000 | | | | 8,531,250 | |
Diversified Financial Services — 0.2% | | | | | | | | | | | | |
Citigroup Capital XIII, 7.88%, 10/30/40 | | | | | | | 349,440 | | | | 9,267,149 | |
RBS Capital Funding Trust VII, 6.08% (p) | | | | | | | 50,000 | | | | 1,238,500 | |
| | | | | | | | | | | | |
| | | | | | | | | | | | 10,505,649 | |
Total Trust Preferreds — 0.3% | | | | | | | | | | | 19,822,499 | |
Total Preferred Securities — 1.6% | | | | | | | | | | | 104,014,077 | |
| | | | | | | | | | | | |
| Taxable Municipal Bonds | | | | | Par (000) | | | | |
Alachua County Health Facilities Authority RB, 5.00%, 12/01/44 | | | USD | | | | 6,270 | | | | 7,013,559 | |
American Municipal Power, Inc. RB, 5.00%, 2/15/34 | | | | | | | 3,520 | | | | 3,990,659 | |
Bay Area Toll Authority RB, 5.00%, 10/01/54 | | | | | | | 4,940 | | | | 5,532,701 | |
Board of Governors of Colorado State University System RB, 5.00%, 3/01/45 (q) | | | | | | | 660 | | | | 753,621 | |
Buckeye Tobacco Settlement Financing Authority RB, 5.88%, 6/01/47 | | | | | | | 1,500 | | | | 1,227,705 | |
California Educational Facilities Authority RB, 5.00%, 10/01/32 | | | | | | | 1,750 | | | | 2,279,777 | |
California Statewide Communities Development Authority, 5.50%, 12/01/54 | | | | | | | 4,000 | | | | 4,466,680 | |
Casino Reinvestment Development Authority RB, 5.25%, 11/01/44 | | | | | | | 1,125 | | | | 1,211,839 | |
Central Texas Turnpike System RB, 5.00%, 8/15/37 | | | | | | | 1,250 | | | | 1,382,875 | |
Chicago Board of Education GO, 5.00%, 12/01/42 | | | | | | | 1,715 | | | | 1,694,609 | |
| | | | | | | | | | | | |
| Taxable Municipal Bonds | | | | | Par
(000) | | | Value | |
Chicago Midway International Airport RB, 5.00%, 1/01/41 | | | USD | | | | 1,860 | | | $ | 2,045,070 | |
City of Atlanta, GA Water & Wastewater Revenue RB, 5.00%, 11/01/40 | | | | | | | 1,300 | | | | 1,496,651 | |
City of Chicago, IL GO, 5.00%, 1/01/40 | | | | | | | 3,000 | | | | 2,970,330 | |
City of Houston, TX Airport System Revenue RB, 5.00%, 7/01/24 | | | | | | | 700 | | | | 817,635 | |
City of Portland, OR Sewer System Revenue RB, 5.00%, 10/01/23 | | | | | | | 655 | | | | 816,156 | |
Commonwealth of Massachusetts GO, 5.00%, 8/01/25 | | | | | | | 2,005 | | | | 2,529,608 | |
Commonwealth of Massachusetts RB, 5.00%, 6/15/26 | | | | | | | 5,210 | | | | 6,444,874 | |
Commonwealth of Puerto Rico GO, 8.00%, 7/01/35 | | | | | | | 7,755 | | | | 6,369,026 | |
County of Fairfax, VA GO, 5.00%, 10/01/24 | | | | | | | 3,330 | | | | 4,216,779 | |
County of Miami-Dade, FL Aviation Revenue RB, 5.00%, 10/01/36 | | | | | | | 2,145 | | | | 2,410,530 | |
County of Miami-Dade, FL Aviation Revenue RB, CIFG, 5.00%, 10/01/38 | | | | | | | 8,770 | | | | 8,924,703 | |
County of Miami-Dade, FL Transit System Sales Surtax Revenue RB, 5.00%, 7/01/42 | | | | | | | 750 | | | | 843,413 | |
County of Miami-Dade, FL Water & Sewer System Revenue RB, 5.00%, 10/01/42 | | | | | | | 3,000 | | | | 3,363,900 | |
County of Montgomery, MD GO, 5.00%, 11/01/23 | | | | | | | 1,300 | | | | 1,626,703 | |
County of New Castle, DE GO, 5.00%, 10/01/40 | | | | | | | 1,320 | | | | 1,578,628 | |
Dallas/Fort Worth International Airport RB: | | | | | | | | | | | | |
5.00%, 11/01/42 | | | | | | | 5,000 | | | | 5,416,050 | |
Series A, 5.00%, 11/01/43 | | | | | | | 5,000 | | | | 5,433,600 | |
5.00%, 11/01/45 | | | | | | | 4,170 | | | | 4,543,715 | |
5.00%, 11/01/45 | | | | | | | 2,650 | | | | 2,862,424 | |
District of Columbia GO: | | | | | | | | | | | | |
5.00%, 6/01/30 | | | | | | | 835 | | | | 987,772 | |
5.00%, 6/01/32 | | | | | | | 2,705 | | | | 3,175,913 | |
5.00%, 6/01/38 | | | | | | | 4,740 | | | | 5,515,274 | |
District of Columbia Water & Sewer Authority RB, 5.00%, 10/01/27 | | | | | | | 1,155 | | | | 1,402,459 | |
Fairfax County Industrial Development Authority RB, 5.00%, 5/15/44 | | | | | | | 3,175 | | | | 3,632,041 | |
Florida Department of Environmental Protection RB, 5.00%, 7/01/23 | | | | | | | 450 | | | | 549,711 | |
Health & Educational Facilities Authority of the State of Missouri RB, 5.00%, 1/01/44 | | | | | | | 2,270 | | | | 2,601,965 | |
Illinois Finance Authority RB, 5.00%, 8/01/38 | | | | | | | 2,920 | | | | 3,351,226 | |
Kansas Development Finance Authority RB, 5.00%, 6/01/46 | | | | | | | 955 | | | | 1,059,372 | |
Las Vegas Valley Water District GO, 5.00%, 6/01/39 | | | | | | | 5,000 | | | | 5,792,600 | |
Long Island Power Authority RB, 5.00%, 9/01/44 | | | | | | | 3,425 | | | | 3,836,925 | |
Los Angeles Community College District/CA GO, 6.60%, 8/01/42 | | | | | | | 1,195 | | | | 1,728,950 | |
Los Angeles Department of Water & Power RB, 5.00%, 7/01/44 | | | | | | | 625 | | | | 721,469 | |
Lower Colorado River Authority RB: | | | | | | | | | | | | |
5.00%, 5/15/24 (q) | | | | | | | 850 | | | | 1,030,107 | |
5.00%, 5/15/26 (q) | | | | | | | 875 | | | | 1,045,153 | |
5.00%, 5/15/36 | | | | | | | 980 | | | | 1,089,544 | |
Maryland Health & Higher Educational Facilities Authority RB: | | | | | | | | | | | | |
5.00%, 7/01/20 | | | | | | | 685 | | | | 792,100 | |
5.00%, 7/01/21 | | | | | | | 965 | | | | 1,128,114 | |
5.00%, 7/01/27 | | | | | | | 815 | | | | 954,235 | |
The Massachusetts Clean Water Trust RB, 5.00%, 8/01/25 | | | | | | | 1,565 | | | | 1,991,807 | |
Metropolitan Transportation Authority RB: | | | | | | | | | | | | |
0.00%, 11/15/30 (i) | | | | | | | 1,785 | | | | 1,079,389 | |
6.67%, 11/15/39 | | | | | | | 350 | | | | 491,323 | |
See Consolidated Notes to Financial Statements.
| | | | | | |
| 52 | | BLACKROCK BALANCED CAPITAL FUND, INC. | | MARCH 31, 2015 | | |
| | | | |
| Consolidated Schedule of Investments (continued) | | | Master Total Return Portfolio | |
| | | (Percentages shown are based on Net Assets) | |
| | | | | | | | | | | | |
| Taxable Municipal Bonds | | | | | Par
(000) | | | Value | |
6.81%, 11/15/40 | | | USD | | | | 860 | | | $ | 1,222,249 | |
5.25%, 11/15/55 | | | | | | | 6,820 | | | | 7,751,407 | |
Metropolitan Washington Airports Authority Dulles Toll Road Revenue RB, 5.00%, 10/01/53 | | | | | | | 1,390 | | | | 1,486,230 | |
Miami-Dade County Expressway Authority RB, 5.00%, 7/01/39 | | | | | | | 2,000 | | | | 2,260,520 | |
Michigan Finance Authority RB, 5.00%, 6/01/39 | | | | | | | 840 | | | | 940,136 | |
Municipal Electric Authority of Georgia RB, 6.64%, 4/01/57 | | | | | | | 1,035 | | | | 1,354,049 | |
New Jersey Economic Development Authority RB: | | | | | | | | | | | | |
5.00%, 3/01/26 | | | | | | | 840 | | | | 924,924 | |
5.00%, 6/15/27 | | | | | | | 1,160 | | | | 1,281,278 | |
5.00%, 6/15/29 | | | | | | | 740 | | | | 805,993 | |
5.00%, 6/15/30 | | | | | | | 690 | | | | 750,416 | |
5.00%, 6/15/31 | | | | | | | 975 | | | | 1,054,872 | |
New Jersey Health Care Facilities Financing Authority RB, 5.00%, 7/01/44 | | | | | | | 680 | | | | 762,253 | |
New Jersey State Turnpike Authority RB, 7.41%, 1/01/40 | | | | | | | 1,499 | | | | 2,255,545 | |
New Jersey Transportation Trust Fund Authority RB: | | | | | | | | | | | | |
0.00%, 12/15/38 (i) | | | | | | | 690 | | | | 219,013 | |
5.00%, 6/15/42 | | | | | | | 5,000 | | | | 5,326,150 | |
Series B, 5.00%, 6/15/42 | | | | | | | 835 | | | | 892,740 | |
New Jersey Transportation Trust Fund Authority RB, AMBAC, 0.00%, 12/15/28 (i) | | | | | | | 1,715 | | | | 931,982 | |
New York City Water & Sewer System RB: | | | | | | | | | | | | |
5.38%, 6/15/43 | | | | | | | 4,410 | | | | 5,173,636 | |
5.50%, 6/15/43 | | | | | | | 5,285 | | | | 6,241,691 | |
5.88%, 6/15/44 | | | | | | | 1,195 | | | | 1,620,767 | |
New York State Dormitory Authority RB: | | | | | | | | | | | | |
5.00%, 3/15/32 | | | | | | | 1,380 | | | | 1,632,181 | |
5.00%, 3/15/36 | | | | | | | 1,380 | | | | 1,610,667 | |
5.00%, 3/15/37 | | | | | | | 1,140 | | | | 1,314,010 | |
5.00%, 3/15/37 | | | | | | | 830 | | | | 968,021 | |
5.00%, 3/15/38 | | | | | | | 1,240 | | | | 1,444,067 | |
5.00%, 3/15/39 | | | | | | | 1,840 | | | | 2,141,226 | |
5.39%, 3/15/40 | | | | | | | 1,070 | | | | 1,365,684 | |
New York State Urban Development Corp. RB: | | | | | | | | | | | | |
5.00%, 3/15/23 | | | | | | | 1,500 | | | | 1,830,660 | |
5.00%, 3/15/44 | | | | | | | 1,250 | | | | 1,431,313 | |
North Carolina Medical Care Commission RB: | | | | | | | | | | | | |
5.00%, 6/01/40 | | | | | | | 1,300 | | | | 1,465,555 | |
5.00%, 6/01/45 | | | | | | | 1,300 | | | | 1,464,359 | |
Orange County Sanitation District RB: | | | | | | | | | | | | |
5.00%, 2/01/29 | | | | | | | 1,250 | | | | 1,527,287 | |
5.00%, 2/01/34 | | | | | | | 1,000 | | | | 1,196,810 | |
Pennsylvania Economic Development Financing Authority RB: | | | | | | | | | | | | |
5.00%, 12/31/22 | | | | | | | 1,055 | | | | 1,226,015 | |
5.00%, 12/31/38 | | | | | | | 790 | | | | 864,710 | |
Philadelphia Authority for Industrial Development RB, 5.00%, 7/01/42 | | | | | | | 925 | | | | 1,063,750 | |
Port Authority of New York & New Jersey RB: | | | | | | | | | | | | |
5.00%, 10/15/44 | | | | | | | 2,470 | | | | 2,774,625 | |
4.96%, 8/01/46 | | | | | | | 1,970 | | | | 2,351,589 | |
Private Colleges & Universities Authority RB, 5.00%, 4/01/44 | | | | | | | 745 | | | | 820,364 | |
Royal Oak Hospital Finance Authority RB, 5.00%, 9/01/39 | | | | | | | 2,005 | | | | 2,238,482 | |
Sales Tax Asset Receivable Corp. RB: | | | | | | | | | | | | |
5.00%, 10/15/24 | | | | | | | 3,890 | | | | 4,920,772 | |
5.00%, 10/15/25 | | | | | | | 990 | | | | 1,242,539 | |
| | | | | | | | | | | | |
| Taxable Municipal Bonds | | | | | Par
(000) | | | Value | |
5.00%, 10/15/28 | | | USD | | | | 2,460 | | | $ | 3,007,227 | |
5.00%, 10/15/29 | | | | | | | 1,890 | | | | 2,304,912 | |
5.00%, 10/15/31 | | | | | | | 1,005 | | | | 1,211,367 | |
Salt Verde Financial Corp. RB, 5.00%, 12/01/37 | | | | | | | 855 | | | | 998,469 | |
South Carolina State Public Service Authority RB: | | | | | | | | | | | | |
5.00%, 12/01/46 | | | | | | | 5,180 | | | | 5,862,672 | |
5.00%, 12/01/48 | | | | | | | 2,090 | | | | 2,324,038 | |
State of California GO: | | | | | | | | | | | | |
5.00%, 10/01/25 | | | | | | | 1,250 | | | | 1,535,350 | |
5.00%, 10/01/37 | | | | | | | 1,180 | | | | 1,371,715 | |
7.55%, 4/01/39 | | | | | | | 1,620 | | | | 2,529,274 | |
7.60%, 11/01/40 | | | | | | | 3,900 | | | | 6,257,667 | |
5.00%, 4/01/43 | | | | | | | 5,000 | | | | 5,691,300 | |
5.00%, 12/01/43 | | | | | | | 5,000 | | | | 5,741,550 | |
5.00%, 10/01/44 | | | | | | | 2,865 | | | | 3,304,892 | |
State of Connecticut GO: | | | | | | | | | | | | |
5.00%, 9/01/23 | | | | | | | 2,020 | | | | 2,463,350 | |
5.00%, 3/01/26 | | | | | | | 1,140 | | | | 1,366,894 | |
5.00%, 11/15/29 | | | | | | | 750 | | | | 884,843 | |
State of Connecticut Special Tax Revenue RB: | | | | | | | | | | | | |
5.00%, 9/01/24 | | | | | | | 1,205 | | | | 1,496,321 | |
5.00%, 9/01/33 | | | | | | | 865 | | | | 1,009,074 | |
State of Delaware GO, 5.00%, 7/01/22 | | | | | | | 1,250 | | | | 1,534,550 | |
State of Illinois GO: | | | | | | | | | | | | |
5.00%, 5/01/24 | | | | | | | 9,335 | | | | 10,597,745 | |
5.10%, 6/01/33 | | | | | | | 5,265 | | | | 5,356,769 | |
State of Maryland GO: | | | | | | | | | | | | |
5.00%, 8/01/21 | | | | | | | 1,705 | | | | 2,063,186 | |
5.00%, 8/01/22 | | | | | | | 1,250 | | | | 1,535,600 | |
5.00%, 8/01/23 | | | | | | | 1,320 | | | | 1,645,684 | |
State of Minnesota GO: | | | | | | | | | | | | |
5.00%, 8/01/24 | | | | | | | 1,790 | | | | 2,252,608 | |
5.00%, 8/01/24 | | | | | | | 1,425 | | | | 1,793,277 | |
State of Mississippi GO, 5.00%, 10/01/26 | | | | | | | 1,260 | | | | 1,573,085 | |
State of New Jersey GO: | | | | | | | | | | | | |
5.00%, 6/01/27 | | | | | | | 2,565 | | | | 3,015,260 | |
5.00%, 6/01/32 | | | | | | | 3,250 | | | | 3,705,683 | |
State of North Carolina RB, 5.00%, 5/01/27 | | | | | | | 1,250 | | | | 1,518,763 | |
State of Texas GO: | | | | | | | | | | | | |
5.00%, 10/01/23 | | | | | | | 1,340 | | | | 1,663,744 | |
5.00%, 4/01/30 | | | | | | | 680 | | | | 808,411 | |
5.00%, 10/01/44 | | | | | | | 1,250 | | | | 1,458,700 | |
State of Washington GO: | | | | | | | | | | | | |
5.00%, 7/01/31 | | | | | | | 5,775 | | | | 6,846,840 | |
5.00%, 7/01/32 | | | | | | | 3,210 | | | | 3,793,739 | |
Tobacco Settlement Financing Corp./NJ RB, 5.00%, 6/01/41 | | | | | | | 1,795 | | | | 1,376,711 | |
University of Arizona RB, 5.00%, 8/01/39 | | | | | | | 1,285 | | | | 1,470,297 | |
University of California RB, 4.86%, 5/15/2112 | | | | | | | 910 | | | | 981,389 | |
University of Kentucky RB: | | | | | | | | | | | | |
5.00%, 10/01/21 (q) | | | | | | | 500 | | | | 600,875 | |
5.00%, 10/01/27 (q) | | | | | | | 2,610 | | | | 3,195,188 | |
University of Massachusetts Building Authority RB, 5.00%, 11/01/44 | | | | | | | 11,655 | | | | 13,520,499 | |
University of North Carolina at Chapel Hill RB, 3.85%, 12/01/34 | | | | | | | 1,385 | | | | 1,478,737 | |
University of Virginia RB: | | | | | | | | | | | | |
5.00%, 8/01/21 (q) | | | | | | | 615 | | | | 745,441 | |
5.00%, 4/01/45 (q) | | | | | | | 1,475 | | | | 1,753,495 | |
Utah Transit Authority RB, 5.00%, 6/15/24 | | | | | | | 1,250 | | | | 1,561,013 | |
Victor Valley Community College District GO, 0.00%, 8/01/38 (i) | | | | | | | 4,585 | | | | 1,783,427 | |
See Consolidated Notes to Financial Statements.
| | | | | | |
| | | BLACKROCK BALANCED CAPITAL FUND, INC. | | MARCH 31, 2015 | | 53 |
| | | | |
| Consolidated Schedule of Investments (continued) | | | Master Total Return Portfolio | |
| | | (Percentages shown are based on Net Assets) | |
| | | | | | | | | | | | |
| Taxable Municipal Bonds | | | | | Par
(000) | | | Value | |
Washington Health Care Facilities Authority RB, 5.00%, 10/01/38 | | | USD | | | | 3,420 | | | $ | 3,917,849 | |
Wisconsin Health & Educational Facilities Authority RB, 5.00%, 8/15/39 | | | | | | | 1,250 | | | | 1,394,437 | |
Total Taxable Municipal Bonds — 5.3% | | | | 352,675,723 | |
| | | | | | | | | | | | |
| U.S. Government Sponsored Agency Securities | | | | | | | | | |
Agency Obligations — 0.3% | | | | | | | | | | | | |
Fannie Mae, 6.63%, 11/15/30 (r) | | | | | | | 1,450 | | | | 2,182,385 | |
Freddie Mac: | | | | | | | | | | | | |
3.75%, 3/27/19 | | | | | | | 3,650 | | | | 4,005,167 | |
4.38%, 7/17/15 | | | | | | | 7,950 | | | | 8,048,771 | |
4.88%, 6/13/18 | | | | | | | 4,300 | | | | 4,825,047 | |
| | | | | | | | | | | | |
| | | | | | | | | | | | 19,061,370 | |
Collateralized Mortgage Obligations — 0.1% | | | | | | | | | | | | |
Fannie Mae: | | | | | | | | | | | | |
Series 2005-48, Class AR, 5.50%, 2/25/35 | | | | | | | 15 | | | | 15,806 | |
Series 2013-C01, Class M2, 5.41%, 10/25/23 (a) | | | | | | | 5,505 | | | | 6,017,692 | |
Series 2014-C01, Class M2, 4.57%, 1/25/24 (a) | | | | | | | 2,112 | | | | 2,192,554 | |
| | | | | | | | | | | | |
| | | | | | | | | | | | 8,226,052 | |
Commercial Mortgage-Backed Securities — 0.2% | |
Fannie Mae: | | | | | | | | | | | | |
Series 2006-M2, Class A2A, 5.27%, 10/25/32 (a) | | | | | | | 3,577 | | | | 4,188,949 | |
Series 2014-M13, Class A2, 3.02%, 8/25/24 (a) | | | | | | | 950 | | | | 984,830 | |
Series 2015-M3, Class A2, 2.72%, 10/25/24 | | | | | | | 5,000 | | | | 5,087,000 | |
Freddie Mac: | | | | | | | | | | | | |
Series K037, Class A2, 3.49%, 1/25/24 | | | | | | | 945 | | | | 1,024,857 | |
Series K041, Class A2, 3.17%, 10/25/24 | | | | | | | 2,000 | | | | 2,116,786 | |
| | | | | | | | | | | | |
| | | | | | | | | | | | 13,402,422 | |
Interest Only Collateralized Mortgage Obligations — 0.1% | |
Freddie Mac: | | | | | | | | | | | | |
Series 4307, Class SE, 5.93%, 9/15/36 (a) | | | | | | | 2,314 | | | | 400,026 | |
Series 4320, Class SD, 5.93%, 7/15/39 (a) | | | | | | | 3,808 | | | | 644,387 | |
Ginnie Mae: | | | | | | | | | | | | |
Series 2009-121, Class UI, 5.00%, 12/20/39 | | | | | | | 1,574 | | | | 280,730 | |
Series 2010-20, Class SE, 6.07%, 2/20/40 (a) | | | | | | | 1,648 | | | | 278,025 | |
Series 2010-35, Class UI, 5.00%, 3/20/40 | | | | | | | 1,334 | | | | 238,301 | |
Series 2010-45, Class SA, 5.67%, 4/20/40 (a) | | | | | | | 988 | | | | 145,589 | |
Series 2010-50, Class LS, 6.32%, 4/20/40 (a) | | | | | | | 984 | | | | 166,742 | |
Series 2010-9, Class UI, 5.00%, 1/20/40 | | | | | | | 5,776 | | | | 1,073,125 | |
Series 2013-103, Class IO, 5.00%, 6/20/43 | | | | | | | 1,991 | | | | 342,091 | |
Series 2013-106, Class DS, 6.02%, 2/20/43 (a) | | | | | | | 1,542 | | | | 225,777 | |
Series 2013-111, Class SA, 6.52%, 7/20/43 (a) | | | | | | | 3,802 | | | | 700,781 | |
| | | | | | | | | | | | |
| U.S. Government Sponsored Agency Securities | | | Par (000) | | | Value | |
Interest Only Collateralized Mortgage Obligations (concluded) | |
Series 2013-113, Class SA, 6.52%, 8/20/43 (a) | | | USD | | | | 2,336 | | | $ | 423,909 | |
Series 2013-134, Class DS, 5.92%, 9/20/43 (a) | | | | | | | 1,899 | | | | 257,458 | |
Series 2013-147, Class SD, 6.47%, 12/20/39 (a) | | | | | | | 2,375 | | | | 359,862 | |
Series 2013-148, Class SA, 6.02%, 10/20/43 (a) | | | | | | | 7,590 | | | | 1,216,368 | |
Series 2013-167, Class SG, 5.97%, 11/20/43 (a) | | | | | | | 3,148 | | | | 481,324 | |
Series 2013-54, Class LI, 5.00%, 2/20/43 | | | | | | | 1,228 | | | | 127,660 | |
Series 2014-180, Class IO, 5.00%, 12/20/44 | | | | | | | 3,225 | | | | 580,145 | |
Series 2014-182, Class KI, 5.00%, 10/20/44 | | | | | | | 850 | | | | 146,482 | |
Series 2015-14, Class IO, 5.00%, 10/20/44 | | | | | | | 2,891 | | | | 536,023 | |
| | | | | | | | | | | | |
| | | | | | | | | | | | 8,624,805 | |
Interest Only Commercial Mortgage-Backed Securities — 0.2% | |
Fannie Mae: | | | | | | | | | | | | |
Series 2013-M5, Class X2, 2.48%, 1/25/22 (a) | | | | | | | 12,585 | | | | 1,359,067 | |
Series 2014-M13, Class X2, 0.24%, 2/25/24 (a) | | | | | | | 127,014 | | | | 1,588,688 | |
Series 2015-M4, Class X2, 0.68%, 7/25/22 | | | | | | | 44,320 | | | | 1,494,324 | |
Freddie Mac, Series K038, Class X1, 1.20%, 3/25/24 (a) | | | | | | | 33,915 | | | | 2,901,908 | |
Ginnie Mae: | | | | | | | | | | | | |
Series 2012-120, Class IO, 0.95%, 2/16/53 (a) | | | | | | | 22,065 | | | | 1,560,120 | |
Series 2014-40, Class AI, 1.00%, 2/16/39 | | | | | | | 18,608 | | | | 581,501 | |
Series 2014-52, Class AI, 0.83%, 8/16/41 | | | | | | | 11,744 | | | | 336,696 | |
| | | | | | | | | | | | |
| | | | | | | | | | | | 9,822,304 | |
Mortgage-Backed Securities — 70.8% | | | | | | | | | | | | |
Fannie Mae Mortgage-Backed Securities: | | | | | | | | | | | | |
2.23%, 10/01/42 (a) | | | | | | | 3,544 | | | | 3,698,396 | |
2.50%, 4/01/30 (s) | | | | | | | 64,600 | | | | 66,294,872 | |
3.00%, 1/01/29-4/01/45 (s) | | | | | | | 449,592 | | | | 466,140,677 | |
3.18%, 12/01/40 (a) | | | | | | | 2,989 | | | | 3,159,763 | |
3.50%, 12/01/25-4/01/45 (s) | | | | | | | 380,062 | | | | 402,242,772 | |
4.00%, 1/01/25-4/01/45 (s) | | | | | | | 652,534 | | | | 697,793,220 | |
4.50%, 2/01/25-4/01/45 (s) | | | | | | | 970,684 | | | | 1,059,097,701 | |
5.00%, 5/01/23-4/01/45 (s) | | | | | | | 241,925 | | | | 269,616,790 | |
5.50%, 12/01/32-4/01/45 (s) | | | | | | | 56,993 | | | | 64,291,952 | |
6.00%, 2/01/34-4/01/45 (s) | | | | | | | 44,235 | | | | 50,545,855 | |
6.50%, 5/01/40 | | | | | | | 9,013 | | | | 10,347,966 | |
Freddie Mac Mortgage-Backed Securities: | | | | | | | | | | | | |
2.50%, 4/01/30 (s) | | | | | | | 37,800 | | | | 38,756,813 | |
2.92%, 6/01/42 (a) | | | | | | | 3,815 | | | | 3,977,027 | |
3.00%, 4/01/30-4/01/45 (s) | | | | | | | 97,641 | | | | 100,434,835 | |
3.50%, 4/01/30-4/01/45 (s) | | | | | | | 161,192 | | | | 169,093,932 | |
4.00%, 4/01/30-4/01/45 (s) | | | | | | | 162,819 | | | | 173,955,988 | |
4.50%, 2/01/39-4/01/45 (s) | | | | | | | 73,112 | | | | 79,653,846 | |
5.00%, 7/01/35-10/01/41 | | | | | | | 30,519 | | | | 33,924,214 | |
5.50%, 10/01/39-4/01/45 (s) | | | | | | | 16,177 | | | | 18,142,174 | |
6.00%, 4/01/45 (s) | | | | | | | 15,600 | | | | 17,743,781 | |
Ginnie Mae Mortgage-Backed Securities: | | | | | | | | | | | | |
1.75%, 5/20/34 (a) | | | | | | | 968 | | | | 1,002,699 | |
3.00%, 4/15/45 (s) | | | | | | | 87,300 | | | | 89,855,318 | |
3.50%, 2/15/42-4/15/45 (s) | | | | | | | 145,688 | | | | 153,731,040 | |
See Consolidated Notes to Financial Statements.
| | | | | | |
| 54 | | BLACKROCK BALANCED CAPITAL FUND, INC. | | MARCH 31, 2015 | | |
| | | | |
| Consolidated Schedule of Investments (continued) | | | Master Total Return Portfolio | |
| | | (Percentages shown are based on Net Assets) | |
| | | | | | | | | | | | |
| U.S. Government Sponsored Agency Securities | | | Par (000) | | | Value | |
Mortgage-Backed Securities (concluded) | |
4.00%, 9/20/40-4/15/45 (s) | | | USD | | | | 584,438 | | | $ | 624,476,497 | |
4.50%, 5/20/41-4/15/45 | | | | | | | 64,003 | | | | 70,112,412 | |
5.00%, 12/15/38-4/15/45 | | | | | | | 25,480 | | | | 28,435,095 | |
5.50%, 4/15/45 (s) | | | | | | | 5,800 | | | | 6,418,063 | |
| | | | | | | | | | | | |
| | | | | | | | | | | | 4,702,943,698 | |
Total U.S. Government Sponsored Agency Securities — 71.7% | | | | 4,762,080,651 | |
| | | | | | | | | | | | |
| U.S. Treasury Obligations | | | | | | | | | |
U.S. Treasury Bonds: | | | | | | | | | | | | |
4.75%, 2/15/37 | | | | | | | 8,629 | | | | 12,142,625 | |
2.50%, 2/15/45 | | | | | | | 227,062 | | | | 224,968,914 | |
U.S. Treasury Inflation Indexed Bonds: | | | | | | | | | | | | |
0.75%, 2/15/42-2/15/45 (j) | | | | | | | 15,410 | | | | 15,601,778 | |
1.38%, 2/15/44 (l) | | | | | | | 18,250 | | | | 21,450,551 | |
U.S. Treasury Inflation Indexed Notes: | | | | | | | | | | | | |
0.13%, 7/15/24 | | | | | | | 3,893 | | | | 3,953,454 | |
0.25%, 1/15/25 (l) | | | | | | | 27,721 | | | | 27,911,479 | |
U.S. Treasury Notes: | | | | | | | | | | | | |
0.50%, 3/31/17 (k) | | | | | | | 329,215 | | | | 328,854,921 | |
1.00%, 3/15/18 (k) | | | | | | | 459,485 | | | | 461,172,626 | |
1.63%, 4/30/19 (l) | | | | | | | 19,620 | | | | 19,944,946 | |
1.38%, 3/31/20 (k) | | | | | | | 520,345 | | | | 520,345,000 | |
1.75%, 2/28/22-3/31/22 | | | | | | | 232,061 | | | | 232,682,842 | |
2.25%, 11/15/24 | | | | | | | 16,398 | | | | 16,857,606 | |
2.00%, 2/15/25 (k) | | | | | | | 40,706 | | | | 40,963,386 | |
U.S. Treasury Strips, 0.00%, 5/15/36 (k) | | | | | | | 14,105 | | | | 8,257,532 | |
Total U.S. Treasury Obligations — 29.1% | | | | 1,935,107,660 | |
Total Long-Term Investments (Cost — $10,744,646,941) — 162.5% | | | | 10,799,668,581 | |
| | | | | | | | | | | | |
| Short-Term Securities | | | | | | | | | |
Borrowed Bond Agreements — 1.6% (t) | |
Barclays Bank PLC, (0.30)%, Open (u)
(Purchased on 12/17/14 to be repurchased at EUR 3,369,516, collateralized by Buoni Poliennali Del Tesoro, 4.50% due at 3/01/26, par and fair value of EUR 2,600,000 and $3,688,845, respectively) | | | EUR | | | | 3,372 | | | | 3,626,200 | |
Barclays Capital, Inc., (0.25)%, Open (u)
(Purchased on 3/31/15 to be repurchased at $2,785,981, collateralized by Rio Tinto Finance USA PLC, 4.13% due at 8/21/42, par and fair value of USD 2,800,000 and $2,757,695, respectively) | | | USD | | | | 2,786 | | | | 2,786,000 | |
Barclays Capital, Inc., (0.15)%, Open (u)
(Purchased on 3/23/15 to be repurchased at $940,465, collateralized by United Rentals North America, Inc., 5.75% due at 11/15/24, par and fair value of USD 900,000 and $929,250, respectively) | | | | | | | 941 | | | | 940,500 | |
Barclays Capital, Inc., (0.10)%, Open (u)
(Purchased on 2/02/15 to be repurchased at $2,051,989, collateralized by Chesapeake Energy Corp., 4.88% due at 4/15/22, par and fair value of USD 2,032,000 and $1,905,000, respectively) | | | | | | | 2,052 | | | | 2,052,320 | |
| | | | | | | | | | | | |
| Short-Term Securities | | | | | Par
(000) | | | Value | |
Borrowed Bond Agreements (continued) | |
Citigroup Global Markets, Inc., (0.75)%, Open (u)
(Purchased on 3/19/15 to be repurchased at $4,173,869, collateralized by AT&T Inc., 3.90% due at 3/11/24, par and fair value of USD 4,000,000 and $4,186,080, respectively) | | | USD | | | | 4,175 | | | $ | 4,175,000 | |
Citigroup Global Markets, Inc., (0.25)%, Open (u)
(Purchased on 3/04/15 to be repurchased at $995,338, collateralized by T-Mobile USA, Inc., 6.84% due at 4/28/23, par and fair value of USD 925,000 and $973,563, respectively) | | | | | | | 996 | | | | 995,531 | |
Citigroup Global Markets, Inc., (0.10)%, Open (u)
(Purchased on 1/13/15 to be repurchased at $1,039,775, collateralized by Iron Mountain, Inc., 5.75% due at 8/15/24, par and fair value of USD 1,000,000 and $1,012,500, respectively) | | | | | | | 1,040 | | | | 1,040,000 | |
Citigroup Global Markets, Inc., (0.10)%, Open (u)
(Purchased on 1/16/15 to be repurchased at $2,803,116, collateralized by Calpine Corp., 5.88% due at 1/15/24, par and fair value of USD 2,645,000 and $2,857,923, respectively) | | | | | | | 2,804 | | | | 2,803,700 | |
Citigroup Global Markets, Inc., (0.10)%, Open (u)
(Purchased on 2/17/15 to be repurchased at $2,591,878, collateralized by Virgin Media Finance PLC, 6.38% due at 4/15/23, par and fair value of USD 2,370,000 and $2,524,050, respectively) | | | | | | | 2,592 | | | | 2,592,187 | |
Citigroup Global Markets, Inc., (0.10)%, Open (u)
(Purchased on 3/13/15 to be repurchased at $2,828,101, collateralized by ConocoPhillips Co., 4.30% due at 11/15/44, par and fair value of USD 2,700,000 and $2,865,745, respectively) | | | | | | | 2,828 | | | | 2,828,250 | |
Citigroup Global Markets, Inc., (0.10)%, Open (u)
(Purchased on 3/31/15 to be repurchased at $1,231,497, collateralized by CBS Corp., 4.60% due at 1/15/45, par and fair value of USD 1,200,000 and $1,221,632, respectively) | | | | | | | 1,232 | | | | 1,231,500 | |
Citigroup Global Markets, Inc., (0.10)%, Open (u)
(Purchased on 3/31/15 to be repurchased at $2,741,992, collateralized by BHP Billiton Finance USA Ltd., 5.00% due at 9/30/43, par and fair value of USD 2,400,000 and $2,748,487, respectively) | | | | | | | 2,742 | | | | 2,742,000 | |
Citigroup Global Markets, Inc., 0.00%, 04/07/15
(Purchased on 3/30/15 to be repurchased at $33,872,504, collateralized by U.S. Treasury Bonds, 6.25% due at 5/15/30, par and fair value of USD 22,013,000 and $33,459,760, respectively) | | | | | | | 33,873 | | | | 33,872,504 | |
Deutsche Bank Securities, Inc., 0.04%, Open (u)
(Purchased on 3/30/15 to be repurchased at $148,405, collateralized by U.S. Treasury Bonds, 3.00% due at 11/15/44, par and fair value of USD 134,000 and $146,824, respectively) | | | | | | | 148 | | | | 148,405 | |
Deutsche Bank Securities, Inc., 0.15%, 05/21/15
(Purchased on 2/19/15 to be repurchased at $8,129,645, collateralized by U.S. Treasury Strips, 0.00% due at 2/15/36, par and fair value of USD 13,601,000 and $8,204,504, respectively) | | | | | | | 8,127 | | | | 8,126,598 | |
See Consolidated Notes to Financial Statements.
| | | | | | |
| | | BLACKROCK BALANCED CAPITAL FUND, INC. | | MARCH 31, 2015 | | 55 |
| | | | |
| Consolidated Schedule of Investments (continued) | | | Master Total Return Portfolio | |
| | | (Percentages shown are based on Net Assets) | |
| | | | | | | | | | | | |
| Short-Term Securities | | | | | Par (000) | | | Value | |
Borrowed Bond Agreements (concluded) | |
Deutsche Bank Securities, Inc., 0.17%, Open (u)
(Purchased on 3/17/15 to be repurchased at $13,529,493, collateralized by U.S. Treasury Bonds, 3.63% due at 2/15/44, par and fair value of USD 11,227,000 and $13,726,657, respectively) | | | USD | | | | 13,529 | | | $ | 13,528,535 | |
J.P. Morgan Securities LLC, 0.20%, Open (u)
(Purchased on 3/12/15 to be repurchased at $18,447,043, collateralized by U.S. Treasury Inflation Indexed Notes, 0.13% due at 4/15/19, par and fair value of USD 18,285,000 and $18,577,751, respectively) | | | | | | | 18,445 | | | | 18,444,994 | |
JPMorgan Chase Bank N.A., (0.18)%, Open (u)
(Purchased on 12/16/14 to be repurchased at EUR 473,269, collateralized by Bundesrepublik Deutschland, 2.50% due at 1/04/21, par and fair value of EUR 404,000 and $499,016, respectively) | | | EUR | | | | 474 | | | | 509,145 | |
JPMorgan Chase Bank N.A., (0.18)%, Open (u)
(Purchased on 12/16/14 to be repurchased at EUR 931,718, collateralized by Bundesrepublik Deutschland, 0.75% due at 2/24/17, par and fair value of EUR 906,000 and $992,594, respectively) | | | | | | | 932 | | | | 1,002,347 | |
RBC Capital Markets, LLC, (0.40)%, Open (u) (Purchased on 3/09/15 to be repurchased at $411,330, collateralized by ArcelorMittal, 6.50% due at 2/25/22, par and fair value of USD 369,000 and $404,055, respectively) | | | USD | | | | 411 | | | | 411,435 | |
RBC Capital Markets, LLC, (0.10)%, Open (u)
(Purchased on 1/26/15 to be repurchased at $1,171,292, collateralized by CIT Group, Inc., 5.00% due at 8/01/23, par and fair value of USD 1,100,000 and $1,127,500, respectively) | | | | | | | 1,172 | | | | 1,171,500 | |
RBC Capital Markets, LLC, (0.10)%, Open (u)
(Purchased on 12/24/14 to be repurchased at $994,735, collateralized by Apache Corp., 4.75% due at 4/15/43, par and fair value of USD 1,000,000 and $1,045,158, respectively) | | | | | | | 995 | | | | 995,000 | |
RBC Capital Markets, LLC, (0.10)%, Open (u)
(Purchased on 3/11/15 to be repurchased at $1,988,884, collateralized by Nova Chemicals Corp., 5.25% due at 8/01/23, par and fair value of USD 1,872,000 and $1,956,240, respectively) | | | | | | | 1,989 | | | | 1,989,000 | |
| | | | | | | | | | | | |
| | | | | | | | | | | | 108,012,651 | |
| | | | | | Shares | | | | |
Mutual Funds — 0.2% | | | | | | | | | | | | |
BlackRock Liquidity Funds, TempFund, Institutional Class, 0.06% (m)(v) | | | | | | | 12,866,608 | | | | 12,866,608 | |
Total Short-Term Securities (Cost — $121,625,045) — 1.8% | | | | 120,879,259 | |
| | | | | | | | | | | | |
| Options Purchased | | | | | | | | | |
(Cost — $26,653,717) — 0.5% | | | | 32,024,009 | |
Total Investments Before TBA Sale Commitments, Options Written and Borrowed Bonds | | | | | |
(Cost — $10,892,925,703) — 164.8% | | | | 10,952,571,849 | |
| | | | | | | | | | | | |
| | | | | | | | | | |
| | | | | | | | | | | | |
| TBA Sale Commitments (s) | | | | | Par (000) | | | Value | |
Fannie Mae Mortgage-Backed Securities: | | | | | | | | | | | | |
2.50%, 4/01/30 | | | USD | | | | 28,000 | | | $ | (28,756,874 | ) |
3.00%, 4/01/30-4/01/45 | | | | | | | 215,125 | | | | (223,618,063 | ) |
3.50%, 4/01/30-4/01/45 | | | | | | | 149,000 | | | | (157,309,958 | ) |
4.00%, 4/01/30-4/01/45 | | | | | | | 477,875 | | | | (510,920,840 | ) |
4.50%, 4/01/45 | | | | | | | 697,100 | | | | (759,698,662 | ) |
5.00%, 4/01/45 | | | | | | | 195,900 | | | | (217,714,733 | ) |
5.50%, 4/01/45 | | | | | | | 7,000 | | | | (7,876,899 | ) |
6.00%, 4/01/45 | | | | | | | 12,200 | | | | (13,917,528 | ) |
Freddie Mac Mortgage-Backed Securities: | | | | | | | | | | | | |
3.50%, 4/01/45 | | | | | | | 52,000 | | | | (54,497,425 | ) |
4.00%, 4/01/45 | | | | | | | 63,300 | | | | (67,612,961 | ) |
4.50%, 4/01/45 | | | | | | | 25,200 | | | | (27,442,407 | ) |
5.00%, 4/01/45 | | | | | | | 9,400 | | | | (10,423,718 | ) |
5.50%, 4/01/45 | | | | | | | 3,400 | | | | (3,814,906 | ) |
6.00%, 4/01/45 | | | | | | | 7,800 | | | | (8,874,023 | ) |
Ginnie Mae Mortgage-Backed Securities: | | | | | | | | | | | | |
3.00%, 4/15/45 | | | | | | | 8,700 | | | | (8,958,109 | ) |
3.50%, 4/15/45 | | | | | | | 104,900 | | | | (110,384,320 | ) |
4.00%, 4/15/45 | | | | | | | 498,900 | | | | (531,495,846 | ) |
Total TBA Sale Commitments (Proceeds — $2,731,349,440) — (41.3)% | | | | | | | | | | | (2,743,317,272 | ) |
| | | | | | | | | | | | |
| Options Written | | | | | | | | | |
(Premiums Received — $20,097,434) — (0.4)% | | | | (24,917,981 | ) |
| | | | | | | | | | | | |
| Borrowed Bonds | | | | | Par (000) | | | Value | |
Corporate Bonds — (0.4)% | | | | | | | | | | | | |
Apache Corp., 4.75%, 4/15/43 | | | USD | | | | 1,000 | | | | (1,045,158 | ) |
ArcelorMittal, 6.50%, 2/25/22 | | | | | | | 369 | | | | (404,055 | ) |
AT&T Inc., 3.90%, 3/11/24 | | | | | | | 4,000 | | | | (4,186,080 | ) |
BHP Billiton Finance USA Ltd., 5.00%, 9/30/43 | | | | | | | 2,400 | | | | (2,748,487 | ) |
Calpine Corp., 5.88%, 1/15/24 (b) | | | | | | | 2,645 | | | | (2,857,923 | ) |
CBS Corp., 4.60%, 1/15/45 | | | | | | | 1,200 | | | | (1,221,632 | ) |
Chesapeake Energy Corp., 4.88%, 4/15/22 | | | | | | | 2,032 | | | | (1,905,000 | ) |
CIT Group, Inc., 5.00%, 8/01/23 | | | | | | | 1,100 | | | | (1,127,500 | ) |
ConocoPhillips Co., 4.30%, 11/15/44 | | | | | | | 2,700 | | | | (2,865,745 | ) |
Iron Mountain, Inc., 5.75%, 8/15/24 | | | | | | | 1,000 | | | | (1,012,500 | ) |
Nova Chemicals Corp., 5.25%, 8/01/23 (b) | | | | | | | 1,872 | | | | (1,956,240 | ) |
Rio Tinto Finance USA PLC, 4.13%, 8/21/42 | | | | | | | 2,800 | | | | (2,757,695 | ) |
T-Mobile USA, Inc., 6.84%, 4/28/23 | | | | | | | 925 | | | | (973,563 | ) |
United Rentals North America, Inc., 5.75%, 11/15/24 | | | | | | | 900 | | | | (929,250 | ) |
Virgin Media Finance PLC, 6.38%, 4/15/23 (b) | | | | | | | 2,370 | | | | (2,524,050 | ) |
| | | | | | | | | | | | |
| | | | | | | | | | | | (28,514,878 | ) |
See Consolidated Notes to Financial Statements.
| | | | | | |
| 56 | | BLACKROCK BALANCED CAPITAL FUND, INC. | | MARCH 31, 2015 | | |
| | | | |
| Consolidated Schedule of Investments (continued) | | | Master Total Return Portfolio | |
| | | (Percentages shown are based on Net Assets) | |
| | | | | | | | | | | | |
| Borrowed Bonds | | | | | Par
(000) | | | Value | |
Foreign Government Obligations — (0.1)% | |
Bundesrepublik Deutschland, | | | | | | | | | | | | |
0.75%, 2/24/17 | | | EUR | | | | 906 | | | $ | (992,594 | ) |
2.50%, 1/04/21 | | | | | | | 404 | | | | (499,016 | ) |
Buoni Poliennali Del Tesoro, 4.50%, 3/01/26 | | | | | | | 2,600 | | | | (3,688,845 | ) |
| | | | | | | | | | | | |
| | | | | | | | | | | | (5,180,455 | ) |
U.S. Treasury Obligations — (1.1)% | | | | | | | | | | | | |
U.S. Treasury Bonds, | | | | | | | | | | | | |
6.25%, 5/15/30 | | | USD | | | | 22,013 | | | | (33,459,760 | ) |
3.63%, 2/15/44 | | | | | | | 11,227 | | | | (13,726,657 | ) |
3.00%, 11/15/44 | | | | | | | 134 | | | | (146,824 | ) |
U.S. Treasury Inflation Indexed Notes, 0.13%, 4/15/19 | | | USD | | | | 18,285 | | | | (18,577,751 | ) |
| | | | | | | | | | | | |
| Borrowed Bonds | | | | | Par
(000) | | | Value | |
U.S. Treasury Obligations (concluded) | |
U.S. Treasury Strips, 0.00%, 2/15/36 | | | USD | | | | 13,601 | | | $ | (8,204,504 | ) |
| | | | | | | | | | | | |
| | | | | | | | | | | | (74,115,496 | ) |
Total Borrowed Bonds (Proceeds — $107,498,813) — (1.6)% | | | | (107,810,829 | ) |
Total Investments Net of TBA Sale Commitments, Options Written and Borrowed Bonds — 121.5% | | | | 8,076,525,767 | |
Liabilities in Excess of Other Assets — (21.5)% | | | | (1,430,828,903 | ) |
| | | | | | | | | | | | |
Net Assets — 100.0% | | | | | | | | | | $ | 6,645,696,864 | |
| | | | | | | | | | | | |
|
| Notes to Consolidated Schedule of Investments |
| (a) | Variable rate security. Rate shown is as of report date. |
| (b) | Security exempt from registration pursuant to Rule 144A under the Securities Act of 1933, as amended. These securities may be resold in transactions exempt from registration to qualified institutional investors. |
| (c) | Represents a step-up bond that pays an initial coupon rate for the first period and then a higher coupon rate for the following periods. Rate shown is as of report date. |
| (d) | All or a portion of security has been pledged and/or segregated as collateral in connection with outstanding options written. |
| (e) | Non-income producing security. |
| (f) | Stapled Security — A security contractually bound to one or more other securities to form a single saleable unit which cannot be sold separately. |
| (h) | Represents a payment-in-kind security which may pay interest/dividends in additional par/shares and/or in cash. Rates shown are the current rate and possible payment rates. |
| (j) | All or a portion of security has been pledged as collateral in connection with outstanding borrowed bonds. |
| (k) | All or a portion of security has been pledged as collateral in connection with outstanding reverse repurchase agreements. |
| (l) | All or a portion of security has been pledged as collateral in connection with outstanding OTC derivatives. |
| (m) | During the six months ended March 31, 2015, investments in issuers considered to be an affiliate of the Master Portfolio for purposes of Section 2(a)(3) of the Investment Company Act of 1940, as amended, were as follows: |
| | | | | | | | | | | | | | | | | | | | | | | | | | | | |
| Affiliate | | Par/Shares
Held at
September 30,
2014 | | | Par/Shares
Purchased | | | Par/Shares
Sold | | | Par/Shares
Held at
March 31,
2015 | | | Value at
March 31,
2015 | | | Income | | | Realized
Gain | |
BlackRock Capital Finance LP, Series 1997-R2, Class AP | | | 7,197 | | | | — | | | | — | | | | 7,237 | | | $ | 7,089 | | | $ | 48 | | | | — | |
BlackRock Liquidity Funds, TempFund, Institutional Class | | | 12,191,454 | | | | 675,154 | 1 | | | — | | | | 12,866,608 | | | $ | 12,866,608 | | | $ | 8,560 | | | $ | 1,154 | |
| | 1 | | Represents net shares purchased. |
| (n) | Other interests represent beneficial interests in liquidation trusts and other reorganization or private entities. |
| (o) | Issuer filed for bankruptcy and/or is in default of interest payments. |
| (p) | Security is perpetual in nature and has no stated maturity date. |
| (q) | When-issued security. Unsettled when-issued transactions were as follows: |
| | | | | | | | |
| Counterparty | | Value | | | Unrealized
Appreciation
(Depreciation) | |
RBC Capital Markets, LLC | | $ | 753,621 | | | $ | 20 | |
Merrill Lynch, Pierce, Fenner & Smith Inc. | | $ | 1,030,107 | | | $ | 11,101 | |
Merrill Lynch, Pierce, Fenner & Smith Inc. | | $ | 1,045,153 | | | $ | (3,342 | ) |
Morgan Stanley & Co. LLC | | $ | 600,875 | | | $ | (1,375 | ) |
Morgan Stanley & Co. LLC | | $ | 3,195,188 | | | $ | (2,454 | ) |
Wells Fargo Securities, LLC | | $ | 1,753,495 | | | $ | 25,695 | |
Wells Fargo Securities, LLC | | $ | 745,441 | | | $ | (1,231 | ) |
| (r) | All or a portion of security has been pledged as collateral in connection with outstanding TBA commitments. |
See Consolidated Notes to Financial Statements.
| | | | | | |
| | | BLACKROCK BALANCED CAPITAL FUND, INC. | | MARCH 31, 2015 | | 57 |
| | | | |
| Consolidated Schedule of Investments (continued) | | | Master Total Return Portfolio | |
| (s) | Represents or includes a TBA transaction. As of March 31, 2015 , unsettled TBA transactions were as follows: |
| | | | | | | | |
| Counterparty | | Value | | | Unrealized
Appreciation
(Depreciation) | |
Barclays Capital, Inc. | | $ | 55,652,218 | | | $ | 189,749 | |
BB&T Securities LLC | | $ | (1,176,141 | ) | | $ | (4,391 | ) |
BNP Paribas Securities Corp. | | $ | 17,999,492 | | | $ | 83,946 | |
Citigroup Global Markets, Inc. | | $ | 18,866,945 | | | $ | 85,831 | |
Credit Suisse Securities (USA) LLC | | $ | 257,566,134 | | | $ | 1,083,543 | |
Deutsche Bank Securities, Inc. | | $ | (23,193,996 | ) | | $ | (493,892 | ) |
Goldman Sachs & Co. | | $ | 66,025,658 | | | $ | 145,189 | |
J.P. Morgan Securities LLC | | $ | 312,041,244 | | | $ | 1,924,986 | |
Merrill Lynch, Pierce, Fenner & Smith, Inc. | | $ | (125,576,452 | ) | | $ | (715,098 | ) |
Morgan Stanley & Co. LLC | | $ | (41,984,249 | ) | | $ | (30,820 | ) |
Nomura Securities International, Inc. | | $ | (103,929,782 | ) | | $ | (199,732 | ) |
RBC Capital Markets, LLC | | $ | (521,858 | ) | | $ | (20,451 | ) |
SG Americas Securities LLC | | $ | (4,464,836 | ) | | $ | (16,336 | ) |
Wells Fargo Securities, LLC | | $ | 24,227,324 | | | $ | 124,617 | |
| (t) | Certain agreements have no stated maturity and can be terminated by either party at any time. |
| (u) | The amount to be repurchased assumes the maturity will be the day after the report date. |
| (v) | Represents the current yield as of report date. |
| • | | For Master Portfolio compliance purposes, the Master Portfolio’s industry classifications refer to any one or more of the industry sub-classifications used by one or more widely recognized market indexes or ratings group indexes, and/or as defined by the investment advisor. These definitions may not apply for purposes of this report, which may combine such industry sub-classifications for reporting ease. |
| • | | As of March 31, 2015, reverse repurchase agreements outstanding were as follows: |
| | | | | | | | | | | | | | | | |
| Counterparty | | Interest
Rate | | | Trade
Date | | Maturity
Date1 | | Face Value | | | Face Value
Including
Accrued
Interest | |
Deutsche Bank Securities, Inc. | | | 0.22 | % | | 2/19/15 | | 5/21/15 | | $ | 7,969,325 | | | $ | 7,971,273 | |
Barclays Capital, Inc. | | | (3.25 | %) | | 3/02/15 | | Open | | | 1,231,333 | | | | 1,228,109 | |
Bank of Montreal | | | 0.24 | % | | 3/31/15 | | Open | | | 249,687,500 | | | | 249,689,164 | |
Credit Suisse Securities (USA) LLC | | | 0.00 | % | | 3/31/15 | | 4/01/15 | | | 66,705,117 | | | | 66,705,117 | |
J.P. Morgan Securities LLC | | | 0.12 | % | | 3/31/15 | | 4/01/15 | | | 451,687,500 | | | | 451,689,006 | |
Merrill Lynch, Pierce, Fenner & Smith, Inc. | | | 0.48 | % | | 3/31/15 | | 4/01/15 | | | 339,575,000 | | | | 339,579,528 | |
Total | | | | | | | | | | $ | 1,116,855,775 | | | $ | 1,116,862,197 | |
| | | | | | | | | | | | |
| | 1 | | Certain agreements have no stated maturity and can be terminated by either party at any time. |
| • | | As of March 31, 2015, financial futures contracts outstanding were as follows: |
| | | | | | | | | | | | | | | | | | | | |
Contracts
Long/(Short) | | | Issue | | Exchange | | Expiration | | | | | Notional Value | | | Unrealized
Appreciation
(Depreciation) | |
| | 81 | | | CBOE Volatility Index | | Chicago Board Options | | April 2015 | | | USD | | | | 1,318,275 | | | $ | 44,896 | |
| | 18 | | | SGX CNX Nifty Index | | Singapore | | April 2015 | | | USD | | | | 307,404 | | | | (470 | ) |
| | 113 | | | CBOE Volatility Index | | Chicago Board Options | | May 2015 | | | USD | | | | 2,014,225 | | | | 12,636 | |
| | 408 | | | Canadian Bankers Acceptance | | Montreal | | June 2015 | | | USD | | | | 79,796,850 | | | | 318,916 | |
| | (81 | ) | | CBOE Volatility Index | | Chicago Board Options | | June 2015 | | | USD | | | | 1,484,325 | | | | (33,191 | ) |
| | (160 | ) | | E-Mini S&P 500 Futures | | Chicago Mercantile | | June 2015 | | | USD | | | | 16,486,400 | | | | 96,964 | |
| | (37 | ) | | Euro Currency Futures | | Chicago Mercantile | | June 2015 | | | USD | | | | 4,973,725 | | | | (66,426 | ) |
| | 82 | | | Euro STOXX 50 Index | | Eurex | | June 2015 | | | USD | | | | 3,201,458 | | | | 24,376 | |
| | (192 | ) | | Euro STOXX Banks Index | | Eurex | | June 2015 | | | USD | | | | 1,606,159 | | | | (60,217 | ) |
| | (829 | ) | | Euro-Bobl | | Eurex | | June 2015 | | | USD | | | | 115,371,143 | | | | (203,962 | ) |
| | 487 | | | Euro-Bobl 4.5 to 5.5-Year Bond Futures Put
Options, Strike Price EUR 128.75 | | Eurex | | June 2015 | | | USD | | | | 41,892 | | | | (37,037 | ) |
| | (67 | ) | | Euro-BTP Italian Government Bond Futures | | Eurex | | June 2015 | | | USD | | | | 10,127,589 | | | | (36,906 | ) |
| | (477 | ) | | Euro-Bund | | Eurex | | June 2015 | | | USD | | | | 81,426,765 | | | | (538,666 | ) |
| | 197 | | | Euro-Bund 8.5 to 10.5-Year Bond Futures
Put Options, Strike Price EUR 156 | | Eurex | | June 2015 | | | USD | | | | 46,601 | | | | (93,357 | ) |
| | (15 | ) | | Euro-Buxl | | Eurex | | June 2015 | | | USD | | | | 2,841,229 | | | | (167,686 | ) |
| | (241 | ) | | Euro-Schatz | | Eurex | | June 2015 | | | USD | | | | 28,822,203 | | | | (22,158 | ) |
| | (43 | ) | | Japanese Yen Currency Futures | | Chicago Mercantile | | June 2015 | | | USD | | | | 4,485,975 | | | | (55,698 | ) |
| | (38 | ) | | Long Gilt British | | NYSE Liffe | | June 2015 | | | USD | | | | 6,806,549 | | | | (128,757 | ) |
See Consolidated Notes to Financial Statements.
| | | | | | |
| 58 | | BLACKROCK BALANCED CAPITAL FUND, INC. | | MARCH 31, 2015 | | |
| | | | |
| Consolidated Schedule of Investments (continued) | | | Master Total Return Portfolio | |
As of March 31, 2015, financial futures contracts outstanding were as follows: (concluded)
| | | | | | | | | | | | | | | | | | | | |
Contracts
Long/(Short) | | | Issue | | Exchange | | Expiration | | | | | Notional
Value | | | Unrealized
Appreciation
(Depreciation) | |
| | 1,191 | | | U.S. Treasury Bonds (30 Year) | | Chicago Board of Trade | | June 2015 | | | USD | | | | 195,175,125 | | | $ | 2,968,668 | |
| | (253 | ) | | U.S. Treasury Notes (10 Year) | | Chicago Board of Trade | | June 2015 | | | USD | | | | 32,613,281 | | | | (92,980 | ) |
| | 1,658 | | | U.S. Treasury Notes (2 Year) | | Chicago Board of Trade | | June 2015 | | | USD | | | | 363,361,062 | | | | 929,636 | |
| | 198 | | | U.S. Treasury Notes (5 Year) | | Chicago Board of Trade | | June 2015 | | | USD | | | | 23,801,766 | | | | (1,603 | ) |
| | (123 | ) | | U.S. Ultra Treasury Bonds | | Chicago Board of Trade | | June 2015 | | | USD | | | | 20,894,625 | | | | (333,892 | ) |
| | 716 | | | Canadian Bankers Acceptance | | Montreal | | September 2015 | | | USD | | | | 140,141,645 | | | | 4,712 | |
| | 81 | | | Three Month Sterling | | NYSE Liffe | | December 2015 | | | USD | | | | 14,920,226 | | | | (1,591 | ) |
| | (604 | ) | | Canadian Bankers Acceptance | | Montreal | | March 2016 | | | USD | | | | 118,267,735 | | | | (52,416 | ) |
| | (686 | ) | | Euro Dollar Futures | | Chicago Mercantile | | March 2016 | | | USD | | | | 170,059,400 | | | | (328,745 | ) |
| | 81 | | | Three Month Sterling | | NYSE Liffe | | March 2016 | | | USD | | | | 14,905,207 | | | | (89 | ) |
| | (191 | ) | | Canadian Bankers Acceptance | | Montreal | | June 2016 | | | USD | | | | 37,380,384 | | | | (359,829 | ) |
| | (526 | ) | | Euro Dollar Futures | | Chicago Mercantile | | June 2016 | | | USD | | | | 130,145,550 | | | | (201,805 | ) |
| | (217 | ) | | Canadian Bankers Acceptance | | Montreal | | September 2016 | | | USD | | | | 42,438,830 | | | | (371,525 | ) |
| | (247 | ) | | Euro Dollar Futures | | Chicago Mercantile | | September 2016 | | | USD | | | | 60,993,562 | | | | (150,089 | ) |
| | (1,189 | ) | | Euro Dollar Futures | | Chicago Mercantile | | December 2016 | | | USD | | | | 293,073,637 | | | | (777,636 | ) |
| | (81 | ) | | Three Month Sterling | | NYSE Liffe | | December 2016 | | | USD | | | | 14,851,137 | | | | 2,915 | |
| | 1,240 | | | 3-month EURIBOR | | NYSE Liffe | | December 2016 | | | USD | | | | 333,259,500 | | | | 245,495 | |
| | (187 | ) | | Euro Dollar Futures | | Chicago Mercantile | | March 2017 | | | USD | | | | 46,025,375 | | | | (123,592 | ) |
| | (81 | ) | | Three Month Sterling | | NYSE Liffe | | March 2017 | | | USD | | | | 14,837,620 | | | | 690 | |
| | (49 | ) | | Euro Dollar Futures | | Chicago Mercantile | | June 2017 | | | USD | | | | 12,042,975 | | | | (679 | ) |
| | (49 | ) | | Euro Dollar Futures | | Chicago Mercantile | | September 2017 | | | USD | | | | 12,028,275 | | | | (26,184 | ) |
| | (49 | ) | | Euro Dollar Futures | | Chicago Mercantile | | December 2017 | | | USD | | | | 12,014,187 | | | | (41,287 | ) |
| | (1,240 | ) | | 3-month EURIBOR | | NYSE Liffe | | December 2017 | | | USD | | | | 332,776,177 | | | | (287,867 | ) |
| | (49 | ) | | Euro Dollar Futures | | Chicago Mercantile | | March 2018 | | | USD | | | | 12,003,775 | | | | (25,094 | ) |
| | Total | | | | | | | | | | | | | | | | | $ | 28,470 | |
| | | | | | | | | | | | | | | | | | | | |
| • | | As of March 31, 2015, forward foreign currency exchange contracts outstanding were as follows: |
| | | | | | | | | | | | | | | | | | | | | | |
Currency
Purchased | | | Currency
Sold | | | Counterparty | | Settlement
Date | | | Unrealized
Appreciation
(Depreciation) | |
| BRL | | | 2,384,888 | | | | USD | | | | 731,000 | | | BNP Paribas S.A. | | | 4/02/15 | | | $ | 15,854 | |
| BRL | | | 2,566,465 | | | | USD | | | | 825,230 | | | Credit Suisse International | | | 4/02/15 | | | | (21,513 | ) |
| BRL | | | 2,739,799 | | | | USD | | | | 878,000 | | | Credit Suisse International | | | 4/02/15 | | | | (20,001 | ) |
| BRL | | | 2,417,783 | | | | USD | | | | 731,000 | | | Deutsche Bank AG | | | 4/02/15 | | | | 26,156 | |
| BRL | | | 2,738,043 | | | | USD | | | | 878,000 | | | Deutsche Bank AG | | | 4/02/15 | | | | (20,551 | ) |
| BRL | | | 2,751,213 | | | | USD | | | | 878,000 | | | Deutsche Bank AG | | | 4/02/15 | | | | (16,427 | ) |
| BRL | | | 2,380,895 | | | | USD | | | | 730,000 | | | Goldman Sachs International | | | 4/02/15 | | | | 15,604 | |
| BRL | | | 2,565,162 | | | | USD | | | | 804,000 | | | Goldman Sachs International | | | 4/02/15 | | | | (691 | ) |
| BRL | | | 2,795,991 | | | | USD | | | | 878,000 | | | Goldman Sachs International | | | 4/02/15 | | | | (2,404 | ) |
| BRL | | | 2,668,381 | | | | USD | | | | 825,230 | | | Royal Bank of Scotland PLC | | | 4/02/15 | | | | 10,404 | |
See Consolidated Notes to Financial Statements.
| | | | | | |
| | | BLACKROCK BALANCED CAPITAL FUND, INC. | | MARCH 31, 2015 | | 59 |
| | | | |
| Consolidated Schedule of Investments (continued) | | | Master Total Return Portfolio | |
As of March 31, 2015, forward foreign currency exchange contracts outstanding were as follows: (continued)
| | | | | | | | | | | | | | | | | | | | | | |
Currency
Purchased | | | Currency
Sold | | | Counterparty | | Settlement
Date | | | Unrealized
Appreciation
(Depreciation) | |
| BRL | | | 2,840,330 | | | | USD | | | | 878,000 | | | UBS AG | | | 4/02/15 | | | $ | 11,481 | |
| IDR | | | 28,066,860,000 | | | | USD | | | | 2,169,000 | | | Royal Bank of Scotland PLC | | | 4/02/15 | | | | (23,380 | ) |
| IDR | | | 57,348,000,000 | | | | USD | | | | 4,320,000 | | | Standard Chartered Bank | | | 4/02/15 | | | | 64,068 | |
| USD | | | 731,000 | | | | BRL | | | | 2,399,508 | | | Citibank N.A. | | | 4/02/15 | | | | (20,433 | ) |
| USD | | | 878,000 | | | | BRL | | | | 2,667,364 | | | Deutsche Bank AG | | | 4/02/15 | | | | 42,685 | |
| USD | | | 1,097,000 | | | | BRL | | | | 3,308,552 | | | Deutsche Bank AG | | | 4/02/15 | | | | 60,890 | |
| USD | | | 878,000 | | | | BRL | | | | 2,647,609 | | | Goldman Sachs International | | | 4/02/15 | | | | 48,871 | |
| USD | | | 878,000 | | | | BRL | | | | 2,755,164 | | | Goldman Sachs International | | | 4/02/15 | | | | 15,189 | |
| USD | | | 878,000 | | | | BRL | | | | 2,771,846 | | | Goldman Sachs International | | | 4/02/15 | | | | 9,965 | |
| USD | | | 1,097,000 | | | | BRL | | | | 3,361,757 | | | Goldman Sachs International | | | 4/02/15 | | | | 44,228 | |
| USD | | | 731,000 | | | | BRL | | | | 2,411,935 | | | HSBC Bank PLC | | | 4/02/15 | | | | (24,324 | ) |
| USD | | | 730,000 | | | | BRL | | | | 2,377,245 | | | Morgan Stanley Capital Services LLC | | | 4/02/15 | | | | (14,461 | ) |
| USD | | | 1,097,000 | | | | BRL | | | | 3,542,762 | | | Morgan Stanley Capital Services LLC | | | 4/02/15 | | | | (12,456 | ) |
| USD | | | 41,460 | | | | BRL | | | | 131,615 | | | Royal Bank of Scotland PLC | | | 4/02/15 | | | | 243 | |
| COP | | | 2,361,540,870 | | | | USD | | | | 897,000 | | | Credit Suisse International | | | 4/06/15 | | | | 10,592 | |
| USD | | | 897,000 | | | | COP | | | | 2,302,150,500 | | | Morgan Stanley & Co. International PLC | | | 4/06/15 | | | | 12,233 | |
| EUR | | | 300,000 | | | | USD | | | | 326,335 | | | UBS AG | | | 4/07/15 | | | | (3,729 | ) |
| TRY | | | 6,917,750 | | | | USD | | | | 2,775,365 | | | BNP Paribas S.A. | | | 4/07/15 | | | | (118,989 | ) |
| TRY | | | 8,293,207 | | | | USD | | | | 3,194,276 | | | BNP Paribas S.A. | | | 4/07/15 | | | | (9,733 | ) |
| TRY | | | 32,390,000 | | | | USD | | | | 12,241,581 | | | Deutsche Bank AG | | | 4/07/15 | | | | 195,992 | |
| TRY | | | 7,539,578 | | | | USD | | | | 2,891,000 | | | Royal Bank of Canada | | | 4/07/15 | | | | 4,154 | |
| USD | | | 2,276,299 | | | | MXN | | | | 34,628,045 | | | BNP Paribas S.A. | | | 4/07/15 | | | | 7,212 | |
| USD | | | 1,811,901 | | | | MXN | | | | 27,027,247 | | | JPMorgan Chase Bank N.A. | | | 4/07/15 | | | | 40,875 | |
| USD | | | 13,089,513 | | | | TRY | | | | 32,390,000 | | | Deutsche Bank AG | | | 4/07/15 | | | | 651,939 | |
| MXN | | | 5,965,721 | | | | USD | | | | 398,400 | | | Deutsche Bank AG | | | 4/08/15 | | | | (7,508 | ) |
| MXN | | | 21,810,920 | | | | USD | | | | 1,465,000 | | | JPMorgan Chase Bank N.A. | | | 4/08/15 | | | | (35,883 | ) |
| MXN | | | 43,502,199 | | | | USD | | | | 2,905,600 | | | Morgan Stanley Capital Services LLC | | | 4/08/15 | | | | (55,206 | ) |
| USD | | | 908,000 | | | | ZAR | | | | 10,892,200 | | | Barclays Bank PLC | | | 4/08/15 | | | | 11,224 | |
| USD | | | 624,000 | | | | ZAR | | | | 7,579,542 | | | BNP Paribas S.A. | | | 4/08/15 | | | | (38 | ) |
| ZAR | | | 3,917,099 | | | | USD | | | | 321,000 | | | BNP Paribas S.A. | | | 4/08/15 | | | | 1,502 | |
| ZAR | | | 5,542,126 | | | | USD | | | | 462,500 | | | BNP Paribas S.A. | | | 4/08/15 | | | | (6,206 | ) |
| ZAR | | | 15,123,682 | | | | USD | | | | 1,273,000 | | | Royal Bank of Scotland PLC | | | 4/08/15 | | | | (27,839 | ) |
| IDR | | | 5,722,476,431 | | | | USD | | | | 438,168 | | | Standard Chartered Bank | | | 4/09/15 | | | | (1,405 | ) |
| IDR | | | 84,746,340,000 | | | | USD | | | | 6,489,000 | | | Standard Chartered Bank | | | 4/09/15 | | | | (20,801 | ) |
| KRW | | | 815,878,800 | | | | USD | | | | 726,000 | | | JPMorgan Chase Bank N.A. | | | 4/09/15 | | | | 9,162 | |
| KRW | | | 815,334,300 | | | | USD | | | | 726,000 | | | Standard Chartered Bank | | | 4/09/15 | | | | 8,671 | |
| MYR | | | 5,429,193 | | | | USD | | | | 1,463,000 | | | Standard Chartered Bank | | | 4/09/15 | | | | 1,687 | |
| USD | | | 1,452,000 | | | | KRW | | | | 1,602,282,000 | | | JPMorgan Chase Bank N.A. | | | 4/09/15 | | | | 8,236 | |
| USD | | | 3,167,000 | | | | MYR | | | | 11,531,680 | | | Royal Bank of Scotland PLC | | | 4/09/15 | | | | 55,984 | |
| EUR | | | 1,884,000 | | | | USD | | | | 2,024,081 | | | Citibank N.A. | | | 4/13/15 | | | | 2,050 | |
| TRY | | | 3,792,370 | | | | USD | | | | 1,494,000 | | | BNP Paribas S.A. | | | 4/13/15 | | | | (40,315 | ) |
| TRY | | | 26,480,000 | | | | USD | | | | 10,401,854 | | | Deutsche Bank AG | | | 4/13/15 | | | | (251,581 | ) |
| USD | | | 597,600 | | | | TRY | | | | 1,520,055 | | | BNP Paribas S.A. | | | 4/13/15 | | | | 14,935 | |
| USD | | | 10,566,218 | | | | TRY | | | | 26,480,000 | | | Deutsche Bank AG | | | 4/13/15 | | | | 415,946 | |
| USD | | | 896,400 | | | | TRY | | | | 2,280,352 | | | Goldman Sachs International | | | 4/13/15 | | | | 22,299 | |
| USD | | | 3,675,000 | | | | ZAR | | | | 45,195,260 | | | Barclays Bank PLC | | | 4/13/15 | | | | (42,767 | ) |
| USD | | | 929,000 | | | | ZAR | | | | 11,435,340 | | | BNP Paribas S.A. | | | 4/13/15 | | | | (11,672 | ) |
| USD | | | 1,211,000 | | | | ZAR | | | | 15,118,003 | | | BNP Paribas S.A. | | | 4/13/15 | | | | (32,609 | ) |
| USD | | | 4,035,200 | | | | ZAR | | | | 49,766,041 | | | Royal Bank of Scotland PLC | | | 4/13/15 | | | | (58,560 | ) |
See Consolidated Notes to Financial Statements.
| | | | | | |
| 60 | | BLACKROCK BALANCED CAPITAL FUND, INC. | | MARCH 31, 2015 | | |
| | | | |
| Consolidated Schedule of Investments (continued) | | | Master Total Return Portfolio | |
As of March 31, 2015, forward foreign currency exchange contracts outstanding were as follows: (continued)
| | | | | | | | | | | | | | | | | | | | | | |
Currency
Purchased | | | Currency
Sold | | | Counterparty | | Settlement
Date | | | Unrealized
Appreciation
(Depreciation) | |
| ZAR | | | 3,576,283 | | | | USD | | | | 302,667 | | | Barclays Bank PLC | | | 4/13/15 | | | $ | (8,482 | ) |
| ZAR | | | 9,145,810 | | | | USD | | | | 743,000 | | | BNP Paribas S.A. | | | 4/13/15 | | | | 9,335 | |
| ZAR | | | 15,190,905 | | | | USD | | | | 1,211,000 | | | BNP Paribas S.A. | | | 4/13/15 | | | | 38,606 | |
| ZAR | | | 17,895,932 | | | | USD | | | | 1,513,333 | | | BNP Paribas S.A. | | | 4/13/15 | | | | (41,212 | ) |
| ZAR | | | 21,545,387 | | | | USD | | | | 1,816,000 | | | BNP Paribas S.A. | | | 4/13/15 | | | | (43,674 | ) |
| ZAR | | | 3,577,000 | | | | USD | | | | 302,667 | | | Citibank N.A. | | | 4/13/15 | | | | (8,423 | ) |
| ZAR | | | 7,145,109 | | | | USD | | | | 605,333 | | | Deutsche Bank AG | | | 4/13/15 | | | | (17,576 | ) |
| ZAR | | | 24,997,631 | | | | USD | | | | 2,119,000 | | | JPMorgan Chase Bank N.A. | | | 4/13/15 | | | | (62,692 | ) |
| PLN | | | 12,565,407 | | | | EUR | | | | 3,069,000 | | | Credit Suisse International | | | 4/15/15 | | | | 13,443 | |
| PLN | | | 3,135,980 | | | | EUR | | | | 767,250 | | | Deutsche Bank AG | | | 4/15/15 | | | | 1,944 | |
| PLN | | | 3,135,025 | | | | EUR | | | | 767,250 | | | Goldman Sachs International | | | 4/15/15 | | | | 1,692 | |
| PLN | | | 3,135,505 | | | | EUR | | | | 767,250 | | | Morgan Stanley Capital Services LLC | | | 4/15/15 | | | | 1,819 | |
| PLN | | | 3,134,891 | | | | EUR | | | | 767,250 | | | UBS AG | | | 4/15/15 | | | | 1,657 | |
| ZAR | | | 12,893,954 | | | | USD | | | | 1,090,000 | | | BNP Paribas S.A. | | | 4/15/15 | | | | (29,712 | ) |
| ZAR | | | 8,675,879 | | | | USD | | | | 726,000 | | | Royal Bank of Scotland PLC | | | 4/15/15 | | | | (12,570 | ) |
| ZAR | | | 8,707,503 | | | | USD | | | | 726,000 | | | Standard Chartered Bank | | | 4/15/15 | | | | (9,970 | ) |
| KRW | | | 1,595,960,100 | | | | USD | | | | 1,407,000 | | | Bank of America N.A. | | | 4/16/15 | | | | 30,720 | |
| KRW | | | 1,622,087,000 | | | | USD | | | | 1,447,000 | | | Deutsche Bank AG | | | 4/16/15 | | | | 14,256 | |
| KRW | | | 1,341,433,800 | | | | USD | | | | 1,206,000 | | | JPMorgan Chase Bank N.A. | | | 4/16/15 | | | | 2,430 | |
| TRY | | | 41,187,000 | | | | USD | | | | 16,166,346 | | | Deutsche Bank AG | | | 4/16/15 | | | | (392,489 | ) |
| USD | | | 1,206,000 | | | | KRW | | | | 1,365,192,000 | | | HSBC Bank PLC | | | 4/16/15 | | | | (23,833 | ) |
| USD | | | 1,608,000 | | | | KRW | | | | 1,812,055,200 | | | HSBC Bank PLC | | | 4/16/15 | | | | (24,389 | ) |
| USD | | | 1,206,000 | | | | KRW | | | | 1,355,242,500 | | | Standard Chartered Bank | | | 4/16/15 | | | | (14,870 | ) |
| USD | | | 2,010,000 | | | | KRW | | | | 2,259,742,500 | | | Standard Chartered Bank | | | 4/16/15 | | | | (25,688 | ) |
| USD | | | 1,077,000 | | | | MYR | | | | 3,994,162 | | | Bank of America N.A. | | | 4/16/15 | | | | 184 | |
| USD | | | 989,000 | | | | MYR | | | | 3,668,498 | | | Royal Bank of Scotland PLC | | | 4/16/15 | | | | (18 | ) |
| USD | | | 16,954,965 | | | | TRY | | | | 41,187,000 | | | BNP Paribas S.A. | | | 4/16/15 | | | | 1,181,107 | |
| EUR | | | 17,873,000 | | | | USD | | | | 19,351,313 | | | Bank of America N.A. | | | 4/21/15 | | | | (127,803 | ) |
| EUR | | | 6,948,000 | | | | USD | | | | 7,457,870 | | | Citibank N.A. | | | 4/21/15 | | | | 15,131 | |
| EUR | | | 150,000 | | | | USD | | | | 170,130 | | | Royal Bank of Scotland PLC | | | 4/21/15 | | | | (8,795 | ) |
| EUR | | | 6,500,000 | | | | USD | | | | 7,299,290 | | | State Street Bank and Trust Co. | | | 4/21/15 | | | | (308,141 | ) |
| USD | | | 1,246,095 | | | | AUD | | | | 1,538,000 | | | TD Securities, Inc. | | | 4/21/15 | | | | 76,180 | |
| USD | | | 316,408 | | | | CNH | | | | 2,000,000 | | | JPMorgan Chase Bank N.A. | | | 4/21/15 | | | | (5,331 | ) |
| USD | | | 59,366 | | | | EUR | | | | 52,000 | | | Bank of America N.A. | | | 4/21/15 | | | | 3,437 | |
| USD | | | 260,885 | | | | EUR | | | | 230,000 | | | Bank of America N.A. | | | 4/21/15 | | | | 13,506 | |
| USD | | | 479,658 | | | | EUR | | | | 417,000 | | | Bank of America N.A. | | | 4/21/15 | | | | 31,149 | |
| USD | | | 960,094 | | | | EUR | | | | 916,000 | | | Bank of America N.A. | | | 4/21/15 | | | | (25,121 | ) |
| USD | | | 1,286,711 | | | | EUR | | | | 1,134,000 | | | Bank of America N.A. | | | 4/21/15 | | | | 67,025 | |
| USD | | | 2,127,575 | | | | EUR | | | | 1,829,000 | | | Bank of America N.A. | | | 4/21/15 | | | | 160,373 | |
| USD | | | 1,956,940 | | | | EUR | | | | 1,724,000 | | | Barclays Bank PLC | | | 4/21/15 | | | | 102,672 | |
| USD | | | 522,285 | | | | EUR | | | | 490,000 | | | BNP Paribas S.A. | | | 4/21/15 | | | | (4,740 | ) |
| USD | | | 769,289 | | | | EUR | | | | 726,000 | | | BNP Paribas S.A. | | | 4/21/15 | | | | (11,568 | ) |
| USD | | | 995,400 | | | | EUR | | | | 864,000 | | | BNP Paribas S.A. | | | 4/21/15 | | | | 66,115 | |
| USD | | | 3,661,362 | | | | EUR | | | | 3,223,000 | | | BNP Paribas S.A. | | | 4/21/15 | | | | 194,827 | |
| USD | | | 180,765 | | | | EUR | | | | 160,000 | | | Citibank N.A. | | | 4/21/15 | | | | 8,675 | |
| USD | | | 1,860,637 | | | | EUR | | | | 1,642,000 | | | Citibank N.A. | | | 4/21/15 | | | | 94,565 | |
| USD | | | 3,001,624 | | | | EUR | | | | 2,651,000 | | | Citibank N.A. | | | 4/21/15 | | | | 150,311 | |
| USD | | | 10,811,676 | | | | EUR | | | | 9,954,000 | | | Citibank N.A. | | | 4/21/15 | | | | 105,538 | |
| USD | | | 13,346,203 | | | | EUR | | | | 11,312,000 | | | Citibank N.A. | | | 4/21/15 | | | | 1,179,452 | |
See Consolidated Notes to Financial Statements.
| | | | | | |
| | | BLACKROCK BALANCED CAPITAL FUND, INC. | | MARCH 31, 2015 | | 61 |
| | | | |
| Consolidated Schedule of Investments (continued) | | | Master Total Return Portfolio | |
As of March 31, 2015, forward foreign currency exchange contracts outstanding were as follows: (continued)
| | | | | | | | | | | | | | | | | | | | | | |
Currency
Purchased | | | Currency
Sold | | | Counterparty | | Settlement
Date | | | Unrealized
Appreciation
(Depreciation) | |
| USD | | | 297,474,658 | | | | EUR | | | | 257,777,000 | | | Citibank N.A. | | | 4/21/15 | | | $ | 20,219,663 | |
| USD | | | 20,622,352 | | | | EUR | | | | 18,400,000 | | | Deutsche Bank AG | | | 4/21/15 | | | | 832,022 | |
| USD | | | 2,089,520 | | | | EUR | | | | 1,800,000 | | | Goldman Sachs Bank USA | | | 4/21/15 | | | | 153,509 | |
| USD | | | 1,588,267 | | | | EUR | | | | 1,399,000 | | | Goldman Sachs International | | | 4/21/15 | | | | 83,556 | |
| USD | | | 1,842,223 | | | | EUR | | | | 1,616,000 | | | Goldman Sachs International | | | 4/21/15 | | | | 104,116 | |
| USD | | | 3,674,152 | | | | EUR | | | | 3,161,000 | | | Goldman Sachs International | | | 4/21/15 | | | | 274,303 | |
| USD | | | 4,091,433 | | | | EUR | | | | 3,603,000 | | | Goldman Sachs International | | | 4/21/15 | | | | 216,185 | |
| USD | | | 6,294,253 | | | | EUR | | | | 5,822,000 | | | Goldman Sachs International | | | 4/21/15 | | | | 32,335 | |
| USD | | | 455,931 | | | | EUR | | | | 405,000 | | | JPMorgan Chase Bank N.A. | | | 4/21/15 | | | | 20,328 | |
| USD | | | 11,986,390 | | | | EUR | | | | 10,624,000 | | | JPMorgan Chase Bank N.A. | | | 4/21/15 | | | | 559,625 | |
| USD | | | 7,792,816 | | | | EUR | | | | 7,119,000 | | | Morgan Stanley & Co. International PLC | | | 4/21/15 | | | | 135,894 | |
| USD | | | 9,305,486 | | | | EUR | | | | 8,520,000 | | | Morgan Stanley & Co. International PLC | | | 4/21/15 | | | | 141,703 | |
| USD | | | 237,617 | | | | EUR | | | | 207,000 | | | Morgan Stanley Capital Services LLC | | | 4/21/15 | | | | 14,976 | |
| USD | | | 3,052,477 | | | | EUR | | | | 2,708,000 | | | Morgan Stanley Capital Services LLC | | | 4/21/15 | | | | 139,857 | |
| USD | | | 14,622,693 | | | | EUR | | | | 12,856,000 | | | Morgan Stanley Capital Services LLC | | | 4/21/15 | | | | 795,276 | |
| USD | | | 1,176,980 | | | | EUR | | | | 1,107,000 | | | Royal Bank of Scotland PLC | | | 4/21/15 | | | | (13,666 | ) |
| USD | | | 2,482,057 | | | | EUR | | | | 2,343,000 | | | Royal Bank of Scotland PLC | | | 4/21/15 | | | | (37,983 | ) |
| USD | | | 10,712,881 | | | | EUR | | | | 9,428,000 | | | Royal Bank of Scotland PLC | | | 4/21/15 | | | | 572,488 | |
| USD | | | 11,509,703 | | | | EUR | | | | 9,936,000 | | | Royal Bank of Scotland PLC | | | 4/21/15 | | | | 822,925 | |
| USD | | | 265,780 | | | | EUR | | | | 235,000 | | | Standard Chartered Bank | | | 4/21/15 | | | | 13,023 | |
| USD | | | 1,131,317 | | | | EUR | | | | 992,000 | | | Standard Chartered Bank | | | 4/21/15 | | | | 64,361 | |
| USD | | | 6,570,737 | | | | EUR | | | | 6,116,000 | | | Standard Chartered Bank | | | 4/21/15 | | | | (7,397 | ) |
| USD | | | 1,201,147 | | | | EUR | | | | 1,054,000 | | | State Street Bank and Trust Co. | | | 4/21/15 | | | | 67,505 | |
| USD | | | 1,320,767 | | | | EUR | | | | 1,167,000 | | | State Street Bank and Trust Co. | | | 4/21/15 | | | | 65,587 | |
| USD | | | 2,647,851 | | | | EUR | | | | 2,291,000 | | | State Street Bank and Trust Co. | | | 4/21/15 | | | | 183,740 | |
| USD | | | 3,945,941 | | | | EUR | | | | 3,458,000 | | | State Street Bank and Trust Co. | | | 4/21/15 | | | | 226,650 | |
| USD | | | 11,832,051 | | | | EUR | | | | 10,401,000 | | | State Street Bank and Trust Co. | | | 4/21/15 | | | | 645,136 | |
| USD | | | 29,878 | | | | EUR | | | | 26,000 | | | The Bank of New York Mellon | | | 4/21/15 | | | | 1,913 | |
| USD | | | 57,338 | | | | EUR | | | | 50,000 | | | The Bank of New York Mellon | | | 4/21/15 | | | | 3,560 | |
| USD | | | 209,662 | | | | EUR | | | | 185,000 | | | The Bank of New York Mellon | | | 4/21/15 | | | | 10,683 | |
| USD | | | 2,804,134 | | | | EUR | | | | 2,577,000 | | | UBS AG | | | 4/21/15 | | | | 32,413 | |
| USD | | | 2,879,815 | | | | EUR | | | | 2,545,000 | | | UBS AG | | | 4/21/15 | | | | 142,511 | |
| USD | | | 9,038,958 | | | | EUR | | | | 8,005,000 | | | UBS AG | | | 4/21/15 | | | | 429,089 | |
| USD | | | 35,268,390 | | | | GBP | | | | 23,250,000 | | | Bank of America N.A. | | | 4/21/15 | | | | 784,506 | |
| USD | | | 1,163,132 | | | | GBP | | | | 762,000 | | | Citibank N.A. | | | 4/21/15 | | | | 32,951 | |
| USD | | | 1,620,788 | | | | GBP | | | | 1,074,000 | | | Citibank N.A. | | | 4/21/15 | | | | 27,855 | |
| USD | | | 3,939,383 | | | | GBP | | | | 2,654,000 | | | Morgan Stanley & Co. International PLC | | | 4/21/15 | | | | 3,030 | |
| USD | | | 1,443,479 | | | | GBP | | | | 948,000 | | | Standard Chartered Bank | | | 4/21/15 | | | | 37,426 | |
| USD | | | 400,852 | | | | GBP | | | | 270,000 | | | State Street Bank and Trust Co. | | | 4/21/15 | | | | 394 | |
| USD | | | 537,600 | | | | GBP | | | | 353,000 | | | State Street Bank and Trust Co. | | | 4/21/15 | | | | 14,038 | |
| USD | | | 695,230 | | | | GBP | | | | 469,000 | | | TD Securities, Inc. | | | 4/21/15 | | | | (381 | ) |
| USD | | | 942,607 | | | | GBP | | | | 639,000 | | | UBS AG | | | 4/21/15 | | | | (5,144 | ) |
| USD | | | 415,562 | | | | HKD | | | | 3,225,000 | | | State Street Bank and Trust Co. | | | 4/21/15 | | | | (399 | ) |
| USD | | | 14,351,734 | | | | MXN | | | | 210,461,000 | | | HSBC Bank PLC | | | 4/21/15 | | | | 573,906 | |
| USD | | | 1,503,039 | | | | MXN | | | | 22,134,000 | | | Morgan Stanley Capital Services LLC | | | 4/21/15 | | | | 54,037 | |
| TRY | | | 2,265,845 | | | | USD | | | | 874,000 | | | BNP Paribas S.A. | | | 4/22/15 | | | | (7,747 | ) |
| TRY | | | 2,283,412 | | | | USD | | | | 874,000 | | | BNP Paribas S.A. | | | 4/22/15 | | | | (1,030 | ) |
| TRY | | | 2,286,561 | | | | USD | | | | 874,000 | | | BNP Paribas S.A. | | | 4/22/15 | | | | 173 | |
| TRY | | | 2,811,356 | | | | USD | | | | 1,121,000 | | | BNP Paribas S.A. | | | 4/22/15 | | | | (46,193 | ) |
See Consolidated Notes to Financial Statements.
| | | | | | |
| 62 | | BLACKROCK BALANCED CAPITAL FUND, INC. | | MARCH 31, 2015 | | |
| | | | |
| Consolidated Schedule of Investments (continued) | | | Master Total Return Portfolio | |
As of March 31, 2015, forward foreign currency exchange contracts outstanding were as follows: (continued)
| | | | | | | | | | | | | | | | | | | | | | |
Currency Purchased | | | Currency Sold | | | Counterparty | | Settlement
Date | | | Unrealized
Appreciation
(Depreciation) | |
| TRY | | | 2,878,264 | | | | USD | | | | 1,093,000 | | | BNP Paribas S.A. | | | 4/22/15 | | | $ | 7,387 | |
| TRY | | | 2,880,274 | | | | USD | | | | 1,093,000 | | | BNP Paribas S.A. | | | 4/22/15 | | | | 8,155 | |
| USD | | | 874,000 | | | | TRY | | | | 2,234,031 | | | BNP Paribas S.A. | | | 4/22/15 | | | | 19,909 | |
| USD | | | 874,000 | | | | TRY | | | | 2,304,758 | | | BNP Paribas S.A. | | | 4/22/15 | | | | (7,130 | ) |
| USD | | | 896,000 | | | | TRY | | | | 2,270,156 | | | BNP Paribas S.A. | | | 4/22/15 | | | | 28,099 | |
| USD | | | 1,093,000 | | | | TRY | | | | 2,799,173 | | | BNP Paribas S.A. | | | 4/22/15 | | | | 22,850 | |
| USD | | | 1,345,000 | | | | TRY | | | | 3,360,684 | | | BNP Paribas S.A. | | | 4/22/15 | | | | 60,179 | |
| USD | | | 874,000 | | | | TRY | | | | 2,259,552 | | | Deutsche Bank AG | | | 4/22/15 | | | | 10,152 | |
| USD | | | 874,000 | | | | TRY | | | | 2,293,665 | | | Deutsche Bank AG | | | 4/22/15 | | | | (2,889 | ) |
| USD | | | 1,093,000 | | | | TRY | | | | 2,793,489 | | | Deutsche Bank AG | | | 4/22/15 | | | | 25,023 | |
| COP | | | 4,174,475,250 | | | | USD | | | | 1,627,000 | | | Royal Bank of Scotland PLC | | | 4/27/15 | | | | (26,930 | ) |
| USD | | | 1,627,000 | | | | COP | | | | 4,132,580,000 | | | Goldman Sachs International | | | 4/27/15 | | | | 42,988 | |
| USD | | | 1,081,000 | | | | MYR | | | | 3,996,457 | | | Deutsche Bank AG | | | 4/30/15 | | | | 5,020 | |
| PLN | | | 15,196,268 | | | | USD | | | | 4,075,127 | | | Standard Chartered Bank | | | 5/04/15 | | | | (69,856 | ) |
| PLN | | | 15,210,517 | | | | USD | | | | 4,028,352 | | | Standard Chartered Bank | | | 5/04/15 | | | | (19,325 | ) |
| USD | | | 3,555,522 | | | | PLN | | | | 13,176,365 | | | Standard Chartered Bank | | | 5/04/15 | | | | 82,635 | |
| USD | | | 4,709,078 | | | | PLN | | | | 17,456,975 | | | Standard Chartered Bank | | | 5/04/15 | | | | 107,953 | |
| BRL | | | 1,850 | | | | USD | | | | 567 | | | UBS AG | | | 5/05/15 | | | | 7 | |
| TRY | | | 42,750,000 | | | | USD | | | | 16,040,072 | | | Deutsche Bank AG | | | 5/05/15 | | | | 246,005 | |
| USD | | | 825,230 | | | | BRL | | | | 2,690,415 | | | Royal Bank of Scotland PLC | | | 5/05/15 | | | | (9,762 | ) |
| USD | | | 17,135,642 | | | | TRY | | | | 42,750,000 | | | Deutsche Bank AG | | | 5/05/15 | | | | 849,565 | |
| USD | | | 2,767,938 | | | | MXN | | | | 41,452,936 | | | Morgan Stanley Capital Services LLC | | | 5/06/15 | | | | 57,062 | |
| TRY | | | 2,277,659 | | | | USD | | | | 998,370 | | | Bank of America N.A. | | | 5/07/15 | | | | (131,085 | ) |
| TRY | | | 2,664,209 | | | | USD | | | | 1,160,521 | | | Bank of America N.A. | | | 5/07/15 | | | | (146,047 | ) |
| TRY | | | 3,691,153 | | | | USD | | | | 1,610,640 | | | Bank of America N.A. | | | 5/07/15 | | | | (205,127 | ) |
| TRY | | | 4,203,655 | | | | USD | | | | 1,846,504 | | | Bank of America N.A. | | | 5/07/15 | | | | (245,841 | ) |
| TRY | | | 5,978,957 | | | | USD | | | | 2,620,959 | | | Barclays Bank PLC | | | 5/07/15 | | | | (344,298 | ) |
| USD | | | 494,829 | | | | TRY | | | | 1,121,629 | | | Bank of America N.A. | | | 5/07/15 | | | | 67,736 | |
| USD | | | 662,912 | | | | TRY | | | | 1,519,195 | | | Bank of America N.A. | | | 5/07/15 | | | | 84,434 | |
| USD | | | 686,041 | | | | TRY | | | | 1,554,466 | | | Bank of America N.A. | | | 5/07/15 | | | | 94,133 | |
| USD | | | 2,340,978 | | | | TRY | | | | 5,278,203 | | | BNP Paribas S.A. | | | 5/07/15 | | | | 331,150 | |
| USD | | | 1,152,400 | | | | TRY | | | | 2,645,335 | | | Deutsche Bank AG | | | 5/07/15 | | | | 145,113 | |
| USD | | | 1,635,738 | | | | TRY | | | | 3,684,174 | | | Deutsche Bank AG | | | 5/07/15 | | | | 232,883 | |
| USD | | | 1,335,919 | | | | TRY | | | | 3,012,631 | | | Goldman Sachs International | | | 5/07/15 | | | | 188,773 | |
| USD | | | 360,420 | | | | COP | | | | 944,005,783 | | | Credit Suisse International | | | 5/13/15 | | | | (704 | ) |
| USD | | | 1,730,395 | | | | MXN | | | | 25,922,645 | | | Morgan Stanley Capital Services LLC | | | 5/13/15 | | | | 36,004 | |
| USD | | | 106,196 | | | | MXN | | | | 1,649,568 | | | Morgan Stanley Capital Services LLC | | | 5/18/15 | | | | (1,586 | ) |
| USD | | | 6,055,477 | | | | MXN | | | | 90,715,645 | | | Morgan Stanley Capital Services LLC | | | 5/18/15 | | | | 128,140 | |
| USD | | | 1,639,324 | | | | MXN | | | | 24,568,693 | | | Morgan Stanley Capital Services LLC | | | 5/20/15 | | | | 34,244 | |
| TRY | | | 20,959,000 | | | | USD | | | | 9,240,367 | | | Deutsche Bank AG | | | 5/26/15 | | | | (1,295,678 | ) |
| TRY | | | 23,319,400 | | | | USD | | | | 10,172,483 | | | Deutsche Bank AG | | | 5/26/15 | | | | (1,333,065 | ) |
| TRY | | | 37,361,300 | | | | USD | | | | 16,333,523 | | | Deutsche Bank AG | | | 5/26/15 | | | | (2,477,904 | ) |
| TRY | | | 37,361,300 | | | | USD | | | | 16,238,395 | | | Goldman Sachs International | | | 5/26/15 | | | | (2,076,275 | ) |
| USD | | | 2,507,340 | | | | MXN | | | | 38,463,149 | | | Morgan Stanley Capital Services LLC | | | 5/26/15 | | | | (4,380 | ) |
| USD | | | 4,957,348 | | | | MXN | | | | 74,762,094 | | | Morgan Stanley Capital Services LLC | | | 5/26/15 | | | | 75,236 | |
| USD | | | 6,343,201 | | | | TRY | | | | 14,250,000 | | | Bank of America N.A. | | | 5/26/15 | | | | 941,616 | |
| USD | | | 10,715,702 | | | | TRY | | | | 24,322,500 | | | Bank of America N.A. | | | 5/26/15 | | | | 1,496,050 | |
| USD | | | 2,444,268 | | | | TRY | | | | 5,526,000 | | | Deutsche Bank AG | | | 5/26/15 | | | | 349,590 | |
| USD | | | 3,256,287 | | | | TRY | | | | 7,368,000 | | | Deutsche Bank AG | | | 5/26/15 | | | | 463,383 | |
See Consolidated Notes to Financial Statements.
| | | | | | |
| | | BLACKROCK BALANCED CAPITAL FUND, INC. | | MARCH 31, 2015 | | 63 |
| | | | |
| Consolidated Schedule of Investments (continued) | | | Master Total Return Portfolio | |
As of March 31, 2015, forward foreign currency exchange contracts outstanding were as follows: (continued)
| | | | | | | | | | | | | | | | | | | | | | |
Currency Purchased | | | Currency Sold | | | Counterparty | | Settlement
Date | | | Unrealized
Appreciation
(Depreciation) | |
| USD | | | 10,630,463 | | | | TRY | | | | 24,322,500 | | | Deutsche Bank AG | | | 5/26/15 | | | $ | 1,610,346 | |
| USD | | | 1,596,515 | | | | TRY | | | | 3,573,000 | | | Goldman Sachs International | | | 5/26/15 | | | | 242,139 | |
| USD | | | 3,176,727 | | | | TRY | | | | 7,147,000 | | | Goldman Sachs International | | | 5/26/15 | | | | 467,595 | |
| USD | | | 4,729,968 | | | | TRY | | | | 10,720,000 | | | Goldman Sachs International | | | 5/26/15 | | | | 666,460 | |
| USD | | | 4,734,982 | | | | TRY | | | | 10,720,000 | | | Goldman Sachs International | | | 5/26/15 | | | | 671,475 | |
| USD | | | 4,858,022 | | | | TRY | | | | 11,052,000 | | | Goldman Sachs International | | | 5/26/15 | | | | 668,678 | |
| USD | | | 1,642,199 | | | | MXN | | | | 24,623,397 | | | Morgan Stanley Capital Services LLC | | | 5/27/15 | | | | 34,359 | |
| USD | | | 2,554,506 | | | | ZAR | | | | 30,789,187 | | | Citibank N.A. | | | 5/29/15 | | | | 40,790 | |
| USD | | | 6,347,586 | | | | ZAR | | | | 76,521,547 | | | Citibank N.A. | | | 5/29/15 | | | | 100,151 | |
| USD | | | 49,497,456 | | | | EUR | | | | 44,829,000 | | | Morgan Stanley Capital Services LLC | | | 6/08/15 | | | | 1,249,469 | |
| AUD | | | 3,120,000 | | | | USD | | | | 2,376,535 | | | Bank of America N.A. | | | 6/17/15 | | | | (10,644 | ) |
| CAD | | | 1,561,827 | | | | USD | | | | 1,250,000 | | | Deutsche Bank AG | | | 6/17/15 | | | | (18,162 | ) |
| CAD | | | 1,984,049 | | | | USD | | | | 1,557,308 | | | State Street Bank and Trust Co. | | | 6/17/15 | | | | 7,544 | |
| EUR | | | 7,645,000 | | | | USD | | | | 8,439,545 | | | Citibank N.A. | | | 6/17/15 | | | | (210,350 | ) |
| GBP | | | 1,600,000 | | | | USD | | | | 2,368,970 | | | Goldman Sachs International | | | 6/17/15 | | | | 3,195 | |
| JPY | | | 499,350,240 | | | | USD | | | | 4,140,000 | | | Deutsche Bank AG | | | 6/17/15 | | | | 28,135 | |
| MXN | | | 58,188,851 | | | | USD | | | | 3,817,000 | | | Goldman Sachs International | | | 6/17/15 | | | | (22,480 | ) |
| SGD | | | 3,958,642 | | | | USD | | | | 2,845,000 | | | Deutsche Bank AG | | | 6/17/15 | | | | 33,892 | |
| USD | | | 32,869,183 | | | | AUD | | | | 42,395,000 | | | Bank of America N.A. | | | 6/17/15 | | | | 721,114 | |
| USD | | | 30,028,592 | | | | AUD | | | | 39,421,000 | | | Citibank N.A. | | | 6/17/15 | | | | 135,703 | |
| USD | | | 2,425,491 | | | | AUD | | | | 3,120,000 | | | HSBC Bank PLC | | | 6/17/15 | | | | 59,599 | |
| USD | | | 1,559,615 | | | | CAD | | | | 1,979,947 | | | Deutsche Bank AG | | | 6/17/15 | | | | (2,001 | ) |
| USD | | | 1,247,692 | | | | CAD | | | | 1,586,728 | | | Royal Bank of Scotland PLC | | | 6/17/15 | | | | (3,785 | ) |
| USD | | | 33,000,000 | | | | CHF | | | | 31,814,706 | | | JPMorgan Chase Bank N.A. | | | 6/17/15 | | | | 156,314 | |
| USD | | | 8,212,247 | | | | EUR | | | | 7,519,512 | | | HSBC Bank PLC | | | 6/17/15 | | | | 118,129 | |
| USD | | | 8,384,287 | | | | EUR | | | | 7,645,000 | | | UBS AG | | | 6/17/15 | | | | 155,092 | |
| USD | | | 2,355,046 | | | | GBP | | | | 1,600,000 | | | JPMorgan Chase Bank N.A. | | | 6/17/15 | | | | (17,119 | ) |
| USD | | | 22,764 | | | | IDR | | | | 298,437,249 | | | Deutsche Bank AG | | | 6/17/15 | | | | 364 | |
| USD | | | 2,389,299 | | | | IDR | | | | 31,323,707,128 | | | Deutsche Bank AG | | | 6/17/15 | | | | 38,163 | |
| USD | | | 4,844,995 | | | | IDR | | | | 63,701,992,872 | | | Deutsche Bank AG | | | 6/17/15 | | | | 63,568 | |
| USD | | | 4,140,000 | | | | KRW | | | | 4,609,062,000 | | | JPMorgan Chase Bank N.A. | | | 6/17/15 | | | | (4,020 | ) |
| USD | | | 1,909,000 | | | | MXN | | | | 29,407,202 | | | BNP Paribas S.A. | | | 6/17/15 | | | | (8,656 | ) |
| USD | | | 2,845,000 | | | | SGD | | | | 3,929,573 | | | Société Générale | | | 6/17/15 | | | | (12,752 | ) |
| USD | | | 2,835,000 | | | | TWD | | | | 89,926,200 | | | Standard Chartered Bank | | | 6/17/15 | | | | (39,713 | ) |
| TRY | | | 26,480,000 | | | | USD | | | | 9,969,880 | | | BNP Paribas S.A. | | | 7/02/15 | | | | (20,453 | ) |
| TRY | | | 26,904,000 | | | | USD | | | | 9,959,649 | | | Deutsche Bank AG | | | 7/02/15 | | | | 149,089 | |
| TRY | | | 44,363 | | | | USD | | | | 16,619 | | | State Street Bank and Trust Co. | | | 7/02/15 | | | | 50 | |
| USD | | | 10,372,427 | | | | TRY | | | | 26,904,000 | | | Deutsche Bank AG | | | 7/02/15 | | | | 263,689 | |
| USD | | | 10,518,129 | | | | TRY | | | | 27,286,130 | | | Deutsche Bank AG | | | 7/02/15 | | | | 265,812 | |
| USD | | | 15,775,367 | | | | TRY | | | | 40,929,190 | | | Deutsche Bank AG | | | 7/02/15 | | | | 396,893 | |
| TRY | | | 2,666,567 | | | | USD | | | | 1,064,728 | | | Deutsche Bank AG | | | 7/13/15 | | | | (65,438 | ) |
| USD | | | 1,124,849 | | | | TRY | | | | 2,666,567 | | | Deutsche Bank AG | | | 7/13/15 | | | | 125,559 | |
| TRY | | | 26,480,000 | | | | USD | | | | 10,304,705 | | | Deutsche Bank AG | | | 8/12/15 | | | | (451,903 | ) |
| USD | | | 7,873,000 | | | | CNH | | | | 50,456,003 | | | Deutsche Bank AG | | | 9/09/15 | | | | (134,364 | ) |
| USD | | | 47,235,439 | | | | CNH | | | | 302,779,164 | | | HSBC Bank PLC | | | 9/09/15 | | | | (815,593 | ) |
| USD | | | 1,574,000 | | | | CNH | | | | 10,089,264 | | | JPMorgan Chase Bank N.A. | | | 9/09/15 | | | | (27,166 | ) |
| USD | | | 7,872,561 | | | | CNH | | | | 50,452,170 | | | JPMorgan Chase Bank N.A. | | | 9/09/15 | | | | (134,195 | ) |
| TRY | | | 26,480,000 | | | | USD | | | | 10,948,935 | | | Deutsche Bank AG | | | 10/28/15 | | | | (1,268,528 | ) |
See Consolidated Notes to Financial Statements.
| | | | | | |
| 64 | | BLACKROCK BALANCED CAPITAL FUND, INC. | | MARCH 31, 2015 | | |
| | | | |
| Consolidated Schedule of Investments (continued) | | | Master Total Return Portfolio | |
As of March 31, 2015, forward foreign currency exchange contracts outstanding were as follows: (concluded)
| | | | | | | | | | | | | | | | | | | | | | |
Currency Purchased | | | Currency Sold | | | Counterparty | | Settlement
Date | | | Unrealized
Appreciation
(Depreciation) | |
| USD | | | 9,699,634 | | | | TRY | | | | 26,480,000 | | | BNP Paribas S.A. | | | 10/28/15 | | | $ | 19,226 | |
| TRY | | | 26,904,000 | | | | USD | | | | 10,035,062 | | | Deutsche Bank AG | | | 12/02/15 | | | | (274,471 | ) |
| USD | | | 9,615,440 | | | | TRY | | | | 26,904,000 | | | Deutsche Bank AG | | | 12/02/15 | | | | (145,151 | ) |
| TRY | | | 32,390,000 | | | | USD | | | | 12,357,407 | | | Deutsche Bank AG | | | 2/02/16 | | | | (762,794 | ) |
| TRY | | | 42,750,000 | | | | USD | | | | 16,327,388 | | | Deutsche Bank AG | | | 2/02/16 | | | | (1,024,217 | ) |
| USD | | | 3,624,884 | | | | TRY | | | | 10,283,432 | | | Deutsche Bank AG | | | 2/02/16 | | | | (56,266 | ) |
| USD | | | 22,857,746 | | | | TRY | | | | 64,856,568 | | | Deutsche Bank AG | | | 2/02/16 | | | | (358,890 | ) |
| Total | | | | | | | | | | | | | | | | | | | | $ | 32,158,282 | |
| | | | | | | | | | | | | | | | | | | | | | |
| • | | As of March 31, 2015, exchange-traded options purchased were as follows: |
| | | | | | | | | | | | | | | | | | | | | | | | |
| Description | | Put/
Call | | | Strike Price | | | Expiration
Date | | | Contracts | | | Value | |
SPDR S&P 500 ETF Trust | | | Call | | | | USD | | | | 213.00 | | | | 4/10/15 | | | | 1,223 | | | $ | 7,950 | |
E-Mini S&P 500 Index Futures | | | Call | | | | USD | | | | 2,095.00 | | | | 4/17/15 | | | | 101 | | | | 40,400 | |
Freeport-McMoRan, Inc. | | | Call | | | | USD | | | | 22.00 | | | | 4/17/15 | | | | 1,834 | | | | 8,253 | |
SPDR Gold Shares1 | | | Call | | | | USD | | | | 116.00 | | | | 6/19/15 | | | | 9,100 | | | | 2,042,950 | |
Barrick Gold Corp. | | | Call | | | | USD | | | | 20.00 | | | | 1/15/16 | | | | 2,000 | | | | 26,000 | |
Transocean Ltd. | | | Put | | | | USD | | | | 15.00 | | | | 5/15/15 | | | | 344 | | | | 55,728 | |
Transocean Ltd. | | | Put | | | | USD | | | | 16.00 | | | | 5/15/15 | | | | 115 | | | | 26,278 | |
Euro Dollar 90-Day | | | Put | | | | USD | | | | 98.63 | | | | 6/12/15 | | | | 216 | | | | 13,500 | |
Euro Dollar 90-Day | | | Put | | | | USD | | | | 98.88 | | | | 6/12/15 | | | | 172 | | | | 36,550 | |
Euro Dollar 90-Day | | | Put | | | | USD | | | | 98.75 | | | | 6/12/15 | | | | 108 | | | | 12,825 | |
Euro Dollar 90-Day | | | Put | | | | USD | | | | 99.25 | | | | 6/15/15 | | | | 194 | | | | 1,213 | |
Transocean Ltd. | | | Put | | | | USD | | | | 14.00 | | | | 8/21/15 | | | | 207 | | | | 49,163 | |
Euro Dollar 90-Day | | | Put | | | | USD | | | | 98.50 | | | | 9/11/15 | | | | 456 | | | | 116,850 | |
Volkswagen AG | | | Put | | | | EUR | | | | 150.00 | | | | 12/18/15 | | | | 283 | | | | 31,342 | |
Freeport-McMoRan, Inc. | | | Put | | | | USD | | | | 15.00 | | | | 1/15/16 | | | | 236 | | | | 30,326 | |
Euro Dollar 90-Day | | | Put | | | | USD | | | | 99.00 | | | | 3/14/16 | | | | 755 | | | | 264,250 | |
Euro Dollar 90-Day | | | Put | | | | USD | | | | 98.50 | | | | 3/14/16 | | | | 755 | | | | 75,500 | |
Transocean Ltd. | | | Put | | | | USD | | | | 13.00 | | | | 1/20/17 | | | | 425 | | | | 206,125 | |
Total | | | | | | | | | | | | | | | | | | | | | | $ | 3,045,203 | |
| | | | | | | | | | | | | | | | | | | | | | | | |
| | 1 | | Security is held by a wholly owned subsidiary. See Note 1 of the Consolidated Notes to Financial Statements for details on the wholly owned subsidiary. |
| • | | As of March 31, 2015, OTC barrier options purchased were as follows: |
| | | | | | | | | | | | | | | | | | | | | | | | | | | | | | |
| Description | | Counterparty | | Barrier Price | | | Expiration Date | | | Contracts | | | Notional
Amount
(000) | | | Value | |
EUR Currency | | Deutsche Bank AG | | | PLN | | | | 3.90 | | | | 6/09/15 | | | | — | | | | EUR | | | | 680 | | | $ | 59,993 | |
AUD Currency | | Deutsche Bank AG | | | USD | | | | 0.71 | | | | 8/20/15 | | | | — | | | | USD | | | | 1,010 | | | | 168,611 | |
AUD Currency | | Deutsche Bank AG | | | USD | | | | 0.70 | | | | 11/20/15 | | | | — | | | | USD | | | | 1,010 | | | | 172,415 | |
USD Currency | | Deutsche Bank AG | | | EUR | | | | 1.10 | | | | 12/18/15 | | | | — | | | | USD | | | | 165 | | | | 89,448 | |
S&P 500 Index | | Deutsche Bank AG | | | USD | | | | 2,015.18 | | | | 9/18/15 | | | | 26,507 | | | | | | | | — | | | | 605,560 | |
Total | | | | | | | | | | | | | | | | | | | | | | | | | | | | $ | 1,096,027 | |
| | | | | | | | | | | | | | | | | | | | | | | | | | | | | | |
| • | | As of March 31, 2015, OTC options purchased were as follows: |
| | | | | | | | | | | | | | | | | | | | | | | | | | | | | | |
| Description | | Counterparty | | Put/
Call | | | Strike Price | | | Expiration
Date | | | Notional
Amount (000) | | | Value | |
USD Currency | | Deutsche Bank AG | | | Call | | | | MXN | | | | 15.70 | | | | 4/09/15 | | | | USD | | | | 3,822 | | | $ | 5,114 | |
USD Currency | | Deutsche Bank AG | | | Call | | | | CAD | | | | 1.18 | | | | 4/15/15 | | | | USD | | | | 7,130 | | | | 499,581 | |
USD Currency | | Deutsche Bank AG | | | Call | | | | INR | | | | 64.30 | | | | 4/15/15 | | | | USD | | | | 4,486 | | | | 1,112 | |
USD Currency | | JPMorgan Chase Bank N.A. | | | Call | | | | CAD | | | | 1.15 | | | | 4/15/15 | | | | USD | | | | 7,130 | | | | 698,741 | |
USD Currency | | JPMorgan Chase Bank N.A. | | | Call | | | | MXN | | | | 15.15 | | | | 4/23/15 | | | | USD | | | | 4,577 | | | | 77,587 | |
USD Currency | | BNP Paribas S.A. | | | Call | | | | JPY | | | | 115.00 | | | | 4/27/15 | | | | USD | | | | 13,970 | | | | 582,422 | |
See Consolidated Notes to Financial Statements.
| | | | | | |
| | | BLACKROCK BALANCED CAPITAL FUND, INC. | | MARCH 31, 2015 | | 65 |
| | | | |
| Consolidated Schedule of Investments (continued) | | | Master Total Return Portfolio | |
As of March 31, 2015, OTC options purchased were as follows: (concluded)
| | | | | | | | | | | | | | | | | | | | | | | | | | | | | | |
| Description | | Counterparty | | Put/
Call | | | Strike Price | | | Expiration
Date | | | Notional
Amount (000) | | | Value | |
USD Currency | | Deutsche Bank AG | | | Call | | | | JPY | | | | 111.00 | | | | 4/27/15 | | | | USD | | | | 28,140 | | | $ | 2,090,681 | |
USD Currency | | UBS AG | | | Call | | | | JPY | | | | 115.00 | | | | 4/27/15 | | | | USD | | | | 14,170 | | | | 590,760 | |
USD Currency | | Goldman Sachs International | | | Call | | | | ZAR | | | | 11.65 | | | | 4/29/15 | | | | USD | | | | 4,625 | | | | 212,552 | |
USD Currency | | Bank of America N.A. | | | Call | | | | CAD | | | | 1.30 | | | | 6/04/15 | | | | USD | | | | 23,740 | | | | 214,417 | |
USD Currency | | Bank of America N.A. | | | Call | | | | CAD | | | | 1.31 | | | | 6/04/15 | | | | USD | | | | 23,740 | | | | 172,030 | |
USD Currency | | Citibank N.A. | | | Call | | | | CAD | | | | 1.26 | | | | 6/04/15 | | | | USD | | | | 23,740 | | | | 499,188 | |
USD Currency | | BNP Paribas S.A. | | | Call | | | | JPY | | | | 125.00 | | | | 6/19/15 | | | | USD | | | | 14,250 | | | | 67,257 | |
USD Currency | | JPMorgan Chase Bank N.A. | | | Call | | | | JPY | | | | 120.00 | | | | 6/19/15 | | | | USD | | | | 14,250 | | | | 236,618 | |
USD Currency | | BNP Paribas S.A. | | | Call | | | | CAD | | | | 1.33 | | | | 7/09/15 | | | | USD | | | | 262,200 | | | | 1,999,799 | |
USD Currency | | BNP Paribas S.A. | | | Call | | | | SGD | | | | 1.40 | | | | 9/28/15 | | | | USD | | | | 15,555 | | | | 229,450 | |
EUR Currency | | Citibank N.A. | | | Put | | | | USD | | | | 1.07 | | | | 4/09/15 | | | | EUR | | | | 7,536 | | | | 56,318 | |
USD Currency | | BNP Paribas S.A. | | | Put | | | | TRY | | | | 2.55 | | | | 4/10/15 | | | | USD | | | | 2,989 | | | | 6,688 | |
USD Currency | | BNP Paribas S.A. | | | Put | | | | TRY | | | | 2.40 | | | | 4/10/15 | | | | USD | | | | 2,989 | | | | 2 | |
USD Currency | | Goldman Sachs International | | | Put | | | | TRY | | | | 2.50 | | | | 4/10/15 | | | | USD | | | | 2,989 | | | | 934 | |
EUR Currency | | Deutsche Bank AG | | | Put | | | | PLN | | | | 4.26 | | | | 4/16/15 | | | | EUR | | | | 15,190 | | | | 740,740 | |
EUR Currency | | Goldman Sachs International | | | Put | | | | PLN | | | | 4.20 | | | | 4/16/15 | | | | EUR | | | | 7,578 | | | | 251,565 | |
EUR Currency | | JPMorgan Chase Bank N.A. | | | Put | | | | PLN | | | | 4.15 | | | | 4/16/15 | | | | EUR | | | | 7,578 | | | | 157,446 | |
GBP Currency | | Deutsche Bank AG | | | Put | | | | NOK | | | | 11.20 | | | | 4/23/15 | | | | GBP | | | | 14,860 | | | | 7,303 | |
GBP Currency | | Deutsche Bank AG | | | Put | | | | USD | | | | 1.49 | | | | 4/30/15 | | | | GBP | | | | 16,695 | | | | 359,203 | |
GBP Currency | | UBS AG | | | Put | | | | USD | | | | 1.54 | | | | 4/30/15 | | | | GBP | | | | 16,695 | | | | 952,001 | |
EUR Currency | | Morgan Stanley Capital Services LLC | | | Put | | | | PLN | | | | 4.05 | | | | 5/05/15 | | | | EUR | | | | 16,000 | | | | 84,038 | |
EUR Currency | | Deutsche Bank AG | | | Put | | | | PLN | | | | 4.15 | | | | 5/08/15 | | | | EUR | | | | 13,895 | | | | 294,004 | |
EUR Currency | | JPMorgan Chase Bank N.A. | | | Put | | | | PLN | | | | 4.12 | | | | 5/08/15 | | | | EUR | | | | 13,895 | | | | 218,707 | |
EUR Currency | | Goldman Sachs International | | | Put | | | | PLN | | | | 4.20 | | | | 6/04/15 | | | | EUR | | | | 7,430 | | | | 252,249 | |
EUR Currency | | Citibank N.A. | | | Put | | | | NOK | | | | 8.70 | | | | 6/12/15 | | | | EUR | | | | 6,280 | | | | 135,024 | |
EUR Currency | | Deutsche Bank AG | | | Put | | | | PLN | | | | 4.10 | | | | 6/12/15 | | | | EUR | | | | 7,956 | | | | 115,674 | |
USD Currency | | Deutsche Bank AG | | | Put | | | | NOK | | | | 7.00 | | | | 6/19/15 | | | | USD | | | | 5,135 | | | | 1,213 | |
EUR Currency | | BNP Paribas S.A. | | | Put | | | | PLN | | | | 4.06 | | | | 6/30/15 | | | | EUR | | | | 4,774 | | | | 48,133 | |
EUR Currency | | Citibank N.A. | | | Put | | | | USD | | | | 1.08 | | | | 7/03/15 | | | | EUR | | | | 66,000 | | | | 1,848,691 | |
EUR Currency | | JPMorgan Chase Bank N.A. | | | Put | | | | PLN | | | | 4.20 | | | | 7/09/15 | | | | EUR | | | | 7,595 | | | | 264,938 | |
Total | | | | | | | | | | | | | | | | | | | | | | | | | | | | $ | 13,972,180 | |
| | | | | | | | | | | | | | | | | | | | | | | | | | | | | | |
| • | | As of March 31, 2015, OTC interest rate swaptions purchased were as follows: |
| | | | | | | | | | | | | | | | | | | | | | | | | | | | | | |
| Description | | Counterparty | | Put/
Call | | | Exercise Rate | | | Pay/Receive
Exercise Rate | | Floating Rate
Index | | Expiration Date | | | Notional Amount (000) | | | Market Value | |
1-Year Interest Rate Swap | | Credit Suisse International | | | Call | | | | 11.40 | % | | Receive | | 1-day BZDIOVER | | | 7/01/15 | | | | BRL | | | | 50,893 | | | $ | 2,703 | |
1-Year Interest Rate Swap | | Deutsche Bank AG | | | Call | | | | 11.40 | % | | Receive | | 1-day BZDIOVER | | | 7/01/15 | | | | BRL | | | | 18,175 | | | | 965 | |
5-Year Interest Rate Swap | | Goldman Sachs International | | | Call | | | | 1.90 | % | | Receive | | 3-month LIBOR | | | 8/24/15 | | | | USD | | | | 155,425 | | | | 2,492,053 | |
5-Year Interest Rate Swap | | Citibank N.A. | | | Call | | | | 2.53 | % | | Receive | | 3-month LIBOR | | | 9/30/15 | | | | USD | | | | 55,885 | | | | 2,218,154 | |
5-Year Interest Rate Swap | | Bank of America N.A. | | | Call | | | | 2.09 | % | | Receive | | 3-month LIBOR | | | 2/10/16 | | | | USD | | | | 243,978 | | | | 5,200,659 | |
5-Year Interest Rate Swap | | Goldman Sachs International | | | Put | | | | 1.90 | % | | Pay | | 3-month LIBOR | | | 8/24/15 | | | | USD | | | | 155,425 | | | | 1,019,697 | |
5-Year Interest Rate Swap | | Citibank N.A. | | | Put | | | | 2.53 | % | | Pay | | 3-month LIBOR | | | 9/30/15 | | | | USD | | | | 55,885 | | | | 115,067 | |
5-Year Interest Rate Swap | | Bank of America N.A. | | | Put | | | | 2.09 | % | | Pay | | 3-month LIBOR | | | 2/10/16 | | | | USD | | | | 243,978 | | | | 2,861,301 | |
Total | | | | | | | | | | | | | | | | | | | | | | | | | | | | $ | 13,910,599 | |
| | | | | | | | | | | | | | | | | | | | | | | | | | | | | | |
See Consolidated Notes to Financial Statements.
| | | | | | |
| 66 | | BLACKROCK BALANCED CAPITAL FUND, INC. | | MARCH 31, 2015 | | |
| | | | |
| Consolidated Schedule of Investments (continued) | | | Master Total Return Portfolio | |
| • | | As of March 31, 2015, exchange-traded options written were as follows: |
| | | | | | | | | | | | | | | | | | | | | | | | |
| Description | | Put/
Call | | | Strike Price | | | Expiration Date | | | Contracts | | | Value | |
CBOE Volatility Index | | | Call | | | | USD | | | | 16.00 | | | | 4/15/15 | | | | 766 | | | $ | (93,835 | ) |
CBOE Volatility Index | | | Call | | | | USD | | | | 17.00 | | | | 4/15/15 | | | | 1,532 | | | | (137,880 | ) |
The Williams Cos., Inc. | | | Call | | | | USD | | | | 50.00 | | | | 5/15/15 | | | | 133 | | | | (27,997 | ) |
Apple Inc. | | | Call | | | | USD | | | | 140.00 | | | | 6/19/15 | | | | 215 | | | | (33,970 | ) |
LyondellBasell Industries NV, Class A | | | Call | | | | USD | | | | 90.00 | | | | 6/19/15 | | | | 282 | | | | (94,470 | ) |
Tesla Motors, Inc. | | | Call | | | | USD | | | | 210.00 | | | | 6/19/15 | | | | 41 | | | | (33,313 | ) |
United Continental Holdings, Inc. | | | Call | | | | USD | | | | 72.50 | | | | 6/19/15 | | | | 190 | | | | (60,800 | ) |
The Williams Cos., Inc. | | | Call | | | | USD | | | | 50.00 | | | | 8/21/15 | | | | 134 | | | | (42,210 | ) |
Euro Dollar 90-Day | | | Call | | | | USD | | | | 98.75 | | | | 9/11/15 | | | | 418 | | | | (229,900 | ) |
SPDR S&P 500 ETF Trust | | | Put | | | | USD | | | | 205.00 | | | | 4/10/15 | | | | 1,529 | | | | (224,763 | ) |
Transocean Ltd. | | | Put | | | | USD | | | | 10.00 | | | | 5/15/15 | | | | 462 | | | | (10,164 | ) |
Euro Dollar 90-Day | | | Put | | | | USD | | | | 98.38 | | | | 6/12/15 | | | | 108 | | | | (2,025 | ) |
Euro Dollar 1-Year Mid-Curve | | | Put | | | | USD | | | | 98.00 | | | | 9/11/15 | | | | 456 | | | | (25,650 | ) |
Euro Dollar 90-Day | | | Put | | | | USD | | | | 98.75 | | | | 3/14/16 | | | | 1,510 | | | | (283,125 | ) |
Total | | | | | | | | | | | | | | | | | | | | | | $ | (1,300,102 | ) |
| | | | | | | | | | | | | | | | | | | | | | | | |
| • | | As of March 31, 2015, OTC options written were as follows: |
| | | | | | | | | | | | | | | | | | | | | | | | | | | | | | |
| Description | | Counterparty | | Put/
Call | | | Strike Price | | | Expiration
Date | | | Notional Amount (000) | | | Value | |
USD Currency | | Deutsche Bank AG | | | Call | | | | MXN | | | | 16.10 | | | | 4/09/15 | | | | USD | | | | 3,822 | | | $ | (651 | ) |
USD Currency | | Deutsche Bank AG | | | Call | | | | CAD | | | | 1.15 | | | | 4/15/15 | | | | USD | | | | 7,130 | | | | (696,207 | ) |
USD Currency | | JPMorgan Chase Bank N.A. | | | Call | | | | CAD | | | | 1.18 | | | | 4/15/15 | | | | USD | | | | 7,130 | | | | (502,190 | ) |
USD Currency | | JPMorgan Chase Bank N.A. | | | Call | | | | MXN | | | | 15.60 | | | | 4/23/15 | | | | USD | | | | 6,103 | | | | (34,832 | ) |
USD Currency | | BNP Paribas S.A. | | | Call | | | | JPY | | | | 111.00 | | | | 4/27/15 | | | | USD | | | | 13,970 | | | | (1,037,911 | ) |
USD Currency | | Deutsche Bank AG | | | Call | | | | JPY | | | | 115.00 | | | | 4/27/15 | | | | USD | | | | 28,140 | | | | (1,173,182 | ) |
USD Currency | | UBS AG | | | Call | | | | JPY | | | | 111.00 | | | | 4/27/15 | | | | USD | | | | 14,170 | | | | (1,052,770 | ) |
USD Currency | | Goldman Sachs International | | | Call | | | | ZAR | | | | 12.00 | | | | 4/29/15 | | | | USD | | | | 6,938 | | | | (172,348 | ) |
USD Currency | | UBS AG | | | Call | | | | TRY | | | | 2.66 | | | | 5/08/15 | | | | USD | | | | 1,107 | | | | (15,608 | ) |
USD Currency | | Bank of America N.A. | | | Call | | | | CAD | | | | 1.35 | | | | 6/04/15 | | | | USD | | | | 23,740 | | | | (67,740 | ) |
USD Currency | | Bank of America N.A. | | | Call | | | | CAD | | | | 1.26 | | | | 6/04/15 | | | | USD | | | | 23,740 | | | | (499,188 | ) |
USD Currency | | Citibank N.A. | | | Call | | | | CAD | | | | 1.30 | | | | 6/04/15 | | | | USD | | | | 23,740 | | | | (214,417 | ) |
USD Currency | | BNP Paribas S.A. | | | Call | | | | JPY | | | | 120.00 | | | | 6/19/15 | | | | USD | | | | 14,250 | | | | (236,618 | ) |
USD Currency | | JPMorgan Chase Bank N.A. | | | Call | | | | JPY | | | | 125.00 | | | | 6/19/15 | | | | USD | | | | 14,250 | | | | (67,257 | ) |
EUR Currency | | BNP Paribas S.A. | | | Call | | | | PLN | | | | 4.16 | | | | 6/30/15 | | | | EUR | | | | 4,774 | | | | (36,251 | ) |
USD Currency | | BNP Paribas S.A. | | | Call | | | | SGD | | | | 1.46 | | | | 9/28/15 | | | | USD | | | | 15,555 | | | | (93,156 | ) |
USD Currency | | BNP Paribas S.A. | | | Put | | | | TRY | | | | 2.45 | | | | 4/10/15 | | | | USD | | | | 2,989 | | | | (68 | ) |
USD Currency | | BNP Paribas S.A. | | | Put | | | | TRY | | | | 2.50 | | | | 4/10/15 | | | | USD | | | | 2,989 | | | | (934 | ) |
USD Currency | | Goldman Sachs International | | | Put | | | | TRY | | | | 2.40 | | | | 4/10/15 | | | | USD | | | | 2,989 | | | | (2 | ) |
EUR Currency | | Goldman Sachs International | | | Put | | | | PLN | | | | 4.26 | | | | 4/16/15 | | | | EUR | | | | 15,190 | | | | (740,740 | ) |
EUR Currency | | JPMorgan Chase Bank N.A. | | | Put | | | | PLN | | | | 4.15 | | | | 4/16/15 | | | | EUR | | | | 7,578 | | | | (157,446 | ) |
EUR Currency | | JPMorgan Chase Bank N.A. | | | Put | | | | PLN | | | | 4.20 | | | | 4/16/15 | | | | EUR | | | | 7,578 | | | | (251,565 | ) |
GBP Currency | | Deutsche Bank AG | | | Put | | | | USD | | | | 1.54 | | | | 4/30/15 | | | | GBP | | | | 16,695 | | | | (952,001 | ) |
GBP Currency | | UBS AG | | | Put | | | | USD | | | | 1.49 | | | | 4/30/15 | | | | GBP | | | | 16,695 | | | | (359,203 | ) |
EUR Currency | | Morgan Stanley Capital Services LLC | | | Put | | | | PLN | | | | 4.12 | | | | 5/05/15 | | | | EUR | | | | 7,225 | | | | (112,619 | ) |
EUR Currency | | JPMorgan Chase Bank N.A. | | | Put | | | | PLN | | | | 4.12 | | | | 5/08/15 | | | | EUR | | | | 6,670 | | | | (104,979 | ) |
EUR Currency | | JPMorgan Chase Bank N.A. | | | Put | | | | PLN | | | | 4.15 | | | | 5/08/15 | | | | EUR | | | | 13,895 | | | | (303,722 | ) |
EUR Currency | | JPMorgan Chase Bank N.A. | | | Put | | | | PLN | | | | 4.20 | | | | 6/04/15 | | | | EUR | | | | 7,430 | | | | (252,249 | ) |
EUR Currency | | Deutsche Bank AG | | | Put | | | | NOK | | | | 8.70 | | | | 6/12/15 | | | | EUR | | | | 6,280 | | | | (135,024 | ) |
EUR Currency | | Deutsche Bank AG | | | Put | | | | PLN | | | | 4.02 | | | | 6/12/15 | | | | EUR | | | | 7,956 | | | | (41,570 | ) |
EUR Currency | | Citibank N.A. | | | Put | | | | USD | | | | 1.02 | | | | 7/03/15 | | | | EUR | | | | 66,000 | | | | (618,797 | ) |
EUR Currency | | Deutsche Bank AG | | | Put | | | | PLN | | | | 4.20 | | | | 7/09/15 | | | | EUR | | | | 7,595 | | | | (264,938 | ) |
Total | | | | | | | | | | | | | | | | | | | | | | | | | | | | $ | (10,196,183 | ) |
| | | | | | | | | | | | | | | | | | | | | | | | | | | | | | |
See Consolidated Notes to Financial Statements.
| | | | | | |
| | | BLACKROCK BALANCED CAPITAL FUND, INC. | | MARCH 31, 2015 | | 67 |
| | | | |
| Consolidated Schedule of Investments (continued) | | | Master Total Return Portfolio | |
| • | | As of March 31, 2015, OTC interest rate swaptions written were as follows: |
| | | | | | | | | | | | | | | | | | | | | | | | | | | | | | |
| Description | | Counterparty | | Put/
Call | | | Exercise Rate | | | Pay/Receive
Exercise Rate | | Floating Rate
Index | | Expiration
Date | | | Notional Amount (000) | | | Value | |
5-Year Interest Rate Swap | | Goldman Sachs International | | | Call | | | | 1.77 | % | | Pay | | 3-month LIBOR | | | 4/24/15 | | | | USD | | | | 269,150 | | | $ | (2,917,667 | ) |
1-Year Interest Rate Swap | | Credit Suisse International | | | Call | | | | 3.83 | % | | Pay | | 28-day MXIBTIIE | | | 6/26/15 | | | | MXN | | | | 164,716 | | | | (6,818 | ) |
1-Year Interest Rate Swap | | Credit Suisse International | | | Call | | | | 10.60 | % | | Pay | | 1-day BZDIOVER | | | 7/01/15 | | | | BRL | | | | 50,893 | | | | (523 | ) |
1-Year Interest Rate Swap | | Deutsche Bank AG | | | Call | | | | 10.60 | % | | Pay | | 1-day BZDIOVER | | | 7/01/15 | | | | BRL | | | | 18,175 | | | | (187 | ) |
10-Year Interest Rate Swap | | Citibank N.A. | | | Call | | | | 3.00 | % | | Pay | | 3-month LIBOR | | | 9/30/15 | | | | USD | | | | 29,620 | | | | (2,383,231 | ) |
10-Year Interest Rate Swap | | Bank of America N.A. | | | Call | | | | 2.37 | % | | Pay | | 3-month LIBOR | | | 2/10/16 | | | | USD | | | | 128,378 | | | | (4,657,695 | ) |
5-Year Interest Rate Swap | | Goldman Sachs International | | | Put | | | | 1.77 | % | | Receive | | 3-month LIBOR | | | 4/24/15 | | | | USD | | | | 269,150 | | | | (257,334 | ) |
10-Year Interest Rate Swap | | Citibank N.A. | | | Put | | | | 3.00 | % | | Receive | | 3-month LIBOR | | | 9/30/15 | | | | USD | | | | 29,620 | | | | (85,652 | ) |
10-Year Interest Rate Swap | | Bank of America N.A. | | | Put | | | | 2.37 | % | | Receive | | 3-month LIBOR | | | 2/10/16 | | | | USD | | | | 128,378 | | | | (3,112,589 | ) |
Total | | | | | | | | | | | | | | | | | | | | | | | | | | | | $ | (13,421,696 | ) |
| | | | | | | | | | | | | | | | | | | | | | | | | | | | | | |
| • | | As of March 31, 2015, interest rate floors purchased outstanding were as follows: |
| | | | | | | | | | | | | | | | | | | | | | | | | | | | | | |
| Description | | Exercise
Rate | | | Counterparty | | Expiration
Date | | | Notional
Amount (000) | | | Value | | | Premiums
Paid | | | Unrealized
Depreciation | |
10Y-2Y CMS Index Floor1 | | | 0.50 | % | | Goldman Sachs International | | | 12/16/15 | | | | USD | | | | 2,371,975 | | | $ | 1,452,450 | | | $ | 2,609,173 | | | $ | (1,156,723 | ) |
| | 1 | | Fund pays the upfront premium and receives the greater of the exercise rate minus the difference of the 10-year CMS Index and 2-year CMS Index or $0. |
| • | | As of March 31, 2015, interest rate floors sold outstanding were as follows: |
| | | | | | | | | | | | | | | | | | | | | | | | | | | | | | |
| Description | | Exercise
Rate | | | Counterparty | | Expiration
Date | | | Notional Amount (000) | | | Value | | | Premiums
Received | | | Unrealized
Appreciation | |
10Y-2Y CMS Index Floor1 | | | 0.00 | % | | Goldman Sachs International | | | 12/16/15 | | | | USD | | | | (2,371,975 | ) | | $ | (263,211 | ) | | $ | (711,593 | ) | | $ | 448,382 | |
| | 1 | | Fund receives the upfront premium and pays the greater of the exercise rate minus the difference of the 10-year CMS Index and 2-year CMS Index or $0. |
| • | | As of March 31, 2015, centrally cleared credit default swaps — buy protection outstanding were as follows: |
| | | | | | | | | | | | | | | | | | | | | | |
| Issuer/Index | | Pay
Fixed Rate | | | Clearinghouse | | Expiration
Date | | | Notional
Amount (000) | | | Unrealized
Appreciation
(Depreciation) | |
iTraxx Sub Financials Series 22 Version 1 | | | 1.00 | % | | InterContinental Exchange | | | 12/20/19 | | | | EUR | | | | 6,720 | | | $ | (53,002 | ) |
CDX.NA.IG Series 24 Version 1 | | | 1.00 | % | | Chicago Mercantile | | | 6/20/20 | | | | USD | | | | 28,401 | | | | 5,174 | |
Total | | | | | | | | | | | | | | | | | | | | $ | (47,828 | ) |
| | | | | | | | | | | | | | | | | | | | | | |
| • | | As of March 31, 2015, centrally cleared credit default swaps — sold protection outstanding were as follows: |
| | | | | | | | | | | | | | | | | | | | | | | | | | |
| Issuer/Index | | Receive
Fixed Rate | | | Clearinghouse | | Expiration
Date | | | Credit
Rating1 | | | Notional Amount (000)2 | | | Unrealized
Appreciation
(Depreciation) | |
iTraxx Europe Crossover Series 21 Version 1 | | | 5.00 | % | | InterContinental Exchange | | | 6/20/19 | | | | B- | | | | EUR | | | | 3,080 | | | $ | 4,279 | |
iTraxx Europe Series 21 Version 1 | | | 1.00 | % | | InterContinental Exchange | | | 6/20/19 | | | | A+ | | | | EUR | | | | 1,445 | | | | 9,862 | |
iTraxx Europe Crossover Series 22 Version 1 | | | 5.00 | % | | InterContinental Exchange | | | 12/20/19 | | | | A- | | | | EUR | | | | 33,530 | | | | 14,949 | |
iTraxx Europe Series 22 Version 1 | | | 1.00 | % | | InterContinental Exchange | | | 12/20/19 | | | | BBB+ | | | | EUR | | | | 12,500 | | | | (27,736 | ) |
CDX.NA.HY Series 24 Version 1 | | | 5.00 | % | | Chicago Mercantile | | | 6/20/20 | | | | B+ | | | | USD | | | | 114,010 | | | | 460,741 | |
Total | | | | | | | | | | | | | | | | | | | | | | | | $ | 462,095 | |
| | | | | | | | | | | | | | | | | | | | | | | | | | |
| | 1 | | Using S&P’s rating of the issuer or the underlying securities of the index, as applicable. |
| | 2 | | The maximum potential amount the Master Portfolio may pay should a negative credit event take place as defined under the terms of the agreement. |
See Consolidated Notes to Financial Statements.
| | | | | | |
| 68 | | BLACKROCK BALANCED CAPITAL FUND, INC. | | MARCH 31, 2015 | | |
| | | | |
| Consolidated Schedule of Investments (continued) | | | Master Total Return Portfolio | |
| • | | As of March 31, 2015, centrally cleared interest rate swaps outstanding were as follows: |
| | | | | | | | | | | | | | | | | | | | | | |
Fixed Rate | | Floating Rate | | Clearinghouse | | Effective
Date | | Expiration
Date | | | Notional Amount (000) | | | Unrealized
Appreciation
(Depreciation) | |
0.65%1 | | 3-month LIBOR | | Chicago Mercantile | | N/A | | | 11/26/16 | | | | USD | | | | 12,695 | | | $ | 10,537 | |
1.26%1 | | 3-month LIBOR | | Chicago Mercantile | | 1/12/162 | | | 1/12/17 | | | | USD | | | | 283,520 | | | | (736,673 | ) |
1.75%1 | | 3-month LIBOR | | Chicago Mercantile | | 7/06/152 | | | 8/31/19 | | | | USD | | | | 94,748 | | | | (973,379 | ) |
2.10%1 | | 3-month LIBOR | | Chicago Mercantile | | N/A | | | 11/26/21 | | | | USD | | | | 1,000 | | | | (28,785 | ) |
2.23%1 | | 3-month LIBOR | | Chicago Mercantile | | N/A | | | 11/26/22 | | | | USD | | | | 1,000 | | | | (34,326 | ) |
2.19%1 | | 3-month LIBOR | | Chicago Mercantile | | N/A | | | 11/28/22 | | | | USD | | | | 800 | | | | (25,242 | ) |
2.21%1 | | 3-month LIBOR | | Chicago Mercantile | | N/A | | | 11/28/22 | | | | USD | | | | 731 | | | | (24,346 | ) |
1.89%1 | | 3-month LIBOR | | Chicago Mercantile | | N/A | | | 2/05/25 | | | | USD | | | | 3,240 | | | | 30,668 | |
0.73%1 | | 6-month EURIBOR | | Chicago Mercantile | | N/A | | | 2/20/25 | | | | EUR | | | | 2,630 | | | | (50,148 | ) |
0.75%1 | | 6-month EURIBOR | | Chicago Mercantile | | N/A | | | 2/20/25 | | | | EUR | | | | 2,630 | | | | (56,048 | ) |
2.03%3 | | 3-month LIBOR | | Chicago Mercantile | | N/A | | | 3/24/25 | | | | USD | | | | 2,800 | | | | 995 | |
Total | | | | | | | | | | | | | | | | | | | | $ | (1,886,747 | ) |
| | | | | | | | | | | | | | | | | | | | | | |
| | 1 | | Master Portfolio pays the fixed rate and receives the floating rate. |
| | 3 | | Master Portfolio pays the floating rate and receives the fixed rate. |
| • | | As of March 31, 2015, OTC credit default swaps — buy protection outstanding were as follows: |
| | | | | | | | | | | | | | | | | | | | | | | | | | | | |
| Issuer/Index | | Pay
Fixed Rate | | | Counterparty | | Expiration
Date | | Notional
Amount (000) | | | Value | | | Premiums
Paid
(Received) | | | Unrealized
Appreciation
(Depreciation) | |
Banca Monte dei Paschi di Siena SpA | | | 5.00 | % | | Deutsche Bank AG | | 12/20/16 | | | EUR | | | | 750 | | | $ | (39,113 | ) | | $ | 61,146 | | | $ | (100,259 | ) |
Transocean Worldwide, Inc. | | | 1.00 | % | | Goldman Sachs Bank USA | | 12/20/16 | | | USD | | | | 5,750 | | | | (81,686 | ) | | | (18,964 | ) | | | (62,722 | ) |
Genworth Holdings, Inc. | | | 1.00 | % | | JPMorgan Chase Bank N.A. | | 12/20/16 | | | USD | | | | 2,830 | | | | 60,154 | | | | 40,997 | | | | 19,157 | |
Banca Monte dei Paschi di Siena SpA | | | 5.00 | % | | JPMorgan Chase Bank N.A. | | 3/20/17 | | | EUR | | | | 3,800 | | | | (222,115 | ) | | | 258,639 | | | | (480,754 | ) |
AK Steel Corp. | | | 5.00 | % | | Citibank N.A. | | 3/20/17 | | | USD | | | | 2,500 | | | | (1,029 | ) | | | (31,898 | ) | | | 30,869 | |
AK Steel Corp. | | | 5.00 | % | | Citibank N.A. | | 3/20/17 | | | USD | | | | 1,100 | | | | (454 | ) | | | (15,684 | ) | | | 15,230 | |
Republic of Ireland | | | 1.00 | % | | Citibank N.A. | | 3/20/17 | | | USD | | | | 2,000 | | | | (32,887 | ) | | | 148,127 | | | | (181,014 | ) |
CDX.NA.IG Series 18 Version 1 | | | 1.00 | % | | Credit Suisse International | | 6/20/17 | | | USD | | | | 103,800 | | | | (1,711,230 | ) | | | (5,478 | ) | | | (1,705,752 | ) |
Peugeot SA | | | 5.00 | % | | BNP Paribas S.A. | | 9/20/17 | | | EUR | | | | 2,975 | | | | (337,211 | ) | | | 178,103 | | | | (515,314 | ) |
Energias de Portugal SA | | | 5.00 | % | | Citibank N.A. | | 9/20/17 | | | EUR | | | | 809 | | | | (98,613 | ) | | | (112,232 | ) | | | 13,619 | |
Energias de Portugal SA | | | 5.00 | % | | Goldman Sachs
International | | 9/20/17 | | | EUR | | | | 325 | | | | (39,624 | ) | | | (45,483 | ) | | | 5,859 | |
Finmeccanica SpA | | | 5.00 | % | | Bank of America N.A. | | 3/20/18 | | | EUR | | | | 470 | | | | (65,623 | ) | | | (25,628 | ) | | | (39,995 | ) |
Marks & Spencer PLC | | | 1.00 | % | | Credit Suisse International | | 3/20/18 | | | EUR | | | | 1,330 | | | | (26,712 | ) | | | 41,390 | | | | (68,102 | ) |
Republic of Italy | | | 1.00 | % | | Barclays Bank PLC | | 3/20/18 | | | USD | | | | 6,000 | | | | (53,098 | ) | | | 218,836 | | | | (271,934 | ) |
iTraxx Europe Series 9 3-6% | | | 5.00 | % | | Citibank N.A. | | 6/20/18 | | | EUR | | | | 3,780 | | | | (422,979 | ) | | | 337,947 | | | | (760,926 | ) |
Finmeccanica SpA | | | 5.00 | % | | Credit Suisse International | | 6/20/18 | | | EUR | | | | 570 | | | | (85,182 | ) | | | (26,045 | ) | | | (59,137 | ) |
Finmeccanica SpA | | | 5.00 | % | | Goldman Sachs
International | | 6/20/18 | | | EUR | | | | 90 | | | | (13,450 | ) | | | (7,080 | ) | | | (6,370 | ) |
Finmeccanica SpA | | | 5.00 | % | | JPMorgan Chase Bank N.A. | | 6/20/18 | | | EUR | | | | 1,290 | | | | (192,781 | ) | | | (92,520 | ) | | | (100,261 | ) |
Republic of France | | | 0.25 | % | | Barclays Bank PLC | | 6/20/18 | | | USD | | | | 2,530 | | | | (4,975 | ) | | | 29,309 | | | | (34,284 | ) |
Republic of France | | | 0.25 | % | | Citibank N.A. | | 6/20/18 | | | USD | | | | 2,740 | | | | (5,389 | ) | | | 35,949 | | | | (41,338 | ) |
Republic of France | | | 0.25 | % | | JPMorgan Chase Bank N.A. | | 6/20/18 | | | USD | | | | 2,735 | | | | (5,378 | ) | | | 27,551 | | | | (32,929 | ) |
Peugeot SA | | | 5.00 | % | | Barclays Bank PLC | | 9/20/18 | | | EUR | | | | 2,975 | | | | (431,795 | ) | | | 74,751 | | | | (506,546 | ) |
Finmeccanica SpA | | | 5.00 | % | | Barclays Bank PLC | | 12/20/18 | | | EUR | | | | 530 | | | | (87,849 | ) | | | (45,522 | ) | | | (42,327 | ) |
iTraxx Financials Series 20 Version 1 | | | 1.00 | % | | Barclays Bank PLC | | 12/20/18 | | | EUR | | | | 1,450 | | | | (31,390 | ) | | | (6,990 | ) | | | (24,400 | ) |
iTraxx Financials Series 20 Version 1 | | | 1.00 | % | | Citibank N.A. | | 12/20/18 | | | EUR | | | | 3,120 | | | | (67,543 | ) | | | (14,745 | ) | | | (52,798 | ) |
Marks & Spencer PLC | | | 1.00 | % | | Barclays Bank PLC | | 3/20/19 | | | EUR | | | | 136 | | | | (2,376 | ) | | | 3,122 | | | | (5,498 | ) |
GDF Suez | | | 1.00 | % | | Bank of America N.A. | | 6/20/19 | | | EUR | | | | 795 | | | | (24,766 | ) | | | (21,883 | ) | | | (2,883 | ) |
GKN Holdings PLC | | | 1.00 | % | | Bank of America N.A. | | 6/20/19 | | | EUR | | | | 90 | | | | (1,705 | ) | | | (709 | ) | | | (996 | ) |
GKN Holdings PLC | | | 1.00 | % | | Barclays Bank PLC | | 6/20/19 | | | EUR | | | | 105 | | | | (1,989 | ) | | | (767 | ) | | | (1,222 | ) |
See Consolidated Notes to Financial Statements.
| | | | | | |
| | | BLACKROCK BALANCED CAPITAL FUND, INC. | | MARCH 31, 2015 | | 69 |
| | | | |
| Consolidated Schedule of Investments (continued) | | | Master Total Return Portfolio | |
As of March 31, 2015, OTC credit default swaps — buy protection outstanding were as follows: (continued)
| | | | | | | | | | | | | | | | | | | | | | | | | | | | |
| Issuer/Index | | Pay
Fixed Rate | | | Counterparty | | Expiration
Date | | Notional Amount (000) | | | Value | | | Premiums
Paid
(Received) | | | Unrealized
Appreciation
(Depreciation) | |
GKN Holdings PLC | | | 1.00 | % | | BNP Paribas S.A. | | 6/20/19 | | | EUR | | | | 150 | | | $ | (2,841 | ) | | $ | (1,095 | ) | | $ | (1,746 | ) |
GDF Suez | | | 1.00 | % | | Citibank N.A. | | 6/20/19 | | | EUR | | | | 455 | | | | (14,174 | ) | | | (11,464 | ) | | | (2,710 | ) |
GKN Holdings PLC | | | 1.00 | % | | Citibank N.A. | | 6/20/19 | | | EUR | | | | 135 | | | | (2,557 | ) | | | (1,055 | ) | | | (1,502 | ) |
iTraxx Financials Series 21 Version 1 | | | 1.00 | % | | Citibank N.A. | | 6/20/19 | | | EUR | | | | 5,210 | | | | (113,546 | ) | | | (66,589 | ) | | | (46,957 | ) |
iTraxx Financials Series 21 Version 1 | | | 1.00 | % | | Citibank N.A. | | 6/20/19 | | | EUR | | | | 2,690 | | | | (58,625 | ) | | | (26,124 | ) | | | (32,501 | ) |
iTraxx Financials Series 21 Version 1 | | | 1.00 | % | | Citibank N.A. | | 6/20/19 | | | EUR | | | | 2,690 | | | | (58,625 | ) | | | (25,561 | ) | | | (33,064 | ) |
iTraxx Financials Series 21 Version 1 | | | 1.00 | % | | Citibank N.A. | | 6/20/19 | | | EUR | | | | 2,555 | | | | (55,684 | ) | | | (26,241 | ) | | | (29,443 | ) |
GDF Suez | | | 1.00 | % | | Deutsche Bank AG | | 6/20/19 | | | EUR | | | | 450 | | | | (14,018 | ) | | | (12,387 | ) | | | (1,631 | ) |
iTraxx Financials Series 21 Version 1 | | | 1.00 | % | | Deutsche Bank AG | | 6/20/19 | | | EUR | | | | 2,690 | | | | (58,625 | ) | | | (36,078 | ) | | | (22,547 | ) |
Federative Republic of Brazil | | | 1.00 | % | | Bank of America N.A. | | 6/20/19 | | | USD | | | | 1,187 | | | | 71,431 | | | | 39,312 | | | | 32,119 | |
Federative Republic of Brazil | | | 1.00 | % | | Citibank N.A. | | 6/20/19 | | | USD | | | | 1,155 | | | | 69,505 | | | | 44,482 | | | | 25,023 | |
Carlsberg Breweries A/S | | | 1.00 | % | | Citibank N.A. | | 9/20/19 | | | EUR | | | | 150 | | | | (2,259 | ) | | | (1,674 | ) | | | (585 | ) |
Fortum Oyj | | | 1.00 | % | | Credit Suisse International | | 9/20/19 | | | EUR | | | | 425 | | | | (11,325 | ) | | | (10,654 | ) | | | (671 | ) |
Fortum Oyj | | | 1.00 | % | | Credit Suisse International | | 9/20/19 | | | EUR | | | | 265 | | | | (7,061 | ) | | | (6,643 | ) | | | (418 | ) |
Fortum Oyj | | | 1.00 | % | | Deutsche Bank AG | | 9/20/19 | | | EUR | | | | 425 | | | | (11,325 | ) | | | (10,659 | ) | | | (666 | ) |
Fortum Oyj | | | 1.00 | % | | Deutsche Bank AG | | 9/20/19 | | | EUR | | | | 315 | | | | (8,394 | ) | | | (8,089 | ) | | | (305 | ) |
Fortum Oyj | | | 1.00 | % | | Deutsche Bank AG | | 9/20/19 | | | EUR | | | | 270 | | | | (7,195 | ) | | | (6,934 | ) | | | (261 | ) |
Carlsberg Breweries A/S | | | 1.00 | % | | Goldman Sachs International | | 9/20/19 | | | EUR | | | | 270 | | | | (4,065 | ) | | | (3,338 | ) | | | (727 | ) |
Republic of Portugal | | | 1.00 | % | | BNP Paribas S.A. | | 9/20/19 | | | USD | | | | 875 | | | | 2,543 | | | | 23,047 | | | | (20,504 | ) |
Casino Guichard Perrachon SA | | | 1.00 | % | | Bank of America N.A. | | 3/20/20 | | | EUR | | | | 120 | | | | (553 | ) | | | 8 | | | | (561 | ) |
Deutsche Lufthansa AG | | | 1.00 | % | | Barclays Bank PLC | | 3/20/20 | | | EUR | | | | 330 | | | | 4,384 | | | | 2,914 | | | | 1,470 | |
Deutsche Lufthansa AG | | | 1.00 | % | | Barclays Bank PLC | | 3/20/20 | | | EUR | | | | 330 | | | | 4,384 | | | | 2,914 | | | | 1,470 | |
Casino Guichard Perrachon SA | | | 1.00 | % | | Citibank N.A. | | 3/20/20 | | | EUR | | | | 230 | | | | (1,060 | ) | | | 154 | | | | (1,214 | ) |
Arrow Electronics, Inc. | | | 1.00 | % | | Barclays Bank PLC | | 3/20/20 | | | USD | | | | 1,000 | | | | (15,800 | ) | | | (8,392 | ) | | | (7,408 | ) |
Avnet, Inc. | | | 1.00 | % | | Barclays Bank PLC | | 3/20/20 | | | USD | | | | 1,000 | | | | (11,746 | ) | | | (3,408 | ) | | | (8,338 | ) |
Block Financial LLC | | | 5.00 | % | | Barclays Bank PLC | | 3/20/20 | | | USD | | | | 1,000 | | | | (172,140 | ) | | | (182,551 | ) | | | 10,411 | |
CBS Corp. | | | 1.00 | % | | Barclays Bank PLC | | 3/20/20 | | | USD | | | | 1,000 | | | | (26,560 | ) | | | (13,925 | ) | | | (12,635 | ) |
Computer Sciences Corp. | | | 5.00 | % | | Barclays Bank PLC | | 3/20/20 | | | USD | | | | 1,000 | | | | (190,209 | ) | | | (181,042 | ) | | | (9,167 | ) |
The Dow Chemical Co. | | | 1.00 | % | | Barclays Bank PLC | | 3/20/20 | | | USD | | | | 1,000 | | | | (16,948 | ) | | | (5,895 | ) | | | (11,053 | ) |
Eastman Chemical Co. | | | 1.00 | % | | Barclays Bank PLC | | 3/20/20 | | | USD | | | | 1,000 | | | | (12,126 | ) | | | (9,896 | ) | | | (2,230 | ) |
Expedia, Inc. | | | 1.00 | % | | Barclays Bank PLC | | 3/20/20 | | | USD | | | | 1,000 | | | | (12,621 | ) | | | (2,912 | ) | | | (9,709 | ) |
FirstEnergy Corp. | | | 1.00 | % | | Barclays Bank PLC | | 3/20/20 | | | USD | | | | 1,000 | | | | (3,063 | ) | | | 7,408 | | | | (10,471 | ) |
Ford Motor Co. | | | 5.00 | % | | Barclays Bank PLC | | 3/20/20 | | | USD | | | | 1,000 | | | | (200,166 | ) | | | (192,437 | ) | | | (7,729 | ) |
Gap, Inc. | | | 1.00 | % | | Barclays Bank PLC | | 3/20/20 | | | USD | | | | 1,000 | | | | (14,835 | ) | | | 2,845 | | | | (17,680 | ) |
Hewlett-Packard Co. | | | 1.00 | % | | Barclays Bank PLC | | 3/20/20 | | | USD | | | | 1,000 | | | | (233 | ) | | | (5,895 | ) | | | 5,662 | |
International Paper Co. | | | 1.00 | % | | Barclays Bank PLC | | 3/20/20 | | | USD | | | | 1,000 | | | | (21,152 | ) | | | (8,893 | ) | | | (12,259 | ) |
Kinder Morgan Energy Partners LP | | | 1.00 | % | | Barclays Bank PLC | | 3/20/20 | | | USD | | | | 1,000 | | | | (22,771 | ) | | | 1,041 | | | | (23,812 | ) |
Kohl’s Corp. | | | 1.00 | % | | Barclays Bank PLC | | 3/20/20 | | | USD | | | | 1,000 | | | | (16,001 | ) | | | 15,146 | | | | (31,147 | ) |
Meadwestvaco Corp. | | | 1.00 | % | | Barclays Bank PLC | | 3/20/20 | | | USD | | | | 1,000 | | | | (34,157 | ) | | | (6,047 | ) | | | (28,110 | ) |
Motorola Solutions, Inc. | | | 1.00 | % | | Barclays Bank PLC | | 3/20/20 | | | USD | | | | 1,000 | | | | (8,056 | ) | | | (4,401 | ) | | | (3,655 | ) |
Pitney Bowes, Inc. | | | 1.00 | % | | Barclays Bank PLC | | 3/20/20 | | | USD | | | | 1,000 | | | | (6,073 | ) | | | (3,223 | ) | | | (2,850 | ) |
Quest Diagnostics, Inc. | | | 1.00 | % | | Barclays Bank PLC | | 3/20/20 | | | USD | | | | 1,000 | | | | (13,302 | ) | | | 3,498 | | | | (16,800 | ) |
Transocean, Inc. | | | 5.00 | % | | Barclays Bank PLC | | 3/20/20 | | | USD | | | | 3,300 | | | | 337,031 | | | | 432,327 | | | | (95,296 | ) |
Valero Energy Corp. | | | 1.00 | % | | Barclays Bank PLC | | 3/20/20 | | | USD | | | | 1,000 | | | | (10,541 | ) | | | 17,064 | | | | (27,605 | ) |
See Consolidated Notes to Financial Statements.
| | | | | | |
| 70 | | BLACKROCK BALANCED CAPITAL FUND, INC. | | MARCH 31, 2015 | | |
| | | | |
| Consolidated Schedule of Investments (continued) | | | Master Total Return Portfolio | |
As of March 31, 2015, OTC credit default swaps — buy protection outstanding as follows: (concluded)
| | | | | | | | | | | | | | | | | | | | | | | | | | | | |
| Issuer/Index | | Pay
Fixed Rate | | | Counterparty | | Expiration
Date | | Notional Amount (000) | | | Value | | | Premiums
Paid
(Received) | | | Unrealized
Appreciation
(Depreciation) | |
Viacom, Inc. | | | 1.00 | % | | Barclays Bank PLC | | 3/20/20 | | | USD | | | | 1,000 | | | $ | (19,025 | ) | | $ | (19,000 | ) | | $ | (25 | ) |
Xerox Corp. | | | 1.00 | % | | Barclays Bank PLC | | 3/20/20 | | | USD | | | | 1,000 | | | | (5,637 | ) | | | (6,519 | ) | | | 882 | |
YUM! Brands, Inc. | | | 1.00 | % | | Barclays Bank PLC | | 3/20/20 | | | USD | | | | 1,000 | | | | (23,305 | ) | | | (5,104 | ) | | | (18,201 | ) |
Boyd Gaming Corp. | | | 5.00 | % | | Citibank N.A. | | 3/20/20 | | | USD | | | | 1,300 | | | | (104,928 | ) | | | (84,661 | ) | | | (20,267 | ) |
Valero Energy Corp. | | | 1.00 | % | | Goldman Sachs
International | | 3/20/20 | | | USD | | | | 2,300 | | | | (24,244 | ) | | | (21,437 | ) | | | (2,807 | ) |
Staples, Inc. | | | 1.00 | % | | Morgan Stanley Capital
Services LLC | | 3/20/20 | | | USD | | | | 3,500 | | | | 121,117 | | | | 111,939 | | | | 9,178 | |
Republic of South Africa | | | 1.00 | % | | Barclays Bank PLC | | 6/20/20 | | | USD | | | | 10,520 | | | | 549,383 | | | | 572,095 | | | | (22,712 | ) |
Republic of South Africa | | | 1.00 | % | | JPMorgan Chase Bank N.A. | | 6/20/20 | | | USD | | | | 3,693 | | | | 192,858 | | | | 197,778 | | | | (4,920 | ) |
Total | | | | | | | | | | | | | | | | | | $ | (4,093,723 | ) | | $ | 1,437,988 | | | $ | (5,531,711 | ) |
| | | | | | | | | | | | | | | | | | | | |
| • | | As of March 31, 2015, OTC credit default swaps — sold protection outstanding were as follows: |
| | | | | | | | | | | | | | | | | | | | | | | | | | | | | | | | |
| Issuer/Index | | Receive
Fixed Rate | | | Counterparty | | Expiration
Date | | Credit
Rating1 | | | Notional Amount (000)2 | | | Value | | | Premiums
Paid
(Received) | | | Unrealized
Appreciation
(Depreciation) | |
Banca Monte dei Paschi di Siena SpA | | | 3.00 | % | | BNP Paribas S.A. | | 9/20/16 | | | Not Rated | | | | EUR | | | | 2,000 | | | $ | 27,515 | | | $ | (117,734 | ) | | $ | 145,249 | |
Banca Monte dei Paschi di Siena SpA | | | 5.00 | % | | Deutsche Bank AG | | 9/20/16 | | | Not Rated | | | | EUR | | | | 750 | | | | 34,539 | | | | (12,575 | ) | | | 47,114 | |
Banca Monte dei Paschi di Siena SpA | | | 3.00 | % | | JPMorgan Chase Bank N.A. | | 9/20/16 | | | Not Rated | | | | EUR | | | | 2,200 | | | | 30,267 | | | | (77,140 | ) | | | 107,407 | |
CDX.NA.IG Series 18 Version 1 | | | 1.00 | % | | Citibank N.A. | | 6/20/17 | | | BBB+ | | | | USD | | | | 103,800 | | | | 1,711,230 | | | | 52,085 | | | | 1,659,145 | |
Abengoa SA | | | 5.00 | % | | Barclays Bank PLC | | 3/20/18 | | | B | | | | EUR | | | | 135 | | | | (14,775 | ) | | | (12,702 | ) | | | (2,073 | ) |
Abengoa SA | | | 5.00 | % | | Credit Suisse International | | 3/20/18 | | | B | | | | EUR | | | | 200 | | | | (21,889 | ) | | | (18,818 | ) | | | (3,071 | ) |
Republic of Italy | | | 1.00 | % | | Barclays Bank PLC | | 3/20/18 | | | BBB- | | | | EUR | | | | 4,500 | | | | 52,828 | | | | (168,442 | ) | | | 221,270 | |
Republic of Italy | | | 1.00 | % | | Barclays Bank PLC | | 3/20/18 | | | BBB- | | | | USD | | | | 37 | | | | 327 | | | | (1,769 | ) | | | 2,096 | |
Bayerische Landesbank Gtd. | | | 1.00 | % | | Barclays Bank PLC | | 12/20/18 | | | Not Rated | | | | EUR | | | | 790 | | | | 14,015 | | | | 1,919 | | | | 12,096 | |
iTraxx Sub Financials Series 20 Version 1 | | | 5.00 | % | | Barclays Bank PLC | | 12/20/18 | | | BBB | | | | EUR | | | | 1,160 | | | | 201,752 | | | | 213,194 | | | | (11,442 | ) |
iTraxx Sub Financials Series 20 Version 1 | | | 5.00 | % | | Citibank N.A. | | 12/20/18 | | | BBB | | | | EUR | | | | 1,660 | | | | 288,714 | | | | 302,331 | | | | (13,617 | ) |
iTraxx Sub Financials Series 20 Version 1 | | | 5.00 | % | | Deutsche Bank AG | | 12/20/18 | | | BBB | | | | EUR | | | | 830 | | | | 144,357 | | | | 151,855 | | | | (7,498 | ) |
CNH Industrial NV | | | 5.00 | % | | Citibank N.A. | | 3/20/19 | | | BB+ | | | | EUR | | | | 240 | | | | 36,174 | | | | 39,682 | | | | (3,508 | ) |
CNH Industrial NV | | | 5.00 | % | | Citibank N.A. | | 3/20/19 | | | BB+ | | | | EUR | | | | 240 | | | | 36,174 | | | | 40,453 | | | | (4,279 | ) |
Astaldi SpA | | | 5.00 | % | | Barclays Bank PLC | | 6/20/19 | | | B+ | | | | EUR | | | | 48 | | | | 3,356 | | | | 808 | | | | 2,548 | |
Astaldi SpA | | | 5.00 | % | | Credit Suisse International | | 6/20/19 | | | B+ | | | | EUR | | | | 72 | | | | 5,034 | | | | 472 | | | | 4,562 | |
Astaldi SpA | | | 5.00 | % | | Credit Suisse International | | 6/20/19 | | | B+ | | | | EUR | | | | 50 | | | | 3,496 | | | | 1,680 | | | | 1,816 | |
Astaldi SpA | | | 5.00 | % | | Deutsche Bank AG | | 6/20/19 | | | B+ | | | | EUR | | | | 47 | | | | 3,295 | | | | 1,702 | | | | 1,593 | |
Astaldi SpA | | | 5.00 | % | | Goldman Sachs
International | | 6/20/19 | | | B+ | | | | EUR | | | | 73 | | | | 5,095 | | | | 2,448 | | | | 2,647 | |
Transocean, Inc. | | | 1.00 | % | | Goldman Sachs
International | | 6/20/19 | | | BB+ | | | | USD | | | | 350 | | | | (75,848 | ) | | | (9,256 | ) | | | (66,592 | ) |
ArcelorMittal | | | 1.00 | % | | Barclays Bank PLC | | 9/20/19 | | | BB | | | | EUR | | | | 140 | | | | (8,921 | ) | | | (10,752 | ) | | | 1,831 | |
ArcelorMittal | | | 1.00 | % | | Barclays Bank PLC | | 9/20/19 | | | BB | | | | EUR | | | | 135 | | | | (8,602 | ) | | | (10,804 | ) | | | 2,202 | |
ArcelorMittal | | | 1.00 | % | | Citibank N.A. | | 9/20/19 | | | BB | | | | EUR | | | | 270 | | | | (17,205 | ) | | | (21,329 | ) | | | 4,124 | |
ArcelorMittal | | | 1.00 | % | | Credit Suisse International | | 9/20/19 | | | BB | | | | EUR | | | | 270 | | | | (17,204 | ) | | | (20,735 | ) | | | 3,531 | |
Abengoa SA | | | 5.00 | % | | Citibank N.A. | | 12/20/19 | | | B | | | | EUR | | | | 5 | | | | (732 | ) | | | (892 | ) | | | 160 | |
Abengoa SA | | | 5.00 | % | | Credit Suisse International | | 12/20/19 | | | B | | | | EUR | | | | 145 | | | | (23,564 | ) | | | (36,442 | ) | | | 12,878 | |
Abengoa SA | | | 5.00 | % | | Credit Suisse International | | 12/20/19 | | | B | | | | EUR | | | | 105 | | | | (17,064 | ) | | | (22,099 | ) | | | 5,035 | |
Abengoa SA | | | 5.00 | % | | Credit Suisse International | | 12/20/19 | | | B | | | | EUR | | | | 100 | | | | (16,251 | ) | | | (26,770 | ) | | | 10,519 | |
Altice Finco SA | | | 5.00 | % | | Citibank N.A. | | 12/20/19 | | | B- | | | | EUR | | | | 120 | | | | 11,340 | | | | 1,733 | | | | 9,607 | |
ArcelorMittal | | | 1.00 | % | | Citibank N.A. | | 12/20/19 | | | BB | | | | EUR | | | | 245 | | | | (18,074 | ) | | | (18,682 | ) | | | 608 | |
Barrick Gold Corp. | | | 1.00 | % | | Deutsche Bank AG | | 12/20/19 | | | BBB- | | | | USD | | | | 1,533 | | | | (31,829 | ) | | | (56,939 | ) | | | 25,110 | |
See Consolidated Notes to Financial Statements.
| | | | | | |
| | | BLACKROCK BALANCED CAPITAL FUND, INC. | | MARCH 31, 2015 | | 71 |
| | | | |
| Consolidated Schedule of Investments (continued) | | | Master Total Return Portfolio | |
As of March 31, 2015, OTC credit default swaps — sold protection outstanding were as follows: (continued)
| | | | | | | | | | | | | | | | | | | | | | | | | | | | | | | | |
| Issuer/Index | | Receive
Fixed Rate | | | Counterparty | | Expiration
Date | | Credit
Rating1 | | | Notional Amount (000)2 | | | Value | | | Premiums
Paid
(Received) | | | Unrealized
Appreciation
(Depreciation) | |
Republic of Italy | | | 1.00 | % | | HSBC Bank PLC | | 12/20/19 | | | BBB- | | | | USD | | | | 1,808 | | | $ | (3,552 | ) | | $ | (43,338 | ) | | $ | 39,786 | |
Republic of Italy | | | 1.00 | % | | Morgan Stanley Capital
Services LLC | | 12/20/19 | | | BBB- | | | | USD | | | | 992 | | | | (1,950 | ) | | | (23,362 | ) | | | 21,412 | |
Transocean, Inc. | | | 1.00 | % | | Bank of America N.A. | | 12/20/19 | | | BB+ | | | | USD | | | | 720 | | | | (174,879 | ) | | | (54,886 | ) | | | (119,993 | ) |
Transocean, Inc. | | | 1.00 | % | | Bank of America N.A. | | 12/20/19 | | | BB+ | | | | USD | | | | 595 | | | | (144,519 | ) | | | (43,864 | ) | | | (100,655 | ) |
Transocean, Inc. | | | 1.00 | % | | Bank of America N.A. | | 12/20/19 | | | BB+ | | | | USD | | | | 595 | | | | (144,518 | ) | | | (42,820 | ) | | | (101,698 | ) |
Abengoa SA | | | 5.00 | % | | Barclays Bank PLC | | 3/20/20 | | | B | | | | EUR | | | | 450 | | | | (75,962 | ) | | | (73,159 | ) | | | (2,803 | ) |
Abengoa SA | | | 5.00 | % | | Goldman Sachs International | | 3/20/20 | | | B | | | | EUR | | | | 270 | | | | (45,577 | ) | | | (36,431 | ) | | | (9,146 | ) |
Abengoa SA | | | 5.00 | % | | Goldman Sachs International | | 3/20/20 | | | B | | | | EUR | | | | 180 | | | | (30,385 | ) | | | (24,288 | ) | | | (6,097 | ) |
AK Steel Corp. | | | 5.00 | % | | Citibank N.A. | | 3/20/20 | | | B- | | | | USD | | | | 2,500 | | | | (328,557 | ) | | | (294,807 | ) | | | (33,750 | ) |
AK Steel Corp. | | | 5.00 | % | | Citibank N.A. | | 3/20/20 | | | B- | | | | USD | | | | 1,100 | | | | (144,565 | ) | | | (127,147 | ) | | | (17,418 | ) |
Apache Corp. | | | 1.00 | % | | BNP Paribas S.A. | | 3/20/20 | | | A- | | | | USD | | | | 1,050 | | | | (13,038 | ) | | | (55,872 | ) | | | 42,834 | |
Apache Corp. | | | 1.00 | % | | BNP Paribas S.A. | | 3/20/20 | | | A- | | | | USD | | | | 1,050 | | | | (13,038 | ) | | | (49,347 | ) | | | 36,309 | |
Apache Corp. | | | 1.00 | % | | JPMorgan Chase Bank N.A. | | 3/20/20 | | | A- | | | | USD | | | | 2,510 | | | | (31,167 | ) | | | (107,885 | ) | | | 76,718 | |
Apache Corp. | | | 1.00 | % | | JPMorgan Chase Bank N.A. | | 3/20/20 | | | A- | | | | USD | | | | 540 | | | | (6,705 | ) | | | (23,576 | ) | | | 16,871 | |
Bank of America Corp. | | | 1.00 | % | | Barclays Bank PLC | | 3/20/20 | | | A- | | | | USD | | | | 3,200 | | | | 57,834 | | | | 40,616 | | | | 17,218 | |
Chesapeake Energy Corp. | | | 5.00 | % | | Goldman Sachs International | | 3/20/20 | | | BB+ | | | | USD | | | | 1,200 | | | | 62,124 | | | | 101,579 | | | | (39,455 | ) |
Chesapeake Energy Corp. | | | 5.00 | % | | JPMorgan Chase Bank N.A. | | 3/20/20 | | | BB+ | | | | USD | | | | 1,500 | | | | 77,656 | | | | 132,245 | | | | (54,589 | ) |
Chesapeake Energy Corp. | | | 5.00 | % | | JPMorgan Chase Bank N.A. | | 3/20/20 | | | BB+ | | | | USD | | | | 725 | | | | 37,534 | | | | 55,500 | | | | (17,966 | ) |
Chesapeake Energy Corp. | | | 5.00 | % | | JPMorgan Chase Bank N.A. | | 3/20/20 | | | BB+ | | | | USD | | | | 500 | | | | 25,886 | | | | 29,134 | | | | (3,248 | ) |
Chesapeake Energy Corp. | | | 5.00 | % | | Morgan Stanley Capital
Services LLC | | 3/20/20 | | | BB+ | | | | USD | | | | 1,200 | | | | 62,125 | | | | 78,110 | | | | (15,985 | ) |
Chesapeake Energy Corp. | | | 5.00 | % | | Morgan Stanley Capital
Services LLC | | 3/20/20 | | | BB+ | | | | USD | | | | 500 | | | | 25,885 | | | | 36,307 | | | | (10,422 | ) |
Chesapeake Energy Corp. | | | 5.00 | % | | Morgan Stanley Capital
Services LLC | | 3/20/20 | | | BB+ | | | | USD | | | | 307 | | | | 15,893 | | | | 23,093 | | | | (7,200 | ) |
Citigroup, Inc. | | | 1.00 | % | | Barclays Bank PLC | | 3/20/20 | | | A- | | | | USD | | | | 3,200 | | | | 44,580 | | | | 36,037 | | | | 8,543 | |
Freeport-McMoRan, Inc. | | | 1.00 | % | | Citibank N.A. | | 3/20/20 | | | BBB- | | | | USD | | | | 3,720 | | | | (245,071 | ) | | | (316,964 | ) | | | 71,893 | |
Freeport-McMoRan, Inc. | | | 1.00 | % | | Citibank N.A. | | 3/20/20 | | | BBB- | | | | USD | | | | 1,915 | | | | (126,159 | ) | | | (145,958 | ) | | | 19,799 | |
Freeport-McMoRan, Inc. | | | 1.00 | % | | Credit Suisse International | | 3/20/20 | | | BBB- | | | | USD | | | | 765 | | | | (50,397 | ) | | | (56,134 | ) | | | 5,737 | |
The Goldman Sachs Group, Inc. | | | 1.00 | % | | Barclays Bank PLC | | 3/20/20 | | | A- | | | | USD | | | | 3,200 | | | | 28,298 | | | | 14,827 | | | | 13,471 | |
JPMorgan Chase and Co. | | | 1.00 | % | | Barclays Bank PLC | | 3/20/20 | | | A | | | | USD | | | | 3,200 | | | | 60,522 | | | | 49,808 | | | | 10,714 | |
Morgan Stanley | | | 1.00 | % | | Barclays Bank PLC | | 3/20/20 | | | A- | | | | USD | | | | 3,200 | | | | 43,955 | | | | 17,841 | | | | 26,114 | |
Novo Banco SA | | | 5.00 | % | | BNP Paribas S.A. | | 3/20/20 | | | Not Rated | | | | EUR | | | | 575 | | | | 58,809 | | | | 55,398 | | | | 3,411 | |
Novo Banco SA | | | 5.00 | % | | BNP Paribas S.A. | | 3/20/20 | | | Not Rated | | | | EUR | | | | 575 | | | | 58,803 | | | | 55,522 | | | | 3,281 | |
Republic of Italy | | | 1.00 | % | | Goldman Sachs International | | 3/20/20 | | | BBB- | | | | USD | | | | 5,000 | | | | (17,006 | ) | | | (35,075 | ) | | | 18,069 | |
Transocean, Inc. | | | 1.00 | % | | Barclays Bank PLC | | 3/20/20 | | | BB+ | | | | USD | | | | 3,300 | | | | (844,424 | ) | | | (829,572 | ) | | | (14,852 | ) |
Transocean, Inc. | | | 1.00 | % | | Barclays Bank PLC | | 3/20/20 | | | BB+ | | | | USD | | | | 1,100 | | | | (281,474 | ) | | | (246,359 | ) | | | (35,115 | ) |
Transocean, Inc. | | | 1.00 | % | | Barclays Bank PLC | | 3/20/20 | | | BB+ | | | | USD | | | | 1,100 | | | | (281,474 | ) | | | (236,503 | ) | | | (44,971 | ) |
Transocean, Inc. | | | 1.00 | % | | Goldman Sachs International | | 3/20/20 | | | BB+ | | | | USD | | | | 1,100 | | | | (281,474 | ) | | | (303,593 | ) | | | 22,119 | |
United Rentals, Inc. | | | 5.00 | % | | Barclays Bank PLC | | 3/20/20 | | | BB- | | | | USD | | | | 700 | | | | 90,925 | | | | 75,431 | | | | 15,494 | |
United Rentals, Inc. | | | 5.00 | % | | Goldman Sachs International | | 3/20/20 | | | BB- | | | | USD | | | | 800 | | | | 103,915 | | | | 86,640 | | | | 17,275 | |
United Rentals, Inc. | | | 5.00 | % | | Goldman Sachs International | | 3/20/20 | | | BB- | | | | USD | | | | 700 | | | | 90,926 | | | | 75,810 | | | | 15,116 | |
See Consolidated Notes to Financial Statements.
| | | | | | |
| 72 | | BLACKROCK BALANCED CAPITAL FUND, INC. | | MARCH 31, 2015 | | |
| | | | |
| Consolidated Schedule of Investments (continued) | | | Master Total Return Portfolio | |
As of March 31, 2015, OTC credit default swaps — sold protection outstanding were as follows: (concluded)
| | | | | | | | | | | | | | | | | | | | | | | | | | | | | | | | |
| Issuer/Index | | Receive
Fixed Rate | | | Counterparty | | Expiration
Date | | Credit
Rating1 | | | Notional Amount (000)2 | | | Value | | | Premiums
Paid
(Received) | | | Unrealized
Appreciation
(Depreciation) | |
Vougeot Bidco PLC | | | 5.00 | % | | Goldman Sachs International | | 3/20/20 | | | B | | | | EUR | | | | 340 | | | $ | 33,539 | | | $ | 25,960 | | | $ | 7,579 | |
Vougeot Bidco PLC | | | 5.00 | % | | Goldman Sachs International | | 3/20/20 | | | B | | | | EUR | | | | 340 | | | | 33,541 | | | | 31,188 | | | | 2,353 | |
Wells Fargo & Co. | | | 1.00 | % | | Barclays Bank PLC | | 3/20/20 | | | A+ | | | | USD | | | | 3,200 | | | | 95,410 | | | | 76,113 | | | | 19,297 | |
Abengoa SA | | | 5.00 | % | | Barclays Bank PLC | | 6/20/20 | | | B | | | | EUR | | | | 180 | | | | (31,574 | ) | | | (39,630 | ) | | | 8,056 | |
Abengoa SA | | | 5.00 | % | | BNP Paribas S.A. | | 6/20/20 | | | B | | | | EUR | | | | 190 | | | | (33,329 | ) | | | (35,223 | ) | | | 1,894 | |
Abengoa SA | | | 5.00 | % | | BNP Paribas S.A. | | 6/20/20 | | | B | | | | EUR | | | | 127 | | | | (22,220 | ) | | | (23,138 | ) | | | 918 | |
Abengoa SA | | | 5.00 | % | | Credit Suisse International | | 6/20/20 | | | B | | | | EUR | | | | 180 | | | | (31,574 | ) | | | (40,124 | ) | | | 8,550 | |
Abengoa SA | | | 5.00 | % | | Goldman Sachs International | | 6/20/20 | | | B | | | | EUR | | | | 180 | | | | (31,574 | ) | | | (39,630 | ) | | | 8,056 | |
The Goldman Sachs Group, Inc. | | | 1.00 | % | | Bank of America N.A. | | 6/20/20 | | | A- | | | | USD | | | | 8,770 | | | | 67,576 | | | | 51,040 | | | | 16,536 | |
United Mexican States | | | 1.00 | % | | Bank of America N.A. | | 6/20/20 | | | BBB+ | | | | USD | | | | 1,846 | | | | (22,016 | ) | | | (25,456 | ) | | | 3,440 | |
United Mexican States | | | 1.00 | % | | Bank of America N.A. | | 6/20/20 | | | BBB+ | | | | USD | | | | 1,845 | | | | (22,004 | ) | | | (30,053 | ) | | | 8,049 | |
United Mexican States | | | 1.00 | % | | Citibank N.A. | | 6/20/20 | | | BBB+ | | | | USD | | | | 3,763 | | | | (44,883 | ) | | | (68,587 | ) | | | 23,704 | |
United Mexican States | | | 1.00 | % | | HSBC Bank PLC | | 6/20/20 | | | BBB+ | | | | USD | | | | 2,083 | | | | (24,840 | ) | | | (37,203 | ) | | | 12,363 | |
Barrick Gold Corp. | | | 1.00 | % | | Goldman Sachs International | | 6/20/21 | | | BBB- | | | | USD | | | | 3,172 | | | | (180,978 | ) | | | (233,023 | ) | | | 52,045 | |
Glencore International AG | | | 1.00 | % | | BNP Paribas S.A. | | 6/20/21 | | | BBB | | | | EUR | | | | 160 | | | | (8,359 | ) | | | (18,028 | ) | | | 9,669 | |
Glencore International AG | | | 1.00 | % | | Citibank N.A. | | 6/20/21 | | | BBB | | | | EUR | | | | 320 | | | | (16,718 | ) | | | (37,111 | ) | | | 20,393 | |
Republic of France | | | 0.25 | % | | Barclays Bank PLC | | 6/20/23 | | | AA | | | | USD | | | | 1,550 | | | | (44,530 | ) | | | (98,663 | ) | | | 54,133 | |
Republic of France | | | 0.25 | % | | Citibank N.A. | | 6/20/23 | | | AA | | | | USD | | | | 1,670 | | | | (47,977 | ) | | | (112,261 | ) | | | 64,284 | |
Republic of France | | | 0.25 | % | | JPMorgan Chase Bank N.A. | | 6/20/23 | | | AA | | | | USD | | | | 1,670 | | | | (47,978 | ) | | | (104,312 | ) | | | 56,334 | |
CMBX.NA Series 7 AAA | | | 0.50 | % | | Morgan Stanley Capital
Services LLC | | 1/17/47 | | | AAA | | | | USD | | | | 5,000 | | | | (122,252 | ) | | | (172,311 | ) | | | 50,059 | |
CMBX.NA Series 3 AM | | | 0.50 | % | | Credit Suisse International | | 12/13/49 | | | BBB- | | | | USD | | | | 920 | | | | (15,989 | ) | | | (86,739 | ) | | | 70,750 | |
CMBX.NA Series 3 AM | | | 0.50 | % | | JPMorgan Chase Bank N.A. | | 12/13/49 | | | BBB- | | | | USD | | | | 5,000 | | | | (86,901 | ) | | | (452,979 | ) | | | 366,078 | |
CMBX.NA Series 3 AM | | | 0.50 | % | | Royal Bank of Scotland PLC | | 12/13/49 | | | BBB- | | | | USD | | | | 2,320 | | | | (40,322 | ) | | | (221,501 | ) | | | 181,179 | |
CMBX.NA Series 4 AM | | | 0.50 | % | | Deutsche Bank AG | | 2/17/51 | | | BB | | | | USD | | | | 2,000 | | | | (51,300 | ) | | | (284,663 | ) | | | 233,363 | |
Total | | | | | | | | | | | | | | | | | | | | | | $ | (699,923 | ) | | $ | (4,016,894 | ) | | $ | 3,316,971 | |
| | | | | | | | | | | | | | | | | | | | | | | | |
| | 1 | | Using S&P’s rating of the issuer or the underlying securities of the index, as applicable. |
| | 2 | | The maximum potential amount the Master Portfolio may pay should a negative credit event take place as defined under the terms of the agreement. |
| • | | As of March 31, 2015, OTC interest rate swaps outstanding were as follows: |
| | | | | | | | | | | | | | | | | | | | | | | | | | |
Fixed Rate | | Floating Rate | | Counterparty | | Expiration
Date | | Notional Amount (000) | | | Value | | | Premiums
Paid
(Received) | | | Unrealized
Appreciation
(Depreciation) | |
12.30%1 | | 1-day BZDIOVER | | Bank of America N.A. | | 1/04/16 | | | BRL | | | | 46,303 | | | $ | 81,487 | | | $ | 1,377 | | | $ | 80,110 | |
12.30%2 | | 1-day BZDIOVER | | Credit Suisse International | | 1/04/16 | | | BRL | | | | 30,093 | | | | (56,327 | ) | | | (895 | ) | | | (55,432 | ) |
11.36%2 | | 1-day BZDIOVER | | Credit Suisse International | | 1/04/16 | | | BRL | | | | 21,685 | | | | (74,993 | ) | | | (286 | ) | | | (74,707 | ) |
11.12%2 | | 1-day BZDIOVER | | Credit Suisse International | | 1/04/16 | | | BRL | | | | 5,825 | | | | (28,913 | ) | | | (45 | ) | | | (28,868 | ) |
11.26%2 | | 1-day BZDIOVER | | Deutsche Bank AG | | 1/04/16 | | | BRL | | | | 5,234 | | | | (22,620 | ) | | | (114 | ) | | | (22,506 | ) |
12.14%1 | | 1-day BZDIOVER | | JPMorgan Chase Bank N.A. | | 1/04/16 | | | BRL | | | | 59,840 | | | | 31,529 | | | | 2,869 | | | | 28,660 | |
11.83%2 | | 1-day BZDIOVER | | JPMorgan Chase Bank N.A. | | 1/04/16 | | | BRL | | | | 27,175 | | | | 50,084 | | | | (1,168 | ) | | | 51,252 | |
11.80%1 | | 1-day BZDIOVER | | JPMorgan Chase Bank N.A. | | 1/04/16 | | | BRL | | | | 26,976 | | | | (7,896 | ) | | | 672 | | | | (8,568 | ) |
12.13%1 | | 1-day BZDIOVER | | JPMorgan Chase Bank N.A. | | 1/04/16 | | | BRL | | | | 24,659 | | | | 14,206 | | | | 1,171 | | | | 13,035 | |
11.85%2 | | 1-day BZDIOVER | | JPMorgan Chase Bank N.A. | | 1/04/16 | | | BRL | | | | 16,143 | | | | (22,248 | ) | | | (379 | ) | | | (21,869 | ) |
11.91%2 | | 1-day BZDIOVER | | JPMorgan Chase Bank N.A. | | 1/04/16 | | | BRL | | | | 11,845 | | | | 31,825 | | | | (277 | ) | | | 32,102 | |
4.19%2 | | 28-day MXIBTIIE | | Deutsche Bank AG | | 12/16/16 | | | MXN | | | | 99,813 | | | | 7,479 | | | | (509 | ) | | | 7,988 | |
12.50%2 | | 1-day BZDIOVER | | Bank of America N.A. | | 1/02/17 | | | BRL | | | | 12,538 | | | | (40,793 | ) | | | (475 | ) | | | (40,318 | ) |
11.17%1 | | 1-day BZDIOVER | | Credit Suisse International | | 1/02/17 | | | BRL | | | | 12,812 | | | | 138,136 | | | | 233 | | | | 137,903 | |
12.18%1 | | 1-day BZDIOVER | | Deutsche Bank AG | | 1/02/17 | | | BRL | | | | 7,200 | | | | 31,740 | | | | 361 | | | | 31,379 | |
12.22%1 | | 1-day BZDIOVER | | Deutsche Bank AG | | 1/02/17 | | | BRL | | | | 3,929 | | | | 16,007 | | | | 204 | | | | 15,803 | |
See Consolidated Notes to Financial Statements.
| | | | | | |
| | | BLACKROCK BALANCED CAPITAL FUND, INC. | | MARCH 31, 2015 | | 73 |
| | | | |
| Consolidated Schedule of Investments (continued) | | | Master Total Return Portfolio | |
As of March 31, 2015, OTC interest rate swaps outstanding were as follows: (concluded)
| | | | | | | | | | | | | | | | | | | | | | | | | | |
Fixed Rate | | Floating Rate | | Counterparty | | Expiration
Date | | Notional Amount (000) | | | Value | | | Premiums
Paid
(Received) | | | Unrealized
Appreciation
(Depreciation) | |
13.11%2 | | 1-day BZDIOVER | | JPMorgan Chase Bank N.A. | | 1/02/17 | | | BRL | | | | 8,230 | | | $ | (5,786 | ) | | $ | (154 | ) | | $ | (5,632 | ) |
12.18%2 | | 1-day BZDIOVER | | JPMorgan Chase Bank N.A. | | 1/02/17 | | | BRL | | | | 8,211 | | | | (26,150 | ) | | | (237 | ) | | | (25,913 | ) |
4.35%1 | | 28-day MXIBTIIE | | Bank of America N.A. | | 11/17/17 | | | MXN | | | | 30,329 | | | | 8,962 | | | | 195 | | | | 8,767 | |
13.34%2 | | 1-day BZDIOVER | | Bank of America N.A. | | 1/02/18 | | | BRL | | | | 18,331 | | | | 22,648 | | | | (228 | ) | | | 22,876 | |
13.14%2 | | 1-day BZDIOVER | | Bank of America N.A. | | 1/02/18 | | | BRL | | | | 11,058 | | | | (7,433 | ) | | | (102 | ) | | | (7,331 | ) |
4.69%1 | | 28-day MXIBTIIE | | Bank of America N.A. | | 3/16/18 | | | MXN | | | | 40,270 | | | | (2,165 | ) | | | 305 | | | | (2,470 | ) |
4.55%1 | | 28-day MXIBTIIE | | Barclays Bank PLC | | 3/21/18 | | | MXN | | | | 39,525 | | | | 7,995 | | | | 551 | | | | 7,444 | |
4.57%1 | | 28-day MXIBTIIE | | Citibank N.A. | | 3/21/18 | | | MXN | | | | 39,525 | | | | 6,513 | | | | 560 | | | | 5,953 | |
4.85%1 | | 28-day MXIBTIIE | | Bank of America N.A. | | 11/01/18 | | | MXN | | | | 23,232 | | | | 3,604 | | | | 75 | | | | 3,529 | |
4.72%1 | | 28-day MXIBTIIE | | Citibank N.A. | | 11/14/18 | | | MXN | | | | 35,665 | | | | 15,520 | | | | 106 | | | | 15,414 | |
5.05%1 | | 28-day MXIBTIIE | | Citibank N.A. | | 11/15/19 | | | MXN | | | | 25,117 | | | | 6,252 | | | | 269 | | | | 5,983 | |
5.04%1 | | 28-day MXIBTIIE | | Bank of America N.A. | | 11/18/19 | | | MXN | | | | 23,840 | | | | 10,759 | | | | 85 | | | | 10,674 | |
4.81%2 | | 28-day MXIBTIIE | | Bank of America N.A. | | 1/28/20 | | | MXN | | | | 23,824 | | | | (29,543 | ) | | | — | | | | (29,543 | ) |
1.96%2 | | 3-month KRW
Certificate of
Deposit | | Citibank N.A. | | 1/30/20 | | | KRW | | | | 6,379,000 | | | | 36,530 | | | | 79 | | | | 36,451 | |
5.59%2 | | 28-day MXIBTIIE | | Goldman Sachs International | | 3/04/20 | | | MXN | | | | 95,557 | | | | 92,491 | | | | (389 | ) | | | 92,880 | |
5.42%2 | | 28-day MXIBTIIE | | Goldman Sachs International | | 3/06/20 | | | MXN | | | | 54,720 | | | | 25,463 | | | | (837 | ) | | | 26,300 | |
5.23%2 | | 28-day MXIBTIIE | | Bank of America N.A. | | 3/12/20 | | | MXN | | | | 72,977 | | | | (10,005 | ) | | | (252 | ) | | | (9,753 | ) |
5.21%2 | | 28-day MXIBTIIE | | Deutsche Bank AG | | 3/16/20 | | | MXN | | | | 83,955 | | | | (18,783 | ) | | | (298 | ) | | | (18,485 | ) |
12.97%2 | | 1-day BZDIOVER | | Bank of America N.A. | | 1/04/21 | | | BRL | | | | 9,908 | | | | 7,155 | | | | (16 | ) | | | 7,171 | |
11.41%1 | | 1-day BZDIOVER | | Bank of America N.A. | | 1/04/21 | | | BRL | | | | 4,756 | | | | 112,016 | | | | 120 | | | | 111,896 | |
12.05%2 | | 1-day BZDIOVER | | Bank of America N.A. | | 1/04/21 | | | BRL | | | | 2,974 | | | | (41,027 | ) | | | (29 | ) | | | (40,998 | ) |
11.84%2 | | 1-day BZDIOVER | | HSBC Bank PLC | | 1/04/21 | | | BRL | | | | 1,990 | | | | (34,619 | ) | | | (11 | ) | | | (34,608 | ) |
3.27%1 | | 3-month LIBOR | | Deutsche Bank AG | | 5/16/21 | | | USD | | | | 9,510 | | | | (988,407 | ) | | | — | | | | (988,407 | ) |
6.19%2 | | 28-day MXIBTIIE | | Goldman Sachs International | | 7/25/24 | | | MXN | | | | 23,177 | | | | 24,597 | | | | (142 | ) | | | 24,739 | |
6.37%2 | | 28-day MXIBTIIE | | JPMorgan Chase Bank N.A. | | 9/18/24 | | | MXN | | | | 17,946 | | | | 34,151 | | | | (114 | ) | | | 34,265 | |
2.54%2 | | 3-month KRW
Certificate of
Deposit | | Morgan Stanley Capital
Services LLC | | 11/13/24 | | | KRW | | | | 1,411,696 | | | | 59,686 | | | | — | | | | 59,686 | |
5.84%2 | | 28-day MXIBTIIE | | Deutsche Bank AG | | 11/14/24 | | | MXN | | | | 37,523 | | | | (27,604 | ) | | | (191 | ) | | | (27,413 | ) |
5.85%2 | | 28-day MXIBTIIE | | Deutsche Bank AG | | 11/14/24 | | | MXN | | | | 16,314 | | | | (11,362 | ) | | | (83 | ) | | | (11,279 | ) |
2.55%2 | | 3-month KRW
Certificate of
Deposit | | Deutsche Bank AG | | 11/20/24 | | | KRW | | | | 1,411,696 | | | | 58,478 | | | | (14 | ) | | | 58,492 | |
5.73%1 | | 28-day MXIBTIIE | | Bank of America N.A. | | 1/03/25 | | | MXN | | | | 23,376 | | | | 28,776 | | | | 324 | | | | 28,452 | |
5.55%2 | | 28-day MXIBTIIE | | Bank of America N.A. | | 1/13/25 | | | MXN | | | | 31,430 | | | | (67,589 | ) | | | (134 | ) | | | (67,455 | ) |
5.56%2 | | 28-day MXIBTIIE | | Goldman Sachs International | | 1/13/25 | | | MXN | | | | 45,012 | | | | (107,232 | ) | | | (193 | ) | | | (107,039 | ) |
2.24%2 | | 3-month KRW
Certificate of
Deposit | | Bank of America N.A. | | 1/15/25 | | | KRW | | | | 1,346,200 | | | | 22,616 | | | | (4 | ) | | | 22,620 | |
6.04%2 | | 28-day MXIBTIIE | | Bank of America N.A. | | 3/17/25 | | | MXN | | | | 21,288 | | | | 1,530 | | | | (107 | ) | | | 1,637 | |
6.04%2 | | 28-day MXIBTIIE | | Credit Suisse International | | 3/17/25 | | | MXN | | | | 14,192 | | | | 1,020 | | | | (71 | ) | | | 1,091 | |
7.48%2 | | 3-month JIBAR | | JPMorgan Chase Bank N.A. | | 3/25/25 | | | ZAR | | | | 52,535 | | | | (69,979 | ) | | | (333 | ) | | | (69,646 | ) |
Total | | | | | | | | | | | | | | | | $ | (712,219 | ) | | $ | 1,469 | | | $ | (713,688 | ) |
| | | | | | | | | | | | | | | | | | |
| | 1 | | Master Portfolio pays the fixed rate and receives the floating rate. |
| | 2 | | Master Portfolio pays the floating rate and receives the fixed rate. |
See Consolidated Notes to Financial Statements.
| | | | | | |
| 74 | | BLACKROCK BALANCED CAPITAL FUND, INC. | | MARCH 31, 2015 | | |
| | | | |
| Consolidated Schedule of Investments (continued) | | | Master Total Return Portfolio | |
| • | | As of March 31, 2015, OTC cross-currency swaps outstanding were as follows: |
| | | | | | | | | | | | | | | | | | | | | | | | | | | | | | | | | | |
| | | | | Notional Amount (000) | | | | | | | | | | | | | | |
| Fund Pays | | Fund Receives | | Fund Pays | | | Fund Receives | | | Counterparty | | Expiration
Date | | Value | | | Premiums
Received | | | Unrealized
Depreciation | |
3-month LIBOR | | 3-month EURIBOR
minus 0.315% | | | EUR | | | | 44,829 | | | | USD | | | | 49,872 | | | Credit Suisse
International | | 3/06/20 | | $ | (3,388,275 | ) | | $ | (62,167 | ) | | $ | (3,326,108 | ) |
3-month LIBOR | | 3-month EURIBOR
minus 0.33125% | | | EUR | | | | 29,351 | | | | USD | | | | 31,591 | | | Credit Suisse
International | | 4/02/20 | | | (36,967 | ) | | | (30,267 | ) | | | (6,700 | ) |
Total | | | | | | | | | | | | | | | | | | | | | | | | $ | (3,425,242 | ) | | $ | (92,434 | ) | | $ | (3,332,808 | ) |
| | | | | | | | | | | | | | | | | | | | | | | | | | |
| • | | As of March 31, 2015, OTC total return swaps outstanding were as follows: |
| | | | | | | | | | | | | | | | | | | | | | | | | | |
| Reference Entity | | Fixed Rate/ Floating Rate | | Counterparty | | Expiration
Date | | Notional
Amount/
Contract
Amount
(000)3 | | | Value | | | Premiums
Paid
(Received) | | | Unrealized
Appreciation
(Depreciation) | |
Telecom Italia SpA | | 3-month
EURIBOR minus
0.40%1 | | Citibank N.A. | | 5/04/15 | | | EUR | | | | 804 | | | $ | (131,807 | ) | | | — | | | $ | (131,807 | ) |
Telecom Italia SpA | | 3-month
EURIBOR minus
0.40%1 | | Citibank N.A. | | 5/07/15 | | | EUR | | | | 809 | | | | (132,672 | ) | | | — | | | | (132,672 | ) |
Volkswagen AG | | 3-month
EURIBOR minus
0.20%1 | | Bank of America N.A. | | 5/22/15 | | | EUR | | | | 3 | | | | (213,957 | ) | | | — | | | | (213,957 | ) |
Volkswagen AG | | 3-month
EURIBOR minus
0.40%1 | | Bank of America N.A. | | 5/22/15 | | | EUR | | | | 3 | | | | (212,534 | ) | | | — | | | | (212,534 | ) |
Telecom Italia SpA | | 3-month
EURIBOR minus
0.25%1 | | BNP Paribas S.A. | | 6/11/15 | | | EUR | | | | 112 | | | | (11,160 | ) | | | — | | | | (11,160 | ) |
Telecom Italia SpA | | 3-month
EURIBOR minus
0.25%1 | | BNP Paribas S.A. | | 6/12/15 | | | EUR | | | | 297 | | | | (29,385 | ) | | | — | | | | (29,385 | ) |
Repsol SA | | 0% Fixed1 | | Citibank N.A. | | 7/17/15 | | | EUR | | | | — | 3 | | | (727 | ) | | | — | | | | (727 | ) |
Repsol SA | | 3-month
EURIBOR minus
0.50%1 | | Citibank N.A. | | 7/17/15 | | | EUR | | | | 1 | | | | (24,902 | ) | | | — | | | | (24,902 | ) |
Telecom Italia SpA | | 3-month
EURIBOR minus
0.30%1 | | BNP Paribas S.A. | | 7/17/15 | | | EUR | | | | 1,047 | | | | (241,236 | ) | | | — | | | | (241,236 | ) |
Aperam SA | | 3-month
EURIBOR minus
0.25%1 | | BNP Paribas S.A. | | 9/18/15 | | | EUR | | | | 2 | | | | (26,650 | ) | | | — | | | | (26,650 | ) |
Aperam SA | | 3-month
EURIBOR minus
0.35%1 | | JPMorgan Chase Bank N.A. | | 9/30/15 | | | EUR | | | | 1 | | | | (7,693 | ) | | | — | | | | (7,693 | ) |
Telecom Italia SpA | | 3-month
EURIBOR minus
0.25%1 | | JPMorgan Chase Bank N.A. | | 11/10/15 | | | EUR | | | | 1,244 | | | | (316,453 | ) | | | — | | | | (316,453 | ) |
Telecom Italia SpA | | 3-month
EURIBOR minus
0.30%1 | | JPMorgan Chase Bank N.A. | | 11/10/15 | | | EUR | | | | 76 | | | | (14,894 | ) | | | — | | | | (14,894 | ) |
Bankia SA | | 3-month
EURIBOR minus
0.40%1 | | JPMorgan Chase Bank N.A. | | 11/12/15 | | | EUR | | | | 233 | | | | (18,084 | ) | | | — | | | | (18,084 | ) |
Bankia SA | | 3-month
EURIBOR minus
0.40%1 | | JPMorgan Chase Bank N.A. | | 11/12/15 | | | EUR | | | | 216 | | | | 12,918 | | | | — | | | | 12,918 | |
Bankia SA | | 3-month
EURIBOR minus
0.40%1 | | JPMorgan Chase Bank N.A. | | 11/12/15 | | | EUR | | | | 62 | | | | 4,788 | | | | — | | | | 4,788 | |
Bankia SA | | 3-month
EURIBOR minus
0.40%1 | | JPMorgan Chase Bank N.A. | | 11/12/15 | | | EUR | | | | 53 | | | | (3,043 | ) | | | — | | | | (3,043 | ) |
See Consolidated Notes to Financial Statements.
| | | | | | |
| | | BLACKROCK BALANCED CAPITAL FUND, INC. | | MARCH 31, 2015 | | 75 |
| | | | |
| Consolidated Schedule of Investments (continued) | | | Master Total Return Portfolio | |
As of March 31, 2015, OTC total return swaps outstanding were as follows: (continued)
| | | | | | | | | | | | | | | | | | | | | | | | | | |
| Reference Entity | | Fixed Rate/
Floating Rate | | Counterparty | | Expiration
Date | | Notional
Amount/
Contract
Amount
(000)3 | | | Value | | | Premiums
Paid
(Received) | | | Unrealized
Appreciation
(Depreciation) | |
Bankia SA | | 3-month
EURIBOR minus
0.40%1 | | JPMorgan Chase Bank N.A. | | 11/12/15 | | | EUR | | | | 41 | | | $ | (2,455 | ) | | | — | | | $ | (2,455 | ) |
Bankia SA | | 3-month
EURIBOR minus
0.40%1 | | JPMorgan Chase Bank N.A. | | 11/12/15 | | | EUR | | | | 24 | | | | 2,097 | | | | — | | | | 2,097 | |
Bankia SA | | 3-month
EURIBOR minus
0.40%1 | | JPMorgan Chase Bank N.A. | | 11/12/15 | | | EUR | | | | 20 | | | | 684 | | | | — | | | | 684 | |
Bankia SA | | 3-month
EURIBOR minus
0.40%1 | | JPMorgan Chase Bank N.A. | | 11/12/15 | | | EUR | | | | 16 | | | | 590 | | | | — | | | | 590 | |
Repsol SA | | 3-month
EURIBOR minus
0.20%1 | | Goldman Sachs
International | | 11/12/15 | | | EUR | | | | 51 | | | | 3,391 | | | | — | | | | 3,391 | |
Bankia SA | | 3-month
EURIBOR minus
0.50%1 | | JPMorgan Chase Bank N.A. | | 12/17/15 | | | EUR | | | | 146 | | | | (8,830 | ) | | | — | | | | (8,830 | ) |
Bankia SA | | 3-month
EURIBOR minus
0.50%1 | | JPMorgan Chase Bank N.A. | | 12/17/15 | | | EUR | | | | 74 | | | | (1,791 | ) | | | — | | | | (1,791 | ) |
Comcast Corp. | | 3-month LIBOR
minus 0.30%1 | | Bank of America N.A. | | 12/31/15 | | | USD | | | | 23 | | | | 24,709 | | | | — | | | | 24,709 | |
Banco Bilbao | | 1-month | | | | | | | | | | | | | | | | | | | | | | | | |
Vizcaya Argentaria SA | | EURIBOR minus
0.35%1 | | BNP Paribas S.A. | | 1/16/16 | | | EUR | | | | 49 | | | | (28,590 | ) | | | — | | | | (28,590 | ) |
Aperam SA | | 3-month
EURIBOR minus
0.50%1 | | JPMorgan Chase Bank N.A. | | 1/18/16 | | | EUR | | | | 6 | | | | (79,027 | ) | | | — | | | | (79,027 | ) |
Bankia SA | | 3-month
EURIBOR minus
0.35%1 | | BNP Paribas S.A. | | 1/18/16 | | | EUR | | | | 255 | | | | (33,677 | ) | | | — | | | | (33,677 | ) |
Repsol SA | | 3-month
EURIBOR minus
0.30%1 | | BNP Paribas S.A. | | 1/18/16 | | | EUR | | | | 1 | | | | (3,071 | ) | | | — | | | | (3,071 | ) |
Standard Chartered PLC | | 1-month LIBOR
minus 0.40%1 | | Goldman Sachs
International | | 1/18/16 | | | GBP | | | | 34 | | | | (101,291 | ) | | | — | | | | (101,291 | ) |
Volkswagen AG | | 3-month
EURIBOR minus
0.43%1 | | BNP Paribas S.A. | | 1/18/16 | | | EUR | | | | 3 | | | | (162,706 | ) | | | — | | | | (162,706 | ) |
Volkswagen AG | | 3-month
EURIBOR minus
0.43%1 | | BNP Paribas S.A. | | 1/18/16 | | | EUR | | | | 4 | | | | (152,060 | ) | | | — | | | | (152,060 | ) |
Freeport-McMoRan Copper & Gold, Inc. | | 3-month LIBOR
minus 0.30%1 | | Bank of America N.A. | | 1/29/16 | | | USD | | | | 33 | | | | (64,738 | ) | | | — | | | | (64,738 | ) |
Standard Chartered PLC | | 3-month LIBOR
minus 0.25%1 | | BNP Paribas S.A. | | 3/09/16 | | | GBP | | | | 32 | | | | (56,674 | ) | | | — | | | | (56,674 | ) |
Altice SA | | 3-month
EURIBOR minus
0.40%1 | | BNP Paribas S.A. | | 3/11/16 | | | EUR | | | | 5 | | | | (4,909 | ) | | | — | | | | (4,909 | ) |
Volkswagen AG | | 3-month
EURIBOR minus
0.10%1 | | JPMorgan Chase Bank N.A. | | 3/16/16 | | | EUR | | | | 9 | | | | (17,990 | ) | | | — | | | | (17,990 | ) |
Energy Select Sector SPDR Fund | | 3-month LIBOR
minus 0.20%1 | | Bank of America N.A. | | 3/19/16 | | | USD | | | | 12 | | | | (18,048 | ) | | | — | | | | (18,048 | ) |
Return on Markit IOS 6.00%, 30-year,fixed rate Fannie Mae | | 1-month LIBOR1 | | Deutsche Bank AG | | 1/12/39 | | | USD | | | | 843 | | | | (5,944 | ) | | $ | 686 | | | | (6,630 | ) |
See Consolidated Notes to Financial Statements.
| | | | | | |
| 76 | | BLACKROCK BALANCED CAPITAL FUND, INC. | | MARCH 31, 2015 | | |
| | | | |
| Consolidated Schedule of Investments (continued) | | | Master Total Return Portfolio | |
As of March 31, 2015, OTC total return swaps outstanding were as follows: (concluded)
| | | | | | | | | | | | | | | | | | | | | | | | | | |
| Reference Entity | | Fixed Rate/
Floating Rate | | Counterparty | | Expiration
Date | | Notional
Amount/
Contract
Amount (000)3 | | | Value | | | Premiums
Paid
(Received) | | | Unrealized
Appreciation
(Depreciation) | |
Return on Markit IOS 6.00%, 30-year, fixed rate Fannie Mae | | 1-month LIBOR1 | | Deutsche Bank AG | | 1/12/39 | | | USD | | | | 587 | | | $ | (4,139 | ) | | $ | 5,542 | | | $ | (9,681 | ) |
Return on Markit IOS 4.50%, 30-year, fixed rate Fannie Mae | | 1-month LIBOR2 | | Citibank N.A. | | 1/12/41 | | | USD | | | | 1,347 | | | | (15,774 | ) | | | (13,625 | ) | | | (2,149 | ) |
Return on Markit IOS 4.50%, 30-year, fixed rate Fannie Mae | | 1-month LIBOR2 | | Credit Suisse
International | | 1/12/41 | | | USD | | | | 1,383 | | | | (16,189 | ) | | | (11,905 | ) | | | (4,284 | ) |
Return on Markit IOS 4.50%, 30-year, fixed rate Fannie Mae | | 1-month LIBOR2 | | Credit Suisse
International | | 1/12/41 | | | USD | | | | 1,347 | | | | (15,773 | ) | | | (20,521 | ) | | | 4,748 | |
Return on Markit IOS 4.50%, 30-year, fixed rate Fannie Mae | | 1-month LIBOR2 | | Credit Suisse
International | | 1/12/41 | | | USD | | | | 1,347 | | | | (16,970 | ) | | | (17,146 | ) | | | 176 | |
Return on Markit IOS 4.50%, 30-year, fixed rate Fannie Mae | | 1-month LIBOR2 | | Credit Suisse
International | | 1/12/41 | | | USD | | | | 1,347 | | | | (15,773 | ) | | | (7,556 | ) | | | (8,217 | ) |
Return on Markit IOS 4.50%, 30-year, fixed rate Fannie Mae | | 1-month LIBOR2 | | Credit Suisse
International | | 1/12/41 | | | USD | | | | 1,312 | | | | (15,359 | ) | | | 15,012 | | | | (30,371 | ) |
Return on Markit IOS 4.50%, 30-year, fixed rate Fannie Mae | | 1-month LIBOR2 | | Credit Suisse
International | | 1/12/41 | | | USD | | | | 1,312 | | | | (15,358 | ) | | | 17,231 | | | | (32,589 | ) |
Return on Markit IOS 4.00%, 30-year, fixed rate Fannie Mae | | 1-month LIBOR2 | | Credit Suisse
International | | 1/12/45 | | | USD | | | | 2,664 | | | | (48,116 | ) | | | (21,963 | ) | | | (26,153 | ) |
Return on Markit IOS 4.00%, 30-year, fixed rate Fannie Mae | | 1-month LIBOR2 | | Credit Suisse
International | | 1/12/45 | | | USD | | | | 1,400 | | | | (23,229 | ) | | | (25,070 | ) | | | 1,841 | |
Return on Markit IOS 4.00%, 30-year, fixed rate Fannie Mae | | 1-month LIBOR2 | | Goldman Sachs
Bank USA | | 1/12/45 | | | USD | | | | 1,400 | | | | (23,228 | ) | | | (10,603 | ) | | | (12,625 | ) |
Total | | | | | | | | | | | | | | | | $ | (2,287,729 | ) | | $ | (89,918 | ) | | $ | (2,197,811 | ) |
| | | | | | | | | | | | | | | | | | |
| | 1 | | Master Portfolio pays the total return of the reference entity and receives the floating rate. |
| | 2 | | Master Portfolio pays the floating rate and receives the total return of the reference entity. |
| | 3 | | Amount is less than 500. |
| • | | Fair Value Measurements — Various inputs are used in determining the fair value of investments and derivative financial instruments. These inputs to valuation techniques are categorized into a disclosure hierarchy consisting of three broad levels for financial statement purposes. The hierarchy gives the highest priority to unadjusted quoted prices in active markets for identical assets or liabilities (Level 1 measurements) and the lowest priority to unobservable inputs (Level 3 measurements). Accordingly, the degree of judgment exercised in determining fair value is greatest for instruments categorized in Level 3. The inputs used to measure fair value may fall into different levels of the fair value hierarchy. In such cases, for disclosure purposes, the fair value hierarchy classification is determined based on the lowest level input that is significant to the fair value measurement in its entirety. The categorization of a value determined for investments and derivative financial instruments is based on the pricing transparency of the investment and derivative financial instrument and is not necessarily an indication of the risks associated with investing in those securities. The three levels of the fair value hierarchy are as follows: |
| | • | | Level 1 — unadjusted quoted prices in active markets/exchanges for identical assets or liabilities that the Fund has the ability to access |
| | • | | Level 2 — other observable inputs (including, but not limited to, quoted prices for similar assets or liabilities in markets that are active, quoted prices for identical or similar assets or liabilities in markets that are not active, inputs other than quoted prices that are observable for the assets or liabilities (such as interest rates, yield curves, volatilities, prepayment speeds, loss severities, credit risks and default rates) or other market–corroborated inputs) |
| | • | | Level 3 — unobservable inputs based on the best information available in the circumstances, to the extent observable inputs are not available (including the Master Portfolio’s own assumptions used in determining the fair value of investments and derivative financial instruments) |
See Consolidated Notes to Financial Statements.
| | | | | | |
| | | BLACKROCK BALANCED CAPITAL FUND, INC. | | MARCH 31, 2015 | | 77 |
| | | | |
| Consolidated Schedule of Investments (continued) | | | Master Total Return Portfolio | |
Changes in valuation techniques may result in transfers into or out of an assigned level within the disclosure hierarchy. In accordance with the Master Portfolio’s policy, transfers between different levels of the fair value disclosure hierarchy are deemed to have occurred as of the beginning of the reporting period. For information about the Master Portfolio’s policy regarding valuation of investments and derivative financial instruments, please refer to Note 2 of the Notes to Consolidated Financial Statements.
The following tables summarize the Master Portfolio’s investments and derivative financial instruments categorized in the disclosure hierarchy as of March 31, 2015:
| | | | | | | | | | | | | | | | | | | | |
| | | Level 1 | | Level 2 | | Level 3 | | Total |
Assets: | | | | | | | | | | | | | | | | | | | | |
Investments: | | | | | | | | | | | | | | | | | | | | |
Long-Term Investments: | | | | | | | | | | | | | | | | | | | | |
Asset-Backed Securities | | | | — | | | | $ | 669,463,998 | | | | $ | 128,643,690 | | | | $ | 798,107,688 | |
Common Stocks | | | $ | 15,288,328 | | | | | 6,737,459 | | | | | — | | | | | 22,025,787 | |
Corporate Bonds | | | | — | | | | | 1,928,159,323 | | | | | 1,218,057 | | | | | 1,929,377,380 | |
Floating Rate Loan Interests | | | | — | | | | | 92,473,172 | | | | | 2,134,116 | | | | | 94,607,288 | |
Foreign Agency Obligations | | | | — | | | | | 31,495,535 | | | | | — | | | | | 31,495,535 | |
Foreign Government Obligations | | | | — | | | | | 207,360,204 | | | | | — | | | | | 207,360,204 | |
Non-Agency Mortgage-Backed Securities | | | | — | | | | | 481,586,242 | | | | | 81,230,345 | | | | | 562,816,587 | |
Other Interests | | | | — | | | | | 1 | | | | | — | | | | | 1 | |
Preferred Securities | | | | 20,109,818 | | | | | 82,093,991 | | | | | 1,810,268 | | | | | 104,014,077 | |
Taxable Municipal Bonds | | | | — | | | | | 352,675,723 | | | | | — | | | | | 352,675,723 | |
U.S. Government Sponsored Agency Securities | | | | — | | | | | 4,755,499,327 | | | | | 6,581,324 | | | | | 4,762,080,651 | |
U.S. Treasury Obligations | | | | — | | | | | 1,935,107,660 | | | | | — | | | | | 1,935,107,660 | |
Short-Term Securities: | | | | | | | | | | | | | | | | | | | | |
Borrowed Bond Agreements | | | | — | | | | | 108,012,651 | | | | | — | | | | | 108,012,651 | |
Mutual Funds | | | | 12,866,608 | | | | | — | | | | | — | | | | | 12,866,608 | |
Options Purchased: | | | | | | | | | | | | | | | | | | | | |
Equity Contracts | | | | 2,524,515 | | | | | 605,560 | | | | | — | | | | | 3,130,075 | |
Foreign Currency Exchange Contracts | | | | — | | | | | 14,462,647 | | | | | — | | | | | 14,462,647 | |
Interest Rate Contracts | | | | 520,688 | | | | | 13,910,599 | | | | | — | | | | | 14,431,287 | |
Liabilities: | | | | | | | | | | | | | | | | | | | | |
Investments in Securities: | | | | | | | | | | | | | | | | | | | | |
TBA Sale Commitments | | | | — | | | | | (2,743,317,272 | ) | | | | — | | | | | (2,743,317,272 | ) |
Borrowed Bonds | | | | — | | | | | (107,810,829 | ) | | | | — | | | | | (107,810,829 | ) |
| | | | | |
Total | | | $ | 51,309,957 | | | | $ | 7,828,515,991 | | | | $ | 221,617,800 | | | | $ | 8,101,443,748 | |
| | | | | |
| | | | | | | | | | | | | | | | | | | | |
| | | Level 1 | | Level 2 | | Level 3 | | Total |
Derivative Financial Instruments1 | | | | | | | | | | | | | | | | | | | | |
Assets: | | | | | | | | | | | | | | | | | | | | |
Credit contracts | | | | — | | | | $ | 4,730,368 | | | | | — | | | | $ | 4,730,368 | |
Equity contracts | | | $ | 178,872 | | | | | 49,177 | | | | | — | | | | | 228,049 | |
Foreign currency exchange contracts | | | | — | | | | | 48,673,794 | | | | | — | | | | | 48,673,794 | |
Interest rate contracts | | | | 4,471,032 | | | | | 1,481,899 | | | | | — | | | | | 5,952,931 | |
Liabilities: | | | | | | | | | | | | | | | | | | | | |
Credit contracts | | | | — | | | | | (6,530,841 | ) | | | | — | | | | | (6,530,841 | ) |
Equity contracts | | | | (853,280 | ) | | | | (2,121,054 | ) | | | | — | | | | | (2,974,334 | ) |
Foreign currency exchange contracts | | | | (122,124 | ) | | | | (26,711,695 | ) | | | | — | | | | | (26,833,819 | ) |
Interest rate contracts | | | | (4,946,132 | ) | | | | (21,671,113 | ) | | | | — | | | | | (26,617,245 | ) |
| | | | | |
Total | | | $ | (1,271,632 | ) | | | $ | (2,099,465 | ) | | | | — | | | | $ | (3,371,097 | ) |
| | | | | |
1 Derivative financial instruments are swaps, financial futures contracts, forward foreign currency exchange contracts and options written. Swaps, financial futures contracts and forward foreign currency exchange contracts are valued at the unrealized appreciation/depreciation on the instrument and options written are shown at value. | |
See Consolidated Notes to Financial Statements.
| | | | | | |
| 78 | | BLACKROCK BALANCED CAPITAL FUND, INC. | | MARCH 31, 2015 | | |
| | | | |
| Consolidated Schedule of Investments (concluded) | | | Master Total Return Portfolio | |
The carrying amount or face value, including accrued interest, for certain of the Master Portfolio’s assets and/or liabilities approximates fair value for financial reporting purposes. As of March 31, 2015, such assets and/or liabilities are categorized within the disclosure hierarchy as follows:
| | | | | | | | | | | | | | | | | | | | |
| | | Level 1 | | Level 2 | | Level 3 | | Total |
Assets: | | | | | | | | | | | | | | | | | | | | |
Cash | | | $ | 14,890,057 | | | | | — | | | | | — | | | | $ | 14,890,057 | |
Foreign currency at value | | | | 15,292,816 | | | | | — | | | | | — | | | | | 15,292,816 | |
Cash pledged for financial futures contracts | | | | 9,256,000 | | | | | — | | | | | — | | | | | 9,256,000 | |
Cash pledged as collateral for OTC derivatives | | | | 3,550,000 | | | | | — | | | | | — | | | | | 3,550,000 | |
Cash pledged for centrally cleared swaps | | | | 9,830,000 | | | | | — | | | | | — | | | | | 9,830,000 | |
Liabilities: | | | | | | | | | | | | | | | | | | | | |
Reverse repurchase agreements | | | | — | | | | $ | (1,116,862,197 | ) | | | | — | | | | | (1,116,862,197 | ) |
Cash received as collateral for OTC derivatives | | | | — | | | | | (2,900,000 | ) | | | | — | | | | | (2,900,000 | ) |
Cash received as collateral for TBA commitments | | | | — | | | | | (2,497,000 | ) | | | | — | | | | | (2,497,000 | ) |
Total | | | $ | 52,818,873 | | | | $ | (1,122,259,197 | ) | | | | — | | | | $ | (1,069,440,324 | ) |
| | | | | |
There were no transfers between Level 1 and Level 2 during the year ended March 31, 2015.
A reconciliation of Level 3 investments is presented when the Master Portfolio had a significant amount of Level 3 investments at the beginning and/or end of the period in relation to net assets. The following table is a reconciliation of Level 3 investments for which significant unobservable inputs were used in determining fair value:
| | | | | | | | | | | | | | | | | | | | | | | | | | | | | | | | |
| | | Asset-Backed
Securities | | | Corporate
Bonds | | | Floating Rate
Loan Interests | | | Non-Agency
Mortgage-Backed
Securities | | | Other
Interests | | | Preferred
Securities | | | U.S. Government
Sponsored
Agency Securities | | | Total | |
Assets: | | | | | | | | | | | | | | | | | | | | | | | | | | | | | | | | |
Opening Balance, as of September 30, 2014 | | $ | 33,947,846 | | | | — | | | $ | 9,752,869 | | | $ | 22,024,354 | | | $ | 1 | | | $ | 2,346,986 | | | | — | | | $ | 68,072,056 | |
Transfers into Level 3 | | | 39,230,940 | | | | — | | | | — | | | | — | | | | — | | | | — | | | | — | | | | 39,230,940 | |
Transfers out of Level 31 | | | (11,500,099 | ) | | | — | | | | — | | | | (12,831 | ) | | | (1 | ) | | | — | | | | — | | | | (11,512,931 | ) |
Accrued discounts/premiums | | | 19,137 | | | $ | 3,754 | | | | 3,073 | | | | 21,738 | | | | — | | | | — | | | $ | (960 | ) | | | 46,742 | |
Net realized gain (loss) | | | 6,902 | | | | 11,462 | | | | 2,761 | | | | 59,984 | | | | — | | | | — | | | | — | | | | 81,109 | |
Net change in unrealized appreciation/depreciation2,3 | | | (851,215 | ) | | | (139,561 | ) | | | (182,461 | ) | | | (195,970 | ) | | | — | | | | (536,718 | ) | | | 12,866 | | | | (1,893,059 | ) |
Purchases | | | 81,560,866 | | | | 1,520,444 | | | | — | | | | 66,044,450 | | | | — | | | | — | | | | 6,569,418 | | | | 155,695,178 | |
Sales | | | (13,770,687 | ) | | | (178,042 | ) | | | (7,442,126 | ) | | | (6,711,380 | ) | | | — | | | | — | | | | — | | | | (28,102,235 | ) |
Closing Balance, as of March 31, 2015 | | $ | 128,643,690 | | | $ | 1,218,057 | | | $ | 2,134,116 | | | $ | 81,230,345 | | | | — | | | $ | 1,810,268 | | | $ | 6,581,324 | | | $ | 221,617,800 | |
Net change in unrealized appreciation/depreciation on investments still held at March 31, 20153 | | $ | (850,568 | ) | | $ | (139,561 | ) | | $ | (4,721 | ) | | $ | (196,883 | ) | | | — | | | $ | (536,718 | ) | | $ | 12,866 | | | $ | (1,715,585 | ) |
| | 1 | | As of September 30, 2014, the Master Portfolio used significant unobservable inputs in determining the value of certain investments. As of March 31, 2015, the Master Portfolio used observable inputs in determining the value of the same investments. As a result, investments with a beginning of period value of $11,512,931 transferred from Level 3 to Level 2 in the disclosure hierarchy. |
| | 2 | | Included in the related net change in unrealized appreciation/depreciation in the Consolidated Statement of Operations. |
| | 3 | | Any difference between Net change in unrealized appreciation/depreciation and Net change in unrealized appreciation/depreciation on investments still held at March 31, 2015 is generally due to investments no longer held or categorized as Level 3 at period end. |
The Master Portfolio’s investments that are categorized as Level 3 were valued utilizing third party pricing information without adjustment. Such valuations are based on unobservable inputs. A significant change in third party information could result in a significantly lower or higher value in such Level 3 investments.
See Consolidated Notes to Financial Statements.
| | | | | | |
| | | BLACKROCK BALANCED CAPITAL FUND, INC. | | MARCH 31, 2015 | | 79 |
| | | | |
| Consolidated Statement of Assets and Liabilities | | | Master Total Return Portfolio | |
| | | | |
| March 31, 2015 (Unaudited) | | | |
| | | | |
| Assets | | | | |
Investments at value — unaffiliated (cost — $10,880,051,897) | | $ | 10,939,698,152 | |
Investments at value — affiliated (cost — $12,873,806) | | | 12,873,697 | |
Cash | | | 14,890,057 | |
Cash pledged as collateral for OTC derivatives | | | 3,550,000 | |
Cash pledged for centrally cleared swaps | | | 9,830,000 | |
Cash pledged for financial futures contracts | | | 9,256,000 | |
Foreign currency at value (cost — $15,360,411) | | | 15,292,816 | |
Variation margin receivable on financial futures contracts | | | 1,026,438 | |
Variation margin receivable on centrally cleared swaps | | | 916,707 | |
Investments sold receivable | | | 153,113,081 | |
Swaps receivable | | | 151,439 | |
TBA sale commitments receivable | | | 2,731,349,440 | |
Swap premiums paid | | | 4,936,427 | |
Interest rate floors premiums paid | | | 2,609,173 | |
Unrealized appreciation on forward foreign currency exchange contracts | | | 48,673,794 | |
Unrealized appreciation on OTC swaps | | | 5,275,857 | |
Unrealized appreciation on interest rate floors | | | 448,382 | |
Contributions receivable from investors | | | 11,371,464 | |
Interest receivable | | | 34,663,441 | |
Dividends receivable — unaffiliated | | | 29,613 | |
Prepaid expenses | | | 17,933 | |
Other assets | | | 1,599 | |
| | | | |
Total assets | | | 13,999,975,510 | |
| | | | |
| | | | |
| Liabilities | | | | |
Options written at value (premiums received — $20,097,434) | | | 24,917,981 | |
Borrowed bonds at value (proceeds — $107,498,813) | | | 107,810,829 | |
TBA sale commitments at value (proceeds — $2,731,349,440) | | | 2,743,317,272 | |
Reverse repurchase agreements | | | 1,116,862,197 | |
Cash received as collateral for OTC derivatives | | | 2,900,000 | |
Cash received as collateral for TBA commitments | | | 2,497,000 | |
Variation margin payable on financial futures contracts | | | 842,495 | |
Investments purchased payable | | | 3,313,529,470 | |
Swaps payable | | | 239,103 | |
Swap premiums received | | | 7,696,216 | |
Interest rate floors premiums received | | | 711,593 | |
Unrealized depreciation on forward foreign currency exchange contracts | | | 16,515,512 | |
Unrealized depreciation on OTC swaps | | | 13,734,904 | |
Unrealized depreciation on interest rate floors | | | 1,156,723 | |
Interest expense payable | | | 912,269 | |
Investment advisory fees payable | | | 319,466 | |
Professional fees payable | | | 29,483 | |
Directors’ fees payable | | | 10,048 | |
Other affiliates payable | | | 17,103 | |
Other accrued expenses payable | | | 258,982 | |
| | | | |
Total liabilities | | | 7,354,278,646 | |
| | | | |
Net Assets | | $ | 6,645,696,864 | |
| | | | |
| | | | |
| Net Assets Consist of | | | | |
Investors’ capital | | $ | 6,583,100,733 | |
Net unrealized appreciation/depreciation | | | 62,596,131 | |
| | | | |
Net Assets | | $ | 6,645,696,864 | |
| | | | |
See Notes to Consolidated Financial Statements.
| | | | | | |
| 80 | | BLACKROCK BALANCED CAPITAL FUND, INC. | | MARCH 31, 2015 | | |
| | | | |
| Consolidated Statement of Operations | | | Master Total Return Portfolio | |
| | | | |
| Six Months Ended March 31, 2015 (Unaudited) | | | |
| | | | |
| Investment Income | | | | |
Interest — unaffiliated | | $ | 83,724,414 | |
Dividends — unaffiliated | | | 647,696 | |
Dividends — affiliated | | | 8,560 | |
Interest — affiliated | | | 48 | |
Foreign taxes withheld | | | (6,501 | ) |
| | | | |
Total income | | | 84,374,217 | |
| | | | |
| | | | |
| Expenses | | | | |
Investment advisory | | | 1,622,767 | |
Accounting services | | | 271,596 | |
Custodian | | | 257,467 | |
Professional | | | 78,533 | |
Directors | | | 31,712 | |
Printing | | | 3,797 | |
Miscellaneous | | | 80,697 | |
| | | | |
Total expenses excluding interest expense | | | 2,346,569 | |
Interest expense | | | 773,093 | |
| | | | |
Total expenses | | | 3,119,662 | |
Less fees waived by Manager | | | (9,851 | ) |
| | | | |
Total expenses after fees waived | | | 3,109,811 | |
| | | | |
Net investment income | | | 81,264,406 | |
| | | | |
| | | | |
| Realized and Unrealized Gain (Loss) | | | | |
Net realized gain (loss) from: | | | | |
Investments — unaffiliated | | | 53,469,386 | |
Investments — affiliated | | | 1,154 | |
Options written and structured options | | | 637,531 | |
Financial futures contracts | | | 5,780,960 | |
Swaps | | | (6,399,229 | ) |
Foreign currency transactions | | | 69,736,738 | |
Borrowed bonds | | | (815,355 | ) |
| | | | |
| | | 122,411,185 | |
| | | | |
Net change in unrealized appreciation/depreciation on: | | | | |
Investments — unaffiliated | | | 10,820,325 | |
Investments — affiliated | | | 41 | |
Options written and structured options | | | 3,688,465 | |
Financial futures contracts | | | 360,922 | |
Interest rate floors | | | (708,341 | ) |
Swaps | | | (6,407,582 | ) |
Foreign currency translations | | | 2,062,368 | |
Short Sales | | | (3,215 | ) |
Unfunded floating rate loan interests | | | 134,852 | |
Borrowed bonds | | | 1,130,384 | |
| | | | |
| | | 11,078,219 | |
| | | | |
Total realized and unrealized gain | | | 133,489,404 | |
| | | | |
Net Increase in Net Assets Resulting from Operations | | $ | 214,753,810 | |
| | | | |
See Notes to Consolidated Financial Statements.
| | | | | | |
| | | BLACKROCK BALANCED CAPITAL FUND, INC. | | MARCH 31, 2015 | | 81 |
| | | | |
| Consolidated Statements of Changes in Net Assets | | | Master Total Return Portfolio | |
| | | | | | | | |
| Increase (Decrease) in Net Assets: | | Six Months Ended March 31, 2015 (Unaudited) | | | Year Ended
September 30, 2014 | |
| | | | | | | | |
| Operations | | | | | | | | |
Net investment income | | $ | 81,264,406 | | | $ | 134,783,460 | |
Net realized gain | | | 122,411,185 | | | | 77,891,869 | |
Net change in unrealized appreciation/depreciation | | | 11,078,219 | | | | 18,644,434 | |
| | | | |
Net increase in net assets resulting from operations | | | 214,753,810 | | | | 231,319,763 | |
| | | | |
| | | | | | | | |
| Capital Transactions | | | | | | | | |
Proceeds from contributions | | | 3,716,964,451 | 1 | | | 1,051,326,985 | |
Value of withdrawals | | | (717,790,793 | ) | | | (1,182,035,050 | ) |
| | | | |
Net decrease in net assets derived from capital transactions | | | 2,999,173,658 | | | | (130,708,065 | ) |
| | | | |
| | | | | | | | |
| Net Assets | | | | | | | | |
Total increase in net assets | | | 3,213,927,468 | | | | 100,611,698 | |
Beginning of period | | | 3,431,769,396 | | | | 3,331,157,698 | |
| | | | |
End of period | | $ | 6,645,696,864 | | | $ | 3,431,769,396 | |
| | | | |
| | 1 | | Includes reimbursement from affiliate relating to processing errors. |
See Notes to Consolidated Financial Statements.
| | | | | | |
| 82 | | BLACKROCK BALANCED CAPITAL FUND, INC. | | MARCH 31, 2015 | | |
| | | | |
| Financial Highlights | | | Master Total Return Portfolio | |
| | | | | | | | | | | | | | | | | | | | | | | | |
| | | Six Months Ended
March 31,
20151
(Unaudited) | | | Year Ended September 30, | |
| | | 20141 | | | 20131 | | | 20121 | | | 2011 | | | 2010 | |
| Total Return | | | | | | | | | | | | | | | | | | | | | | | | |
Total return | | | 4.23 | %2 | | | 7.15 | % | | | 1.30 | % | | | 10.04 | % | | | 2.82 | % | | | 13.05 | % |
| | | | |
| | | | | | | | | | | | | | | | | | | | | | | | |
| Ratios to Average Net Assets | | | | | | | | | | | | | | | | | | | | | | | | |
Total expenses | | | 0.12 | %3 | | | 0.25 | % | | | 0.32 | % | | | 0.29 | % | | | 0.56 | % | | | 0.58 | % |
| | | | |
Total expenses after fees waived and paid indirectly | | | 0.12 | %3 | | | 0.25 | % | | | 0.32 | % | | | 0.29 | % | | | 0.56 | % | | | 0.58 | % |
| | | | |
Total expenses after fees waived and paid indirectly and excluding interest expense | | | 0.09 | %3 | | | 0.14 | % | | | 0.12 | % | | | 0.12 | % | | | 0.11 | % | | | 0.13 | % |
| | | | |
Net investment income | | | 3.06 | %3 | | | 4.03 | % | | | 3.59 | % | | | 4.20 | % | | | 4.67 | % | | | 4.97 | % |
| | | | |
| | | | | | | | | | | | | | | | | | | | | | | | |
| Supplemental Data | | | | | | | | | | | | | | | | | | | | | | | | |
Net assets, end of period (000) | | $ | 6,645,697 | | | $ | 3,431,769 | | | $ | 3,331,158 | | | $ | 3,470,151 | | | $ | 3,899,364 | | | $ | 3,591,890 | |
| | | | |
Portfolio turnover rate4 | | | 529 | % | | | 750 | % | | | 777 | % | | | 1,346 | % | | | 1,771 | % | | | 1,754 | % |
| | | | |
| | 1 | | Consolidated Financial Highlights. |
| | 2 | | Aggregate total return. |
| | 4 | | Includes mortgage dollar roll transactions. Additional information regarding portfolio turnover rate is as follows: |
| | | | | | | | | | | | | | | | | | | | | | | | | | | | | | | | | | |
| | | Six Months Ended
March 31,
2015 (Unaudited) | | | | | Year Ended September 30, | |
| | | | 2014 | | | | | 2013 | | | | | 2012 | | | | | 2011 | | | | | 2010 | |
Portfolio turnover rate (excluding mortgage dollar roll transactions) | | | 468 | % | | | | | 529 | % | | | | | 450 | % | | | | | 752 | % | | | | | 1,379 | % | | | | | 1,248% | |
See Notes to Consolidated Financial Statements.
| | | | | | |
| | | BLACKROCK BALANCED CAPITAL FUND, INC. | | MARCH 31, 2015 | | 83 |
| | | | |
| Notes to Consolidated Financial Statements (Unaudited) | | | Master Total Return Portfolio | |
1. Organization:
Master Total Return Portfolio (the “Master Portfolio”), a series of Master Bond LLC (the “Master LLC”), is registered under the Investment Company Act of 1940, as amended (the “1940 Act”), as a diversified, open-end management investment company. The Master LLC is organized as a Delaware limited liability company. The Limited Liability Company Agreement of the Master LLC permits the Board of Directors of the Master LLC (the “Board”) to issue nontransferable interests in the Master LLC, subject to certain limitations.
Basis of Consolidation: The accompanying consolidated financial statements include the accounts of BlackRock Cayman Master Total Return Portfolio I, Ltd. (the “Subsidiary”), which is a wholly owned subsidiary of the Master Portfolio and primarily invests in commodity-related instruments. The Subsidiary enables the Master Portfolio to hold these commodity-related instruments while allowing its investors to satisfy regulated investment company tax requirements. The Master Portfolio may invest up to 25% of its total assets in the Subsidiary. Intercompany accounts and transactions, if any, have been eliminated. The Subsidiary is subject to the same investment policies and restrictions that apply to the Master Portfolio, except that the Subsidiary may invest without limitation in commodity-related instruments.
2. Significant Accounting Policies:
The Master Portfolio’s consolidated financial statements are prepared in conformity with accounting principles generally accepted in the United States of America (“U.S. GAAP”), which may require management to make estimates and assumptions that affect the reported amounts of assets and liabilities in the consolidated financial statements and the reported amounts of increases and decreases in net assets from operations during the reporting period. Actual results could differ from those estimates. The Master Portfolio is considered an investment company under U.S. GAAP and follows the accounting and reporting guidance applicable to investment companies. The following is a summary of significant accounting policies followed by the Master Portfolio:
Valuation: The Master Portfolio investments are valued at fair value as of the close of trading on the New York Stock Exchange (“NYSE”) (generally 4:00 p.m., Eastern time). U.S. GAAP defines fair value as the price the Master Portfolio would receive to sell an asset or pay to transfer a liability in an orderly transaction between market participants at the measurement date. The Master Portfolio determines the fair values of its financial instruments at market value using independent dealers or pricing services under policies approved by the Board. The BlackRock Global Valuation Methodologies Committee (the “Global Valuation Committee”) is the committee formed by management to develop global pricing policies and procedures and to provide oversight of the pricing function for the Master Portfolio for all financial instruments.
Bond investments are valued on the basis of last available bid prices or current market quotations provided by dealers or pricing services. Floating rate loan interests are valued at the mean of the bid prices from one or more brokers or dealers as obtained from a pricing service. In determining the value of a particular investment, pricing services may use certain information with respect to transactions in such investments, quotations from dealers, pricing matrixes, market transactions in comparable investments, various relationships observed in the market between investments and calculated yield measures. Asset-backed and mortgage-backed securities are valued by independent pricing services using models that consider estimated cash flows of each tranche of the security, establish a benchmark yield and develop an estimated tranche specific spread to the benchmark yield based on the unique attributes of the tranche. Financial futures contracts traded on exchanges are valued at their last sale price. To-be-announced (“TBA”) commitments are valued on the basis of last available bid prices or current market quotations provided by pricing services. Swap agreements are valued utilizing quotes received daily by the Master Portfolio’s pricing service or through brokers, which are derived using daily swap curves and models that incorporate a number of market data factors, such as discounted cash flows, trades and values of the underlying reference instruments. Certain centrally cleared swaps are valued at the price determined by the relevant exchange or clearinghouse. Investments in open-end registered investment companies are valued at NAV each business day. Short-term securities with remaining maturities of 60 days or less may be valued at amortized cost, which approximates fair value.
Municipal investments (including commitments to purchase such investments on a “when-issued” basis) are valued on the basis of prices provided by dealers or pricing services. In determining the value of a particular investment, pricing services may use certain information with respect to transactions in such investments, quotations from dealers, pricing matrixes, market transactions in comparable investments and information with respect to various relationships between investments.
Equity investments traded on a recognized securities exchange are valued at the official close price each day, if available. For equity investments traded on more than one exchange, the official close price on the exchange where the stock is primarily traded is used. Equity investments traded on a recognized exchange for which there were no sales on that day may be valued at the last available bid (long positions) or ask (short positions) price.
Securities and other assets and liabilities denominated in foreign currencies are translated into U.S. dollars using exchange rates determined as of the close of business on the NYSE. Forward foreign currency exchange contracts are valued at the mean between the bid and ask prices and are determined as of the close of business on the NYSE. Interpolated values are derived when the settlement date of the contract is an interim date for which quotations are not available.
| | | | | | |
| 84 | | BLACKROCK BALANCED CAPITAL FUND, INC. | | MARCH 31, 2015 | | |
| | | | |
| Notes to Consolidated Financial Statements (continued) | | | Master Total Return Portfolio | |
Exchange-traded options are valued at the mean between the last bid and ask prices at the close of the options market in which the options trade. An exchange-traded option for which there is no mean price is valued at the last bid (long positions) or ask (short positions) price. If no bid or ask price is available, the prior day’s price will be used, unless it is determined that the prior day’s price no longer reflects the fair value of the option. Over-the-counter (“OTC”) options and options on swaps (“swaptions”) are valued by an independent pricing service using a mathematical model, which incorporates a number of market data factors, such as the trades and prices of the underlying instruments.
In the event that the application of these methods of valuation results in a price for an investment that is deemed not to be representative of the market value of such investment, or if a price is not available, the investment will be valued by the Global Valuation Committee, or its delegate, in accordance with a policy approved by the Board as reflecting fair value (“Fair Value Investments”). When determining the price for Fair Value Investments, the Global Valuation Committee, or its delegate, seeks to determine the price that the Master Portfolio might reasonably expect to receive or pay from the current sale or purchase of that asset or liability in an arm’s-length transaction. Fair value determinations shall be based upon all available factors that the Global Valuation Committee, or its delegate, deems relevant consistent with the principles of fair value measurement, which include the market approach, income approach and/or in the case of recent investments, the cost approach, as appropriate. The market approach generally consists of using comparable market transactions. The income approach generally is used to discount future cash flows to present value and is adjusted for liquidity as appropriate. These factors include but are not limited to: (i) attributes specific to the investment or asset; (ii) the principal market for the investment or asset; (iii) the customary participants in the principal market for the investment or asset; (iv) data assumptions by market participants for the investment or asset, if reasonably available; (v) quoted prices for similar investments or assets in active markets; and (vi) other factors, such as future cash flows, interest rates, yield curves, volatilities, prepayment speeds, loss severities, credit risks, recovery rates, liquidation amounts and/or default rates. Due to the inherent uncertainty of valuations of such investments, the fair values may differ from the values that would have been used had an active market existed. The Global Valuation Committee, or its delegate, employs various methods for calibrating valuation approaches for investments where an active market does not exist, including regular due diligence of the Master Portfolio’s pricing vendors, regular reviews of key inputs and assumptions, transactional back-testing or disposition analysis to compare unrealized gains and losses to realized gains and losses, reviews of missing or stale prices and large movements in market values and reviews of any market related activity. The pricing of all Fair Value Investments is subsequently reported to the Board or a committee thereof on a quarterly basis.
Generally, trading in foreign instruments is substantially completed each day at various times prior to the close of business on the NYSE. Occasionally, events affecting the values of such instruments may occur between the foreign market close and the close of business on the NYSE that may not be reflected in the computation of the Fund’s net assets. If events (e.g., a company announcement, market volatility or a natural disaster) occur during such periods that are expected to materially affect the value of such instruments, those instruments may be Fair Value Investments and be valued at their fair value, as determined in good faith by the Global Valuation Committee, or its delegate, using a pricing service and/or policies approved by the Board. Each business day, the Fund uses a pricing service to assist with the valuation of certain foreign exchange-traded equity securities and foreign exchange-traded and OTC options (the “Systematic Fair Value Price”). Using current market factors, the Systematic Fair Value Price is designed to value such foreign securities and foreign options at fair value as of the close of business on the NYSE, which follows the close of the local markets.
Foreign Currency: The Master Portfolio’s books and records are maintained in U.S. dollars. Purchases and sales of investment securities are recorded at the rates of exchange prevailing on the respective dates of such transactions. Generally, when the U.S. dollar rises in value against a foreign currency, the Master Portfolio’s investments denominated in that currency will lose value because that currency is worth fewer U.S. dollars; the opposite effect occurs if the U.S. dollar falls in relative value.
The Master Portfolio does not isolate the portion of the results of operations arising as a result of changes in the foreign exchange rates from the changes in the market prices of investments held or sold for financial reporting purposes. Accordingly, the effects of changes in foreign currency exchange rates on investments are not segregated in the Consolidated Statement of Operations from the effects of changes in market prices of those investments, but are included as a component of net realized and unrealized gain (loss) from investments. The Master Portfolio reports realized currency gains (losses) on foreign currency related transactions as components of net realized gain (loss) for financial reporting purposes, whereas such components are generally treated as ordinary income for federal income tax purposes.
The Master Portfolio does not isolate the portion of the results of operations arising as a result of changes in the foreign exchange rates from the changes in the market prices of investments held or sold for financial reporting purposes. Accordingly, the effects of changes in foreign currency exchange rates on investments are not segregated in the Consolidated Statement of Operations from the effects of changes in market prices of those investments, but are included as a component of net realized and unrealized gain (loss) from investments. The Master Portfolio reports realized currency gains (losses) on foreign currency related transactions as components of net realized gain (loss) for financial reporting purposes, whereas such components are generally treated as ordinary income for federal income tax purposes. The Master Portfolio has elected to treat realized gains (losses) from certain foreign currency exchange contracts as capital gain (loss) for federal income tax purposes.
Segregation and Collateralization: In cases where the Master Portfolio enters into certain investments (e.g., dollar rolls, TBA sale commitments, financial futures contracts, forward foreign currency exchange contracts, options written, swaps, short sales and structured options), or certain borrowings (e.g., reverse repurchase transactions and treasury roll transactions) that would be “senior securities” for 1940 Act purposes, the Master Portfolio may
| | | | | | |
| | | BLACKROCK BALANCED CAPITAL FUND, INC. | | MARCH 31, 2015 | | 85 |
| | | | |
| Notes to Consolidated Financial Statements (continued) | | | Master Total Return Portfolio | |
segregate or designate on its books and records cash or liquid securities having a market value at least equal to the amount of the Master Portfolio’s future obligations under such investments or borrowings. Doing so allows the investment or borrowing to be excluded from treatment as a “senior security.” Furthermore, if required by an exchange or counterparty agreement, the Master Portfolio may be required to deliver/deposit cash and/or securities to/with an exchange, or broker-dealer or custodian as collateral for certain investments or obligations.
Investment Transactions and Investment Income: For financial reporting purposes, investment transactions are recorded on the dates the transactions are entered into (the trade dates). Realized gains and losses on investment transactions are determined on the identified cost basis. Dividend income is recorded on the ex-dividend date. Dividends from foreign securities where the ex-dividend date may have passed are subsequently recorded when the Master Portfolio is informed of the ex-dividend date. Under the applicable foreign tax laws, a withholding tax at various rates may be imposed on capital gains, dividends and interest. Upon notification from issuers, some of the dividend income received from a real estate investment trust may be redesignated as a reduction of cost of the related investment and/or realized gain. Interest income, including amortization and accretion of premiums and discounts on debt securities, is recognized on the accrual basis. Income, expenses and realized and unrealized gains and losses are allocated daily to each class based on its relative net assets.
Recent Accounting Standard: In June 2014, the Financial Accounting Standards Board issued guidance to improve the financial reporting of reverse repurchase agreements and other similar transactions. The guidance will require expanded disclosure for entities that enter into reverse repurchase agreements and similar transactions accounted for as secured borrowings. It is effective for financial statements with fiscal years beginning on or after December 15, 2014 and for interim periods beginning after March 31, 2015. Management is evaluating the impact, if any, of this guidance on the Master Portfolio’s financial statement disclosures.
Other: Expenses directly related to the Master Portfolio are charged to the Master Portfolio. Other operating expenses shared by several funds are prorated among those funds on the basis of relative net assets or other appropriate methods.
The Master Portfolio has an arrangement with its custodian whereby fees may be reduced by credits earned on uninvested cash balances, which, if applicable, are shown as fees paid indirectly in the Consolidated Statement of Operations. The custodian imposes fees on overdrawn cash balances, which can be offset by accumulated credits earned or may result in additional custody charges.
3. Securities and Other Investments:
Asset-Backed and Mortgage-Backed Securities: The Master Portfolio may invest in asset-backed securities. Asset-backed securities are generally issued as pass-through certificates, which represent undivided fractional ownership interests in an underlying pool of assets, or as debt instruments, which are also known as collateralized obligations, and are generally issued as the debt of a special purpose entity organized solely for the purpose of owning such assets and issuing such debt. Asset-backed securities are often backed by a pool of assets representing the obligations of a number of different parties. The yield characteristics of certain asset-backed securities may differ from traditional debt securities. One such major difference is that all or a principal part of the obligations may be prepaid at any time because the underlying assets (i.e., loans) may be prepaid at any time. As a result, a decrease in interest rates in the market may result in increases in the level of prepayments as borrowers, particularly mortgagors, refinance and repay their loans. An increased prepayment rate with respect to an asset-backed security subject to such a prepayment feature will have the effect of shortening the maturity of the security. In addition, the Master Portfolio may subsequently have to reinvest the proceeds at lower interest rates. If the Master Portfolio has purchased such an asset-backed security at a premium, a faster than anticipated prepayment rate could result in a loss of principal to the extent of the premium paid.
The Master Portfolio may purchase certain mortgage pass-through securities. There are a number of important differences among the agencies and instrumentalities of the U.S. Government that issue mortgage-related securities and among the securities that they issue. For example, mortgage-related securities guaranteed by Ginnie Mae are guaranteed as to the timely payment of principal and interest by Ginnie Mae and such guarantee is backed by the full faith and credit of the United States. However, mortgage-related securities issued by Freddie Mac and Fannie Mae, including Freddie Mac and Fannie Mae guaranteed mortgage pass-through certificates, which are solely the obligations of Freddie Mac and Fannie Mae, are not backed by or entitled to the full faith and credit of the United States, but are supported by the right of the issuer to borrow from the U.S. Treasury.
Collateralized Debt Obligations: The Master Portfolio may invest in collateralized debt obligations (“CDOs”), which include collateralized bond obligations (“CBOs”) and collateralized loan obligations (“CLOs”). CBOs and CLOs are types of asset-backed securities. A CDO is an entity that is backed by a diversified pool of debt securities (CBOs) or syndicated bank loans (CLOs). The cash flows of the CDO can be split into multiple segments, called “tranches,” which will vary in risk profile and yield. The riskiest segment is the subordinated or “equity” tranche. This tranche bears the greatest risk of defaults from the underlying assets in the CDO and serves to protect the other, more senior, tranches from default in all but the most severe circumstances. Since it is shielded from defaults by the more junior tranches, a “senior” tranche will typically have higher credit ratings and lower yields than their underlying securities, and often receive investment grade ratings from one or more of the nationally recognized rating agencies. Despite the protection from the more junior tranches, senior tranches can experience substantial losses due to actual defaults, increased sensitivity to future defaults and the disappearance of one or more protecting tranches as a result of changes in the credit profile of the underlying pool of assets.
| | | | | | |
| 86 | | BLACKROCK BALANCED CAPITAL FUND, INC. | | MARCH 31, 2015 | | |
| | | | |
| Notes to Consolidated Financial Statements (continued) | | | Master Total Return Portfolio | |
Inflation-Indexed Bonds: The Master Portfolio may invest in inflation-indexed bonds. Inflation-indexed bonds are fixed income securities whose principal value is periodically adjusted according to the rate of inflation. If the index measuring inflation rises or falls, the principal value of inflation-indexed bonds will be adjusted upward or downward, and consequently the interest payable on these securities (calculated with respect to a larger or smaller principal amount) will be increased or reduced, respectively. Any upward or downward adjustment in the principal amount of an inflation-indexed bond will be included as interest income in the Consolidated Statement of Operations, even though investors do not receive their principal until maturity. Repayment of the original bond principal upon maturity (as adjusted for inflation) is guaranteed in the case of U.S. Treasury inflation-indexed bonds. For bonds that do not provide a similar guarantee, the adjusted principal value of the bond repaid at maturity may be less than the original principal.
Multiple Class Pass-Through Securities: The Master Portfolio may invest in multiple class pass-through securities, including collateralized mortgage obligations (“CMOs”) and commercial mortgage-backed securities. These multiple class securities may be issued by Ginnie Mae, U.S. Government agencies or instrumentalities or by trusts formed by private originators of, or investors in, mortgage loans. In general, CMOs are debt obligations of a legal entity that are collateralized by, and multiple class pass-through securities represent direct ownership interests in, a pool of residential or commercial mortgage loans or mortgage pass-through securities (the “Mortgage Assets”), the payments on which are used to make payments on the CMOs or multiple pass-through securities. Classes of CMOs include interest only (“IOs”), principal only (“POs”), planned amortization classes and targeted amortization classes. IOs and POs are stripped mortgage-backed securities representing interests in a pool of mortgages, the cash flow from which has been separated into interest and principal components. IOs receive the interest portion of the cash flow while POs receive the principal portion. IOs and POs can be extremely volatile in response to changes in interest rates. As interest rates rise and fall, the value of IOs tends to move in the same direction as interest rates. POs perform best when prepayments on the underlying mortgages rise since this increases the rate at which the principal is returned and the yield to maturity on the PO. When payments on mortgages underlying a PO are slower than anticipated, the life of the PO is lengthened and the yield to maturity is reduced. If the underlying Mortgage Assets experience greater than anticipated pre-payments of principal, the Master Portfolio may not fully recoup its initial investment in IOs.
Stripped Mortgage-Backed Securities: The Master Portfolio may invest in stripped mortgage-backed securities issued by the U.S. Government, its agencies and instrumentalities. Stripped mortgage-backed securities are usually structured with two classes that receive different proportions of the interest (IOs) and principal (POs) distributions on a pool of Mortgage Assets. The Master Portfolio also may invest in stripped mortgage-backed securities that are privately issued.
Zero-Coupon Bonds: The Master Portfolio may invest in zero-coupon bonds, which are normally issued at a significant discount from face value and do not provide for periodic interest payments. Zero-coupon bonds may experience greater volatility in market value than other debt obligations of similar maturity which provide for regular interest payments.
Capital Trusts and Trust Preferred Securities: The Master Portfolio may invest in capital trusts and/or trust preferred securities. These securities are typically issued by corporations, generally in the form of interest bearing notes with preferred securities characteristics, or by an affiliated business trust of a corporation, generally in the form of beneficial interests in subordinated debentures or similarly structured securities. The securities can be structured as either fixed or adjustable coupon securities that can have either a perpetual or stated maturity date. For trust preferred securities, the issuing bank or corporation will pay interest to the trust, which will then be distributed to holders of the trust preferred securities as a dividend. Dividends can be deferred without creating an event of default or acceleration, although maturity cannot take place unless all cumulative payment obligations have been met. The deferral of payments does not affect the purchase or sale of these securities in the open market. Payments on these securities are treated as interest rather than dividends for federal income tax purposes. These securities generally are rated below that of the issuing company’s senior debt securities and are freely callable at the issuer’s option.
Preferred Stock: The Master Portfolio may invest in preferred stock. Preferred stock has a preference over common stock in liquidation (and generally in receiving dividends as well) but is subordinated to the liabilities of the issuer in all respects. As a general rule, the market value of preferred stock with a fixed dividend rate and no conversion element varies inversely with interest rates and perceived credit risk, while the market price of convertible preferred stock generally also reflects some element of conversion value. Because preferred stock is junior to debt securities and other obligations of the issuer, deterioration in the credit quality of the issuer will cause greater changes in the value of a preferred stock than in a more senior debt security with similar stated yield characteristics. Unlike interest payments on debt securities, preferred stock dividends are payable only if declared by the issuer’s board of directors. Preferred stock also may be subject to optional or mandatory redemption provisions.
Floating Rate Loan Interests: The Master Portfolio may invest in floating rate loan interests. The floating rate loan interests held by the Master Portfolio are typically issued to companies (the “borrower”) by banks, other financial institutions, and privately and publicly offered corporations (the “lender”). Floating rate loan interests are generally non-investment grade, often involve borrowers whose financial condition is troubled or uncertain and companies that are highly leveraged. The Master Portfolio may invest in obligations of borrowers who are in bankruptcy proceedings. Floating rate loan interests may include fully funded term loans or revolving lines of credit. Floating rate loan interests are typically senior in the corporate capital structure of the borrower. Floating rate loan interests generally pay interest at rates that are periodically determined by reference to a base lending rate plus a premium. The base lending rates are generally the lending rate offered by one or more European banks, such as the London Interbank Offered Rate (“LIBOR”), the prime rate offered by one or more U.S. banks or the certificate of deposit rate. Floating rate loan interests may involve foreign borrowers,
| | | | | | |
| | | BLACKROCK BALANCED CAPITAL FUND, INC. | | MARCH 31, 2015 | | 87 |
| | | | |
| Notes to Consolidated Financial Statements (continued) | | | Master Total Return Portfolio | |
and investments may be denominated in foreign currencies. The Master Portfolio considers these investments to be investments in debt securities for purposes of its investment policies.
When the Master Portfolio purchases a floating rate loan interest it may receive a facility fee and when it sells a floating rate loan interest it may pay a facility fee. On an ongoing basis, the Master Portfolio may receive a commitment fee based on the undrawn portion of the underlying line of credit amount of a floating rate loan interest. Facility and commitment fees are typically amortized to income over the term of the loan or term of the commitment, respectively. Consent and amendment fees are recorded to income as earned. Prepayment penalty fees, which may be received by the Master Portfolio upon the prepayment of a floating rate loan interest by a borrower, are recorded as realized gains. The Master Portfolio may invest in multiple series or tranches of a loan. A different series or tranche may have varying terms and carry different associated risks.
Floating rate loan interests are usually freely callable at the borrower’s option. The Master Portfolio may invest in such loans in the form of participations in loans (“Participations”) or assignments (“Assignments”) of all or a portion of loans from third parties. Participations typically will result in the Master Portfolio having a contractual relationship only with the lender, not with the borrower. The Master Portfolio will have the right to receive payments of principal, interest and any fees to which it is entitled only from the lender selling the Participation and only upon receipt by the lender of the payments from the borrower. In connection with purchasing Participations, the Master Portfolio generally will have no right to enforce compliance by the borrower with the terms of the loan agreement, nor any rights of offset against the borrower, and the Master Portfolio may not benefit directly from any collateral supporting the loan in which it has purchased the Participation. As a result, the Master Portfolio will assume the credit risk of both the borrower and the lender that is selling the Participation. The Master Portfolio’s investment in loan participation interests involves the risk of insolvency of the financial intermediaries who are parties to the transactions. In the event of the insolvency of the lender selling the Participation, the Master Portfolio may be treated as a general creditor of the lender and may not benefit from any offset between the lender and the borrower. Assignments typically result in the Master Portfolio having a direct contractual relationship with the borrower, and the Master Portfolio may enforce compliance by the borrower with the terms of the loan agreement.
Forward Commitments and When-Issued Delayed Delivery Securities: The Master Portfolio may purchase securities on a when-issued basis and may purchase or sell securities on a forward commitment basis. Settlement of such transactions normally occurs within a month or more after the purchase or sale commitment is made. The Master Portfolio may purchase securities under such conditions with the intention of actually acquiring them, but may enter into a separate agreement to sell the securities before the settlement date. Since the value of securities purchased may fluctuate prior to settlement, the Master Portfolio may be required to pay more at settlement than the security is worth. In addition, the Master Portfolio is not entitled to any of the interest earned prior to settlement. When purchasing a security on a delayed delivery basis, the Master Portfolio assumes the rights and risks of ownership of the security, including the risk of price and yield fluctuations. In the event of default by the counterparty, the Master Portfolio’s maximum amount of loss is the unrealized appreciation of unsettled when-issued transactions, which is shown in the Consolidated Schedule of Investments.
TBA Commitments: The Master Portfolio may enter into TBA commitments. TBA commitments are forward agreements for the purchase or sale of mortgage-backed securities for a fixed price, with payment and delivery on an agreed upon future settlement date. The specific securities to be delivered are not identified at the trade date. However, delivered securities must meet specified terms, including issuer, rate and mortgage terms. When entering into TBA commitments, the Master Portfolio may take possession of or deliver the underlying mortgage-backed securities but can extend the settlement or roll the transaction. TBA commitments involve a risk of loss if the value of the security to be purchased or sold declines or increases, respectively, prior to settlement date.
In order to better define contractual rights and to secure rights that will help the Master Portfolio mitigate its counterparty risk, TBA commitments may be entered into by the Master Portfolio under Master Securities Forward Transaction Agreements (each, an “MSFTA”). An MSFTA typically contains, among other things, collateral posting terms and netting provisions in the event of default and/or termination. The collateral requirements are typically calculated by netting the mark to market amount for each transaction under such agreement and comparing that amount to the value of the collateral currently pledged by the Master Portfolio and the counterparty. Cash collateral that has been pledged to cover the obligations of the Master Portfolio and cash collateral received from the counterparty, if any, is reported separately on the Consolidated Statement of Assets and Liabilities as cash pledged as collateral for TBA commitments or cash received as collateral for TBA commitments, respectively. Non-cash collateral pledged by the Master Portfolio, if any, is noted in the Consolidated Schedule of Investments. Typically, the Master Portfolio is permitted to sell, repledge or use the collateral they receive; however, the counterparty is not permitted to do so. To the extent amounts due to the Master Portfolio are not fully collateralized, contractually or otherwise, the Master Portfolio bears the risk of loss from counterparty non-performance.
Mortgage Dollar Roll Transactions: The Master Portfolio may sell TBA mortgage-backed securities and simultaneously contract to repurchase substantially similar (i.e., same type, coupon and maturity) securities on a specific future date at an agreed upon price. During the period between the sale and repurchase, the Master Portfolio will not be entitled to receive interest and principal payments on the securities sold. The Master Portfolio accounts for mortgage dollar roll transactions as purchases and sales and realizes gains and losses on these transactions. These transactions may increase the Master Portfolio’s portfolio turnover rate. Mortgage dollar rolls involve the risk that the market value of the securities that the Master Portfolio is required to purchase may decline below the agreed upon repurchase price of those securities.
| | | | | | |
| 88 | | BLACKROCK BALANCED CAPITAL FUND, INC. | | MARCH 31, 2015 | | |
| | | | |
| Notes to Consolidated Financial Statements (continued) | | | Master Total Return Portfolio | |
Borrowed Bond Agreements: The Master Portfolio may enter into borrowed bond agreements. In a borrowed bond agreement, the Master Portfolio borrows a bond from a counterparty in exchange for cash collateral. The borrowed bond agreement contains a commitment that the security and the cash will be returned to the counterparty and the Master Portfolio at a mutually agreed upon date. Certain agreements have no stated maturity and can be terminated by either party at any time. Borrowed bond agreements are entered into primarily in connection with short sales of bonds. Earnings on cash collateral and compensation to the lender of the bond are based on agreed upon rates between the Master Portfolio and the counterparty. The value of the underlying cash collateral approximates the market value and accrued interest of the borrowed bond. To the extent that a borrowed bond transaction exceeds one business day, the value of the cash collateral in the possession of the counterparty is monitored on a daily basis to ensure the adequacy of the collateral. As the market value of the borrowed bond changes, the cash collateral is periodically increased or decreased with a frequency and in amounts prescribed in the borrowed bond agreement. Full realization of the collateral by the Master Portfolio may be limited if the value of an investment purchased with the cash collateral by the lender decreases. The Master Portfolio may also experience delays in gaining access to the collateral.
Reverse Repurchase Agreements: The Master Portfolio may enter into reverse repurchase agreements with qualified third party broker-dealers. In a reverse repurchase agreement, the Master Portfolio sells securities to a bank or broker-dealer and agrees to repurchase the same securities at a mutually agreed upon date and price. During the term of the reverse repurchase agreement, the Master Portfolio continues to receive the principal and interest payments on the securities sold. Certain agreements have no stated maturity and can be terminated by either party at any time. Interest on the value of the reverse repurchase agreements issued and outstanding is based upon competitive market rates determined at the time of issuance. The Master Portfolio may utilize reverse repurchase agreements when it is anticipated that the interest income to be earned from the investment of the proceeds of the transaction is greater than the interest expense of the transaction. Reverse repurchase agreements involve leverage risk and also the risk that the market value of the securities to be repurchased may decline below the repurchase price.
For financial reporting purposes, cash received in exchange for securities delivered plus accrued interest due to the counterparty is recorded as a liability in the Consolidated Statement of Assets and Liabilities at face value including accrued interest. Due to the short-term nature of the reverse repurchase agreements, face value approximates fair value. Interest payments made by the Master Portfolio to the counterparties are recorded as a component of interest expense in the Consolidated Statement of Operations. In periods of increased demand for the security, the Master Portfolio may receive a fee for use of the security by the counterparty, which may result in interest income to the Master Portfolio.
Treasury Roll Transactions: The Master Portfolio may enter into treasury roll transactions. In a treasury roll transaction, the Master Portfolio sells a Treasury security to a counterparty with a simultaneous agreement to repurchase the same security at an agreed upon price and future settlement date. The Master Portfolio receives cash from the sale of the Treasury security to use for other investment purposes. The difference between the sale price and repurchase price represents net interest income or net interest expense reflective of an agreed upon rate between the Master Portfolio and the counterparty over the term of the borrowing. For U.S. GAAP purposes, a treasury roll transaction is accounted for as a secured borrowing and not as a purchase or sale. During the term of the borrowing, interest income from the Treasury security and the related interest expense on the secured borrowing is recorded by the Master Portfolio on an accrual basis. The Master Portfolio will benefit from the transaction if the income earned on the investment purchased with the cash received in the treasury roll transaction exceeds the interest expense incurred by the Master Portfolio. If the interest expense exceeds the income earned, the Master Portfolio’s net investment income may be adversely impacted. Treasury roll transactions involve the risk that the market value of the securities that the Master Portfolio is required to repurchase may decline below the agreed upon repurchase price of those securities.
For the six months ended March 31, 2015, the average amount of reverse repurchase agreements and treasury roll transactions outstanding and the daily weighted average interest rate for the Master Portfolio were $854,685,244 and (0.16)%, respectively.
Reverse repurchase transactions, borrowed bond agreements and treasury roll transactions are entered into by the Master Portfolio under Master Repurchase Agreements (each, an “MRA”), which permit the Master Portfolio, under certain circumstances, including an event of default (such as bankruptcy or insolvency), to offset payables and/or receivables under the MRA with collateral held and/or posted to the counterparty and create one single net payment due to or from the Master Portfolio. With reverse repurchase transactions, borrowed bond agreements and treasury roll transactions, typically the Master Portfolio and the counterparties are permitted to sell, re-pledge, or use the collateral associated with the transaction. Bankruptcy or insolvency laws of a particular jurisdiction may impose restrictions on or prohibitions against such a right of offset in the event of the MRA counterparty’s bankruptcy or insolvency. Pursuant to the terms of the MRA, the Master Portfolio receives or posts securities as collateral with a market value in excess of the repurchase price to be paid or received by the Master Portfolio upon the maturity of the transaction. Upon a bankruptcy or insolvency of the MRA counterparty, the Master Portfolio is considered an unsecured creditor with respect to excess collateral and, as such, the return of excess collateral may be delayed.
| | | | | | |
| | | BLACKROCK BALANCED CAPITAL FUND, INC. | | MARCH 31, 2015 | | 89 |
| | | | |
| Notes to Consolidated Financial Statements (continued) | | | Master Total Return Portfolio | |
As of March 31, 2015, the following table is a summary of the Master Portfolio’s open borrowed bond agreements and reverse repurchase agreements by counterparty which are subject to offset under an MRA on a net basis:
| | | | | | | | | | | | | | | | | | | | | | | | | | | | | | | | |
| Counterparty | | Borrowed
Bond
Agreements1 | | | Reverse
Repurchase
Agreements | | | Borrowed
Bonds
at Value
Including
Accrued
Interest2 | | | Exposure
Due (to)/from
Counterparty
Before
Collateral | | | Non-cash
Collateral
Received3 | | | Non-cash
Collateral
Pledged3 | | | Net Collateral
(Received)/
Pledged | | | Net Exposure
Due (to)/from
Counterparty4 | |
Bank of Montreal | | | ��� | | | $ | (249,689,164 | ) | | | — | | | $ | (249,689,164 | ) | | $ | (150,767 | ) | | $ | 249,729,987 | | | $ | 249,579,220 | | | $ | (109,944 | ) |
Barclays Bank PLC | | $ | 3,626,200 | | | | — | | | $ | (3,699,509 | ) | | | (73,309 | ) | | | — | | | | — | | | | — | | | | (73,309 | ) |
Barclays Capital, Inc. | | | 5,778,820 | | | | (1,228,109 | ) | | | (5,669,778 | ) | | | (1,119,067 | ) | | | — | | | | 1,119,067 | | | | 1,119,067 | | | | — | |
Citigroup Global Markets, Inc. | | | 52,280,672 | | | | — | | | | (52,557,434 | ) | | | (276,762 | ) | | | — | | | | 43,408 | | | | 43,408 | | | | (233,354 | ) |
Credit Suisse Securities (USA) LLC | | | — | | | | (66,705,117 | ) | | | — | | | | (66,705,117 | ) | | | — | | | | 66,705,117 | | | | 66,705,117 | | | | — | |
Deutsche Bank Securities, Inc. | | | 21,803,538 | | | | (7,971,273 | ) | | | (22,130,091 | ) | | | (8,297,826 | ) | | | — | | | | 8,257,532 | | | | 8,257,532 | | | | (40,294 | ) |
J.P. Morgan Securities LLC | | | 18,444,994 | | | | (451,689,006 | ) | | | (18,588,332 | ) | | | (451,832,344 | ) | | | — | | | | 451,832,344 | | | | 451,832,344 | | | | — | |
JPMorgan Chase Bank N.A. | | | 1,511,492 | | | | — | | | | (1,495,044 | ) | | | 16,448 | | | | — | | | | — | | | | — | | | | 16,448 | 5 |
Merrill Lynch, Pierce, Fenner & Smith, Inc. | | | — | | | | (339,579,528 | ) | | | — | | | | (339,579,528 | ) | | | — | | | | 339,579,528 | | | | 339,579,528 | | | | — | |
RBC Capital Markets, LLC | | | 4,566,935 | | | | — | | | | (4,582,910 | ) | | | (15,975 | ) | | | — | | | | 15,975 | | | | 15,975 | | | | — | |
| | | | |
Total | | $ | 108,012,651 | | | $ | (1,116,862,197 | ) | | $ | (108,723,098 | ) | | $ | (1,117,572,644 | ) | | $ | (150,767 | ) | | $ | 1,117,282,958 | | | $ | 1,117,132,191 | | | $ | (440,453 | ) |
| | | | |
| | 1 | | Included in Investments at value-unaffiliated in the Consolidated Statement of Assets and Liabilities. |
| | 2 | | Includes accrued interest on borrowed bonds in the amount of $912,269 which is included in interest expense payable in the Consolidated Statement of Assets and Liabilities. |
| | 3 | | Net collateral with a value of $1,118,343,609 has been pledged/received in connection with open reverse repurchase agreements. Excess of net collateral pledged to the individual counterparty is not shown for financial reporting purposes. |
| | 4 | | Net exposure represents the net receivable (payable) that would be due from/to the counterparty in the event of default. |
| | 5 | | Net receivable is subject to set-off provision with net payable under the ISDA Master Agreement. |
When the Master Portfolio enters into an MRA and an ISDA and/or MSLA with the same counterparty, the agreements may contain a set-off provision allowing the Master Portfolio to offset a net amount payable with a net amount receivable upon default of the counterparty. Bankruptcy or insolvency laws of a particular jurisdiction may restrict or prohibit the right of offset in bankruptcy, insolvency or other events. For example, regardless of the contractual rights included in an MRA, such laws may prohibit the Master Portfolio from setting off amounts owed to a defaulting counterparty under an MRA against amounts owed to the Master Portfolio by affiliates of the defaulting counterparty. However, the insolvency regimes of many jurisdictions generally permit set-off of simultaneous payables and receivables with the same legal entity under certain types of financial contracts. These rules would apply upon a default of the legal entity, regardless of the existence of a contractual set-off right in those contracts.
In the event the counterparty of securities under an MRA files for bankruptcy or becomes insolvent, the Master Portfolio’s use of the proceeds from the agreement may be restricted while the counterparty, or its trustee or receiver, determines whether or not to enforce the Master Portfolio’s obligation to repurchase the securities.
Short Sales: The Master Portfolio may enter into short sale transactions in which the Master Portfolio sells a security it does not hold in anticipation of a decline in the market price of that security. When the Master Portfolio makes a short sale, it will borrow the security sold short (borrowed bond) and deliver the security to the counterparty to which it sold the security short. An amount equal to the proceeds received by the Master Portfolio is reflected as an asset and an equivalent liability. The amount of the liability is subsequently marked-to-market to reflect the market value of the short sale. The Master Portfolio is required to repay the counterparty interest on the security sold short, which is shown as interest expense in the Consolidated Statement of Operations. The Master Portfolio is exposed to market risk based on the amount, if any, that the market value of the security increases beyond the market value at which the position was sold. Thus, a short sale of a security involves the risk that instead of declining, the price of the security sold short will rise. The short sale of securities involves the possibility of a theoretically unlimited loss since there is a theoretically unlimited potential for the market price of the security sold short to increase. A gain, limited to the price at which the Master Portfolio sold the security short, or a loss, unlimited as to the dollar amount, will be recognized upon the termination of a short sale if the market price is either less than or greater than the proceeds originally received. There is no assurance that the Master Portfolio will be able to close out a short position at a particular time or at an acceptable price.
4. Derivative Financial Instruments:
The Master Portfolio engages in various portfolio investment strategies using derivative contracts both to increase the returns of the Master Portfolio and/or to economically manage its exposure to certain risks such as credit risk, equity risk, interest rate risk, foreign currency exchange rate risk or other risk (e.g. inflation risk). These contracts may be transacted on an exchange or OTC.
| | | | | | |
| 90 | | BLACKROCK BALANCED CAPITAL FUND, INC. | | MARCH 31, 2015 | | |
| | | | |
| Notes to Consolidated Financial Statements (continued) | | | Master Total Return Portfolio | |
Financial Futures Contracts: The Master Portfolio invests in long and/or short positions in financial futures contracts and options on financial futures contracts and options on financial futures contracts to gain exposure to, or economically hedge against, changes in interest rates (interest rate risk), changes in the value of equity securities (equity risk) or foreign currencies (foreign currency exchange rate risk). Financial futures contracts are agreements between the Master Portfolio and a counterparty to buy or sell a specific quantity of an underlying instrument at a specified price and at a specified date. Depending on the terms of the particular contract, financial futures contracts are settled either through physical delivery of the underlying instrument on the settlement date or by payment of a cash settlement amount on the settlement date.
Upon entering into a financial futures contract, the Master Portfolio is required to deposit initial margin with the broker in the form of cash or securities in an amount that varies depending on a contract’s size and risk profile. The initial margin deposit must then be maintained at an established level over the life of the contract. Securities deposited as initial margin are designated on the Consolidated Schedule of Investments and cash deposited, if any, is recorded on the Consolidated Statement of Assets and Liabilities as cash pledged for financial futures contracts. Pursuant to the contract, the Master Portfolio agrees to receive from or pay to the broker an amount of cash equal to the daily fluctuation in value of the contract. Such receipts or payments are known as variation margin. Variation margin is recorded by the Master Portfolio as unrealized appreciation or depreciation and, if applicable, as a receivable or payable for variation margin in the Consolidated Statement of Assets and Liabilities.
When the contract is closed, the Master Portfolio records a realized gain or loss equal to the difference between the value of the contract at the time it was opened and the value at the time it was closed. The use of financial futures contracts involves the risk of an imperfect correlation in the movements in the price of financial futures contracts, interest or foreign currency exchange rates and the underlying assets.
Forward Foreign Currency Exchange Contracts: The Master Portfolio enters into forward foreign currency exchange contracts as an economic hedge against either specific transactions or portfolio instruments or to obtain exposure to, or hedge exposure away from, foreign currencies (foreign currency exchange rate risk). A forward foreign currency exchange contract is an agreement between two parties to buy and sell a currency at a set exchange rate on a future date. Forward foreign currency exchange contracts, when used by the Master Portfolio, help to manage the overall exposure to the currencies in which some of the investments held by the Master Portfolio are denominated. The contract is marked-to-market daily and the change in market value is recorded by the Master Portfolio as an unrealized gain or loss. When the contract is closed, the Master Portfolio records a realized gain or loss equal to the difference between the value at the time it was opened and the value at the time it was closed. The use of forward foreign currency exchange contracts involves the risk that the value of a forward foreign currency exchange contract changes unfavorably due to movements in the value of the referenced foreign currencies and the risk that the counterparty to the contract does not perform its obligations under the agreement.
Options: The Master Portfolio purchases and writes call and put options to increase or decrease its exposure to underlying instruments including credit risk, equity risk, interest rate risk and/or foreign currency exchange risk and/or, in the case of options written, to generate gains from options premiums. A call option gives the purchaser (holder) of the option the right (but not the obligation) to buy, and obligates the seller (writer) to sell (when the option is exercised) the underlying instrument at the exercise or strike price at any time or at a specified time during the option period. A put option gives the holder the right to sell and obligates the writer to buy the underlying instrument at the exercise or strike price at any time or at a specified time during the option period. When the Master Portfolio purchases (writes) an option, an amount equal to the premium paid (received) by the Master Portfolio is reflected as an asset (liability). The amount of the asset (liability) is subsequently marked-to-market to reflect the current market value of the option purchased (written). When an instrument is purchased or sold through an exercise of an option, the related premium paid (or received) is added to (or deducted from) the basis of the instrument acquired or deducted from (or added to) the proceeds of the instrument sold. When an option expires (or the Master Portfolio enters into a closing transaction), the Master Portfolio realizes a gain or loss on the option to the extent of the premiums received or paid (or gain or loss to the extent the cost of the closing transaction exceeds the premiums received or paid). When the Master Portfolio writes a call option, such option is “covered,” meaning that the Master Portfolio holds the underlying instrument subject to being called by the option counterparty. When the Master Portfolio writes a put option, such option is covered by cash in an amount sufficient to cover the obligation.
Options on swaps (“swaptions”) are similar to options on securities except that instead of selling or purchasing the right to buy or sell a security, the writer or purchaser of the swaptions is granting or buying the right to enter into a previously agreed upon interest rate or credit default swap agreement (interest rate risk and/or credit risk) at any time before the expiration of the option.
The Master Portfolio also purchases or sells listed or OTC foreign currency options, foreign currency futures and related options on foreign currency futures as a short or long hedge against possible variations in foreign exchange rates or to gain exposure to foreign currencies (foreign currency exchange rate risk). When foreign currency is purchased or sold through an exercise of a foreign currency option, the related premium paid (or received) is added to (or deducted from) the basis of the foreign currency acquired or deducted from (or added to) the proceeds of the foreign currency sold (receipts from the foreign currency purchased). Such transactions may be effected with respect to hedges on non-U.S. dollar denominated instruments owned by the Master Portfolio but not yet delivered, or committed or anticipated to be purchased by the Master Portfolio.
The Master Portfolio may also purchase and write a variety of options with non-standard payout structures or other features (“barrier options”). Barrier options are generally traded OTC. The Master Portfolio may invest in various types of barrier options including up-and-out options. Up-and-out options expire worthless if the price of the underlying instrument increases beyond a predetermined barrier price level prior to the option’s expiration date.
| | | | | | |
| | | BLACKROCK BALANCED CAPITAL FUND, INC. | | MARCH 31, 2015 | | 91 |
| | | | |
| Notes to Consolidated Financial Statements (continued) | | | Master Total Return Portfolio | |
Barrier options may also be referred to as knockout options. In a reverse knockout option, the option expires worthless if the price of the underlying instrument decreases beyond a predetermined barrier price level prior to the option’s expiration date.
In purchasing and writing options, the Master Portfolio bears the risk of an unfavorable change in the value of the underlying instrument or the risk that the Master Portfolio may not be able to enter into a closing transaction due to an illiquid market. Exercise of a written option could result in the Master Portfolio purchasing or selling a security when it otherwise would not, or at a price different from the current market value.
The Master Portfolio invests in structured options to increase or decrease its exposure to an underlying index or group of securities (equity risk). These structured options are European-style options and may consist of single or multiple OTC options which are priced as a single security. European-style options may only be exercised at the expiration date, but may be transferred/sold prior to the expiration date. The value of a structured option may either increase or decrease with the underlying index or group of securities, depending on the combination of options used. Structured options are issued in units whereby each unit represents a structure based on the specific index with an initial reference strike price. One type of structure involves the combination of selling a put while buying a call on a specific index. This option would rise in value as the underlying index increases and fall in value as the underlying index decreases. Alternatively, another structure involves the sale of a call and the purchase of a put. This option structure would rise in value as the underlying index decreases and fall in value as the underlying index increases. Upon the exercise of the structured option, the Master Portfolio will receive a payment from, or be required to remit a payment to the counterparty, depending on the value of the underlying index at exercise.
For the six months ended March 31, 2015, transactions in options written, including swaptions and currency options, were as follows:
| | | | | | | | | | | | | | | | | | | | | | | | | | |
| | | Calls | | | | | Puts | |
| | | Contracts | | | Notional
(000)1 | | | Premiums
Received | | | | | Contracts | | | Notional
(000)1 | | | Premiums
Received | |
Outstanding options, beginning of period | | | 1,095 | | | | 456,038 | | | $ | 5,403,960 | | | | | | 187 | | | | 476,317 | | | $ | 5,341,417 | |
Options written | | | 49,403 | | | | 1,497,125 | | | | 18,816,484 | | | | | | 30,389 | | | | 1,199,752 | | | | 23,448,515 | |
Options exercised | | | — | | | | — | | | | — | | | | | | (689 | ) | | | — | | | | (42,195 | ) |
Options expired | | | (7,313 | ) | | | (344,978 | ) | | | (1,564,795 | ) | | | | | (3,768 | ) | | | (242,108 | ) | | | (1,613,044 | ) |
Options closed | | | (39,474 | ) | | | (738,694 | ) | | | (11,962,116 | ) | | | | | (22,054 | ) | | | (811,059 | ) | | | (17,730,792 | ) |
| | | | | | | | | | |
Outstanding options, end of period | | | 3,711 | | | | 869,491 | | | $ | 10,693,533 | | | | | | 4,065 | | | | 622,902 | | | $ | 9,403,901 | |
| | | | | | | | | | |
| | 1 | | Amount shown is in the currency in which the transaction was denominated. |
As of March 31, 2015, the value of portfolio securities subject to covered call options written was $8,553,666.
Swaps: The Master Portfolio enters into swap agreements in which the Master Portfolio and a counterparty agree either to make periodic net payments on a specified notional amount or a net payment upon termination. Swap agreements are privately negotiated in the OTC market and may be entered into as a bilateral contract (“OTC swaps”) or centrally cleared (“centrally cleared swaps”). Swaps are marked-to-market daily and changes in value are recorded as unrealized appreciation (depreciation).
For OTC swaps, any upfront premiums paid are recorded as assets and any upfront fees received are recorded as liabilities and are shown as swap premiums paid and swap premiums received, respectively, in the Consolidated Statement of Assets and Liabilities and amortized over the term of the OTC swap. Payments received or made by the Master Portfolio for OTC swaps are recorded in the Consolidated Statement of Operations as realized gains or losses, respectively. When an OTC swap is terminated, the Master Portfolio will record a realized gain or loss equal to the difference between the proceeds from (or cost of) the closing transaction and the Master Portfolio’s basis in the contract, if any. Generally, the basis of the contract is the premium received or paid.
In a centrally cleared swap, immediately following execution of the swap agreement, the swap agreement is novated to a central counterparty (the “CCP”) and the Master Portfolio’s counterparty on the swap agreement becomes the CCP. The Master Portfolio is required to interface with the CCP through a broker. Upon entering into a centrally cleared swap, the Master Portfolio is required to deposit initial margin with the broker in the form of cash or securities in an amount that varies depending on the size and risk profile of the particular swap. Securities deposited as initial margin are designated on the Consolidated Schedule of Investments and cash deposited is recorded on the Consolidated Statement of Assets and Liabilities as cash pledged for centrally cleared swaps. The daily change in valuation of centrally cleared swaps is recorded as a receivable or payable for variation margin in the Consolidated Statement of Assets and Liabilities. Payments received from (paid to) the counterparty, including at termination, are recorded as realized gain (loss) in the Consolidated Statement of Operations.
Swap transactions involve, to varying degrees, elements of interest rate, credit and market risk in excess of the amounts recognized in the Consolidated Statement of Assets and Liabilities. Such risks involve the possibility that there will be no liquid market for these agreements, that the counterparty to
| | | | | | |
| 92 | | BLACKROCK BALANCED CAPITAL FUND, INC. | | MARCH 31, 2015 | | |
| | | | |
| Notes to Consolidated Financial Statements (continued) | | | Master Total Return Portfolio | |
the agreements may default on its obligation to perform or disagree as to the meaning of the contractual terms in the agreements, and that there may be unfavorable changes in interest rates and/or market values associated with these transactions.
| • | | Credit default swaps — The Master Portfolio enters into credit default swaps to manage its exposure to the market or certain sectors of the market, to reduce its risk exposure to defaults of corporate and/or sovereign issuers or to create exposure to corporate and/or sovereign issuers to which it is not otherwise exposed (credit risk). The Master Portfolio may either buy or sell (write) credit default swaps on single-name issuers (corporate or sovereign), a combination or basket of single-name issuers or traded indexes. Credit default swaps on single-name issuers are agreements in which the protection buyer pays fixed periodic payments to the seller in consideration for a guarantee from the protection seller to make a specific payment should a negative credit event take place with respect to the referenced entity (e.g., bankruptcy, failure to pay, obligation accelerators, repudiation, moratorium or restructuring). Credit default swaps on traded indexes are agreements in which the buyer pays fixed periodic payments to the seller in consideration for a guarantee from the seller to make a specific payment should a write-down, principal or interest shortfall or default of all or individual underlying securities included in the index occur. As a buyer, if an underlying credit event occurs, the Master Portfolio will either (i) receive from the seller an amount equal to the notional amount of the swap and deliver the referenced security or underlying securities comprising the index, or (ii) receive a net settlement of cash equal to the notional amount of the swap less the recovery value of the security or underlying securities comprising the index. As a seller (writer), if an underlying credit event occurs, the Master Portfolio will either pay the buyer an amount equal to the notional amount of the swap and take delivery of the referenced security or underlying securities comprising the index or pay a net settlement of cash equal to the notional amount of the swap less the recovery value of the security or underlying securities comprising the index. |
| • | | Total return swaps — The Master Portfolio enters into total return swaps to obtain exposure to a security or market without owning such security or investing directly in that market or to transfer the risk/return of one market (e.g., fixed income) to another market (e.g., equity) (equity risk and/or interest rate risk). Total return swaps are agreements in which there is an exchange of cash flows whereby one party commits to make payments based on the total return (coupons plus capital gains/losses) of an underlying instrument in exchange for fixed or floating rate interest payments. To the extent the total return of the instrument or index underlying the transaction exceeds or falls short of the offsetting interest rate obligation, the Master Portfolio will receive a payment from or make a payment to the counterparty. |
| • | | Interest rate swaps — The Master Portfolio enters into interest rate swaps to gain or reduce exposure to interest rates or to manage duration, the yield curve or interest rate risk by economically hedging the value of the fixed rate bonds, which may decrease when interest rates rise (interest rate risk). Interest rate swaps are agreements in which one party pays a stream of interest payments, either fixed or floating, for another party’s stream of interest payments, either fixed or floating, on the same notional amount for a specified period of time. In more complex swaps, the notional principal amount may decline (or amortize) over time. |
| • | | Cross-currency swaps — The Master Portfolio enter into cross-currency swaps to gain or reduce exposure to foreign currencies or as an economic hedge against either specific transactions or portfolio instruments (foreign currency exchange rate and/or interest rate risk). Cross-currency swaps are interest rate swaps in which one party pays a stream of interest payments, either fixed or floating, in exchange for another party’s stream of interest payments, either fixed or floating, based on the notional amounts of two different currencies. The notional amounts are typically determined based on the spot exchange rates at the inception of the trade. Cross-currency swaps may also involve an exchange of notional amounts at the start, during and/or at expiration of the contract, either at the current spot rate or another specified rate. |
| • | | Forward interest rate swaps — The Master Portfolio may enter into forward interest rate swaps and forward total return swaps. In a forward swap, the Master Portfolio and the counterparty agree to make either periodic net payments beginning on a specified future effective date or a net payment at termination, unless terminated earlier. |
| | | | | | |
| | | BLACKROCK BALANCED CAPITAL FUND, INC. | | MARCH 31, 2015 | | 93 |
| | | | |
| Notes to Consolidated Financial Statements (continued) | | | Master Total Return Portfolio | |
The following is a summary of the Master Portfolio’s derivative financial instruments categorized by risk exposure:
| | | | | | | | | | |
| Fair Values of Derivative Financial Instruments as of March 31, 2015 | |
| | | | | Value | |
| | | Consolidated Statement of Assets and Liabilities Location | | Derivative
Assets | | | Derivative
Liabilities | |
Interest rate contracts | | Net unrealized appreciation/depreciation1
Unrealized appreciation/depreciation on OTC
derivatives;
Swap premiums received; Investments at
value — unaffiliated2; Options written at value; | | $ | 23,041,418 | | | $ | 27,557,748 | |
Foreign currency exchange contracts | | Unrealized appreciation/depreciation on foreign
currency exchange contracts; Investments at
value — unaffiliated2;
Options written at value; | | | 63,136,441 | | | | 26,833,819 | |
Credit contracts | | Net unrealized appreciation/depreciation1;
Unrealized appreciation/depreciation on OTC
derivatives;
Swap premiums received; | | | 9,618,768 | | | | 13,998,147 | |
Equity contracts | | Net unrealized appreciation/depreciation1;
Unrealized appreciation/depreciation on OTC
derivatives;
Investments at value — unaffiliated2;
Options written at value; | | | 3,358,124 | | | | 2,974,334 | |
Total | | | | $ | 99,154,751 | | | $ | 71,364,048 | |
| | | | | | |
| | 1 | | Includes cumulative appreciation/depreciation on financial futures contracts and centrally cleared swaps, if any, as reported in the Consolidated Schedule of Investments. Only current day’s variation margin is reported within the Consolidated Statement of Assets and Liabilities. |
| | 2 | | Includes options purchased at value as reported within the Consolidated Statement of Assets and Liabilities. |
| | | | | | | | | | |
The Effect of Derivative Financial Instruments in the Consolidated Statement of Operations Six Months Ended March 31, 2015 | |
| | | Net Realized Gain (Loss) From | | | | | Net Change in Unrealized Appreciation/Depreciation on | |
Interest rate contracts: | | | | | | | | | | |
Financial futures contracts | | $ | 2,636,275 | | | | | $ | 167,982 | |
Swaps | | | (8,680,212) | | | | | | (4,647,451 | ) |
Interest rate floors | | | — | | | | | | (708,341 | ) |
Options1 | | | (4,064,295) | | | | | | 465,138 | |
Foreign currency exchange contracts: | | | | | | | | | | |
Financial futures contracts | | | 2,764,670 | | | | | | (122,124 | ) |
Foreign currency transactions/translations | | | 72,757,980 | | | | | | 3,297,830 | |
Options1 | | | 4,280,907 | | | | | | (191,011 | ) |
Credit contracts: | | | | | | | | | | |
Swaps | | | 1,018,406 | | | | | | 1,443,752 | |
Options1 | | | (51,371) | | | | | | (8,730 | ) |
Equity contracts: | | | | | | | | | | |
Financial futures contracts | | | 380,015 | | | | | | 315,064 | |
Swaps | | | 1,262,577 | | | | | | (3,203,883 | ) |
Options1 | | | 583,930 | | | | | | (382,355 | ) |
| | | | |
Other contracts: | | | | | | | | | | |
Total | | $ | 72,888,882 | | | | | $ | (3,574,129 | ) |
| | | | |
| | 1 | | Options purchased are included in the net realized gain (loss) from investments and net change in unrealized appreciation/depreciation on investments. |
| | | | | | |
| 94 | | BLACKROCK BALANCED CAPITAL FUND, INC. | | MARCH 31, 2015 | | |
| | | | |
| Notes to Consolidated Financial Statements (continued) | | | Master Total Return Portfolio | |
For the six months ended March 31, 2015, the average quarterly balances of outstanding derivative financial instruments were as follows:
| | | | |
Financial futures contracts: | | | | |
Average notional value of contracts - long | | $ | 1,451,961,953 | |
Average notional value of contracts - short | | $ | 1,655,834,037 | |
Forward foreign currency exchange contracts: | | | | |
Average amounts purchased - in USD | | $ | 944,302,829 | |
Average amounts sold - in USD | | $ | 313,076,315 | |
Options: | | | | |
Average value of option contracts purchased | | $ | 22,750,260 | |
Average value of option contracts written | | $ | 16,445,709 | |
Average notional value of swaption contracts purchased | | $ | 680,661,745 | |
Average notional value of swaption contracts written | | $ | 558,081,720 | |
Average value of interest rate floors purchased | | $ | 1,921,880 | |
Average value of interest rate floors written | | $ | 481,273 | |
Structured options: | | | | |
Average notional value | | $ | 6,458 | |
Credit default swaps: | | | | |
Average notional value - buy protection | | $ | 275,939,411 | |
Average notional value - sell protection | | $ | 336,800,110 | |
Interest rate swaps: | | | | |
Average notional value - pays fixed rate | | $ | 307,340,994 | |
Average notional value - receives fixed rate | | $ | 157,936,548 | |
Cross currency swaps: | | | | |
Average notional value - pays | | $ | 39,881,122 | |
Average notional value - receives | | $ | 40,731,500 | |
Total return swaps: | | | | |
Average notional value | | $ | 210,612,844 | |
Counterparty Credit Risk: A derivative contract may suffer a mark-to-market loss if the value of the contract decreases due to an unfavorable change in the market rates or values of the underlying instrument. Losses can also occur if the counterparty does not perform under the contract.
The Master Portfolio’s risk of loss from counterparty credit risk on OTC derivatives is generally limited to the aggregate unrealized gain less the value of any collateral held by such Master Portfolio.
For OTC options purchased, the Master Portfolio bears the risk of loss of the amount of the premiums paid plus the positive change in market values net of any collateral held by such Master Portfolio should the counterparty fail to perform under the contracts. Options written by the Master Portfolio do not typically give rise to counterparty credit risk, as options written generally obligate the Master Portfolio, and not the counterparty, to perform.
With exchange-traded options purchased and futures and centrally cleared swaps, there is less counterparty credit risk to the Master Portfolio since the exchange or clearinghouse, as counterparty to such instruments, guarantees against a possible default. The clearinghouse stands between the buyer and the seller of the contract; therefore, credit risk is limited to failure of the clearinghouse. While offset rights may exist under applicable law, the Master Portfolio does not have a contractual right of offset against a clearing broker or clearinghouse in the event of a default (including the bankruptcy or insolvency) of the clearing broker or clearinghouse. Additionally, credit risk exists in exchange traded futures and centrally cleared swaps with respect to initial and variation margin that is held in a clearing broker’s customer accounts. While clearing brokers are required to segregate customer margin from their own assets, in the event that a clearing broker becomes insolvent or goes into bankruptcy and at that time there is a shortfall in the aggregate amount of margin held by the clearing broker for all its clients, typically the shortfall would be allocated on a pro rata basis across all the clearing broker’s customers, potentially resulting in losses to the Master Portfolio.
In order to better define its contractual rights and to secure rights that will help the Master Portfolio mitigate its counterparty risk, the Master Portfolio may enter into an International Swaps and Derivatives Association, Inc. Master Agreement (“ISDA Master Agreement”) or similar agreement with its derivative contract counterparties. An ISDA Master Agreement is a bilateral agreement between a Master Portfolio and a counterparty that governs certain OTC derivatives and typically contains, among other things, collateral posting terms and netting provisions in the event of a default and/or termination event. Under an ISDA Master Agreement, the Master Portfolio may, under certain circumstances, offset with the counterparty certain derivative financial instruments’ payables and/or receivables with collateral held and/or posted and create one single net payment. The provisions of the ISDA Master Agreement typically permit a single net payment in the event of default including the bankruptcy or insolvency of the counterparty. Bankruptcy or insolvency laws of a particular jurisdiction may restrict or prohibit the right of offset in bankruptcy, insolvency or other events. In addition, certain ISDA Master Agreements allow counterparties to terminate derivative contracts prior to maturity in the event the Master Portfolio’s net assets decline by a stated percentage or the Master Portfolio fails to meet the terms of its ISDA Master Agreements, which would cause the Master Portfolio to accelerate payment of any net liability owed to the counterparty.
| | | | | | |
| | | BLACKROCK BALANCED CAPITAL FUND, INC. | | MARCH 31, 2015 | | 95 |
| | | | |
| Notes to Consolidated Financial Statements (continued) | | | Master Total Return Portfolio | |
Collateral Requirements: For derivatives traded under an ISDA Master Agreement, the collateral requirements are typically calculated by netting the mark-to-market amount for each transaction under such agreement and comparing that amount to the value of any collateral currently pledged by the Master Portfolio and the counterparty.
Cash collateral that has been pledged to cover obligations of the Master Portfolio and cash collateral received from the counterparty, if any, is reported separately on the Consolidated Statement of Assets and Liabilities as cash pledged as collateral and cash received as collateral, respectively. Non-cash collateral pledged by the Master Portfolio, if any, is noted in the Consolidated Schedule of Investments. Generally, the amount of collateral due from or to a party has to exceed a minimum transfer amount threshold (typically either $250,000 or $500,000) before a transfer is required, which is determined at the close of business of the Master Portfolio. Any additional required collateral is delivered to/pledged by the Master Portfolio on the next business day. Typically, the Master Portfolio and counterparties are not permitted to sell, re-pledge or use the collateral they receive. To the extent amounts due to the Master Portfolio from its counterparties are not fully collateralized, the Master Portfolio bears the risk of loss from counterparty non-performance. Likewise, to the extent the Master Portfolio has delivered collateral to a counterparty and stands ready to perform under the terms of its agreement with such counterparty, the Master Portfolio bears the risk of loss from a counterparty in the amount of the value of the collateral in the event the counterparty fails to return such collateral.
For financial reporting purposes, the Master Portfolio does not offset derivative assets and derivative liabilities that are subject to netting arrangements, if any, in the Consolidated Statement of Assets and Liabilities.
As of March 31, 2015, the Master Portfolio’s derivative assets and liabilities (by type) are as follows:
| | | | | | | | |
| | | Assets | | | Liabilities | |
Derivative Financial Instruments: | | | | | | | | |
Financial futures contracts | | $ | 1,026,438 | | | $ | 842,495 | |
Forward foreign currency exchange contracts | | | 48,673,794 | | | | 16,515,512 | |
Interest rate floors1 | | | 3,057,555 | | | | 1,868,316 | |
Options | | | 32,024,009 | 2 | | | 24,917,981 | |
Swaps — Centrally cleared | | | 916,707 | | | | — | |
Swaps — OTC3 | | | 10,212,284 | | | | 21,431,120 | |
| | | | |
Total derivative assets and liabilities in the Consolidated Statement of Assets and Liabilities | | | 95,910,787 | | | | 65,575,424 | |
Derivatives not subject to a Master Netting Agreement or similar agreement (“MNA”) | | | (4,988,348 | ) | | | (2,142,597 | ) |
| | | | |
Total derivative assets and liabilities subject to a MNA | | $ | 90,922,439 | | | $ | 63,432,827 | |
| | | | |
| | 1 | | Includes unrealized appreciation/depreciation on interest rate floors and interest rate floors premiums paid/received in the Consolidated Statement of Assets and Liabilities. |
| | 2 | | Includes options purchased at value which is included in Investments at value — unaffiliated in the Consolidated Statement of Assets and Liabilities and reported in the Consolidated Schedule of Investments. |
| | 3 | | Includes unrealized appreciation/depreciation on OTC swaps and swap premiums paid/received in the Consolidated Statement of Assets and Liabilities. |
As of March 31, 2015, the following tables present the Master Portfolio’s derivative assets and liabilities by counterparty net of amounts available for offset under an MNA and net of the related collateral received and pledged by the Master Portfolio:
| | | | | | | | | | | | | | | | | | | | |
| Counterparty | | Derivative Assets
Subject to an MNA
by Counterparty | | | Derivatives
Available
for Offset1 | | | Non-cash
Collateral
Received | | | Cash
Collateral
Received2 | | | Net Amount of
Derivative Assets3 | |
Bank of America N.A. | | $ | 13,419,816 | | | $ | (10,549,452 | ) | | | — | | | | — | | | $ | 2,870,364 | |
The Bank of New York Mellon | | | 16,156 | | | | — | | | | — | | | | — | | | | 16,156 | |
Barclays Bank PLC | | | 2,466,733 | | | | (2,466,733 | ) | | | — | | | | — | | | | — | |
BNP Paribas S.A. | | | 5,516,007 | | | | (3,434,734 | ) | | | — | | | | — | | | | 2,081,273 | |
Citibank N.A. | | | 30,011,493 | | | | (6,685,742 | ) | | | — | | | | — | | | | 23,325,751 | |
Credit Suisse International | | | 371,893 | | | | (371,893 | ) | | | — | | | | — | | | | — | |
Deutsche Bank AG | | | 13,398,029 | | | | (13,398,029 | ) | | | — | | | | — | | | | — | |
Goldman Sachs Bank USA | | | 153,509 | | | | (104,914 | ) | | | — | | | | — | | | | 48,595 | |
Goldman Sachs International | | | 11,728,304 | | | | (9,157,976 | ) | | | — | | | $ | (2,570,328 | ) | | | — | |
HSBC Bank PLC | | | 803,783 | | | | (803,783 | ) | | | — | | | | — | | | | — | |
JPMorgan Chase Bank N.A. | | | 4,020,519 | | | | (4,020,519 | ) | | | — | | | | — | | | | — | |
Morgan Stanley & Co. International PLC | | | 292,860 | | | | — | | | | — | | | | — | | | | 292,860 | |
Morgan Stanley Capital Services LLC | | | 3,094,301 | | | | (429,988 | ) | | | — | | | | — | | | | 2,664,313 | |
Royal Bank of Canada | | | 4,154 | | | | — | | | | — | | | | — | | | | 4,154 | |
Royal Bank of Scotland PLC | | | 1,643,223 | | | | (444,789 | ) | | | — | | | | — | | | | 1,198,434 | |
Standard Chartered Bank | | | 379,824 | | | | (209,025 | ) | | | — | | | | — | | | | 170,799 | |
State Street Bank and Trust Co. | | | 1,210,644 | | | | (308,540 | ) | | | — | | | | — | | | | 902,104 | |
| | | | | | |
| 96 | | BLACKROCK BALANCED CAPITAL FUND, INC. | | MARCH 31, 2015 | | |
| | | | |
| Notes to Consolidated Financial Statements (continued) | | | Master Total Return Portfolio | |
| | | | | | | | | | | | | | | | | | | | |
| Counterparty | | Derivative Assets
Subject to an MNA
by Counterparty | | | Derivatives
Available
for Offset1 | | | Non-cash
Collateral
Received | | | Cash
Collateral
Received2 | | | Net Amount of
Derivative Assets3 | |
TD Securities, Inc. | | $ | 76,180 | | | $ | (381 | ) | | | — | | | | — | | | $ | 75,799 | |
UBS AG | | | 2,315,011 | | | | (1,436,454 | ) | | | — | | | | — | | | | 878,557 | |
| | | | |
Total | | $ | 90,922,439 | | | $ | (53,822,952 | ) | | | — | | | $ | (2,570,328 | ) | | $ | 34,529,159 | |
| | | | |
| | | | | | | | | | | | | | | | | | | | |
| Counterparty | | Derivative Liabilities
Subject to an MNA
by Counterparty | | | Derivatives
Available
for Offset1 | | | Non-cash
Collateral
Pledged4 | | | Cash
Collateral
Pledged4 | | | Net Amount of
Derivative
Liabilities5 | |
Bank of America N.A. | | $ | 10,549,452 | | | $ | (10,549,452 | ) | | | — | | | | — | | | | — | |
Barclays Bank PLC | | | 4,213,080 | | | | (2,466,733 | ) | | $ | (1,531,504 | ) | | | — | | | $ | 214,843 | |
BNP Paribas S.A. | | | 3,434,734 | | | | (3,434,734 | ) | | | — | | | | — | | | | — | |
Citibank N.A. | | | 6,685,742 | | | | (6,685,742 | ) | | | — | | | | — | | | | — | |
Credit Suisse International | | | 6,034,712 | | | | (371,893 | ) | | | (3,215,411 | ) | | $ | (300,000 | ) | | | 2,147,408 | |
Deutsche Bank AG | | | 15,288,714 | | | | (13,398,029 | ) | | | (1,040,881 | ) | | | (600,000 | ) | | | 249,804 | |
Goldman Sachs Bank USA | | | 104,914 | | | | (104,914 | ) | | | — | | | | — | | | | — | |
Goldman Sachs International | | | 9,157,976 | | | | (9,157,976 | ) | | | — | | | | — | | | | — | |
HSBC Bank PLC | | | 1,003,299 | | | | (803,783 | ) | | | — | | | | — | | | | 199,516 | |
JPMorgan Chase Bank N.A. | | | 4,118,275 | | | | (4,020,519 | ) | | | — | | | | (97,756 | ) | | | — | |
Morgan Stanley Capital Services LLC | | | 429,988 | | | | (429,988 | ) | | | — | | | | — | | | | — | |
Royal Bank of Scotland PLC | | | 444,789 | | | | (444,789 | ) | | | — | | | | — | | | | — | |
Société Générale | | | 12,752 | | | | — | | | | — | | | | — | | | | 12,752 | |
Standard Chartered Bank | | | 209,025 | | | | (209,025 | ) | | | — | | | | — | | | | — | |
State Street Bank and Trust Co. | | | 308,540 | | | | (308,540 | ) | | | — | | | | — | | | | — | |
TD Securities, Inc. | | | 381 | | | | (381 | ) | | | — | | | | — | | | | — | |
UBS AG | | | 1,436,454 | | | | (1,436,454 | ) | | | — | | | | — | | | | — | |
| | | | |
Total | | $ | 63,432,827 | | | $ | (53,822,952 | ) | | $ | (5,787,796 | ) | | $ | (997,756 | ) | | $ | 2,824,323 | |
| | | | |
| | 1 | | The amount of derivatives available for offset is limited to the amount of assets and/or liabilities that are subject to an MNA. |
| | 2 | | Excess of collateral received to the individual counterparty may not be shown for financial reporting purposes. |
| | 3 | | Net amount represents the net amount receivable from the counterparty in the event of default. |
| | 4 | | Excess of collateral pledged to the individual counterparty may not be shown for financial reporting purposes. |
| | 5 | | Net amount represents the net amount payable due to the counterparty in the event of default. |
5. Investment Advisory Agreement and Other Transactions with Affiliates:
The PNC Financial Services Group, Inc. is the largest stockholder and an affiliate of BlackRock, Inc. (“BlackRock”) for 1940 Act purposes.
The Master LLC, on behalf of the Master Portfolio, entered into an Investment Advisory Agreement with BlackRock Advisors, LLC (the “Manager”), the Master LLC’s investment advisor, an indirect, wholly owned subsidiary of BlackRock, to provide investment advisory and administration services. The Manager is responsible for the management of the Master Portfolio’s portfolio and provides the necessary personnel, facilities, equipment and certain other services necessary to the operations of the Master Portfolio. For such services, the Master Portfolio pays the Manager a monthly fee based on the percentage of the Master Portfolio’s average daily net assets at the following annual rates for the period indicated:
| | | | | | | | |
| | | Investment Advisory Fee | |
| Average Daily Net Assets | | Period October 1, 2014
to November 20, 2014 | | | Period November 21, 2014
to March 31, 2015 | |
First $250 Million | | | 0.20 | % | | | 0.16 | % |
$250 Million - $500 Million | | | 0.15 | % | | | 0.12 | % |
$500 Million - $750 Million | | | 0.10 | % | | | 0.08 | % |
Greater than $750 Million | | | 0.05 | % | | | 0.05 | % |
The Manager voluntarily agreed to waive its investment advisory fees by the amount of investment advisory fees the Master Portfolio pays to the Manager indirectly through its investment in affiliated money market funds. However, the Manager does not waive its investment advisory fees by the amount of investment advisory fees paid in connection with the Master Portfolio’s investments in other affiliated investment companies, if any. This amount is shown as fees waived by the Manager in the Consolidated Statement of Operations.
The Manager provides investment management and other services to the Subsidiary. The Manager does not receive separate compensation from the Subsidiary for providing investment management or administrative services. However, the Master Portfolio pays the Manager based on the Master Portfolio’s net assets which includes the assets of the Subsidiary.
| | | | | | |
| | | BLACKROCK BALANCED CAPITAL FUND, INC. | | MARCH 31, 2015 | | 97 |
| | | | |
| Notes to Consolidated Financial Statements (continued) | | | Master Total Return Portfolio | |
The Manager, on behalf of the Master Portfolio, entered into sub-advisory agreements with BlackRock International Limited (“BIL”) and BlackRock (Singapore) Limited (“BRS”), each an affiliate of the Manager. The Manager pays BIL and BRS for services they provide, a monthly fee that is a percentage of the investment advisory fees paid by the Master Portfolio to the Manager.
For the six months ended March 31, 2015, the Master LLC reimbursed the Manager $17,198 for certain accounting services, which is included in accounting services in the Consolidated Statement of Operations.
During the six months ended March 31, 2015, the Portfolio received a reimbursement of $668 from an affiliate, which is included in capital transactions in the Consolidated Statements of Changes in Net Assets, relating to a processing error.
Certain officers and/or directors of the Master LLC are officers and/or directors of BlackRock or its affiliates.
The Master Portfolio may purchase securities from, or sell securities to, an affiliated fund provided the affiliation is due solely to having a common investment advisor, common officers, or common trustees. For the six months ended March 31, 2015, the purchase and sale transactions with an affiliated fund in compliance with Rule 17a-7 under the 1940 Act were $9,977,127 and $661,733, respectively.
6. Purchases and Sales:
For the six months ended March 31, 2015, purchases and sales of investments, including paydown and mortgage dollar rolls and excluding short-term securities, were as follows:
| | | | |
| Purchases | |
Non-U.S. Government Securities | | $ | 22,910,144,245 | |
U.S. Government Securities | | | 12,569,461,991 | |
| | | | |
Total Purchases | | $ | 35,479,606,236 | |
| | | | |
| | | | |
| Sales | |
Non-U.S. Government Securities (including paydowns) | | $ | 21,715,081,483 | |
U.S. Government Securities | | | 11,480,052,711 | |
| | | | |
Total Sales | | $ | 33,195,134,194 | |
| | | | |
For the six months ended March 31, 2015, purchases and sales related to mortgage dollar rolls were as follows:
| | | | |
Purchases | | $ | 3,814,754,517 | |
Sales | | $ | 3,813,458,310 | |
7. Income Tax Information:
The Master Portfolio is classified as a partnership for federal income tax purposes. As such, each investor in the Master Portfolio is treated as the owner of its proportionate share of net assets, income, expenses and realized and unrealized gains and losses of the Master Portfolio. Therefore, no federal income tax provision is required. It is intended that the Master Portfolio’s assets will be managed so an investor in the Master Portfolio can satisfy the requirements of Subchapter M of the Internal Revenue Code of 1986, as amended.
The Master Portfolio files U.S. federal and various state and local tax returns. No income tax returns are currently under examination. The statute of limitations on the Master Portfolio’s U.S. federal tax returns remains open for each of the four years ended September 30, 2014. The statutes of limitations on Master Portfolio’s state and local tax returns may remain open for an additional year depending upon the jurisdiction.
Management has analyzed tax laws and regulations and their application to the Master Portfolio as of March 31, 2015, inclusive of the open tax return years, and does not believe there are any uncertain tax positions that require recognition of a tax liability in the Master Portfolio’s financial statements.
As of March 31, 2015, gross unrealized appreciation and depreciation based on cost for federal income tax purposes were as follows:
| | | | |
Tax cost | | $ | 10,908,152,054 | |
| | | | |
Gross unrealized appreciation | | $ | 112,712,836 | |
Gross unrealized depreciation | | | (68,293,041 | ) |
| | | | |
Net unrealized appreciation | | $ | 44,419,795 | |
| | | | |
| | | | | |
8. Bank Borrowings:
The Master LLC, on behalf of the Master Portfolio, along with certain other funds managed by the Manager and its affiliates (“Participating Funds”), was a party to a 364-day, $1.1 billion credit agreement with a group of lenders, under which the Master Portfolio may borrow to fund shareholder redemptions. Excluding commitments designated for a certain individual fund, the Participating Funds, including the Master Portfolio, could borrow up to an aggregate commitment amount of $650 million, subject to asset coverage and other limitations as specified in the agreement. Effective November 25,
| | | | | | |
| 98 | | BLACKROCK BALANCED CAPITAL FUND, INC. | | MARCH 31, 2015 | | |
| | | | |
| Notes to Consolidated Financial Statements (concluded) | | | Master Total Return Portfolio | |
2014, the credit agreement was amended to an aggregate commitment amount of $2.1 billion, of which the Participating Funds, including the Fund, can borrow up to $1.6 billion at any time outstanding, subject to asset coverage and other limitations as specified in the agreement. The agreement terminates on April 23, 2015, unless otherwise extended to November 24, 2015 or renewed for a period of 364 days from April 23, 2015. The amended agreement has the following terms: a fee of 0.06% per annum on unused commitment amounts and interest at a rate equal to the higher of (a) one-month LIBOR (but, in any event, not less than 0.00%) on the date the loan is made plus 0.80% per annum or (b) the Fed Funds rate (but, in any event, not less than 0.00%) in effect from time to time plus 0.80% per annum on amounts borrowed. Participating Funds paid administration, legal and arrangement fees, which are included in miscellaneous expenses in the Consolidated Statement of Operations, and along with commitment fees, were allocated among such funds based upon portions of the aggregate commitment available to them and relative net assets of Participating Funds. During the six months ended March 31, 2015, the Master Portfolio did not borrow under the credit agreement.
9. Principal Risks:
In the normal course of business, the Master Portfolio invests in securities and enters into transactions where risks exist due to fluctuations in the market (market risk) or failure of the issuer of a security to meet all its obligations (issuer credit risk). The value of securities held by the Master Portfolio may decline in response to certain events, including those directly involving the issuers whose securities are owned by the Master Portfolio; conditions affecting the general economy; overall market changes; local, regional or global political, social or economic instability; and currency, interest rate and price fluctuations. Similar to issuer credit risk, the Master Portfolio may be exposed to counterparty credit risk, or the risk that an entity with which the Master Portfolio has unsettled or open transactions may fail to or be unable to perform on its commitments. The Master Portfolio manages counterparty credit risk by entering into transactions only with counterparties that it believes have the financial resources to honor their obligations and by monitoring the financial stability of those counterparties. Financial assets, which potentially expose the Master Portfolio to market, issuer and counterparty credit risks, consist principally of financial instruments and receivables due from counterparties. The extent of the Master Portfolio’s exposure to market, issuer and counterparty credit risks with respect to these financial assets is generally approximated by their value recorded in the Consolidated Statement of Assets and Liabilities, less any collateral held by the Master Portfolio.
The Master Portfolio invests a significant portion of its assets in fixed-income securities and/or uses derivatives tied to the fixed income markets. Changes in market interest rates or economic conditions may affect the value and/or liquidity of such investments. Interest rate risk is the risk that prices of bonds and other fixed-income securities will increase as interest rates fall and decrease as interest rates rise. The Master Portfolio may be subject to a greater risk of rising interest rates due to the current period of historically low rates.
The Master Portfolio invests a significant portion of its assets in securities backed by commercial or residential mortgage loans or in issuers that hold mortgage and other asset-backed securities. Investment percentages in these securities are presented in the Consolidated Schedule of Investments. Changes in economic conditions, including delinquencies and/or defaults on assets underlying these securities, can affect the value, income and/or liquidity of such positions.
10. Subsequent Events:
Management’s evaluation of the impact of all subsequent events on the Master Portfolio’s financial statements was completed through the date the financial statements were issued and the following items were noted:
Effective April 23, 2015, the 364-day, $2.1 billion credit agreement to which the Master LLC is a party, was further amended to expire on April 21, 2016, unless otherwise extended or renewed.
| | | | | | |
| | | BLACKROCK BALANCED CAPITAL FUND, INC. | | MARCH 31, 2015 | | 99 |
Robert M. Hernandez, Chairman of the Board and Director
Fred G. Weiss, Vice Chairman of the Board and Director
James H. Bodurtha, Director
Bruce R. Bond, Director
Donald W. Burton, Director
Honorable Stuart E. Eizenstat, Director
Robert Fairbairn, Director
Kenneth A. Froot, Director
Henry Gabbay, Director
John F. O’Brien, Director
Roberta Cooper Ramo, Director
David H. Walsh, Director
John M. Perlowski, Director, President and Chief Executive Officer
Fernanda Piedra, Anti-Money Laundering Compliance Officer
Jennifer McGovern, Vice President
Neal Andrews, Chief Financial Officer
Jay Fife, Treasurer
Charles Park, Chief Compliance Officer
Benjamin Archibald, Secretary
Effective December 31, 2014, Paul L. Audet and Laurance D. Fink resigned as Directors of the Fund. Effective January 1, 2015, Robert Fairbairn and John M. Perlowski were appointed to serve as Directors of the Fund.
Effective March 1, 2015, Charles Park resigned as Anti-Money Laundering Compliance Officer of the Fund and Fernanda Piedra became Anti-Money Laundering Compliance Officer of the Fund.
Effective as of the close of business on May 13, 2015, Valerie G. Brown and Donald C. Opatrny were appointed to serve as Directors of the Fund.
| | | | | | |
| | | | |
| Investment Advisor | | Independent Registered | | Custodian | | Legal Counsel |
| BlackRock Advisors, LLC | | Public Accounting Firm | | Bank of New York Mellon | | Willkie Farr & Gallagher LLP |
| Wilmington, DE 19809 | | Deloitte & Touche LLP | | New York, NY 10286 | | New York, NY 10019 |
| | Philadelphia, PA 19103 | | | | |
| | | | | | |
Sub-Advisors BlackRock International Limited Edinburgh, EH3 8BL United Kingdom BlackRock (Singapore) Limited 079912 Singapore | | Accounting Agent and | | Distributor | | Address of the Fund |
| | Transfer Agent | | BlackRock Investments, LLC | | 100 Bellevue Parkway |
| | BNY Mellon Investment | | New York, NY 10022 | | Wilmington, DE 19809 |
| | Servicing (US) Inc. | | | | |
| | Wilmington, DE 19809 | | | | |
| | | | | | |
| | | | | | |
| | | | | | |
| 100 | | BLACKROCK BALANCED CAPITAL FUND, INC. | | MARCH 31, 2015 | | |
Electronic Delivery
Electronic copies of most financial reports and prospectuses are available on the Fund’s website or shareholders can sign up for e-mail notifications of quarterly statements, annual and semi-annual reports and prospectuses by enrolling in the Fund’s electronic delivery program.
To enroll in electronic delivery:
Shareholders Who Hold Accounts with Investment Advisors, Banks or Brokerages:
Please contact your financial advisor. Please note that not all investment advisors, banks or brokerages may offer this service.
Householding
The Funds will mail only one copy of shareholder documents, including prospectuses [open end only], annual and semi-annual reports and proxy statements, to shareholders with multiple accounts at the same address. This practice is commonly called “householding” and is intended to reduce expenses and eliminate duplicate mailings of shareholder documents. Mailings of your shareholder documents may be householded indefinitely unless you instruct us otherwise. If you do not want the mailing of these documents to be combined with those for other members of your household, please call the Fund at (800) 441-7762.
Availability of Quarterly Schedule of Investments
The Funds file their complete schedule of portfolio holdings with the SEC for the first and third quarters of each fiscal year on Form N-Q. The Funds’ Forms N-Q are available on the SEC’s website at http://www.sec.gov and may also be reviewed and copied at the SEC’s Public Reference Room in Washington, D.C. Information on how to access documents on the SEC’s website without charge may be obtained by calling (800) SEC-0330. The Funds’ Forms N-Q may also be obtained upon request and without charge by calling (800) 441-7762.
Availability of Proxy Voting Policies and Procedures
A description of the policies and procedures that the Funds use to determine how to vote proxies relating to portfolio securities is available upon request and without charge (1) by calling (800) 441-7762; (2) at http://www.blackrock.com; and (3) on the SEC’s website at http://www.sec.gov.
Availability of Proxy Voting Record
Information about how the Fund voted proxies relating to securities held in the Fund’s portfolios during the most recent 12-month period ended June 30 is available, upon request and without charge (1) at http://www.blackrock.com; or by calling (800) 441-7762 and (2) on the SEC’s website at http://www.sec.gov.
Account Information
Call us at (800) 441-7762 from 8:00 AM to 6:00 PM EST on any business day to get information about your account balances, recent transactions and share prices. You can also reach us on the Web at http://www.blackrock.com/funds.
Automatic Investment Plans
Investor Class shareholders who want to invest regularly can arrange to have $50 or more automatically deducted from their checking or savings account and invested in any of the BlackRock funds.
Systematic Withdrawal Plan
Investor Class shareholders can establish a systematic withdrawal plan and receive periodic payments of $50 or more from their BlackRock portfolios, as long as their account balance is at least $10,000.
Retirement Plans
Shareholders may make investments in conjunction with Traditional, Rollover, Roth, Coverdell, Simple IRAs, SEP IRAs and 403(b) Plans.
| | | | | | |
| | | BLACKROCK BALANCED CAPITAL FUND, INC. | | MARCH 31, 2015 | | 101 |
| | |
| Additional Information (concluded) | | |
|
| BlackRock Privacy Principles |
BlackRock is committed to maintaining the privacy of its current and former fund investors and individual clients (collectively, “Clients”) and to safeguarding their non-public personal information. The following information is provided to help you understand what personal information BlackRock collects, how we protect that information and why in certain cases we share such information with select parties.
If you are located in a jurisdiction where specific laws, rules or regulations require BlackRock to provide you with additional or different privacy-related rights beyond what is set forth below, then BlackRock will comply with those specific laws, rules or regulations.
BlackRock obtains or verifies personal non-public information from and about you from different sources, including the following: (i) information we receive from you or, if applicable, your financial intermediary, on applications, forms or other documents; (ii) information about your transactions with us, our affiliates, or others; (iii) information we receive from a consumer reporting agency; and (iv) from visits to our websites.
BlackRock does not sell or disclose to non-affiliated third parties any non-public personal information about its Clients, except as permitted by law or as is necessary to respond to regulatory requests or to service Client accounts. These non-affiliated third parties are required to protect the confidentiality and security of this information and to use it only for its intended purpose.
We may share information with our affiliates to service your account or to provide you with information about other BlackRock products or services that may be of interest to you. In addition, BlackRock restricts access to non-public personal information about its Clients to those BlackRock employees with a legitimate business need for the information. BlackRock maintains physical, electronic and procedural safeguards that are designed to protect the non-public personal information of its Clients, including procedures relating to the proper storage and disposal of such information.
| | | | | | |
| 102 | | BLACKROCK BALANCED CAPITAL FUND, INC. | | MARCH 31, 2015 | | |
This report is intended for existing shareholders. It is not authorized for use as an offer of sale or a solicitation of an offer to buy shares of a Fund unless preceded or accompanied by the Funds’ current prospectus. Past performance results shown in this report should not be considered a representation of future performance. Investment returns and principal value of shares will fluctuate so that shares, when redeemed, may be worth more or less than their original cost.
Statements and other information herein are as dated and are subject to change.

| | |
| |
BC-3/15-SAR | |  |
| Item 2 – | Code of Ethics – Not Applicable to this semi-annual report |
| Item 3 – | Audit Committee Financial Expert – Not Applicable to this semi-annual report |
| Item 4 – | Principal Accountant Fees and Services – Not Applicable to this semi-annual report |
| Item 5 – | Audit Committee of Listed Registrants – Not Applicable |
| | (a) The registrants’ Schedules of Investments are included as part of the Report to Stockholders filed under Item 1 of this Form. |
| | (b) Not Applicable due to no such divestments during the semi-annual period covered since the previous Form N-CSR filing. |
| Item 7 – | Disclosure of Proxy Voting Policies and Procedures for Closed-End Management Investment Companies – Not Applicable |
| Item 8 – | Portfolio Managers of Closed-End Management Investment Companies – Not Applicable |
| Item 9 – | Purchases of Equity Securities by Closed-End Management Investment Company and Affiliated Purchasers – Not Applicable |
| Item 10 – | Submission of Matters to a Vote of Security Holders – There have been no material changes to these procedures. |
| Item 11 – | Controls and Procedures |
| | (a) – The registrants’ principal executive and principal financial officers, or persons performing similar functions, have concluded that the registrants’ disclosure controls and procedures (as defined in Rule 30a-3(c) under the Investment Company Act of 1940, as amended (the “1940 Act”)) are effective as of a date within 90 days of the filing of this report based on the evaluation of these controls and procedures required by Rule 30a-3(b) under the 1940 Act and Rule 15d-15(b) under the Securities Exchange Act of 1934, as amended. |
| | (b) – There were no changes in the registrants’ internal control over financial reporting (as defined in Rule 30a-3(d) under the 1940 Act) that occurred during the second fiscal quarter of the period covered by this report that have materially affected, or are reasonably likely to materially affect, the registrants’ internal control over financial reporting. |
| Item 12 – | Exhibits attached hereto |
| | (a)(1) – Code of Ethics – Not Applicable to this semi-annual report |
| | (a)(2) – Certifications – Attached hereto |
| | (b) – Certifications – Attached hereto |
2
Pursuant to the requirements of the Securities Exchange Act of 1934 and the Investment Company Act of 1940, each registrant has duly caused this report to be signed on its behalf by the undersigned, thereunto duly authorized.
BlackRock Balanced Capital Fund, Inc., Master Large Cap Core Portfolio of Master Large Cap Series LLC and Master Total Return Portfolio of Master Bond LLC
| | |
| By: | | /s/ John M. Perlowski |
| | John M. Perlowski |
| | Chief Executive Officer (principal executive officer) of |
| | BlackRock Balanced Capital Fund, Inc., Master Large Cap Core Portfolio of Master Large Cap Series LLC and Master Total Return Portfolio of Master Bond LLC |
Date: June 2, 2015
Pursuant to the requirements of the Securities Exchange Act of 1934 and the Investment Company Act of 1940, this report has been signed below by the following persons on behalf of each registrant and in the capacities and on the dates indicated.
| | |
| By: | | /s/ John M. Perlowski |
| | John M. Perlowski |
| | Chief Executive Officer (principal executive officer) of |
| | BlackRock Balanced Capital Fund, Inc., Master Large Cap Core Portfolio of Master Large Cap Series LLC and Master Total Return Portfolio of Master Bond LLC |
Date: June 2, 2015 |
| By: | | /s/ Neal J. Andrews |
| | Neal J. Andrews |
| | Chief Financial Officer (principal financial officer) of |
| | BlackRock Balanced Capital Fund, Inc., Master Large Cap Core Portfolio of Master Large Cap Series LLC and Master Total Return Portfolio of Master Bond LLC |
Date: June 2, 2015
3