2013 Q3 Earnings Call November 11, 2013, 9:00 am PST

Disclosure Statement 1 Certain statements contained in this presentation that are not historical information contain forward-looking statements. The forward-looking statements involve risks and uncertainties and actual results may differ materially from those projected or implied. Further, certain forward-looking statements are based on assumptions of future events which may not prove to be accurate. Factors that may impact such forward- looking statements include, among others, changes in general economic conditions and in the markets in which the Company competes, limitations on the Company’s ability to utilize its tax attributes, limitations on the Company’s ability to reverse any portion of its valuation allowance with respect to its deferred tax assets, changes in mortgage and other interest rates, changes in prices of homebuilding materials, weather conditions, the occurrence of events such as landslides, soil subsidence and earthquakes that are uninsurable, not economically insurable or not subject to effective indemnification agreements, the availability of labor and homebuilding materials, changes in governmental laws and regulations, the timing of receipt of regulatory approvals and the opening of projects, and the availability and cost of land for future development, as well as the other factors discussed in the Company’s reports filed with the Securities and Exchange Commission. As a result of the consummation of the Prepackaged Joint Plan of Reorganization on February 25, 2012, the Company adopted Fresh Start Accounting in accordance with Accounting Standards Codification No. 852, Reorganizations. Accordingly, the financial statement information prior to February 25, 2012 is not comparable with the financial statement information for periods on and after February 25, 2012. Any reference hereinafter to the “Successor” reflects the operations of the Company post-emergence from February 25, 2012 through September 30, 2013 and any reference to the “Predecessor” refers to the operations of the Company pre-emergence prior to February 25, 2012. Any reference to the “Combined Total” reflects the operations of the Company in both the Predecessor and Successor periods. A copy of the press release reporting the Company’s financial results for the three months ended September 30, 2013 is available on the Company's website at www.lyonhomes.com.

Management Presenters William H. Lyon − Chief Executive Officer Matthew Zaist − President and Chief Operating Officer Colin Severn − Vice President and Chief Financial Officer 2

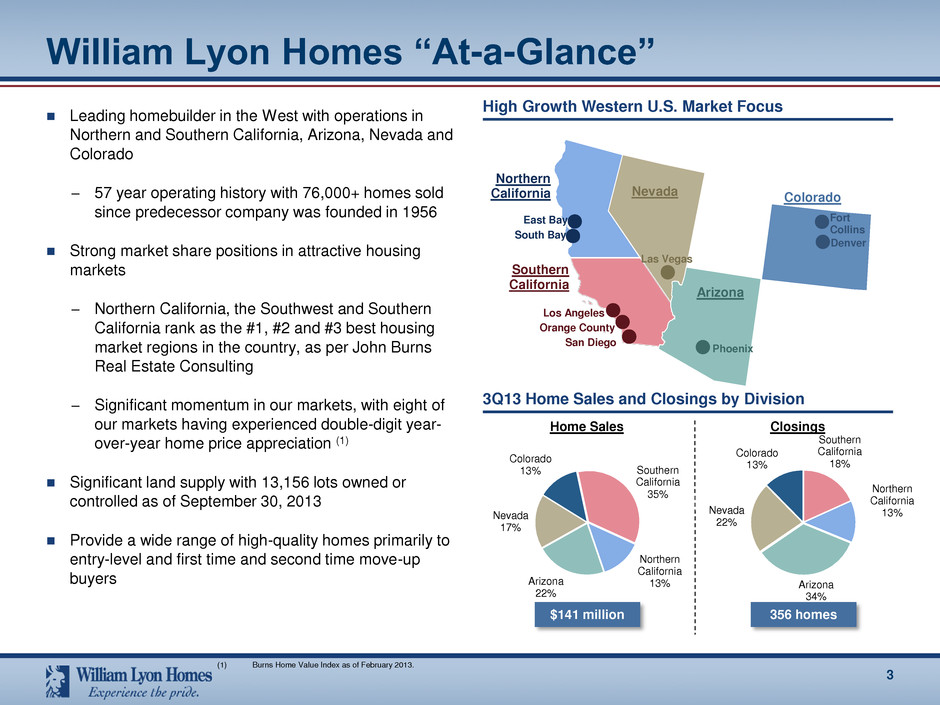
Southern California 35% Northern California 13% Arizona 22% Nevada 17% Colorado 13% William Lyon Homes “At-a-Glance” Leading homebuilder in the West with operations in Northern and Southern California, Arizona, Nevada and Colorado − 57 year operating history with 76,000+ homes sold since predecessor company was founded in 1956 Strong market share positions in attractive housing markets − Northern California, the Southwest and Southern California rank as the #1, #2 and #3 best housing market regions in the country, as per John Burns Real Estate Consulting − Significant momentum in our markets, with eight of our markets having experienced double-digit year- over-year home price appreciation (1) Significant land supply with 13,156 lots owned or controlled as of September 30, 2013 Provide a wide range of high-quality homes primarily to entry-level and first time and second time move-up buyers 3 High Growth Western U.S. Market Focus 3Q13 Home Sales and Closings by Division Southern California 18% Northern California 13% Arizona 34% Nevada 22% Colorado 13% Home Sales Closings $141 million 356 homes East Bay Northern California Nevada Phoenix Las Vegas San Diego Arizona Los Angeles Southern California South Bay Orange County Colorado Fort Collins Denver (1) Burns Home Value Index as of February 2013.

Key Investment Highlights Leading local presence in high growth Western U.S. markets 2 Positioned for meaningful community count growth 4 Expertise in land acquisition, entitlement and development 5 Deep and long-standing relationships in each of our local markets 6 Strategically diversified across buyer segments and product offerings 7 Deep and experienced management team with significant WLH tenure 1 Significant and high quality land inventory recorded at an attractive basis 3 4 Reputation for delivering superior quality and customer service 8

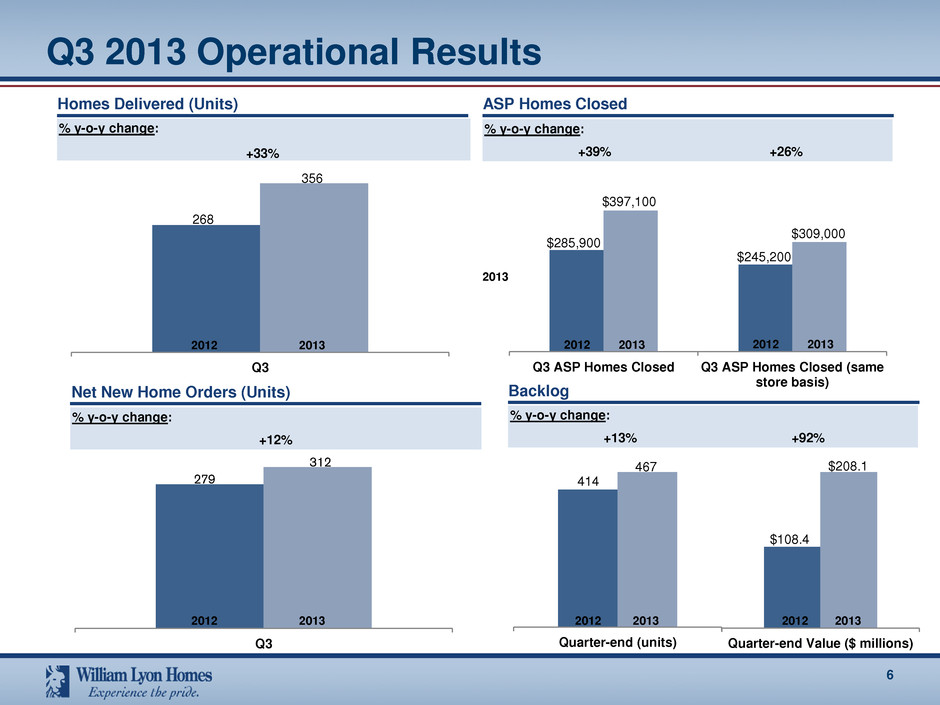
Third Quarter Results 5 Three months ended 9/30/2013 Three months ended 9/30/2012 Change Unit Closings 356 268 33% Unit Backlog 467 414 13% Backlog ($ in millions) $208.1 $108.4 92% Average Sales Price $397,100 285,900 39% Average Selling Communities 26 18 44% Homebuilding Revenues ($ in millions) $141.4 $76.6 84% Homebuilding Gross Margin 23.6% 17.8% 580 bps Homebuilding Adjusted Gross Margin 29.0% 25.7% 330 bps SG&A as a % of Homebuilding Revenue 11.9% 12.5% (60 bps) Operating Income ($ in millions) $17.0 $3.6 374% Net Income (Loss) Available to Common Stockholders ($ in millions) $7.6 ($1.5) N/M Diluted EPS $0.24 ($0.12) N/M William Lyon Homes’ business has continued to improve dramatically in line with the U.S. housing recovery − ASP and closings are up 39% and 33% y-o-y, respectively − The average number of selling communities and adjusted gross margins are up 44% and 330 bps y-o-y, respectively Additionally, our core markets continue to show robust growth

Q3 2013 Operational Results 6 ASP Homes Closed % y-o-y change: Homes Delivered (Units) % y-o-y change: +39% +26% % y-o-y change: +12% Net New Home Orders (Units) % y-o-y change: +13% +92% Backlog Q3 356 268 2012 2013 +33% Q3 312 279 Q3 ASP Homes Closed Q3 ASP Homes Closed (same store basis) $309,000 $397,100 $285,900 $245,200 2013 2012 2013 2012 Quarter-end (units) $208.1 $108.4 467 414 2013 2012 2013 2012 2013 2012 Quarter-end Value ($ millions) 2013 2012

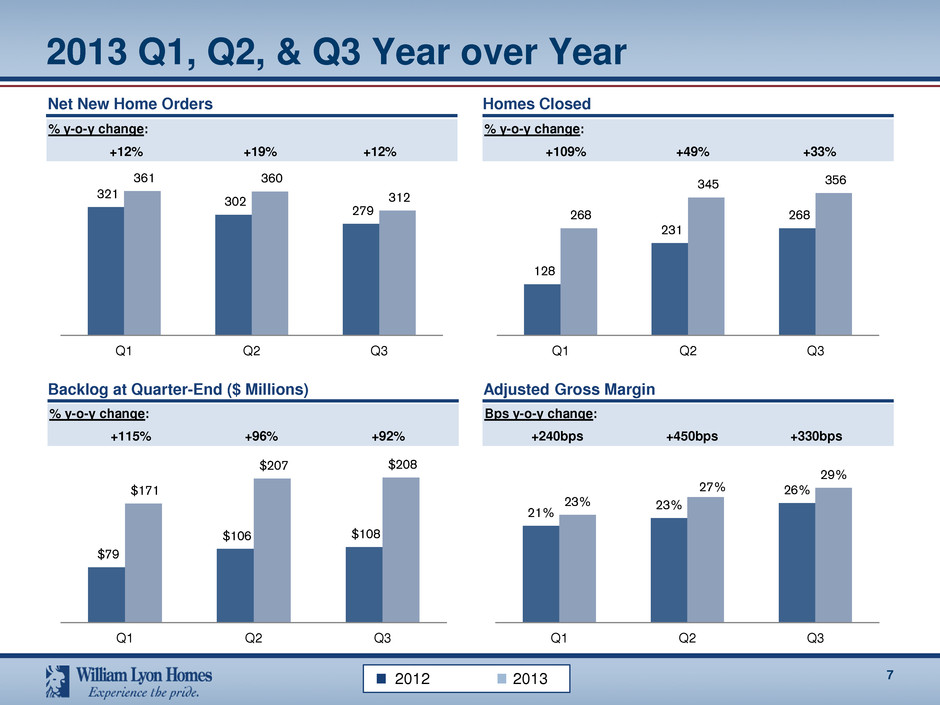
2013 Q1, Q2, & Q3 Year over Year 7 % y-o-y change: +12% +19% +12% % y-o-y change: +115% +96% +92% Bps y-o-y change: +240bps +450bps +330bps Net New Home Orders Homes Closed Backlog at Quarter-End ($ Millions) Adjusted Gross Margin % y-o-y change: +109% +49% +33% 2012 2013 321 302 279 361 360 312 Q1 Q2 Q3 128 231 268 268 345 356 Q1 Q2 Q3 $79 $106 $108 $171 $207 $208 Q1 Q2 Q3 21% 23% 26% 23% 27% 29% Q1 Q2 Q3

ASP Homes Closed – Q3 Year over Year 8 ASP of Homes Closed ($ Thousands) (1) % variance: +54% +21% +22% +41% +59% +35% +65% +21% +11% +8% $497 $325 $161 $183 $371 $764 $398 $256 $303 $413 $455 $217 $165 $219 $381 $552 $307 $222 $266 $413 SoCal NoCal Arizona Nevada Colorado Q3 2012 Q3 2013 Q3 2012 (same store) Q3 2013 (same store) (1) Net sales price, which includes option revenue and lot premiums.

Significant and High Quality Land 9 Significant lot supply reflecting balanced approach to land investment − Current mix of finished lots allows for near-term homebuilding operations with longer-term strategic land positions to support future growth − Meaningful supply of owned lots allows us to be selective in making new land acquisitions − Current focus on acquiring lots for 2015 and beyond − Our land supply “runway” allows us to avoid hyper- competitive bidding situations to fill near-term inventory needs Total Lots Owned and Controlled at Quarter End 9/30/13 Southern California 13% Northern California 12% Arizona 45% Nevada 23% Colorado 7% Land Distribution by Division as of 9/30/13 Owned Southern California 1,186 Northern California 869 Arizona 5,653 Nevada 2,864 Colorado 546 Total 11,118 Controlled Southern California 577 Northern California 684 Arizona 220 Nevada 215 Colorado 342 Total 2,038 Owned & Controlled % Change YOY Southern California 1,763 45% Northern California 1,553 56% Arizona 5,873 -6% Nevada 3,079 5% Colorado 888 N/M Total 13,156 15%

Selected Financial Data 10 Selected Financial Data ($ Thousands) 2013 2012 Variance Homebuilding revenue 141,352$ 76,617$ 84% Homebuilding gross profit 33,395$ 13,605$ 145% Homebuilding gross margin % 23.6% 17.8% 580 bps Adjusted homebuilding gross margin % 29.0% 25.7% 330 bps Sales and marketing (6,679)$ (4,172)$ 60% General and administrative (10,200)$ (5,440)$ 88% SGA as % of homebuilding revenue 11.9% 12.5% (60 bps) Operating income 16,973$ 3,585$ 373% Adjusted EBITDA 22,975$ 9,702$ 137% Net income (loss) available to common stockholders 7,562$ (1,507)$ N/A Income (loss) per common diluted share 0.24$ (0.12)$ N/A Three Months Ended September 30,

Selected Financial Data 11 Selected Financial Data ($ Thousands) 2013 2012 Variance Homebuilding revenue 338,434$ 162,664$ 108% Homebuilding gross profit 70,502$ 25,911$ 172% Homebuilding gross margin % 20.8% 15.9% 490 bps Adjusted homebuilding gross margin % 27.0% 23.7% 330 bps Sales and marketing (17,482)$ (10,779)$ 62% Gener l and administrative (28,016)$ (17,227)$ 63% SGA as % of homebuilding revenue 13.4% 17.2% (380 bps) Operating income (loss) 26,462$ (496)$ N/A Adjusted EBITDA 46,500$ 7,157$ 550% Net income available to common stockholders 10,880$ 218,974$ N/A Nine Months Ended September 30,

Adjusted EBITDA 12 Predecessor Three Three Nine Period from Period from Months Months Months February 25 January 1 Ended Ended Ended through through September September September September February 24, 2013 2012 2013 2012 2012 Net income (loss) attributable to 7,562$ (752)$ 12,408$ (7,611)$ 228,383$ Provision for income taxes 6,356 11 6,366 11 - Interest expense Interest incurred 7,511 8,729 22,511 22,336 7,145 Interest capitalized (7,460) (6,238) (19,909) (15,009) (4,638) Amortization of capitalized interest included in cost of sales 7,569 6,051 20,729 11,200 1,360 880 - 2,207 - - - - 4 - - - - - (975) - - - - - (241,271) Depreciation and amortization 557 1,901 2,184 5,640 586 Adjusted EBITDA 22,975$ 9,702$ 46,500$ 15,592$ (8,435)$ William Lyon Homes Successor Stock based compensation Non-cash reorganization items Loss on sale of fixed asset Gain on retirement of debt (dollars in thousands)

Adjusted Homebuilding Gross Margin 13 2013 2012 2013 2012 Consolidated Consolidated Consolidated Combined Total Total Total Total (dollars in thousands) Homes closed 356 268 969 627 Home sales revenue $ 141,352 $ 76,617 $ 338,434 $ 162,664 Cost of sales (excluding interest) (100,388) (56,961) (247,203) (124,193) Adjusted homebuilding gross margin $ 40,964 $ 19,656 $ 91,231 $ 38,471 Adjusted homebuilding gross margin percentage 29.0% 25.7% 27.0% 23.7% Interest in cost of sales (7,569) (6,051) (20,729) (12,560) Gross margin $ 33,395 $ 13,605 70,502 25,911 Gross margin percentage 23.6% 17.8% 20.8% 15.9% Three Months Ended September 30, Nine Months Ended September 30, Selected Financial Information

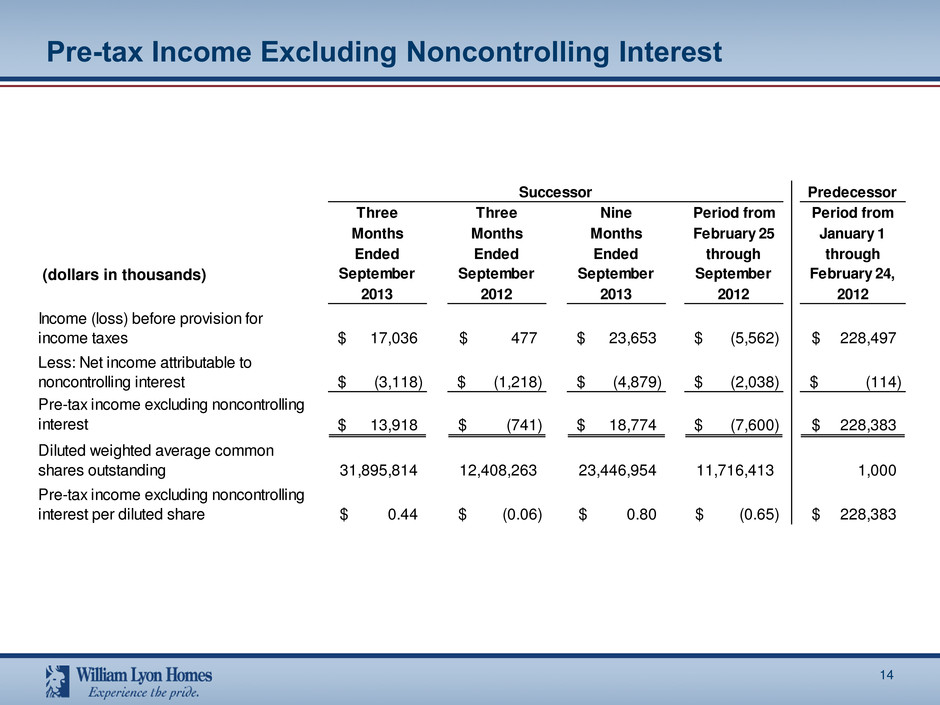
Predecessor Three Three Nine Period from Period from Months Months Months February 25 January 1 Ended Ended Ended through through September September September September February 24, 2013 2012 2013 2012 2012 17,036$ 477$ 23,653$ (5,562)$ 228,497$ (3,118)$ (1,218)$ (4,879)$ (2,038)$ (114)$ 13,918$ (741)$ 18,774$ (7,600)$ 228,383$ 31,895,814 12,408,263 23,446,954 11,716,413 1,000 0.44$ (0.06)$ 0.80$ (0.65)$ 228,383$ Pre-tax income excluding noncontrolling interest per diluted share Successor Income (loss) before provision for income taxes Less: Net income attributable to noncontrolling interest Pre-tax income excluding noncontrolling interest Diluted weighted average common shares outstanding Pre-tax Income Excluding Noncontrolling Interest 14 (dollars in thousands)

Executing Our Strategy 15 Drive revenue growth through community count growth on existing land supply − Current land position covers all of projected 2013 and 2014 closings and substantially all of 2015 − Diversified product offering increasingly targets underserved move-up market, driving higher ASPs Remain disciplined in land acquisitions to support future growth − Leverage long-standing local relationships with land sellers, MPC developers and other builders − Dynamic land acquisition strategy balancing value-added development opportunities with strategic shorter life-cycle projects Enhance our leading positions in current high growth Western markets − Increase market share within our markets achieving further economies of scale and driving profits − Leverage our long-term and strong reputation for superior quality and customer service Maintain strict operating discipline focused on earnings and cash flow − Decentralized management approach allows for detailed knowledge of local market conditions − Optimize balance between opportunistic price increases and cost controls Manage our balance sheet to drive attractive risk-adjusted shareholder returns


