Use these links to rapidly review the document
Table of Contents
Index to Consolidated Financial Statements
As filed with the Securities and Exchange Commission on March 31, 2014
UNITED STATES
SECURITIES AND EXCHANGE COMMISSION
WASHINGTON, D.C. 20549
FORM 20-F
o | REGISTRATION STATEMENT PURSUANT TO SECTION 12(b) OR (g) OF THE SECURITIES EXCHANGE ACT OF 1934 | |
OR | ||
ý | ANNUAL REPORT PURSUANT TO SECTION 13 OR 15(d) OF THE SECURITIES EXCHANGE ACT OF 1934 For the fiscal year ended December 31, 2013 | |
OR | ||
o | TRANSITION REPORT PURSUANT TO SECTION 13 OR 15(d) OF THE SECURITIES EXCHANGE ACT OF 1934 | |
OR | ||
o | SHELL COMPANY REPORT PURSUANT TO SECTION 13 OR 15(d) OF THE SECURITIES EXCHANGE ACT OF 1934 | |
Commission File Number 001-35370
| LUXFER HOLDINGS PLC (Exact name of Registrant as specified in its charter) |
England and Wales (Jurisdiction of incorporation or organization) |
Anchorage Gateway, 5 Anchorage Quay, Salford, England M50 3XE (Address of principal executive offices) |
Dan Stracner, Investor Relations 3016 Kansas Avenue, Riverside, California, 92507, United States Telephone No. 001 951 341 2375, E-Mail: dan.stracner@luxfer.net (Name, Telephone, E-mail and/or Facsimile number and Address of Company Contact Person) |
Securities registered or to be registered pursuant to Section 12(b) of the Act.
| Title of each class | Name of each exchange on which registered | |
|---|---|---|
Ordinary Shares, nominal value £1 each | New York Stock Exchange* | |
American Depositary Shares, each representing one-half of an Ordinary Share of nominal value £1 each | New York Stock Exchange |
Securities registered or to be registered pursuant to Section 12(g) of the Act: None
Securities for which there is a reporting obligation pursuant to Section 15(d) of the Act: None
Indicate the number of outstanding shares of each of the issuer's classes of capital or common stock as of the close of the period covered by the annual report: 13,407,288 Ordinary Shares of £1 each and 769,413,708,000 Deferred Ordinary Shares of £0.0001 each.
Indicate by check mark if the registrant is a well-known seasoned issuer, as defined in Rule 405 of the Securities Act.
Yes o No ý
If this report is an annual or transition report, indicate by check mark if the registrant is not required to file reports pursuant to Section 13 or 15(d) of the Securities Exchange Act of 1934.
Yes o No ý
Indicate by check mark whether the registrant (1) has filed all reports required to be filed by Section 13 or 15(d) of the Securities Exchange Act of 1934 during the preceding 12 months (or for such shorter period that the registrant was required to file such reports), and (2) has been subject to such filing requirements for the past 90 days.
Yes ý No o
Indicate by check mark whether the registrant has submitted electronically and posted on its corporate Web site, if any, every Interactive Data File required to be submitted and posted pursuant to Rule 405 of Regulation S-T (§232.405 of this chapter) during the preceding 12 months (or for such shorter period that the registrant was required to submit and post such files).
Yes o No o
Indicate by check mark whether the registrant is a large accelerated filer, an accelerated filer, or a non-accelerated filer. See definition of "accelerated filer and large accelerated filer" in Rule 12b-2 of the Exchange Act. (Check one):
| Large accelerated filer o | Accelerated filer ý | Non-accelerated filer o |
Indicate by check mark which basis of accounting the registrant has used to prepare the financial statements included in this filing:
| U.S. GAAPo | International Financial Reporting Standards as issued by the International Accounting Standards Boardý | Othero |
If "Other" has been checked in response to the previous question, indicate by check mark which financial statement item the registrant has elected to follow.
Item 17 o Item 18 o
If this is an annual report, indicate by check mark whether the registrant is a shell company (as defined in Rule 12b-2 of the Exchange Act).
Yes o No ý
* Not for trading, but only in connection with the registration of American Depositary Shares.
TABLE OF CONTENTS
| | | Page | ||||
|---|---|---|---|---|---|---|
PART I | ||||||
Item 1. | Identity Of Directors, Senior Management and Advisers | 1 | ||||
Item 2. | Offer Statistics and Expected Timetable | 1 | ||||
Item 3. | Key Information | 1 | ||||
Item 4. | Information on the Company | 25 | ||||
Item 4a. | Unresolved Staff Comments | 50 | ||||
Item 5. | Operating and Financial Review and Prospects | 50 | ||||
Item 6. | Directors, Senior Management and Employees | 76 | ||||
Item 7. | Major Shareholders and Related Party Transactions | 114 | ||||
Item 8. | Financial Information | 117 | ||||
Item 9. | The Offer and Listing | 118 | ||||
Item 10. | Additional Information | 119 | ||||
Item 11. | Quantitative and Qualitative Disclosures About Market Risk | 124 | ||||
Item 12. | Description of Securities Other Than Equity | 131 | ||||
PART II | ||||||
Item 13. | Defaults, Dividend Arrearages and Delinquencies | 133 | ||||
Item 14. | Material Modifications to The Rights Of Security Holders and Use Of Proceeds | 133 | ||||
Item 15. | Controls and Procedures | 133 | ||||
Item 16. | [Reserved] | 133 | ||||
Item 16a. | Audit Committee Financial Expert | 133 | ||||
Item 16b. | Code of Ethics | 134 | ||||
Item 16c. | Principal Accountant Fees and Services | 134 | ||||
Item 16d. | Exemptions From The Listing Standards For Audit Committees | 134 | ||||
Item 16e. | Purchases of Equity Securities By The Issuer and Affiliated Purchasers | 134 | ||||
Item 16f. | Change In Registrant's Certifying Accountant | 134 | ||||
Item 16g. | Corporate Governance | 135 | ||||
Item 16h. | Mine Safety Disclosure | 135 | ||||
PART III | ||||||
Item 17. | Financial Statements | 136 | ||||
Item 18. | Financial Statements | 136 | ||||
Item 19. | Exhibits | 136 | ||||
GENERAL INFORMATION
In this annual report on Form 20-F ("Annual Report") references to "Company", "Luxfer", "Group", "Luxfer Group", "we", "us" and "our" are to Luxfer Holdings PLC and, except as the context requires, its consolidated subsidiaries.
PRESENTATION OF FINANCIAL AND OTHER DATA
The consolidated financial statements have been prepared in accordance with International Financial Reporting Standards ("IFRS") as issued by the International Accounting Standards Board ("IASB") as they apply to the financial statements of the Group. The consolidated financial statements have been prepared on a historical cost basis, except where IFRS requires or permits fair value measurement.
All references in this Annual Report to (i) "US Dollar", "USD" or "$" are to the currency of the United States, (ii) "Pounds Sterling", "GBP sterling", "pence", "p" or "£" are to the currency of the United Kingdom and (iii) "Euro" or "€" are to the currency introduced at the start of the third stage of European economic and monetary union pursuant to the treaty establishing the European Community, as amended.
INFORMATION REGARDING FORWARD-LOOKING STATEMENTS
This Annual Report contains certain statements, statistics and projections that are, or may be, forward-looking. The accuracy and completeness of all such statements, including, without limitation, statements regarding our future financial position, strategy, plans and objectives for the management of future operations, is not warranted or guaranteed. These statements typically contain words such as "believes", "intends", "expects", "anticipates", "estimates", "may", "will", "should" and words of similar import. By their nature, forward-looking statements involve risk and uncertainty because they relate to events and depend on circumstances that will occur in the future. We undertake no obligation to update any forward-looking statements, whether as a result of new information, future events or otherwise. Although we believe that the expectations reflected in such statements are reasonable, no assurance can be given that such expectations will prove to be correct. There are a number of factors that could cause actual results and developments to differ materially from those expressed or implied by such forward-looking statements. These factors include, but are not limited to, factors identified in "Risk Factors", "Information on the Company" and "Operating and Financial Review and Prospects", or elsewhere in this Annual Report, as well as:
- •
- future revenues being lower than expected;
- •
- increasing competitive pressures in the industry;
- •
- general economic conditions or conditions affecting demand for the services offered by us in the markets in which we operate, both domestically and internationally, being less favorable than expected;
- •
- the significant amount of indebtedness we have incurred and may incur and the obligations to service such indebtedness and to comply with the covenants contained therein;
- •
- restrictions on the ability of Luxfer Holdings PLC to receive dividends or loans from certain of its subsidiaries;
- •
- fluctuations in the price of raw materials and utilities;
- •
- currency fluctuations and hedging risks;
- •
- worldwide economic and business conditions and conditions in the industries in which we operate;
- •
- relationships with our customers and suppliers;
- •
- increased competition from other companies in the industries in which we operate;
- •
- changing technology;
- •
- claims for personal injury, death or property damage arising from the use of products produced by us;
- •
- the occurrence of accidents or other interruptions to our production processes;
- •
- changes in our business strategy or development plans, and our expected level of capital expenditure;
- •
- our ability to attract and retain qualified personnel;
- •
- regulatory, environmental, legislative and judicial developments;
- •
- our intention to pay dividends; and
- •
- factors that are not known to us at this time.
You are urged to read the sections "Risk Factors", "Information on the Company" and "Operating and Financial Review and Prospects" of this Annual Report for a more complete discussion of the factors that could affect our performance and the industry in which we operate.
Item 1. Identity of Directors, Senior Management and Advisers
Not applicable.
Item 2. Offer Statistics and Expected Timetable
Not applicable.
A. Selected Financial Data
The following selected consolidated financial data of Luxfer as of December 31, 2013, 2012, 2011, 2010 and 2009 and for the years ended December 31, 2013, 2012, 2011, 2010 and 2009 have been derived from our audited consolidated financial statements and the related notes appearing elsewhere in this Annual Report, which have been prepared in accordance with IFRS as issued by the IASB. Our historical results are not necessarily indicative of results to be expected for future periods.
This financial data should be read in conjunction with our audited consolidated financial statements and the related notes appearing elsewhere in this Annual Report and Item 5, "Operating and Financial Review and Prospects" below.
1
Consolidated Statement of Income Data
| | Year Ended December 31, | ||||||||||
|---|---|---|---|---|---|---|---|---|---|---|---|
| | 2013 | 2012 | 2011 | 2010 | 2009 | ||||||
| | (In $ million, except share and per share data) | ||||||||||
| | Restated under IAS 19R | ||||||||||
Continuing operations | |||||||||||
Revenue: | |||||||||||
Elektron | $219.7 | $265.3 | $287.5 | $203.5 | $184.8 | ||||||
Gas Cylinders | 261.6 | 246.3 | 223.3 | 199.2 | 186.5 | ||||||
| | | | | | | | | | | | |
| $481.3 | $511.6 | $510.8 | $402.7 | $371.3 | |||||||
Cost of sales | (363.5 | ) | (385.7 | ) | (390.4 | ) | (305.1 | ) | (295.7 | ) | |
| | | | | | | | | | | | |
Gross profit | 117.8 | 125.9 | 120.4 | 97.6 | 75.6 | ||||||
Other income/(costs) | — | — | 2.0 | 0.1 | 0.1 | ||||||
Distribution costs | (6.5 | ) | (6.9 | ) | (7.3 | ) | (7.4 | ) | (6.8 | ) | |
Administrative expenses | (52.2 | ) | (50.4 | ) | (51.2 | ) | (45.5 | ) | (40.4 | ) | |
Share of results of joint venture | 0.1 | (0.1 | ) | (0.2 | ) | (0.1 | ) | (0.1 | ) | ||
| | | | | | | | | | | | |
Trading profit(1) | $59.2 | $68.5 | $63.7 | $44.7 | $28.4 | ||||||
Restructuring and other income (expense)(2) | (2.7 | ) | (2.1 | ) | 0.2 | (0.8 | ) | (1.1 | ) | ||
| | | | | | | | | | | | |
Operating profit | $56.5 | $66.4 | $63.9 | $43.9 | $27.3 | ||||||
Acquisition costs(3) | (0.1 | ) | (0.6 | ) | — | — | (0.5 | ) | |||
Disposal costs of intellectual property(4) | — | (0.2 | ) | (0.2 | ) | (0.4 | ) | — | |||
Finance income: | |||||||||||
Interest received | 0.3 | 0.2 | 0.2 | 0.2 | 0.2 | ||||||
Gain on purchase of own debt | — | — | — | 0.5 | — | ||||||
Finance costs: | |||||||||||
Interest costs | (6.2 | ) | (6.7 | ) | (9.2 | ) | (9.6 | ) | (11.8 | ) | |
IAS 19 retirement benefits finance charge | (3.8 | ) | (3.6 | ) | (1.9 | ) | (2.6 | ) | — | ||
| | | | | | | | | | | | |
Profit on operations before taxation | $46.7 | $55.5 | $52.8 | $32.0 | $15.2 | ||||||
Tax expense | (12.6 | ) | (16.0 | ) | (12.5 | ) | (8.9 | ) | (5.7 | ) | |
| | | | | | | | | | | | |
Net income for the year | $34.1 | $39.5 | $40.3 | $23.1 | $9.5 | ||||||
| | | | | | | | | | | | |
| | | | | | | | | | | | |
Profit for the year attributable to controlling interests | $34.1 | $39.5 | $40.3 | $23.1 | $9.5 | ||||||
Profit from continuing operations per ordinary share(5): | |||||||||||
Basic | $2.54 | $3.68 | $4.08 | $2.34 | $0.97 | ||||||
Diluted | $2.43 | $3.61 | $4.04 | $2.33 | $0.96 | ||||||
Weighted average ordinary shares outstanding(5): | |||||||||||
Basic | 13,407,077 | 10,741,677 | 9,884,145 | 9,851,204 | 9,824,326 | ||||||
Diluted | 14,023,201 | 10,927,446 | 9,980,055 | 9,919,104 | 9,894,726 | ||||||
Dividends declared and paid during the year per share(6): | $0.80 | $0.59 | — | — | — | ||||||
2
Consolidated Balance Sheet Data
| | As of December 31, | ||||||||||
|---|---|---|---|---|---|---|---|---|---|---|---|
| | 2013 | 2012 | 2011 | 2010 | 2009 | ||||||
| | (In $ million) | ||||||||||
Total assets | $396.1 | $390.5 | $364.3 | $296.6 | $273.7 | ||||||
Total liabilities | 204.4 | 241.7 | 299.5 | 231.4 | 238.0 | ||||||
Total equity | 191.7 | 148.8 | 64.8 | 65.2 | 35.7 | ||||||
Cash and short term deposits | 28.4 | 40.2 | 22.2 | 10.3 | 2.9 | ||||||
Non-current bank and other loans | (63.8 | ) | (63.5 | ) | (129.4 | ) | — | (10.1 | ) | ||
Senior Loan Notes due 2012 | — | — | — | (106.3 | ) | (115.8 | ) | ||||
Current bank and other loans | — | — | (3.1 | ) | (9.6 | ) | — | ||||
| | | | | | | | | | | | |
Net debt | $(35.4 | ) | $(23.3 | ) | $(110.3 | ) | $(105.6 | ) | $(123.0 | ) | |
| | | | | | | | | | | | |
| | | | | | | | | | | | |
Non-GAAP Financial Measures
| | Year ended December 31, | ||||||||||
|---|---|---|---|---|---|---|---|---|---|---|---|
| | 2013 | 2012 | 2011 | 2010 | 2009 | ||||||
| | (In $ million) | ||||||||||
Net revenue(7): | |||||||||||
Elektron | $211.3 | $224.8 | $217.7 | $200.3 | $184.8 | ||||||
Gas Cylinders | 261.6 | 246.3 | 223.3 | 199.2 | 186.5 | ||||||
| | | | | | | | | | | | |
| $472.9 | $471.1 | $441.0 | $399.5 | $371.3 | |||||||
| | | | | | | | | | | | |
| | | | | | | | | | | | |
Trading profit(1): | |||||||||||
Elektron | $40.2 | $52.8 | $52.5 | $32.8 | $23.3 | ||||||
Gas Cylinders | 19.0 | 15.7 | 11.2 | 11.9 | 5.1 | ||||||
| | | | | | | | | | | | |
| $59.2 | $68.5 | $63.7 | $44.7 | $28.4 | |||||||
| | | | | | | | | | | | |
| | | | | | | | | | | | |
Adjusted net income(8) | $39.8 | $44.7 | $41.1 | $25.1 | $10.5 | ||||||
Adjusted EBITDA(8) | 76.6 | 83.2 | 78.2 | 58.6 | 42.2 | ||||||
Adjusted net income per ADS outstanding(9): | |||||||||||
Basic | $1.48 | $2.08 | $2.08 | $1.27 | $0.53 | ||||||
Diluted | $1.42 | $2.05 | $2.06 | $1.27 | $0.53 | ||||||
Equivalent weighted average ADS outstanding(9): | |||||||||||
Basic | 26,814,154 | 21,483,354 | 19,768,290 | 19,702,408 | 19,648,652 | ||||||
Diluted | 28,046,402 | 21,854,892 | 19,960,110 | 19,838,208 | 19,789,452 | ||||||
- (1)
- Trading profit is defined as operating profit before restructuring and other income (expense). Trading profit is the "segment profit" performance measure used by our chief operating decision maker as required under IFRS 8 for divisional segmental analysis. Management also believes that the presentation of group trading profit is useful to investors because it is a key performance indicator used by management to measure financial performance. See "Note 2—Revenue and segmental analysis" in our audited consolidated financial statements included elsewhere in this Annual Report.
3
- (2)
- Restructuring and other income (expense)
| | 2013 | 2012 | 2011 | 2010 | 2009 | ||||||
|---|---|---|---|---|---|---|---|---|---|---|---|
| | ($ millions) | ||||||||||
(Charged) / Credited to Operating Profit | |||||||||||
Rationalization of operations | (0.5 | ) | (1.3 | ) | — | (0.2 | ) | (1.1 | ) | ||
IPO related share based compensation charges | (0.5 | ) | (0.8 | ) | — | — | — | ||||
Non-trade legal & professional costs | — | — | (1.4 | ) | — | — | |||||
(Charges)/credits on retirement benefit obligations | (1.7 | ) | — | 1.6 | — | — | |||||
Loss on disposal of property, plant and equipment | — | — | — | (0.6 | ) | — | |||||
| | | | | | | | | | | | |
| $(2.7 | ) | $(2.1 | ) | $0.2 | $(0.8 | ) | $(1.1 | ) | |||
| | | | | | | | | | | | |
| | | | | | | | | | | | |
Rationalization of operations—In 2013 the Gas Cylinders division incurred $0.3 million of rationalization costs (2012: $1.1 million, 2011 and 2010: $nil, 2009: $0.1 million) in relation to the former Dynetek operations while in the same period the Elektron division incurred a $0.2 million of rationalization costs (2012: $0.2 million, 2011: $nil, 2010: $0.2 million, 2009: $1.0 million) in relation to restructuring activities.
IPO related share based compensation charges—In 2013, a charge of $0.5 million (2012: $0.8 million) was recognized in the income statement under IFRS 2 in relation to share options granted as part of the initial public offering.
Non-trade legal and professional costs—In 2011, the Group incurred legal, audit and professional costs of $2.8 million in relation to the IPO and regulatory and legal documentation to support the transaction. Of this, $1.4 million was expensed in the year mainly in relation to historical audit work and $1.4 million was deferred to be taken against share premium when the IPO took place in 2012.
Charges/credits on retirement benefit obligations—In 2013, deferred members of the US pension plans were offered the option of a lump sum in respect of their benefits in the plan. The settlement of the pension liabilities resulted in a non-cash charge to the income statement of $1.7 million. In 2011, retired members of the Luxfer Group Pension Plan, the principal defined benefit plan in the U.K., were offered the option of altering the structure of their pension by receiving an immediate uplift in their pension in return for giving up rights to a portion of their future inflation-related pension increases. This resulted in a non-cash gain of $1.6 million .
Loss on disposal of property, plant and equipment—In 2010, a charge of $0.6 million, net of proceeds from a third party lessee of the building, was made for the demolition of a vacant property owned by the Group.
For further information, see also "Note 5—Other income (expense) items" in our audited consolidated financial statements appearing elsewhere in this Annual Report.
- (3)
- Acquisition costs—In 2013, a net acquisition cost of $0.1 million (2012: $0.6 million) was recognized by the Gas Cylinder division in relation to the acquisition of Dynetek Industries Limited ("Dynetek"). In 2009, $0.5 million of costs were incurred by the Elektron division in relation to the 2007 acquisition of Revere Graphics Worldwide ("Revere").
- (4)
- Disposal costs of intellectual property—In 2012, the Elektron division incurred costs of $0.2 million (2011: $0.2 million, 2010: $0.4 million) in relation to the sale process of intellectual property in the U.S. acquired as part of the 2007 acquisition of Revere.
- (5)
- Basic and diluted earnings per ordinary share—For further information, see "Note 10—Earnings per share" to our audited consolidated financial statements. We calculate earnings per share in accordance
4
with IAS 33. Basic earnings per share is calculated based on the weighted average ordinary shares outstanding for the period presented. The weighted average of ordinary shares outstanding is calculated by time-apportioning the shares outstanding during the year. For the purpose of calculating diluted earnings per share, the weighted average ordinary shares outstanding during the period presented has been adjusted for the dilutive effect of all share options granted to employees. In calculating the diluted weighted average ordinary shares outstanding, there are no shares that have not been included for anti-dilution reasons.
- (6)
- Dividends declared and paid in the year—In 2013, four interim dividends of $0.20 per share were declared and payments took place on February 6, May 8, August 7, and November 6.
- (7)
- Net revenue—Net Revenue is defined as revenue excluding rare earth surcharges and the following table presents a reconciliation from Revenue to Net Revenue.
| | Year Ended December 31, | ||||||||||
|---|---|---|---|---|---|---|---|---|---|---|---|
| | 2013 | 2012 | 2011 | 2010 | 2009 | ||||||
| | (In $ million, except share and per share data) | ||||||||||
| | Restated under IAS 19R | ||||||||||
Revenue: | |||||||||||
Elektron | $219.7 | $265.3 | $287.5 | $203.5 | $184.8 | ||||||
Gas Cylinders | 261.6 | 246.3 | 223.3 | 199.2 | 186.5 | ||||||
| | | | | | | | | | | | |
| $481.3 | $511.6 | $510.8 | $402.7 | $371.3 | |||||||
Surcharge | |||||||||||
Elektron | 8.4 | 40.5 | 69.8 | 3.2 | — | ||||||
Gas Cylinders | — | — | — | — | — | ||||||
| | | | | | | | | | | | |
| 8.4 | 40.5 | 69.8 | 3.2 | — | |||||||
Net revenue(7): | |||||||||||
Elektron | 211.3 | 224.8 | 217.7 | 200.3 | 184.8 | ||||||
Gas Cylinders | 261.6 | 246.3 | 223.3 | 199.2 | 186.5 | ||||||
| | | | | | | | | | | | |
| $472.9 | $471.1 | $441.0 | $399.5 | $371.3 | |||||||
| | | | | | | | | | | | |
| | | | | | | | | | | | |
5
- (8)
- Non-GAAP financial measures—The following tables present a reconciliation of Adjusted net income and Adjusted EBITDA to net income, the most comparable IFRS measure.
| | Year Ended December, 31 | ||||||||||
|---|---|---|---|---|---|---|---|---|---|---|---|
| | 2013 | 2012 | 2011 | 2010 | 2009 | ||||||
| | ($ millions) | ||||||||||
| | Restated under IAS 19R | ||||||||||
Net income for the year | $34.1 | $39.5 | $40.3 | $23.1 | $9.5 | ||||||
IAS 19 retirement benefits finance charge | 3.8 | 3.6 | 1.9 | 2.6 | — | ||||||
Acquisitions | 0.1 | 0.6 | — | — | 0.5 | ||||||
Disposal costs of intellectual property | — | 0.2 | 0.2 | 0.4 | — | ||||||
Restructuring and other income / (expense) | 2.7 | 2.1 | (0.2 | ) | 0.8 | 1.1 | |||||
Gain on purchase of own debt | — | — | — | (0.5 | ) | — | |||||
Other share based compensation charges | 1.3 | — | — | — | — | ||||||
Tax thereon | (2.2 | ) | (1.3 | ) | (1.1 | ) | (1.3 | ) | (0.6 | ) | |
| | | | | | | | | | | | |
Adjusted net income | $39.8 | $44.7 | $41.1 | $25.1 | $10.5 | ||||||
Add back: | |||||||||||
Tax thereon | 2.2 | 1.3 | 1.1 | 1.3 | 0.6 | ||||||
Tax expense | 12.6 | 16.0 | 12.5 | 8.9 | 5.7 | ||||||
Interest costs | 6.2 | 6.7 | 9.2 | 9.6 | 11.8 | ||||||
Interest received | (0.3 | ) | (0.2 | ) | (0.2 | ) | (0.2 | ) | (0.2 | ) | |
Depreciation & amortization | 15.8 | 14.7 | 14.5 | 13.9 | 13.8 | ||||||
Loss on disposal of property, plant and equipment | 0.3 | — | — | — | — | ||||||
| | | | | | | | | | | | |
Adjusted EBITDA | $76.6 | $83.2 | $78.2 | $58.6 | $42.2 | ||||||
| | | | | | | | | | | | |
| | | | | | | | | | | | |
Adjusted net income consists of net income adjusted for the post tax impact of non-trading items, including IAS 19 retirement benefits finance charge, acquisition costs, disposal costs of intellectual property, restructuring and other income / (expense), gain on purchase of own debt and other share based compensation charges.
Adjusted EBITDA consists of net income before tax expense, interest costs, interest received, IAS 19 retirement benefits finance charge, acquisition costs, disposal costs of intellectual property, restructuring and other income / (expense), gain on purchase of own debt, other share-based compensation charges, depreciation and amortization and loss on disposal of property, plant and equipment. Depreciation and amortization amounts include impairments to fixed assets, and they are reflected in our financial statements as increases in accumulated depreciation or amortization.
We prepare and present Adjusted net income and Adjusted EBITDA to eliminate the effect of items that we do not consider indicative of our core operating performance. Management believes that each of Adjusted net income and Adjusted EBITDA is a key performance indicator used by the investment community and that the presentation of Adjusted net income and Adjusted EBITDA will enhance an investor's understanding of our results of operations. However, Adjusted net income and Adjusted EBITDA should not be considered in isolation by investors as an alternative to profit for the year, as an indicator of our operating performance or as a measure of our profitability. Adjusted net income and Adjusted EBITDA are not measures of financial performance under IFRS, may not be indicative of historic operating results and are not meant to be predictive of potential future results. Adjusted net income and Adjusted EBITDA measures presented herein may not be comparable to other similarly titled measures of other companies. While Adjusted net income and Adjusted EBITDA are not measures of financial performance under IFRS, Adjusted net income and Adjusted EBITDA presented have been computed using IFRS amounts.
6
- (9)
- Basic and diluted adjusted earnings per ADS—For further information, see "Note 10—Earnings per share" to our audited consolidated financial statements. As at December, 31 2013, 91% of our equity was held via American Depository Shares ("ADS") listed on the New York Stock Exchange under the ticker LXFR. We believe analysis of our results per ADS is therefore relevant to the vast majority of our equity investors. We calculate both earnings and adjusted earnings per ordinary share and per ADS to enable those equity holders to understand the Group's earnings and adjusted earnings as a proportion of their equity investment held and easier reference to the share price quoted on the NYSE, which is also per ADS. We believe the use of non-GAAP financial measures such as adjusted earnings per ADS more closely reflects the underlying earnings per ADS performance and is a financial measure widely used by both investors and financial analysts of the company's ADSs.
B. Capitalization and Indebtedness
Not applicable.
C. Reasons for the Offer and Use of Proceeds
Not applicable.
D. Risk Factors
You should carefully consider the following risk factors described below, together with all of the other information in this Annual Report, including our consolidated financial statements and the related notes appearing elsewhere in this Annual Report, before investing in our American Depositary Shares ("ADSs"). The risks and uncertainties described below are those significant risk factors, currently known and specific to us that we believe are relevant to an investment in our securities. If any of these risks materialize, our business, financial condition or results of operations could suffer, the price of our ADSs could decline and you could lose part or all of your investment. Additional risks and uncertainties not currently known to us or those we now deem immaterial may also harm us and adversely affect your investment in our ADSs.
Risks Relating to Our Operations
We depend on certain end-markets, including the automotive, self-contained breathing apparatus, aerospace and defense, medical and printing and paper end-markets and an economic downturn or regulatory changes in any of those end-markets could reduce sales.
We have significant exposures to certain key end-markets, including some end-markets that are cyclical in nature or subject to high levels of regulatory control. To the extent that any of these cyclical end-markets are in decline, at a low point in their economic cycle or subject to regulatory change, sales may be adversely affected and thereby negatively affect our ability to fund our business operations and service our indebtedness. It is possible that all or most of these end-markets could be in decline at the same time, such as during a recession, which could significantly harm our financial condition and result of operations due to decreased sales. For example, 27% of our 2013 sales were related to automotive end-markets, 14% to self-contained breathing apparatus ("SCBA") end-market, 14% to the aerospace and defense end-markets, 8% to medical end-markets (including portable oxygen) and 9% to the printing and paper end-markets. Together, these five markets accounted for approximately 72% of our 2013 revenues. Dependence of either of our divisions on certain end-markets is even more pronounced. For example, in 2013, excluding rare earth surcharges, 28% of the Elektron division's sales were to customers in the automotive end-market, which slumped in 2009 and although global automotive production has since improved, European production has not risen back to pre-recession levels.
7
Our global operations expose us to economic conditions, political risks and specific regulations in the countries in which we operate, which could have a material adverse impact on our business, financial condition and results of operations.
We derive our revenues and earnings from operations in many countries and are subject to risks associated with doing business internationally. We have wholly-owned facilities in the United Kingdom, the United States, Canada, France, Germany, the Czech Republic and China and joint venture facilities in India, South Korea, Japan and the United States. Doing business in different countries has risks, including the potential for adverse changes in the local political, financial or regulatory climate, difficulty in staffing and managing geographically diverse operations, and the costs of complying with a variety of laws and regulations. Because we have operations in many countries, we are also liable to pay taxes in many fiscal jurisdictions. Our tax burden on us depends on the interpretation of local tax regulations, bilateral or multilateral international tax treaties and the administrative doctrines in each jurisdiction. Changes in these tax regulations may increase our tax burden.
Moreover, the principal markets for our products are located in North America, Europe and Asia, and any financial difficulties experienced in these markets may have a material adverse impact on our businesses. The maturity of some of our markets, particularly the U.S. medical oxygen cylinder market and the European fire extinguisher market, could require us to increase sales in developing regions, which may involve greater economic and political risks. We cannot provide any assurances that we will be able to expand sales in these regions.
Our operations rely on a number of large customers in certain areas of our business, and the loss of any of our major customers could negatively impact our sales.
If we fail to maintain our relationships with our major customers, or fail to replace lost customers, or if there is reduced demand from our customers or for the products produced by our customers, such failures or reduced demand could reduce our sales and have a material adverse effect on our financial condition and results of operations. In addition, we could experience a reduction in sales if any of our customers fail to perform or default on any payment pursuant to our contracts with them. Long-term relationships with customers are especially important for suppliers of intermediate materials and components such as us. We often work closely with customers to develop products that meet particular specifications as part of the design of a product intended for the end-user market. The bespoke nature of many of our products could make it difficult to replace lost customers. Our top ten customers accounted for 30% of our revenue in 2013.
Competitive pressures can materially and adversely affect our sales, profit margins, financial condition and results of operations.
The markets for many of our products are now increasingly global and highly competitive, especially in terms of quality, price and service. We could lose market share as a result of these competitive pressures which could materially and adversely affect our sales, profit margins, financial condition and results of operations.
Because of the highly competitive nature of some of the markets in which we operate, we may have difficulty raising customer prices to offset increases in costs of raw materials. For example, the U.S. medical oxygen cylinder market has a number of dedicated producers with excess capacity, making it very difficult for us to raise customer prices to offset aluminum cost increases. In addition, rising aluminum prices could lead to the development of alternative products that use lower cost materials, which could become favored by end-market users. In recent years, we have also experienced increased competition from developing markets where manufacturers may benefit from lower labor costs. Competitors with operations in these regions may be able to produce goods at a relatively lower cost, which may enable them to offer highly competitive selling prices.
8
More generally, we may face potential competition from producers that manufacture products similar to our aluminum-, magnesium- and zirconium-based products using other materials, such as steel, plastics, composite materials or other metals, minerals and chemicals. Products manufactured by competitors using different materials might compete with our products in terms of price, weight, engineering characteristics, recyclability or other grounds.
Competition with respect to less complex zirconium chemicals has been particularly intense, with Chinese suppliers providing low cost feedstock to specialist competitors, making it especially difficult to compete in commodity products such as paint drying additives. Chinese magnesium also continues to be imported into Europe in large volumes, which may impact our competitive position in Europe regarding certain magnesium alloys. We are also affected by Western-based competitors that have chosen to relocate production to Asia to take advantage of lower labor costs.
Other parts of our operations manufacture and sell products that satisfy customer specifications. Competitors may develop lower cost or better-performing products and customers may not be willing to pay a premium for the advantages offered by our products.
In addition, governments may impose import and export restrictions, grant subsidies to local companies and implement tariffs and other trade protection regulations and measures that may give competitive advantages to certain of our competitors and adversely affect our business.
We depend upon our larger suppliers for a significant portion of our raw materials, and a loss of one of these suppliers or a significant supply interruption could negatively impact our financial performance.
Failure to maintain relationships with key suppliers or to develop relationships with other suppliers could negatively affect our financial condition or results of operations. We rely, to varying degrees, on major suppliers for some of the principal raw materials of our engineered products, including aluminum, zirconium and carbon fiber. For example, in 2013, we obtained 57% of our aluminum, the largest single raw material purchased by the Gas Cylinders division, from Rio Tinto Alcan and its associated companies. Moreover, demand for carbon fiber is increasing rapidly, leading to occasional periods of short supply in recent years, with a number of expanding applications competing for the same supply of this specialized raw material. We currently purchase most of our carbon fiber from Toray and Garfil, a subsidiary of Mitsubishi Chemical. For additional details of some of our major suppliers see "Item 4.B. Business Overview".
We generally purchase raw materials from suppliers on a spot basis, under standard terms and conditions. We have recently agreed to a one-year supply contract with Rio Tinto Alcan for a substantial portion of our aluminum requirements. We also have a five-year magnesium supply contract for a portion of our magnesium requirements with U.S. Magnesium that expires on December 31, 2014.
An interruption in the supply of essential materials used in our production processes, or an increase in the prices of materials due to market shortages, government quotas or natural disturbances, could significantly affect our ability to provide competitively priced products to customers in a timely manner, and thus have a material adverse effect on our business, results of operations or financial condition. In the event of a significant interruption in the supply of any materials used in our production processes, or a significant increase in their prices (as we have experienced, for example, at different times with aluminum, magnesium and rare earths), we may have to purchase these materials from alternative sources, build additional inventory of the raw materials, increase our prices, reduce our profit margins or possibly fail to fill customer orders by the deadlines required in contracts. We can provide no assurance that we would be able to obtain replacement materials quickly on similar terms or at all.
9
We are exposed to fluctuations in the prices of the raw materials that are used to manufacture our products, and such fluctuations in raw material prices could lead us to incur unexpected costs and could affect our margins or our results of operations.
The primary raw material used in the manufacturing of gas cylinders and superformed panels is aluminum. The price of aluminum is subject to both short-term price fluctuations and to longer-term cyclicality as a result of international supply and demand relationships. Although the London Metal Exchange ("LME") three-month price of aluminum has decreased from $2,419 per metric ton in 2011 to $2,049 per metric ton in 2012 and decreased to $1,887 per metric ton in 2013, it has increased significantly in the past, including from an average of $1,701 per metric ton in 2009 to $2,198 per metric ton in 2010. We have experienced significant price increases and volatility in other raw material costs in the last few years such as primary magnesium, carbon fiber, zircon sand and rare earths. For example, starting in mid-2010, Chinese authorities greatly reduced the export quota for rare earths, which resulted in volatility and an increase in the price of cerium carbonate. See "Item 4.B. Business Overview".
Fluctuations in the prices of these raw materials could affect margins in the businesses in which we use them. See "Item 5. Operating and Financial Review and Prospects." We cannot always pass on price increases or increase our prices to offset increases in raw material immediately or at all, whether because of fixed price agreements with customers, competitive pressures that restrict our ability to pass on cost increases or increase prices, or other factors. It can be particularly difficult to pass on price increases or increase prices in product areas such as gas cylinders, where competitors offer similar products made from alternative materials, such as steel, if those materials are not subject to the same cost increases. As a result, a substantial increase in raw material costs could have a material adverse effect on our financial condition and results of operations. In such an event, there might be less cash available than necessary to fund our business operations effectively or to service our indebtedness. In addition, higher prices necessitated by large increases in raw material costs could make our current, or future, products unattractive compared to competing products made from alternative materials that have not been so affected by raw material cost increases or compared to products produced by competitors who have not incurred such large increases in their raw material costs. Currently we use derivative financial instruments to hedge our exposures to fluctuations in aluminum prices. Although it is our treasury policy to enter into these transactions only for hedging, and not for speculative purposes, we are exposed to market risk and credit risk with respect to the use of these derivative financial instruments. If the price of aluminum were to rise, our increased exposure to changes in aluminum prices could have a material adverse impact on our results of operations to the extent that we cannot pass price increases on to our customers or manage exposure effectively through hedging instruments. See "Item 11. Quantitative & Qualitative Disclosures About Market Risk." In addition, if we have hedged our metal position, a fall in the price of aluminum might give rise to hedging margin calls to the detriment of our borrowing position.
In the past few years we have made additional purchases of large stocks of magnesium and some rare earth chemicals in an effort to delay the effect of potentially increased prices in the future. However, even though such purchases are not made for speculative purposes, there can be no assurance that prices will move as expected. Moreover, these strategic purchases increase our working capital needs, reducing our liquidity and cash flow and potentially resulting in an increased drawdown on our revolving credit facility (the "Revolving Credit Facility").
We are exposed to fluctuations in the prices of utilities that are used in the manufacture of our products, and such fluctuations in utility prices could lead us to incur unexpected costs and could affect our margins or our results of operations.
Our utility costs, which constitute another major input cost of our total expenses and include costs related to electricity, natural gas and water, may be subject to significant variations. The emergence of financial speculators in energy, increased taxation and other factors have contributed to a significant increase in utility costs for us, particularly with respect to the price that we pay for our U.K. energy supplies.
10
Fluctuations in the prices of these utility costs could affect margins in the businesses in which we use them. We cannot always pass on price increases or increase our prices to offset increases in utility costs immediately or at all, whether because of fixed price agreements with customers, competitive pressures that restrict our ability to pass on cost increases or increase prices, or other factors. It can be particularly difficult to pass on price increases or increase prices in product areas such as gas cylinders, where competitors offer similar products made from alternative materials, such as steel, if those materials are not subject to the same cost increases. As a result, a substantial increase in utility costs could have a material adverse effect on our financial condition and results of operations. In such an event, there might be less cash available than necessary to fund our business operations effectively or to service our indebtedness.
Changes in foreign exchange rates could reduce margins on our sales, reduce the reported revenues of our non-U.S. operations and have a material adverse effect on our results of operations.
We conduct a large portion of our commercial transactions, purchases of raw materials and sales of goods in various countries and regions, including the United Kingdom, the United States, continental Europe, Australia and Asia. Our manufacturing operations based in the United States, continental Europe and Asia usually sell goods denominated in their local currency, but our manufacturing operations in the United Kingdom purchase raw materials and sell products often in currencies other than pound sterling. Changes in the relative values of currencies can decrease the profits of our subsidiaries when they incur costs in currencies that are different from the currencies in which they generate all or part of their revenue. These transaction risks principally arise as a result of purchases of raw materials in U.S. dollars, coupled with sales of products to customers in euros. This impact is most pronounced in our exports to continental Europe from the United Kingdom. In 2013, our U.K. operations sold approximately €37.2 million of goods into the euro zone. Our policy is to hedge a portion of our net exposure to fluctuations in exchange rates with forward foreign currency exchange contracts. Therefore, we are exposed to market risk and credit risk through the use of derivative financial instruments. Any failure of hedging policies could negatively impact our profits, and thus damage our ability to fund our operations and to service our indebtedness.
In addition to subsidiaries and joint ventures in the United States, we have subsidiaries located in the United Kingdom, France, Germany, the Czech Republic, Canada and China, as well as joint ventures in Japan, South Korea and India, whose revenue, costs, assets and liabilities are denominated in local currencies. Because our consolidated accounts are reported in U.S. dollars, we are exposed to fluctuations in those currencies when those amounts are translated to U.S. dollars for purposes of reporting our consolidated accounts, which may cause declines in results of operations. The largest risk is from our operations in the United Kingdom, which in 2013 generated operating profits of $14.3 million from sales revenues of $137.8 million. Fluctuations in exchange rates, particularly between the U.S. dollar and the pound sterling, can have a material effect on our consolidated income statement and balance sheet. In 2013 movements in the average U.S. dollar exchange rate had a negative impact on revenues of $1.5 million while in 2012 movements in the average U.S. dollar exchange rate had a negative impact on reported revenues of $6.2 million. Changes in translation exchange rates increased net assets by $3.1 in 2013 and $2.9 million in 2012. For additional information on these risks and the historical impact on our results see "Item 11. Quantitative & Qualitative Disclosure About Market Risk."
Our defined benefit pension plans have significant funding deficits and are exposed to market forces that could require us to make increased ongoing cash contributions in response to changes in market conditions, actuarial assumptions and investment decisions and that could expose us to significant short-term liabilities if a wind-up trigger occurred in relation to such plans, each of which could have a material adverse effect on our financial condition and results of operations.
We have defined benefit pension arrangements in the United Kingdom, the United States and France. See "Note 28" of the audited consolidated financial statements appearing elsewhere in this Annual Report. Our largest defined benefit plan, the Luxfer Group Pension Plan, which closed to new members in 1998 but
11
remains open for accrual of future benefits based on career-average salary, is funded according to the regulations in effect in the United Kingdom and, as of December 31, 2013 and December 31, 2012, had an IAS 19 accounting deficit of $61.4 million and $76.8 million, respectively. Luxfer Group Limited is the principal employer under the Luxfer Group Pension Plan, and other U.K. subsidiaries also participate under the plan. Our other defined benefit plans are less significant than the Luxfer Group Pension Plan and, as of December 31, 2013 and December 31, 2012, had an IAS 19 accounting deficit of $6.2 million and $19.9 million, respectively. The largest of these additional plans is the BA Holdings, Inc. Pension Plan in the United States, which was closed to further benefit accruals in December 2005. According to the actuarial valuation of the Luxfer Group Pension Plan as at April 5, 2012, the Luxfer Group Pension Plan had a deficit of £50.1 million on the plan specific basis. Should a wind-up trigger occur in relation to the Luxfer Group Pension Plan, the buy-out deficit of that plan will become due and payable by the employers. The aggregate deficit of the Luxfer Group Pension Plan on a buy-out basis was estimated at £140 million as at April 5, 2012. The trustees have the power to wind-up the Luxfer Group Pension Plan if they consider that in the best interests of members there is no reasonable purpose in continuing the Luxfer Group Pension Plan.
We are exposed to various risks related to our defined benefit plans, including the risk of loss of market value of the plan assets, the risk of actual investment returns being less than assumed rates of return, the trustees of the Luxfer Group Pension Plan switching investment strategy (which does require consultation with the employer) and the risk of actual experience deviating from actuarial assumptions for such things as mortality of plan participants. In addition, fluctuations in interest rates cause changes in the annual cost and benefit obligations. As a result of the actuarial valuation as at April 5, 2012, we are required to make increased ongoing cash contributions, over and above the normal contributions required to meet the cost of future accrual, to the Luxfer Group Pension Plan. These additional payments are intended to reduce the funding deficit. We have agreed with the trustees to a schedule of payments to reduce the deficit. This schedule has been provided to, and confirmed by, the UK Pensions Regulator (the "Pensions Regulator"). The schedule of payments provides for minimum annual contributions of £3.4 million per year, together with additional variable contributions based on one-fifth of net earnings of Luxfer Holdings PLC, in the previous calendar year, in excess of £12 million. The total contributions are subject to an annual cap of £5 million. These contribution rates are to apply until the deficit is eliminated (expected to take between 10 and 12 years, depending on the variable contributions), but in practice the schedule will be reviewed, and may be revised, following the next triennial actuarial valuation. There is a limited ability to delay payments in the event of another severe economic downturn. Regulatory burdens have also proven to be a significant risk, such as the United Kingdom's Pension Protection Fund ("PPF") Levy, which was $1.2 million in 2013. Although they do not carry the same risks to the Company, we have offered new employees membership in defined contribution pension arrangements or 401(k) arrangements following closure of the defined benefit plans described above.
The Pensions Regulator in the United Kingdom has power in certain circumstances to issue contribution notices or financial support directions which, if issued, could result in significant liabilities arising for us.
The Pensions Regulator may issue a contribution notice to the employers that participate in the Luxfer Group Pension Plan or any person who is connected with or is an associate of these employers where the Pensions Regulator is of the opinion that the relevant person has been a party to an act, or a deliberate failure to act, which had as its main purpose (or one of its main purposes) the avoidance of pension liabilities or where such act has a materially detrimental effect on the likelihood of payment of accrued benefits under the Luxfer Group Pension Plan being received. A person holding alone or together with his or her associates directly or indirectly one-third or more of our voting power could be the subject of a contribution notice. The terms "associate" and "connected person," which are taken from the Insolvency Act 1986, are widely defined and could cover our significant shareholders and others deemed to be shadow directors. If the Pensions Regulator considers that a plan employer is "insufficiently resourced" or a
12
"service company" (which terms have statutory definitions), it may impose a financial support direction requiring such plan's employer or any member of the Group, or any person associated or connected with an employer, to put in place financial support in relation to the Luxfer Group Pension Plan. Liabilities imposed under a contribution notice or financial support direction may be up to the difference between the value of the assets of the Luxfer Group Pension Plan and the cost of buying out the benefits of members and other beneficiaries of the Luxfer Group Pension Plan. In practice, the risk of a contribution notice being imposed may restrict our ability to restructure or undertake certain corporate activities. Additional security may also need to be provided to the trustees of the Luxfer Group Pension Plan before certain corporate activities can be undertaken (such as the payment of an unusual dividend) and any additional funding of the Luxfer Group Pension Plan may have an adverse effect on our financial condition and the results of our operations.
Our ability to remain profitable depends on our ability to protect and enforce our intellectual property, and any failure to protect and enforce such intellectual property could have a material adverse impact on our business, financial condition and results of operations.
We cannot ensure that we will always have the ability to protect proprietary information and our intellectual property rights. We protect our intellectual property rights (within the United States, Europe and other countries) through various means, including patents and trade secrets. Because of the difference in foreign trademark, patent and other laws concerning proprietary rights, our intellectual property rights may not receive the same degree of protection in other countries as they would in the United States or the United Kingdom. The patents we own could be challenged, invalidated or circumvented by others and may not be of sufficient scope or strength to provide us with any meaningful protection or commercial advantage. Further, we cannot assure you that competitors will not infringe our patents, or that we will have adequate resources to enforce our patents. Our failure to obtain or maintain adequate protection of our intellectual property rights for any reason could have a material adverse effect on our business, results of operations and financial condition. In addition, our patents will only be protected for the duration of the patent. The minimum amount of time remaining in respect to any of our material patents is two years (which relates to certain patents used in our gas cylinder business).
With respect to our unpatented proprietary technology, it is possible that others will independently develop the same or similar technology or obtain access to our unpatented technology. To protect our trade secrets and other proprietary information, we require employees, consultants, advisors and collaborators to enter into confidentiality agreements. Nevertheless, we cannot assure you that these agreements will provide meaningful protection for our trade secrets, know-how or other proprietary information in the event of any unauthorized use, misappropriation or disclosure of such trade secrets, know-how or other proprietary information. If we are unable to maintain the proprietary nature of our technologies, we could be materially adversely affected. Moreover, we rely on our trademarks, trade names, and brand names to distinguish our products from the products of our competitors, and have registered or applied to register many of these trademarks. Third parties may also oppose our trademark applications, or otherwise challenge our use of the trademarks. In the event that our trademarks are successfully challenged, we could be forced to rebrand our products, which could result in loss of brand recognition, and could require us to devote resources to advertising and marketing new brands. Further, we cannot assure you that competitors will not infringe our trademarks, or that we will have adequate resources to enforce our trademarks.
Expiration or termination of our right to use certain intellectual property granted by third parties, the right of those third parties to grant the right to use the same intellectual property to our competitors and the right of certain third parties to use certain intellectual property used as part of our business could have a material adverse impact on our business, financial condition and results of operations.
We have negotiated, and may from time to time in the future negotiate, licenses with third parties with respect to third-party proprietary technologies used in certain of our manufacturing processes and products. If any of these licenses expires or terminates, we will no longer retain the rights to use the relevant third-
13
party proprietary technologies in our manufacturing processes and products, which could have a material adverse effect on our business, results of operations and financial condition. Further, the rights granted to us might be nonexclusive, which could result in our competitors gaining access to the same intellectual property.
Some of our patents may cover inventions that were conceived or first reduced to practice under, or in connection with, government contracts or other government funding agreements or grants. With respect to inventions conceived or first reduced to practice under such government funding agreements, a government may retain a nonexclusive, irrevocable, royalty-free license to practice or have practiced for or on behalf of the relevant country the invention throughout the world. In addition, if we fail to comply with our reporting obligations or to adequately exploit the developed intellectual property under these government funding agreements, the relevant country may obtain additional rights to the developed intellectual property, including the right to take title to any patents related to government funded inventions or to license the same to our competitors. Furthermore, our ability to exclusively license or assign the intellectual property developed under these government funding agreements to third parties may be limited or subject to the relevant government's approval or oversight. These limitations could have a significant impact on the commercial value of the developed intellectual property.
We often enter into research and development agreements with academic institutions where they generally retain certain rights to the developed intellectual property. The academic institutions generally retain rights over the technology for use in non-commercial academic and research fields, including in some cases the right to license the technology to third parties for use in those fields. It is difficult to monitor and enforce such noncommercial academic and research uses, and we cannot predict whether the third-party licensees would comply with the use restrictions of these licenses. We could incur substantial expenses to enforce our rights against such licensees. In addition, even though the rights that academic institutions obtain are generally limited to the noncommercial academic and research fields, they may obtain rights to commercially exploit developed intellectual property in certain instances. Under research and development agreements with academic institutions, our rights to intellectual property developed thereunder is not always certain, but instead may be in the form of an option to obtain license rights to such intellectual property. If we fail to timely exercise our option rights and/or we are unable to negotiate a license agreement, the academic institution may offer a license to the developed intellectual property to third parties for commercial purposes. Any such commercial exploitation could adversely affect our competitive position and have a material adverse effect on our business.
If third parties claim that intellectual property used by us infringes upon their intellectual property, our operating profits could be adversely affected.
We may, from time to time, be notified of claims that we are infringing upon patents, copyrights, or other intellectual property rights owned by third parties, and we cannot provide assurances that other companies will not, in the future, pursue such infringement claims against us or any third-party proprietary technologies we have licensed. If we were found to infringe upon a patent or other intellectual property right, or if we failed to obtain or renew a license under a patent or other intellectual property right from a third party, or if a third party from whom we are licensing technologies was found to infringe upon a patent or other intellectual property rights of another third party, we may be required to pay damages, suspend the manufacture of certain products or reengineer or rebrand our products, if feasible, or we may be unable to enter certain new product markets. Any such claims could also be expensive and time consuming to defend and could divert management's attention and resources. Our competitive position could suffer as a result. In addition, if we have omitted to enter into a valid non-disclosure or assignment agreement for any reason, we may not own the invention or our intellectual property and may not be adequately protected.
14
Any failure of our research and development activity to improve our existing products and develop new products could cause us to lose market share and impact our financial position.
Our products are highly technical in nature, and in order to maintain and improve our market position, we depend on successful research and development activity to continue to improve our existing products and develop new products. We cannot be certain that we will have sufficient research and development capability to respond to changes in the industries in which we operate. These changes could include changes in the technological environment in which we currently operate, increased demand for new products or the development of alternatives to our products. For example, the development of lighter-weight steel alloys has made the use of steel in gas cylinders a more competitive alternative to aluminum than it had been previously. In addition, our superformed aluminum components compete with new high-performance composite materials developed for use in the aerospace industry. Without the timely introduction of new products or enhancements to existing products, our products could become obsolete over time, in which case our business, results of operations and financial condition could be adversely affected. In our efforts to develop and market new products and enhancements to our existing products, we may fail to identify new product opportunities successfully or develop and timely bring new products to market. We may also experience delays in completing development of, enhancements to or new versions of our products and product innovations may not achieve the market penetration or price stability necessary for profitability. In addition to benefiting from our research collaboration with universities, we spent $9.8 million, $8.9 million and $11.1 million (including revenue and capital items but before funding grants received) in 2013, 2012 and 2011, respectively, on our own research and development activities. We expect to fund our future capital expenditure requirements through operating profit cash flows and restricted levels of indebtedness, but if operating profit decreases, we may not be able to invest in research and development or continue to develop new products or enhancements.
Some of our key operational equipment is relatively old and may require significant capital expenditures for repair or replacement.
High levels of maintenance and repair costs could result from the need to maintain our older plants, property and equipment, and machinery breakdowns could result in interruptions to the business causing lost production time and reduced output. Machinery breakdowns or equipment failures may hamper or cause delays in the production and delivery of products to our customers and increase our operating costs, thus reducing cash flow from operations. In particular, the breakdown of some of our older equipment, such as the large hot rolling mill at our Madison, Illinois plant, could be difficult to repair and would be very costly should it need to be replaced. Any failure to deliver products to our customers in a timely manner could adversely affect our customer relationships and reputation. We already incur considerable expense on maintenance, including preventative maintenance, and repairs. Any failure to implement required investments, whether because of requirements to divert funds to repair existing physical infrastructure, debt service obligations, unanticipated liquidity constraints or other factors, could have a material adverse effect on our business and on our ability to service our indebtedness.
Our operations may prove harmful to the environment, and any clean-up or other related costs could have a material adverse effect on our operating results or financial condition.
We are exposed to substantial environmental costs and liabilities, including liabilities associated with divested assets and prior activities performed on sites before we acquired an interest in them. Our operations, including the production and delivery of our products, are subject to a broad range of continually changing environmental laws and regulations in each of the jurisdictions in which we operate. These laws and regulations increasingly impose more stringent environmental protection standards on us with respect to, among other things, air emissions, waste-water discharges, the use and handling of hazardous materials, noise levels, waste disposal practices, soil and groundwater contamination and environmental clean-up. Complying with these regulations involves significant and recurring costs. See
15
"Item 4.B. Business Overview" for details of our environmental management program and the environmental issues that we are currently addressing.
We cannot predict our future environmental liabilities and cannot assure investors that our management is aware of every fact or circumstance regarding potential liabilities or that the amounts provided and budgeted to address such liabilities will be adequate for all purposes. In addition, future developments, such as changes in regulations, laws or environmental conditions, may increase environmental costs and liabilities and could have a material adverse effect on our operating results and consolidated financial position in any given financial year, which could negatively affect our cash flows and hinder our ability to service our indebtedness.
The health and safety of our employees and the safe operation of our businesses is subject to various health and safety regulations in each of the jurisdictions in which we operate. These regulations impose various obligations on us, including the provision of safe working environments and employee training on health and safety matters. Complying with these regulations involves recurring costs.
Certain of our operations are highly regulated by different agencies, which require products to comply with their rules and procedures and can subject our operations to penalties or adversely affect production.
Certain of our operations are in highly regulated industries that require us to maintain regulatory approvals and, from time to time, obtain new regulatory approvals from various countries. This can involve substantial time and expense. In turn, higher costs of compliance reduce our cash flow from operations. For example, manufacturers of gas cylinders throughout the world must comply with high local safety and health standards and obtain regulatory approvals in the markets where they sell their products. In addition, military organizations require us to comply with applicable government regulations and specifications when providing products or services to them directly or as subcontractors. In addition, we are required to comply with U.S. and other export regulations with respect to certain products and materials. The European Union has also passed legislation governing the registration, evaluation and authorization of chemicals, known as REACH, pursuant to which we are required to register chemicals and gain authorization for the use of certain substances. Although we make reasonable efforts to obtain all the licenses and certifications that are required by countries in which we operate, there is always a risk that we may be found not to comply with certain required procedures. This risk grows with increased complexity and variance in regulations across the globe. Because the regulatory schemes vary by country, we may also be subject to regulations of which we are not presently aware and could be subject to sanctions by a foreign government that could materially and adversely affect our operations in the relevant country.
Governments and their agencies have considerable discretion to determine whether regulations have been satisfied. They may also revoke or limit existing licenses and certifications or change the laws and regulations to which we are subject at any time. If our operations fail to obtain, experience delays in obtaining or lose a needed certification or approval, we may not be able to sell our products to our customers, expand into new geographic markets or expand into new product lines, which will ultimately have a material adverse effect on our business, financial position and results of operations. In addition, new or more stringent regulations, if imposed, could have an adverse effect on our results of operations because we may experience difficulty or incur significant costs in connection with compliance. Non-compliance with these regulations could result in administrative, civil, financial, criminal or other sanctions against us, which could have negative consequences on our business and financial position. Furthermore, as we begin to operate in new countries, we may need to obtain new licenses, certifications and approvals.
Our customers are also often subject to similar regulations and risks. We therefore face the risk that our customers may have the demand for their products reduced as a result of regulatory matters which fall outside our direct control. This would in turn reduce demand for our products and have a negative financial impact on our operating results.
16
Legislation and regulation to reduce carbon dioxide and other greenhouse gas emissions may have a material adverse impact on our results of operations, financial condition and cash flows.
Although we are working to improve our energy efficiency, our manufacturing processes, and the manufacturing processes of many of our suppliers and customers, are still energy intensive and use or generate, directly or indirectly, greenhouse gases. Political and scientific debates related to the effects of emissions of carbon dioxide and other greenhouse gases ("GHGs") on the global climate are ongoing. In recent years, current regulatory programs impacting GHG emissions from large industrial plants and other sources include the European Union Emissions Trading Scheme, the CRC Energy Efficiency Scheme in the United Kingdom, and certain federal and state programs in the United States, including GHG reporting and permitting rules issued by the U.S. Environmental Protection Agency and the California cap and trade program. These programs and additional future legislation and regulation aimed at reducing GHG emissions could have a material adverse effect on our results of operations and financial condition because of the costs of compliance and the impact on our energy costs.
Because of the nature and use of the products that we manufacture, we may in the future face large liability claims.
We are subject to litigation in the ordinary course of our business, which could be costly to us and which may arise in the future. We are exposed to possible claims for personal injury, death or property damage, which could result from a failure of a product manufactured by us or of a product integrating one of our products. For example, improperly manufactured gas cylinders could explode at high pressure, which can cause substantial personal and property damage. We also supply many components into aerospace applications, where the potential for significant liability exposures necessitates additional insurance costs.
Many factors beyond our control could lead to liability claims, including:
- •
- the failure of a product manufactured by a third party that incorporated components manufactured by us;
- •
- the reliability and skills of persons using our products or the products of our customers; and
- •
- the use by customers of materials or products that we produced for applications for which the material or product was not designed.
If we cannot successfully defend ourselves against claims, we may incur substantial liabilities. Even successful defense would require significant financial and management resources. Regardless of the merits or eventual outcome, liability claims may result in:
- •
- decreased demand for our products;
- •
- reputational injury;
- •
- initiation of investigation by regulators;
- •
- costs to defend related litigation;
- •
- diversion of management time and resources;
- •
- compensatory damages and fines;
- •
- product recalls, withdrawals or labeling, marketing or promotional restrictions;
- •
- loss of revenue;
- •
- exhaustion of any available insurance and our capital resources; and
- •
- a decline in our stock price.
We could be required to pay a material amount if a claim is made against us that is not covered by insurance or otherwise subject to indemnification, or that exceeds the insurance coverage that we maintain. Moreover, we do not currently carry insurance to cover the expense of product recalls, and litigation involving significant product recalls or product liability could have a material adverse effect on our financial condition or results of operations.
17
Our businesses could suffer if we lose certain of our employees or cannot attract and retain qualified employees.
We rely upon a number of key executives and employees, particularly Brian Purves, our CEO, and other members of the executive management board. If these and certain other employees ceased to work for us, we would lose valuable expertise and industry experience and could become less profitable. In addition, future operating results depend in part upon our ability to attract and retain qualified engineering and technical personnel. As a result of intense competition for talent in the market, we cannot ensure that we will be able to continue to attract and retain such personnel. While our key employees are generally subject to non-competition agreements for a limited period of time following the end of their employment, if we were to lose the services of key executives or employees, it could have an adverse effect on operations, including our ability to maintain our technological position. We do not carry "key-man" insurance covering the loss of any of our executives or employees.
Any expansion or acquisition may prove risky.
As part of our strategy, we have and may continue to supplement organic growth by acquiring companies or operations engaged in similar or complementary businesses. If the consummation of acquisitions and integration of acquired companies and businesses excessively diverts management's attention from the operations of our core businesses, operating results could suffer. Any acquisition made could be subject to a number of risks, including:
- •
- failing to discover liabilities of the acquired company or business for which we may be responsible as a successor owner or operator, including environmental costs and liabilities;
- •
- difficulties associated with the assimilation of the operations and personnel of the acquired company or business;
- •
- increased debt service requirements as a result of increased indebtedness to complete acquisitions;
- •
- the loss of key personnel in the acquired company or business; and/or
- •
- a negative effect on our financial results resulting from an impairment of acquired intangible assets, the creation of provisions or write-downs.
We cannot ensure that every acquisition will ultimately provide the benefits originally anticipated.
We also face certain challenges as a result of organic growth. For example, in order to grow while maintaining or decreasing per unit costs, we will need to improve efficiency, effectively manage operations and employees and hire enough qualified technical personnel. We may not be able to adequately meet these challenges. Any failure to do so could result in costs increasing more rapidly than any growth in sales, thus resulting in lower operating income from which to finance operations and indebtedness. In addition, we may need to borrow money to finance organic growth, which will increase our debt service requirements. There can be no assurance that we will be able to borrow money in the future on favorable terms or at all.
We could suffer a material interruption in our operations as a result of unforeseen events or operating hazards.
Our production facilities are located in a number of different locations throughout the world. Any of our facilities could suffer an interruption in production, either at separate times or at the same time, because of various and unavoidable occurrences, such as severe weather events (for example, hurricanes, floods and earthquakes), casualty events (for example, explosions, fires or material equipment breakdown), acts of terrorism, pandemic disease, labor disruptions or other events (for example, required maintenance shutdowns). For example, a severe hailstorm caused extensive damage to glazed panels at our Madison, Illinois plant in 2012, and our operations in California are subject to risks related to earthquakes. In addition, some of our products are highly flammable, and there is a risk of fire inherent in their production process. For example, in 2010, two furnaces were destroyed in a fire at our Madison, Illinois plant. Such
18
hazards could cause personal injury or death, serious damage to or destruction of property and equipment, suspension of operations, substantial damage to the environment and/or reputational harm. The risk is particularly high in the production of fine magnesium powders, which are highly flammable and explosive in certain situations. Similar disruptions in the operations of our suppliers or customers could materially affect our business and operations. Although we carry certain levels of business interruption insurance, the coverage on certain catastrophic events or natural disasters, including earthquakes, a failure of energy supplies and certain other events, is limited, and it is possible that the occurrence of such events may have a significant adverse impact on our business and, as a result, on our cash flows.
Employee strikes and other labor-related disruptions may adversely affect our operations.
Our business depends on a large number of employees who are members of various trade union organizations. Strikes or labor disputes with our employees may adversely affect our ability to conduct business. We cannot assure you that there will not be any strike, lock-out or material labor dispute in the future. Work interruptions or stoppages could have a material adverse effect on our business, results of operations and financial condition.
We could incur future liability claims arising from previous businesses now closed or sold.
We previously operated Baco Contracts, a building cladding contracting business, and although the business has been closed for many years, the warranties on several of the business' contracts have several years remaining, thereby exposing us to continuing potential liabilities.
As a holding company, Luxfer Holding PLC's main source of cash is distributions from our operating subsidiaries.
Our ultimate parent company, Luxfer Holdings PLC, conducts all of its operations through the subsidiaries of the Luxfer Group. Accordingly, its main cash source is dividends from these subsidiaries. The ability of each subsidiary to make distributions depends on the funds that a subsidiary receives from its operations in excess of the funds necessary for its operations, obligations or other business plans. Since the Luxfer Group subsidiaries are wholly-owned, the claims of Luxfer Holdings PLC will generally rank junior to all other obligations of the subsidiaries. If Luxfer Group operating subsidiaries are unable to make distributions, the Luxfer Group's growth may slow, unless we are able to obtain additional debt or equity financing. In the event of a subsidiary's liquidation, there may not be assets sufficient for us to recoup our investment in the subsidiary.
Our failure to perform under purchase or sale contracts could result in the payment of penalties to customers or suppliers, which could have a negative impact on our results of operations or financial condition.
A failure to perform under purchase or sale contracts could result in the payment of penalties to suppliers or customers, which could have a negative impact on our results of operations or financial condition. Certain contracts with suppliers could also obligate us to purchase a minimum product volume (clauses known as "take or pay") or contracts with customers may impose firm commitments for the delivery of certain quantities of products within certain time periods. The risk of incurring liability under a take-or-pay supply contract would increase during an economic crisis, which would increase the likelihood of a sharp drop in demand for our products.
We could be adversely affected by violations of the U.K. Bribery Act, the U.S. Foreign Corrupt Practices Act and similar worldwide anti-bribery laws.
The U.K. Bribery Act, the U.S. Foreign Corrupt Practices Act and similar worldwide anti-bribery laws generally prohibit companies and their intermediaries from making or, in the case of the U.K. Bribery Act,
19
receiving, improper payments to, or from, government officials or, in the case of the U.K. Bribery Act, third parties, for the purpose of obtaining or retaining business. Failing to prevent bribery is also an offence under the U.K. Bribery Act. Our policies mandate compliance with these laws. Despite our compliance program, we cannot assure you that our internal control policies and procedures will always protect us from reckless, negligent or improper acts committed by our employees or agents. The costs of violations of these laws, or allegations of such violations, could have a negative impact on our business, results of operations and reputation.
We have a significant amount of indebtedness, which may adversely affect our cash flow and our ability to operate our business, remain in compliance with debt covenants, make payments on our indebtedness, pay dividends and respond to changes in our business or take certain actions.
As of December 31, 2013, we had $65 million of indebtedness on a consolidated basis under our senior notes due 2018 (the "Loan Notes due 2018"). We also have a Revolving Credit Facility which as at December 31, 2013 was not utilized.
Our indebtedness could have important consequences to you. For example, it could make it more difficult for us to satisfy obligations with respect to indebtedness, and any failure to comply with the obligations of any of our debt instruments, including financial and other restrictive covenants, could result in an event of default under agreements governing our indebtedness. Further, our indebtedness could require us to dedicate a substantial portion of available cash flow to pay principal and interest on our outstanding debt, which would reduce the funds available for working capital, capital expenditures, dividends, acquisitions and other general corporate purposes. Our indebtedness could also limit our ability to operate our business, including the ability to engage in strategic transactions or implement business strategies. Factors related to our indebtedness could materially and adversely affect our business and our results of operations. Furthermore, our interest expense could increase if interest rates rise because certain portions of our debt facilities bear interest at floating rates. If we do not have sufficient cash flow to service our debt, we may be required to refinance all or part of our existing debt, sell assets, borrow more money or sell securities, none of which we can guarantee we will be able to do.
In addition, the agreements that govern the terms of our indebtedness contain, and any future indebtedness would likely contain, a number of restrictive covenants imposing significant operating and financial restrictions on us, including restrictions that may limit our ability to engage in acts that may be in our long-term best interests, including:
- •
- incurring or guaranteeing additional indebtedness;
- •
- paying dividends (including to fund cash interest payments at different entity levels), or making redemptions, repurchases or distributions, with respect to ordinary shares or capital stock;
- •
- creating or incurring certain security interests;
- •
- making certain loans or investments;
- •
- engaging in mergers, acquisitions, amalgamations, asset sales and sale and leaseback transactions; and
- •
- engaging in transactions with affiliates.
These restrictive covenants are subject to a number of qualifications and exceptions. The operating and financial restrictions and covenants in our existing debt agreements and any future financing agreements may adversely affect our ability to finance future operations or capital needs or to engage in other business activities.
We may be able to incur significant additional indebtedness in the future. Although the agreements governing our indebtedness contain restrictions on the incurrence of certain additional indebtedness, these restrictions are subject to a number of important qualifications and exceptions, and the indebtedness
20
incurred in compliance with these restrictions could be substantial. If we incur new indebtedness, the related risks, including those described above, could intensify.
Certain factors beyond our control may affect the market price of our ADSs or ordinary shares.
Certain factors, some of which are beyond our control, may have a material effect on the market price of our ordinary shares or ADSs, including:
- •
- fluctuations in our results of operations;
- •
- negative publicity;
- •
- changes in stock market analyst recommendations regarding our company, the sectors in which we operate, the securities market generally and conditions in the financial markets;
- •
- regulatory developments affecting our industry;
- •
- announcements of studies and reports relating to our products or those of our competitors;
- •
- changes in economic performance or market valuations of our competitors;
- •
- actual or anticipated fluctuations in our quarterly results;
- •
- conditions in the industries in which we operate;
- •
- announcements by us or our competitors of new products, acquisitions, strategic relations, joint ventures or capital commitments;
- •
- additions to or departures of our key executives and employees;
- •
- fluctuations of exchange rates;
- •
- release of transfer restrictions on our outstanding ordinary shares or ADSs; and
- •
- sales or perceived sales of additional ordinary shares or ADSs.
During recent years, securities markets in the United States and worldwide have experienced significant volatility in prices and trading volumes. This volatility could have a material adverse effect on the market price of the ADSs, irrespective of our results of operations and financial condition.
Our ability to pay regular dividends on our ordinary shares is subject to the discretion of our board of directors and will depend on many factors, including our results of operations, cash requirements, financial condition, contractual restrictions, applicable laws and other factors, and may be limited by our structure and statutory restrictions and restrictions imposed by the Revolving Credit Facility and Notes due 2018 as well as any future agreements.
We may declare cash dividends on our ordinary shares as described in "Item 8, Financial Information." However, the payment of future dividends will be at the discretion of our board of directors. Any recommendation by our board to pay dividends will depend on many factors, including our results of operations, cash requirements, financial condition, contractual restrictions, applicable laws and other factors. In addition, our Revolving Credit Facility and Loan Notes due 2018 limit our ability to pay dividends or make other distributions on our shares, and in the future we may become subject to debt instruments or other agreements that further limit our ability to pay dividends. Under English law, any payment of dividends would be subject to the Companies Act 2006 of England and Wales (the "Companies Act"), which requires, among other things, that we can only pay dividends on ordinary shares out of profits available for distribution determined in accordance with the Companies Act. Additionally, any change in the level of our dividends or the suspension of the payment thereof could adversely affect the market price of our ADSs.
21
Holders of our ADSs may not have the same voting rights as the holders of our ordinary shares and may not receive voting materials in time to be able to exercise your right to vote.
Holders of our ADSs will not be able to exercise voting rights attaching to the ordinary shares evidenced by the ADSs on an individual basis. Holders of the ADSs will instead appoint the depositary or its nominee as their representative to exercise the voting rights attaching to the ordinary shares represented by the ADSs. You may not receive voting materials in time to instruct the depositary to vote, and it is possible that you, or persons who hold their ADSs through brokers, dealers or other third parties, will not have the opportunity to exercise a right to vote.
You may be subject to limitations on the transfer of your ADSs.
Your ADSs, which may be evidenced by American depositary receipts ("ADRs"), are transferable on the books of the depositary. However, the depositary may close its books at any time or from time to time when it deems expedient in connection with the performance of its duties. The depositary may refuse to deliver, transfer or register transfers of your ADSs generally when our books or the books of the depositary are closed, or at any time if we or the depositary think it is advisable to do so because of any requirement of law, government or governmental body, or under any provision of the deposit agreement, or for any other reason.
As a foreign private issuer, we are exempt from a number of rules under the U.S. securities laws and are permitted to file less information with the Securities and Exchange Commission than a U.S. company. This may limit the information available to holders of the ADSs.
We are a "foreign private issuer," as defined in the Securities and Exchange Commission's ("SEC") rules and regulations and, consequently, we are not subject to all of the disclosure requirements applicable to companies organized within the United States. For example, we are exempt from certain rules under the U.S. Securities Exchange Act of 1934, as amended (the "Exchange Act"), that regulate disclosure obligations and procedural requirements related to the solicitation of proxies, consents or authorizations applicable to a security registered under the Exchange Act. In addition, our officers and directors are exempt from the reporting and "short-swing" profit recovery provisions of Section 16 of the Exchange Act and related rules with respect to their purchases and sales of our securities. Moreover, we are not required to file periodic reports and financial statements with the SEC as frequently or as promptly as U.S. public companies. Accordingly, there may be less publicly available information concerning our company than there is for U.S. public companies.
As a foreign private issuer, we are not subject to certain New York Stock Exchange corporate governance rules applicable to U.S. listed companies.
We rely on a provision in the New York Stock Exchange's Listed Company Manual that allows us to follow English corporate law and the Companies Act with regard to certain aspects of corporate governance. This allows us to follow certain corporate governance practices that differ in significant respects from the corporate governance requirements applicable to U.S. companies listed on the New York Stock Exchange.
For example, we are exempt from New York Stock Exchange regulations that require a listed U.S. company, among other things, to:
- •
- have a majority of the board of directors consist of independent directors;
- •
- require non-management directors to meet on a regular basis without management present;
- •
- establish a nominating and compensation committee composed entirely of independent directors;
- •
- adopt and disclose a code of business conduct and ethics for directors, officers and employees; and
22
- •
- promptly disclose any waivers of the code for directors or executive officers that should address certain specified items.
In accordance with our New York Stock Exchange listing, our Audit Committee is required to comply with the provisions of Section 301 of the Sarbanes-Oxley Act of 2002 (the "Sarbanes-Oxley Act") and Rule 10A-3 of the Exchange Act, both of which are also applicable to New York Stock Exchange-listed U.S. companies. Because we are a foreign private issuer, however, our Audit Committee is not subject to additional New York Stock Exchange requirements applicable to listed U.S. companies, including:
- •
- an affirmative determination that all members of the Audit Committee are "independent," using more stringent criteria than those applicable to us as a foreign private issuer;
- •
- the adoption of a written charter specifying, among other things, the audit committee's purpose and including an annual performance evaluation; and
- •
- the review of an auditor's report describing internal quality-control issues and procedures and all relationships between the auditor and us.
Furthermore, the New York Stock Exchange's Listed Company Manual requires listed U.S. companies to, among other things, seek shareholder approval for the implementation of certain equity compensation plans and issuances of common stock.
We may lose our foreign private issuer status in the future, which could result in significant additional costs and expenses.
We are a "foreign private issuer," as such term is defined in Rule 405 under the Securities Act, and, therefore, we are not required to comply with all the periodic disclosure and current reporting requirements of the Exchange Act and related rules and regulations. Under Rule 405, the determination of foreign private issuer status is made annually on the last business day of an issuer's most recently completed second fiscal quarter and, accordingly, the next determination will be made with respect to us on June 30, 2014. There is a risk that we will lose our foreign private issuer status.
In the future, we would lose our foreign private issuer status if, for example, more than 50% of our assets are located in the United States and we continue to fail to meet additional requirements necessary to maintain our foreign private issuer status. The regulatory and compliance costs to us under U.S. securities laws as a U.S. domestic issuer may be significantly more than costs we incur as a foreign private issuer. If we are not a foreign private issuer, we will be required to file periodic reports and registration statements on U.S. domestic issuer forms with the SEC, which are more detailed and extensive in certain respects than the forms available to a foreign private issuer. We would be required under current SEC rules to prepare our financial statements in accordance with U.S. generally accepted accounting principles ("GAAP") and modify certain of our policies to comply with corporate governance practices associated with U.S. domestic issuers, these requirements would be additional to, and not in place of, those under U.K. law to prepare financial statements under IFRS and comply with U.K. corporate governance laws. Such conversion and modifications will involve additional costs, both one-off in nature on conversion and also extra ongoing costs to meet reporting in both U.S. GAAP and IFRS, which would reduce our operating profit. In addition, we may lose our ability to rely upon exemptions from certain corporate governance requirements on U.S. stock exchanges that are available to foreign private issuers such as the ones described above and exemptions from procedural requirements related to the solicitation of proxies.
If we fail to establish or maintain an effective system of internal controls, we may be unable to accurately report our financial results or prevent fraud, and investor confidence and the market price of our ADSs may, therefore, be adversely impacted.
We are subject to reporting obligations under U.S. securities laws. Our reporting obligations as a public company place a significant strain on our management, operational and financial resources and systems for
23
the foreseeable future. Our management and our independent registered public accounting firm are required to report on the effectiveness of our internal controls over financial reporting as required by Section 404 of the Sarbanes-Oxley Act, for which we perform system and process evaluation and testing of our internal controls over financial reporting.
Over time we may identify and correct deficiencies or weaknesses in our internal controls and, where and when appropriate, report on the identification and correction of these deficiencies or weaknesses. However, the internal control procedures can provide only reasonable, and not absolute, assurance that deficiencies or weaknesses are identified. Deficiencies or weaknesses that have not been identified by us could emerge and the identification and correction of these deficiencies or weaknesses could have a material impact on our results of operations. If our internal controls over financial reporting are not considered adequate, this may adversely affect our ability to report our financial results on a timely and accurate basis, which may result in a loss of public confidence or have an adverse effect on our business and the market price of our ADRs.
Finally, on April 5, 2012, President Obama signed into law the Jumpstart Our Business Startups Act (the "JOBS Act"). The JOBS Act contains provisions that, among other things, relax certain reporting requirements for qualifying public companies. We are an "emerging growth company," as defined in the JOBS Act and, for as long as we continue to be an emerging growth company, we are permitted to rely on exemptions from various reporting requirements applicable to other public companies but not to emerging growth companies, including an exemption from the requirement to comply with the auditor attestation requirements of Section 404 of the Sarbanes-Oxley Act. We will remain an emerging growth company up to the last day of the fifth fiscal year following October 3, 2012, the date of our IPO, although (i) if the market value of our ordinary shares that is held by non-affiliates exceeds $700 million as of any June 30 before that time, we would cease to be an emerging growth company as of the following December 31; (ii) if our annual gross revenues are $1 billion or more during any fiscal year before that time, we would cease to be an emerging growth company as of the last day of such fiscal year; and (iii) if during any three-year period before that time we issue an aggregate of over $1 billion in non-convertible debt, we would cease to be an emerging growth company upon the date of such issuance.
It may be difficult to effect service of U.S. process and enforce U.S. legal process against the directors of Luxfer.
Luxfer is a public limited company incorporated under the laws of England and Wales. A number of our directors and officers reside outside of the United States, principally in the United Kingdom. A substantial portion of our assets, and the assets of such persons, are located outside of the United States. Therefore, it may not be possible to effect service of process within the United States upon Luxfer or these persons in order to enforce judgements of U.S. courts against Luxfer or these persons based on the civil liability provisions of the U.S. federal securities laws. There is doubt as to the enforceability in England and Wales, in original actions or in actions for enforcement of judgements of U.S. courts, of civil liabilities solely based on the U.S. federal securities laws.
24
Item 4. Information On The Company
A. History and Development of the Luxfer Group
General
Although the origins of some of our operations date back to the early part of the 19th century, we trace our business as it is today back to the 1982 merger of The British Aluminium Company Limited and Alcan Aluminium U.K. Limited, which created British Alcan. The original Luxfer Group was formed in February 1996 in connection with the management buy-in (the "Management Buy-In") of certain downstream assets of British Alcan. Our current Chief Executive, Brian Purves, was a member of the Management Buy-In team. All of our current Executive Management team have served with Luxfer Group for over 10 years. The Management Buy-In was financed by a syndicate of private equity investors. Upon completion of a capital reorganization in 2007, these investors fully exited their original investment in the business.
Our Company was incorporated on December 31, 1998 with the name Neverealm Limited (we re-registered as a public limited company and changed our name to Luxfer Holdings PLC on April 1, 1999), for the purpose of acquiring all of the outstanding share capital of the original Luxfer Group Limited in connection with a leveraged recapitalization that occurred in April 1999. As part of the 1999 recapitalization, Luxfer Holdings PLC became the parent holding company of our operating subsidiaries around the world. To facilitate the 1999 recapitalization, Luxfer Holdings PLC issued £160 million of Senior Notes due 2009 and took on £140 million of bank debt.
In February 2007, Luxfer Holdings PLC completed a capital reorganization, which substantially reduced its debt burden and realigned its share capital. A key part of this reorganization was the release and cancellation of the Senior Notes due 2009 in consideration for, among other things, the issuance of a lower principal amount of new Senior Notes due 2012. Senior noteholders, other than Luxfer Group Limited, also acquired 87% of the voting share capital of Luxfer Holdings PLC from exiting shareholders with management and the employee share ownership plan ("ESOP") retaining 13% of the voting share capital.
Since the 2007 capital reorganization, we have considerably improved the profitability of the businesses and reduced debt, repaying the Senior Notes due 2012 early.
We have re-shaped the business since 1996 through a significant number of acquisitions and disposals.
In July 2012, we entered into an arrangement agreement with Dynetek Industries Ltd. ("Dynetek"), a Canadian business listed on the Toronto Stock Exchange, to acquire all of the common shares of Dynetek at a price of CAD0.24 per share, for a total equity value of CAD5 million. We assumed approximately CAD7 million of bank debt, for a total purchase cost of approximately CAD12 million. The acquisition closed on September 17, 2012. Dynetek designs and manufactures high-pressure aluminum and carbon fiber gas cylinders and systems for compressed natural gas ("CNG), low emission vehicles and compressed hydrogen, zero-emission fuel cell vehicles. Dynetek's system applications include, but are not limited to, passenger automobiles, light and heavy-duty trucks, transit vehicles and school buses, bulk hauling of compressed gases and stationary storage or ground storage refueling applications. Dynetek's publicly-reported 2011 sales revenue was CAD19.8 million, generated from two manufacturing sites in Calgary, Canada and Ratingen, Germany, near Dusseldorf. In 2013, the former Dynetek operations generated $33.4 million (equivalent CAD34.6 million) of sales revenue as part of the Luxfer Group.
In October 2012, Luxfer Holdings PLC successfully listed its shares (in the form of American Depositary Shares evidenced by American Depositary Receipts) on the New York Stock Exchange.
Most recently, in March 2014 we acquired a small composite cylinder manufacturer and the associated production assets in Utah. This will provide our North American gas cylinder business with a facility purpose-built for the manufacture of Type 4 (polymer-lined) composite cylinder products, which will be targeted initially at the class 8 heavy-duty truck market, where an increasing rate of conversion from diesel
25
to CNG is widely anticipated. The initial cost is $3 million with a deferred consideration element linked largely to the success of the operation in the next three years and estimated at $6 million. We are in the final stages of developing a new range of larger-diameter Type 4 cylinders for growing CNG markets to complement our existing lightweight range of Type 3 (aluminum-lined) cylinder products and systems, and our plan is for the new range to be made in Utah.
Corporate
Luxfer Holdings PLC is registered as a public limited company under the laws of England and Wales with its registered office at Anchorage Gateway, 5 Anchorage Quay, Salford, M50 3XE, England and our telephone number is +44(0) 161 300 0600.
We are a publically traded company, listed on the New York Stock Exchange under the symbol "LXFR".
Our agent in the United States is Corporation Service Company, 2711 Centreville Road, Wilmington, Delaware 19808.
B. Business Overview
We are a global materials technology company specializing in the design, manufacture and supply of high-performance materials, components and gas cylinders to customers in a broad range of growing end-markets. Our key end-markets are environmental technologies, healthcare technologies, protection and specialty technologies. Our customers include both end-users of our products and manufacturers that incorporate our products into their finished goods. Our products include specialty chemicals used as catalysts in automobile engines to remove noxious gases; corrosion, flame and heat-resistant magnesium alloys used in safety-critical, aerospace, automotive and defense applications; photo-sensitive plates used for embossing and gold-foiling in the luxury packaging and greetings card industries; high-pressure aluminum and composite gas cylinders used by patients with breathing difficulties for mobile oxygen therapy, by firefighters in breathing apparatus equipment and by manufacturers of vehicles that run on CNG; and metal panels that can be "superformed" into complex shapes to provide additional design freedom for a wide variety of industries, including aerospace, high-end automotive and rail transportation.
Our area of expertise covers the chemical and metallurgical properties of aluminum, magnesium, zirconium, rare earths and certain other materials, and we have pioneered the application of these materials in certain high-technology industries. For example, we were the first to develop and patent a rare earth containing magnesium alloy (EZ33A) for use in high-temperature aerospace applications such as helicopter gearboxes; we are at the forefront of the commercial development of zirconia-rich mixed oxides for use in automotive catalysis; we were the first to manufacture a high-pressure gas cylinder out of a single piece of aluminum using cold impact extrusion; and we developed and patented the superforming process and the first superplastic aluminum alloy (AA2004) and were the first to offer superformed aluminum panelwork commercially. We have a long history of innovation derived from our strong technical base, and we work closely with customers to apply innovative solutions to their most demanding product needs. Our proprietary technology and technical expertise, coupled with best-in-class customer service and global presence provide significant competitive advantages and have established us as leaders in the markets in which we operate. We believe that we have leading positions, technically and by market share, in key product areas, including magnesium aerospace alloys, photo-engraving plates, zirconium chemicals for automotive catalytic converters and aluminum and composite cylinders for breathing applications.
We have a global presence, employing approximately 1,800 people on average in 2013, and operating 18 manufacturing plants in the United Kingdom, United States, Canada, France, Germany, the Czech Republic and China. We also have joint ventures in Japan, South Korea, India and the United States. Our total revenue, Adjusted EBITDA and net income for the year in 2013 were $481.3 million, $76.6 million and $34.1 million, respectively. See "Item 3A Selected Financial Data" for the definition of Adjusted
26
EBITDA and reconciliations to profit for the year. In 2013, we manufactured and sold approximately 16,200 metric tons of our magnesium products, approximately 3,100 metric tons of our zirconium products and approximately 2.0 million gas cylinders. For a breakdown of our total revenue in 2013, 2012 and 2011 by geographic origin, see "Note 2—Revenue and segmental analysis" to our audited consolidated financial statements included in this Annual Report.
Our company is organized into two operational divisions, Elektron and Gas Cylinders, which represented 54% and 46%, respectively, of our total revenue in 2013.
Elektron
The Elektron division focuses on specialty materials based on magnesium, zirconium and rare earths. Within this division, we sell our products through two brands. Under ourMagnesium Elektron brand, we develop and manufacture specialist lightweight, corrosion-resistant and heat- and flame-resistant magnesium alloys, extruded magnesium products, magnesium powders, magnesium plates and rolled sheets and photo-engraving plates for the aerospace (lightweight alloys and components), automotive (lightweight alloys and components), defense (powders for countermeasure flares) and printing (photo- engraving sheets) industries. Under ourMEL Chemicals brand, we develop and manufacture specialty zirconium compounds for use in automotive applications (exhaust catalysts), electronics (ceramic sensors), structural ceramics, aerospace (thermal barrier coatings) and chemical synthesis (industrial catalysts).
Gas Cylinders
The Gas Cylinders division focuses on products based on aluminum, composites and other metals using technically advanced processes. Within this division, we sell our products through two brands. Under ourLuxfer Gas Cylinders brand, we develop and manufacture advanced high-pressure aluminum and composite aluminum/carbon fiber gas containment cylinders for use in healthcare (oxygen), breathing apparatus (air), electronics (industrial gases), fire-fighting (carbon dioxide), transportation (CNG), and many other applications. Under our Superform brand, we design and manufacture highly complex-shaped, sheet-based products for a wide range of industries, including aerospace (engine air intakes), specialist automotive (body panels and door inners), rail transport (train fronts and window frames) and healthcare (non-magnetic equipment casings).
Our End-Markets
The key end-markets for our products fall into four categories:
- •
- Environmental technologies: we believe many of our products serve a growing need to protect the environment and conserve its resources. Increasing environmental regulation, "green" taxes and the increasing cost of fossil fuels are driving growth in this area and are expected to drive growth in the future. For example, our products are used to reduce weight in vehicles improving fuel efficiency, help in the use of alternative cleaner fuels, like CNG and Hydrogen to power vehicles, in catalytic converters in automotive engines, to remove noxious gases and to remove heavy metals from drinking water and industrial effluent.
- •
- Healthcare technologies: we have a long history in the healthcare end-market, and see this as a major growth area through the introduction of new product technologies. Our products, among other applications, contain medical gases, are featured in medical equipment and are used in medical treatment. For example, our more recent innovations include lightweight medical oxygen cylinders featuring our patented L7X higher-strength aluminum alloy and carbon composite cylinders.
27
- •
- Protection technologies: we offer a number of products that are used to protect individuals and equipment. Principal factors driving growth in this end-market include increasing societal expectations regarding the protection of individuals and armed forces personnel, tightening health and safety regulations and the significant cost of investing in and replacing technologically-advanced military equipment. Our products are used in the protection of emergency services personnel, the protection of military vehicles, aircraft and personnel. For example, we manufacture ultra-lightweight breathing-air cylinders that lighten the load on emergency services personnel working in dangerous environments. Our ultra-fine magnesium powders are a key component of countermeasure flares carried on military aircraft.
- •
- Specialty technologies: our core technologies have enabled us to exploit various other niche and specialty markets and applications. Our products include photo-engraving plates and etching chemicals used to produce high-quality packaging, as well as cylinders used for high-purity gas applications, beverage dispensing and leisure applications such as paintball.
Our Strengths:
Market leading positions. We believe all of our main brands,Magnesium Elektron,MEL Chemicals,Luxfer Gas Cylinders andSuperform, are market leaders and strive to achieve best-in-class performance and premium price positions. We believe we are the leading manufacturer in the western world of high-performance magnesium alloys, powders, plates, and rolled sheets used in the aerospace, defense, and photo-engraving industries. We believe we are a leading manufacturer of specialty zirconium compounds for use in the global market for washcoats of catalytic converters in gasoline engine vehicles. In addition, we believe we are (i) the most global manufacturer of high pressure aluminum and composite gas cylinders; (ii) a leading global supplier of cylinders for medical gases, fire extinguishers and breathing apparatus; and (iii) the largest manufacturer of portable high pressure aluminum and composite cylinders in the world. Drawing on our expertise in the metallurgy of aluminum, we invented the superplastic forming process, and we believe we are the largest independent supplier of superplastically-formed aluminum components in the western world.
Focus on innovation and product development for growing specialist end-markets. We recognize the importance of fostering the creative ability of our employees and have developed a culture where any employee can take an active involvement in the innovation process. As a result of this culture of ingenuity, we have, in close collaboration with research departments in universities around the world, developed and continue to develop a steady stream of new products, including carbon composite ultra-lightweight gas cylinders, L7X extra high pressure aluminum gas cylinders, fourth generation (G4) doped zirconium chemicals for automotive and chemical catalysis, Isolux zirconium-based separation products used in water purification and ELEKTRON magnesium alloys for advanced aerospace and specialty automotive applications.
Strong technical expertise and know-how. We specialize in advanced materials where our expertise in metallurgy and material science enables us to develop products and materials with superior performance to satisfy the most demanding requirements in the most extreme environments. We design some products to withstand temperatures of absolute zero and others to withstand contact with molten steel. We produce materials that operate in a complete vacuum and absolute zero temperature, and cylinders that safely contain gases at over 300 atmospheres of pressure. Our technical excellence is driven in part by safety- critical products, including aerospace alloys and high-pressure gas cylinders that are subject to extensive regulation and are approved only after an extensive review process that in some cases can take years. Further, we benefit from the fact that a growing number of our products, including many of the alloys and zirconium compounds we sell, are patented.
Diversified blue chip customer base with long-standing relationships. We have developed and seek to maintain and grow our long-term and diverse customer base of global leaders. We put the customer at the
28
heart of our strategy and we have long-standing relationships with many of our customers including global leaders in our key markets. Our businesses have cultivated a number of these relationships over the course of many decades. The diversity and breadth of our customer base also mitigates the reliance on any one customer. In 2013, our ten largest customers represented 30% of our total revenue. In 2013, our ten largest customers for the Elektron division represented 41% of its revenue, and our ten largest customers for the Gas Cylinders division represented 42% of its revenue.
Resilient business model. Although the recent downturn in the global economy represented one of the most challenging economic environments for manufacturers in decades, in 2009, we generated cash and made a net profit every quarter. In 2010, our trading profit rebounded by 57% as compared to 2009 to $44.7 million. We have followed this up with trading profits of $63.7 million, $68.5 million and $59.2 million in 2011, 2012 and 2013 respectively. We have protected our margins to a large extent by successfully passing on to customers increases in raw material cost and overhead expense. We have also increased our margins over time by (i) disposing of low margin and cash intensive operations such as the Elektron division's magnesium and zinc die casting operations in 2006, and the BA Tubes aluminum tubes business in 2007; (ii) increasing our focus on high-performance value-added product lines and markets; and (iii) investing in automation and operational efficiencies at our manufacturing facilities. Our ratio of trading profit divided by sales revenue was 8.8% in 2008, fell only to 7.6% during the 2009 economic downturn, improved to 11.1% in 2010 and was 12.5% in 2011 and was 13.4% in 2012 and 12.3% in 2013.
Highly experienced and effective management team. We are led by an experienced executive management board, several of whom have been with us since the Management Buy-in of certain downstream assets of British Alcan in 1996. Our current executive management board has played a significant role in developing our strategy and in delivering our stability and growth in recent years. We also highly value the quality of our local senior management. Our board of directors actively supports our business and contributes a wealth of industrial and financial experience.
Our Business Strategy
Our business strategy is underpinned by the "Luxfer Model" which consists of five key themes:
- •
- Maintainingtechnical excellence relating both to our products and to the processes needed to make them
- •
- Building and maintainingstrong, long-termcustomer relationships
- •
- Selling high performance products intospecialty markets that require products with high technology content where customers are willing to pay premium prices
- •
- Acommitment to innovation of products that are well-equipped to address opportunities created by heightened chemical emissions controls, global environmental concerns, public health legislation and the need for improved protection technology
- •
- Achieving high levels ofmanufacturing excellence by improving processes and reducing operating costs, thus mitigating the threat from competitors in low labor cost economies
Each of our businesses has developed a strategic roadmap based on a balanced scorecard methodology and driven by the Luxfer Model. These strategic roadmaps contain business-specific initiatives, actions and measures necessary to guide the businesses towards achieving financial objectives set by our board of directors. With the Luxfer Model as its backbone, our company-wide strategy includes the following key elements:
Continued focus on innovation, R&D and protection of intellectual property. We have always recognized the importance of research in material science and innovation in the development of our products. We plan to continue this history of innovation through investment in our own research and development teams, as well as through extensive collaboration with universities, industry partners and customers around the world.
29
Further, given the high level of research and development and technology content inherent in our products, we intend to aggressively protect our inventions and innovations by patenting them when appropriate and by actively monitoring and managing our existing intellectual property portfolio.
Increase the flow of innovative, higher value-added products targeting specialist markets. We plan to increase our focus on higher growth, specialist end-markets, including environmental, healthcare and protection technologies. In response to increasing demand in these markets for higher value-added products, we plan to utilize our metallurgical and chemical expertise to develop new products and applications for existing products in these markets. We also seek to identify alternative applications for our products that leverage the existing capabilities of our products and our existing customer base.
Enhance awareness of Luxfer brands. We intend to maintain and improve global awareness of our four brands:Magnesium Elektron,MEL Chemicals,Luxfer Gas Cylinders andSuperform. Our efforts will include promoting our leading technologies at trade shows, industry conferences and other strategic forums. We also plan to expand our online presence by maximizing the visibility and utility of our website and web-based access. Whenever possible, we insist that our corporate logos are visible on products sold by our customers, especially products such as medical cylinders that remain in active circulation and tend to be widely visible in the public domain.
Focus on continued gains in operational and manufacturing efficiencies. We seek to continuously improve operational and manufacturing efficiencies, investing in modern enterprise resource planning systems and using external auditors to measure our performance against rigorous, world-class standards. In order to do so, we look for ways to automate our processes to provide protection against competition based in low labor-cost economies. While we plan to maintain our focus on ways to reduce our operational and manufacturing costs, we also seek to modernize machinery and equipment at minimal costs when necessary to prevent bottlenecks in the manufacturing process.
Selectively pursue value-enhancing acquisitions. We have undertaken several successful complementary acquisitions over the past fifteen years, and we believe there will be opportunities to pursue synergistic acquisitions at attractive valuations in the future. We plan to assess these opportunities with a focus on broadening our product and service offerings, expanding our technological capabilities and capitalizing on potential operating synergies.
Our Business Divisions
We are organized into two operational divisions, Elektron and Gas Cylinders. The following table illustrates the revenue and trading profit of each division in 2013, 2012 and 2011.
| | Year Ended December 31, 2013 | ||||||||||||
|---|---|---|---|---|---|---|---|---|---|---|---|---|---|
| | Revenue | Trading Profit(1) | |||||||||||
| | Amount | Percentage | Amount | Percentage | |||||||||
| | (in $ millions) | (%) | (in $ millions) | (%) | |||||||||
Elektron | $ | 219.7 | 45.6 | % | $ | 40.2 | 67.9 | % | |||||
Gas Cylinders | 261.6 | 54.4 | % | 19.0 | 32.1 | % | |||||||
| | Year Ended December 31, 2012 | ||||||||||||
|---|---|---|---|---|---|---|---|---|---|---|---|---|---|
| | Revenue | Trading Profit(1) | |||||||||||
| | Amount | Percentage | Amount | Percentage | |||||||||
| | (in $ millions) | (%) | (in $ millions) | (%) | |||||||||
Elektron | $ | 265.3 | 51.9 | % | $ | 52.8 | 77.1 | % | |||||
Gas Cylinders | 246.3 | 48.1 | % | 15.7 | 22.9 | % | |||||||
30
| | Year Ended December 31, 2011 | ||||||||||||
|---|---|---|---|---|---|---|---|---|---|---|---|---|---|
| | Revenue | Trading Profit(1) | |||||||||||
| | Amount | Percentage | Amount | Percentage | |||||||||
| | (in $ millions) | (%) | (in $ millions) | (%) | |||||||||
Elektron | $ | 287.5 | 56.3 | % | $ | 52.5 | 82.4 | % | |||||
Gas Cylinders | 223.3 | 43.7 | % | 11.2 | 17.6 | % | |||||||
- (1)
- Trading profit is defined as operating profit before restructuring and other income (expense). Trading profit is the "segment profit" performance measure used by our chief operating decision maker as required under IFRS 8 for divisional segmental analysis. See "Note 2—Revenue and segmental analysis" to our audited consolidated financial statements attached to this Annual Report.
Elektron Division
Our Elektron division sells products under two brands:Magnesium Elektron andMEL Chemicals. The Elektron division represented 46% and 68% of our total revenue and trading profit, respectively, in 2013. The table below provides a summary of the products, applications and principal markets and illustrative customers and end-users within each brand in the Elektron division.
Products | Application/principal markets supplied | Illustrative customers and end-users | ||
|---|---|---|---|---|
Magnesium Elektron: | ||||
| Magnesium alloys | Aerospace and specialist automotive | United Technologies, Fansteel-Wellman, Boeing, Lockheed Martin | ||
| Magnesium powders | Defense (anti-tank practice rounds, sea water batteries and decoy flares) | Esterline, Chemring | ||
| Fabricated products, recycling, sheets and plate | Automotive Photo-engraving | Volkswagen Hallmark | ||
MEL Chemicals: | ||||
| Zirconium compounds | Automotive (catalytic converters) | Umicore, Johnson Matthey, BASF | ||
Electro-ceramics (oxygen sensors, capacitors, microwave relays) | Bosch, EPCOS | |||
Engineering ceramics Aerospace ceramics Chemical synthesis Fuel cells Refinery catalysis Reflective coatings | HiTech Sulzer Metco BASF SOFC Power UOP (Honeywell) 3M |
31
The principal geographic markets for the Elektron division are Europe and North America and the percentage of revenue by geographic destination and geographic origin and by key end-markets in 2013 is shown below:
Elektron Division—Revenue by Geographic Destination
2013
Geographic Region | Percentage of Elektron Revenue | |||
|---|---|---|---|---|
North America | 51 | % | ||
European Community excluding U.K. | 26 | % | ||
Asia Pacific | 10 | % | ||
Other Europe | 2 | % | ||
United Kingdom | 6 | % | ||
South & Central America | 3 | % | ||
Africa | 2 | % | ||
Elektron Division—Revenue by Geographic Origin
2013
Geographic Region | Percentage of Elektron Revenue | |||
|---|---|---|---|---|
North America | 55% | |||
United Kingdom | 34% | |||
Other Europe | 11% | |||
32
Elektron Division—End-Market Sales Analysis
2013
End-Market | Percentage of Elektron Revenue | |||
|---|---|---|---|---|
Environmental: | ||||
Aerospace—Lightweight Materials | 14% | |||
Automotive—Catalysis (excluding surcharges) | 16% | |||
Rare earth surcharge (predominantly automotive) | 4% | |||
Automotive—Lightweight Materials | 12% | |||
Specialty Chemicals | 9% | |||
| | | | | |
Environmental Total | 55% | |||
| | | | | |
| | | | | |
Healthcare Total | 3% | |||
| | | | | |
| | | | | |
Protection: | ||||
Countermeasures | 7% | |||
Defense | 1% | |||
Ceramics | 3% | |||
| | | | | |
Protection Total | 11% | |||
| | | | | |
| | | | | |
Specialty: | ||||
Graphic Arts | 19% | |||
Industrial | 8% | |||
Chemicals | 3% | |||
Electronics | 1% | |||
| | | | | |
Specialty Total | 31% | |||
| | | | | |
| | | | | |
Divisional and geographical information relating to revenue is disclosed in note 2, "Revenue and segmental analysis" of the Consolidated Audited Financial Statements, attached to this Annual Report.
Magnesium Elektron
We believe we are the leading manufacturer in the western world of high-performance magnesium alloys, powders, plates and rolled sheets used in the aerospace, defense and photo-engraving industries. Magnesium Elektron operates plants in Swinton, United Kingdom, the Czech Republic, numerous plants in the United States and a plant in Ontario, Canada.
Magnesium alloys offer significant advantages over aluminum alloys, as they are around a third lighter, while exhibiting similar properties in terms of strength and stability. Customers typically utilize our specialized magnesium alloys when lightweight, high-strength or extreme temperature stability characteristics are important, such as in jet fighters and in helicopter gearboxes, which need to be able to operate at high temperatures and without lubrication in emergency situations.
33
We have developed a large percentage of the high-performance magnesium alloys that are available in major markets, including the United States. For example, we have developed 12 of the 18 magnesium alloys approved by the American Society for Testing Material's ("ASTM") Standard Specification for Magnesium-Alloy Sand Castings. In the last 30 years, five out of six new alloys added to the list have been developed and patented by Magnesium Elektron. The ASTM's Standard Specification for Magnesium-Alloy Extruded Bars, Rods, Profiles, Tubes, and Wire lists nine currently used alloys, and Magnesium Elektron has developed five of them. Furthermore, we believe we are the largest manufacturer of atomized magnesium powders in the world. Our magnesium powder manufacturing facilities have been manufacturing ground magnesium powders since 1941 and atomized powders since the 1960s.
Our growth strategy for Magnesium Elektron is to build on the strength of the brand name and worldwide reputation for developing and producing high performance magnesium alloys. This includes maintaining a continued focus on developing value-added products leveraging our extensive knowledge in magnesium metallurgy for a number of specialist markets, including the aerospace, defense, medical, high-end graphic arts and consumer packaging markets. Although we ultimately sell tangible products, we believe our customers place significant value on our technical know-how and ability to help them effectively utilize our materials in their products. Our strategy is to patent new materials and sometimes the processes used to make them, when appropriate. In the future, we may also charge a royalty fee for the use of some of our materials (e.g., medical applications), however, we currently price our materials to cover the cost of providing such technical expertise.
Magnesium Elektron serves a wide range of customers globally and has close and collaborative relationships with its customers. The top ten customers for magnesium products accounted for 25% of the Elektron division's revenue in 2013. Our largest Magnesium Elektron customer accounted for 4% of divisional revenue in 2013.
Magnesium Elektron competes in various specialist niches, including in the production of military powders and high-performance alloys. Competition is fragmented and varies from sector to sector, and includes competition from Chinese suppliers of magnesium die-casting alloys. We do not normally compete directly against primary magnesium producers, which supply pure magnesium and simple alloys.
We have a number of patented and off-patent products, which helps us maintain our competitive leverage in the markets we serve. Due to the significant complexity of producing our specific alloys, we believe that competitors are likely to have difficulty manufacturing certain of these alloys even after the patents that protect the composition have expired. Our principal competitor in magnesium powders is ESM, a U.S.-based subsidiary of the German company SKW Stahl-Metallurgie.
MEL Chemicals
We believe we are a leader in the manufacture of specialty zirconium compounds. MEL Chemicals chemically-derived zirconium products are more versatile, pure, and suitable for demanding applications than thermally derived products or natural zirconia, thus commanding a significantly higher value-added premium. These are sold in a powder or solution form and have a broad range of applications, including as the wash coats for catalytic converters that remove noxious gases in gasoline engine vehicles, electronics, structural and functional ceramics, paper production, chemical catalysis, solid oxide fuel cells and water purification. Our zirconium products are key components in a range of products, from automotive catalytic converters to microwave telecommunications and back-lighting technology found in mobile phones. MEL Chemicals operates two main manufacturing facilities in Swinton, United Kingdom and in Flemington, New Jersey. We also have a joint venture with Nippon Light Metal in Japan that is primarily devoted to research and analysis.
The zirconium plants use a multi-stage process based on proprietary technology to produce zirconium salts and zirconium oxides, which are differentiated by their chemical purity and physical properties. While zircon
34
sand is the base raw material in the manufacturing process, the division also uses a number of rare earths and commodity chemical products to produce its zirconium compounds. Yttria-stabilized zirconia, for example, exhibits a hardness, chemical inertness, and low heat conductivity that make it suitable in applications as diverse as dentistry and gas turbines.
The demand for our products is mainly driven by environmental concerns and environmental legislation, since our environmentally-friendly products can replace toxic chemicals in many applications, such as replacing formaldehyde in paper-coating and removing environmental toxins, such as arsenic, from waste effluent. We aim to buttress market demand for our products by developing new applications for our zirconium products, which will assist our customers address rising environmental, health and safety concerns in various industries related to chemical emissions, global environmental considerations and public health regulation and legislation. Key growth areas are catalytic applications for emission control systems for automotive and chemical industries, advanced ceramics in electronics and engineering, water purification technologies and biomedical applications.
With a leading position in the zirconium compounds market, MEL Chemicals has established itself over a number of years as an approved supplier to a number of blue-chip customers. These relationships have, in turn, facilitated the sharing of technical knowledge to develop new products and applications. The top ten customers of zirconium products accounted for 29% of the Elektron division's revenue in 2013. Our largest zirconium customer accounted for 8% of divisional revenue in 2013.
MEL Chemicals has experienced significant competition in simple zirconium compounds from Chinese suppliers, either directly or through the availability of low cost Chinese zirconium stock to specialist competitors. Markets with relatively low technology needs, such as lead replacement products for paint drying, have low margins due to aggressive pricing by Chinese suppliers who now have a majority share in such low technology markets. Rather than compete in these low margin areas, we have shifted our focus to more advanced products that require our leading technological knowledge, which we market to our clients to develop customized products to match their needs. There are a limited number of direct competitors in these specialized markets, where the products sold are complex chemical compounds with catalytic, electrical and ceramic properties. In such markets, we compete primarily with Daiichi Kigenso Kagaku Kogyo (DKKK) of Japan, Rhodia of France, Molycorp of Canada and Tosoh of Japan.
35
Gas Cylinders Division
Our Gas Cylinders division sells products under two core brands:Luxfer Gas Cylinders andSuperform. The Gas Cylinders division represented 54% and 32% of our total revenue and trading profit, respectively, in 2013. The table below shows the products, applications and principal markets and illustrative customers and end-users within each brand in the Gas Cylinders division.
Products | Application/principal markets supplied | Illustrative customers and end-users | ||
|---|---|---|---|---|
Luxfer Gas Cylinders: | ||||
| High-pressure aluminum and composite gas containment cylinders | Fire-fighters breathing apparatus | Scott International (Tyco), MSA, Honeywell | ||
Alternative fuels | Agility Fuel Systems | |||
Bulk gas transportation | GTM Technologies | |||
Industrial gases | Linde, Air Liquide | |||
Medical | Linde, Air Products | |||
Fire extinguisher | Ansul (Tyco), Chubb/Kidde (UTC) | |||
Beverage | Coca-Cola, Pepsi | |||
Scuba | XS Scuba | |||
Superform: | ||||
Superplastically-formed products | Aerospace | UTC Aerospace, Lockheed Martin, BAE Systems, Honeywell, Embraer, Short Brothers Plc | ||
Automotive | Rolls-Royce (BMW), Aston Martin, Morgan, Bentley (VW), Ferrari S.P.A. | |||
Medical | Siemens | |||
Rail | Bombardier |
The principal geographic markets for the Gas Cylinders division are the United States, Europe and Asia Pacific and the percentage of sales revenue by geographic destination and geographic origin and by end-markets for 2013 is shown below:
Gas Cylinders Division—Revenue by Geographic Destination
2013
Geographic Region | Percentage of Gas Cylinders Revenue | |||
|---|---|---|---|---|
North America | 42 | % | ||
European Community excluding U.K | 19 | % | ||
Asia Pacific | 14 | % | ||
Other Europe | 4 | % | ||
United Kingdom | 17 | % | ||
South & Central America | 4 | % | ||
36
Gas Cylinders Division—Revenue by Geographic Origin
2013
Geographic Region | Percentage of Gas Cylinders Revenue | |||
|---|---|---|---|---|
North America | 53% | |||
United Kingdom | 24% | |||
Other Europe | 21% | |||
Asia Pacific | 2% | |||
Gas Cylinders Division—End-Market Sales Analysis
2013
End-Market | Percentage of Gas Cylinders Revenue | |||
|---|---|---|---|---|
Environmental: | ||||
Aerospace—Lightweight Materials | 6% | |||
Alternative Fuels | 19% | |||
Automotive—Lightweight Materials | 5% | |||
Rail—Lightweight Materials | 2% | |||
| | | | | |
Environmental Total | 32% | |||
| | | | | |
| | | | | |
Healthcare: | ||||
Oxygen | 14% | |||
Medical Equipment | 1% | |||
| | | | | |
Healthcare Total | 15% | |||
| | | | | |
| | | | | |
Protection: | ||||
SCBA | 24% | |||
Fire | 8% | |||
Defense | 2% | |||
Scuba | 2% | |||
| | | | | |
Protection Total | 36% | |||
| | | | | |
| | | | | |
Specialty: | ||||
Industrial Gases | 11% | |||
Other | 6% | |||
| | | | | |
Specialty Total | 17% | |||
| | | | | |
| | | | | |
Divisional and geographical information relating to revenue is disclosed in note 2, "Revenue and segmental analysis" of the Consolidated Audited Financial Statements, attached to this Annual Report.
Luxfer Gas Cylinders
Luxfer Gas Cylinders manufactured and sold approximately 2.0 million cylinders in 2013, making us, we believe, the largest manufacturer of portable high pressure aluminum and composite cylinders worldwide. The business has achieved its leadership position through a long history of innovation and a commitment to setting a leading standard in product specifications and customer service. In 2013, we manufactured gas cylinders at seven manufacturing facilities: two in the United States and one each in the United Kingdom, France, Germany, Canada and China. In 2009, we established a presence in India through a 51% interest in a joint venture with a local business partner based in Delhi. In 2012 we established a 49% joint venture
37
with a business partner in the United States that commenced trading in 2013. All of our Luxfer Gas Cylinder manufacturing facilities also maintain sales and distribution functions. We have also established sales, distribution and service centers in Australia and Italy.
Overall growth in the Luxfer Gas Cylinders business has historically been driven by the inherent benefits of aluminum over steel for high pressure cylinders and, in 2013, sales of our aluminum cylinders accounted for approximately 40% of Gas Cylinders divisional revenue. Steel was the first material used for the containment of high pressure gas, but aluminum cylinders have the following recognized benefits:
- •
- Lightweight (up to 40% lighter than steel for most applications);
- •
- Non-corroding and non-reactive (ideal for maintaining gas purity);
- •
- Considered by many to be more cosmetically attractive than steel (desirable for domestic fire extinguishers, medical and scuba applications); and
- •
- Non-magnetic, allowing for safe use near powerful magnets used by some diagnostic equipment.
Luxfer Gas Cylinders has also led the industry's development of carbon composite cylinders, which include thin-walled aluminum lined cylinders wrapped in carbon fiber and, in 2013, sales of our composite cylinders accounted for approximately 57% of Gas Cylinders divisional revenue. Over the last decade, our composite cylinder business has enjoyed higher growth rates and stronger margins than our aluminum cylinder business. We believe demand for carbon composite cylinders will continue to grow driven by many of the additional benefits of carbon composite cylinders over aluminum and steel, namely the following:
- •
- Carbon composite cylinders are generally only one-third the weight of a comparable steel cylinder; and
- •
- High strength-to-weight ratio enabling increased pressure to be used for the same size cylinder, thereby increasing its volume capacity.
Demand has been driven by increased usage by the emergency services sector which is attracted to the advantages of the lightweight characteristics for life-support applications and the use of carbon composite cylinders to carry CNG for alternative fuel use in vehicles or the transportation of the gases themselves. Therefore, we see further growth opportunities in composite cylinders and associated new specialty products such as our patented SmartFlow flow control device, currently under development, and in alternative-fuel cylinder technology.
Luxfer Gas Cylinders has a very broad customer base, both geographically and by number. In total, the top ten customers accounted for 42% of the Gas Cylinder division's revenue in 2013. The division's largest customer accounted for 11% of its revenue in 2013. Customers in certain markets such as the medical, SCBA and fire extinguisher markets tend to be highly concentrated as there are relatively few end-user distributors. Within the SCBA market, we have achieved a very high level of market penetration by providing composite gas cylinders to the three major suppliers to the Western market, which we believe supply approximately 90% of the U.S. market: MSA, Tyco and Sperian (Honeywell).
Supported by a strong worldwide distribution network, we believe that Luxfer Gas Cylinders is the most global manufacturer of high pressure aluminum and composite gas cylinders worldwide. Over recent years, the high pressure gas cylinder market has been subject to some consolidation. Over the last four years, Worthington Industries, originally a steel cylinder competitor in the United States and Europe, has purchased three U.S. based competitors, the composite cylinder manufacturer SCI and two small aluminum cylinder manufacturers, Piper Metal Forming and Hy-mark Cylinders. Other competitors include Catalina Cylinders, an aluminum cylinder manufacturer in the United States, Faber, a steel and composite manufacturer from Italy, and MES Cylinders, an aluminum cylinder competitor based in Turkey. In the alternative fuel cylinder sector, our main competitor is the Norwegian-owned Hexagon Composites, which produces composite cylinders for CNG-powered vehicles. Quantum Fuel Systems also makes composite cylinders for CNG vehicles. In September 2012, Luxfer purchased Dynetek Industries, a specialist manufacturer of alternative fuel systems, with plants in Canada and Germany. In March 2014, Luxfer
38
acquired a small composite cylinder manufacturer in Utah including a facility purpose-built for the manufacture of Type 4 (polymer-lined) composite cylinder products which will be targeted initially at the class 8 heavy-duty truck market, where an increasing rate of conversion from diesel to CNG is widely anticipated.
In Asia, the market for aluminum cylinders is less developed and the larger competitors are predominantly steel-focused. Larger manufacturers include Everest Kanto Cylinder, based in India, and Beijing Tianhai Industry, based in China. However, the use of composite cylinders is growing in the Asia Pacific region and several competitors are now also manufacturing composite cylinders.
Superform
Superform developed the superplastic forming process, wherein controlled heat and air pressure are applied to special aluminum alloy sheets to elongate and form them into complex, bespoke shapes. These light, complex-shaped aluminum components are principally for use in the specialist automotive, electronics, aerospace, medical and rail transportation end-markets. Although superplastically-formed aluminum components are currently a relatively small, niche market, we believe that Superform is the largest independent supplier of such superplastically-formed aluminum components in the western world. Superform has operations in the United Kingdom and the United States.
Superform offers customers highly customized project development with the freedom to create complex geometric shapes that conventional stamping equipment cannot produce. Superform's technology is particularly well-suited to the manufacture of low to medium volumes of complex shapes in aluminum and composite materials, where the advantage of low-cost tooling resulting from the low-impact, low-pressure process more than offsets a generally higher component price than alternatives because of the material and length of process. The Superform business is also now offering titanium formings, and is working with the magnesium operations within our Elektron division to develop the market for ultra- lightweight magnesium superplastically-formed parts for our customers.
Demand in our Superform business has grown generally due to the automotive industry's increasing need to reduce weight in vehicles. In addition, demand has also grown as a result of an increasing variety of automotive bodywork in terms of shapes and sizes, especially in specialty and limited-edition automobiles, and, in 2013, Superform sales accounted for approximately 8% of Gas Cylinders divisional revenue.
Superform's customers tend to vary with the specific projects that it undertakes, but its key end-markets are aerospace, specialty automotive, rail transport and medical equipment.
As Superform invented the superplastic forming process, direct competition with our technology tends to be limited. Competition mainly arises from alternative technologies such as cold pressing and hydroforming or composite technology. Cold pressing uses standard alloys and high-tonnage presses with matched tooling. While the cold pressing process is very rapid, taking only a few seconds, the tooling is heavy and expensive, while the capability of the process is limited as pressing deep shapes using this process can excessively thin, or even tear, the material. Hydroforming is a specialized type of die forming that uses a high pressure hydraulic fluid to press material into a die at room temperature. A sheet of aluminum is placed inside a negative mold that has the shape of the desired end product. Hydraulic pumps then inject fluid at very high pressure, which forces the sheet of aluminum into the mold. The process is slower with higher tooling costs than cold pressing, but energy usage is less.
KTK in China is a competitor, and Magna International has established a forming operation in Ireland targeting slightly higher volume niche automotive applications and using slightly different technology—heated tools as opposed to heated presses. In addition, Boeing purchased a license to use our then-still-patented Superforming process from us in 1998, providing them with in-house superforming capability.
39
Luxfer Group—Our Key End-Markets
Environmental (43% of 2013 Revenue)
We believe many of our products serve a growing need to protect the environment and conserve its resources. Increasing environmental regulation, "green" taxes, and the increasing cost of fossil fuels have driven growth in this area. Our Elektron lightweight magnesium alloys and lightweight Superform aluminum, magnesium and titanium panels and components made with our alloys are widely used in aircraft, trains, trucks, buses and cars to reduce weight and improve fuel efficiency. Our composite gas cylinders are used in CNG-powered vehicles. For many years, we have sold zirconium-based chemicals for catalytic converters in gasoline engines, and we have recently developed similar products for the catalysis of emissions from diesel engines. Our zirconium chemical products are used to remove heavy metals (e.g., arsenic) from drinking water and have recently been developed to do the same from industrial effluent.
Area of focus | Product | End-Market Drivers | ||
|---|---|---|---|---|
| Alternative Fuels | • CNG fuel cylinders • CO2 capture • Bulk gas transportation cylinders | • "Clean air" initiatives • Abundance of natural gas • Favorable tax treatment • Increasing CNG filling infrastructure | ||
Environmental Catalysts (cleaning of exhaust emissions) | • Zirconium compounds with specific properties used in auto-cat washcoats | • Emissions legislation generally • Application of tighter regulations on diesel engines in United States and Europe • Cost effective for vehicle manufacturers as they avoid using precious metals | ||
Specialty/High end Automotive | • Superformed complex body panels, door inners and other components • Magnesium extrusions | • Fuel efficiency for a given level of performance • Increased flexibility to vehicle designers • Strong demand for top-end cars from wealthy individuals in emerging markets | ||
Recycling | • Recycling service converting magnesium scrap into good die-casting ingot | • Marketing "whole of life" costing for vehicles • Legislation requiring recycling at end of vehicle's life cycle | ||
Sensors, piezoelectrics and electro-ceramics | • Zirconium-based ceramic materials used in sensors of engine management systems | • Engine efficiency • Control of exhaust gases | ||
Water purification | • ISOLUX technology (removal of heavy metals from drinking water) | • Tightened World Health Organization guidelines on levels of heavy metals in drinking water and associated legislation |
40
Area of focus | Product | End-Market Drivers | ||
|---|---|---|---|---|
Rail transport | • Superformed train front cab and internal components | • Government investment in public transport • Fuel efficiency • Safety requirements moving from plastic to metal for internal components | ||
Military and civil aerospace | • Superform (wing leading edges, engine nacelle skins) • ELEKTRON aerospace alloys in cast, extruded, and sheet form | • Growing aircraft build rate • Increasing cost of fuel | ||
Helicopters | • Magnesium sand casting alloys, superformed panels | • Light-weighting • Fuel efficiency | ||
Paper | • Bacote and Zirmel, both formaldehyde-free insolubilizers that aid high quality printing | • Elimination of toxic chemicals |
41
Healthcare (10% of 2013 Revenue)
We have a long history in the healthcare end-market and see this as a major area of opportunity for new product technologies. We believe we offer the world's most comprehensive range of cylinders designed to contain medical gases, including specialized composite cylinders popular in emergency medical services. Our materials are also being used in medical treatments and are featured in certain medical equipment, including MRI scanners. Our recently announced innovations, which are still in development, include the lightweight IOS medical oxygen delivery system featuring our patented L7X higher-strength aluminum alloy and carbon composite cylinders integrated with our patented SmartFlow valve- regulator technology. We have also developed a bio-absorbable magnesium alloy branded SynerMag to be used for vascular intervention and skeletal tissue repair and zirconium MELSorb materials for use, among other things, as the active ingredient in the development of new dialysis media, including their use in portable equipment.
Area of focus | Product | End-Market Drivers | ||
|---|---|---|---|---|
| Medical Gases | • Portable aluminum and composite cylinders • Medical oxygen delivery system | • Growing use of medical gases • Shift to paramedics, who need portable, lightweight products • Growing trend to provide oxygen therapy in the home and to keep patients mobile • Increasingly aging population • Increase in respiratory diseases | ||
Medical Equipment Casings | • Superformed panels (e.g. for MRI scanners) | • Growing use of equipment using powerful magnets and consequent need for non-ferrous, but hygienic casings | ||
Pharmaceutical Industry | • Magnesium powders as a catalyst for chemical synthesis called the Grignard process | • Growth in pharmaceutical industry | ||
Orthopedics | • Magnesium sheets | • Improved mobility through use of easy-to-wear, lightweight braces and trusses | ||
Sorbents | • Melsorb material as active ingredient in wearable dialysis equipment | • Growth in kidney problems • Need to reduce time spent in hospital on dialysis • Invention of portable dialysis equipment |
42
Protection Technologies (24% of 2013 Revenue)
We offer a number of products that are used to protect individuals and property. Principal factors driving growth in this end-market include increasing societal expectations regarding the protection of individuals and armed forces personnel, tightening health and safety regulations and the significant cost of investing in and replacing technologically-advanced military property. We manufacture ultra-lightweight breathing-air cylinders that lighten the load on emergency services personnel working in dangerous environments, miniature cylinders for use in personal escape sets, aluminum cylinders for fire extinguishers and lightweight composite cylinders used to inflate aircraft emergency escape slides. Our ultra-fine atomized magnesium powder is a principal ingredient in counter-measure flares used to protect aircraft from heat-seeking missiles. Further, we are currently developing lightweight magnesium alloy armor plates for use on personnel carriers and patrol vehicles.
Area of focus | Product | End-Market Drivers | ||
|---|---|---|---|---|
| Life support breathing apparatus | • Composite gas cylinders used in SCBA | • Increased awareness of importance of properly equipping fire-fighting services post 9/11 • Demand for lightweight products to upgrade from heavy all-metal cylinders • Periodic upgrade of New U.S. National Institute for Occupational Safety and Health standards and natural replacement cycles • Asian and European fire services looking to adopt more modern SCBA equipment | ||
Fire protection | • Cylinders (carbon-dioxide-filled fire extinguisher) | • New commercial buildings • Cylinder replacement during annual servicing | ||
Countermeasures | • Ultra-fine magnesium powder for flares used in the protection of fixed wing aircraft and helicopters from attack by heat-seeking missile | • Use in training and combat • Maintenance of fresh reserve stocks of countermeasure powders | ||
Military Vehicles | • ELEKTRON magnesium alloys in cast, rolled, and extruded form | • Maintaining high level of protection while reducing weight to improve maneuverability and fuel economy |
43
Specialty Technologies (23% of 2013 Revenue)
Our core technologies have enabled us to exploit various other niche and specialty markets and applications. We are a leading producer of magnesium photo-engraving plates used by graphic arts printers and sign makers to produce high-quality packaging (e.g., book covers, labels for bottles of high-end spirits). We have also developed a range of cylinders for specialty applications, including inert-inner gas cylinders for rare gas and high-purity gas applications such as in the manufacture of semiconductors and other electronic products. Other applications include gas cylinders for portable welding and cutting equipment, carbon dioxide cylinders for beverage dispensing and cylinders for leisure applications such as paintball.
Area of focus | Product | End-Market Drivers | ||
|---|---|---|---|---|
| Specialty Industrial Gases | • Inert-interior aluminum cylinders for the electronics industry | • Semiconductor industry • Oil exploration | ||
Graphic Arts | • Photo-engraving plates | • Focus on luxury packaging as part of marketing high-end products | ||
Leisure activities | • Cylinders for leisure markets including paintballing, dragster racing | • Leisure time • Growth of middle class in emerging markets | ||
General Engineering | • Magnesium billets, sheets, coil, tooling plates • Zirconium ceramic compounds for hard working components. | • Economic growth • Need for components to operate in more extreme environments for longer periods, such as underground or in the ocean. |
Suppliers and Raw Materials
Elektron
The key raw materials used by our Elektron division are magnesium, zircon sand and rare earths.
The world market for magnesium is around 900,000 metric tons per year, with China being the dominant country of supply, representing around 75% of world supply. Western primary production is, however, significant, with U.S. Magnesium based in the United States, Dead Sea Magnesium based in Israel, RIMA Industrial based in Brazil, and two smelters in Russia. We purchase approximately half of our magnesium needs from China. We use only U.S. sourced materials for U.S. production for sale in the United States and in key markets like military applications, where U.S. and Canadian material and technology sourcing is mandatory. In 2010, we entered into a five-year magnesium supply contract with back-to-back pricing to support contracts for U.S. military countermeasure applications.
We purchase around 3,000 metric tons of zircon sand per annum. Zircon sand is a by-product of mining for titanium dioxide, and global production is estimated at approximately 1.2 million metric tons. We purchase only zircon sand of the highest-quality grades from Rio Tinto in South Africa and Iluka in Australia. We also purchase around 3,000 metric tons of intermediate zirconium chemicals from suppliers in China. We decide whether to purchase intermediate zircon or directly process zircon sand ourselves based on market prices, which determines the amount of zircon sand that we buy.
There are 17 rare earth metals that are reasonably common in nature and are usually found mixed together with other mineral deposits. Their magnetic and light-emitting properties make them invaluable to high-tech manufacturers. Demand for rare earths has expanded over the last few years because they serve as key
44
inputs in the manufacturing of a number of zirconium chemical and magnesium alloy products, but our main requirement is for cerium for use in automotive catalysis compounds, where it has particular oxygen storage capabilities.
Following a decade or more of low prices that drove most Western mines out of business, China developed a virtual monopoly on supply, producing 97% of the world's supply of rare earths in 2009. Supply of rare earths from China has been impacted since mid-2010 by Chinese export quotas, which limit the export of these raw materials from China, resulting in significant increases in pricing, including an increase in the price of cerium carbonate, priced in rare earth oxide contained weight, from $10 per kilogram in May 2010 to a peak of $270 per kilogram in July 2011. The high prices appear to have destroyed low-value applications, and the Chinese export quotas are not, at present, a supply constraint. During the second half of 2011 and throughout 2012 and 2013, rare earth prices fell, with cerium carbonate ending 2013 at approximately $8 per kilogram. In an effort to protect ourselves and our customers from significant fluctuation in the pricing of rare earths, we are being proactive in arranging sourcing of a growing proportion of our rare earths from non-Chinese suppliers. There are many projects currently underway to mine and refine rare earths outside China, and we have commenced discussions with a small number of potential suppliers, which are currently in the process of developing production capability. Notwithstanding the extremely large impact of the peak in rare earth pricing, we have been able to recover the rise in these rare earth costs through a customer surcharge.
Gas Cylinders
The largest single raw material purchased by the Gas Cylinders division is aluminum. In 2013, we purchased 57% of our aluminum needs from Rio Tinto Alcan and its associated companies. Aluminum costs were 53% of the division's raw material costs in 2013.
Since 2005, the cost of aluminum has been somewhat volatile, with several periods of high pricing, which has required us to implement significant price increases on our products. While we pass on most of the price increases to our customers, in some cases through contractual cost-sharing formulas, we have found that passing on price increases can be more difficult, or takes longer, for certain products that are more commoditized, such as cylinders for use as fire extinguishers. As a result, we have historically hedged a portion of our exposure to fluctuations in the price of aluminum.
As a means of hedging against increases in the price of aluminum, we use London Metal Exchange ("LME") derivative contracts. As of December 31, 2013 LME derivative contracts covered approximately 65% of our estimated primary aluminum needs for the following twelve months. The sheet used in the Superform operations is specialized and sourced from a number of different suppliers and distributors. Some highly specialized aluminum sheet is manufactured in-house by our Elektron division using equipment designed for casting and rolling of magnesium sheet.
Other key materials include carbon fiber used in composite products. The main suppliers of these materials are Toray and Mitsubishi. Increased demand for carbon fiber in the United States for commercial aerospace and military applications has led to carbon fiber shortages in recent years. We have built up relationships with these suppliers through providing them predictable requirements and fixed price annual contracts to encourage the successful procurement of our required quota for high-strength carbon fiber.
Environmental Matters
Our facilities, as with most manufacturing facilities, are subject to a range of environmental laws and regulations, including those relating to air emissions, wastewater discharges, the handling and disposal of solid and hazardous waste and the remediation of contamination associated with the current and historic use of hazardous substances or materials. If a release of hazardous substances or materials occurs on or from our properties, processes or any off-site disposal location we have used, or if contamination from
45
previous activities is discovered at any of our locations, we may be held liable for the costs of remediation, including response costs, natural resource damage costs and associated transaction costs. We devote considerable efforts to complying with, and reducing our risk of liability under, environmental laws, including the maintenance of a detailed environmental management system.
In view of their long history of industrial use, certain of our facilities have areas of soil and groundwater or surface water contamination that require or are anticipated to require investigation or remediation.
Magnesium Elektron, Swinton, U.K. A dedicated landfill has been adjacent to our Swinton, Manchester plant for over sixty years. Following a review, we decided to close the landfill and ship our continuing waste to commercial landfills off-site. A detailed closure plan for the landfill was approved in June 2011 with the Environmental Agency as the relevant regulator. The remediation process has progressed well through 2012 and 2013 and we estimate that it will require a further cost of $1.3 million to achieve closure, which amount is covered by a specific reserve in the books. This expenditure is likely to be spread over 2014 and early 2015, with the closure being undertaken by an independent third-party contractor.
Magnesium Elektron CZ, Litvinov, Czech Republic. Dross is a by-product of our production process. As a result of the local Czech environmental agency withdrawing permission for the previous disposal route, we began to stockpile significant quantities of the waste in 2007. The local environment agency also insisted on additional measures regarding the safe disposal of waste dross and a limit to the amount being held on-site. We began to address the issue in 2008 by installing a dross processing plant, at a cost of $0.8 million, to deal with this waste stream in an environmentally acceptable way. The recovery process involves crushing the dross waste and then extracting the magnesium to leave a residual powder. The process has proven successful with better than anticipated metal recovery and yields. The recovered metal is fed back into our main production process, which has resulted in a significant cost reduction benefit to the business. We have obtained approval to sell the powder as a soil supplement or fertilizer and have sold over 4,000 metric tons for this purpose in 2012 and 2013. At the end of 2013 we held an accrual of $0.3 million for the disposal of the remaining dross.
MEL Chemicals, Swinton, U.K. In 1998, MEL Chemicals identified radioactive scale (or mineral buildup) contaminating pipes, valves and tanks in a redundant ion exchange plant. The zircon sand used by the operation contains low-level naturally occurring radioactive material, which has become concentrated in the scale. More recently, radioactive hotspots were identified in an unused building on the site that had previously been used for the storage of a radioactive material. We have accrued $0.7 million to cover the estimated cost of removal and subsequent disposal for both of these matters and the work commenced in 2013. The relevant areas are isolated, have been clearly quarantined and are off limits to site personnel.
MEL Chemicals, Flemington, NJ. We have requested permission to collapse the sides of an old settling pond and, as a pre-condition, have been required by the New Jersey Department of Environmental Projection to undertake sampling of the soil that lay under the old pond liner. The total cost is expected to be between $0.2 million to $0.3 million.
MEL Chemicals, Flemington, NJ. We have been investigating the presence of dissolved salts in groundwater adjacent to our plant as to whether it has been caused by activity on our site. At this point, we believe that the majority of the salts being detected off-site are naturally occurring and our consultants have submitted a report to the NJDEP for acceptance.
MEL Chemicals, Flemington, NJ. We have historically used sludge ponds to help separate solid waste from process water used in our chemical plant, enabling us to recycle the water. Local environmental legislation tightening has made the process of safely disposing of such solid waste more expensive and problematic. We no longer use sludge ponds for this treatment, but hold accruals for the disposal of the remaining material of $3.2 million and expect the expenditures to be incurred in 2014 to 2015.
46
Redditch, U.K. In 2000, civil works carried out at the BA Tubes plant in Redditch were undertaken as part of the facility's capital expenditure program. Under the United Kingdom's Integrated Pollution Control regime, and at the request of the EA, soil samples were taken that revealed significant ground water contamination. Further investigations suggest that there were two historic spillages of large quantities of trichloroethylene prior to our ownership of the business. In 2008, the site was designated as a "special site" under the contaminated land regime in England and Wales, which makes the EA responsible for the management and oversight of site assessment and remediation. Various potential treatments have been evaluated and we have presented an action plan for voluntary remediation to the EA, the first elements of which have been implemented. We are working to deliver a long-term improvement plan. Since 2008, there has been no industrial activity on the Redditch site. As of December 31, 2013, we had a specific provision of $0.9 million to cover the future costs that would not be of a capital nature. It is expected that remediation will take several years.
General Issues. Under the U.S. Superfund Law or similar laws, we may be subject to liability with regard to on-site contamination and off-site waste disposals. The costs and liabilities associated with the identified matters above are not currently expected to be material. However, because additional contamination could be discovered or more stringent remediation requirements could be imposed in the future, there can be no assurance that the costs and liabilities associated with further environmental investigation and clean-up in respect of these matters will not be material.
We have made and will continue to make expenditures on environmental compliance and related matters. In 2013, we spent $0.8 million on environmental remediation.
We estimate that our expenditures on general environmental matters could be approximately $0.8 million in 2014. These expenditures primarily relate to, the closure of the Swinton landfill and the remediation at the Redditch site. We may also clear the effluent pond at Flemington at an estimated cost of $3.2 million. The exact timing of these expenditures is still uncertain and they may get delayed, reducing the expenditures in 2014 and pushing work into 2015 and later years. Since the magnitude of environmental problems often becomes clearer as remediation is undertaken, the actual cost of such remediation could be higher than our estimate. The nature of the cost is also difficult to fully ascertain, and we may capitalize some costs because the remediation work enhances the value of the land we own.
We have taken the future estimated environmental remediation expenditures into account in our ongoing financial planning, and expect to fund the expenditures from the operating cash we generate. Based on the information currently available to us, we do not believe that there are any other environmental liabilities or issues of non-compliance that will have a material effect on our consolidated financial position or results of operations. Future changes in environmental laws and regulations or other developments could, however, increase environmental expenditures and liabilities, and there can be no assurance that such costs and liabilities in any given year will not be material.
Environmental Management Systems. Following the completion of the Management Buy-In, we retained independent environmental consultants RPS to design and implement an Environmental Management System ("EMS") for the purpose of monitoring and taking remedial action in respect of the issues which were identified in the course of the Management Buy-In due diligence. This work led to the adoption of a corporate environmental policy and the development of an EMS manual used by all the facilities acquired at that time. Subsequent to the original Management Buy-In, all acquired facilities have been the subject of stringent environmental due diligence.
On all sites, we continued during 2013 to take a proactive approach to environmental issues and completed a number of projects to reduce the potential environmental impacts of issues identified in previous base-line reviews. We intend to certify all of our larger sites as ISO 14001-compliant. As of December 31, 2013, fourteen out of nineteen sites had achieved this objective.
47
We report the proportion of our sales that comes from ISO 14001-compliant sites as a non-financial KPI. The figure for 2013 is 91%, up from the 73% reported in 2012.
Seasonality
We have little aggregate exposure to seasonality in respect of demand for our products. However, we have shutdown periods for most of our manufacturing sites during which we carry out key maintenance work on our plants and equipment. The shut-down periods typically last two weeks in the summer and one to two weeks around Christmas, and consequently lead to reduced levels of activity in the second half of the year compared to the first half. Third and fourth quarter revenue and operating profit can be affected by the shutdowns at our own plants or by shut downs of production by various industrial customers. In particular, we have found that our fourth quarter results are lower as many customers reduce their production activity from late November through December. However, the lower level of activity in December usually leads to lower levels of working capital and therefore stronger cash flow around the year-end period. We also operate in various areas which are susceptible to bad weather during winter months, such as in Calgary, Canada and various eastern states in the U.S. Bad weather can lead to unexpected distribution of production or movement of goods from our manufacturing facilities and this could lead to reduced sales revenue and operating profits.
C. Organizational Structure
The following is a list of the Luxfer Holdings PLC significant subsidiaries:
Name of company | Country of incorporation | Proportion of ownership interest | ||||
|---|---|---|---|---|---|---|
BA Holdings, Inc.* | United States | 100% | ||||
Biggleswick Limited* | England and Wales | 100% | ||||
Luxfer Group Services Limited* | England and Wales | 100% | ||||
LGL 1996 Limited* | England and Wales | 100% | ||||
BAL 1996 Limited* | England and Wales | 100% | ||||
Hart Metals, Inc.* | United States | 100% | ||||
Lumina Trustee Limited(1) | England and Wales | 100% | ||||
Luxfer Australia Pty Limited* | Australia | 100% | ||||
Luxfer Gas Cylinders Limited* | England and Wales | 100% | ||||
Luxfer Gas Cylinders China Holdings Limited* | England and Wales | 100% | ||||
Luxfer Gas Cylinders (Shanghai) Co., Limited* | Republic of China | 100% | ||||
Luxfer Group Limited | England and Wales | 100% | ||||
Luxfer Group 2000 Limited | England and Wales | 100% | ||||
Luxfer, Inc.* | United States | 100% | ||||
Luxfer Overseas Holdings Limited* | England and Wales | 100% | ||||
Magnesium Elektron Limited* | England and Wales | 100% | ||||
MEL Chemicals, Inc.* | United States | 100% | ||||
Magnesium Elektron North America, Inc.* | United States | 100% | ||||
Magnesium Elektron CZ s.r.o.* | Czech Republic | 100% | ||||
MEL Chemicals China Limited* | England and Wales | 100% | ||||
Niagara Metallurgical Products Limited* | Canada | 100% | ||||
Reade Manufacturing, Inc.* | United States | 100% | ||||
Luxfer Gas Cylinders S.A.S.* | France | 100% | ||||
Luxfer Canada Limited* | Canada | 100% | ||||
Dynetek Europe GmbH* | Germany | 100% | ||||
48
Other Investments:
Name of company | Country of incorporation | Proportion of voting rights and shares held | ||||
|---|---|---|---|---|---|---|
Nikkei-MEL Co Limited* | Japan | 50% | ||||
Luxfer Uttam India Private Limited* | India | 51% | ||||
Dynetek Korea Co Limited* | South Korea | 49% | ||||
Dynetek Cylinders India Private Limited* | India | 49% | ||||
Luxfer Holdings NA, LLC* | United States | 49% | ||||
Subsidiary undertakings are all held by the Company unless indicated.
- *
- Held by a subsidiary undertaking.
- (1)
- Acts as bare trustee in connection with the 2007 share capital reorganization.
D. Property, Plant and Equipment
We operate from 18 manufacturing plants in the United Kingdom, United States, France, Germany, Czech Republic, Canada and China. We also have joint ventures in Japan, South Korea, India and the United States. Our headquarters are located in Salford, England. Our manufacturing plants for our operations, as of December 31, 2013, are shown in the table below:
Division | Property/Plant | Principal products manufactured | Ownership | Approximate area (square feet) | ||||||
|---|---|---|---|---|---|---|---|---|---|---|
Elektron | ||||||||||
| Swinton, England (2 plants) | Magnesium alloys/Zirconium chemicals | Split Lease/Own | 561,264 | |||||||
Madison, IL | Magnesium sheet | Lease | 803,795 | |||||||
Findlay, OH | Photo-engraving sheet | Own | 43,000 | |||||||
Tamaqua, PA | Magnesium powders | Own | 64,304 | |||||||
Lakehurst, NJ | Magnesium powders | Own | 78,926 | |||||||
Flemington, NJ | Zirconium chemicals | Own | 65,000 | |||||||
Ontario, Canada | Magnesium powders | Lease | 16,335 | |||||||
Litvinov, Czech Republic | Magnesium recycling | Own | 62,140 | |||||||
49
Division | Property/Plant | Principal products manufactured | Ownership | Approximate area (square feet) | ||||||
|---|---|---|---|---|---|---|---|---|---|---|
| Gas Cylinders | ||||||||||
| Nottingham, England | Aluminum cylinders | Lease | 143,222 | |||||||
Gerzat, France | Cylinders | Own | 327,535 | |||||||
Calgary, Canada | Composite Cylinders | Lease | 65,500 | |||||||
Dusseldorf, Germany | Composite Cylinders | Lease | 47,361 | |||||||
Worcester, England | Aluminum panels | Lease | 97,315 | |||||||
Riverside, CA | Composite cylinders | Lease/Own | 125,738 | |||||||
Graham, NC | Aluminum cylinders | Own | 121,509 | |||||||
Riverside, CA | Aluminum panels | Lease | 68,240 | |||||||
Shanghai, China | Cylinders | Lease | 15,383 | |||||||
We have other locations in Australia and Italy that are involved in sales and distribution but not the manufacture of our products, as well as our headquarters in Salford, England. Our headquarters are approximately 5,500 square feet, and we hold our headquarters under a short-term lease.
Utilization of our main productive pieces of plant and equipment is generally high across our businesses. We can adjust capacity relatively easily by varying shift patterns and/or manning levels, and there are few areas where we are currently constrained such that major capital investment is required to add capacity. Our strategic growth projects may require additional capacity to be installed over the next three years depending on the degree to which such projects are successful.
Item 4.A. Unresolved Staff Comments
There are no written comments from the staff of the SEC which remain unresolved as of the date of filing this Annual Report with the SEC.
Item 5. Operating and Financial Review and Prospects
The following discussion of our financial condition and results of operations should be read in conjunction with Item 3.A "Selected Financial Data", our audited consolidated financial statements and accompanying notes appearing elsewhere in this Annual Report. Our audited consolidated financial statements have been prepared in accordance with IFRS as issued by the IASB.
The preparation of our audited consolidated financial statements required the adoption of assumptions and estimates that affect the amounts recorded as assets, liabilities, revenue and expenses in the years and periods addressed and are subject to certain risks and uncertainties. See "Note 1—Accounting policies" to our audited consolidated financial statements included in this Annual Report for additional details on assumptions and estimates. Our future results may vary substantially from those indicated because of various factors that affect our business, including, among others, those identified under "Forward-Looking Statements" and "Risk Factors" and other factors discussed in this Annual Report.
50
A. Operating Results
Results of Operations for the Years Ended December 31, 2013, 2012 and 2011
The table below summarizes our consolidated results of operations for the years ended December 31, 2013, 2012 and 2011, both in U.S. dollars and as a percentage of total revenue. For more detailed segment information, see "Note 2—Revenue and Segmental Analysis" to our audited consolidated financial statements included elsewhere in this Annual Report.
| | Year Ended December 31, | ||||||||||||
|---|---|---|---|---|---|---|---|---|---|---|---|---|---|
| | | | Restated under IAS 19R | ||||||||||
| | 2013 | 2012 | 2011 | ||||||||||
| | Amount | Percentage of Revenue | Amount | Percentage of Revenue | Amount | Percentage of Revenue | |||||||
| | (in $ millions) | (%) | (in $ millions) | (%) | (in $ millions) | (%) | |||||||
Revenue | $481.3 | 100.0 | % | $511.6 | 100.0 | % | $510.8 | 100.0 | % | ||||
Cost of sales | (363.5 | ) | (75.5 | )% | (385.7 | ) | (75.4 | )% | (390.4 | ) | (76.4 | )% | |
| | | | | | | | | | | | | | |
Gross profit | 117.8 | 24.5 | % | 125.9 | 24.6 | % | 120.4 | 23.6 | % | ||||
Other income | — | — | — | — | 2.0 | 0.4 | % | ||||||
Distribution costs | (6.5 | ) | (1.4 | )% | (6.9 | ) | (1.3 | )% | (7.3 | ) | (1.4 | )% | |
Administrative expenses | (52.2 | ) | (10.8 | )% | (50.4 | ) | (9.9 | )% | (51.2 | ) | (10.0 | )% | |
Share of results of joint venture | 0.1 | 0.0 | % | (0.1 | ) | (0.0 | )% | (0.2 | ) | (0.0 | )% | ||
| | | | | | | | | | | | | | |
Trading profit(1) | $59.2 | 12.3 | % | $68.5 | 13.4 | % | $63.7 | 12.5 | % | ||||
Restructuring and other expense(2) | (2.7 | ) | (0.6 | )% | (2.1 | ) | (0.4 | )% | 0.2 | 0.0% | |||
| | | | | | | | | | | | | | |
Operating profit | $56.5 | 11.7 | % | $66.4 | 13.0 | % | $63.9 | 12.5 | % | ||||
Other income (expense): | |||||||||||||
Acquisition and disposal costs(2) | (0.1 | ) | (0.0 | )% | (0.8 | ) | (0.2 | )% | (0.2 | ) | (0.0 | )% | |
Finance income: | |||||||||||||
Interest received | 0.3 | 0.0 | % | 0.2 | 0.0 | % | 0.2 | 0.0 | % | ||||
Finance costs: | |||||||||||||
Interest costs | (6.2 | ) | (1.3 | )% | (6.7 | ) | (1.3 | )% | (9.2 | ) | (1.8 | )% | |
IAS 19—retirement benefits finance charge | (3.8 | ) | (0.8 | )% | (3.6 | ) | (0.7 | )% | (1.9 | ) | (0.4 | )% | |
| | | | | | | | | | | | | | |
Profit on operations before taxation | $46.7 | 9.7 | % | $55.5 | 10.8 | % | $52.8 | 10.3 | % | ||||
Tax expense | (12.6 | ) | (2.6 | )% | (16.0 | ) | (3.1 | )% | (12.5 | ) | (2.4 | )% | |
| | | | | | | | | | | | | | |
Net income for the year | $34.1 | 7.1 | % | $39.5 | 7.7 | % | $40.3 | 7.9 | % | ||||
| | | | | | | | | | | | | | |
| | | | | | | | | | | | | | |
Adjusted net income for the year(3) | $39.8 | 8.3 | % | $44.7 | 8.7 | % | $41.1 | 8.0 | % | ||||
| | | | | | | | | | | | | | |
- (1)
- Trading profit is the "segment profit" performance measure used by our chief operating decision maker as required under IFRS 8 for divisional segmental analysis. Management also believes that the presentation of group trading profit is useful to investors because it is a key performance indicator used by management to measure financial performance. Trading profit is defined as operating profit before restructuring and other income (expense). See "Note 2—Revenue and segmental analysis" in our audited consolidated financial statements included elsewhere in this Annual Report.
- (2)
- For further information, see "Note 5—Other income (expense) items" in our audited consolidated financial statements included elsewhere in this Annual Report. See footnote (2) of Item 3.A. ("Selected financial data") of this Annual Report.
- (3)
- Adjusted net income for the year is a non-GAAP financial measure and is used to provide an alternative to net income for purposes of measuring earnings per share. See note 10 of the audited consolidated financial statement included elsewhere in this Annual Report footnote (8) of Item 3.A., "Selected financial data" of this Annual Report for a reconciliation to net income for the year.
51
Year Ended December 31, 2013 Compared to Year Ended December 31, 2012
Revenue. Our revenue from continuing operations was $481.3 million in 2013, a decrease of $30.3 million from $511.6 million in 2012. This decrease includes the effect of a $32.1 million reduction in revenue resulting from the rare earth surcharges to zirconium chemical customers that our Elektron division used to recover the increased cost of rare earths. Excluding the rare earth surcharge and impact of exchange rate translation (a $1.5 million loss on revenue attributable to a stronger average U.S. dollar exchange rate used to translate revenues from operations outside the United States), the increase in revenue at constant translation exchange rates was $3.3 million. This related to increased sales of large composite cylinders for CNG containment, along with strong sales demand for composite SCBA cylinders, which offset weaker demand for defense products and other industrial sectors, mainly in European markets, in both the Elektron and Gas Cylinders divisions.
Analysis of revenue variances from 2012 to 2013 for continuing operations
| | Elektron | Gas Cylinders | Group | |||||||
|---|---|---|---|---|---|---|---|---|---|---|
| | (in $ millions) | |||||||||
2012 revenue—as reported under IFRS | $ | 265.3 | $ | 246.3 | $ | 511.6 | ||||
FX Translation impact—on non-U.S. operating results | (1.4 | ) | (0.1 | ) | (1.5 | ) | ||||
Trading variances for ongoing operations—2013 v 2012 | (12.1 | ) | 15.4 | 3.3 | ||||||
Rare earth surcharge variance | (32.1 | ) | — | (32.1 | ) | |||||
| | | | | | | | | | | |
2013 revenue—as reported under IFRS | $ | 219.7 | $ | 261.6 | $ | 481.3 | ||||
| | | | | | | | | | | |
| | | | | | | | | | | |
The above table shows the change in each division's revenue between 2013 and 2012. It separates the impact of changes in average exchange rates on non-U.S. operations when translated into U.S. dollar consolidated results as well as the impact of the rare earth surcharge, which we introduced in late 2010 to offset the effect of a substantial increase in the cost of rare earth chemicals. The total rare earth surcharge levied in 2013 was $8.4 million, compared to $40.5 million in 2012.
The total revenue profile for the Group and the Elektron division has been distorted by the level of surcharge levied in 2012 and 2013 and is not indicative of the underlying performance of the Group and the Elektron division. The following discussion provides an explanation of our changes in revenue by division.
Elektron
The Elektron division's revenue was $219.7 million in 2013, a reduction of $45.6 million from $265.3 million in 2012. Excluding the $1.4 million adverse translation exchange rate impact on revenue and excluding the decrease in revenue relating to the rare earth surcharge, the underlying decrease in revenue at constant translation exchange rates was $12.1 million from 2012. This represents a revenue decrease of 4.6%, on revenues in 2012, excluding the rare earth surcharge and adjusted for the translation impact.
Magnesium revenue decreased, at constant exchange rates, by 2.7% in 2013 when compared to 2012. The main decreases related to magnesium powders sold to the military for use in counter-measure flares due to the ongoing impact of the U.S. federal government budget sequestration in 2013, which, among other items, imposed spending cuts on defense spending. This was partially offset by strong demand for our high-performance aerospace alloys in the United States and increased volumes in our Magnesium recycling business.
52
Overall sales volume of zirconium products reduced in 2013. Excluding the effects of the surcharge revenue and the translation exchange rate impact, revenues decreased by 6.2% as a result of lower volumes and selling prices. Although there were some signs of recovery in the European automotive market, this has not led to an increase in demand.
Gas Cylinders
The Gas Cylinder division's revenue was $261.6 million in 2013, an increase of $15.3 million from $246.3 million in 2012. Excluding a $0.1 million adverse impact on revenue attributable to exchange rate translation the underlying revenue, at constant translation exchange rates, was $261.7 million, or 6.3%, higher than 2012.
Sales volumes of our aluminum gas cylinders decreased by 11% in 2013, with total sales revenue of these products reducing by 16.5% due to an unfavorable mix of product sales. There was lower demand across the aluminum product range, mainly due to weak European demand. The sector most impacted were medical aluminum cylinders, beverage CO2 cylinders and fire extinguisher cylinders.
Sales volumes of our composite cylinders increased by 1.4% in 2013 compared to 2012, however due to a significant change in mix (size and type of cylinder), total sales revenue increased by 33.2%. There was significant growth in sales volumes of large composite cylinders used in alternative fuel vehicle systems and gas transportation modules in 2013, when compared to the prior year. The increase in underlying alternative fuel cylinders was further augmented by our acquisition of Dynetek which took place at the end of the third quarter of 2012, adding significant new capacity. Sales in composite life-support (air) cylinders used in self-contained breathing apparatus for emergency services also increased significantly over 2012, with stronger demand returning in the USA, on the back of fire fighter kits being replaced approximately 10 years after a major investment period in protection equipment, post 9-11.
Superform sales increased slightly by 3.0% in 2013 compared to 2012. The growth is the result of increased demand in the premium automotive market and new opportunities for train (rail) applications.
Luxfer Group
Cost of Sales. Our cost of sales was $363.5 million in 2013, a decrease of $22.2 million from $385.7 million in 2012. Excluding a translation gain of $2.1 million on cost of sales of non-U.S. operations, our cost of sales at constant translation exchange rates decreased by $24.3 million, or 6.3%, from 2012. A reduction in sales volumes, mainly in European markets, and costs of certain raw materials led to the decreases in 2013 when compared to 2012.
Gross Profit. Gross profit was $117.8 million in 2013, a decrease of $8.1 million from $125.9 million in 2012. Overall gross profit margin was relatively stable with a small decreased to 24.5% in 2013 from 24.6% in 2012.
Distribution Costs. Distribution costs were $6.5 million in 2013, a decrease of $0.4 million from $6.9 million in 2012. There was a translation gain on costs for non-U.S. operations of $0.1 million, and the underlying movement in costs at constant translation exchange rates was a decrease of $0.5 million, or 7.2%, reflecting the reduction in sales volumes in certain markets.
Administrative Expenses. Our administrative expenses were $52.2 million in 2013, an increase of $1.8 million, or 3.6%, from $50.4 million in 2012. The translation to U.S. dollars from our non-U.S. operations decreased costs by $0.3 million. The underlying increase in costs of $2.1 million was due to a full year of additional administrative costs for the former Dynetek operations acquired in the second half of 2012, along with a full year of the costs associated with being a listed company following the IPO in the fourth quarter of 2012.
53
Share of results of joint ventures. We have a number of joint venture operations, with the most active being in India and USA. In 2013 we entered into a new joint venture agreement to establish a manufacturing facility to produce Gas Transportation Modules in the USA. The joint ventures have been accounted for using the equity method, as the partners have a contractual agreement that establishes joint control over the economic activities of the entities. In 2013 there was a profit of $0.1 million attributable to the joint ventures, compared to a loss of $0.1 million in 2012. We also receive interest income from the USA joint venture, which is recognized below operating and trading profit.
Operating and Trading Profit. Our operating profit was $56.5 million in 2013, a decrease of $9.9 million, or 14.9%, from $66.4 million in 2012. Our trading profit was $59.2 million in 2013, a decrease of $9.3 million, or 13.6%, from $68.5 million in 2012.
Analysis of trading profit and operating profit variances from 2012 to 2013 for continuing operations
| | Elektron Trading Profit | Gas Cylinders Trading Profit | Group Trading Profit | Restructuring and other expense | Group Operating Profit | |||||||||||
|---|---|---|---|---|---|---|---|---|---|---|---|---|---|---|---|---|
| | (in $ millions) | |||||||||||||||
2012—as reported under IFRS (restated under IAS 19R) | $ | 52.8 | $ | 15.7 | $ | 68.5 | $ | (2.1 | ) | $ | 66.4 | |||||
FX Translation impact—on non-U.S. operating results | (0.5 | ) | 0.1 | (0.4 | ) | — | (0.4 | ) | ||||||||
| | | | | | | | | | | | | | | | | |
2012—adjusted for FX translation | $ | 52.3 | $ | 15.8 | $ | 68.1 | $ | (2.1 | ) | $ | 66.0 | |||||
Trading variances for ongoing operations—2012 v 2013 | (12.1 | ) | 3.2 | (8.9 | ) | (0.6 | ) | (9.5 | ) | |||||||
| | | | | | | | | | | | | | | | | |
2013—as reported under IFRS | $ | 40.2 | $ | 19.0 | $ | 59.2 | $ | (2.7 | ) | $ | 56.5 | |||||
| | | | | | | | | | | | | | | | | |
| | | | | | | | | | | | | | | | | |
The above table shows the change in each division's trading profit, Group trading profit and Group operating profit between 2012 and 2013. The table also provides a reconciliation of Group trading profit to Group operating profit. The table separates the impact of changes in average exchange rates on non-U.S. operations when translated into U.S. dollar consolidated results.
Translating our non-U.S. operations into U.S. dollars has resulted in a decrease in our trading profit and operating profit of $0.4 million and $0.4 million, respectively, in 2013. This decrease represented 4.3% and 4.0% of the change in trading profit and operating profit respectively from 2012. At constant translation exchange rates, our trading profit decreased by $8.9 million or 13.1% and our operating profit decreased by $9.5 million or 14.4% in 2013.
Though net revenue, excluding the rare earth surcharge and the impact of changes in foreign exchange translation rates improved, there was a switch in the sales mix from the Elektron division to the Gas Cylinders division which had an adverse profit impact. The fall in Elektron's sales had a greater profit impact due to the typically higher operating margins of the Elektron division. These volume and mix changes are further discussed by division below. This had a negative impact of $6.1 million on our trading profit and operating profit in 2013.
We had a number of cost changes that together resulted in reducing trading profit and operating profit by a net $2.8 million in 2013. The main reasons for these changes were as follows:
- •
- The overall impact of foreign exchange transaction rates on sales and purchases was a charge of $2.2 million, net of the benefit of utilizing foreign currency exchange derivative contracts.
54
- •
- Employment and other costs have increased by a net $0.6 million in 2013, this included the following variances:
- •
- Our accounting charges for our defined benefit plans increased in 2013. The total impact on trading profit and operating profit was a $0.1 million additional charge when compared to 2012. The increase in retirement benefit costs reflects the increased actuarial costs of the U.K. and U.S. plans under IAS 19 accounting. We had a decrease in central costs of $0.3 million, which related to the levy charged on the U.K. Luxfer Group Pension Plan by the Pension Protection Fund ("PPF"). The PPF applies a levy on all U.K. defined benefit pension plans to pay for the cost of U.K. plans that it takes over after a sponsor has gone into insolvency with an under-funded plan. The cost of the PPF levy for us was $1.2 million in 2013, as compared to $1.5 million in 2012.
- •
- As a result of implementing a series of share based compensation plans across the group we incurred an IFRS 2 charge of $1.3 million linked to the fair value of these awards vesting in 2013.
- •
- We incurred net other cost increases of employment and other costs of $1.0 million across the Group.
The segment trading profit results by division are further explained in more detail below:
Elektron
The Elektron division's trading profit of $40.2 million in 2013 was a decrease of $12.6 million from $52.8 million in 2012. Changes in exchange rates used to translate segment trading profit into U.S. dollars led to a $0.5 million decrease in 2013, and therefore profits at constant translation exchange rates decreased by $12.1 million, or 22.9%.
There was an adverse variance of $10.0 million in 2013 in volume and sales mix when compared with 2012. This being a result of weaker demand in various higher margin product lines, offset by improved sales in recycling which is significantly lower in profit margin. There was a further $2.7 million adverse variance as a result of reduced margins on lower pricing, net of reduced material costs.
For 2013, the foreign exchange transaction rates on sales and purchases had a negative impact of $1.2 million, net of the benefit of utilizing foreign currency exchange derivative contracts, compared to 2012.
Employment and other costs have reduced by a net $1.8 million in 2013. This included a $0.1 million decrease in retirement benefit charges and PPF levy cost allocated to the division and $2.8 million of other cost savings, but net of cost increases in relation to an estimated $0.4 million of production inefficiencies and $0.7 million of equity compensation charges in relation to new equity award schemes.
Gas Cylinders
The Gas Cylinders division's trading profit of $19.0 million in 2013 was an increase of $3.3 million from $15.7 million in 2012. Changes in exchange rates used to translate segment trading profit into U.S. dollars led to a $0.1 million increase in 2013, and therefore profits at constant translation exchange rates increased by $3.2 million, or 20.4%.
The division achieved a trading profit benefit of $6.6 million through improved trading activities, including higher sales of composite cylinders, better pricing and reduction in input costs. Breaking this down further, improved sales volumes and a better mix of sales, with a larger proportion of sales being derived from higher margin products, increased profit by $3.5 million when compared to 2012. This includes the benefit of being able to utilize the full capacity of the Dynetek operations acquired in September 2012, which had been under-utilized under the previous ownership. The input cost savings on raw materials were $1.2 million favorable compared to 2012 and net sales prices were $1.9 million favorable.
55
In 2013, the foreign exchange transaction rates on sales and purchases had a negative impact of $1.0 million, net of the benefit of utilizing foreign currency exchange derivative contracts, compared to 2012.
Through our investment in automation of our production facilities we saved a further $2.1 million in operating costs. The division's allocation of the new share based compensation costs was $0.6 million. Employment and other costs increased by a net $3.9 million, reflecting the increased costs from the acquisition of Dynetek, expansion of our sales and distribution costs for the expanding alternative fuel business, staff bonuses which are linked to the improved profit performance and general cost increases.
Luxfer Group
Restructuring and other income (expense). In 2013, there was a $2.7 million charge to restructuring and other income (expense) compared to a charge of $2.1 million in 2012. In 2013, deferred members of the U.S. pension plans were offered the option of a lump sum buy-out in respect of their benefits in the plan. The settlement of the pension liabilities resulted in a one off actuarial charge to the income statement of $1.7 million. There were $0.3 million of costs incurred in relation to rationalization costs in the Gas Cylinders division and $0.2 million of costs were incurred in relation to rationalization costs in the Elektron division. There was also a charge of $0.5 million to the income statement under IFRS 2 in relation to share options granted as part of the IPO.
In 2012, there was a $2.1 million charge to restructuring and other income (expense). There were $1.1 million of costs incurred in relation to rationalization costs in the Gas Cylinders division and $0.2 million of costs were incurred in relation to minor rationalization costs in the Elektron division. There was also a charge of $0.8 million to the income statement under IFRS 2 in relation to share options granted as part of our IPO. The IPO being a one-off event.
Net acquisition and disposal costs. In 2013, we incurred a non-operating charge of $0.1 million compared to $0.8 million in 2012. In 2013, $0.1 million was recognized by the Gas Cylinders division in relation to the acquisition of Dynetek and the finalization of the fair value exercise. In 2012, there was a net acquisition cost of $0.6 million recognized by the Gas Cylinders division in relation to the acquisition of Dynetek and we also incurred $0.2 million in relation to a voluntary agreement with the Federal Trade Commission ("FTC") to sell and license a subset of our U.S. photo-engraving business to a third party after the acquisition of Revere Graphics Worldwide ("Revere") in 2007. The sale was achieved in late 2012.
Finance income—interest received. Interest received was $0.3 million in 2013 and $0.2 million in 2012. Interest received is generated by placing surplus cash on short-term deposit.
Finance costs—interest costs. The finance costs of $6.2 million that we incurred in 2013 decreased from $6.7 million in 2012. The costs were lower as a result of the reduced level of indebtedness.
The finance costs we incurred in 2013 included $5.0 million of interest payable on our current financing facilities and $1.2million of amortization relating to finance costs.
The finance costs we incurred in 2012 included $5.7 million of interest payable on our current financing facilities and $1.0 million of amortization relating to finance costs.
Taxation. In 2013, our tax expense was $12.6 million on profit before tax of $46.7 million. The effective tax rate was 27.0% on the profit before tax. Of the charge of $12.6 million, $9.6 million (20.6% effective rate) related to current tax payable and $3.0 million (6.4% effective rate) was a deferred taxation charge. In 2012, our tax expense was $16.0 million on profit before tax of $55.5 million. The effective tax rate was 28.8% on the profit before tax. Of the charge of $16.0 million, $11.1 million (20.0% effective rate) related to current tax payable and $4.9 million (8.8% effective rate) was a deferred taxation charge.
56
The effective rate of the current tax, which is the taxes that are payable on current year profits rose by 0.6% from 2012 with more profits being generated in higher tax jurisdictions, such as the U.S., partially offset through the benefit of tax initiatives in the U.K around manufacturing U.K. patented products ("UK Patent Box"). The deferred tax rate is lower than 2012 due to the partial recognition of certain losses for offset against future income and various timing differences including in relation to share based compensation charges in the year.
Net income for the Financial Year. Net income for the year was $34.1 million compared to $39.5 million in 2012, mainly as a result of the switch in the sales mix from the typically higher margin Elektron division to the Gas Cylinders division.
Adjusted net income, which excludes the after tax impact of certain exceptional items, as set out in the Non-GAAP reconciliation under Item 3.A. "Selected Financial Data", was $39.8 million, down on the adjusted income for 2012 of $44.7 million. This fall being a more direct measure of the net income impact of the lower trading result in the Elektron division, offset by the improvement in the Gas Cylinders division.
Year Ended December 31, 2012 Compared to Year Ended December 31, 2011
Revenue. Our revenue from continuing operations was $511.6 million in 2012, an increase of $0.8 million from $510.8 million in 2011. This increase includes the effect of a $29.3 million reduction in revenue resulting from the rare earth surcharges to zirconium chemical customers that our Elektron division used to recover the increased cost of rare earths. Excluding the rare earth surcharge and impact of exchange rate translation (a $6.2 million loss on revenue attributable to a stronger average U.S. dollar exchange rate used to translate revenues from operations outside the United States), the increase in revenue at constant translation exchange rates was $36.3 million. This increase was a result of increased sales volumes combined with changes in sales mix, the acquisition of Dynetek, pricing and transactional exchange differences on export sales across a range of major market sectors.
Analysis of revenue variances from 2011 to 2012 for continuing operations
| | Elektron | Gas Cylinders | Group | |||||||
|---|---|---|---|---|---|---|---|---|---|---|
| | (in $ millions) | |||||||||
2011 revenue—as reported under IFRS | $ | 287.5 | $ | 223.3 | $ | 510.8 | ||||
FX Translation impact—on non-U.S. operating results | (3.3 | ) | (2.9 | ) | (6.2 | ) | ||||
Trading variances for ongoing operations—2012 v 2011 | 10.4 | 25.9 | 36.3 | |||||||
Rare earth surcharge variance | (29.3 | ) | — | (29.3 | ) | |||||
| | | | | | | | | | | |
2012 revenue—as reported under IFRS | $ | 265.3 | $ | 246.3 | $ | 511.6 | ||||
| | | | | | | | | | | |
| | | | | | | | | | | |
The above table shows the change in each division's revenue between 2012 and 2011. It separates the impact of changes in average exchange rates on non-U.S. operations when translated into U.S. dollar consolidated results as well as the impact of the rare earth surcharge. The total rare earth surcharge levied in 2012 was $40.5 million, compared to $69.8 million in 2011.
The total revenue profile for the Group and the Elektron division has been distorted by the increase and subsequent decrease in the surcharge levied in 2011 and 2012 and is not indicative of the underlying performance of the Group and the Elektron division. The following discussion provides an explanation of our changes in revenue by division.
57
Elektron
The Elektron division's revenue was $265.3 million in 2012, a reduction of $22.2 million from $287.5 million in 2011. Excluding the $3.3 million adverse translation exchange rate impact on revenue and excluding the decrease in revenue relating to the rare earth surcharge, the underlying increase in revenue at constant translation exchange rates was $10.4 million from 2011. This represents a revenue increase of 3.6%, on revenues in 2011, excluding the rare earth surcharge and adjusted for the translation impact.
Despite a decrease in overall volumes of 3%, a favorable mix of product sales resulted in magnesium revenue increasing, at constant exchange rates, by 5.2% in 2012 when compared to 2011. There was strong demand generally for our high-performance aerospace alloys in the United States, and we also benefited from the extension of a major helicopter gearbox refurbishment program. Following the successful installation of a new extrusion press at our U.K. magnesium operation, we were able to increase sales of extruded products by being able to manufacture and offer magnesium alloys extruded into shaped cross- sectional profiles. Sales of powders to the military for use in counter-measure flares increased in 2012 due to stronger demand from the U.S. military and increased export sales. Sales of our own-manufactured magnesium photo- engraving plate remained similar to those achieved in 2011, while sales of our traded non-magnesium photo-engraving plate, such as zinc and copper, increased over the same period. The downturn in the European automotive market resulted in a reduction in sales volumes of recycled magnesium while sales of commercial alloys were also down in 2012 compared with 2011.
Though overall sales volume of zirconium products reduced in 2012, excluding the effects of the surcharge revenue, revenues increased by 4.4% as a result of higher selling prices and an improved mix of products sold. Rare earths are primarily used in the manufacture of catalysts used in catalytic converters. As the costs of rare earths fell in 2012, customers reduced their inventory levels ahead of an expected future reduction in the surcharge. This, combined with an 8% reduction in demand for new cars within Europe in 2012, resulted in sales volumes of auto-catalyst products being less in 2012 than in 2011. This reduction was more than off-set by increased sales of: our industrial catalysts, as interest rose in our environmentally-friendly zirconium technologies; traditional oxide products used in ceramic and electro-ceramic applications; and ceramic and reactive chemicals that have a number of uses, including, for example, improving the energy efficiency of screens in electronic devices.
Gas Cylinders
The Gas Cylinder division's revenue was $246.3 million in 2012, an increase of $23.0 million from $223.3 million in 2011. Excluding a $2.9 million adverse impact on revenue attributable to exchange rate translation the underlying revenue, at constant translation exchange rates, was $25.9 million, or 11.6%, higher than 2011.
While sales volumes of our aluminum gas cylinders decreased by 8% in 2012, total sales revenue of these products rose by 1.6% due to increased selling prices and a favorable mix of product sales. There were some encouraging growth signs in this sector with increased sales volumes of beverage, large industrial and scuba aluminum cylinders. These increases were offset by lower sales of smaller medical aluminum cylinders and reduced demand for lower-value fire extinguisher cylinders.
Sales volumes of our composite cylinders increased by 20% in 2012 compared to 2011. There was a significant increase in the sales of our patented L7X medical composite cylinders in 2012 when compared to 2011, mainly as a result of the finalization in late 2011 of the U.K. National Health Service tenders to supply the home oxygen therapy market and our subsequent selection as the provider of light-weight cylinders in 2012 to the newly appointed U.K. home oxygen service providers. We also saw significant growth in sales volumes of large composite cylinders used in alternative fuel vehicle systems and gas
58
transportation modules in 2012 compared to the prior year. The increase in underlying alternative fuel cylinders was further augmented by our acquisition of Dynetek at the end of the third quarter of 2012.
Superform sales were slightly down by 2.5% in 2012 compared to 2011. Two major customers suffered weaker than expected demand for premium cars and the U.K. government cut back spending on rail infrastructure projects. U.S aerospace demand remained strong with new projects boosting sales demand.
Luxfer Group
Cost of Sales. Our cost of sales was $385.7 million in 2012, a decrease of $4.7 million from $390.4 million in 2011. Excluding a translation gain of $5.5 million on cost of sales of non-U.S. operations, our cost of sales at constant translation exchange rates increased $0.8 million, or 0.2%, from 2011. The reduction in rare earth costs was offset by increases in other material costs and higher sales volumes in 2012 when compared to 2011.
Gross Profit. Gross profit was $125.9 million in 2012, an increase of $5.5 million from $120.4 million in 2011. Overall gross profit margin increased to 24.6% in 2012 from 23.6% in 2011, reflecting the more favorable mix of products sold.
Distribution Costs. Distribution costs were $6.9 million in 2012, a decrease of $0.4 million, or 5.5%, from $7.3 million in 2011. There was a translation gain on costs for non-U.S. operations of $0.2 million, and the underlying movement in costs at constant translation exchange rates was a decrease of $0.2 million, or 2.7%, reflecting the improved mix of higher value sales and some reduction in freight costs.
Administrative Expenses. Our administrative expenses were $50.4 million in 2012, a decrease of $0.8 million, or 1.6%, from $51.2 million in 2011. The translation to U.S. dollars from our non-U.S. operations decreased costs by $0.4 million. There were increases in costs of $1.6 million due to the incorporation of Dynetek costs following the acquisition of the business, an increase in the net cost of spending on research and development (net of grants), marketing and advertising and general inflationary increases. This was offset by a reduction in the amount charged to administrative expenses relating to retirement benefits schemes of $2.0 million following the restatement of 2011 and 2012 under IAS 19R.
Share of start-up costs of joint venture. In late 2009, we entered into a joint venture agreement to establish a manufacturing facility to produce gas cylinders in India. The joint venture has been accounted for using the equity method, as the partners have a contractual agreement that establishes joint control over the economic activities of the entity. The loss attributable to the start-up costs of the joint venture in 2012 was $0.1 million compared to $0.2 million in 2011.
Operating and Trading Profit. Our operating profit was $66.4 million in 2012, an increase of $2.5 million, or 3.9%, from $63.9 million in 2011. Our trading profit was $68.5 million in 2012, an increase of $4.8 million, or 7.5%, from $63.7 million in 2011.
59
Analysis of trading profit and operating profit variances from 2011 to 2012 for continuing operations
| | Elektron Trading Profit | Gas Cylinders Trading Profit | Group Trading Profit | Restructuring and other expense | Group Operating Profit | |||||||||||
|---|---|---|---|---|---|---|---|---|---|---|---|---|---|---|---|---|
| | (in $ millions) | |||||||||||||||
2011—as reported under IFRS (restated under IAS 19R) | $ | 52.5 | $ | 11.2 | $ | 63.7 | $ | 0.2 | $ | 63.9 | ||||||
FX Translation impact—on non-U.S. operating results | (0.4 | ) | — | (0.4 | ) | — | (0.4 | ) | ||||||||
| | | | | | | | | | | | | | | | | |
2011—adjusted for FX translation | $ | 52.1 | $ | 11.2 | $ | 63.3 | $ | 0.2 | $ | 63.5 | ||||||
Trading variances for ongoing operations—2011 v 2012 | 0.7 | 4.5 | 5.2 | (2.3 | ) | 2.9 | ||||||||||
| | | | | | | | | | | | | | | | | |
2012—as reported under IFRS (restated under IAS 19R) | $ | 52.8 | $ | 15.7 | $ | 68.5 | $ | (2.1 | ) | $ | 66.4 | |||||
| | | | | | | | | | | | | | | | | |
| | | | | | | | | | | | | | | | | |
The above table shows the change in each division's trading profit, group trading profit and operating profit between 2011 and 2012. The table also provides a reconciliation of group trading profit to group operating profit. The table separates the impact of changes in average exchange rates on non-U.S. operations when translated into U.S. dollar consolidated results.
Translating our non-U.S. operations into U.S. dollars has resulted in a decrease in our trading profit and operating profit of $0.4 million and $0.4 million, respectively, in 2012. This decrease represented 0.6% of the change in both trading profit and operating profit from 2012. At constant translation exchange rates, our trading profit increased by $5.2 million or 8.2% and our operating profit increased by $2.9 million or 4.6% in 2012.
Excluding the rare earth surcharge, revenue growth through both favorable pricing and volume changes had a significant benefit in 2012 when compared to 2011. As the cost of rare earths decreased in the year we had to carefully manage the level of surcharge charged to ensure that we were able to maintain profit margins. We also were able to achieve better underlying pricing across a wide range of products through a focus on both price increases and mix of products sold, including through the introduction of new products at price points that helped us to enhance our profitability. These volume and mix changes are further discussed by division below and in the revenue discussion. Together, these factors had a positive impact of $10.0 million on our trading profit and operating profit in 2012.
We had a number of cost changes that together resulted in reducing the increase in trading profit and operating profit by a net $4.8 million in 2012. The main reasons for these changes were as follows:
- •
- Our accounting charges for our defined benefit plans increased in 2012. The total impact on trading profit and operating profit was a $0.8 million additional charge when compared to 2011.The increase in retirement benefit costs reflects the increased actuarial costs of the U.K. and U.S. plans under IAS 19 accounting and is shown after restating 2012 and 2011 for IAS 19R.
- •
- We had a decrease in central costs of $0.2 million, which related to the levy charged on the U.K. Luxfer Group Pension Plan by the Pension Protection Fund ("PPF"). The PPF applies a levy on all U.K. defined benefit pension plans to pay for the cost of U.K. plans that it takes over after a sponsor has gone into insolvency with an under-funded plan. The cost of the PPF levy for us was $1.5 million in 2012, compared to $1.3 million in 2011.
- •
- The overall impact of foreign exchange transaction rates on sales and purchases was a charge of $0.7 million, net of the benefit of utilizing foreign currency exchange derivative contracts.
60
- •
- Employment and other costs have increased by a net $3.5 million in 2012, reflecting additional costs in marketing, product development and maintenance of our operations.
The segment trading profit results by division are further explained in more detail below:
Elektron
The Elektron division's trading profit of $52.8 million in 2012 was an increase of $ 0.3 million from $52.5 million in 2011. Changes in exchange rates used to translate segment trading profit into U.S. dollars led to a $0.4 million decrease in 2012, and therefore profits at constant translation exchange rates increased by $0.7 million, or 1.3%.
There was a positive benefit of $1.5 million in 2012 when compared with 2011 as a result of obtaining better underlying selling prices, as well as achieving a more favorable mix of sales. The cost of rare earths reduced in 2012 from the peak in the third quarter of 2011 of $270 per kilogram to approximately $28 per kilogram by December 2012. Managing this price reduction was as challenging as managing the price increases in the previous year. We believe we negotiated this volatile period in our cost base successfully, as, through the levying of the surcharge and careful control of our cost base and working capital, we were able to maintain our profit margins. We also benefited from a slight reduction in the cost of magnesium in 2012 through careful sourcing of material while the cost of other zirconium raw materials, including zircon sand, increased in cost during the year.
For 2011, the foreign exchange transaction rates on sales and purchases had a negative impact of $0.2 million, net of the benefit of utilizing foreign currency exchange derivative contracts, compared to 2011.
Accounting charges for the Elektron element of the defined benefit plans increased in 2012. The total impact on trading profit was a $0.3 million additional charge when compared to 2011 and after restating 2012 and 2011 for IAS 19R.
The decrease in retirement benefit charges and PPF levy cost allocated to the Elektron division was $0.2 million in 2011. The allocation for the Elektron division was more than the allocation for the Gas Cylinders division because the former had more members in the relevant plans.
Other costs increased by a net $0.5 million in 2012 compared to 2011 and these include increased expenditures on research and development, maintenance and marketing costs.
Gas Cylinders
The Gas Cylinders division's trading profit of $15.7 million in 2012 was an increase of $4.5 million from $11.2 million in 2011, an increase of 40.2%. The exchange rates used to translate segment profit into U.S. dollars in 2012 were broadly similar to those in the previous year without any impact on profit.
The input costs of raw materials were similar in 2012 compared to 2011. Despite the reduction in overall cylinders sold, there was a favorable mix of products sold as well as an increase in the level of sales prices achieved in 2012 compared to 2011. The net impact of these factors was to increase trading profit by $8.5 million.
In 2012, the foreign exchange transaction rates on sales and purchases had a negative impact of $0.5 million, net of the benefit of utilizing foreign currency exchange derivative contracts, compared to 2011.
Accounting charges for the Gas Cylinders element of the defined benefit plans increased in 2012. The total impact on trading profit was a $0.5 million additional charge when compared to 2011 and after restating 2012 and 2011 for IAS 19R.
61
Other costs increased by a net $3.0 million, which include increased expenditures on research and development, maintenance, sales and marketing costs and general inflation increases.
Luxfer Group
Restructuring and other income (expense). In 2012, there was $2.1 million charge to restructuring and other income (expense) compared to a credit of $0.2 million in 2011. There were $1.1 million of costs incurred in relation to rationalization costs in the Gas Cylinders division and $0.2 million of costs have been incurred in relation to minor rationalization costs in the Elektron division. There was also a charge of $0.8 million to the income statement under IFRS 2 in relation to share options granted as part of our IPO.
In 2011, there was a credit of $0.2 million to restructuring and other income (expense). A past service credit of $1.6 million was recognized in 2011 in relation to pension plan changes undertaken by the Luxfer Group Pension Plan. In 2011, the Group incurred legal, audit and professional costs of $2.8 million in relation to our IPO. Of this, $1.4 million was expensed in the year mainly in relation to historical audit work and $1.4 million in relation to regulatory and legal documentation to support the transaction was deferred to 2012.
Net acquisition and disposal costs. In 2012, we incurred a non-operating charge of $0.8 million compared to $0.2 million in 2011. In 2012, there was also a net acquisition cost of $0.6 million recognized by the Gas Cylinders division in relation to the acquisition of Dynetek Industries Limited. The cost was comprised of acquisition costs of $0.8 million less a negative goodwill credit of $0.2 million. We also incurred $0.2 million in 2012 and in 2011 relating to a voluntary agreement with the FTC to sell and license a subset of our U.S. photo-engraving business to a third party after the acquisition of Revere in 2007. The sale was achieved in late 2012.
Finance income—interest received. Interest received was $0.2 million in 2012 and 2011. Interest received is generated by placing surplus cash on short-term deposit. In 2011, the interest received included $0.1 million of interest received from the loan note due to us from the buyers of our Speciality Aluminium division.
Finance costs—interest costs. The finance costs of $6.7 million that we incurred in 2012 decreased from $9.2 million in 2011. The costs were lower as a result of the reduced level of indebtedness.
The finance costs we incurred in 2012 included $5.7 million of interest payable on our current financing facilities and $1.0 million of amortization relating to finance costs.
The finance costs we incurred in 2011 included $3.3 million of interest payable on our Senior Notes due 2012, $0.5 million of interest payable on our banking facility, $3.8 million of interest payable on our current financing facilities and $1.6 million of amortization relating to finance costs.
Taxation. In 2012, our tax expense was $16.0 million on profit before tax of $55.5 million. The effective tax rate was 28.8% on the profit before tax. Of the charge of $16.0 million, $11.1 million (20% effective rate) related to current tax payable and $4.9 million (8.8% effective rate) was a deferred taxation charge. In 2011, our tax expense was $12.5 million on profit before tax of $52.8 million. The effective tax rate was 23.7% on the profit before tax. Of the charge of $12.5 million, $11.8 million (effective rate of 22.3%) related to current tax payable and $0.7 million (1.3% effective rate) was a deferred taxation charge.
The effective rate of the current tax, which is the taxes that are payable on current year profits, fell, with more profits being generated in lower tax jurisdictions, such as the U.K, and continued use of tax credits for R&D expenditure. The deferred tax rate is higher, with the utilization of capital allowances and pension deficit payments, which are recognized as a deferred tax asset on the balance sheet and then charged to the income statement when utilized to reduce current tax payable.
62
Net income for the Financial Year. Net income for the year was $39.5 million compared to $40.3 million in 2011, with the fall due to several one-off costs relating to the acquisition of Dynetek Industries and some IPO related costs, rather than due to lower trading profit. Adjusted net income, which excludes the after tax impact of these exceptional items, was $44.7 million up on the adjusted income for 2011 of $41.1 million.
B. Liquidity & Capital Resources
Liquidity
Our liquidity requirements arise primarily from obligations under our indebtedness, capital expenditures, the funding of working capital and the funding of hedging facilities to manage foreign exchange and commodity purchase price risks. We meet these requirements primarily through cash flow from operating activities, cash deposits and borrowings under our Revolving Credit Facility (as defined below) and accompanying ancillary hedging facilities. As of December 31, 2013, we had available £70 million ($116.0 million at the December 31, 2013 exchange rate of $1.00:£0.6037) under our Revolving Credit Facility. However from March 25, 2014, this was extended to $150.0 million. See "—Financing—Senior Facilities Agreement." Our principal liquidity needs are:
- •
- payment of shareholder dividends;
- •
- servicing interest on our Loan Notes due 2018, which is payable at each quarter end, in addition to interest and/or commitment fees on our Senior Facility Agreement;
- •
- capital expenditure requirements;
- •
- working capital requirements, particularly in the short-term as we aim to achieve organic sales growth;
- •
- hedging facilities used to manage our foreign exchange and aluminum purchase price risks.
- •
- funding acquisitions
From time to time, we consider acquisitions or investments in other businesses that we believe would be appropriate additions to our business. For example, we purchased Revere for $14.7 million in 2007, and in 2012 we acquired Dynetek for a consideration of $11.8 million. In March 2014 we acquired a small composite cylinder manufacturer and associated production facilities for an initial cost of $3.0 million and a deferred consideration element estimated at $6.0 million. The Senior Facilities Agreement (as defined below) agreed in June 2011 and then amended several times, with the most recent being March 25, 2014 contains certain restrictions on its use for acquisitions, unless an acquisition is a Permitted Acquisition (as defined in the Senior Facilities Agreement) or is agreed by the lenders thereunder. As part of the renegotiated facility agreement, agreed in March 2014, these restrictions were amended to relax the terms of use of the facilities for acquisitions, including increasing the size of an acquisition before consent is required to 25% of the consolidated net assets of Luxfer Holdings PLC.
We believe that in the long term, cash generated from our operations will be adequate to meet our anticipated requirements for working capital, capital expenditures and interest payments on our indebtedness. In the short term, we believe we have sufficient credit facilities to cover any variation in our cash flow generation. However, any major repayments of indebtedness will be dependent on our ability to raise alternative financing or to realize substantial returns from the sale of operations. Also, our ability to expand operations through sales development and capital expenditures could be constrained by the availability of liquidity, which, in turn, could impact the profitability of our operations.
The history of the current facilities is on May 13, 2011, we entered into a senior facilities agreement (the "Senior Facilities Agreement"), initially providing £70 million of funding through a combination of a term loan of £30 million ($49 million) and a revolving credit facility of £40 million ($64 million) (the "Revolving Credit Facility"). It is this facility which has then been subject to a series of amendments and extentions to form the current $150 million banking facility in the form of a multi-currency revolving credit facility.
63
On May 13, 2011, we also issued $65 million principal amount of Loan Notes due 2018 in a private placement to an insurance company. In connection with this new financing, we issued a redemption notice for the Senior Notes due 2012, and they were repaid on June 15, 2011. We also fully repaid and cancelled our Previous Credit Facility on June 15, 2011.
Following the listing of the Company's shares on the New York Stock Exchange we utilized some of the proceeds of our IPO to repay the senior term loan, under the pre-amended Senior Facilities Agreement. We subsequently undertook a renegotiation of the terms and conditions of the Senior Facilities Agreement in November 2012 and then again in March 2014. Under the modified agreement, as at March 25, 2014, the value of debt repaid can now be re-drawn against the Revolving Credit Facility available in pounds sterling, U.S. dollars or euros up to a maximum aggregate principal amount of $150 million. There were no drawing at December 31, 2013, nor at the point of amendment in March 2014. We also have negotiated in March 2014, under the Senior Facilities Agreement an uncommitted Accordion Facility of $50 million which provides for a mechanism for the agreement to be expanded further by the $50 million to up to $200 million. The Lenders of the Senior Facilities Agreement have first call on funding this extra element, but are not committed to fund the Accordion and so the Company has the right to seek funding outside the current banking syndicate if this is insufficient take up of a request to fund the Accordion and make it part of the committed facilities.
We have been in compliance with the covenants under the Senior Notes due 2018 and the Senior Facilities agreement throughout all of the quarterly measurement dates from and including September 30, 2011 to December 31, 2013.
Our total interest expense was $6.2 million in 2013, compared to $6.7 million in 2012. We expect to invest approximately $28 million in capital expenditures in 2014. We have also been managing the rising costs of retirement benefits, including higher government insurance levies and some historical environmental remediation requirements.
Luxfer Holdings PLC conducts all of its operations through its subsidiaries. Accordingly, Luxfer Holdings PLC's main cash source is dividends from its subsidiaries. The ability of each subsidiary to make distributions depends on the funds that a subsidiary receives from its operations in excess of the funds necessary for its operations, obligations or other business plans. We have not historically experienced any material impediment to these distributions, and we do not expect any local legal or regulatory regimes to have any impact on our ability to meet our liquidity requirements in the future. In addition, since our subsidiaries are wholly-owned, our claims will generally rank junior to all other obligations of the subsidiaries. If our operating subsidiaries are unable to make distributions, our growth may slow, unless we are able to obtain additional debt or equity financing. In the event of a subsidiary's liquidation, there may not be assets sufficient for us to recoup our investment in the subsidiary.
Our ability to maintain or increase the generation of cash from our operations in the future will depend significantly on the competitiveness of and demand for our products, including our success in launching new products that we have been developing over many years. Achieving such success is a key objective of our business strategy. Due to commercial, competitive and external economic factors, however, we cannot guarantee that we will generate sufficient cash flow from operations or that future working capital will be available in an amount sufficient to enable us to service our indebtedness or make necessary capital expenditures.
We are still vulnerable to external shocks relating to our fixed and variable cost of goods sold. In recent years, external economic shocks to oil prices, commodity prices and a weakening U.S. dollar have impacted our results. In 2013, our continuing operations incurred over $15 million of energy costs, purchased over $43 million of primary aluminum and over $34 million of primary magnesium. In 2013, $37.6 million, or 67%, of our operating profit was derived from North American businesses. A significant economic shock that has a major impact on one or several of these risks simultaneously could have a severe impact on our financial position.
64
We operate robust cash and trading forecasting systems that impose tight controls on our operating businesses with regard to cash management. We use regularly updated forecasts to plan liquidity requirements, including the payment of interest on our indebtedness, capital expenditures and payments to our suppliers. Although we have generated cash sufficient to cover most of our liability payments, we also rely on the Revolving Credit Facility to provide sufficient liquidity. Our banking facilities are further explained below under "—Financing—Senior Facilities Agreement."
Cash Flow
The following table presents information regarding our cash flows, cash and cash equivalents for the years ended December 31, 2013, 2012 and 2011:
| | Year Ended December 31, | |||||||||
|---|---|---|---|---|---|---|---|---|---|---|
| | 2013 | 2012 | 2011 | |||||||
| | (in $ millions) | |||||||||
Net cash flows from operating activities | $ | 37.1 | $ | 69.0 | $ | 29.1 | ||||
Net cash used in investing activities | (33.4 | ) | (29.4 | ) | (21.2 | ) | ||||
| | | | | | | | | | | |
Net cash flow before financing activities | 3.7 | 39.6 | 7.9 | |||||||
Net cash flows from financing activities | (15.7 | ) | (23.0 | ) | 5.4 | |||||
| | | | | | | | | | | |
Net (decrease) / increase in cash and cash equivalents | $ | (12.0 | ) | $ | 16.6 | $ | 13.3 | |||
| | | | | | | | | | | |
| | | | | | | | | | | |
Cash flows from operating activities
| | Year Ended December 31, | |||||||||
|---|---|---|---|---|---|---|---|---|---|---|
| | 2013 | 2012 | 2011 | |||||||
| | (in $ millions) | |||||||||
| | | Restated under IAS 19R | ||||||||
CASH FLOWS FROM OPERATING ACTIVITIES | ||||||||||
Profit for the year | $ | 34.1 | $ | 39.5 | $ | 40.3 | ||||
Adjustments for: | ||||||||||
Income taxes | 9.6 | 11.1 | 11.8 | |||||||
Deferred income taxes | 3.0 | 4.9 | 0.7 | |||||||
Depreciation and amortization | 15.8 | 14.7 | 14.5 | |||||||
Charges/(credits) on retirement benefit obligations | 1.7 | — | (1.6 | ) | ||||||
IPO related share based compensation charges | 1.8 | 0.8 | — | |||||||
Loss on disposal of property, plant and equipment | 0.3 | — | — | |||||||
Net interest costs | 5.9 | 6.5 | 9.0 | |||||||
IAS 19 finance charge | 3.8 | 3.6 | 1.9 | |||||||
Acquisition and disposal costs. | 0.1 | — | 0.2 | |||||||
Share of start-up costs of joint venture | (0.1 | ) | 0.1 | 0.2 | ||||||
Decrease/(increase) in receivables | 5.7 | (1.3 | ) | (13.1 | ) | |||||
Decrease/(increase) in inventories | (9.1 | ) | 24.1 | (24.8 | ) | |||||
(Decrease)/increase in payables | (11.2 | ) | (15.3 | ) | 13.1 | |||||
Movement in retirement benefit obligations | (11.4 | ) | (9.8 | ) | (2.0 | ) | ||||
Accelerated deficit contributions into retirement benefit obligations | — | — | (7.2 | ) | ||||||
Decrease in provisions | (0.7 | ) | (0.6 | ) | (0.2 | ) | ||||
Income tax paid | (12.2 | ) | (9.3 | ) | (13.7 | ) | ||||
| | | | | | | | | | | |
NET CASH FLOWS FROM OPERATING ACTIVITIES | $ | 37.1 | $ | 69.0 | $ | 29.1 | ||||
| | | | | | | | | | | |
| | | | | | | | | | | |
65
In 2013, net cash flows from operating activities decreased by $31.9 million to $37.1 million from $69.0 million in 2012. Profit in 2013 of $34.1 million decreased by $5.4 million from $39.5 million in 2012. There was a net working capital outflow of $14.6 million in 2013 as compared to an inflow of $7.5 million in 2012, an adverse variance of $22.1 million. The increase in inventories resulted in a cash outflow of $9.1 million in 2013, a $33.2 million swing from a cash inflow of $24.1 million in 2012. In 2012 the improved availability of rare earths had reduced the need for strategic holding of inventory, and the corresponding fall in prices had benefited the cash flow. There was an inflow in receivables of $5.7 million in 2013 compared to an outflow of $1.3 million in 2012, an improvement of $7.0 million. There was also an outflow in payables of $11.2 million in 2013, a decrease of $4.1 million from the $15.3 million outflow in 2012. Lower indebtedness resulted in the net finance costs outflow of $5.9 million in 2013 being $0.6 million less than the outflow of $6.5 million in 2012. The income tax outflow in 2013 of $12.2 million was $2.9 million higher than the outflow of $9.3 million due to additional pension payments in the U.S and the effect of temporary timing differences in 2012.
In 2012, net cash flows from operating activities increased by $39.9 million to $69.0 million from $29.1 million in 2011. In 2011, there was an outflow relating to working capital of $24.8 million. The equivalent figure for 2012 was an inflow of $7.5 million, an improvement in working capital expenditure of $32.3 million. One of the main reasons for the improvement in the cash flows was the improved availability of rare earths which reduced the need for strategic holding of inventory, and the corresponding fall in prices benefited the cash flow. The inventory reduction resulted in a $24.1 million cash inflow in 2012, a $48.9 million improvement from the outflow of $24.8 million in 2011.There was an outflow in receivables of $1.3 million in 2012 compared to an outflow of $13.1 million in 2011, an improvement of $11.8 million. There was also an outflow in payables of $15.3 million in 2012, an increase of $28.4 million from the $13.1 million inflow in 2011.Lower interest rates following the refinancing undertaken in June 2011, the reduction in the need to draw down the Revolving Credit Facility and the repayment of the senior term loan in October 2012 resulted in the net finance costs outflow of $6.5 million in 2012 being $2.5 million less than the outflow of $9.0 million in 2011. In 2012, there were some additional payments made in respect of pension plan deficit remediation funding in the United States, while in 2011, as part of the June 2011 refinancing, we agreed to make advanced payments of $7.2 million into our retirement benefit pension plans covering the period to March 2012. Due to additional pension payments in the U.S. and the effect of temporary timing differences, the income tax outflow in 2012 of $9.3 million was $4.4 million less than the outflow of $13.7 million in 2011.
Cash used in investing activities
| | Year Ended December 31, | |||||||||
|---|---|---|---|---|---|---|---|---|---|---|
| | 2013 | 2012 | 2011 | |||||||
| | (in $ millions) | |||||||||
CASH FLOWS FROM INVESTING ACTIVITIES | ||||||||||
Purchases of property, plant and equipment | $ | (24.2 | ) | $ | (19.3 | ) | $ | (21.2 | ) | |
Purchases of intangible fixed assets | (2.3 | ) | — | (0.3 | ) | |||||
Receipts from sales of property, plant and equipment | 0.1 | — | — | |||||||
Investment in joint venture—equity funding | (2.5 | ) | (0.4 | ) | (0.3 | ) | ||||
Investment in joint venture—debt funding | (4.5 | ) | — | — | ||||||
Proceeds from sale of business (net of costs) | — | 1.5 | 0.8 | |||||||
Net cash flow on purchase of business | — | (11.0 | ) | — | ||||||
Disposal costs of intellectual property | — | (0.2 | ) | (0.2 | ) | |||||
| | | | | | | | | | | |
NET CASH USED IN INVESTING ACTIVITIES | $ | (33.4 | ) | $ | (29.4 | ) | $ | (21.2 | ) | |
| | | | | | | | | | | |
| | | | | | | | | | | |
Net cash used in investing activities increased by $4.0 million, or 13.6%, to $33.4 million in 2013 from $29.4 million in 2012. We invested $7.0 million through equity and debt funding into our Gas Cylinders
66
North American joint venture in 2013. We also incurred capital expenditures of $24.2 million in 2013, an increase of $4.9 million from the $19.3 million expenditure in 2012. See "—Capital Expenditures." In addition, we incurred $2.3 million of intangible capital expenditure in 2013. The net cash used in investing activities in 2013 were partially offset by $0.1 million in receipts from sales of property, plant and equipment.
Net cash used in investing activities increased by $8.2 million, or 38.7%, to $29.4 million in 2012 from $21.2 million in 2011. We incurred capital expenditures of $19.3 million in 2012 compared to $21.2 million in 2011. See "—Capital Expenditures." In addition, in 2012, we incurred costs of $0.2 million related to the disposal of certain intellectual property and invested a further $0.4 million into our Gas Cylinders Indian joint venture. The net cash used in investing activities in 2012 were partially offset by $1.5 million in deferred consideration we received from the sale of our Speciality Aluminium division in 2008.
Cash flows from financing activities
| | Year Ended December 31, | |||||||||
|---|---|---|---|---|---|---|---|---|---|---|
| | 2013 | 2012 | 2011 | |||||||
| | (in $ millions) | |||||||||
CASH FLOWS FROM FINANCING ACTIVITIES | ||||||||||
Interest paid on banking facilities | $ | (0.9 | ) | $ | (1.8 | ) | $ | (1.9 | ) | |
Interest paid on Loan Notes due 2018 | (4.0 | ) | (3.9 | ) | (2.1 | ) | ||||
Interest paid on Senior Notes due 2012 | — | — | (4.5 | ) | ||||||
Interest received on Loan Note | — | — | 0.1 | |||||||
Interest received from joint ventures | 0.1 | — | — | |||||||
Other interest received | 0.2 | 0.2 | 0.1 | |||||||
Dividends paid | (10.8 | ) | (5.8 | ) | — | |||||
Draw down on previous banking facilities | — | — | 27.7 | |||||||
Repayments of previous banking facilities | — | — | (38.5 | ) | ||||||
Draw down on new banking facilities and other loans | — | — | 139.5 | |||||||
Repayments of banking facilities and other loans | — | (72.8 | ) | — | ||||||
Repayment of Senior Notes due 2012 | — | — | (109.8 | ) | ||||||
Redemption of preference shares | — | — | (0.1 | ) | ||||||
Payment of banking facilities and other loans—financing costs | — | — | (5.1 | ) | ||||||
Modification to banking facilities and other loans—financing costs | — | (0.6 | ) | — | ||||||
Proceeds from issue of shares | — | 65.1 | — | |||||||
Share issue costs | (0.3 | ) | (3.5 | ) | — | |||||
Purchase of shares from ESOP | — | 0.1 | — | |||||||
| | | | | | | | | | | |
NET CASH FLOWS (USED IN) / FROM FINANCING ACTIVITIES | $ | (15.7 | ) | $ | (23.0 | ) | $ | 5.4 | ||
| | | | | | | | | | | |
| | | | | | | | | | | |
Net cash flows used in financing activities decreased by $7.3 million to $15.7 million in 2013 from $23.0 million in 2012. Net cash flows used in financing activities in 2013 were primarily attributable to dividend payments to holders of our ordinary shares resulting in a cash outflow of $10.8 million. Lower indebtedness resulted in $0.9 interest expenditure on banking facilities, a decrease of 50% from $1.8 million in 2012. The company provided debt financing for the Gas Cylinder North American joint venture in 2013 and as a result has received $0.1 million in interest.
Net cash flows used in financing activities decreased by $28.4 million to $23.0 million in 2012 from $5.4 million in 2011. Net cash flows used in financing activities in 2012 were primarily attributable to the proceeds of $65.1 million from our IPO in October 2012 following the successful listing of the Luxfer Holdings PLC ADSs on the New York Stock Exchange. We paid share issuance costs in respect of the IPO
67
process of $3.5 million. A part of the proceeds was used to repay the senior term loan and in addition we also repaid the amount outstanding on the Revolving Credit Facility in the year, for a combined cash outflow of $72.8 million. In 2012 we also made two dividend payments to holders of our ordinary shares, resulting in a cash outflow of $5.8 million.
Increase/(decrease) in cash and cash equivalents
Our cash and cash equivalents decreased by $11.8 million to $28.4 million for the year ended December 31, 2013 from December 31, 2012. We had cash and cash equivalents of $40.2 million as of December 31, 2012. As of December 31, 2013, we held $6.3 million of cash and cash equivalents denominated in GBP sterling, $13.3 million of denominated in U.S. dollars and $8.8 million of foreign cash and cash equivalents denominated in Australian dollars, Canadian dollars, euro, Chinese renminbi, Japanese yen and Czech koruna.
Our cash and cash equivalents increased by $18.0 million to $40.2 million for the year ended December 31, 2012 from December 31, 2011. We had cash and cash equivalents of $22.2 million as of December 31, 2011. As of December 31, 2012, we held $16.9 million of cash and cash equivalents denominated in GBP sterling, $14.5 million of denominated in U.S. dollars and $8.8 million of foreign cash and cash equivalents denominated in Australian dollars, Canadian dollars, euro, Chinese renminbi and Czech koruna.
Financing
Indebtedness
Our indebtedness under our Revolving Credit Facility and Loan Notes due 2018 was $63.8 million (net of issue costs) as of December 31, 2013, while our cash and short term deposits were $28.4 million as of December 31, 2013. Our indebtedness under our Revolving Credit Facility and Loan Notes due 2018 was $63.5 million as of December 31, 2012, while our cash and short term deposits were $40.2 million as of December 31, 2012.
As of December 31, 2013, we also had utilized $2.0 million of the ancillary facilities available under the Senior Facilities Agreement in connection with certain derivative financial instruments, letters of credit and bank guarantees.
Loan Notes due 2018
On May 13, 2011, our subsidiary, BA Holdings, Inc., entered into a note purchase agreement (the "Note Purchase Agreement"), among us, our subsidiaries and the note purchasers, to issue $65 million aggregate principal amount of Loan Notes due 2018 in a U.S. private placement to an insurance company and related parties. We used the net proceeds from the private placement of the notes, together with borrowings under the Revolving Credit Facility and Term Loan, to redeem the Senior Notes due 2012, repay borrowings under our Previous Credit Facility and for general corporate purposes. The Loan Notes due 2018 bear interest at a rate of 6.19% per annum, payable quarterly on the 15th day of September, December, March and June, commencing on September 15, 2011 and continuing until the principal amount of the notes has become due and payable. The Loan Notes due 2018 mature on June 15, 2018.
Following the listing of the Company's shares on the New York Stock Exchange, we successfully renegotiated and agreed amendments to the original Note Purchase Agreement which removed all U.K. and U.S. security debentures together with the cancellation of all share pledges. These amendments were achieved without any changes to the interest rate of 6.19% per annum.
The Note Purchase Agreement contains customary covenants and events of default, in each case with customary and appropriate grace periods and thresholds. In addition, the Note Purchase Agreement requires
68
us to maintain compliance with a debt service coverage ratio, an interest coverage ratio and a leverage ratio. The debt service coverage ratio measures our Adjusted EBITDA (as defined in the Note Purchase Agreement) to Debt Service (as defined in the Note Purchase Agreement). We are required to maintain a debt service coverage ratio of 1.25:1 for Relevant Periods (as defined in the Note Purchase Agreement). The interest coverage ratio measures our EBITDA (as defined in the Note Purchase Agreement) to Net Finance Charges (as defined in the Note Purchase Agreement). We are required to maintain an interest coverage ratio of 4.0:1. The leverage ratio measures our Total Net Debt (as defined in the Note Purchase Agreement) to Adjusted Acquisition EBITDA (as defined in the Note Purchase Agreement). We are required to maintain a leverage ratio of no more than 3.0:1.
We have been in compliance with the covenants under the Note Purchase Agreement throughout all of the quarterly measurement dates from and including September 30, 2011 to December 31, 2013.
The Loan Notes due 2018 and the Note Purchase Agreement are governed by the law of the State of New York.
The Loan Notes due 2018 are denominated in U.S. dollars, which creates a natural partial offset between the dollar-denominated net assets and earnings of our U.S. operations and the dollar-denominated debt and related interest expense of the notes. We have included the Note Purchase Agreement and a form of the Loan Notes due 2018 as exhibits to this Annual Report and refer you to the exhibits for more information on the Note Purchase Agreement and the Loan Notes due 2018.
Senior Facilities Agreement
Overview. On May 13, 2011, we entered into the Senior Facilities Agreement with Lloyds TSB Bank plc, Clydesdale Bank PLC and Bank of America, N.A. Lloyds TSB Bank plc and Clydesdale Bank PLC were Mandated Lead Arrangers under the Senior Facilities Agreement. The main purpose of the Senior Facilities Agreement was to enable us to redeem the Senior Notes due 2012 and repay borrowings and accrued interest under the Previous Credit Facility. We issued a redemption notice for the Senior Notes due 2012, and they were repaid on June 15, 2011. We cancelled our Previous Credit Facility on June 15, 2011. This agreement has been subject to a series of amendments, the most significant of which is dated March 25, 2014, where two new banks, Santander U.K. plc and National Westminster Bank plc, joined the banking syndicate. The following is a summary of the terms of the Senior Facilities Agreement, as amended, that we believe are the most important. We have included the Senior Facilities Agreement as an exhibit to this Annual Report and refer you to the exhibit for more information on the Senior Facilities Agreement.
Structure. The current Senior Facilities Agreement provides $150 million of committed debt facilities, in the form of a multi-currency (pound sterling, euro or U.S. dollars) Revolving Credit Facility and an additional $50 million of uncommitted facilities through an accordion clause. The amended facilities mature April 30, 2019. The original May 13, 2011 Senior Facilities Agreement provided £70 million of debt facilities in the form of a senior term loan facility available in pound sterling, U.S. dollars or euros, in an aggregate amount of £30 million and a revolving facility available in pound sterling, U.S. dollars or euros up to a maximum aggregate principal amount of £40 million. Using part of the funds generated by IPO in October 2012, we repaid fully the amounts outstanding on the senior term loan. Following the listing of the Company's shares on the New York Stock Exchange and the repayment of the senior term loan we undertook a renegotiation of the terms and conditions of the Senior Facilities Agreement, including the removal of all U.K. and U.S. security debentures together with the cancellation of all share pledges and conversion of the facilities into a single Revolving Credit Facility. The facilities were undrawn as at 31 December 2013 and 31 December 2012.
Availability. The facility is used for loans and overdrafts. Amounts unutilized under the Revolving Credit Facility (or, if the case, under the revolving portion of the Accordion) are allocated to ancillary facilities available under the Senior Facilities Agreement in connection with overdraft facilities, bilateral loan
69
facilities and letter of credit facilities. None of these facilities were drawn at the end of 2012 or 2013. We may use amounts drawn under the Revolving Credit Facility for our general corporate purposes and certain capital expenditures, as well as for the financing of permitted acquisitions and reorganizations. As of December 31, 2013, $116 million was available under the Revolving Credit Facility and following the March amendment, $150 million was available. The last day we may draw funds from the Revolving Credit Facility is March 30, 2019.
The Company has a separate bonding facility for bank guarantees denominated in GBP sterling of £3.0 million ($5.0 million), of which £1.2 million ($2.0 million) was drawn at December 31, 2013. The amount drawn on the bonding facility as at December 31, 2012 was £1.2 million ($2.0 million).
Interest Rates and Fees. Borrowings under the facility bears an interest rate equal to an applicable margin plus either EURIBOR, in the case of amounts drawn in euros, or LIBOR, in the case of amounts drawn in pound sterling or U.S. dollars.
The applicable base margin for the Revolving Credit Facility is subject to adjustment each quarter end based on our leverage ratio, which is defined in the Senior Facilities Agreement as the ratio of the Total Net Debt to Adjusted Acquisition EBITDA (each as defined in the Senior Facilities Agreement) in respect of the rolling 12 month period ending on the last day of the relevant quarter.
The table below sets out the range of ratios and the related margin percentage currently in effect.
Leverage | Margin | |||
|---|---|---|---|---|
| | (% per annum) | |||
Greater than 2.5:1 | 2.75 | |||
Less than or equal to 2.5:1, but greater than 2.0:1 | 2.50 | |||
Less than or equal to 2.0:1, but greater than 1.5:1 | 2.00 | |||
Less than or equal to 1.5:1, but greater than 1.0:1 | 1.75 | |||
Less than or equal to 1.0:1 | 1.50 | |||
During the year the Revolving Credit Facility remained unutilized. A commitment fee is levied each quarter against any unutilized Revolving Credit Facility, excluding overdraft or ancillary facilities and is currently calculated at 40% of the applicable margin in force. This fee percentage and the margins were higher in 2013, before the current amendment: during 2013 this rate was 0.7875%.
Guarantees and security. The renegotiated Senior Facility Agreement, agreed in November 2012, removed all U.K. and U.S. security debentures from the agreement together with the cancellation of all share pledges, with no change to this in the March 2014 amendments.
Repayment of principal. Any amounts borrowed under the Revolving Credit Facility must be paid at the end of an interest period agreed between the borrower (or Luxfer Holdings PLC acting on its behalf) and the agent when the loan is made.
Change of control. In the event of a sale of all or substantially all of our business and/or assets or if any person or group of persons acting in concert gains direct or indirect control (as defined in the Senior Facilities Agreement) of Luxfer Holdings PLC, we will be required to immediately prepay all outstanding amounts under the Revolving Credit Facility (and, if the case, the Accordion) and the ancillary facilities under the Senior Facilities Agreement.
Certain covenants and undertakings. The Senior Facilities Agreement contains a number of additional undertakings and covenants that, among other things, restrict, subject to certain exceptions, us and our subsidiaries' ability to:
- •
- engage in mergers, demergers, consolidations or deconstructions;
- •
- change the nature of our business;
- •
- make certain acquisitions;
70
- •
- participate in certain joint ventures;
- •
- grant liens or other security interests on our assets;
- •
- sell, lease, transfer or otherwise dispose of assets, including receivables;
- •
- enter into certain non-arm's-length transactions;
- •
- grant guarantees;
- •
- pay off certain existing indebtedness;
- •
- make investments, loans or grant credit;
- •
- pay dividends and distributions or repurchase our shares;
- •
- issue shares or other securities; and
- •
- redeem, repurchase, defease, retire or repay any of our share capital.
We are permitted to dispose of assets up to $25 million in aggregate over the next five years to April 2019, without restriction as to the use of the proceeds under the Senior Facilities Agreement. Above this level, we would need to seek agreement from the majority of the Senior Facilities Agreement Lenders. In addition, we may pay dividends, subject to certain limitations.
In addition, the Senior Facilities Agreement requires us to maintain compliance with a debt service coverage ratio, an interest coverage ratio and a leverage ratio. The debt service coverage ratio measures our Adjusted EBITDA (as defined in the Senior Facilities Agreement) to Debt Service (as defined in the Senior Facilities Agreement). We are required to maintain a debt service coverage ratio of 1.25:1 for Relevant Periods. The interest coverage ratio measures our EBITDA (as defined in the Senior Facilities Agreement) to Net Finance Charges (as defined in the Senior Facilities Agreement). We are required to maintain an interest coverage ratio of 4.0:1. The leverage ratio measures our Total Net Debt (as defined in the Senior Facilities Agreement) to the Relevant Period Adjusted Acquisition EBITDA (as defined in the Senior Facilities Agreement). We are required to maintain a leverage ratio of no more than 3.0:1.
Any breach of a covenant in the Senior Facilities Agreement could result in a default under the Senior Facilities Agreement, in which case lenders could elect to declare all borrowed amounts immediately due and payable if the default is not remedied or waived within any applicable grace periods. Additionally, our and our subsidiaries' ability to make investments, incur liens and make certain restricted payments is also tied to ratios based on EBITDA.
We have been in compliance with the covenants under the Senior Facilities Agreement throughout all of the quarterly measurement dates from and including September 30, 2011 to December 31, 2013.
Events of default. The Senior Facilities Agreement contains customary events of default, in each case with customary and appropriate grace periods and thresholds, including, but not limited to:
- •
- non-payment of principal, interest or commitment fee;
- •
- violation of covenants or undertakings;
- •
- representations, warranties or written statements being untrue;
- •
- cross default and cross acceleration;
- •
- certain liquidation, insolvency, winding-up, attachment and bankruptcy events;
- •
- certain litigation, arbitration, administrative or environmental claims having a material adverse effect on us or any of our subsidiaries;
- •
- qualification by the auditors of our consolidated financial statements which is materially adverse to the interests of the lenders;
- •
- certain change of control events;
- •
- cessation of business;
- •
- material adverse change; and
71
- •
- certain ERISA matters.
Upon the occurrence of an event of default under the Senior Facilities Agreement, the lenders will be able to terminate the commitments under the senior secured credit facilities, and declare all amounts, including accrued interest to be due and payable and take certain other actions.
The Senior Facilities Agreement is governed by English law.
Capital Expenditures
Investment in upgrading and expanding our production facilities is a key part of our strategy. In 2011 and 2012, we reaffirmed our commitment to capital expenditures by investing $21.2 million and $19.3 million, respectively. In 2013 we spent a further $24.2 million on the purchase of property, plant and equipment. We also invested $7 million in a new joint venture with GTM Technologies providing equity and debt to fund the expansion of this business. The projects conducted in 2013, 2012 and 2011 included:
- •
- In 2013, we commenced a significant investment to expand the capacity at both our Gerzat, France and Riverside, California facilities. This investment was made to support the growth being seen in demand for our ultra-lightweight composite SCBA cylinders for emergency services. We invested $3.9 million in 2013 for this project.
- •
- In 2013, in a continuation of our strategy to expand in the Alternative Fuel market, we made a further investment of $2.8 million to increase further the capacity at our Riverside, California facility. As part of the same strategy, we made the $7 million investment in GTM Technologies joint venture for gas transportation modules, which use the Alternative Fuel cylinders manufactured at our Riverside facility.
- •
- In 2012, we began investing in production facilities for our Synermag bio-absorbable magnesium alloy. We invested $2.0 million in the first phase of this project.
- •
- In 2012, as part of strategy to develop new growth opportunities in the Alternative Fuel market, we invested $1.8 million at our Riverside, California facility. The purchase of a new 3 spindle winding machine has significantly increased our capacity to manufacture large cylinders used in this application and allows us to further expand our presence in this market.
- •
- In 2011, we invested in a number of projects at our Madison, Illinois magnesium rolling facility. These included new modern ovens for $3.2 million, which is partly funded from an insurance claim related to older furnaces, and a special slab casting unit for $2.4 million, which is being paid for by the U.S. military as part of our development of ultra-lightweight magnesium armor plating.
- •
- In 2011, we started a major investment in upgrading our Elektron R&D facilities, across a number of product ranges, to support our new product development objectives and provide enhanced technical support to our customers. R&D related capital expenditure was $1.8 million and $2.6 million in 2012 and 2011 respectively.
- •
- In 2011, we invested $1.6 million in a new U.S. distribution facility for our gas cylinders business to enable improved service to customers and reduce costs being incurred by exiting older leased facilities.
- •
- In 2011, we also continued to invest in a range of automation projects within our gas cylinder production facilities, including major automation investments in some of the finishing stages of our U.K. aluminum cylinder facilities.
C. Research and development, patents and licenses, etc
Research and Development
Luxfer has always recognized the importance of research in materials science and the need for innovation in the development of new products designed to meet the future needs of customers and continue to provide growth opportunities for the business. As a result, each year we make a major investment in the
72
development of new products and processes across the Group. The Group's research and development is directed towards the Healthcare, Protection and Environmental specialist business segments. Direct expenditure on research and development (including revenue and capital items and before funding grants received) amounted to $9.8 million in 2013 (2012—$8.9 million, 2011—$11.1 million). The wider cost of product development and our financial commitment to its success is much harder for us to measure, because our product development projects include utilizing the skills of our wider commercial technical sales staff and general management, many of whom are highly qualified scientists and engineers. A large proportion of senior sales and management time is spent overseeing the development of products and working with customers on their integration of our technology into their product designs.
To provide customers with constantly improving products and services, we continuously invest in new technology and research and employ some of the world's leading specialists in materials science and metallurgy. Our engineers and metallurgists collaborate closely with our customers to design, develop and manufacture our products. We also co-sponsor ongoing research programs at major universities in the United States, Canada and Europe. Thanks to the ingenuity of our own research and development teams, Luxfer has developed a steady stream of new products, including
- •
- ultra lightweight large composite cylinders for CNG and Hydrogen containment;
- •
- enabling technologies for Alternative Fuel systems, including high pressure valves and pressure release devices (PRDs);
- •
- new magnesium alloy variants such as in Elektron 43, which are designed for use in aircraft seating;
- •
- zirconium catalysts for large scale industrial chemical applications;
- •
- L7X® higher strength aluminum alloy and carbon composite gas cylinders;
- •
- SmartFlow valve-regulator technology;
- •
- bio-absorbable magnesium alloys, branded Synermag; and
- •
- zirconium sorbents, branded MELsorb, used, for example, as an active ingredient in dialysis equipment.
We believe that this commitment to research and new product development, through the dedicated resources and significant use of management's time, is at the core of the growth potential of the Luxfer Group worldwide. Our research and development commitment reflects our strategy of increasing our focus on high-performance value-added product lines and markets and leveraging our collaboration with universities. We seek to invest in the development of products that are designed for end markets that we believe have long-term growth potential and as such many projects take considerable time to commercialize, but if successful, provide a competitive advantage and the opportunity for sustainable profit growth.
Intellectual Property
We currently rely on a combination of patents, trade secrets, copyrights, trademarks and design rights, together with non-disclosure agreements and technical measures, to establish and protect proprietary rights in our products. Key patents held by our Elektron division include aerospace alloys, magnesium gadolinium alloy (protection applications), water treatment and G4 (environmental applications) and key patents held by our Gas Cylinders division relate to SmartFlow technology, aluminum alloy for pressurized hollow bodies and superplastic forming techniques.
In certain areas, we rely more heavily upon trade secrets and un-patented proprietary know-how than patent protection in order to establish and maintain our competitive advantage. We generally enter into non-disclosure and invention assignment agreements with our employees and subcontractors.
73
D. Trend information.
Information required by this item is set forth in Item 5.A of this Annual Report, Risk Factors and below.
The Group has a diversified portfolio of products and end markets and therefore it is not unusual for certain markets to be down or to be showing positive or negative trends. In 2008-09 the automotive sector, other than in certain emerging markets, slumped with the global recession and has still not recovered to pre-2008 levels in various developed economic regions. The North American market appears to be steadily recovering. Europe had recovered somewhat through to 2013, but the economic climate is still fragile in certain regions and this has impacted sales volumes in our Elektron division and had some negative impact on the Elektron division's profit. The weakness in the European automotive industry is expected to continue into 2014 and remains an area of uncertainty. Independent automotive industry forecasts, such as those published by IHS Automotive, project long term growth in all major regions for automotive production, with the recession of 2008-09 and recent economic problems in Europe being projected as shorter-term adjustments to positive long-term growth trends in production and sales. Defense spending in the United States can also have an impact on demand for our Elektron products. Though overall demand for our products into the defense market has continued to be reasonably strong in 2013, we would expect some negative impact from currently-planned U.S. defense spending cuts in the next few years.
Our strategy is focused around introducing new products into markets with expected strong growth trends. For example, we seek to respond to the need for environmentally friendly products required, as a result of stricter government regulations on emissions and the increasing cost of fossil fuels. Currently we are experiencing strong growth for high pressure composite cylinders used to contain CNG. We expect the alternative fuel market to grow further in North America during 2014, which we expect would have a positive influence on our Gas Cylinders Division. This growth is due to the increasing use of CNG to power buses and trucks and the need to transport CNG to fuel stations and areas that do not have gas pipelines. The greater use of CNG is partly due to its lower cost and also because it is a cleaner-burning fuel than either gasoline or diesel.
Our revenue on automotive catalyst products has been distorted in recent years by rare earth surcharges levied on customers to recover the volatile changes to the costs of rare earth chemicals. For example the impact on 2011 was an additional $69.8 million in revenue, in 2012 this was $40.5 million and in 2013 this fell to $8.4 million. The surcharges are expected to be minimal in 2014. If rare earth costs remain relatively low or fall further, it is likely we will stop having a separate surcharge price in 2014 and cover the residual cost as part of a normal pricing structure.
E. Off Balance Sheet Arrangements
In the ordinary course of business we enter into operating lease commitments and capital commitments. These transactions are recognized in the consolidated financial statements in accordance with IFRS as issued by the IASB and are more fully disclosed therein.
As at December 31, 2013, neither Luxfer Holdings PLC nor any of its subsidiaries has any off-balance sheet financing arrangements that currently have or are reasonably likely to have a future effect on the Group's financial condition, changes in financial condition, results of operations, liquidity, capital expenditure or capital resources.
F. Contractual Obligations and Commitments
We have various contractual obligations arising from both our continuing and discontinued operations. The following table lists the aggregate maturities of various classes of obligations and expiration amounts of various classes of commitments related to our continuing operations as of December 31, 2013. See "Note 25—Commitments and contingencies" and "Note 26—Financial risk management objectives and
74
policies" to our audited consolidated financial statements attached to this Annual Report for additional details on these obligations and commitments.
| | Payments Due by Period | |||||||||||||||
|---|---|---|---|---|---|---|---|---|---|---|---|---|---|---|---|---|
| | Total | Less than 1 year | 1 – 3 years | 3 – 5 years | After 5 years | |||||||||||
| | (in $ millions) | |||||||||||||||
Contractual obligations | ||||||||||||||||
Loan Notes due 2018(1) | $ | 65.0 | $ | — | $ | — | $ | 65.0 | $ | — | ||||||
Obligations under operating leases | 34.4 | 4.9 | 6.6 | 6.5 | 16.4 | |||||||||||
Capital commitments | 2.6 | 2.6 | — | — | — | |||||||||||
Interest payments(2) | 17.9 | 4.0 | 6.9 | 7.0 | — | |||||||||||
Total contractual cash obligations | $ | 119.9 | $ | 11.5 | $ | 13.5 | $ | 78.5 | $ | 16.4 | ||||||
| | | | | | | | | | | | | | | | | |
| | | | | | | | | | | | | | | | | |
- (1)
- The Loan Notes due 2018 are gross of unamortized finance costs, which were $1.2 million as of December 31, 2013. As required by IFRS, the Loan Notes due 2018 are disclosed in our balance sheet as $63.8 million, being net of these costs. The amounts to be repaid exclude interest payable on the indebtedness.
- (2)
- Interest payments include estimated interest payable on the Loan Notes due 2018 at the fixed rate of 6.19% under the notes. No interest payments have been included for the Revolving Credit Facility given that the level of debt under this facility is managed on an ongoing basis in conjunction with the level of cash and short term deposits held by us.
Loan notes due 2018. See "—Financing—Loan Notes due 2018" above for a detailed explanation of our Loan Notes due 2018.
Obligations under non-cancellable operating leases. We lease certain land and buildings and a limited amount of plant and equipment pursuant to agreements that we cannot terminate prior to the end of their terms without incurring substantial penalties, absent breach by the counterparty. However, under the lease agreements, the risks and rewards of ownership have substantially remained with the lessors. In particular, the fair value of the future payments under these leases is significantly less than the value of the assets to which they relate, and the lease periods are significantly shorter than the estimated lives of the relevant assets. We therefore do not recognize the future lease obligations and the value of the assets leased in our balance sheet. The lease costs payable each year are charged to operating expenses during the year and amounted to $4.8 million in the year ended December 31, 2013.
Foreign currency forward contracts. We use forward contracts to hedge the risk of exchange movements of foreign currencies in relation to sales and purchases and their corresponding trade receivable or trade payable. Under IFRS, we recognize the value of these contracts at their fair value in our consolidated balance sheet. As of December 31, 2013, we had outstanding contracts with a mark to market fair value gain of $0.8 million, calculated using exchange rates and forward interest rates compared to market rates as of December 31, 2013. See "Item 11. Quantitative and Qualitative Disclosure About Market Risk—Effect of Currency Movement on Results of Operations."
Aluminum forward contracts. We may use LME forward purchase contracts to fix a portion of our aluminum purchase costs and thereby hedge against future price movements in the cost of primary aluminum. In 2013, we entered into a number of LME contracts to provide hedges against some of our aluminum price risks in 2014. As of December 31, 2013, we had outstanding contracts with a mark to market fair value loss of $1.2 million. See "Item 11. Quantitative and Qualitative Disclosure About Market Risk—Effect of Commodity Price Movements On Results of Operations."
75
We do not recognize the fair value of forward LME contracts in our income statement until we receive delivery of the underlying physical aluminum. The value of such contracts is recognized as an asset or liability in our balance sheet, with the profit or loss deferred in a hedging reserve account in equity until the underlying delivery of the physical aluminum. The fair value of the contracts is based on quoted forward prices from the LME.
Forward interest rate agreements. There were no FRAs in place as of December 31, 2013.
Capital commitments. From time to time, we have capital expenditure commitments when we have new plant and equipment on order. We treat these commitments as contingent liabilities because they will not be recognized on the balance sheet until the capital equipment to which they relate has been delivered. As of December 31, 2013, we had capital commitments of $2.6 million.
G. Safe Harbor
See the section entitled "Information Regarding Forward-Looking Statements" at the beginning of this Annual Report.
Item 6. Directors, Senior Management and Employees
A. Directors and Senior Management.
The Board of Directors
The following table presents information regarding the members of the board of directors.
Name | Age | Position | |||
|---|---|---|---|---|---|
Peter Joseph Kinder Haslehurst(1)(2)(3)(4) | 73 | Non-Executive Chairman | |||
Brian Gordon Purves | 59 | Director and Chief Executive | |||
Andrew Michael Beaden | 46 | Director and Group Finance Director | |||
Joseph Allison Bonn(1)(2)(3)(4) | 70 | Non-Executive Director | |||
Kevin Sean Flannery(1)(2)(3)(4) | 69 | Non-Executive Director | |||
David Farrington Landless(1)(3)(4)(5) | 54 | Non-Executive Director | |||
- (1)
- Member of the Audit Committee
- (2)
- Member of the Remuneration Committee
- (3)
- Member of the Nomination Committee
- (4)
- An "independent director" as such term is defined in Rule 10A-3 under the Exchange Act
- (5)
- Joined board of directors March 1, 2013
Biographical information concerning the members of our board of directors is set forth below.
Peter Joseph Kinder Haslehurst
Peter Joseph Kinder Haslehurst was appointed our Non-Executive Chairman on March 31, 2006. Mr. Haslehurst has been a Non-Executive Director of the company and a member of both the Audit Committee and the Remuneration Committee since June 2003. Since his appointment as our Chairman, he has chaired the Audit and Remuneration Committees. He also chairs our newly established Nomination Committee. Mr. Haslehurst is a Chartered Engineer, a Companion of the Chartered Management Institute, a Fellow of the Institution of Mechanical Engineers, a Fellow of the Institution of Engineering and Technology, a Fellow of the Royal Society of the Arts and also a Fellow of the Institute of Materials, Minerals and Mining, where he was formerly a vice-president. He has been a managing director, chief executive or
76
chairman in the international manufacturing industry for over 40 years, including president emeritus of VAI Industries (U.K.), following chairmanship of VA Tech (U.K.) from 1999 to 2002 and most recently as chairman and chief executive of the Brunner Mond Group from 2000 to 2008. He holds a number of appointments, including chairman of the audit committee of the Institute of Materials, Minerals and Mining. He is chairman of the Leonard Cheshire Hill House appeal fund. He was made an Eisenhower Fellow from Britain in 1980, received an honorary Doctor of Science at Loughborough University in 2008 and is a Freeman of the City of London. Mr. Haslehurst holds a BSc degree in production engineering from Loughborough University. He was proud to be made an honorary Chief of the Maasai following his services to their tribe as chairman of Magadi Soda Company in Kenya from 2001 to 2008.
Brian Gordon Purves
Brian Gordon Purves was appointed our Chief Executive on January 2, 2002 and has been an Executive Director of the company or its predecessors since 1996. He also served as Group Finance Director from 1996 to 2001. He was a member of the Management Buy-In team in 1996. Before joining the company, Mr. Purves held several senior positions in Land Rover and Rover Group covering financial, commercial and general management responsibilities. A qualified accountant, Mr. Purves has a degree in physics from the University of Glasgow and a Master's degree in business studies from the University of Edinburgh. He is also a Companion of the Chartered Management Institute.
Andrew Michael Beaden
Andrew Michael Beaden was appointed as an Executive Director and our Group Finance Director on June 1, 2011. Previously, he worked as Director of Planning and Finance from 2008 to 2011. He joined the company in 1997 and was promoted to Group Financial Controller in 2002. He became a member of the executive management board in January 2006. Mr. Beaden is a qualified Chartered Accountant who has worked for KPMG, as well as several U.K. FTSE 100 companies in a variety of financial roles. He has an economics and econometrics honors degree from Nottingham University.
Joseph Allison Bonn
Joseph Allison Bonn was appointed as a Non-Executive Director on March 1, 2007. Mr. Bonn is a member of the Audit, Remuneration and Nomination Committees. He has extensive experience in the aluminum and specialty chemical industry, having worked for Kaiser Aluminum and Chemical Corporation for over 35 years in various senior capacities. Among other appointments in the United States, he has served on the Board and Executive Committee of the Aluminum Association, the Board of the National Association of Purchasing Management and the International Primary Aluminum Institute Board. He is currently a consultant with Joseph Bonn RE&C Corp. Mr. Bonn holds a BS degree from Rensselaer Polytechnic Institute and an MBA degree in Finance from Cornell University.
Kevin Sean Flannery
Kevin Sean Flannery was appointed as a Non-Executive Director on June 1, 2007. Mr. Flannery is a member of the Audit, Remuneration and Nomination Committees. Mr. Flannery has over 40 years of experience in both operational and financial management roles in a variety of industries. He is currently the president and chief executive officer of Whelan Financial Corporation, a company he founded in 1993 that specializes in financial management and consulting. He was formerly the chairman and chief executive officer of several companies, including RoweCom, Inc., a provider of service and e-commerce solutions for purchasing and managing print and e-content knowledge resources; Telespectrum Worldwide, a telemarketing and consumer service-company; and Rehrig United Inc., a manufacturing company. He serves as a director of FPM Heat Treating LLC, a leading provider of heat treatment processes; and Energy XXI, a Bermuda based oil and gas-company. From 2005 to 2007, he served as a director of Seitel, Inc., from
77
2007 to 2009, he served as a director of Daystar Technologies, Inc and from 2009 to 2011 he served as a director of ATS Corporation. Mr. Flannery began his career at Goldman, Sachs & Co. and was a senior managing director of Bear Stearns & Co.
David Landless
David Landless was appointed as a Non-Executive Director on March 1, 2013. Mr. Landless is a member of the Audit and Nomination Committees. Mr. Landless started his career with Bowater and Carrington Viyella and joined Courtaulds Plc in 1984. He was appointed a Finance Director in the U.K. and U.S. divisions of Courtaulds Plc from 1989 to 1997 and Finance Director of Courtaulds Coatings (Holdings) Limited from 1997 to 1999. He is currently Group Finance Director of Bodycote plc. Mr. Landless is a Chartered Management Accountant, and he graduated from the University of Manchester Institute of Science and Technology.
Executive Management Board
The members of the executive management board of Luxfer are responsible for the day-to-day management of our company.
The following table lists the names and positions of the members of the executive management board.
Name | Age | Position | |||
|---|---|---|---|---|---|
Brian Gordon Purves | 59 | Director and Chief Executive | |||
Andrew Michael Beaden | 46 | Director and Group Finance Director | |||
Christopher John Hillary Dagger(1) | 65 | Managing Director of Magnesium Elektron | |||
Edward John Haughey | 58 | Managing Director of MEL Chemicals | |||
John Stephen Rhodes(2) | 64 | President of Luxfer Gas Cylinders | |||
Linda Frances Seddon | 63 | Company Secretary and General Counsel | |||
David Terrence Rix(3) | 45 | Managing Director of Magnesium Elektron | |||
Andrew William John Butcher(4) | 45 | President Designate of Luxfer Gas Cylinders | |||
- (1)
- Stepped down as Managing Director of Magnesium Elektron on July 31, 2013 but remained on the Executive Management Board until retirement on January 31, 2014.
- (2)
- Announced retirement as of March 31, 2014.
- (3)
- Joined the Executive Management Board on August 1, 2013 and immediately became Managing Director of Magnesium Elektron.
- (4)
- Joined the Executive Management Board on January 1, 2014 and will become President of Luxfer Gas Cylinders from April 1, 2014.
Biographical information of members of our executive management board who are not members of our board of directors is set forth below.
Christopher John Hillary Dagger
Christopher John Hillary Dagger has been a member of the executive management board since 2001. He joined the business in 1999 and became Managing Director of Magnesium Elektron in 2001. Previously, Mr. Dagger held a number of positions with British Alcan Aluminium over the course of 20 years in a number of fields, including metal stockholders, gas cylinder manufacture, extrusions and smelting. Mr. Dagger holds an HND in Business Studies and a Post Graduate Diploma in Personnel Management, from Middlesex Polytechnic. He is also a member of the Chartered Institute of Personnel and Development.
78
Edward John Haughey
Edward John Haughey has been a member of the executive management board since 2003, when he was appointed Managing Director of our MEL Chemicals business. Prior to joining the company, Mr. Haughey was managing director of Croda Colloids Limited for Croda International Plc from 1994 to 2003, and has held a series of senior general management positions in the Croda Group, BASF and Rhone Poulenc. Mr. Haughey holds a chemistry degree from Paisley College of Technology and a Post Graduate Diploma in Industrial Administration from Glasgow College of Technology.
John Stephen Rhodes
John Stephen Rhodes became a member of the executive management board in 1996 upon the Management Buy-In. Since 1998, Mr. Rhodes has been President of our Luxfer Gas Cylinders business. Mr. Rhodes has held numerous positions at the company and its predecessors since 1974, including President of Luxfer Gas Cylinders North America from 1994 to 1998, Managing Director of the Superform business from 1991 to 1994 and Director of Business Development for the Enterprise Division of British Alcan Aluminium from 1989 to 1991. Mr. Rhodes holds a BSc Hons degree in Social Sciences from London University. He is also on the Board of the North American Compressed Gas Association.
Linda Frances Seddon
Linda Frances Seddon has been a member of the executive management board since 2001. Mrs. Seddon has been Secretary and Legal Adviser of the company and its predecessors since 1997. After qualifying as a solicitor in England and Wales in 1976, Mrs. Seddon spent 14 years in private practice as a solicitor, before becoming a legal adviser with Simon Engineering PLC in 1990 and, subsequently, with British Fuels upon its privatization, focusing on general commercial, property, intellectual property, mergers and acquisitions and corporate matters. Mrs. Seddon holds a BA Honours degree in Business Law from the City of London Polytechnic and a post graduate diploma in Competition Law from Kings College London.
David Terrence Rix
David Terrence Rix was appointed to the Executive Management Board in 2013 and immediately assumed responsibility for Luxfer's Magnesium businesses. Mr. Rix was formerly Managing Director of Luxfer Gas Cylinders in Europe after serving as European Sales Director. Mr. Rix joined Alcan Wire and Conductor in 1991 and moved to Luxfer Gas Cylinders in 1994, holding various sales and marketing positions in Germany, France and Dubai, UAE, before returning to the U.K. Mr. Rix joined the Gas Cylinders Divisional Team in 2001 with strategic responsibility for global marketing. Mr. Rix holds a BA (Honours) in business studies, and a diploma from the Institute of Marketing. Mr. Rix is fluent in French and German.
Andrew William John Butcher
Andrew William John Butcher joined the Executive Management Board on 1 January 2014 and will become President of Luxfer Gas Cylinders on 2 April 2014. Mr. Butcher joined Luxfer Gas Cylinders in Nottingham in 1991, before moving to California in 2002, where he led our composite businesses. He has been President of Luxfer Gas Cylinders North America since 2009. Mr. Butcher holds an MA degree in Engineering from Cambridge University, and an MBA from Keele University, and is a US citizen.
B. Compensation
The total amount of compensation paid and benefits in kind granted to the Directors and members of our executive management board for the 2013 fiscal year was $2.3 million.
For the 2013 fiscal year, (i) we and our subsidiaries contributed a total of $0.4 million in respect of our contribution into money purchase plans to provide pension, retirement or similar benefits to our directors
79
and members of the executive management board and (ii) the total increase in accrued pension benefits earned during the 2013 fiscal year (excluding any increase due to inflation) by our Directors and members of the executive management board under the defined benefit plans was $0.1 million.
The 2013 Remuneration Report (the "Remuneration Report"), was prepared in accordance with our UK home-country regulations and is reproduced hereunder in all material respects.
REMUNERATION REPORT
Chairman's Statement
The 2013 Remuneration Report has been prepared in accordance with the new UK regulations governing the way remuneration for directors of UK companies is reported and voted upon.
The new UK regulation requires the Remuneration Report to be divided into two sections:
- •
- The Annual Report on Remuneration which sets out how we remunerated our director in 2013. This report will be proposed for an advisory vote at the Company's 2014 Annual General Meeting; and
- •
- The Remuneration Policy Report setting out the Remuneration Committee's policy and framework for executive remuneration. In accordance with the new UK regulations this report will be proposed for a binding vote by shareholders at the same meeting.
Context of Luxfer Remuneration Report
The Company successfully completed an Initial Public Offering (IPO) of American Depository Shares (ADS) on the New York Stock Exchange (NYSE) in October 2012. A number of its shareholders were US based prior to the IPO and the listing in New York (the Company's sole listing) has increased this number. With its equity quoted in US dollars in New York and this large US shareholder base in mind, the Company chose to report in US dollars. All of the 'comparable' companies chosen by Research Analysts are US listed businesses, and a basket of these US companies is used to benchmark the Company's performance.
The Remuneration Committee remains focused on ensuring the remuneration policy and procedure is right for the Company's business and is capable of attracting and retaining its executives to create long-term value for its shareholders. The price of the Luxfer ADS has made significant gains since the IPO reaching more than twice the IPO price of $10 by the close of 2013.
In the context of a recent IPO, the focus of the Remuneration Committee during the year has been:
- •
- To ensure stability of senior management over the next few years whilst the Group matures as a listed Company with all the necessary changes that involves, through a remuneration structure that is designed to retain senior management;
- •
- To promote increased involvement in the ownership of shares by all levels of management in the Group to promote and strengthen alignment of the interests of management with the interests of shareholders; and
- •
- To create a remuneration environment that will facilitate growing the Group.
In the area of remuneration, there are differences between the USA and the UK both in what is considered best practice and in the standard practice of companies. In considering the structure of remuneration for the executive directors and senior management, the Remuneration Committee has taken account of the US listing and the large US shareholder base, particularly in relation to long term incentives, resulting in remuneration packages which have some elements of what the Remuneration Committee believe is usual in the US but may not necessarily be best practice in the UK. They remain convinced however that these elements are appropriate for the Company in the context explained above.
80
Major Decisions on Remuneration during the Year
Following advice from Mercers in January 2013, and building on what was reported for 2012, the Remuneration Committee has continued to adjust the remuneration of the executive directors and other managers to bring it more into line with market practice for comparable listed companies. Advice had indicated that the overall remuneration package of Brian Purves was below the lower quartile and that of Andrew Beaden, was well below the lower quartile for the comparable listed companies. The Remuneration Committee took the advice into consideration when determining the overall remuneration package for Brian Purves and Andrew Beaden for 2013. The major decisions and changes are summarised below.
Base Salary—Both of the Executive Directors were awarded a 20% increase in their base salaries in 2013 in recognition of their additional responsibilities in a listed environment. The increase in Andrew Beaden's base salary still left him below the median of the comparator group but was a significant move towards bridging the gap, and he was still a relatively recent appointment. The Remuneration Committee has partly addressed this in 2014 by awarding him a higher than inflation increase of 5%.
Annual Bonus—The Committee decided to continue with an annual bonus based on profit and net cash flow measured against the approved budget for 2013, weighted in 2013 heavily towards achieving budget profit which formed two thirds of the bonus potential in the year. The remaining third was equally divided between cash and a non-financial element. The maximum potential bonus for Brian Purves remained at 100% of base salary with 60% awarded for achieving on-target performance. The maximum potential bonus for Andrew Beaden was increased from 75% to 80% to make it more competitive, with 48% being awarded for on-target performance. The pensionable element of the bonus was removed for the Executive Directors to align with best practice in a listed environment. The targets were not achieved, resulting in no bonus being payable to either Brian Purves or Andrew Beaden for 2013.
Share Incentive Awards—In order to provide more flexibility, particularly in relation to less senior management, the requirement in the executive LTIP that at least 50% of the awards would be performance based and at least 25% would be made in market value options to buy the Company's ADS was removed. However, the Committee used their discretion under the rules of the plan and determined the 2013 mix of awards to the Executive Directors and the Executive Board would follow this principle. The awards made to the executive directors for 2013 are set out in the Remuneration Implementation Report. These were a mixture of time-based options vesting over three-years to further consolidate retention, and market-based and performance-based options to strengthen alignment of the executives and other senior management with the interests of shareholders. The Committee believe they set challenging but, importantly, attainable EPS and Total Shareholder Return ("TSR") targets for the performance based awards to motivate the executives and the management. The first TSR target measured at the end of 2013 has resulted in one-sixth of the performance awards vesting.
Although under the rules of the LTiP the maximum value of the awards granted in any calendar year are not to exceed in the aggregate 150% of base salary at date of grant for the Chief Executive Brian Purves and 120% of base salary for our Group Finance Director Andrew Beaden, and mindful that there are only a limited amount of the total share capital that is available to grant awards under the LTiP for all levels of management, total awards made by the Committee for 2013 were based on a value at the date of grant of 63% of the Chief Executive's base salary and 50% of the Group Finance Director's base salary.
Pursuant to the Non-executive Directors Equity Incentive Plan (EIP), the first non-discretionary awards of 50% of annual fees were made to the Non-Executive directors. A one-time mandatory award under the EIP was made to David Landless on joining the Board.
81
Particulars of the 2013 awards appear in the Annual Report on Remuneration.
To further strengthen alignment with the interests of shareholders we also granted time based awards vesting over three years to a wider group of managers and we have introduced an All Employee Share Scheme for our UK employees. We plan to introduce appropriate Schemes for the rest of the Group
In considering the future remuneration policy set out in the Remuneration Policy Report, the Remuneration Committee remain of the belief that because of the particular circumstances applying to the Company: a single listing on the New York Stock Exchange; the US shareholder base; the substantial part of its reporting being in compliance with the US requirements and the US companies against which the Company's performance is measured, that it is appropriate for them to structure incentives according to US market practice to ensure it is able to attract and retain high calibre management both now and for the future. The Future Remuneration Policy has been framed on this basis. The Remuneration Committee recommend that the shareholders approve the Remuneration Policy Report and the Annual Report on Remuneration.
Remuneration Policy Report
The table below sets out the main components of the remuneration packages for the Executive Directors. This policy will take effect immediately following approval at the 2014 annual general meeting and will apply until a further policy is approved by an ordinary resolution of the shareholders.
Since the IPO, the Remuneration Committee has been working to review and restructure remuneration packages for the Executive Directors and senior management to reflect that following the IPO, it is deemed more appropriate to align them with the type and level of package paid to executives in comparable (by size and industry) companies in a listed environment. The Committee determined that to maintain top performance levels in the Company they should be targeting at least median level remuneration packages for key executives. However, the Committee recognised that it was unfeasible and undesirable to move to this position immediately. Adjustments to the remuneration packages will be considered over a number of years with the medium-term objective to position them on or about the median to maximise the Group top quartile performance.
Under the Remuneration Policy, the Committee has discretion in a number of areas as set out in the relevant section of the policy. In addition, certain operational and administrative discretions may be exercised under relevant standalone deeds of grant or plan rules, including LTiP and EIP implemented for the IPO, the rules of which are on file at the SEC.
82
EXECUTIVE DIRECTORS
Fixed Remuneration
| Base salary | Purpose and Link to Strategy: To attract, retain and incentivise high calibre individuals who can deliver the company's strategy and reward performance. To be competitive. | |||||
Operation: Reviewed annually and normally fixed for 12 months from 1 January in each year. Paid in 12 equal monthly instalments. Reviews take account of a variety of different factors including: • The rise in the cost of living, market rates, responsibility of the position, experience and contribution of the individual, the scale of the Group's operations, group performance and affordability, remuneration levels and increases in the rest of the Group; • Following the IPO, the Committee's objective is to adjust the remuneration packages of the executive directors over the next few years to at least the median of an external comparator (broadly by size and industry) group drawn from the S & P Small Cap 600 or any other comparator group in the UK or the US the Committee deem appropriate to remain competitive; • Pay and practices in both the US and the UK. | Maximum Opportunity: No prescribed maximum to avoid setting expectations. The Committee retain discretion to re-adjust salaries as part of the overall package to at or about the median or above of the external comparator group deemed appropriate by them to maximise the Group's top quartile performance. Where it is satisfied that salaries are at or about the median of the external comparator group it will increase them in line with the cost of living as implemented for the general work force in the country in which the executive is based, other than exceptional circumstances or where there is a change in the role or an increase in the responsibilities of the role where it will increase salaries in its discretion. | |||||
Performance Metric: None | Provisions for Recovery or Withholding of Payment: None | |||||
Benefits in kind | Purpose and Link to Strategy: To aid recruitment and retention of high calibre individuals and to remain competitive in the market. | |||||
Operation: Benefits received by directors will generally include car allowance, medical and dental insurance. Additional benefits may be provided where required by legislation or to align the remuneration package with market practice where these are not significant in value. The company may introduce new benefits that are or become prevalent in the jurisdiction in which it operates or in which the director is based. Where an individual director is relocated benefits such as relocation expenses, travel expenses, accommodation, tax equalisation; professional advice, and post-retirement medical expenses may be provided. Benefits are reviewed annually. | Maximum Opportunity: No maximum value is set but the Committee periodically monitors the overall cost of the benefits to ensure they are affordable, competitive and in line with market practice in the UK and the US. | |||||
Performance Metric: None | Provisions for Recovery or Withholding of Payment: None | |||||
Pension | Purpose and Link to Strategy: To provide funding for retirement and aid recruitment and retention of high calibre individuals. | |||||
Operation: For directors based in the UK and who joined the Group prior to the closure of the defined benefit scheme to new entrants, contributory pension arrangements are provided partly by defined benefit arrangements up to a specific earnings cap and partly by registered defined contribution arrangements. Directors who joined the Group after the defined benefit scheme was closed will have benefits provided by the registered defined contribution scheme. For those who exceed one or more tax allowance, an equivalent allocation or payment may be made to an unregistered alternative savings vehicle. Arrangements are reviewed annually to ensure consistency with market practice and take account of the effect of regulatory change on an individual's benefits. For directors based in other jurisdictions they will be offered arrangements appropriate to that jurisdiction. | Maximum Opportunity: For those directors who are still members of the defined benefit scheme accrual is on a career average basis of 1.50% of pensionable earnings for a member contribution of 9.8% of salary or 1.31% for a member contribution of 7.4% of pensionable earnings. Pensionable earnings are limited to a scheme specific earning cap of £76,000 from 6th April, 2014, which increases by wage inflation in the UK group. Inflationary increases will continue to accrue benefits in accordance with the scheme rules to deferred members. Under the Defined contribution arrangements the Company makes an annual contribution into the personal pension plan which increases on an age related basis up to a maximum of 25% in accordance with the rules of the plan. The maximum contribution into or allocations to any alternative savings vehicle will not exceed the contributions the Company would have made to the defined benefit and defined contribution schemes had the executive been a member of one or both of those pension schemes. Contributions or allocations in respect of Brian Purves rise with age and may reach as much as 30% of base salary due to prior contractual commitments. | |||||
Performance Metric: None | Provisions for Recovery or Withholding of Payment: None | |||||
83
Variable Remuneration
Annual bonus | Purpose and Link to Strategy: To retain, motivate, incentivise high calibre individuals and promote the achievement of key financial and strategic goals and targets of the Company in the financial year to which it relates. | |||||
Operation: Cash bonus paid in March for performance over the previous financial year. Targets are set at the beginning of the financial year and normally based on achievement of a mix of financial targets (typically profit before tax and net cash flow) measured against the approved annual budget for the bonus year and usually awarded for achieving on a sliding scale between Threshold, Target and Stretch. The Committee has retained the flexibility to determine one or more elements may be earned for attaining target and stretch or a single target. The Remuneration Committee has flexibility to use non-financial and personal targets if deemed appropriate in addition to financial targets. In addition the Committee has reserved discretion to offer an Additional Percentage Bonus (APB) on achievement of specific additional targets set by them at their discretion aligned with the strategic goals of the Company for that year. The bonus for achieving threshold is at the discretion of the Committee but will normally be 1/6th of the potential but may be more. | Maximum Opportunity: Maximum bonus is capped (excluding APB) at: • 100% of salary for the chief executive; • 80% of salary for the group finance director. The APB discretionary award offered may be up to an additional 50% of salary. This additional discretionary award could increase the maximum bonus achievable to 150% of salary for the Chief Executive Officer and 130% of base salary for the Group Finance Director. | |||||
Performance Metric: Weighting of measures and between measures for achieving financial and non-financial targets are adjusted annually and are discretionary being driven by the Company's strategy, financial goals and requirement to maintain and improve operating efficiencies. The APB performance metric is discretionary based on the associated strategic objective for which the APB is offered. | Provisions for Recovery or Withholding of Payment: None. If the directors leaves during the year to which the bonus relates it is not payable. | |||||
Long-term incentive plan ('LTiP') | Purpose and Link to Strategy: Attract and retain high quality senior employees in an environment where compensation levels are based on a global market. Align rewards for employees with returns to shareholders through personal financial investment. Reward achievement of business targets and key strategic objectives. | |||||
Operation: The type and level of award made and the criteria for vesting are considered annually to ensure they continue to support shareholder alignment and group strategy. The LTiP provides the Remuneration Committee the discretion to grant time-based, market value or performance based awards in the form of Options, Stock Appreciation Rights (SAR's) Restricted Stock, Restricted Stock Units (RSU's) and other stock based awards or a combination of such awards. The discretion over what type or combination of types of award to be made will be exercised by the Remuneration Committee based on what they consider to be the market norms in the UK and US and the particular circumstance in which the award is made. Awards are made over ADS primarily through the issue of new shares. Participants are required to pay at a minimum the nominal cost of the Ordinary share underlying the ADS. The Committee has the discretion (which will be used as deemed appropriate to a particular circumstance, such as retirement of long serving employees or leavers due to sickness or disability) to: • Accelerate vesting and exercise dates; • Waive conditions to vesting or exercise or transferability; • Extend exercise periods after termination of employment. RSU's can be settled in cash or shares or a combination of both at the discretion of the Committee. This discretion will be exercised based on what is in the best interests of the Company. Awards may accrue dividends either under the rules of the Plan or at the discretion of the Committee, payable in cash or shares.Options and RSU's that vest, accrue a dividend until vesting payable in cash or shares as determined at the discretion of the Committee. The Committee reserves the right to make this decision based on the needs of the Company. | Maximum Opportunity: The LTiP maximum awards in any calendar year may not exceed: • Chief Executive 150% of base salary; • Group Finance Director 120% of base salary. The maximum amount of dividend paid will be the dividends paid on the ADS over which the awards are granted between grant and vesting. | |||||
Performance Metric: Under the LTiP the Committee has the discretion to use a range of performance targets. Performance targets for performance awards will be those deemed appropriate by the Committee to support the long term strategy of the group set at the time of grant and in the best interests of the Company. For recent performance awards the Committee has used EPS or TSR or a combination of both. | Provisions for Recovery or Withholding of Payment There are no provisions for recovery of awards. Leavers are treated as set out in the section of this report titled Policy onPayment for Loss of Office | |||||
All employee share incentive plans | Purpose and Link to Strategy: To encourage share ownership by all employees in the group and increase alignment with shareholders. | |||||
Operation: The UK all employee share incentive plan is an HMRC approved plan, subject to prescribed limits, to provide all eligible employees (including executive directors) with a tax-efficient way of purchasing ADS out of monthly savings over a 6 monthly accumulation period. The Company currently provides 1 matching share free for every 1 share purchased. It is proposed to implement additional share incentives for all employees and where practical on a tax favourable/efficient basis. | Maximum Opportunity: Participants in the UK plan, including the executive directors, can invest up to £125 per month (£1,500 p.a.) or 10% of salary, if lower, in any tax year to purchase ADS. ADS are purchased using the participants' contributions at the end of each accumulation period at the lower of the price at the start of the accumulation period and the price immediately before purchase. The maximum number of shares matched is 1:1. Dividends on both purchased shares and matching shares are used to purchase additional shares. The plan or plans implemented for other jurisdictions in which the Group operates may have maximum opportunity commensurate with the UK plan or their legislation if deemed appropriate by the Committee. | |||||
Performance Metric: None | Provisions for Recovery or Withholding of Payment: Under the UK plan, matching shares are forfeited if not held for 3 years except if the participant leaves employment through redundancy, retirement, disability, or TUPE transfer. | |||||
84
Legacy Long-Term Incentives
The following section of the policy sets out details of the legacy share awards granted prior to the policy that will continue to vest and become exercisable pursuant to the plan rules or grant agreements under which they were granted.
Legacy Long-Term Incentives
Standalone options grants made prior to the IPO (IPO options) | Purpose and Link to Strategy: To retain key personnel after the IPO and align rewards for employees with returns to shareholders through personal financial investment. | |||||
Operation: Time-based market value options to purchase the Company's ADS at a price of $10 each ADS. 60% of the options have already vested and become exercisable. 20% of the remaining options vest in 2014 and the final 20% vest in 2015. Grants were made to the executive and non-executive directors. | Maximum Opportunity: The option awards granted to Brian Purves were valued at 120% of base salary on grant and those of Andrew Beaden and the non-executive directors were valued at an average of 93% of base salary or annual fee on grant. | |||||
Performance Metric: None | Provisions for Recovery or Withholding of Payment: None | |||||
2013 grants made under the LTiP | Purpose and Link to Strategy: To attract and retain high quality senior employees in an environment where compensation levels are based on a global market. Align rewards for employees with returns to shareholders through personal financial investment. Reward achievement of business targets and key strategic objectives. | |||||
Operation: In 2013 awards consisting of a mix of time based nominal cost options, time based market value options and performance based nominal cost options were made. Details of these awards are set out in the Annual Remuneration Report. | Maximum Opportunity: Total awards made to Brian Purves were valued at 63% of base salary at date of grant and to Andrew Beaden 50% of base salary at date of grant. | |||||
Performance Metric: 50% of the performance nominal cost options vest on the achievement of defined EPS targets and 50% on defined TSR targets. Performance period: EPS target—4 years with one-sixth vest on achievement of defined EPS targets for the first time measured at 31 December; TSR targets—3 years with ability to extend to 4 years if unvested awards remain available after third year—one-sixth vest if TSR is at or above the median TSR of defined comparator group measured at 31 December. | Provisions for Recovery or Withholding of Payment: None | |||||
Luxfer Holdings Executive Share Options Plan | Purpose and Link to Strategy: To attract and retain high quality senior employees. Align rewards for employees with returns to shareholders through personal financial investment. Option grants made under this plan were made to support the strategy pre-IPO. | |||||
Operation: Options granted under this plan are vested and exercisable on payment of the option price. | Maximum Opportunity: Difference between the option price of £4 per ordinary share and the price of the ordinary share in the form of ADS on exercise. | |||||
Performance Metric: None | Provisions for Recovery or Withholding of Payment: None | |||||
Notes to the Policy Tables:
- 1.
- Annual Bonus: The targets selected and the weighting given to those targets are chosen annually and reflect the goals and priorities of the Group for the year in which they are earned. Discretion will be exercised in a manner that supports these goals and priorities and in the best interests of the Company. The financial targets are usually based on management trading profit and cash flow measured against the approved annual budget. These measures are also Group KPI's. Non-financial targets are based on group strategic goals.
- 2.
- Long Term Incentive Plan:
- •
- For the purpose of the maximum opportunity limits to determine the award size, awards are valued at the date of grant as follows: time based restricted stock and RSU's Fair Market Value ("FMV"); Options and SAR's1/3 of FMV, performance restricted stock and performance RSU's 50% of FMV of the target awards; cash incentives the maximum value of cash; and other stock base awards such as the UK option granted to the executive directors, as determined in good faith by the Committee
85
- •
- The LTiP performance measures are chosen to align the interests of directors with those of shareholders. The EPS performance criterion is selected by the Committee on the basis that it encourages a focus on and rewards delivery of earnings growth, which is the key driver of long-term returns to shareholders. TSR further reinforces the directors' alignment with shareholder interest. The targets set are considered to be challenging, with the stretch target representing only outstanding performance in order to be rewarded with the maximum pay out. The main EPS targets for 2014 are based on budgeted earnings;
- •
- Performance targets are generally set in the context of the strategic objectives of the Group and at such a level that they are challenging but achievable in the context of the economic environment in which they are set so as to incentivise the directors;
- •
- Comparator groups for TSR purposes are reviewed regularly to ensure they remain appropriate;
- •
- Time-based and time-based market value options were awarded for the IPO standalone grants and included in the first awards under the 2013 LTiP awards consistent with advice to the Committee on US practice.
at the date of grant by reference to the FMV. FMV is defined as the closing price on the NYSE on the trading day before grant;
- 3.
- Legacy Long-Term Incentives: All legacy grants will be honoured going forward as set out in this policy and the Annual Remuneration Report in accordance with the rules of the plan under which they were granted and the approval of this policy will be approval of those awards yet to be vested.
Non-Executive Directors
Fees | Purpose and Link to Strategy: Reflects the time commitment required for the role. To attract and retain executive directors with the skill set and experience required by the Company. To be in line with UK and US market practice. | |||||
Operation: Fees are paid part in cash and part in shares under the EIP. Neither the Board Chairman nor the Non-Executive Directors are paid supplemental fees for any of their committee responsibilities, however, the discretion is reserved to do so if it is deemed appropriate and in line with market practice. The cash element of the fees is reviewed annually. Reviews take account of a variety of different factors including: • Inflation, market rates, affordability, remuneration levels and increases in the rest of the Group; • Pay and practices in both the US and the UK. Fees for the non-executive directors are set in USD. The fees for the Chairman are set in sterling. The share based element of the fees is a non-discretionary grant of share awards in the form of options, restricted stock or restricted stock units. Awards are made annually immediately after the Annual General Meeting (AGM) and vest the following year immediately before the next AGM. David Landless was awarded restricted stock under the EIP during 2013, 2/3rds of which still remain to vest. | Maximum Opportunity: Non-Executive directors serving for at least six months from appointment receive share based fee awards valued at 50% of annual fees at date of award. New non-executive directors, upon appointment or election, receive a one-time award valued at $30,000 at date of award and having served 6 months the annual fee pro-rated. | |||||
Performance Metric: None | Provisions for Recovery or Withholding of Payment: None | |||||
86
Differences between Policy for Directors and Employees
There are differences in the remuneration policy for executive directors who are both UK based and the approach to remuneration of other employees which reflect differing levels of responsibility and seniority within the organisation and market norms in the jurisdictions in which the employees are employed. The following are differences in the remuneration policy for executive directors and the approach to remuneration for other employees generally:
- •
- The bonus arrangements for the executives, directors and senior, middle and lower management are structured broadly on the same basis to ensure commonality of objectives but at a lower percentage level depending on the seniority of the manager in the group. There is a greater emphasis on performance-related pay for management levels, and lower levels of bonus opportunity or no bonus opportunity may apply to other employees in the group, depending on local policies;
- •
- Benefits are generally offered that meet market norms in the jurisdiction in which employees are employed and take into account the position in which they are employed;
- •
- Pension arrangements are offered where it is the market norm to offer such arrangements in the jurisdiction in which the employee is employed. Where such arrangements are in place membership is encouraged. Where local regulation permits, top-up arrangements may be put in place for more senior management if that is the market norm;
- •
- Participation in the LTiP is limited to executive directors and a selected number of senior and other managers. Whilst the Committee has determined for 2014 to grant only performance awards to the executive directors, less senior managers may be granted market value awards or time based awards over ADS to encourage share ownership and retention. UK employees, if eligible, can participate in the UK SIP.
Approach to Recruitment Remuneration
Executive Directors
When setting a remuneration package for new executive directors, including internal promotions, the Remuneration Committee will apply similar principles to those set out in the most recent approved remuneration policy for both short term and long term incentives depending on the experience of the new executive. The table below sets out the maximum variable pay opportunities.
87
Maximum Variable Pay Opportunities
Element of Remuneration | Approach | Maximum Opportunity | ||
|---|---|---|---|---|
| Base salary | Set in line with policy at a level appropriate to the role and experience of the new executive. This may include, if appropriate, an agreement to increase base salary over a defined period up to a pre-defined level on acquiring experience and having delivered satisfactory performance in the role, in which case the salary increases may exceed inflation or general increases in the work force in the country in which the executive is based. | In line with existing policy. | ||
Benefits | In line with existing policy. | In line with existing policy. | ||
Pension | In line with existing policy. | In line with existing policy. | ||
Annual Bonus | In line with existing policy but pro-rated to reflect the proportion of the year served. | Up to 100% of base salary depending on the seniority of the role (150% in exceptional circumstances under the APB). | ||
Long-terms Incentives | In line with existing policy. | Up to 150% of salary at date of grant depending on the seniority of the role. |
88
In relation to external appointments, the Remuneration Committee may consider compensating candidates in cash or shares for remuneration relinquished on leaving their former employment if they consider it to be in the best interests of the Company and the shareholders. In considering such payments, the Committee would take into consideration the amount of remuneration foregone, the nature, vesting dates and performance requirements attached to the remuneration foregone.
If a new executive director (either an internal or external appointment) is required to relocate, relocation payments may be offered at the Committee's discretion if they consider it to be in the best interests of the Company and the shareholders.
In respect of internal promotions, any commitments made to the new executive before his/her promotion will continue to be honoured by the Committee even if not consistent with the approved policy outlined above in terms of short term and long term incentives awarded but yet to be earned.
Newly appointed directors will be required to hold shares (ordinary shares or the equivalent in ADS) to the value of one hundred per cent of base salary, which can be built up over three years from appointment.
Non-Executive Directors
New Non-Executive directors will be paid fees on the same basis as the existing non-executive directors. They will also participate in the Non-Executive Directors Incentive Plan under which the annual awards are non-discretionary. The plan does provide on election, a new non-executive director will receive a one-time award of or in respect of ADS to the value of $30,000. The form of the award which can be either Options, Restricted Stock, or Restricted Stock Units at the discretion of the Board based on the value of each type of award and the number of shares left in the plan. The vesting period is at the discretion of what the relevant committee of the Board believe is in the best interests of the Company.
Service Contracts
Executive Directors
The Company has entered into service contracts with the Executive Directors that are not for a fixed term. The Executive Directors have service contracts that ordinarily are terminable by twelve months' notice by either the Company or the director, which notice can be given at any time. The Company may terminate an Executive Director's contract without notice on the occurrence of certain events identified in their contract which would normally consist of conduct justifying summary dismissal, including gross misconduct.
Executive Directors' Service Contracts
| | Date of Current Contract | Notice Period | Remuneration Entitlement | |||
|---|---|---|---|---|---|---|
| Brian Purves | 9 April 1999 continuity of service from 1996 | 12 months' notice | Payment in lieu of notice in the event of early termination. This may include base salary benefits and pension payable for the notice period. A bonus may be paid if the period for which pay in lieu of notice is made extends past the year end subject to targets being met |
89
| | Date of Current Contract | Notice Period | Remuneration Entitlement | |||
|---|---|---|---|---|---|---|
| Andrew Beaden | 5 August 2011 continuity of service from 1996 | 12 months' notice | Payment in lieu of notice in the event of early termination. This may include base salary benefits and pension payable for the notice period. A bonus may be paid the period for which pay in lieu of notice is made extends past the year end subject to targets being met |
The Executive Directors have the same employment rights as any other employee in the case of redundancy or if the termination of their employment was determined by a relevant tribunal to be unfair under English law.
On the IPO at the end of 2012, the contracts of both Brian Purves and Andrew Beaden were amended to provide enhanced payments in the event of a change of control as agreed with each of them at the start of the IPO process in 2011. If their contract is not assumed by the acquiring entity or a materially different position is offered to either of them, on termination of their contract a severance payment based on the group standard severance policy is payable, but calculated using two times highest annual base salary prior to the change of control instead of twelve months' salary under their normal notice provisions.
The relevant rules for both the IPO standalone options and the LTiP provide that upon a change in control, all unvested time-based awards will fully vest and become exercisable as applicable and unless determined by the Committee, shall lapse on the first anniversary of the change of control if not exercised as applicable. Under the rules of the LTiP all performance-based awards will vest pro-rata based on the performance results to the date of change and the elapsed portion of the performance period.
Service agreements for new recruits to the board and internal promotions will be on the same basis as the current Executive Directors with no fixed term and will be terminable by either party on twelve months' notice. They may make provision, at the discretion of the Company for pay in lieu of notice for early termination which will include base salary, benefit and pension contributions and may include payment of the annual bonus. They may also make provision for similar change of control provisions as offered to the current Executive Directors if the Committee consider it is market practice or in the best interests of the Company.
Non-Executive Directors
The Company has entered into letters of appointment with the Non-Executive Directors and the Chairman that are not for a fixed term.
90
Non-Executive Directors' Letters of Appointment
| | Date of Current Letter of Appointment | Notice Period and Entitlement to Fees | |||
|---|---|---|---|---|---|
| Peter Haslehurst | 27 June, 2012 | 3 months' notice except if fail to be re-elected at an AGM when contract terminate immediately without notice or compensation. | |||
Joseph Bonn | 28 February, 2007 | 3 months' notice except if fail to be re-elected at an AGM when contract terminate immediately without notice or compensation. | |||
Kevin Flannery | 11 May, 2007 | 3 months' notice except if fail to be re-elected at an AGM when contract terminates immediately without notice or compensation. | |||
David Landless | 20 February, 2013 | 3 months' notice except if fail to be re-elected at an AGM when contract terminate immediately without notice or compensation. | |||
Neither the Non-Executive Directors nor the Chairman has any employment rights. New appointees to the Board will generally be appointed on the same basis as the current non-executive directors.
Directors' service agreements and letters of appointment are available for inspection at the registered office of the Company.
Policy on Payment for Loss of Office
Contractual entitlements to the date of termination will be honoured and the Company will pay any amounts it is required to pay in accordance with the directors statutory employment or contractual rights and to settle those rights. The Company will seek to apply the principles of mitigation to ensure it is not paying more than is required. In the event of a compromise or severance agreement, the Committee may make payments it considers reasonable in settlement of potential legal claims. It may include in such payments reasonable incidental and professional fees paid by a director.
There is no entitlement to annual bonus on termination of employment and leavers during the calendar year, for whatever reason, are not eligible. Leavers departing after the year-end, but before completion of the audit, will be paid the actual bonus earned on the normal bonus payment date. Leavers are not eligible for bonus payments if they are in breach of any obligations of their contract of employment, including the period of notice. The Committee may, where the individual is, in the Committee discretion, considered a good leaver, pay a time pro-rated bonus.
On termination of employment, outstanding share awards will be treated in accordance with the relevant plan rules:
LTiP: The default treatment under the LTiP is that subject to the Committee's discretion, after a participant's termination of employment with the Company, for any reason other than for Cause, all unvested time-based awards will immediately lapse or be forfeited and all vested unexercised options and stock appreciation rights (SARs) will lapse on the first anniversary of the date of termination. In the case of termination of the participant's employment for Cause, all time based awards will immediately lapse or be forfeited as at the date of termination and all unexercised options will immediately lapse or be forfeited as at the date of termination. If employment of a participant is terminated for any reason, other than for Cause, performance-based awards will vest pro-rata based on the performance results to the date of
91
termination and the elapsed portion of the performance period. In case of termination of employment for Cause, all unvested performance-based awards will lapse as of the date of termination.
IPO Options: The default treatment under the IPO standalone option grants for both Executive and Non-Executive Directors is that subject to the relevant Committees' discretion, after a participants termination of employment for any reason other than for Cause, the unvested portion of the option will immediately lapse and the vested unexercised portion of the options will lapse on the first anniversary of the date of termination unless exercised beforehand. If a participant's employment is terminated for Cause, all unexercised options will immediately lapse.
The definition of Cause for both the IPO standalone options and the LTiP is as defined in the participants' service contract or, if not so defined, would be conduct that would constitute grounds for summary dismissal.
The Committee has the discretion to accelerate vesting and exercise dates, waive conditions to vesting or exercise or extend exercise period after termination of employment. The Committee may exercise their discretion to allow accelerated vesting or extended exercise periods, which discretion it may exercise in such circumstances as long serving directors retiring before the last vesting date or leave employment through ill health or redundancy.
Illustration of the Application of the Remuneration Policy
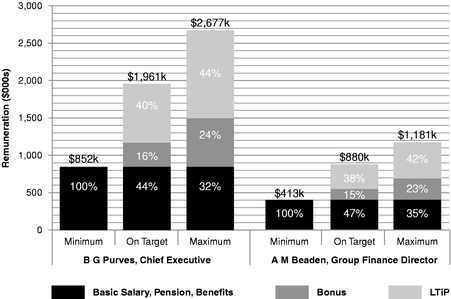
Notes
- 1.
- The base salary of the executive directors used is the 2014 confirmed salary which has been converted at the average USD rate for the year ended 31 December, 2013 of $1.5663:£
- 2.
- The value of the benefits and pensions for 2014 is the same value as used for the benefits and pensions in the 2013 single figure table.
- 3.
- The Remuneration Committee set bonus targets early in 2014. Annual cash bonus is earned only when company performance exceeds a threshold level. 'On plan' bonus is generally set to be half the potential and is paid for achievement of the annual budget. Maximum bonus is earned for hitting a stretch target considerably above the board-approved budget, and represents exceptional performance. The illustration of maximum bonus does not include the APB as it was not part of the 2014 bonus.
92
- 4.
- The LTiP is entirely performance-based, with targets being set by the Committee for each of 2014, 2015 and 2016. Within each year, there is a threshold level, an 'on plan'; level, and a stretch level. Performance below the threshold each year would mean no LTiP award would vest. Hitting the plan targets in each year would result in vesting awards at 100% of the value of that year. Each subsequent year's target represents a material improvement on the prior-year target. Reaching stretch targets in each of the three years, which would mean that the Company had considerably out-performed the board's expectations, would result in a maximum vesting, at 150% of the value anticipated when awarded. The availability of the LTiP is spread evenly over the three year vesting period, and if any target is missed, the associated award lapses. The maximum award shown in the above chart as 2014 remuneration is therefore actually only determined and earned over the three-year period 2014-2016.
Consideration of Conditions Elsewhere in the Group
While the major influence in setting the executive directors' pay and benefits is benchmarking of comparable companies, consideration is given to pay and benefits throughout the Group, so that there is a clear structure of pay and benefits layer by layer. Benchmarking studies commissioned by the Committee normally include other senior executive positions. When undertaking annual reviews of basic salary, the general level of cost-of-living increases throughout the Group is taken into account.
The Committee has commissioned two external benchmarking reports within the last fifteen months, one using a database of UK-based comparable companies, and one using a database of US-based comparables.
The Committee does not consult with employees when drawing up the Directors' Remuneration Policy. No internal comparison metrics were used, but the Committee is aware of average pay and benefits packages within the Group.
Shareholders' Views
In formulating the terms of the 2014 LTiP awards to Executive Directors, the Committee took into consideration the views expressed by the institutional shareholder bodies at the time of the 2013 Annual General Meeting concerning the grant of awards to the Executive Directors, some of which were time-based and market value awards, not performance based, and without holding periods.
Remuneration Implementation Report
2013 Annual Report on Remuneration will be subject to advisory vote by the shareholders at
the 2014 AGM
This section of the report has been compiled in accordance withThe Large and Medium-sized Companies and Groups (Accounts and Reports) (Amendment) Regulations 2013). As required by the Regulations, the report will be proposed for an advisory vote at the 2014 AGM.
The members of the Remuneration Committee during the Year did not change and were:
Peter Haslehurst, Non-Executive Director and Chairman (Chair)
Joseph Bonn, Non-Executive Director
Kevin Flannery, Non-Executive Director
The Company Secretary acts as secretary to the Committee and Brian Purves and Andrew Beaden attend all the meetings other than when their own remuneration is being discussed.
Responsibilities
The Remuneration Committee is responsible for determining and agreeing with the Board the framework on executive remuneration and its costs.
93
The Committee operates to written terms of reference under which its main duties are to:
- •
- Determine a remuneration policy taking into account such factors as it deems necessary;
- •
- Approve the design of and determine targets for any performance-related pay schemes for the Executive Directors, which in turn provide the framework for related pay schemes around the Group. They also determine whether or not such targets have been met;
- •
- Review the on-going appropriateness and relevance of the remuneration policy, having regard to market comparisons and practices, and ensure that the policy facilitates the employment of senior executives and managers. To the extent necessary, commission surveys and reports to establish relevant market practices and positions;
- •
- Determine Executive Director pay and packages and on appointment only, specific remuneration packages for the divisional heads;
- •
- Determine fair compensation packages for Executive Directors on early termination of their contracts;
- •
- Review the design of and monitor any Company share schemes and determine grants of awards and other issues under any Company share option plan and any related performance criteria.
Meetings are held at least twice a year to consider the remuneration packages for the year ahead and to consider remuneration reporting requirements as a minimum.
During 2013, the Committee met on four occasions to:
- •
- Consider whether and to what extent the Executive Directors' bonus targets for 2012 had been met;
- •
- Determine and approve the Executive Directors' annual bonus targets for 2013;
- •
- Perform their annual review of the Executive Directors' salaries and packages in January;
- •
- Grant annual awards under the LTiP;
- •
- Consider new legislation on Directors' remuneration and discuss terms of the proposed Remuneration Policy.
Advisors to the Committee
The Committee has access to independent advice when is considers it requires such advice. The Committee appointed Mercer Limited in 2012 to provide comparative data on salaries and the variable elements of remuneration packages paid by a range of comparative US listed and FTSE 250 companies in preparation for ensuring that the remuneration packages for the directors were appropriate, bearing in mind their increased responsibilities brought about by the 2012 IPO on the NYSE. The comparative data was updated in early 2013 by Mercer and used by the Committee to restructure and re-position the remuneration of executives during the year. The cost of advice during 2013 was $28,977. The Committee is satisfied that Mercer provides independent objective advice as the human capital business of the Group provide no other services to the group. However, Mercer do provide pension administration and actuarial services to the trustees of the UK defined benefit pension scheme through another division of their group, and insurance broking and consultancy through Marsh, another member of their group. The Chief Executive Officer Brian Purves provides information and his views on executive remuneration packages for the Executive Directors which the Committee take into consideration in the course of their deliberations.
Remuneration Received by the Directors for the Year Ended 31 December, 2013
Single Figure
The new disclosure regulations for directors requires the Company to provide in tabular form a single total figure of remuneration for each director, broken down by each distinct component of remuneration and
94
compared to prior year. For clarity we have set out separate tables for the Executive and Non-Executive Directors.
Executive Directors Remuneration
| | Salary $ | Taxable Benefits $(1) | Annual Bonus $ | Long Term Incentive Awards $(2)&(3) | Pensions $ | Total $ | |||||||||||||||||||||||||||||||
|---|---|---|---|---|---|---|---|---|---|---|---|---|---|---|---|---|---|---|---|---|---|---|---|---|---|---|---|---|---|---|---|---|---|---|---|---|---|
| | 2013 | 2012 | 2013 | 2012 | 2013 | 2012 | 2013 | 2012 | 2013 | 2012 | 2013 | 2012 | |||||||||||||||||||||||||
Brian Purves | 592,061 | 501,701 | 30,292 | 28,444 | 0 | 379,129 | 198,070 | 0 | 164,653 | 141,604 | 985,076 | 1,050,878 | |||||||||||||||||||||||||
Andrew Beaden | 305,428 | 258,820 | 23,314 | 21,140 | 0 | 132,451 | 81,019 | 0 | 62,860 | 49,895 | 472,621 | 462,306 | |||||||||||||||||||||||||
Notes to the Executive Director single figure table:
- (1)
- Benefits for Brian Purves comprised car allowance, medical and dental insurance cover. Benefits for Andrew Beaden comprised car allowance and medical insurance cover.
- (2)
- Annual Bonus—For the 2013 financial year, the annual cash bonus was based on the achievement of two financial targets, management trading profit and pre-interest cash measured against the annual budget and a non-financial objective. The table below summarises the bonus potential for each of the Executive Directors for 2013.
Director | Maximum annual bonus (% of salary) | Trading profit | Pre-interest cash flow | Non-financial objective | ||||||||||
|---|---|---|---|---|---|---|---|---|---|---|---|---|---|---|
Brian Purves | 100 | % | 66.7 | % | 16.7 | % | 16.6 | % | ||||||
Andrew Beaden | 80 | % | 53.3 | % | 13.4 | % | 13.3 | % | ||||||
The performance of the Company during the year included trading profit of $59.2 million (a 13.6% reduction on the previous year) and a pre-interest cash flow of $22.7 million (a 62% reduction on last year).
In the light of the above performance, the Committee concluded that no bonus is payable to either Brian Purves or Andrew Beaden. The Board has considered whether to include targets which applied to the bonus arrangements for the Executive Directors in 2013 and which will apply for 2014 but determined that these figures are commercially sensitive. It is the Committee's intention to include the 2013 targets in a future remuneration report, once the figures are no longer commercially sensitive. Personal objectives for Brian Purves and Andrew Beaden broadly cover driving growth and implementing major projects.
- (3)
- The Long-term Incentive
2012 single figure: Standalone market value options were granted over ADS at the IPO on 2 October 2012 40% of which vested on grant and 20% of which vest or vested on each of the three successive anniversaries of grant. The ADS price on grant was $10 producing a nil value for 2012 after the deduction of the $10 exercise price.
2013 single figure: A combination of market value, nominal cost time-based and performance options were granted to both Brian Purves and Andrew Beaden during 2013. The price of each ADS at the date of grant was $12.91.
As the exercise price of the 22,100 market value options granted to Brian Purves and the 9,100 market value options granted to Andrew Beaden was the equivalent figure of $12.91 there is no value ascribed in the single figure for these options.
Time based options were granted with an exercise price of $0.79 each ADS (using an exchange rate for the date of grant of $1.5855:£). Included in the single figure for Brian Purves is the sum of $95,748 being the value of the 7,900 options over ADS at the date of grant at an ADS price of $12.91 less the exercise price of each ADS. The sum included for the 3,200 time based options granted to Andrew Beaden based on the same calculation is $38,784. Under the plan an additional 179 ADS will accrue to Brian Purves and an additional 72 ADS to Andrew Beaden. As they are not credited under the plan until the options are exercised, no value has been ascribed to them in the single figure.
Brian Purves was granted performance based options over 31,500 ADS and Andrew Beaden 13,000 such options. The first TSR target which was Company TSR attaining the median or above of the comparator group measured over a 15 months
95
period from the date of the IPO to the measurement date 31 December, 2013 was confirmed met in February 2014 as at the measurement date leading to the vesting of one-sixth of the options. 5,250 of the performance options of Brian Purves vested. The sum of $102,322 has been included in the single figure for Brian Purves based on the ADS price at the date of vesting of $20.30 and after deducting the exercise price for each option of $0.81 (using an exchange rate of 1.6295:£ for the date of vesting). 2,167 of the performance options of Andrew Beaden vested and using the same calculation a sum of $42,235 has been included in the single figure for him. Under the terms of the LTiP at vesting Brian Purves has been credited with an additional 722 ADS and Andrew Beaden an additional 297 ADS representing dividends earned on the ADS since the grant. One sixth of these dividends also vest but they are not credited under the LTiP until the options are exercised so no value has been ascribed to them in the single figure.
Non-Executive Directors' Fees
| | Fees $ | Fees in the form of share awards under the Non-Executive Director Equity Awards(3) $ | Total $ | ||||||||||||||||
|---|---|---|---|---|---|---|---|---|---|---|---|---|---|---|---|---|---|---|---|
| | 2013 | 2012 | 2013 | 2012 | 2013 | 2012 | |||||||||||||
Peter Haslehurst(1) | 156,630 | (1) | 143,343 | 73,978 | — | 230,608 | 143,343 | ||||||||||||
Joseph Bonn(2) | 75,200 | 72,818 | 35,825 | — | 111,025 | 72,818 | |||||||||||||
Kevin Flannery(2) | 75,200 | 72,818 | 35,825 | — | 111,025 | 72,818 | |||||||||||||
David Landless | 62,667 | — | 28,547 | — | 91,214 | — | |||||||||||||
Notes to Non-Executive Directors Single Figure Table:
- (1)
- The chairman's fees are converted at the average USD rate of 1.5663:£ for 2013 and at an average of USD$1.5927:£ for 2012
- (2)
- The fees of the Non-Executive Directors are determined in USD. The single figure amount for David Landless in 2013 was for ten months as he joined the Board on 1 March 2013. His fees are determined in USD and received by him in sterling.
- (3)
- Non-Executive Directors Equity Awards:
2012 single figure: Standalone market value options were granted to Peter Haslehurst, Joseph Bonn and Kevin Flannery over ADS at the IPO on 2 October 2012 40% of which vested on grant and 20% of which vest or vested on each of the three successive anniversaries of grant. The ADS price on grant was $10 producing a nil value for 2012 after the deduction of the $10 exercise price.
2013 single figure: The single figure for the Chairman is calculated in respect of the 4,700 time based restricted stock units awarded to him during the year. They vest immediately before the 2014 AGM. The price of each ADS on the date of grant was $16.52. The issue price of each ADS converted into US dollars at the grant date exchange rate of $1.5598 was $0.78 which has been deducted from the price of each share. Joseph Bonn and Kevin Flannery were also each awarded 2,276 restricted stock units on the same date and the sum in the single figure for them is calculated on the same basis. David Landless was awarded time based restricted stock ADS to the value of $30,000 vesting in equal tranches on the anniversary of the date of grant in the following three years. He paid in sterling as an issue price the nominal value of the underlying ordinary shares in aggregate $1,453 which was deducted from the single figure shown above.
96
Awards Granted Under the Long-Term Umbrella Incentive Scheme (LTiP) During the Year—Grant Date 31 January, 2013
Executive | Basis of Aggregate Awards Granted | Share Price at Date of Grant $ | Type of Award | Number of Shares Over Which Award Granted | Face Value of Award $ | Exercise Price of Award Each ADS(1) & in Aggregate $ | Vesting | % of Face Value That Would Vest | Expiry Date of Option Once Vested | Vesting determined by performance over | ||||||||||||||
|---|---|---|---|---|---|---|---|---|---|---|---|---|---|---|---|---|---|---|---|---|---|---|---|---|
| Brian Purves | 63% of base salary | $ | 12.91 | Performance nominal cost options | 31,500 | $ | 406,665 | $0.79 each ADS Aggregate $24,885 | EPS: 1/6 vest on achievement of each of three adjusted EPS targets for the first time measured at 31 Dec and | At threshold performance: | 30 Jan, 2020 | |||||||||||||
| TSR: 1/6th vest on in each of 3 performance years if company TSR is at or above the TSR of comparator group on 31 Dec in each performance year | EPS 16.67% | 4 years for the EPS targets and 3 years with the ability to extend to four if unvested awards remain available after the third vesting date | ||||||||||||||||||||||
| TSR 16.67% | ||||||||||||||||||||||||
| Time based nominal cost options | 7,900 | $ | 101,989 | $0.79 each ADS Aggregate $6,241 | 1/3rd vest on each of 31 Jan 2014/2015 and 2016 | Each vesting date | 30 Jan 2018 | N/A | ||||||||||||||||
| 33.3% | ||||||||||||||||||||||||
| Market price nominal options | 22,100 | $ | 285,311 | $12.91 each ADS Aggregate $285,311 | 1/3rd vest on each of 31 Jan 2014/2015 and 2016 | Each vesting date | 30 Jan 2018 | N/A | ||||||||||||||||
| 33.3% | ||||||||||||||||||||||||
Andrew Beaden | 50% base salary | $ | 12.91 | Performance nominal cost options | 13,000 | $ | 167,830 | $0.79 each ADS Aggregate $10,270 | EPS: 1/6 vest on achievement of each of three adjusted EPS targets for the first time measured at 31 Dec and TSR: 1/6th vest on in each of 3 performance years if company TSR is at or above the TSR of comparator group on 31 Dec in each performance year | At threshold performance: | 30 Jan 2020 | 4 years for the EPS targets and 3 years with the ability to extend to four if unvested awards remain available after the third vesting date | ||||||||||||
| EPS 16.67% | ||||||||||||||||||||||||
| TSR 16.67% | ||||||||||||||||||||||||
| Time based nominal cost options | 3,200 | $ | 41,312 | $0.79 each ADS Aggregate $2,528 | 1/3rd vest on each of 31 Jan 2014/2015 and 2016 | Each vesting date | 30 Jan 2018 | N/A | ||||||||||||||||
| 33.3% | ||||||||||||||||||||||||
| Market price nominal options | 9,100 | $ | 117,481 | $12.91 each ADS Aggregate $117,481 | 1/3rd vest on each of 31 Jan 2014/2015 and 2016 | Each vesting date | 30 Jan 2018 | N/A | ||||||||||||||||
| 33.3% | ||||||||||||||||||||||||
- (1)
- The exercise price is £0.50 each ADS. The exercise price is converted into USD at the rate of USD $1.6487:£1 for 31 January 2013, the date of grant.
- (2)
- The Performance awards comparator group consists of Hexcel Corp., Globe Speciality Metals Inc., RTI International Metals Inc. Haynes International Inc., Ametek Inc., Chart Industries Inc., Worthington Industries Inc., Curtis-Wright Corp., Mine Safety Appliances Co., Dynamic Materials Inc., Barnes Group Inc. and Trimas Corporation. If more than 4 companies are removed from the group for bankruptcy or takeover the Remuneration Committee will identify replacement companies.
97
Awards Granted Under the Director Equity Incentive Plan (EIP) to Non-Executive Directors During 2013
Chairman/Non-Executive Director | Date of Grant | Basis of Aggregate Awards Granted | Share Price at Date of Grant | Type of Award | Number of Shares Over Which Award Granted | Face Value of Award $ | Issue Price per ADS & in Aggregate $ | Vesting Date | % of Face Value That Would Vest | Vesting determined by performance over | |||||||||||||||
|---|---|---|---|---|---|---|---|---|---|---|---|---|---|---|---|---|---|---|---|---|---|---|---|---|---|
Peter Haslehurst | 11 Jun '13 | 50% of annual fee for 2013 | 16.52 | Restricted Stock Unit | 4,700 | 77,644 | 0.78 each ADS Aggregate 3,666 | Day before 2014 AGM | On vesting date 100 | % | N/A | ||||||||||||||
Joseph Bonn | 11 Jun '13 | 50% of annual fee for 2013 | 16.52 | Restricted Stock Unit | 2,276 | 37,600 | 0.78 each ADS Aggregate 1,775 | Day before 2014 AGM | On vesting date 100 | % | N?A | ||||||||||||||
Kevin Flannery | 11 Jun '13 | 50% of annual fee for 2013 | 16.52 | Restricted Stock Unit | 2,276 | 37,600 | 0.78 each ADS Aggregate 1,775 | Day before 2014 AGM | On vesting date 100 | % | N/A | ||||||||||||||
David Landless | 15 Mar '13 | $30,000 in value | 15.59 | Restricted Stock | 1,924 | 30,000 | 0.75 each ADS Aggregate 1,453 | 1/3 on each of 15 March 2014/2015/2016 | Each vesting date 33.3 | % | N/A | ||||||||||||||
The issue price of £0.50 each ADS for Peter Haslehurst, Joseph Bonn and Kevin Flannery has been converted at the USD rate for 11 June 2013, the date of grant, of $1.5589 : £1.
The issue price of £0.50 each ADS for David Landless has been converted at the USD rate for the 15 March 2013, the date of grant, of $1,5106 : £1.
98
Outstanding Scheme Interest Awards During 2013
IPO Option Awards (Executive and Non-Executive Directors)
As part of the IPO in October 2012, stand-alone option grants were made over our ADSs to the Executive Directors, Non-Executive Directors and certain other key executives seen as critical to our future success on completion of the IPO.
Value of options granted: The options were granted at the IPO price. To determine the number of IPO Options to be granted, the IPO Options were valued at one-third of the IPO price of the ADSs. The IPO Options granted were valued at: (i) 120% of base salary to Brian Purves; (ii) an average 93% of base salary to the Group Finance Director, Andrew Beaden; and (iii) an average 93% of annual fee to our Non-Executive Directors Peter Haslehurst, Joseph Bonn and Kevin Flannery.
IPO Option Awards
Executive Directors | Grant Date | Exercised Price Each Option | No of Options 31 Dec '12 | Exercised During the Year | No of Options 31 Dec '13 | No of Options Vested on Grant(1) | No of Options Vested During Year(2) | Total No Vested Options(3) | No of Unvested Options(4) | Remaining Vesting Dates | Exercise Period | ||||||||||||||||||||
|---|---|---|---|---|---|---|---|---|---|---|---|---|---|---|---|---|---|---|---|---|---|---|---|---|---|---|---|---|---|---|---|
Brian Purves | 2 Oct '12 | $ | 10 | 179,200 | 0 | 179,200 | 71,680 | 35,840 | 107,520 | 71,680 | 2/10/2015 | Grant date to | |||||||||||||||||||
| 2/10/2016 | 1 Oct '19 | ||||||||||||||||||||||||||||||
Andrew Beaden | 2 Oct '12 | $ | 10 | 69,000 | 0 | 69,000 | 27,600 | 13,800 | 41,400 | 27,600 | 2/10/2015 | Grant date to | |||||||||||||||||||
| �� | 2/10/2016 | 1 Oct '19 | |||||||||||||||||||||||||||||
Non-Executive Directors | |||||||||||||||||||||||||||||||
Peter Haslehurst | 2 Oct '12 | $ | 10 | 40,400 | 0 | 40,400 | 16,160 | 8,080 | 24,240 | 16,160 | 2/10/2015 | Grant date to | |||||||||||||||||||
| 2/10/2016 | 1 Oct '19 | ||||||||||||||||||||||||||||||
Jospeh Bonn | 2 Oct '12 | $ | 10 | 20,000 | 0 | 20,000 | 8,000 | 4,000 | 12,000 | 8,000 | 2/10/2015 | Grant date to | |||||||||||||||||||
| 2/10/2016 | 1 Oct '19 | ||||||||||||||||||||||||||||||
Kevin Flannery | 2 Oct '12 | $ | 10 | 20,000 | 0 | 20,000 | 8,000 | 4,000 | 12,000 | 8,000 | 2/10/2015 | Grant date to | |||||||||||||||||||
| 2/10/2016 | 1 Oct '19 | ||||||||||||||||||||||||||||||
- (1)
- 40% of options vested on grant
- (2)
- 20% of options vested
- (3)
- 60% options are vested to date
- (4)
- 40% of the options remain to vest on each of the next two anniversaries of grant provided the director is still acting as a Non-Executive Director or if an Executive Director, he remains employed by the Company on each of the anniversary dates.
The Luxfer Group Employee Share Ownership Plan (ESOP) (Executive Directors only).
Executive Directors | Grant Date | Exercise Price each option $(1) | Number of Options 31 Dec '12 | Exercised during the year | Number of Options 31 Dec '13 | Number of options vested | Number of options vested during year | Total number vested options | Number of unvested options | Remaining vesting dates | Exercise period | ||||||||||||||||||||
|---|---|---|---|---|---|---|---|---|---|---|---|---|---|---|---|---|---|---|---|---|---|---|---|---|---|---|---|---|---|---|---|
Andrew Beaden | 3 Aug '11 | 3.31 | 59,020 | 0 | 59,020 | 59,020 | 0 | 59,020 | 0 | 0 | Grant date to 3 Aug '21 | ||||||||||||||||||||
- (1)
- The options under the ESOP as originally granted were granted over ordinary shares of £1 at an exercise price of £4 each option over ordinary shares. For comparative purposes the table has been prepared setting out the corresponding number of ADS that would result from an exercise of options over the ordinary shares at the rate of 2 ADS for each ordinary share. The exercise price for each ADS of £2 has been converted to USD at the 2013 year end USD rate of $1.6565 to £. The Trustees of the ESOP have converted the ordinary shares held by them to satisfy options under the ESOP to ADS. Participants will be required to reimburse the cost of conversion including stamp duty and issuance fees on exercise of their options.
Pension arrangements for the Executive Directors are reviewed annually to ensure that the benefits are consistent with market practice. The Group's contributory pension arrangements consist of both defined benefit and defined contribution arrangements. The pensions for the Executive Directors who were directors during the year were provided partly by the defined benefit and partly by registered defined contribution arrangements and an allocation to an unfunded unregistered retirement benefit scheme (UURBS) accrued by the Company.
The main features of the defined benefit arrangements are currently:
- •
- A normal retirement age of 65;
99
- •
- Accrual on a career average basis each year of 1.50% of pensionable earnings for a member contribution of 9.8% or 1.31% for a member contribution of 7.4%;
- •
- Pensionable earnings are limited to a scheme-specific earnings cap of £74,000 p.a. from 6 April 2013 (£72,000 p.a. for 2012/13);
- •
- A spouse's pension on death and a lump sum payment on death in service.
Directors' Remuneration and Benefits for the Year Ended 31 December 2013
| | 2013 | ||||||||||||
|---|---|---|---|---|---|---|---|---|---|---|---|---|---|
Executive Directors | Defined Benefit | Funded Defined Contribution | Unfunded Defined Contribution | Total | |||||||||
Brian Purves | — | — | $ | 164,653 | $ | 164,653 | |||||||
Andy Beaden | $ | 17,062 | $ | 45,798 | — | $ | 62,860 | ||||||
| | 2012 | ||||||||||||
|---|---|---|---|---|---|---|---|---|---|---|---|---|---|
Executive Directors | Defined Benefit | Funded Defined Contribution | Unfunded Defined Contribution | Total | |||||||||
Brian Purves | $ | 2,039 | $ | 4,507 | $ | 135,058 | $ | 141,604 | |||||
Andrew Beaden | $ | 15,840 | $ | 34,055 | — | $ | 49,895 | ||||||
- (1)
- The values of the increase in defined benefit pension in excess of inflation has been calculated on the basis set by legislation, less contributions paid by the Directors themselves.
Pension Benefits for the Years Ending 31 December, 2013 and 2012
Executive Directors | Accrued Pension at 31 December 2013 | Accrued Pension at 31 December 2012 | |||||
|---|---|---|---|---|---|---|---|
Brian Purves | $ | 55,670 p.a. | $ | 53,382 p.a. | |||
Andrew Beaden | $ | 33,484 p.a. | $ | 30,890 p.a. | |||
- (1)
- The accrued benefit is the total defined benefit pension which would be paid annually on retirement based on service to and salary at the end of the year. It includes the longevity adjustment factor that applies to benefits earned from 6 October 2007.
Implementation of the Remuneration Policy for the Year Ending 31 December, 2014
Set out below is a summary of how the Directors Remuneration Policy will be applied during the year ending 31 December, 2014.
Base Salary
| | 2014 $ | 2013 $ | % increase(2) | |||||||
|---|---|---|---|---|---|---|---|---|---|---|
Brian Purves(1) | 610,935 | 592,061 | 3 | % | ||||||
Andrew Beaden(1) | 321,132 | 305,425 | 5% | (3) | ||||||
- (1)
- The 2014 salary of Brian Purves and Andrew Beaden has been converted at the average USD rate for 2013 of $1.5663:£. Their 2013 salary has been converted at the average USD rate for 2013 of $1.5663:£.
- (2)
- The cost of living increases around the Group for employees were generally running at just ahead of inflation (2.5% to 3% in the UK) and the Committee determined to give the executive directors an increase consistent with increases around the Group.
100
- (3)
- In line with their determination in 2012, the Committee decided to give the Finance Director Andrew Beaden an above inflation increase to move his salary further toward the median of the relevant comparator group.
Pension Arrangements
Brian Purves will continue to receive an allocation or payment to an unregistered alternative savings arrangement based on contributions the Company would have made to the defined benefit and defined contribution schemes had he been a member of those pension schemes. Andrew Beaden will continue to participate on the Group UK defined benefit scheme up to the salary cap applied by the rules of the scheme and the Group UK defined contribution scheme.
Annual Bonus
In line with policy, the annual bonus for Brian Purves, as Chief Executive, will continue to be capped at 100% of base salary and for Andrew Beaden, as Group Finance Director, 80% of base salary. The Committee did not determine to add any additional percentage bonus for the year. The bonus targets are based on a combination of two financial performance targets, management trading profit and net cash flow pre-dividend and an additional specific non-financial target. The bonus is weighted 67% toward the achievement of the trading profit target which will be earned on a sliding scale for the achievement of threshold, target and stretch and the remaining 33% is split equally between the remaining single cash target and the non-financial objective. The Committee intends to disclose the financial performance targets and the non-financial objectives retrospectively in a future years' Remuneration Report provided they are no longer considered commercially sensitive.
Long Term Incentives
For 2014 the awards granted under the LTiP are performance awards only. For both Brian Purves and Andrew Beaden they consist of performance based nominal cost options and will vest in equal tranches over three years from the date of award, dependent on a specified Group earnings per share ('EPS') in each year comprising threshold, target and stretch. The awards must be held for a minimum of three years from the date of grant before sale (other than to fund the exercise price and tax liabilities on a vesting or exercise. Brian Purves has been awarded 42,000 options over ADS, valued at the date grant at 60% of his base salary and Andrew Beaden has been awarded 17,700 options over ADS, valued at the date of grant at 48% of his base salary. The awards provide the Committee has the discretion to (a) accelerate the vesting of the award in the case of a participant who retires and is determined by the Committee to be a long serving employee who has made a significant contribution to the Company and (b) waive the holding period for such participant.
Non-Executive Directors
Set out below is a summary of how the Directors Remuneration Policy for the Non-Executive Directors will be applied during the year ending 31 December, 2014.
The Board decide on the approach to compensating the Non-Executive directors.
Summary of how the Directors' Remuneration Policy for the Non-Executive Directors will be applied during the year ending December 31, 2014
| | 2014 | 2013 | % Increase | Value of Share(3) Awards % of Annual Fee 2014 | Value of Share Awards% of Annual award 2013 | |||||||||||
|---|---|---|---|---|---|---|---|---|---|---|---|---|---|---|---|---|
Chairman, Peter Haslehurst(1) | $ | 161,349 | $ | 156,630 | 3 | % | 50 | % | 50 | % | ||||||
Joseph Bonn | 77,500 | 75,200 | 3 | % | 50 | % | 50 | % | ||||||||
Kevin Flannery | 77,500 | 75,200 | 3 | % | 50 | % | 50 | % | ||||||||
David Landless(2) | 77,500 | 62,667 | 3 | % | 50%+50% of 2013 prorated fees | $ | 30,000 | (4) | ||||||||
- (1)
- Peter Haslehurst's fees are determined in sterling. His fees for 2013 were converted at the average rate USD for 2013 of $1.5663:£. His 2014 have been converted at the average USD rate for 2013 of $1.5663:£
101
- (2)
- The 2013 fees for David Landless were for a period of 10 months as he joined the Board on 1 March 2013. The % increase between 2013 and 2014 is calculated on the 12 months fees as if he had been appointed for the full year. As David Landless had been appointed less than 6 months on the 11 June 2013 when the 2013 awards under the Director Equity Incentive Plan (EIP) were made, the EIP provides he should receive awards valued at 50% of the fees paid to him for 2013 in addition to 50% in value of the fees to be paid during 2014.
- (3)
- The awards will vest the day before the 2015 AGM if the non-executive director is still a director of the Company.
- (4)
- David Landless was awarded a one off value award in the form of restricted stock of $30,000 and not a % of annual fee.
Payment to Past Directors and Payment for Loss of Office
No payments to past directors or payment for loss of office were made during the year.
Directors' Interests in Shareholdings in the Company
Executive Director | American Depository Shares (2x ADS=£1 ord.) Held at 1 January 2013 No. | American Depository Shares (2x ADS=£1 ord.) Held at 31 December 2013 No. | Deferred Shares of £0.0001 Each Held at 1 January 2013 No. | Deferred Shares £0.0001 Each Held at 31 December 2013 No. | |||||||||
|---|---|---|---|---|---|---|---|---|---|---|---|---|---|
Brian Purves(2) | 649,998 | (1) | 649,998 | 29,602,995,623 | 29,602,995,623 | ||||||||
Andrew Beaden(3) | 91,000 | (1) | 91,000 | 4,144,419,390 | 4,144,419,390 | ||||||||
Non-Executive Director | |||||||||||||
Peter Haslehurst(1) | 130,000 | (1) | 130,000 | 5,920,598,526 | 5,920,598,526 | ||||||||
Joseph Bonn | — | — | — | — | |||||||||
Kevin Flannery | 10,000 | 10,000 | — | — | |||||||||
David Landless | — | 1,924 | (4) | — | — | ||||||||
- (1)
- Brian Purves, Andrew Beaden and Peter Haslehurst hold their shares as ordinary shares not yet having converted them to ADS. For ease of comparison the table shows their interests as ADS
- (2)
- Includes Brian Purves' beneficial holding through the BG Purves Retirement Trust and shares held by his wife
- (3)
- Includes shares held by his wife
- (4)
- Comprises restricted stock ADS awarded to David Landless on appointment, which vest in equal thirds over three years commencing 15 March 2014.
Executive Director Shareholder Requirements
The Executive Directors are required to hold shares (ordinary shares or the equivalent in ADS) to the value of one hundred percent of base salary. This requirement was met by both Brian Purves and Andrew Beaden.
102
Total Directors Shareholdings and Interests 31 December 2013
Executive | Shares Owned Outright (2x ADS=£1 ord.) | Deferred Shares Owned Outright | Options Vested but not Exercised | Unvested Options Subject to Performance Criteria | Unvested Options | Restricted Stock Not Yet Vested | Restricted Stock Units Not Yet Vested (Assuming Will be Settled in Shares Not Cash) | |||||||||||||||
|---|---|---|---|---|---|---|---|---|---|---|---|---|---|---|---|---|---|---|---|---|---|---|
Brian Purves | 649,998 | 29,602,995,623 | 107,520 | 31,500 | 101,680 | — | — | |||||||||||||||
Andrew Beaden | 91,000 | 4,144,419,390 | 100,420 | 13,000 | 39,900 | — | — | |||||||||||||||
Non-Executive | — | — | ||||||||||||||||||||
Peter Haslehurst | 130,000 | 5,920,598,526 | 24,240 | — | 16,160 | — | 4,700 | |||||||||||||||
Joseph Bonn | — | — | 12,000 | — | 8,000 | — | 2,276 | |||||||||||||||
Kevin Flannery | 10,000 | — | 12,000 | — | 8,000 | — | 2,276 | |||||||||||||||
David Landless | — | — | — | — | 1,924 | — | ||||||||||||||||
Performance Graph
UK legislation requires the annual remuneration report to contain a line graph that shows the TSR over a five year period (in the first remuneration report prepared under the revised legislation) for both a holding of the Company's listed shares and a hypothetical comparator holding of shares representing a specified broad equity market index. As the Company's ADSs were only listed on the NYSE at the beginning of October 2012, we are only able to provide TSR for the Company's shares in a listed environment for a 15 month period. We have used the S&P Small Cap 600 (Industrial) index as the most appropriate to where we are placed as a small cap company in the US, and the industrials sub-sector includes most of our comparables. It is typical for shares to be offered at a discount to ensure a successful IPO. The performance of our shares over this period may have been enhanced by the unwinding of the IPO discount. See the chart below.
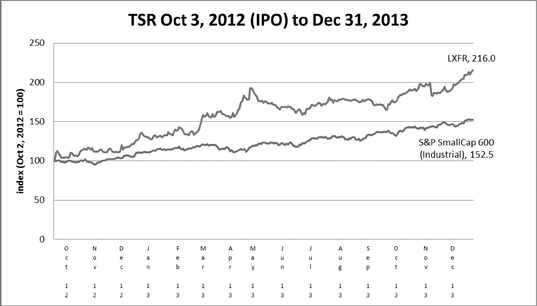
The TSR is calculated in US dollars
The table shows the value of $100 vested in Luxfer in October 2012 at the IPO compared to $100 invested in the S & P SmallCap 600 (Industrial) on the same date. The S & P Small Cap 600 (Industrial) was chosen as the index as it comprises companies that most closely resemble Luxfer.
We have included the total remuneration figure for the Chief Executive for a five year period as required by legislation despite the TSR graph only reflecting the TSR from the date of the IPO.
103
Total Remuneration Figure for CEO over a five year period
Year ended 31 December | 2009 | 2010 | 2011 | 2012(1) | 2013(2) | |||||||||||
|---|---|---|---|---|---|---|---|---|---|---|---|---|---|---|---|---|
Total remuneration | 807,862 | 897,421 | 998,638 | 1,050,878 | 985,076 | |||||||||||
Annual bonus % | 40 | % | 100 | % | 100 | % | 71 | % | 0 | % | ||||||
Share awards vesting % | N/A | N/A | N/A | 100 | % | 59 | % | |||||||||
- (1)
- The shares awards shown as vesting for 2012 are the time-based market value IPO standalone options that were granted at the IPO at an exercise price of $10, 40% of which vested immediately.
- (2)
- The share awards vesting comprised a further 20% of the IPO market value time based options vesting and 16.6% of the performance options granted under the LTiP in the year which vested at the beginning of February 2014 as a result of the determination of the Remuneration Committee the first TSR target measured as at 31 December 2013 had been attained. We have included the vesting in this chart as it relates to 2013. Other early 2014 time-based vestings are not included and will be included for 2014.
Relative Importance on Spend on Pay
The following chart sets out the groups actual spend on pay (for all employees) relative to dividends paid in the current and prior year.
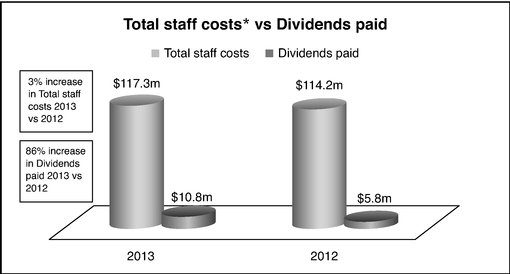
- *
- To assist with conformity and transparency we have used staff costs as set out in Note 6 to the Financial Statements.
Percentage Change in CEO's Remuneration
| | 2013 | 2012(2) | % change | |||||||
|---|---|---|---|---|---|---|---|---|---|---|
Salary | ||||||||||
Chief Executive | 592,061 | 493,385 | 20% | (3) | ||||||
UK employee average(1) | 48,772 | 47,254 | 3 | % | ||||||
Benefits | ||||||||||
Chief Executive | 30,292 | 27,973 | 7 | % | ||||||
UK employee average | 802 | 714 | 12 | % | ||||||
Annual Bonus | ||||||||||
Chief Executive | — | 347,836 | -100% | (4) | ||||||
UK employee average | 2,574 | 4,518 | -43 | % | ||||||
104
- (1)
- We have selected UK employees as the most appropriate comparator as the Chief Executive officer is based in the UK and the benefits structure is similar.
- (2)
- The 2012 amounts were adjusted for the impacted of translation and have been calculated using the 2013 Average Exchange rate.
- (3)
- The CEO's salary was increased by 20% in 2013 to reflect the increase in his responsibilities as a result of the Company being a listed Company for the first time pursuant to its IPO on the New York Stock Exchange.
- (4)
- There was no bonus payment made to the CEO during the year as his bonus targets were not met. Bonus was paid to certain UK employees whose targets were met.
Statement of voting at AGM
As the requirement to put the Remuneration Policy Report to a mandatory vote and the Annual Remuneration Report to an advisory vote was only introduced from the 30 September, 2012, the 2014 AGM is the first year a resolution will be put to shareholders concerning remuneration. At the time the IPO standalone grants and the LTiP were implemented, the Company was not required to obtain shareholder approval to implement them. Details of the plan rules and the standalone grants were included in the IPO prospectus and are filed with the US Security and Exchange Commission.
105
C. Board Practices
Board of Directors
The board of directors of Luxfer is currently composed of six Directors, including four Non-Executive directors, of which one is the Chairman. Under the Articles of Association, unless otherwise determined by an ordinary resolution of our shareholders (which is passed by a simple majority of those voting), there may not be less than two and not more than eight directors. A director need not be a shareholder. Under the terms of the Amended Articles, directors may be elected by an ordinary resolution of our shareholders and at least one-third of the directors must stand for re-election at every annual general meeting. Directors may be removed by a special resolution of our shareholders at any time before the expiration of their period of office.
Corporate Governance
The Directors support principles of corporate governance and have over the years adopted many principles from the corporate governance code in the U.K. in so far as they have considered it appropriate, relevant and practical for a company of Luxfer's status and size. As the Company has ADSs listed on the NYSE we are now subject to the rules of NYSE as well as the U.S. securities rules in so far as and to the extent they apply to a foreign private issuer. We explain below how we practice corporate governance.
The Board Members
The board of directors consists of six members, comprised of a Non-Executive Chairman, three Non-Executive Directors and two Executive Directors. The Chairman and the Executive Directors are shareholders. Under the Post-IPO Articles of Association, we are permitted to have up to eight directors. As discussed above, a sixth director, Mr. Landless, was appointed to the board of directors on March 1, 2013.
Brief biographical details of the Directors who served at the end of the 2013 are provided in Item 6.A, together with information on their other commitments. Our post-IPO Articles contain a provision requiring a third of the directors to retire by rotation each year.
Roles
The board of directors has responsibility for the overall leadership of the Company, its long-term success and helping to develop and approve its strategic aims. They have determined a schedule of matters reserved to the board of directors. Reserved matters are comprehensive and reviewed as the board of directors considers appropriate.
These reserved matters include:
- •
- approval of strategy and long term objectives, annual operating budget, major capital expenditure, significant contracts and acquisitions and disposals;
- •
- approval of financial statements, release of financial information and significant changes to accounting policies;
- •
- approval of certain statutory and compliance matters and approval of the dividend and any dividend policy;
- •
- Board and Committee membership and certain other senior appointments;
- •
- changes in structure and capital of the Company;
- •
- approval of treasury policies, borrowing facilities and funding;
- •
- maintenance and monitoring through the Audit Committee of internal controls and risk management;
- •
- approval of executive benefits such as pension plans, share options and share incentive plans.
106
The executive management board meets ten or eleven times a year. It is chaired by the Chief Executive. The executive management board consists of the Group Finance Director and senior management at Group and divisional level. The members of the executive management board during 2013 are listed in Item 6.A above. The executive management board provides a forum where matters of interest or concern to the Group can be reviewed and discussed, policies agreed and appropriate measures implemented. It also provides an opportunity for senior management to update themselves with progress in other parts of the Group outside their remit.
Division of responsibilities
As the number of directors is small and with only three Non-Executive Directors in 2013 in addition to the Chairman, the board of directors considers it inappropriate to appoint a senior independent director.
The division of responsibilities between the Chief Executive and the Chairman is clear and it has not been considered necessary to record it in writing:
- •
- The Chief Executive is responsible to the board of directors for the management and performance of the business within the frame-work of the matters reserved to the Board and for developing strategy and then implementing the strategy he has agreed with the board of directors.
- •
- The Chairman is responsible for the leadership of the board of directors and ensuring its effectiveness. He ensures that board of directors discussions are conducted taking into account all views, promoting openness and debate by facilitating the effective contribution of the Non-Executive Directors and ensuring no individual or group dominates the board of directors.
The Chairman maintains a dialogue with the Non-Executive Directors in the absence of the Executive Directors, where appropriate canvassing their opinion on issues. The Company does not have a standing Nomination Committee. The Directors have determined that it is more appropriate with a board of directors of six members that appointments are considered and agreed by the board of directors as a whole with any necessary research delegated to an outside body through a designated individual Director. The most recent appointments in the last two years have been dealt with in this way. If the Company were not a foreign private issuer under the NYSE listing rules it would be required to have such a committee under the NYSE listing rules.
The board of directors reviews succession planning for senior appointments in the Group annually.
Meetings
There are six main scheduled meetings of the board of directors each year and normally three or four additional scheduled telephone meetings timed to approve the release of financial information. Additional meetings are called as appropriate. The board of directors will normally meet at least twice a year at one of the Group's operational plants including overseas locations as part of their monitoring role and to ensure a better understanding of the Group's operations. At these meetings the Board has an opportunity to meet local and divisional management on both a formal and informal basis and discuss the progress of their operations with them.
In 2013 the board of directors held six main scheduled meetings and six additional telephone meetings. Of the six main meetings, three were held at our manufacturing plants located in Calgary in Canada, Graham in North Carolina in the United States and Swinton in the United Kingdom.
A Director was unable to attend a board meeting that took place in July. The remaining meetings were attended by all the Directors with no absentees.
107
Information and Support
The Company Secretary normally distributes board of directors and committee agendas and materials to the board of directors and committees seven days before a scheduled meeting.
There is a written procedure for decisions to be taken between scheduled board of directors and committee meetings that also deals with information distribution in such cases.
The Board receives both financial and operational information to assist it in discharging its duties. The Chief Executive and the Group Finance Director provide monthly reports to the board of directors which together cover all aspects of the business and which are then elaborated or commented upon at scheduled Board Meetings as appropriate. Additional topics for review and discussion are added in these reports from time to time at the request of the Directors. In addition specific items are scheduled into the board of directors agenda for report and review on a regular basis, such as health and safety and environmental matters and current topical issues.
There is a written procedure in place to cover circumstances when the Directors either individually or collectively determine that they require independent professional advice at the Company's expense.
The Company Secretary updates the board of directors on issues and changes of a legal and regulatory nature of which it and the individual Directors should be aware to refresh their skills and knowledge. There is a culture of information exchange on various matters of interest to the Group and its operations between Directors and senior managers to keep Directors abreast of relevant developments. In addition to meetings held at sites as described above, the Non-Executive Directors will independently visit operational sites to enlarge their knowledge of the individual businesses that make up the Group. The Executive Directors have regular business reviews at operational sites throughout the year and any appropriate information gathered on those visits will be reported to the board of directors.
We implemented an induction programme for our new Non-Executive Director David Landless appointed on 1 March 2013. The programme included presentations on the Group businesses and Group finance, site visits and an opportunity to meet senior management.
During the year the board of directors evaluated its information and support procedures to ensure they were appropriate.
Audit Committee
The members of our Audit Committee during 2013 were:
Peter Haslehurst, Non-Executive Director and Chairman (Chair)
Joseph Bonn, Non-Executive Director
Kevin Flannery, Non-Executive Director
David Landless, Non-Executive Director (appointed March 28, 2013)
The Company Secretary acts as secretary to the Audit Committee. The Finance Director and the Chief Executive attend as required.
The responsibility and duties of the Audit Committee are set out in written terms of reference which appear on the Company's website. The Audit Committee has the responsibility of overseeing our corporate accounting and financial reporting. Its duties include:
- •
- External Auditors: Engagement and retention of our independent auditors, pre-approval of audit and non-audit services, approving fees paid, monitoring independence and performance, discussing audit findings with auditors.
108
- •
- Financial Reporting—monitoring the integrity of the financial information to be included in all financial statements and announcements, reviewing and challenging critical accounting policies, how major elements of judgment are reflected in the financial statements, disclosures, significant adjustments and compliance with standards.
- •
- Internal Controls and Risk Management System—reviewing systems of internal control and risk management and adequacy of disclosure controls and procedures. Maintaining a record of complaints regarding accounting and audit matters.
- •
- Whistleblowing—establishment and monitoring of the Group whistleblowing policy and procedures.
- •
- Oversight of the Code of Ethics.
The Chairman Peter Haslehurst also chairs the Audit Committee. The board of directors considers that all the members have appropriate financial experience to enable them to contribute to the Audit Committee's work. Each of the members of the Audit Committee is an "independent director" as such term is defined in Rule 10A-3 under the Exchange Act. During the year the Audit Committee appointed a Financial Expert as defined in Item 407(d) of Regulation S-K. The Audit Committee has established a schedule of meetings to coincide with the key events in the Company's financial reporting and audit cycle. Agendas and appropriate papers are issued for each meeting. The Chairman speaks to the external auditors as he considers appropriate and necessary in preparation for meetings at which matters are discussed that have been audited by auditors or are relevant to them.
During the year the Committee met on eight occasions and among other matters:
- •
- Undertook a specific review of auditor's independence with the external auditors and the Company's management, which confirmed the independence of the auditors;
- •
- Reviewed the performance of the external auditors and lead audit partner with management;
- •
- Discussed matters pertaining to and approved work to be undertaken by the external auditors under the pre-approval policy for audit and non-audit work;
- •
- Reviewed with management the internal audit work, the system of internal controls and monitored progress of the implementation of the SOX 404 programme throughout the Group;
- •
- Reviewed the Company's annual SEC filing, statutory report and accounts and the quarterly financial releases made by the Company;
- •
- Discussed and reviewed the engagement of the external auditor, the external audit engagement letter and audit fees;
- •
- Undertook an evaluation of the work of the Audit Committee.
Nomination Committee
The Company constituted a standing Nomination Committee during the year. Members of the Committee consist of the Non-Executive Directors. The Chairman of the Board chairs the Committee. As the Committee was newly constituted there were no meetings of the Committee during 2013.
The Committee operates to written terms of reference under which its main duties are to:
- •
- Identify and review individuals qualified to become board members and fill vacancies;
- •
- Select and approve directors to stand for re-election pursuant to the retirement provisions under the articles;
- •
- Develop a process for annual evaluation of the Board and Committees;
- •
- Develop and recommend to the Board a succession plan, and review management's succession plan.
109
Relations with Shareholders
Members of the Board seek to develop an understanding of the views of shareholders of the Company in various ways, always taking into account the need to treat shareholders equally. Regular contact is also maintained with analysts, and their views and reports are circulated to the board of directors and discussed where appropriate. The Non-Executive Directors have also, on occasion, taken the opportunity to speak to major investors and make themselves available to do so if requested. The Chief Executive and the Group Finance Director hold quarterly investor conference calls as part of the Company's reporting cycle.
Documentation for the annual general meeting is normally sent out at least twenty working days before the meeting. Separate resolutions are proposed and proxy votes for the ordinary shares are recorded. Results for, against and withheld are posted to the Company's website. All Directors attend the annual general meeting. ADS holders will be given the opportunity through procedures agreed with the depository, the Bank of New York, to vote the number of ordinary shares that represent their holding of ADSs at the annual general meeting, provided they have submitted valid instructions to the depository by the date set by the depository for receiving such instructions.
D. Employees
The average number of employees by division, function and geography for the years ended December 31, 2013, 2012 and 2011 was as follows:
| | 2013 | 2012 | 2011 | |||||||
|---|---|---|---|---|---|---|---|---|---|---|
By Division: | ||||||||||
Elektron | 573 | 558 | 561 | |||||||
Gas Cylinders | 1,032 | 962 | 888 | |||||||
| | | | | | | | | | | |
Total | 1,605 | 1,520 | 1,449 | |||||||
| | | | | | | | | | | |
| | | | | | | | | | | |
By Function: | ||||||||||
Direct production and distribution | 1,363 | 1,284 | 1,209 | |||||||
Indirect: | ||||||||||
Sales and administration | 190 | 183 | 189 | |||||||
Research and development | 52 | 53 | 51 | |||||||
| | | | | | | | | | | |
Total | 1,605 | 1,520 | 1,449 | |||||||
| | | | | | | | | | | |
| | | | | | | | | | | |
By Geography: | ||||||||||
Europe | 860 | 819 | 804 | |||||||
North America | 720 | 675 | 619 | |||||||
Rest of the World | 25 | 26 | 26 | |||||||
| | | | | | | | | | | |
Total | 1,605 | 1,520 | 1,449 | |||||||
| | | | | | | | | | | |
| | | | | | | | | | | |
Employees at a number of our locations are members of various trade union organizations. We consider our employee relations to be good. In the last four years, we have experienced a few one to three day work stoppages in France and the United Kingdom, but do not consider any of these work stoppages to have been material to our operations. We also employed on average 191, 180 and 183 temporary contract and agency staff in 2013, 2012 and 2011, respectively. Our average total headcount, including employees and temporary contract and agency staff, was 1,796, 1,700 and 1,632 in 2013, 2012 and 2011, respectively.
110
E. Share Ownership
The following table shows the number of shares owned by our directors and members/designated members of our executive management as at December 31, 2013.
Name of Beneficial Owner | Ordinary Shares Beneficially Owned(1) | ADS equivalent | Awards over Ordinary Shares | ADS equivalent | Percentage ownership | |||||||||||
|---|---|---|---|---|---|---|---|---|---|---|---|---|---|---|---|---|
Peter Joseph Kinder Haslehurst | 65,000 | 130,000 | 22,550 | 45,100 | (9) | (* | ) | |||||||||
Brian Gordon Purves(2) | 324,999 | 649,998 | 120,350 | 240,700 | (10) | 3.3 | % | |||||||||
Andrew Michael Beaden(3) | 45,500 | 91,000 | 76,660 | 153,320 | (11) | (* | ) | |||||||||
Joseph Allison Bonn | — | — | 11,138 | 22,276 | (9) | (* | ) | |||||||||
Kevin Sean Flannery | 5,000 | 10,000 | 11,138 | 22,276 | (9) | (* | ) | |||||||||
David Farrington Landless | — | — | 962 | 1,924 | (12) | (* | ) | |||||||||
Christopher John Hillary Dagger(4) | 66,100 | 132,200 | 42,250 | 84,500 | (13) | (* | ) | |||||||||
Edward John Haughey(5) | 78,000 | 156,000 | 49,750 | 99,500 | (14) | (* | ) | |||||||||
John Stephen Rhodes(6) | 70,676 | 141,352 | 51,000 | 102,000 | (15) | 1.2 | % | |||||||||
Linda Frances Seddon(7) | 32,370 | 64,740 | 34,000 | 68,000 | (16) | (* | ) | |||||||||
David Terrence Rix(8) | 27,613 | 55,225 | 25,800 | 51,600 | (17) | (* | ) | |||||||||
Andrew John Butcher | 27,200 | 54,400 | 38,600 | 77,200 | (18) | (* | ) | |||||||||
- (*)
- Indicates beneficial ownership of less than one percent of our ordinary shares
- (1)
- Number of shares owned as shown both in this table and the accompanying footnotes and percentage of ownership is based upon 13,500,962 £1 ordinary shares (equivalent 27,001,924 ADSs) allocated as at December 31, 2013
- (2)
- Includes 206,608 ordinary shares (413,216 equivalent ADSs) held by Barnett Waddingham Capital Trustees Limited BG Purves Retirement Trust and 60,000 ordinary shares (120,000 equivalent ADSs) owned by Mr. Purves' spouse.
- (3)
- Includes 15,000 ordinary shares (30,000 equivalent ADSs) beneficially owned by Mr. Beaden's spouse.
- (4)
- Includes 44,007 ordinary shares (88,014 equivalent ADSs) held by B W SIPP Trustees Limited—A/C SIPP 4106 and 13,000 ordinary shares (26,000 equivalent ADSs) beneficially owned by Mr. Dagger's spouse.
- (5)
- Includes 30,000 ordinary shares (60,000 equivalent ADSs) beneficially owned by Mr. Haughey's spouse.
- (6)
- 70,676 ordinary shares (141,352 equivalent ADSs) shown for John Stephen Rhodes are jointly owned by Mr. Rhodes and his spouse.
- (7)
- Includes 7,500 ordinary shares (15,000 equivalent ADSs) beneficially owned by Mrs. Seddon's spouse. Since the year end Mrs. Seddon's spouse has sold 475 ordinary shares (equivalent to 950 ADSs).
- (8)
- Includes 20,000 ordinary shares (40,000 equivalent ADSs) beneficially owned by Mr. Rix's spouse.
- (9)
- 40,400 of the options (equivalent to 20,200 options over ordinary shares) granted to Mr Haslehurst, 20,000 of the options (equivalent to 10,000 options over ordinary shares) granted to Mr Bonn and 20,000 of the options (equivalent to 10,000 options over ordinary shares) granted to Mr Flannery are options to purchase the equivalent amount of ADS at an exercise price of $10 per ADS and were granted on October 2, 2012. The vesting conditions for these options are described under "Long Term Incentives—IPO Options" in Item 6.B. 4,700 of the awards (equivalent to 2,350 awards over ordinary shares) granted to Mr Haslehurst, 2,276 of the awards (equivalent to 1,138 awards over ordinary
111
shares) granted to Mr Bonn and 2,276 of the awards (equivalent to 1,138 awards over ordinary shares) granted to Mr Flannery are nominal cost restricted stock units with an issue price of £0.50 per ADS, their vesting dates are set out in Item 6.B.
- (10)
- Options granted to Mr. Purves are options to purchase the equivalent amount of ADSs. 179,200 of the options (equivalent to 89,600 options over ordinary shares) have an exercise price of $10 and were granted on October 2, 2012 and their vesting conditions are described under "Long Term Incentives—IPO Options" in Item 6.B. The remaining 61,500 options (equivalent to 30,750 options over ordinary shares) were granted on January 31, 2013 and their vesting conditions are described in Item 6.B under "Long Term Incentives—2013 Awards under the LTIP". Of such remaining options, 22,100 (equivalent to 11,050 options over ordinary shares) are market-value options with an exercise price of $12.91 per ADS, 7,900 (equivalent to 3,950 options over ordinary shares) are nominal cost time-based options with an exercise price of £0.50 per ADS and 31,500 (equivalent to 15,750 options over ordinary shares) are performance-based options with an exercise price of £0.50 per ADS.
- (11)
- 94,300 of the options (equivalent to 47,150 options over ordinary shares) granted to Mr. Beaden are options to purchase the equivalent amount of ADSs. 69,000 of the options over ADSs (equivalent to 34,500 options over ordinary shares) have an exercise price of $10 and were granted on October 2, 2012. Their vesting conditions are described under "Long Term Incentives—IPO Options" in Item 6.B. The remaining options to purchase ADSs were granted on January 31, 2013 and their vesting conditions are described in Item 6.B under "Long Term Incentives—2013 Awards under the LTIP". Of such remaining options to purchase ADSs, 9,100 (equivalent to 4,550 options over ordinary shares) are market-value options with an exercise price of $12.91 per ADS, 3,200 (equivalent to 1,600 options over ordinary shares) are nominal cost time-based options with an exercise price of £0.50 per ADS and 13,000 (equivalent to 6,500 options over ordinary shares) are performance-based options with an exercise price of £0.50 per ADS. The remaining options are options to purchase 29,510 £1 ordinary shares (equivalent to 59,020 ADSs) that have vested at an exercise price of £4.00 per ordinary share (equivalent to £2.00 per ADS).
- (12)
- Mr. Landless was awarded an amount of restricted stock equivalent to $30,000 in ADSs on March 15, 2013 in respect of his appointment as a Non-Executive director pursuant to the provisions the Non-Executive Director Equity Incentive Plan described in Item 6.B. The restricted stock was issued on payment by Mr. Landless of the nominal value of the underlying shares of £1 each shares. A third of the restricted stock vests on each of the first three anniversaries of the grant date.
- (13)
- Options granted to Mr. Dagger are options to purchase the equivalent amount of ADSs. 77,000 of the options (equivalent to 38,500 options over ordinary shares) have an exercise price of $10 and were granted on October 2, 2012 and their vesting conditions are described under "Long Term Incentives—IPO Options" in Item 6.B. The remaining 7,500 options (equivalent to 3,750 options over ordinary shares) were granted on January 31, 2013. 2,700 (equivalent to 1,350 options over ordinary shares) are market-value options with an exercise price of $12.91 per ADS vesting on January 31, 2014, 1,000 (equivalent to 500 options over ordinary shares) are nominal cost time-based options with an exercise price of £0.50 per ADS vesting on January, 31 2014 and 3,800 (equivalent to 1,900 options over ordinary shares) are performance-based options with an exercise price of £0.50 per ADS. The vesting conditions for the performance options are the same as described in Item 6.B under "Long Term Incentives—2013 Awards under the LTIP" except that they are scaled down to 12 months.
- (14)
- Options granted to Mr. Haughey are options to purchase the equivalent amount of ADSs. 77,000 of the options (equivalent to 38,500 options over ordinary shares) have an exercise price of $10 and were granted on October 2, 2012 and their vesting conditions are described under "Long Term Incentives—IPO Options" in Item 6.B. The remaining 22,500 options (equivalent to 11,250 options over ordinary shares) were granted on January 31, 2013 and their vesting conditions are described in Item 6.B under "Long Term Incentives—2013 Awards under the LTIP". 8,100 (equivalent to 4,050 options over ordinary shares) are market-value options with an exercise price of $12.91 per ADS, 2,900 (equivalent
112
to 1,450 options over ordinary shares) are nominal cost time-based options with an exercise price of £0.50 per ADS and 11,500 (equivalent to 5,750 options over ordinary shares) are performance-based options with an exercise price of £0.50 per ADS.
- (15)
- Options granted to Mr. Rhodes are options to purchase the equivalent amount of ADSs. 77,000 of the options (equivalent to 38,500 options over ordinary shares) have an exercise price of $10 and were granted on October 2, 2012 and their vesting conditions are described under "Long Term Incentives—IPO Options" in Item 6.B. The remaining 25,000 options (equivalent to 12,500 options over ordinary shares) were granted on January 31, 2013 and their vesting conditions are described in Item 6.B under "Long Term Incentives—2013 Awards under the LTIP". 9,000 (equivalent to 4,500 options over ordinary shares) are market-value options with an exercise price of $12.91 per ADS, 3,200 (equivalent to 1,600 options over ordinary shares) are nominal cost time-based options with an exercise price of £0.50 per ADS and 12,800 (equivalent to 6,400 options over ordinary shares) are performance-based options with an exercise price of £0.50 per ADS.
- (16)
- Options granted to Mrs. Seddon are options to purchase the equivalent amount of ADSs. 51,000 of the options (equivalent to 25,500 options over ordinary shares) have an exercise price of $10 and were granted on October 2, 2012 and their vesting conditions are described under "Long Term Incentives—IPO Options" in Item 6.B. The remaining 17,000 options (equivalent to 8,500 options over ordinary shares) were granted on January 31, 2013 and their vesting conditions are described on in Item 6.B under "Long Term Incentives—2013 Awards under the LTIP". 6,100 (equivalent to 3,050 options over ordinary shares) are market-value options with an exercise price of $12.91 per ADS, 2,200 (equivalent to 1,100 options over ordinary shares) are nominal cost time-based options with an exercise price of £0.50 per ADS and 8,700 (equivalent to 4,350 options over ordinary shares) are performance-based options with an exercise price of £0.50 per ADS.
- (17)
- Options granted to Mr. Rix are options to purchase the equivalent amount of ADSs. 36,600 of the options (equivalent to 18,300 options over ordinary shares) have an exercise price of $10 and were granted on October 2, 2012 and their vesting conditions are described under "Long Term Incentives—IPO Options" in Item 6.B. The remaining 15,000 options (equivalent to 7,500 options over ordinary shares) were granted on January 31, 2013 and their vesting conditions are described in Item 6.B under "Long Term Incentives—2013 Awards under the LTIP". 5,000 (equivalent to 2,500 options over ordinary shares) are nominal cost time-based options with an exercise price of £0.50 per ADS and 10,000 (equivalent to 5,000 options over ordinary shares) are performance-based options with an exercise price of £0.50 per ADS.
- (18)
- 51,600 of the options (equivalent to 25,800 options over ordinary shares) granted to Mr. Butcher are options to purchase the equivalent amount of ADSs. 36,600 of the options (equivalent to 18,300 options over ordinary shares) have an exercise price of $10 and were granted on October 2, 2012 and their vesting conditions are described under "Long Term Incentives—IPO Options" in Item 6.B. The remaining 15,000 awards over ADSs (equivalent to 7,500 awards over ordinary shares) were granted on January 31, 2013 and their vesting conditions are described in Item 6.B under "Long Term Incentives—2013 Awards under the LTIP". Together with accumulated dividend shares, as at February 28, 2014, Mr. Butcher had 15,341 awards over ADSs (equivalent to 7,670 awards over ordinary shares). 5,113 (equivalent to 2,557 options over ordinary shares) are nominal cost restricted stock units with an issue price of £0.50 per ADS, of which 1,704 (equivalent to 852 options over ordinary shares) vested on January 31, 2014. 10,228 (equivalent to 5,114 options over ordinary shares) are nominal cost performance restricted stock units with an issue price of £0.50 each ADS, of which 1,704 vested on January 31, 2014. The remaining options are options to purchase 12,800 £1 ordinary shares (equivalent to 25,600 ADSs) that have an exercise price of £0.97 per ordinary share (equivalent to £0.49 per ADS).
113
A. Major Shareholders.
The following table shows our major shareholders (shareholders that are beneficial owners of 5% or more of the Companies voting shares) as at December 31, 2013, based on notifications made to the Company or public filings:
Shareholder | Number of Ordinary Shares Beneficially Owned | Equivalent ADS Beneficially Owned | Percent(8) | |||||||
|---|---|---|---|---|---|---|---|---|---|---|
Stonehill Group(1) | 1,586,941 | 3,173,882 | 11.8 | % | ||||||
T. Rowe Price Associates, Inc.(2) | 1,431,215 | 2,862,430 | 10.6 | % | ||||||
GMT Capital Group(3) | 1,213,184 | 2,426,367 | 9.0 | % | ||||||
Wellington Management Company, LLP(4) | 1,104,260 | 2,208,520 | 8.2 | % | ||||||
Cetus Group(5) | 978,797 | 1,957,594 | 7.2 | % | ||||||
Canton Group(6). | 928,400 | 1,856,800 | 6.9 | % | ||||||
Barclays Group(7). | 793,545 | 1,587,090 | 5.9 | % | ||||||
- (1)
- This information is based on the Schedule 13G jointly filed on February 13, 2014 by Stonehill Capital Management LLC ("SCM"), a Delaware limited liability company, Stonehill Master Fund Ltd. ("Stonehill Master"), a Caymans Islands exempted company, John Motulsky, Christopher Wilson, Wayne Teetsel, Thomas Varkey, Jonathan Sacks, Peter Sisitsky, Michael Thoyer and Michael Stern (together with SCM, Stonehill Master and Messrs. Motulsky, Wilson, Teetsel, Varkey, Sacks, Sisitsky and Thoyer, the "Stonehill Group"). Includes (i) 1,087,029 ordinary shares (equivalent to 2,174,058 ADSs) beneficially owned by Stonehill Master and (ii) 1,586,941 ordinary shares (equivalent to 3,173,882 ADSs) beneficially owned by SCM (inclusive of the ordinary shares beneficially owned by Stonehill Master) and (iii) 1,586,941 ordinary shares (equivalent to 3,173,882 ADSs) beneficially owned by each of Messrs. Motulsky, Wilson, Teetsel, Varkey, Sacks, Sisitsky, Thoyer and Stern ("Stonehill Management") (inclusive of the ordinary shares beneficially owned by SCM). SCM is the investment adviser of Stonehill Master. The individuals comprising Stonehill Management are the managing members of SCM. Each member of the Stonehill Group disclaims beneficial ownership of such ordinary shares except to the extent of its or his pecuniary interest therein. The principal business address of each member of the Stonehill Group is c/o Stonehill Capital Management LLC, 885 Third Avenue, 30th Floor, New York, NY 10022.
- (2)
- This information is based solely on the Schedule 13G filed on February 10, 2014 by T. Rowe Price Associates, Inc ("Price Associates"), a Maryland corporation. Price Associates is an investment adviser with beneficial ownership over 1,431,215 ordinary shares (equivalent to 2,862,420 ADSs). Price Associates' principal business address is 100 E. Pratt Street, Baltimore, MD 21202.
- (3)
- This information is based solely on the Schedule 13G jointly filed on February 18, 2014 by GMT Capital Corp. ("GMT Capital"), a Georgia corporation, Bay Resource Partners, L.P. ("Bay"), a Delaware limited partnership, Bay II Resource Partners, L.P. ("Bay II"), a Delaware limited partnership, Bay Resource Partners Offshore Fund, Ltd ("Bay Offshore"), a Cayman Islands exempted company, and Thomas E. Claugus (collectively, the "GMT Capital Group"). Includes (i) 665,100 ADSs (equivalent to 332,550 ordinary shares) held by Bay, (ii) 500,300 ADSs (equivalent to 250,150 ordinary shares) held by Bay II, (iii) 1,013,167 ADSs (equivalent to 506,583.5 ordinary shares) held by Bay Offshore, (iv) 2,295,567 ADSs (equivalent to 1,147,783.5 ordinary shares) beneficially owned by GMT Capital (inclusive of the ADSs held by Bay, Bay II and Bay Offshore) and (v) 2,426,367 ADSs (equivalent to 1,213,183.5 ordinary shares) beneficially owned by Mr. Claugus (inclusive of the ADSs beneficially owned by GMT and 130,800 ADSs (equivalent to 65,400 ordinary shares) held by Mr. Claugus). GMT Capital is the general partner of Bay and Bay II and the discretionary investment manager of Bay
114
Offshore. Mr. Claugus is the President of GMT Capital. The principal business address of each member of the GMT Capital Group is 2300 Windy Ridge Parkway, Suite 550 South, Atlanta, GA 30339.
- (4)
- This information is based solely on the Schedule 13G filed on March 10, 2014 by Wellington Management Company, LLP ("Wellington"), a Massachusetts limited liability partnership. Wellington is an investment adviser and may be deemed to beneficially own 1,104,260 ordinary shares (equivalent to 2,208,520 ADSs) held by its clients. Wellington's principal business address is 280 Congress Street, Boston, MA 02210.
- (5)
- The information is based solely on the Schedule 13G filed jointly on February 14, 2014 by Cetus Capital II, LLC ("Cetus"), a Delaware limited liability company, Littlejohn Opportunities Master Fund LP ("Littlejohn Opportunities"), a Caymans Islands limited partnership, and SG Distressed Fund, LP ("SG"), a Delaware limited partnership. Includes (i) 874,133 ordinary shares (equivalent to 1,748,266 ADSs) beneficially owned by Cetus, (ii)76,366 ordinary shares (equivalent to 152,732 ADSs) beneficially owned by Littlejohn Opportunities and (iii) 28,298 ordinary shares (equivalent to 56,476 ADSs) beneficially owned by SG. The sole member of Cetus is Littlejohn Fund IV, L.P. ("Littlejohn Fund"), a Delaware limited partnership, whose manager is Littlejohn Managers LLC ("Littlejohn Managers"), a Delaware limited liability company. The general partner of Littlejohn Opportunities and SG is Littlejohn Opportunities GP LLC (together with Cetus, Littlejohn Opportunities, SG, Littlejohn Fund, Littlejohn Managers, the "Cetus Group"), a Delaware limited liability company. The principal business address of each member of the Cetus Group is 8 Sound Shore Drive, Suite 303, Greenwich, CT 06830.
- (6)
- This information is based solely on the Schedule 13G filed jointly on February 14, 2014 by Canton Holdings, L.L.C ("Canton"), a Delaware limited liability company, Archer Capital Management, L.P. ("Archer"), a Delaware limited partnership, Joshua A. Lobel and Eric J. Edidin (together with Canton, Archer and Mr. Lobel, the "Canton Group"). Includes (i) 1,856,800 ADSs (equivalent to 928,400 ordinary shares) beneficially owned by Archer, (ii) 1,856,800 ADSs (equivalent to 928,400 ordinary shares) beneficially owned by Canton (inclusive of the ordinary shares beneficially owned by Archer) and (iii) 1,856,800 ADSs (equivalent to 928,400 ordinary shares) beneficially owned by each of Messrs. Lobel and Edidin (inclusive of the ordinary shares beneficially owned by Canton). Canton is the general partner of Archer, which is the investment manager for certain private investment funds. Messrs. Lobel and Edidin are principals of Canton. The principal business address of each member of the Canton Group is 570 Lexington Avenue, 40th Floor, New York, NY 10022.
- (7)
- The information is based on the Schedule 13G filed jointly on February 12, 2014 by Barclays PLC ("Barclays"), an English public limited company, Barclays Capital Inc. ("Barclays Capital), a Connecticut corporation, and Barclays Capital Securities Limited ("Barclays Securities" and, together with Barclays and Barclays Capital, the "Barclays Group"), an English limited company. Includes (i) 793,538 ordinary shares (equivalent to 1,587,076 ADSs) beneficially owned by Barclays Securities, (ii) 7 ordinary shares (equivalent to 14 ADSs) beneficially owned by Barclays Capital and (iii) 793,545 ordinary shares (equivalent to 1,587,090 ADSs) beneficially owned by Barclays (inclusive of the ADSs beneficially owned by Barclays Securities and Barclays Capital). The principal business address of Barclays is 1 Churchill Place, London, E14 5HP, England. The principal business address of Barclays Capital is 745 Seventh Avenue, New York, NY 10019. The principal business address of Barclays Securities is 5 The North Colonnade, Canary Wharf, London E14 4BB, England.
- (8)
- Based upon the percentage of the total ordinary share capital in issue. As at December 31, 2013 this was 13,500,962 ordinary shares (December 31, 2012: 13,500,000).
Between January 1, 2013 and December 31, 2013:
- •
- the percentage of our ordinary shares beneficially owned by (i) T. Rowe Price Associates Inc. increased from 6.9% to 10.7% and (ii) the Stonehill Group decreased from 17.4% to 11.8%;;
- •
- the Canton Group and the GMT Capital Group each became a major shareholder; and
115
- •
- entities and persons affiliated with Greywolf GP LLC (the "Greywolf Group") and entities affiliated with Marathon Asset Management, L.P. (the "Marathon Group") ceased to be major shareholders of the Company. The percentage of our ordinary shares beneficially owned by (i) the Greywolf Group decreased from 5.1% to 4.6% and (ii) the Marathon Group decreased from 9.3% to 0%.
Between January 1, 2012 and December 31, 2012:
- •
- the percentage of our ordinary shares beneficially owned by (i) the Stonehill Group decreased from 23.4% to 17.4% and (ii) the Marathon Group increased from 12.5% to 9.3%;
- •
- Wellington and T. Rowe Price Associates Inc. each became a major shareholder. Wellington increased its beneficial ownership of our ordinary shares from 0% to 8.9% and T. Rowe Price Associates Inc. increased its beneficial ownership of our shares from 0% to 6.9%; and
- •
- entities or persons affiliated with Avenue Capital Group ceased to be major shareholders of the Company, decreasing its beneficial ownership of our ordinary shares from 12.0% to 4.5%.
Between January 1, 2011 and December 31, 2011:
- •
- the percentage of ordinary shares beneficially owned by entities and persons affiliated with Avenue Capital Group decreased from 25.2% to 12.0%; and
- •
- the Cetus Group and the Stonehill Group each became a major shareholder. The Cetus Group increased its beneficial ownership of our ordinary shares from 0% to 8.7% and the Stonehill Group increased its beneficial ownership of our ordinary shares from 3.6% to 23.4%.
Voting Rights
Major shareholders have the same voting rights per share as all other ordinary shareholders.
Lock-Up Agreements
In connection with our IPO, we and each of our directors, members of our executive management board, the selling shareholders and certain other shareholders entered into lock-up agreements that restricted the sale of ordinary shares and ADSs for up to 180 days after our IPO, subject to an extension in certain circumstances. The lock up period expired on April 1, 2013, after which the ordinary shares or ADSs held by our directors, members of our executive management board, the selling shareholders and certain other shareholders were permitted to be sold, subject to the restrictions under Rule 144 under the Securities Act or by means of registered public offerings.
U.S. Resident Shareholders of Record
BNY (Nominees) Limited is the holder of record for the company's ADR program, whereby each ADS represents one-half of an Ordinary Share of £1 each. At March 26, 2014, BNY (Nominees) Limited held 12,509,003 Ordinary Shares representing 93% of the issued share capital held at that date. As at that date, we had a further 301,985 Ordinary shares held by 8 U.S resident shareholders of record, representing approximately 2% of total voting power. Certain of these ordinary shares and ADSs were held by brokers or other nominees. As a result, the number of holders of record or registered holders in the U.S. is not representative of the number of beneficial holders or of the residence of beneficial holders.
B. Related Party Transactions
Since January 1, 2011, there has not been, nor is there currently proposed, any material transaction or series of similar material transactions to which we were or are a party in which any of our directors, members of our executive management board, associates, holders of more than 10% of any class of our voting securities, or any affiliates or member of the immediate family of any of the foregoing persons, had
116
or will have a direct or indirect material interest, other than the compensation and shareholding arrangements we describe where required in "Management."
C. Interests of experts and counsel
Not applicable.
Item 8. Financial Information.
A. Consolidated Statements and Other Financial Information.
See "Item 18. Financial Statements."
Dividend Distribution policy
We did not declare or pay any dividends on our ordinary shares in 2009, 2010 or 2011. In July 2012, our board of directors declared an interim dividend of £0.25 per ordinary share (equal to $0.39 per ordinary share at an exchange rate of $1.57:£1), totaling $3.8 million, which was paid on August 10, 2012. Our first quarterly dividend of $0.20 per ordinary share ($0.10 per ADS) was declared and paid in October 2012 to holders of our ordinary shares as of September 30, 2012. In 2013 interim dividends totaling $2.7 million ($0.10 per ADS) were paid on February 6, 2013, May 8, 2013, August 7, 2013 and November 6, 2013. The declaration and payment of these dividends and any future dividends will be at the discretion of our board of directors and will depend upon our results of operations, cash requirements, financial condition, contractual restrictions, restrictions imposed by our indebtedness, any future debt agreements or applicable laws and other factors that our board of directors may deem relevant. As with the all the dividends declared to date, we expect future dividends to be paid out of our earnings. See Item 5, "Operating and Financial Review and Prospects" and Item 3.D, "Risk Factors"—Our ability to pay regular dividends on our ordinary shares is subject to the discretion of our board of directors and will depend on many factors, including our results of operations, cash requirements, financial condition, contractual restrictions, applicable laws and other factors, and may be limited by our structure and statutory restrictions and restrictions imposed by the Senior Facilities Agreement and Loan Notes due 2018 as well as any future agreements.
Under our Articles of Association, our shareholders must approve any final dividend, although the board of directors may resolve to pay interim dividends without shareholder approval. Any payment of dividends is also subject to the provisions of the Companies Act, according to which dividends may only be paid out of profits available for distribution determined by reference to accounts prepared in accordance with the Companies Act and IFRS as issued by the IASB, which differ in some respects from U.S. GAAP. In the event that dividends are paid in the future, holders of the ADSs will be entitled to receive payments in U.S. dollars in respect of dividends on the underlying ordinary shares in accordance with the deposit agreement. Furthermore, because we are a holding company, any dividend payments would depend on cash flow from our subsidiaries. See Item 3.D. "Risk Factors—As a holding company, Luxfer Holdings PLC's main source of cash is distributions from our operating subsidiaries".
B. Significant Changes
Except as disclosed elsewhere in this Annual Report, there have been no significant changes since December 31, 2013.
117
Item 9. The Offer and Listing.
A. Offer and Listing Details
Price History of Stock
Following the listing of our ordinary shares, in the form of ADSs evidenced by ADRs, on October 3, 2012 on the New York Stock Exchange, the following table sets forth, for the periods indicated, the reported high and low prices quoted in USD.
| | Price Per ADS | ||||||
|---|---|---|---|---|---|---|---|
| | High | Low | |||||
| | (in USD) | ||||||
2013 | |||||||
Annual | 21.16 | 12.03 | |||||
Quarter | |||||||
First Quarter | 16.36 | 12.03 | |||||
Second Quarter | 19.00 | 14.62 | |||||
Third Quarter | 17.79 | 15.26 | |||||
Fourth Quarter | 21.16 | 16.04 | |||||
Month | |||||||
July | 17.79 | 15.26 | |||||
August | 17.57 | 16.40 | |||||
September | 17.30 | 15.85 | |||||
October | 18.69 | 16.04 | |||||
November | 19.30 | 17.50 | |||||
December | 21.16 | 18.00 | |||||
B. Plan of Distribution
Not applicable
C. Markets
As at February 28, 2014, 24,790,186 ADSs of Luxfer Holdings PLC are listed on the New York Stock Exchange. The depositary for the ADSs holds one £1 ordinary share for every two ADSs. Prior to this listing, no public market existed for our ordinary shares. Our ordinary shares are listed, in the form of ADSs evidenced by ADRs, on the NYSE under the symbol "LXFR".
D. Selling Shareholders
Not applicable
E. Dilution
Not applicable
F. Expenses of the Issue
Not applicable
118
Item 10. Additional Information
A. Share Capital
Not applicable
B. Memorandum and articles of association
The information called for by this item has been reported previously in our Registration Statement on form F-1 (File No. 333-178278), filed with the SEC October 4, 2012, as amended, under the heading "Description of Share Capital" and is incorporated by reference into this Annual Report.
C. Material contracts
For the two years immediately preceding the date of this Annual Report, we have not been a party to any material agreements other than in the ordinary course of business.
D. Exchange controls
There are no governmental laws, decrees, regulations or other legislation in the United Kingdom that may affect the import or export of capital, including the availability of cash and cash equivalents for use by us, or which may affect the remittance of dividends, interest, or other payments by us to non-resident holders of our ordinary shares or ADSs, other than withholding tax requirements. There is no limitation imposed by U.K. law or Luxfer Holdings PLC's Articles of Association on the right of non-residents to hold or vote shares.
E. Taxation
United States Federal Income Taxation
The following discussion describes certain U.S. federal income tax consequences of the purchase, ownership and disposition of our ADSs by a holder that is a citizen or resident of the United States, a U.S. domestic corporation or a person or entity that otherwise will be subject to U.S. federal income tax on a net income basis in respect of our ADSs (a "U.S. Holder"). This discussion does not purport to be a description of all of the possible tax considerations that may be relevant to a decision to purchase, hold or dispose of ADSs. In particular, this discussion does not address all U.S. federal income tax considerations that may be relevant to a particular investor, nor does it address the special tax rules applicable to certain categories of investors, such as banks, dealers, traders who elect to mark to market, tax-exempt entities, insurance companies, certain short-term holders of ADSs or investors who hold our ADSs as part of a hedge, straddle, conversion or integrated transaction or investors who have a 'functional currency" other than the U.S. dollar. In addition, the discussion does not address tax consequences to an entity treated as a partnership for U.S. federal income tax purposes that holds the ADSs, or a partner in such partnership. This summary deals only with U.S. Holders that will hold our ADSs as capital assets and does not address the tax treatment of a U.S. Holder that owns or is treated as owning 10% or more of the voting shares (including ADSs) of the company.
This discussion is based on the federal income tax laws of the United States, as well as U.S. Treasury promulgated thereunder and judicial and administrative interpretations thereof, all as in effect as of the date of this annual report, and the income and capital gains tax convention between the United States and the United Kingdom that was signed on July 24, 2001 (and amended by a Protocol signed on July 19, 2002) (the "Treaty"). All of the foregoing authorities are subject to change, which change could apply retroactively and could affect the tax consequences described below. This summary does not address any tax consequences under the laws of any state or locality of the United States.
119
YOU ARE URGED TO CONSULT YOUR TAX ADVISORS ABOUT THE APPLICATION OF THE U.S. FEDERAL INCOME TAX RULES TO YOUR PARTICULAR CIRCUMSTANCES AS WELL AS THE STATE, LOCAL, FOREIGN AND OTHER TAX CONSEQUENCES OF THE PURCHASE, OWNERSHIP AND DISPOSITION OF THE ADSs.
The discussion below assumes that the representations contained in the deposit agreement are true and that the obligations in the deposit agreement and any related agreement will be complied with in accordance with their terms. If you hold ADSs, you should be treated as the holder of the underlying ordinary shares represented by those ADSs for U.S. federal income tax purposes.
Taxation of Dividends and Other Distributions on the ADSs
Subject to the exceptions discussed below, the gross amount of distributions made by us to you with respect to the ADSs will generally be includable in your gross income as dividend income. You will be treated as receiving the dividend on the date of receipt by the depositary. If dividends are converted into U.S. dollars on the date of receipt, you generally should not be required to recognize foreign currency gain or loss in respect of the dividends. You should consult your tax advisor regarding the treatment of the foreign currency gain or loss, if any, on any non-U.S. currency received that is converted into U.S. dollars on a date subsequent to the date of receipt by the depositary.
The gross amount of distributions made by us to you with respect to the ADSs will be treated as a dividend for U.S. federal income tax purposes only to the extent that the distribution is paid out of our current or accumulated earnings and profits (as determined under U.S. federal income tax principles). To the extent, if any, that the amount of the distribution exceeds our current and accumulated earnings and profits, it will be treated first as a tax-free return of your tax basis in your ADSs, and to the extent the amount of the distribution exceeds your tax basis, the excess will be taxed as capital gain. We do not intend to calculate our earnings and profits under U.S. federal income tax principles. Therefore, a U.S. Holder should expect that a distribution will generally be treated as a dividend even if that distribution would otherwise be treated as a non-taxable return of capital or as capital gain under the rules described above. A dividend in respect of the ADSs will not be eligible for the dividends-received deduction allowed to corporations in respect of dividends received from other U.S. corporations.
With respect to non-corporate U.S. Holders, including individual U.S. Holders, dividends will generally be taxed at the lower rate applicable to qualified dividend income, provided that (1) the ADSs are readily tradable on an established securities market in the United States, or we are eligible for the benefits of a qualifying income tax treaty with the United States that has been approved by the Internal Revenue Service for purposes of the qualified dividend rules, (2) we are not a passive foreign investment company (a "PFIC") for either our taxable year in which the dividend is paid or the preceding taxable year and (3) certain holding period requirements are met. Under U.S. Internal Revenue Service authority, common or ordinary shares, or ADSs representing such shares, are considered for purpose of clause (1) above to be readily tradable on an established securities market in the United States if they are listed on the New York Stock Exchange. Based on our financial statements and current expectations regarding our income, assets and activities, we believe that we were not a PFIC in 2013 and do not anticipate becoming a PFIC in 2014 or in the foreseeable future. If we were to be a PFIC for any taxable year during which a U.S. Holder holds our shares, certain adverse U.S. federal income tax consequences (including, but not limited to, dividends received by non-corporate U.S. Holders being treated as other than qualified dividends) could apply. You should consult your tax advisors regarding the availability of the lower rate for dividends paid with respect to the ADSs.
Dividends generally will constitute foreign source income for foreign tax credit limitation purposes. However, if 50% or more of our stock is treated as held by U.S. persons, we will be treated as a "United States-owned foreign corporation." In view of the substantial number of shares of our stock that are held by shareholders of record that are U.S. persons, there is a significant possibility that we may be classified as a
120
United States-owned foreign corporation. If that were the case, dividends on our stock would be treated for foreign tax credit limitation purposes as income from sources within the U.S. to the extent they are attributable to our U.S. source earnings and profits, and as income from sources outside the U.S. to the extent the dividends are attributable to our non-U.S. source earnings. As described below under "—United Kingdom Tax Considerations," U.S. holders that are eligible for benefits under the Treaty and meet certain other requirements generally will not be subject to U.K. tax on dividend payments in respect of the ordinary shares and ADSs or on capital gains realized on the disposal of the ordinary shares or ADSs. The treatment of our dividends as U.S. source or foreign source income under the rules described above may nevertheless be relevant for determining your overall foreign tax credit limitation. We do not maintain information definitively establishing the extent to which our earnings and profits are treated as U.S. source for these purposes and such amount therefore is uncertain. You should consult your tax advisor regarding the consequences to you, if any, of the potential treatment of dividends on our stock as U.S. source income under these rules. If the dividends are taxed as qualified dividend income (as discussed above), the amount of the dividend taken into account for purposes of calculating the foreign tax credit limitation will generally be limited to the gross amount of the dividend, multiplied by the reduced rate divided by the highest rate of tax normally applicable to dividends. The limitation on foreign taxes eligible for credit is calculated separately with respect to specific classes of income. For this purpose, dividends distributed by us with respect to the ADSs will generally constitute "passive category income."
Distributions of additional shares with respect to our ADSs that are made as part of a pro rata distribution to all of our shareholders generally will not be subject to U.S. federal income tax.
Taxation of Dispositions of ADSs
Subject to the passive foreign investment company rules discussed above, you will recognize taxable gain or loss on any sale, exchange or other taxable disposition of an ADS equal to the difference between the amount realized (in U.S. dollars) for the ADS and your tax basis (in U.S. dollars) in the ADS. The gain or loss will generally be capital gain or loss. If you are a non-corporate U.S. Holder, including an individual U.S. Holder, who has held the ADS for more than one year, you will be eligible for reduced tax rates. The deductibility of capital losses is subject to limitations. Any such gain or loss that you recognize will generally be treated as U.S. source income or loss.
Information Reporting and Backup Withholding
Dividend payments with respect to ADSs and proceeds from the sale, exchange or redemption of ADSs may be subject to information reporting to the U.S. Internal Revenue Service and possible U.S. backup withholding. Backup withholding will not apply, however, to a U.S. Holder who furnishes a correct taxpayer identification number and makes any other required certification or who is otherwise exempt from backup withholding. U.S. Holders that are United States Persons who are required to establish their exempt status generally must provide such certification on U.S. Internal Revenue Service Form W-9. Holders that are not United States persons generally are not subject to information reporting or backup withholding. However, such a holder may be required to provide a certification of its non-U.S. status in connection with payments received within the United States or through a U.S.-related financial intermediary. You should consult your tax advisors regarding the application of the U.S. information reporting and backup withholding rules.
Backup withholding is not an additional tax. Amounts withheld as backup withholding may be credited against your U.S. federal income tax liability, and you may obtain a refund of any excess amounts withheld under the backup withholding rules by filing the appropriate claim for refund with the U.S. Internal Revenue Service and furnishing any required information.
U.S. Holders who are individuals are required to report information relating to an interest in the ADSs, subject to certain exceptions (including an exception for ADSs held in accounts maintained by certain
121
financial institutions). You should consult your tax advisor regarding the effect, if any, of this requirement on your ownership and disposition of the ADSs.
United Kingdom Tax Considerations
This section discusses the material U.K. tax consequences of an investment in ordinary shares or ADSs by Eligible U.S. Holders. It applies only to Eligible U.S. Holders that beneficially hold ordinary shares or ADSs as capital assets and does not address the tax treatment of investors that are subject to special rules. An "Eligible U.S. Holder" is an investor that, at all material times: (i) qualifies for benefits under the income and capital gains tax convention between the United States and the United Kingdom that was signed on July 24, 2001 (and amended by a Protocol signed on July 19, 2002) (the "Treaty"); (ii) is a resident of the United States for the purposes of the Treaty; and (iii) is not resident or (while it remains relevant to the charge to U.K. capital gains tax) ordinarily resident in the United Kingdom for U.K. tax purposes at any material time. Investors should note that the U.K. Government has announced that ordinary residence will cease to be relevant to the charge to U.K. capital gains tax for the tax year 2013-14 and subsequent tax years.
This section does not apply to an investor who holds shares in connection with the conduct of a business or the performance of personal services in the United Kingdom or otherwise in connection with a branch, agency or permanent establishment in the United Kingdom.
This section is based on current U.K. tax law and published HM Revenue & Customs ("HMRC") practice as at the date of this annual report, both of which are subject to change, possibly with retrospective effect.
POTENTIAL INVESTORS IN THE ADSs SHOULD SATISFY THEMSELVES PRIOR TO INVESTING AS TO THE OVERALL TAX CONSEQUENCES, INCLUDING, SPECIFICALLY, THE CONSEQUENCES UNDER U.K. TAX LAW AND HMRC PRACTICE OF THE ACQUISITION, OWNERSHIP AND DISPOSAL OF THE ORDINARY SHARES OR ADSs, IN THEIR OWN PARTICULAR CIRCUMSTANCES BY CONSULTING THEIR OWN TAX ADVISERS.
Taxation of dividends
Withholding Tax
Dividend payments in respect of the ordinary shares and ADSs may be made without withholding or deduction for or on account of U.K. tax.
Income Tax
Payments of dividends on the ordinary shares and ADSs will constitute U.K. source income for U.K. tax purposes and, as such, remain subject to U.K. income tax by direct assessment even if paid without deduction or withholding for or on account of any U.K. tax. However, dividends with a U.K. source will not generally be chargeable to U.K. tax by direct assessment in the hands of an Eligible US Holder.
Taxation of disposals
As an Eligible U.S. Holder, you will not generally be liable for U.K. taxation on any capital gain realized on the disposal of the ordinary shares or ADSs.
Inheritance Tax
If for the purposes of the Taxes on Estates of Deceased Persons and on Gifts Treaty 1978 between the United States and the United Kingdom an individual holder is domiciled in the United States and is not a national of the United Kingdom, any ordinary shares or ADSs beneficially owned by that holder will not
122
generally be subject to U.K. inheritance tax on that holder's death or on a gift made by that holder during his/her lifetime, provided that any applicable United States federal gift or estate tax liability is paid, except where (i) the ordinary shares or ADSs are part of the business property of a U.K. permanent establishment or pertain to a U.K. fixed base used for the performance of independent personal services; or (ii) the ordinary shares or ADSs are comprised in a settlement unless, at the time of the settlement, the settlor was domiciled in the United States and not a national of the United Kingdom.
Stamp Duty and Stamp Duty Reserve Tax
Issue and transfer of ordinary shares
No U.K. stamp duty or stamp duty reserve tax ("SDRT") is payable on the issue of the ordinary shares.
Transfers of ordinary shares to, or to a nominee or agent for, a person whose business is or includes issuing depositary receipts (which will include a transfer of ordinary shares to the depositary or to the custodian as nominee or agent for the depositary) or to, or to a nominee or agent for, a person whose business is or includes the provision of clearance services, will generally be regarded by HMRC as subject to stamp duty or SDRT at 1.5% of the amount or value of the consideration or, in certain circumstances, the value of the ordinary shares transferred. In practice this liability for stamp duty or SDRT is in general borne by such person depositing the relevant shares in the clearance service or depositary receipt scheme.
The transfer on sale of ordinary shares by a written instrument of transfer will generally be liable to U.K. stamp duty at the rate of 0.5% of the amount or value of the consideration for the transfer. The purchaser normally pays the stamp duty.
An agreement to transfer ordinary shares will generally give rise to a liability on the purchaser to SDRT at the rate of 0.5% of the amount or value of the consideration. Such SDRT is payable on the seventh day of the month following the month in which the charge arises, but where an instrument of transfer is executed and duly stamped before the expiry of a period of six years beginning with the date of that agreement, (i) any SDRT that has not been paid ceases to be payable, and (ii) any SDRT that has been paid may be recovered from HMRC, generally with interest.
Transfer of ADSs
No U.K. stamp duty will be payable on a written instrument transferring an ADS or on a written agreement to transfer an ADS provided that the instrument of transfer or the agreement to transfer is executed and remains at all times outside the United Kingdom. Where these conditions are not met, the transfer of, or agreement to transfer, an ADS could, depending on the circumstances, attract a charge to U.K. stamp duty at the rate of 0.5% of the value of the consideration.
No SDRT will be payable in respect of an agreement to transfer an ADS.
F. Dividends and paying agents
Not applicable.
G. Statement by experts
Not applicable.
H. Documents on Display
You may read and copy any reports or information that we file at the SEC's Public Reference Room at 100 F Street, N.E.,Washington, D.C. 20549. Information on the operation of the Public Reference Room may be obtained by calling at the SEC at 1-800-SEC-0330. In addition, the SEC maintains an Internet
123
website that contains reports and other about issuers, like us, that file electronically with the SEC. The address of that site is "www.sec.gov".
We also make available on our website, free of charge, our annual reports on Form 20-F and the text of our reports on Form 6-K, including any amendments to these reports, as well as certain other SEC filings, as soon as reasonably practicable after they are electronically filed with or furnished to the SEC. Our website address is "www.Luxfer.com". The information contained on our website is not incorporated by reference in this document.
I. Subsidiary information
Not applicable.
Item 11. Quantitative & Qualitative Disclosures About Market Risk
We are exposed to market risk during the normal course of business from changes in currency exchange rates, interest rates and commodity prices such as aluminum prices. We manage exposures through a combination of normal operating and financing activities and through the use of derivative financial instruments such as foreign currency forward purchase contracts and aluminum forward purchase contracts. We do not use market risk-sensitive instruments for trading or speculative purposes.
A hedging committee, chaired by the Group Finance Director, controls and oversees the monitoring of market risks and hedging activities undertaken throughout the company.
Effect of Currency Movement on Results of Operations
We conduct business in the United Kingdom, the United States, continental Europe, Australasia and Asia and in various other countries around the world and, accordingly, our results of operations are subject to currency translation risk and currency transaction risk.
For the year ended December 31, 2013, our revenue by origin of manufacture and destination of sales, as a percentage of our consolidated revenues for continuing operations, were as follows:
Revenue by Geographic Destination
2013
Geographic Region | Percentage of Revenue | |||
|---|---|---|---|---|
North America | 47 | % | ||
European Community excluding U.K | 22 | % | ||
Asia Pacific | 12 | % | ||
Africa | 1 | % | ||
Other Europe | 3 | % | ||
United Kingdom | 12 | % | ||
South & Central America | 3 | % | ||
124
Revenue by Geographic Origin
2013
Geographic Region | Percentage of Revenue | |||
|---|---|---|---|---|
North America | 54 | % | ||
United Kingdom | 29 | % | ||
Other Europe | 16 | % | ||
Asia Pacific | 1 | % | ||
In 2013, 54%, 12% and 22% of our sales revenue from continuing operations was denominated in U.S. dollars, pound sterling and euro respectively.
Currency translation risk
With respect to currency translation risk, our financial condition and results of operations are measured and recorded in the relevant local base currency and then translated each month into U.S. dollars for inclusion in our consolidated financial statements. We translate balance sheet amounts at the exchange rates in effect on the date of the balance sheet, while income and cash flow items are translated at the average rate of exchange in effect for the relevant period.
The chart below shows the monthly rates used to translate our U.K. and European operations over the last year:
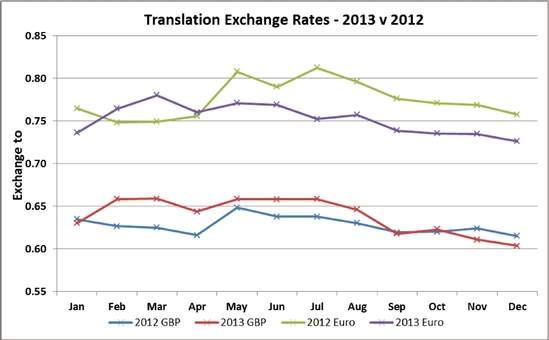
Translation risk on net assets
We hold significant assets in the United States, United Kingdom and continental Europe, and we have in the past used either forward foreign currency exchange contracts or local currency debt to hedge translation risk on our net assets. Since 2004, we have not engaged in the use of forward foreign currency exchange contracts for the purpose of hedging translation risk, although we may in the future enter into other similar arrangements when we believe it appropriate. We use local denominated debt externally provided by third parties, in various forms and to various levels, to hedge the exchange rate risks. Since 2000, following the sale of British Aluminium, we had a disproportionate amount of external debt in the United Kingdom,
125
leading to an imbalance in the net assets by economic region. In June 2011, however, our new financing facilities enabled us to allocate external debt levels between the United States and United Kingdom in a more appropriate manner, replacing the internal debt structure. Following the IPO in October 2012, we repaid the senior term debt which was held in both the United States and United Kingdom, leaving the Loan Notes due 2018 as our principal external debt instrument, and this debt is denominated in U.S dollars. The net assets employed in North America, continental Europe and the United Kingdom was $80.4 million, $42.5 million and $63.9 million respectively as of December 31, 2013. Of the $80.4 million net assets in North America, $23.4 million relates to goodwill with a functional currency of pound sterling, the functional currency of the holding company, Luxfer Holdings PLC, following the transition to IFRS. Net assets in other regions only totaled $4.9 million and therefore were not a significant risk. Following the change in presentation currency to U.S. dollars, we are now exposed to translation risk for the U.K. and all other non-U.S. net assets plus the U.S. goodwill, which in total is $134.7 million. Depreciation of the U.S. dollar compared to the pound sterling positively affects the value of our assets that are exposed to translation risk as reported in U.S. dollars in our consolidated financial statements and, conversely, the appreciation of the U.S dollar has a negative impact on the value of those assets.
As at December, 31 2013 the U.S. dollar had weakened by approximately 3% against pound sterling and by approximately 4% against the euro, compared to December, 31, 2012. These movements in conjunction with exchange rate movements of our other overseas investments, which are principally denominated in Czech koruna, Chinese renminbi, Canadian dollars and Australian dollars, increased our consolidated net assets by $3.1 million, which we reported in our statement of other comprehensive income. As of December 31, 2013, we estimate that a 10% appreciation in the U.S. dollar against the other currencies of our operations would have decreased the value of our consolidated net assets by approximately $13.0 million.
Translation risk on revenues and operating profits
The impact of changes in exchange rates on our reported revenue and operating profit is dependent on changes in average exchange rates in one year when compared to another. The chart above plots the pound sterling and euro exchange rates against U.S. dollars. The table below shows the impact of such shifts in average exchange rates had on our financial results. On average, the translation exchange rate was £0.6391 per $1 in 2013 and €0.6280 per $1 in 2012.
| | Q1 2013 | Q2 2013 | Q3 2013 | Q4 2013 | FY 2013 | |||||||||||
|---|---|---|---|---|---|---|---|---|---|---|---|---|---|---|---|---|
| | (in $ millions) | |||||||||||||||
All currencies—translation impact—gain/(loss) | ||||||||||||||||
Revenue | $ | (1.5 | ) | $ | (1.0 | ) | $ | 0.3 | $ | 0.7 | $ | (1.5 | ) | |||
Operating profit | (0.3 | ) | (0.3 | ) | (0.6 | ) | 0.8 | (0.4 | ) | |||||||
The table above also indicates the impact of movements in the exchange rate of pound sterling, the euro and other currencies against the U.S. dollar for 2013. We estimate that a 10% appreciation in the U.S. dollar against the other currencies of our operations in 2013 would have decreased our operating profit by approximately $3.3 million.
Hedging of currency translation risk
The gains and losses arising from our exposure to movements in foreign currency exchange rates are recognized in the SOCI.
We cannot easily hedge the impact of translation risk on our operating profits, but we are able to hedge the translation risk on our overseas net assets. The two common methods are through either bank borrowing denominated in the foreign currency or use of forward foreign currency exchange contracts. We have hedged this risk through bank borrowings denominated in the same currencies as the net assets they help to fund.
126
We can draw down amounts under our new Revolving Credit Facility and Term Loan in U.S. dollars, pound sterling and euro. As of December 31, 2013 and 2012, we had $65.0 million of debt denominated in U.S. dollars. We have on occasion also used forward foreign currency exchange contracts to hedge this exposure. However, this approach is less desirable than the use of bank debt because it requires the cash settlement of the contracts, which exposes us to an additional cash flow risk. As a result, we have not used such hedges in recent years. We also report any gains and losses on hedging instruments in the SOCI, offsetting the exchange movements on overseas net assets.
Currency transaction risk
In addition to currency translation risk, we incur currency transaction risk whenever one of our operating subsidiaries enters into either a purchase or sales transaction in a currency other than its functional currency. Matching sales revenues and costs in the same currency reduces currency transaction risk.
Our U.S. operations have little currency exposure, as most purchases, costs and revenues are denominated in U.S. dollars. In our U.K. operations, purchases of raw materials and sales are conducted in a large number of countries and in differing currencies, while other operating costs are generally incurred in pound sterling, resulting in exposure to changes in foreign exchange rates. For example, purchases of raw materials are denominated principally in U.S. dollars, and a large portion of our sales by U.K. operations are in euros.
The analysis of our revenues by destination and origin, as shown in the chart above, demonstrates that, although 29% of our product sales revenue originates from manufacturing facilities in the United Kingdom, only 12% of our revenues are derived from sales to customers within the United Kingdom. The remaining percentage of revenues is generated from exports outside the United Kingdom. We sold 19% of our products into the countries that have adopted the euro, but we only manufactured 11% of our goods in the euro-zone. As a result, movement in the exchange rate between the euro and the pound sterling is our largest currency transaction risk. We estimate the net exposure to the euro between sales and purchases equates to a gross profit exposure varying between €50 million and €60 million a year, fluctuating due to changes in sales, which will vary due to market demand factors. The geographic sales analysis shows that the U.S. dollar is another potential source of currency transaction risk for our U.K. operations, with sales of products denominated in U.S. dollars extending beyond North America, as many of our sales to Asia are also priced in U.S. dollars. The U.K. operations are exposed to a translation risk, with export sales being priced in U.S. dollars, and have an estimated $10 million to $20 million net sales risk per year. We manage transaction risk on the sales and purchase cash flows separately, using separate sell and buy forward currency contracts, rather than on a net basis.
Hedging of currency transaction risk
To mitigate our exposure to currency transaction risk, we operate a policy of hedging all contracted commitments in foreign currency, and we also hedge a substantial portion of non-contracted forecast currency receipts and payments for up to twelve months forward.
Where no natural hedge exists, all firm contracted commitments and a portion of non-contracted forecast receipts and payments denominated in foreign currencies are hedged by means of forward foreign currency exchange contracts. We base our decision to hedge against non-contracted amounts based on the nature of the transaction being hedged and the volatility of currency movements, among other factors. For example, we cover a lower percentage of our forecast exposure in the case of businesses with relatively few long-term sales contracts.
As of December 31, 2013, we held various foreign currency exchange contracts designated as hedges in respect of forward sales for U.S. dollars, euros and Japanese yen for the receipt of pound sterling. We also held foreign currency exchange contracts designated as hedges in respect of forward purchases for U.S.
127
dollars by the sale of pound sterling. The contract totals in pound sterling, range of maturity dates and range of exchange rates are disclosed below:
| | 2013 Sales hedges | |||||||||
|---|---|---|---|---|---|---|---|---|---|---|
| | U.S. dollars | Euros | Japanese Yen | |||||||
Contract totals/£M | 14.2 | 27.7 | 0.1 | |||||||
Maturity dates | 01/14 to 03/15 | 01/14 to 04/15 | 01/14 to 01/14 | |||||||
Exchange rates | $ | 1.5021 to $1.6509 | €1.1395 to €1.2665 | ¥173.37 to ¥173.37 | ||||||
| | 2013 Purchase hedges | ||||||
|---|---|---|---|---|---|---|---|
| | U.S. dollars | Euros | Canadian dollars | ||||
Contract totals/£M | 17.3 | N/A | N/A | ||||
Maturity dates | 01/14 to 04/15 | N/A | N/A | ||||
Exchange rates | $ | 1.4888 to $1.6181 | N/A | N/A | |||
The fair value of the above hedges was $0.8 million as of December 31, 2013. Under "International Accounting Standard 39—Financial Instruments: Recognition and Measurement," a gain of $1.0 million has been deferred from recognition in our consolidated income statement until 2014, because it relates to effective hedges against forecasted sales and purchases in 2014 and 2015. We disclose the amount deferred separately under hedging reserve in our consolidated balance sheet.
Effect of Commodity Price Movements on Results of Operations
Commodity price risk
We are exposed to commodity price risks in relation to the purchases of our raw materials. The raw materials we use include primary magnesium, rare earth metals and chemical compounds, zircon sand, zirconium oxychloride intermediates and other chemical inputs like soda ash for the Elektron division and aluminum log and sheet and carbon fiber for the Gas Cylinders division. Many of these raw materials have been subject to price rises and volatility over the last few years, some of which were substantial.
In 2012, against the backdrop of global economic uncertainties, raw material prices generally stabilized or reduced from previous peak prices. The average LME price for aluminum was $2,049 per metric ton in 2012, a reduction of $370 per metric ton, or 15%, from the 2011 equivalent figure. Magnesium costs were almost identical in cost in 2012 to the previous year with the average price of Chinese magnesium on a free on board basis being $3,114 per metric ton, a $2 per metric ton difference in 2012 compared to 2011. The largest single impact on our business in previous years was that of cerium carbonate. By the end of 2011 we had seen a softening of the price quoted on the Asian Metal Market to approximately $95 per kilogram (oxide contained) from the peak of $270 per kilogram months earlier. 2012 saw an increase in the supply of cerium carbonate and a return to more stable market conditions. As a result of this, the quoted Asian Metal Index price of cerium carbonate reduced progressively during the year, closing at approximately $28 per kilogram by December 2012.
In 2013 raw material prices generally decreased or stabilized. The average LME price for aluminum was $1,887 per metric ton in 2012, a reduction of $162 per metric ton, or 8%, from the 2012 equivalent figure. Magnesium costs reduced in 2013 compared to the previous year with the average price of Chinese magnesium on a free on board basis being $2,713 per metric ton, a $401 per metric ton difference in 2013 compared to 2012. 2013 saw market conditions for rare earth chemicals stabilize further, with the quoted Asian Metal Index price of cerium carbonate, a raw material which has had a significant impact on the business over the previous few years, reduce progressively during the year, closing at approximately $8 per kilogram by December 2013.
128
Utility costs slightly increased by $1.0 million in 2013 compared to 2012 with the increase in costs being due to higher usage of gas and electricity, with a full year contribution of costs from the former Dynetek operations; and higher unit costs of electricity, gas and water. We continue to seek further cost savings in this area, especially given the risk of higher water and energy costs in the medium to long-term.
Primary aluminum is a global commodity, with its principal trading market on the LME. In the normal course of business, we are exposed to aluminum price volatility to the extent that the prices of aluminum purchases are more closely related to the LME price than the sales prices of certain of our products. Our Gas Cylinder division will buy various aluminum alloys, in log, sheet, or tube form, and the contractual price will usually include a LME-linked base cost plus a premium for a particular type of alloy and the cost of casting, rolling or extruding. The price of high-grade aluminum, which is actively traded on the LME, has fluctuated significantly in recent years as shown in the LME price graph below. The price remains volatile and difficult to predict. Since aluminum is the Gas Cylinders division's largest single raw material cost, these fluctuations in the cost of aluminum can affect this division's and our financial results. In order to help mitigate this risk, we enter into LME-related transactions in the form of commodity contracts. Historically we have also ordered a certain amount of our aluminum billet purchases on a forward fixed price.
The three-month LME price for primary aluminum was as follows from January 1, 2010 through December 31, 2013:
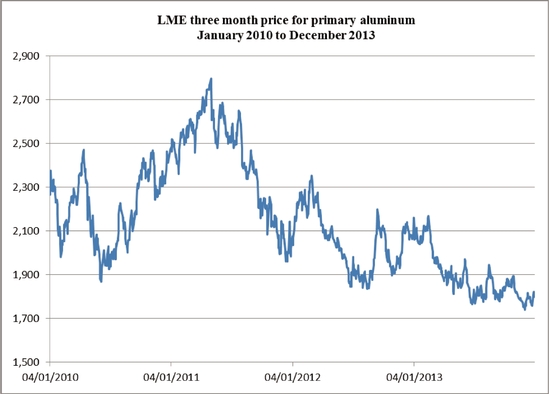
Source: London Metal Exchange
We estimate that changes in the LME price of aluminum will normally take approximately three months to impact our reported costs of sales and operating profits. There was an increase in aluminum costs in the second half of 2010 which continued into 2011 with the average three month LME cost of primary aluminum being 10.0% higher in 2011 compared to 2010. The higher base cost increased our aluminum purchase costs by $2.6 million in 2011 compared to 2010. In the later stages of 2011, the average three month LME cost of primary aluminum began to fall, and this reduction continued in the first nine months
129
of 2012, recovering slightly by December 2012. This overall reduction in 2012 reduced our cost base in 2012 by $1.3 million compared to 2011. The LME price reduced in 2013 also, reducing our cost base on 2012 by $0.4 million.
We estimate the average LME cost of our hedges was $2,173 per metric ton in 2013, $2,220 per metric ton in 2012 and $2,405 per metric ton in 2011.
There is no similar financial market to hedge magnesium, zirconium raw materials or carbon fiber, and prices for these raw materials have been volatile in recent years with some increasing substantially. To help mitigate these risks, we have a number of fixed-price supply contracts for these raw materials, which limit our exposure to price volatility over a calendar year. However, we remain exposed over time to rising prices in these markets, and therefore rely on the ability to pass on any major price increases to our customers in order to maintain our levels of profitability for zirconium- and magnesium-based products. We have also in the last few years, when we felt it was appropriate, made additional physical purchases of magnesium and some rare earth chemicals to delay the impact of higher prices, but this has had a cash flow impact on occasion thereby leading to greater utilization of our revolving credit bank facilities. Also, the cost of magnesium in the United States is fairly high due to the protection of the U.S. market from Chinese imports through anti-dumping tariffs.
Ultimately we aim to recover all our raw material cost increases through adjustment to our sales prices. However, for aluminum costs, we can utilize LME financial derivative contracts over a one to two year period to mitigate shorter term fluctuations and protect us in the short term as we renegotiate sales prices with customers.
Hedging of aluminum metal price risk
Based on current sales mix between composite and aluminum cylinders, we expect that our gas cylinders operations will need to purchase approximately 10,000 to 14,000 metric tons of primary aluminum each year, in various sizes of billet and various types of alloy, and that another approximately 1,000 metric tons per year of various forms of fabricated sheet aluminum will be purchased for use in our Superform and composite cylinder production processes. Normally, the division will recover approximately 2,500 to 3,500 metric tons per year of process scrap and would expect to be able to sell this scrap into the market at prices linked to the LME prices. Over time, we have also aimed to recover cost increases via sales price increases, and use LME hedging to protect margins for the next 12 to 18 months.
In 2013, approximately 63% of our price risk on primary aluminum costs was covered with LME hedges. Together, we estimate we have 63% and 32% of our forecasted price risk of aluminum covered by LME derivative contracts for 2014 and 2015 respectively.
Our hedging policy is designed to enable us to benefit from a more stable cost base. The effect of the LME-related transactions we enter into is to mitigate the unfavorable impact of price increases on aluminum purchases. Under IFRS, similar to the treatment of derivative financial instruments used to hedge foreign currency risk, the change in the fair value of the LME contracts that relate to future transactions is deferred and held in an equity hedging reserve account. Gains and losses derived from such commodity contracts are reflected in the cost of goods sold when the underlying physical transaction takes place. The LME contracts we had at the end of 2013 had a mark-to-market loss of $1.2 million, which was deferred and included in the equity hedging reserve account. This compares to a mark-to-market loss of $0.3 million in 2012.
Our hedging policy aims to achieve protection against our calculated exposure to metal price volatility for a full calendar year by the end of the immediately preceding year. We use our hedging policy to minimize risk rather than to engage in speculative positions on the underlying commodity. Although this may result in losses on hedged positions, the downside risk of un-hedged exposure to aluminum prices can be far greater. If we did not hedge our aluminum exposure and were unable to pass additional costs onto customers, we
130
estimate, based on a price exposure on 10,000 metric tons that a $100 annual increase in the price of aluminum on the LME would result in a $1.0 million adverse effect on our full year operating profit.
Effect of Interest Rate Movements
Interest Rate Risk
As at December 31, 2013, we only have fixed rate debt outstanding on our consolidated balance sheet. We are potentially exposed to market risks related to floating interest rates if we draw-down on our Revolving Credit Facility. As a result of this exposure, we sometimes used to hedge interest payable under our floating rate indebtedness based on a combination of forward rate agreements, interest rate caps and swaps. There were no fixed rate interest hedge agreements in place at December 31, 2013 and December 31, 2012.
On May 13, 2011, we entered into the Senior Facilities Agreement and Note Purchase Agreement, providing a variable interest rate Term Loan and Revolving Credit Facility and fixed rated Loan Notes due 2018. This debt was all drawn down on June 15, 2011. The Loan Notes due 2018 have a $65 million principal amount a fixed rate of interest of 6.19%. The Term Loan was fully repaid in October 2012 and under the revised agreement, the value of debt repaid can now be re-drawn against the revolving credit facility available in pound sterling, U.S. dollars or euros up to a maximum aggregate principal amount of £70 million ($116 million), of which $nil was outstanding at December 31, 2013. Should our future need require us to utilize this facility, the variable interest charged will be linked to LIBOR (or, in the case of euro loans, EURIBOR).
Item 12. Description of Securities Other Than Equity Securities
A. Debt Securities
Not applicable.
B. Warrant and Rights
Not applicable.
C. Other Securities
Not applicable.
131
D. American Depositary Shares
Fees payable by ADR Holders
The following table shows the fees and charges that a holder of our ADR may have to pay, either directly or indirectly. The majority of these costs are set by the Depositary and are subject to change:
| Persons depositing or withdrawing ordinary shares or ADS holders must pay: | For: | |
$5.00 (or less) per 100 ADSs (or portion of 100 ADSs) | Issuance of ADSs, including issuances resulting from a distribution of ordinary shares or rights or other property Cancellation of ADSs for the purpose of withdrawal, including if the deposit agreement terminates | |
$0.02 per ADS per annum | Any cash distribution to ADS holders | |
A fee equivalent to the fee that would be payable if securities distributed to you had been ordinary shares and the ordinary shares had been deposited for issuance of ADSs | Distribution of securities distributed to holders of deposited securities which are distributed by the depositary to ADS holders | |
Registration or transfer fees | Transfer and registration of shares on our share register to or from the name of the depositary or its agent when you deposit or withdraw ordinary shares | |
Expenses of the depositary | Cable, telex and facsimile transmissions (when expressly provided in the deposit agreement) | |
Converting foreign currency to U.S. dollars | ||
Taxes and other governmental charges the depositary or the custodian have to pay on any ADS or share underlying an ADS, for example, stock transfer taxes, stamp duty or withholding taxes | As necessary | |
Any charges incurred by the depositary or its agents for servicing the deposited securities | As necessary |
Fees and other payments made by the depositary to Luxfer
The depositary has agreed to reimburse us for certain expenses we incur in relation to the ADS program.
During the year ended December 31, 2013, we received $0.3 million in fees from the depositary of our ADSs.
132
Item 13. Defaults, Dividend Arrearages and Delinquencies.
None
Item 14. Material Modifications To The Rights of Security Holders and Use of Proceeds.
Not applicable
Item 15. Controls & Procedures.
We have carried out an evaluation of the effectiveness of the design and operation of our disclosure controls and procedures (as such term is defined in Rules 13a-15(e) and 15d-15(e) under the Exchange Act) under the supervision and the participation of the Executive Management Board, which is responsible for the management of the internal controls, and which includes the Chief Executive Officer and the Group Finance Director. There are inherent limitations to the effectiveness of any system of disclosure controls and procedures, including the possibility of human error and the circumvention or overriding of the controls and procedures. Accordingly, even effective disclosure controls and procedures can only provide reasonable assurance of achieving their control objectives. Based upon our evaluation as of December 31, 2013, the Chief Executive Officer and Group Finance Director have concluded that the disclosure controls and procedures (i) were effective at a reasonable level of assurance as of the end of the period covered by this Annual Report in ensuring that information required to be recorded, processed, summarized and reported in the reports that are filed or submitted under the Exchange Act, is recorded, processed, summarized and reported within the time periods specified in the SEC's rules and forms and (ii) were effective at a reasonable level of assurance as of the end of the period covered by this Annual Report in ensuring that information to be disclosed in the reports that are filed or submitted under the Exchange Act is accumulated and communicated to the management of the Company, including the Principal Executive Officer and the Principal Financial Officer, to allow timely decisions regarding required disclosure.
In accordance with the requirements of section 404 of Sarbanes-Oxley, the following report is provided by management in respect of our internal control over financial reporting (as defined in Rules 13a-15(f) and 15d-15(f) under the US Securities Exchange Act of 1934):
- •
- management is responsible for establishing and maintaining adequate internal control over financial reporting for the Group. Internal control over financial reporting is designed to provide reasonable assurance regarding the reliability of financial reporting and the preparation of financial statements for external purposes in accordance with IFRS;
- •
- management conducted an evaluation of the effectiveness of internal control over financial reporting based on the framework in Internal Control—Integrated Framework (1992 Framework) issued by the Committee of Sponsoring Organizations of the Treadway Commission;
- •
- management has assessed the effectiveness of internal control over financial reporting, as at December 31, 2013 and has concluded that such internal control over financial reporting was effective. In addition, there have been no changes in the Group's internal control over financial reporting during 2013 that have materially affected, or are reasonably likely to affect materially, the Group's internal control over financial reporting.
Item 16a. Audit Committee Financial Expert
The Company announced on March 1, 2013 that it had appointed an additional Non-Executive Director, David Landless, who is serving as the audit committee financial expert and is independent for the purposes of Rule 10A-3 of the Exchange Act, the U.K. Corporate Governance Code and NYSE Section 303A.02.
133
The Company has adopted a formal code of ethics applicable to the chief executive officer, group financial director, group financial controller.
The Company's code of ethics is available on our website at http://investor.luxfer.com/corporate-governance
Item 16c. Principal Accountant Fees and Services
Ernst & Young LLP (E&Y) acted as our independent auditor for the fiscal years ended December 31, 2013 and December 31, 2012. The table below sets out the amount billed to us by E&Y for services performed in the year ended December 31, 2013 and 2012 and breaks down these amounts by category:
| | 2013 | 2012 | |||||
|---|---|---|---|---|---|---|---|
| | $ Millions | ||||||
Audit Fees | 1.0 | 0.9 | |||||
Audit Related Fees | 0.1 | 0.4 | |||||
Tax Fees | |||||||
Tax Compliance Fees | 0.4 | 0.5 | |||||
Tax Advisory Fees | 0.2 | 0.3 | |||||
| | | | | | | | |
Total | 1.7 | 2.1 | |||||
| | | | | | | | |
| | | | | | | | |
Audit Fees
Audit fees in 2013 and 2012 were related to the audit of our consolidated financial statements and other audit or interim review services provided in connection with statutory and regulatory filings or engagements.
Audit Related Fees
Audit related fees in 2012 were related to professional services rendered in connection with our IPO.
Tax Fees
Tax Compliance and Tax Advisory fees in 2013 and 2012 were related to tax compliance and tax planning services.
Pre-approval policies and procedures
The audit committee has established pre-approval policies and procedures which are followed prior to the engagement of E&Y relating to the carrying out of audit and non-audit services. All services provided by our auditors are approved in advance by the audit committee in accordance with such policies and procedures.
Item 16d. Exemptions From The Listing Standards For Audit Committees
Item 16e. Purchases of Equity Securities by the Issuer and Affiliated Purchasers
Not applicable.
Item 16f. Change in the Registrants Certifying Accountant
Not applicable.
134
Item 16g. Corporate Governance
Corporate governance practices
Our ADSs are listed on the New York Stock Exchange (NYSE). As a foreign private issuer, we are permitted to follow home-country practice in lieu of certain NYSE corporate governance requirements. As a U.K. company, our corporate governance practices are governed by our bylaws and the Companies Act 2006. The significant differences between our corporate governance practices as a U.K. company and those required by NYSE listing standards for U.S. companies are listed as follows:
Independence
The NYSE listing standards provide that listed companies must have a majority of independent directors and that certain board committees must consist solely of independent directors. Under NYSE rule 303A.02, a director qualifies as independent only if the board affirmatively determines that such director has no material relationship with the company, either directly or indirectly. In addition, the NYSE listing standards enumerate a number of relationships that preclude independence. We have determined that our Non-Executive Directors are independent for the purposes of Rule 10A-3 of the Exchange Act and the U.K. Corporate Governance Code but we have not yet made an affirmative determination that our Non-Executive Directors are independent for the purposes of Rule 303A.02.
Committees
We have board committees that are different than those required by NYSE rules for domestic U.S. companies. For instance, we have a nomination committee but it does not deal with corporate governance issues. Our remuneration committee is broadly similar to the compensation committee the NYSE rules require for domestic U.S. companies. We also have an audit committee, which NYSE rules require for both U.S. companies and foreign private issuers. The audit committee, the remuneration committee and the nomination committee are composed solely of Non-Executive Directors whom the board has determined to be independent, in the manner described above.
Equity Compensation Plans
We comply with legal requirements under the Companies Act 2006 and our bylaws regarding shareholder approval to the extent required in respect of equity compensation plans. The Companies Act 2006 does not require shareholder approval of equity compensation plans and certain revisions thereof for which the NYSE listing standards require such shareholder approval.
Code of Ethics
The Companies Act 2006 does not require us to adopt a Code of Ethics. See Item 16b. Code of Ethics.
Item 16h. Mine Safety Disclosure
Not applicable.
135
Not applicable.
The audited consolidated financial statements as required under Item 18 are attached hereto starting on page F-1 of this Annual Report. The audit reports of Ernst & Young LLP, independent registered public accounting firm, is included herein preceding the audited consolidated financial statements.
| 1.1 | Articles of Association of the Registrant (incorporated by reference to Exhibit 3.1 to our Registration Statement on Form F-1 (file no. 333-178278), as amended, initially filed with the SEC on December 2, 2011) | ||
2.1 | Form of specimen certificate evidencing ordinary shares (incorporated by reference to Exhibit 2.1 to our Registration Statement on Form F-1 (file no. 333-178278), as amended, initially filed with the SEC on December 2, 2011) | ||
2.2 | Form of Deposit Agreement among Luxfer Holdings PLC, The Bank of New York Mellon and holders of American Depositary Receipts (incorporated by reference to Exhibit 2.2 to our Registration Statement on Form F-1 (file no. 333-178278), as amended, initially filed with the SEC on December 2, 2011) | ||
4.1 | Note Purchase Agreement dated as of May 13, 2011 by and among BA Holdings, Inc. and the parties named therein, as amended on November 30, 2012 and March 25, 2014. | ||
4.2 | Senior Facilities Agreement dated as of May 13, 2011, as amended and restated on March 25, 2014 by and among Luxfer Holdings PLC and the parties named therein | ||
4.3 | Executive Share Option Plan (incorporated by reference to Exhibit 10.3 to our Registration Statement on Form F-1 (file no. 333-178278), as amended, initially filed with the SEC on December 2, 2011) | ||
4.4 | Long-Term Umbrella Incentive Plan (incorporated by reference to Exhibit 10.4 to our Registration Statement on Form F-1 (file no. 333-178278), as amended, initially filed with the SEC on December 2, 2011) | ||
4.5 | Amendment No. 1 to Long-Term Umbrella Incentive Plan (incorporated by reference to Exhibit 4.5 to our Annual Report on Form 20-F (file no. 001-35370), initially filed with the SEC on March 29, 2013) | ||
4.6 | Amendment No. 2 to Long-Term Umbrella Incentive Plan (incorporated by reference to Exhibit 4.6 to our Annual Report on Form 20-F (file no. 001-35370), initially filed with the SEC on March 29, 2013) | ||
4.7 | Amended and Restated Non-Executive Director Equity Incentive Plan (incorporated by reference to Exhibit 4.7 to our Annual Report on Form 20-F (file no. 001-35370), initially filed with the SEC on March 29, 2013) | ||
8.1 | List of Subsidiaries (included under Item 4.C "Organizational Structure" in this Annual Report on Form 20-F) | ||
12.1 | Certification Required by Rule 13a-14(a) or 15d-14(a) under the Securities Exchange Act of 1934—Brian Gordon Purves |
136
| 12.2 | Certification Required by Rule 13a-14(a) or 15d-14(a) under the Securities Exchange Act of 1934—Andrew Michael Beaden | ||
13.1 | Certification Pursuant to Section 906 of the Sarbanes-Oxley Act of 2002 (Subsections (a) and (b) of Section 1350, Chapter 63 of Title 18, United States Code)—Brian Gordon Purves | ||
13.2 | Certification Pursuant to Section 906 of the Sarbanes-Oxley Act of 2002 (Subsections (a) and (b) of Section 1350, Chapter 63 of Title 18, United States Code)—Andrew Michael Beaden | ||
15.1 | Consent of Ernst & Young LLP |
137
The registrant hereby certifies that it meets all of the requirements for filing on Form 20-F and that it has duly caused and authorized the undersigned to sign this Annual Report on its behalf.
| Luxfer Holdings PLC | ||||||
March 31, 2014 | By: | /s/ Andrew Michael Beaden | ||||
| Andrew Michael Beaden | ||||||
| Group Finance Director | ||||||
138
INDEX TO CONSOLIDATED FINANCIAL STATEMENTS
| | Page | |
|---|---|---|
Consolidated Financial Statements | ||
Report of Independent Registered Public Accounting Firm | F-2 | |
Consolidated Income Statement for the years ended December 31, 2013, 2012 and 2011 | F-3 | |
Consolidated Statement of Comprehensive Income for the years ended December 31, 2013, 2012 and 2011 | F-4 | |
Consolidated Balance Sheet as of December 31, 2013 and 2012 | F-5 | |
Consolidated Cash Flow Statement for the years ended December 31, 2013, 2012 and 2011 | F-6 | |
Consolidated Statement of Changes in Equity for the years ended December 31, 2013, 2012 and 2011 | F-7 | |
Notes to the Consolidated Financial Statements | F-8 |
F-1
Report of Independent Registered Public Accounting Firm
The Board of Directors and Shareholders of Luxfer Holdings PLC
We have audited the accompanying consolidated balance sheets of Luxfer Holdings PLC as of December 31, 2013 and 2012, and the related consolidated income statement, consolidated statement of comprehensive income, consolidated cash flow statement and consolidated changes in equity, for each of the three years in the period ended December 31, 2013. These financial statements are the responsibility of the Company's management. Our responsibility is to express an opinion on these financial statements based on our audits.
We conducted our audits in accordance with the standards of the Public Company Accounting Oversight Board (United States). Those standards require that we plan and perform the audit to obtain reasonable assurance about whether the financial statements are free of material misstatement. We were not engaged to perform an audit of the Company's internal control over financial reporting. Our audits included consideration of internal control over financial reporting as a basis for designing audit procedures that are appropriate in the circumstances, but not for the purpose of expressing an opinion on the effectiveness of the Company's internal control over financial reporting. Accordingly, we express no such opinion. An audit also includes examining, on a test basis, evidence supporting the amounts and disclosures in the financial statements, assessing the accounting principles used and significant estimates made by management, and evaluating the overall financial statement presentation. We believe that our audits provide a reasonable basis for our opinion.
In our opinion, the financial statements referred to above present fairly, in all material respects, the consolidated financial position of Luxfer Holdings PLC at December 31, 2013 and 2012, and the consolidated results of its operations and its cash flows for each of the three years in the period ended December 31, 2013, in conformity with International Financial Reporting Standards as adopted by International Accounting Standards Board.
/s/ Ernst & Young LLP
March 31, 2014
F-2
LUXFER HOLDINGS PLC
CONSOLIDATED INCOME STATEMENT
All amounts in millions
| | | | Restated under IAS 19R | |||||||
|---|---|---|---|---|---|---|---|---|---|---|
| | Notes | 2013 $M | 2012 $M | 2011 $M | ||||||
CONTINUING OPERATIONS | ||||||||||
REVENUE | 2 | 481.3 | 511.6 | 510.8 | ||||||
| | | | | | | | | | | |
Cost of sales | (363.5 | ) | (385.7 | ) | (390.4 | ) | ||||
| | | | | | | | | | | |
Gross profit | 117.8 | 125.9 | 120.4 | |||||||
Other income | — | — | 2.0 | |||||||
Distribution costs | (6.5 | ) | (6.9 | ) | (7.3 | ) | ||||
Administrative expenses | (52.2 | ) | (50.4 | ) | (51.2 | ) | ||||
Share of results of joint ventures | 14 | 0.1 | (0.1 | ) | (0.2 | ) | ||||
| | | | | | | | | | | |
TRADING PROFIT | 2 | 59.2 | 68.5 | 63.7 | ||||||
Restructuring and other income (expense) | 5 | (2.7 | ) | (2.1 | ) | 0.2 | ||||
| | | | | | | | | | | |
OPERATING PROFIT | 3 | 56.5 | 66.4 | 63.9 | ||||||
Other income (expense): | ||||||||||
Acquisitions and disposals | 5 | (0.1 | ) | (0.8 | ) | (0.2 | ) | |||
Finance income: | ||||||||||
Interest received | 7 | 0.3 | 0.2 | 0.2 | ||||||
Finance costs | ||||||||||
Interest costs | 8 | (6.2 | ) | (6.7 | ) | (9.2 | ) | |||
IAS 19—retirement benefits finance charge | 8 | (3.8 | ) | (3.6 | ) | (1.9 | ) | |||
| | | | | | | | | | | |
PROFIT ON OPERATIONS BEFORE TAXATION | 46.7 | 55.5 | 52.8 | |||||||
Tax expense | 9 | (12.6 | ) | (16.0 | ) | (12.5 | ) | |||
| | | | | | | | | | | |
NET INCOME FOR THE YEAR | 34.1 | 39.5 | 40.3 | |||||||
| | | | | | | | | | | |
| | | | | | | | | | | |
Attributable to: | ||||||||||
Equity shareholders | 34.1 | 39.5 | 40.3 | |||||||
| | | | | | | | | | | |
Earnings per share: | ||||||||||
Basic | ||||||||||
Unadjusted | 10 | $2.54 | $3.68 | $4.08 | ||||||
| | | | | | | | | | | |
Diluted | ||||||||||
Unadjusted | 10 | $2.43 | $3.61 | $4.04 | ||||||
| | | | | | | | | | | |
F-3
LUXFER HOLDINGS PLC
CONSOLIDATED STATEMENT OF COMPREHENSIVE INCOME
All amounts in millions
| | | | Restated under IAS 19R | ||||||
|---|---|---|---|---|---|---|---|---|---|
| | Notes | 2013 $M | 2012 $M | 2011 $M | |||||
Net income for the year | 34.1 | 39.5 | 40.3 | ||||||
| | | | | | | | | | |
Other comprehensive income movements: | |||||||||
Exchange differences on translation of foreign operations | 3.1 | 2.9 | (5.4 | ) | |||||
Fair value movements in cash flow hedges | (0.8 | ) | (0.1 | ) | 0.9 | ||||
Transfers to income statement on cash flow hedges | — | (0.2 | ) | (0.2 | ) | ||||
Exchange differences on translation of hedging reserve | — | — | (0.1 | ) | |||||
Deferred tax on cash flow hedges | 0.1 | — | — | ||||||
| | | | | | | | | | |
Hedge accounting income adjustments | (0.7 | ) | (0.3 | ) | 0.6 | ||||
Total hedge accounting and translation of foreign operation movements | 2.4 | 2.6 | (4.8 | ) | |||||
| | | | | | | | | | |
Remeasurement of defined benefit retirement plans | 28 | 23.7 | (17.4 | ) | (49.8 | ) | |||
Deferred tax on retirement benefit changes | 23 | (9.1 | ) | 2.9 | 13.9 | ||||
| | | | | | | | | | |
Retirement benefit changes | 14.6 | (14.5 | ) | (35.9 | ) | ||||
| | | | | | | | | | |
Total other comprehensive income movements for the year | 17.0 | (11.9 | ) | (40.7 | ) | ||||
| | | | | | | | | | |
Total comprehensive income for the year | 51.1 | 27.6 | (0.4 | ) | |||||
| | | | | | | | | | |
Attributed to: | |||||||||
Equity shareholders | 51.1 | 27.6 | (0.4 | ) | |||||
| | | | | | | | | | |
| | | | | | | | | | |
F-4
LUXFER HOLDINGS PLC
CONSOLIDATED BALANCE SHEET
All amounts in millions
| | Notes | December 31, 2013 | December 31, 2012 | ||||||
|---|---|---|---|---|---|---|---|---|---|
| | | $M | $M | ||||||
ASSETS | |||||||||
Non-current assets | |||||||||
Property, plant and equipment | 11 | 137.9 | 129.6 | ||||||
Intangible assets | 12 | 41.4 | 38.4 | ||||||
Investments | 14 | 7.9 | 0.8 | ||||||
Deferred tax assets | 23 | 15.8 | 21.6 | ||||||
| | | | | | | | | | |
| 203.0 | 190.4 | ||||||||
Current assets | |||||||||
Inventories | 15 | 94.1 | 83.8 | ||||||
Trade and other receivables | 16 | 68.6 | 74.4 | ||||||
Income tax receivable | 2.0 | 1.7 | |||||||
Cash and short term deposits | 17 | 28.4 | 40.2 | ||||||
| | | | | | | | | | |
| 193.1 | 200.1 | ||||||||
| | | | | | | | | | |
TOTAL ASSETS | 396.1 | 390.5 | |||||||
| | | | | | | | | | |
| | | | | | | | | | |
EQUITY AND LIABILITIES | |||||||||
Capital and reserves attributable to the Group's equity holders | |||||||||
Ordinary share capital | 18 | 25.3 | 25.3 | ||||||
Deferred share capital | 18 | 150.9 | 150.9 | ||||||
Share premium account | 20 | 55.6 | 55.6 | ||||||
Retained earnings | 20 | 317.3 | 278.6 | ||||||
Own shares held by ESOP | 18 | (0.5 | ) | (0.5 | ) | ||||
Other capital reserves | 18 | 2.6 | 0.8 | ||||||
Hedging reserve | 20 | (0.3 | ) | 0.4 | |||||
Translation reserve | 20 | (25.4 | ) | (28.5 | ) | ||||
Merger reserve | 20 | (333.8 | ) | (333.8 | ) | ||||
| | | | | | | | | | |
Capital and reserves attributable to the Group's equity holders | 191.7 | 148.8 | |||||||
| | | | | | | | | | |
Total equity | 191.7 | 148.8 | |||||||
| | | | | | | | | | |
Non-current liabilities | |||||||||
Bank and other loans | 21 | 63.8 | 63.5 | ||||||
Retirement benefits | 28 | 67.6 | 96.7 | ||||||
Deferred tax liability | 23 | 5.5 | — | ||||||
Provisions | 22 | 2.2 | 2.8 | ||||||
| | | | | | | | | | |
| 139.1 | 163.0 | ||||||||
Current liabilities | |||||||||
Trade and other payables | 24 | 63.2 | 73.7 | ||||||
Current income tax liabilities | 0.3 | 3.1 | |||||||
Provisions | 22 | 1.8 | 1.9 | ||||||
| | | | | | | | | | |
| 65.3 | 78.7 | ||||||||
| | | | | | | | | | |
Total liabilities | 204.4 | 241.7 | |||||||
| | | | | | | | | | |
TOTAL EQUITY AND LIABILITIES | 396.1 | 390.5 | |||||||
| | | | | | | | | | |
| | | | | | | | | | |
F-5
LUXFER HOLDINGS PLC
CONSOLIDATED CASH FLOW STATEMENT
All amounts in millions
| | | | Restated under IAS 19R | ||||||
|---|---|---|---|---|---|---|---|---|---|
| | Notes | 2013 | 2012 | 2011 | |||||
| | | $M | $M | $M | |||||
RECONCILIATION OF CASH FLOWS FROM OPERATING ACTIVITIES | |||||||||
Net income for the year | 34.1 | 39.5 | 40.3 | ||||||
Adjustments to reconcile net income for the year to net cash from operating activities: | |||||||||
Income taxes | 9 | 9.6 | 11.1 | 11.8 | |||||
Deferred income taxes | 9 | 3.0 | 4.9 | 0.7 | |||||
Depreciation and amortization | 15.8 | 14.7 | 14.5 | ||||||
Charges/(credits) on retirement benefit obligations | 5 | 1.7 | — | (1.6 | ) | ||||
Share based compensation charges | 6 | 1.8 | 0.8 | — | |||||
Loss on disposal of property, plant and equipment | 3 | 0.3 | — | — | |||||
Net interest costs | 5.9 | 6.5 | 9.0 | ||||||
IAS 19 finance charge | 3.8 | 3.6 | 1.9 | ||||||
Acquisitions and disposals | 5 | 0.1 | — | 0.2 | |||||
Share of results of joint ventures | 14 | (0.1 | ) | 0.1 | 0.2 | ||||
Changes in operating assets and liabilities: | |||||||||
Decrease/(increase) in receivables | 5.7 | (1.3 | ) | (13.1 | ) | ||||
(Increase)/decrease in inventories | (9.1 | ) | 24.1 | (24.8 | ) | ||||
(Decrease)/increase in payables | (11.2 | ) | (15.3 | ) | 13.1 | ||||
Movement in retirement benefit obligations | (11.4 | ) | (9.8 | ) | (2.0 | ) | |||
Accelerated deficit contributions into retirement benefit obligations | — | — | (7.2 | ) | |||||
Decrease in provisions | 22 | (0.7 | ) | (0.6 | ) | (0.2 | ) | ||
Income tax paid | (12.2 | ) | (9.3 | ) | (13.7 | ) | |||
NET CASH FLOWS FROM OPERATING ACTIVITIES | 37.1 | 69.0 | 29.1 | ||||||
Net cash inflow from continuing operating activities | 37.1 | 69.0 | 29.4 | ||||||
Net cash outflow from discontinued operating activities | — | — | (0.3 | ) | |||||
CASH FLOWS FROM INVESTING ACTIVITIES | |||||||||
Purchases of property, plant and equipment | (24.2 | ) | (19.3 | ) | (21.2 | ) | |||
Purchases of intangible assets | (2.3 | ) | — | (0.3 | ) | ||||
Receipts from sales of property, plant and equipment | 0.1 | — | — | ||||||
Investment in joint ventures—equity funding | 14 | (2.5 | ) | (0.4 | ) | (0.3 | ) | ||
Investment in joint ventures—debt funding | 14 | (4.5 | ) | — | — | ||||
Proceeds from sale of business | — | 1.5 | 0.8 | ||||||
Net cashflow on purchase of business | — | (11.0 | ) | — | |||||
Disposal of intellectual property | 5 | — | (0.2 | ) | (0.2 | ) | |||
NET CASH USED IN INVESTING ACTIVITIES | (33.4 | ) | (29.4 | ) | (21.2 | ) | |||
NET CASH FLOW BEFORE FINANCING | 3.7 | 39.6 | 7.9 | ||||||
FINANCING ACTIVITIES | |||||||||
Interest and similar finance costs paid on banking facilities | (0.9 | ) | (1.8 | ) | (1.9 | ) | |||
Interest paid on Loan Notes due 2018 | (4.0 | ) | (3.9 | ) | (2.1 | ) | |||
Interest paid on Senior Notes due 2012 | — | — | (4.5 | ) | |||||
Interest received on Loan Note | — | — | 0.1 | ||||||
Interest income received from joint ventures | 0.1 | — | — | ||||||
Other interest received | 0.2 | 0.2 | 0.1 | ||||||
Dividends paid | 19 | (10.8 | ) | (5.8 | ) | — | |||
Draw down on previous banking facilities | — | — | 27.7 | ||||||
Repayment of previous banking facilities | — | — | (38.5 | ) | |||||
Draw down on banking facilities and other loans | — | — | 139.5 | ||||||
Repayment of banking facilities and other loans | — | (72.8 | ) | — | |||||
Repayment of Senior Notes due 2012 | — | — | (109.8 | ) | |||||
Redemption of preference shares | 18 | — | — | (0.1 | ) | ||||
Payment of banking facilities and other loans—financing costs | — | — | (5.1 | ) | |||||
Modification to banking facilities and other loans—financing costs | — | (0.6 | ) | — | |||||
Proceeds from issue of shares | — | 65.1 | — | ||||||
Share issue costs | (0.3 | ) | (3.5 | ) | — | ||||
Purchase of shares from ESOP | 18 | — | 0.1 | — | |||||
NET CASH FLOWS (USED IN)/FROM FINANCING ACTIVITIES | (15.7 | ) | (23.0 | ) | 5.4 | ||||
NET (DECREASE)/INCREASE IN CASH AND CASH EQUIVALENTS | (12.0 | ) | 16.6 | 13.3 | |||||
Net (decrease)/increase in cash and cash equivalents | (12.0 | ) | 16.6 | 13.3 | |||||
Net foreign exchange differences | 0.2 | 1.4 | (1.4 | ) | |||||
Cash and cash equivalents at January 1 | 17 | 40.2 | 22.2 | 10.3 | |||||
Cash and cash equivalents at December 31 | 17 | 28.4 | 40.2 | 22.2 | |||||
F-6
LUXFER HOLDINGS PLC
CONSOLIDATED STATEMENT OF CHANGES IN EQUITY
All amounts in millions
| | Equity attributable to the equity holders of the parent | ||||||||||||||||||||||
|---|---|---|---|---|---|---|---|---|---|---|---|---|---|---|---|---|---|---|---|---|---|---|---|
| | Notes | Ordinary share capital $M | Deferred share capital $M | Share premium account $M | Retained earnings $M | Own shares held by ESOP $M | Other reserves(1) $M | Total equity $M | |||||||||||||||
At January 1, 2011 | 19.6 | 150.9 | — | 255.0 | (0.6 | ) | (359.7 | ) | 65.2 | ||||||||||||||
| | | | | | | | | | | | | | | | | | | | | | | | |
Net income for the year | — | — | — | 40.3 | — | — | 40.3 | ||||||||||||||||
Currency translation differences | — | — | — | — | — | (5.5 | ) | (5.5 | ) | ||||||||||||||
Increase in fair value of cash flow hedges | — | — | — | — | — | 0.9 | 0.9 | ||||||||||||||||
Transfer to income statement on cash flow hedges | — | — | — | — | — | (0.2 | ) | (0.2 | ) | ||||||||||||||
Remeasurement of defined benefit retirement plans | — | — | — | (49.8 | ) | — | — | (49.8 | ) | ||||||||||||||
Deferred tax on items taken to other comprehensive income | — | — | — | 13.9 | — | — | 13.9 | ||||||||||||||||
| | | | | | | | | | | | | | | | | | | | | | | | |
Total comprehensive income for the year (restated under IAS 19R) | — | — | — | 4.4 | — | (4.8 | ) | (0.4 | ) | ||||||||||||||
| | | | | | | | | | | | | | | | | | | | | | | | |
At December 31, 2011 | 19.6 | 150.9 | — | 259.4 | (0.6 | ) | (364.5 | ) | 64.8 | ||||||||||||||
| | | | | | | | | | | | | | | | | | | | | | | | |
| | | | | | | | | | | | | | | | | | | | | | | | |
Net income for the year | — | — | — | 39.5 | — | — | 39.5 | ||||||||||||||||
Currency translation differences | — | — | — | — | — | 2.9 | 2.9 | ||||||||||||||||
Decrease in fair value of cash flow hedges | — | — | — | — | — | (0.1 | ) | (0.1 | ) | ||||||||||||||
Transfer to income statement on cash flow hedges | — | — | — | — | — | (0.2 | ) | (0.2 | ) | ||||||||||||||
Remeasurement of defined benefit retirement plans | — | — | — | (17.4 | ) | — | — | (17.4 | ) | ||||||||||||||
Deferred tax on items taken to other comprehensive income | — | — | — | 2.9 | — | — | 2.9 | ||||||||||||||||
| | | | | | | | | | | | | | | | | | | | | | | | |
Total comprehensive income for the year (restated under IAS 19R) | — | — | — | 25.0 | — | 2.6 | 27.6 | ||||||||||||||||
| | | | | | | | | | | | | | | | | | | | | | | | |
Equity dividends | 19 | — | — | — | (5.8 | ) | — | — | (5.8 | ) | |||||||||||||
Proceeds from shares issued | 20 | 5.7 | — | 59.4 | — | — | — | 65.1 | |||||||||||||||
Share issue costs | 20 | — | — | (3.8 | ) | — | — | — | (3.8 | ) | |||||||||||||
I.P.O related share based compensation charges | 18 | — | — | — | — | — | 0.8 | 0.8 | |||||||||||||||
Purchase of shares from ESOP | 18 | — | — | — | — | 0.1 | — | 0.1 | |||||||||||||||
| | | | | | | | | | | | | | | | | | | | | | | | |
Other changes in equity in the year | 5.7 | — | 55.6 | (5.8 | ) | 0.1 | 0.8 | 56.4 | |||||||||||||||
| | | | | | | | | | | | | | | | | | | | | | | | |
At December 31, 2012 | 25.3 | 150.9 | 55.6 | 278.6 | (0.5 | ) | (361.1 | ) | 148.8 | ||||||||||||||
| | | | | | | | | | | | | | | | | | | | | | | | |
| | | | | | | | | | | | | | | | | | | | | | | | |
Net income for the year | — | — | — | 34.1 | — | — | 34.1 | ||||||||||||||||
Currency translation differences | — | — | — | — | — | 3.1 | 3.1 | ||||||||||||||||
Decrease in fair value of cash flow hedges | — | — | — | — | — | (0.8 | ) | (0.8 | ) | ||||||||||||||
Remeasurement of defined benefit retirement plans | — | — | — | 23.7 | — | — | 23.7 | ||||||||||||||||
Deferred tax on items taken to other comprehensive income | — | — | — | (9.1 | ) | — | 0.1 | (9.0 | ) | ||||||||||||||
| | | | | | | | | | | | | | | | | | | | | | | | |
Total comprehensive income for the year | — | — | — | 48.7 | — | 2.4 | 51.1 | ||||||||||||||||
| | | | | | | | | | | | | | | | | | | | | | | | |
Equity dividends | 19 | — | — | — | (10.8 | ) | — | — | (10.8 | ) | |||||||||||||
Share based compensation charges | 18 | — | — | — | — | — | 1.8 | 1.8 | |||||||||||||||
Deferred tax on items taken to equity | 23 | — | — | — | 0.8 | — | — | 0.8 | |||||||||||||||
| | | | | | | | | | | | | | | | | | | | | | | | |
Other changes in equity in the year | — | — | — | (10.0 | ) | — | 1.8 | (8.2 | ) | ||||||||||||||
| | | | | | | | | | | | | | | | | | | | | | | | |
At December 31, 2013 | 25.3 | 150.9 | 55.6 | 317.3 | (0.5 | ) | (356.9 | ) | 191.7 | ||||||||||||||
| | | | | | | | | | | | | | | | | | | | | | | | |
| | | | | | | | | | | | | | | | | | | | | | | | |
- (1)
- Other reserves include a hedging reserve of a loss of $0.3 million (2012: gain of $0.4 million and 2011: gain of $0.7 million), a translation reserve of $25.4 million (2012: $28.5 million and 2011: $31.4 million), a merger reserve of $333.8 million (2012 and 2011: $333.8 million) and other capital reserves of $2.6 million (2012: $0.8 million and 2011: $nil).
F-7
LUXFER HOLDINGS PLC
NOTES TO THE CONSOLIDATED FINANCIAL STATEMENTS
(Dollars in millions)
1. Accounting policies
Basis of preparation and statement of compliance with IFRS
The consolidated financial statements have been prepared in accordance with the International Financial Reporting Standards (IFRS) as issued by both the International Accounting Standards Board and adopted by the European Union as they apply to the financial statements of the Group for the year ended December 31, 2013. The consolidated financial statements have been prepared on a historical cost basis, except where IFRS requires or permits fair value measurement.
The Directors have a reasonable expectation that the Group has adequate resources to continue in operational existence for the foreseeable future. Therefore the Directors continue to apply the going concern basis for accounting in the preparation of the financial statements.
For the purpose of the accompanying consolidated financial statements, subsequent events have been evaluated through to March 31, 2014, which is the date the financial statements were authorized by the board. The financial statements were issued on March 31, 2014.
Basis of consolidation
The consolidated financial statements comprise the financial statements of Luxfer Holdings PLC and its subsidiaries (the "Group") as at December 31 each year. The financial statements consolidated of the subsidiaries are prepared for the same reporting year as the parent company, using consistent accounting policies. All inter-company balances and transactions, including unrealized profits arising from intra-group transactions, have been eliminated in full.
Subsidiaries are consolidated from the date on which control is transferred to the Group and cease to be consolidated from the date on which control is transferred out of the Group.
The accounting policies which follow, set out those polices which apply in preparing the financial statements for the years ended December 31, 2011, December 31, 2012 and December 31, 2013.
Presentation currency
The consolidated financial statements are presented in US dollars and all values are rounded to the nearest $0.1 million except when otherwise indicated. The books of the Group's non-US entities are converted to US dollars at each reporting period date in accordance with the accounting policy below.
The functional currency of the holding company Luxfer Holdings PLC and its UK subsidiaries remains pounds sterling, being the most appropriate currency for those particular operations.
Business combinations and goodwill
Business combinations are accounted for using the acquisition method. The cost of an acquisition is measured as the aggregate of the consideration transferred, measured at acquisition date fair value and the amount of any non-controlling interest in the acquiree. The choice of measurement of non-controlling interest, either at fair value or at the proportionate share of the acquiree's identifiable net assets is determined on a transaction by transaction basis. Acquisition costs incurred are expensed and included in administrative expenses.
F-8
LUXFER HOLDINGS PLC
NOTES TO THE CONSOLIDATED FINANCIAL STATEMENTS (Continued)
(Dollars in millions)
1. Accounting policies (Continued)
Goodwill is initially measured at cost being the excess of the aggregate of the acquisition-date fair value of the consideration transferred and the amount recognized for the non-controlling interest over the net identifiable amounts of the assets acquired and the liabilities assumed in exchange for the business combination. After initial recognition, goodwill is measured at cost less any accumulated impairment losses. For the purpose of impairment testing, goodwill acquired in a business combination is, from the acquisition date, allocated to the Group's cash generating units that are expected to benefit from the combination. Where goodwill forms part of a cash-generating unit and part of the operation within that unit is disposed of, the goodwill associated with the operation disposed of is included in the carrying amount of the operation when determining the gain or loss on disposal of the operation. Goodwill disposed of in this circumstance is measured based on the relative values of the operation disposed of and the portion of the cash generating unit retained.
Goodwill arising on acquisitions before the date of transition to IFRS has been retained at the previous UK GAAP amounts subject to being tested for impairment at that date.
Negative goodwill is measured at cost being the excess of the net identifiable amounts of the assets acquired and the liabilities assumed in exchange for the business combination over the aggregate of the acquisition-date fair value of the consideration transferred and the amount recognized for the non-controlling interest. Any amount of negative goodwill is recognized immediately as income.
Patents and trademarks
Patents and trademarks are measured initially at purchase cost and are amortized on a straight-line basis over the lower of their estimated useful lives, or legal life, this being 17 to 20 years. The carrying values are reviewed for impairment when events or changes in circumstances indicate that the carrying amount may not be recoverable. Reviews are made annually of the estimated remaining lives and residual values of the patents and trademarks.
Revenue
Revenue excludes inter-company sales and value added tax and represents net invoice value less estimated rebates, returns and settlement discounts. Revenue is recognized on the sale of goods and services when the significant risks and rewards of ownership of those goods and services have been transferred to a third party.
Property, plant and equipment
Property, plant and equipment is stated at cost less accumulated depreciation and any impairment in value. Depreciation is initially calculated on a straight-line basis over the estimated useful life of the particular
F-9
LUXFER HOLDINGS PLC
NOTES TO THE CONSOLIDATED FINANCIAL STATEMENTS (Continued)
(Dollars in millions)
1. Accounting policies (Continued)
asset. As a result of the complexity of our manufacturing process, there is a wide range of plant and equipment in operation. The rate of annual charge is summarized as follows:
Freehold buildings | 3% – 10% | |
Leasehold land and buildings | The lesser of life of lease or freehold rate | |
Plant and equipment | 4% – 30% | |
Including: | ||
Heavy production equipment (including casting, rolling, extrusion and press equipment) | 4% – 6% | |
Chemical production plant and robotics | 10% – 15% | |
Other production machinery | 10% – 20% | |
Furniture, fittings, storage and equipment | 10% – 30% |
Freehold land is not depreciated.
Reviews are made annually of the estimated remaining lives and residual values of individual productive assets, taking account of commercial and technological obsolescence as well as normal wear and tear.
For any individual asset the carrying value is reviewed for impairment when events or changes in circumstances indicate the carrying value may not be recoverable. If any such indication exists and where the carrying value exceeds the estimated recoverable amount, the asset is written down to its recoverable amount. The recoverable amount of property, plant and equipment is the greater of the net selling price and the value in use. In assessing the value in use, the estimated future cash flows are discounted to their present value using a pre-tax discount rate that reflects current market assessments of the time value of money and the risks specific to the asset. For an asset that does not generate largely independent cash inflows, the recoverable amount is determined for the cash-generating unit to which the asset belongs. Impairment losses are recognized in the income statement as part of the profit or loss before tax.
An item of property, plant and equipment is derecognized upon disposal or when no future economic benefits are expected to arise from the continued use of the asset. Any gain or loss arising on derecognition of the asset (calculated as the difference between the net disposal proceeds and the carrying amount of the item) is included in the income statement in the year the item is derecognized.
Inventories
Inventories are stated at the lower of cost and net realizable value. Raw materials are valued on a first-in, first-out basis. Strategic purchases of inventories in order to secure supply and reduce the impact of price volatility on the cost of inventories are valued on an average cost basis. Work in progress and finished goods costs comprise direct materials and, where applicable, direct labor costs, an apportionment of production overheads and any other costs that have been incurred in bringing the inventories to their present location and condition. Net realizable value represents the estimated selling price less all estimated costs of completion and costs to be incurred in marketing, selling and distribution.
F-10
LUXFER HOLDINGS PLC
NOTES TO THE CONSOLIDATED FINANCIAL STATEMENTS (Continued)
(Dollars in millions)
1. Accounting policies (Continued)
Research and development
Research expenditure is written off as incurred. Internal development expenditure is charged to the income statement in the year it is incurred unless it meets the recognition criteria of IAS 38 "Intangible Assets". Where the recognition criteria are met, intangible assets are capitalized and amortized over their useful economic lives from product launch. Intangible assets relating to products in development are subject to impairment testing at each balance sheet date or earlier upon indication of impairment.
Foreign currencies
Transactions in currencies other than an operation's functional currency are initially recorded in the functional currency at the rate of exchange prevailing on the dates of transactions. At each balance sheet date, the foreign currency monetary assets and liabilities are translated into the functional currency at the rates prevailing on the balance sheet date. All differences are taken to the consolidated income statement with the exception of differences on foreign currency borrowings that provide a hedge against a net investment in a foreign entity. These are taken directly to equity until the disposal of the net investment, at which time they are recognized in the consolidated income statement. Tax charges and credits attributable to exchange differences on those borrowings are also dealt with in equity.
On consolidation, the assets and liabilities of the Group's foreign operations are translated at exchange rates prevailing on the balance sheet date. Income and expense items are translated at the average exchange rates for the period. Exchange differences that arise, if any, are classified as equity and transferred to the Group's translation reserve. Such translation differences are recognized in the income statement in the period in which the operation is disposed.
Income tax
Current income tax
Current income tax assets and liabilities for the current period are measured at the amount expected to be recovered from or paid to the taxation authorities. The tax rates and tax laws used to compute the amount are those that are enacted or substantively enacted, at the reporting date in the countries where the Group operates and generates taxable income.
Current income tax relating to items recognized directly in equity is recognized in equity and not in the income statement. Management periodically evaluates positions taken in the tax returns with respect to situations in which applicable tax regulations are subject to interpretation and establishes provisions where appropriate.
Deferred tax
Deferred income tax is the future corporation tax expected to be payable or recoverable on differences between the carrying amounts of assets and liabilities in the financial statements and the corresponding tax bases used in the computation of taxable profit, and is accounted for using the balance sheet liability method. Deferred income tax liabilities are generally recognized for all taxable temporary differences. Deferred income tax assets are recognized to the extent that it is probable that taxable profits will be
F-11
LUXFER HOLDINGS PLC
NOTES TO THE CONSOLIDATED FINANCIAL STATEMENTS (Continued)
(Dollars in millions)
1. Accounting policies (Continued)
available against which deductible temporary differences can be utilized. Such assets and liabilities are not recognized if the temporary difference arises from goodwill or from the initial recognition (other than in a business combination) of other assets and liabilities in a transaction that affects neither the tax profit nor the accounting profit.
Deferred income tax liabilities are recognized for taxable temporary differences arising on investments in subsidiaries, investments in associates, and interests in joint ventures, except where the Group is able to control the reversal of the temporary difference and it is probable that the temporary difference will not reverse in the foreseeable future.
The carrying amount of a deferred income tax asset is reviewed at each balance sheet date and reduced to the extent that it is no longer probable that sufficient taxable profits will be available to allow all or part of the asset to be recovered.
Deferred income tax is calculated at the tax rate that is expected to apply in the period when the liability is settled or the asset is realized based on tax rates and tax laws that have been enacted or substantively enacted at the balance sheet date. Deferred income tax is charged or credited in the income statement, except when it relates to items charged or credited directly to equity, in which case the deferred income tax is also dealt with in equity.
Leases
Finance leases, which transfer to the Group substantially all the risks and benefits incidental to ownership of the leased items, are capitalized as a fixed asset at the inception of the lease at the fair value of the leased asset or, if lower, at the present value of the minimum lease payments.
The capital element of the leasing commitment is shown as obligations under finance leases. Lease payments are apportioned between finance charges and reduction of the lease liability so as to achieve a constant rate of interest on the remaining balance of the liability. Finance charges are charged directly against income. Capitalized leased assets are depreciated over the shorter of the estimated useful life of the asset or the lease term.
Leases where the lessor retains substantially all the risks and benefits of ownership of the asset are classified as operating leases. Operating lease payments are recognized as an expense in the income statement on a straight-line basis over the lease term.
Retirement benefit costs
In respect of defined benefit plans, obligations are measured at discounted present value whilst plan assets are recorded at fair value. The cost of providing benefits is determined using the Projected Unit Method, with actuarial valuations being carried out at each balance sheet date.
The charge to the income statement is based on an actuarial calculation of the Group's portion of the annual expected costs of the benefit plans and the net interest cost, which is calculated by applying the discount rate to the net defined benefit obligation, taking into account contributions and benefits paid. Remeasurements are recognized in the statement of comprehensive income.
F-12
LUXFER HOLDINGS PLC
NOTES TO THE CONSOLIDATED FINANCIAL STATEMENTS (Continued)
(Dollars in millions)
1. Accounting policies (Continued)
When a settlement or curtailment occurs the obligation and related plan assets are re-measured using current actuarial assumptions and the resultant gain or loss recognized in the income statement in the period in which the settlement or curtailment occurs.
Payments to defined contribution plans are charged as an expense as they fall due.
Government grants
Government grants relating to property, plant and equipment are treated as deferred income and released to the income statement over the expected useful lives of the asset concerned.
Provisions
Provisions are recognized when the Group has a present obligation as a result of a past event, it is probable that a transfer of resources will be required to settle the obligation and a reliable estimate can be made of the amount of the obligation.
Share based compensation
The cost of equity-settled transactions is recognized, based upon the fair value at grant date, together with a corresponding increase in other capital reserves in equity, over the period in which the performance or service conditions are fulfilled. The cumulative expense recognized for equity-settled transactions at each reporting date until the vesting date reflects the extent to which the vesting period has expired and the Group's best estimate of the number of equity instruments that will ultimately vest. The income statement expense or credit for a period represents the movement in cumulative expense recognized as at the beginning and end of that period.
Cash and cash equivalents
Cash and cash equivalents in the balance sheet comprise cash at bank and in hand and short-term deposits with an original maturity date of three months or less. For the purpose of the consolidated cash flow statement, cash and cash equivalents consist of cash and cash equivalents as defined above.
Discontinued operations and assets and liabilities held for sale
Discontinued operations are those operations that represent a separately identifiable major line of business that has either been disposed of, or is classified as held for sale.
For those activities classified as discontinued, the post-tax profit or loss is disclosed separately on the face of the income statement. The cash flows associated with the discontinued operation are also disclosed.
Assets (or disposal groups) held for sale are classified as assets held for sale and stated at the lower of their carrying amount and fair value costs to sell, if their carrying amount is recovered principally through a sale transaction rather than through continuing use. Assets held for sale are no longer amortized or depreciated from the time they are classified as such.
F-13
LUXFER HOLDINGS PLC
NOTES TO THE CONSOLIDATED FINANCIAL STATEMENTS (Continued)
(Dollars in millions)
1. Accounting policies (Continued)
Interest in joint ventures
The Group has interests in joint ventures which are joint arrangements, whereby the venturers have a contractual arrangement that establishes joint control over the economic activities of the entity. The Group recognizes its interest in its joint ventures using the equity method.
Under the equity method, the investment in a joint venture is carried in the balance sheet at cost plus post acquisition changes in the Group's share of net assets of the joint venture. The income statement reflects the share of the results of the joint venture. The share of the result of joint venture is shown on the face of the income statement. This is the result attributable to equity holders of the joint venture.
The financial statements of the joint ventures are prepared for the same reporting period as the parent company. Where necessary, adjustments are made to bring the accounting policies in line with those of the Group.
After application of the equity method, the Group determines whether it is necessary to recognize an additional impairment loss on the Group's investment in a joint venture. The Group determines at each reporting date whether there is any objective evidence that the investment in a joint venture is impaired. If this is the case the Group calculates the amount of impairment as the difference between the recoverable amount of a joint venture and its carrying value and recognizes the amount in the income statement.
Upon loss of joint control and provided the former joint control entity does not become a subsidiary or associate, the Group measures and recognizes its remaining investment at its fair value. Any difference between the carrying amount of the former joint controlled entity upon loss of joint control and the fair value of the remaining investment and proceeds from disposal is recognized in profit or loss. When the remaining investment constitutes significant influence, it is accounted for as investment in an associate.
Financial assets and liabilities
Trade and other receivables
Trade receivables do not carry any interest and are stated at their nominal value as reduced by appropriate allowances for estimated irrecoverable amounts.
Bank and other loans
Bank and other loans are recorded at the fair value of the proceeds received plus directly attributable transaction costs. Issue costs relating to revolving credit facilities are charged to the income statement over the life of the facility on a periodic basis. Issue costs relating to fixed term loans are charged to the income statement using the effective interest method and are added to the carrying amount of the fixed term loan.
Trade payables
Trade payables are not interest bearing and are stated at their nominal value.
F-14
LUXFER HOLDINGS PLC
NOTES TO THE CONSOLIDATED FINANCIAL STATEMENTS (Continued)
(Dollars in millions)
1. Accounting policies (Continued)
Derivative financial instruments
The Group uses derivative financial instruments such as foreign currency contracts to hedge its risks associated with foreign currency fluctuations. Such derivative financial instruments are stated at fair value.
Hedges are classified as cash flow hedges when they hedge exposure to variability in cash flows either attributable to a particular risk associated with a recognized asset or liability or a highly probable forecast transaction.
In relation to cash flow hedges to hedge the foreign currency risk of firm commitments which meet the conditions for special hedge accounting, the portion of the gain or loss on the hedging instrument that is determined to be an effective hedge is recognized directly in equity and the ineffective portion is recognized in the income statement.
In relation to derivative financial instruments used to hedge a forecast transaction, the portion of the gain or loss on the hedging instrument that is determined to be an effective hedge is recognized directly in equity and the ineffective portion is recognized in the income statement. Amounts taken to equity are transferred to the income statement when the hedged transaction affects profit or loss.
Financial liabilities and equity instruments
Financial liabilities and equity instruments issued by the Group are recorded at the proceeds received.
Financial liabilities and equity instruments are all instruments that are issued by the Group as a means of raising finance, including shares, loan notes, debentures, debt instruments and options and warrants that give the holder the right to subscribe for or obtain financial liabilities and equity instruments.
An equity instrument is any contract that evidences a residual interest in the assets of an entity after deducting all of its liabilities. All equity instruments are included in shareholders' funds. The finance costs incurred in respect of an equity instrument are charged directly to the income statement. Other instruments are classified as financial liabilities if they contain a contractual obligation to transfer economic benefits.
Critical accounting judgments and key sources of estimation uncertainty
The key assumptions concerning the future, and other key sources of estimation uncertainty at the balance sheet date, that have a significant risk of causing a material adjustment to the carrying amounts of assets and liabilities within the next financial year, are discussed below. The judgments used by management in the application of the Group's accounting policies in respect of these key areas of estimation are considered to be the most significant.
Impairment of non-financial assets
The Group assesses whether there are any indicators of impairment for all non-financial assets at each reporting date. Goodwill is tested for impairment annually and at other times when such indicators exist. Other non-financial assets are tested for impairment when there are indicators that the carrying amount may not be recoverable.
F-15
LUXFER HOLDINGS PLC
NOTES TO THE CONSOLIDATED FINANCIAL STATEMENTS (Continued)
(Dollars in millions)
1. Accounting policies (Continued)
When value in use calculations are undertaken, management must estimate the expected future cash flows from the asset or cash generating unit and choose a suitable discount rate in order to calculate the present value of those cash flows. Details regarding goodwill and assumptions used in carrying out the impairment review are provided in Note 13.
Pensions
Determining the present value of future obligations of pensions requires an estimation of future mortality rates, future salary increases, future pension increases, future inflation increases and discount rates. These assumptions are determined in association with qualified actuaries. Due to the long term nature of these plans, such estimates are subject to significant uncertainty. The pension liability at December 31, 2013 is $67.6 million (December 31, 2012: $96.7 million). Further details are given in Note 28.
Deferred tax
Deferred tax assets are recognized for unabsorbed tax losses and unutilized capital allowances to the extent that it is probable that taxable profit will be available against which the losses and capital allowances can be utilized. Judgment is required to determine the amount of deferred tax assets that can be recognized, based upon the likely timing and level of future taxable profits together with future tax planning strategies. Further details are given in Note 23.
Inventories obsolescence and inventories write down
Inventories are stated at the lower of cost and net realizable value. Inventories are reviewed on a regular basis and the Group will make allowance for excess or obsolete inventories and write down to net realizable value based primarily on committed sales prices and management estimates of expected and future product demand and related pricing. Further details are given in Note 15.
Changes in accounting policies
The accounting policies adopted are consistent with those of the previous financial year except for the following new and amended standards and interpretations during the year. Adoption of these revised standards and interpretations did not have any effect on the financial statements of the Group, with the exception of IAS 19 for which the impact is described at the end of this note.
International Accounting Standards | Effective date | |||
|---|---|---|---|---|
| IAS 1 | Presentation of Financial Statements (Amendments) | July 1, 2012 | ||
| IAS 19 | Employee Benefits (Revised) | January 1, 2013 | ||
| IAS 27 | Separate Financial Statements (Revised) | January 1, 2013 | ||
| IAS 28 | Investments in Associates and Joint Ventures (Revised) | January 1, 2013 | ||
| IFRS 7 | Financial Instruments: Disclosures (Amendment) | January 1, 2013 | ||
| IFRS 10 | Consolidated Financial Statements | January 1, 2013 | ||
| IFRS 11 | Joint Arrangements | January 1, 2013 | ||
| IFRS 12 | Disclosure of Interests in Other Entities | January 1, 2013 | ||
| IFRS 13 | Fair Value Measurement | January 1, 2013 | ||
F-16
LUXFER HOLDINGS PLC
NOTES TO THE CONSOLIDATED FINANCIAL STATEMENTS (Continued)
(Dollars in millions)
1. Accounting policies (Continued)
New standards and amendments to standards not applied
The IASB has issued the following standards and amendments to standards with an effective date after the date of these financial statements:
International Accounting Standards | Effective date | |||
|---|---|---|---|---|
| IAS 32 | Financial Instruments: Presentation (Amendment) | January 1, 2014 | ||
| IAS 36 | Impairment of Assets (Amendments) | January 1, 2014 | ||
| IAS 39 | Financial Instruments: Recognition and Measurements (Amendments) | January 1, 2014 | ||
| IFRIC 21 | Levies | January 1, 2014 | ||
| IAS 19 | Employee Benefits (Amendments) | July 1, 2014 | ||
| IFRSs | Annual Improvements to IFRSs: 2010 - 2012 and 2011 - 2013 Cycles | July 1, 2014 | ||
| IFRS 7, | Financial Instruments (Amendments) | No earlier than | ||
| IFRS 9, | January 1, 2017 | |||
| IAS 39 | ||||
The Group applies both IFRS as issued by the IASB and adopted by the EU. Where mandatory effective dates differ, the Group applies the earlier date as issued by the IASB.
The Directors do not anticipate that the adoption of these standards and interpretations will have a material effect on the Group's financial statements in the period of initial application.
IAS 19 Employee Benefits (Revised)
Under the revised standard, the charge to the income statement in relation to defined benefit costs has changed, with only current period service costs and administrative expenses being charged to operating profit and a finance expense calculated on the outstanding accounting deficit being charged to finance costs. The revised standard has not led to changes on the balance sheet or the deficit, so movements in the income statement have equal and opposite movements in Other Comprehensive Income.
F-17
LUXFER HOLDINGS PLC
NOTES TO THE CONSOLIDATED FINANCIAL STATEMENTS (Continued)
(Dollars in millions)
1. Accounting policies (Continued)
The following table summarizes the impact of the revision to the standard to the income statement for the years ended December 31, 2012 and 2011.
| | Previously published information | Restated under IAS 19 (Revised) | |||||||||||
|---|---|---|---|---|---|---|---|---|---|---|---|---|---|
| | 2012 $M | 2011 $M | 2012 $M | 2011 $M | |||||||||
OPERATING PROFIT | 66.7 | 66.2 | 66.4 | 63.9 | |||||||||
Other income (expense): | |||||||||||||
Acquisitions and disposals | (0.8 | ) | (0.2 | ) | (0.8 | ) | (0.2 | ) | |||||
Finance income: | |||||||||||||
Interest received | 0.2 | 0.2 | 0.2 | 0.2 | |||||||||
Finance costs | |||||||||||||
Interest costs | (6.7 | ) | (9.2 | ) | (6.7 | ) | (9.2 | ) | |||||
IAS 19 charge | — | — | (3.6 | ) | (1.9 | ) | |||||||
| | | | | | | | | | | | | | |
PROFIT ON OPERATIONS BEFORE | |||||||||||||
TAXATION | 59.4 | 57.0 | 55.5 | 52.8 | |||||||||
Tax expense | (17.0 | ) | (13.6 | ) | (16.0 | ) | (12.5 | ) | |||||
| | | | | | | | | | | | | | |
NET INCOME FOR THE YEAR | 42.4 | 43.4 | 39.5 | 40.3 | |||||||||
| | | | | | | | | | | | | | |
| | | | | | | | | | | | | | |
Attributable to: | |||||||||||||
Equity shareholders | 42.4 | 43.4 | 39.5 | 40.3 | |||||||||
Earnings per share: | |||||||||||||
Basic | |||||||||||||
Unadjusted | $ | 3.95 | $ | 4.39 | $ | 3.68 | $ | 4.08 | |||||
Diluted | |||||||||||||
Unadjusted | $ | 3.88 | $ | 4.35 | $ | 3.61 | $ | 4.04 | |||||
Based on the above table, the IAS 19 (revised) impact can be summarized as follows:
| | 2012 $M | 2011 $M | |||||
|---|---|---|---|---|---|---|---|
Reduction in: | |||||||
Operating profit | (0.3 | ) | (2.3 | ) | |||
Profit on operations before taxation | (3.9 | ) | (4.2 | ) | |||
Net income | (2.9 | ) | (3.1 | ) | |||
F-18
LUXFER HOLDINGS PLC
NOTES TO THE CONSOLIDATED FINANCIAL STATEMENTS (Continued)
(Dollars in millions)
2. Revenue and segmental analysis
For management purposes, the Group is organized into two operational divisions, Gas Cylinders and Elektron. The tables below set out information on the results of these two reportable segments.
Management monitors the operating results of its divisions separately for the purpose of making decisions about resource allocation and performance assessment. Segment performance is evaluated based on trading profit or loss, defined as operating profit or loss before restructuring and other expense.
Unallocated assets and liabilities include those which are held on behalf of the Group and cannot be allocated to a division, such as taxation, investments, cash, retirement benefit obligations, bank and other loans and holding company assets and liabilities.
All inter-segment sales are made on an arm's length basis.
REPORTING SEGMENTS:
Year ended December 31, 2013
| | Gas Cylinders $M | Elektron $M | Unallocated $M | Total Continuing Activities $M | |||||
|---|---|---|---|---|---|---|---|---|---|
Revenue | |||||||||
Segment Revenue | 261.6 | 220.4 | — | 482.0 | |||||
Inter-segment sales | — | (0.7 | ) | — | (0.7 | ) | |||
| | | | | | | | | | |
Sales to external customers | 261.6 | 219.7 | — | 481.3 | |||||
| | | | | | | | | | |
| | | | | | | | | | |
Result | |||||||||
Trading profit | 19.0 | 40.2 | — | 59.2 | |||||
Restructuring and other income (expense) (Note 5) | (1.5 | ) | (0.7 | ) | (0.5 | ) | (2.7 | ) | |
| | | | | | | | | | |
Operating profit/(loss) | 17.5 | 39.5 | (0.5 | ) | 56.5 | ||||
Acquisitions and disposals (Note 5) | (0.1 | ) | — | — | (0.1 | ) | |||
Net interest costs | — | — | (5.9 | ) | (5.9 | ) | |||
IAS 19 finance charge | — | — | (3.8 | ) | (3.8 | ) | |||
| | | | | | | | | | |
Profit/(loss) before tax | 17.4 | 39.5 | (10.2 | ) | 46.7 | ||||
Tax expense | (12.6 | ) | |||||||
| | | | | | | | | | |
Net income for the year | 34.1 | ||||||||
| | | | | | | | | | |
| | | | | | | | | | |
Other segment information | |||||||||
Segment assets | 183.5 | 150.4 | 62.2 | 396.1 | |||||
Segment liabilities | (35.0 | ) | (22.3 | ) | (147.1 | ) | (204.4 | ) | |
| | | | | | | | | | |
Net assets/(liabilities) | 148.5 | 128.1 | (84.9 | ) | 191.7 | ||||
| | | | | | | | | | |
| | | | | | | | | | |
Capital expenditure: Property, plant and equipment | 13.3 | 10.2 | — | 23.5 | |||||
Capital expenditure: Intangible assets | 0.3 | 2.0 | — | 2.3 | |||||
Depreciation and amortization | 7.1 | 8.7 | — | 15.8 |
F-19
LUXFER HOLDINGS PLC
NOTES TO THE CONSOLIDATED FINANCIAL STATEMENTS (Continued)
(Dollars in millions)
2. Revenue and segmental analysis (Continued)
Year ended December 31, 2012 (Restated under IAS 19R)
| | Gas Cylinders $M | Elektron $M | Unallocated $M | Total Continuing Activities $M | |||||||||
|---|---|---|---|---|---|---|---|---|---|---|---|---|---|
Revenue | |||||||||||||
Segment Revenue | 246.3 | 265.7 | — | 512.0 | |||||||||
Inter-segment sales | — | (0.4 | ) | — | (0.4 | ) | |||||||
| | | | | | | | | | | | | | |
Sales to external customers | 246.3 | 265.3 | — | 511.6 | |||||||||
| | | | | | | | | | | | | | |
| | | | | | | | | | | | | | |
Result | |||||||||||||
Trading profit | 15.7 | 52.8 | — | 68.5 | |||||||||
Restructuring and other income (expense) (Note 5) | (1.1 | ) | (0.2 | ) | (0.8 | ) | (2.1 | ) | |||||
| | | | | | | | | | | | | | |
Operating profit/(loss) | 14.6 | 52.6 | (0.8 | ) | 66.4 | ||||||||
Acquisitions and disposals (Note 5) | (0.6 | ) | (0.2 | ) | — | (0.8 | ) | ||||||
Net finance costs | — | — | (6.5 | ) | (6.5 | ) | |||||||
IAS 19 finance charge | — | — | (3.6 | ) | (3.6 | ) | |||||||
| | | | | | | | | | | | | | |
Profit/(loss) before tax | 14.0 | 52.4 | (10.9 | ) | 55.5 | ||||||||
Tax expense | (16.0 | ) | |||||||||||
| | | | | | | | | | | | | | |
Net income for the year | 39.5 | ||||||||||||
| | | | | | | | | | | | | | |
| | | | | | | | | | | | | | |
Other segment information | |||||||||||||
Segment assets | 165.7 | 152.1 | 72.7 | 390.5 | |||||||||
Segment liabilities | (40.3 | ) | (28.2 | ) | (173.2 | ) | (241.7 | ) | |||||
| | | | | | | | | | | | | | |
Net assets/(liabilities) | 125.4 | 123.9 | (100.5 | ) | 148.8 | ||||||||
| | | | | | | | | | | | | | |
| | | | | | | | | | | | | | |
Capital expenditure: Property, plant and equipment | 8.2 | 11.3 | — | 19.5 | |||||||||
Capital expenditure: Intangible assets | — | — | — | — | |||||||||
Depreciation and amortization | 6.5 | 8.2 | — | 14.7 | |||||||||
F-20
LUXFER HOLDINGS PLC
NOTES TO THE CONSOLIDATED FINANCIAL STATEMENTS (Continued)
(Dollars in millions)
2. Revenue and segmental analysis (Continued)
Year ended December 31, 2011 (Restated under IAS 19R)
| | Gas Cylinders $M | Elektron $M | Unallocated $M | Total Continuing Activities $M | |||||||||
|---|---|---|---|---|---|---|---|---|---|---|---|---|---|
Revenue | |||||||||||||
Segment Revenue | 223.3 | 287.8 | — | 511.1 | |||||||||
Inter-segment sales | — | (0.3 | ) | — | (0.3 | ) | |||||||
| | | | | | | | | | | | | | |
Sales to external customers | 223.3 | 287.5 | — | 510.8 | |||||||||
| | | | | | | | | | | | | | |
| | | | | | | | | | | | | | |
Result | |||||||||||||
Trading profit | 11.2 | 52.5 | — | 63.7 | |||||||||
Restructuring and other income (expense) (Note 5) | — | — | 0.2 | 0.2 | |||||||||
| | | | | | | | | | | | | | |
Operating profit | 11.2 | 52.5 | 0.2 | 63.9 | |||||||||
Acquisitions disposals (Note 5) | — | (0.2 | ) | — | (0.2 | ) | |||||||
Net finance costs | — | — | (9.0 | ) | (9.0 | ) | |||||||
IAS 19 finance charge | — | — | (1.9 | ) | (1.9 | ) | |||||||
| | | | | | | | | | | | | | |
Profit/(loss) before tax | 11.2 | 52.3 | (10.7 | ) | 52.8 | ||||||||
Tax expense | (12.5 | ) | |||||||||||
| | | | | | | | | | | | | | |
Net income for the year | 40.3 | ||||||||||||
| | | | | | | | | | | | | | |
| | | | | | | | | | | | | | |
Other segment information | |||||||||||||
Segment assets | 136.5 | 172.7 | 55.1 | 364.3 | |||||||||
Segment liabilities | (39.8 | ) | (40.0 | ) | (219.7 | ) | (299.5 | ) | |||||
| | | | | | | | | | | | | | |
Net assets/(liabilities) | 96.7 | 132.7 | (164.6 | ) | 64.8 | ||||||||
| | | | | | | | | | | | | | |
| | | | | | | | | | | | | | |
Capital expenditure: Property, plant and equipment | 7.0 | 13.8 | — | 20.8 | |||||||||
Capital expenditure: Intangible assets | 0.2 | 0.1 | — | 0.3 | |||||||||
Depreciation and amortization | 6.4 | 8.1 | — | 14.5 | |||||||||
F-21
LUXFER HOLDINGS PLC
NOTES TO THE CONSOLIDATED FINANCIAL STATEMENTS (Continued)
(Dollars in millions)
2. Revenue and segmental analysis (Continued)
GEOGRAPHIC ORIGIN:
Year ended December 31, 2013
| | United Kingdom $M | Rest of Europe $M | North America $M | Australasia $M | Asia $M | Total $M | |||||||||||||
|---|---|---|---|---|---|---|---|---|---|---|---|---|---|---|---|---|---|---|---|
Revenue | |||||||||||||||||||
Segment revenue | 172.0 | 82.3 | 294.1 | 0.1 | 5.7 | 554.2 | |||||||||||||
Inter-segment sales | (34.2 | ) | (4.9 | ) | (33.8 | ) | — | — | (72.9 | ) | |||||||||
| | | | | | | | | | | | | | | | | | | | |
Sales to external customers | 137.8 | 77.4 | 260.3 | 0.1 | 5.7 | 481.3 | |||||||||||||
| | | | | | | | | | | | | | | | | | | | |
| | | | | | | | | | | | | | | | | | | | |
Result | |||||||||||||||||||
Trading profit | 15.0 | 3.6 | 39.6 | 0.1 | 0.9 | 59.2 | |||||||||||||
Restructuring and other expense (Note 5) | (0.7 | ) | — | (2.0 | ) | — | — | (2.7 | ) | ||||||||||
| | | | | | | | | | | | | | | | | | | | |
Operating profit | 14.3 | 3.6 | 37.6 | 0.1 | 0.9 | 56.5 | |||||||||||||
| | | | | | | | | | | | | | | | | | | | |
| | | | | | | | | | | | | | | | | | | | |
Other geographical segment information | |||||||||||||||||||
Non-current assets(1) | 66.2 | 21.6 | 98.9 | — | 0.5 | 187.2 | |||||||||||||
Net assets/(liabilities)(2) | 63.9 | 42.5 | 80.4 | 0.1 | 4.8 | 191.7 | |||||||||||||
Capital expenditure: Property, plant and equipment | 7.4 | 3.3 | 12.7 | — | 0.1 | 23.5 | |||||||||||||
Capital expenditure: Intangible assets | 1.5 | 0.2 | 0.6 | — | — | 2.3 | |||||||||||||
Depreciation and amortization | 5.9 | 2.8 | 7.0 | — | 0.1 | 15.8 | |||||||||||||
- (1)
- The Group's non-current assets analyzed by geographic origin include property, plant and equipment, intangible assets and investments.
- (2)
- Represents net assets/(liabilities) employed—excluding inter-segment assets and liabilities.
F-22
LUXFER HOLDINGS PLC
NOTES TO THE CONSOLIDATED FINANCIAL STATEMENTS (Continued)
(Dollars in millions)
2. Revenue and segmental analysis (Continued)
Year ended December 31, 2012 (Restated under IAS 19R)
| | United Kingdom $M | Rest of Europe $M | North America $M | Australasia $M | Asia $M | Total $M | |||||||||||||
|---|---|---|---|---|---|---|---|---|---|---|---|---|---|---|---|---|---|---|---|
Revenue | |||||||||||||||||||
Segment revenue | 210.1 | 65.2 | 304.2 | 0.1 | 5.9 | 585.5 | |||||||||||||
Inter-segment sales | (42.9 | ) | (4.5 | ) | (26.5 | ) | — | — | (73.9 | ) | |||||||||
| | | | | | | | | | | | | | | | | | | | |
Sales to external customers | 167.2 | 60.7 | 277.7 | 0.1 | 5.9 | 511.6 | |||||||||||||
| | | | | | | | | | | | | | | | | | | | |
| | | | | | | | | | | | | | | | | | | | |
Result | |||||||||||||||||||
Trading profit | 24.7 | 3.2 | 39.6 | 0.1 | 0.9 | 68.5 | |||||||||||||
Restructuring and other expense (Note 5) | (1.0 | ) | (0.2 | ) | (0.9 | ) | — | — | (2.1 | ) | |||||||||
| | | | | | | | | | | | | | | | | | | | |
Operating profit | 23.7 | 3.0 | 38.7 | 0.1 | 0.9 | 66.4 | |||||||||||||
| | | | | | | | | | | | | | | | | | | | |
| | | | | | | | | | | | | | | | | | | | |
Other geographical segment information | |||||||||||||||||||
Non-current assets(1) | 56.7 | 20.9 | 90.8 | — | 0.4 | 168.8 | |||||||||||||
Net assets/(liabilities)(2) | 52.1 | 32.8 | 58.9 | 0.4 | 4.6 | 148.8 | |||||||||||||
Capital expenditure: Property, plant and equipment | 6.7 | 2.4 | 10.2 | — | 0.2 | 19.5 | |||||||||||||
Capital expenditure: Intangible assets | — | — | — | — | — | — | |||||||||||||
Depreciation and amortization | 5.5 | 2.7 | 6.5 | — | — | 14.7 | |||||||||||||
- (1)
- The Group's non-current assets analyzed by geographic origin include property, plant and equipment, intangible assets and investments
- (2)
- Represents net assets/(liabilities) employed—excluding inter-segment assets and liabilities.
F-23
LUXFER HOLDINGS PLC
NOTES TO THE CONSOLIDATED FINANCIAL STATEMENTS (Continued)
(Dollars in millions)
2. Revenue and segmental analysis (Continued)
Year ended December 31, 2011 (Restated under IAS 19R)
| | United Kingdom $M | Rest of Europe $M | North America $M | Australasia $M | Asia $M | Total $M | |||||||||||||
|---|---|---|---|---|---|---|---|---|---|---|---|---|---|---|---|---|---|---|---|
Revenue | |||||||||||||||||||
Segment revenue | 221.8 | 54.9 | 290.3 | 0.1 | 6.5 | 573.6 | |||||||||||||
Inter-segment sales | (35.4 | ) | (2.5 | ) | (24.9 | ) | — | — | (62.8 | ) | |||||||||
| | | | | | | | | | | | | | | | | | | | |
Sales to external customers | 186.4 | 52.4 | 265.4 | 0.1 | 6.5 | 510.8 | |||||||||||||
| | | | | | | | | | | | | | | | | | | | |
| | | | | | | | | | | | | | | | | | | | |
Result | |||||||||||||||||||
Trading profit/(loss) | 23.8 | (0.2 | ) | 39.5 | 0.1 | 0.5 | 63.7 | ||||||||||||
Restructuring and other expense (Note 5) | 0.2 | — | — | — | — | 0.2 | |||||||||||||
| | | | | | | | | | | | | | | | | | | | |
Operating profit/(loss) | 24.0 | (0.2 | ) | 39.5 | 0.1 | 0.5 | 63.9 | ||||||||||||
| | | | | | | | | | | | | | | | | | | | |
| | | | | | | | | | | | | | | | | | | | |
Other geographical segment information | |||||||||||||||||||
Non-current assets(1) | 52.6 | 18.8 | 80.0 | — | 0.3 | 151.7 | |||||||||||||
Net assets/(liabilities)(2) | 14.0 | 26.8 | 19.7 | 0.3 | 4.0 | 64.8 | |||||||||||||
Capital expenditure: Property, plant and equipment | 7.8 | 1.7 | 11.3 | — | — | 20.8 | |||||||||||||
Capital expenditure: Intangible assets | 0.3 | — | — | — | — | 0.3 | |||||||||||||
Depreciation and amortization | 5.5 | 2.9 | 6.1 | — | — | 14.5 | |||||||||||||
- (1)
- The Group's non-current assets analyzed by geographic origin include property, plant and equipment, intangible assets and investments.
- (2)
- Represents net assets/(liabilities) employed—excluding inter-segment assets and liabilities.
GEOGRAPHIC DESTINATION:
| | United Kingdom $M | Rest of Europe $M | Africa $M | North America $M | South America $M | Asia Pacific $M | Total $M | |||||||||||||||
|---|---|---|---|---|---|---|---|---|---|---|---|---|---|---|---|---|---|---|---|---|---|---|
Revenue—Continuing activities | ||||||||||||||||||||||
Year ended December 31, 2013 | 56.5 | 120.7 | 5.3 | 223.6 | 16.3 | 58.9 | 481.3 | |||||||||||||||
Year ended December 31, 2012 | 58.8 | 126.6 | 7.6 | 226.6 | 19.4 | 72.6 | 511.6 | |||||||||||||||
Year ended December 31, 2011 | 61.5 | 128.3 | 20.3 | 210.3 | 25.1 | 65.3 | 510.8 | |||||||||||||||
F-24
LUXFER HOLDINGS PLC
NOTES TO THE CONSOLIDATED FINANCIAL STATEMENTS (Continued)
(Dollars in millions)
3. Operating profit
Operating profit for continuing activities is stated after charging/(crediting):
| | | Restated under IAS 19R | |||||
|---|---|---|---|---|---|---|---|
| | 2013 $M | 2012 $M | 2011 $M | ||||
Research and development expenditure charged to the income statement | 8.2 | 7.1 | 8.5 | ||||
Research and development capital expenditure included within non-current assets | 1.6 | 1.8 | 2.6 | ||||
| | | | | | | | |
Total research and development expenditure | 9.8 | 8.9 | 11.1 | ||||
less external funding received—grants and recharges to third parties | (0.2 | ) | (0.7 | ) | (2.9 | ) | |
less research and development expenditure capitalized within non-current assets | (1.6 | ) | (1.8 | ) | (2.6 | ) | |
| | | | | | | | |
Net research and development | 8.0 | 6.4 | 5.6 | ||||
| | | | | | | | |
| | | | | | | | |
Depreciation of property, plant and equipment (Note 11) | 15.5 | 14.4 | 14.2 | ||||
Amortization of intangible assets (Note 12) | 0.3 | 0.2 | 0.3 | ||||
Loss on disposal of property, plant and equipment | 0.3 | — | — | ||||
Net foreign exchange gains | — | (0.7 | ) | (0.7 | ) | ||
Staff costs (Note 6) | 117.3 | 114.2 | 108.5 | ||||
Cost of inventories recognized as expense | 333.0 | 356.5 | 355.9 | ||||
4. Fees payable to auditors
| | 2013 $M | 2012 $M | 2011 $M | ||||
|---|---|---|---|---|---|---|---|
Fees payable to auditors for the audit of the financial statements | 1.0 | 0.9 | 0.8 | ||||
| | | | | | | | |
The audit fee for the Company financial statements of Luxfer Holdings PLC was $0.1 million (2012 and 2011: $0.1 million).
Fees payable to auditors for non-audit services: | ||||||||||
Audit related assurance services | 0.1 | 0.4 | 1.0 | |||||||
Tax compliance services | 0.4 | 0.5 | 0.5 | |||||||
Tax advisory services | 0.2 | 0.3 | 0.3 | |||||||
| | | | | | | | | | | |
| 0.7 | 1.2 | 1.8 | ||||||||
| | | | | | | | | | | |
| | | | | | | | | | | |
Total fees payable | 1.7 | 2.1 | 2.6 | |||||||
| | | | | | | | | | | |
| | | | | | | | | | | |
Included in fees payable to auditors was $1.0 million (2012: $1.3 million and 2011: $1.4 million) relating to the Company and its UK subsidiaries.
F-25
LUXFER HOLDINGS PLC
NOTES TO THE CONSOLIDATED FINANCIAL STATEMENTS (Continued)
(Dollars in millions)
5. Other income (expense) items
(a) Restructuring and other income (expense)
| | 2013 $M | 2012 $M | 2011 $M | ||||
|---|---|---|---|---|---|---|---|
(Charged)/credited to Operating profit: | |||||||
Rationalization of operations | (0.5 | ) | (1.3 | ) | — | ||
I.P.O related share based compensation charges | (0.5 | ) | (0.8 | ) | — | ||
I.P.O related legal and professional costs | — | — | (1.4 | ) | |||
(Charges)/credits on retirement benefit obligations | (1.7 | ) | — | 1.6 | |||
| | | | | | | | |
| (2.7 | ) | (2.1 | ) | 0.2 | |||
| | | | | | | | |
| | | | | | | | |
(b) Acquisitions and disposals
| | 2013 $M | 2012 $M | 2011 $M | ||||
|---|---|---|---|---|---|---|---|
Charged to Non-operating profit: | |||||||
Net acquisition costs | (0.1 | ) | (0.6 | ) | — | ||
Disposal costs of intellectual property | — | (0.2 | ) | (0.2 | ) | ||
| | | | | | | | |
| (0.1 | ) | (0.8 | ) | (0.2 | ) | ||
| | | | | | | | |
| | | | | | | | |
Rationalization of operations
In 2013, $0.3 million (2012: $1.1 million) of costs have been incurred in relation to rationalization costs in the Gas Cylinders Division and $0.2 million (2012: $0.2 million) have been incurred in the Elektron division.
I.P.O related share based compensation charges
In 2013, a charge of $0.5 million (2012: $0.8 million) was recognized in the income statement under IFRS 2 in relation to share options granted as part of the initial public offering. The share options are described in further detail in note 30.
I.P.O related non-trade legal and professional costs
In 2011, the Group incurred legal, audit and professional costs of $2.8 million in relation to the raising of equity funding. Of this, $1.4 million was expensed in the year mainly in relation to historical audit work and $1.4 million was deferred, which related to regulatory and legal documentation to support the transaction.
F-26
LUXFER HOLDINGS PLC
NOTES TO THE CONSOLIDATED FINANCIAL STATEMENTS (Continued)
(Dollars in millions)
5. Other income (expense) items (Continued)
Charges/credits on retirement benefit obligations
In 2013, deferred members of the US pension plans were offered the option of a lump sum buyout in respect of their benefits in the plan. The settlement of the pension liabilities has resulted in a charge to the income statement of $1.7 million.
In 2011, retired members of the Luxfer Group Pension Plan, the principal defined benefit plan in the UK, we offered a one-off option of altering the structure of their pension by receiving an uplift immediately in return for giving up rights to a portion of their future pension increases. This reduced the costs and risks of operating the pension plan and resulted in a non-cash gain of $1.6 million and a corresponding reduction in the present value of the defined benefit obligations of the pension plan.
Net acquisition costs
In 2013, net acquisition costs of $0.1 million (2012: $0.6 million) were recognized by the Gas Cylinders division in relation to the acquisition of Dynetek Industries Limited and the finalization of the fair value exercise.
Disposal costs of intellectual property
In 2012 and 2011, the Elektron division incurred costs of $0.2 million in relation to the sale process of intellectual property in the USA, acquired as part of the 2007 acquisition of Revere Graphics.
6. Staff Costs
| | | Restated under IAS 19R | |||||
|---|---|---|---|---|---|---|---|
| | 2013 $M | 2012 $M | 2011 $M | ||||
Wages and salaries | 92.8 | 89.6 | 88.0 | ||||
Social security costs | 12.2 | 12.3 | 12.6 | ||||
Retirement benefit costs | 10.2 | 10.3 | 7.9 | ||||
Redundancy costs: | |||||||
Continuing activities (note 5) | 0.3 | 1.2 | — | ||||
Share based compensation charges | 1.8 | 0.8 | — | ||||
| | | | | | | | |
| 117.3 | 114.2 | 108.5 | |||||
| | | | | | | | |
| | | | | | | | |
F-27
LUXFER HOLDINGS PLC
NOTES TO THE CONSOLIDATED FINANCIAL STATEMENTS (Continued)
(Dollars in millions)
6. Staff Costs (Continued)
The average monthly number of employees during the year was made up as follows:
| | 2013 No. | 2012 No. | 2011 No. | ||||
|---|---|---|---|---|---|---|---|
Production and distribution | 1,363 | 1,284 | 1,209 | ||||
Sales and administration | 190 | 183 | 189 | ||||
Research and development | 52 | 53 | 51 | ||||
| | | | | | | | |
| 1,605 | 1,520 | 1,449 | |||||
| | | | | | | | |
| | | | | | | | |
The compensation of Directors was:
| | 2013 $M | 2012 $M | 2011 $M | ||||
|---|---|---|---|---|---|---|---|
Remuneration (short-term benefits) | 1.3 | 1.6 | 1.3 | ||||
Post-employment benefits | 0.2 | 0.2 | 0.2 | ||||
| | | | | | | | |
Total short-term and post-retirement benefits | 1.5 | 1.8 | 1.5 | ||||
| | | | | | | | |
| | | | | | | | |
In 2013, compensation of key management personnel (including directors) was $2.3 million (2012: $2.8 million and 2011: $2.7 million) for short-term employee benefits and $0.5 million (2012: $0.4 million and 2011: $0.5 million) for post-employment benefits.
During the year, one of the directors was a member of the group's registered defined contribution and defined benefit pension arrangements and another director was a participant in the unfunded unregistered unsecured retirement benefit arrangement accrued by the company.
Directors' interests and related party transactions
No directors had a material interest in, nor were they a party to, any contract or arrangement to which the parent company, Luxfer Holdings PLC (the "Company") or any of its subsidiaries is or was party either during the year or at the end of the year, with the following exceptions: in the case of the executive directors their individual service contract and the Luxfer Holdings PLC Long-Term Umbrella Incentive Plan; in the case of the non-executive directors their engagement letters or the contract for services under which their services as a director of the Company are provided; in the case of the executive directors and the chairman, the Luxfer Holdings PLC Non-Executive Directors Equity Incentive Plan. No share options were exercised by directors of the Company during the year.
7. Finance income
| | 2013 $M | 2012 $M | 2011 $M | ||||
|---|---|---|---|---|---|---|---|
Bank interest received | 0.2 | 0.2 | 0.1 | ||||
Other interest received | 0.1 | — | 0.1 | ||||
| | | | | | | | |
Total finance income | 0.3 | 0.2 | 0.2 | ||||
| | | | | | | | |
| | | | | | | | |
F-28
LUXFER HOLDINGS PLC
NOTES TO THE CONSOLIDATED FINANCIAL STATEMENTS (Continued)
(Dollars in millions)
8. Finance costs
| | | Restated under IAS 19R | |||||
|---|---|---|---|---|---|---|---|
| | 2013 $M | 2012 $M | 2011 $M | ||||
Interest paid: | |||||||
Senior Notes due 2012 | — | — | 3.3 | ||||
Bank and other loans | 5.0 | 5.7 | 4.3 | ||||
Amortization of issue costs | 1.2 | 1.0 | 1.6 | ||||
IAS 19 finance charge | 3.8 | 3.6 | 1.9 | ||||
| | | | | | | | |
Total finance costs | 10.0 | 10.3 | 11.1 | ||||
| | | | | | | | |
| | | | | | | | |
9. Income tax
(a) Analysis of taxation charge for the year
| | | Restated under IAS 19R | ||||||||
|---|---|---|---|---|---|---|---|---|---|---|
| | 2013 $M | 2012 $M | 2011 $M | |||||||
Current tax: | ||||||||||
UK Corporation tax | 0.2 | 3.3 | 1.0 | |||||||
Adjustments in respect of previous years | (0.7 | ) | (0.4 | ) | — | |||||
| | | | | | | | | | | |
| (0.5 | ) | 2.9 | 1.0 | |||||||
Non-UK tax | 10.2 | 9.9 | 10.8 | |||||||
Adjustments in respect of previous years | (0.1 | ) | (1.7 | ) | — | |||||
| | | | | | | | | | | |
Total current tax charge | 9.6 | 11.1 | 11.8 | |||||||
| | | | | | | | | | | |
| | | | | | | | | | | |
Deferred tax: | ||||||||||
Origination and reversal of temporary differences | 2.6 | 3.5 | 0.9 | |||||||
Adjustments in respect of previous years | 0.4 | 1.4 | (0.2 | ) | ||||||
| | | | | | | | | | | |
Total deferred tax charge | 3.0 | 4.9 | 0.7 | |||||||
| | | | | | | | | | | |
Tax on profit on operations | 12.6 | 16.0 | 12.5 | |||||||
| | | | | | | | | | | |
| | | | | | | | | | | |
The income tax charge relates to continuing activities and there is no tax charge in relation to discontinued activities.
(b) Factors affecting the taxation charge for the year
The tax assessed for the year differs from the standard rate of 23.25% (2012: 24.5% and 2011: 26.5%) for corporation tax in the UK.
F-29
LUXFER HOLDINGS PLC
NOTES TO THE CONSOLIDATED FINANCIAL STATEMENTS (Continued)
(Dollars in millions)
9. Income tax (Continued)
The differences are explained below:
| | | Restated under IAS 19R | ||||||||
|---|---|---|---|---|---|---|---|---|---|---|
| | 2013 $M | 2012 $M | 2011 $M | |||||||
Profit on operations before taxation | 46.7 | 55.5 | 52.8 | |||||||
| | | | | | | | | | | |
Profit on operations at 2013 standard rate of corporation tax in the UK of 23.25% (2012: 24.5% and 2011: 26.5%) | ||||||||||
| 10.9 | 13.6 | 14.0 | ||||||||
Effects of: | ||||||||||
Income not taxable | (1.1 | ) | (0.2 | ) | (0.3 | ) | ||||
Unprovided deferred tax | (1.1 | ) | (1.3 | ) | (4.7 | ) | ||||
Foreign tax rate differences | 4.3 | 4.6 | 3.7 | |||||||
Adjustment in respect of previous years | (0.4 | ) | (0.7 | ) | (0.2 | ) | ||||
| | | | | | | | | | | |
Tax expense | 12.6 | 16.0 | 12.5 | |||||||
| | | | | | | | | | | |
| | | | | | | | | | | |
(c) Factors that may affect future taxation charge
As at December 31, 2013, the Group has carried forward tax losses of $99.4 million (UK: $71.9 million, non-UK $27.5 million). Carried forward tax losses for 2012 were $85.4 million (UK: $71.9 million, non-UK: $13.5 million) and for 2011 were $74.2 million (UK: $69.2 million, non-UK: $5.0 million). To the extent that these losses are available to offset against future taxable profits, it is expected that the future effective tax rate would be below the standard rate in the country where the profits are offset.
In his annual Budget announcement of March 20, 2013, the Chancellor of the Exchequer announced certain tax changes which will have a significant effect on the Group's future tax position. The proposals include phased reductions in the UK corporation tax rate to 20% from 1 April 2015.
As at December 31, 2013, the previously announced reduction in the rate to 20% had been 'substantively enacted' and this has been reflected in the Group's financial statements as at December 31, 2013.
10. Earnings per share
The Group calculates earnings per share in accordance with IAS 33. Basic income per share is calculated based on the weighted average common shares outstanding for the period presented. The weighted average number of shares outstanding is calculated by time-apportioning the shares outstanding during the year.
For the purpose of calculating diluted earnings per share, the weighted average number of ordinary shares outstanding during the financial year have been adjusted for the dilutive effects of all potential ordinary shares and share options granted to employees.
American Depositary Shares (ADSs) of Luxfer Holdings PLC are listed on the New York Stock Exchange following an initial public offering on October 3, 2012. The company's £1 ordinary shares are not traded on
F-30
LUXFER HOLDINGS PLC
NOTES TO THE CONSOLIDATED FINANCIAL STATEMENTS (Continued)
(Dollars in millions)
10. Earnings per share (Continued)
any recognized stock exchange. The Depository for the ADSs holds 1 £1 ordinary share for every 2 ADSs traded, through American Depositary Receipts.
The Group reports earnings and adjusted earnings per ordinary share and per ADS to enable both sets of equity holders to understand the Group's earnings and adjusted earnings as a proportion of their equity investment held. Management believe the use of non-GAAP financial measures such as adjusted earnings per ADS more closely reflects the underlying earnings per ADS performance.
The weighted average methodology used to calculate the ordinary shareholders for 2012 and 2011 EPS on the £1 shares does not reflect a full-year economic impact of a 35% increase in the share capital of the Group from the IPO at 3rd October 2012. ADS and ordinary £1 shareholders should consider this impact when comparing the IFRS EPS to any ADS share price or comparator companies earnings multiples, for valuation purposes.
It should be noted that all EPS measures for prior periods have been restated for the application of IAS 19 Revised due to the impact of the accounting standard on the Group's net income.
| | | Restated under IAS 19R | |||||
|---|---|---|---|---|---|---|---|
| | 2013 $M | 2012 $M | 2011 $M | ||||
Basic earnings: | |||||||
Basic earnings attributable to ordinary shareholders | 34.1 | 39.5 | 40.3 | ||||
| | | | | | | | |
Adjusted earnings: | |||||||
IAS 19—retirement benefits finance charge | 3.8 | 3.6 | 1.9 | ||||
Acquisitions and disposals (Note 5) | 0.1 | 0.8 | 0.2 | ||||
Restructuring and other (income) expense (Note 5) | 2.7 | 2.1 | (0.2 | ) | |||
Other share based compensation charges | 1.3 | — | — | ||||
| | | | | | | | |
Tax thereon | (2.2 | ) | (1.3 | ) | (1.1 | ) | |
| | | | | | | | |
Adjusted earnings | 39.8 | 44.7 | 41.1 | ||||
| | | | | | | | |
| | | | | | | | |
Weighted average number of £1 ordinary shares: | |||||||
For basic earnings per share | 13,407,077 | 10,741,677 | 9,884,145 | ||||
Exercise of share options | 616,124 | 185,769 | 95,910 | ||||
| | | | | | | | |
For diluted earnings per share | 14,023,201 | 10,927,446 | 9,980,055 | ||||
| | | | | | | | |
| | | | | | | | |
Earnings per share using weighted average number of ordinary shares outstanding: | |||||||
Basic | |||||||
Adjusted | $2.97 | $4.16 | $4.16 | ||||
Unadjusted | $2.54 | $3.68 | $4.08 | ||||
Diluted | |||||||
Adjusted | $2.84 | $4.09 | $4.12 | ||||
Unadjusted | $2.43 | $3.61 | $4.04 | ||||
F-31
LUXFER HOLDINGS PLC
NOTES TO THE CONSOLIDATED FINANCIAL STATEMENTS (Continued)
(Dollars in millions)
10. Earnings per share (Continued)
Each £1 ordinary share is equal to 2 American Depositary Shares, as listed and quoted on the New York Stock Exchange.
If all £1 ordinary shares were converted to ADSs, the weighted average number of ADSs would be as follows:
For basic earnings per share | 26,814,154 | 21,483,354 | 19,768,290 | ||||
| | | | | | | | |
For diluted earnings per share | 28,046,402 | 21,854,892 | 19,960,110 | ||||
| | | | | | | | |
Earnings per share using weighted average number of ADSs outstanding: | |||||||
Basic | |||||||
Adjusted | $1.48 | $2.08 | $2.08 | ||||
Unadjusted | $1.27 | $1.84 | $2.04 | ||||
Diluted | |||||||
Adjusted | $1.42 | $2.05 | $2.06 | ||||
Unadjusted | $1.22 | $1.81 | $2.02 |
F-32
LUXFER HOLDINGS PLC
NOTES TO THE CONSOLIDATED FINANCIAL STATEMENTS (Continued)
(Dollars in millions)
11. Property, plant and equipment
| | Freehold $M | Long leasehold $M | Short leasehold $M | Plant and equipment $M | Total $M | |||||||||||
|---|---|---|---|---|---|---|---|---|---|---|---|---|---|---|---|---|
Cost: | ||||||||||||||||
At January 1, 2012 | 45.1 | 3.9 | 6.6 | 273.1 | 328.7 | |||||||||||
Additions | 3.0 | 0.1 | 1.1 | 15.3 | 19.5 | |||||||||||
Business additions | 0.6 | — | — | 7.6 | 8.2 | |||||||||||
Disposals | — | — | (0.2 | ) | (6.5 | ) | (6.7 | ) | ||||||||
Exchange adjustments | 0.6 | 0.2 | 0.1 | 7.3 | 8.2 | |||||||||||
| | | | | | | | | | | | | | | | | |
At December 31, 2012 | 49.3 | 4.2 | 7.6 | 296.8 | 357.9 | |||||||||||
Additions | 2.9 | 0.4 | 0.6 | 19.6 | 23.5 | |||||||||||
Disposals | (0.5 | ) | — | — | (3.7 | ) | (4.2 | ) | ||||||||
Exchange adjustments | 0.1 | 0.1 | — | 3.2 | 3.4 | |||||||||||
| | | | | | | | | | | | | | | | | |
At December 31, 2013 | 51.8 | 4.7 | 8.2 | 315.9 | 380.6 | |||||||||||
| | | | | | | | | | | | | | | | | |
| | | | | | | | | | | | | | | | | |
Depreciation: | ||||||||||||||||
At January 1, 2012 | 15.4 | 3.1 | 2.4 | 193.6 | 214.5 | |||||||||||
Provided during the year | 1.2 | 0.1 | 0.5 | 12.6 | 14.4 | |||||||||||
Disposals | — | — | (0.2 | ) | (6.5 | ) | (6.7 | ) | ||||||||
Exchange adjustments | 0.2 | 0.1 | — | 5.8 | 6.1 | |||||||||||
| | | | | | | | | | | | | | | | | |
At December 31, 2012 | 16.8 | 3.3 | 2.7 | 205.5 | 228.3 | |||||||||||
Provided during the year | 1.4 | 0.1 | 0.6 | 13.4 | 15.5 | |||||||||||
Disposals | (0.5 | ) | — | — | (3.3 | ) | (3.8 | ) | ||||||||
Exchange adjustments | — | 0.1 | — | 2.6 | 2.7 | |||||||||||
| | | | | | | | | | | | | | | | | |
At December 31, 2013 | 17.7 | 3.5 | 3.3 | 218.2 | 242.7 | |||||||||||
| | | | | | | | | | | | | | | | | |
| | | | | | | | | | | | | | | | | |
Net book values: | ||||||||||||||||
At December 31, 2013 | 34.1 | 1.2 | 4.9 | 97.7 | 137.9 | |||||||||||
| | | | | | | | | | | | | | | | | |
At December 31, 2012 | 32.5 | 0.9 | 4.9 | 91.3 | 129.6 | |||||||||||
| | | | | | | | | | | | | | | | | |
At January 1, 2012 | 29.7 | 0.8 | 4.2 | 79.5 | 114.2 | |||||||||||
| | | | | | | | | | | | | | | | | |
| | | | | | | | | | | | | | | | | |
F-33
LUXFER HOLDINGS PLC
NOTES TO THE CONSOLIDATED FINANCIAL STATEMENTS (Continued)
(Dollars in millions)
11. Property, plant and equipment (Continued)
Long and short leasehold
The long and short leasehold costs relate to leasehold property improvements.
12. Intangible assets
| | Goodwill $M | Patents $M | Development Costs $M | Other $M | Total $M | |||||||||||
|---|---|---|---|---|---|---|---|---|---|---|---|---|---|---|---|---|
Cost: | ||||||||||||||||
At January 1, 2012 | 54.2 | 1.7 | — | 1.4 | 57.3 | |||||||||||
Exchange adjustments | 2.0 | — | — | — | 2.0 | |||||||||||
| | | | | | | | | | | | | | | | | |
At December 31, 2012 | 56.2 | 1.7 | — | 1.4 | 59.3 | |||||||||||
Additions | 0.2 | — | 0.8 | 1.5 | 2.5 | |||||||||||
Exchange adjustments | 0.8 | 0.1 | — | — | 0.9 | |||||||||||
| | | | | | | | | | | | | | | | | |
At December 31, 2013 | 57.2 | 1.8 | 0.8 | 2.9 | 62.7 | |||||||||||
| | | | | | | | | | | | | | | | | |
| | | | | | | | | | | | | | | | | |
Amortization: | ||||||||||||||||
At January 1, 2012 | 18.5 | 0.9 | — | 0.9 | 20.3 | |||||||||||
Provided during the year | — | 0.1 | — | 0.1 | 0.2 | |||||||||||
Exchange adjustments | 0.4 | — | — | — | 0.4 | |||||||||||
| | | | | | | | | | | | | | | | | |
At December 31, 2012 | 18.9 | 1.0 | — | 1.0 | 20.9 | |||||||||||
Provided during the year | — | 0.1 | — | 0.2 | 0.3 | |||||||||||
Exchange adjustments | 0.1 | — | — | — | 0.1 | |||||||||||
| | | | | | | | | | | | | | | | | |
At December 31, 2013 | 19.0 | 1.1 | — | 1.2 | 21.3 | |||||||||||
| | | | | | | | | | | | | | | | | |
| | | | | | | | | | | | | | | | | |
Net book values: | ||||||||||||||||
At December 31, 2013 | 38.2 | 0.7 | 0.8 | 1.7 | 41.4 | |||||||||||
| | | | | | | | | | | | | | | | | |
At December 31, 2012 | 37.3 | 0.7 | — | 0.4 | 38.4 | |||||||||||
| | | | | | | | | | | | | | | | | |
At January 1, 2012 | 35.7 | 0.8 | — | 0.5 | 37.0 | |||||||||||
| | | | | | | | | | | | | | | | | |
| | | | | | | | | | | | | | | | | |
The patents acquired are being amortized over the lower of their estimated useful life, or legal life; this being 17 to 20 years.
The additions to goodwill of $0.2 million in the year ended December 31, 2013 relate to the acquisition of Dynetek Industries Limited and the finalization of the fair value exercise.
13. Impairment of goodwill
Goodwill acquired in a business combination is allocated, at acquisition, to the cash-generating units (CGUs) that are expected to benefit from the business combination. The four CGUs represent the lowest level within the Group at which goodwill is monitored for internal reporting management purposes. The four
F-34
LUXFER HOLDINGS PLC
NOTES TO THE CONSOLIDATED FINANCIAL STATEMENTS (Continued)
(Dollars in millions)
13. Impairment of goodwill (Continued)
CGUs are aggregated to form the Group's two defined reportable segments: Gas Cylinders division and Elektron division. The table below summarizes the carrying amount of goodwill by division:
| | Gas Cylinders division $M | Elektron division $M | Total $M | |||||||
|---|---|---|---|---|---|---|---|---|---|---|
At January 1, 2012 | 23.0 | 12.7 | 35.7 | |||||||
Exchange adjustments | 1.0 | 0.6 | 1.6 | |||||||
| | | | | | | | | | | |
At December 31, 2012 | 24.0 | 13.3 | 37.3 | |||||||
Additions | 0.2 | — | 0.2 | |||||||
Exchange adjustments | 0.5 | 0.2 | 0.7 | |||||||
| | | | | | | | | | | |
At December 31, 2013 | 24.7 | 13.5 | 38.2 | |||||||
| | | | | | | | | | | |
| | | | | | | | | | | |
The Gas Cylinders division goodwill of $24.7 million (December 31, 2012: $24.0 million) included goodwill attributable to our Luxfer Gas Cylinders operations of $23.4 million (December 31, 2012: $22.7 million) and goodwill attributable to our Superform operations of $1.3 million (December 31, 2012: $1.3 million). The Elektron division goodwill of $13.5 million (December 31, 2012: $13.3 million) included goodwill attributable to our MEL Chemicals operations of $5.2 million (December 31, 2012: $5.1 million) and goodwill attributable to our Magnesium Elektron operations of $8.3 million (December 31, 2012: $8.2 million).
The Group tests goodwill annually for impairment, or more frequently if there are indications that goodwill might be impaired.
The recoverable amount of each of the cash-generating units has been determined based on a value in use calculation using a discounted cash flow method. The cash flows were derived from a business plan prepared at a detailed level by individual businesses within each CGU. The results of these plans were then extrapolated to give cash flow projections to 2016 and then a terminal value based on a growth rate of 2.5% (2012: 2.5% and 2011: 2.5%). The rate is estimated to be below the average long-term growth rate for the relevant markets. The business plans were driven by detailed sales forecasts by product type and best estimate of future demand by end market. The cash flows included allowance for detailed capital expenditure and maintenance programs, along with working capital requirements based on the projected level of sales. The before tax discount rate used was 9% (2012: 10% and 2011: 9%), which was considered a best estimate for the risk-adjusted cost of capital for the business units. The long term projections assumed product prices and costs were at current levels, but the exchange rates used were: US$: £ exchange ranging from $1.55 - $1.60 and US$: € exchange ranging from €1.33—€1.29. Based on the current business plans used in the impairment testing, it is believed no reasonable changes in the discount and growth rates or forecast future cash flows are expected to result in an impairment of the carrying value of the goodwill.
F-35
LUXFER HOLDINGS PLC
NOTES TO THE CONSOLIDATED FINANCIAL STATEMENTS (Continued)
(Dollars in millions)
14. Investments
| | Shares in joint ventures $M | Loans to joint ventures $M | Other $M | Total $M | |||||||||
|---|---|---|---|---|---|---|---|---|---|---|---|---|---|
At January 1, 2012 | 0.3 | — | 0.2 | 0.5 | |||||||||
Equity funding of joint ventures | 0.4 | — | — | 0.4 | |||||||||
Share of results of joint ventures | (0.1 | ) | — | — | (0.1 | ) | |||||||
| | | | | | | | | | | | | | |
At December 31, 2012 | 0.6 | — | 0.2 | 0.8 | |||||||||
Equity funding of joint ventures | 2.5 | — | — | 2.5 | |||||||||
Debt funding of joint ventures | — | 4.5 | — | 4.5 | |||||||||
Share of results of joint ventures | 0.1 | — | — | 0.1 | |||||||||
| | | | | | | | | | | | | | |
At December 31, 2013 | 3.2 | 4.5 | 0.2 | 7.9 | |||||||||
| | | | | | | | | | | | | | |
| | | | | | | | | | | | | | |
Investment in joint ventures
At December 31, 2013, the Group had the following joint venture undertakings which affect the profit of the Group. Unless otherwise stated, the Group's joint ventures have share capital which consists solely of ordinary shares and are indirectly held, and the country of incorporation or registration is also their principal place of operation.
Name of company | Country of incorporation | Holding | Proportion of voting rights and shares held | Nature of business | |||||
|---|---|---|---|---|---|---|---|---|---|
Dynetek Cylinders India Private Limited | India | Ordinary shares | 49 | % | Engineering | ||||
Dynetek Korea Co. Limited | South Korea | Ordinary shares | 49 | % | Engineering | ||||
Luxfer Holdings NA, LLC | United States | N/A | 49 | % | Engineering | ||||
Luxfer Uttam India Private Limited | India | Ordinary shares | 51 | % | Engineering | ||||
Nikkei-MEL Co Limited | Japan | Ordinary shares | 50 | % | Distribution | ||||
During 2012, the Group acquired two Joint Ventures in India and South Korea through its acquisition of Dynetek Industries and at the end of the year established a third in North America. The objective of these joint ventures is to promote and support the use of large composite cylinders for use by end customers in CNG and Hydrogen gas transportation applications. Only the North American joint venture had any significant trading activities in 2013 and the profit attributable to Luxfer Holdings NA, LLC in its first year of trading was $0.2 million.
The Group has committed up to $12.5 million of future funding to aid expansion of the North American Joint Venture in the coming years, via $2.5 million of equity into Luxfer Holdings NA, LLC and an un-drawn $10 million secured credit line for working capital and supplier finance of which $4.5 million was drawn down as at December 31, 2013.
The loss attributable to the Luxfer Uttam India Private Limited joint venture for 2013 was $0.1 million (2012: loss of $0.1 million).
F-36
LUXFER HOLDINGS PLC
NOTES TO THE CONSOLIDATED FINANCIAL STATEMENTS (Continued)
(Dollars in millions)
14. Investments (Continued)
The share of results of all other joint ventures was $nil.
Related party transactions with joint ventures have been disclosed in Note 31 to the Group's financial statements.
15. Inventories
| | December 31, 2013 $M | December 31, 2012 $M | |||||
|---|---|---|---|---|---|---|---|
Raw materials and consumables | 37.7 | 35.6 | |||||
Work in progress | 27.6 | 25.2 | |||||
Finished goods and goods for resale | 28.8 | 23.0 | |||||
| | | | | | | | |
| 94.1 | 83.8 | ||||||
| | | | | | | | |
| | | | | | | | |
The provision against obsolete and excess inventories at December 31, 2013 was $4.8 million (December 31, 2012: $6.8 million). The movement represents the utilization of the provision. The cost of inventories recognized as an expense during the year has been disclosed in Note 3.
16. Trade and other receivables
| | December 31, 2013 $M | December 31, 2012 $M | |||||
|---|---|---|---|---|---|---|---|
Trade receivables | 53.0 | 60.3 | |||||
Amounts owed by joint ventures and associates | 1.7 | 0.7 | |||||
Other receivables | 5.4 | 7.6 | |||||
Prepayments and accrued income | 7.7 | 5.3 | |||||
Derivative financial instruments | 0.8 | 0.5 | |||||
| | | | | | | | |
| 68.6 | 74.4 | ||||||
| | | | | | | | |
| | | | | | | | |
The Directors consider that the carrying value of trade and other receivables approximates to their fair value.
Trade receivables are non-interest bearing and are generally on 30-90 days terms.
Trade receivables above are disclosed net of any provisions for doubtful receivables.
As at December 31, 2013, trade receivables with a nominal value $0.6 million (December 31, 2012: $2.2 million) were impaired and fully provided for. Movements in the provision for impairment of trade receivables were as follows:
| | 2013 $M | 2012 $M | |||||
|---|---|---|---|---|---|---|---|
At January 1 | 2.2 | 1.9 | |||||
(Credit)/charge in the year | (1.1 | ) | 0.1 | ||||
Other movements | (0.5 | ) | 0.2 | ||||
| | | | | | | | |
At December 31 | 0.6 | 2.2 | |||||
| | | | | | | | |
| | | | | | | | |
F-37
LUXFER HOLDINGS PLC
NOTES TO THE CONSOLIDATED FINANCIAL STATEMENTS (Continued)
(Dollars in millions)
17. Cash and short term deposits
| | December 31, 2013 $M | December 31, 2012 $M | |||||
|---|---|---|---|---|---|---|---|
Cash at bank and in hand | 28.4 | 40.2 | |||||
| | | | | | | | |
Cash at bank and in hand earns interest at floating rates based on daily bank deposit rates. The Directors consider that the carrying amount of cash and short-term deposits approximates to their fair value.
18. Share capital
- (a)
- Ordinary share capital
| | December 31, 2013 No. | December 31, 2012 No. | December 31, 2013 $M | December 31, 2012 $M | |||||||||
|---|---|---|---|---|---|---|---|---|---|---|---|---|---|
Authorized: | |||||||||||||
Ordinary shares of £1 each | 20,000,000 | 20,000,000 | 35.7 | (1) | 35.7 | (1) | |||||||
Deferred ordinary shares of £0.0001 each | 769,423,688,000 | 769,423,688,000 | 150.9 | (1) | 150.9 | (1) | |||||||
| | | | | | | | | | | | | | |
| 769,443,688,000 | 769,443,688,000 | 186.6 | (1) | 186.6 | (1) | ||||||||
| | | | | | | | | | | | | | |
| | | | | | | | | | | | | | |
Allotted, called up and fully paid: | |||||||||||||
Ordinary shares of £1 each | 13,500,962 | 13,500,000 | 25.3 | (1) | 25.3 | (1) | |||||||
Deferred ordinary shares of £0.0001 each | 769,413,708,000 | 769,413,708,000 | 150.9 | (1) | 150.9 | (1) | |||||||
| | | | | | | | | | | | | | |
| 769,427,208,962 | 769,427,208,000 | 176.2 | (1) | 176.2 | (1) | ||||||||
| | | | | | | | | | | | | | |
| | | | | | | | | | | | | | |
- (1)
- The Group's ordinary and deferred share capital are shown in US dollars at the exchange rate prevailing at the month end spot rate at the time of the share capital being issued. This rate at the end of February 2007 was $1.9613: £1 when the first 10,000,000 shares were issued, and the rate at the end of October 2012 was $1.6129:£1 when 3,500,000 shares were issued.
The rights of the shares are as follows:
Ordinary shares of £1 each
The ordinary shares carry no entitlement to an automatic dividend but rank pari passu in respect of any dividend declared and paid other than preference dividend (see below).
Since the balance sheet date, the Group has allotted and issued 6,038 ordinary shares of £1 each pursuant to an ordinary resolution empowering the directors to allot equity securities for cash up to an aggregate nominal amount of £20,000,000, passed by shareholders on 26 October, 2011. The ordinary shares were
F-38
LUXFER HOLDINGS PLC
NOTES TO THE CONSOLIDATED FINANCIAL STATEMENTS (Continued)
(Dollars in millions)
18. Share capital (Continued)
allotted and issued to satisfy share awards which vested under the Company's Long-Term Umbrella Incentive Plan.
Deferred ordinary shares of £0.0001 each
The deferred shares have no entitlement to dividends or to vote. On a winding up (but not otherwise) the holders of the deferred shares shall be entitled to the repayment of the paid up nominal amount of the deferred shares, but only after any payment to the holders of ordinary shares of an amount equal to 100 times the amount paid up on such ordinary shares.
- (b)
- American Depositary Shares
As at December 31, 2013, there were 24,639,564 American Depositary Shares (ADSs) of Luxfer Holdings PLC listed on the New York Stock Exchange following an initial public offering on October 3, 2012. The Depository for the ADSs holds 1 £1 ordinary share for every 2 ADSs traded, through American Depositary Receipts.
ADS holders are entitled to instruct their Depositary to vote and to receive a dividend as per the ordinary shareholders, after deducting the fees and expenses of the Depositary.
- (c)
- Own shares held by ESOP
| | $M | |||
|---|---|---|---|---|
At January 1, 2012 | 0.6 | |||
Purchases of shares from ESOP | (0.1 | ) | ||
| | | | | |
At December 31, 2012 and 2013 | 0.5 | |||
| | | | | |
| | | | | |
As at December 31, 2012, there were 93,674 ordinary shares of £1 each held by The Luxfer Group Employee Share Ownership Plan. During the year ended December 31, 2013, all of the ordinary shares held by The Luxfer Group Employee Share Ownership Plan were transferred into the ADS scheme.
- (d)
- Other capital reserves
| | Share based compensation $M | |||
|---|---|---|---|---|
At January 1, 2011 and December 31, 2011 | — | |||
I.P.O related share based compensation charges | 0.8 | |||
| | | | | |
At December 31, 2012 | 0.8 | |||
I.P.O related share based compensation charges | 0.5 | |||
Other share based compensation charges | 1.3 | |||
| | | | | |
At December 31, 2013 | 2.6 | |||
| | | | | |
| | | | | |
F-39
LUXFER HOLDINGS PLC
NOTES TO THE CONSOLIDATED FINANCIAL STATEMENTS (Continued)
(Dollars in millions)
18. Share capital (Continued)
The share based compensation reserve is used to recognize the fair value of options and performance shares granted under IFRS 2. For further information refer to Note 30. The charge in 2013 related to options over ADSs and not directly in ordinary shares.
19. Dividends paid and proposed
| | 2013 $M | 2012 $M | 2011 $M | |||||||
|---|---|---|---|---|---|---|---|---|---|---|
Dividends declared and paid during the year: | ||||||||||
Interim dividend paid August 10, 2012 ($0.39 per ordinary share) | — | 3.8 | — | |||||||
Interim dividend paid October 25, 2012 ($0.20 per ordinary share) | — | 2.0 | — | |||||||
Interim dividend paid February 6, 2013 ($0.20 per ordinary share) | 2.7 | — | — | |||||||
Interim dividend paid May 8, 2013 ($0.20 per ordinary share) | 2.7 | — | — | |||||||
Interim dividend paid August 7, 2013 ($0.20 per ordinary share) | 2.7 | — | — | |||||||
Interim dividend paid November 6, 2013 ($0.20 per ordinary share) | 2.7 | — | — | |||||||
| | | | | | | | | | | |
| 10.8 | 5.8 | — | ||||||||
| | | | | | | | | | | |
| | | | | | | | | | | |
| | 2013 $M | 2012 $M | 2011 $M | |||||||
|---|---|---|---|---|---|---|---|---|---|---|
Dividends proposed and paid after December 31 (not recognized as a liability as at December 31): | ||||||||||
Interim dividend paid February 6, 2013: ($0.20 per ordinary share) | — | 2.7 | — | |||||||
Interim dividend paid February 5, 2014: ($0.20 per ordinary share) | 2.7 | — | — | |||||||
| | | | | | | | | | | |
| 2.7 | 2.7 | — | ||||||||
| | | | | | | | | | | |
| | | | | | | | | | | |
F-40
LUXFER HOLDINGS PLC
NOTES TO THE CONSOLIDATED FINANCIAL STATEMENTS (Continued)
(Dollars in millions)
20. Reserves
| | Share premium account $M | Hedging reserve $M | Translation reserve $M | Merger reserve $M | Restated under IAS 19R Retained earnings $M | |||||||||||
|---|---|---|---|---|---|---|---|---|---|---|---|---|---|---|---|---|
At January 1, 2011 | — | 0.1 | (26.0 | ) | (333.8 | ) | 255.0 | |||||||||
Net income for the year | — | — | — | — | 40.3 | |||||||||||
Currency translation differences | — | (0.1 | ) | (5.4 | ) | — | — | |||||||||
Increase in fair value of cash flow hedges | — | 0.9 | — | — | — | |||||||||||
Transfer to income statement on cash flow hedges | — | (0.2 | ) | — | — | — | ||||||||||
Remeasurement of defined benefit retirement plans | — | — | — | — | (49.8 | ) | ||||||||||
Deferred tax on items taken to other comprehensive income | — | — | — | — | 13.9 | |||||||||||
| | | | | | | | | | | | | | | | | |
At December 31, 2011 | — | 0.7 | (31.4 | ) | (333.8 | ) | 259.4 | |||||||||
| | | | | | | | | | | | | | | | | |
| | | | | | | | | | | | | | | | | |
Net income for the year | — | — | — | — | 39.5 | |||||||||||
Currency translation differences | — | — | 2.9 | — | — | |||||||||||
Decrease in fair value of cash flow hedges | — | (0.1 | ) | — | — | — | ||||||||||
Transfer to income statement on cash flow hedges | — | (0.2 | ) | — | — | — | ||||||||||
Remeasurement of defined benefit retirement plans | — | — | — | — | (17.4 | ) | ||||||||||
Deferred tax on items taken to other comprehensive income | — | — | — | — | 2.9 | |||||||||||
Equity dividends | — | — | — | — | (5.8 | ) | ||||||||||
Arising from issue of share capital | 59.4 | — | — | — | — | |||||||||||
Share issue costs | (3.8 | ) | — | — | — | — | ||||||||||
| | | | | | | | | | | | | | | | | |
At December 31, 2012 | 55.6 | 0.4 | (28.5 | ) | (333.8 | ) | 278.6 | |||||||||
| | | | | | | | | | | | | | | | | |
| | | | | | | | | | | | | | | | | |
Net income for the year | — | — | — | — | 34.1 | |||||||||||
Currency translation differences | — | — | 3.1 | — | — | |||||||||||
Decrease in fair value of cash flow hedges | — | (0.8 | ) | — | — | — | ||||||||||
Remeasurement of defined benefit retirement plans | — | — | — | — | 23.7 | |||||||||||
Deferred tax on items taken to other comprehensive income | — | 0.1 | — | — | (9.1 | ) | ||||||||||
Equity dividends | — | — | — | — | (10.8 | ) | ||||||||||
Deferred tax on items taken to equity | — | — | — | — | 0.8 | |||||||||||
| | | | | | | | | | | | | | | | | |
At December 31, 2013 | 55.6 | (0.3 | ) | (25.4 | ) | (333.8 | ) | 317.3 | ||||||||
| | | | | | | | | | | | | | | | | |
| | | | | | | | | | | | | | | | | |
Nature and purpose of reserves
Share premium account
The share premium account is used to record the excess of proceeds over nominal value on the issue of shares. Share issue costs directly related to the issue of shares are deducted from share premium.
F-41
LUXFER HOLDINGS PLC
NOTES TO THE CONSOLIDATED FINANCIAL STATEMENTS (Continued)
(Dollars in millions)
20. Reserves (Continued)
Hedging reserve
The hedging reserve contains the effective portion of the cash flow hedge relationships entered into by the Group at the reporting date. The movement in the year to December 31, 2013 of $0.7 million includes a decrease in the fair value of cash flow hedges of $0.8 million, no impact of cash flow hedges being transferred to the income statement and a $0.1 million movement in deferred tax. For further information regarding the Group's forward foreign currency contracts, forward aluminum commodity contracts and forward rate interest rate agreements refer to Note 27 section (a)—Financial Instruments: Financial Instruments of the Group.
Translation reserve
The foreign currency translation reserve is used to record exchange differences arising from the translation of the financial statements of operations which do not have U.S. dollars as their functional currency. It would also be used to record the effect of hedging net investments in such operations.
Merger reserve
The merger reserve relates to the recapitalization of Luxfer Group Limited during the year ended December 31, 1999. Pursuant to the recapitalization of Luxfer Group Limited, Luxfer Holdings PLC acquired the entire share capital of Luxfer Group Limited. The company known as Luxfer Group Limited during the year ended December 31, 1999 was subsequently renamed LGL 1996 Limited and remains dormant. The recapitalization was accounted for using merger accounting principles.
The accounting treatment reflected the fact that ownership and control of Luxfer Group Limited, after the recapitalization, remained with the same institutional and management shareholders as before the recapitalization. Under merger accounting principles the consolidated financial statements of Luxfer Holdings PLC appear as a continuation of those for Luxfer Group Limited and therefore as if it had been the parent of the Group from its incorporation.
21. Bank and other loans
Non-current | December 31, 2013 $M | December 31, 2012 $M | |||||
|---|---|---|---|---|---|---|---|
Private Placement Loan Notes due 2018 | 63.8 | 63.5 | |||||
| | | | | | | | |
| 63.8 | 63.5 | ||||||
| | | | | | | | |
| | | | | | | | |
As at December 31, 2013 the group had £110 million facilities (approximately $182 million) comprising a seven year private placement denominated in US dollars of $65 million (approximately £39 million) with a US insurance company and banking facilities that include a revolving credit facility of £70 million ($116 million) with a number of banks.
On March 25, 2014 the Group amended its banking facilities, which are currently a £70 million ($116 million) revolving credit facility. The new arrangements will provide an expanded $150 million of
F-42
LUXFER HOLDINGS PLC
NOTES TO THE CONSOLIDATED FINANCIAL STATEMENTS (Continued)
(Dollars in millions)
21. Bank and other loans (Continued)
committed revolving credit facilities, at slightly lower costs to previous terms, and also provide up to an additional $50 million via a standby accordion facility. The current facilities were due to mature in early May 2015, but the amended facility will now be extended to the end of April 2019. The cost of extending these facilities was an additional $1.3 million commitment fee plus legal costs estimated at $0.3m.
As at December 31, 2013 the outstanding debt was made up of the private placement of $65 million (December 31, 2012: $65 million), with no draw down on loans under the bank facility (December 31, 2012: $nil).
The $65 million (£39 million) seven year private placement will be repayable in full in 2018 and bears interest at a fixed rate of 6.19%. The Group has arranged the seven year debt to be denominated in US dollars so that there is a natural partial offset between its dollar-denominated net assets and earnings of its US operations and this dollar-denominated debt and related interest expense.
As at December 31, 2013, the revolving credit facility carried amortization of $1.0 million (£0.6 million) per annum. The private placement notes and the revolving credit facility are unsecured. Unamortized finance costs of $1.4 million are included in trade and other receivables. As at December 31, 2013, the total amounts outstanding on the Loan Notes due 2018 were $65.0 million, which are shown in non-current bank and other loans net of unamortized finance costs of $1.2 million. The maturity profile of the Group's undiscounted contractual payments is disclosed in Note 26.
22. Provisions
| | Rationalization & redundancy $M | Employee benefits $M | Environmental provisions $M | Total $M | |||||||||
|---|---|---|---|---|---|---|---|---|---|---|---|---|---|
At January 1, 2012 | 0.4 | 1.2 | 3.5 | 5.1 | |||||||||
Charged to income statement | 1.3 | 0.3 | 0.1 | 1.7 | |||||||||
Cash payments | (1.3 | ) | (0.2 | ) | (0.8 | ) | (2.3 | ) | |||||
Exchange adjustments | — | — | 0.2 | 0.2 | |||||||||
| | | | | | | | | | | | | | |
At December 31, 2012 | 0.4 | 1.3 | 3.0 | 4.7 | |||||||||
Charged to income statement | 0.5 | 0.2 | — | 0.7 | |||||||||
Cash payments | (0.6 | ) | (0.1 | ) | (0.7 | ) | (1.4 | ) | |||||
Exchange adjustments | — | 0.1 | (0.1 | ) | — | ||||||||
| | | | | | | | | | | | | | |
At December 31, 2013 | 0.3 | 1.5 | 2.2 | 4.0 | |||||||||
| | | | | | | | | | | | | | |
| | | | | | | | | | | | | | |
F-43
LUXFER HOLDINGS PLC
NOTES TO THE CONSOLIDATED FINANCIAL STATEMENTS (Continued)
(Dollars in millions)
22. Provisions (Continued)
| | Rationalization & redundancy $M | Employee benefits $M | Environmental provisions $M | Total $M | |||||||||
|---|---|---|---|---|---|---|---|---|---|---|---|---|---|
At December 31, 2013 | |||||||||||||
Included in current liabilities | 0.3 | — | 1.5 | 1.8 | |||||||||
Included in non-current liabilities | — | 1.5 | 0.7 | 2.2 | |||||||||
| | | | | | | | | | | | | | |
| 0.3 | 1.5 | 2.2 | 4.0 | ||||||||||
| | | | | | | | | | | | | | |
| | | | | | | | | | | | | | |
At December 31, 2012 | |||||||||||||
Included in current liabilities | 0.4 | — | 1.5 | 1.9 | |||||||||
Included in non-current liabilities | — | 1.3 | 1.5 | 2.8 | |||||||||
| | | | | | | | | | | | | | |
| 0.4 | 1.3 | 3.0 | 4.7 | ||||||||||
| | | | | | | | | | | | | | |
| | | | | | | | | | | | | | |
Rationalization and redundancy
At December 31, 2013 the Group had $0.3 million of provisions relating to redundancy and the rationalization of its operations (December 31, 2012: $0.4 million). $0.1 million of this provision relates to restructuring of the production facilities at Gerzat, France within the Gas Cylinders division. A further $0.2 million of this provision relates to closure of the Gas Cylinders division manufacturing facility based at Aldridge in the UK.
Employee benefits
At December 31, 2013 the Group had $1.5 million of employee benefit liabilities (in addition to retirement benefits), as calculated on an actuarial basis, relating to a provision for workers' compensation at the Gas Cylinders division in the USA (December 31, 2012: $1.3 million).
Environmental provisions
As at December 31, 2013, the Group had environmental provisions of $2.2 million relating to environmental clean-up costs (December 31, 2012: $3.0 million). $0.9 million of the provision is for future remediation costs required at the Speciality Aluminium site, in relation to an incident before Luxfer Group's ownership. A further $1.3 million of environmental provisions relate to work required at the UK Elektron division site. This expenditure is expected to take place over the next one to three years.
F-44
LUXFER HOLDINGS PLC
NOTES TO THE CONSOLIDATED FINANCIAL STATEMENTS (Continued)
(Dollars in millions)
23. Deferred tax
| | Accelerated tax depreciation $M | Other temporary differences $M | Tax losses $M | Restated under IAS 19R Retirement benefit obligations $M | Total $M | |||||||||||
|---|---|---|---|---|---|---|---|---|---|---|---|---|---|---|---|---|
At January 1, 2012 | 8.8 | (7.9 | ) | — | (23.6 | ) | (22.7 | ) | ||||||||
Charged/(credited) to income statement | 1.1 | 3.0 | (1.5 | ) | 2.3 | 4.9 | ||||||||||
Credited to other comprehensive income | — | — | — | (2.9 | ) | (2.9 | ) | |||||||||
Exchange adjustment | 0.5 | (0.2 | ) | — | (1.2 | ) | (0.9 | ) | ||||||||
| | | | | | | | | | | | | | | | | |
At December 31, 2012 | 10.4 | (5.1 | ) | (1.5 | ) | (25.4 | ) | (21.6 | ) | |||||||
| | | | | | | | | | | | | | | | | |
| | | | | | | | | | | | | | | | | |
Charged/(credited) to income statement | 1.0 | 0.2 | (0.4 | ) | 2.2 | 3.0 | ||||||||||
(Credited)/charged to other comprehensive income | — | (0.1 | ) | — | 9.1 | 9.0 | ||||||||||
Credited to equity | — | (0.8 | ) | — | — | (0.8 | ) | |||||||||
Exchange adjustment | 0.1 | — | — | — | 0.1 | |||||||||||
| | | | | | | | | | | | | | | | | |
At December 31, 2013 | 11.5 | (5.8 | ) | (1.9 | ) | (14.1 | ) | (10.3 | ) | |||||||
| | | | | | | | | | | | | | | | | |
| | | | | | | | | | | | | | | | | |
The amount of deferred taxation accounted for in the Group balance sheet, after the offset of balances within countries for financial reporting purposes, comprised the following deferred tax assets and liabilities:
| | December 31, 2013 $M | December 31, 2012 $M | |||||
|---|---|---|---|---|---|---|---|
Deferred tax liabilities | (5.5 | ) | — | ||||
Deferred tax assets | 15.8 | 21.6 | |||||
| | | | | | | | |
Net deferred tax asset | 10.3 | 21.6 | |||||
| | | | | | | | |
| | | | | | | | |
At the balance sheet date, the Group has unrecognized deferred tax assets relating to certain trading and capital losses and other temporary differences of $19.5 million (December 31, 2012: $23.6 million) potentially available for offset against future profits. No deferred tax asset has been recognized in respect of this amount because of the unpredictability of future qualifying profit streams in the relevant entities. Of the total unrecognized deferred tax asset of $19.5 million (December 31, 2012: $23.6 million), $19.1 million (December 31, 2012: $18.5 million) relates to losses that can be carried forward indefinitely under current legislation.
At the balance sheet date there were unremitted earnings of overseas subsidiaries and joint ventures of $72.7 million (December 31, 2012: $56.7 million), for which there are no deferred tax liabilities recognized or unrecognized (December 31, 2012: $nil).
F-45
LUXFER HOLDINGS PLC
NOTES TO THE CONSOLIDATED FINANCIAL STATEMENTS (Continued)
(Dollars in millions)
24. Trade and other payables
| | December 31, 2013 $M | December 31, 2012 $M | |||||
|---|---|---|---|---|---|---|---|
Trade payables | 33.7 | 35.7 | |||||
Other taxation and social security | 4.7 | 5.2 | |||||
Accruals | 23.4 | 32.6 | |||||
Interest payable | 0.2 | 0.2 | |||||
Derivative financial instruments | 1.2 | — | |||||
| | | | | | | | |
| 63.2 | 73.7 | ||||||
| | | | | | | | |
| | | | | | | | |
The Directors consider that the carrying amount of trade payables approximates to their fair value.
25. Commitments and contingencies
| | December 31, 2013 $M | December 31, 2012 $M | December 31, 2011 $M | |||||||
|---|---|---|---|---|---|---|---|---|---|---|
Operating lease commitments—Group as a lessee | ||||||||||
Minimum lease payments under operating leases recognized in the income statement | 4.8 | 3.7 | 4.0 | |||||||
| | | | | | | | | | | |
At the balance sheet date, the Group had outstanding commitments for future minimum lease payments under non-cancellable operating leases, which fall due as follows:
| | December 31, 2013 $M | December 31, 2012 $M | December 31, 2011 $M | |||||||
|---|---|---|---|---|---|---|---|---|---|---|
Within one year | 4.9 | 4.4 | 3.3 | |||||||
In two to five years | 13.1 | 12.3 | 9.4 | |||||||
In over five years | 16.4 | 15.9 | 13.9 | |||||||
| | | | | | | | | | | |
| 34.4 | 32.6 | 26.6 | ||||||||
| | | | | | | | | | | |
| | | | | | | | | | | |
Operating lease payments represent rentals payable by the Group for certain of its properties and items of machinery. Leasehold land and buildings have a life between 2 and 65 years. Plant and equipment held under operating leases have an average life between 2 and 5 years. Renewal terms are included in the lease contracts.
Capital commitments
At December 31, 2013, the Group had capital expenditure commitments of $2.6 million (December 31, 2012: $0.9 million and January 1, 2012: $1.3 million) for the acquisition of new plant and equipment.
F-46
LUXFER HOLDINGS PLC
NOTES TO THE CONSOLIDATED FINANCIAL STATEMENTS (Continued)
(Dollars in millions)
26. Financial risk management objectives and policies
Financial risk management objectives and policies
The Group's financial instruments comprise bank and other loans, senior loan notes, derivatives and trade payables. Other than derivatives, the main purpose of these financial instruments is to raise finance for the Group's operations. The Group also has various financial assets such as trade receivables and cash and short-term deposits, which arise directly from its operations.
A Hedging Committee, chaired by the Group Finance Director, oversees the implementation of the Group's hedging policies, including the risk management of currency and aluminum risks and the use of derivative financial instruments.
It is not the Group's policy or business activity to trade in derivatives. They are only used to hedge underlying risks occurring as part of the Group's normal operating activities.
The main risks arising from the Group's financial instruments are cash flow interest rate risk, liquidity risk, foreign currency translation and transaction risk, aluminum price risk and credit risk on trade receivables.
The Group regularly enters into forward currency contracts to manage currency risks and when considered suitable will use other financial derivatives to manage commodity and interest rate risks.
Interest rate risk
The Group has exposure to variable interest rates if or when it may drawdown on the revolving credit facilities. As a result of this exposure, the Group may decide to hedge interest payable based on a combination of forward rate agreements, interest rate caps and swaps. It has also used an element of fixed rate debt within its financing structure to mitigate volatility in interest rate movements as disclosed in Note 21.
Total debt and debt funding to joint ventures, as at December 31, 2013, all related to fixed interest rate debt and so there was no interest rate risk at that date.
Liquidity risk
To understand and monitor cash flows, the Group uses a combination of a short-term rolling six week cash forecasts, based on expected daily liquidity requirements and longer term monthly rolling forecasts, covering forecast periods of between six and eighteen months forward. The Group also prepares, at least annually, longer-term strategic cash forecasts. Together this system of control is used to ensure the Group can fund its ongoing operations, including working capital, capital expenditure and interest payments and to ensure that bank covenant targets will be met. Short and medium term changes in liquidity needs are funded from the Group's $150 million revolving bank facility (as disclosed in Note 21), which provides the ability to draw down and repay funds on a daily basis. In monitoring liquidity requirements and planning its working capital and capital expenditure programs, the Group aims to maintain a sufficiently prudent level of headroom against its banking facilities and forecast covenant position as protection against any unexpected or sudden market shocks.
The Group also uses forecasts to manage the compliance with any associated covenant tests in relation to the Group's financing arrangements. The Group is subject to maintaining net debt to EBITDA levels of
F-47
LUXFER HOLDINGS PLC
NOTES TO THE CONSOLIDATED FINANCIAL STATEMENTS (Continued)
(Dollars in millions)
26. Financial risk management objectives and policies (Continued)
below three times, EBITDA to net interest above four times, and a number of other debt service tests which include EBITDA, taxation, capital expenditure and pension payments.
The Group has been in compliance with the covenants under the senior loan notes and the banking facilities throughout all of the quarterly measurement dates from and including September 30, 2011 to December 31, 2013.
The maturity of the Group's liabilities is also monitored to ensure sufficient funds remain available to meet liabilities as they fall due. The table below summarizes the maturity profile of the Group's financial liabilities at December 31 based on contractual payments.
| | December 31, 2013 | December 31, 2012 | |||||||||||||||||||||||
|---|---|---|---|---|---|---|---|---|---|---|---|---|---|---|---|---|---|---|---|---|---|---|---|---|---|
| | Within 12 months $M | 1-5 years $M | > 5 years $M | Total $M | Within 12 months $M | 1-5 years $M | > 5 years $M | Total $M | |||||||||||||||||
Loan Notes due 2018 | — | 65.0 | — | 65.0 | — | — | 65.0 | 65.0 | |||||||||||||||||
Trade payables | 33.7 | — | — | 33.7 | 35.7 | — | — | 35.7 | |||||||||||||||||
Accruals | 23.4 | — | — | 23.4 | 32.6 | — | — | 32.6 | |||||||||||||||||
Interest payable | 0.2 | — | — | 0.2 | 0.2 | — | — | 0.2 | |||||||||||||||||
Derivative financial instruments | 1.2 | — | — | 1.2 | — | — | — | — | |||||||||||||||||
| | | | | | | | | | | | | | | | | | | | | | | | | | |
| 58.5 | 65.0 | — | 123.5 | 68.5 | — | 65.0 | 133.5 | ||||||||||||||||||
| | | | | | | | | | | | | | | | | | | | | | | | | | |
| | | | | | | | | | | | | | | | | | | | | | | | | | |
The table below summarizes the maturity profile of the Group's financial liabilities at December 31 based on contractual undiscounted payments. Interest rates on the Group's debt have been based on a forward curve.
| | December 31, 2013 $M | December 31, 2012 $M | |||||
|---|---|---|---|---|---|---|---|
Undiscounted contractual maturity of financial liabilities: | |||||||
Amounts payable: | |||||||
Within 12 months | 62.5 | 72.5 | |||||
1-5 years | 78.9 | 16.1 | |||||
> 5 years | — | 66.8 | |||||
| | | | | | | | |
| 141.4 | 155.4 | ||||||
Less: future finance charges | (17.9 | ) | (21.9 | ) | |||
| | | | | | | | |
| 123.5 | 133.5 | ||||||
| | | | | | | | |
| | | | | | | | |
Capital risk management
In recent years the Group has sought to reduce its indebtedness and increase the level of equity funding and has organized its capital structure to fund medium and long-term investment programs aimed at the
F-48
LUXFER HOLDINGS PLC
NOTES TO THE CONSOLIDATED FINANCIAL STATEMENTS (Continued)
(Dollars in millions)
26. Financial risk management objectives and policies (Continued)
development of new products and production facilities. As at December 31, 2013, the debt drawn by the Group was only its Loan Notes due 2018.
The Group monitors its adjusted EBITDA for continuing activities to net debt ratio and has sought to reduce this over time from 6x to below 2x. The table below sets out the calculations for 2013, 2012 and 2011:
| | | Restated under IAS 19R | ||||||||
|---|---|---|---|---|---|---|---|---|---|---|
| | 2013 $M | 2012 $M | 2011 $M | |||||||
For continuing operations: | ||||||||||
Operating profit | 56.5 | 66.4 | 63.9 | |||||||
Add back: Restructuring and other (income) expense (Note 5) | 2.7 | 2.1 | (0.2 | ) | ||||||
Loss on disposal of property, plant and equipment | 0.3 | — | — | |||||||
Other share based compensation charges | 1.3 | — | — | |||||||
Depreciation and amortization | 15.8 | 14.7 | 14.5 | |||||||
| | | | | | | | | | | |
Adjusted EBITDA | 76.6 | 83.2 | 78.2 | |||||||
| | | | | | | | | | | |
| | | | | | | | | | | |
Bank and other loans | 63.8 | 63.5 | 132.5 | |||||||
| | | | | | | | | | | |
Total debt | 63.8 | 63.5 | 132.5 | |||||||
Less: | ||||||||||
Cash and short term deposits | (28.4 | ) | (40.2 | ) | (22.2 | ) | ||||
| | | | | | | | | | | |
Net debt | 35.4 | 23.3 | 110.3 | |||||||
| | | | | | | | | | | |
| | | | | | | | | | | |
Net debt: EBITDA ratio | 0.5x | 0.3x | 1.4x | |||||||
Credit risk
The Group only provides trade credit to creditworthy third parties. Credit checks are performed on new and existing customers along with monitoring payment histories of customers. Outstanding receivables from customers are closely monitored to ensure they are paid when due, with both outstanding overdue days and total days of sales outstanding ("DSO days") reported as a business unit key performance measure. Where possible export sales are also protected through the use of credit export insurance. At December 31, 2013, the Group has a provision for bad and doubtful debtors of $0.6 million (December 31, 2012: $2.2 million) and a credit of $0.4 million (2012: charge of $0.1 million) has gone to the Income Statement in relation to bad debts incurred in 2013.
The analysis of trade receivables that were past due but not impaired is as follows:
| | | | Past due but not impaired | |||||||||||||||||||
|---|---|---|---|---|---|---|---|---|---|---|---|---|---|---|---|---|---|---|---|---|---|---|
| | | Neither past due nor impaired $M | ||||||||||||||||||||
| | Total $M | < 31 days $M | 31-61 days $M | 61-91 days $M | 91-121 days $M | > 121 days $M | ||||||||||||||||
At December 31, 2013 | 53.0 | 41.8 | 9.5 | 1.6 | 0.1 | — | — | |||||||||||||||
At December 31, 2012 | 60.3 | 48.2 | 10.2 | 1.9 | — | — | — | |||||||||||||||
F-49
LUXFER HOLDINGS PLC
NOTES TO THE CONSOLIDATED FINANCIAL STATEMENTS (Continued)
(Dollars in millions)
26. Financial risk management objectives and policies (Continued)
The Group also monitors the spread of its customer base with the objective of trying to minimize exposure at a Group and divisional level to any one customer. The top ten customers in 2013 represented 30% (2012: 36.0% and 2011: 38.9%) of total revenue. There were no customers in 2013 or 2012 that represented over 10% of total revenue.
Foreign currency translation risk
With substantial operations in the UK and Rest of Europe, the Group is exposed to translation risk on both its Income Statement, based on average exchange rates, and its Balance Sheet with regards to period end exchange rates.
The Group's results and net assets are reported by geographic region in Note 2. This analysis shows in 2013 the Group had revenue of $137.8 million derived from UK operations, operating profit of $14.3 million and when adding back restructuring and other income (expense), share based compensation, loss on disposals and depreciation and amortization, an adjusted EBITDA of $21.9 million. During 2013, the average exchange rate for GBP sterling was £0.6384 being weaker than the 2012 average of £0.6279. This resulted in an adverse impact of $3.0 million on revenue and $0.7 million on operating profit and adjusted EBITDA. Based on the 2013 level of sales and profits a £0.05 increase in the GBP sterling to US dollar exchange rate would result in a $14.2 million decrease in revenue and a $3.3 million decrease in operating profit and adjusted EBITDA.
The capital employed as at December 31, 2013 in the UK was $75.9 million translated at an exchange rate of £0.6037. A £0.05 increase in exchange rates would reduce capital employed by approximately $5.8 million.
During 2013, the average exchange rate for the Euro was €0.7518, being stronger than the 2012 average of €0.7747. This resulted in a positive impact of $1.2 million on revenue, $0.1 million on operating profit and $0.2 million on adjusted EBITDA. Based on the 2013 level of sales and profits a €0.05 increase in the Euro to US dollar exchange rate would result in a $2.6 million decrease in revenue, a $0.2 million decrease in operating profit and a $0.4 million decrease in adjusted EBITDA.
Foreign currency transaction risk
In addition to currency translation risk, the Group incurs currency transaction risk whenever one of the Group's operating subsidiaries enters into either a purchase or sales transaction in a currency other than its functional currency. Currency transaction risk is reduced by matching sales revenues and costs in the same currency. The Group's US operations have little currency exposure as most purchases, costs and revenues are conducted in US dollars. The Group's UK operations are exposed to exchange transaction risks, mainly because these operations sell goods priced in euros and US dollars, and purchase raw materials priced in US dollars. The Group also incurs currency transaction risk if it lends currency other than its functional currency to one of its joint venture partners.
The UK operations within the Group have around an estimated $10 million net sales risk after offsetting raw material purchases made in US dollars and a substantial euro sales risk, with approximately €50 million of exports priced in euros. These risks are being partly hedged through the use of forward foreign currency
F-50
LUXFER HOLDINGS PLC
NOTES TO THE CONSOLIDATED FINANCIAL STATEMENTS (Continued)
(Dollars in millions)
26. Financial risk management objectives and policies (Continued)
exchange rate contracts, but we estimate that in 2013 our Elektron division has incurred a transaction loss of $1.2 million, and the transaction impact at our Gas Cylinders division was a loss of $1.0 million.
Based on a $10 million net exposure to the US dollar, a $0.10 increase in exchange rates would have a $0.6 million annual decrease in Group operating profit and based on a €50 million euro sales risk a €0.10 increase in exchange rates would have a $5.3 million annual decrease in Group operating profit.
Commodity price risks
The Group is exposed to a number of commodity price risks, including primary aluminum, magnesium, rare earth chemicals, zircon sand and other zirconium basic compounds. All have been subject to substantial increases in recent years. Historically the two largest exposures to the Group have been aluminum and magnesium prices and the Group will spend annually approximately $75 million to $85 million on these two raw materials. In recent years the costs of rare earth chemicals had been subject to significant commodity inflation.
Unlike the other major commodities purchased, aluminum is traded on the London Metal Exchange ("LME") and therefore the Group is able to use LME derivative contracts to hedge a portion of its price exposure. In 2013 the Group purchased approximately 13,500 metric tons of primary aluminum, it scrapped around 2,500 metric tons of processed waste and made finished goods equal to approximately 11,000 metric tons. The processed waste can be sold as scrap aluminum at prices linked to the LME price. The price risk on aluminum is mitigated by the use of LME derivative contracts. As at December 31, 2013, the Group had hedged 62% of our main primary aluminum requirements for 2014. Before hedging the risk, a $100 increase in the LME price of aluminum would increase our Gas Cylinders division's costs by $1.0 million.
In the long term the Group has sought to recover the cost of increased commodity costs through price increases and surcharges. Any hedging of aluminum risk is performed to protect the Group against short-term fluctuations in aluminum costs.
In 2013 the Group purchased approximately 6,000 metric tons of primary magnesium. Magnesium is not traded on the LME so we are not able to maintain a hedge position of its price exposure.
The Group purchases annually approximately 300 to 500 metric tons of various rare earth chemicals which it uses in the production of various materials produced by its Elektron division and when these chemicals became subject to significant price volatility it used surcharges on its products to maintain its product margins. To provide its customers with a stable surcharge price the Group's operations would also buy forward rare earths in bulk.
F-51
LUXFER HOLDINGS PLC
NOTES TO THE CONSOLIDATED FINANCIAL STATEMENTS (Continued)
(Dollars in millions)
27. Financial instruments
The following disclosures relating to financial instruments have been prepared on a basis which excludes short-term debtors and creditors which have resulted from the Group's operating activities.
(a) Financial instruments of the Group
The financial instruments of the Group other than short-term debtors and creditors were as follows:
Primary financial instruments: | Book value December 31, 2013 $M | Fair value December 31, 2013 $M | Book value December 31, 2012 $M | Fair value December 31, 2012 $M | |||||||||
|---|---|---|---|---|---|---|---|---|---|---|---|---|---|
Financial assets: | |||||||||||||
Cash at bank and in hand | 28.4 | 28.4 | 40.2 | 40.2 | |||||||||
| | | | | | | | | | | | | | |
Financial liabilities: | |||||||||||||
Bank and other loans(1) | 65.0 | 66.6 | 65.0 | 67.3 | |||||||||
| | | | | | | | | | | | | | |
- (1)
- Bank and other loans are shown gross of unamortized finance costs. The fair value of bank and other loans is calculated by discounting the future cash flows, including interest payments due.
All financial assets mature within one year. The maturity of the financial liabilities is disclosed in Note 26.
As at December 31, 2013 and 2012, the amount drawn in bank and other loans was $65.0 million, which was all denominated in US dollars.
Derivative financial instruments are as follows: | Book value December 31, 2013 $M | Fair value December 31, 2013 $M | Book value December 31, 2012 $M | Fair value December 31, 2012 $M | |||||||||
|---|---|---|---|---|---|---|---|---|---|---|---|---|---|
Held to hedge purchases and sales by trading businesses: | |||||||||||||
Forward foreign currency contracts | 0.8 | 0.8 | 0.2 | 0.2 | |||||||||
LME derivative contracts | (1.2 | ) | (1.2 | ) | 0.3 | 0.3 | |||||||
The fair value calculations were performed on the following basis:
Cash at bank and in hand
The carrying value approximates to the fair value as a result of the short-term maturity of the instruments.
Bank loans
At December 31, 2013 bank and other loans of $65.0 million (December 31, 2012: $65.0 million) were outstanding. As at December 31, 2013 bank and other loans are shown net of issue costs of $1.2 million and these issue costs are to be amortized to the expected maturity of the facilities. There are $1.4 million of deferred finance costs relating to the revolving credit facility shown in trade and other receivables. The
F-52
LUXFER HOLDINGS PLC
NOTES TO THE CONSOLIDATED FINANCIAL STATEMENTS (Continued)
(Dollars in millions)
27. Financial instruments (Continued)
Group at December 31, 2013 was not exposed to variable interest rates on its bank and other loans because all drawn debt was at fixed interest rates.
Forward foreign currency contracts
The fair value of these contracts was calculated by determining what the Group would be expected to receive or pay on termination of each individual contract by comparison to present market prices.
LME derivative contracts
The fair value of these contracts has been calculated by valuing the contracts against the equivalent forward rates quoted on the LME.
Fair value hierarchy
At December 31, 2013, the Group uses the following hierarchy for determining and disclosing the fair value of financial instruments by valuation technique:
Level 1: quoted (unadjusted) prices in active markets for identical assets or liabilities
Level 2: other techniques for which all inputs which have a significant effect on the recorded fair value are observable, either directly or indirectly
Level 3: techniques which use inputs which have a significant effect on the recorded fair value that are not based on observable market data.
| | December 31, 2013 $M | Level 1 $M | Level 2 $M | Level 3 $M | |||||||||
|---|---|---|---|---|---|---|---|---|---|---|---|---|---|
Derivative financial liabilities at fair value through profit or loss: | |||||||||||||
Forward foreign currency contracts | 0.8 | — | 0.8 | — | |||||||||
LME derivative contracts | (1.2 | ) | — | (1.2 | ) | — | |||||||
Interest bearing loans and borrowings: | |||||||||||||
Bank and other loans | (66.6 | ) | — | (66.6 | ) | — | |||||||
During the year ended December 31, 2013, there were no transfers between Level 1 and Level 2 fair value measurements, and no transfers into and out of Level 3 fair value measurements.
F-53
LUXFER HOLDINGS PLC
NOTES TO THE CONSOLIDATED FINANCIAL STATEMENTS (Continued)
(Dollars in millions)
27. Financial instruments (Continued)
(b) Interest rate risks
Interest rate risk profile on financial assets
This table shows the Group's financial assets as at December 31, which are cash at bank and in hand. These assets are all subject to floating interest rate risk.
Cash by currency: | December 31, 2013 $M | December 31, 2012 $M | |||||
|---|---|---|---|---|---|---|---|
US Dollar | 13.3 | 14.5 | |||||
GBP | 6.3 | 16.9 | |||||
Euro | 3.8 | 2.7 | |||||
Australian Dollar | 0.2 | 0.6 | |||||
Chinese Renminbi | 1.9 | 2.9 | |||||
Czech Koruna | 0.2 | 2.0 | |||||
Canadian Dollar | 2.5 | 0.6 | |||||
Japanese Yen | 0.2 | — | |||||
| | | | | | | | |
| 28.4 | 40.2 | ||||||
| | | | | | | | |
| | | | | | | | |
The Group earns interest on cash balances through either deposit accounts or placing funds on money markets at short-term fixed rates. In all cases, interest earned is at approximately LIBOR rates during the year.
Interest rate risk profile on financial liabilities
The following table sets out the carrying amount, by original maturity, of the Group's financial instruments that were exposed to both fixed and variable interest rate risk. The carrying amounts include interest payments to be made.
| | December 31, 2013 | December 31, 2012 | |||||||||||||||||||||||
|---|---|---|---|---|---|---|---|---|---|---|---|---|---|---|---|---|---|---|---|---|---|---|---|---|---|
| | Within 12 months $M | 1-5 years $M | > 5 years $M | Total $M | Within 12 months $M | 1-5 years $M | > 5 years $M | Total $M | |||||||||||||||||
Fixed interest rate risk: | |||||||||||||||||||||||||
Loan Notes due 2018 (including interest payments) | 4.0 | 78.9 | — | 82.9 | 4.0 | 16.1 | 66.8 | 86.9 | |||||||||||||||||
| | | | | | | | | | | | | | | | | | | | | | | | | | |
| 4.0 | 78.9 | — | 82.9 | 4.0 | 16.1 | 66.8 | 86.9 | ||||||||||||||||||
| | | | | | | | | | | | | | | | | | | | | | | | | | |
| | | | | | | | | | | | | | | | | | | | | | | | | | |
At December 31, 2013 and 2012 the Group had no floating rate liabilities outstanding.
F-54
LUXFER HOLDINGS PLC
NOTES TO THE CONSOLIDATED FINANCIAL STATEMENTS (Continued)
(Dollars in millions)
27. Financial instruments (Continued)
(c) Hedging activities
Forward foreign exchange contracts
The Group utilizes forward foreign exchange contracts to hedge significant future transactions and cash flows to manage its exchange rate exposures. The contracts purchased are primarily denominated in Sterling, US dollars and Euros. The Group is also exposed to a number of other currencies like Australian dollars with hedges against these on a more ad hoc basis, when exposures are more significant.
At December 31, 2013, the fair value of forward foreign exchange contracts deferred in equity was a gain of $1.0 million (2012: gain of $0.7 million and 2011: gain of $1.2 million). During 2013 a movement of $nil (2012: loss of $0.2 million and 2011: loss of $0.2 million) has been transferred to the income statement in respect of contracts that have matured in the year.
At December 31, 2013 and 2012 the Group held various foreign exchange contracts designated as hedges in respect of forward sales for US dollars, Euros, Canadian dollars and Japanese yen for the receipt of GBP sterling. The Group also held foreign exchange contracts designated as hedges in respect of forward purchases for US dollars and Euros by the sale of GBP sterling. The contract totals in GBP sterling, range of maturity dates and range of exchange rates are disclosed below:
December 31, 2013 Sales hedges | US dollars | Euros | Japanese Yen | Canadian dollars | ||||
|---|---|---|---|---|---|---|---|---|
Contract totals/£M | 14.2 | 27.7 | 0.1 | N/A | ||||
Maturity dates | 01/14 to 03/15 | 01/14 to 04/15 | 01/14 to 01/14 | N/A | ||||
Exchange rates | $1.5021 to $1.6509 | €1.1395 to €1.2665 | ¥173.37 to ¥173.37 | N/A |
Purchase hedges | US dollars | Euros | Japanese Yen | Canadian dollars | ||||
|---|---|---|---|---|---|---|---|---|
Contract totals/£M | 17.3 | N/A | N/A | N/A | ||||
Maturity dates | 01/14 to 04/15 | N/A | N/A | N/A | ||||
Exchange rates | $1.4888 to $1.6181 | N/A | N/A | N/A |
December 31, 2012 Sales hedges | US dollars | Euros | Japanese Yen | Canadian dollars | ||||
|---|---|---|---|---|---|---|---|---|
Contract totals/£M | 42.8 | 30.3 | N/A | 2.5 | ||||
Maturity dates | 01/13 to 03/14 | 01/13 to 05/14 | N/A | 01/13 to 01/13 | ||||
Exchange rates | $1.5433 to $1.6213 | €1.1880 to €1.2719 | N/A | $1.608 to $1.608 |
Purchase hedges | US dollars | Euros | Japanese Yen | Canadian dollars | ||||
|---|---|---|---|---|---|---|---|---|
Contract totals/£M | 29.4 | 0.6 | N/A | N/A | ||||
Maturity dates | 01/13 to 03/14 | 01/13 to 01/13 | N/A | N/A | ||||
Exchange rates | $1.5450 to $1.6234 | €1.2297 to €1.2297 | N/A | N/A |
F-55
LUXFER HOLDINGS PLC
NOTES TO THE CONSOLIDATED FINANCIAL STATEMENTS (Continued)
(Dollars in millions)
27. Financial instruments (Continued)
Aluminum commodity contracts
The Group did not hold any forward aluminum commodity contracts at December 31, 2013 or December 31, 2012.
Forward rate interest rate agreements
The Group did not hold any forward rate interest rate agreements at December 31, 2013 or December 31, 2012.
LME derivative contracts
As at 31 December 2013, the Group has hedged 6,000 and 1,800 metric tons of aluminum for supply in 2014 and 2015 respectively using its ancillary banking facilities. The fair value of LME derivative contracts deferred in equity was a loss of $1.4 million (2012: loss of $0.3 million and 2011: loss of $0.5 million).
(d) Foreign currency translation risk disclosures
Exchange gains and losses arising on the translation of the Group's non-US assets and liabilities are classified as equity and transferred to the Group's translation reserve. In 2013 a gain of $3.1 million (2012: gain of $2.9 million and 2011: loss of $5.4 million) was recognized in translation reserves.
(e) Un-drawn committed facilities
At December 31, 2013 and 2012 the Group had committed banking facilities denominated in GBP sterling of £70.0 million ($116 million). The facilities were for providing short-term loans and overdrafts, with a sub-limit for letters of credit which at December 31, 2013 was £7.0 million ($11.6 million) and 2012 was £8.0 million ($13.2 million). Of these committed facilities, $nil (December 31, 2012: $nil million) of short-term loans and $nil (December 31, 2012: $nil) for letters of credit were drawn. The Group has a separate bonding facility for bank guarantees denominated in GBP sterling of £3.0 million ($5.0 million), of which £1.2 million ($2.0 million) was drawn at December 31, 2013. At December 31, 2012 the amount drawn on the bonding facility was £1.2 million ($2.0 million). On March 25, 2014, the Group amended its banking facilities, which were still undrawn, to expand the committed facilities to $150 million.
28. Retirement benefits
The Group operates defined benefit arrangements in the UK, the US and France. The levels of funding are determined by periodic actuarial valuations. The assets of the plans are generally held in separate trustee administered funds. The Group also operates defined contribution plans in the UK, US, Australia and Canada.
Remeasurements are recognized in full in the period in which they occur. The liability recognized in the balance sheet represents the present value of the defined benefit obligation, as reduced by the fair value of plan assets. The cost of providing benefits is determined using the Projected Unit Credit Method.
F-56
LUXFER HOLDINGS PLC
NOTES TO THE CONSOLIDATED FINANCIAL STATEMENTS (Continued)
(Dollars in millions)
28. Retirement benefits (Continued)
The principal defined benefit pension plan in the Group and in the UK is the Luxfer Group Pension Plan, which closed to new members in 1998, new employees then being eligible for a defined contribution plan. With effect from April 2004 the Luxfer Group Pension Plan changed from a final salary to a career average revalued earnings benefit scale. In August 2005 a plan specific earnings cap of £60,000 per annum subject to inflation increases was introduced, effectively replacing the statutory earnings cap. In October 2007 the rate of the future accrual for pension was reduced and a longevity adjustment was introduced to mitigate against the risk of further unexpected increases in life expectancies. The weighted average duration of the expected benefit payments from the Luxfer Group Pension Plan is around 17 years. The pension cost of the Plan is assessed in accordance with the advice of an independent firm of professionally qualified actuaries, Lane Clark & Peacock LLP. The Plan is registered with HMRC for tax purposes, operates separately from the Group and is managed by an independent set of Trustees. The Plan is subject to UK regulations, which require the Group and Trustees to agree a funding strategy and contribution schedule for the plan. Over and above the normal contributions required to meet the cost of future accrual, the schedule of payments provides for deficit funding, which is based upon minimum annual contributions of £3.4 million per year, together with additional variable contributions based on one-fifth of net earnings of Luxfer Holdings PLC in excess of £12 million, with total deficit funding contributions subject to an annual cap of £5 million.
The Group's other arrangements are less significant than the Luxfer Group Pension Plan, the largest being the BA Holdings Inc Pension Plan in the US. In December 2005 the plan was closed to further benefit accrual with members being offered contributions to the Company's 401(k) plan.
The total charge to the Group's income statement for 2013 for retirement benefits was a cost of $11.9 million (2012: $10.4 million and 2011: $6.3 million).
The movement in the pension liability is shown below:
| | Restated under IAS 19R | ||||||
|---|---|---|---|---|---|---|---|
| | 2013 $M | 2012 $M | |||||
Balance at January 1 | 96.7 | 82.4 | |||||
Charged to the Income Statement | 10.2 | 10.3 | |||||
Past service cost/(credit) | — | 0.1 | |||||
Contributions | (17.8 | ) | (16.6 | ) | |||
(Credited) / charged to the Statement of Comprehensive Income | (23.7 | ) | 17.4 | ||||
Settlement charge | 1.7 | — | |||||
Exchange adjustments | 0.5 | 3.1 | |||||
| | | | | | | | |
Balance at December 31 | 67.6 | 96.7 | |||||
| | | | | | | | |
| | | | | | | | |
F-57
LUXFER HOLDINGS PLC
NOTES TO THE CONSOLIDATED FINANCIAL STATEMENTS (Continued)
(Dollars in millions)
28. Retirement benefits (Continued)
The financial assumptions used in the calculations are:
| | Projected Unit Valuation | ||||||||||||||||||
|---|---|---|---|---|---|---|---|---|---|---|---|---|---|---|---|---|---|---|---|
| | United Kingdom | Non United Kingdom | |||||||||||||||||
| | 2013% | 2012% | 2011% | 2013% | 2012% | 2011% | |||||||||||||
Discount Rate | 4.50 | 4.40 | 4.90 | 4.90 | 4.20 | 4.70 | |||||||||||||
Retail Price Inflation | 3.40 | 3.00 | 3.10 | — | — | — | |||||||||||||
Inflation related assumptions: | |||||||||||||||||||
Salary Inflation | 4.40 | 4.00 | 4.10 | — | — | — | |||||||||||||
Consumer Price Inflation | 2.40 | 2.30 | 2.10 | — | — | — | |||||||||||||
Pension increases—pre 6 April 1997 | 2.60 | 2.40 | 2.40 | — | — | — | |||||||||||||
—1997 – 2005 | 3.30 | 2.90 | 3.00 | — | — | — | |||||||||||||
—post 5 April 2005 | 2.20 | 2.10 | 1.90 | — | — | — | |||||||||||||
| | 2013 Years | 2012 Years | 2011 Years | |||||||
|---|---|---|---|---|---|---|---|---|---|---|
Other principal actuarial assumptions: | ||||||||||
Life expectancy of male in the UK aged 65 at accounting date | 20.5 | 20.3 | 20.4 | |||||||
Life expectancy of male in the UK aged 65 at 20 years after accounting date | 22.2 | 22.1 | 21.5 | |||||||
Investment strategies
For the principal defined benefit plan in the Group and the UK, the Luxfer Group Pension Plan, the assets are invested in a diversified range of asset classes and include matching assets (comprising fixed interest assets) and growth assets (comprising all other assets). The Trustees have formulated a de-risking strategy to help control the short term risks of volatility associated with holding growth assets. The Trustees also monitor the cost of a buy-in to secure pensioner liabilities with an insurance company to ensure they are able to act if such an opportunity arises.
Risk exposures
The Group is at risk of adverse experience relating to the defined benefit plans.
The plans hold a high proportion of assets in equity and other growth investments, with the intention of growing the value of assets relative to liabilities. The Group is at risk if the value of liabilities grows at a faster rate than the plan assets, or if there is a significant fall in the value of these assets not matched by a fall in the value of liabilities. This would be expected to lead to an increase in the Group's future cash contributions.
Special Events
In 2013 the US Plans offered deferred members the opportunity to receive a lump sum in respect of their benefits in the Plans. As a result, in early November and December a total of $12.9 million of lump sums were paid to members. This resulted in a settlement charge of $1.7 million.
F-58
LUXFER HOLDINGS PLC
NOTES TO THE CONSOLIDATED FINANCIAL STATEMENTS (Continued)
(Dollars in millions)
28. Retirement benefits (Continued)
The amounts recognized in income in respect of the pension plans are as follows:
| | | | | Restated under IAS 19R | ||||||||||||||||||||||||
|---|---|---|---|---|---|---|---|---|---|---|---|---|---|---|---|---|---|---|---|---|---|---|---|---|---|---|---|---|
| | 2013 UK $M | 2013 Non UK $M | 2013 Total $M | 2012 UK $M | 2012 Non UK $M | 2012 Total $M | 2011 UK $M | 2011 Non UK $M | 2011 Total $M | |||||||||||||||||||
In respect of defined benefit plans | ||||||||||||||||||||||||||||
Current service cost | 1.4 | 0.1 | 1.5 | 1.2 | — | 1.2 | 0.7 | — | 0.7 | |||||||||||||||||||
Net interest on net liability | 3.1 | 0.7 | 3.8 | 2.8 | 0.8 | 3.6 | 1.3 | 0.6 | 1.9 | |||||||||||||||||||
Administrative expenses | 1.5 | 0.2 | 1.7 | 2.2 | 0.1 | 2.3 | 2.2 | 0.1 | 2.3 | |||||||||||||||||||
Past service cost/(credit) | — | — | — | 0.1 | — | 0.1 | (1.6 | ) | — | (1.6 | ) | |||||||||||||||||
Settlements | — | 1.7 | 1.7 | — | — | — | — | — | — | |||||||||||||||||||
| | | | | | | | | | | | | | | | | | | | | | | | | | | | | |
Total charge/(credit) for defined benefit plans | 6.0 | 2.7 | 8.7 | 6.3 | 0.9 | 7.2 | 2.6 | 0.7 | 3.3 | |||||||||||||||||||
| | | | | | | | | | | | | | | | | | | | | | | | | | | | | |
| | | | | | | | | | | | | | | | | | | | | | | | | | | | | |
In respect of defined contribution plans | ||||||||||||||||||||||||||||
Total charge for defined contribution plans | 1.3 | 1.9 | 3.2 | 1.3 | 1.9 | 3.2 | 1.3 | 1.7 | 3.0 | |||||||||||||||||||
| | | | | | | | | | | | | | | | | | | | | | | | | | | | | |
Total charge for pension plans | 7.3 | 4.6 | 11.9 | 7.6 | 2.8 | 10.4 | 3.9 | 2.4 | 6.3 | |||||||||||||||||||
| | | | | | | | | | | | | | | | | | | | | | | | | | | | | |
| | | | | | | | | | | | | | | | | | | | | | | | | | | | | |
Of the charge for the year, charges of $4.5 million and $1.9 million (2012: $4.6 million and $2.2 million; 2011: $4.1 million and $1.9 million); have been included in cost of sales and administrative costs respectively; a charge of $1.7 million (2012: $nil million; 2011: a credit of $1.6 million) has been included in restructuring and other income (expense) and a charge of $3.8 million (2012: $3.6 million; 2011: $1.9 million) has been included in finance costs.
For the year, the amount of gain recognized in the Statement of Comprehensive Income is $23.7 million (2012: loss of $17.4 million and 2011: loss of $49.8 million).
The actual return of the plan assets was a gain of $33.4 million (2012: gain of $31.3 million and 2011: loss of $9.9 million).
The 2013 figures have been calculated under IAS 19 (Revised). There has been no impact on the disclosed defined benefit obligation, fair value of assets or net liabilities. However, the net charge to the Income Statement has increased by $6.2 million (relative to that under the previous version of IAS 19), and the actuarial loss recognized for 2013 has decreased correspondingly by $6.2 million.
The 2012 and 2011 figures have been restated under IAS 19 (Revised). There has been no impact on the disclosed defined benefit obligation, fair value of assets or net liabilities. However, the net charge to the Income Statement for 2012 and 2011 has increased by $3.9 million and $ 4.2 million respectively (relative to that previously disclosed in 2012 and 2011), and the prior year actuarial loss recognized for 2012 and 2011 has decreased correspondingly by $3.9 million and $4.2 million.
F-59
LUXFER HOLDINGS PLC
NOTES TO THE CONSOLIDATED FINANCIAL STATEMENTS (Continued)
(Dollars in millions)
28. Retirement benefits (Continued)
The value of the plan assets were:
| | | | | Restated under IAS 19R | |||||||||||||||
|---|---|---|---|---|---|---|---|---|---|---|---|---|---|---|---|---|---|---|---|
| | 2013 UK $M | 2013 Non UK $M | 2013 Total $M | 2012 UK $M | 2012 Non UK $M | 2012 Total $M | |||||||||||||
Assets in active markets: | |||||||||||||||||||
Equities and Growth Funds | 197.3 | 28.7 | 226.0 | 187.1 | 29.8 | 216.9 | |||||||||||||
Government bonds | 22.0 | — | 22.0 | 15.8 | — | 15.8 | |||||||||||||
Corporate Bonds | 76.8 | 19.8 | 96.6 | 63.4 | 23.1 | 86.5 | |||||||||||||
Cash | 0.3 | — | 0.3 | 0.6 | — | 0.6 | |||||||||||||
| | | | | | | | | | | | | | | | | | | | |
Total market value of assets | 296.4 | 48.5 | 344.9 | 266.9 | 52.9 | 319.8 | |||||||||||||
Present value of plan liabilities | (357.8 | ) | (54.7 | ) | (412.5 | ) | (343.7 | ) | (72.8 | ) | (416.5 | ) | |||||||
| | | | | | | | | | | | | | | | | | | | |
Deficit in the plan | (61.4 | ) | (6.2 | ) | (67.6 | ) | (76.8 | ) | (19.9 | ) | (96.7 | ) | |||||||
Related deferred tax asset | 12.3 | 1.7 | 14.0 | 17.7 | 7.7 | 25.4 | |||||||||||||
| | | | | | | | | | | | | | | | | | | | |
Net pension liability | (49.1 | ) | (4.5 | ) | (53.6 | ) | (59.1 | ) | (12.2 | ) | (71.3 | ) | |||||||
| | | | | | | | | | | | | | | | | | | | |
| | | | | | | | | | | | | | | | | | | | |
Analysis of movement in the present value of the defined benefit obligations:
| | | | | Restated under IAS 19R | |||||||||||||||
|---|---|---|---|---|---|---|---|---|---|---|---|---|---|---|---|---|---|---|---|
| | 2013 UK $M | 2013 Non UK $M | 2013 Group $M | 2012 UK $M | 2012 Non UK $M | 2012 Group $M | |||||||||||||
At January 1 | 343.7 | 72.8 | 416.5 | 295.1 | 66.7 | 361.8 | |||||||||||||
Service cost | 1.4 | 0.1 | 1.5 | 1.2 | — | 1.2 | |||||||||||||
Interest on obligation | 14.3 | 2.9 | 17.2 | 14.7 | 2.9 | 17.6 | |||||||||||||
Contributions from plan members | 0.8 | — | 0.8 | 0.8 | — | 0.8 | |||||||||||||
Age related NI rebate | — | — | — | 0.2 | — | 0.2 | |||||||||||||
Actuarial (gains) and losses | 3.7 | (7.4 | ) | (3.7 | ) | 29.1 | 5.6 | 34.7 | |||||||||||
Exchange difference | 6.6 | 0.1 | 6.7 | 14.6 | — | 14.6 | |||||||||||||
Benefits paid | (12.7 | ) | (2.6 | ) | (15.3 | ) | (12.1 | ) | (2.4 | ) | (14.5 | ) | |||||||
Past service cost/(credit) | — | — | — | 0.1 | — | 0.1 | |||||||||||||
Settlements | — | (11.2 | ) | (11.2 | ) | — | — | — | |||||||||||
| | | | | | | | | | | | | | | | | | | | |
At December 31 | 357.8 | 54.7 | 412.5 | 343.7 | 72.8 | 416.5 | |||||||||||||
| | | | | | | | | | | | | | | | | | | | |
| | | | | | | | | | | | | | | | | | | | |
The defined benefit obligation comprises $2.2 million (December 31, 2012: $1.4 million) arising from unfunded plans and $410.3 million (December 31, 2011: $415.1 million) from plans that are funded.
F-60
LUXFER HOLDINGS PLC
NOTES TO THE CONSOLIDATED FINANCIAL STATEMENTS (Continued)
(Dollars in millions)
28. Retirement benefits (Continued)
The sensitivities regarding the principal assumptions used to measure the present value of the defined benefit obligations are set out below:
Assumption | Change in assumption | Impact on total defined benefit obligations | ||
|---|---|---|---|---|
Discount rate | Increase/decrease by 1.0% | Decrease/increase by 16% | ||
RPI inflation (and related increases) | Increase/decrease by 1.0% | Increase/decrease by 8% | ||
Post retirement mortality | Increase by 1 year | Increase by 3% |
Analysis of movement in the present value of the fair value of plan assets:
| | | | | Restated under IAS 19R | |||||||||||||||
|---|---|---|---|---|---|---|---|---|---|---|---|---|---|---|---|---|---|---|---|
| | 2013 UK $M | 2013 Non UK $M | 2013 Group $M | 2012 UK $M | 2012 Non UK $M | 2012 Group $M | |||||||||||||
At January 1 | 266.9 | 52.9 | 319.8 | 236.6 | 42.8 | 279.4 | |||||||||||||
Interest on plan assets | 11.2 | 2.2 | 13.4 | 11.9 | 2.1 | 14.0 | |||||||||||||
Actuarial (gains) and losses | 15.3 | 4.7 | 20.0 | 12.2 | 5.1 | 17.3 | |||||||||||||
Exchange difference | 6.2 | — | 6.2 | 11.5 | — | 11.5 | |||||||||||||
Contributions from employer | 10.2 | 4.4 | 14.6 | 8.0 | 5.4 | 13.4 | |||||||||||||
Contributions from plan members | 0.8 | — | 0.8 | 0.8 | — | 0.8 | |||||||||||||
Age related NI rebate | — | — | — | 0.2 | — | 0.2 | |||||||||||||
Administrative expenses | (1.5 | ) | (0.2 | ) | (1.7 | ) | (2.2 | ) | (0.1 | ) | (2.3 | ) | |||||||
Benefits paid | (12.7 | ) | (2.6 | ) | (15.3 | ) | (12.1 | ) | (2.4 | ) | (14.5 | ) | |||||||
Settlements | — | (12.9 | ) | (12.9 | ) | — | — | — | |||||||||||
| | | | | | | | | | | | | | | | | | | | |
At December 31 | 296.4 | 48.5 | 344.9 | 266.9 | 52.9 | 319.8 | |||||||||||||
| | | | | | | | | | | | | | | | | | | | |
| | | | | | | | | | | | | | | | | | | | |
The estimated amount of employer contributions expected to be paid to the defined benefit pension plans for the year ending December 31, 2014 is $13.5 million (2013: $14.6 million actual employer contributions).
29. The Luxfer Group Employee Share Ownership Plan
The trust
In 1997, the Group established an employee benefit trust ("the ESOP") with independent trustees, to purchase and hold shares in the Company in trust to be used to satisfy options granted to eligible senior employees under the Company's share plans established from time to time.
The ESOP was established with the benefit of a gift equivalent to the set up and running costs. Purchase monies and costs required by the ESOP trustees to purchase shares for and under the provisions of the trust are provided by way of an interest free loan from a Group subsidiary. The loan is repayable, in normal circumstances, out of monies received from senior employees when they exercise options granted to them
F-61
LUXFER HOLDINGS PLC
NOTES TO THE CONSOLIDATED FINANCIAL STATEMENTS (Continued)
(Dollars in millions)
29. The Luxfer Group Employee Share Ownership Plan (Continued)
over shares. Surplus shares are held by the ESOP trustees to satisfy future option awards. The ESOP trustees have waived their right to receive dividends on shares held in trust. The Remuneration Committee is charged with determining which senior employees are to be granted options and in what number subject to the relevant plan rules.
The current plan
The current share option plan, implemented by the Company in February 2007 is The Luxfer Holdings Executive Share Option Plan ("the Plan"), which consists of two parts. Part A of the Plan is approved by HM Revenue & Customs and Part B is unapproved. Options can be exercised at any time up to the tenth anniversary of their grant subject to the rules of the relevant part of the Plan. As a result of the I.P.O all leaver restrictions over the shares were released. There is no other performance criteria attached to the options.
Movements in the year
The movement in the number of shares held by the trustees of the ESOP and the number of share options held over those shares are shown below:
| | Number of shares held by ESOP Trustees | Number of options held over £1 ordinary shares | ||||||||||||||||||||
|---|---|---|---|---|---|---|---|---|---|---|---|---|---|---|---|---|---|---|---|---|---|---|
| | £0.0001 deferred shares | £1 ordinary shares | £0.97 options held | £1.40 options held | £3 options held | £4 options held | Total options held | |||||||||||||||
At January 1, 2013 | 15,977,968,688 | 93,674 | 15,200 | — | 20,800 | 29,510 | 65,510 | |||||||||||||||
Options granted during the year | — | — | — | — | — | — | — | |||||||||||||||
Options exercised during the year | — | — | — | — | — | — | — | |||||||||||||||
Options lapsed during the year | — | — | — | — | — | — | — | |||||||||||||||
| | | | | | | | | | | | | | | | | | | | | | | |
At December 31, 2013 | 15,977,968,688 | 93,674 | 15,200 | — | 20,800 | 29,510 | 65,510 | |||||||||||||||
| | | | | | | | | | | | | | | | | | | | | | | |
| | | | | | | | | | | | | | | | | | | | | | | |
As at December 31, 2013 the loan outstanding from the ESOP was $3.6 million (December 31, 2012: $3.5 million).
During the year ended December 31, 2013 all of the shares held by the ESOP were transferred into the ADS plan.
The market value of each £1 ordinary shares held by the ESOP as at December 13, 2013 was $41.72.
30. Share based compensation
Luxfer Holdings PLC Long-Term Umbrella Incentive Plan and Luxfer Holdings PLC Non-Executive Directors Equity Incentive Plan
As an important retention tool and to align the long-term financial interests of our management with those of our shareholders, the Group adopted the Luxfer Holdings PLC Long-Term Umbrella Incentive Plan (the
F-62
LUXFER HOLDINGS PLC
NOTES TO THE CONSOLIDATED FINANCIAL STATEMENTS (Continued)
(Dollars in millions)
30. Share based compensation (Continued)
"LTIP") for the Group's senior employees, and the Luxfer Holdings PLC Non-Executive Directors Equity Incentive Plan (the "Director EIP") for the Non-Executive Directors.
The equity or equity-related awards under the LTIP and the Director EIP will be based on the ordinary shares or ADSs of the Group. The Remuneration Committee will administer the LTIP and will have the power to determine to whom the awards will be granted, the amount, type and other terms. Awards under the EIP are non-discretionary and purely time-based.
Share option and restricted stock awards
As a tool to retain key people and align their interests with those of shareholders, a one-off award of market-value options was made to a small number of executives and the non-executive directors immediately prior to the I.P.O. in 2012.
40% of the options granted vested immediately and 20% of the options vest upon each of the first, second and third anniversaries of the I.P.O.
In January 2013, 306,200 Restricted Stock Units and Options over ADSs, equivalent to 153,100 ordinary shares, were granted under the LTIP and 9,252 ADS Restricted Stock, equivalent to 18,504 was granted under the Director EIP. In March 2013, 1,924 ADS Restricted Stock, equivalent to 962 ordinary shares, was granted under the Director EIP.
In March 2014, 201,870 Restricted Stock Units and Options over ADSs, equivalent to 100,935 ordinary shares, were granted under the LTIP.
| | 2013 $M | 2012 $M | 2011 $M | |||||||
|---|---|---|---|---|---|---|---|---|---|---|
I.P.O related share based compensation charges | 0.5 | 0.8 | — | |||||||
Other share based compensation charges | 1.3 | — | — | |||||||
| | | | | | | | | | | |
| 1.8 | 0.8 | — | ||||||||
There were no cancellations or modifications to the awards in 2013.
The following table illustrates the number and weighted average exercise prices (WAEP) of, and movements in, share options during the year, with each option relating to 1 American Depositary Share:
| | 2013 Number | 2013 WAEP | 2012 Number | 2012 WAEP | 2011 Number | 2011 WAEP | |||||||||||||
|---|---|---|---|---|---|---|---|---|---|---|---|---|---|---|---|---|---|---|---|
At January 1 | 816,400 | $ | 10.00 | — | — | — | — | ||||||||||||
Granted during the year | 317,376 | $ | 2.80 | 816,400 | $ | 10.00 | — | — | |||||||||||
Lapsed during the year | (2,000 | ) | $ | (0.76 | ) | ||||||||||||||
| | | | | | | | | | | | | | | | | | | | |
At December 31 | 1,131,776 | $ | 8.00 | 816,400 | $ | 10.00 | — | — | |||||||||||
| | | | | | | | | | | | | | | | | | | | |
| | | | | | | | | | | | | | | | | | | | |
The weighted average remaining contractual life for the share options outstanding as at December 31, 2013 was 5 years (December 31, 2012: 7 years).
F-63
LUXFER HOLDINGS PLC
NOTES TO THE CONSOLIDATED FINANCIAL STATEMENTS (Continued)
(Dollars in millions)
30. Share based compensation (Continued)
The weighted average fair value of options granted during the year was $7.27.
The weighted average exercise price for options outstanding at the end of the year was $7.99.
The following tables list the inputs to the models used for the plans for the year ended December 31, 2013:
| | 2013 | 2012 | ||
|---|---|---|---|---|
Dividend yield (%) | 2.25 | 3.0 | ||
Expected volatility range (%) | 41.3 – 42.8 | 40.7 – 42.7 | ||
Risk-free interest rate (%) | 0.15 – 0.86 | 0.16 – 0.61 | ||
Expected life of share options range (years) | 1 – 7 | 1 – 5 | ||
Weighted average exercise price ($) | $2.81 | $10.00 | ||
Model used | Black-Scholes | Black-Scholes |
The expected life of the share options is based on historical data and current expectations and is not necessary indicative of exercise patterns that may occur. The expected volatility reflects the assumption that the historical volatility over a period similar to the life of the options is indicative of future trends, which may not necessarily be the actual outcome.
Employee Share Incentive Plan—UK
In December 2013, the Group implemented an Employee Share Incentive Plan (the "SIP") in the UK. Under the plan, all employees with at least six months of service with the group and who are employed by a participating group company are entitled to contribute up to 10% of basic pay each month, subject to a £125 maximum. The SIP trustees buy shares (partnership shares) every 6 months at market value with the employees' contributions. For each partnership share purchased, the group purchases one share (matching shares) which are allocated to the employee. In the UK SIP, if the employee sells or transfers partnership shares within three years from the date of allocation, the linked matching shares are forfeited.
31. Related party transactions
Joint venture in which the Group is a venturer
During 2013, the Group maintained its 51% investment in the equity of the joint venture Luxfer Uttam India Private Limited. During 2013, the Gas Cylinders division made $1.3 million of sales to the joint venture. At December 31, 2013, the amounts receivable from the joint venture amounted to $1.4 million.
During 2013, the Group provided $2.5 million in equity investment and $4.5 million in debt investment to its joint venture Luxfer Holdings NA, LLC, of which it holds 49% of the equity. The debt investment was provided through a secured revolving credit facility that the Group has granted to the joint venture of which up to $10 million can be drawn down until March 31, 2018. During 2013, the Gas Cylinders division made $7.6 million of sales to the joint venture. At December 31, 2013, the amounts receivable from the joint venture amounted to $0.3 million of trade debt and $4.5 million of debt investment.
F-64
LUXFER HOLDINGS PLC
NOTES TO THE CONSOLIDATED FINANCIAL STATEMENTS (Continued)
(Dollars in millions)
31. Related party transactions (Continued)
Transactions with other related parties
As at December 31, 2013 the Directors and key management comprising the members of the Executive Management Board, owned 715,258 £1 ordinary shares (2012: 734,645 £1 ordinary shares) and held options over a further 445,598 £1 ordinary shares (2012: 334,810 £1 ordinary shares).
During the years ended December 31, 2013 and December 31, 2012, no share options held by members of the Executive Management board were exercised.
Other than the transactions with the joint ventures disclosed above and key management personnel disclosed above, no other related party transactions have been identified.
32. Post Balance Sheet Events
Acquisition of additional CNG cylinder manufacturing facility
In March 2014 the group acquired a small composite cylinder manufacturer and the associated production assets in Utah. This provides our North American gas cylinder business with a facility purpose-built for the manufacture of Type 4 (polymer-lined) composite cylinder products, which will be targeted initially at the class 8 heavy-duty truck market, where an increasing rate of conversion from diesel to CNG is widely anticipated. The initial cost is $3 million with a deferred consideration element linked largely to the success of the operation in the next three years and estimated at $6m. We are in the final stages of developing a new range of larger-diameter Type 4 cylinders for growing CNG markets to complement our existing lightweight range of Type 3 (aluminum-lined) cylinder products and systems, and our plan is for the new range to be made in Utah.
F-65