UNITED STATES SECURITIES AND EXCHANGE COMMISSION Washington, D.C. 20549
Form 10-K
|
| | | | |
| ý | ANNUAL REPORT PURSUANT TO SECTION 13 OR 15(d) OF THE SECURITIES EXCHANGE ACT OF 1934 | | ¨ | TRANSITION REPORT PURSUANT TO SECTION 13 OR 15(d) OF THE SECURITIES EXCHANGE ACT OF 1934. |
| | | or | | |
| | For the fiscal year ended December 31, 2012 | | | For the transition period from to . |
Commission File Number: 000-28369
Geeknet, Inc.
(Exact name of Registrant as specified in its charter) |
| |
| Delaware | 77-0399299 |
(State or other jurisdiction of incorporation or organization) | (I.R.S. Employer Identification No.) |
11216 Waples Mill Rd., Suite 100, Fairfax, VA 22030
(Address, including zip code, of principal executive offices)
(877) 433-5638
(Registrant’s telephone number, including area code)
Securities registered pursuant to Section 12(b) of the Act:
|
| |
| Common Stock, $0.001 par value | The Nasdaq Stock Market LLC (Nasdaq Global Market) |
| (Title of Class) | (Name of each exchange on which registered) |
Indicate by check mark if the registrant is a well-known seasoned issuer, as defined in Rule 405 of the Securities Act. Yes ¨ No ý
Indicate by check mark if the registrant is not required to file reports pursuant to Section 13 or Section 15(d) of the Act. Yes ¨ No ý
Indicate by check mark whether the registrant: (1) has filed all reports required to be filed by Section 13 or 15(d) of the Securities Exchange Act of 1934 during the preceding 12 months (or for such shorter period that the registrant was required to file such reports), and (2) has been subject to such filing requirements for the past 90 days. Yes ý No ¨
Indicate by check mark whether the registrant has submitted electronically and posted on its corporate Web site, if any, every Interactive Data File required to be submitted and posted pursuant to Rule 405 of Regulation S-T during the preceding 12 months (or for such shorter period that the registrant was required to submit and post such files). Yes ý No ¨
Indicate by check mark if disclosure of delinquent filers pursuant to Item 405 of Regulation S-K is not contained herein, and will not be contained, to the best of the registrant’s knowledge, in definitive proxy or information statements incorporated by reference in Part III of this Form 10-K or any amendment to this Form 10-K. x
Indicate by check mark whether the registrant is a large accelerated filer, an accelerated filer, a non-accelerated filer, or a smaller reporting company. See the definition of “large accelerated filer,” “accelerated filer” and “smaller reporting company” in Rule 12b-2 of the Exchange Act). (Check one): Large accelerated filer ¨ Accelerated filer ý Non-accelerated filer ¨ Smaller reporting company ¨
Indicate by check mark whether the registrant is a shell company (as defined in Rule 12b-2 of the Exchange Act). Yes ¨ No ý
As of February 22, 2013, there were 6,575,633 shares of the registrant’s Common Stock outstanding. The aggregate market value of the Common Stock held by non-affiliates of the registrant as of June 30, 2012 (based on the closing price for the Common Stock on the NASDAQ Global Market for such date) was approximately $74 million. Shares of common stock held by each of our officers and directors and by each person or group who owns 5% or more of our outstanding common stock have been excluded in that such persons or groups may be deemed to be our affiliate. This determination of affiliate status is not necessarily a conclusive determination for other purposes.
DOCUMENTS INCORPORATED BY REFERENCE
Portions of the Proxy Statement for the 2012 Annual Meeting of Stockholders which will be held on May 7, 2013, and which will be filed pursuant to Regulation 14A within 120 days after the registrant’s year ended December 31, 2012, are incorporated by reference into Part III of this Form 10-K.
PART I
ITEM 1. Business
Special Note Regarding Forward-Looking Statements
This Form 10-K contains forward-looking statements that involve risks and uncertainties. Words such as “may,” “could,” “anticipate,” “potential,” “intend,” “expect,” “believe,” “in our view,” and variations of such words and similar expressions, are intended to identify such forward-looking statements, which include, but are not limited to, statements regarding our expectations and beliefs regarding future revenue growth; financial performance and results of operations; popularity and demand for our retail products; management's strategy, plans and objectives for future operations; employee relations and our ability to attract and retain highly qualified personnel; our ability to continue to invest in developing new products; competition, competitors and our ability to compete; liquidity and capital resources; and sufficiency of our cash resources and investments to meet our operating and working capital requirements. Actual results may differ materially from those expressed or implied in such forward-looking statements due to various factors, including those set forth in this Business section under “Competition” and in the Risk Factors contained in Item 1A of this Form 10-K. We undertake no obligation to update the forward-looking statements to reflect events or circumstances occurring after the date of this Form 10-K.
Introduction
Geeknet, Inc. (“Geeknet” or the “Company”) is the parent company of ThinkGeek, Inc. an online premier retailer for the global geek community, comprised of technology enthusiasts and general consumers of geek-themed, technology-oriented and popular culture goods. ThinkGeek has sought to provide the tech, gadget and game-obsessed communities with all the things that geeks crave through its ThinkGeek.com website. ThinkGeek was founded to serve the distinct needs and interests of technology professionals and enthusiasts and today has grown to become the place for innovative and imaginative products that appeal to the geek in everyone.
We are subject to the informational requirements of the Securities Exchange Act of 1934, as amended (the “Exchange Act”). Therefore, we file periodic reports, proxy statements and other information with the Securities and Exchange Commission (the “SEC”). Such reports, proxy statements and other information may be obtained by visiting the Public Reference Room of the SEC at 100 F Street, NE, Washington, DC 20549 or by calling the SEC at 1-800-SEC-0330. In addition, the SEC maintains an Internet site (http://sec.gov) that contains reports, proxy and information statements and other information regarding issuers that file electronically with the SEC.
You can access other information at our Investor Relations web site at investors.geek.net. The content of this web site is not intended to be incorporated by reference into this report or any other report we file with the SEC. We make available, free of charge on our website, copies of our annual report on Form 10-K, quarterly reports on Form 10-Q, current reports on Form 8-K and any amendments to these reports as soon as reasonably practicable after filing such material electronically or otherwise furnishing it to the SEC.
On November 10, 2010 we effected a 1-for-10 reverse stock split of all outstanding shares of common stock, reduced the total number of shares of common stock that the Company is authorized to issue to 25,000,000 and reduced the total number of shares of preferred stock that the Company is authorized to issue to 1,000,000. We have adjusted all share and per share amounts in this report to give effect to the reverse stock split.
Business Overview
Geeknet was incorporated in California in January 1995 and reincorporated in Delaware in December 1999. From the date of its incorporation through October 2001, the Company sold Linux-based hardware systems and services under the name VA Linux Systems, Inc. In December 2001, the Company changed its name to VA Software Corporation to reflect its decision to pursue Media, e-commerce, Software and Online Images businesses. In May 2007, the Company changed its name to SourceForge, Inc. In November 2009, the Company changed its name to Geeknet to project a more accurate reflection of its business, primarily to the advertising community.
On September 17, 2012 , Geeknet, Inc. entered into an Asset Purchase Agreement with Dice Holdings, Inc. and two of Dice’s subsidiaries, Dice Career Solutions, Inc. and eFinancialCareers Limited (collectively, the “Buyers”) pursuant to which the Buyers purchased the Company’s Media business, including the SourceForge, Slashdot and Freecode websites and assumed certain related liabilities.
Subsequent to the sale of the Company's Media business, Geeknet, Inc.'s business consists solely of its e-Commerce business that sells geek-themed retail products through its ThinkGeek website and wholesale channel. Some ThinkGeek products are custom made and developed by the Company's product development team, GeekLabs. Revenue is generated by attracting traffic to the ThinkGeek website, by offering a broad range of products that are not available in traditional brick-and-mortar stores and by introducing new products to the ThinkGeek audience and fans on a regular basis.
The Company also sells ThinkGeek products through its wholesale channel. The Company has wholesale partnerships with brick and mortar retailers that allow the Company to reach a new consumer audience and expand ThinkGeek's unique brand. The Company recently established and strengthened existing partnerships with retail store chains that have hundreds of locations throughout the United States and Canada and now has a presence internationally.
We offer a broader range of unique products in a single web property than are typically available in traditional brick-and-mortar stores. We introduce a range of new products to our audience on a regular basis and develop and sell our own “GeekLabs” custom products. Our customers are able to buy electronics, toys, gadgets, apparel, edibles and other specialty items with a single check-out. Consumers can access the information directly through our web site or contact our customer care representatives and experts by e-mail at orders@thinkgeek.com or by telephone at 1-888-GEEKSTUFF. A third-party contract warehouse provider located in Lockbourne, Ohio receives purchased inventory, fulfills customers’ orders, and processes returns.
During the last half of 2012, we transitioned our product safety and quality assurance function in-house. Prior to the transition, we were using various third-party vendors to perform these services. We have invested in certified personnel, who are highly qualified in product development processes and in conducting safety and quality assurance testing. We also began the process of building a testing laboratory. We believe our investment will enable us to improve the quality of our products, minimize defective products, and continue to exceed industry standards.
Sales and Marketing
Our e-Commerce marketing and promotion strategy is focused on acquiring new customers and building brand loyalty with existing customers. This strategy is designed to increase customer traffic to our online store and improve loyalty while increasing revenue opportunities by adding new customers. We will continue to use the unique capabilities of the Internet, including social networking sites such as Facebook, Twitter and YouTube, to increase brand awareness while encouraging new and repeat customers to visit our web site. We participate in traditional online marketing activities such as email, search, affiliates and social media. During 2012, we limited the use of printed catalogs to include in orders shipped to our customers. This is consistent with industry trends and allowed us to redeploy our marketing spend to other channels.
Our Geek Points customer retention program is designed to build customer loyalty. Through this program, customers are rewarded for shopping with us. When customers sign up for Geek Points, they earn points on certain purchases. Rewards for Geek Points participants include special promotions and discounts. We also have developed marketing programs that include special offers to promote sales or sales of certain products. We ran programs such as discounting certain products or product lines, offering a dollar amount off of an order if it reached a certain dollar threshold and free upgraded shipping. We also offered free shipping on certain days during the holiday seasons and we had a free t-shirt giveaway program. Certain of these programs were offered to all customers while others were for a targeted audience. Our programs are more frequently run during certain holiday peak seasons such as Christmas, April Fool's Day, Father's Day and Halloween. This maximizes our sales potential while rewarding our customers. We continue to evaluate and measure the success of all of our marketing programs and redesign or adjust as needed. During the first half of 2013, we will be modifying our Geek Points loyalty program.
In addition to our core business of selling products through our ThinkGeek website, we also sell products through our wholesale channel. During 2012, our wholesale channel continued to deliver rapid growth. Our wholesale clients buy our ThinkGeek exclusive products to sell in their brick and mortar stores across the United States, in Canada and internationally. Our clients are well-known reputable retailers that have a strong presence in malls and in stand-alone stores. Our notable clients are f.y.e., HMV (in Canada), Books-A-Million and Urban Outfitters (primarily United States locations). f.y.e, is a successful entertainment and pop culture mall-based chain store with locations across the United States. HMV, an established entertainment retailer in Canada similar to f.y.e., has over one hundred stores in Canada. Books-A-Million is the second largest book retailer in the United States, with over 250 locations and Urban Outfitters has over 150 stores throughout the country.
Our international wholesale channel grew significantly in 2012. We have partnered with distributors in Australia, Germany, Japan and the United Kingdom. We believe our international wholesale business will grow in future years. We believe selling to widely known popular retailers is an opportunity to expand our brand recognition and grow our wholesale business. We believe that continuing to build our wholesale channel client base and strengthening our existing relationships will result in a positive impact on future revenues.
Technology and Design
During the fourth quarter of 2012, we changed the name of our Research and Development to Technology and Design. We believe that the name Technology and Design conforms to similar naming conventions used in our industry for similar activities, as described below.
GeekLabs
We have strengthened our focus and investment on the development of new and innovative products developed by GeekLabs. We have a talented group of artists and engineers who use their expertise, creativity and imagination to design, build and test original geek-themed products to offer to our customers. Our unique product ideas are originated via brainstorm sessions by the GeekLabs team and internal staff focus groups. Customers can suggest ideas and be compensated for them via our IdeaFactory program featured on the ThinkGeek website.
GeekLabs leverages ThinkGeek's formidable cache of licenses for various notable properties such as Star Wars, Star Trek, Game of Thrones, Minecraft and Portal. Selected ideas will transition to our GeekLabs engineering team for design, prototype and development. We then work with our manufacturing partners overseas to complete and deliver the finished products. GeekLabs products are exclusively launched on the ThinkGeek website. Some of these products are sold by our wholesale clients in non-competing channels. We hope to delight our customers and the media by the unique, unexpected, exciting and sometimes humorous geeky products our GeekLabs team create.
Website Engineering and Technology
We have implemented a broad array of services and systems for customer service, product searching, customer communication, order processing and order fulfillment functions. These services and systems use a combination of our own proprietary technologies and commercially available, licensed technologies. We focus our internal development efforts on creating and enhancing the specialized, proprietary software to improve our customer experience and ease of use and to increase the functionality of our ThinkGeek.com web site.
Our core online merchandise catalog, customer interaction, order collection, fulfillment and back-end systems are proprietary to ThinkGeek. The systems are designed to provide connectivity to our distribution center allowing for same day shipment of in-stock items. These include an inventory tracking system, a real-time order tracking system, an executive information system and an inventory replenishment system. Our Internet servers use secure sockets layer (SSL) technology to help conduct secure communications and transactions.
During the past two years, we have greatly improved the search function and product categorizations on our website. This helps our customers find products they are seeking that are similar in nature or theme. Additionally, we have developed functionality that identifies products that may interest a customer based upon the history of products customers have visited, purchased or added to their wish list. We have also developed targeted customer emails that notify customers if a product is in stock, if a new product is available for sale, or to remind customers of a product they recently viewed along with a special promotion or offer. This encourages our customers to revisit the website and potentially purchase that product. We have also streamlined our online shopping cart so there are fewer steps to check out, making it easier to use and is consistent with industry practices. We continue to invest in improving our site, our customer service, order processing, shipping and tracking systems.
Competition
The market for retail products similar to those offered by ThinkGeek is highly competitive. We compete with a variety of companies in different consumer verticals. Our competition includes apparel companies such as Threadless and Zazzle and gadget and home goods stores such as Brookstone, Best Buy and Bed Bath and Beyond. We also compete with gifting companies such as RedEnvelope, UncommonGoods, Perpetual Kid and larger online marketplaces such as Amazon.com, Buy.com, and Overstock.com.
More recently, some online retailers have developed sites targeted to the computer enthusiast and computer gaming markets. We believe that there are a number of competitive factors in our market, including company credibility, product selection and availability, convenience, price, web site features, functionality and performance, ease of purchasing, customer service and reliability and speed of order shipment.
Many of the competitors in our e-Commerce industry have substantial competitive advantages, including greater resources that can be devoted to the development, promotion and sale of their online products, more established sales channels, greater software and web site development experience, and greater name recognition. To be competitive, we must respond promptly and effectively to changes in consumer preferences, the challenges of technological change, evolving standards and our competitors’ innovations by continuing to enhance our services and products. Any pricing pressures or loss of customers resulting from our failure to compete effectively would reduce our revenue and margin.
Intellectual Property Rights
We protect our intellectual property through a combination of copyright, trademark, patent and trade secret laws, employee and third-party nondisclosure agreements, and other methods of protection. Geeknet, ThinkGeek and their associated logos are some of our trademarks that we use in the United States and in other countries.
Seasonality
Our business is highly seasonal, reflecting the general pattern associated with the retail industry of peak sales and earnings during the holiday shopping season. As a result, a substantial portion of our 2012 e-Commerce revenue occurred in our fourth quarter, which began on October 1, 2012 and ended on December 31, 2012. As is typical in the retail industry, we generally experience lower e-Commerce revenue during the other quarters. Therefore, our e-Commerce revenue in a particular quarter is not necessarily indicative of future revenue for a subsequent quarter or our full year.
Employees
Our employees are not represented by any collective bargaining organization; we have never experienced a work stoppage; and we believe that our relations with our employees are good. As of December 31, 2012, our employee base totaled 76, including 21 in operations, 16 in sales and marketing, 20 in technology and design and 19 in finance and administration.
Item 1A. Risk Factors
CURRENT AND PROSPECTIVE INVESTORS IN GEEKNET SECURITIES SHOULD CAREFULLY CONSIDER THE RISKS DESCRIBED BELOW BEFORE MAKING AN INVESTMENT DECISION. IN ADDITION, THESE RISKS ARE NOT THE ONLY ONES FACING OUR COMPANY. ADDITIONAL RISKS OF WHICH WE ARE NOT PRESENTLY AWARE OR THAT WE CURRENTLY BELIEVE ARE IMMATERIAL MAY ALSO IMPAIR OUR BUSINESS OPERATIONS. OUR BUSINESS COULD BE HARMED BY ANY OF THESE RISKS. THE TRADING PRICE OF OUR COMMON STOCK COULD DECLINE DUE TO ANY OF THESE RISKS, AND INVESTORS MAY LOSE ALL OR PART OF THEIR INVESTMENT.
Risks Related To Our e-Commerce Business
If ThinkGeek fails to launch new and innovative products, the demand for our products may be limited and our revenue will be adversely affected.
In order to attract customers to our site, we must continually release new and innovative products, including products internally developed by GeekLabs. In addition to the direct revenue we derive from product sales, the release of new and innovative products attracts media coverage and drives customers to our site. The successful development, sourcing, manufacturing and merchandising of products is subject to numerous risks and uncertainties, including:
| |
| • | specific economic conditions relating to our business |
| |
| • | the spending habits of our customers |
| |
| • | the performance of our suppliers |
| |
| • | execution by our third party fulfillment center |
| |
| • | our ability to retain qualified merchandising, sales and product development personnel |
There can be no assurance that our new products will appeal to customers or that demand for these products will be sufficient to generate revenue consistent with our estimates. In addition, there can be no assurance that new products will be developed in a timely or cost-effective manner, or that we will be able to procure appropriate quantities of such products. If we are unable to deliver new and innovative products that allow us to increase demand, we may not be able to generate sufficient revenue to grow our ThinkGeek business. See also additional risks related to competition set forth elsewhere in these Risk Factors.
Our e-Commerce business is highly seasonal. In addition, we are exposed to significant inventory risks as a result of seasonality, new product launches, rapid changes in product cycles and changes in consumer tastes.
Our business is highly seasonal, with a disproportionate amount of our sales occurring in the fourth quarter which begins on October 1 and ends on December 31. To be successful, we must accurately predict our customers' tastes and demands to avoid purchasing too much or too little inventory. If we purchase too much inventory, we may be required to discount those products or write off products we are unable to sell, reducing our gross margins. If we purchase too little inventory, we may fail to meet customer demand and lose potential orders, which will adversely affect our financial results.
In addition, when we launch a new product, it is difficult to accurately forecast customer demand. Certain products, especially custom manufactured products or products purchased from outside the United States may require significant lead-time, payment or partial payment prior to shipment, and may not be returnable. We carry a broad selection of products and significant inventory levels of certain products and we may be unable to sell products in sufficient quantities or during the relevant selling seasons. Failure to properly assess our inventory needs could adversely affect our financial results.
We are dependent upon a single third-party fulfillment and warehouse provider. Our customer satisfaction is highly dependent upon fulfillment of orders in a professional and timely manner. Any decrease in the quality of service offered by our fulfillment and warehouse provider will adversely affect our reputation and the growth of our ThinkGeek e-Commerce business. If we fail to realize anticipated operating efficiencies at our third-party fulfillment and warehouse provider, our operating results will be adversely affected.
Our business' ability to receive inbound inventory and ship completed orders efficiently and in a timely manner to our customers is substantially dependent on a single third-party fulfillment and warehouse provider. We ship products to customers worldwide using the services of Exel, Inc. (“Exel”), located in Lockbourne, Ohio. Our contract with Exel ends April 26, 2016.
If Exel fails to meet our distribution and fulfillment needs, our relationship with and reputation among our customers will suffer and this will adversely affect our revenue. Additionally, if Exel is unable to meet our distribution and fulfillment needs, particularly during the holiday season, or our contract with Exel is terminated, we may be required to secure a second-source or replacement fulfillment and warehouse provider. If we fail to secure such a fulfillment and warehouse provider or are unable to secure a fulfillment and warehouse provider on comparable terms our reputation and our financial results would be adversely affected.
If we fail to maintain and continuously improve our ThinkGeek website and customer loyalty program, we may not attract or retain customers.
If potential or existing customers do not find our website an entertaining and convenient place to shop, we may not attract or retain customers and our sales may suffer. To encourage the use of our website, it must continuously improve in accessibility, content and ease of use. Customer traffic and our business would be adversely affected if competitors' websites are perceived as easier to use or better able to satisfy customer needs. In addition, if we fail to maintain a customer loyalty program that is competitive in our industry, we may not attract or retain customers and our sales may suffer.
Unplanned system interruptions and capacity constraints could harm our revenue and reputation.
Our business is dependent on the uninterrupted and highly-available operation of our website. We experience periodic service interruptions with our ThinkGeek web site. Service interruptions may be caused by a variety of factors, including capacity constraints, software design flaws and bugs, and third party denial of service attacks. If we fail to provide customers with such access to our web site at the speed and performance which they require, our sales and business reputation will be adversely affected.
Our systems and operations remain vulnerable to damage or interruption from fire, power loss, telecommunications failure and similar events. If our web site experiences frequent or lengthy service interruptions, our business and reputation could be adversely affected. In the third quarter of 2012, we moved our disaster recovery site to Dallas, Texas from Chicago, Illinois. Failure of our new disaster recovery location to perform effectively could adversely affect our business and reputation.
We are subject to risks as a result of our reliance on foreign sources of production for certain products.
In order to offer cost-effective and innovative products, we rely on manufacturers located outside of the United States, most of which are located in Asia (primarily China), to supply us with sufficient quantities of these products based on our forecasts and to deliver these products in a timely manner.
Our arrangements with these manufacturers are generally limited to purchase orders tied to specific lots of goods. We are subject to the risks of relying on products manufactured outside of the United States, including political unrest, trade restrictions, customs and import/export regulations, local business practice and geo-political issues, such as political and social unrest and economic instability. Additionally, significant reliance on foreign sources of production increases the risks relating to compliance with domestic or international labor standards, customs and import/export laws and regulations, compliance with domestic or international manufacturing and product safety standards, currency fluctuations, restrictions on the transfer of funds, work stoppages or slowdowns and other labor issues, economic uncertainties including inflation and government regulations, availability and costs of raw materials, potentially adverse tax consequences and other uncertainties. China, in particular, has recently experienced rapid social, political and economic change and further changes may adversely affect our ability to procure our products from Chinese suppliers.
Our ability to obtain goods on a cost effective basis is also subject to our ability to maintain relationships with our suppliers and our ability to negotiate and maintain supply arrangements on favorable terms. The Chinese Yuan (“CNY”) exchange rate to the U.S. Dollar (“USD”) has not historically been volatile. In the event that the CNY/USD exchange rate changes substantially, our suppliers could attempt to renegotiate our purchase orders with them and increase our costs. In addition, because our purchases are usually on a case by case basis, we are subject to the risk of unexpected changes in pricing or supply from these suppliers. We may also be unable to develop beneficial relationships with new vendors in the future.
We may be subject to product liability claims if people or property are harmed by the products we sell on our ThinkGeek website, which could be costly to defend and subject us to significant damage claims.
Some of the products we offer for sale on our ThinkGeek website may expose us to product liability or product safety claims relating to personal injury, death or property damage caused by such products and may require us to take actions such as product recalls, which could involve significant expense incurred by the Company. Although we maintain liability insurance, we cannot be certain that our coverage will be adequate for liabilities actually incurred or that insurance will continue to be available to us on economically reasonable terms, or at all. The successful assertion of an uninsured product liability or other claim against us could cause us to incur significant expenses to pay such a claim and could adversely affect our financial results. Even a successfully defended product liability claim could cause us to incur significant expenses to defend such a claim and could adversely affect our financial results. In addition, some of our vendor agreements with our suppliers do not indemnify us from product liability and even if some agreements provide for indemnification, it may not be possible or practical to avail ourselves of the benefits of the protection.
As a distributor of consumer products, we are subject to various government regulations and may be subject to additional regulations in the future, violation of which could subject us to sanctions or otherwise harm our business.
As a distributor of consumer products, we are subject to significant government regulations, including, in the United States, under The Consumer Products Safety Act, The Federal Hazardous Substances Act, and The Flammable Fabrics Act, as well as under product safety and consumer protection statutes in our international markets. In addition, certain of our products are subject to regulation by the Food and Drug Administration or similar international authorities. In addition, collecting information from children is subject to regulation by the Federal Trade Commission under the Children's Online Privacy Protection Act. We are taking steps we believe are necessary to comply with these acts, but there can be no assurance that we will be in compliance, and failure to comply with these acts could result in sanctions which could have a negative impact on our business, financial condition and results of operations. We may also be subject to involuntary product recalls or may voluntarily conduct a product recall. While costs associated with product recalls have generally not been material to our business, the costs associated with future product recalls individually or in the aggregate in any given fiscal year, could be significant. In addition, any product recall, regardless of direct costs of the recall, may harm consumer perceptions of our products and have a negative impact on our future revenues and results of operations.
Governments and regulatory agencies in the markets where we manufacture and sell products may enact additional regulations relating to product safety and consumer protection in the future, and may also increase the penalties for failure to comply with product safety and consumer protection regulations. Complying with any such additional regulations or requirements could impose increased costs on our business. Similarly, increased penalties for non-compliance could subject us to greater expense in the event any of our products were found to not comply with such regulations. Such increased costs or penalties could harm our business.
Increased focus on sales and use tax could subject us to liability for past sales and cause our future sales to decrease.
We do not collect sales or other taxes on shipments of our goods into most states in the United States or internationally. The relocation of our fulfillment center or customer service centers or any future expansion of them, along with other aspects of our business, may result in additional sales and other tax obligations. We do not collect consumption tax (including value added tax, goods and services tax, and provincial sales tax) as applicable on goods and services sold that are delivered outside of the United States as our terms of sale provide that the customer is responsible for such expenses. One or more states or foreign countries may seek to impose sales or other tax collection obligations on out-of-jurisdiction e-Commerce companies. A successful assertion by one or more states or foreign countries that we should collect sales or other taxes on the sale of merchandise or services could result in substantial tax liabilities for past sales, decrease our ability to compete with traditional retailers, and otherwise harm our business.
Currently, U.S. Supreme Court decisions restrict the imposition of obligations to collect state and local sales and use taxes with respect to sales made over the Internet. However, a number of states and the U.S. Congress continue to consider initiatives that could limit or supersede the Supreme Court's position regarding sales and use taxes on Internet sales, and some states have adopted laws that attempt to impose obligations on out-of-state retailers to collect taxes on their behalf. If any of these initiatives are successful, we could be required to collect sales and use taxes in additional states. The imposition by state and local governments of various taxes upon Internet commerce could create administrative burdens for us, put us at a competitive disadvantage if they do not impose similar obligations on all of our online competitors and decrease our future sales.
Risks Related To Our Financial Results
Certain factors specific to our business over which we have limited or no control may nonetheless adversely impact our total revenue and financial results.
The primary factors over which we have limited or no control that may adversely impact our total revenue and financial results include the following:
| |
| • | specific economic conditions relating to our business |
| |
| • | the spending habits of our customers |
| |
| • | our ability to keep our website operational at a reasonable cost |
If our revenue and operating results fall below our expectations, the expectations of securities analysts or the expectations of investors, the trading price of our common stock will likely be materially and adversely affected. You should not rely on the results of our business in any past periods as an indication of our future financial performance.
Future changes in financial accounting standards, including pronouncements and interpretations of accounting pronouncements on revenue recognition, may cause adverse unexpected revenue fluctuations and/or affect our reported results of operations.
From time to time, the Financial Accounting Standards Board (“FASB”) may issue updates to the FASB Accounting Standards Codification. A change in an accounting policy can have a significant effect on our reported results and may even affect our reporting of transactions completed before a change is announced. Accounting policies affecting our business, including rules relating to revenue recognition have recently been revised or are under review. The SEC has issued a work plan regarding the potential use of financial statements prepared in accordance with International Financial Reporting Standards (“IFRS“). IFRS is a comprehensive series of accounting standards published by the International Accounting Standards Board (“IASB”).
If we fail to adequately monitor and minimize our use of existing cash, we may need additional capital to fund continued operations beyond the next 12 months.
We must continue to closely monitor the use of our existing cash, cash equivalents and marketable securities. In addition, our existing marketable securities may not provide us with adequate liquidity when needed. While we believe we will not require additional capital to fund continued operations for the next 12 months, we may require additional funding within this time frame, and this additional funding, if needed, may not be available on terms acceptable to us, or at all. A slowdown in ThinkGeek spending or an increased working capital requirement for our ThinkGeek inventory, as well as other factors that may arise, could affect our future capital requirements and the adequacy of our available funds. As a result, we may be required to raise additional funds through private or public financing facilities, strategic relationships or other arrangements. Any additional equity financing would likely be dilutive to our stockholders. Debt financing, if available, may involve restrictive covenants on our operations and financial condition. Our inability to raise capital when needed could seriously harm our business.
Furthermore, if we fail to adequately deploy or invest the cash we received in our September 17, 2012 sale of our former Media business, our financial results could be adversely affected.
We have a history of losses and may incur net losses in the foreseeable future. Failure to attain consistent profitability may materially and adversely affect the market price of our common stock and our ability to raise capital and continue operations.
We have an accumulated deficit of $743.2 million as of December 31, 2012. We may continue to incur net losses in the future. Failure to attain profitability on a sustained basis may materially and adversely affect the market price of our common stock and our ability to raise capital and continue operations beyond the next 12 months.
Our ability to use net operating loss carryforwards to offset future taxable income for U.S. federal income tax purposes is subject to limitation and may be limited further.
In general, under Section 382 of the Internal Revenue Code of 1986, as amended (the “Code”), a corporation that undergoes an “ownership change” is subject to limitations on its ability to utilize its net operating losses (“NOLs”), to offset future taxable income. In general, an ownership change occurs if the aggregate stock ownership of certain stockholders increases by more than 50 percentage points over such stockholders' lowest percentage ownership during the testing period (generally three years). We determined that such an ownership change occurred as of November 2008. This ownership change resulted in limitations on the utilization of tax attributes, including net operating loss carryforwards and tax credits.
The occurrence of a additional ownership change could limit the ability to utilize NOLs that are not currently subject to limitation, and could further limit the ability to utilize NOLs that are currently subject to limitation. The amount of the annual limitation generally is equal to the value of the stock of the corporation immediately prior to the ownership change multiplied by the adjusted federal tax-exempt rate, set by the Internal Revenue Service. Limitations imposed on the ability to use NOLs to offset future taxable income could cause U.S. federal income taxes to be paid earlier than otherwise would be paid if such limitations were not in effect and could cause such NOLs to expire unused, in
each case reducing or eliminating the benefit of such NOLs. Similar rules and limitations may apply for state income tax purposes.
Risks Related To Competition
Our competition is intense. Our failure to compete successfully could adversely affect our revenue and financial results.
Our ThinkGeek business is rapidly evolving and operates in an intensely competitive industry. We have many competitors, including other e-Commerce businesses as well as traditional brick and mortar retailers. Increases in shipping costs or the taxation of Internet commerce may make our products uncompetitive when compared with traditional brick and mortar retailers. Additionally, our current and future competitors may have greater resources, more customers and greater brand recognition than we do. These competitors may secure better terms from vendors and adopt more competitive pricing for their products. They may also devote more resources to their technology infrastructure, product development, order fulfillment, distribution facilities and marketing and advertising campaigns. In addition, as we expand into new markets and broaden our product offering, our competition may intensify as our current and future competitors enter into similar markets and offer similar products. Local competitors in these new markets may have substantial competitive advantages because of greater focus on and knowledge of local customers and their preferences and greater brand recognition.
Increased competition in our ThinkGeek business could result in price reductions, reduced margins or loss of market share, any of which could have a material adverse effect on our future revenue and financial results.
Risks Related To Intellectual Property
We are vulnerable to claims that our ThinkGeek website infringes third-party intellectual property rights. Any resulting claims against us could be costly to defend or subject us to significant damages.
We expect that our ThinkGeek website will increasingly be subject to infringement claims as the number of competitors in our industry segment grows and the functionality of web properties in different Internet industry segments overlap. The scope of United States patent protection for software is not well defined and will evolve as the United States Patent and Trademark Office grants additional patents. Because patent applications in the United States are not publicly disclosed until the patent is issued, applications may have been filed that would relate to our products. In addition, we may receive patent infringement claims as companies increasingly seek to patent their software. Our developers may unknowingly infringe on third-party patent rights. We cannot prevent current or future patent holders or other owners of intellectual property from suing us and others seeking monetary damages or an injunction against our web offerings. A patent holder may deny us a license or force us to pay royalties. In either event, our operating results could be seriously harmed. In addition, employees hired from competitors might utilize proprietary and trade secret information from their former employers without our knowledge, even though our employment agreements and policies clearly prohibit such practices.
Any litigation regarding our intellectual property, with or without merit, could be costly and time consuming to defend, divert the attention of our management and key personnel from our business operations and cause interruption in our ThinkGeek website. Claims of intellectual property infringement may require us to enter into royalty and licensing agreements that may not be available on acceptable terms. In addition, parties making claims against us may be able to obtain injunctive or other equitable relief that could effectively block our ability to offer our products in the United States and abroad and could result in an award of substantial damages against us. Defense of any lawsuit or failure to obtain any required license could delay release of our products and increase our costs. If a successful claim is made against us and we fail to develop or license a substitute technology, our business, results of operations, financial condition or cash flows could be immediately and materially adversely affected.
If we fail to adequately protect our intellectual property rights, competitors may use our technology and trademarks, which could weaken our competitive position, reduce our revenue, and increase our costs.
We rely on a combination of copyright, trademark, patent and trade secret laws, employee and third-party nondisclosure agreements, and other arrangements to protect our proprietary rights. Despite these precautions, it may be possible for unauthorized third parties to copy our ThinkGeek website, or products and services offered thereon or obtain and use information that we regard as proprietary to create sites that compete against ours. Some license
provisions protecting against unauthorized use, copying, transfer, and disclosure of our licensed programs may be unenforceable under the laws of certain jurisdictions and foreign countries.
In addition, the laws of some countries do not protect proprietary rights to the same extent as do the laws of the United States. To the extent that we increase our international activities, our exposure to unauthorized copying and use of our ThinkGeek website, proprietary information and original products will increase. Additionally, we manufacture most of our original products in Asia, primarily in China, where there is a risk that such products would be copied and enforcement of our intellectual property rights would be difficult.
Our collection of trademarks is important to our business. The protective steps we take or have taken may be inadequate to deter misappropriation of our trademark rights. We have filed applications for registration of and registered some of our trademarks in the United States and internationally. Effective trademark protection may not be available in every country in which we offer or intend to offer our products and services. Failure to protect our trademark rights adequately could damage our brand identity and impair our ability to compete effectively. Furthermore, defending or enforcing our trademark rights could result in the expenditure of significant financial and managerial resources.
Our success depends significantly upon our proprietary technology and information. Despite our efforts to protect our proprietary technology and information, it may be possible for unauthorized third parties to copy certain portions of our offerings or to reverse engineer or otherwise obtain and use our proprietary technology or information. We periodically discover products that are counterfeit reproductions of our products or designs, or that otherwise infringe our intellectual property rights. The actions we take to establish and protect our intellectual property rights may not be adequate to prevent imitation of our offerings by others or prevent others from seeking to block sales of our offerings as violations of proprietary rights. Existing copyright laws afford only limited protection, and the laws of certain foreign countries may not protect intellectual property rights to the same extent as do United States laws. Litigation may be necessary to protect our proprietary technology and information. Such litigation may be costly and time-consuming and if we are unsuccessful in challenging a party on the basis of intellectual property infringement, our sales and intellectual property rights could adversely be affected and result in a shift of customer preference away from our offerings.
In addition, we cannot be certain that others will not develop substantially equivalent or superseding proprietary technology, or that equivalent offerings will not be marketed in competition with our offerings, thereby substantially reducing the value of our proprietary rights. Currently, we do not have any software, utility, or design patents and we may not be able to develop proprietary offerings or technologies that are patentable, that any patent, if issued, would provide us with any competitive advantages or would not be challenged by third parties, or that the patents of others will not adversely affect our ability to do business.
Other Risks Related To Our Overall Business
We are exposed to risks associated with worldwide economic slowdowns and related uncertainties.
We are subject to macroeconomic fluctuations in the U.S. economy and elsewhere. Concerns about consumer and investor confidence, volatile corporate profits and reduced capital spending, international conflicts, terrorist and military activity, civil unrest and pandemic illness could cause a slowdown in sales revenue. In addition, political and social turmoil related to international conflicts and terrorist acts may put further pressure on economic conditions in the United States and abroad.
Recent macroeconomic issues involving the broader financial markets, including elevated unemployment, consumer access to credit for housing and other purposes, anticipated U.S. government spending cuts, European sovereign debt market and general liquidity issues in the securities markets, have negatively impacted the economy and may negatively affect our business. In addition, weak economic conditions and declines in consumer spending and consumption may harm our operating results. Purchases of our ThinkGeek products are discretionary. If the economic climate deteriorates, customers or potential customers could delay, reduce or suspend their purchases of our products. This could impact our business in a number of ways, including lower prices for our products and reduced or delayed sales. There could be a number of follow-on effects from the recent financial crisis on our business, including insolvency of key suppliers resulting in product delays; customer insolvencies; counterparty failures; and increased expense or inability to obtain future financing.
If negative macroeconomic conditions persist, or if the economy enters a prolonged period of limited growth, our results of operations may be harmed.
Our business could be adversely affected if our consumer data protection measures are not seen as adequate or unauthorized persons disrupt or access our systems.
As our e-Commerce business sells goods and operates online, we are at risk of cyber-attacks. Our e-Commerce business involves the use of our proprietary information as well as the storage and transmission of customers' personally identifiable and proprietary information, and security breaches could expose us to a risk of loss of this information, litigation, and potential liability. While we take measures to protect personally identifiable information from unauthorized access or disclosure, it is possible that our security controls over personally identifiable information may not prevent improper access or disclosure. Our security measures may be breached due to the actions of outside parties, employee error, malfeasance, or otherwise. Because the techniques used to obtain unauthorized access, disable or degrade service, or sabotage systems change frequently and often are not recognized until launched against a target, we may be unable to anticipate these techniques or to implement adequate preventative measures. As a result, an unauthorized party may be able to disrupt our operations or obtain access to our data or our customers' personally identifiable information or proprietary data. Due to the nature of sophisticated cyber-attacks, there is a risk that such attack may remain undetected for a period of time.
A party who is able to circumvent our security measures could misappropriate proprietary information or cause interruptions or malfunctions in our Internet operations. In addition, a security breach that leads to disclosure of our proprietary information may compromise our ability to compete in the marketplace by allowing others to use our proprietary information to develop similar or competitive products. A security breach that leads to disclosure of user or consumer information (including sensitive personally identifiable information) could harm our reputation, compel us to comply with disparate breach notification laws in various jurisdictions and otherwise subject us to liability under laws that protect personal data, resulting in increased costs or loss of revenue. A cyber-attack, such as a denial of service attack, that renders our site inoperable would result in adverse consequences, including significant loss of revenues. Any security breach may also cause us to expend significant resources to restore system functionality and incur costs to deploy additional personnel, protection technologies and third party consultants to defend against a future security breach.
We outsource the operation of our network connectivity and work actively to maintain up-to-date security and defense measures. If any of our outsourcing providers do not perform adequately, we may be exposed to greater risk of a cyber-attack. In addition to utilizing third party providers, we periodically review our security and privacy practices and we are continuing to implement and update policies and practices as a result of these reviews. We may not adequately identify risks and the policies and practices we implement may not be effective.
Government laws and regulations are evolving and unfavorable changes could harm our business.
We are subject to general business regulations and laws, as well as regulations and laws specifically governing the Internet and e-commerce. Existing and future laws and regulations may impede our growth. These regulations and laws may cover taxation, privacy, data protection, pricing, content, copyrights, distribution, mobile communications, electronic device certification, electronic waste, electronic contracts and other communications, consumer protection, web services, the design and operation of websites, and the characteristics and quality of products and services. It is not clear how existing laws governing issues such as property ownership, libel, and personal privacy apply to the Internet and e-commerce.
Legislation and regulation in the United States as well as international laws and regulations could result in compliance costs which may reduce our revenue and income, as well as governmental action should our compliance measures not be deemed satisfactory.
We depend on third parties to provide a number of products and services, subjecting us to significant operational risks.
We currently depend on a number of third-party providers, and this reliance subjects us to significant operational risks, any of which could impair our ability to deliver products to our customers should they occur. These risks include:
| |
| • | reduced management and control of our data, including the risk of unauthorized disclosure of customer and/or other protected information |
| |
| • | reduced control over delivery schedule and quality assurance |
| |
| • | misappropriation of our intellectual property |
| |
| • | failures by the third parties on whom we rely to comply with all domestic and foreign laws relating to our business |
We have identified a material weakness in our internal control over financial reporting. We may not detect other weaknesses in our internal control over financial reporting in a timely manner, or at all.
Pursuant to Section 404 of the Sarbanes-Oxley Act of 2002 ("Section 404"), we are required to evaluate the effectiveness of our internal control over financial reporting as well as our disclosure controls and procedures each fiscal year.
Management identified a material weakness in the Company's internal control over financial reporting as of December 31, 2012. Specifically, we did not maintain a sufficient complement of corporate accounting personnel necessary to consistently operate management review controls. The demand on the corporate accounting resources is significant due to the manual nature of controls necessary to maintain effective control over our legacy system, and intensified in 2012 as a result of the increased volume of our sales activity and the complexity of the disposal of our Media business. As a result of this material weakness, we made a number of adjustments to cost of goods sold, share based compensation and presentation to discontinued operations in connection with our financial statement audit in order to prepare the consolidated financial statements and footnotes included in this Form 10-K.
A material weakness is a deficiency, or combination of deficiencies, in internal control over financial reporting such that there is a reasonable possibility that a material misstatement of the Company's annual or interim consolidated financial statements would not be prevented or detected on a timely basis. In reaching the conclusion that, as of December 31, 2012, a material weakness existed, management evaluated the criteria established in Internal Control - Integrated Framework issued by the Committee of Sponsoring Organizations of the Treadway Commission.
As described in “Item 9A(b). Controls and Procedures - Management's Report on Internal Control Over Financial Reporting,” in order to address the material weakness that was identified, we will determine the appropriate complement of corporate accounting personnel required to consistently operate management review controls. We are currently in the process of hiring additional personnel and/or contractors with appropriate accounting experience. This hiring process may take longer than anticipated and could delay our ability to remediate this material weakness. We will also continue to transition toward a new integrated enterprise resource planning system. Given the complexity of the new systems, the implementation may not be completed prior to December 31, 2013. We will continue to operate manual controls until the new system is implemented.
We cannot be certain in future periods that other control deficiencies that may constitute one or more “significant deficiencies” (as defined by the relevant auditing standards) or material weaknesses in our internal control over financial reporting will not be identified. If we fail to maintain the adequacy of our internal controls, including any failure to implement or difficulty in implementing required or new or improved controls, our business and results of operations could be harmed, the results of operations we report could be subject to adjustments, we may not be able to provide reasonable assurance as to our financial results or the effectiveness of our internal controls, we may not be able to meet our reporting obligations, we may experience a loss of investor confidence and any of the foregoing could have a negative impact on the trading price of our common stock.
If we are unable to implement appropriate systems, procedures and controls, we may not be able to successfully offer our products and grow our business and account for transactions in an appropriate and timely manner.
Our ability to successfully offer our products, grow our business and account for transactions in an appropriate and timely manner requires an effective planning and management process. We currently do not have an integrated enterprise resource planning system. We periodically update our operations and financial systems, procedures and controls; however; we still rely on manual processes and procedures that may not scale commensurately with our business growth. Our systems will continue to require automation, modifications and improvements to respond to current and future changes in our business. If we cannot grow our businesses, and manage that growth effectively, or if we fail to implement in a timely manner appropriate internal systems, procedures, controls and necessary automation and improvements to these systems, our business will suffer and our financial results could be adversely affected.
If we lose key personnel or fail to integrate replacement personnel successfully, our ability to manage our business could be impaired.
Our future success depends upon the continued service of our key management, technical, sales, and other critical personnel. Our officers and other key personnel are employees-at-will, and we may not be able to retain them. Key personnel have left our company in the past and there likely will be additional departures of key personnel from time to time in the future. The loss of any key employee could result in significant disruptions to our operations, including adversely affecting the timeliness of product releases, the successful implementation and completion of company initiatives, and the results of our operations. Competition for these individuals is intense, and we may not be able to attract, assimilate or retain highly qualified personnel. Competition for qualified personnel in our industry, as well as other geographic markets, in which we recruit, is intense. In the Internet and high technology industries, qualified candidates often consider equity awards in compensation arrangements and fluctuations in our stock price may make it difficult to recruit, retain, and motivate employees. In addition, the integration of replacement personnel could be time consuming, may cause additional disruptions to our operations, and may be unsuccessful.
We may face liability under our agreement to sell our Media Business.
Under the terms of our Asset Purchase Agreement, we have agreed to indemnify the buyers against specified losses that might be incurred in connection with our former Media business, including losses that the buyers may incur as a result of certain breaches of the representations, warranties and covenants we made to buyers in the Asset Purchase Agreement, and certain liabilities related to our Media business not expressly assumed by the buyers. The Purchase Agreement generally limits our liability for breaches of representations and warranties made in the Purchase Agreement to an aggregate of $10.0 million. There is $3.0 million of the $20 million purchase price held in escrow through September 2013.
If a buyer makes a claim for indemnification against us, we may incur expenses to contest or resolve the claim that could adversely affect our financial results. These expenses may include costs to defend the buyer if the buyer is sued by a third party and such suit, if adversely decided, could result in an indemnifiable loss to buyer. In addition, indemnity claims may divert management attention from our continuing business. The Purchase Agreement generally limits the Company's liability for breaches of representations and warranties made in the Purchase Agreement to an aggregate of $10.0 million.
Our stock price has been volatile historically and may continue to be volatile.
The trading price of our common stock has been and may continue to be subject to wide fluctuations. During the year ended December 31, 2012, the closing sale prices of our common stock on the NASDAQ Global Market ranged from $12.68 to $21.42 per share and the closing sale price on December 31, 2012, the last trading day of the year, was $16.10 per share. Our stock price may fluctuate in response to a number of events and factors, such as quarterly variations in operating results, announcements of technological innovations or new products by us or our competitors, changes in financial estimates and recommendations by securities analysts, the operating and stock price performance of other companies that investors may deem comparable to us, and news reports relating to trends in our markets or general economic conditions.
In addition, the stock market in general and the market prices for Internet-related companies in particular have experienced volatility that often has been unrelated to the operating performance of such companies. These broad market and industry fluctuations may adversely affect the price of our stock, regardless of our operating performance. Additionally, volatility or a lack of positive performance in our stock price may adversely affect our ability to retain key employees, all of whom have been granted stock options.
Sales of our common stock by a significant stockholder may cause the price of our common stock to decrease.
Several of our stockholders own significant portions of our common stock. If these stockholders were to sell substantial amounts of their holdings of our common stock, then the market price of our common stock could be negatively impacted. The effect of such sales, or of significant portions of our stock being offered or made available for sale, could result in strong downward pressure on our stock price. Investors should be aware that they could experience significant short-term volatility in our stock if such stockholders decide to sell a substantial amount of their holdings of our common stock at once or within a short period of time.
System disruptions could adversely affect our future operating results.
Our ability to attract and maintain relationships with customers, merchants and strategic partners will depend on the satisfactory performance, reliability and availability of our Internet channels and network infrastructure. In the past year, our ThinkGeek website has experienced unplanned service interruptions. We will continue to suffer future interruptions from time to time whether due to capacity constraints, natural disasters, telecommunications failures, other system failures, rolling blackouts, viruses, hacking or other events. System interruptions or slower response times could have a material adverse effect on our revenue and financial condition.
Item 1B. Unresolved Staff Comments
None.
Item 2. Properties
Our principal location is as follows: |
| | | | | | | |
| Location | | Purpose | | Approximate Size (in square feet) | | Expiration of Lease |
| Fairfax, Virginia | | Corporate headquarters; finance and administration, and e-Commerce operations | | 17,699 |
| | 2014 |
We relocated our corporate headquarters from Mountain View, California to Fairfax, Virginia effective March 1, 2011. We believe that our existing properties are in good condition and are adequate and suitable for the conduct of our business.
Item 3. Legal Proceedings
The disclosure under the caption “Litigation” in Note 5. Commitments and Contingencies to the Consolidated Financial Statements is incorporated by reference into this Item 3.
Item 4. Mine Safety Disclosure
Not applicable.
PART II
Item 5. Market for Registrant’s Common Equity, Related Stockholder Matters and Issuer Purchases of Equity Securities
Our common stock is traded on the NASDAQ Global Market under the symbol GKNT. As of February 8, 2013, there were 430 holders of record of our common stock. We have not declared any cash dividends since our inception and do not expect to pay any dividends in the foreseeable future. The high and low closing sales prices, as reported by NASDAQ, of our common stock are as follows:
|
| | | | | | | | | | | | | | | | |
| | | Year Ended
December 31, 2012 | | Year Ended
December 31, 2011 |
| Quarter | | High | | Low | | High | | Low |
| Fourth Quarter | | $ | 19.09 |
| | $ | 14.68 |
| | $ | 20.84 |
| | $ | 15.44 |
|
| Third Quarter | | $ | 21.42 |
| | $ | 17.11 |
| | $ | 27.00 |
| | $ | 15.46 |
|
| Second Quarter | | $ | 19.82 |
| | $ | 12.68 |
| | $ | 30.00 |
| | $ | 24.10 |
|
| First Quarter | | $ | 18.57 |
| | $ | 14.35 |
| | $ | 29.59 |
| | $ | 16.94 |
|
The foregoing reflects interdealer prices without retail markup, markdown, or commissions and may not necessarily reflect actual transactions.
On October 14, 2010, our shareholders approved an amendment to the Company’s Amended and Restated Certificate of Incorporation to effect a 1-for-10 reverse stock split of all outstanding shares of our common stock, reduce the total number of shares of common stock that we are authorized to issue to 25,000,000 and reduce the total number of shares of preferred stock that we are authorized to issue to 1,000,000. The reverse stock split became effective on November 10, 2010.
Issuer Purchases of Equity Securities
The following table sets forth information regarding the Company's purchases of its common stock during the three months ended December 31, 2012.
|
| | | | | | | |
| Period | | Total Number of Shares Purchased (1) | | Average Price Paid Per Share |
| October 1, 2012 to October 31, 2012 | | — |
| | $ | — |
|
| November 1, 2012 to November 30, 2012 | | 478 |
| | $ | 17.13 |
|
| December 1, 2012 to December 31, 2012 | | 136 |
| | $ | 16.40 |
|
| Total | | 614 |
| | |
(1) All shares were repurchased to satisfy tax withholding obligations from restricted stock vestings.
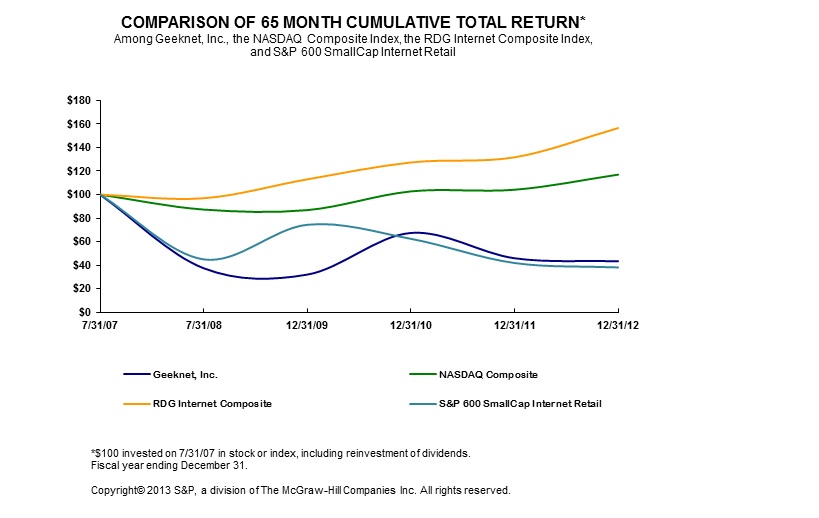
Stock Performance Graph
Set forth below is a line graph comparing the percentage change in the cumulative return to the stockholders of our Common Stock with the cumulative return of the NASDAQ Stock Market (U.S.) Index, the S&P 600 SmallCap Internet Retail Index and the RDG Internet Composite (“RDG”) Index for the period commencing July 31, 2007 and ending on December 31, 2012. Returns for the indices are weighted based on market capitalization at the beginning of each measurement point.
Item 6. Selected Financial Data
You should read the selected consolidated financial data set forth below in conjunction with Part II Item 7. Management’s Discussion and Analysis of Financial Condition and Results of Operations and with Part II Item 8. Financial statements and Financial Data and the related notes. Historical amounts have been restated to present the results of the Media business sold on September 17, 2012 and Geek.com, which was sold in December 2010, as discontinued operations. The historical results are not necessarily indicative of results that may be expected for any future period.
Summary Financial Information
(In thousands, except per share data)
|
| | | | | | | | | | | | | | | | | |
|
| | Five Months Ended | | Year Ended |
| | Year Ended December 31, | | December 31, | | July 31, |
| | 2012 | | 2011 | | 2010 | | 2009 | | 2008 | | 2008 |
| Selected Consolidated Statements of Operations Data: | | | | | �� | | | | | | |
Net revenue from continuing operations (1) | $118,913 | | $99,057 | | $76,335 | | $49,091 | | $23,994 | | $36,820 |
| Cost of revenue from continuing operations | 97,848 |
| | 83,602 |
| | 63,036 |
| | 38,343 |
| | 18,655 |
| | 27,860 |
|
Gross margin from continuing operations (2) | 21,065 |
| | 15,455 |
| | 13,299 |
| | 10,748 |
| | 5,339 |
| | 8,960 |
|
Income (loss) from continuing operations (3) | 1,805 |
| | (3,447 | ) | | (4,259 | ) | | (7,678 | ) | | 1,526 |
| | (3,978 | ) |
Income (loss) from discontinued operations (4) | 12,102 |
| | 1,932 |
| | (595 | ) | | (6,535 | ) | | (727 | ) | | (348 | ) |
Net income (loss) (5) | 13,907 |
| | (1,515 | ) | | (4,854 | ) | | (14,213 | ) | | 799 |
| | (4,326 | ) |
| Income (loss) per share from continuing operations: |
| | | | | | | | | | |
| Basic | 0.28 |
| | (0.55 | ) | | (0.70 | ) | | (1.26 | ) | | 0.23 |
| | (0.59 | ) |
| Diluted | 0.28 |
| | (0.55 | ) | | (0.70 | ) | | (1.26 | ) | | 0.23 |
| | (0.59 | ) |
| Income (loss) per share from discontinued operations: | | | | | | | | | | | |
| Basic | 1.87 |
| | 0.31 |
| | (0.10 | ) | | (1.07 | ) | | (0.11 | ) | | (0.05 | ) |
| Diluted | 1.85 |
| | 0.31 |
| | (0.10 | ) | | (1.07 | ) | | (0.11 | ) | | (0.05 | ) |
| Net income (loss) per share: | | | | | | | | | | | |
| Basic | 2.15 |
| | (0.24 | ) | | (0.80 | ) | | (2.34 | ) | | 0.12 |
| | (0.64 | ) |
| Diluted | 2.12 |
| | (0.24 | ) | | (0.80 | ) | | (2.34 | ) | | 0.12 |
| | (0.64 | ) |
| Shares used in per share calculation: | | | | | | | | | | | |
| Basic | 6,466 |
| | 6,319 |
| | 6,073 |
| | 6,080 |
| | 6,653 |
| | 6,747 |
|
| Diluted | 6,556 |
| | 6,319 |
| | 6,073 |
| | 6,080 |
| | 6,665 |
| | 6,747 |
|
| Selected Balance Sheet data: | | | | | | | | | | | |
| Cash, cash equivalents and investments | 57,294 |
| | 36,910 |
| | 35,341 |
| | 38,351 |
| | 50,021 |
| | 52,702 |
|
| Working capital | 65,254 |
| | 40,318 |
| | 37,198 |
| | 40,360 |
| | 40,140 |
| | 42,933 |
|
| Total assets | 85,872 |
| | 64,292 |
| | 66,757 |
| | 60,151 |
| | 74,166 |
| | 74,533 |
|
| Non-current liabilities | 29 |
| | 343 |
| | 302 |
| | 225 |
| | 1,423 |
| | 166 |
|
| Total stockholders’ equity | $69,083 | | $49,781 | | $46,993 | | $47,792 | | $62,286 | | $63,652 |
| |
| (1) | Net revenue from continuing operations has increased significantly over the last five years. Revenues increased 223 percent when comparing the year ended December 31, 2012 to the year ended July 31, 2008. |
| |
| (2) | Certain prior period amounts have been adjusted as a result of the review of our accounting treatment for accruing liabilities related to our Geek Points loyalty program at the end of each reporting period presented. Our adjustments include a decrease in gross margins of $0.3 million, $0.4 million, $0.2 million and $0.3 million during the years ended December 31, 2011, 2010, 2009 and the five months ended December 31, 2008, each respectively. During the fourth quarter of 2012, we reversed $0.6 million of our Geek Points liability due to management's decision to change the program effective the first half of 2013. |
| |
| (3) | Loss from continuing operations in the year ended December 31, 2009 includes the write down of our investment in CollabNet of $4.6 million and the write down of internally developed software of $1.2 million. The loss from continuing operations in the year ended December 31, 2010 includes severance related to leadership changes and the decision to move our corporate headquarters from Mountain View, California to Fairfax, VA. The loss from continuing operations in the year ended December 31, 2011 includes investments in our ThinkGeek business, investments in new leadership and severance costs. Income from continuing operations in the year ended December 31, 2012 is primarily due to the sale of our investment in CollabNet that resulted in a gain on sale of $4.0 million. |
| |
| (4) | Income (loss) from discontinued operations in each of the periods presented include Media business revenues, cost of sales and operating and non operating expenses, excluding general corporate costs. The year ended December 31, 2010 also includes $0.2 million of losses from discontinued operations from the sale of Geek.com. |
(5) Net income of $13.9 million for the year ended December 31, 2012 included a gain of $13.7 million for the sale of the Company's Media business.
Item 7. Management’s Discussion and Analysis of Financial Condition and Results of Operations
The following discussion and analysis should be read in conjunction with “Selected Consolidated Financial Data” and our financial statements and the related notes included elsewhere in this Form 10-K. This discussion contains forward-looking statements that involve risks and uncertainties. Our actual results could differ materially from those anticipated in the forward-looking statements as a result of certain factors including the risks discussed in “Item 1A. Risk Factors” and elsewhere in this Form 10-K. See Part I — Item 1 — “Special Note Regarding Forward-Looking Statements.”
Overview
We sell technology-themed retail products for technology enthusiasts and general consumers through our ThinkGeek.com website and to our wholesale channel customers. We offer a broad range of unique products in a single web property that are not available in traditional brick-and-mortar stores. We introduce a range of new products to our audience on a regular basis and sell our own innovative GeekLabs products developed in-house. We have several wholesale partnerships with brick and mortar retailers that allow us to reach a new consumer audience and expand our unique brand. We have recently established and strengthened existing partnerships with certain retail store chains that have hundreds of locations throughout the United States and Canada.
Prior to September 17, 2012, we had two operating segments: e-Commerce and Media. e-Commerce sells technology-themed retail products for technology enthusiasts and general consumers through our ThinkGeek.com website and to our wholesale channel customers. Our Media segment provided web properties that served as platforms for the creation, review and distribution of online peer produced content, using our Media websites, SourceForge, Slashdot, and Freecode.
On May 11, 2012, we announced that our Board of Directors was exploring strategic alternatives with respect to our Media business, including the SourceForge, Slashdot and Freecode websites. We, along with our advisers, evaluated a range of options to maximize shareholder value, including, but not limited to, selling the Media business. We received bids from various organizations interested in purchasing the Media business and reviewed each one carefully with our advisers.
On September 17, 2012 (the “Closing Date”), we entered into an Asset Purchase Agreement (the “Purchase Agreement”) with Dice Holdings, Inc. (“Dice”) and two of Dice’s subsidiaries, Dice Career Solutions, Inc. and eFinancialCareers Limited (collectively, the “Buyers”) pursuant to which the Buyers purchased our Media business, including the SourceForge, Slashdot and Freecode websites (the “Purchased Business”) and assumed certain related liabilities.
Our Board of Directors and management believe that selling the Media business will allow us to focus our business strategy on growing and improving our e-Commerce business and our ThinkGeek sourced and custom developed products. We believe the proceeds generated from the sale of the Media business and management's ability to solely focus on our core e-Commerce business will result in a positive impact to our future business strategy.
In accordance with the terms of the Purchase Agreement, the Buyers paid us $20.0 million in cash, of which $3.0 million was deposited by the Buyers into an escrow account for a period of twelve months after the Closing Date in order to secure our indemnification obligations to the Buyers for breaches of our representations, warranties, covenants and other obligations under the Purchase Agreement.
The Purchase Agreement contains customary representations, warranties and covenants. Subject to certain exceptions and limitations, each party has agreed to indemnify the other for breaches of representations, warranties and covenants and other specified matters. The Purchase Agreement generally limits the Company's liability for breaches of representations and warranties made in the Purchase Agreement to an aggregate of $10.0 million. The Purchase Agreement also contains covenants requiring us not to solicit or hire certain employees of the Buyers or
compete with the Purchased Business for a period of three years. We have also agreed with Dice to provide certain transition services to one another through December 31, 2013.
ThinkGeek's business strategy is to increase revenue by expanding the range of new and innovative products we sell, including our exclusive GeekLabs products, to manage gross margin dollars at the product level, and to increase traffic to our site and customer conversion. We attract traffic to our site by using a variety of traditional online and direct retail marketing channels including paid search and e-mail to our customers and followers. We continue to use the capabilities of the internet, including social networking sites such as Facebook, Twitter and YouTube, to increase brand awareness and to communicate with our customers.
Our ThinkGeek business is highly seasonal, reflecting the general pattern associated with the retail industry of peak sales and earnings during the calendar year-end holiday shopping season. In the past several years, a substantial portion of ThinkGeek revenue has occurred in the fourth quarter ending December 31. As is typical in the retail industry, we generally experience lower monthly revenue during the first nine months of the year.
Each year we initiate programs and promotions to attract additional customers and increase sales from our existing customer base. This year we enhanced our Geek Points program by making the program more flexible for our customers and in the first half of 2013 we will be modifying this program. We ran special programs to discount certain products and product lines and we offered free shipping and discounted shipping days. We regularly send direct marketing e-mails to our customers and we increase the number of e-mails and promotions during the fourth quarter in preparation for the holiday season. We also utilize Facebook, Twitter and YouTube to generate interest in our new product launches. We expect to continue to expand and diversify our sales and marketing programs next year.
During the first quarter of 2013, we restructured certain areas of the business and hired three new members of the senior leadership team. These changes will impact our operations beginning in the first quarter of 2013. We look forward to the knowledge, creativity, experience and passion these talented individuals will bring to the business.
We currently use the following key metrics to measure our e-Commerce business:
|
| | | | | | | | | | | |
| | Year Ended December 31, |
| | 2012 | | 2011 | | 2010 |
Daily unique visitors (in thousands) (1) | 89,330 |
| | 73,076 |
| | 53,111 |
|
Number of orders received (in thousands) (2) | 2,010 |
| | 1,640 |
| | 1,239 |
|
| Conversion rate | 2.25 | % | | 2.24 | % | | 2.33 | % |
Average order value received (3) | $ | 61.10 |
| | $ | 61.51 |
| | $ | 63.74 |
|
| | | | | | |
Number of orders shipped (in thousands) (4) | 2,011 |
| | 1,707 |
| | 1,303 |
|
Average order value shipped (5) | $ | 59.13 |
| | $ | 58.04 |
| | $ | 58.59 |
|
| |
| (1) | Unique visitors is the total of unique visitors for the ThinkGeek website during the periods presented. This data is accumulated daily and can include the same unique visitor on different days. We track unique visitors and the volume of traffic to our website to help us determine the effectiveness of our online marketing efforts. |
| |
| (2) | The number of orders received represents all orders placed on the ThinkGeek website during each period shown and does not necessarily correlate to revenue recognized during the period. For example, some orders placed on the ThinkGeek website at the end of a reporting period are recognized as revenue in the subsequent reporting period because delivery had not yet occurred. |
| |
| (3) | Average order value received or shipped is calculated by the total sales for orders received or shipped divided by the number of orders received or shipped. Average order value can vary depending on, but not limited to, seasonality, promotions, the number of volume sales in a given period, the competitive environment and economic conditions. |
(4) The number of orders shipped represents all orders associated with the amount of revenue recognized for ThinkGeek for the period presented.
(5) Wholesale channel sales contributed to the total average order value shipped. Excluding wholesale channel sales, average order value shipped for ThinkGeek website orders was $56 and $55 for the years ended December 31, 2012 and 2011. Wholesale channel sales were insignificant compared to total sales during 2010 and therefore did not have a meaningful impact on average order value shipped for the year ended December 31, 2010.
Critical Accounting Policies
Accounting policies, methods and estimates are an integral part of the consolidated financial statements prepared by management and are based upon management’s current judgments. Those judgments are normally based on knowledge and experience with regard to past and current events and assumptions about future events. Certain accounting policies, methods and estimates are particularly sensitive because of their significance to the financial statements and because of the possibility that future events affecting them may differ from management’s current judgments. While there are a number of accounting policies, methods and estimates affecting our financial statements, areas that are particularly significant include revenue recognition, inventories, the assessment of impairment of long-lived assets, stock-based compensation and discontinued operations.
Basis of Presentation
The results of our Media business, which was sold on September 17, 2012, are classified as discontinued operations for the years ended December 31, 2012, 2011 and 2010 in the Company's Consolidated Statement of Operations. The results include Media business revenues, cost of sales and operating and non operating expenses, excluding general corporate costs. Also included as discontinued operations for the year ended December 31, 2010 are the results from the sale of the Company's Geek.com business. The cash flows from the Media business' operating and investing activities are shown separately in cash flows from discontinued operations, with the exception of proceeds from the sale of the Media business and related transaction costs.
The assets and liabilities related to the Media business are included in their respective sections on the December 31, 2011 Consolidated Balance Sheet as they did not meet the criteria for classification as assets held for sale at that date.
During the fourth quarter of 2012, we reviewed our accounting treatment for accruing liabilities for our Geek Points loyalty program. We performed an analysis on the costs incurred for redeeming the Geek Points using historical data and determined that the liabilities were understated at the end of each of the reporting periods presented. Although the impact of the adjustments is immaterial, we adjusted our consolidated financial statements for all prior periods presented.
Net Revenue
Net revenue is derived from the online sale of consumer goods and through our wholesale channel. Net revenues are presented net of sales tax. We recognize revenue from consumer goods when persuasive evidence of an arrangement exists, delivery has occurred, the sale price is fixed or determinable, and collectibility is reasonably assured. Revenue is deferred for orders shipped but not delivered before the end of the period. The amount recorded as deferred revenue is estimated because of our high volume of transactions and the use of multiple shipping carriers. These estimates are used to determine what orders that shipped at the end of the reporting period, were delivered and should be recognized as revenue. When calculating these estimates, we consider historical experiences of shipping transit times for domestic and international orders using different carriers. On average, shipping transit times are approximately one to six business days. As of December 31, 2012 and December 31, 2011, $1.3 million and $0.9 million, respectively, was recognized as deferred revenue for orders placed at the end of the reporting period, but not yet delivered.
We also engage in the sale of gift certificates. When a gift certificate is sold, revenue is deferred until the certificate is redeemed and the products are delivered. Deferred revenue at December 31, 2012 and December 31, 2011 relating to gift certificates was $1.0 million and $0.7 million, respectively.
We reserve an amount for estimated returns at the end of each reporting period. We generally give customers a 90-day right to return products. These estimates are based on historical trends of amounts returned per revenue for a period. Reserves for returns at December 31, 2012 and December 31, 2011 were $0.5 million and $0.7 million, respectively, and are recorded as accrued liabilities and other in the consolidated balance sheets.
We voluntarily ceased selling a product in July 2012 because of safety concerns. We are offering our customers who have purchased this product, the opportunity to return the product in exchange for a ThinkGeek
credit. As of December 31, 2012, we issued an insignificant amount of credits. We believe the reserves for returns at December 31, 2012 to be adequate.
Inventories
Inventories consist solely of finished goods that are valued at the lower of cost, using the weighted average cost method, or market. We review inventories each quarter and, when required, reduce estimated excess and obsolete inventories to their net realizable values.
Long-Lived Assets
We continually evaluate whether events and circumstances have occurred that indicate the remaining estimated useful life of long-lived assets may warrant revision or that the remaining balance of long-lived assets may not be recoverable. When factors indicate that long-lived assets should be evaluated for possible impairment, we use an estimate of the related undiscounted future cash flows over the remaining life of the long-lived assets in measuring whether they are recoverable. If the carrying value of the asset exceeds the estimated undiscounted future cash flows, a loss is recorded as the excess of the asset’s carrying value over fair value. Long-lived assets and certain identifiable intangible assets to be disposed of are reported at the lower of carrying amount or fair value less costs to sell.
Geek Points Loyalty Program
We maintain a customer loyalty program by issuing Geek Points to participating customers for certain purchases of products. Customers can redeem their Geek Points toward future purchases in accordance with program rules and promotions. Geek Points expire three years from the date they are earned. The Company accrues the cost of anticipated redemptions using an estimated redemption rate calculated based on historical experiences and trends, adjusted for known modifications to the program that will occur in the future. The cost of the redemptions is included in cost of revenues on the Company's consolidated statements of operations.
Stock-Based Compensation
We measure compensation cost for stock awards at grant date fair value and recognize the expense net of estimated forfeitures for shares expected to vest over the service period of the award.
Calculating compensation expense for stock options requires the input of subjective assumptions, including the expected term of the stock option grant, stock price volatility, interest rates and the forfeiture rate. The fair value of the option grants are calculated on the date of grant using the Black-Scholes option pricing model. The expected life is based on historical settlement patterns. Expected volatility is based on the historical implied volatility of our stock. The interest rate for periods within the contractual life of the award is based on the U.S. Treasury yield curve in effect at the time of grant. We estimate the forfeiture rate based on historical trends of our stock-based awards that cancel.
Income Taxes
The Company has recognized a deferred tax asset associated with previously reported net operating losses, which can result in a future tax benefit. A valuation allowance is recognized if it is more-likely-than-not that some portion or all of the deferred tax asset will not be realized. The Company has recognized a valuation allowance for the full amount of the deferred tax asset as there is insufficient evidence to support that it is more-likely-than-not that the assets will be realized. The Company reviews its valuation allowance at each reporting period using, but not limited to, forecasted financial information to determine if the deferred tax assets could more-likely-than-not be realized and after considering the impact of limits sanctioned by Internal Revenue Code Section 382 on the use of net operating loss carryforwards.
The Company provides for uncertain tax positions and the related interest and penalties based upon management's assessment of whether a tax benefit is more-likely-than-not to be sustained upon examination by taxing authorities.
Contingencies and Litigation
We are subject to proceedings, lawsuits and other claims. We assess the likelihood of any adverse judgments or outcomes to these matters as well as ranges of probable losses. A determination of the amount of any loss contingency required is assessed and recorded, if probable, after careful analysis of each individual matter. The required loss contingencies may change in the future as the facts and circumstances of each matter change.
Results of Operations and Discontinued Operations
The following table sets forth our operating results for the periods indicated as a percentage of net revenue, represented by selected items from the consolidated statements of operations. This table should be read in conjunction with the consolidated financial statements and the accompanying notes included in this Form 10-K.
|
| | | | | | | | |
| | Year Ended December 31, |
| | 2012 | | 2011 | | 2010 |
| Consolidated Statements of Operations Data: | | | | | |
| Net revenue | 100.0 | % | | 100.0 | % | | 100.0 | % |
| Cost of revenue | 82.3 |
| | 84.4 |
| | 82.6 |
|
| Gross margin | 17.7 | % | | 15.6 | % | | 17.4 | % |
| Operating expenses: | |
| | |
| | |
| Sales and marketing | 7.7 |
| | 8.8 |
| | 9.1 |
|
| Technology and design | 3.3 |
| | 1.9 |
| | 2.0 |
|
| General and administrative | 8.4 |
| | 9.6 |
| | 11.9 |
|
| Total operating expenses | 19.4 | % | | 20.3 | % | | 23.0 | % |
| Loss from operations | (1.7 | ) | | (4.7 | ) | | (5.6 | ) |
| Gain on sale of non-marketable securities | 3.4 |
| | — |
| | — |
|
| Interest and other income (expense), net | (0.1 | ) | | — |
| | 0.1 |
|
| Income (loss) from continuing operations before income taxes | 1.6 |
| | (4.7 | ) | | (5.5 | ) |
| Income tax provision (benefit) | — |
| | (1.1 | ) | | 0.1 |
|
| Net income (loss) from continuing operations | 1.5 | % | | (3.5 | )% | | (5.6 | )% |
| Income from discontinued operations, net of tax | 10.2 | % | | 2.0 | % | | (0.8 | )% |
| Net income (loss) | 11.7 | % | | (1.5 | )% | | (6.4 | )% |
Net Revenue
Net revenue is derived from the sale of consumer goods at retail on our ThinkGeek website and from our wholesale channel, and includes shipping, net of returns and allowances. These consumer goods are typically electronics, gadgets, apparel, edibles, geek-themed and other specialty or unique items. Our customers are primarily technology enthusiasts and general consumers. We sell and ship our products domestically and internationally.
|
| | | | | | | | | | | | | | | | | | | | | |
| | Year Ended December 31, | | | | Year Ended December 31, | | |
| | 2012 | | 2011 | | % Change | | 2011 | | 2010 | | % Change |
| ($ in thousands) | | | | | | | | | | | |
| Net revenue | $ | 118,913 |
| | $ | 99,057 |
| | 20 | % | | $ | 99,057 |
| | $ | 76,335 |
| | 30 | % |
We experienced significant growth in net revenue during the years ended December 31, 2012 and December 31, 2011 as compared to their respective prior year periods. This is primarily due to an increase in the number of orders placed through our ThinkGeek website and an increase in revenue through our wholesale channel.
Our orders have grown year over year primarily due to heightened consumer awareness of our web site as a result of more advertising, diversified product offerings and the increase and variety of promotions offered to our customers. During 2012, we introduced a number of new products that included unique products developed in our GeekLabs. Our internally developed Minecraft Foam Pickaxe and Minecraft Foam Sword were best sellers throughout
the year. Also our GeekLabs product, Star Trek Pizza Cutter, continues to be a popular item. Other best selling GeekLabs products include Portal themed products, LED Iron Man shirt and Star Wars family car decals. Other popular products this year were the Bag of Holding Messenger bag, DIY guitar pick punch, Star Wars lightsaber, bathrobe products and Doctor Who-themed products. During 2011, new products such as the i-CADE ,the Joystick-IT, the Han Solo Carbonite Chocolate Bar, the Portal Plush Turret and items inspired by the popular TV show DEXTER were introduced. We are licensed to sell our unique GeekLabs products that have themes such as StarWars, StarTrek or Minecraft through the relationships we have with Lucas Films, CBS and Mojang, respectively.
The number of unique visitors increased 22% during the year ended December 31, 2012, as compared to the year ended December 31, 2011 and the number of unique visitors increased 38% during the year ended December 31, 2011 , as compared to the year ended December 31, 2010. The higher volume of visitors is primarily due to our efforts to increase consumer awareness of our ThinkGeek website through media coverage and advertising.
Wholesale revenue to retailers and brick and mortar stores increased $1.5 million during the year ended December 31, 2012, as compared to the year ended December 31, 2011. These stores include chain stores with a strong presence in malls across the country and in Canada and free standing retail stores. Some of our current wholesale clients are f.y.e., HMV, Books-A-Million and Urban Outfitters. We also partnered with Old Navy for a custom version of the Electronic Rock Guitar shirt during the 2011 holiday season. The ThinkGeek sales team continues to strengthen relationships with our existing wholesale clients and acquire new clients who have particular interest in ThinkGeek products.
ThinkGeek products are sold in the U.S. and internationally. Approximately 86%, 86% and 82% of sales were made to customers in the US in 2012, 2011 and 2010 respectively. We have been focusing on increasing ThinkGeek awareness in other countries and increasing our ability to ship to other countries.
We continue to diversify our product offerings by introducing new products, including our innovative GeekLabs products and expanding licensing partnerships. We also are working to continually improve our ThinkGeek website. We have developed enhancements that include improved product search capabilities, easier navigation in the website, and a smoother check-out process. In 2011, we developed our mobile site allowing our customers to access our website from numerous new channels such as tablets and smart phones.
Cost of Revenue / Gross Margin
Cost of revenue consists of product, shipping and fulfillment costs and personnel and related overhead expenses associated with the operations and merchandising functions.
|
| | | | | | | | | | | | | | | | | | | | | |
| | Year Ended December 31, | | | | Year Ended December 31, | | |
| | 2012 | | 2011 | | % Change | | 2011 | | 2010 | | % Change |
| ($ in thousands) | | | | | | | | | | | |
| Cost of revenue | $ | 97,848 |
| | $ | 83,602 |
| | 17 | % | | $ | 83,602 |
| | $ | 63,036 |
| | 33 | % |
| Gross margin | $ | 21,065 |
| | $ | 15,455 |
| | 36 | % | | $ | 15,455 |
| | $ | 13,299 |
| | 16 | % |
| Gross margin % | 18 | % | | 16 | % | | | | 16 | % | | 17 | % | | |
Cost of revenues increased $14.2 million during the year ended December 31, 2012, as compared to the year ended December 31, 2011 primarily due to an increase in product costs of $13.1 million and packaging and fulfillment costs of $2.4 million, partially offset by a lower expense of $0.9 million related to a reduction of our Geek Points liability and a lower expense of $0.3 million due to a rebate received from a vendor . The aforementioned increases were due to the increase in revenues and number of orders. Royalties increased due to a higher volume of sales of our licensed product lines. Our Geek Points liability decreased due to management's decision to modify the Geek Points loyalty program in the first half of 2013.
Cost of revenues increased $20.6 million during the year ended December 31, 2011, as compared to year ended December 31, 2010 primarily due to an increase in product costs of $13.4 million, shipping costs of $3.6 million, fulfillment and packing costs of $1.9 million, and merchandising and customer support costs of $1.0 million. These increases were due to the increase in revenues and number of orders. Fulfillment costs were also higher due to the start-up costs related to moving to a new fulfillment center. The increase in merchandising and customer support costs was also due to increased personnel required to support our broader product offering.
Gross margin as a percentage of revenues increased by two percentage points due to a decrease in seventeen full-time equivalents ("FTEs"). During the first quarter of 2012, we began outsourcing our customer service department, which reduced FTEs. We also redirected certain of our workforce from merchandising, included as cost of revenue, to developing our own innovative products in our GeekLabs, included in technology and design. Also contributing to better margins is our efforts to reduce shipping costs due to renegotiations with our largest shipping supplier.
Gross margin percentage for the year ended December 31, 2011 decreased from the year ended December 31, 2010 due to higher customer discounts as well as increased inbound shipping costs, fulfillment costs and merchandising and customer support costs. The higher customer discounts were primarily due to decisions to discontinue certain products in the second and third quarters of 2011 to prepare for the peak holiday season and apparel promotions during the holiday season.
We are continually analyzing gross margins by the product and category levels to ensure that product mix and product costs are in line with our gross margin expectations. We work to manage gross margins through negotiations with our vendors to reduce product, materials and in-bound shipping costs.
Operating Expenses
Sales and Marketing Expenses
Sales and marketing expenses consist primarily of personnel and related overhead expenses, including sales commissions, marketing and sales support functions, as well as costs associated with advertising and promotional activities.
|
| | | | | | | | | | | | | | | | | | | | | |
| | Year Ended December 31, | | | | Year Ended December 31, | | |
| | 2012 | | 2011 | | % Change | | 2011 | | 2010 | | % Change |
| ($ in thousands) | | | | | | | | | | | |
| Sales and marketing | $ | 9,184 |
| | $ | 8,681 |
| | 6 | % | | $ | 8,681 |
| | $ | 6,910 |
| | 26 | % |
| Percentage of total net revenue | 8 | % | | 9 | % | | | | 9 | % | | 9 | % | | |
Sales and marketing expenses increased $0.5 million for the year ended December 31, 2012 as compared to the year ended December 31, 2011 primarily due to an increase of $0.7 million in personnel and related overhead expenses because of an average of five additional full-time equivalents in our marketing workforce as compared to prior year and severance costs of $0.1 million. Also contributing to the increase is $0.1 million in marketing services and public relations costs used to increase brand awareness and traffic to our website. This increase was partially offset by a decrease of $0.4 million in marketing expenses primarily due our decision to discontinue printing large catalogs.
Sales and marketing expense increased $1.8 million for the year ended December 31, 2011 as compared to the year ended December 31, 2010 primarily due to increases in marketing expenses of $0.7 million, credit card fees of $0.5 million and direct labor expenses of $0.5 million. The increase in discretionary marketing expenses was primarily due to an increase of $0.4 million in paid affiliate fees and $0.2 million increase in promotional materials. The increase in credit card fees was due to an increase in our revenue.
Technology and Design Expenses
During the fourth quarter of 2012, we changed the name of our Research and Development department to Technology and Design. We believe that the name Technology and Design conforms to similar naming conventions used in our industry for similar activities. Technology and design expenses consist of personnel and related overhead expenses for GeekLabs and developers that design and create new products to sell on our ThinkGeek website. It also includes personnel and related overhead and technology expenses for our engineering group that work to continually improve website design, functionality and capacity. We expense all of our technology and design costs as they are incurred.
|
| | | | | | | | | | | | | | | | | | | | | |
| | Year Ended December 31, | | | | Year Ended December 31, | | |
| | 2012 | | 2011 | | % Change | | 2011 | | 2010 | | % Change |
| ($ in thousands) | | | | | | | | | | | |
| Technology and design | $ | 3,968 |
| | $ | 1,857 |
| | 114 | % | | $ | 1,857 |
| | $ | 1,514 |
| | 23 | % |
| Percentage of total net revenue | 3 | % | | 2 | % | | | | 2 | % | | 2 | % | | |
Technology and design expense increased $2.1 million for the year ended December 31, 2012 as compared to the year ended December 31, 2011 primarily due to our increased focus on testing and developing our own GeekLabs innovative products. We redirected certain of our workforce and hired new employees for our internal development center, GeekLabs, which resulted in an increase of $1.2 million in personnel and related overhead expenses. Also contributing to the increase are $0.2 million in fees related to developing prototypes of GeekLabs custom products and $0.4 million rent expense for equipment used in our new data recovery site built this year.
Technology and design expense increased $0.3 million for the year ended December 31, 2011 as compared to the year ended December 31, 2010 primarily due to an increase in labor costs.
General and Administrative Expenses
General and administrative expenses consist of personnel and related expenses for finance and accounting, human resources, legal and safety and quality assurance, professional fees for accounting and legal services as well as insurance and other public company related costs.
During the second half of 2012, we transitioned our product safety and quality assurance function in-house. Prior to the transition we were using various third-party vendors to perform these services. We have invested in certified personnel, who are highly qualified in conducting safety and quality assurance testing. We also began the process of building a testing laboratory. We believe our investment will enable us to improve the quality of our products, minimize defective products, and continue to exceed industry standards.
|
| | | | | | | | | | | | | | | | | | | | | |
| | Year Ended December 31, | | | | Year Ended December 31, | | |
| | 2012 | | 2011 | | % Change | | 2011 | | 2010 | | % Change |
| ($ in thousands) | | | | | | | | | | | |
| General and administrative | $ | 10,001 |
| | $ | 9,501 |
| | 5 | % | | $ | 9,501 |
| | $ | 9,093 |
| | 4 | % |
| Percentage of total net revenue | 8 | % | | 10 | % | | | | 10 | % | | 12 | % | | |
General and administrative expenses increased $0.5 million for the year ended December 31, 2012 as compared to the year ended December 31, 2011 primarily due to an increase in professional services fees of $0.4 million, an increase in business consulting services of $0.3 million and an increase of $0.2 million in stock-based compensation. These increases were partially offset by nonrecurring severance costs of $0.6 million that occurred in the prior year period primarily related to the resignation of our ThinkGeek Chief Executive Officer.
General and administrative expenses as a percentage of total net revenue improved by two percentage points in year ended December 31, 2012 as compared to the same prior year period primarily due to the significant investments in our ThinkGeek business and in our leadership that occurred in the prior year period as well as efficiencies gained from the move of our headquarters.
General and administrative expenses increased by $0.4 million for the year ended December 31, 2011 as compared to the year ended December 31, 2010 . This change was driven by investments in infrastructure to support growth including stock based compensation for key executives $1.4 million and $0.1 million of public relations costs, partially offset by a decrease in facilities costs of $0.7 million and a decrease in severance costs of $0.4 million.
Gain on Sale of Non-Marketable Securities
|
| | | | | | | | | | | | | | | | | | | |
| | Year Ended December 31, | | | | Year Ended December 31, | | |
| | 2012 | | 2011 | | % Change | | 2011 | | 2010 | | % Change |
| ($ in thousands) | | | | | | | | | | | |
| Gain on sale of non-marketable securities | $ | 4,021 |
| | $ | — |
| | nm | | $ | — |
| | $ | — |
| | nm |
nm= not meaningful
As of December 31, 2011, we owned approximately 9% of the outstanding capital stock of CollabNet, Inc. (“CollabNet”), which consist of shares of CollabNet’s Series C-1 preferred stock. This investment was accounted for under the cost method as we held less than 20% of the voting stock of CollabNet and did not otherwise exercise significant influence over CollabNet.
On April 5, 2012, we sold our Series C-1 preferred stock investment in CollabNet, Inc. to a third party for $6.0 million. The carrying value of the investment at the time of the sale was $2.0 million and as such, a gain of $4.0 million was recognized during 2012. The carrying value of the investment was zero and $2.0 million at December 31, 2012 and December 31, 2011.
Interest and Other Income (Expense), Net
|
| | | | | | | | | | | | | | | | | | | | | |
| | Year Ended December 31, | | | | Year Ended December 31, | | |
| | 2012 | | 2011 | | % Change | | 2011 | | 2010 | | % Change |
| ($ in thousands) | | | | | | | | | | | |
| Interest income | $ | 4 |
| | $ | — |
| | nm |
| | $ | — |
| | $ | 63 |
| | (100 | )% |
| Other than temporary impairment | — |
| | (8 | ) | | (100 | )% | | (8 | ) | | (6 | ) | | 33 | % |
| Other income (expense), net | $ | (126 | ) | | 8 |
| | (1,675 | )% | | 8 |
| | — |
| | nm |
|
| Interest and other income (expense), net | $ | (122 | ) | | $ | — |
| | nm |
| | $ | — |
| | $ | 57 |
| | (100 | )% |
nm= not meaningful
Interest and other income (expense), net during the year ended December 31, 2012 primarily consisted of the write off of certain receivables, foreign currency gains and losses, penalties and credit facility fees, partially offset by other income.
Interest income decreased in the year ended December 31, 2011 as compared to the year ended December 31, 2010 as a result our decision to invest in short-term treasuries, which generally have lower yields. Other income (expense) decreased in the December 31, 2011 as compared to the year ended December 31, 2010, primarily due to realized losses on investments.
Income Taxes
|
| | | | | | | | | | | |
| | Year Ended December 31, |
| | 2012 | | 2011 | | 2010 |
| ($ in thousands) | | | | | |
| Income tax provision (benefit) | $ | 6 |
| | $ | (1,137 | ) | | $ | 98 |
|
The income tax benefit recognized in 2011 is offset by a tax provision in discontinued operations as there was a loss in continuing operations and income in discontinued operations in that same year. There was not a similar benefit in 2012 and 2010 as there was income or loss in both continuing and discontinuing operations in those years.
We have recently completed a study addressing the recoverability of our net operating loss carryforwards. The results of the study indicated that there was a change of control as defined by section 382 of the Internal Revenue Code (“IRC”) in 2008. As a result of the change of control, certain net operating losses previously included in our deferred tax disclosures will not be available to offset future taxable income as the IRC limits the annual utilization of these carryforwards. Consistent with what we have done historically, we continue to fully reduce the net operating loss carryforwards and all other deferred tax assets by a valuation allowance. This is due to our conclusion that it was more-likely-than-not that we would not recover the deferred tax assets because of management's uncertainties about our ability to generate taxable income in the future.
Our previously reported net operating loss carryforwards of $280.6 million as of December 31, 2011 will be limited to $49.9 million, of which $13.0 million will be utilized to offset taxable income in 2012. Also reducing the net operating loss carryforwards was $1.4 million of recognized built in losses. The amount of net operating losses available to offset taxable income in 2013 and beyond as of December 31, 2012 is $35.5 million.
This change in control also limits the amount of net operating loss carry-forwards available to offset future California taxable income. As of December 31, 2011, our previously reported net operating loss carryforwards of $76.2 million will be limited to $38.9 million, of which $2.0 million will be utilized to offset taxable income in 2012 with $36.9 million available to offset California taxable income in 2013 and beyond. The net operating losses not expected to be utilized in 2012 expire between 2013 and 2031.
Discontinued Operations, Net of Tax
|
| | | | | | | | | | | |
| | Year Ended December 31, |
| | 2012 | | 2011 | | 2010 |
| ($ in thousands) | | | | | |
| (Loss) income from discontinued operations | $ | (1,509 | ) | | $ | 2,986 |
| | $ | (805 | ) |
| Gain on sale of discontinued operations | 13,712 |
| | $ | — |
| | (55 | ) |
| Income tax provision (benefit) from discontinued operations | 101 |
| | 1,054 |
| | (265 | ) |
| Income (loss) from discontinued operations, net of tax | $ | 12,102 |
| | $ | 1,932 |
| | $ | (595 | ) |
Due to the sale of our Media business on September 17, 2012, the results of the Media business are classified as (Loss) income on discontinued operations for the years ended December 31, 2012, 2011 and 2010. The results include Media business revenues, cost of sales and operating and non operating expenses, excluding general corporate costs and including tax effects.
On September 17, 2012, we entered into a Purchase Agreement with Dice pursuant to which the Buyers purchased our Media business, including the SourceForge, Slashdot and Freecode websites and assumed certain related liabilities. In accordance with the terms of the Purchase Agreement, the Buyers paid Geeknet $20.0 million in cash of which $3.0 million was deposited by the Buyers into an escrow account. The $13.7 million gain on the sale of the Media business is the selling price of $20.0 million less the carrying value of certain assets and liabilities assumed by the Buyers, offset by transaction costs of $1.1 million.
The gain on disposal assumes a full recovery of the $3.0 million held in escrow. The gain and results from discontinued operations for the year ended December 31, 2012 are subject to adjustments based upon final allocation of revenues and expenses to us and the Buyers. Final settlement of transition services will occur during 2013. The tax provision (benefit) recorded on discontinued operations for the years ended December 31, 2012, 2011 and 2010 represents the tax based upon the with and without. The 2012 tax provision is significantly lower than the statutory rate as a result of net operating losses with a full valuation allowance. The tax provision for 2011 is offset by a tax benefit in continuing operations. The 2010 tax benefit represents use of available tax credits.
Liquidity and Capital Resources
|
| | | | | | | | | | | |
| | Year Ended December 31, |
| ($ in thousands) | 2012 | | 2011 | | 2010 |
| Net cash (used in) provided by: | | | | | |
| Continuing operations | | | | | |
| Operating activities | $ | (1,883 | ) | | $ | 1,070 |
| | $ | (3,083 | ) |
| Investing activities | 21,787 |
| | (827 | ) | | 7,214 |
|
| Financing activities | (849 | ) | | 658 |
| | 1,805 |
|
| Discontinued operations | 1,329 |
| | 676 |
| | 454 |
|
| Net increase in cash and cash equivalents | $ | 20,384 |
| | $ | 1,577 |
| | $ | 6,390 |
|
Our principal sources of cash as of December 31, 2012 were our existing cash and cash equivalents of $57.3 million, which included proceeds of $17.0 million from the sale of our Media business and $6.0 million from the sale of our investment in CollabNet.
Operating Activities
Net cash used in operating activities increased $3.0 million during the year ended December 31, 2012 as compared to the year ended December 31, 2011 primarily due to a decrease in changes in assets and liabilities of $4.7 million, offset by improved profitability from continuing operations of $1.2 million, excluding the $4.0 million gain on sale of non-marketable securities and an increase in stock-based compensation of $0.5 million. The changes in assets and liabilities was primarily due to an increase in cash used to purchase inventory of $12.1 million, an increase of prepaid expenses of $2.3 million, other assets and liabilities of $2.9 million, partially offset by an increase in accounts payable of $12.6 million. Inventory purchases are higher to support ThinkGeek growth, improve our in-stock levels and meet anticipated demands in the first quarter of 2013 for our website and wholesale channel sales. Typically during the first quarter of each year, we receive minimal amounts of inventory due to industry practices in other countries where our suppliers are located.
Net cash provided by operating activities increased $4.2 million during the year ended December 31, 2011 as compared to the year ended December 31, 2010, as a result of a improved profitability of $0.8 million, an increase in stock-based compensation of $1.6 million, and an increase in depreciation and amortization expense of $0.7 million, partially offset by a decrease in changes in assets and liabilities of $1.2 million.
Investing Activities
Cash provided by investing activities for the year ended December 31, 2012 of $21.8 million included proceeds of $17.0 million for the sale of the Company's Media business and proceeds of $6.0 million for the sale of the Company's series C-1 preferred stock investment in CollabNet, Inc., partially offset by $1.1 in transaction costs and $0.1 million in investments in property and equipment.
Cash used in investing activities for year ended December 31, 2011 of $0.8 million was primarily due to the expansion of our distribution equipment at our contract-fulfillment and warehouse provider and purchases of property and equipment related to computer and equipment and leasehold improvements for relocating our corporate headquarters from Mountain View, California to Fairfax, Virginia. This was partially offset by cash received from the sale of intangible assets that had occurred in the prior year.
Cash provided by investing activities for the year ended December 31, 2010 of $7.2 million was primarily due to the sale of $10.2 million of auction rate securities to UBS AG (“UBS”) and a $1.0 million reduction in restricted cash resulting from the conclusion of our former corporate headquarter lease in Fremont, California, partially offset by $4.0 million for the purchase of property and equipment, primarily payments for distribution equipment installed at our third-party contract-fulfillment and warehouse provider.
Financing Activities
Cash used in financing activities for the year ended December 31, 2012 of $0.8 million included $1.2 million for the repurchase of our common stock to satisfy tax withholding obligations that arose from the vesting of restricted stock, partially offset by $0.4 million cash provided by the issuance of common stock from stock option exercises.
Cash provided by financing activities for the year ended December 31, 2011 of $0.7 million included $1.0 million in cash provided by the issuance of common stock from stock option exercises, partially offset by $0.4 million of repurchases of our common stock.
Cash provided by financing activities for the year ended December 31, 2010 of $1.8 million included $2.0 million in cash provided by the issuance of common stock from stock option exercises, partially offset by $0.2 million of repurchases of our common stock.
Net Cash Provided By Discontinued Operations
Cash flow from discontinued operations includes operating and investing activities that have been reported separately in the consolidated statements of cash flows. The absence of cash flows from discontinued operations in our ongoing operations is not expected to materially impact our future cash flow or liquidity due to the
relatively modest amounts historically contributed by the discontinued operations.
Liquidity
Our liquidity and capital requirements depend on numerous factors, including our investment in inventory to support the e-Commerce business, market acceptance of our online products, the resources we devote to developing, marketing, selling and supporting our online products and website, the timing and expense associated with expanding our distribution channels, potential acquisitions and other factors.
On December 12, 2011, we entered into a secured credit agreement with Wells Fargo Bank, N.A., or Wells Fargo, that provided us with a $5 million revolving line of credit including a $2 million sub-facility for the issuance of standby letters of credit. The revolving credit facility has the option of an applicable interest rate of 2.5% above one or three month LIBOR. We renewed the revolving credit facility during the fourth quarter of 2012, and the facility now expires October 15, 2013. To date, we have not drawn down on our line of credit and have no plans to do so at this time. As part of our agreement we must keep a minimum of $5 million dollars in Wells Fargo Bank at all times. This credit line is collateralized by substantially all of the assets of the Company. As of December 31, 2011, we were in default of certain covenants for which we received a waiver from Wells Fargo Bank. As of December 31, 2012, we were not in default of these covenants. As of December 31, 2012, the borrowing capacity of our line of credit was reduced by a letter of credit outstanding with one of our vendors for less than $0.1 million.
On September 17, 2012 we entered into an Asset Purchase Agreement with Dice pursuant to which the Buyers purchased our Media business, including the SourceForge, Slashdot and Freecode websites and assumed certain related liabilities. In accordance with the terms of the Purchase Agreement, the Buyers paid us $20.0 million in cash, of which $3.0 million was deposited by the Buyers into an escrow account for a period of twelve months after the Closing Date in order to secure our indemnification obligations to the Buyers for breaches of our representations, warranties, covenants and other obligations under the Purchase Agreement.
The Purchase Agreement contains customary representations, warranties and covenants. Subject to certain exceptions and limitations, each party has agreed to indemnify the other for breaches of representations, warranties and covenants and other specified matters. The Purchase Agreement generally limits the Company's liability for breaches of representations and warranties made in the Purchase Agreement to an aggregate of $10.0 million. The Purchase Agreement also contains covenants requiring us not to solicit or hire certain employees of the Buyers or compete with the Purchased Business for a period of three years. We have also agreed with Dice to provide certain transition services to one another through December 31, 2013.
We expect to devote capital resources to continue:
| |
| • | investing in capital projects that support our distribution and related support systems, and infrastructure, |
•investing and improving product safety and quality assurance testing,
•enhancing and diversifying sales and marketing programs,
•improving our technology and functionality,
•developing trendy unique exclusive GeekLabs products,
•optimizing supplier and manufacturer relationships, and
•investing in other general corporate activities.
We do not believe that the absence of cash flows from our Media business will significantly impact our cash balances as the majority of cash generated is derived from our e-Commerce sales. We believe that our existing cash balances will be sufficient to meet near term liquidity needs.
Stock Repurchase Program
In February 2011, we announced an "odd lot" share repurchase program under which our Board of Directors approved the repurchase of up to $1 million of our common stock Under this program, the Company repurchased 4,868 shares of common stock at a weighted average price of $26.01 per share for aggregate purchase price of approximately $127,000. There was no "odd lot" share repurchase program during 2012.
Contractual Obligations
The contractual obligations presented in the table below represent our estimates of future payments under fixed contractual obligations, purchase orders (primarily for inventory) and commitments. Changes in our business needs, cancellation provisions and other factors may result in actual payments differing from the estimates. We cannot provide certainty regarding the timing and amounts of payments. The following table summarizes our contractual obligations and commitments as of December 31, 2012 (in thousands):
|
| | | | | | | | | | | | | | | |
| | | | Payments due by period |
| | Total | | Less than 1 year | | 1-3 years | | Thereafter |
Operating Lease Obligations (1) | $ | 622 |
| | $ | 367 |
| | $ | 255 |
| | $ | — |
|
Purchase Obligations (2) | 917 |
| | 774 |
| | 143 |
| | — |
|
| Total Obligations | $ | 1,539 |
| | $ | 1,141 |
| | $ | 398 |
| | $ | — |
|
(1) Includes future payments for the Company's facilities under non-cancelable operating leases that expire at various dates through 2014.
(2) Includes a one-time termination fee of approximately $0.4 million that we would be required to pay to our third-party fulfillment and warehouse provider if we were to cancel our contract with them and also includes committed licensing payments.
Financial Risk Management
We currently face limited exposure to adverse movements in foreign currency exchange rates and we do not engage in hedging activity. We do not anticipate significant currency gains or losses in the near term. These exposures may change over time as business practices evolve and could have a material adverse impact on our financial results.
Recent Accounting Pronouncements
In June 2011, the FASB issued authoritative guidance that amends previous guidance for the presentation of comprehensive income. It eliminates the option to present other comprehensive income in the statement of changes in equity. Under this revised guidance, an entity has the option to present the components of net income and other comprehensive income in either a single continuous statement of comprehensive income or in two separate but consecutive financial statements. The revised guidance also required entities to present reclassification adjustments out of accumulated other comprehensive income by component in both the statement in which net income is presented and the statement in which other comprehensive income is presented. In December 2011, the FASB issued guidance which indefinitely defers the guidance related to the presentation of reclassification adjustments. We adopted this standard on January 1, 2012. The adoption of this standard only impacts the presentation of our consolidated financial statements.
In May 2011, the FASB issued authoritative guidance that amends previous guidance for fair value measurement and disclosure requirements. The revised guidance changes certain fair value measurement principles, clarifies the application of existing fair value measurements and expands the disclosure requirements, particularly for
Level 3 fair value measurements. We adopted this standard on January 1, 2012. The adoption of this standard did not have an impact on our consolidated financial statements.
Item 7A. Quantitative and Qualitative Disclosures About Market Risk
We have operated primarily in the United States, and the majority of sales have been made in U.S. dollars. Accordingly, we have not had any material exposure to foreign currency rate fluctuations.
We do not currently hold any derivative instruments and do not engage in hedging activities.
Item 8. Financial Statements and Supplementary Data
TABLE OF CONTENTS
All other schedules are omitted because they are not applicable, not required, or because the required information is included in the consolidated financial statements or notes thereto.
REPORT OF INDEPENDENT REGISTERED PUBLIC ACCOUNTING FIRM
The Board of Directors and Stockholders
Geeknet, Inc:
We have audited the accompanying consolidated balance sheets of Geeknet, Inc. and subsidiaries as of December 31, 2012 and 2011, and the related consolidated statements of operations, comprehensive income (loss), stockholders' equity, and cash flows for each of the years in the three‑year period ended December 31, 2012. In connection with our audits of the consolidated financial statements, we also have audited financial statement schedule II. These consolidated financial statements and financial statement schedule are the responsibility of the Company's management. Our responsibility is to express an opinion on these consolidated financial statements and financial statement schedules based on our audits.
We conducted our audits in accordance with the standards of the Public Company Accounting Oversight Board (United States). Those standards require that we plan and perform the audit to obtain reasonable assurance about whether the financial statements are free of material misstatement. An audit includes examining, on a test basis, evidence supporting the amounts and disclosures in the financial statements. An audit also includes assessing the accounting principles used and significant estimates made by management, as well as evaluating the overall financial statement presentation. We believe that our audits provide a reasonable basis for our opinion.
In our opinion, the consolidated financial statements referred to above present fairly, in all material respects, the financial position of Geeknet, Inc. and subsidiaries as of December 31, 2012 and 2011, and the results of their operations and their cash flows for each of the years in the three‑year period ended December 31, 2012, in conformity with U.S. generally accepted accounting principles. Also in our opinion, the related financial statement schedule, when considered in relation to the basic consolidated financial statements taken as a whole, presents fairly, in all material respects, the information set forth therein.
We also were engaged to audit, in accordance with the standards of the Public Company Accounting Oversight Board (United States), Geeknet, Inc. and subsidiaries internal control over financial reporting as of December 31, 2012, based on criteria established in Internal Control - Integrated Framework issued by the Committee of Sponsoring Organizations of the Treadway Commission (COSO) and our report dated March 1, 2013 expressed an adverse opinion on the effectiveness of the Company's internal control over financial reporting.
/s/ KPMG LLP
McLean, Virginia
March 1, 2013
REPORT OF INDEPENDENT REGISTERED PUBLIC ACCOUNTING FIRM
The Board of Directors and Stockholders
Geeknet, Inc:
We have audited Geeknet, Inc. and subsidiaries (the Company) internal control over financial reporting as of December 31, 2012, based on criteria established in Internal Control ‑ Integrated Framework issued by the Committee of Sponsoring Organizations of the Treadway Commission (COSO). The Company's management is responsible for maintaining effective internal control over financial reporting and for its assessment of the effectiveness of internal control over financial reporting, included in Item 9A(b), Management's Report on Internal Control over Financial Reporting. Our responsibility is to express an opinion on the Company's internal control over financial reporting based on our audit.
We conducted our audit in accordance with the standards of the Public Company Accounting Oversight Board (United States). Those standards require that we plan and perform the audit to obtain reasonable assurance about whether effective internal control over financial reporting was maintained in all material respects. Our audit included obtaining an understanding of internal control over financial reporting, assessing the risk that a material weakness exists, and testing and evaluating the design and operating effectiveness of internal control based on the assessed risk. Our audit also included performing such other procedures as we considered necessary in the circumstances. We believe that our audit provides a reasonable basis for our opinion.
A company's internal control over financial reporting is a process designed to provide reasonable assurance regarding the reliability of financial reporting and the preparation of financial statements for external purposes in accordance with generally accepted accounting principles. A company's internal control over financial reporting includes those policies and procedures that (1) pertain to the maintenance of records that, in reasonable detail, accurately and fairly reflect the transactions and dispositions of the assets of the company; (2) provide reasonable assurance that transactions are recorded as necessary to permit preparation of financial statements in accordance with generally accepted accounting principles, and that receipts and expenditures of the company are being made only in accordance with authorizations of management and directors of the company; and (3) provide reasonable assurance regarding prevention or timely detection of unauthorized acquisition, use, or disposition of the company's assets that could have a material effect on the financial statements.
Because of its inherent limitations, internal control over financial reporting may not prevent or detect misstatements. Also, projections of any evaluation of effectiveness to future periods are subject to the risk that controls may become inadequate because of changes in conditions, or that the degree of compliance with the policies or procedures may deteriorate.
A material weakness is a deficiency, or a combination of deficiencies, in internal control over financial reporting, such that there is a reasonable possibility that a material misstatement of the company's annual or interim financial statements will not be prevented or detected on a timely basis. A material weakness in monitoring controls as it relates to the identification on a timely basis of deficiencies in the operation of controls in the financial statement close process has been identified and included in management's assessment in Item 9A(b). We also have audited, in accordance with the standards of the Public Company Accounting Oversight Board (United States), the accompanying consolidated balance sheets of Geeknet, Inc. and subsidiaries as of December 31, 2012 and 2011, and the related consolidated statements of operations, comprehensive income (loss), stockholders' equity, and cash flows for each of the years in the three‑year period ended December 31, 2012. This material weakness was considered in determining the nature, timing, and extent of audit tests applied in our audit of the 2012 consolidated financial statements, and this report does not affect our report dated March 1, 2013 which expressed an unqualified opinion on those consolidated financial statements.
In our opinion, because of the effect of the aforementioned material weakness on the achievement of the objectives of the control criteria, Geeknet, Inc. and subsidiaries has not maintained effective internal control over financial reporting as of December 31, 2012, based on criteria established in Internal Control-Integrated Framework issued by the Committee of Sponsoring Organizations of the Treadway Commission.
We do not express an opinion or any other form of assurance on management's statements referring to corrective actions taken after December 31, 2012, relative to the aforementioned material weakness in internal control over financial reporting.
/s/ KPMG LLP
McLean, Virginia
March 1, 2013
GEEKNET, INC.
CONSOLIDATED BALANCE SHEETS
(In thousands)
|
| | | | | | | |
| December 31,
2012 | | December 31,
2011 |
| ASSETS |
| Current assets: | | | |
| Cash and cash equivalents | $ | 57,294 |
| | $ | 36,910 |
|
| Accounts receivable, net of allowance of $14 and $27 as of December 31, 2012 and December 31, 2011, respectively | 1,050 |
| | 6,264 |
|
| Inventories, net | 16,657 |
| | 8,935 |
|
| Prepaid expenses and other current assets | 7,013 |
| | 2,377 |
|
| Total current assets | 82,014 |
| | 54,486 |
|
| Property and equipment, net | 3,523 |
| | 5,717 |
|
| Other long-term assets | 335 |
| | 4,089 |
|
| Total assets | $ | 85,872 |
| | $ | 64,292 |
|
| | | | |
| LIABILITIES AND STOCKHOLDERS’ EQUITY |
| Current liabilities: | |
| | |
|
| Accounts payable | $ | 11,641 |
| | $ | 6,327 |
|
| Deferred revenue | 2,303 |
| | 3,482 |
|
| Accrued liabilities and other | 2,816 |
| | 4,359 |
|
| Total current liabilities | 16,760 |
| | 14,168 |
|
| Other long-term liabilities | 29 |
| | 343 |
|
| Total liabilities | 16,789 |
| | 14,511 |
|
| Commitments and Contingencies (Note 5) |
|
| |
|
|
| Stockholders’ equity: | |
| | |
|
| Preferred stock, $0.001 par value; 1,000 shares authorized; no shares issued or outstanding | — |
| | — |
|
| Common stock, $0.001 par value; authorized — 25,000; issued — 6,738 and 6,473 shares, as of December 31, 2012 and December 31, 2011, respectively; outstanding — 6,555 and 6,361 shares as of December 31, 2012 and December 31, 2011, respectively | 7 |
| | 7 |
|
| Treasury stock, 183 shares at December 31, 2012 and 112 shares at December 31, 2011 | (2,182 | ) | | (978 | ) |
| Additional paid-in capital | 814,411 |
| | 807,829 |
|
| Accumulated other comprehensive income | 16 |
| | (1 | ) |
| Accumulated deficit | (743,169 | ) | | (757,076 | ) |
| Total stockholders’ equity | 69,083 |
| | 49,781 |
|
| Total liabilities and stockholders’ equity | $ | 85,872 |
| | $ | 64,292 |
|
The accompanying notes are an integral part of these consolidated financial statements.
GEEKNET, INC.
CONSOLIDATED STATEMENTS OF OPERATIONS
(In thousands, except per share amounts)
|
| | | | | | | | | | | |
| Year Ended December 31, |
| | 2012 | | 2011 | | 2010 |
| Net revenue | $ | 118,913 |
|
| $ | 99,057 |
| | $ | 76,335 |
|
| Cost of revenue | 97,848 |
|
| 83,602 |
| | 63,036 |
|
| Gross margin | 21,065 |
|
| 15,455 |
| | 13,299 |
|
| Operating expenses: | |
|
| |
| | |
|
| Sales and marketing | 9,184 |
|
| 8,681 |
| | 6,910 |
|
| Technology and design | 3,968 |
|
| 1,857 |
| | 1,514 |
|
| General and administrative | 10,001 |
|
| 9,501 |
| | 9,093 |
|
| Total operating expenses | 23,153 |
|
| 20,039 |
| | 17,517 |
|
| Loss from operations | (2,088 | ) |
| (4,584 | ) | | (4,218 | ) |
| Gain on sale of non-marketable securities | 4,021 |
| | — |
| | — |
|
| Interest and other income (expense), net | (122 | ) |
| — |
| | 57 |
|
| Income (loss) from continuing operations before income taxes | 1,811 |
|
| (4,584 | ) | | (4,161 | ) |
| Income tax provision (benefit) | 6 |
|
| (1,137 | ) | | 98 |
|
| Net income (loss) from continuing operations | 1,805 |
| | (3,447 | ) | | (4,259 | ) |
| Discontinued operations: | | | | | |
| Income (loss) from discontinued operations, net of tax | 12,102 |
| | 1,932 |
| | (595 | ) |
| Net income (loss) | $ | 13,907 |
| | $ | (1,515 | ) | | $ | (4,854 | ) |
| Income (loss) per share from continuing operations: | | | | | |
| Basic | $ | 0.28 |
| | $ | (0.55 | ) | | $ | (0.70 | ) |
| Diluted | $ | 0.28 |
| | $ | (0.55 | ) | | $ | (0.70 | ) |
| Income (loss) per share from discontinued operations: | |
|
| |
| | |
|
| Basic | $ | 1.87 |
|
| $ | 0.31 |
| | $ | (0.10 | ) |
| Diluted | $ | 1.85 |
| | $ | 0.31 |
| | $ | (0.10 | ) |
| Net income (loss) per share: | | | | | |
| Basic | $ | 2.15 |
| | $ | (0.24 | ) | | $ | (0.80 | ) |
| Diluted | $ | 2.12 |
| | $ | (0.24 | ) | | $ | (0.80 | ) |
| Shares used in per share calculations: | |
|
| |
| | |
|
| Basic | 6,466 |
| | 6,319 |
| | 6,073 |
|
| Diluted | 6,556 |
| | 6,319 |
| | 6,073 |
|
The accompanying notes are an integral part of these consolidated financial statements.
GEEKNET, INC.
CONSOLIDATED STATEMENTS OF COMPREHENSIVE INCOME (LOSS)
(In thousands)
|
| | | | | | | | | | | |
| | Year Ended December 31, |
| | 2012 | | 2011 | | 2010 |
| | | | | | |
| Net income (loss) | $ | 13,907 |
| | $ | (1,515 | ) | | $ | (4,854 | ) |
| Other comprehensive income (loss): | | | | | |
| Foreign currency translation income (loss) | 17 |
| | (11 | ) | | (3 | ) |
| Comprehensive income (loss) | $ | 13,924 |
| | $ | (1,526 | ) | | $ | (4,857 | ) |
The accompanying notes are an integral part of these consolidated financial statements.
GEEKNET, INC.
CONSOLIDATED STATEMENTS OF STOCKHOLDERS’ EQUITY
(In thousands)
|
| | | | | | | | | | | | | | | | | | | | | | | | | | |
| | Common Stock | | Treasury Stock | | Additional Paid-in Capital | | Accumulated
Other Comprehensive Income (Loss) | | Accumulated Deficit | | Total Stockholders' Equity |
| | Shares | | Amount | | | | | |
| BALANCE AT DECEMBER 31, 2009 | 6,052 |
| | $ | 61 |
| | $ | (492 | ) | | $ | 798,917 |
| | $ | 13 |
| | $ | (750,234 | ) | | $ | 48,265 |
|
| Correction for treatment of liabilities (Note 3) | — |
| | — |
| | — |
| | — |
| | — |
| | (473 | ) | | (473 | ) |
| Issuance of common stock | 231 |
| | 1 |
| | — |
| | 1,961 |
| | — |
| | — |
| | 1,962 |
|
| Repurchase of restricted stock | (10 | ) | | — |
| | (130 | ) | | (27 | ) | | — |
| | — |
| | (157 | ) |
| Par value change resulting from reverse stock split | — |
| | (56 | ) | | — |
| | 56 |
| | — |
| | — |
| | — |
|
| Stock based compensation | — |
| | — |
| | — |
| | 2,253 |
| | — |
| | — |
| | 2,253 |
|
| Net loss | — |
| | — |
| | — |
| | — |
| | — |
| | (4,854 | ) | | (4,854 | ) |
| Other comprehensive loss | — |
| | — |
| | — |
| | — |
| | (3 | ) | | — |
| | (3 | ) |
| BALANCE AT DECEMBER 31, 2010 | 6,273 |
| | $ | 6 |
| | $ | (622 | ) | | $ | 803,160 |
| | $ | 10 |
| | $ | (755,561 | ) | | $ | 46,993 |
|
| Issuance of common stock | 88 |
| | 1 |
| | — |
| | 1,013 |
| | — |
| | — |
| | 1,014 |
|
| Repurchase of restricted stock | — |
| | — |
| | (356 | ) | | — |
| | — |
| | — |
| | (356 | ) |
| Stock based compensation | — |
| | — |
| | — |
| | 3,656 |
| | — |
| | — |
| | 3,656 |
|
| Net loss | — |
| | — |
| | — |
| | — |
| | — |
| | (1,515 | ) | | (1,515 | ) |
| Other comprehensive loss | — |
| | — |
| | — |
| | — |
| | (11 | ) | | — |
| | (11 | ) |
| BALANCE AT DECEMBER 31, 2011 | 6,361 |
| | $ | 7 |
| | $ | (978 | ) | | $ | 807,829 |
| | $ | (1 | ) | | $ | (757,076 | ) | | $ | 49,781 |
|
| Issuance of common stock | 194 |
| | — |
| | — |
| | 355 |
| | — |
| | — |
| | 355 |
|
| Repurchase of restricted stock | — |
| | — |
| | (1,204 | ) | | | | — |
| | — |
| | (1,204 | ) |
| Stock based compensation | — |
| | — |
| | — |
| | 6,227 |
| | — |
| | — |
| | 6,227 |
|
| Net income | — |
| | — |
| | — |
| | — |
| | — |
| | 13,907 |
| | 13,907 |
|
| Other comprehensive income | — |
| | — |
| | — |
| | — |
| | 17 |
| | — |
| | 17 |
|
| BALANCE AT DECEMBER 31, 2012 | 6,555 |
| | $ | 7 |
| | $ | (2,182 | ) | | $ | 814,411 |
| | $ | 16 |
| | $ | (743,169 | ) | | $ | 69,083 |
|
The accompanying notes are an integral part of these consolidated financial statements.
GEEKNET, INC.
CONSOLIDATED STATEMENTS OF CASH FLOWS
(In thousands)
|
| | | | | | | | | | | |
| Year Ended December 31, |
| | 2012 | | 2011 | | 2010 |
| Cash flows from operating activities from continuing operations: | | | | | |
| Net income (loss) | $ | 13,907 |
| | $ | (1,515 | ) | | $ | (4,854 | ) |
| (Income) loss from discontinued operations, net of tax | (12,102 | ) | | (1,932 | ) | | 595 |
|
| Income (loss) from continuing operations | 1,805 |
| | (3,447 | ) | | (4,259 | ) |
| Adjustments to reconcile income (loss) from continuing operations to net cash (used in) provided by operating activities: | | | | | |
| Depreciation and amortization | 1,394 |
| | 1,203 |
| | 514 |
|
| Stock-based compensation expense | 3,559 |
| | 3,017 |
| | 1,421 |
|
| Provision for bad debts | 38 |
| | 29 |
| | — |
|
| Provision for excess and obsolete inventory | 120 |
| | 65 |
| | 42 |
|
| Change in provision for returns | (129 | ) | | 301 |
| | 350 |
|
| Gain on sale of non-marketable securities | (4,021 | ) | | — |
| | — |
|
| Loss (gain) on sale of assets, net | 53 |
| | (139 | ) | | — |
|
| Impairment of investments | — |
| | 8 |
| | — |
|
| Changes in assets and liabilities: | | | | | |
| Accounts receivable | (322 | ) | | 14 |
| | (292 | ) |
| Inventories | (7,842 | ) | | 4,322 |
| | (8,084 | ) |
| Prepaid expenses and other assets | (1,855 | ) | | 450 |
| | 346 |
|
| Accounts payable | 5,608 |
| | (7,012 | ) | | 7,557 |
|
| Deferred revenue | 744 |
| | 2,287 |
| | 118 |
|
| Accrued restructuring liabilities | — |
| | — |
| | (1,238 | ) |
| Accrued liabilities and other | (721 | ) | | (93 | ) | | 233 |
|
| Other long-term liabilities | (314 | ) | | 65 |
| | 209 |
|
| Net cash (used in) provided by operating activities | (1,883 | ) | | 1,070 |
| | (3,083 | ) |
| Cash flows from investing activities: | |
| | |
| | |
| Purchase of property and equipment | (113 | ) | | (1,733 | ) | | (3,993 | ) |
| Proceeds from sale of non-marketable equity investment | 6,000 |
| | — |
| | — |
|
| Proceeds from sale of discontinued operations | 17,000 |
| | — |
| | — |
|
| Transaction costs from sale of discontinued operations | (1,100 | ) | | — |
| | — |
|
| Proceeds from sales of intangible assets, net | — |
| | 906 |
| | — |
|
| Maturities or sales of investments and marketable securities | — |
| | — |
| | 10,207 |
|
| Change in restricted cash | — |
| | — |
| | 1,000 |
|
| Net cash provided by (used in) investing activities | 21,787 |
| | (827 | ) | | 7,214 |
|
| Cash flows from financing activities: | |
| | |
| | |
| Proceeds from issuance of common stock | 355 |
| | 1,014 |
| | 1,962 |
|
| Repurchase of stock | (1,204 | ) | | (356 | ) | | (157 | ) |
| Net cash (used in) provided by financing activities | (849 | ) | | 658 |
| | 1,805 |
|
| Cash flows from discontinued operations: | | | | | |
| Net cash provided by operating activities | 2,395 |
| | 1,479 |
| | 28 |
|
| Net cash (used in) provided by investing activities | (1,066 | ) | | (803 | ) | | 426 |
|
| Net cash provided by discontinued operations | 1,329 |
| | 676 |
| | 454 |
|
| Net increase in cash and cash equivalents | 20,384 |
| | 1,577 |
| | 6,390 |
|
| Cash and cash equivalents, beginning of year | 36,910 |
| | 35,333 |
| | 28,943 |
|
| Cash and cash equivalents, end of period | $ | 57,294 |
| | $ | 36,910 |
| | $ | 35,333 |
|
The accompanying notes are an integral part of these consolidated financial statements.
GEEKNET, INC.
NOTES TO CONSOLIDATED FINANCIAL STATEMENTS
1. Organization and Operations of the Company
Overview
Geeknet, Inc.'s e-Commerce business ("Geeknet" or the “Company”) sells technology-themed retail products for technology enthusiasts and general consumers through its ThinkGeek.com website and to the Company's wholesale channel customers. ThinkGeek offers a broad range of unique products in a single web property that are not available in traditional brick-and-mortar stores. The Company introduces a range of new products to ThinkGeek audiences on a regular basis. Some ThinkGeek products are custom made and developed by the Company's product development team ("GeekLabs"). The Company has several wholesale partnerships with brick and mortar retailers that allows the Company to reach a new consumer audience and expand its unique brand. The Company has recently established and strengthened existing partnerships with certain retail store chains that have hundreds of locations throughout the United States and Canada.
Prior to September 17, 2012, the Company had two operating segments: e-Commerce and Media. The Media segment provided web properties that served as platforms for the creation, review and distribution of online peer produced content, using our Media websites, SourceForge, Slashdot, and Freecode.
On September 17, 2012 (the “Closing Date”), Geeknet, Inc. entered into an Asset Purchase Agreement (the “Purchase Agreement”) with Dice Holdings, Inc. (“Dice”) and two of Dice’s subsidiaries, Dice Career Solutions, Inc. and eFinancialCareers Limited (collectively, the “Buyers”) pursuant to which the Buyers purchased the Company’s Media business, including the SourceForge, Slashdot and Freecode websites (the “Purchased Business”) and assumed certain related liabilities.
2. Summary of Significant Accounting Policies
Basis of Presentation
The results of the Company's Media business, which was sold on September 17, 2012, are classified as discontinued operations for the years ended December 31, 2012, 2011 and 2010 in the Company's Consolidated Statement of Operations. The results include Media business revenues, cost of sales and operating and non operating expenses, excluding general corporate costs. Also included as discontinued operations for the year ended December 31, 2010 are the results from the sale of the Company's Geek.com business. The cash flows from the Media business' operating and investing activities are shown separately in cash flows from discontinued operations, with the exception of proceeds from the sale of the Media business and related transaction costs. See Note 10. Discontinued Operations for additional information.
The assets and liabilities related to the Media business are included in their respective sections on the December 31, 2011 Consolidated Balance Sheet as they did not meet the criteria for classification as assets held for sale at that date.
During the fourth quarter of 2012, the Company reviewed its accounting treatment for accruing liabilities for its Geek Points loyalty program. The Company performed an analysis on the costs incurred for redeeming the Geek Points using historical data and determined that the liabilities were understated at the end of each of the reporting periods presented. Although the impact of the adjustments is immaterial, the Company has adjusted its consolidated financial statements for all prior periods presented. See Note 3. Correction of Liabilities for additional information.
On November 10, 2010, the Company effected a 1-for-10 reverse stock split. All share and per share amounts in this report have been adjusted to give effect to the reverse stock split. In conjunction with the reverse stock split, the common stock par value remained constant at $0.001 per share. Following the reverse stock split, a portion of the common stock was transferred to additional paid in capital.
Use of Estimates in Preparation of Consolidated Financial Statements
The preparation of consolidated financial statements in conformity with accounting principles generally accepted by the United States of America requires management to make estimates and assumptions that affect the reported amounts of assets and liabilities and the disclosure of contingent assets and liabilities at the date of such financial statements, as well as the reported amounts of revenue and expenses during the periods indicated. Estimates include, but are not limited to, orders delivered at end of reporting period, provision for returns, inventory valuation, stock-based compensation, bad debt expense and income taxes. Actual results could differ from those estimates.
Adopted Accounting Pronouncements
In June 2011, the FASB issued authoritative guidance that amends previous guidance for the presentation of comprehensive income. It eliminates the option to present other comprehensive income in the statement of changes in equity. Under this revised guidance, an entity has the option to present the components of net income and other comprehensive income in either a single continuous statement of comprehensive income or in two separate but consecutive financial statements. The revised guidance also required entities to present reclassification adjustments out of accumulated other comprehensive income by component in both the statement in which net income is presented and the statement in which other comprehensive income is presented. In December 2011, the FASB issued guidance which indefinitely defers the guidance related to the presentation of reclassification adjustments. The Company adopted this standard on January 1, 2012. The adoption of this standard only impacts the presentation of the Company’s consolidated financial statements.
In May 2011, the FASB issued authoritative guidance that amends previous guidance for fair value measurement and disclosure requirements. The revised guidance changes certain fair value measurement principles, clarifies the application of existing fair value measurements and expands the disclosure requirements, particularly for Level 3 fair value measurements. The Company adopted this standard on January 1, 2012. The adoption of this standard did not have an impact on the Company’s consolidated financial statements.
Principles of Consolidation
These consolidated financial statements include the accounts of the Company and its wholly-owned subsidiaries. All significant intercompany accounts and transactions have been eliminated in consolidation.
Cash and Cash Equivalents
The Company considers all highly-liquid investments with an original maturity of three months or less to be cash equivalents. Cash and cash equivalents consist principally of cash deposited in money market and checking accounts.
Credit Line
On December 12, 2011, the Company entered into a secured credit agreement with Wells Fargo Bank, N.A., or Wells Fargo, that provided us with a $5 million revolving line of credit including a $2 million sub-facility for the issuance of standby letters of credit. The revolving credit facility has the option of an applicable interest rate of 2.5% above one or three month LIBOR. The revolving credit facility was renewed during the fourth quarter of 2012, and now expires October 15, 2013. To date, we have not drawn down on our line of credit and have no plans to do so at this time. As part of our agreement we must keep a minimum of $5 million dollars in Wells Fargo Bank at all times. This credit line is collateralized by substantially all of the assets of the Corporation. As of December 31, 2011, we were in default of certain covenants for which we received a waiver from Wells Fargo Bank. As of December 31, 2012, we were not in default of these covenants.
As of December 31, 2012, the borrowing capacity of our line of credit was reduced by a letter of credit outstanding with one of our vendors for less than $0.1 million.
Fair Value Measurements
The Company holds certain of its cash and cash equivalents in money market funds which is measured and recorded at fair value on a recurring basis at each reporting period using Level 1 inputs. The following tables show the fair value of the amounts held in money market funds at each reporting period (in thousands):
|
| | | | | | | | | | | | | | | |
| | December 31, 2012 |
| | Level 1 | | Level 2 | | Level 3 | | Total |
| | | | | | | | |
| Money market fund deposits | $ | 18,265 |
| | $ | — |
| | $ | — |
| | $ | 18,265 |
|
| | | | | | | | |
| | | | | | | | |
| | December 31, 2011 |
| | Level 1 | | Level 2 | | Level 3 | | Total |
| | | | | | | | |
| Money market fund deposits | $ | 18,263 |
| | $ | — |
| | $ | — |
| | $ | 18,263 |
|
Trade Accounts Receivable
Trade accounts receivable are primarily amounts related to customer receivables and are not interest bearing. The Company will record an allowance for doubtful accounts to reserve for potentially uncollectible trade receivables. The Company also reviews its trade receivables by aging category to identify specific customers with known disputes or collectibility issues. The Company exercises judgment when determining the adequacy of these reserves and evaluates historical bad debt trends, general economic conditions in the United States and internationally, and changes in customer financial conditions.
Inventories, net
Inventories consist solely of finished goods that are valued at the lower of cost, using the weighted average cost method, or market. Inventories are presented net of an allowance for excess and/or obsolete inventory, which reduces inventories to their estimated net realizable values. At December 31, 2012 and 2011, the allowance for excess and/or obsolete inventory was $0.3 million and $0.1 million, respectively.
Property and Equipment
Property and equipment are stated at cost and are depreciated using the straight-line method over the estimated useful lives of the assets. Leasehold improvements are amortized over the lesser of the estimated useful lives or the corresponding lease term.
Goodwill and Intangible Assets
Goodwill and intangible assets, which were entirely related to the Media business, were disposed of in full with the sale of the Media business on September 17, 2012.
The carrying amount of goodwill is as follows (in thousands):
|
| | | |
| Goodwill | Amount |
| Goodwill - December 31, 2010 | $ | 1,675 |
|
| Additions | — |
|
| Disposals | — |
|
| Goodwill - December 31, 2011 | $ | 1,675 |
|
| Additions | $ | — |
|
| Disposals | $ | (1,675 | ) |
| Goodwill - December 31, 2012 | $ | — |
|
The changes in the carrying amount of the intangible assets are as follows (in thousands):
|
| | | | | | | | | | | | | | | | | | | | | | | |
| | December 31, 2012 | | December 31, 2011 |
| | Gross Asset | | Accumulated Amortization | | Net Asset | | Gross Asset | | Accumulated Amortization | | Net Asset |
| Identified intangible assets: | | | | | | | | | | | |
| Domain and trade names, intellectual property | $ | — |
| | $ | — |
| | $ | — |
| | $ | 6,196 |
| | $ | (6,095 | ) | | $ | 101 |
|
| Purchased technology | — |
| | — |
| | — |
| | 2,535 |
| | (2,535 | ) | | — |
|
| Total Identified intangible assets | $ | — |
| | $ | — |
| | $ | — |
| | $ | 8,731 |
| | $ | (8,630 | ) | | $ | 101 |
|
Net Revenue
Net revenue is derived from the online sale of consumer goods through our wholesale channel. Net revenues are presented net of sales tax. The Company recognizes revenue from sales of consumer goods or products when persuasive evidence of an arrangement exists, delivery has occurred, the sale price is fixed or determinable, and collectibility is reasonably assured. Revenue is deferred for orders shipped but not delivered before the end of the period. The amount recorded as deferred revenue is estimated because of the Company's high volume of transactions and the use of multiple shipping carriers. These estimates are used to determine what orders that shipped at the end of the reporting period, were delivered and should be recognized as revenue. When calculating these estimates, the Company considers historical experience of shipping transit times for domestic and international orders using different carriers. On average, shipping transit times are approximately one to six business days. As of December 31, 2012 and December 31, 2011, $1.3 million and $0.9 million, respectively, was recognized as deferred revenue for orders placed at the end of the reporting period, but not yet delivered.
The Company also engages in the sale of gift certificates. When a gift certificate is sold, revenue is deferred until the certificate is redeemed and the products are delivered. Deferred revenue at December 31, 2012 and December 31, 2011 relating to gift certificates were $1.0 million and $0.7 million, respectively.
The Company reserves an amount for estimated returns at the end of each reporting period. The Company generally gives customers a 90-day right to return products. These estimates are based on historical trends of amounts returned per revenue for a period. Reserves for returns at December 31, 2012 and December 31, 2011 and were $0.5 million and $0.7 million, respectively, and are recorded as accrued liabilities and other in the consolidated balance sheets.
The Company voluntarily ceased selling a product in July 2012 because of safety concerns. The Company is offering its customers who have purchased this product, the opportunity to return the product in exchange for a ThinkGeek credit. As of December 31, 2012, the Company issued an insignificant amount of credits. The Company believes the reserves for returns at December 31, 2012 to be adequate.
Geek Points Loyalty Program
The Company maintains a customer loyalty program by issuing Geek Points to participating customers for certain purchases of products. Customers can redeem their Geek Points toward future purchases in accordance with program rules and promotions. Geek Points expire three years from the date they are earned. The Company accrues the cost of anticipated redemptions using an estimated redemption rate calculated based on historical experiences and trends, adjusted for known modifications to the program that will occur in the future. The cost of the redemptions is included in cost of revenues on the Company's consolidated statements of operations.
Income Taxes
The Company has recognized a deferred tax asset associated with previously reported net operating losses, which can result in a future tax benefit. A valuation allowance is recognized if it is more-likely-than-not that some portion or all of the deferred tax asset will not be realized. The Company has recognized a valuation allowance for the full amount of the deferred tax asset as there is insufficient evidence to support that it is more-likely-than-not that the assets will be realized. The Company reviews its valuation allowance at each reporting period to determine if the deferred tax assets could more-likely-than-not be realized and after considering the impact of limits sanctioned by Internal Revenue Code Section 382 on the use of net operating loss carryforwards.
The Company provides for uncertain tax positions and the related interest and penalties based upon management's assessment of whether a tax benefit is more-likely-than-not to be sustained upon examination by taxing authorities.
The Company performs Section 382 studies on an as needed basis to analyze if there was a change in control of ownership as defined by Section 382 of the Internal Revenue Code that could limit the amount of net operating loss carry-forwards available to offset future federal taxable income. The Company completed a Section 382 study at the end of 2012 of which results are explained in Note 9. Income Taxes.
Computation of Per Share Amounts
Basic income (loss) per common share is computed using the weighted-average number of common shares outstanding (adjusted for treasury stock and common stock subject to repurchase activity) during the period. Diluted income (loss) per common share is computed using the weighted-average number of common and dilutive common equivalent shares outstanding during the period. Common equivalent shares are anti-dilutive when their conversion would increase earnings or decrease loss per share. Dilutive common equivalent shares consist primarily of stock options and restricted stock awards.
The Company considers employee equity share options, non-vested shares, and similar equity instruments as potential common shares outstanding in computing diluted earnings per share. Diluted shares outstanding would include the dilutive effect of in-the-money options, calculated based on the average share price for each fiscal period using the treasury stock method. Under the treasury stock method, the amount the employee must pay for exercising stock options and the amount of compensation cost for future service that is not yet recognized are assumed to be used to repurchase shares.
Foreign Currency Translation and Comprehensive Income (Loss)
The Company had a wholly-owned subsidiaries in the United Kingdom prior to the sale of the Media business on September 17, 2012. The Company also has a wholly-owned subsidiary in Belgium of which there has been minimal activity in the periods presented in the Company's consolidated financial statements . The functional currency of the previously owned United Kingdom subsidiary is the local currency. Balance sheet accounts were translated into U.S. dollars at exchange rates prevailing at balance sheet dates. Revenue and expenses were translated into U.S. dollars at average rates for the period and are included in discontinued operations for each of the years ended December 31, 2012, 2011 and 2010. Adjustments resulting from translation were recorded in other comprehensive income as a component of stockholders' equity. Comprehensive income (loss) is comprised of net income (loss) and foreign currency translation gains or losses .
Supplier Concentration
While no supplier concentration exists in the Company’s e-Commerce business, certain suppliers that the Company's GeekLabs uses to manufacture its unique products are located outside of the United States, most of which are located in China. ThinkGeek's ability to receive inbound inventory and ship completed orders to its customers is substantially dependent on a single third-party contract-fulfillment and warehouse provider.
Concentrations of Credit Risk and Significant Customers
The Company’s investments are held with two reputable financial institutions; both institutions are headquartered in the United States. The Company’s investment policy limits the amount of risk exposure. The Company has cash in financial institutions that is insured by the Federal Deposit Insurance Corporation ("FDIC") up to $0.25 million per institution. At December 31, 2012 and December 31, 2011, the Company had cash and cash equivalents in excess of the FDIC limits.
Financial instruments that potentially subject the Company to concentrations of credit risk consist primarily of trade receivables. The Company provides credit, in the normal course of business, to a number of companies and performs ongoing credit evaluations of its customers. The credit risk in the Company’s trade receivables is substantially mitigated by its credit evaluation process and reasonably short collection terms. The Company maintains reserves for potential credit losses, if any, and such losses have been within management’s expectations.
For the years ended December 31, 2012, December 31, 2011 and December 31, 2010 respectively, no one customer represented 10% or greater of net revenue or accounts receivable.
3. Correction of Treatment for Liabilities
During the fourth quarter of 2012, the Company reviewed its accounting treatment for accruing liabilities for its Geek Points loyalty program at the end of each reporting period. Geek Points are earned by customers upon certain events and can be redeemed with future purchases prior to a three year expiration date. The Company performed an analysis on the costs incurred for redeeming the Geek Points using historical data and determined that the liabilities were understated as of December 31, 2009 and for each of the prior periods presented. Although the impact of the adjustments are immaterial, the Company has adjusted its financial statements for all prior period years presented. The accumulated impact of the prior period adjustments at December 31, 2009 increased accumulated deficit by $0.5 million. The impact of the adjustment to loss from continuing operations for the years ended December 31, 2011 and 2010 was $0.4 million and $0.3 million, respectively. Additional information regarding the adjustments is shown in the following tables (in thousands):
|
| | | | | | | | | | | | | | | |
| | Year Ended December 31, 2011 | | Year Ended December 31, 2010 |
| | As Reported | | Adjusted | | As Reported | | Adjusted |
| | | | | | | | |
| Consolidated statement of operations: | | | | | | | |
Cost of revenue (1) | $ | 83,277 |
| | $ | 83,602 |
| | $ | 62,630 |
| | $ | 63,036 |
|
Gross margin (1) | $ | 15,780 |
| | $ | 15,455 |
| | $ | 13,705 |
| | $ | 13,299 |
|
| | | | | | | | |
Loss from continuing operations (2) | $ | (3,122 | ) | | $ | (3,447 | ) | | $ | (3,853 | ) | | $ | (4,259 | ) |
| Net loss | $ | (1,190 | ) | | $ | (1,515 | ) | | $ | (4,448 | ) | | $ | (4,854 | ) |
(1) Cost of revenue and gross margin, as reported, was previously reported as e-Commerce segment information.
(2) Loss from continuing operations, as reported, has been revised to exclude amounts related to the sale of the Company's Media business, which has been presented as discontinued operations.
|
| | | | | |
| | December 31, 2011 |
| | As Reported | | Adjusted |
| Consolidated balance sheets: | | | |
| Deferred revenue | 3,500 |
| | 3,482 |
|
| Accrued liabilities and other | 3,409 |
| | 4,359 |
|
| Other long-term liabilities | 71 |
| | 343 |
|
| Accumulated deficit | (755,872 | ) | | (757,076 | ) |
4. Balance Sheet Components
Prepaid expenses and other current assets
Prepaid expenses and other current assets consist of the following (in thousands):
|
| | | | | | | |
| | December 31, | | December 31, |
| | 2012 | | 2011 |
| Prepaid expenses and deposits for inventory | $ | 2,794 |
| | $ | 1,991 |
|
| Escrow receivable (Note 10) | 3,000 |
| | — |
|
Other current assets (1) | 1,219 |
| | 386 |
|
| Prepaid expenses and other current assets | $ | 7,013 |
| | $ | 2,377 |
|
(1) Other current assets in 2012 include $0.7 million receivable from the Buyers for performance of transition services and $0.5 million in vendor rebate and other receivables.
Property and Equipment
Property and equipment consist of the following (in thousands):
|
| | | | | | | |
| | December 31, | | December 31, |
| | 2012 | | 2011 |
| Computer and office equipment (useful lives of 2 to 4 years) | $ | 650 |
| | $ | 5,143 |
|
| Distribution equipment (useful life of 5 years) | 5,290 |
| | 5,394 |
|
| Furniture and fixtures (useful lives of 2 to 4 years) | 143 |
| | 347 |
|
| Leasehold improvements (useful lives of lesser of estimated life or lease term) | 220 |
| | 365 |
|
| Software (useful lives of 2 to 5 years) | 393 |
| | 700 |
|
| Total property and equipment | 6,696 |
| | 11,949 |
|
| Less: Accumulated depreciation and amortization | (3,173 | ) | | (6,232 | ) |
| Property and equipment, net | $ | 3,523 |
| | $ | 5,717 |
|
Depreciation and amortization expense from continuing operations for property and equipment was $1.4 million, $1.2 million and $0.5 million for the years ended December 31, 2012, 2011 and 2010, respectively.
Other long-term assets
Other long-term assets consist of the following (in thousands):
|
| | | | | | | |
| December 31, | | December 31, |
| | 2012 | | 2011 |
| Non marketable equity investment | $ | — |
| | $ | 1,979 |
|
| Goodwill | — |
| | 1,675 |
|
| Intangible assets, net | — |
| | 101 |
|
| Other | 335 |
| | 334 |
|
| Other long-term assets | $ | 335 |
| | $ | 4,089 |
|
Non-marketable equity investments
As of December 31, 2011, the Company owned approximately 9% of the outstanding capital stock of CollabNet, Inc. (“CollabNet”), which consisted of shares of CollabNet’s Series C-1 preferred stock. This investment was accounted for under the cost method as the Company held less than 20% of the voting stock of CollabNet and did not otherwise exercise significant influence over CollabNet.
On April 5, 2012, the Company sold its Series C-1 preferred stock investment in CollabNet, Inc. to a third party for $6.0 million. The carrying value of the investment at the time of the sale was $2.0 million and as such, a gain of $4.0 million was recognized during 2012.
The carrying value of the investment is included in Other long-term assets and was zero and $2.0 million at December 31, 2012 and December 31, 2011.
Accrued liabilities and other
Accrued liabilities and other consisted of the following (in thousands):
|
| | | | | | | |
| | December 31, 2012 | | December 31, 2011 |
| Accrued employee compensation and benefits | $ | 1,258 |
| | $ | 2,175 |
|
| Other accrued liabilities | 1,558 |
| | 2,184 |
|
| Accrued liabilities and other | $ | 2,816 |
| | $ | 4,359 |
|
5. Commitments and Contingencies
Litigation
On October 3, 2007, a purported Geeknet (formerly known as VA Linux Systems, Inc.) shareholder filed a complaint for violation of Section 16(b) of the Securities Exchange Act of 1934 (“Exchange Act”), which prohibits short-swing trading, against the Company's IPO underwriters. On June 11, 2012, the Plaintiff voluntarily dismissed the action in part with prejudice. On August 29, 2012, the same Plaintiff sent a demand to the Company requesting the Company commence an action under Section 16(b) of the Exchange Act against Credit Suisse Securities (USA) LLC, one of the Company's IPO underwriters based on similar allegations as in Plaintiff's prior lawsuit. The Company believes that pursuing the claim would not be in the best interests of the Company and therefore did not take the action requested in the letter. On November 2, 2012, the Plaintiff filed a complaint in the United States District Court for the Western District of Washington under Section 16(b) of the Exchange Act against Credit Suisse Securities (USA) LLC seeking disgorgement of short-swing trading profits (Simmonds v. Credit Suisse Securities (USA) LLC, No. 12-cv-01937). The Company was named as a nominal plaintiff in the suit, and no recovery is sought against the Company.
During July 2012, the Consumer Product Safety Commission ("CPSC") filed an administrative complaint against the maker of a product that was sold on the Company's ThinkGeek website. The CPSC complaint does not name ThinkGeek or Geeknet as a party; however, the Company voluntarily ceased selling this product due to the safety concerns raised by the CPSC. The Company is offering its customers who have purchased this product the opportunity to return the product in exchange for a ThinkGeek credit. This exchange is being offered through August 31, 2013. As of December 31, 2012, the Company issued an insignificant amount of credits.
During September 2012, the Company sold its Media business for $20.0 million of which $3.0 million was deposited by the Buyers into an escrow account for a period of twelve months after the Closing Date in order to secure the Company’s indemnification obligations to the Buyers for breaches of the Company’s representations, warranties, covenants and other obligations under the Purchase Agreement. The Purchase Agreement generally limits the Company's liability for breaches of representations and warranties made in the Purchase Agreement to an aggregate of $10.0 million.
The Company is subject to various claims and legal actions arising in the ordinary course of business. The Company reviews all claims and accrues a liability for those matters where it believes that the likelihood that a loss will occur is probable and the amount of loss is reasonably estimable. At December 31, 2012 and December 31, 2011, no liability was recorded for outstanding matters.
Purchase Obligations
The following table summarizes the Company's contractual obligations and commitments as of December 31, 2012 (in thousands):
|
| | | | | | | | | | | | | | |
| | | | Years Ending December 31, | | |
| | Total | | 2013 | | 2014 | | 2015 | | Thereafter |
Operating Lease Obligations (1) | 622 |
| | 367 |
| | 255 |
| | — |
| | — |
|
Purchase Obligations (2) | 917 |
| | 774 |
| | 40 |
| | 103 |
| | — |
|
| Total Obligations | 1,539 |
| | 1,141 |
| | 295 |
| | 103 |
| | — |
|
(1) Includes future payments for the Company's facilities under non-cancelable operating leases that expire at various dates through 2014.
(2) Includes a one-time termination fee of approximately $0.4 million that the Company would be required to pay to our third-party fulfillment and warehouse provider if the Company were to cancel the contract with them and also includes committed licensing payments.
Rent Expense
Rent expense from continuing operations for the years ended December 31, 2012, December 31, 2011 and December 31, 2010 was approximately $0.4 million, $0.5 million and $0.8 million, respectively.
6. Employee Benefit Plans
Retirement Savings Plan
The Company maintains an employee savings and retirement plan which is qualified under Section 401(k) of the Internal Revenue Code and is available to substantially all full-time employees of the Company. The plan provides for tax deferred salary deductions and after-tax employee contributions. Contributions include employee salary deferral contributions and beginning in 2012, matching employer contributions. Prior to 2012, there have been no employer discretionary contributions.
Employee Stock Purchase Plan
In May 2012, the Company's Board of Directors and shareholders approved an Employee Stock Purchase Program (“ESPP”) to provide an opportunity for all employees to purchase the Company's common stock through accumulated payroll deductions. The Company's ESPP authorizes up to 100,000 shares to be granted. The per share price of the Company's common stock purchased pursuant to the ESPP is 95% of the fair market value of the common stock on the last day of the offering period. The ESPP has two six month offering periods beginning September 1 and March 1. The first offering period closes on February 28, 2013 and as such no ESPP shares were issued as of December 31, 2012.
7. Common Stock and Stock Compensation
Stock Repurchase Program
In February 2011, the Company announced an "odd lot" share repurchase program under which the Board of Directors approved the repurchase of up to $1.0 million of the Company's common stock through March 18, 2011. Under this program, the Company repurchased 4,868 shares of common stock at a weighted average price of 26.01 per share for aggregate purchase price of approximately $127,000. There was no "odd lot" share repurchase program during 2012.
Equity Incentive Plans
In December 2007, the Company's stockholders approved the 2007 Equity Incentive Plan (“2007 Plan”). The 2007 Plan replaced the Company's 1998 Stock Plan (the “1998 Plan”) and the 1999 Director Option Plan (the “Directors' Plan”), collectively referred to as the “Equity Plans”. The Equity Plans will continue to govern awards previously granted under each respective plan. There were initially 525,000 shares of common stock reserved for issuance under the 2007 Plan, subject to increase for stock options or awards previously issued under the Equity Plans which expire, cancel or are forfeited. In May 2011, the Company's stockholders approved the addition of 200,000 shares of common stock available for issuance under the 2007 Plan. At December 31, 2012, a total of 289,606 shares of common stock were available for issuance under the 2007 Plan.
In May 2012 at the Annual Meeting of Stockholders, the stockholders approved an amendment to the 2007 Plan. The 2007 Plan was amended to change the way restricted stock unit grants reduce the number of shares available for issuance under the 2007 Plan. Prior to the amendment, for each grant or forfeiture of a restricted stock unit, the number of shares available for issuance under the 2007 Plan decreased or increased by two. The amendment changed this 2:1 ratio to a 1:1 ratio.
Options granted under the 2007 Plan must be issued at a price equal to at least the fair market value of the Company’s common stock on the date of grant. All vested stock options under the 2007 Plan may be exercised at any time within 10 years of the date of grant or within 90 days of termination of employment, or such other time as may be provided in the stock option agreement, and vest as determined by the Board of Directors. The Company’s policy is to issue new shares upon exercise of options, granting of Restricted Stock Awards ("RSA") or vesting of Restricted Stock Units ("RSU") under the 2007 Plan.
Stock Options
The following table summarizes option activities from December 31, 2011 through December 31, 2012:
|
| | | | | | | | | | |
| | | Number of Shares | | Weighted-Average Exercise Price per Share | | Weighted-Average Remaining Contractual Term (in years) | | Aggregate Intrinsic Value (in thousands) |
| Outstanding as of December 31, 2011 | | 411,726 |
| | $20.47 | | | | |
| Granted | | 5,989 |
| | $18.07 | | | | |
| Exercised | | (27,782 | ) | | $12.77 | | | | |
| Forfeited | | (181,071 | ) | | $21.25 | | | | |
| Outstanding as of December 31, 2012 | | 208,862 |
| | $20.75 | | 4.3 | | $252 |
| Vested or expected to vest at December 31, 2012 | | 202,526 |
| | $20.69 | | 4.2 | | $250 |
| Exercisable at December 31, 2012 | | 166,155 |
| | $20.77 | | 3.6 | | $216 |
The total intrinsic value of options exercised was $0.1 million, $0.6 million and $3.6 million for the years ended December 31, 2012 , December 31, 2011 and December 31, 2010, respectively. The Company issues new shares upon the exercise of options. The weighted average grant date fair value was $7.42, $13.72 and $8.70 for the years ended December 31, 2012 , December 31, 2011 and December 31, 2010 , respectively. For the years ended December 31, 2012, December 31, 2011 and December 31, 2010, no tax benefit was realized from exercised options.
The fair value of the option grants has been calculated on the date of grant using the Black-Scholes option pricing model. The expected life was based on historical settlement patterns. Expected volatility was based on historical implied volatility in the Company’s stock. The interest rate for periods within the contractual life of the award is based on the U.S. Treasury yield curve in effect at the time of grant. The following table summarizes the weighted-average assumptions for stock options granted:
|
| | | | | | | | |
| | Year Ended December 31, |
| | 2012 | | 2011 | | 2010 |
| Expected life (years) | 3.02 |
| | 4.36 |
| | 5.6 |
|
| Risk-free interest rate | 0.4 | % | | 1.2 | % | | 2.3 | % |
| Volatility | 62 | % | | 74 | % | | 63 | % |
| Dividend yield | — | | — | | — |
Restricted Stock
Outstanding restricted stock units granted to employees vest over a three year period. Outstanding restricted stock units granted to non-employee directors typically vest in less than a year and represent compensation for serving on the Company's Board of Directors. The following table summarizes restricted stock activities from December 31, 2011 through December 31, 2012:
|
| | | | | |
| | | Number of Shares | | Weighted-Average Grant-Date Fair Value |
| Outstanding as of December 31, 2011 | 388,318 |
| | $23.65 |
| Granted | 167,120 |
| | $16.31 |
| Restricted Stock Release | (235,029 | ) | | $22.44 |
| Canceled | (94,007 | ) | | $18.31 |
| Outstanding as of December 31, 2012 | 226,402 |
| | $21.70 |
Stock-Based Compensation Expense
The following table summarizes stock-based compensation expense as recorded in the Consolidated Statements of Operations (in thousands):
|
| | | | | | | | | | | |
| | Year Ended December 31, |
| | 2012 | | 2011 | | 2010 |
| Cost of revenue | $ | 376 |
| | $ | 193 |
| | $ | 97 |
|
| | | | | | |
| Sales and marketing | $ | 148 |
| | $ | 55 |
| | $ | 10 |
|
| Technology and design | 133 |
| | 57 |
| | 19 |
|
| General and administrative | 2,902 |
| | 2,712 |
| | 1,295 |
|
| Included in operating expenses | 3,183 |
| | 2,824 |
| | 1,324 |
|
| | | | | | |
| Total stock-based compensation expense | $ | 3,559 |
| | $ | 3,017 |
| | $ | 1,421 |
|
Stock-based compensation expense is recognized, net of estimated forfeitures, on a straight line basis over the vesting period. Forfeitures are estimated at the time of the grant, based on historical trends, and revised in subsequent periods, if necessary.
As of December 31, 2012, total compensation cost not yet recognized and the weighted-average remaining term is as follows ($ in thousands):
|
| | | | | | |
| | Expense not yet
recognized | | Weighted Average Remaining Term (in years) |
| Stock Options | $ | 439 |
| | 1.8 |
|
| Restricted Stock Units | $ | 2,528 |
| | 1.2 |
|
8. Computation of Per Share Amounts
The following table presents the calculation of basic and diluted earnings per share (in thousands, except per share data):
|
| | | | | | | | | | | |
| | Year Ended December 31, |
| | 2012 | | 2011 | | 2010 |
| | | | | | |
| Income (loss) from continuing operations | 1,805 |
| | (3,447 | ) | | (4,259 | ) |
| Income (loss) from discontinued operations, net of tax | 12,102 |
| | 1,932 |
| | (595 | ) |
| Net income (loss) | $ | 13,907 |
| | $ | (1,515 | ) | | $ | (4,854 | ) |
| | | | | | |
| Weighted average shares - basic | 6,466 |
| | 6,319 |
| | 6,073 |
|
| Dilutive effect of stock-based awards | 90 |
| | — |
| | — |
|
| Weighted average shares - dilutive | 6,556 |
| | 6,319 |
| | 6,073 |
|
| | | | | | |
| Income (loss) per share from continuing operations: | | | | | |
| Basic | $ | 0.28 |
| | $ | (0.55 | ) | | $ | (0.70 | ) |
| Diluted | $ | 0.28 |
| | $ | (0.55 | ) | | $ | (0.70 | ) |
| | | | | | |
| Income (loss) per share from discontinued operations: | | | | | |
| Basic | $ | 1.87 |
| | $ | 0.31 |
| | $ | (0.10 | ) |
| Diluted | $ | 1.85 |
| | $ | 0.31 |
| | $ | (0.10 | ) |
| | | | | | |
| Net income (loss) per share: | | | | | |
| Basic | $ | 2.15 |
| | $ | (0.24 | ) | | $ | (0.80 | ) |
| Diluted | $ | 2.12 |
| | $ | (0.24 | ) | | $ | (0.80 | ) |
The following potential common shares have been excluded from the calculation of diluted earnings per share for all periods presented because they are anti-dilutive (in thousands):
|
| | | | | | | | |
| | Year Ended December 31, |
| | 2012 | | 2011 | | 2010 |
| Anti-dilutive securities: | | | | | |
| Options to purchase common stock | 232 |
| | 192 |
| | 537 |
|
| Unvested restricted stock units | 114 |
| | 174 |
| | 8 |
|
| Total | 346 |
| | 366 |
| | 545 |
|
9. Income Taxes
The Company provides for income taxes using an asset and liability approach, where deferred income taxes are provided based upon enacted tax laws and rates applicable to periods in which the taxes become payable. The Company is subject to taxation in the U.S. and various states and foreign jurisdictions. With few exceptions, as of December 31, 2012 and 2011, the Company is no longer subject to U.S. federal, state, local, or foreign examinations by tax authorities for years before 2008.
Income (loss) from continuing operations before income taxes consists of the following components (in thousands):
|
| | | | | | | | | | | |
| | Year ended December 31, |
| | 2012 | | 2011 | | 2010 |
| United States | $ | 1,811 |
| | $ | (4,584 | ) | | $ | (4,161 | ) |
During the years ended December 31, 2012, December 31, 2011 and December 31, 2010, the Company paid income taxes of $0.1 million, $0.0 million and $0.1 million, respectively.
A summary of total tax expense, by classification, included in the accompanying consolidated statements of income is as follows (in thousands):
|
| | | | | | | | | | | |
| | Year ended December 31, |
| | 2012 | | 2011 | | 2010 |
| Current: | | | | | |
| Federal | $ | 6 |
| | $ | (1,171 | ) | | $ | 25 |
|
| State | — |
| | 34 |
| | 73 |
|
| | $ | 6 |
| | $ | (1,137 | ) | | $ | 98 |
|
The income tax benefit recognized in 2011 is offset by a tax provision in discontinued operations as there was a loss in continuing operations and income in discontinued operations in that same year. There was not a similar benefit in 2012 and 2010 as there was income or loss in both continuing and discontinuing operations in those years.
Deferred tax assets consist of the following (in thousands):
|
| | | | | | | |
| | Year ended December 31, |
| | 2012 | | 2011 |
| Deferred tax assets: | | | |
| Accruals and reserves | $ | 2,271 |
| | $ | 3,288 |
|
| Net operating loss carryforwards | 14,816 |
| | 21,125 |
|
| Research and development credit carryforward | 858 |
| | 556 |
|
| Gross deferred tax asset | $ | 17,945 |
| | $ | 24,969 |
|
| Valuation allowance | (17,945 | ) | | (24,969 | ) |
| Net deferred tax asset | $ | — |
| | $ | — |
|
The Company has recently completed a study addressing the recoverability of our net operating loss carryforwards. The results of the study indicated that there was a change of control as defined by Section 382 of the Internal Revenue Code (“IRC”) in 2008. As a result of the change of control, certain net operating losses previously included in the Company's deferred tax disclosures will not be available to offset future taxable income as the IRC limits the annual utilization of these carryforwards. Consistent with historical practices, the Company continues to fully reduce the net operating loss carryforwards and all other deferred tax assets by a valuation allowance. This is due to the conclusion that it was more-likely-than-not that the Company would not recover the deferred tax assets because of uncertainties about the Company's ability to generate taxable income in the future.
The Company's previously reported net operating loss carryforwards of $280.6 million as of December 31, 2011 is limited to $49.9 million, of which $13.0 million will be utilized to offset taxable income in 2012. Also reducing the net operating loss carryforwards was $1.4 million of recognized built in losses. The amount of net operating losses available to offset taxable income in 2013 and beyond as of December 31, 2012 is $35.5 million. Approximately $1.8 million of the net operating loss carryforwards have not been recognized as they related to benefits associated with stock option exercises that have not reduced current taxes payable.
This change in control also limits the amount of net operating loss carry-forwards available to offset future California taxable income. As of December 31, 2011, the previously reported net operating loss carryforwards of $76.2 million is limited to $38.9 million, of which $2.0 million will be utilized to offset taxable income in 2012 with $36.9 million available to offset California taxable income in 2013 and beyond.
The net operating losses not expected to be utilized in 2012 expire between 2013 and 2031. The net operating loss carryforwards stated above are reflective of various federal and state tax limitations. As of December 31, 2012 and December 31, 2011, the Company has gross federal and California state research and development credit carryforwards of $0.8 million and $0.2 million, respectively, which expire between 2019 and 2031.
Reconciliation of the statutory federal income tax to the Company’s effective tax is as follows:
|
| | | | | | | | |
| | Year ended December 31, |
| | 2012 | | 2011 | | 2010 |
| Tax Benefit at Federal statutory rate | 34.0 | % | | 34.0 | % | | 34.0 | % |
| State, net of Federal benefit | 0.9 | % | | (0.1 | )% | | 3.6 | % |
| Stock compensation | — | % | | 0.3 | % | | (3.5 | )% |
| Research and development credit | — | % | | 6.5 | % | | 6.9 | % |
| Return to Provision and True-ups | — | % | | (2.8 | )% | | 3.8 | % |
| Change in valuation allowance | (35.9 | )% | | (12.7 | )% | | (44.6 | )% |
| Other | 1.3 | % | | (0.4 | )% | | (2.5 | )% |
| Benefit (Provision) for taxes | 0.3 | % | | 24.8 | % | | (2.3 | )% |
A reconciliation of the beginning and ending amount of unrecognized tax benefits is as follows (in thousands):
|
| | | | | | | | | | | |
| | Year ended December 31, |
| | 2012 | | 2011 | | 2010 |
| Unrecognized tax benefits at beginning of period | $ | 1,192 |
| | $ | 1,234 |
| | $ | 810 |
|
| Gross increases to current period tax positions | — |
| | 59 |
| | 180 |
|
| Gross (decreases) increases to prior period tax positions | (848 | ) | | (101 | ) | | 244 |
|
| Unrecognized tax benefits at end of period | $ | 344 |
| | $ | 1,192 |
| | $ | 1,234 |
|
The Company classifies interest expense and penalties related to unrecognized tax benefits and interest income on tax overpayments as components of its income tax expense. During the years ended December 31, 2012, December 31, 2011 and December 31, 2010 no interest or penalties were recognized. The Company does not expect its unrecognized tax benefits to change significantly over the next 12 months. There are no unrecognized tax benefits that would affect the actual tax rate at December 31, 2012, as the full valuation is recorded as deferred tax asset.
10. Discontinued Operations
Media Business
On May 11, 2012, the Company announced that its Board of Directors was exploring strategic alternatives with respect to the Company's Media business, including the SourceForge, Slashdot and Freecode websites. The Company and its advisers evaluated a range of options to maximize shareholder value, including, but not limited to, selling the Media business. On September 17, 2012, Geeknet, Inc. entered into a Purchase Agreement with Dice and two of Dice’s subsidiaries, (collectively, the “Buyers”) pursuant to which the Buyers purchased the Company’s Media business segment, including the SourceForge, Slashdot and Freecode websites (the “Purchased Business”) and assumed certain related liabilities.
In accordance with the terms of the Purchase Agreement, the Buyers paid to the Company $20.0 million in cash, of which $3.0 million was deposited by the Buyers into an escrow account for a period of twelve months after the Closing Date in order to secure the Company’s indemnification obligations to the Buyers for breaches of the Company’s representations, warranties, covenants and other obligations under the Purchase Agreement.
The Purchase Agreement contains customary representations, warranties and covenants. Subject to certain exceptions and limitations, each party has agreed to indemnify the other for breaches of representations, warranties and covenants and other specified matters. The Purchase Agreement generally limits the Company's liability for breaches of representations and warranties made in the Purchase Agreement to an aggregate of $10.0 million. The Purchase Agreement also contains covenants requiring the Company not to solicit or hire certain employees of the
Buyers or compete with the Purchased Business for a period of three years. The Company and Dice have also agreed to provide certain transition services to one another through December 31, 2013.
The following shows revenues, gross profit and income from discontinued operations, net of tax from discontinued operations:
|
| | | | | | | | | | | |
| | Year Ended December 31, |
| | 2012 | | 2011 | | 2010 |
| Revenue | $ | 13,797 |
| | $ | 20,409 |
| | $ | 18,284 |
|
| Gross profit | $ | 10,421 |
| | $ | 15,503 |
| | $ | 11,674 |
|
| | | | | | |
| (Loss) income from discontinued operations | $ | (1,509 | ) | | $ | 2,986 |
| | $ | (805 | ) |
| Gain (loss) on sale of discontinued operations | 13,712 |
| | — |
| | (55 | ) |
| Income tax provision (benefit) from discontinued operations | 101 |
| | 1,054 |
| | (265 | ) |
| Income (loss) from discontinued operations, net of tax | $ | 12,102 |
| | $ | 1,932 |
| | $ | (595 | ) |
Gross profit and (loss) income from discontinued operations do not include corporate costs that were allocated to the Company's Media segment. The $13.7 million gain on the sale of the Media business is the selling price of $20.0 million less the carrying value of certain assets and liabilities assumed by the Buyers, offset by transaction costs of $1.1 million. The carrying value of the total assets and total liabilities included in the Purchased Business were $8.3 million and $3.1 million, respectively.
The gain on disposal assumes a full recovery of the $3.0 million held in escrow. The gain and results from discontinued operations for the year ended December 31, 2012 was subject to adjustments based upon final allocation of revenues and expenses to the Company and the Buyers. Final settlement of transition services will occur during 2013.
The tax provision (benefit) recorded on discontinued operations for the years ended December 31, 2012, 2011 and 2010 represents the tax based upon the with and without. The 2012 tax provision is significantly lower than the statutory rate as a result of net operating losses with a full valuation allowance. The tax provision for 2011 is offset by a tax benefit in continuing operations. The 2010 tax benefit represents use of available tax credits.
Included in (loss) income from discontinued operations, net of tax for the year ended December 31, 2010 was a loss of $0.2 million from the sale of the Media business' website Geek.com that had been acquired earlier in the year.
11. Segment and Geographic Information
Prior to the sale of the Company's Media business on September 17, 2012, the Company had two strategic business segments that offered different products and services, e-Commerce and Media. The Company currently has one segment, e-Commerce, that sells geek-themed retail products to technology enthusiasts and general consumers through its ThinkGeek website and wholesale channel.
International revenue comprised approximately 14%, 14% and 18% of total e-Commerce revenue for the years ended December 31, 2012, 2011 and 2010.
12. Quarterly Financial Information
Quarterly Consolidated Financial Data
(Unaudited, in thousands, except per share amounts)
The Company’s quarters end on March 31, June 30, September 30 and December 31 of each calendar year.
You should read the following tables presenting our quarterly results of operations in conjunction with the consolidated financial statements and related notes included in Item 8 of this Annual Report on Form 10-K. We have prepared the unaudited information on the same basis as our audited consolidated financial statements. Certain amounts in previously reported quarters have been adjusted to exclude discontinued operations as a result of the sale of the Company's Media business.
ThinkGeek sales are highly seasonal, reflecting the general pattern associated with the retail industry of peak sales and earnings during the holiday shopping season. As a result, a substantial portion of the 2012 and 2011 revenue occurred in the fourth quarter, which began on October 1 and ended on December 31, for 2012 and 2011. As is typical in the retail industry, the Company generally experiences lower revenue during the other quarters. Therefore, the revenue in a particular quarter is not necessarily indicative of future revenue for a subsequent quarter or a full year.
|
| | | | | | | | | | | | | | | |
| | For the three months ended |
| | March 31 | | June 30 | | September 30 | | December 31 |
| Year 2012 | | | | | | |
|
| Net revenue | $ | 17,510 |
| | $ | 17,804 |
| | $ | 17,260 |
| | $ | 66,339 |
|
| Gross margin | 2,567 |
| | 2,096 |
| | 2,256 |
| | 14,147 |
|
| (Loss) income from continuing operations | (1,380 | ) | | 507 |
| | (1,999 | ) | | 4,676 |
|
Net (loss) income (1) | $ | (2,055 | ) | | $ | 1,543 |
| | $ | 8,363 |
| | $ | 6,056 |
|
| Net (loss) income per share from continuing operations: |
|
| |
|
| |
|
| |
|
|
| Basic | $ | (0.22 | ) | | $ | 0.08 |
| | $ | (0.31 | ) | | $ | 0.71 |
|
| Diluted | $ | (0.22 | ) | | $ | 0.08 |
| | $ | (0.31 | ) | | $ | 0.71 |
|
| Net (loss) income per share: |
|
| |
|
| |
|
| |
|
|
| Basic | $ | (0.32 | ) | | $ | 0.24 |
| | $ | 1.29 |
| | $ | 0.92 |
|
| Diluted | $ | (0.32 | ) | | $ | 0.24 |
| | $ | 1.27 |
| | $ | 0.92 |
|
| Year 2011 |
|
| |
|
| |
|
| |
|
|
| Net revenue | $ | 15,205 |
| | $ | 14,319 |
| | $ | 14,693 |
| | $ | 54,840 |
|
Gross margin (2) | 1,513 |
| | 1,043 |
| | 1,209 |
| | 11,690 |
|
| (Loss) income from continuing operations | (2,554 | ) | | (2,854 | ) | | (3,175 | ) | | 5,140 |
|
| Net (loss) income | $ | (2,444 | ) | | $ | (2,208 | ) | | $ | (2,747 | ) | | $ | 5,888 |
|
| Net (loss) income per share from continuing operations: |
|
| |
|
| |
|
| |
|
|
| Basic | $ | (0.41 | ) | | $ | (0.45 | ) | | $ | (0.50 | ) | | $ | 0.81 |
|
| Diluted | $ | (0.41 | ) | | $ | (0.45 | ) | | $ | (0.50 | ) | | $ | 0.81 |
|
| Net (loss) income per share: |
| |
| |
| |
|
| Basic | $ | (0.39 | ) | | $ | (0.35 | ) | | $ | (0.43 | ) | | $ | 0.93 |
|
| Diluted | $ | (0.39 | ) | | $ | (0.35 | ) | | $ | (0.43 | ) | | $ | 0.92 |
|
(1) Included in net income for the three months ended June 30, 2012, is a gain of $4.0 million from the sale of the Company's Series C-1 preferred stock investment in CollabNet, Inc.
(2) During the fourth quarter of 2012, the Company reviewed its accounting treatment for accruing liabilities for its Geek Points loyalty program at the end of each reporting period and determined that the liabilities were understated at the end of each quarterly reporting period in 2011. The Company adjusted March 1, June 30, September 30 and December 31, 2011 by decreasing gross margins by $58 thousand, $67 thousand, $70 thousand and $130 thousand, each respectively.
13. Subsequent Events
During the first quarter of 2013, the Company restructured certain areas of the business and hired three new members of the senior leadership team. Total restructuring costs of $1.1 million were all incurred in the first quarter of 2013.
Item 9. Changes in and Disagreements with Accountants on Accounting and Financial Disclosure
None.
Item 9A. Controls and Procedures
(a) Evaluation of Disclosure Controls and Procedures
The Company's management, with the participation of the Company's chief executive officer and chief financial officer, evaluated the effectiveness of the Company's disclosure controls and procedures (as defined in Rules 13a-15(e) and 15d-15(e) under the Securities Exchange Act of 1934), as amended, as of December 31, 2012. Disclosure controls are controls and procedures designed to provide reasonable assurance that information required to be disclosed in our reports filed under the Securities Exchange Act of 1934 is recorded, processed, summarized and reported within the time periods prescribed by SEC rules and regulations, and that such information was accumulated and communicated to our management to allow timely decisions regarding required disclosure.
In conducting our evaluation, we concluded there is a material weakness in the operating effectiveness of our internal control over financial reporting described below relating to the sufficiency of resources devoted to monitoring activities during the financial statement close process.
As a result of the foregoing, we have concluded that as of December 31, 2012 we did not maintain disclosure controls and procedures that were effective in providing reasonable assurance that information required to be disclosed in our reports filed under the Securities Exchange Act of 1934 was recorded, processed, summarized and reported within the time periods prescribed by SEC rules and regulations, and that such information was accumulated and communicated to our management to allow timely decisions regarding required disclosure.
Our management does not expect that our disclosure controls and procedures will prevent all errors and all fraud. A control system, no matter how well designed and operated, can provide only reasonable, not absolute, assurance that the control system's objectives will be met. Further, the design of a control system must reflect the fact that there are resource constraints, and the benefits of controls must be considered relative to their costs. Because of the inherent limitations in all control systems, no evaluation of controls can provide absolute assurance that all control issues and instances of fraud, if any, have been detected. These inherent limitations include the realities that judgments in decision-making can be faulty, and that breakdowns can occur because of simple error or mistake. The design of any system of controls is based in part upon certain assumptions about the likelihood of future events, and there can be no assurance that any design will succeed in achieving its stated goals under all potential future conditions.
(b) Management's Report on Internal Control over Financial Reporting
Management is responsible for establishing and maintaining adequate internal control over financial reporting and for the assessment of the effectiveness of internal control over financial reporting as defined in Rules 13a-15(f) and 15d-15(f) under the Securities Exchange Act of 1934, as amended. In connection with the preparation of the Company's annual financial statements, management of the Company, including our chief executive officer and chief financial officer, has undertaken an assessment of the effectiveness of the Company's internal control over financial reporting as of December 31, 2012 based on criteria established in Internal Control - Integrated Framework issued by the Committee of Sponsoring Organizations of the Treadway Commission (the “COSO”). A material weakness is a deficiency, or combination of deficiencies, in internal control over financial reporting, such that there is a reasonable possibility that a material misstatement of the annual or interim financial statements will not be prevented or detected on a timely basis.
Management identified a material weakness in the Company's internal control over financial reporting as of December 31, 2012. Specifically, we did not maintain a sufficient complement of corporate accounting personnel necessary to consistently operate management review controls. The demand on the corporate accounting resources is significant due to the manual nature of controls necessary to maintain effective control over our legacy system, and intensified in 2012 as a result of the increased volume of our sales activity and the complexity of the disposal of our Media business. As a result of this material weakness, we made a number of adjustments to cost of goods sold, share based compensation and presentation to discontinued operations in connection with our financial statement audit in order to prepare the consolidated financial statements and footnotes included in this Form 10-K. Additionally, there is a reasonable possibility that a material misstatement of the Company's annual or interim consolidated financial statements would not be prevented or detected on a timely basis.
As a result of this material weakness, the Company's management has concluded that, as of December 31, 2012, its internal control over financial reporting was not effective based on criteria established in Internal Control - Integrated Framework issued by the COSO.
Our independent registered public accounting firm, KPMG LLP, has issued an audit report on the effectiveness of our internal controls over financial reporting as of December 31, 2012, which is included in this Annual Report on Form 10-K.
(c) Changes in Internal Control over Financial Reporting and Remediation
As a result of management's evaluation of our internal control over financial reporting, our Chief Executive Officer and Chief Financial Officer have concluded that our internal control over financial reporting was not effective as of December 31, 2012 due to the following material weakness:
| |
| • | The Company's monitoring activities are not effective at identifying, on a timely basis, deficiencies in the operation of controls in the financial statement close process. Specifically, the Company did not have sufficient resources to complete, at a sufficiently detailed level, the review of manual controls performed by Company personnel associated with account analysis and the verification of the accuracy of electronic spreadsheets that support financial reporting. This material weakness resulted in deficiencies in the operation of controls not being detected timely and in errors in the Company's preliminary 2012 financial statements, including errors in cost of goods sold, share based compensation and presentation of discontinued operations. |
To remediate this material weakness, during 2013, we will determine the appropriate complement of corporate accounting personnel required to consistently operate management review controls. We are currently in the process of hiring additional personnel and/or contractors with appropriate accounting experience. We will continue to transition toward a new integrated enterprise resource planning system. Given the importance of the new systems, the implementation may not be completed prior to December 31, 2013. We will continue to operate manual controls until the new system is implemented.
Item 9B. Other Information
The annual meeting of stockholders for 2013 is scheduled to be held on May 7, 2013. Under our bylaws as currently in effect notices of stockholder proposals must be received no earlier than 120 days and no later than 90 days prior to the first anniversary the date of the 2012 annual meeting in order to be timely. Accordingly, notices of stockholder proposals with respect to the 2013 annual meeting of stockholders must have been received no earlier than January 10, 2013, and no later than February 9, 2013, in order to be timely.
PART III
Item 10. Directors, Executive Officers and Corporate Governance
The information called for by this item is incorporated by reference to the sections entitled “Certain Beneficial Owners,” “Security Ownership of Directors and Executive Officers” and “Information About The Directors, Nominees
And Executive Officers” in the Company’s 2013 Proxy Statement, which will be delivered to stockholders in connection with the Company’s annual stockholders’ meeting to be held on May 7, 2013.
Code of Ethics
In addition to the Company’s Code of Business Conduct and Ethics that is applicable to all employees and directors, the Company has adopted a Code of Ethics for Principal Executive and Senior Financial Officers. The Company has posted the text of its Code of Ethics for Principal Executive and Senior Financial Officers on its Internet web site at: investors.geek.net/governance.cfm
We will post on this section of our website any amendment to our Code of Ethics for Principal Executive and Senior Financial Officers that are required to be disclosed by the rules of the SEC or The NASDAQ Stock Market.
Item 11. Executive Compensation
The information called for by this item is incorporated by reference to the section entitled “Compensation of Directors and Executive Officers” in the Company’s 2013 Proxy Statement, which will be delivered to stockholders in connection with the Company’s annual stockholders’ meeting to be held on May 7, 2013.
Item 12. Security Ownership of Certain Beneficial Owners and Management and Related Stockholder Matters
Equity Compensation Plans
The information called for by this item is incorporated by reference to the sections entitled “Certain Beneficial Owners” and “Security Ownership of Directors and Executive Officers” in the Company’s 2013 Proxy Statement, which will be delivered to stockholders in connection with the Company’s annual stockholders’ meeting to be held on May 7, 2013 .
The following table summarizes our equity compensation plans as of December 31, 2012, all of which have been approved by our stockholders:
|
| | | | | | | | | | | |
| | | A | | | B | | C |
| Plan Category | | Number of securities to be issued upon exercise of outstanding options | | | Weighted average exercise price of outstanding options | | Number of securities remaining available for future issuance under equity compensation plan (excluding securities reflected in column A) |
Equity compensation plans approved by stockholders | | 208,862 |
| (1)(2) | | $ | 20.75 |
| | 289,606 |
|
______________________
| |
| (1) | All options outstanding are under the Company’s 2007 Equity Incentive Plan. |
| |
| (2) | Does not include 226,402 restricted stock units outstanding under the Company's 2007 Equity Plan. |
Item 13. Certain Relationships and Related Transactions, and Director Independence
The information called for by this item is incorporated by reference to the section entitled “Certain Relationships and Related Transactions” in the Company’s 2013 Proxy Statement, which will be delivered to stockholders in connection with the Company’s annual stockholders’ meeting to be held on May 7, 2013.
Item 14. Principal Accounting Fees and Services
The information called for by this item is incorporated by reference to the section entitled “Principal Accountant Fees and Services” in the Company’s 2013 Proxy Statement, which will be delivered to stockholders in connection with the Company’s annual stockholders’ meeting to be held on May 7, 2013.
PART IV
Item 15. Exhibits and Financial Statement Schedule
| |
(a) | The following documents are filed as part of this report: |
| |
1 | All Financial Statements: |
See the Consolidated Financial Statements and notes thereto in Item 8 above.
| |
2 | Schedule II — Valuation and Qualifying Accounts are filed as part of this Form 10-K. |
See the Exhibit Index.
| |
(b) | Exhibits: We have filed, or incorporated into this Report by reference, the exhibits listed on the accompanying Exhibit Index immediately following the signature page to this Form 10-K. |
| |
(c) | Financial Statement Schedules: See Item 15(a) above. |
SIGNATURES
Pursuant to the requirements of Section 13 or 15(d) of the Securities Exchange Act of 1934, the Registrant has duly caused this report to be signed on its behalf by the undersigned, thereunto duly authorized.
|
| | |
| | GEEKNET, INC. |
| | | |
| | By: | /s/ Kathryn K. McCarthy |
| | | Kathryn K. McCarthy |
| | | President and Chief Executive Officer |
Date: March 1, 2013
POWER OF ATTORNEY
KNOW ALL PERSONS BY THESE PRESENTS, that each person whose signature appears below hereby constitutes and appoints Kenneth G. Langone and Kathryn K. McCarthy, and each of them, his true and lawful attorneys-in-fact, each with full power of substitution, for him and all capacities, to sign any amendments to this report on Form 10-K and to file the same, with exhibits thereto and other documents in connection therewith, with the Securities and Exchange Commission and does hereby ratify and confirm all that each of said attorneys-in-fact or their substitute or substitutes may do or cause to be done by virtue hereof.
Pursuant to the requirement of the Securities Exchange Act of 1934, this report has been signed below by the following persons on behalf of the Registrant and in the capacities and on the dates indicated.
|
| | | | |
| Signature | | Title | | Date |
| | | | | |
| /s/ Kenneth G. Langone | | Chairman of the Board of Directors | | March 1, 2013 |
| Kenneth G. Langone | | | | |
| | | | | |
| /s/ Kathryn K. McCarthy | | President, Chief Executive Officer | | March 1, 2013 |
| Kathryn K. McCarthy | | | | |
| | | | | |
| /s/ Ali R. Sorbi | | Chief Financial Officer | | March 1, 2013 |
| Ali R. Sorbi | | (principal financial officer) | | |
| | | | | |
| /s/ Matthew C. Blank | | Director | | March 1, 2013 |
| Matthew C. Blank | | | | |
| | | | | |
| /s/ Thomas Coughlin | | Director | | March 1, 2013 |
| Thomas Coughlin | | | | |
| | | | | |
| /s/ Matt Carey | | Director | | March 1, 2013 |
| Matt Carey | | | | |
| | | | | |
| /s/ Peter A. Georgescu | | Director | | March 1, 2013 |
| Peter A. Georgescu | | | | |
| | | | | |
| /s/ Sir Ronald Hampel | | Director | | March 1, 2013 |
| Sir Ronald Hampel | | | | |
| | | | | |
| /s/ Frank A. Riddick, III | | Director | | March 1, 2013 |
| Frank A. Riddick, III | | | | |
| | | | | |
| /s/ Derek Smith | | Director | | March 1, 2013 |
| Derek Smith | | | | |
| | | | | |
| /s/ Michael Solomon | | Director | | March 1, 2013 |
| Michael Solomon | | | | |
| | | | | |
| /s/ David B. Wright | | Director | | March 1, 2013 |
| David B. Wright | | | | |
GEEKNET, INC.
SCHEDULE II — VALUATION AND QUALIFYING ACCOUNTS
(In thousands)
|
| | | | | | | | | | | | | | | | | | | | |
| Description | | Balance
Beginning of
Period | | Charged to Expenses | | Deductions | | Discontinued from disposal of Media business | | Balance End
of Period |
| Allowance for doubtful accounts | | | | | | | | |
| Year Ended December 31, 2010 | | $ | — |
| | $ | — |
| | $ | — |
| | $ | — |
| | $ | — |
|
| Year Ended December 31, 2011 | | $ | — |
| | $ | 28 |
| | $ | (28 | ) | (1) | $ | 27 |
| | $ | 27 |
|
| Year Ended December 31, 2012 | | $ | 27 |
| | $ | 38 |
| | $ | (24 | ) | (1) | $ | (27 | ) | | $ | 14 |
|
| | | | | | | | | | | |
| (1) Uncollectible accounts written off | | | | | | | | |
| | | | | | | | | | | |
| Allowance for returns | | | | |
| | | | | | |
|
| Year Ended December 31, 2010 | | $ | 258 |
| | $ | 350 |
| | $ | (258 | ) | | $ | — |
| | $ | 350 |
|
| Year Ended December 31, 2011 | | $ | 350 |
| | $ | 301 |
| | $ | — |
| | $ | — |
| | $ | 651 |
|
| Year Ended December 31, 2012 | | $ | 651 |
| | $ | (130 | ) | | $ | — |
| | $ | — |
| | $ | 521 |
|
| | | | | | | | | | | |
| Deferred tax valuation allowance | | | | | | | | |
| Year Ended December 31, 2010 | | $ | 26,777 |
| | $ | — |
| | $ | (2,055 | ) | | $ | — |
| | $ | 24,722 |
|
| Year Ended December 31, 2011 | | $ | 24,722 |
| | $ | — |
| | $ | 247 |
| | $ | — |
| | $ | 24,969 |
|
| Year Ended December 31, 2012 | | $ | 24,969 |
| | $ | — |
| | $ | (7,024 | ) | | $ | — |
| | $ | 17,945 |
|
|
| | |
Exhibit Number | | EXHIBIT INDEX |
| | | |
| 2.1(2) | — | Asset Purchase Agreement by and between VA Software Corporation and CollabNet, Inc., dated April 24, 2007 |
| | | |
| 2.2 (5) | | Asset Purchase Agreement between Geeknet, Inc., Dice Holdings, Inc., Dice Career Solutions, Inc, and eFinancialCareers Limited dated September 17, 2012 (incorporated by reference from Exhibit 2.1 of Registrant's Current Report on From 8-K filed on September 18, 2012). |
| | | |
| 3.1(3) | — | Restated Certificate of Incorporation of the Registrant |
| | | |
| 3.2 (4) | — | Amended and Restated Bylaws of the Registrant |
| | | |
| 4.1(1) | — | Specimen Common Stock Certificate |
| | | |
| 10.1(1) ‡ | — | Form of Indemnification Agreement between the Registrant and each of its directors and officers |
| | | |
| 10.2(1) ‡ | — | 1998 Stock Plan and forms of agreement thereunder |
| | | |
| 10.4(1) ‡ | — | 1999 Director Option Plan |
| | | |
| 10.14(6) ‡ | — | 2007 Equity Incentive Plan |
| | | |
| 10.15(7) ‡ | — | 2007 Equity Incentive Plan Award Agreements |
| | | |
| 10.23(8) ‡ | — | Employment Agreement, effective as of December 16, 2010, by and between the Company and Kathryn McCarthy |
| | | |
| 10.24(9) | — | Office Lease Agreement between PS Business Parks, L.P. and ThinkGeek, Inc., dated June 26, 2009 |
| | | |
| 10.25(10) ‡ | — | Restricted Stock Award Agreement between the Registrant and Kathryn McCarthy, dated December 30, 2010 |
| 10.26 (11) | — | Employment Agreement, dated September 6, 2011, by and between the Company and Colon Washburn |
| | | |
| 10.27 (12) | — | Separation Agreement and Release, dated September 7, 2011, by and between the Company and Caroline Offutt |
| | | |
| 10.28 (13) | — | Amendments to the 2007 Equity Incentive Plan, dated May 16, 2012 |
| | | |
| 10.29 (14) | — | 2012 Employee Stock Purchase Plan, dated May 16, 2012 |
| | | |
| 10.30 (15) | | Amendment to Employment Agreement, between Geeknet, Inc. and Jeffrey Drobick, dated May 14, 2012 |
| | | |
| 10.31 (16) | | Retention Letter Agreement between Geeknet, Inc. and Jeffrey Drobick, dated May 14, 2012 |
| | | |
| 10.32 (17) | | Separation Agreement by and between Colon Washburn and Geeknet, Inc. dated August 20, 2012. |
| | | |
| 21 | | List of Subsidiaries |
| | | |
| 23.1 | — | Consent of KPMG LLP, Independent Registered Public Accounting Firm |
| | | |
| 24.1 | — | Power of Attorney (see signature page) |
| | | |
| 31.1 | — | Certification of Chief Executive Officer Pursuant to Section 302 of The Sarbanes-Oxley Act Of 2002 |
| | | |
| 31.2 | — | Certification of Chief Financial Officer Pursuant to Section 302 of The Sarbanes-Oxley Act Of 2002 |
| | | |
| 32.1 | — | Certification of Chief Executive Officer Pursuant to Section 906 of The Sarbanes-Oxley Act Of 2002 |
| | | |
| 32.2 | — | Certification of Chief Financial Officer Pursuant to Section 906 of The Sarbanes-Oxley Act Of 2002 |
|
| | |
| 101.INS | | XBRL Instance Document |
| | | |
| 101.SCH | | XBRL Taxonomy Extension Schema Document |
| | | |
| 101.CAL | | XBRL Taxonomy Extension Calculation Linkbase Document |
| | | |
| 101.DEF | | XBRL Taxonomy Extension Definition Linkbase Document |
| | | |
| 101.LAB | | XBRL Taxonomy Extension Label Linkbase Document |
| | | |
| 101.PRE | | XBRL Taxonomy Extension Presentation Linkbase Document |
_______________________
‡ Denotes a management contract or compensatory plan or arrangement.
| |
| (1) | Incorporated by reference to the corresponding exhibit of Registrant’s form S-1 and the amendment thereto (Commission registration no. 333-88687). |
| |
| (2) | Incorporated by reference from Exhibit 2.1 of Registrant's Current Report on Form 8-K filed on April 25, 2007. |
| |
| (3) | Incorporated by reference from Exhibit 3.1 of Registrant’s Current Report on Form 8-K filed on August 12, 2011 (Commission file number 000-28369). |
| |
| (4) | Incorporated by reference from Exhibit 3.2 of Registrant’s Current Report on Form 8-K filed on August 12, 2011 (Commission file number 000-28369). |
| |
| (5) | Incorporated by reference from Exhibit 2.1 of Registrant's Current Report on From 8-K filed on September 18, 2012 (Commission file number 000-28369). |
| |
| (6) | Incorporated by reference from Appendix A of Registrant’s Definitive Proxy Statement on Schedule 14A filed on November 1, 2007 (Commission file number 000-28369). |
| |
| (7) | Incorporated by reference from Exhibits 10.1 through 10.4 of Registrant’s Current Report on Form 8-K filed on December 31, 2007. |
| |
| (8) | Incorporated by reference from Exhibit 10.1 of Registrant’s Current Report on Form 8-K filed on December 20, 2010 (Commission file number 000-28369). |
| |
| (9) | Incorporated by reference from Exhibit 10.23 of Registrant’s Annual Report on Form 10-K filed on February 26, 2010 (Commission file number 000-28369). |
| |
| (10) | Incorporated by reference from Exhibit 4.1 of Registrant’s Registration Statement on Form S-8 filed on January 3, 2011 (Commission file number 333-171522). |
| |
| (11) | Incorporated by reference from Exhibit 10.2 of the Registrant's Current Report on Form 8-K filed September 8, 2011 (Commission file number 000-28369). |
| |
| (12) | Incorporated by reference from Exhibit 10.1 of the Registrant's Current Report on Form 8-K filed September 8, 2011 |
| |
| (13) | Incorporated by reference from Appendix I of Registrant’s Definitive Proxy Statement on Schedule 14A filed on March 30, 2012 (Commission file number 000-28369). |
| |
| (14) | Incorporated by reference from Appendix I of Registrant’s Definitive Proxy Statement on Schedule 14A filed on March 30, 2012 (Commission file number 000-28369). |
| |
| (15) | Incorporated by reference from Appendix II of Registrant’s Definitive Proxy Statement on Schedule 14A filed on March 30, 2012 (Commission file number 000-28369). |
| |
| (16) | Incorporated by reference from Exhibit 10.1 of the Registrant's Current Report on Form 8-K filed May 14, 2012 (Commission file number 000-28369). |
| |
| (17) | Incorporated by reference from Exhibit 10.1 of the Registrant's Quarterly Report on Form 10-Q filed November 8, 2012 (Commission file number 000-28369). |