UNITED STATES
SECURITIES AND EXCHANGE COMMISSION
Washington, D.C. 20549
FORM N-CSR
CERTIFIED SHAREHOLDER REPORT OF REGISTERED MANAGEMENT
INVESTMENT COMPANIES
| | | | | | |
| | Investment Company Act file number | | 811-09607 | | |
| | Fairholme Funds, Inc. | | |
| | (Exact name of registrant as specified in charter) | | |
| | 4400 Biscayne Blvd., 9th Floor | | |
| | Miami, FL 33137 | | |
| | (Address of principal executive offices) (Zip code) | | |
| | Bruce R. Berkowitz | | |
| | 4400 Biscayne Blvd., 9th Floor | | |
| | Miami, FL 33137 | | |
| | (Name and address of agent for service) | | |
| | registrant’s telephone number, including area code: 1-866-202-2263 | | |
| | Date of fiscal year end: November 30 | | |
| | Date of reporting period: November 30, 2015 | | |
Form N-CSR is to be used by management investment companies to file reports with the Commission not later than 10 days after the transmission to stockholders of any report that is required to be transmitted to stockholders under Rule 30e-1 under the Investment Company Act of 1940 (17 CFR 270.30e-1). The Commission may use the information provided on Form N-CSR in its regulatory, disclosure review, inspection, and policymaking roles.
A registrant is required to disclose the information specified by Form N-CSR, and the Commission will make this information public. A registrant is not required to respond to the collection of information contained in Form N-CSR unless the Form displays a currently valid Office of Management and Budget (“OMB”) control number. Please direct comments concerning the accuracy of the information collection burden estimate and any suggestions for reducing the burden to Secretary, Securities and Exchange Commission, 100 F Street, NE, Washington, DC 20549. The OMB has reviewed this collection of information under the clearance requirements of 44 U.S.C. § 3507.
Item 1. Reports to Stockholders.
The Reports to Shareholders of each Fund are attached herewith.


“(E)ven the intelligent investor is likely to need considerable
willpower to keep from following the crowd.”
Benjamin Graham
This page is not part of The Fairholme Fund 2015 Annual Report

PORTFOLIO MANAGER’S REPORT
THE FAIRHOLME FUND
JANUARY 2016
This page is not part of The Fairholme Fund 2015 Annual Report
FAIRHOLME CAPITAL MANAGEMENT, L.L.C.
PORTFOLIO MANAGER’S REPORT
For the Year Ended December 31, 2015
Mutual fund investing involves risks, including loss of principal. The charts below cover the period from inception of The Fairholme Fund (December 29, 1999) to December 31, 2015. Unless otherwise specified, all holdings information is shown as of December 31, 2015. Past performance information quoted below does not guarantee future results. The investment return and principal value of an investment in The Fairholme Fund will fluctuate so that an investor’s shares, when redeemed, may be worth more or less than their original cost. Current performance may be lower or higher than the performance information quoted below. Performance figures are after expenses and assume reinvestment of dividends and capital gains but do not reflect a 2.00% redemption fee on shares redeemed within 60 days of purchase. Most recent month-end performance and answers to any questions you may have can be obtained by calling Shareholder Services at 1.866.202.2263. The Fairholme Fund maintains a focused portfolio of investments in a limited number of issuers and does not seek to diversify its investments. This exposes The Fairholme Fund to the risk of unanticipated industry conditions and risks particular to a single company or the securities of a single company. The S&P 500 Index is a broad-based measurement of changes in the stock market, is used for comparative purposes only, and is not meant to be indicative of The Fairholme Fund’s performance, asset composition, or volatility. The Fairholme Fund’s performance may differ markedly from the performance of the S&P 500 Index in either up or down market trends. The performance of the S&P 500 Index is shown with all dividends reinvested and does not reflect any reduction in performance for the effects of transaction costs or management fees. Investors cannot invest directly in an index. The Fairholme Fund’s total expense ratio reflected in its prospectus dated March 27, 2015, was 1.06%, which included acquired fund fees and expenses that were incurred indirectly by The Fairholme Fund as a result of investments in securities issued by one or more investment companies.
January 28, 2016
The Fairholme Fund vs. The S&P 500 Index
| | | | | | | | |
TOTAL ANNUAL RETURN | |
| | |
Year | | | The Fairholme Fund | | | | The S&P 500 Index | |
| | |
2000 | | | 46.5% | | | | (9.1)% | |
| | |
2001 | | | 6.2% | | | | (11.9)% | |
| | |
2002 | | | (1.6)% | | | | (22.1)% | |
| | |
2003 | | | 24.0% | | | | 28.7% | |
| | |
2004 | | | 24.9% | | | | 10.9% | |
| | |
2005 | | | 13.7% | | | | 4.9% | |
| | |
2006 | | | 16.7% | | | | 15.8% | |
| | |
2007 | | | 12.4% | | | | 5.5% | |
| | |
2008 | | | (29.7)% | | | | (37.0)% | |
| | |
2009 | | | 39.0% | | | | 26.5% | |
| | |
2010 | | | 25.5% | | | | 15.1% | |
| | |
2011 | | | (32.4)% | | | | 2.1% | |
| | |
2012 | | | 35.8% | | | | 16.0% | |
| | |
2013 | | | 35.5% | | | | 32.4% | |
| | |
2014 | | | (2.7)% | | | | 13.7% | |
| | |
2015 | | | (11.5)% | | | | 1.4% | |
| | |
Compounded Annual Gain | | | 10.2% | | | | 4.1% | |
Overall Gain | | | 374.4% | | | | 89.8% | |
This page is not part of The Fairholme Fund 2015 Annual Report.
i
To the Shareholders and Directors of The Fairholme Fund:
The Fairholme Fund (the “Fund” or “FAIRX”) decreased 11.48% versus a 1.38% gain for the S&P 500 Index (the “S&P 500”) in 2015. The following table compares the Fund’s unaudited performance (after expenses) with that of the S&P 500, with dividends and distributions reinvested, for various periods ending December 31, 2015.
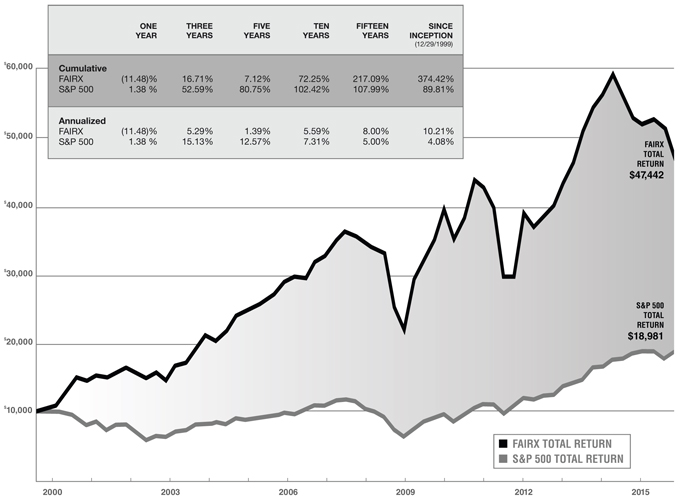
The value of a $10,000 investment in the Fund at its inception was worth $47,442 (assumes reinvestment of distributions into additional Fund shares) compared to $18,981 for the S&P 500 at year-end. Of the $47,442, the value of distributions reinvested was $28,942. It is clear a reinvestment strategy is rewarding.
Recent times have not been easy for all of us Fund shareholders. My three decades of experience dictates that the seeds of great performance are planted during the toughest of times. Above-average returns only seem painless in hindsight. After all, if it were easy, everyone would do it.
Fairholme remains focused on buying and holding securities characterized by large differences between our assessment of intrinsic value and their market price. Paying a cheap price relative to intrinsic value has determined much of Fairholme’s performance success and helps protect against less-than-perfect future outcomes. Security prices and estimates of intrinsic value widen during bouts of market irrationality or times of crisis, but they usually converge. We try to take advantage of these bargains by buying securities of businesses with fixable problems trading at distressed prices. We only buy when the facts tell us to be greedy, especially when others are fearful. While holding our investments, we may appear wrong for extended periods, and in some instances, it can take years for a position to become an overnight success. We believe that point is near and maintain our strong conviction that the Fund’s current securities are worth multiples of today’s prices.
Historically, large and liquid markets have allowed the Fund to focus on a few, best ideas. Times have changed. Over the course of the year, the Fund reduced positions that appreciated and initiated investments in several new opportunities. Going forward, if markets remain less liquid, we will become less concentrated than in the past. Cash and equivalents now exceeding 20% of net assets provide ample dry powder.
American International Group
Fund shareholders have realized over $2 billion in gains from our investment in American International Group (“AIG”) common stock. Today, our remaining AIG stake is composed of double-ratchet, long-dated warrants (14.2% of Fund assets) received in connection with AIG’s 2011 recapitalization. These warrants are our largest position for three reasons: (i) AIG’s common shares continue to trade at a meaningful discount to the company’s tangible book value of nearly $80 per share; (ii) AIG has the potential to materially improve the cost structure of its property and casualty business, as its expense ratio remains higher than its peer group average; and (iii) future dividend increases and capital distributions will improve the conversion ratio and exercise price of the warrants until their 2021 expiry.
This page is not part of The Fairholme Fund 2015 Annual Report.
ii
Sears Holdings Corporation
Sears Holdings Corporation (“Sears”) common stock, warrants, and bonds comprise 13.2% of Fund assets. Our ongoing valuation work reinforces our longstanding belief that Sears is worth multiples of its current market price (as evidenced in the chart below), largely based on its vast real estate empire and disparate businesses configured to sell, deliver, connect, control, service, and replace all manner of consumer products. Throughout the year, the Fund took advantage of price declines to increase its stake.
| | | | | | | | |
Estimated Net Asset Value of Sears Holdings Corporation* | | | $Millions | | | | Per Share | |
| | |
Real Estate | | | $15,772 | | | | $123 | |
Kenmore, Craftsman, DieHard, Home Services | | | $5,150 | | | | $40 | |
Net Inventory, Cash, and Accounts Receivable | | | $4,682 | | | | $37 | |
Other Assets | | | $2,400 | | | | $19 | |
Total Assets | | | $28,004 | | | | $219 | |
Total Liabilities | | | ($9,168 | ) | | | ($72 | ) |
Net Asset Value | | | $18,836 | | | | $147 | |
*Estimate based on data as of Q3 2015.
Last year’s sale of 266 properties for $3.1 billion unlocked one-fourth of the company’s real estate square footage. The properties included in the transaction were not exclusively the crème de la crème of the company’s real estate portfolio as many have falsely asserted. Instead, the quality of the properties included in the transaction closely mirrors the approximately 170 million square feet of real estate retained by Sears today as depicted in the following chart.
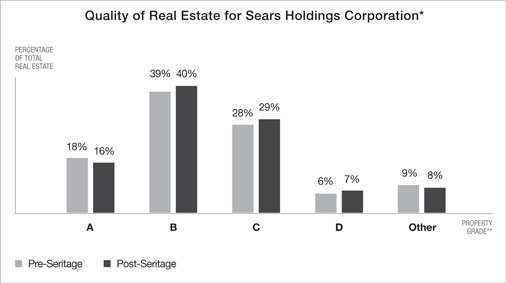
*Proprietary assessment based on publicly available information.
**Property Grades are derived from a proprietary research methodology developed by Fairholme Capital Management, LLC, corroborated by independent real estate professionals. The methodology utilizes key indicators of property and location value including revenue per square foot, local population and median household income demographics, presence of strategic tenants, and other measures. Grade A properties consistently ranked highest in most categories, Grade B properties predominantly scored higher than average in most categories, Grade C properties scored lower than average in most categories, and Grade D properties consistently ranked lowest in most categories. Other properties include freestanding Sears locations and unrated properties.
Proceeds from the sale were used to reduce corporate debt by $936 million, and the company must now accelerate its return to profitability in order to rebuild confidence with customers, creditors, vendors, employees, and other investors. Doing so should enable Sears to optimize the value of all its assets.
Seritage Growth Properties
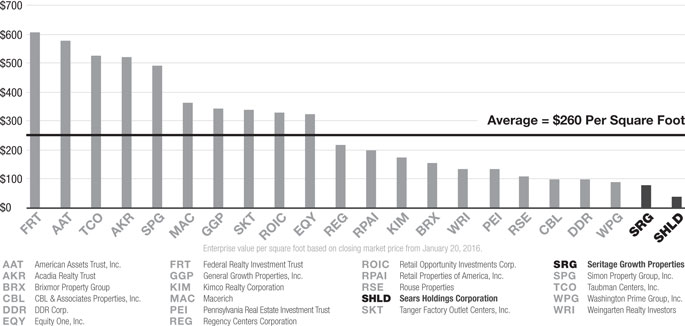
Seritage Growth Properties (“Seritage”), a newly formed public real estate investment trust (REIT) that purchased the aforementioned 266 properties from Sears in mid-2015, comprises 2.5% of Fund assets. Our detailed property-by-property analysis, which has been independently corroborated by third party real estate professionals, indicates that Seritage is significantly undervalued at current market prices. One can only speculate that Warren Buffett concurs with our assessment given his recent decision to personally acquire shares. Seritage’s real estate portfolio, which includes 235 properties and joint venture interests in 31 additional properties, has the opportunity to command significantly higher rents. Seritage appears to have the largest development backlog of any national REIT, and will be able to develop more rentable space over time without a need for further acquisitions. Commentary from the company’s joint venture partners – General Growth Properties, Macerich, and Simon Properties – about ongoing and future projects across the country only serves to reinforce our conclusions. As shown in the following chart, Seritage and Sears have two of the lowest priced real estate portfolios in the United States.
This page is not part of The Fairholme Fund 2015 Annual Report.
iii
ENTERPRISE VALUE PER SQUARE FOOT
Fannie Mae and Freddie Mac
In 1986, famed Magellan Fund manager Peter Lynch touted Fannie Mae as “the best business, literally, in America.” At that time, Fannie Mae had a price-to-earnings ratio of one. Lynch noted that “when a company can earn back the price of its stock in one year, you’ve found a good deal.” Thirty years later, the price-to-earnings ratio of Fannie Mae is back at one – but the circumstances are quite different. In our view, current prices of Fannie Mae as well as its smaller cousin Freddie Mac do not reflect the economic value of existing assets, let alone future earnings power, embedded in these world-class franchises. Indeed, the companies are not priced for a run-off of their existing businesses; they are priced for the permanent expropriation of all assets.
Fannie Mae and Freddie Mac represent 16.4% of Fund assets, primarily in the form of preferred stock. For those unfamiliar, Fannie Mae and Freddie Mac are simple and straightforward insurance companies. They are not banks. There isn’t a local Fannie Mae or Freddie Mac branch on the street corner. Unlike the big banks, Fannie Mae and Freddie Mac did not commit any consumer fraud in the run-up to the financial crisis. The two do not originate mortgages and they do not deal directly with individual homeowners. However, when it comes to funding our nation’s housing market, Fannie Mae and Freddie Mac are mission critical. The companies have helped tens of millions of American families buy, rent, or refinance a home even during the toughest economic times when banks and other lenders shun mortgage risk. Bottom line: Fannie Mae and Freddie Mac are the housing finance system in America, and earn a nominal amount (less than 40 basis points) for ensuring that the venerable 30-year fixed-rate mortgage remains widely accessible and affordable.
During the 2008 financial crisis, Fannie Mae and Freddie Mac helped save America’s home mortgage system and resuscitated our national economy by continuing to provide liquidity when credit and insurance markets froze solid. According to a comprehensive analysis by Thomas Ferguson and Robert Johnson published in the International Journal of Political Economy, federal regulators explicitly directed Fannie Mae and Freddie Mac to initiate massive purchases of “home mortgages and mortgage bonds to stem declines in those markets and alleviate pressures on the balance sheets of private firms,” particularly “overburdened banks.” Then in 2012, Treasury’s decision to usurp all of the profits from each company in perpetuity (the so-called “Net Worth Sweep”) improved the federal budget deficit in an election year and avoided protracted debt ceiling negotiations with Congressional Republicans.
Roger Parloff’s recent Fortune magazine piece – “How Uncle Sam Nationalized Two Fortune 50 Companies” – details the de facto nationalization of Fannie Mae and Freddie Mac by the federal government and the determined effort by a handful of bureaucrats to hide the truth from the public:
For reasons that remain shrouded in secrecy to this day, the Treasury Department and the companies’ conservator, the Federal Housing Finance Agency (FHFA) – two arms of the same government – agreed to radically change the terms of what the GSEs would owe in exchange for the moneys they had already received. Instead of a 10% annual dividend on all the bailout funds drawn … the dividend was now to be set at 100% of each GSE’s net worth. One hundred percent. That is to say, any and all profit they posted. And this would be so in perpetuity … The two firms, on their way back to health, were effectively nationalized. The sudden change was called the “third amendment,” an innocuous-sounding designation that belies its momentous consequences … If this strikes you as, well, un-American, you’re not alone … The government’s alleged nationalization of two enormous corporations raises potentially landmark constitutional issues – comparable to President Harry Truman’s attempt to nationalize steel mills during the Korean War … Seven years into their conservatorship, the GSEs remain adrift, with shrinking capital reserves and no exit plan—a dormant, festering crisis … Documents and depositions from officials at Treasury and FHFA, obtained in discovery in a suit brought by Fairholme Funds, show that the government’s story is “highly misleading” in some respects and “outright false” in others, plaintiffs lawyers allege in court briefs … The lawyers can’t tell the media (or even their clients) specifically what the documents and depositions show, however. That’s because Court of Federal Claims Judge Margaret Sweeney has ordered those materials sealed from public view, at the government’s behest. Bewilderingly, the Justice Department has persuaded her that disclosure of that information—concerning a now three- to eight-year-old decision-making process of tremendous public interest—might cause “dire harm” and “place this nation’s financial markets in jeopardy”… The spectacle of a conservator wiping out shareholders just as the companies he’s supervising are about to have their best years in history simply doesn’t smell right. It’s hard to picture the Supreme Court letting it stand.
This page is not part of The Fairholme Fund 2015 Annual Report.
iv
The market gyrations experienced during 2015 do not reflect our progress in halting Treasury’s unlawful taking of Fannie Mae’s and Freddie Mac’s assets. Indeed, newly discovered evidence – which shows the government’s defense to be outright false – was subsequently presented to the D.C. Circuit Court (under seal as required), and plaintiffs in other cases from the Northern District of Iowa to the Eastern District of Kentucky have now obtained these documents as well. We remain confident that Treasury’s deliberate effort to realign the equity of each company and allocate all profits to itself in perpetuity is strictly prohibited by federal and state law, and anticipate that several of these cases will be adjudicated this year.
Today, taxpayers own 79.9% of Fannie Mae and Freddie Mac. In this respect, taxpayers are fully aligned with private shareholders of these extremely valuable companies. In our view, anyone claiming that shareholders are seeking remuneration at “taxpayer expense” is peddling fiction. Only the disingenuous would assert that recapitalization of these companies would take decades and come at taxpayer expense, as if retaining earnings precluded the ability of each company to raise equity from private investors. Only those beholden to special interests would ignore the substantial reforms implemented at Fannie Mae and Freddie Mac over the last eight years and pretend that the companies are somehow doomed to repeat the past upon release from conservatorship. Only those who oppose the dream of American homeownership would attempt to dismantle President Franklin Roosevelt’s New Deal by eliminating two publicly traded, shareholder-owned companies that have single-handedly provided $7 trillion dollars – yes, trillion – in liquidity to support America’s mortgage market since 2009.
Shareholders simply request that the Treasury Department respect the capital structure of each company, respect the economic bundle of rights associated with our securities, and respect the law setting forth the rules of a conservatorship as decreed by Congress. The economist Herbert Stein once famously said: “If something cannot go on forever, it will stop.” Sooner rather than later, we believe the Net Worth Sweep will be halted and a common sense solution will prevail: Fannie Mae and Freddie Mac will transform into low-risk, public utilities with regulated rates of return, just like your local electric company.
The St. Joe Company
The St. Joe Company (“St. Joe”) comprises 12.8% of Fund assets. Today, St. Joe stands well capitalized and focused on future developments in Florida’s Bay and Walton Counties. The company is entitled to develop 170,000 residential units and 22 million square feet of retail, commercial, and industrial facilities on 110,500 acres of nearly contiguous land on the “Emerald Coast.” We believe that the intrinsic value of St. Joe’s current entitlements and other assets is substantially higher than its recent market price, and were pleased that the company repurchased almost 17 million shares of its common stock (over 18% of the outstanding public float) at $18 per share in 2015.
Imperial Metals Corporation
Imperial Metals Corporation (“Imperial”) common shares and senior unsecured notes due 2019 comprise 5.4% of Fund assets. We first bought Imperial after observing Murray Edwards develop Canadian Natural Resources Limited – particularly its massive Horizon oil sands project – into a world-class energy producer. We believe that Imperial’s Red Chris mine is a replay of low-cost Horizon, but with one of the largest copper resources and the seventh largest gold deposit in the world. Imperial posted record production results in 2015, and we expect the company to weather the current commodity cycle while preparing for the next upswing.
Oil and Natural Gas Related Companies
A shale fracking revolution allows America to be an energy exporter. Supply increases have led to an oil and gas price collapse. Energy companies now sell for huge discounts from historic values, and related service businesses are trading at record lows as well. When the Fund last purchased large amounts of securities in the energy sector, no one thought that the world would function if oil exceeded $40 per barrel. We sold our positions when oil eclipsed $100 per barrel and few thought a return to $80 possible. Now, experts believe a price of $10 is possible and $50 per barrel a long way off. We again disagree. Prices cannot stay below marginal costs when demand grows and supply depletes – at least, not for too long.
In the immortal words of Yogi Berra, “It’s déjà vu all over again.” Common shares of MRC Global and NOW Inc. comprise 4.8% of Fund assets. Both companies operate in the supply chain and inventory management industry, and should be among the first to experience a rebound with higher oil and gas prices. Ultimately, MRC and NOW should consider a merger in order to create huge efficiencies and maximize value for all shareholders.
We are pleased to invite shareholders to join us for a public conference call in the near future, during which I will discuss the Fund’s investments and address your questions. Details will be made available on www.fairholmefunds.com in the coming weeks, along with additional updated information on our investments.
Respectfully submitted,

Bruce R. Berkowitz
Chief Investment Officer
Fairholme Capital Management
The Portfolio Manager’s Report is not part of The Fairholme Fund’s Annual Report due to forward-looking statements that, by their nature, cannot be attested to, as required by regulation. The Portfolio Manager’s Report is based on calendar-year performance. A more formal Management Discussion and Analysis is included in the Annual Report. Opinions of the Portfolio Manager are intended as such, and not as statements of fact requiring attestation.
This page is not part of The Fairholme Fund 2015 Annual Report.
v

The Fairholme Fund (FAIRX)
Seeking long-term growth of capital
Annual Report 2015
Managed by Fairholme Capital Management
1.866.202.2263 • fairholmefunds.com
THE FAIRHOLME FUND
TABLE OF CONTENTS
November 30, 2015
2
THE FAIRHOLME FUND
FUND PERFORMANCE (unaudited)
November 30, 2005 — November 30, 2015
THE FAIRHOLME FUND vs. THE S&P 500 INDEX
INITIAL INVESTMENTOF $10,000
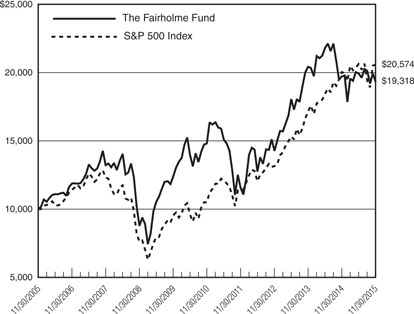
The Fairholme Fund (the “Fund”) commenced operations on December 29, 1999. The chart above presents the performance of a $10,000 investment for up to ten years to the latest fiscal year ending November 30, 2015.
The following notes pertain to the chart above as well as to the performance table included in the Management Discussion & Analysis Report. Performance information in this report represents past performance and is not a guarantee of future results. The investment return and principal value of an investment in the Fund will fluctuate, so that an investor’s shares when redeemed may be worth more or less than their original cost. Current performance may be lower or higher than the performance quoted within. The performance information does not reflect the taxes an investor would pay on Fund distributions or upon redemption of Fund shares. Most recent month-end performance and answers to any questions you may have can be obtained by calling Shareholder Services at 1-866-202-2263.
Data for both the S&P 500 Index and the Fund are presented assuming all dividends and distributions have been reinvested and do not reflect any taxes that might have been incurred by a shareholder as a result of the Fund distributions. The S&P 500 Index is a widely recognized, unmanaged index of 500 of the largest companies in the United States as measured by market capitalization and does not reflect any investment management fees or transaction expenses, nor the effects of taxes, fees or other charges.
3
THE FAIRHOLME FUND
MANAGEMENT DISCUSSION & ANALYSIS
For the Fiscal Year Ended November 30, 2015
The Fairholme Fund (the “Fund”) shares outstanding and audited net asset value per share (“NAV”) at November 30, 2015, the end of the Fund’s fiscal year, and per share NAVs at other pertinent dates, were as follows:
| | | | | | | | |
| | | 11/30/2015 Shares Outstanding | | 11/30/2015
NAV
(audited) | | 05/31/2015
NAV
(unaudited) | | 11/30/2014
NAV
(audited) |
| | 134,704,321 | | $34.24 | | $35.33 | | $37.96 |
At December 31, 2015, the unaudited per share NAV of the Fund was $18.50. Performance figures below are shown for the Fund’s fiscal year ended November 30, 2015, and do not match calendar year figures for the period ended December 31, 2015, cited in the Portfolio Manager’s report.
| | | | | | | | | | | | | | | | | | | | | | | | |
Fund Performance to 11/30/2015 | | Six
Months | | | One
Year | | | Five
Years | | | Ten
Years | | | Fifteen
Years | | | Since
Inception
12/29/1999 | |
| | | | | | |
Cumulative: | | | | | | | | | | | | | | | | | | | | | | | | |
Fund | | | (3.09)% | | | | (1.95)% | | | | 30.43% | | | | 93.18% | | | | 286.07% | | | | 423.12% | |
S&P 500 | | | (0.21)% | | | | 2.75% | | | | 95.92% | | | | 105.74% | | | | 112.36% | | | | 92.85% | |
| | | | | | |
Annualized: | | | | | | | | | | | | | | | | | | | | | | | | |
Fund | | | | | | | (1.95)% | | | | 5.46% | | | | 6.81% | | | | 9.42% | | | | 10.95% | |
S&P 500 | | | | | | | 2.75% | | | | 14.40% | | | | 7.48% | | | | 5.15% | | | | 4.21% | |
For the six months ended November 30, 2015, the Fund was outperformed by the S&P 500 Index (“S&P 500”) by 2.88 percentage points while over the last year the Fund was outperformed by the S&P 500 by 4.70 percentage points. From inception, the Fund outperformed the S&P 500 by 6.74 percentage points per annum or, on a cumulative basis, 330.27 percentage points over fifteen years and eleven months.
Fairholme Capital Management, L.L.C. (the “Manager”) believes performance over shorter periods is likely to be less meaningful than performance over longer periods. Investors are cautioned not to rely on short-term results. The fact that securities increase or decline in value does not always indicate that the Manager believes these securities to be more or less attractive — in fact, the Manager believes that some price increases present selling opportunities and some price declines present buying opportunities.
Further, shareholders should note that the S&P 500 is an unmanaged index incurring no fees, expenses, or tax effects and is shown solely to compare Fund performance to that of an unmanaged and diversified index of U.S. publicly traded corporation common stock.
Shareholders are also cautioned that it is possible that some securities mentioned in this discussion may no longer be held by the Fund subsequent to the end of the fiscal period and that the Fund may have made significant new purchases that are not yet required to be disclosed. It is the Fund’s general policy not to disclose portfolio holdings other than when required by relevant law or regulation. Portfolio holdings are subject to change without notice.
Not all Fund portfolio dispositions or additions are material, and, while the Fund and the Manager have long-term objectives, it is possible that a security sold or purchased in one period will be purchased or sold in a subsequent period. Generally, the Manager determines to buy and sell based on its estimates of the absolute and relative intrinsic values and fundamental dynamics of a particular security and its issuer and its industry. However, certain strategies of the Manager in carrying out Fund policies may result in shorter holding periods.
The Manager invests Fund assets in securities to the extent it finds reasonable investment opportunities in accordance with its Prospectus and may invest a significant portion of Fund assets in liquid, low-risk securities or cash. The Manager views liquidity as a strategic advantage. At November 30, 2015, cash and cash equivalents
4
THE FAIRHOLME FUND
MANAGEMENT DISCUSSION & ANALYSIS (continued)
For the Fiscal Year Ended November 30, 2015
(consisting of cash, commercial paper, deposit accounts, U.S. Treasury Bills, and money-market funds) represented 23.58% of total assets. Since inception, the Fund has held liquid, low-risk securities or cash for periods without negatively influencing performance, although there is no guarantee that future performance will not be negatively affected by Fund liquidity.
The Fund is considered to be “non-diversified” under the Investment Company Act of 1940. The Fund can invest a greater percentage of assets in fewer securities than a diversified fund and may invest a significant portion of cash and liquid assets in one or more higher-risk securities at any time, particularly in situations where markets are weak or a particular security declines sharply. The Fund may also have a greater percentage of assets invested in a particular industry than a diversified fund, exposing the Fund to the risk of an unanticipated industry condition as well as risks specific to a single company or security. For the fiscal year ended November 30, 2015, the Fund investments that performed the best were American International Group, Inc., The St. Joe Co., Canadian Natural Resources Ltd., Citigroup, Inc., NOW, Inc., and MRC Global, Inc. The biggest contributors to negative performance were investments in Sears Holdings Corp., Leucadia National Corp., Seritage Growth Properties, National Oilwell Varco, Inc., and Federal Home Loan Mortgage Corp. The following charts show the top holdings by issuer and sector in descending order of net assets as of November 30, 2015.
| | | | | | | | | | |
The Fairholme Fund Top Holdings by Issuer* (% of Net Assets) | | | | | | The Fairholme Fund Top Sectors (% of Net Assets) | | | | |
American International Group, Inc. | | | 11.8% | | | Cash and Cash Equivalents** | | | 23.8% | |
Sears Holdings Corp. | | | 10.5% | | | Mortgage Finance | | | 15.1% | |
The St. Joe Co. | | | 9.7% | | | Retail Department Stores | | | 12.4% | |
Federal National Mortgage Association | | | 8.0% | | | Multi-Line Insurance | | | 11.8% | |
Federal Home Loan Mortgage Corp. | | | 7.1% | | | Real Estate Management & Development | | | 9.7% | |
Bank of America Corp. | | | 5.5% | | | Diversified Banks | | | 5.5% | |
Canadian Natural Resources Ltd. | | | 4.7% | | | Oil & Natural Gas Exploration | | | 5.3% | |
Imperial Metals Corp. | | | 4.0% | | | Trading Companies & Distributors | | | 4.0% | |
NOW, Inc. | | | 2.5% | | | Metals & Mining | | | 4.0% | |
Leucadia National Corp. | | | 2.0% | | | Diversified Holding Companies | | | 2.0% | |
| | | | | | | | | | | |
| | | | 65.8% | | | | | | 93.6% | |
| | | | | | | | | | | |
| | | | | | | | | | | |
| * | Excludes cash, U.S. Treasury Bills, commercial paper, and money market funds. |
| ** | Includes cash, U.S. Treasury Bills, commercial paper, and money market funds. |
The Manager views the ability to focus on fewer investments than a diversified fund as a strategic advantage. However, such a strategy may negatively influence short-term performance and there is no guarantee that long-term performance will not be negatively affected.
The Fund may invest in non-U.S. securities and securities of corporations domiciled outside of the United States, which may expose the Fund to adverse changes resulting from foreign currency fluctuations or other potential risks as described in the Fund’s Prospectus and Statement of Additional Information.
The Fund’s officers, the Board of Directors (the “Board” or the “Directors”), and the Manager are aware that large cash inflows or outflows may adversely affect Fund performance. Such flows are monitored and appropriate actions are contemplated for when such flows could negatively impact performance.
Since inception, the Fund has been advised by the Manager. Bruce Berkowitz, both the Chief Investment Officer of the Manager and Chairman of the Fund’s Board, continues to have a significant personal stake in the Fund, holding
5
THE FAIRHOLME FUND
MANAGEMENT DISCUSSION & ANALYSIS (continued)
For the Fiscal Year Ended November 30, 2015
an aggregate 3,330,764 shares at November 30, 2015. While there is no requirement that Mr. Berkowitz own shares of the Fund, such holdings are believed to help align the interests of the Manager with the interests of the shareholders.
The Board, including the Independent Directors, continues to believe that it is in the best interests of the Fund to have Mr. Berkowitz serve as Chairman of the Board given: his long-term relative performance; his experience, commitment, and significant personal investment in the Fund; the present constitution of Directors and policies; and current rules and regulations. A Director and Officers of the Fund are also Officers of the Manager. Nevertheless, at November 30, 2015, a majority of Directors were independent of the Manager, no stock option or restricted stock plans exist, Officers received no direct compensation from the Fund, and the Director affiliated with the Manager received no compensation for being a Director.
For more complete information about the Fund, or to obtain a current Prospectus, please visit www.fairholmefunds.com or call Shareholder Services at 1-866-202-2263.
6
THE FAIRHOLME FUND
EXPENSE EXAMPLE
For the Six Month Period from June 1, 2015
through November 30, 2015 (unaudited)
As a Fund shareholder, you incur direct and indirect costs. Direct costs include, but are not limited to, transaction fees at some broker-dealers, custodial fees for retirement accounts, redemption fees on Fund shares redeemed within 60 days of purchase, and wire transfer fees. You also incur indirect, ongoing costs that include, but are not limited to, management fees paid to the Manager.
The following example is intended to help you understand your indirect costs (also referred to as “ongoing costs” and measured in dollars) when investing in the Fund and to compare these costs with the ongoing costs of investing in other mutual funds. This example is based on an investment of $1,000 invested in the Fund at June 1, 2015, and held for the entire six month period ending November 30, 2015.
Actual Expenses
The first line of the table below provides information about actual account values and actual expenses. You may use the information in this line, together with the amount you had invested at the beginning of the period, to estimate the expenses that you paid over the period. Simply divide your account value by $1,000 (for example, an $8,600 account value divided by $1,000 = 8.6), then multiply the result by the number in the first line under the heading “Expenses Paid During the Period” to estimate the expenses you paid on your Fund holdings during this period.
Hypothetical Example for Comparison Purposes
The second line of the table provides information about hypothetical account values and hypothetical expenses based on the Fund’s actual expense ratio and an assumed rate of return of 5% per year before expenses, which is not the Fund’s actual return for the period presented. The hypothetical account values and expenses may not be used to estimate the actual ending account balance or expenses that you paid for the period presented. However, you may use this information to compare ongoing costs of investing in the Fund with the ongoing costs of investing in other funds. To do so, compare this 5% hypothetical example with the 5% examples that appear in the shareholder reports of other funds.
Please note that the column titled “Expenses Paid During the Period” in the table below is meant to highlight your ongoing costs only and do not reflect any transactional costs, such as redemption fees (if any), or other direct costs. Therefore, the second line of the table is useful in comparing ongoing costs only, and will not help you determine the relative total costs of owning different funds. In addition, if these direct costs were included, your total costs would be higher.
| | | | | | | | |
| | | Beginning
Account Value
June 1, 2015 | | Ending
Account Value
November 30, 2015 | | Annualized
Expense
Ratio | | Expenses Paid
During the Period
June 1, 2015
Through
November 30, 2015* |
Fund | | | | | | | | |
Actual | | $1,000.00 | | $ 969.10 | | 1.04% | | $5.13 |
Hypothetical | | | | | | | | |
(5% return before expenses) | | $1,000.00 | | $1,019.85 | | 1.04% | | $5.27 |
| * | Expenses are equal to the Fund’s annualized expense ratio, multiplied by the average account value over the period, multiplied by 183 days/365 days (to reflect the one-half year period). |
7
THE FAIRHOLME FUND
SCHEDULE OF INVESTMENTS
November 30, 2015
| | | | | | | | |
Shares | | | | | Value | |
| | | | DOMESTIC EQUITY SECURITIES — 32.2% | | | | |
| | | | DIVERSIFIED BANKS — 4.9% | | | | |
| | 12,882,215 | | | Bank of America Corp. | | $ | 224,537,008 | |
| | | | | | | | |
| | | | DIVERSIFIED HOLDING COMPANIES — 2.0% | | | | |
| | 5,192,315 | | | Leucadia National Corp. | | | 91,800,129 | |
| | | | | | | | |
| | | | MORTGAGE
FINANCE — 1.8% | | | | |
| | 24,741,100 | | | Federal Home Loan Mortgage Corp. (a) | | | 50,719,255 | |
| | 15,476,100 | | | Federal National Mortgage Association (a) | | | 32,345,049 | |
| | | | | | | | |
| | | | | | | 83,064,304 | |
| | | | | | | | |
| | | | REAL ESTATE INVESTMENT TRUSTS — 1.6% | | | | |
| | 2,084,600 | | | Seritage Growth Properties (a)(b) | | | 76,087,900 | |
| | | | | | | | |
| | | | REAL ESTATE MANAGEMENT & DEVELOPMENT — 9.7% | | | | |
| | 23,136,502 | | | The St. Joe Co. (a)(b)(c) | | | 449,310,869 | |
| | | | | | | | |
| | | | RETAIL DEPARTMENT STORES — 6.9% | | | | |
| | 14,219,873 | | | Sears Holdings Corp. (b) | | | 314,685,789 | |
| | 640,300 | | | Sears Hometown and Outlet Stores, Inc. (a) | | | 5,096,788 | |
| | | | | | | | |
| | | | | | | 319,782,577 | |
| | | | | | | | |
| | | | RETAILER — 1.3% | | | | |
| | 2,415,527 | | | Lands’ End, Inc. (a)(b) | | | 58,069,269 | |
| | | | | | | | |
| | |
| | | | TRADING COMPANIES & DISTRIBUTORS — 4.0% | | | | |
| | 4,720,500 | | | MRC Global, Inc. (a) | | | 69,816,195 | |
| | 6,266,800 | | | NOW, Inc. (a)(b) | | | 115,183,784 | |
| | | | | | | | |
| | | | | | | 184,999,979 | |
| | | | | | | | |
| TOTAL DOMESTIC EQUITY SECURITIES
(COST $2,080,196,703) | | | 1,487,652,035 | |
| | | | | | | | |
| | | | | | | | |
Shares | | | | | Value | |
| | | | FOREIGN EQUITY
SECURITIES —7.3% | | | | |
| | | | CANADA — 7.3% | | | | |
| | | | METALS & MINING — 0.8% | | | | |
| | 7,132,613 | | | Imperial Metals Corp. (a)(b) | | $ | 36,852,766 | |
| | | | | | | | |
| | | | OIL & NATURAL GAS EXPLORATION — 4.7% | | | | |
| | 8,981,900 | | | Canadian Natural Resources Ltd. | | | 217,361,980 | |
| | | | | | | | |
| | | | RETAIL DEPARTMENT
STORES — 1.8% | | | | |
| | 9,685,672 | | | Sears Canada, Inc. (a) (b) | | | 82,134,499 | |
| | | | | | | | |
| TOTAL FOREIGN EQUITY SECURITIES
(COST $350,090,615) | | | 336,349,245 | |
| | | | | | | | |
| | | | DOMESTIC PREFERRED EQUITY
SECURITIES — 13.3% | | | | |
| | | | MORTGAGE FINANCE — 13.3% | | | | |
| | | | Federal Home Loan Mortgage Corp. | | | | |
| | 50,025,248 | | | 7.875%, Series Z (a)(d) | | | 217,109,576 | |
| | 5,750,575 | | | 5.570%, Series V (a) | | | 17,999,300 | |
| | 2,726,100 | | | 6.550%, Series Y (a) | | | 9,813,960 | |
| | 1,614,250 | | | 0.680%, Series M (a)(d) | | | 8,878,375 | |
| | 1,308,929 | | | 0.963%, Series B (a)(d) | | | 7,081,306 | |
| | 1,119,600 | | | 5.100%, Series H (a) | | | 6,717,600 | |
| | 519,142 | | | 1.680%, Series L (a)(d) | | | 2,829,324 | |
| | 450,000 | | | 5.900%, Series U (a) | | | 1,453,500 | |
| | 437,340 | | | 5.660%, Series W (a) | | | 1,924,296 | |
| | 200,000 | | | 5.000%, Series F (a) | | | 1,264,000 | |
| | | | Federal National Mortgage Association | | | | |
| | 57,852,719 | | | 7.750%, Series S (a)(d) | | | 251,659,328 | |
| | 8,049,643 | | | 7.000%, Series O (a)(d) | | | 60,452,819 | |
| | 3,558,097 | | | 4.500%, Series P (a)(d) | | | 12,595,663 | |
| | 1,557,500 | | | 6.750%, Series Q (a) | | | 6,712,825 | |
| | 1,500,000 | | | 7.625%, Series R (a) | | | 5,610,000 | |
| | 256,000 | | | 0.400%, Series G (a)(d) | | | 1,763,840 | |
| | | | | | | | |
| | | | | | | 613,865,712 | |
| | | | | | | | |
| | | | RETAIL DEPARTMENT STORES — 0.0% | |
| | 15,405 | | | Sears Roebuck Acceptance Corp. 7.400% (b) | | | 216,748 | |
| | | | | | | | |
| | | | | | | | |
| TOTAL DOMESTIC PREFERRED
EQUITY SECURITIES
(COST $719,554,484) | | | 614,082,460 | |
| | | | | | | | |
The accompanying notes are an integral part of the financial statements.
8
THE FAIRHOLME FUND
SCHEDULE OF INVESTMENTS (continued)
November 30, 2015
| | | | | | | | |
Shares | | | | | Value | |
| | | | WARRANTS — 12.5% | | | | |
| | | | DIVERSIFIED
BANKS — 0.6% | | | | |
| | 4,750,218 | | | Bank of America Corp., | | | | |
| | | | Vested, Strike Price $13.137, Expire 01/16/2019 (a)(e) | | $ | 29,688,863 | |
| | | | | | | | |
| | | | MULTI-LINE
INSURANCE — 11.8% | | | | |
| | 21,261,817 | | | American International Group, Inc., | | | | |
| | | | Vested, Strike Price $45.00, Expire 01/19/2021 (a)(e) | | | 545,790,842 | |
| | | | | | | | |
| | | | RETAIL DEPARTMENT STORES — 0.1% | | | | |
| | 222,319 | | | Sears Holdings Corp., | | | | |
| | | | Vested, Strike Price $25.686, Expire 12/15/2019 (a)(b)(e) | | | 2,890,147 | |
| | | | | | | | |
| TOTAL WARRANTS
(COST $376,674,508) | | | 578,369,852 | |
| | | | | | | | |
| | | | | | | | |
Principal | | | | | | |
| | | | DOMESTIC CORPORATE BONDS — 4.6% | | | | |
| | | | AEROSPACE &
DEFENSE — 0.1% | | | | |
| | $2,000,000 | | | Bombardier, Inc. | | | | |
| | | | 5.500%, 09/15/2018 (f) | | | 1,890,000 | |
| | | | | | | | |
| | | | OIL & NATURAL GAS EXPLORATION — 0.6% | | | | |
| | 37,863,000 | | | Atwood Oceanics, Inc. | | | | |
| | | | 6.500%, 02/01/2020 | | | 28,586,565 | |
| | | | | | | | |
| | | | OIL DRILLING — 0.1% | | | | |
| | 7,000,000 | | | Transocean, Inc. | | | | |
| | | | 6.875%, 12/15/2021 | | | 5,390,000 | |
| | | | | | | | |
| | | | PHARMACEUTICALS — 0.2% | | | | |
| | 8,000,000 | | | Valeant Pharmaceuticals International, Inc. | | | | |
| | | | 6.750%, 08/15/2018 (f) | | | 7,835,200 | |
| | | | | | | | |
| | | | RETAIL DEPARTMENT STORES — 3.6% | | | | |
| | | | Sears Holdings Corp. | | | | |
| | 22,022,000 | | | 6.625%, 10/15/2018 (b) | | | 21,563,943 | |
| | 143,408,000 | | | 8.000%, 12/15/2019 (b) | | | 139,937,526 | |
| | | | | | | | |
Principal | | | | | Value | |
| | | | DOMESTIC CORPORATE BONDS
(CONTINUED) — 4.6% | | | | |
| | | | RETAIL DEPARTMENT STORES
(CONTINUED) — 3.6% | | | | |
| | | | Sears Roebuck Acceptance Corp. | | | | |
| | $ 823,000 | | | 6.875%, 10/15/2017 (b) | | $ | 786,047 | |
| | 6,886,000 | | | 7.500%, 10/15/2027 (b) | | | 4,964,806 | |
| | | | | | | | |
| | | | | | | 167,252,322 | |
| | | | | | | | |
| TOTAL DOMESTIC CORPORATE BONDS
(COST $217,095,655) | | | 210,954,087 | |
| | | | | | | | |
| | | | FOREIGN CORPORATE BONDS — 3.2% | | | | |
| | | | CANADA — 3.2% | | | | |
| | | | METALS &
MINING — 3.2% | | | | |
| | | | Imperial Metals Corp. | | | | |
| | 156,780,000 | | | 7.000%, 03/15/2019 (b)(f) | | | 147,185,064 | |
| | | | | | | | |
| TOTAL FOREIGN CORPORATE BONDS
(COST $147,738,395) | | | 147,185,064 | |
| | | | | | | | |
| | | | COMMERCIAL
PAPER — 4.8% | | | | |
| | | | ALUMINUM — 1.1% | | | | |
| | 50,000,000 | | | Alcoa, Inc. | | | | |
| | | | 0.550%, 12/07/2015 (g) | | | 49,995,625 | |
| | | | | | | | |
| | | | AUTO
MANUFACTURERS — 1.9% | | | | |
| | | | Ford Motor Credit Co. | | | | |
| | 15,000,000 | | | 0.720%, 12/03/2015 (g) | | | 14,999,437 | |
| | 45,205,000 | | | 0.740%, 12/07/2015 (g) | | | 45,201,045 | |
| | 30,000,000 | | | 0.720%, 12/14/2015 (g) | | | 29,994,750 | |
| | | | | | | | |
| | | | | | | 90,195,232 | |
| | | | | | | | |
| | | | FOOD PRODUCTS — 0.4% | | | | |
| | 20,000,000 | | | ConAgra Foods, Inc. | | | | |
| | | | 0.600%, 12/01/2015 (g) | | | 19,999,761 | |
| | | | | | | | |
| | | | MULTIMEDIA — 0.4% | | | | |
| | 19,150,000 | | | Viacom, Inc. | | | | |
| | | | 0.500%, 12/02/2015 (g) | | | 19,149,734 | |
| | | | | | | | |
| | | | WIRELESS TELECOMMUNICATION SERVICES — 1.0% | | | | |
| | 45,000,000 | | | Bell Canada | | | | |
| | | | 0.420%, 12/01/2015 (g) | | | 44,999,725 | |
| | | | | | | | |
| TOTAL COMMERCIAL PAPER
(COST $224,336,344) | | | 224,340,077 | |
| | | | | | | | |
The accompanying notes are an integral part of the financial statements.
9
THE FAIRHOLME FUND
SCHEDULE OF INVESTMENTS (continued)
November 30, 2015
| | | | | | |
Principal | | | | Value | |
| | U.S. GOVERNMENT OBLIGATIONS — 2.2% | | | | |
| $100,000,000 | | U.S. Treasury Bills
0.099%, 03/17/2016 (g) | | $ | 99,947,200 | |
| | | | | | |
TOTAL U.S. GOVERNMENT
OBLIGATIONS
(COST $99,971,169) | | | 99,947,200 | |
| | | | | | |
| | |
Shares | | | | | |
| | MONEY MARKET
FUNDS — 16.8% | | | | |
| 774,074,868 | | Fidelity Institutional Money
Market Funds - Money
Market Portfolio, 0.160% (h) | | | 774,074,868 | |
| | | | | | |
TOTAL MONEY MARKET FUNDS
(COST $774,074,868) | | | 774,074,868 | |
| | | | | | |
| | MISCELLANEOUS INVESTMENTS — 3.6%(i) | | | | |
(COST $233,170,203) | | | 164,381,585 | |
| | | | | | |
| | | | | | |
| | | | | Value | |
TOTAL INVESTMENTS — 100.5%
(COST $5,222,902,944) | | $ | 4,637,336,473 | |
| | LIABILITIES IN EXCESS
OF OTHER
ASSETS — (0.5)% | | | (24,982,048 | ) |
| | | | | | |
NET ASSETS — 100.0% | | $ | 4,612,354,425 | |
| | | | | | |
| (a) | Non-income producing security. |
| (b) | Affiliated Company. See Note 8. |
| (c) | Restricted and controlled security under procedures approved by the Directors. The value of these securities totals $449,310,869, which represents 9.74% of the Fund’s net assets. Information related to these securities is as follows: |
| | | | | | | | |
Acquisition Shares | | Issuer | | Acquisition Date(s) | | Acquisition Cost | | 11/30/2015 Carrying Value Per Unit |
23,136,502 | | The St. Joe Co. | | 12/12/2007-10/13/2010 | | $607,609,975 | | $19.42 |
| (d) | Variable rate security. Rates shown are the effective rates as of November 30, 2015. |
| (e) | Warrants have terms and conditions based on dividends paid and other events that may lower the strike price and raise the shares per warrant conversion ratio. Reported strike prices and conversion ratios are as of the date of this report. All share-to-warrant conversion ratios are currently 1:1, excluding the Sears Holdings Corp. warrants, which on November 30, 2015 had a conversion ratio of 1:1.11. |
| (f) | Restricted security as defined in Rule 144A/144a under the Securities Act of 1933. The Manager has determined that such security is liquid pursuant to the Fund’s liquidity guidelines. The value of these securities totals $156,910,264, which represents 3.40% of the Fund’s net assets. |
| (g) | Rates shown are the effective yields based on the purchase price. The calculation assumes the security is held to maturity. |
| (h) | Annualized based on the 1-day yield as of November 30, 2015. |
| (i) | Represents previously undisclosed unrestricted securities, which the Fund has held for less than one year. |
The accompanying notes are an integral part of the financial statements.
10
THE FAIRHOLME FUND
STATEMENT OF ASSETS & LIABILITIES
November 30, 2015
| | | | |
Assets | | | | |
Investments, at Fair Value: | | | | |
Unaffiliated Issuers (Cost — $3,006,718,615) | | $ | 3,187,467,316 | |
Affiliated Issuers (Cost — $2,216,184,329) | | | 1,449,869,157 | |
| | | | |
| |
Total Investments, at Fair Value | | | | |
(Cost — $5,222,902,944) | | | 4,637,336,473 | |
Interest Receivable | | | 16,728,055 | |
Receivable for Investments Sold | | | 3,224,284 | |
Receivable for Capital Shares Sold | | | 461,840 | |
| | | | |
| |
Total Assets | | | 4,657,750,652 | |
| | | | |
Liabilities | | | | |
Payable for Capital Shares Redeemed | | | 40,781,377 | |
Accrued Management Fees | | | 3,995,598 | |
Accrued Legal Expenses | | | 619,252 | |
| | | | |
| |
Total Liabilities | | | 45,396,227 | |
| | | | |
| |
NET ASSETS | | $ | 4,612,354,425 | |
| | | | |
Net Assets Consist of: | | | | |
Paid-In Capital | | $ | 3,634,284,243 | |
Undistributed Net Investment Income | | | 73,575,252 | |
Accumulated Net Realized Gain on Investments and | | | | |
Foreign Currency Related Transactions | | | 1,490,061,401 | |
Net Unrealized Depreciation on Investments and | | | | |
Foreign Currency Related Translations | | | (585,566,471 | ) |
| | | | |
NET ASSETS | | $ | 4,612,354,425 | |
| | | | |
Shares of Common Stock Outstanding* ($0.0001 par value) | | | 134,704,321 | |
| | | | |
Net Asset Value, Offering and Redemption Price Per Share
($4,612,354,425 / 134,704,321 shares) | | $ | 34.24 | |
| | | | |
| * | 700,000,000 shares authorized in total. |
The accompanying notes are an integral part of the financial statements.
11
THE FAIRHOLME FUND
STATEMENT OF OPERATIONS
| | | | |
| | | For the
Fiscal Year Ended
November 30, 2015 | |
Investment Income | | | | |
Dividends — Unaffiliated Issuers (net of $209,849 in
foreign taxes withheld) | | $ | 29,427,012 | |
Dividends — Affiliated Issuers | | | 82,358,195 | |
Interest — Affiliated Issuers | | | 12,552,342 | |
Interest — Unaffiliated Issuers | | | 7,049,908 | |
| | | | |
| |
Total Investment Income | | | 131,387,457 | |
| | | | |
| |
Expenses | | | | |
Management Fees | | | 55,982,433 | |
Legal Expenses | | | 1,594,600 | |
Registration Fees | | | 235,000 | |
Miscellaneous Expense | | | 14,518 | |
| | | | |
| |
Total Expenses | | | 57,826,551 | |
| | | | |
| |
Net Investment Income | | | 73,560,906 | |
| | | | |
| |
Realized and Unrealized Gain (Loss) on Investments and
Foreign Currency Related Transactions | | | | |
Net Realized Gain on Investments and Foreign Currency | | | | |
Related Transactions | | | | |
Unaffiliated Issuers | | | 1,497,443,687 | |
Affiliated Issuers | | | 2,131,845 | |
| |
Net Change in Unrealized Appreciation (Depreciation) on
Investments and Foreign Currency Related Translations | | | (1,679,802,694 | ) |
| | | | |
| |
Net Realized and Unrealized Gain (Loss) on Investments
and Foreign Currency Related Transactions | | | (180,227,162 | ) |
| | | | |
| |
NET DECREASE IN NET ASSETS FROM OPERATIONS | | $ | (106,666,256 | ) |
| | | | |
The accompanying notes are an integral part of the financial statements.
12
THE FAIRHOLME FUND
STATEMENTS OF CHANGES IN NET ASSETS
| | | | | | | | |
| | | For the Fiscal
Year Ended
November 30, 2015 | | | For the Fiscal
Year Ended
November 30, 2014 | |
CHANGES IN NET ASSETS | | | | | | | | |
From Operations | | | | | | | | |
Net Investment Income (Loss) | | $ | 73,560,906 | | | $ | (39,531,846 | ) |
Net Realized Gain on Investments and Foreign Currency Related Transactions | | | 1,499,575,532 | | | | 594,237,348 | |
Net Change in Unrealized Appreciation (Depreciation) on Investments and Foreign Currency Related Translations | | | (1,679,802,694 | ) | | | (805,928,580 | ) |
| | | | | | | | |
Net Decrease in Net Assets from Operations | | | (106,666,256 | ) | | | (251,223,078 | ) |
| | | | | | | | |
From Dividends and Distributions to Shareholders | | | | | | | | |
Net Realized Capital Gains from Investment Transactions | | | (538,063,047 | ) | | | (690,418,532 | ) |
| | | | | | | | |
Net Decrease in Net Assets from Dividends and Distributions | | | (538,063,047 | ) | | | (690,418,532 | ) |
| | | | | | | | |
From Capital Share Transactions | | | | | | | | |
Proceeds from Sale of Shares | | | 274,869,917 | | | | 553,078,572 | |
Shares Issued in Reinvestment of Dividends and Distributions | | | 475,827,681 | | | | 612,192,862 | |
Redemption Fees | | | 240,567 | | | | 263,247 | |
Cost of Shares Redeemed | | | (2,270,739,382 | ) | | | (2,236,856,973 | ) |
| | | | | | | | |
Net Decrease in Net Assets from Shareholder Activity | | | (1,519,801,217 | ) | | | (1,071,322,292 | ) |
| | | | | | | | |
NET ASSETS | | | | | | | | |
Net Decrease in Net Assets | | | (2,164,530,520 | ) | | | (2,012,963,902 | ) |
Net Assets at Beginning of Year | | | 6,776,884,945 | | | | 8,789,848,847 | |
| | | | | | | | |
Net Assets at End of Year | | $ | 4,612,354,425 | | | $ | 6,776,884,945 | |
| | | | | | | | |
Undistributed Net Investment Income at End of Year | | $ | 73,575,252 | | | $ | — | |
| | | | | | | | |
SHARES TRANSACTIONS | | | | | | | | |
Issued | | | 7,865,752 | | | | 13,903,282 | |
Reinvested | | | 13,456,741 | | | | 15,689,206 | |
Redeemed | | | (65,125,309 | ) | | | (56,657,870 | ) |
| | | | | | | | |
Net Decrease in Shares | | | (43,802,816 | ) | | | (27,065,382 | ) |
Shares Outstanding at Beginning of Year | | | 178,507,137 | | | | 205,572,519 | |
| | | | | | | | |
Shares Outstanding at End of Year | | | 134,704,321 | | | | 178,507,137 | |
| | | | | | | | |
The accompanying notes are an integral part of the financial statements.
13
THE FAIRHOLME FUND
FINANCIAL HIGHLIGHTS
| | | | | | | | | | | | | | | | | | | | |
| | | For the Fiscal Year Ended November 30, | |
| | | 2015 | | | 2014 | | | 2013 | | | 2012 | | | 2011 | |
| PER SHARE OPERATING PERFORMANCE NET ASSET VALUE, BEGINNING OF YEAR | | $ | 37.96 | | | $ | 42.76 | | | $ | 29.89 | | | $ | 25.10 | | | $ | 34.19 | |
| | | | | | | | | | | | | | | | | | | | |
Investment Operations | | | | | | | | | | | | | | | | | | | | |
Net Investment Income (Loss)(1) | | | 0.46 | | | | (0.19 | ) | | | (0.10 | ) | | | 0.15 | | | | (0.07 | ) |
Net Realized and Unrealized Gain (Loss) on Investments | | | (1.10 | ) | | | (1.21 | ) | | | 12.97 | | | | 5.55 | | | | (6.95 | ) |
| | | | | | | | | | | | | | | | | | | | |
Total from Investment Operations | | | (0.64 | ) | | | (1.40 | ) | | | 12.87 | | | | 5.70 | | | | (7.02 | ) |
| | | | | | | | | | | | | | | | | | | | |
Dividends and Distributions | | | | | | | | | | | | | | | | | | | | |
From Net Investment Income | | | — | | | | — | | | | — | | | | (0.70 | ) | | | (0.39 | ) |
From Realized Capital Gains | | | (3.08 | ) | | | (3.40 | ) | | | — | | | | — | | | | (1.69 | ) |
From Return of Capital | | | — | | | | — | | | | — | | | | (0.21 | ) | | | — | |
| | | | | | | | | | | | | | | | | | | | |
Total Dividends and Distributions | | | (3.08 | ) | | | (3.40 | ) | | | — | | | | (0.91 | ) | | | (2.08 | ) |
| | | | | | | | | | | | | | | | | | | | |
Redemption Fees(1) | | | 0.00 | (2) | | | 0.00 | (2) | | | 0.00 | (2) | | | 0.00 | (2) | | | 0.01 | |
| | | | | | | | | | | | | | | | | | | | |
NET ASSET VALUE, END OF YEAR | | $ | 34.24 | | | $ | 37.96 | | | $ | 42.76 | | | $ | 29.89 | | | $ | 25.10 | |
| | | | | | | | | | | | | | | | | | | | |
TOTAL RETURN | | | (1.95 | )% | | | (3.50 | )% | | | 43.06 | % | | | 23.69 | % | | | (22.10 | )% |
Ratio/Supplemental Data | | | | | | | | | | | | | | | | | | | | |
Net Assets, End of Year (in 000’s) | | $ | 4,612,354 | | | $ | 6,776,885 | | | $ | 8,789,849 | | | $ | 6,992,078 | | | $ | 8,015,294 | |
Ratio of Expenses to Average Net Assets | | | 1.03 | %(3) | | | 1.06 | %(4) | | | 1.02 | %(5)(6) | | | 1.00 | % | | | 1.01 | %(7) |
Ratio of Net Investment Income (Loss) to Average Net Assets | | | 1.31 | % | | | (0.48 | )% | | | (0.29 | )% | | | 0.52 | % | | | (0.22 | )% |
Portfolio Turnover Rate | | | 40.46 | % | | | 1.62 | % | | | 15.59 | % | | | 1.57 | % | | | 43.95 | % |
| (1) | Based on average shares outstanding. |
| (2) | Redemption fees represent less than $0.01. |
| (3) | 0.03% is attributable to legal expenses incurred outside of the 1.00% management fee and less than 0.01% is attributable to registration fees and miscellaneous expenses incurred outside of the 1.00% management fee. |
| (4) | 0.04% is attributable to legal expenses incurred outside of the 1.00% management fee and 0.02% is attributable to miscellaneous expenses incurred outside of the 1.00% management fee. |
| (5) | 0.02% is attributable to legal expenses incurred outside of the 1.00% management fee. |
| (6) | Less than 0.01% is attributable to interest expenses incurred outside of the 1.00% management fee. |
| (7) | 0.01% is attributable to legal expenses incurred outside of the 1.00% management fee. |
The accompanying notes are an integral part of the financial statements.
14
THE FAIRHOLME FUND
NOTES TO FINANCIAL STATEMENTS
November 30, 2015
Note 1. Organization
Fairholme Funds, Inc. (the “Company”), a Maryland corporation, is registered under the Investment Company Act of 1940, as amended (the “1940 Act”), as an open-end management investment company. The Company’s Articles of Incorporation permit the Board of Directors of the Company (the “Board” or the “Directors”) to issue 1,100,000,000 shares of common stock at $.0001 par value. 700,000,000 shares have been allocated to The Fairholme Fund (the “Fund”). The Fund is a non-diversified fund. The Fund may have a greater percentage of its assets invested in particular securities than a diversified fund, exposing the Fund to the risk of unanticipated industry conditions as well as risks specific to a single company or the securities of a single company. The Board has the power to designate one or more separate and distinct series and/or classes of shares of common stock and to classify or reclassify any unissued shares with respect to such series.
The Fund’s investment objective is to provide long-term growth of capital. Under normal circumstances, the Fund seeks to achieve its investment objective by investing in a focused portfolio of equity and fixed-income securities. The proportion of the Fund’s assets invested in each type of asset class will vary from time to time based upon Fairholme Capital Management, L.L.C.’s (the “Manager”) assessment of general market and economic conditions. The Fund may invest in, and may shift frequently among, the asset classes and market sectors. The equity securities in which the Fund may invest include common and preferred stock (including convertible preferred stock), partnership interests, business trust shares, interests in real estate investment trusts (“REITs”), rights and warrants to subscribe for the purchase of equity securities, and depository receipts. The Fund may invest in equity securities without regard to the jurisdictions in which the issuers of the securities are organized or situated and without regard to the market capitalizations or sectors of such issuers. The fixed-income securities in which the Fund may invest include U.S. corporate debt securities, non-U.S. corporate debt securities, bank debt (including bank loans and participations), U.S. government and agency debt securities (including U.S. Treasury bills), short-term debt obligations of foreign governments, and foreign money market instruments. Except for its investments in short-term debt obligations of foreign governments, the Fund may invest in fixed-income securities regardless of maturity or the rating of the issuer of the security. The Fund may also invest in “special situations” to achieve its objective. “Special situation” investments may include equity securities or fixed-income securities, such as corporate debt, which may be in a distressed position as a result of economic or company specific developments. Although the Fund normally holds a focused portfolio of equity and fixed-income securities, the Fund is not required to be fully invested in such securities and may maintain a significant portion of its total assets in cash and securities generally considered to be cash equivalents. The Manager serves as investment adviser to the Fund.
There is no guarantee that the Fund will meet its objective.
Note 2. Significant Accounting Policies
As an investment company, the Fund follows the investment company accounting and reporting guidance, which is part of U.S. generally accepted accounting principles (“U.S. GAAP”). The Fund’s investments are reported at fair value as defined by U.S. GAAP. The Fund calculates its net asset value as soon as practicable following the close of regular trading on the New York Stock Exchange (currently 4:00 p.m. Eastern Time) on each day the New York Stock Exchange is open.
A description of the valuation techniques applied to the Fund’s securities measured at fair value on a recurring basis follows:
Security Valuation:
Equity securities (common and preferred stocks): Securities traded on a national securities exchange or reported on the NASDAQ national market are generally valued at the official closing price, or at the last reported sale price on the exchange or market on which the securities are traded, as of the close of business on the day the securities are being valued or, lacking any sales, at the last available bid price. To the extent these securities are actively traded and valuation adjustments are not applied, they are classified in Level 1 of the fair value hierarchy. If these securities are not actively traded, they are classified in Level 2. The Manager may also employ other valuation methods which the Manager believes would provide a more
15
THE FAIRHOLME FUND
NOTES TO FINANCIAL STATEMENTS (continued)
November 30, 2015
accurate indication of fair value. In these situations, if the inputs are observable, the valuation will be classified in Level 2 of the fair value hierarchy, otherwise they would be classified in Level 3.
Fixed-income securities (U.S. government obligations, corporate bonds, convertible bonds, and asset backed securities): The fair value of fixed-income securities is estimated using market quotations when readily available, but may also be estimated by various methods when no such market quotations exist and when the Manager believes these other methods reflect the fair value of such securities. These methods may consider recently executed transactions in securities of the issuer or comparable issuers and market price valuations from independent pricing services and/or brokers (where observable). Where the Manager deems it appropriate to do so (such as when independent prices are unavailable or not deemed to be representative of fair value) long-term fixed income securities will be fair valued in good faith following consideration by, and conclusion of, the Manager’s Valuation Committee. As of November 30, 2015, fixed-income securities are valued by the Manager utilizing observable market prices on the day of valuation or the average bid of independent broker/dealer quotes and/or the average of valuations from independent pricing services. Although fixed-income securities are classified in Level 2 of the fair value hierarchy at November 30, 2015, in instances where lower relative weight is placed on transaction prices, quotations, or similar observable inputs, they would be classified in Level 3.
Open-end mutual funds: Investments in open-end mutual funds including money market funds are valued at their closing net asset value each business day and are classified in Level 1 of the fair value hierarchy.
Short-term securities: Investments in securities with maturities of less than sixty days when acquired, or which subsequently are within sixty days of maturity, shall be valued at prices supplied by an independent pricing source or by one of the Fund’s pricing agents based on broker or dealer supplied valuations or matrix pricing. To the extent the inputs are observable and timely, the values would be classified in Level 2 of the fair value hierarchy.
Restricted securities: Depending on the relative significance of valuation inputs, these instruments may be classified in any level of the fair value hierarchy.
Warrants: The Fund may invest in warrants, which may be acquired either through a direct purchase, included as part of a private placement, or pursuant to corporate actions. Warrants entitle, but do not obligate, the holder to buy equity securities at a specific price for a specific period of time. Warrants may be considered more speculative than certain other types of investments in that they do not entitle a holder to dividends or voting rights with respect to the underlying securities that may be purchased nor do they represent any rights in the assets of the issuing company. Also, the value of a warrant does not necessarily change with the value of the underlying securities and a warrant ceases to have value if it is not exercised prior to its expiration date. Warrants traded on a security exchange are valued at the official closing price on the valuation date and are classified as Level 1 of the fair value hierarchy. Over the counter (OTC) warrants are valued using simulation models utilizing market value of the underlying security, expiration date of the warrants, volatility of the underlying security, strike price of the warrants, risk-free interest rate at the valuation date, and are classified as Level 2 or Level 3 of the fair value hierarchy depending on the observability of the inputs used.
The Fund uses several recognized industry third-party pricing services (TPPS) - approved by the Board and unaffiliated with the Manager - to value some of its securities. It also uses other independent market trade data sources (such as TRACE, the FINRA developed mandatory reporting of over-the-counter secondary market transactions), as well as broker quotes provided by market makers. The data within these feeds is ultimately sourced from major stock exchanges and trading systems where these securities trade. If a price obtained from the pricing source is deemed unreliable, it may be discarded and/or challenged. In these cases the pricing decision is made by reference to the reliable market data from the other market data sources.
The Manager may determine the fair valuation of a security when market quotations are insufficient or not readily available, when securities are determined to be illiquid or restricted, or when in the judgment of the Manager the prices or values available do not represent the fair value of the instrument. Factors which may cause the Manager to make such a judgment include the following: (a) only a bid price or an asked price is available; (b) the spread between bid and asked prices is
16
THE FAIRHOLME FUND
NOTES TO FINANCIAL STATEMENTS (continued)
November 30, 2015
substantial; (c) the liquidity of the securities; (d) the frequency of sales; (e) the thinness of the market; (f) the size of reported trades; (g) actions of the securities markets, such as the suspension or limitation of trading; and (h) local market closures. Among the factors to be considered to fair value a security are recent prices of comparable securities that are publicly traded, reliable prices of securities not publicly traded, the use of valuation models, current analyst reports, valuing the income or cash flow of the issuer, or cost if the preceding factors do not apply. The circumstances of Level 3 securities are frequently monitored to determine if fair valuation measures continue to apply.
The Manager reports quarterly to the Board the results of the application of fair valuation policies and procedures.
The inputs and valuation techniques used to measure fair value of the Fund’s investments are summarized into three levels as described in the hierarchy below:
| | • | | Level 1 — quoted prices in active markets for identical securities; |
| | • | | Level 2 — other significant observable inputs (including quoted prices for similar securities, quoted prices in inactive markets for identical securities, interest rates, prepayment speeds, credit risk, etc.); and |
| | • | | Level 3 — significant unobservable inputs (including the Manager’s determination as to the fair value of investments). |
The inputs or methodology used for valuing investments are not necessarily an indication of the level of risk associated with investing in those investments. The summary of the Fund’s investments by inputs used to value the Fund’s investments as of November 30, 2015, is as follows:
| | | | | | | | | | | | |
| | | Valuation Inputs | | | | |
| | | Level 1 –
Quoted Prices | | | Level 2 – Other
Significant
Observable Inputs | | | Total
Fair Value
at 11/30/15 | |
ASSETS: | | | | | | | | | | | | |
INVESTMENTS (Fair Value): | | | | | | | | | | | | |
Domestic Equity Securities* | | $ | 1,487,652,035 | | | | — | | | $ | 1,487,652,035 | |
Foreign Equity Securities* | | | 336,349,245 | | | | — | | | | 336,349,245 | |
Domestic Preferred Equity Securities | | | | | | | | | | | | |
Mortgage Finance | | | 612,101,872 | | | $ | 1,763,840 | | | | 613,865,712 | |
Retail Department Stores | | | — | | | | 216,748 | | | | 216,748 | |
Warrants* | | | 578,369,852 | | | | — | | | | 578,369,852 | |
Domestic Corporate Bonds* | | | — | | | | 210,954,087 | | | | 210,954,087 | |
Foreign Corporate Bonds* | | | — | | | | 147,185,064 | | | | 147,185,064 | |
Commercial Paper* | | | — | | | | 224,340,077 | | | | 224,340,077 | |
U.S. Government Obligations | | | — | | | | 99,947,200 | | | | 99,947,200 | |
Money Market Funds | | | 774,074,868 | | | | — | | | | 774,074,868 | |
Miscellaneous Investments | | | — | | | | 164,381,585 | | | | 164,381,585 | |
| | | | | | | | | | | | |
TOTAL INVESTMENTS | | $ | 3,788,547,872 | | | $ | 848,788,601 | | | $ | 4,637,336,473 | |
| | | | | | | | | | | | |
| * | Industry classifications for these categories are detailed in the Schedule of Investments. |
The Fund did not have material transfers between Level 1 and Level 2 during the fiscal year ended November 30, 2015. The Fund’s policy is to recognize transfers among Levels as of the beginning of the reporting period.
There were no Level 3 investments at November 30, 2015, or November 30, 2014.
Warrants: The Fund’s investments in warrants as of November 30, 2015, are presented within the Schedule of Investments.
17
THE FAIRHOLME FUND
NOTES TO FINANCIAL STATEMENTS (continued)
November 30, 2015
The Fund’s warrant positions during the year ended November 30, 2015, had an average monthly market value of approximately $537,250,629.
As of November 30, 2015, the value of warrants with equity risk exposure of $578,369,852 is included with Investments at Fair Value on the Statement of Assets and Liabilities. For the year ended November 30, 2015, the effect of the net change in unrealized appreciation of warrants with equity risk exposure of $37,191,126 is included with the Net Change in Unrealized Appreciation (Depreciation) on Investments and Foreign Currency Related Translations on the Statement of Operations and realized gains from warrants with equity risk exposure of $2,734,207 is included in Net Realized Gain on Investments and Foreign Currency Related Transactions on the Statement of Operations.
Dividends and Distributions: The Fund records dividends and distributions to shareholders on the ex-dividend date. The Fund intends to distribute substantially all of its net investment income (if any) as dividends to its shareholders on an annual basis in December. The Fund intends to distribute any net long-term capital gains and any net short-term capital gains at least once a year. If the total dividends and distributions made in any tax year exceeds net investment income and accumulated realized capital gains, a portion of the total distribution may be treated as a tax return of capital.
Foreign Currency Translation: The books and records of the Fund are maintained in U.S. dollars. Foreign currency amounts are translated into U.S. dollars on the following basis: (i) fair value of investment securities, assets, and liabilities at the current rate of exchange; and (ii) purchases and sales of investment securities, income, and expenses at the relevant rates of exchange prevailing on the respective dates of such transactions. The Fund does not isolate that portion of gains and losses on investment securities which is due to changes in the foreign exchange rates from that which is due to changes in the market prices of such securities.
Estimates: The preparation of financial statements in conformity with U.S. GAAP requires the Fund to make estimates and assumptions that affect the reported amounts of assets and liabilities and disclosure of both contingent assets and liabilities at the date of the financial statements and the reported amounts of revenues and expenses during the reported period. Actual results could differ from those estimates.
Redemption Fee: The Fund assesses a 2% fee on the proceeds of the Fund shares that are redeemed within 60 days of their purchase. The redemption fee is paid to the Fund as applicable, for the benefit of remaining shareholders and is recorded as paid-in capital. The redemption fees retained by the Fund during the fiscal years ended November 30, 2015 and November 30, 2014, amounted to $240,567 and $263,247, respectively.
Other: The Fund accounts for security transactions on the trade date for financial statement purposes. The specific identification method is used for determining gains or losses for financial statements and income tax purposes. Dividend income is recorded on the ex-dividend date net of foreign taxes withheld where recovery is uncertain and interest income is recorded on an accrual basis. Discounts and premiums on securities purchased are amortized over the life of the respective securities using the effective yield method. Securities denominated in currencies other than U.S. dollars are subject to changes in value due to fluctuation in exchange rates. The Fund may invest in countries that require governmental approval for the repatriation of investment income, capital, or the proceeds of sales of securities by foreign investors. In addition, if there is deterioration in a country’s balance of payments or for other reasons, a country may impose temporary restrictions on foreign capital remittances abroad.
The Fund paid commissions, other brokerage fees, registration fees, and legal expenses in connection with its investments in Federal National Mortgage Association and the Federal Home Loan Mortgage Corporation.
Note 3. Related Party Transactions
The Manager is a Delaware limited liability company and is registered with the Securities and Exchange Commission as an investment adviser. The Manager’s principal business and occupation is to provide investment management and advisory services to individuals, corporations, and other institutions throughout the world. Pursuant to an Investment Management
18
THE FAIRHOLME FUND
NOTES TO FINANCIAL STATEMENTS (continued)
November 30, 2015
Agreement, the Fund pays a management fee to the Manager for its provision of investment advisory and operating services to the Fund. Subject to applicable waivers or limitations, the management fee is paid at an annual rate equal to 1.00% of the daily average net assets of the Fund. The Manager is responsible pursuant to the Investment Management Agreement for paying the Fund’s expenses for the following services: transfer agency, fund accounting, fund administration, custody, legal, audit, compliance, directors’ fees, call center, fulfillment, travel, insurance, rent, printing, postage and other office supplies. The Manager is not responsible for paying for the following costs and expenses of the Fund: commissions, brokerage fees, issue and transfer taxes, and other costs chargeable to the Fund in connection with securities transactions or in connection with securities owned by the Fund, taxes, interest, acquired fund fees and related expenses, expenses in connection with litigation by or against the Fund, and any other extraordinary expenses.
The Manager earned $55,982,433 from the Fund for its services during the year ended November 30, 2015.
Bruce Berkowitz, both the Chief Investment Officer of the Manager and Chairman of the Fund’s Board, continues to have a significant personal stake in the Fund, holding in an aggregate 3,330,764 shares at November 30, 2015.
A Director and Officers of the Fund are also Officers of the Manager or its affiliates.
Note 4. Investments
For the year ended November 30, 2015, aggregated purchases and sales of investment securities other than short-term investments and U.S. government obligations were as follows:
| | | | |
Purchases | | Sales | |
$1,897,527,200 | | $ | 4,616,424,601 | |
Note 5. Tax Matters
Federal Income Taxes: The Fund intends to qualify each year as a “Regulated Investment Company” under Subchapter M of the Internal Revenue Code of 1986, as amended. By so qualifying, the Fund will not be subject to federal income taxes to the extent that it distributes all of its net investment income and any realized capital gains.
For U.S. federal income tax purposes, the cost of securities owned, gross unrealized appreciation, gross unrealized depreciation, and net unrealized appreciation of investments at November 30, 2015, were as follows:
| | | | | | |
Cost | | Gross Unrealized
Appreciation | | Gross Unrealized
Depreciation | | Net Unrealized Depreciation |
$5,241,860,505 | | $366,879,553 | | $(971,403,585) | | $(604,524,032) |
The difference between book basis and tax basis net unrealized depreciation is attributable to the tax deferral of losses on wash sales and capitalized cost.
The Fund’s tax basis capital gains are determined only at the end of each fiscal year. As of November 30, 2015, the components of distributable earnings on a tax basis were as follows:
| | | | |
Undistributed Ordinary Income | | $ | 73,575,252 | |
Net Long-Term Capital Gain | | | 1,509,018,962 | |
Net Unrealized Depreciation on Investments
and Foreign Currency Related Transactions | | | (604,524,032 | ) |
| | | | |
Total | | $ | 978,070,182 | |
| | | | |
The Fund is permitted to carry capital losses forward for an unlimited period. Capital losses that are carried forward will retain their character as either short term or long term capital losses.
19
THE FAIRHOLME FUND
NOTES TO FINANCIAL STATEMENTS (continued)
November 30, 2015
The Manager has analyzed the Fund’s tax positions taken on tax returns for all open tax years (current and prior three tax years) and has concluded that there are no uncertain tax positions that require recognition of a tax liability. The Fund’s federal and state income and federal excise tax returns for tax years for which the applicable statutes of limitations have not expired (the current year and prior three years) are subject to examination by the Internal Revenue Service and state departments of revenue. Additionally, the Fund is not aware of any tax position for which it is reasonably possible that the total amounts of unrecognized tax benefits will change materially in the next twelve months.
Note 6. Dividends and Distributions to Shareholders
Ordinary income and capital gain distributions are determined in accordance with federal income tax regulations, which may differ from U.S. GAAP.
The tax character of dividends and distributions paid by the Fund were as follows:
| | | | | | | | | | |
| | | For the
Fiscal Year Ended
November 30, 2015 | | | | | For the
Fiscal Year Ended
November 30, 2014 | |
Dividends and Distributions paid from: | | | | | | | | | | |
Ordinary Income* | | $ | 6,221,462 | | | | | | — | |
Long-Term Capital Gain | | | 531,841,585 | | | | | $ | 690,418,532 | |
| | | | | | | | | | |
| | $ | 538,063,047 | | | | | $ | 690,418,532 | |
| | | | | | | | | | |
| * | Inclusive of short-term capital gains |
The Fund declared and made payable the following distribution on December 11, 2015.
| | | | |
Dividends and Distributions paid from: | | | | |
Ordinary Income | | $ | 73,560,978 | |
Long-Term Capital Gain | | | 1,509,019,832 | |
| | | | |
| | $ | 1,582,580,810 | |
| | | | |
Note 7. Reclassification in the Capital Accounts
In accordance with U.S. GAAP, the Fund has recorded reclassifications in their capital accounts. These reclassifications have no impact on the net asset value of the Fund and are designed generally to present undistributed income and realized gains on a tax basis which is considered to be more informative to the shareholder. Permanent differences were primarily due to the disallowance of certain non-tax deductible expenses for the Fund. As of November 30, 2015, the Fund recorded the following reclassifications to increase (decrease) the accounts listed below:
| | | | |
Undistributed Net Investment Income | | $ | 14,346 | |
Paid-in-Capital | | | (14,346 | ) |
Note 8. Transactions in Shares of Affiliates
Portfolio companies in which the Fund owns 5% or more of the outstanding voting securities of the issuer are considered affiliates of the Fund. The aggregate fair value of all securities of affiliates held in the Fund as of November 30, 2015, amounted to $1,449,869,157 representing approximately 31.43% of the Fund’s net assets.
20
THE FAIRHOLME FUND
NOTES TO FINANCIAL STATEMENTS (continued)
November 30, 2015
Transactions in the Fund during the year ended November 30, 2015, in which the issuer was an affiliate are as follows:
| | | | | | | | | | | | | | | | | | | | | | | | | | | | |
| | | November 30, 2014 | | | Gross Additions | | | Gross Deductions | | | November 30, 2015 | | | | | | | |
| | | Shares/
Par Value | | | Shares/
Par Value | | | Shares/
Par Value | | | Shares/
Par Value | | | Fair Value | | | Realized
Gain | | | Investment
Income | |
Imperial Metals Corp. | | | 4,795,100 | | | | 2,337,513 | | | | — | | | | 7,132,613 | | | | $ 36,852,766 | | | | $ — | | | | $ — | |
Lands’ End, Inc.(a) | | | 75,019 | | | | 2,415,527 | | | | 75,019 | | | | 2,415,527 | | | | 58,069,269 | | | | 1,940,194 | | | | — | |
NOW, Inc. | | | — | | | | 6,266,800 | | | | — | | | | 6,266,800 | | | | 115,183,784 | | | | — | | | | — | |
Sears Holdings Corp. | | | 14,212,673 | | | | 7,200 | | | | — | | | | 14,219,873 | | | | 314,685,789 | | | | — | | | | 82,351,070 | |
Sears Canada, Inc.(a) | | | 5,078,700 | | | | 4,606,972 | | | | — | | | | 9,685,672 | | | | 82,134,499 | | | | — | | | | — | |
Seritage Growth Properties | | | — | | | | 2,084,600 | | | | — | | | | 2,084,600 | | | | 76,087,900 | | | | — | | | | — | |
The St. Joe Co. | | | 23,136,502 | | | | — | | | | — | | | | 23,136,502 | | | | 449,310,869 | | | | — | | | | — | |
Sears Roebuck Acceptance Corp. 7.400% | | | — | | | | 15,405 | | | | — | | | | 15,405 | | | | 216,748 | | | | — | | | | 7,125 | |
Sears Holdings Corp., Vested, Strike Price $25.686, Expire 12/15/2019 | | | — | | | | 222,319 | | | | — | | | | 222,319 | | | | 2,890,147 | | | | — | | | | — | |
| | | | | | | |
Imperial Metals Corp. 7.000%, 03/15/2019 | | | $ — | | | | $161,870,000 | | | | $5,090,000 | | | | $156,780,000 | | | | 147,185,064 | | | | 191,651 | | | | 10,218,114 | |
Sears Holdings Corp. 6.625%, 10/15/2018 | | | $ — | | | | $ 22,022,000 | | | | $ — | | | | $ 22,022,000 | | | | 21,563,943 | | | | — | | | | 276,089 | |
Sears Holdings Corp. 8.000%, 12/15/2019 | | | $ — | | | | $143,408,000 | | | | $ — | | | | $143,408,000 | | | | 139,937,526 | | | | — | | | | 1,917,382 | |
Sears Roebuck Acceptance Corp. 6.875%, 10/15/2017 | | | $ — | | | | $ 823,000 | | | | $ — | | | | $ 823,000 | | | | 786,047 | | | | — | | | | 11,793 | |
Sears Roebuck Acceptance Corp. 7.500%, 10/15/2027 | | | $ — | | | | $ 6,886,000 | | | | $ — | | | | $ 6,886,000 | | | | 4,964,806 | | | | — | | | | 128,964 | |
| | | | | | | | | | | | | | | | | | | | | | | | | | | | |
Total | | | | | | | | | | | | | | | | | | | $1,449,869,157 | | | | $2,131,845 | | | | $94,910,537 | |
| | | | | | | | | | | | | | | | | | | | | | | | | | | | |
| (a) | Company was not an “affiliated company” at November 30, 2014. |
Note 9. Indemnifications
Under the Company’s organizational documents, its Officers and Directors are indemnified against certain liabilities arising out of the performance of their duties to the Fund. In the normal course of business the Company or the Fund enters into contracts that contain a variety of representations and customary indemnifications. The Fund’s maximum exposure under these arrangements is unknown as this would involve future claims that may be made against the Fund that have not yet occurred. However, based on its experience to date, the Fund expects the risk of loss to be remote.
21
REPORT OF INDEPENDENT REGISTERED PUBLIC ACCOUNTING FIRM
To the Board of Directors of Fairholme Funds, Inc. and
the shareholders of The Fairholme Fund:
We have audited the accompanying statement of assets and liabilities, including the schedule of investments, of The Fairholme Fund (the “Fund”), as of November 30, 2015, and the related statement of operations for the year then ended, the statements of changes in net assets for each of the two years in the period then ended, and the financial highlights for each of the five years in the period then ended. These financial statements and financial highlights are the responsibility of the Fund’s management. Our responsibility is to express an opinion on these financial statements and financial highlights based on our audits.
We conducted our audits in accordance with the standards of the Public Company Accounting Oversight Board (United States). Those standards require that we plan and perform the audit to obtain reasonable assurance about whether the financial statements and financial highlights are free of material misstatement. The Fund is not required to have, nor were we engaged to perform, an audit of its internal control over financial reporting. Our audits included consideration of internal control over financial reporting as a basis for designing audit procedures that are appropriate in the circumstances, but not for the purpose of expressing an opinion on the effectiveness of the Fund’s internal control over financial reporting. Accordingly, we express no such opinion. An audit also includes examining, on a test basis, evidence supporting the amounts and disclosures in the financial statements, assessing the accounting principles used and significant estimates made by management, as well as evaluating the overall financial statement presentation. Our procedures included confirmation of securities owned as of November 30, 2015, by correspondence with the custodian and brokers. We believe that our audits provide a reasonable basis for our opinion.
In our opinion, the financial statements and financial highlights referred to above present fairly, in all material respects, the financial position of The Fairholme Fund as of November 30, 2015, the results of its operations for the year then ended, the changes in its net assets for each of the two years in the period then ended, and the financial highlights for each of the five years in the period then ended, in conformity with accounting principles generally accepted in the United States of America.
DELOITTE & TOUCHE LLP
Philadelphia, Pennsylvania
January 28, 2016
22
THE FAIRHOLME FUND
ADDITIONAL INFORMATION
November 30, 2015
Board of Directors (unaudited)
The Board of Directors has overall responsibility for conduct of the Company’s affairs. The day-to-day operations of the Fund are managed by the Manager, subject to the By-Laws of the Company and review by the Company’s Board. The Directors and Officers of the Company, including those Directors who are also officers, are listed below.
| | | | | | | | |
Name, Age & Address† | | Position(s) Held, Term of Office & Length of Time Served** | | Principal Occupation(s) During Past 5 Years§ | | Number of Portfolios in Fund Complex Overseen by Director | | Other Current Directorships Held by Director |
Interested Directors and Officers | | | | | | |
| | | | | |
Bruce R. Berkowitz*
Age 57 | | Mr. Berkowitz has served as a Director of the Company since
December 15, 1999. | | Manager, Fairholme Holdings LLC since January 2015 and Chief Investment Officer, Fairholme Capital Management, L.L.C. since October 1997; Managing Member, Fairholme Capital Management, L.L.C. from October 1997 to December 2014. | | 3 | | Director and Chairman of the Board of Directors, The St. Joe Co. |
| | | | | |
Cesar L. Alvarez, Esq.*
Age 68 | | Mr. Alvarez has served as a Director of the Company since
May 19, 2008. | | Senior Chairman effective January 1, 2016; Executive Chairman and Co-Chairman from 2010 to 2015; and Chief Executive Officer from 1997 to 2010 of Greenberg Traurig, LLP. | | 3 | | Chairman, Board of Directors, Mednax, Inc.; Director, Intrexon Corp., Sears Holdings Corp., and The St. Joe Co. |
Independent Directors^ |
| | | | | |
Terry L. Baxter
Age 70 | | Mr. Baxter has served as a Director of the Company since
May 19, 2008. | | Chairman of the Board, CEO, Source One (retired); President of White Mountain Holdings (retired). | | 3 | | Director, Main Street America Group |
| | | | | |
Howard S. Frank
Age 74 | | Mr. Frank has served as a Director of the Company since
May 7, 2007. | | Chairman of the Board of Costa Crociere S.p.A. since 2014; Special Advisor to the CEO and to the Chairman of Carnival Corporation & plc. since 2013; Vice Chairman, Chief Operating Officer and Director, Carnival Corporation & plc. 1989 to 2013 | | 3 | | Director, New World Symphony; Director, The St. Joe Co. |
| | | | | |
Steven J. Gilbert
Age 68 | | Mr. Gilbert has served as a Director of the Company since
June 16, 2014 | | Chairman, Gilbert Global Equity Partners, L.P. since 1998; Vice Chairman, MidOcean Equity Partners, L.P. since 2005; Co-Chairman, Birch Grove Capital since 2013; Senior Managing Director and Chairman, Sun Group (USA) from 2007 to 2009. | | 3 | | Chairman, CPM Holdings, Inc.; Director, MBIA, Inc.; Lead Independent Director, Empire State Realty Trust; Lead Independent Director, TRI Pointe Homes, Inc.; Director, Waterpik, Inc., and Director, Trade Informatics, Inc. |
| | | | | |
Avivith Oppenheim, Esq.
Age 65 | | Ms. Oppenheim has served as a Director of the Company since
December 15, 1999. | | Attorney-at-Law. | | 3 | | None. |
| | | | | |
Leigh Walters, Esq.
Age 69 | | Mr. Walters has served as a Director of the Company since
December 15, 1999. | | Vice-President and Director, Valcor Engineering Corporation. Attorney- at-Law. | | 3 | | Director, Valcor Engineering Corporation |
| † | Unless otherwise indicated, the address of each Director of the Company is c/o Fairholme Capital Management, L.L.C., 4400 Biscayne Blvd., 9th Floor, Miami, FL 33137. |
| ^ | Directors who are not “interested persons” of the Company as defined under the 1940 Act. |
| * | Mr. Berkowitz and Mr. Alvarez are each an interested person, as defined in the 1940 Act, of the Company because of their affiliation with the Manager. |
| ** | Each Director serves for an indefinite term. Each officer serves for an annual term and until his or her successor is elected and qualified. |
| § | The information reported includes the principal occupation during the last five years for each Director and other information relating to the professional experiences, attributes and skills relevant to each Director’s qualifications to serve as Director. |
23
THE FAIRHOLME FUND
ADDITIONAL INFORMATION (continued)
November 30, 2015
Officers (unaudited)
| | | | | | |
| Name, Age & Address† | | Position(s) Held with the Company | | Term of Office & Length of Time Served* | | Principal Occupation(s) During Past 5 Years |
| | | | |
Fernando Font
Age 41 | | Vice President | | Mr. Font has served as Vice President of the Company since June 2015. | | Chief Administrative Officer of Fairholme Capital Management, L.L.C. since August 2009. |
| | | | |
Wayne Kellner
Age 46 | | Treasurer | | Mr. Kellner has served as Treasurer of the Company since March 2012. | | Chief Operating Officer, Fairholme Capital Management, L.L.C. since June 2014; Chief Financial Officer, Fairholme Capital Management, L.L.C. since January 2012; Treasurer, Fairholme Capital Management, L.L.C. from January 2011 to December 2011; Tax Principal, Rothstein Kass from 2006 to 2010. |
| | | | |
Paul R. Thomson
Age 59 | | Chief Compliance Officer and Secretary | | Mr. Thomson has served as Chief Compliance Officer of the Company since April 2010 and has served as Secretary of the Company since June 2011. Mr. Thomson previously served as Chief Compliance Officer from November 2008 to January 2009. | | Chief Compliance Officer, Fairholme Capital Management L.L.C. since April 2010; Chief Financial Officer, Fairholme Capital Management L.L.C. from January 2008 to January 2012. |
| † | Unless otherwise indicated, the address of each Officer of the Company is c/o Fairholme Capital Management, L.L.C., 4400 Biscayne Blvd., 9th Floor, Miami, FL 33137. |
| * | Each officer serves for an annual term and until his or her successor is elected and qualified. |
24
THE FAIRHOLME FUND
ADDITIONAL INFORMATION (continued)
November 30, 2015
Approval of Investment Management Agreement (unaudited)
At its meeting on October 22, 2015, the Board of Directors (the “Board” or the “Directors”) of Fairholme Funds, Inc. (the “Company”) approved the renewal of the investment management agreement between the Company, on behalf of The Fairholme Fund (the “Fund”), and Fairholme Capital Management, L.L.C. (the “Manager”). In considering whether to approve the renewal of the agreement, the Directors considered the factors discussed below, and information made available to them at the meeting relating to such factors, and other information they deemed relevant. The renewal of the agreement was not, however, based on any single factor, but on an evaluation of the totality of factors and information reviewed and evaluated by the Directors.
A. Nature, Extent and Quality of Services
The Directors considered information provided to them concerning the services performed by the Manager for the Fund pursuant to the agreement. The Directors reviewed information concerning the nature, extent and quality of investment advisory and operational services provided, or overseen, by the Manager. The Directors reviewed information concerning the personnel responsible for the day-to-day portfolio and administrative management of the Fund, the overall reputation of the Manager and the Manager’s current and planned staffing levels. The Directors considered the Manager’s commitment to the Fund as evidenced, among other things, by the current share ownership of the Fund by management/owners/employees of the Manager. The Directors considered information describing the Manager’s compliance policies and procedures, including recent updates to those policies and information concerning the policies designed to address the Fund’s compliance with its investment objective, policies and restrictions and applicable regulatory requirements and to address the Manager’s conflicts of interest in providing services to the Fund and to other advisory clients.
The Directors did not compare services provided by the Manager to the Fund with the services provided by Manager to its other advisory accounts because such accounts are not subject to the same regulatory requirements as the Fund, may have different investment restrictions, holdings and goals than the Fund and require different levels of client and back-office servicing than the Fund.
The Directors concluded that the nature, extent and quality of services provided by the Manager to the Fund were appropriate and sufficient to support renewal of the agreement.
B. Investment Performance
The Directors considered information regarding the Fund’s performance, the Manager’s views on performance and the holdings of the Fund that contributed negatively and positively to the Fund’s performance. The Directors considered information about the short- and long-term investment performance of the Fund, including information comparing the Fund’s performance with the performance of the S&P 500 Index, for the fiscal year to date period ended August 31, 2015. The Directors also reviewed and considered a third-party report (from Lipper/Broadridge, “Lipper”) comparing the Fund’s annualized performance with the annualized performance of similarly situated mutual funds, which reflected the annualized performance of the Fund and the similarly situated mutual funds for the 1-year, 3-year, 5-year, 10-year and since-inception periods ended August 31, 2015. The Directors noted that the Fund’s annualized performance exceeded both the average and median annualized performance of the peer group for the 10-year and since inception periods ended August 31, 2015 by 1.85 and 1.62, and 4.65 and 5.18 percentage points, respectively. The Directors noted that the Fund’s 1-year and 5-year annualized performance trailed the peer group’s average and median annualized performance by 3.4 and 5.2 percentage points, and 4.1 and 5.3 percentage points, respectively and that the Fund’s 3-year annualized performance equaled the peer group’s average annualized performance, but trailed the peer group’s median 3-year annualized performance by 0.85 percentage points. The Directors took into consideration the volatility of the Fund’s recent performance as well as the Fund’s longer-term performance relative to that of the other funds in the peer group. The Directors considered information provided to them concerning the performance of the Fund in light of market events and other factors affecting the Fund’s performance and information about developments with respect to specific issuers of securities held in the Fund’s portfolio. They also considered other information about the Fund’s total returns and focused investment strategies.
25
THE FAIRHOLME FUND
ADDITIONAL INFORMATION (continued)
November 30, 2015
C. Management Fees and Expense Ratios
The Directors considered information about the Fund’s management fee and expense ratio, including information in the Lipper report comparing the Fund’s management fee and the most recent Total Expense ratio to the advisory fees and expense ratios of other similarly situated mutual funds. The Directors noted for the Fund that the Management Fee was reasonable when compared to the median of the peer groups’ Advisory Fees when consideration was given to the Fund operating and other expenses that the Manager pays on behalf of the Fund. The Directors noted that the total expense ratio for the Fund’s latest full fiscal year of 1.06 was slightly higher than the median expense ratio of the most recently completed fiscal year of its peer group funds included in the Lipper report.
In evaluating the management fee and expense ratio information, the Directors took into account the demands and complexity of portfolio management for the Fund in light of its investment objective, strategies, and asset size. The Directors also considered information regarding the Manager’s payment (in some cases from its resources) of certain expenses for the benefit of the Fund, including shareholder account-level expenses associated with certain omnibus accounts. The Directors also reviewed information concerning the fees paid to the Manager by its other advisory accounts.
After reviewing information presented to them concerning fees, expenses, performance and other matters, the Directors concluded that the Fund’s management fee and overall expense ratio were reasonable in light of the services provided by or through the Manager.
D. Profitability
The Directors considered information regarding the estimated profitability of the Fund to the Manager. They considered such profitability in light of the Fund’s assets under management, overall expense ratio, performance and the services provided by or through the Manager, and concluded that the Manager’s estimated profitability was not such as to prevent Directors from approving the renewal of the agreement.
E. Economies of Scale
The Directors considered information concerning economies of scale for the Fund, including the current assets of the Fund. The Directors concluded for the Fund that no modification to the Fund’s existing arrangements was warranted based on economies of scale.
Proxy Voting Policies, Procedures and Records (unaudited)
The Company has adopted policies and procedures that provide guidance and set forth parameters for the voting of proxies relating to securities held in the Fund’s portfolio. A description of these policies and procedures, and records of how the Fund voted proxies relating to their portfolio securities during the most recent twelve month period ended June 30, 2015, are available to you upon request and free of charge by writing to the Fairholme Funds, Inc., c/o BNY Mellon Investment Servicing (US) Inc., P.O. Box 9692, Providence, RI, 02940 or by calling Shareholder Services at 1-866-202-2263 or visiting our website at fairholmefunds.com. They may also be obtained by visiting the Securities and Exchange Commission (“SEC”) website at www.sec.gov. The Company shall respond to all shareholder requests for records within three business days of its receipt of such request by first-class mail or other means designed to ensure prompt delivery.
N-Q Filing (unaudited)
The Company files a complete schedule of the Fund’s portfolio holdings on Form N-Q for the fiscal quarters ending February
28 (February 29 during leap year) and August 31. The Form N-Q filing must be made within 60 days of the end of the quarter.
The Forms N-Q relating to the Fund’s portfolio investments are available on the SEC’s website at www.sec.gov, or may be reviewed and copied at the SEC’s Public Reference Room in Washington, DC (call 1-800-732-0330 for information on the operation of the Public Reference Room).
26
THE FAIRHOLME FUND
ADDITIONAL INFORMATION (continued)
November 30, 2015
Shareholder Tax Information (unaudited)
The Fund reported $538,063,047 of total distributions paid during the fiscal year ended November 30, 2015, and $531,841,585 of that represented long-term capital gain distributions.
The information below is reported for the Fund’s fiscal year and not calendar year. Therefore, shareholders should refer to their Form 1099-DIV or other tax information which will be mailed in 2016 to determine the calendar year amounts to be included on their 2015 tax returns. Shareholders should consult their own tax advisors.
Please note that, for the fiscal year ended November 30, 2015, the respective percentages of ordinary income distributions paid by the Fund were reported as follows:
| | |
Distribution Period November 30, 2015 | | The Fund |
Qualified Dividend Income for Individuals | | 100.00% |
Dividends Qualifying for the Dividends Received Deduction for Corporations | | 100.00% |
Qualifying Interest Income | | 0.00% |
Qualifying Short-term Gain | | 100.00% |
U.S. Treasury Securities | | 0.27%* |
| * | The law varies in each state as to whether and what percentage of dividend income attributable to U.S. Treasury securities is exempt from state and local income tax. It is recommended that you consult your tax advisor to determine if any portion of the dividends you received is exempt from income taxes. |
All information reported is based on financial information available as of the date of this annual report and, accordingly, are subject to change. For each item, it is the intention of the Fund to report the maximum amount permitted under the Internal Revenue Code and the regulations thereunder.
27

| | |
Officers of Fairholme Funds, Inc. BRUCE R. BERKOWITZ President FERNANDO M. FONT Vice President WAYNE KELLNER Treasurer PAUL R. THOMSON Chief Compliance Officer & Secretary Board of Directors of Fairholme Funds, Inc. CESAR L. ALVAREZ, Esq. TERRY L. BAXTER BRUCE R. BERKOWITZ HOWARD S. FRANK STEVEN J. GILBERT, Esq. AVIVITH OPPENHEIM, Esq. LEIGH WALTERS, Esq. Investment Manager FAIRHOLME CAPITAL MANAGEMENT, L.L.C. 4400 Biscayne Boulevard, Miami, FL 33137 Transfer Agent, Fund Accountant & Administrator BNY MELLON INVESTMENT SERVICING (US) INC. 760 Moore Road, King of Prussia, PA 19406 Custodian THE BANK OF NEW YORK MELLON One Wall Street, New York, NY 10286 Independent Registered Public Accounting Firm DELOITTE & TOUCHE LLP 1700 Market Street, Philadelphia, PA 19103 Legal Counsel SEWARD & KISSEL LLP 901 K Street NW, Washington, DC 20001 | | |
THIS REPORT IS PROVIDED FOR THE GENERAL INFORMATION OF THE SHAREHOLDERS OF FAIRHOLME FUNDS, INC. IT IS NOT INTENDED FOR DISTRIBUTION TO PROSPECTIVE INVESTORS IN THE FUNDS UNLESS PRECEDED OR ACCOMPANIED BY AN EFFECTIVE PROSPECTUS, WHICH CONTAINS MORE INFORMATION ON FEES, CHARGES AND OTHER EXPENSES AND SHOULD BE READ CAREFULLY BEFORE INVESTING OR SENDING MONEY. PAST PERFORMANCE IS NOT A GUARANTEE OF FUTURE RESULTS. SHARES OF THE FUNDS ARE DISTRIBUTED BY FAIRHOLME DISTRIBUTORS, LLC.


“(E)ven the intelligent investor is likely to need considerable
willpower to keep from following the crowd.”
Benjamin Graham
This page is not part of The Fairholme Focused Income Fund 2015 Annual Report.
| | |
| FAIRHOLME CAPITAL MANAGEMENT, L.L.C. |
|
| | PORTFOLIO MANAGER’S REPORT |
| | For the Year Ended December 31, 2015 |
|
Mutual fund investing involves risks, including loss of principal. The charts below cover the period from inception of The Fairholme Focused Income Fund (December 31, 2009) to December 31, 2015. Unless otherwise specified, all holdings information is shown as of December 31, 2015. Past performance information quoted below does not guarantee future results. The investment return and principal value of an investment in The Fairholme Focused Income Fund will fluctuate so that an investor’s shares, when redeemed, may be worth more or less than their original cost. Current performance may be lower or higher than the performance information quoted below. Performance figures assume reinvestment of dividends and capital gains. Most recent month-end performance and answers to any questions you may have can be obtained by calling Shareholder Services at 1.866.202.2263. The Fairholme Focused Income Fund maintains a focused portfolio of investments in a limited number of issuers and does not seek to diversify its investments. This exposes The Fairholme Focused Income Fund to the risk of unanticipated industry conditions and risks particular to a single company or the securities of a single company. The Fairholme Focused Income Fund’s performance may differ markedly from the performance of the Barclays Capital U.S. Aggregate Bond Index in either up or down market trends. The Barclays Capital U.S. Aggregate Bond Index is an unmanaged market-weighted index comprised of investment-grade (rated Baa3/BBB-/BBB- or higher) taxable bonds, mortgage-backed securities, asset-backed securities, corporate securities, and government-related securities, including U.S. Treasury and government agency issues, with at least one year to maturity. Because indices cannot be invested in directly, these index returns do not reflect a deduction for fees, expenses, or taxes. The Fairholme Focused Income Fund’s expense ratio reflected in its prospectus dated March 27, 2015, is 1.01%, which included acquired fund fees and expenses that were incurred indirectly by The Fairholme Focused Income Fund as a result of investments in securities issued by one or more investment companies.
January 28, 2016
The Fairholme Focused Income Fund vs. The Barclays Capital U.S. Aggregate Bond Index
| | | | | | | | |
TOTAL ANNUAL RETURN | |
| | | | | | | | |
| Year | | The Fairholme
Focused Income Fund | | | The Barclays Capital U.S.
Aggregate Bond Index | |
2010 | | | 11.2% | | | | 6.5% | |
2011 | | | (0.7)% | | | | 7.8% | |
2012 | | | 5.2% | | | | 4.2% | |
2013 | | | 29.9% | | | | (2.0)% | |
2014 | | | (3.4)% | | | | 6.0% | |
2015 | | | (1.5)% | | | | 0.6% | |
Compounded Annual Gain | | | 6.2% | | | | 3.8% | |
Overall Gain | | | 43.5% | | | | 25.0% | |
This page is not part of The Fairholme Focused Income Fund 2015 Annual Report.
i
To the Shareholders and Directors of The Fairholme Focused Income Fund:
The Fairholme Focused Income Fund (the “Fund” or “FOCIX”) seeks current income. The Fund invests in a focused portfolio of cash distributing securities and, to maintain maximum flexibility, may invest in a variety of assets, including, but not limited to, corporate bonds and other corporate debt securities of issuers in the U.S. and foreign countries, bank debt, government and agency debt securities of the U.S. and foreign countries, convertible bonds and other convertible securities, preferred and common stock, and interests in real estate investment trusts.
The Fund decreased 1.50% versus an increase of 0.55% for the Barclays Capital U.S. Aggregate Bond Index (the “Barclays Bond Index”) in 2015. Since inception, the Fund increased 43.51% versus 25.00% for the Barclays Bond Index. The following table compares the Fund’s unaudited performance (after expenses) with that of the Barclays Bond Index, with dividends and distributions reinvested, for various periods ending December 31, 2015.
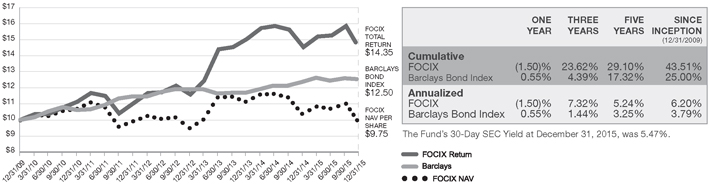
At December 31, 2015, the value of a $10.00 investment in the Fund at its inception was worth $14.35 (assumes reinvestment of distributions into additional Fund shares) compared to $12.50 for the Barclays Bond Index. The Fund returned 1.7 times more than the Barclays Bond Index on a $10.00 investment since inception. Of the $14.35, the share price (net asset value per share) was $9.75 and the value of distributions reinvested was $4.60. This difference, more than anything, demonstrates how the Fund has outperformed the market (as represented by the Barclays Bond Index) over the period shown.
Last year’s performance proved similar to that of 2014, as positive returns for the first three quarters were muted by fourth quarter tumult. As 2016 begins, credit investors remain fixated on several headline issues – a slowing China, freefalling commodity prices, and reduced liquidity in bond markets. However, today’s teetering credit markets will likely produce tomorrow’s winners, and the Fund is well positioned to buffer volatility and take advantage of new opportunities with cash and cash equivalents comprising 28.7% of the Fund.
The Fund’s single largest bond position (20.6% of the Fund portfolio) is Imperial Metals Corporation (“Imperial”) senior unsecured notes due 2019 with a yield to maturity of 9.7%. The notes are backed by the world-class Red Chris mine that is expected to produce copper at cash costs of around $1.20 per pound for decades to come. While primarily known for its huge copper reserve, Red Chris also boasts the seventh largest gold deposit in the world. Imperial posted record production results in 2015: 88.1 million pounds of copper, 44.7 thousand ounces of gold, and 224.5 thousand ounces of silver. We anticipate that Imperial will prudently weather this commodity cycle while preparing for the next upswing.
Debt securities issued by Sears Holdings Corporation (“Sears”) comprise 14.8% of the Fund’s assets. The Fund owns 6.625% senior secured notes due 2018 and 8.00% senior unsecured notes due 2019, with yields to maturity of 11.0% and 12.0%, respectively. Sears’ vast portfolio of real estate and other assets provides, in our view, ample asset coverage for these bonds. During 2015, Sears substantially de-risked its balance sheet by repurchasing $936 million of debt, and successfully amending and extending its $3.25 billion credit facility. The company must now accelerate its return to profitability in order to rebuild confidence with customers, creditors, vendors, employees, and other investors. Doing so should enable Sears to optimize the value of all its assets.
Seritage Growth Properties (“Seritage”), a newly formed public real estate investment trust (REIT) that acquired real estate from Sears, comprises 6.0% of Fund assets. Seritage’s real estate portfolio, which includes 235 properties and joint venture interests in 31 additional properties, has the opportunity to recycle existing leases into new leases commanding significantly higher rents. We anticipate that more than half of its 42 million square feet will be redeveloped and re-tenanted, which should ultimately boost cash flow and fuel meaningful dividend growth over time. One can only speculate that Warren Buffett concurs with this assessment given his recent decision to personally acquire shares of Seritage.
In 1986, famed Magellan Fund manager Peter Lynch touted Fannie Mae as “the best business, literally, in America.” At that time, Fannie Mae had a price-to-earnings ratio of one. Lynch noted that “when a company can earn back the price of its stock in one year, you’ve found a good deal.” Thirty years later, the price-to-earnings ratio of Fannie Mae is back at one – but the circumstances are quite different. Current prices of Fannie Mae as well as its smaller cousin Freddie Mac do not reflect the economic value, let alone the earnings power, embedded in these world-class franchises. Indeed, the companies are not priced for a run-off of their existing businesses; they are priced for permanent expropriation of all assets.
Fannie Mae and Freddie Mac preferred stock collectively represent 8.9% of Fund assets. The market gyrations experienced during 2015 do not reflect the progress in halting Treasury’s unlawful taking of Fannie Mae and Freddie Mac’s assets. For example, at the end of the summer, plaintiffs informed the United States Court of Appeals for the District of Columbia Circuit that newly discovered evidence from “improperly concealed” documents clearly shows that the government defendants submitted materials to a lower court that were “incomplete, misleading, and in important respects, outright false.” This important evidence was subsequently presented to the D.C. Circuit Court (under seal as required), and plaintiffs in other cases from the Northern District of Iowa to the Eastern District of Kentucky have now obtained these documents as well. We remain confident that Treasury’s deliberate effort to realign the equity of each company and allocate all profits to itself in perpetuity is strictly prohibited by federal and state law, and anticipate that several of these cases will be adjudicated this year.
This page is not part of The Fairholme Focused Income Fund 2015 Annual Report.
ii
Sooner rather than later, we believe the Net Worth Sweep will be halted and a common sense solution will prevail: Fannie Mae and Freddie Mac will transform into low-risk, public utilities with regulated rates of return, just like your local electric company.
Plunging natural gas and oil prices have roiled the energy sector. Industry participants are being forced to adjust to today’s realities of oversupplied markets and irrational production dynamics. Senior unsecured bonds of offshore driller Atwood Oceanics (“Atwood”) and America’s #2 natural gas producer, Chesapeake Energy (“Chesapeake”), were purchased at significant discounts to par and comprise 3.6% and 3.2% of Fund assets, respectively. Atwood owns 11 modernized drill rigs, and has manageable debt and solid contract coverage into 2018. Chesapeake holds large acreage positions across top U.S. shale basins providing a multi-decade drilling inventory. Both companies possess asset values that are being ignored at current prices.
The Fund’s other bond investments include HomeFed Corporation notes due 2018 (4.3% of Fund assets), Bombardier notes due 2018 (4.3% of Fund assets), and Ally Financial notes due 2016 (2.3% of Fund assets). These three short duration investments also offer attractive yields averaging 6.7% to maturity.
Overall, we believe the Fund is positioned to offer attractive interest income as the underlying investments have an average current yield of 5.1% and capital appreciation potential with an average 7.5% yield to maturity, while minimizing the risks of rising interest rates.1 We estimate that an instantaneous 100 basis point increase in interest rates may reduce the fair market value of the portfolio securities (excluding Seritage common) by 1.6%, or approximately 4 months of interest. The Fund also reopened to new investors during 2015. Effective February 1, 2016, the initial subscription minimum is $10,000, and the subsequent subscription minimum is $1,000.
We are pleased to invite shareholders to join us for a public conference call in the near future, during which I will discuss the Fund’s investments and address your questions. Details will be made available on www.fairholmefunds.com in the coming weeks, along with additional updated information on our investments.
Respectfully submitted,

Bruce R. Berkowitz
Chief Investment Officer
Fairholme Capital Management
The Portfolio Manager’s Report is not part of The Fairholme Focused Income Fund’s Annual Report due to forward-looking statements that, by their nature, cannot be attested to, as required by regulation. The Portfolio Manager’s Report is based on calendar-year performance and precedes a more formal Management Discussion and Analysis. Opinions of the Portfolio Manager are intended as such, and not as statements of fact requiring attestation.
1Average current yield represents interest received by the Fund and not distributions to shareholders.
This page is not part of The Fairholme Focused Income Fund 2015 Annual Report.
iii
“Traditionally the investor has been the man with patience
and the courage of his convictions who would buy when the
harried or disheartened speculator was selling.”
Benjamin Graham & David Dodd
This page is not part of The Fairholme Focused Income Fund 2015 Annual Report.

The Fairholme Focused Income Fund (FOCIX)
Seeking current income
Annual Report 2015
Managed by Fairholme Capital Management
1.866.202.2263 • fairholmefunds.com
THE FAIRHOLME FOCUSED INCOME FUND
| | |
| | TABLE OF CONTENTS |
| | November 30, 2015 |
2
THE FAIRHOLME FOCUSED INCOME FUND
| | |
| | FUND PERFORMANCE (unaudited) |
| | Inception through November 30, 2015 |
THE FAIRHOLME FOCUSED INCOME FUNDVS.
The BARCLAYS CAPITAL U.S. AGGREGATE BOND INDEX
INITIAL MINIMUM INVESTMENTOF $25,000
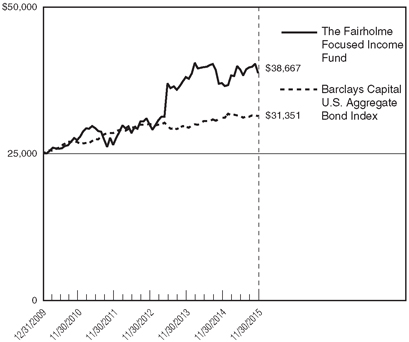
The Fairholme Focused Income Fund (the “Fund”) commenced operations on December 31, 2009. The chart above presents the performance of a $25,000 investment from inception to the latest fiscal year ending November 30, 2015.
The following notes pertain to the chart above as well as to the performance table included in the Management Discussion & Analysis Report. Performance information in this report represents past performance and is not a guarantee of future results. The investment return and principal value of an investment in the Fund will fluctuate, so that an investor’s shares when redeemed may be worth more or less than their original cost. Current performance may be lower or higher than the performance quoted within. The performance information does not reflect the taxes an investor would pay on Fund distributions or upon redemption of Fund shares. Most recent month-end performance and answers to any questions you may have can be obtained by calling Shareholder Services at 1-866-202-2263.
Data for both the Barclays Capital U.S. Aggregate Bond Index and the Fund are presented assuming all dividends and distributions have been reinvested and do not reflect any taxes that might have been incurred by a shareholder as a result of the Fund distributions. The Barclays Capital U.S. Aggregate Bond Index is an unmanaged market weighted index comprised of investment grade corporate bonds (rated BBB or better), mortgages, and U.S. Treasury and government agency issues with at least one year to maturity and does not reflect any investment management fees or transaction expenses, nor the effects of taxes, fees, or other charges.
3
THE FAIRHOLME FOCUSED INCOME FUND
| | |
| | MANAGEMENT DISCUSSION & ANALYSIS |
| | For the Fiscal Year Ended November 30, 2015 |
The Fairholme Focused Income Fund (the “Fund”) shares outstanding and audited net asset value per share (“NAV”) at November 30, 2015, the end of the Fund’s fiscal year, and per share NAVs at other pertinent dates, were as follows:
| | | | | | |
11/30/2015
Shares
Outstanding | | 11/30/2015
NAV
(audited) | | 05/31/2015
NAV
(unaudited) | | 11/30/2014
NAV
(audited) |
| 22,682,152 | | $10.72 | | $11.12 | | $10.82 |
At December 31, 2015, the unaudited per share NAV of the Fund was $9.75. Performance figures below are shown for the Fund’s fiscal year ended November 30, 2015, and do not match calendar year figures for the period ended December 31, 2015, cited in the Portfolio Manager’s report.
| | | | | | | | | | | | | | | | | | | | |
Fund Performance to 11/30/2015 | | Six Months | | | | | One Year | | | | Five Year | | | | | Since Inception 12/31/2009 | |
| | | | | | | |
Cumulative: | | | | | | | | | | | | | | | | | | | | |
Fund | | | (1.61) | % | | | | 4.60% | | | | | 41.83 | % | | | | | 54.66% | |
Barclays Bond Index | | | (0.12) | % | | | | 0.98% | | | | | 16.43 | % | | | | | 25.40% | |
| | | | | | | |
Annualized: | | | | | | | | | | | | | | | | | | | | |
Fund | | | | | | | | 4.60% | | | | | 7.24 | % | | | | | 7.65% | |
Barclays Bond Index | | | | | | | | 0.98% | | | | | 3.09 | % | | | | | 3.90% | |
For the six months ended November 30, 2015, the Fund was outperformed by the Barclays Capital U.S. Aggregate Bond Index (“Barclays Bond Index”) by 1.49 percentage points while over the last year the Fund outperformed the Barclays Bond Index by 3.62 percentage points. From inception, the Fund outperformed the Barclays Bond Index by 3.75 percentage points per annum, or on a cumulative basis, 29.26 percentage points over five years and eleven months.
Fairholme Capital Management, L.L.C. (the “Manager”) believes performance over shorter periods is likely to be less meaningful than performance over longer periods. Investors are cautioned not to rely on short-term results. The fact that securities increase or decline in value does not always indicate that the Manager believes these securities to be more or less attractive — in fact, the Manager believes that some price increases present selling opportunities and some price declines present buying opportunities.
Further, shareholders should note that the Barclays Bond Index is an unmanaged index incurring no fees, expenses, or tax effects and is shown solely to compare Fund performance to that of an unmanaged and diversified index.
Shareholders are also cautioned that it is possible that some securities mentioned in this discussion may no longer be held by the Fund subsequent to the end of the fiscal period and that the Fund may have made significant new purchases that are not yet required to be disclosed. It is the Fund’s general policy not to disclose portfolio holdings other than when required by relevant law or regulation. Portfolio holdings are subject to change without notice.
Not all Fund portfolio dispositions or additions are material, and, while the Fund and the Manager have long-term objectives, it is possible that a security sold or purchased in one period will be purchased or sold in a subsequent period. Generally, the Manager determines to buy and sell based on its estimates of the absolute and relative intrinsic values and fundamental dynamics of a particular security and its issuer and its industry. However, certain strategies of the Manager in carrying out Fund policies may result in shorter holding periods.
The Manager invests Fund assets in securities to the extent it finds reasonable investment opportunities in accordance with its Prospectus and may invest a significant portion of Fund assets in liquid, low-risk securities or
4
THE FAIRHOLME FOCUSED INCOME FUND
MANAGEMENT DISCUSSION & ANALYSIS (continued)
For the Fiscal Year Ended November 30, 2015
cash. The Manager views liquidity as a strategic advantage. At November 30, 2015, cash and cash equivalents (consisting of cash, commercial paper, deposit accounts, U.S. Treasury Bills, and money-market funds) represented 24.49% of total assets. Since inception, the Fund has held liquid, low-risk securities or cash for periods without negatively influencing performance, although there is no guarantee that future performance will not be negatively affected by Fund liquidity.
The Fund is considered to be “non-diversified” under the Investment Company Act of 1940. The Fund can invest a greater percentage of assets in fewer securities than a diversified fund and may invest a significant portion of cash and liquid assets in one or more higher-risk securities at any time, particularly in situations where markets are weak or a particular security declines sharply. The Fund may also have a greater percentage of assets invested in a particular industry than a diversified fund, exposing the Fund to the risk of an unanticipated industry condition as well as risks specific to a single company or security. For the fiscal year ended November 30, 2015, the Fund investments that performed the best were Sears Holdings Corp., Imperial Metals Corp., and Federal National Mortgage Association. The biggest contributors to negative performance were investments in Chesapeake Energy Corp. and Atwood Oceanics, Inc. The following charts show the top holdings by issuer and sector in descending order of net assets as of November 30, 2015.
| | | | | | | | | | |
| | |
| The Fairholme Focused Income Fund | | | The Fairholme Focused Income Fund | |
| Top Holdings by Issuer* | | | Top Sectors | |
| (% of Net Assets) | | | (% of Net Assets) | |
| | | | |
Imperial Metals Corp. | | | 18.4% | | | Cash and Cash Equivalents** | | | 24.5% | |
Sears Holdings Corp. | | | 14.7% | | | Metals & Mining | | | 18.4% | |
Federal National Mortgage Association | | | 5.4% | | | Retail Department Stores | | | 14.7% | |
Chesapeake Energy Corp. | | | 5.2% | | | Mortgage Finance | | | 10.3% | |
Federal Home Loan Mortgage Corp. | | | 4.9% | | | Oil & Natural Gas Exploration | | | 9.6% | |
Seritage Growth Properties | | | 4.8% | | | Real Estate Investment Trusts | | | 4.8% | |
Atwood Oceanics, Inc. | | | 4.4% | | | Consumer Finance | | | 4.0% | |
Ally Financial, Inc. | | | 4.0% | | | Aerospace & Defense | | | 3.9% | |
Bombardier, Inc. | | | 3.9% | | | Real Estate Management & Development | | | 3.8% | |
Homefed Corp. | | | 3.8% | | | Pharmaceuticals | | | 2.8% | |
| | | | | | | | | | | |
| | | | 69.5% | | | | | | 96.8% | |
| | | | | | | | | | | |
| | | | | | | | | | | |
| * | Excludes cash, U.S. Treasury Bills, commercial paper, and money market funds. |
| ** | Includes cash, U.S. Treasury Bills, commercial paper, and money market funds. |
The Manager views the ability to focus on fewer investments than a diversified fund as a strategic advantage. However, such a strategy may negatively influence short-term performance and there is no guarantee that long-term performance will not be negatively affected.
The Fund may invest in non-U.S. securities and securities of corporations domiciled outside of the United States, which may expose the Fund to adverse changes resulting from foreign currency fluctuations or other potential risks as described in the Fund’s Prospectus and Statement of Additional Information.
The Fund’s officers, the Board of Directors (the “Board” or the “Directors”), and the Manager are aware that large cash inflows or outflows may adversely affect Fund performance. Such flows are monitored and appropriate actions are contemplated for when such flows could negatively impact performance.
Since inception, the Fund has been advised by the Manager. Bruce Berkowitz, both the Chief Investment Officer of the Manager and Chairman of the Fund’s Board, continues to have a significant personal stake in the Fund, holding
5
THE FAIRHOLME FOCUSED INCOME FUND
MANAGEMENT DISCUSSION & ANALYSIS (continued)
For the Fiscal Year Ended November 30, 2015
an aggregate 1,440,894 shares at November 30, 2015. While there is no requirement that Mr. Berkowitz own shares of the Fund, such holdings are believed to help align the interests of the Manager with the interests of the shareholders.
The Board, including the Independent Directors, continues to believe that it is in the best interests of Fund to have Mr. Berkowitz serve as Chairman of the Board given: his long-term relative performance; his experience, commitment, and significant personal investment in the Fund; the present constitution of Directors and policies; and current rules and regulations. A Director and Officers of the Fund are also Officers of the Manager. Nevertheless, at November 30, 2015, a majority of Directors were independent of the Manager, no stock option or restricted stock plans exist, Officers received no direct compensation from the Fund, and the Director affiliated with the Manager received no compensation for being a Director.
For more complete information about the Fund, or to obtain a current Prospectus, please visit www.fairholmefunds.com or call Shareholder Services at 1-866-202-2263.
6
THE FAIRHOLME FOCUSED INCOME FUND
EXPENSE EXAMPLE
For the Six Month Period from June 1, 2015
through November 30, 2015 (unaudited)
As a Fund shareholder, you incur direct and indirect costs. Direct costs include, but are not limited to, transaction fees at some broker-dealers, custodial fees for retirement accounts and wire transfer fees. You also incur indirect, ongoing costs that include, but are not limited to, management fees paid to the Manager.
The following example is intended to help you understand your indirect costs (also referred to as “ongoing costs” and measured in dollars) when investing in the Fund and to compare these costs with the ongoing costs of investing in other mutual funds. This example is based on an investment of $1,000 invested in the Fund at June 1, 2015, and held for the entire six month period ending November 30, 2015.
Actual Expenses
The first line of the table below provides information about actual account values and actual expenses. You may use the information in this line, together with the amount you had invested at the beginning of the period, to estimate the expenses that you paid over the period. Simply divide your account value by $1,000 (for example, an $8,600 account value divided by $1,000 = 8.6), then multiply the result by the number in the first line under the heading “Expenses Paid During the Period” to estimate the expenses you paid on your Fund holdings during this period.
Hypothetical Example for Comparison Purposes
The second line of the table provides information about hypothetical account values and hypothetical expenses based on the Fund’s actual expense ratio and an assumed rate of return of 5% per year before expenses, which is not the Fund’s actual return for the period presented. The hypothetical account values and expenses may not be used to estimate the actual ending account balance or expenses that you paid for the period presented. However, you may use this information to compare ongoing costs of investing in the Fund with the ongoing costs of investing in other funds. To do so, compare this 5% hypothetical example with the 5% examples that appear in the shareholder reports of other funds.
Please note that the column titled “Expenses Paid During the Period” in the table below is meant to highlight your ongoing costs only and do not reflect any transactional costs, such as redemption fees (if any), or other direct costs. Therefore, the second line of the table is useful in comparing ongoing costs only, and will not help you determine the relative total costs of owning different funds. In addition, if these direct costs were included, your total costs would be higher.
| | | | | | | | | | | | | | | | | | | | |
| | | Beginning
Account Value
June 1, 2015 | | Ending
Account Value
November 30, 2015 | | Annualized
Expense
Ratio | | Expenses Paid
During the Period
June 1, 2015
Through
November 30, 2015* |
Fund | | | | | | | | | | | | | | | | | | | | |
Actual | | | $ | 1,000.00 | | | | $ | 983.90 | | | | | 1.00 | % | | | $ | 4.97 | |
Hypothetical
(5% return before expenses) | | | $ | 1,000.00 | | | | $ | 1,020.05 | | | | | 1.00 | % | | | $ | 5.06 | |
| * | Expenses are equal to the Fund’s annualized expense ratio, multiplied by the average account value over the period, multiplied by 183 days/365 days (to reflect the one-half year period). |
7
THE FAIRHOLME FOCUSED INCOME FUND
SCHEDULE OF INVESTMENTS
November 30, 2015
| | | | | | | | |
| | |
Shares | | | | | Value | |
| | |
| | | | DOMESTIC EQUITY SECURITIES — 4.8% | | | | |
| | |
| | | | REAL ESTATE INVESTMENT TRUSTS — 4.8% | | | | |
| | 318,600 | | | Seritage Growth Properties (a) | | $ | 11,628,900 | |
| | | | | | | | |
| TOTAL DOMESTIC EQUITY SECURITIES
(COST $11,995,198) | | | 11,628,900 | |
| | | | | | | | |
| | |
| | | | DOMESTIC PREFERRED EQUITY
SECURITIES — 14.9% | | | | |
| | |
| | | | CONSUMER FINANCE — 1.9% | | | | |
| | 4,604 | | | Ally Financial, Inc. | | | | |
| | | | 7.000%, Series G (b) | | | 4,629,967 | |
| | | | | | | | |
| | |
| | | | MORTGAGE
FINANCE — 10.3% | | | | |
| | | | Federal Home Loan Mortgage Corp. | | | | |
| | 1,200,000 | | | 7.875%, Series Z (a)(c) | | | 5,208,000 | |
| | 1,029,724 | | | 6.550%, Series Y (a) | | | 3,707,006 | |
| | 396,000 | | | 5.100%, Series H (a) | | | 2,376,000 | |
| | 98,355 | | | 6.000%, Series P (a) | | | 663,896 | |
| | | | Federal National Mortgage Association | | | | |
| | 1,167,500 | | | 7.000%, Series O (a)(c) | | | 8,767,925 | |
| | 520,000 | | | 7.750%, Series S (a)(c) | | | 2,262,000 | |
| | 500,000 | | | 6.750%, Series Q (a) | | | 2,155,000 | |
| | | | | | | | |
| | | | | | | 25,139,827 | |
| | | | | | | | |
| | |
| | | | OIL & NATURAL GAS EXPLORATION — 0.8% | | | | |
| | | | Chesapeake Energy Corp. | | | | |
| | 47,200 | | | 5.000% | | | 1,699,200 | |
| | 600 | | | 5.750% (b) | | | 142,404 | |
| | 100 | | | 5.750% (b) | | | 24,927 | |
| | | | | | | | |
| | | | | | | 1,866,531 | |
| | | | | | | | |
| | |
| | | | RETAIL DEPARTMENT STORES — 1.9% | | | | |
| | | | Sears Roebuck Acceptance Corp. | | | | |
| | 178,106 | | | 7.000% | | | 2,504,170 | |
| | 149,931 | | | 7.400% | | | 2,109,529 | |
| | | | | | | | |
| | | | | | | 4,613,699 | |
| | | | | | | | |
| TOTAL DOMESTIC PREFERRED
EQUITY SECURITIES
(COST $40,443,518) | | | 36,250,024 | |
| | | | | | | | |
| | | | | | | | |
| | |
Principal | | | | | Value | |
| | |
| | | | DOMESTIC CORPORATE BONDS — 34.2% | | | | |
| | |
| | | | AEROSPACE &
DEFENSE — 3.9% | | | | |
| | | | Bombardier, Inc. | | | | |
| $ | 6,557,000 | | | 7.500%, 03/15/2018 (b) | | $ | 6,557,000 | |
| | 3,000,000 | | | 5.500%, 09/15/2018 (b) | | | 2,835,000 | |
| | | | | | | | |
| | | | | | | 9,392,000 | |
| | | | | | | | |
| | |
| | | | CONSUMER FINANCE — 2.1% | | | | |
| | 5,000,000 | | | Ally Financial, Inc. | | | | |
| | | | 3.500%, 07/18/2016 | | | 5,024,500 | |
| | | | | | | | |
| | |
| | | | OIL & NATURAL GAS
EXPLORATION — 8.8% | | | | |
| | 14,155,000 | | | Atwood Oceanics, Inc. | | | | |
| | | | 6.500%, 02/01/2020 | | | 10,687,025 | |
| | | | Chesapeake Energy Corp. | | | | |
| | 10,850,000 | | | 7.250%, 12/15/2018 | | | 6,483,960 | |
| | 8,856,000 | | | 6.625%, 08/15/2020 | | | 4,162,320 | |
| | | | | | | | |
| | | | | | | 21,333,305 | |
| | | | | | | | |
| | |
| | | | PHARMACEUTICALS — 2.8% | | | | |
| | 7,000,000 | | | Valeant Pharmaceuticals International, Inc. | | | | |
| | | | 6.750%, 08/15/2018 (b) | | | 6,855,800 | |
| | | | | | | | |
| | |
| | | | REAL ESTATE MANAGEMENT &
DEVELOPMENT — 3.8% | | | | |
| | 9,230,000 | | | Homefed Corp. | | | | |
| | | | 6.500%, 06/30/2018 (b) | | | 9,230,923 | |
| | | | | | | | |
| | |
| | | | RETAIL DEPARTMENT STORES — 12.8% | | | | |
| | | | Sears Holdings Corp. | | | | |
| | 8,093,000 | | | 6.625%, 10/15/2018 | | | 7,924,666 | |
| | 23,738,500 | | | 8.000%, 12/15/2019 | | | 23,164,028 | |
| | | | Sears Roebuck Acceptance Corp. | | | | |
| | 95,000 | | | 7.500%, 10/15/2027 | | | 68,495 | |
| | 11,000 | | | 6.750%, 01/15/2028 | | | 7,837 | |
| | 40,000 | | | 6.500%, 12/01/2028 | | | 27,816 | |
| | 50,000 | | | 7.000%, 06/01/2032 | | | 35,960 | |
| | | | | | | | |
| | | | | | | 31,228,802 | |
| | | | | | | | |
| TOTAL DOMESTIC CORPORATE BONDS
(COST $87,057,971) | | | 83,065,330 | |
| | | | | | | | |
The accompanying notes are an integral part of the financial statements.
8
THE FAIRHOLME FOCUSED INCOME FUND
SCHEDULE OF INVESTMENTS (continued)
November 30, 2015
| | | | | | | | |
| | |
Principal | | | | | Value | |
| | |
| | | | FOREIGN CORPORATE BONDS — 18.4% | | | | |
| | |
| | | | CANADA — 18.4% | | | | |
| | |
| | | | METALS & MINING — 18.4% | | | | |
| | | | Imperial Metals Corp. | | | | |
| | $47,700,000 | | | 7.000%, 03/15/2019 (b) | | $ | 44,780,760 | |
| | | | | | | | |
| TOTAL FOREIGN CORPORATE BONDS
(COST $44,857,840) | | | 44,780,760 | |
| | | | | | | | |
| | |
| | | | COMMERCIAL
PAPER — 13.6% | | | | |
| | |
| | | | ALUMINUM — 4.5% | | | | |
| | | | Alcoa, Inc. | | | | |
| | 6,000,000 | | | 0.530%, 12/02/2015 (d) | | | 5,999,850 | |
| | 5,000,000 | | | 0.550%, 12/07/2015 (d) | | | 4,999,563 | |
| | | | | | | | |
| | | | | | | 10,999,413 | |
| | | | | | | | |
| | |
| | | | AUTOMOTIVE
RETAIL — 2.1% | | | | |
| | | | AutoNation, Inc. | | | | |
| | 5,000,000 | | | 0.700%, 12/04/2015 (d) | | | 4,999,750 | |
| | | | | | | | |
| | |
| | | | MULTIMEDIA — 2.9% | | | | |
| | | | Viacom, Inc. | | | | |
| | 7,000,000 | | | 0.500%, 12/02/2015 (d) | | | 6,999,903 | |
| | | | | | | | |
| | |
| | | | OIL & NATURAL GAS EXPLORATION — 4.1% | | | | |
| | | | Canadian Natural Resources Ltd. | | | | |
| | 10,000,000 | | | 0.400%, 12/04/2015 (d) | | | 9,999,722 | |
| | | | | | | | |
| TOTAL COMMERCIAL PAPER
(COST $32,998,748) | | | 32,998,788 | |
| | | | | | | | |
| | | | | | |
| | |
Principal | | | | Value | |
| | |
| | U.S. GOVERNMENT OBLIGATIONS — 4.1% | | | | |
| $10,000,000 | | U.S. Treasury Bills 0.099%, 03/17/2016 (d) | | $ | 9,994,720 | |
| | | | | | |
| |
TOTAL U.S. GOVERNMENT OBLIGATIONS
(COST $9,997,176) | | | 9,994,720 | |
| | | | | | |
| | |
Shares | | | | | |
| | |
| | MONEY MARKET FUNDS — 6.8% | | | | |
| 16,573,023 | | Fidelity Institutional Money Market Funds - Money Market Portfolio, 0.160% (e) | | | 16,573,023 | |
| | | | | | |
| |
TOTAL MONEY MARKET FUNDS
(COST $16,573,023) | | | 16,573,023 | |
| | | | | | |
| | |
| | MISCELLANEOUS INVESTMENTS — 1.9%(f) | | | | |
(COST $4,404,504) | | | 4,620,000 | |
| | | | | | |
| |
TOTAL INVESTMENTS — 98.7%
(COST $248,327,978) | | | 239,911,545 | |
| | OTHER ASSETS IN EXCESS OF LIABILITIES — 1.3% | | | 3,160,504 | |
| | | | | | |
NET ASSETS — 100.0% | | $ | 243,072,049 | |
| | | | | | |
| (a) | Non-income producing security. |
| (b) | Restricted security as defined in Rule 144A/144a under the Securities Act of 1933. The Manager has determined that such security is liquid pursuant to the Fund’s liquidity guidelines. The value of these securities totals $75,056,781, which represents 30.88% of the Fund’s net assets. |
| (c) | Variable rate security. Rates shown are the effective rates as of November 30, 2015. |
| (d) | Rates shown are the effective yields based on the purchase price. The calculation assumes the security is held to maturity. |
| (e) | Annualized based on the 1-day yield as of November 30, 2015. |
| (f) | Represents previously undisclosed unrestricted securities, which the Fund has held for less than one year. |
The accompanying notes are an integral part of the financial statements.
9
THE FAIRHOLME FOCUSED INCOME FUND
STATEMENT OF ASSETS & LIABILITIES
November 30, 2015
| | | | |
Assets | | | | |
Investments, at Fair Value (Cost — $248,327,978) | | $ | 239,911,545 | |
Interest Receivable | | | 3,289,469 | |
Receivable for Capital Shares Sold | | | 75,511 | |
| | | | |
| |
Total Assets | | | 243,276,525 | |
| | | | |
| |
Liabilities | | | | |
Accrued Management Fees | | | 203,131 | |
Payable for Capital Shares Redeemed | | | 1,345 | |
| | | | |
| |
Total Liabilities | | | 204,476 | |
| | | | |
| |
NET ASSETS | | $ | 243,072,049 | |
| | | | |
| |
Net Assets Consist of: | | | | |
Paid-In Capital | | $ | 247,980,756 | |
Undistributed Net Investment Income | | | 1,963,043 | |
Accumulated Net Realized Gain on Investments and Foreign Currency Related Transactions | | | 1,544,683 | |
Net Unrealized Depreciation on Investments and Foreign Currency Related Translations | | | (8,416,433 | ) |
| | | | |
| |
NET ASSETS | | $ | 243,072,049 | |
| | | | |
| |
Shares of Common Stock Outstanding* ($0.0001 par value) | | | 22,682,152 | |
| | | | |
| |
Net Asset Value, Offering and Redemption Price Per Share ($243,072,049 / 22,682,152 shares) | | $ | 10.72 | |
| | | | |
| * | 200,000,000 shares authorized in total. |
The accompanying notes are an integral part of the financial statements.
10
THE FAIRHOLME FOCUSED INCOME FUND
STATEMENT OF OPERATIONS
| | |
| | | For the Fiscal Year Ended
November 30, 2015 |
| | | | |
Investment Income | | | | |
Interest | | $ | 10,426,845 | |
Dividends | | | 913,360 | |
| | | | |
| |
Total Investment Income | | | 11,340,205 | |
| | | | |
| |
Expenses | | | | |
Management Fees | | | 2,205,527 | |
| | | | |
| |
Total Expenses | | | 2,205,527 | |
| | | | |
| |
Net Investment Income | | | 9,134,678 | |
| | | | |
| |
Realized and Unrealized Gain (Loss) on Investments and Foreign Currency Related Transactions | | | | |
Net Realized Gain on Investments and Foreign Currency Related Transactions | | | 1,695,482 | |
Net Change in Unrealized Appreciation (Depreciation) on Investments and Foreign Currency Related Translations | | | (2,766,651 | ) |
| | | | |
| |
Net Realized and Unrealized Gain (Loss) on Investments and Foreign Currency Related Transactions | | | (1,071,169 | ) |
| | | | |
| |
NET INCREASE IN NET ASSETS FROM OPERATIONS | | $ | 8,063,509 | |
| | | | |
The accompanying notes are an integral part of the financial statements.
11
THE FAIRHOLME FOCUSED INCOME FUND
STATEMENTS OF CHANGES IN NET ASSETS
| | | | | | | | |
| | | For the Fiscal Year Ended
November 30, 2015 | | | For the Fiscal Year Ended
November 30, 2014 | |
CHANGES IN NET ASSETS | | | | | | | | |
From Operations | | | | | | | | |
Net Investment Income | | | $ 9,134,678 | | | | $ 4,603,794 | |
Net Realized Gain on Investments and Foreign Currency Related Transactions | | | 1,695,482 | | | | 2,795,505 | |
Net Change in Unrealized (Depreciation) on Investments and Foreign Currency Related Translations | | | (2,766,651 | ) | | | (13,798,701 | ) |
Net Increase (Decrease) in Net Assets from Operations | | | 8,063,509 | | | | (6,399,402 | ) |
From Dividends and Distributions to Shareholders | | | | | | | | |
Net Investment Income | | | (8,626,519 | ) | | | (3,837,576 | ) |
Net Realized Capital Gains from Investment Transactions | | | (2,939,655 | ) | | | (13,876,149 | ) |
Net Decrease in Net Assets from Dividends and Distributions | | | (11,566,174 | ) | | | (17,713,725 | ) |
From Capital Share Transactions | | | | | | | | |
Proceeds from Sale of Shares | | | 69,260,014 | | | | 30,025,869 | |
Shares Issued in Reinvestment of Dividends and Distributions | | | 9,261,109 | | | | 14,885,867 | |
Cost of Shares Redeemed | | | (47,993,070 | ) | | | (51,739,852 | ) |
Net Increase (Decrease) in Net Assets from Shareholder Activity | | | 30,528,053 | | | | (6,828,116 | ) |
NET ASSETS | | | | | | | | |
Net Increase (Decrease) in Net Assets | | | 27,025,388 | | | | (30,941,243 | ) |
Net Assets at Beginning of Year | | | 216,046,661 | | | | 246,987,904 | |
Net Assets at End of Year | | | $243,072,049 | | | | $216,046,661 | |
Undistributed Net Investment Income at End of Year | | | $ 1,963,043 | | | | $ 1,421,920 | |
SHARES TRANSACTIONS | | | | | | | | |
Issued | | | 6,273,697 | | | | 2,609,016 | |
Reinvested | | | 867,545 | | | | 1,322,790 | |
Redeemed | | | (4,431,080 | ) | | | (4,568,532 | ) |
Net Increase (Decrease) in Shares | | | 2,710,162 | | | | (636,726 | ) |
Shares Outstanding at Beginning of Year | | | 19,971,990 | | | | 20,608,716 | |
Shares Outstanding at End of Year | | | 22,682,152 | | | | 19,971,990 | |
The accompanying notes are an integral part of the financial statements.
12
THE FAIRHOLME FOCUSED INCOME FUND
FINANCIAL HIGHLIGHTS
| | | | | | | | | | | | | | | | | | | | |
| | | For the Fiscal
Year Ended
November 30, 2015 | | | For the Fiscal
Year Ended
November 30, 2014 | | | For the Fiscal
Year Ended
November 30, 2013 | | | For the Fiscal
Year Ended
November 30, 2012 | | | For the Fiscal
Year Ended
November 30, 2011 | |
PER SHARE OPERATING PERFORMANCE | | | | | | | | | | | | | | | | | | | | |
NET ASSET VALUE, BEGINNING OF YEAR | | | $10.82 | | | | $11.98 | | | | $10.02 | | | | $9.71 | | | | $10.70 | |
Investment Operations | | | | | | | | | | | | | | | | | | | | |
Net Investment Income(1) | | | 0.45 | | | | 0.22 | | | | 0.46 | | | | 0.97 | | | | 0.64 | |
Net Realized and Unrealized Gain (Loss) on Investments | | | 0.03 | | | | (0.51 | ) | | | 2.12 | | | | 0.31 | | | | (0.95 | ) |
Total from Investment Operations | | | 0.48 | | | | (0.29 | ) | | | 2.58 | | | | 1.28 | | | | (0.31 | ) |
Dividends and Distributions | | | | | | | | | | | | | | | | | | | | |
From Net Investment Income | | | (0.43 | ) | | | (0.19 | ) | | | (0.62 | ) | | | (0.97 | ) | | | (0.64 | ) |
From Realized Capital Gains | | | (0.15 | ) | | | (0.68 | ) | | | — | | | | — | | | | (0.04 | ) |
Total Dividends and Distributions | | | (0.58 | ) | | | (0.87 | ) | | | (0.62 | ) | | | (0.97 | ) | | | (0.68 | ) |
NET ASSET VALUE, END OF YEAR | | | $10.72 | | | | $10.82 | | | | $11.98 | | | | $10.02 | | | | $9.71 | |
TOTAL RETURN | | | 4.60 | % | | | (2.67 | )% | | | 26.91 | % | | | 13.45 | % | | | (3.24 | )% |
Ratio/Supplemental Data | | | | | | | | | | | | | | | | | | | | |
Net Assets, End of Year (in 000’s) | | | $243,072 | | | | $216,047 | | | | $246,988 | | | | $257,430 | | | | $299,224 | |
Ratio of Expenses to Average Net Assets: | | | | | | | | | | | | | | | | | | | | |
Before Expenses Waived | | | 1.00 | % | | | 1.00 | % | | | 1.00 | % | | | 1.00 | % | | | 1.00 | % |
After Expenses Waived | | | 1.00 | %(2) | | | 1.00 | %(2) | | | 1.00 | %(2) | | | 0.91 | %(2) | | | 0.67 | % |
Ratio of Net Investment Income to Average Net Assets | | | 4.14 | % | | | 1.94 | % | | | 4.28 | % | | | 9.53 | % | | | 5.96 | % |
Portfolio Turnover Rate | | | 67.05 | % | | | 38.86 | % | | | 42.87 | % | | | 8.27 | % | | | 91.67 | % |
(1) Based on average shares outstanding.
(2) Effective March 29, 2012, the Manager’s contractual management fee waiver/expense reimbursement for the Fund expired.
The accompanying notes are an integral part of the financial statements.
13
THE FAIRHOLME FOCUSED INCOME FUND
NOTES TO FINANCIAL STATEMENTS
November 30, 2015
Note 1. Organization
Fairholme Funds, Inc. (the “Company”), a Maryland corporation, is registered under the Investment Company Act of 1940, as amended (the “1940 Act”), as an open-end management investment company. The Company’s Articles of Incorporation permit the Board of Directors of the Company (the “Board” or the “Directors”) to issue 1,100,000,000 shares of common stock at $.0001 par value. 200,000,000 shares have been allocated to The Fairholme Focused Income Fund (the “Fund”). The Fund is a non-diversified fund. The Fund may have a greater percentage of its assets invested in particular securities than a diversified fund, exposing the Fund to the risk of unanticipated industry conditions as well as risks specific to a single company or the securities of a single company. The Board has the power to designate one or more separate and distinct series and/or classes of shares of common stock and to classify or reclassify any unissued shares with respect to such series.
The Fund’s investment objective is to seek current income. Under normal circumstances, the Fund seeks to achieve its investment objective by investing in a focused portfolio of cash distributing securities. To maintain maximum flexibility, the securities in which the Fund may invest include corporate bonds and other corporate debt securities of issuers in the U.S. and foreign countries, bank debt (including bank loans and loan participations), government and agency debt securities of the U.S. and foreign countries (including U.S. Treasury bills), convertible bonds and other convertible securities, and equity securities, including preferred and common stock and interests in real estate investment trusts (“REITs”). Although the Fund normally holds a focused portfolio of securities, the Fund is not required to be fully invested in such securities and may maintain a significant portion of its total assets in cash and securities generally considered to be cash equivalents. Fairholme Capital Management, L.L.C. (the “Manager”) serves as investment adviser to the Fund.
There is no guarantee that the Fund will meet its objectives.
Note 2. Significant Accounting Policies
As an investment company, the Fund follows the investment company accounting and reporting guidance, which is part of U.S. generally accepted accounting principles (“U.S. GAAP”). The Fund’s investments are reported at fair value as defined by U.S. GAAP. The Fund calculates its net asset value as soon as practicable following the close of regular trading on the New York Stock Exchange (currently 4:00 p.m. Eastern Time) on each day the New York Stock Exchange is open.
A description of the valuation techniques applied to the Fund’s securities measured at fair value on a recurring basis follows:
Security Valuation:
Equity securities (common and preferred stocks): Securities traded on a national securities exchange or reported on the NASDAQ national market are generally valued at the official closing price, or at the last reported sale price on the exchange or market on which the securities are traded, as of the close of business on the day the securities are being valued or, lacking any sales, at the last available bid price. To the extent these securities are actively traded and valuation adjustments are not applied, they are classified in Level 1 of the fair value hierarchy. If these securities are not actively traded, they are classified in Level 2. The Manager may also employ other valuation methods which the Manager believes would provide a more accurate indication of fair value. In these situations, if the inputs are observable, the valuation will be classified in Level 2 of the fair value hierarchy, otherwise they would be classified in Level 3.
Fixed-income securities (U.S. government obligations, corporate bonds, convertible bonds, and asset backed securities): The fair value of fixed-income securities is estimated using market quotations when readily available, but may also be estimated by various methods when no such market quotations exist and when the Manager believes these other methods reflect the fair value of such securities. These methods may consider recently executed transactions in securities of the issuer or comparable issuers and market price valuations from independent pricing services and/or brokers (where observable). Where the Manager deems it appropriate to do so (such as when independent prices are unavailable or not deemed to be representative of fair value) long-term fixed-income securities will be fair valued in good faith following consideration by, and conclusion of, the Manager’s Valuation Committee. As of November 30, 2015, fixed-income securities are valued by the Manager utilizing observable market prices on the day of valuation or the average bid of independent broker/dealer quotes and/or the average
14
THE FAIRHOLME FOCUSED INCOME FUND
NOTES TO FINANCIAL STATEMENTS (continued)
November 30, 2015
of valuations from independent pricing services. Although fixed-income securities are classified in Level 2 of the fair value hierarchy at November 30, 2015, in instances where lower relative weight is placed on transaction prices, quotations, or similar observable inputs, they would be classified in Level 3.
Open-end mutual funds: Investments in open-end mutual funds including money market funds are valued at their closing net asset value each business day and are classified in Level 1 of the fair value hierarchy.
Short-term securities: Investments in securities with maturities of less than sixty days when acquired, or which subsequently are within sixty days of maturity, shall be valued at prices supplied by an independent pricing source or by one of the Fund’s pricing agents based on broker or dealer supplied valuations or matrix pricing. To the extent the inputs are observable and timely, the values would be classified in Level 2 of the fair value hierarchy.
Restricted securities: Depending on the relative significance of valuation inputs, these instruments may be classified in any level of the fair value hierarchy.
Warrants: The Fund may invest in warrants, which may be acquired either through a direct purchase, included as part of a private placement, or pursuant to corporate actions. Warrants entitle, but do not obligate, the holder to buy equity securities at a specific price for a specific period of time. Warrants may be considered more speculative than certain other types of investments in that they do not entitle a holder to dividends or voting rights with respect to the underlying securities that may be purchased nor do they represent any rights in the assets of the issuing company. Also, the value of a warrant does not necessarily change with the value of the underlying securities and a warrant ceases to have value if it is not exercised prior to its expiration date. Warrants traded on a security exchange are valued at the official closing price on the valuation date and are classified as Level 1 of the fair value hierarchy. Over the counter (OTC) warrants are valued using simulation models utilizing market value of the underlying security, expiration date of the warrants, volatility of the underlying security, strike price of the warrants, risk-free interest rate at the valuation date, and are classified as Level 2 or Level 3 of the fair value hierarchy depending on the observability of the inputs used.
The Fund uses several recognized industry third-party pricing services (TPPS) - approved by the Board and unaffiliated with the Manager - to value some of its securities. It also uses other independent market trade data sources (such as TRACE, the FINRA-developed mandatory reporting of over-the-counter secondary market transactions), as well as broker quotes provided by market makers. The data within these feeds is ultimately sourced from major stock exchanges and trading systems where these securities trade. If a price obtained from the pricing source is deemed unreliable, it may be discarded and/or challenged. In these cases the pricing decision is made by reference to the reliable market data from the other market data sources.
The Manager may determine the fair valuation of a security when market quotations are insufficient or not readily available, when securities are determined to be illiquid or restricted, or when in the judgment of the Manager the prices or values available do not represent the fair value of the instrument. Factors which may cause the Manager to make such a judgment include the following: (a) only a bid price or an asked price is available; (b) the spread between bid and asked prices is substantial; (c) the liquidity of the securities; (d) the frequency of sales; (e) the thinness of the market; (f) the size of reported trades; (g) actions of the securities markets, such as the suspension or limitation of trading; and (h) local market closures. Among the factors to be considered to fair value a security are recent prices of comparable securities that are publicly traded, reliable prices of securities not publicly traded, the use of valuation models, current analyst reports, valuing the income or cash flow of the issuer, or cost if the preceding factors do not apply. The circumstances of Level 3 securities are frequently monitored to determine if fair valuation measures continue to apply.
The Manager reports quarterly to the Board the results of the application of fair valuation policies and procedures.
15
THE FAIRHOLME FOCUSED INCOME FUND
NOTES TO FINANCIAL STATEMENTS (continued)
November 30, 2015
The inputs and valuation techniques used to measure fair value of the Fund’s investments are summarized into three levels as described in the hierarchy below:
| | |
| • Level 1 — | | quoted prices in active markets for identical securities; |
| |
| • Level 2 — | | other significant observable inputs (including quoted prices for similar securities, quoted prices in inactive markets for identical securities, interest rates, prepayment speeds, credit risk, etc.); and |
| |
| • Level 3 — | | significant unobservable inputs (including the Manager’s determination as to the fair value of investments). |
The inputs or methodology used for valuing investments are not necessarily an indication of the level of risk associated with investing in those investments. The summary of the Fund’s investments by inputs used to value the Fund’s investments as of November 30, 2015, is as follows:
| | | | | | | | | | | | | | | |
| | | Valuation Inputs | | |
| | | Level 1 –
Quoted Prices | | Level 2 – Other
Significant
Observable Inputs | | Total
Fair Value
at 11/30/2015 |
| | | |
ASSETS: | | | | | | | | | | | | | | | |
INVESTMENTS (Fair Value): | | | | | | | | | | | | | | | |
Domestic Equity Securities* | | | $ | 11,628,900 | | | | | — | | | | $ | 11,628,900 | |
Domestic Preferred Equity Securities | | | | | | | | | | | | | | | |
Consumer Finance | | | | — | | | | $ | 4,629,967 | | | | | 4,629,967 | |
Mortgage Finance | | | | 24,475,931 | | | | | 663,896 | | | | | 25,139,827 | |
Oil & Natural Gas Exploration | | | | 1,699,200 | | | | | 167,331 | | | | | 1,866,531 | |
Retail Department Stores | | | | — | | | | | 4,613,699 | | | | | 4,613,699 | |
Domestic Corporate Bonds* | | | | — | | | | | 83,065,330 | | | | | 83,065,330 | |
Foreign Corporate Bonds* | | | | — | | | | | 44,780,760 | | | | | 44,780,760 | |
Commercial Paper* | | | | — | | | | | 32,998,788 | | | | | 32,998,788 | |
U.S. Government Obligations | | | | — | | | | | 9,994,720 | | | | | 9,994,720 | |
Money Market Funds | | | | 16,573,023 | | | | | — | | | | | 16,573,023 | |
Miscellaneous Investments | | | | — | | | | | 4,620,000 | | | | | 4,620,000 | |
| | | | | | | | | | | | | | | |
TOTAL INVESTMENTS | | | $ | 54,377,054 | | | | $ | 185,534,491 | | | | $ | 239,911,545 | |
| | | | | | | | | | | | | | | |
* Industry classifications for these categories are detailed in the Schedule of Investments.
The Fund had no transfers between Level 1 and Level 2 during the fiscal year ended November 30, 2015. The Fund’s policy is to recognize transfers among Levels as of the beginning of the reporting period.
There were no Level 3 investments at November 30, 2015, or November 30, 2014.
Dividends and Distributions: The Fund records dividends and distributions to shareholders on the ex-dividend date. The Fund intends to declare and pay net investment income distributions, if any, quarterly in March, June, September, and December. The Fund intends to distribute any net long-term capital gains and any net short-term capital gains at least once a year. If the total dividends and distributions made in any tax year exceeds net investment income and accumulated realized capital gains, a portion of the total distribution may be treated as a tax return of capital.
Foreign Currency Translation: The books and records of the Fund are maintained in U.S. dollars. Foreign currency amounts are translated into U.S. dollars on the following basis: (i) fair value of investment securities, assets, and liabilities at the current rate of exchange; and (ii) purchases and sales of investment securities, income, and expenses at the relevant rates of exchange prevailing on the respective dates of such transactions. The Fund does not isolate that portion of gains and losses
16
THE FAIRHOLME FOCUSED INCOME FUND
NOTES TO FINANCIAL STATEMENTS (continued)
November 30, 2015
on investment securities which is due to changes in the foreign exchange rates from that which is due to changes in the market prices of such securities.
Estimates: The preparation of financial statements in conformity with U.S. GAAP requires the Fund to make estimates and assumptions that affect the reported amounts of assets and liabilities and disclosure of both contingent assets and liabilities at the date of the financial statements and the reported amounts of revenues and expenses during the reported period. Actual results could differ from those estimates.
Other: The Fund accounts for security transactions on the trade date for financial statement purposes. The specific identification method is used for determining gains or losses for financial statements and income tax purposes. Dividend income is recorded on the ex-dividend date net of foreign taxes withheld where recovery is uncertain and interest income is recorded on an accrual basis. Discounts and premiums on securities purchased are amortized over the life of the respective securities using the effective yield method. Securities denominated in currencies other than U.S. dollars are subject to changes in value due to fluctuation in exchange rates. The Fund may invest in countries that require governmental approval for the repatriation of investment income, capital, or the proceeds of sales of securities by foreign investors. In addition, if there is deterioration in a country’s balance of payments or for other reasons, a country may impose temporary restrictions on foreign capital remittances abroad.
The Fund paid commissions and other brokerage fees during the period.
Note 3. Related Party Transactions
The Manager is a Delaware limited liability company and is registered with the Securities and Exchange Commission as an investment adviser. The Manager’s principal business and occupation is to provide investment management and advisory services to individuals, corporations, and other institutions throughout the world. Pursuant to an Investment Management Agreement, the Fund pays a management fee to the Manager for its provision of investment advisory and operating services to the Fund. Subject to applicable waivers or limitations, the management fee is paid at an annual rate equal to 1.00% of the daily average net assets of the Fund. The Manager is responsible pursuant to the Investment Management Agreement for paying the Fund’s expenses for the following services: transfer agency, fund accounting, fund administration, custody, legal, audit, compliance, directors’ fees, call center, fulfillment, travel, insurance, rent, printing, postage and other office supplies. The Manager is not responsible for paying for the following costs and expenses of the Fund: commissions, brokerage fees, issue and transfer taxes, and other costs chargeable to the Fund in connection with securities transactions or in connection with securities owned by the Fund, taxes, interest, acquired fund fees and related expenses, expenses in connection with litigation by or against the Fund, and any other extraordinary expenses.
Effective March 29, 2012, the Manager’s contractual management fee waiver/expense reimbursement for the Fund expired. Prior to March 29, 2012, the Manager had contractually agreed to waive a portion of its management fee and/or limit the Fund’s operating expenses (excluding taxes, interest, brokerage commissions, acquired fund fees and expenses, expenses incurred in connections with any merger or reorganization and extraordinary expenses such as litigation) so that the Fund’s operating expenses, after such waiver or limitation payment, would not exceed an annual rate of 0.75% of the Fund’s daily average net assets for the period March 30, 2011 to March 29, 2012. For the period December 31, 2009 to March 30, 2011, the Manager had contractually agreed to waive a portion of its management fee and/or limit the Fund’s operating expenses (excluding those expenses noted above) so that the Fund’s operating expenses, after such waiver or limitation payment, would not exceed an annual rate of 0.50% of the Fund’s daily average net assets. The Manager may be reimbursed for fee waivers and/or expense limitation payments made in any fiscal year of the Fund over the following three fiscal years. Any reimbursement is subject to the Board’s review and approval. A reimbursement may be requested by the Manager if the aggregate amount paid by the Fund for operating expenses for such fiscal year, taking into account any reimbursement, does not exceed the fee waiver/expense limitation in place at the time of the initial waiver or reimbursement of the amount by the Manager. On November 30, 2015, reimbursements which were subject to recoupment by the Manager in the amount of $249,582 expired.
17
THE FAIRHOLME FOCUSED INCOME FUND
NOTES TO FINANCIAL STATEMENTS (continued)
November 30, 2015
The Manager earned $2,205,527 from the Fund for its services during the year ended November 30, 2015.
Bruce Berkowitz, both the Chief Investment Officer of the Manager and Chairman of the Fund’s Board, continues to have a significant personal stake in the Fund, holding an aggregate 1,440,894 shares at November 30, 2015.
A Director and Officers of the Fund are also Officers of the Manager or its affiliates.
Note 4. Investments
For the year ended November 30, 2015, aggregated purchases and sales of investment securities other than short-term investments and U.S. government obligations were as follows:
| | |
Purchases | | Sales |
$151,168,799 | | $112,616,736 |
Note 5. Tax Matters
Federal Income Taxes: The Fund intends to qualify each year as a “Regulated Investment Company” under Subchapter M of the Internal Revenue Code of 1986, as amended. By so qualifying, the Fund will not be subject to federal income taxes to the extent that it distributes all of its net investment income and any realized capital gains.
For U.S. federal income tax purposes, the cost of securities owned, gross unrealized appreciation, gross unrealized depreciation, and net unrealized appreciation of investments at November 30, 2015, were as follows:
| | | | | | |
| | | Gross Unrealized | | Gross Unrealized | | Net Unrealized |
Cost | | Appreciation | | Depreciation | | Depreciation |
$248,445,725 | | $3,359,378 | | $(11,893,558) | | $(8,534,180) |
The difference between book basis and tax basis net unrealized appreciation is attributable to capitalized cost.
The Fund’s tax basis capital gains are determined at the end of each fiscal year. As of November 30, 2015, the components of distributable earnings on a tax basis were as follows:
| | | | |
Undistributed Ordinary Income* | | $ | 2,490,873 | |
Net Long-Term Capital Gain | | | 1,134,600 | |
Net Unrealized Depreciation on Investments and Foreign Currency Related Transactions | | | (8,534,180) | |
| | | | |
Total | | $ | (4,908,707) | |
| | | | |
| |
* Inclusive of short-term capital gain | | | | |
The Fund is permitted to carry capital losses forward for an unlimited period. Capital losses that are carried forward will retain their character as either short term or long term capital losses.
The Manager has analyzed the Fund’s tax positions taken on tax returns for all open tax years (current and prior three tax years) and has concluded that there are no uncertain tax positions that require recognition of a tax liability. The Fund’s federal and state income and federal excise tax returns for tax years for which the applicable statutes of limitations have not expired (the current year and prior three years) are subject to examination by the Internal Revenue Service and state departments of revenue. Additionally, the Fund is not aware of any tax position for which it is reasonably possible that the total amounts of unrecognized tax benefits will change materially in the next twelve months.
Note 6. Dividends and Distributions to Shareholders
Ordinary income and capital gain distributions are determined in accordance with federal income tax regulations, which may differ from U.S. GAAP.
18
THE FAIRHOLME FOCUSED INCOME FUND
NOTES TO FINANCIAL STATEMENTS (continued)
November 30, 2015
The tax character of dividends and distributions paid by the Fund were as follows:
| | | | | | | | | | |
| | | For the
Fiscal Year Ended
November 30, 2015 | | For the
Fiscal Year Ended
November 30, 2014 |
| | |
Dividends and Distributions paid from: | | | | | | | | | | |
Ordinary Income | | | | $ 8,626,519 | | | | | $ 3,837,576 | |
Long-Term Capital Gain | | | | 2,939,655 | | | | | 13,876,149 | |
| | | | | | | | | | |
| | | | $11,566,174 | | | | | $17,713,725 | |
| | | | | | | | | | |
The Fund declared and made payable the following distribution on December 11, 2015:
| | | | |
Dividends and Distributions paid from: | | | | |
Ordinary Income | | $ | 2,978,314 | |
Short-Term Capital Gain | | | 528,009 | |
Long-Term Capital Gain | | | 1,134,811 | |
| | | | |
| | $ | 4,641,134 | |
| | | | |
Note 7. Reclassification in the Capital Accounts
In accordance with U.S. GAAP, the Fund has recorded reclassifications in their capital accounts. These reclassifications have no impact on the net asset value of the Fund and are designed generally to present undistributed income and realized gains on a tax basis which is considered to be more informative to the shareholder. Permanent differences are primarily due to the tax treatment of distributions from partnerships to the Fund. As of November 30, 2015, the Fund recorded the following reclassifications to increase (decrease) the accounts listed below:
| | | | |
Undistributed Net Investment Income | | | $ 32,964 | |
Accumulated Net Realized Gain | | | (32,964) | |
Note 8. Indemnifications
Under the Company’s organizational documents, its Officers and Directors are indemnified against certain liabilities arising out of the performance of their duties to the Fund. In the normal course of business the Company or the Fund enter into contracts that contain a variety of representations and customary indemnifications. The Fund’s maximum exposure under these arrangements is unknown as this would involve future claims that may be made against the Fund that have not yet occurred. However, based on its experience to date, the Fund expects the risk of loss to be remote.
19
REPORT OF INDEPENDENT REGISTERED PUBLIC ACCOUNTING FIRM
To the Board of Directors of Fairholme Funds, Inc. and
the shareholders of The Fairholme Focused Income Fund:
We have audited the accompanying statement of assets and liabilities, including the schedule of investments, of The Fairholme Focused Income Fund (the “Fund”), as of November 30, 2015, and the related statement of operations for the year then ended, the statements of changes in net assets for each of the two years in the period then ended, and the financial highlights for each of the five years in the period then ended. These financial statements and financial highlights are the responsibility of the Fund’s management. Our responsibility is to express an opinion on these financial statements and financial highlights based on our audits.
We conducted our audits in accordance with the standards of the Public Company Accounting Oversight Board (United States). Those standards require that we plan and perform the audit to obtain reasonable assurance about whether the financial statements and financial highlights are free of material misstatement. The Fund is not required to have, nor were we engaged to perform, an audit of its internal control over financial reporting. Our audits included consideration of internal control over financial reporting as a basis for designing audit procedures that are appropriate in the circumstances, but not for the purpose of expressing an opinion on the effectiveness of the Fund’s internal control over financial reporting. Accordingly, we express no such opinion. An audit also includes examining, on a test basis, evidence supporting the amounts and disclosures in the financial statements, assessing the accounting principles used and significant estimates made by management, as well as evaluating the overall financial statement presentation. Our procedures included confirmation of securities owned as of November 30, 2015, by correspondence with the custodian. We believe that our audits provide a reasonable basis for our opinion.
In our opinion, the financial statements and financial highlights referred to above present fairly, in all material respects, the financial position of The Fairholme Focused Income Fund as of November 30, 2015, the results of its operations for the year then ended, the changes in its net assets for each of the two years in the period then ended, and the financial highlights for each of the five years in the period then ended, in conformity with accounting principles generally accepted in the United States of America.
DELOITTE & TOUCHE LLP
Philadelphia, Pennsylvania
January 28, 2016
20
THE FAIRHOLME FOCUSED INCOME FUND
ADDITIONAL INFORMATION
November 30, 2015
Board of Directors (unaudited)
The Board of Directors has overall responsibility for conduct of the Company’s affairs. The day-to-day operations of the Fund are managed by the Manager, subject to the By-Laws of the Company and review by the Company’s Board. The Directors and Officers of the Company, including those Directors who are also officers, are listed below.
| | | | | | | | | | |
Name, Age & Address† | | Position(s) Held, Term of Office & Length of Time Served** | | Principal Occupation(s) During Past 5 Years§ | | | | Number of Portfolios in Fund Complex Overseen by Director | | Other Current Directorships Held by Director |
Interested Directors and Officers | | | | | | | | |
Bruce R. Berkowitz* Age 57 | | Mr. Berkowitz has served as a Director of the Company since December 15, 1999. | | Manager, Fairholme Holdings LLC since January 2015 and Chief Investment Officer, Fairholme Capital Management, L.L.C. since October 1997; Managing Member, Fairholme Capital Management, L.L.C. from October 1997 to December 2014. | | | | 3 | | Director and Chairman of the Board of Directors, The St. Joe Co. |
Cesar L. Alvarez, Esq.* Age 68 | | Mr. Alvarez has served as a Director of the Company since May 19, 2008. | | Senior Chairman effective January 1, 2016; Executive Chairman and Co-Chairman from 2010 to 2015; and Chief Executive Officer from 1997 to 2010 of Greenberg Traurig, LLP. | | | | 3 | | Chairman, Board of Directors, Mednax, Inc.; Director, Intrexon Corp., Sears Holdings Corp., and The St. Joe Co. |
Independent Directors^ | | | | | | |
Terry L. Baxter Age 70 | | Mr. Baxter has served as a Director of the Company since May 19, 2008. | | Chairman of the Board, CEO, Source One (retired); President of White Mountain Holdings (retired). | | | | 3 | | Director, Main Street America Group |
Howard S. Frank Age 74 | | Mr. Frank has served as a Director of the Company since May 7, 2007. | | Chairman of the Board of Costa Crociere S.p.A. since 2014; Special Advisor to the CEO and to the Chairman of Carnival Corporation & plc. since 2013; Vice Chairman, Chief Operating Officer and Director, Carnival Corporation & plc. 1989 to 2013 | | | | 3 | | Director, New World Symphony; Director, The St. Joe Co. |
Steven J. Gilbert Age 68 | | Mr. Gilbert has served as a Director of the Company since June 16, 2014 | | Chairman, Gilbert Global Equity Partners, L.P. since 1998; Vice Chairman, MidOcean Equity Partners, L.P. since 2005; Co-Chairman, Birch Grove Capital since 2013; Senior Managing Director and Chairman, Sun Group (USA) from 2007 to 2009. | | | | 3 | | Chairman, CPM Holdings, Inc.; Director, MBIA, Inc.; Lead Independent Director, Empire State Realty Trust; Lead Independent Director, TRI Pointe Homes, Inc.; Director, Waterpik, Inc., and Director, Trade Informatics, Inc. |
Avivith Oppenheim, Esq. Age 65 | | Ms. Oppenheim has served as a Director of the Company since December 15, 1999. | | Attorney-at-Law. | | | | 3 | | None. |
Leigh Walters, Esq. Age 69 | | Mr. Walters has served as a Director of the Company since December 15, 1999. | | Vice-President and Director, Valcor Engineering Corporation. Attorney-at-Law. | | | | 3 | | Director, Valcor Engineering Corporation |
| † | Unless otherwise indicated, the address of each Director of the Company is c/o Fairholme Capital Management, L.L.C., 4400 Biscayne Blvd., 9th Floor, Miami, FL 33137. |
| ^ | Directors who are not “interested persons” of the Company as defined under the 1940 Act. |
| * | Mr. Berkowitz and Mr. Alvarez are each an interested person, as defined in the 1940 Act, of the Company because of their affiliation with the Manager. |
| ** | Each Director serves for an indefinite term. Each officer serves for an annual term and until his or her successor is elected and qualified. |
| § | The information reported includes the principal occupation during the last five years for each Director and other information relating to the professional experiences, attributes and skills relevant to each Director’s qualifications to serve as Director. |
21
THE FAIRHOLME FOCUSED INCOME FUND
ADDITIONAL INFORMATION (continued)
November 30, 2015
Officers (unaudited)
| | | | | | | | | | | | | | |
| Name, Age & Address† | | | | Position(s) Held with the Company | | | | Term of Office & Length of Time Served* | | | | | | Principal Occupation(s) During Past 5 Years |
Fernando Font Age 41 | | | | Vice President | | | | Mr. Font has served as Vice President of the Company since June 2015. | | | | | | Chief Administrative Officer of Fairholme Capital Management, L.L.C. since August 2009. |
Wayne Kellner Age 46 | | | | Treasurer | | | | Mr. Kellner has served as Treasurer of the Company since March 2012. | | | | | | Chief Operating Officer, Fairholme Capital Management, L.L.C. since June 2014; Chief Financial Officer, Fairholme Capital Management, L.L.C. since January 2012; Treasurer, Fairholme Capital Management, L.L.C. from January 2011 to December 2011; Tax Principal, Rothstein Kass from 2006 to 2010. |
Paul R. Thomson Age 59 | | | | Chief Compliance Officer and Secretary | | | | Mr. Thomson has served as Chief Compliance Officer of the Company since April 2010 and has served as Secretary of the Company since June 2011. Mr. Thomson previously served as Chief Compliance Officer from November 2008 to January 2009. | | | | | | Chief Compliance Officer, Fairholme Capital Management L.L.C. since April 2010; Chief Financial Officer, Fairholme Capital Management L.L.C. from January 2008 to January 2012. |
† Unless otherwise indicated, the address of each Officer of the Company is c/o Fairholme Capital Management, L.L.C., 4400 Biscayne Blvd., 9th Floor, Miami, FL 33137.
* Each officer serves for an annual term and until his or her successor is elected and qualified.
22
THE FAIRHOLME FOCUSED INCOME FUND
ADDITIONAL INFORMATION (continued)
November 30, 2015
Approval of Investment Management Agreement (unaudited)
At its meeting on October 22, 2015, the Board of Directors (the “Board” or the “Directors”) of Fairholme Funds, Inc. (the “Company”) approved the renewal of the investment management agreement between the Company, on behalf of The Fairholme Focused Income Fund (the “Fund”), and Fairholme Capital Management, L.L.C. (the “Manager”). In considering whether to approve the renewal of the agreement, the Directors considered the factors discussed below, and information made available to them at the meeting relating to such factors, and other information they deemed relevant. The renewal of the agreement was not, however, based on any single factor, but on an evaluation of the totality of factors and information reviewed and evaluated by the Directors.
A. Nature, Extent and Quality of Services
The Directors considered information provided to them concerning the services performed by the Manager for the Fund pursuant to the agreement. The Directors reviewed information concerning the nature, extent and quality of investment advisory and operational services provided, or overseen, by the Manager. The Directors reviewed information concerning the personnel responsible for the day-to-day portfolio and administrative management of the Fund, the overall reputation of the Manager and the Manager’s current and planned staffing levels. The Directors considered the Manager’s commitment to the Fund as evidenced, among other things, by the current share ownership of the Fund by management/owners/employees of the Manager. The Directors considered information describing the Manager’s compliance policies and procedures, including recent updates to those policies and information concerning the policies designed to address the Fund’s compliance with its investment objective, policies and restrictions and applicable regulatory requirements and to address the Manager’s conflicts of interest in providing services to the Fund and to other advisory clients.
The Directors did not compare services provided by the Manager to the Fund with the services provided by Manager to its other advisory accounts because such accounts are not subject to the same regulatory requirements as the Fund, may have different investment restrictions, holdings and goals than the Fund and require different levels of client and back-office servicing than the Fund.
The Directors concluded that the nature, extent and quality of services provided by the Manager to the Fund were appropriate and sufficient to support renewal of the agreement.
B. Investment Performance
The Directors considered information regarding the Fund’s performance, the Manager’s views on performance and the holdings of the Fund that contributed negatively and positively to the Fund’s performance. The Directors also reviewed and considered a third-party report (from Lipper/Broadridge, “Lipper”) comparing information about the investment performance of the Fund, including information reflecting that the Fund’s performance had trailed the 1-year performance of its Lipper peer group’s average and median performance by 0.72 and 3.5 percentage points, but that the 3-year, 5-year and since inception annualized performance of the Fund exceeded both the average and median annualized performance of similarly situated mutual funds for those periods by 4.71 and 5.01, 3.01 and 2.47, and 1.21 and 0.70 percentage points, respectively. The Directors also noted that while the Fund’s performance for the year ended August 31, 2015 trailed the Barclays Capital US Aggregate Bond Index, its benchmark, by 3.03 percentage points, its annualized performance for the 3-year, 5-year, and since-inception periods exceeded the benchmark index by 7.70, 5.54 and 4.46 percentage points, respectively. The Directors considered information provided to them concerning the performance of the Fund in light of market events and other factors affecting the Fund’s performance and information about developments with respect to specific issuers of securities held in the Fund’s portfolio. They also considered other information about the Fund’s total returns and focused investment strategies.
C. Management Fees and Expense Ratios
The Directors considered information about the Fund’s management fee and expense ratio, including information in the Lipper report comparing the Fund’s management fee and the most recent Total Expense ratio to the advisory fees and expense
23
THE FAIRHOLME FOCUSED INCOME FUND
ADDITIONAL INFORMATION (continued)
November 30, 2015
ratios of other similarly situated mutual funds. The Directors noted for the Fund that the Management Fee was reasonable when compared to the median of the peer groups’ Advisory Fees when consideration was given to the Fund operating and other expenses that the Manager pays on behalf of the Fund. The Directors noted that, for the Fund, the total expense ratio for its latest full fiscal year was lower than the median expense ratio of the most recently completed fiscal year of its peer group funds included in the Lipper report.
In evaluating the management fee and expense ratio information, the Directors took into account the demands and complexity of portfolio management for the Fund in light of its investment objective, strategies, and asset size. The Directors also considered information regarding the Manager’s payment (in some cases from its resources) of certain expenses for the benefit of the Fund, including shareholder account-level expenses associated with certain omnibus accounts. The Directors also reviewed information concerning the fees paid to the Manager by its other advisory accounts.
After reviewing information presented to them concerning fees, expenses, performance and other matters, the Directors concluded that the Fund’s management fee and overall expense ratio were reasonable in light of the services provided by or through the Manager.
D. Profitability
The Directors considered information regarding the estimated profitability of the Fund to the Manager. They considered such profitability in light of the Fund’s assets under management, overall expense ratio, performance and the services provided by or through the Manager, and concluded that the Manager’s estimated profitability was not such as to prevent Directors from approving the renewal of the agreement.
E. Economies of Scale
The Directors considered information concerning economies of scale for the Fund, including the current assets of the Fund. The Directors concluded for the Fund that no modification to the Fund’s existing arrangements was warranted based on economies of scale.
Proxy Voting Policies, Procedures and Records (unaudited)
The Company has adopted policies and procedures that provide guidance and set forth parameters for the voting of proxies relating to securities held in the Fund’s portfolio. A description of these policies and procedures, and records of how the Fund voted proxies relating to their portfolio securities during the most recent twelve month period ended June 30, 2015, are available to you upon request and free of charge by writing to the Fairholme Funds, Inc., c/o BNY Mellon Investment Servicing (US) Inc., P.O. Box 9692, Providence, RI, 02940 or by calling Shareholder Services at 1-866-202-2263 or visiting our website at fairholmefunds.com. They may also be obtained by visiting the Securities and Exchange Commission (“SEC”) website at www.sec.gov. The Company shall respond to all shareholder requests for records within three business days of its receipt of such request by first-class mail or other means designed to ensure prompt delivery.
N-Q Filing (unaudited)
The Company files a complete schedule of the Fund’s portfolio holdings on Form N-Q for the fiscal quarters ending February 28 (February 29 during leap year) and August 31. The Form N-Q filing must be made within 60 days of the end of the quarter. The Forms N-Q relating to the Fund’s portfolio investments are available on the SEC’s website at www.sec.gov, or may be reviewed and copied at the SEC’s Public Reference Room in Washington, DC (call 1-800-732-0330 for information on the operation of the Public Reference Room).
24
THE FAIRHOLME FOCUSED INCOME FUND
ADDITIONAL INFORMATION (continued)
November 30, 2015
Shareholder Tax Information (unaudited)
The Fund reported $11,566,174 of total distributions paid during the fiscal year ended November 30, 2015, and $2,939,655 of that represented long-term capital gain distributions.
The information below is reported for the Fund’s fiscal year and not calendar year. Therefore, shareholders should refer to their Form 1099-DIV or other tax information which will be mailed in 2016 to determine the calendar year amounts to be included on their 2015 tax returns. Shareholders should consult their own tax advisors.
Please note that, for the fiscal year ended November 30, 2015, the respective percentages of ordinary income distributions paid by the Fund were reported as follows:
| | | | |
Distribution Period November 30, 2015 | | The Fund | |
| |
Qualified Dividend Income for Individuals | | | 10.88% | |
Dividends Qualifying for the Dividends Received Deduction for Corporations | | | 11.10% | |
Qualifying Interest Income | | | 76.44% | |
U.S. Treasury Securities | | | 0.19% | |
* The law varies in each state as to whether and what percentage of dividend income attributable to U.S. Treasury securities is exempt from state and local income tax. It is recommended that you consult your tax advisor to determine if any portion of the dividends you received is exempt from income taxes.
All information reported is based on financial information available as of the date of this annual report and, accordingly, are subject to change. For each item, it is the intention of the Fund to report the maximum amount permitted under the Internal Revenue Code and the regulations thereunder.
25

| | |
Officers of Fairholme Funds, Inc. BRUCE R. BERKOWITZ President FERNANDO M. FONT Vice President WAYNE KELLNER Treasurer PAUL R. THOMSON Chief Compliance Officer & Secretary | | |
Board of Directors of Fairholme Funds, Inc. CESAR L. ALVAREZ, Esq. TERRY L. BAXTER BRUCE R. BERKOWITZ HOWARD S. FRANK STEVEN J. GILBERT, Esq. AVIVITH OPPENHEIM, Esq. LEIGH WALTERS, Esq. | | |
Investment Manager FAIRHOLME CAPITAL MANAGEMENT, L.L.C. 4400 Biscayne Boulevard, Miami, FL 33137 Transfer Agent, Fund Accountant & Administrator BNY MELLON INVESTMENT SERVICING (US) INC. 760 Moore Road, King of Prussia, PA 19406 Custodian THE BANK OF NEW YORK MELLON One Wall Street, New York, NY 10286 Independent Registered Public Accounting Firm DELOITTE & TOUCHE LLP 1700 Market Street, Philadelphia, PA 19103 Legal Counsel SEWARD & KISSEL LLP 901 K Street NW, Washington, DC 20001 | | |
THIS REPORT IS PROVIDED FOR THE GENERAL INFORMATION OF THE SHAREHOLDERS OF FAIRHOLME FUNDS, INC. IT IS NOT INTENDED FOR DISTRIBUTION TO PROSPECTIVE INVESTORS IN THE FUNDS UNLESS PRECEDED OR ACCOMPANIED BY AN EFFECTIVE PROSPECTUS, WHICH CONTAINS MORE INFORMATION ON FEES, CHARGES AND OTHER EXPENSES AND SHOULD BE READ CAREFULLY BEFORE INVESTING OR SENDING MONEY. PAST PERFORMANCE IS NOT A GUARANTEE OF FUTURE RESULTS. SHARES OF THE FUNDS ARE DISTRIBUTED BY FAIRHOLME DISTRIBUTORS, LLC.


“(E)ven the intelligent investor is likely to need considerable
willpower to keep from following the crowd.”
Benjamin Graham
This page is not part of The Fairholme Allocation Fund 2015 Annual Report.
FAIRHOLME CAPITAL MANAGEMENT, L.L.C.
PORTFOLIO MANAGER’S REPORT
For the Year Ended December 31, 2015
Mutual fund investing involves risks, including loss of principal. The charts below cover the period from inception of The Fairholme Allocation Fund (December 31, 2010) to December 31, 2015. Unless otherwise specified, all holdings information is shown as of December 31, 2015. Past performance information quoted below does not guarantee future results. The investment return and principal value of an investment in The Fairholme Allocation Fund will fluctuate so that an investor’s shares, when redeemed, may be worth more or less than their original cost. Current performance may be lower or higher than the performance information quoted below. Performance figures assume reinvestment of dividends and capital gains, but do not reflect a 2.00% redemption fee on shares redeemed within 60 days of purchase. Most recent month-end performance and answers to any questions you may have can be obtained by calling Shareholder Services at 1.866.202.2263. The Fairholme Allocation Fund invests opportunistically in a focused portfolio of investments in a limited number of issuers and does not seek to diversify its investments. This exposes The Fairholme Allocation Fund to the risk of unanticipated industry conditions and risks particular to a single company or the securities of a single company. The Fairholme Allocation Fund’s performance may differ markedly from the performance of the S&P 500 Index or the Barclays Capital U.S. Aggregate Bond Index in either up or down market trends. The S&P 500 Index is a broad-based measurement of changes in the stock market and the performance of the S&P 500 Index is shown with all dividends reinvested and does not reflect any reduction in performance for the effects of transaction costs or management fees. The Barclays Capital U.S. Aggregate Bond Index is an unmanaged market-weighted index comprised of investment-grade (rated Baa3/BBB-/BBB- or higher) taxable bonds, mortgage-backed securities, asset-backed securities, corporate securities, and government-related securities, including U.S. Treasury and government agency issues, with at least one year to maturity. The S&P 500 Index and the Barclays Capital U.S. Aggregate Bond Index are used for comparative purposes only, and are not meant to be indicative of The Fairholme Allocation Fund’s performance, asset composition, or volatility. Because indices cannot be invested in directly, these index returns do not reflect a deduction for fees, expenses, or taxes. The Fairholme Allocation Fund’s expense ratio reflected in its prospectus dated March 27, 2015, was 1.01%, which included acquired fund fees and expenses that were incurred indirectly by The Fairholme Allocation Fund as a result of investments in securities issued by one or more investment companies.
January 28, 2016
The Fairholme Allocation Fund vs. The Barclays Capital U.S. Aggregate Bond Index and The S&P 500 Index
| | | | | | | | | | | | |
| Year | | The Fairholme Allocation Fund | | | The Barclays Capital U.S.
Aggregate Bond Index | | | The S&P 500 Index | |
2011 | | | (14.0)% | | | | 7.8% | | | | 2.1% | |
2012 | | | 9.5% | | | | 4.2% | | | | 16.0% | |
2013 | | | 45.5% | | | | (2.0)% | | | | 32.4% | |
2014 | | | (9.0)% | | | | 6.0% | | | | 13.7% | |
2015 | | | (14.9)% | | | | 0.6% | | | | 1.4% | |
Compounded Annual Gain | | | 1.2% | | | | 3.3% | | | | 12.6% | |
Overall Gain | | | 6.1% | | | | 17.3% | | | | 80.8% | |
This page is not part of The Fairholme Allocation Fund 2015 Annual Report.
i
To the Shareholders and Directors of The Fairholme Allocation Fund:
The Fairholme Allocation Fund (the “Fund” or “FAAFX”) decreased 14.89% versus an increase of 0.55% for the Barclays Capital U.S. Aggregate Bond Index (the “Barclays Bond Index”) and a 1.38% increase for the S&P 500 Index (the “S&P 500”) in 2015. The following table compares the Fund’s unaudited performance (after expenses) with that of the Barclays Bond Index and S&P 500, with dividends and distributions reinvested, for various periods ending December 31, 2015.
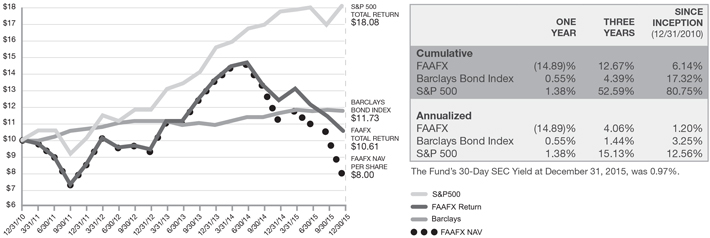
At December 31, 2015, the value of a $10.00 investment in the Fund at its inception was worth $10.61 (assumes reinvestment of distributions into additional Fund shares), compared to $11.73 and $18.08 for the Barclays Bond Index and the S&P 500, respectively.
Entering its sixth year, the Fund had 25.4% of its assets in cash and cash equivalents as investors remain fixated on a slowing China, freefalling commodity prices, and increased market volatility. We believe the portfolio is well positioned to weather today’s jittery environment and ultimately outperform in the years ahead.
Sears Holdings Corporation (“Sears”) common stock and warrants comprise 15.6% of the Fund’s assets. Our ongoing valuation work of Sears’ real estate, which has been independently corroborated by third party real estate professionals, reinforces our strong belief that this company is intrinsically worth multiples of its current market price – and we took advantage of price declines in the second half of the year to increase the Fund’s stake. During 2015, Sears continued its retail transformation while also raising over $3 billion from the sale of 266 real estate properties. Sears used a portion of the proceeds to pay down $936 million of debt and also amended and extended its $3.25 billion credit facility, reducing its net debt to the lowest level this decade. The company must now accelerate its return to profitability in order to rebuild confidence with customers, creditors, vendors, employees, and other investors. Doing so should enable Sears to optimize the value of all its assets.
Seritage Growth Properties (“Seritage”), a newly formed public real estate investment trust (REIT) that purchased the aforementioned 266 properties from Sears, comprises 15.1% of Fund assets. Our detailed property-by-property analysis indicates that Seritage is significantly undervalued at current market prices. One can only speculate that Warren Buffett concurs with this assessment given his recent decision to personally acquire shares of Seritage. Seritage’s real estate portfolio, which includes 235 properties and joint venture interests in 31 additional properties, has the opportunity to recycle existing leases into new leases commanding significantly higher rents. We anticipate that more than half of the company’s 42 million square feet will be redeveloped and re-tenanted, which should ultimately boost cash flow and fuel meaningful dividend growth over time.
The preferred securities of Fannie Mae and Freddie Mac represent 11.1% of Fund assets. At their core, Fannie Mae and Freddie Mac are simple and straightforward insurance companies. They are not banks. There isn’t a local Fannie Mae or Freddie Mac branch on the street corner. Unlike the big banks, Fannie Mae and Freddie Mac did not commit any consumer fraud in the run-up to the financial crisis. The two do not originate mortgages and they do not deal directly with individual homeowners. But when it comes to funding our nation’s housing market, Fannie Mae and Freddie Mac are mission critical. Simply put, if you own a home, Fannie Mae and Freddie Mac have helped you. If you have a mortgage, Fannie Mae and Freddie Mac have helped you. If you rent a home, Fannie Mae and Freddie Mac have helped you. And Fannie Mae and Freddie Mac have helped millions of American families buy, rent, or refinance a home even during the toughest economic times when banks and other lenders shunned mortgage risk. They are the housing finance system in America, and earn a nominal amount (less than 40 basis points) for ensuring that the venerable 30-year fixed-rate mortgage remains widely accessible and affordable.
During the 2008 financial crisis, Fannie Mae and Freddie Mac helped save America’s home mortgage system and resuscitated our national economy by continuing to provide liquidity when credit markets froze. In fact, according to a comprehensive analysis by Thomas Ferguson and Robert Johnson published in the International Journal of Political Economy, federal regulators explicitly directed Fannie Mae and Freddie Mac to initiate massive purchases of “home mortgages and mortgage bonds to stem declines in those markets and alleviate pressures on the balance sheets of private firms,” particularly “overburdened banks.” Then in 2012, Treasury’s decision to usurp all of the profits from each company in perpetuity (the so-called “Net Worth Sweep”) improved the federal budget deficit in an election year and avoided protracted debt ceiling negotiations with Congressional Republicans.
This page is not part of The Fairholme Allocation Fund 2015 Annual Report.
ii
Today, taxpayers own 79.9% of Fannie Mae and Freddie Mac. Only those who oppose the dream of American homeownership would attempt to dismantle President Franklin Roosevelt’s New Deal by eliminating two publicly traded, shareholder-owned companies that have single-handedly provided $7 trillion dollars – yes, trillion – in liquidity to support America’s mortgage market since 2009.
Shareholders simply request that the Treasury Department respect the capital structure of each company, respect the economic bundle of rights associated with our securities, and respect the law setting forth the rules of a conservatorship as decreed by Congress. The economist Herbert Stein once famously said: “If something cannot go on forever, it will stop.” Sooner rather than later, we believe the Net Worth Sweep will be halted and a common sense solution will prevail: Fannie Mae and Freddie Mac will transform into low-risk, public utilities with regulated rates of return, just like your local electric company.
Bank of America warrants comprise 9.4% of Fund assets. The warrants offer attractive upside given that the company trades under tangible book value per share of $15.62. CEO Brian Moynihan recently noted that Bank of America’s 2015 results were the “company’s highest earnings in nearly a decade,” and much more improvement is possible. As the company reduces expenses and increases capital distributions, the double-ratchet feature of our warrants ensures that we are more than compensated for dividends paid to common equity shareholders.
American International Group (“AIG”) warrants comprise 4.6% of Fund assets and are attractive for the very same reasons.
Imperial Metals Corporation (“Imperial”), whose securities comprise 4.9% of Fund assets, posted record production results in 2015: 88.1 million pounds of copper, 44.7 thousand ounces of gold, and 224.5 thousand ounces of silver. During the year, the company focused on ramping up its world-class Red Chris mine that is expected to produce copper at cash costs around $1.20 per pound for decades to come. While primarily known for its huge copper reserve, Red Chris also boasts the seventh largest gold deposit in the world. We anticipate that Imperial will prudently weather this commodity cycle while preparing for the next development phase at Red Chris.
The precipitous decline in oil and gas prices has roiled the energy sector. Industry participants in all parts of the production process are being forced to adjust to today’s reality, characterized by oversupplied markets and irrational production dynamics. The Fund has purchased common shares in MRC Global and NOW Inc. that collectively comprise 2.5% of Fund assets. Both companies are essential to the North American energy distribution markets. In our view, each company possesses the financial wherewithal to survive this downturn and thrive once energy markets normalize. During the year, the Fund also purchased senior unsecured bonds of offshore driller Atwood Oceanics (“Atwood”), which comprises 1.8% of Fund assets, at a significant discount to par. Atwood owns 11 modernized drill rigs, and has manageable debt and solid contract coverage into 2018. At current bond prices, the market is ignoring Atwood’s substantial asset value and conservative operating culture that dates back to 1968.
The Fund reopened to new investors in November 2015. Effective February 1, 2016, the initial subscription minimum is $10,000, and the subsequent subscription minimum is $1,000. We believe that opportunities abound, and the Fund is poised for future capital appreciation.
We are pleased to invite shareholders to join us for a public conference call in the near future, during which I will discuss the Fund’s investments and address your questions. Details will be made available on www.fairholmefunds.com in the coming weeks, along with additional updated information on our investments.
|
Respectfully submitted, |
|

|
Bruce R. Berkowitz |
Chief Investment Officer |
Fairholme Capital Management |
The Portfolio Manager’s Report is not part of The Fairholme Allocation Fund’s Annual Report due to forward-looking statements that, by their nature, cannot be attested to, as required by regulation. The Portfolio Manager’s Report is based on calendar-year performance and precedes a more formal Management Discussion and Analysis. Opinions of the Portfolio Manager are intended as such, and not as statements of fact requiring attestation.
This page is not part of The Fairholme Allocation Fund 2015 Annual Report.
iii
“Traditionally the investor has been the man with patience
and the courage of his convictions who would buy when the
harried or disheartened speculator was selling.”
Benjamin Graham & David Dodd
This page is not part of The Fairholme Allocation Fund 2015 Annual Report.

The Fairholme Allocation Fund (FAAFX)
Seeking long-term total return
Annual Report 2015
Managed by Fairholme Capital Management
1.866.202.2263 • fairholmefunds.com
THE FAIRHOLME ALLOCATION FUND
TABLE OF CONTENTS
November 30, 2015
2
THE FAIRHOLME ALLOCATION FUND
FUND PERFORMANCE (unaudited)
Inception through November 30, 2015
THE FAIRHOLME ALLOCATION FUNDVS. The BARCLAYS CAPITAL U.S.
AGGREGATE BOND INDEXAND THE S&P 500 INDEX
INITIAL MINIMUM INVESTMENTOF $25,000
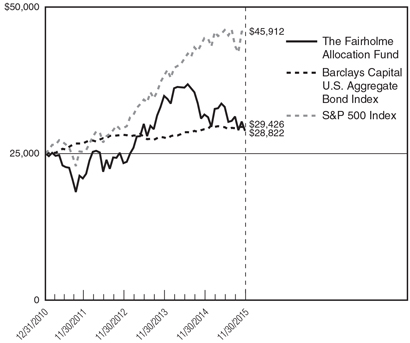
The Fairholme Allocation Fund (the “Fund”) commenced operations on December 31, 2010. The chart above presents the performance of a $25,000 investment from inception to the latest fiscal year ending November 30, 2015.
The following notes pertain to the chart above as well as to the performance table included in the Management Discussion & Analysis Report. Performance information in this report represents past performance and is not a guarantee of future results. The investment return and principal value of an investment in the Fund will fluctuate, so that an investor’s shares when redeemed may be worth more or less than their original cost. Current performance may be lower or higher than the performance quoted within. The performance information does not reflect the taxes an investor would pay on Fund distributions or upon redemption of the Fund shares. Most recent month-end performance and answers to any questions you may have can be obtained by calling Shareholder Services at 1-866-202-2263.
Data for the Barclays Capital U.S. Aggregate Bond Index, the S&P 500 Index and the Fund are presented assuming all dividends and distributions have been reinvested and do not reflect any taxes that might have been incurred by a shareholder as a result of the Fund distributions. The Barclays Capital U.S. Aggregate Bond Index is an unmanaged market-weighted index comprised of investment grade corporate bonds (rated BBB or better), mortgages, and U.S. Treasury and government agency issues with at least one year to maturity. The S&P 500 Index is a widely recognized, unmanaged index of 500 of the largest companies in the United States as measured by market capitalization and does not reflect any investment management fees or transaction expenses, nor the effects of taxes, fees, or other charges.
3
THE FAIRHOLME ALLOCATION FUND
MANAGEMENT DISCUSSION & ANALYSIS
For the Fiscal Year Ended November 30, 2015
The Fairholme Allocation Fund (the “Fund”) shares outstanding and audited net asset value per share (“NAV”) at November 30, 2015, the end of the Fund’s fiscal year, and per share NAVs at other pertinent dates, were as follows:
| | | | | | |
11/30/2015 Shares Outstanding | | 11/30/2015
NAV
(audited) | | 05/31/2015
NAV
(unaudited) | | 11/30/2014
NAV
(audited) |
| 28,608,762 | | $10.40 | | $11.88 | | $12.57 |
At December 31, 2015, the unaudited per share NAV of the Fund was $8.00. Performance figures below are shown for the Fund’s fiscal year ended November 30, 2015, and do not match calendar year figures for the period ended December 31, 2015, cited in the Portfolio Manager’s report.
| | | | | | | | | | | | |
Fund Performance
to 11/30/2015 | | Six
Months | | | One
Year | | | Since
Inception
12/31/2010 | |
| | | |
Cumulative: | | | | | | | | | | | | |
Fund | | | (12.46) | % | | | (8.88)% | | | | 15.29% | |
Barclays Bond Index | | | (0.12) | % | | | 0.98% | | | | 17.70% | |
S&P 500 | | | (0.21) | % | | | 2.75% | | | | 83.65% | |
| | | |
Annualized: | | | | | | | | | | | | |
Fund | | | | | | | (8.88)% | | | | 2.94% | |
Barclays Bond Index | | | | | | | 0.98% | | | | 3.37% | |
S&P 500 | | | | | | | 2.75% | | | | 13.16% | |
For the six months ended November 30, 2015, the Fund was outperformed by the Barclays Capital U.S. Aggregate Bond Index (“Barclays Bond Index”) and the S&P 500 Index (“S&P 500”) by 12.34 and 12.25 percentage points, respectively, while over the last year the Fund was outperformed by the Barclays Bond Index and S&P 500 by 9.86 and 11.63 percentage points, respectively. From inception, the Fund was outperformed by the Barclays Bond Index and the S&P 500 by 0.43 and 10.22 percentage points per annum or, on a cumulative basis, 2.41 and 68.36 percentage points over the past four years and eleven months, respectively.
Fairholme Capital Management, L.L.C. (the “Manager”) believes performance over shorter periods is likely to be less meaningful than performance over longer periods. Investors are cautioned not to rely on short-term results. The fact that securities increase or decline in value does not always indicate that the Manager believes these securities to be more or less attractive — in fact, the Manager believes that some price increases present selling opportunities and some price declines present buying opportunities.
Further, shareholders should note that the S&P 500 and the Barclays Bond Index are unmanaged indices incurring no fees, expenses, or tax effects and are shown solely to compare Fund performance to that of unmanaged and diversified indices of U.S. publicly traded corporation common stock.
Shareholders are also cautioned that it is possible that some securities mentioned in this discussion may no longer be held by the Fund subsequent to the end of the fiscal period and that the Fund may have made significant new purchases that are not yet required to be disclosed. It is the Fund’s general policy not to disclose portfolio holdings other than when required by relevant law or regulation. Portfolio holdings are subject to change without notice.
Not all Fund portfolio dispositions or additions are material, and, while the Fund and the Manager have long-term objectives, it is possible that a security sold or purchased in one period will be purchased or sold in a subsequent period. Generally, the Manager determines to buy and sell based on its estimates of the absolute and relative intrinsic values and fundamental dynamics of a particular security and its issuer and its industry. However, certain strategies of the Manager in carrying out Fund policies may result in shorter holding periods.
4
THE FAIRHOLME ALLOCATION FUND
MANAGEMENT DISCUSSION & ANALYSIS (continued)
For the Fiscal Year Ended November 30, 2015
The Manager invests Fund assets in securities to the extent it finds reasonable investment opportunities in accordance with its Prospectus and may invest a significant portion of Fund assets in liquid, low-risk securities or cash. The Manager views liquidity as a strategic advantage. At November 30, 2015, cash and cash equivalents (consisting of cash, commercial paper, deposit accounts, U.S. Treasury Bills, and money-market funds) represented 14.67% of total assets. Since inception, the Fund has held liquid, low-risk securities or cash for periods without negatively influencing performance, although there is no guarantee that future performance will not be negatively affected by Fund liquidity.
The Fund is considered to be “non-diversified” under the Investment Company Act of 1940. The Fund can invest a greater percentage of assets in fewer securities than a diversified fund and may invest a significant portion of cash and liquid assets in one or more higher-risk securities at any time, particularly in situations where markets are weak or a particular security declines sharply. The Fund may also have a greater percentage of assets invested in a particular industry than a diversified fund, exposing the Fund to the risk of an unanticipated industry condition as well as risks specific to a single company or security. For the fiscal year ended November 30, 2015, the Fund investments that performed the best were Canadian Natural Resources Ltd. and Valeant Pharmaceuticals International, Inc. The biggest contributors to negative performance were investments in Sears Holdings Corp., Imperial Metals Corp., Bank of America Corp., Seritage Growth Properties, and Leucadia National Corp. The following charts show the top holdings by issuer and sector in descending order of net assets as of November 30, 2015.
| | | | | | | | | | | | |
| | | |
The Fairholme Allocation Fund Top Holdings by Issuer* (% of Net Assets) | | | | | The Fairholme Allocation Fund Top Sectors (% of Net Assets) | |
| | | | | |
Sears Holdings Corp. | | | 16.5% | | | | | Retail Department Stores | | | 18.2% | |
Seritage Growth Properties | | | 11.9% | | | | | Cash and Cash Equivalents** | | | 14.8% | |
Bank of America Corp. | | | 11.7% | | | | | Mortgage Finance | | | 12.2% | |
Federal National Mortgage Association | | | 6.3% | | | | | Real Estate Investment Trusts | | | 11.9% | |
Federal Home Loan Mortgage Corp. | | | 5.9% | | | | | Diversified Banks | | | 11.7% | |
Valeant Pharmaceuticals International, Inc. | | | 5.1% | | | | | Oil & Natural Gas Exploration | | | 5.6% | |
Imperial Metals Corp. | | | 4.6% | | | | | Pharmaceuticals | | | 5.1% | |
American International Group, Inc. | | | 4.4% | | | | | Metals & Mining | | | 4.6% | |
Canadian Natural Resources Ltd. | | | 3.9% | | | | | Multi-Line Insurance | | | 4.4% | |
Leucadia National Corp. | | | 2.8% | | | | | Diversified Holding Companies | | | 2.8% | |
| | | | | | | | | | | | | |
| | | | 73.1% | | | | | | | | 91.3% | |
| | | | | | | | | | | | | |
| | | | | | | | | | | |
* Excludes cash, U.S. Treasury Bills, commercial paper, and money market funds.
** Includes cash, U.S. Treasury Bills, commercial paper, and money market funds.
The Manager views the ability to focus on fewer investments than a diversified fund as a strategic advantage. However, such a strategy may negatively influence short-term performance and there is no guarantee that long-term performance will not be negatively affected.
The Fund may invest in non-U.S. securities and securities of corporations domiciled outside of the United States, which may expose the Fund to adverse changes resulting from foreign currency fluctuations or other potential risks as described in the Fund’s Prospectus and Statement of Additional Information.
5
THE FAIRHOLME ALLOCATION FUND
MANAGEMENT DISCUSSION & ANALYSIS (continued)
For the Fiscal Year Ended November 30, 2015
The Fund’s officers, the Board of Directors (the “Board” or the “Directors”), and the Manager are aware that large cash inflows or outflows may adversely affect Fund performance. Such flows are monitored and appropriate actions are contemplated for when such flows could negatively impact performance.
Since inception, the Fund has been advised by the Manager. Bruce Berkowitz, both the Chief Investment Officer of the Manager and Chairman of the Fund’s Board, continues to have a significant personal stake in the Fund, holding an aggregate 9,157,652 shares at November 30, 2015. While there is no requirement that Mr. Berkowitz own shares of the Fund, such holdings are believed to help align the interests of the Manager with the interests of the shareholders.
The Board, including the Independent Directors, continues to believe that it is in the best interests of the Fund to have Mr. Berkowitz serve as Chairman of the Board given: his long-term relative performance; his experience, commitment, and significant personal investment in the Fund; the present constitution of Directors and policies; and current rules and regulations. A Director and Officers of the Fund are also Officers of the Manager. Nevertheless, at November 30, 2015, a majority of Directors were independent of the Manager, no stock option or restricted stock plans exist, Officers received no direct compensation from the Fund, and the Director affiliated with the Manager received no compensation for being a Director.
For more complete information about the Fund, or to obtain a current Prospectus, please visit www.fairholmefunds.com or call Shareholder Services at 1-866-202-2263.
6
THE FAIRHOLME ALLOCATION FUND
EXPENSE EXAMPLE
For the Six Month Period from June 1, 2015
through November 30, 2015 (unaudited)
As a Fund shareholder, you incur direct and indirect costs. Direct costs include, but are not limited to, transaction fees at some broker-dealers, custodial fees for retirement accounts, redemption fees on Fund shares redeemed within 60 days of purchase, and wire transfer fees. You also incur indirect, ongoing costs that include, but are not limited to, management fees paid to the Manager.
The following example is intended to help you understand your indirect costs (also referred to as “ongoing costs” and measured in dollars) when investing in the Fund and to compare these costs with the ongoing costs of investing in other mutual funds. This example is based on an investment of $1,000 invested in the Fund at June 1, 2015, and held for the entire six month period ending November 30, 2015.
Actual Expenses
The first line of the table below provides information about actual account values and actual expenses. You may use the information in this line, together with the amount you had invested at the beginning of the period, to estimate the expenses that you paid over the period. Simply divide your account value by $1,000 (for example, an $8,600 account value divided by $1,000 = 8.6), then multiply the result by the number in the first line under the heading “Expenses Paid During the Period” to estimate the expenses you paid on your Fund holdings during this period.
Hypothetical Example for Comparison Purposes
The second line of the table provides information about hypothetical account values and hypothetical expenses based on the Fund’s actual expense ratio and an assumed rate of return of 5% per year before expenses, which is not the Fund’s actual return for the period presented. The hypothetical account values and expenses may not be used to estimate the actual ending account balance or expenses that you paid for the period presented. However, you may use this information to compare ongoing costs of investing in the Fund with the ongoing costs of investing in other funds. To do so, compare this 5% hypothetical example with the 5% examples that appear in the shareholder reports of other funds.
Please note that the column titled “Expenses Paid During the Period” in the table below is meant to highlight your ongoing costs only and do not reflect any transactional costs, such as redemption fees (if any), or other direct costs. Therefore, the second line of the table is useful in comparing ongoing costs only, and will not help you determine the relative total costs of owning different funds. In addition, if these direct costs were included, your total costs would be higher.
| | | | | | | | | | | | | | | | | | | | |
| | | Beginning
Account Value
June 1, 2015 | | Ending
Account Value
November 30, 2015 | | Annualized
Expense
Ratio | | Expenses Paid
During the Period
June 1, 2015
Through
November 30, 2015* |
Fund | | | | | | | | | | | | | | | | | | | | |
Actual | | | $ | 1,000.00 | | | | $ | 875.40 | | | | | 1.01 | % | | | $ | 4.75 | |
Hypothetical
(5% return before expenses) | | | $ | 1,000.00 | | | | $ | 1,020.00 | | | | | 1.01 | % | | | $ | 5.11 | |
| * | Expenses are equal to the Fund’s annualized expense ratio, multiplied by the average account value over the period, multiplied by 183 days/365 days (to reflect the one-half year period). |
7
THE FAIRHOLME ALLOCATION FUND
SCHEDULE OF INVESTMENTS
November 30, 2015
| | | | | | | | |
| | |
Shares | | | | | Value | |
| | |
| | | | DOMESTIC EQUITY SECURITIES — 36.6% | | | | |
| | |
| | | | DIVERSIFIED HOLDING COMPANIES — 2.8% | | | | |
| | 467,700 | | | Leucadia National Corp. | | $ | 8,268,936 | |
| | | | | | | | |
| | |
| | | | PHARMACEUTICALS — 3.8% | | | | |
| | 126,000 | | | Valeant Pharmaceuticals International, Inc. (a) | | | 11,334,960 | |
| | | | | | | | |
| | |
| | | | REAL ESTATE INVESTMENT TRUSTS — 11.9% | | | | |
| | 974,050 | | | Seritage Growth Properties (a) | | | 35,552,825 | |
| | | | | | | | |
| | |
| | | | RETAIL DEPARTMENT STORES — 14.5% | | | | |
| | 1,948,100 | | | Sears Holdings Corp. | | | 43,111,453 | |
| | | | | | | | |
| | |
| | | | RETAILER — 1.1% | | | | |
| | 140,000 | | | Lands’ End, Inc. (a) | | | 3,365,600 | |
| | | | | | | | |
| | |
| | | | TRADING COMPANIES & DISTRIBUTORS — 2.5% | | | | |
| | 255,000 | | | MRC Global, Inc. (a) | | | 3,771,450 | |
| | 195,000 | | | NOW, Inc. (a) | | | 3,584,100 | |
| | | | | | | | |
| | | | | | | 7,355,550 | |
| | | | | | | | |
| |
| TOTAL DOMESTIC EQUITY SECURITIES
(COST $144,637,940) | | | 108,989,324 | |
| | | | | | | | |
| | |
| | | | FOREIGN EQUITY SECURITIES — 10.2% | | | | |
| | |
| | | | CANADA — 10.2% | | | | |
| | |
| | | | METALS & MINING — 4.6% | | | | |
| | 2,623,506 | | | Imperial Metals Corp. (a) | | | 13,555,124 | |
| | | | | | | | |
| | |
| | | | OIL & NATURAL GAS EXPLORATION — 3.9% | | | | |
| | 485,000 | | | Canadian Natural Resources Ltd. | | | 11,737,000 | |
| | | | | | | | |
| | |
| | | | RETAIL DEPARTMENT STORES — 1.7% | | | | |
| | 600,943 | | | Sears Canada, Inc. (a) | | | 5,095,997 | |
| | | | | | | | |
| |
| TOTAL FOREIGN EQUITY SECURITIES
(COST $42,453,605) | | | 30,388,121 | |
| | | | | | | | |
| | | | | | | | |
| | |
Shares | | | | | Value | |
| | |
| | | | DOMESTIC PREFERRED EQUITY
SECURITIES — 12.2% | | | | |
| | |
| | | | MORTGAGE FINANCE — 12.2% | | | | |
| | | | Federal Home Loan Mortgage Corp. | | | | |
| | 4,033,100 | | | 7.875%, Series Z (a)(b) | | $ | 17,503,654 | |
| | | | Federal National Mortgage Association | | | | |
| | 4,301,200 | | | 7.750%, Series S (a)(b) | | | 18,710,220 | |
| | | | | | | | |
| |
| TOTAL DOMESTIC PREFERRED EQUITY
SECURITIES
(COST $37,299,594) | | | 36,213,874 | |
| | | | | | | | |
| | |
| | | | WARRANTS — 18.1% | | | | |
| | |
| | | | DIVERSIFIED BANKS — 11.7% | | | | |
| | 5,570,428 | | | Bank of America Corp., | | | | |
| | | | Vested, Strike Price $13.137, Expire 01/16/2019 (a)(c) | | | 34,815,175 | |
| | | | | | | | |
| | |
| | | | MULTI-LINE
INSURANCE — 4.4% | | | | |
| | 507,515 | | | American International Group, Inc., | | | | |
| | | | Vested, Strike Price $45.000, Expire 01/19/2021 (a)(c) | | | 13,027,910 | |
| | | | | | | | |
| | |
| | | | RETAIL DEPARTMENT STORES — 2.0% | | | | |
| | 474,265 | | | Sears Holdings Corp., | | | | |
| | | | Vested, Strike Price $25.686, Expire 12/15/2019 (a)(c) | | | 6,165,452 | |
| | | | | | | | |
| |
| TOTAL WARRANTS
(COST $26,341,647) | | | 54,008,537 | |
| | | | | | | | |
The accompanying notes are an integral part of the financial statements.
8
THE FAIRHOLME ALLOCATION FUND
SCHEDULE OF INVESTMENTS (continued)
November 30, 2015
| | | | | | |
| | |
Principal | | | | Value | |
| | |
| | DOMESTIC CORPORATE BONDS — 3.0% | | | | |
| | |
| | OIL & NATURAL GAS EXPLORATION — 1.7% | | | | |
| $ 6,800,000 | | Atwood Oceanics, Inc. | | | | |
| | 6.500%, 02/01/2020 | | $ | 5,134,000 | |
| | | | | | |
| | |
| | PHARMACEUTICALS — 1.3% | | | | |
| 4,000,000 | | Valeant Pharmaceuticals International, Inc. | | | | |
| | 6.750%, 08/15/2018 (d) | | | 3,917,600 | |
| | | | | | |
| |
TOTAL DOMESTIC CORPORATE BONDS
(COST $8,973,053) | | | 9,051,600 | |
| | | | | | |
| | |
| | COMMERCIAL PAPER — 3.4% | | | | |
| | |
| | MULTIMEDIA — 3.4% | | | | |
| 10,000,000 | | Viacom, Inc. | | | | |
| | 0.500%, 12/04/2015 (e) | | | 9,999,722 | |
| | | | | | |
| |
TOTAL COMMERCIAL PAPER
(COST $9,999,583) | | | 9,999,722 | |
| | | | | | |
| | |
| | U.S. GOVERNMENT OBLIGATIONS — 3.4% | | | | |
| 10,000,000 | | U.S. Treasury Bills 0.099%,
03/17/2016 (e) | | | 9,994,720 | |
| | | | | | |
| |
TOTAL U.S. GOVERNMENT OBLIGATIONS
(COST $9,997,117) | | | 9,994,720 | |
| | | | | | |
| | | | | | |
| | |
Shares | | | | Value | |
| | |
| | MONEY MARKET
FUNDS — 8.0% | | | | |
| 23,722,226 | | Fidelity Institutional Money | | | | |
| | Market Funds - Money | | | | |
| | Market Portfolio, 0.160% (f) | | $ | 23,722,226 | |
| | | | | | |
| |
TOTAL MONEY MARKET FUNDS
(COST $23,722,226) | | | 23,722,226 | |
| | | | | | |
| | |
| | MISCELLANEOUS INVESTMENTS — 4.9%(g) | | | | |
(COST $19,639,554) | | | 14,680,138 | |
| | | | | | |
| |
TOTAL INVESTMENTS — 99.8%
(COST $323,064,319) | | | 297,048,262 | |
| | OTHER ASSETS IN EXCESS OF
LIABILITIES — 0.2% | | | 479,085 | |
| | | | | | |
NET ASSETS — 100.0% | | $ | 297,527,347 | |
| | | | | | |
| (a) | Non-income producing security. |
| (b) | Variable rate security. Rates shown are the effective rates as of November 30, 2015. |
| (c) | Warrants have terms and conditions based on dividends paid and other events that may lower the strike price and raise the shares per warrant conversion ratio. Reported strike prices and conversion ratios are as of the date of this report. All share-to-warrant conversion ratios are currently 1:1, excluding the Sears Holdings Corp. warrants, which on November 30, 2015 had a conversion ratio of 1:1.11. |
| (d) | Restricted security as defined in Rule 144a under the Securities Act of 1933. The Manager has determined that such security is liquid pursuant to the Fund’s liquidity guidelines. The value of these securities totals $3,917,600, which represents 1.32% of the Fund’s net assets. |
| (e) | Rates shown are the effective yields based on the purchase price. The calculation assumes the security is held to maturity. |
| (f) | Annualized based on the 1-day yield as of November 30, 2015. |
| (g) | Represents previously undisclosed unrestricted securities, which the Fund has held for less than one year. |
The accompanying notes are an integral part of the financial statements.
9
THE FAIRHOLME ALLOCATION FUND
STATEMENT OF ASSETS & LIABILITIES
November 30, 2015
| | | | |
Assets | | | | |
Investments, at Fair Value (Cost — $323,064,319) | | $ | 297,048,262 | |
Interest Receivable | | | 956,940 | |
Receivable for Capital Shares Sold | | | 58,600 | |
| | | | |
Total Assets | | | 298,063,802 | |
| | | | |
Liabilities | | | | |
Payable for Capital Shares Redeemed | | | 281,848 | |
Accrued Management Fees | | | 254,607 | |
| | | | |
Total Liabilities | | | 536,455 | |
| | | | |
NET ASSETS | | $ | 297,527,347 | |
| | | | |
| |
Net Assets Consist of: | | | | |
Paid-In Capital | | $ | 279,212,120 | |
Undistributed Net Investment Income | | | 8,229,913 | |
Accumulated Net Realized Gain on Investments and Foreign Currency Related Transactions | | | 36,101,371 | |
Net Unrealized Depreciation on Investments and Foreign Currency Related Translations | | | (26,016,057 | ) |
| | | | |
NET ASSETS | | $ | 297,527,347 | |
| | | | |
| |
Shares of Common Stock Outstanding* ($0.0001 par value) | | | 28,608,762 | |
| | | | |
| |
Net Asset Value, Offering and Redemption Price Per Share ($297,527,347 / 28,608,762 shares) | | $ | 10.40 | |
| | | | |
| * | 200,000,000 shares authorized in total. |
The accompanying notes are an integral part of the financial statements.
10
THE FAIRHOLME ALLOCATION FUND
STATEMENT OF OPERATIONS
| | | | |
| | | For the
Fiscal Year Ended
November 30, 2015 | |
Investment Income | | | | |
Dividends (net of $13,477 in foreign taxes withheld) | | | $ 11,562,984 | |
Interest | | | 2,547,816 | |
| |
Total Investment Income | | | 14,110,800 | |
| |
Expenses | | | | |
Management Fees | | | 3,443,638 | |
Registration Fees | | | 15,000 | |
| |
Total Expenses | | | 3,458,638 | |
| |
Net Investment Income | | | 10,652,162 | |
| |
Realized and Unrealized Gain (Loss) on Investments and Foreign Currency Related Transactions | | | | |
Net Realized Gain on Investments and Foreign Currency Related Transactions | | | 36,408,291 | |
Net Change in Unrealized Appreciation (Depreciation) on Investments and Foreign Currency Related Translations | | | (76,862,855 | ) |
| |
Net Realized and Unrealized Gain (Loss) on Investments and Foreign Currency Related Transactions | | | (40,454,564 | ) |
| |
NET DECREASE IN NET ASSETS FROM OPERATIONS | | | $(29,802,402 | ) |
The accompanying notes are an integral part of the financial statements.
11
THE FAIRHOLME ALLOCATION FUND
STATEMENTS OF CHANGES IN NET ASSETS
| | | | | | | | |
| | | For the
Fiscal Year Ended
November 30, 2015 | | | For the
Fiscal Year Ended
November 30, 2014 | |
CHANGES IN NET ASSETS | | | | | | | | |
From Operations | | | | | | | | |
Net Investment Income (Loss) | | | $ 10,652,162 | | | | $ (2,601,316 | ) |
Net Realized Gain on Investments and Foreign Currency Related Transactions | | | 36,408,291 | | | | 34,479,453 | |
Net Change in Unrealized Depreciation on Investments and Foreign Currency Related Translations | | | (76,862,855 | ) | | | (63,377,266 | ) |
Net Decrease in Net Assets from Operations | | | (29,802,402 | ) | | | (31,499,129 | ) |
From Dividends and Distributions to Shareholders | | | | | | | | |
Net Realized Capital Gains from Investment Transactions | | | (34,099,921 | ) | | | — | |
Net Decrease in Net Assets from Dividends and Distributions | | | (34,099,921 | ) | | | — | |
From Capital Share Transactions | | | | | | | | |
Proceeds from Sale of Shares | | | 18,287,557 | | | | 82,815,593 | |
Shares Issued in Reinvestment of Dividends and Distributions | | | 33,456,690 | | | | — | |
Redemption Fees | | | 1,177 | | | | 1,983 | |
Cost of Shares Redeemed | | | (69,066,091 | ) | | | (32,037,717 | ) |
Net Increase (Decrease) in Net Assets from Shareholder Activity | | | (17,320,667 | ) | | | 50,779,859 | |
NET ASSETS | | | | | | | | |
Net Increase (Decrease) in Net Assets | | | (81,222,990 | ) | | | 19,280,730 | |
Net Assets at Beginning of Year | | | 378,750,337 | | | | 359,469,607 | |
Net Assets at End of Year | | | $297,527,347 | | | | $378,750,337 | |
Accumulated Undistributed Net Investment Income (Loss) at End of Year | | | $ 8,229,913 | | | | $ (2,422,249 | ) |
SHARES TRANSACTIONS | | | | | | | | |
Issued | | | 1,597,157 | | | | 6,502,543 | |
Reinvested | | | 2,973,928 | | | | — | |
Redeemed | | | (6,086,517 | ) | | | (2,394,347 | ) |
Net Increase (Decrease) in Shares | | | (1,515,432 | ) | | | 4,108,196 | |
Shares Outstanding at Beginning of Year | | | 30,124,194 | | | | 26,015,998 | |
Shares Outstanding at End of Year | | | 28,608,762 | | | | 30,124,194 | |
The accompanying notes are an integral part of the financial statements.
12
THE FAIRHOLME ALLOCATION FUND
FINANCIAL HIGHLIGHTS
| | | | | | | | | | | | | | | | | | | | |
| | | For the
Fiscal Year Ended
November 30, 2015 | | | For the
Fiscal Year Ended
November 30, 2014 | | | For the
Fiscal Year Ended
November 30, 2013 | | | For the
Fiscal Year Ended
November 30, 2012 | | | For the
Period Ended
November 30, 2011(1) | |
PER SHARE OPERATING PERFORMANCE | | | | | | | | | | | | | | | | | | | | |
NET ASSET VALUE, BEGINNING OF PERIOD | | | $12.57 | | | | $13.82 | | | | $9.33 | | | | $8.29 | | | | $10.00 | |
| | | | | |
Investment Operations | | | | | | | | | | | | | | | | | | | | |
Net Investment Income (Loss)(2) | | | 0.35 | | | | (0.10 | ) | | | (0.09 | ) | | | 0.07 | | | | (0.02 | ) |
Net Realized and Unrealized Gain (Loss) on Investments | | | (1.38 | ) | | | (1.15 | ) | | | 4.64 | | | | 0.97 | | | | (1.69 | ) |
| | | | | |
Total from Investment Operations | | | (1.03 | ) | | | (1.25 | ) | | | 4.55 | | | | 1.04 | | | | (1.71 | ) |
| | | | | |
Dividends and Distributions | | | | | | | | | | | | | | | | | | | | |
From Net Investment Income | | | — | | | | — | | | | (0.06 | ) | | | — | | | | — | |
From Realized Capital Gains | | | (1.14 | ) | | | — | | | | — | | | | — | | | | — | |
| | | | | |
Total Dividends and Distributions | | | (1.14 | ) | | | — | | | | (0.06 | ) | | | — | | | | — | |
| | | | | |
Redemption Fees(2) | | | 0.00 | (3) | | | 0.00 | (3) | | | 0.00 | (3) | | | 0.00 | (3) | | | 0.00 | (3) |
| | | | | |
NET ASSET VALUE, END OF PERIOD | | | $10.40 | | | | $12.57 | | | | $13.82 | | | | $9.33 | | | | $8.29 | |
| | | | | |
TOTAL RETURN | | | (8.88 | )% | | | (9.04 | )% | | | 49.09 | % | | | 12.55 | % | | | (17.10 | )%(4) |
Ratio/Supplemental Data | | | | | | | | | | | | | | | | | | | | |
Net Assets, End of Period (in 000’s) | | | $297,527 | | | | $378,750 | | | | $359,470 | | | | $255,430 | | | | $212,122 | |
Ratio of Expenses to Average Net Assets: | | | | | | | | | | | | | | | | | | | | |
Before Expenses Waived | | | 1.00 | % | | | 1.00 | % | | | 1.01 | %(5) | | | 1.00 | % | | | 1.00 | %(6) |
After Expenses Waived | | | 1.00 | %(7) | | | 1.00 | %(7) | | | 1.01 | %(7) | | | 0.92 | %(7) | | | 0.75 | %(6) |
Ratio of Net Investment Income (Loss) to Average Net Assets | | | 3.09 | % | | | (0.73 | )% | | | (0.80 | )% | | | 0.74 | % | | | (0.30 | )%(6) |
Portfolio Turnover Rate | | | 39.24 | % | | | 33.15 | % | | | 35.97 | % | | | 26.96 | % | | | 41.60 | %(4) |
| (1) | The Fund commenced operations on December 31, 2010. |
| (2) | Based on average shares outstanding. |
| (3) | Redemption fees represent less than $0.01. |
| (5) | 0.01% is attributable to interest expense incurred outside of the 1.00% management fee. |
| (7) | Effective March 29, 2012, the Manager’s contractual management fee waiver/expense reimbursement for the Fund expired. |
The accompanying notes are an integral part of the financial statements.
13
THE FAIRHOLME ALLOCATION FUND
NOTES TO FINANCIAL STATEMENTS
November 30, 2015
Note 1. Organization
Fairholme Funds, Inc. (the “Company”), a Maryland corporation, is registered under the Investment Company Act of 1940, as amended (the “1940 Act”), as an open-end management investment company. The Company’s Articles of Incorporation permit the Board of Directors of the Company (the “Board” or the “Directors”) to issue 1,100,000,000 shares of common stock at $.0001 par value. 200,000,000 shares have been allocated to The Fairholme Allocation Fund (the “Fund”). The Fund is a non-diversified fund. The Fund may have a greater percentage of its assets invested in particular securities than a diversified fund, exposing the Fund to the risk of unanticipated industry conditions as well as risks specific to a single company or the securities of a single company. The Board has the power to designate one or more separate and distinct series and/or classes of shares of common stock and to classify or reclassify any unissued shares with respect to such series.
The Fund’s investment objective is to seek long-term total return. Under normal circumstances, the Fund seeks to achieve its investment objective by investing opportunistically in a focused portfolio of investments in the equity, fixed-income and cash, and cash-equivalent asset classes. The proportion of the Fund’s portfolio invested in each asset class will vary from time to time based on Fairholme Capital Management, L.L.C.’s (the “Manager”) assessment of relative fundamental values of securities and other investments in the asset class, the attractiveness of investment opportunities within each asset class, general market and economic conditions, and expected future returns of other investment opportunities. The Fund seeks to capitalize on anticipated fluctuations in the financial markets by changing the mix of its holdings in the targeted asset classes. The Fund may maintain a significant portion of its total assets in cash and securities generally considered to be cash equivalents. The Manager serves as investment adviser to the Fund.
There is no guarantee that the Fund will meet its objective.
Note 2. Significant Accounting Policies
As an investment company, the Fund follows the investment company accounting and reporting guidance, which is part of U.S. generally accepted accounting principles (“U.S. GAAP”). The Fund’s investments are reported at fair value as defined by U.S. GAAP. The Fund calculates its net asset value as soon as practicable following the close of regular trading on the New York Stock Exchange (currently 4:00 p.m. Eastern Time) on each day the New York Stock Exchange is open.
A description of the valuation techniques applied to the Fund’s securities measured at fair value on a recurring basis follows:
Security Valuation:
Equity securities (common and preferred stocks): Securities traded on a national securities exchange or reported on the NASDAQ national market are generally valued at the official closing price, or at the last reported sale price on the exchange or market on which the securities are traded, as of the close of business on the day the securities are being valued or, lacking any sales, at the last available bid price. To the extent these securities are actively traded and valuation adjustments are not applied, they are classified in Level 1 of the fair value hierarchy. If these securities are not actively traded, they are classified in Level 2. The Manager may also employ other valuation methods which the Manager believes would provide a more accurate indication of fair value. In these situations, if the inputs are observable, the valuation will be classified in Level 2 of the fair value hierarchy, otherwise they would be classified in Level 3.
Fixed-income securities (U.S. government obligations, corporate bonds, convertible bonds, and asset backed securities): The fair value of fixed-income securities is estimated using market quotations when readily available, but may also be estimated by various methods when no such market quotations exist and when the Manager believes these other methods reflect the fair value of such securities. These methods may consider recently executed transactions in securities of the issuer or comparable issuers and market price valuations from independent pricing services and/or brokers (where observable). Where the Manager deems it appropriate to do so (such as when independent prices are unavailable or not deemed to be representative of fair value) long-term fixed-income securities will be fair valued in good faith following consideration by, and conclusion of, the Manager’s Valuation Committee. As of November 30, 2015, fixed-income securities are valued by the Manager utilizing observable market prices on the day of valuation. Although fixed-income securities are classified in Level 2 of the fair value hierarchy at November 30, 2015, in instances where lower relative weight is placed on transaction prices, quotations, or similar observable inputs, they would be classified in Level 3.
14
THE FAIRHOLME ALLOCATION FUND
NOTES TO FINANCIAL STATEMENTS (continued)
November 30, 2015
Open-end mutual funds: Investments in open-end mutual funds including money market funds are valued at their closing net asset value each business day and are classified in Level 1 of the fair value hierarchy.
Short-term securities: Investments in securities with maturities of less than sixty days when acquired, or which subsequently are within sixty days of maturity, shall be valued at prices supplied by an independent pricing source or by one of the Fund’s pricing agents based on broker or dealer supplied valuations or matrix pricing. To the extent the inputs are observable and timely, the values would be classified in Level 2 of the fair value hierarchy.
Restricted securities: Depending on the relative significance of valuation inputs, these instruments may be classified in any level of the fair value hierarchy.
Warrants: The Fund may invest in warrants, which may be acquired either through a direct purchase, included as part of a private placement, or pursuant to corporate actions. Warrants entitle, but do not obligate, the holder to buy equity securities at a specific price for a specific period of time. Warrants may be considered more speculative than certain other types of investments in that they do not entitle a holder to dividends or voting rights with respect to the underlying securities that may be purchased nor do they represent any rights in the assets of the issuing company. Also, the value of a warrant does not necessarily change with the value of the underlying securities and a warrant ceases to have value if it is not exercised prior to its expiration date. Warrants traded on a security exchange are valued at the official closing price on the valuation date and are classified as Level 1 of the fair value hierarchy. Over the counter (OTC) warrants are valued using simulation models utilizing market value of the underlying security, expiration date of the warrants, volatility of the underlying security, strike price of the warrants, risk-free interest rate at the valuation date, and are classified as Level 2 or Level 3 of the fair value hierarchy depending on the observability of the inputs used.
The Fund uses several recognized industry third-party pricing services (TPPS) - approved by the Board and unaffiliated with the Manager - to value some of its securities. It also uses other independent market trade data sources (such as TRACE, the FINRA-developed mandatory reporting of over-the-counter secondary market transactions), as well as broker quotes provided by market makers. The data within these feeds is ultimately sourced from major stock exchanges and trading systems where these securities trade. If a price obtained from the pricing source is deemed unreliable, it may be discarded and/or challenged. In these cases the pricing decision is made by reference to the reliable market data from the other market data sources.
The Manager may determine the fair valuation of a security when market quotations are insufficient or not readily available, when securities are determined to be illiquid or restricted, or when in the judgment of the Manager the prices or values available do not represent the fair value of the instrument. Factors which may cause the Manager to make such a judgment include the following: (a) only a bid price or an asked price is available; (b) the spread between bid and asked prices is substantial; (c) the liquidity of the securities; (d) the frequency of sales; (e) the thinness of the market; (f) the size of reported trades; (g) actions of the securities markets, such as the suspension or limitation of trading; and (h) local market closures. Among the factors to be considered to fair value a security are recent prices of comparable securities that are publicly traded, reliable prices of securities not publicly traded, the use of valuation models, current analyst reports, valuing the income or cash flow of the issuer, or cost if the preceding factors do not apply. The circumstances of Level 3 securities are frequently monitored to determine if fair valuation measures continue to apply.
The Manager reports quarterly to the Board the results of the application of fair valuation policies and procedures.
The inputs and valuation techniques used to measure fair value of the Fund’s investments are summarized into three levels as described in the hierarchy below:
| | • Level 1 — | quoted prices in active markets for identical securities; |
15
THE FAIRHOLME ALLOCATION FUND
NOTES TO FINANCIAL STATEMENTS (continued)
November 30, 2015
| | • Level 2 — | other significant observable inputs (including quoted prices for similar securities, quoted prices in inactive markets for identical securities, interest rates, prepayment speeds, credit risk, etc.); and |
| | • Level 3 — | significant unobservable inputs (including the Manager’s determination as to the fair value of investments). |
The inputs or methodology used for valuing investments are not necessarily an indication of the level of risk associated with investing in those investments. The summary of the Fund’s investments by inputs used to value the Fund’s investments as of November 30, 2015, is as follows:
| | | | | | | | | | | | | | | |
| | | Valuation Inputs | | |
| | | Level 1 –
Quoted Prices | | Level 2 – Other
Significant
Observable Inputs | | Total
Fair Value
at 11/30/15 |
ASSETS: | | | | | | | | | | | | | | | |
INVESTMENTS (Fair Value): | | | | | | | | | | | | | | | |
Domestic Equity Securities* | | | $ | 108,989,324 | | | | | — | | | | $ | 108,989,324 | |
Foreign Equity Securities* | | | | 30,388,121 | | | | | — | | | | | 30,388,121 | |
Domestic Preferred Equity Securities* | | | | 36,213,874 | | | | | — | | | | | 36,213,874 | |
Warrants* | | | | 54,008,537 | | | | | — | | | | | 54,008,537 | |
Domestic Corporate Bonds* | | | | — | | | | $ | 9,051,600 | | | | | 9,051,600 | |
Commercial Paper* | | | | — | | | | | 9,999,722 | | | | | 9,999,722 | |
U.S. Government Obligations | | | | — | | | | | 9,994,720 | | | | | 9,994,720 | |
Money Market Funds | | | | 23,722,226 | | | | | — | | | | | 23,722,226 | |
Miscellaneous Investments | | | | — | | | | | 14,680,138 | | | | | 14,680,138 | |
| | | | | | | | | | | | | | | |
TOTAL INVESTMENTS | | | $ | 253,322,082 | | | | $ | 43,726,180 | | | | $ | 297,048,262 | |
| | | | | | | | | | | | | | | |
| * | Industry classifications for these categories are detailed in the Schedule of Investments. |
The Fund had no transfers between Level 1 and Level 2 during the fiscal year ended November 30, 2015. The Fund’s policy is to recognize transfers among Levels as of the beginning of the reporting period.
There were no Level 3 investments at November 30, 2015, or November 30, 2014.
Warrants: The Fund’s investments in warrants as of November 30, 2015, are presented within the Schedule of Investments.
The Fund’s warrant positions during the year ended November 30, 2015, had an average monthly market value of approximately $89,690,474.
As of November 30, 2015, the value of warrants with equity risk exposure of $54,008,537 is included with Investments at Fair Value on the Statement of Assets and Liabilities. For the year ended November 30, 2015, the effect of the net change in unrealized appreciation of warrants with equity risk exposure of $(36,184,590) is included with the Net Change in Unrealized Appreciation (Depreciation) on Investments and Foreign Currency Related Translations on the Statement of Operations and realized gains from warrants with equity risk exposure of $29,865,290 is included in Net Realized Gain on Investments and Foreign Currency Related Transactions on the Statement of Operations.
Dividends and Distributions: The Fund records dividends and distributions to shareholders on the ex-dividend date. The Fund intends to distribute substantially all of its net investment income (if any) as dividends to its shareholders on an annual basis in December. The Fund intends to distribute any net long-term capital gains and any net short-term capital gains at least once a year. If the total dividends and distributions made in any tax year exceeds net investment income and accumulated realized capital gains, a portion of the total distribution may be treated as a tax return of capital.
Foreign Currency Translation: The books and records of the Fund are maintained in U.S. dollars. Foreign currency amounts are translated into U.S. dollars on the following basis: (i) fair value of investment securities, assets, and liabilities at the
16
THE FAIRHOLME ALLOCATION FUND
NOTES TO FINANCIAL STATEMENTS (continued)
November 30, 2015
current rate of exchange; and (ii) purchases and sales of investment securities, income, and expenses at the relevant rates of exchange prevailing on the respective dates of such transactions. The Fund does not isolate that portion of gains and losses on investment securities which is due to changes in the foreign exchange rates from that which is due to changes in the market prices of such securities.
Estimates: The preparation of financial statements in conformity with U.S. GAAP requires the Fund to make estimates and assumptions that affect the reported amounts of assets and liabilities and disclosure of both contingent assets and liabilities at the date of the financial statements and the reported amounts of revenues and expenses during the reported period. Actual results could differ from those estimates.
Redemption Fee: The Fund assesses a 2% fee on the proceeds of the Fund shares that are redeemed within 60 days of their purchase. The redemption fee is paid to the Fund, as applicable, for the benefit of remaining shareholders and is recorded as paid-in capital. The redemption fees retained by the Fund during the fiscal years ended November 30, 2015 and November 30, 2014, amounted to $1,177 and $1,983, respectively.
Other: The Fund accounts for security transactions on the trade date for financial statement purposes. The specific identification method is used for determining gains or losses for financial statements and income tax purposes. Dividend income is recorded on the ex-dividend date net of foreign taxes withheld where recovery is uncertain and interest income is recorded on an accrual basis. Discounts and premiums on securities purchased are amortized over the life of the respective securities using the effective yield method. Securities denominated in currencies other than U.S. dollars are subject to changes in value due to fluctuation in exchange rates. The Fund may invest in countries that require governmental approval for the repatriation of investment income, capital, or the proceeds of sales of securities by foreign investors. In addition, if there is deterioration in a country’s balance of payments or for other reasons, a country may impose temporary restrictions on foreign capital remittances abroad.
The Fund paid commissions, other brokerage fees, and registration fees during the period.
Note 3. Related Party Transactions
The Manager is a Delaware limited liability company and is registered with the Securities and Exchange Commission as an investment adviser. The Manager’s principal business and occupation is to provide investment management and advisory services to individuals, corporations, and other institutions throughout the world. Pursuant to an Investment Management Agreement, the Fund pays a management fee to the Manager for its provision of investment advisory and operating services to the Fund. Subject to applicable waivers or limitations, the management fee is paid at an annual rate equal to 1.00% of the daily average net assets of the Fund. The Manager is responsible pursuant to the Investment Management Agreement for paying the Fund’s expenses for the following services: transfer agency, fund accounting, fund administration, custody, legal, audit, compliance, directors’ fees, call center, fulfillment, travel, insurance, rent, printing, postage, and other office supplies. The Manager is not responsible for paying for the following costs and expenses of the Fund: commissions, brokerage fees, issue and transfer taxes, and other costs chargeable to the Fund in connection with securities transactions or in connection with securities owned by the Fund, taxes, interest, acquired fund fees and related expenses, expenses in connection with litigation by or against the Fund, and any other extraordinary expenses.
Effective March 29, 2012, the Manager’s contractual management fee waiver/expense reimbursement for the Fund expired. Prior to March 29, 2012, the Manager had contractually agreed to waive a portion of its management fee and/or limit the Fund’s operating expenses (excluding taxes, interest, brokerage commissions, acquired fund fees and expenses, expenses incurred in connections with any merger or reorganization and extraordinary expenses such as litigation) so that the Fund’s operating expenses, after such waiver or limitation payment, would not exceed an annual rate of 0.75% of the Fund’s daily average net assets for the period December 29, 2010 to March 29, 2012. The Manager may be reimbursed for fee waivers and/or expense limitation payments made in any fiscal year of the Fund over the following three fiscal years. Any such reimbursement is subject to the Board’s review and approval. A reimbursement may be requested by the Manager if the
17
THE FAIRHOLME ALLOCATION FUND
NOTES TO FINANCIAL STATEMENTS (continued)
November 30, 2015
aggregate amount paid by the Fund for operating expenses for such fiscal year, taking into account any reimbursement, does not exceed the fee waiver/expense limitation in place at the time of the initial waiver or reimbursement of the amount by the Manager. On November 30, 2015, reimbursements subject to recoupment by the manager in the amount of $225,673 expired.
The Manager earned $3,443,638 from the Fund for its services during the year ended November 30, 2015.
Bruce Berkowitz, both the Chief Investment Officer of the Manager and Chairman of the Fund’s Board, continues to have a significant personal stake in the Fund, holding an aggregate 9,157,652 shares at November 30, 2015.
A Director and Officers of the Fund are also Officers of the Manager or its affiliates.
Note 4. Investments
For the year ended November 30, 2015, aggregated purchases and sales of investment securities other than short-term investments and U.S. government obligations were as follows:
| | |
Purchases | | Sales |
| $128,072,794 | | $105,341,693 |
Note 5. Tax Matters
Federal Income Taxes: The Fund intends to qualify each year as a “Regulated Investment Company” under Subchapter M of the Internal Revenue Code of 1986, as amended. By so qualifying, the Fund will not be subject to federal income taxes to the extent that it distributes all of its net investment income and any realized capital gains.
For U.S. federal income tax purposes, the cost of securities owned, gross unrealized appreciation, gross unrealized depreciation, and net unrealized appreciation of investments at November 30, 2015, were as follows:
| | | | | | |
Cost | | Gross Unrealized Appreciation | | Gross Unrealized Depreciation | | Net Unrealized Depreciation |
| $323,371,031 | | $34,042,594 | | $(60,365,363) | | $(26,322,769) |
The differences between book basis and tax basis net unrealized appreciation is attributable to the tax deferral of losses on wash sales and capitalized cost.
The Fund’s tax basis capital gains are determined at the end of each fiscal year. As of November 30, 2015, the components of distributable earnings on a tax basis were as follows:
| | | | |
Undistributed Ordinary Income* | | $ | 14,232,224 | |
Undistributed Long-term Capital Gains | | | 30,405,772 | |
Net Unrealized Depreciation on Investments and Foreign Currency Related Transactions | | | (26,322,769) | |
| | | | |
Total | | $ | 18,315,227 | |
| | | | |
* Inclusive of short-term capital gain | | | | |
The Fund is permitted to carry capital losses forward for an unlimited period. Capital losses that are carried forward will retain their character as either short term or long term capital losses.
The Manager has analyzed the Fund’s tax positions taken on tax returns for all open tax years (current and prior three tax years) and has concluded that there are no uncertain tax positions that require recognition of a tax liability. The Fund’s federal and state income and federal excise tax returns for tax years for which the applicable statutes of limitations have not expired (the current year and prior three years) are subject to examination by the Internal Revenue Service and state departments of revenue. Additionally, the Fund is not aware of any tax position for which it is reasonably possible that the total amounts of unrecognized tax benefits will change materially in the next twelve months.
18
THE FAIRHOLME ALLOCATION FUND
NOTES TO FINANCIAL STATEMENTS (continued)
November 30, 2015
Note 6. Dividends and Distributions to Shareholders
Ordinary income and capital gain distributions are determined in accordance with federal income tax regulations, which may differ from U.S. GAAP.
The tax character of dividends and distributions paid by the Fund were as follows:
| | | | | | | | | | |
| | | For the
Fiscal Year Ended
November 30, 2015 | | For the
Fiscal Year Ended
November 30, 2014 |
| | |
Dividends and Distributions paid from: | | | | | | | | | | |
Long-term Capital Gain | | | $ | 34,099,921 | | | | $ | — | |
| | | | | | | | | | |
The Fund declared and made payable the following distribution on December 11, 2015.
| | | | |
Dividends and Distributions paid from: | | | | |
Ordinary Income | | $ | 8,437,431 | |
Long-Term Capital Gain | | | 30,405,997 | |
Short-Term Capital Gain | | | 6,002,540 | |
| | | | |
| | $ | 44,845,968 | |
Note 7. Indemnifications
Under the Company’s organizational documents, its Officers and Directors are indemnified against certain liabilities arising out of the performance of their duties to the Fund. In the normal course of business the Company or the Fund enters into contracts that contain a variety of representations and customary indemnifications. The Fund’s maximum exposure under these arrangements is unknown as this would involve future claims that may be made against the Fund that have not yet occurred. However, based on its experience to date, the Fund expects the risk of loss to be remote.
19
REPORT OF INDEPENDENT REGISTERED PUBLIC ACCOUNTING FIRM
To the Board of Directors of Fairholme Funds, Inc. and
the shareholders of The Fairholme Allocation Fund:
We have audited the accompanying statement of assets and liabilities, including the schedule of investments, of The Fairholme Allocation Fund (the “Fund”), as of November 30, 2015, and the related statement of operations for the year then ended, the statements of changes in net assets for each of the two years in the period then ended, and the financial highlights for each of the periods presented. These financial statements and financial highlights are the responsibility of the Fund’s management. Our responsibility is to express an opinion on these financial statements and financial highlights based on our audits.
We conducted our audits in accordance with the standards of the Public Company Accounting Oversight Board (United States). Those standards require that we plan and perform the audit to obtain reasonable assurance about whether the financial statements and financial highlights are free of material misstatement. The Fund is not required to have, nor were we engaged to perform, an audit of its internal control over financial reporting. Our audits included consideration of internal control over financial reporting as a basis for designing audit procedures that are appropriate in the circumstances, but not for the purpose of expressing an opinion on the effectiveness of the Fund’s internal control over financial reporting. Accordingly, we express no such opinion. An audit also includes examining, on a test basis, evidence supporting the amounts and disclosures in the financial statements, assessing the accounting principles used and significant estimates made by management, as well as evaluating the overall financial statement presentation. Our procedures included confirmation of securities owned as of November 30, 2015, by correspondence with the custodian. We believe that our audits provide a reasonable basis for our opinion.
In our opinion, the financial statements and financial highlights referred to above present fairly, in all material respects, the financial position of The Fairholme Allocation Fund as of November 30, 2015, the results of its operations for the year then ended, the changes in its net assets for each of the two years in the period then ended, and the financial highlights for each of the periods presented, in conformity with accounting principles generally accepted in the United States of America.
|
DELOITTE & TOUCHE LLP |
Philadelphia, Pennsylvania |
January 28, 2016 |
20
THE FAIRHOLME ALLOCATION FUND
ADDITIONAL INFORMATION
November 30, 2015
Board of Directors (unaudited)
The Board of Directors has overall responsibility for conduct of the Company’s affairs. The day-to-day operations of the Fund are managed by the Manager, subject to the By-Laws of the Company and review by the Company’s Board. The Directors and Officers of the Company, including those Directors who are also officers, are listed below.
| | | | | | | | |
Name, Age & Address† | | Position(s) Held, Term of Office & Length of Time Served** | | Principal Occupation(s) During Past 5 Years§ | | Number of Portfolios in Fund Complex Overseen by Director | | Other Current Directorships Held by Director |
Interested Directors and Officers | | | | | | |
Bruce R. Berkowitz* Age 57 | | Mr. Berkowitz has served as a Director of the Company since December 15, 1999. | | Manager, Fairholme Holdings LLC since January 2015 and Chief Investment Officer, Fairholme Capital Management, L.L.C. since October 1997; Managing Member, Fairholme Capital Management, L.L.C. from October 1997 to December 2014. | | 3 | | Director and Chairman of the Board of Directors, The St. Joe Co. |
Cesar L. Alvarez, Esq.* Age 68 | | Mr. Alvarez has served as a Director of the Company since May 19, 2008. | | Senior Chairman effective January 1, 2016; Executive Chairman and Co-Chairman from 2010 to 2015; and Chief Executive Officer from 1997 to 2010 of Greenberg Traurig, LLP. | | 3 | | Chairman, Board of Directors, Mednax, Inc.; Director, Intrexon Corp., Sears Holdings Corp., and The St. Joe Co. |
Independent Directors^ | | |
Terry L. Baxter Age 70 | | Mr. Baxter has served as a Director of the Company since May 19, 2008. | | Chairman of the Board, CEO, Source One (retired); President of White Mountain Holdings (retired). | | 3 | | Director, Main Street America Group |
Howard S. Frank Age 74 | | Mr. Frank has served as a Director of the Company since May 7, 2007. | | Chairman of the Board of Costa Crociere S.p.A. since 2014; Special Advisor to the CEO and to the Chairman of Carnival Corporation & plc. since 2013; Vice Chairman, Chief Operating Officer and Director, Carnival Corporation & plc. 1989 to 2013 | | 3 | | Director, New World Symphony; Director, The St. Joe Co. |
Steven J. Gilbert Age 68 | | Mr. Gilbert has served as a Director of the Company since June 16, 2014 | | Chairman, Gilbert Global Equity Partners, L.P. since 1998; Vice Chairman, MidOcean Equity Partners, L.P. since 2005; Co-Chairman, Birch Grove Capital since 2013; Senior Managing Director and Chairman, Sun Group (USA) from 2007 to 2009. | | 3 | | Chairman, CPM Holdings, Inc.; Director, MBIA, Inc.; Lead Independent Director, Empire State Realty Trust; Lead Independent Director, TRI Pointe Homes, Inc.; Director, Waterpik, Inc., and Director, Trade Informatics, Inc. |
Avivith Oppenheim, Esq. Age 65 | | Ms. Oppenheim has served as a Director of the Company since December 15, 1999. | | Attorney-at-Law. | | 3 | | None. |
Leigh Walters, Esq. Age 69 | | Mr. Walters has served as a Director of the Company since December 15, 1999. | | Vice-President and Director, Valcor Engineering Corporation. Attorney-at-Law. | | 3 | | Director, Valcor Engineering Corporation |
| † | Unless otherwise indicated, the address of each Director of the Company is c/o Fairholme Capital Management, L.L.C., 4400 Biscayne Blvd., 9th Floor, Miami, FL 33137. |
| ^ | Directors who are not “interested persons” of the Company as defined under the 1940 Act. |
| * | Mr. Berkowitz and Mr. Alvarez are each an interested person, as defined in the 1940 Act, of the Company because of their affiliation with the Manager. |
| ** | Each Director serves for an indefinite term. Each officer serves for an annual term and until his or her successor is elected and qualified. |
| § | The information reported includes the principal occupation during the last five years for each Director and other information relating to the professional experiences, attributes and skills relevant to each Director’s qualifications to serve as Director. |
21
THE FAIRHOLME ALLOCATION FUND
ADDITIONAL INFORMATION (continued)
November 30, 2015
Officers (unaudited)
| | | | | | | | | | | | | | |
| Name, Age & Address† | | | | Position(s) Held with the Company | | Term of Office & Length of Time Served* | | | | | | Principal Occupation(s) During Past 5 Years | | |
Fernando Font Age 41 | | | | Vice President | | Mr. Font has served as Vice President of the Company since June 2015. | | | | | | Chief Administrative Officer of Fairholme Capital Management, L.L.C. since August 2009. | | |
Wayne Kellner Age 46 | | | | Treasurer | | Mr. Kellner has served as Treasurer of the Company since March 2012. | | | | | | Chief Operating Officer, Fairholme Capital Management, L.L.C. since June 2014; Chief Financial Officer, Fairholme Capital Management, L.L.C. since January 2012; Treasurer, Fairholme Capital Management, L.L.C. from January 2011 to December 2011; Tax Principal, Rothstein Kass from 2006 to 2010. | | |
Paul R. Thomson Age 59 | | | | Chief Compliance Officer and Secretary | | Mr. Thomson has served as Chief Compliance Officer of the Company since April 2010 and has served as Secretary of the Company since June 2011. Mr. Thomson previously served as Chief Compliance Officer from November 2008 to January 2009. | | | | | | Chief Compliance Officer, Fairholme Capital Management L.L.C. since April 2010; Chief Financial Officer, Fairholme Capital Management L.L.C. from January 2008 to January 2012. | | |
| † | Unless otherwise indicated, the address of each Officer of the Company is c/o Fairholme Capital Management, L.L.C., 4400 Biscayne Blvd., 9th Floor, Miami, FL 33137. |
| * | Each officer serves for an annual term and until his or her successor is elected and qualified. |
22
THE FAIRHOLME ALLOCATION FUND
ADDITIONAL INFORMATION (continued)
November 30, 2015
Approval of Investment Management Agreement (unaudited)
At its meeting on October 22, 2015, the Board of Directors (the “Board” or the “Directors”) of Fairholme Funds, Inc. (the “Company”) approved the renewal of the investment management agreement between the Company, on behalf of The Fairholme Allocation Fund (the “Fund”), and Fairholme Capital Management, L.L.C. (the “Manager”). In considering whether to approve the renewal of the agreement, the Directors considered the factors discussed below, and information made available to them at the meeting relating to such factors, and other information they deemed relevant. The renewal of the agreement was not, however, based on any single factor, but on an evaluation of the totality of factors and information reviewed and evaluated by the Directors.
A. Nature, Extent and Quality of Services
The Directors considered information provided to them concerning the services performed by the Manager for the Fund pursuant to the agreement. The Directors reviewed information concerning the nature, extent and quality of investment advisory and operational services provided, or overseen, by the Manager. The Directors reviewed information concerning the personnel responsible for the day-to-day portfolio and administrative management of the Fund, the overall reputation of the Manager and the Manager’s current and planned staffing levels. The Directors considered the Manager’s commitment to the Fund as evidenced, among other things, by the current share ownership of the Fund by management/owners/employees of the Manager. The Directors considered information describing the Manager’s compliance policies and procedures, including recent updates to those policies and information concerning the policies designed to address the Fund’s compliance with its investment objective, policies and restrictions and applicable regulatory requirements and to address the Manager’s conflicts of interest in providing services to the Fund and to other advisory clients.
The Directors did not compare services provided by the Manager to the Fund with the services provided by Manager to its other advisory accounts because such accounts are not subject to the same regulatory requirements as the Fund, may have different investment restrictions, holdings and goals than the Fund and require different levels of client and back-office servicing than the Fund.
The Directors concluded that the nature, extent and quality of services provided by the Manager to the Fund were appropriate and sufficient to support renewal of the agreement.
B. Investment Performance
The Directors considered information regarding the Fund’s performance, the Manager’s views on performance and the holdings of the Fund that contributed negatively and positively to the Fund’s performance. The Directors considered information about the investment performance of the Fund, including information reflecting that the performance of the Fund had trailed the performance of the Barclays Capital US Aggregate Bond Index by approximately 13.17 percentage points for the 1-year period ended August 31, 2015, but the Fund’s performance had exceeded the annualized performance of the Barclays Capital US Aggregate Bond Index by approximately 7.26 and 1.46 percentage points, for the 3-years and since inception periods ended August 31, 2015. The Directors also considered information that the Fund’s annualized performance lagged the annualized performance of its second benchmark index, the S&P 500 Index, by 12.1, 5.52 and 7.56 percentage points in the 1-year, 3-year and since its inception periods to August 31, 2015. The Directors also reviewed and considered a third-party report (from Lipper/Broadridge, “Lipper”), comparing the Fund’s annualized performance and the annualized performance of similarly situated mutual funds, which reflected that in the 1-year. 3-year and since inception periods ended August 31, 2015 the Fund’s annualized performance trailed, exceeded and trailed the average and median annualized performance of the peer group, by 7.51 and 8.60, 1.98 and 1.26, and 0.51 and 0.27 percentage points, respectively. The Directors considered information provided to them concerning the performance of the Fund in light of market events and other factors affecting the Fund’s performance and information about developments with respect to specific issuers of securities held in the Fund’s portfolio. They also considered other information about the Fund’s total returns and focused investment strategies.
23
THE FAIRHOLME ALLOCATION FUND
ADDITIONAL INFORMATION (continued)
November 30, 2015
C. Management Fee and Expense Ratio
The Directors considered information about the Fund’s management fee and expense ratio, including information in the Lipper report comparing the Fund’s management fee and the most recent Total Expense ratio to the advisory fees and expense ratios of other similarly situated mutual funds. The Directors noted for the Fund that the Management Fee was reasonable when compared to the median of the peer groups’ Advisory Fees when consideration was given to the Fund operating and other expenses that the Manager pays on behalf of the Fund. The Directors noted that, for the Fund, the total expense ratio for its latest full fiscal year was lower than the median expense ratio of the most recently completed fiscal year of its peer group funds included in the Lipper report.
In evaluating the management fee and expense ratio information, the Directors took into account the demands and complexity of portfolio management for the Fund in light of its investment objective, strategies, and asset size. The Directors also considered information regarding the Manager’s payment (in some cases from its resources) of certain expenses for the benefit of the Fund, including shareholder account-level expenses associated with certain omnibus accounts. The Directors also reviewed information concerning the fees paid to the Manager by its other advisory accounts.
After reviewing information presented to them concerning fees, expenses, performance and other matters, the Directors concluded that the Fund’s management fee and overall expense ratio were reasonable in light of the services provided by or through the Manager.
D. Profitability
The Directors considered information regarding the estimated profitability of the Fund to the Manager. They considered such profitability in light of the Fund’s assets under management, overall expense ratio, performance and the services provided by or through the Manager, and concluded that the Manager’s estimated profitability was not such as to prevent Directors from approving the renewal of the agreement.
E. Economies of Scale
The Directors considered information concerning economies of scale for the Fund, including the current assets of the Fund. The Directors concluded for the Fund that no modification to the Fund’s existing arrangements was warranted based on economies of scale.
Proxy Voting Policies, Procedures and Records (unaudited)
The Company has adopted policies and procedures that provide guidance and set forth parameters for the voting of proxies relating to securities held in the Fund’s portfolio. A description of these policies and procedures, and records of how the Fund voted proxies relating to their portfolio securities during the most recent twelve month period ended June 30, 2014, are available to you upon request and free of charge by writing to the Fairholme Funds, Inc., c/o BNY Mellon Investment Servicing (US) Inc., P.O. Box 9692, Providence, RI, 02940 or by calling Shareholder Services at 1-866-202-2263 or visiting our website at www.fairholmefunds.com. They may also be obtained by visiting the Securities and Exchange Commission (“SEC”) website at www.sec.gov. The Company shall respond to all shareholder requests for records within three business days of its receipt of such request by first-class mail or other means designed to ensure prompt delivery.
24
THE FAIRHOLME ALLOCATION FUND
ADDITIONAL INFORMATION (continued)
November 30, 2015
N-Q Filing (unaudited)
The Company files a complete schedule of the Fund’s portfolio holdings on Form N-Q for the fiscal quarters ending February 28 (February 29 during leap year) and August 31. The Form N-Q filing must be made within 60 days of the end of the quarter. The Forms N-Q relating to the Fund’s portfolio investments are available on the SEC’s website at www.sec.gov, or may be reviewed and copied at the SEC’s Public Reference Room in Washington, DC (call 1-800-732-0330 for information on the operation of the Public Reference Room).
Shareholder Tax Information (unaudited)
The Fund reported $34,099,921 of long-term capital gain distributions paid during the fiscal year ended November 30, 2015.
25

Officers of Fairholme Funds, Inc.
BRUCE R. BERKOWITZ
President
FERNANDO M. FONT
Vice President
WAYNE KELLNER
Treasurer
PAUL R. THOMSON
Chief Compliance Officer & Secretary
Board of Directors of Fairholme Funds, Inc.
CESAR L. ALVAREZ, Esq.
TERRY L. BAXTER
BRUCE R. BERKOWITZ
HOWARD S. FRANK
STEVEN J. GILBERT, Esq.
AVIVITH OPPENHEIM, Esq.
LEIGH WALTERS, Esq.
Investment Manager
FAIRHOLME CAPITAL MANAGEMENT, L.L.C.
4400 Biscayne Boulevard, Miami, FL 33137
Transfer Agent, Fund Accountant & Administrator
BNY MELLON INVESTMENT SERVICING (US) INC.
760 Moore Road, King of Prussia, PA 19406
Custodian
THE BANK OF NEW YORK MELLON
One Wall Street, New York, NY 10286
Independent Registered Public Accounting Firm
DELOITTE & TOUCHE LLP
1700 Market Street, Philadelphia, PA 19103
Legal Counsel
SEWARD & KISSEL LLP
901 K Street NW, Washington, DC 20001
THIS REPORT IS PROVIDED FOR THE GENERAL INFORMATION OF THE SHAREHOLDERS OF FAIRHOLME FUNDS, INC. IT IS NOT INTENDED FOR DISTRIBUTION TO PROSPECTIVE INVESTORS IN THE FUNDS UNLESS PRECEDED OR ACCOMPANIED BY AN EFFECTIVE PROSPECTUS, WHICH CONTAINS MORE INFORMATION ON FEES, CHARGES AND OTHER EXPENSES AND SHOULD BE READ CAREFULLY BEFORE INVESTING OR SENDING MONEY. PAST PERFORMANCE IS NOT A GUARANTEE OF FUTURE RESULTS. SHARES OF THE FUNDS ARE DISTRIBUTED BY FAIRHOLME DISTRIBUTORS, LLC.
Item 2. Code of Ethics.
| | |
(a) | | The registrant, as of the end of the period covered by this report, has adopted a code of ethics that applies to the registrant’s principal executive officer, principal financial officer, principal accounting officer or controller, or persons performing similar functions, regardless of whether these individuals are employed by the registrant or a third party. |
| |
(b) | | Reserved. |
| |
(c) | | As of the filing date of this report, the Code was amended to clarify the manner in which |
| | amendments to the Code may be made. |
| |
(d) | | The registrant has not granted any waivers, during the period covered by this report, including an implicit waiver, from a provision of the code of ethics that applies to the registrant’s principal executive officer, principal financial officer, principal accounting officer or controller, or persons performing similar functions, regardless of whether these individuals are employed by the registrant or a third party, that relates to one or more of the items set forth in paragraph (b) of this Item. |
| |
(e) | | Reserved. |
| |
(f)(1) | | A copy of the registrant’s code of ethics is filed as an exhibit. |
Item 3. Audit Committee Financial Expert.
The registrant’s board of directors has determined that the registrant has at least one audit committee financial expert serving on its audit committee. Howard Frank is the “audit committee financial expert” and is considered to be “independent” as each term is defined in Item 3 of Form N-CSR.
Item 4. Principal Accountant Fees and Services.
Audit Fees
| | |
(a) | | The aggregate fees billed for each of the last two fiscal years for professional services rendered by the principal accountant for the audits of the annual financial statements of each series of the registrant or services that are normally provided by the accountant in connection with statutory and regulatory filings or engagements for those fiscal years were $120,000 in 2014 and $125,000 in 2015. |
Audit-Related Fees
| | |
(b) | | The aggregate fees billed in each of the last two fiscal years for assurance and related services by the principal accountant that are reasonably related to the performance of the audits of the financial statements of each series of the registrant and are not reported under paragraph (a) of this Item were $0 in 2014 and $0 in 2015. |
Tax Fees
| | |
(c) | | The aggregate fees billed in each of the last two fiscal years for professional services rendered by the principal accountant for tax compliance, tax advice, and tax planning were $36,000 in 2014 and $37,500 in 2015. These fees relate to the preparation and review of the various tax forms of each series of the registrant and also for the review of the dividend and distributions of each series of the registrant. |
All Other Fees
| | |
(d) | | The aggregate fees billed in each of the last two fiscal years for products and services provided by the principal accountant, other than the services reported in paragraphs (a) through (c) of this Item were $0 in 2014 and $0 in 2015. |
| |
(e)(1) | | Disclose the audit committee’s pre-approval policies and procedures described in paragraph (c)(7) of Rule 2-01 of Regulation S-X. |
| |
| | The audit committee has adopted policies and procedures that require the pre-approval by the audit committee of all audit and non-audit services to the registrant by the registrant’s principal accountant, including services provided to any entity affiliated with the registrant to the extent that such services are directly related to the operations or financial reporting of the registrant. |
| |
(e)(2) | | The percentage of services described in each of paragraphs (b) through (d) of this Item that were approved by the audit committee pursuant to paragraph (c)(7)(i)(C) of Rule 2-01 of Regulation S-X are as follows: |
(b) 100%
(c) 100%
(d) Not Applicable
| | |
(f) | | Not applicable. |
| |
(g) | | The aggregate non-audit fees billed by the registrant’s accountant for services rendered to the registrant, and rendered to the registrant’s investment adviser, and any entity controlling, controlled by, or under common control with the adviser that provides ongoing services to the registrant for each of the last two fiscal years of the registrant were $0 in 2014 and $0 in 2015. |
| |
(h) | | Not applicable. |
Item 5. Audit Committee of Listed Registrants.
Not applicable.
Item 6. Investments.
| | |
| (a) | | Schedule of investments in securities of unaffiliated issuers as of the close of the reporting period is included as part of the report to shareholders filed under Item 1 of this Form. |
| |
| (b) | | Not applicable. |
Item 7. Disclosure of Proxy Voting Policies and Procedures for Closed-End Management Investment
Companies.
Not applicable.
Item 8. Portfolio Managers of Closed-End Management Investment Companies.
Not applicable.
Item 9. Purchases of Equity Securities by Closed-End Management Investment Company and Affiliated
Purchasers.
Not applicable.
Item 10. Submission of Matters to a Vote of Security Holders.
There have been no material changes to the procedures by which the shareholders may recommend nominees to the registrant’s board of directors, where those changes were implemented after the registrant last provided disclosure in response to the requirements of Item 407(c)(2)(iv) of Regulation S-K (17 CFR 229.407) (as required by Item 22(b)(15) of Schedule 14A (17 CFR 240.14a-101)), or this Item.
Item 11. Controls and Procedures.
| | |
(a) | | The registrant’s principal executive and principal financial officers, or persons performing similar functions, have concluded that the registrant’s disclosure controls and procedures (as defined in Rule 30a-3(c) under the Investment Company Act of 1940, as amended (the “1940 Act”) (17 CFR 270.30a-3(c))) are effective, as of a date within 90 days of the filing date of the report that includes the disclosure required by this paragraph, based on the evaluation of these controls and procedures required by Rule 30a-3(b) under the 1940 Act (17 CFR 270.30a-3(b)) and Rules 13a-15(b) or 15d-15(b) under the Securities Exchange Act of 1934, as amended (17 CFR 240.13a-15(b) or 240.15d-15(b)). |
| |
(b) | | There were no changes in the registrant’s internal control over financial reporting (as defined in Rule 30a-3(d) under the 1940 Act (17 CFR 270.30a-3(d)) that occurred during the registrant’s second fiscal quarter of the period covered by this report that has materially affected, or is reasonably likely to materially affect, the registrant’s internal control over financial reporting. |
Item 12. Exhibits.
| | |
(a)(1) | | Code of ethics that is the subject of disclosure required by Item 2 is attached hereto as Exhibit (a)(1). |
| |
(a)(2) | | Certifications pursuant to Rule 30a-2(a) under the 1940 Act and Section 302 of the Sarbanes-Oxley Act of 2002 are attached hereto as Exhibits (a)(2)(i) and (a)(2)(ii). |
| |
(a)(3) | | Not applicable. |
| |
(b) | | Certifications pursuant to Rule 30a-2(b) under the 1940 Act and Section 906 of the Sarbanes- Oxley Act of 2002 are attached hereto as Exhibit (b). |
(12.other) Not applicable.
SIGNATURES
Pursuant to the requirements of the Securities Exchange Act of 1934 and the Investment Company Act of 1940, the registrant has duly caused this report to be signed on its behalf by the undersigned, thereunto duly authorized.
| | | | |
| (Registrant) | | Fairholme Funds, Inc. | | |
| | | | |
| | |
| By (Signature and Title)* | | /s/ Bruce R. Berkowitz | | |
| | Bruce R. Berkowitz, President | | |
| | (principal executive officer) | | |
Pursuant to the requirements of the Securities Exchange Act of 1934 and the Investment Company Act of 1940, this report has been signed below by the following persons on behalf of the registrant and in the capacities and on the dates indicated.
| | | | |
| By (Signature and Title)* | | /s/ Bruce R. Berkowitz | | |
| | Bruce R. Berkowitz, President | | |
| | (principal executive officer) | | |
| | | | |
| | |
| By (Signature and Title)* | | /s/ Wayne Kellner | | |
| | Wayne Kellner, Treasurer | | |
| | (principal financial officer) | | |
* Print the name and title of each signing officer under his or her signature.