UNITED STATES
SECURITIES AND EXCHANGE COMMISSION
Washington, D.C. 20549
FORM N-CSR
CERTIFIED SHAREHOLDER REPORT OF REGISTERED MANAGEMENT
INVESTMENT COMPANIES
Investment Company Act file number 811-09607
Fairholme Funds, Inc.
(Exact name of registrant as specified in charter)
4400 Biscayne Blvd., 9th Floor
Miami, FL 33137
(Address of principal executive offices) (Zip code)
Bruce R. Berkowitz
4400 Biscayne Blvd., 9th Floor
Miami, FL 33137
(Name and address of agent for service)
Registrant’s telephone number, including area code: 1-866-202-2263
Date of fiscal year end: November 30
Date of reporting period: November 30, 2017
Form N-CSR is to be used by management investment companies to file reports with the Commission not later than 10 days after the transmission to stockholders of any report that is required to be transmitted to stockholders under Rule 30e-1 under the Investment Company Act of 1940 (17 CFR 270.30e-1). The Commission may use the information provided on Form N-CSR in its regulatory, disclosure review, inspection, and policymaking roles.
A registrant is required to disclose the information specified by Form N-CSR, and the Commission will make this information public. A registrant is not required to respond to the collection of information contained in Form N-CSR unless the Form displays a currently valid Office of Management and Budget (“OMB”) control number. Please direct comments concerning the accuracy of the information collection burden estimate and any suggestions for reducing the burden to Secretary, Securities and Exchange Commission, 450 Fifth Street, NW, Washington, DC 20549-0609. The OMB has reviewed this collection of information under the clearance requirements of 44 U.S.C. § 3507.
Item 1. Reports to Stockholders.
The Reports to Shareholders of each Fund are attached herewith.

FAIRHOLME FUNDS, INC.
The Fairholme Fund (FAIRX)
Seeking long-term growth of capital
The Fairholme Focused Income Fund (FOCIX)
Seeking current income
The Fairholme Allocation Fund (FAAFX)
Seeking long-term total return
Annual Report
November 30, 2017
Managed by Fairholme Capital Management
(866) 202-2263 • fairholmefunds.com
FAIRHOLME FUNDS, INC.
TABLE OF CONTENTS
November 30, 2017
2
FAIRHOLME FUNDS, INC.
FUND PERFORMANCE (unaudited)
November 30, 2007 — November 30, 2017
THE FAIRHOLME FUND VS. THE S&P 500 INDEX
INITIAL INVESTMENT OF $10,000
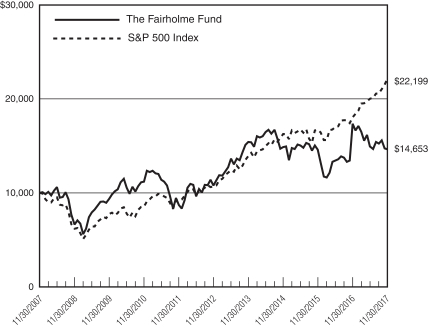
The Fairholme Fund (“The Fairholme Fund”) commenced operations on December 29, 1999. The chart above presents the performance of a $10,000 investment for up to ten years to the latest annual period ending November 30, 2017.
The following notes pertain to the chart above as well as to the performance table included in the Management Discussion & Analysis Report. Performance information in this report represents past performance and is not a guarantee of future results. The investment return and principal value of an investment in The Fairholme Fund will fluctuate, so that an investor’s shares when redeemed may be worth more or less than their original cost. Current performance may be lower or higher than the performance quoted within. The performance information does not reflect the taxes an investor would pay on distributions from The Fairholme Fund or upon redemption of shares of The Fairholme Fund. Most recent month-end performance and answers to any questions you may have can be obtained by calling Shareholder Services at 1-866-202-2263.
Data for both the S&P 500 Index and The Fairholme Fund are presented assuming all dividends and distributions have been reinvested and do not reflect any taxes that might have been incurred by a shareholder as a result of The Fairholme Fund distributions. The S&P 500 Index is a widely recognized, unmanaged index of 500 of the largest companies in the United States as measured by market capitalization and does not reflect any investment management fees or transaction expenses, nor the effects of taxes, fees or other charges.
3
FAIRHOLME FUNDS, INC.
FUND PERFORMANCE (unaudited)
Inception through November 30, 2017
THE INCOME FUND VS.
The BLOOMBERG BARCLAYS U.S. AGGREGATE BOND INDEX
INITIAL INVESTMENT OF $10,000
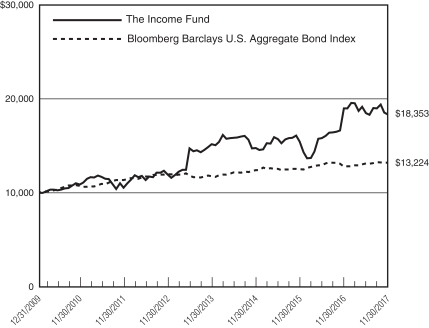
The Fairholme Focused Income Fund (“The Income Fund”) commenced operations on December 31, 2009. The chart above presents the performance of a $10,000 investment from inception to the latest annual period ending November 30, 2017.
The following notes pertain to the chart above as well as to the performance table included in the Management Discussion & Analysis Report. Performance information in this report represents past performance and is not a guarantee of future results. The investment return and principal value of an investment in The Income Fund will fluctuate, so that an investor’s shares when redeemed may be worth more or less than their original cost. Current performance may be lower or higher than the performance quoted within. The performance information does not reflect the taxes an investor would pay on distributions from The Income Fund or upon redemption of shares of The Income Fund. Most recent month-end performance and answers to any questions you may have can be obtained by calling Shareholder Services at 1-866-202-2263.
Data for both the Bloomberg Barclays U.S. Aggregate Bond Index and The Income Fund are presented assuming all dividends and distributions have been reinvested and do not reflect any taxes that might have been incurred by a shareholder as a result of The Income Fund distributions. The Bloomberg Barclays U.S. Aggregate Bond Index is a broad-based flagship benchmark that measures the investment grade, U.S. dollar-denominated, fixed-rate taxable bond market, and includes Treasuries, government-related and corporate securities, mortgage-backed securities (agency fixed-rate and hybrid adjustable-rate mortgage pass-throughs), asset-backed securities and commercial mortgage-backed securities (agency and non-agency). The Bloomberg Barclays U.S. Aggregate Bond Index does not reflect any investment management fees or transaction expenses, nor the effects of taxes, fees, or other charges.
4
FAIRHOLME FUNDS, INC.
FUND PERFORMANCE (unaudited)
Inception through November 30, 2017
THE ALLOCATION FUND VS. The BLOOMBERG BARCLAYS U.S.
AGGREGATE BOND INDEX AND THE S&P 500 INDEX
INITIAL INVESTMENT OF $10,000
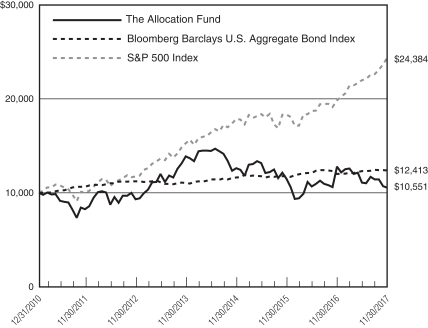
The Fairholme Allocation Fund (“The Allocation Fund”) commenced operations on December 31, 2010. The chart above presents the performance of a $10,000 investment from inception to the latest annual period ending November 30, 2017.
The following notes pertain to the chart above as well as to the performance table included in the Management Discussion & Analysis Report. Performance information in this report represents past performance and is not a guarantee of future results. The investment return and principal value of an investment in The Allocation Fund will fluctuate, so that an investor’s shares when redeemed may be worth more or less than their original cost. Current performance may be lower or higher than the performance quoted within. The performance information does not reflect the taxes an investor would pay on distributions from The Allocation Fund or upon redemption of shares of The Allocation Fund. Most recent month-end performance and answers to any questions you may have can be obtained by calling Shareholder Services at 1-866-202-2263.
Data for the Bloomberg Barclays U.S. Aggregate Bond Index, the S&P 500 Index and The Allocation Fund are presented assuming all dividends and distributions have been reinvested and do not reflect any taxes that might have been incurred by a shareholder as a result of The Allocation Fund distributions. The Bloomberg Barclays U.S. Aggregate Bond Index is a broad-based flagship benchmark that measures the investment grade, U.S. dollar-denominated, fixed-rate taxable bond market, and includes Treasuries, government-related and corporate securities, mortgage-backed securities (agency fixed-rate and hybrid adjustable-rate mortgage pass-throughs), asset-backed securities and commercial mortgage-backed securities (agency and non-agency). The S&P 500 Index is a widely recognized, unmanaged index of 500 of the largest companies in the United States as measured by market capitalization. These index returns do not reflect any investment management fees or transaction expenses, nor the effects of taxes, fees or other charges.
5
FAIRHOLME FUNDS, INC.
MANAGEMENT DISCUSSION & ANALYSIS
For the Fiscal Year Ended November 30, 2017
The Fairholme Fund, The Income Fund, and The Allocation Fund (each a “Fund” and collectively, the “Funds”) shares outstanding and audited net asset value per share (“NAV”) at November 30, 2017, the end of the Funds’ fiscal year, and NAVs at other pertinent dates, were as follows:
| | | | | | | | | | | | | | | | |
| | | 11/30/2017
Shares
Outstanding | | | 11/30/2017
NAV
(audited) | | | 05/31/2017
NAV
(unaudited) | | | 11/30/2016
NAV
(audited) | |
The Fairholme Fund | | | 97,989,113 | | | $ | 19.10 | | | $ | 19.47 | | | $ | 24.26 | |
The Income Fund | | | 19,724,137 | | | $ | 11.33 | | | $ | 11.69 | | | $ | 12.38 | |
The Allocation Fund | | | 15,354,878 | | | $ | 7.44 | | | $ | 7.84 | | | $ | 9.65 | |
At December 31, 2017, the unaudited NAVs of The Fairholme Fund, The Income Fund, and The Allocation Fund were $20.14, $11.02, and $7.98 per share, respectively.
Performance figures below are shown for the Funds’ fiscal year ended November 30, 2017, and do not match calendar year figures for the period ended December 31, 2017, cited in the Portfolio Manager’s report.
| | | | | | | | | | | | | | | | | | | | | | | | |
The Fairholme Fund Performance to 11/30/2017 | | Six
Months | | | One
Year | | | Five
Years | | | Ten
Years | | | Fifteen
Years | | | Since
Inception
12/29/1999 | |
| | | | | | |
| Cumulative: | | | | | | | | | | | | | | | | | | | | | | | | |
The Fairholme Fund | | | (1.90 | )% | | | (15.64 | )% | | | 35.80 | % | | | 46.53 | % | | | 237.55 | % | | | 424.82 | % |
S&P 500 Index | | | 10.89 | % | | | 22.87 | % | | | 107.73 | % | | | 121.99 | % | | | 284.77 | % | | | 156.06 | % |
| | | | | | |
| Annualized: | | | | | | | | | | | | | | | | | | | | | | | | |
The Fairholme Fund | | | | | | | (15.64 | )% | | | 6.31 | % | | | 3.89 | % | | | 8.45 | % | | | 9.69 | % |
S&P 500 Index | | | | | | | 22.87 | % | | | 15.74 | % | | | 8.30 | % | | | 9.40 | % | | | 5.38 | % |
For the six months ended November 30, 2017, The Fairholme Fund was outperformed by the S&P 500 Index (“S&P 500”) by 12.79 percentage points while over the last year The Fairholme Fund was outperformed by the S&P 500 by 38.51 percentage points. From inception, The Fairholme Fund outperformed the S&P 500 by 4.31 percentage points per annum, or on a cumulative basis, 268.76 percentage points over seventeen years and eleven months.
| | | | | | | | | | | | | | | | |
The Income Fund Performance to 11/30/2017 | | Six
Months | | | One
Year | | | Five
Year | | | Since
Inception
12/31/2009 | |
| | | | |
| Cumulative: | | | | | | | | | | | | | | | | |
The Income Fund | | | (0.69 | )% | | | (3.35 | )% | | | 53.30 | % | | | 83.52 | % |
Bloomberg Barclays Bond Index | | | 0.68 | % | | | 3.21 | % | | | 10.29 | % | | | 32.24 | % |
| | | | |
| Annualized: | | | | | | | | | | | | | | | | |
The Income Fund | | | | | | | (3.35 | )% | | | 8.92 | % | | | 7.97 | % |
Bloomberg Barclays Bond Index | | | | | | | 3.21 | % | | | 1.98 | % | | | 3.59 | % |
6
FAIRHOLME FUNDS, INC.
MANAGEMENT DISCUSSION & ANALYSIS (continued)
For the Fiscal Year Ended November 30, 2017
For the six months ended November 30, 2017, The Income Fund was outperformed by the Bloomberg Barclays U.S. Aggregate Bond Index (“Bloomberg Barclays Bond Index”) by 1.37 percentage points while over the last year The Income Fund was outperformed by the Bloomberg Barclays Bond Index by 6.56 percentage points. From inception, The Income Fund outperformed the Bloomberg Barclays Bond Index by 4.38 percentage points per annum, or on a cumulative basis, 51.28 percentage points over seven years and eleven months.
| | | | | | | | | | | | | | | | |
The Allocation Fund Performance to 11/30/2017 | | Six
Months | | | One
Year | | | Five
Year | | | Since
Inception
12/31/2010 | |
| | | | |
| Cumulative: | | | | | | | | | | | | | | | | |
The Allocation Fund | | | (5.10 | )% | | | (17.59 | )% | | | 13.09 | % | | | 5.51 | % |
Bloomberg Barclays Bond Index | | | 0.68 | % | | | 3.21 | % | | | 10.29 | % | | | 24.13 | % |
S&P 500 Index | | | 10.89 | % | | | 22.87 | % | | | 107.73 | % | | | 143.84 | % |
| | | | |
| Annualized: | | | | | | | | | | | | | | | | |
The Allocation Fund | | | | | | | (17.59 | )% | | | 2.49 | % | | | 0.78 | % |
Bloomberg Barclays Bond Index | | | | | | | 3.21 | % | | | 1.98 | % | | | 3.17 | % |
S&P 500 Index | | | | | | | 22.87 | % | | | 15.74 | % | | | 13.75 | % |
For the six months ended November 30, 2017, The Allocation Fund was outperformed by the Bloomberg Barclays Bond Index and the S&P 500 by 5.78 and 15.99 percentage points, respectively, while over the last year The Allocation Fund was outperformed by the Bloomberg Barclays Bond Index and the S&P 500 by 20.80 and 40.46 percentage points, respectively. From inception, The Allocation Fund was outperformed by the Bloomberg Barclays Bond Index and the S&P 500 by 2.39 and 12.97 percentage points per annum, respectively, or on a cumulative basis, 18.62 and 138.33 percentage points over six years and eleven months.
Fairholme Capital Management, L.L.C. (the “Manager”) believes performance over shorter periods is likely to be less meaningful than performance over longer periods. Investors are cautioned not to rely on short-term results. The fact that securities increase or decline in value does not always indicate that the Manager believes these securities to be more or less attractive — in fact, the Manager believes that some price increases present selling opportunities and some price declines present buying opportunities.
Further, shareholders should note that the S&P 500 and the Bloomberg Barclays Bond Index are unmanaged indices incurring no fees, expenses, or tax effects and are shown solely to compare the Funds’ performance to that of unmanaged and diversified indices of securities. Shareholders are also cautioned that it is possible that some securities mentioned in this discussion may no longer be held by a Fund subsequent to the end of the fiscal period, and that a Fund may have made significant new purchases that are not yet required to be disclosed. It is the Funds’ general policy not to disclose portfolio holdings other than when required by relevant law or regulation. Portfolio holdings are subject to change without notice.
Not all Fund portfolio dispositions or additions are material, and, while the Funds and the Manager have long-term objectives, it is possible that a security sold or purchased in one period will be purchased or sold in a subsequent period. Generally, the Manager determines to buy and sell based on its estimates of the absolute and relative intrinsic values and fundamental dynamics of a particular security and its issuer and its industry. However, certain strategies of the Manager in carrying out the Funds’ policy may result in shorter holding periods.
The Manager invests each Fund’s assets in securities to the extent it finds reasonable investment opportunities in accordance with its Prospectus and may invest a significant portion of each Fund’s assets in liquid, low-risk securities or cash. The Manager views liquidity as a strategic advantage. At November 30, 2017, cash and cash equivalents (consisting of cash, commercial paper, deposit accounts, U.S. Treasury Bills, and money-market funds) represented 27.0%, 34.6%, and 18.7% of The Fairholme Fund, The Income Fund, and The Allocation Fund total
7
FAIRHOLME FUNDS, INC.
MANAGEMENT DISCUSSION & ANALYSIS (continued)
For the Fiscal Year Ended November 30, 2017
assets, respectively. Since inception, the Funds have held liquid, low-risk securities or cash for periods without negatively influencing performance, although there is no guarantee that future performance will not be negatively affected by Funds’ liquidity.
Each Fund is considered to be “non-diversified” under the Investment Company Act of 1940. The Funds can invest a greater percentage of assets in fewer securities than a diversified fund and may invest a significant portion of cash and liquid assets in one or more higher-risk securities at any time, particularly in situations where markets are weak or a particular security declines sharply. The Funds may also have a greater percentage of assets invested in a particular industry than a diversified fund, exposing the Funds to the risk of an unanticipated industry condition as well as risks specific to a single company or security.
The commentaries below provide details of each fund’s portfolio holdings by issuer and sector, as well as reporting the most significant positive and negative performance by investment for the fiscal year ended November 30, 2017.
The most significant losses in each of the Funds related to negative developments in the Mortgage Finance, Retail Department Stores, Real Estate Management & Development, and Real Estate Investment Trusts. Investments in the Capital Goods and Oil & Gas sectors saw some gains during the fiscal year.
The Manager made no changes to the core investment strategies and techniques it employs during the fiscal year ended November 30, 2017.
For the fiscal year ended November 30, 2017, The Fairholme Fund investments that were the biggest contributors to positive performance were Intelsat Jackson Holdings S.A. (“Intelsat”), Chesapeake Energy Corp. (“Chesapeake”), and Atwood Oceanic, Inc. (“Atwood”). The biggest contributors to negative performance were investments in Sears Holdings Corp. (“Sears”), Federal National Mortgage Association (“Fannie”), Federal Home Loan Mortgage Corp. (“Freddie”), The St. Joe Co., Sears Canada, Inc., Seritage Growth Properties (“Seritage”), and Imperial Metals Corp. (“Imperial”). The following charts show the top holdings by issuer and sector in descending order of net assets as of November 30, 2017.
| | | | | | | | | | |
| | |
The Fairholme Fund Top Holdings by Issuer* (% of Net Assets) | | | The Fairholme Fund Top Sectors (% of Net Assets) | |
| | | | |
The St. Joe Co. | | | 22.8% | | | Cash and Cash Equivalents** | | | 27.1% | |
Federal Home Loan Mortgage Corp. | | | 12.9% | | | Mortgage Finance | | | 25.6% | |
Federal National Mortgage Association | | | 12.7% | | | Real Estate Management & Development | | | 22.8% | |
Imperial Metals Corp. | | | 7.9% | | | Metals & Mining | | | 7.9% | |
Sears Holdings Corp. | | | 7.3% | | | Retail Department Stores | | | 7.3% | |
Seritage Growth Properties | | | 4.7% | | | Real Estate Investment Trusts | | | 4.7% | |
International Wire Group, Inc. | | | 2.0% | | | Capital Goods | | | 2.0% | |
Monitronics International, Inc. | | | 1.9% | | | Consumer Services | | | 1.9% | |
Bristow Group, Inc. | | | 0.5% | | | Oil & Gas Equipment & Services | | | 0.5% | |
| | | | | | | | | | | |
| | | | 72.7% | | | | | | 99.8% | |
| | | | | | | | | | | |
| | | | | | | | | | | |
| * | Excludes cash, U.S. Treasury Bills, commercial paper, and money market funds. |
| ** | Includes cash, U.S. Treasury Bills, commercial paper, and money market funds. |
8
FAIRHOLME FUNDS, INC.
MANAGEMENT DISCUSSION & ANALYSIS (continued)
For the Fiscal Year Ended November 30, 2017
For the fiscal year ended November 30, 2017, The Income Fund investments that were the biggest contributors to positive performance were Atwood, Intelsat, Imperial, Chesapeake, HC2 Holdings, Inc., GMAC Capital Trust I, Inc. The biggest contributors to negative performance were investments in Sears, Fannie, Freddie, and Seritage. The following charts show the top holdings by issuer and sector in descending order of net assets as of November 30, 2017.
| | | | | | | | | | |
| | |
The Income Fund Top Holdings by Issuer* (% of Net Assets) | | | The Income Fund Top Sectors (% of Net Assets) | |
| | | | |
Imperial Metals Corp. | | | 11.6% | | | Cash and Cash Equivalents** | | | 34.7% | |
Seritage Growth Properties | | | 10.4% | | | Metals & Mining | | | 11.6% | |
Sears Holdings Corp. | | | 8.3% | | | Real Estate Investment Trusts | | | 10.4% | |
Federal National Mortgage Association | | | 5.5% | | | Mortgage Finance | | | 9.9% | |
International Wire Group, Inc. | | | 5.1% | | | Capital Goods | | | 9.4% | |
Federal Home Loan Mortgage Corp. | | | 4.4% | | | Retail Department Stores | | | 8.3% | |
HC2 Holdings, Inc. | | | 4.3% | | | Consumer Finance | | | 3.1% | |
GMAC Capital Trust I, Inc. | | | 3.1% | | | Chemicals | | | 2.5% | |
Public Finance Authority | | | 2.5% | | | Oil & Natural Gas Exploration | | | 1.8% | |
Chesapeake Energy Corp. | | | 1.8% | | | Consumer Services | | | 1.7% | |
| | | | | | | | | | | |
| | | | 57.0% | | | | | | 93.4% | |
| | | | | | | | | | | |
| | | | | | | | | | | |
| * | Excludes cash, U.S. Treasury Bills, commercial paper, and money market funds. |
| ** | Includes cash, U.S. Treasury Bills, commercial paper, and money market funds. |
For the fiscal year ended November 30, 2017, The Allocation Fund investments that were the biggest contributors to positive performance were Intelsat and Atwood. The biggest contributors to negative performance were investments in Sears, Imperial, Fannie, Freddie, Seritage, Sears Canada, Inc., and Lands’ End, Inc. The following charts show the top holdings by issuer and sector in descending order of net assets as of November 30, 2017.
| | | | | | | | | | |
| | |
The Allocation Fund Top Holdings by Issuer* (% of Net Assets) | | | The Allocation Fund Top Sectors (% of Net Assets) | |
| | | | |
Seritage Growth Properties | | | 24.5% | | | Mortgage Finance | | | 32.5% | |
Federal Home Loan Mortgage Corp. | | | 16.3% | | | Real Estate Investment Trusts | | | 24.5% | |
Federal National Mortgage Association | | | 16.2% | | | Cash and Cash Equivalents** | | | 18.6% | |
The St. Joe Co. | | | 6.9% | | | Real Estate Management & Development | | | 6.9% | |
Sears Holdings Corp. | | | 5.1% | | | Retail Department Stores | | | 5.1% | |
International Wire Group, Inc. | | | 4.1% | | | Capital Goods | | | 4.1% | |
Imperial Metals Corp. | | | 3.5% | | | Metals & Mining | | | 3.5% | |
Chesapeake Energy Corp. | | | 2.5% | | | Oil & Natural Gas Exploration | | | 2.5% | |
Monitronics International, Inc. | | | 2.2% | | | Consumer Services | | | 2.2% | |
| | | | | | | | | | | |
| | | | 81.3% | | | | | | 99.9% | |
| | | | | | | | | | | |
| | | | | | | | | | | |
| * | Excludes cash, U.S. Treasury Bills, commercial paper, and money market funds. |
| ** | Includes cash, U.S. Treasury Bills, commercial paper, and money market funds. |
The Manager views the ability to focus on fewer investments than a diversified fund as a strategic advantage. However, such a strategy may negatively influence short-term performance and there is no guarantee that long-term performance will not be negatively affected.
9
FAIRHOLME FUNDS, INC.
MANAGEMENT DISCUSSION & ANALYSIS (continued)
For the Fiscal Year Ended November 30, 2017
The Funds may invest in non-U.S. securities and securities of corporations domiciled outside of the United States, which may expose a Fund to adverse changes resulting from foreign currency fluctuations or other potential risks as described in the Funds’ Prospectus and Statement of Additional Information.
The Funds’ Officers, the Board of Directors (the “Board” or the “Directors”), and the Manager are aware that large cash inflows or outflows may adversely affect the Funds’ performance. Such flows are monitored and appropriate actions are contemplated for when such flows could negatively impact performance.
Since inception, the Funds have been advised by the Manager. Bruce Berkowitz, both the Chief Investment Officer of the Manager and Chairman of the Funds’ Board, and his affiliates beneficially own an aggregate 7,604,186, 1,750,580, and 6,465,023 shares of The Fairholme Fund, The Income Fund, and The Allocation Fund, respectively, at November 30, 2017. While there is no requirement that Mr. Berkowitz own shares of the Funds, such holdings are believed to help align the interests of the Manager with the interests of the shareholders.
The Board, including the Independent Directors, continues to believe that it is in the best interests of the Funds to have Mr. Berkowitz serve as Chairman of the Board given: his long-term relative performance; his experience, commitment, and significant personal investment in the Funds; the present constitution of Directors and policies; and current rules and regulations. A Director and Officers of the Funds are also Officers of the Manager. Nevertheless, at November 30, 2017, a majority of Directors were independent of the Manager, no stock option or restricted stock plans exist, Officers received no direct compensation from the Funds, and the Director affiliated with the Manager received no compensation for being a Director.
For more complete information about the Funds, or to obtain a current Prospectus, please visit www.fairholmefunds.com or call Shareholder Services at (866) 202-2263.
10
| | | | |
FAIRHOLME FUNDS, INC. | | | | |
| |
| |
EXPENSE EXAMPLE | |
For the Six Month Period from June 1, 2017 | |
through November 30, 2017 (unaudited) | |
| |
As a Fund shareholder, you incur direct and indirect costs. Direct costs include, but are not limited to, transaction fees at some broker-dealers, custodial fees for retirement accounts, redemption fees (on The Fairholme Fund and The Fairholme Allocation Fund shares redeemed within 60 days of purchase), and wire transfer fees. You also incur indirect, ongoing costs that include, but are not limited to, management fees paid to the Manager.
The following examples are intended to help you understand your indirect costs (also referred to as “ongoing costs” and measured in dollars) when investing in the Funds and to compare these costs with the ongoing costs of investing in other mutual funds. These examples are based on an investment of $1,000 invested in the Funds at June 1, 2017, and held for the entire six month period ending November 30, 2017.
Actual Expenses
The first line of the tables below provides information about actual account values and actual expenses. You may use the information in this line, together with the amount you had invested at the beginning of the period, to estimate the expenses that you paid over the period. Simply divide your account value by $1,000 (for example, an $8,600 account value divided by $1,000 = 8.6), then multiply the result by the number in the first line under the heading “Expenses Paid During the Period” to estimate the expenses you paid on your Fund holdings during this period.
Hypothetical Example for Comparison Purposes
The second line of the tables provides information about hypothetical account values and hypothetical expenses based on each Fund’s actual expense ratio and an assumed rate of return of 5% per year before expenses, which is not the Fund’s actual return for the period presented. The hypothetical account values and expenses may not be used to estimate the actual ending account balance or expenses that you paid for the period presented. However, you may use this information to compare ongoing costs of investing in the Funds with the ongoing costs of investing in other funds. To do so, compare this 5% hypothetical example with the 5% examples that appear in the shareholder reports of other funds.
Please note that the column titled “Expenses Paid During the Period” in the tables below is meant to highlight your ongoing costs only and do not reflect any transactional costs, such as redemption fees (if any), or other direct costs. Therefore, the second line of the tables is useful in comparing ongoing costs only, and will not help you determine the relative total costs of owning different funds. In addition, if these direct costs were included, your total costs would be higher.
| | | | | | | | | | | | | | | | | | | | | | | | | | | | |
| | | Beginning
Account Value
June 1, 2017 | | | | | | Ending
Account Value
November 30, 2017 | | | | | | Annualized
Expense
Ratio | | | | | | Expenses Paid
During the Period
June 1, 2017
Through
November 30, 2017* | |
The Fairholme Fund | | | | | | | | | | | | | | | | | | | | | | | | | | | | |
Actual | | | $1,000.00 | | | | | | | | $ 981.00 | | | | | | | | 1.03% | | | | | | | | $5.12 | |
Hypothetical
(5% return before expenses) | | | $1,000.00 | | | | | | | | $1,019.90 | | | | | | | | 1.03% | | | | | | | | $5.22 | |
| | | | | | | | | | | | | | | | | | | | | | | | | | | | | |
The Income Fund | | | | | | | | | | | | | | | | | | | | | | | | | | | | |
Actual | | | $1,000.00 | | | | | | | | $ 993.10 | | | | | | | | 1.00% | | | | | | | | $5.00 | |
Hypothetical
(5% return before expenses) | | | $1,000.00 | | | | | | | | $1,020.05 | | | | | | | | 1.00% | | | | | | | | $5.06 | |
| | | | | | | | | | | | | | | | | | | | | | | | | | | | | |
The Allocation Fund | | | | | | | | | | | | | | | | | | | | | | | | | | | | |
Actual | | | $1,000.00 | | | | | | | | $ 949.00 | | | | | | | | 1.00% | | | | | | | | $4.89 | |
Hypothetical
(5% return before expenses) | | | $1,000.00 | | | | | | | | $1,020.05 | | | | | | | | 1.00% | | | | | | | | $5.06 | |
| | | | | | | | | | | | | | | | | | | | | | | | | | | | | |
| * | Expenses are equal to each Fund’s annualized expense ratio, multiplied by the average account value over the period, multiplied by 183 days/365 days (to reflect the one-half year period). |
11
| | | | |
THE FAIRHOLME FUND | | | | |
| |
| |
SCHEDULE OF INVESTMENTS | |
November 30, 2017 | |
| |
| | | | | | | | |
| Shares | | | | | Value | |
| | | | | | |
| | |
| | | | DOMESTIC EQUITY
SECURITIES — 30.4% | | | | |
| | | | REAL ESTATE INVESTMENT
TRUSTS — 4.7% | | | | |
| | 2,185,580 | | | Seritage Growth Properties (a) | | $ | 88,953,106 | |
| | | | | | | | |
| | |
| | | | REAL ESTATE MANAGEMENT
& DEVELOPMENT — 22.8% | | | | |
| | 22,730,687 | | | The St. Joe Co. (a)(b)(c) | | | 427,336,916 | |
| | | | | | | | |
| | |
| | | | RETAIL DEPARTMENT
STORES — 2.9% | | | | |
| | 13,535,991 | | | Sears Holdings Corp. (a)(b)(c)(d) | | | 53,467,164 | |
| | | | | | | | |
| TOTAL DOMESTIC EQUITY SECURITIES
(COST $1,501,625,813) | | | 569,757,186 | |
| | | | | | | | |
| | |
| | | | FOREIGN EQUITY
SECURITIES — 0.7% | | | | |
| | |
| | | | CANADA — 0.7% | | | | |
| | |
| | | | METALS & MINING — 0.7% | | | | |
| | 7,027,352 | | | Imperial Metals Corp. (a)(b) | | | 12,636,868 | |
| | | | | | | | |
| TOTAL FOREIGN EQUITY SECURITIES
(COST $65,617,874) | | | 12,636,868 | |
| | | | | | | | |
| | | | | | | | |
| Shares | | | | | Value | |
| | | | | | |
| |
| | | | DOMESTIC PREFERRED EQUITY
SECURITIES — 25.6% | |
| |
| | | | MORTGAGE FINANCE — 25.6% | |
| | | | Federal Home Loan Mortgage
Corp. | |
| | 29,448,106 | | | 7.875%, Series Z (b)(e) | | $ | 195,829,905 | |
| | 2,678,285 | | | 6.550%, Series Y (b) | | | 13,471,774 | |
| | 1,285,184 | | | 1.696%, Series B (b)(e) | | | 10,294,324 | |
| | 1,099,962 | | | 5.100%, Series H (b) | | | 10,064,652 | |
| | 1,214,003 | | | 5.570%, Series V (b) | | | 5,766,636 | |
| | 442,107 | | | 5.900%, Series U (b) | | | 2,210,535 | |
| | 429,669 | | | 5.660%, Series W (b) | | | 2,040,928 | |
| | 196,492 | | | 5.000%, Series F (b) | | | 1,768,428 | |
| | | | Federal National Mortgage Association | | | | |
| | 31,479,110 | | | 7.750%, Series S (b)(e) | | | 210,595,246 | |
| | 1,473,690 | | | 7.625%, Series R (b) | | | 8,444,244 | |
| | 1,530,181 | | | 6.750%, Series Q (b) | | | 7,880,432 | |
| | 1,083,749 | | | 4.500%, Series P (b)(e) | | | 5,527,120 | |
| | 390,493 | | | 7.000%, Series O (b)(e) | | | 3,943,979 | |
| | 125,000 | | | 0.570%, Series G (b)(e) | | | 1,181,250 | |
| | | | | | | | |
| | | | | | | 479,019,453 | |
| | | | | | | | |
| |
| | | | RETAIL DEPARTMENT STORES — 0.0% | |
| | 15,134 | | | Sears Roebuck Acceptance Corp.
7.400% (a)(c)(d) | | | 144,378 | |
| | | | | | | | |
| TOTAL DOMESTIC PREFERRED
EQUITY SECURITIES
(COST $349,231,448) | | | 479,163,831 | |
| | | | | | | | |
The accompanying notes are an integral part of the financial statements.
12
| | | | |
THE FAIRHOLME FUND | | | | |
| |
| |
SCHEDULE OF INVESTMENTS (continued) | |
November 30, 2017 | |
| |
| | | | | | | | |
| Shares | | | | | Value | |
| | |
| | | | RIGHTS — 0.0%
| | | | |
| |
| | | | METALS & MINING — 0.0% | |
| | 4,797,852 | | | Imperial Metals Corp.,
Expire 12/22/2017 (a)(b) | | $ | 92,971 | |
| | | | | | | | |
| TOTAL RIGHTS
(COST $0) | | | 92,971 | |
| | | | | | | | |
| | |
| | | | WARRANTS — 0.0% | | | | |
| | |
| | | | RETAIL DEPARTMENT
STORES — 0.0% | | | | |
| | 218,419 | | | Sears Holdings Corp., | | | | |
| | | | Vested, Strike Price $25.686,
Expire 12/15/2019 (a)(b)(c)(d)(f) | | | 98,289 | |
| | | | | | | | |
| TOTAL WARRANTS
(COST $3,881,918) | | | 98,289 | |
| | | | | | | | |
Principal | | | | | | |
| | |
| | | | DOMESTIC CORPORATE
BONDS — 8.8% | | | | |
| | |
| | | | CAPITAL GOODS — 2.0% | | | | |
| $ | 42,187,000 | | | International Wire Group, Inc. | | | | |
| | | | 10.750%, 08/01/2021 (g) | | | 38,461,888 | |
| | | | | | | | |
| | |
| | | | CONSUMER
SERVICES — 1.9% | | | | |
| | 41,951,000 | | | Monitronics International, Inc. | | | | |
| | | | 9.125%, 04/01/2020 | | | 35,410,839 | |
| | | | | | | | |
| |
| | | | OIL & GAS EQUIPMENT &
SERVICES — 0.5% | |
| | 11,790,000 | | | Bristow Group, Inc. | | | | |
| | | | 6.250%, 10/15/2022 | | | 9,531,036 | |
| | | | | | | | |
| |
| | | | RETAIL DEPARTMENT
STORES — 4.4% | |
| | | | Sears Holdings Corp. | | | | |
| | 7,580,000 | | | 6.625%, 10/15/2018 (a)(c)(d) | | | 5,867,678 | |
| | 140,893,000 | | | 8.000%, 12/15/2019 (a)(c)(d) | | | 73,137,556 | |
| | 6,765,000 | | | Sears Roebuck Acceptance Corp. | | | | |
| | | | 7.500%, 10/15/2027 (a)(c)(d) | | | 2,850,771 | |
| | | | | | | | |
| | | | | | | 81,856,005 | |
| | | | | | | | |
| TOTAL DOMESTIC CORPORATE BONDS
(COST $240,701,930) | | | 165,259,768 | |
| | | | | | | | |
| | | | | | | | |
Principal | | | | | Value | |
| | |
| | | | FOREIGN CORPORATE
BONDS — 7.2% | | | | |
| | |
| | | | CANADA — 7.2% | | | | |
| |
| | | | METALS & MINING — 7.2% | |
| | | | Imperial Metals Corp. | | | | |
| $ | 143,223,000 | | | 7.000%, 03/15/2019 (a)(g) | | $ | 134,271,563 | |
| | | | | | | | |
| TOTAL FOREIGN CORPORATE BONDS
(COST $139,593,695) | | | 134,271,563 | |
| | | | | | | | |
| | |
| | | | COMMERCIAL
PAPER — 19.9% | | | | |
| |
| | | | AUTOMOTIVE RETAIL — 2.7% | |
| | 50,000,000 | | | AutoZone, Inc. | | | | |
| | | | 1.351%, 12/08/2017 (g)(h) | | | 49,984,756 | |
| | | | | | | | |
| | |
| | | | BEVERAGES — 1.4% | | | | |
| | 27,000,000 | | | Molson Coors Brewing Co. | | | | |
| | | | 1.541%, 12/04/2017 (g)(h) | | | 26,995,914 | |
| | | | | | | | |
| |
| | | | FOOD PRODUCTS — 2.9% | |
| | | | Mondelez International, Inc. | | | | |
| | 36,000,000 | | | 1.331%, 12/07/2017 (g)(h) | | | 35,990,410 | |
| | 18,000,000 | | | 1.361%, 12/18/2017 (g)(h) | | | 17,987,364 | |
| | | | | | | | |
| | | | | | | 53,977,774 | |
| | | | | | | | |
| |
| | | | INSURANCE BROKERS — 0.5% | |
| | 10,000,000 | | | Marsh & McLennan Co., Inc. | | | | |
| | | | 1.280%, 12/06/2017 (g)(h) | | | 9,997,720 | |
| | | | | | | | |
| |
| | | | LIFE & HEALTH INSURANCE — 1.0% | |
| | 19,000,000 | | | Cigna Corp. | | | | |
| | | | 1.291%, 12/07/2017 (g)(h) | | | 18,994,680 | |
| | | | | | | | |
| | |
| | | | LODGING — 2.6% | | | | |
| | | | Wyndham Worldwide Co. | | | | |
| | 11,000,000 | | | 1.851%, 12/05/2017 (g)(h) | | | 10,997,345 | |
| | 37,500,000 | | | 1.851%, 12/06/2017 (g)(h) | | | 37,489,131 | |
| | | | | | | | |
| | | | | | | 48,486,476 | |
| | | | | | | | |
| | |
| | | | MULTIMEDIA — 1.0% | | | | |
| | 18,500,000 | | | Viacom, Inc. | | | | |
| | | | 1.902%, 12/11/2017 (g)(h) | | | 18,492,199 | |
| | | | | | | | |
The accompanying notes are an integral part of the financial statements.
13
| | | | |
THE FAIRHOLME FUND | | | | |
| |
| |
SCHEDULE OF INVESTMENTS (continued) | |
November 30, 2017 | |
| |
| | | | | | | | |
Principal | | | | | Value | |
| | |
| | | | COMMERCIAL PAPER
(CONTINUED) — 19.9% | | | | |
| | |
| | | | OIL & GAS STORAGE &
TRANSPORTATION — 4.5% | | | | |
| | | | Energy Transfer Partners | | | | |
| | $27,000,000 | | | 2.052%, 12/01/2017 (g)(h) | | | $ 26,998,700 | |
| | 30,000,000 | | | 1.951%, 12/11/2017 (g)(h) | | | 29,984,004 | |
| | 27,000,000 | | | 2.052%, 12/21/2017 (g)(h) | | | 26,971,996 | |
| | | | | | | | |
| | | | | | | 83,954,700 | |
| | | | | | | | |
| | |
| | | | OIL & NATURAL GAS
EXPLORATION — 1.3% | | | | |
| | 24,000,000 | | | Canadian Natural Resources Ltd. | | | | |
| | | | 1.430%, 12/07/2017 (g)(h) | | | 23,992,347 | |
| | | | | | | | |
| | |
| | | | RAILROADS — 1.1% | | | | |
| | 20,000,000 | | | Kansas City Southern | | | | |
| | | | 1.551%, 12/01/2017 (g)(h) | | | 19,999,037 | |
| | | | | | | | |
| | |
| | | | RETAIL DRUG STORE — 0.9% | | | | |
| | | | Walgreens Boots Alliance, Inc. | | | | |
| | 7,000,000 | | | 1.381%, 12/06/2017 (g)(h) | | | 6,998,404 | |
| | 10,000,000 | | | 1.420%, 12/18/2017 (g)(h) | | | 9,992,980 | |
| | | | | | | | |
| | | | | | | 16,991,384 | |
| | | | | | | | |
| TOTAL COMMERCIAL PAPER
(COST $371,875,712) | | | 371,866,987 | |
| | | | | | | | |
| | | | | | | | |
Principal | | | | | Value | |
| | |
| | | | U.S. GOVERNMENT
OBLIGATIONS — 6.7% | | | | |
| | | | U.S. Treasury Bills | | | | |
| | $75,000,000 | | | 1.030%, 12/07/2017 (h) | | | $ 74,987,875 | |
| | 50,000,000 | | | 1.245%, 04/26/2018 (h) | | | 49,739,937 | |
| | | | | | | | |
| |
| TOTAL U.S. GOVERNMENT
OBLIGATIONS
(COST $124,736,010) | | | 124,727,812 | |
| | | | | | | | |
| | |
Shares | | | | | | |
| | |
| | | | MONEY MARKET
FUNDS — 0.5% | | | | |
| | 10,489,864 | | | Fidelity Investments Money Market Treasury Portfolio -
Class I, 0.97% (i) | | | 10,489,864 | |
| | | | | | | | |
| |
| TOTAL MONEY MARKET FUNDS
(COST $10,489,864) | | | 10,489,864 | |
| | | | | | | | |
| |
| TOTAL INVESTMENTS — 99.8%
(COST $2,807,754,264) | | | 1,868,365,139 | |
| | |
| | | | OTHER ASSETS IN
EXCESS OF
LIABILITIES — 0.2% | | | 3,114,944 | |
| | | | | | | | |
| | NET ASSETS — 100.0% | | | $1,871,480,083 | |
| | | | | | | | |
| (a) | Affiliated Company. See Note 8. |
| (b) | Non-income producing security. |
| (c) | Restricted and controlled security under procedures approved by the Directors. The value of these securities totals $562,902,752, which represents 30.08% of The Fairholme Fund’s net assets. Information related to these securities is as follows: |
| | | | | | | | | | | | | | | | | | |
Shares/
Principal
Amount | | | | Issuer | | | | | Acquisition
Date(s) | | | Acquisition
Cost | | | 11/30/2017
Carrying Value
Per Unit |
$ 7,580,000 | | | | Sears Holdings Corp., 6.625% | | | | | | | 09/10/2015-10/30/2015 | | | | $ 7,622,418 | | | $77.41 |
$140,893,000 | | | | Sears Holdings Corp., 8.000% | | | | | | | 09/10/2015-10/30/2015 | | | | $142,252,083 | | | $51.91 |
13,535,991 | | | | Sears Holdings Corp. Common Stock | | | | | | | 11/26/2007-12/11/2015 | | | | $810,536,627 | | | $ 3.95 |
218,419 | | | | Sears Holdings Corp., Strike Price $25.686 | | | | | | | 09/10/2015-10/20/2015 | | | | $ 3,881,918 | | | $ 0.45 |
$ 6,765,000 | | | | Sears Roebuck Acceptance Corp., 7.500% | | | | | | | 09/08/2015-09/23/2015 | | | | $ 5,048,220 | | | $42.14 |
15,134 | | | | Sears Roebuck Acceptance Corp., 7.400% Preferred Stock | | | | | | | 09/08/2015-09/24/2015 | | | | $ 248,912 | | | $ 9.54 |
22,730,687 | | | | The St. Joe Co. | | | | | | | 12/12/2007-10/13/2010 | | | | $601,313,309 | | | $18.80 |
The accompanying notes are an integral part of the financial statements.
14
| | | | |
THE FAIRHOLME FUND | | | | |
| |
| |
SCHEDULE OF INVESTMENTS (continued) | |
November 30, 2017 | |
| |
| (d) | Security is deemed an illiquid security pursuant to the Funds’ liquidity guidelines. |
| (e) | Variable rate security. Rates shown are the effective rates as of November 30, 2017. |
| (f) | Warrants have terms and conditions based on dividends paid and other events that may lower the strike price and raise the shares per warrant conversion ratio. Reported strike prices and conversion ratios are as of the date of this report. All share-to-warrant conversion ratios are currently 1:1.11. |
| (g) | Restricted security as defined in Rule 144(a) under the Securities Act of 1933. The Manager has determined that such security is liquid pursuant to the Funds’ liquidity guidelines. The value of these securities totals $544,600,438, which represents 29.10% of The Fairholme Fund’s net assets. |
| (h) | Rates shown are the effective yields based on the purchase price. The calculation assumes the security is held to maturity. |
| (i) | Annualized based on the 1-day yield as of November 30, 2017. |
The accompanying notes are an integral part of the financial statements.
15
| | | | |
THE FAIRHOLME FUND | | | | |
| |
| |
| STATEMENT OF ASSETS & LIABILITIES | |
November 30, 2017 | |
| |
| | | | |
Assets | | | | |
Investments, at Fair Value: | | | | |
Unaffiliated Issuers (Cost — $942,370,876) | | $ | 1,069,507,879 | |
Affiliated Issuers (Cost — $1,865,383,388) | | | 798,857,260 | |
Interest Receivable | | | 9,727,886 | |
Receivable for Capital Shares Sold | | | 262,480 | |
Receivable for Investments Sold | | | 3,739 | |
| | | | |
Total Assets | | | 1,878,359,244 | |
| | | | |
| |
Liabilities | | | | |
Payable for Capital Shares Redeemed | | | 5,062,132 | |
Accrued Management Fees | | | 1,559,514 | |
Accrued Legal Expenses | | | 257,515 | |
| | | | |
Total Liabilities | | | 6,879,161 | |
| | | | |
NET ASSETS | | $ | 1,871,480,083 | |
| | | | |
| |
Net Assets Consist of: | | | | |
Paid-In Capital | | $ | 2,793,490,316 | |
Undistributed Net Investment Income | | | 24,854,693 | |
Distributions in Excess of Net Realized Gain on Investments and Foreign Currency Related Transactions | | | (7,475,801 | ) |
Net Unrealized Depreciation on Investments and Foreign Currency Related Translations | | | (939,389,125 | ) |
| | | | |
NET ASSETS | | $ | 1,871,480,083 | |
| | | | |
| |
Shares of Common Stock Outstanding* ($0.0001 par value) | | | 97,989,113 | |
| | | | |
| |
Net Asset Value, Offering and Redemption Price Per Share
($1,871,480,083 / 97,989,113 shares) | | $ | 19.10 | |
| | | | |
* 700,000,000 shares authorized in total.
The accompanying notes are an integral part of the financial statements.
16
| | | | |
THE FAIRHOLME FUND | | | | |
| |
| |
STATEMENT OF OPERATIONS | |
| |
| | | | | | | | |
| | | For the
Fiscal Year Ended
November 30, 2017 | |
Investment Income | | | | | | | | |
Interest — Unaffiliated Issuers | | | | | | $ | 24,547,019 | |
Interest — Affiliated Issuers | | | | | | | 25,527,719 | |
Dividends — Affiliated Issuers | | | | | | | 2,218,099 | |
| | | | | | | | |
| | |
Total Investment Income | | | | | | | 52,292,837 | |
| | | | | | | | |
| | |
Expenses | | | | | | | | |
Management Fees | | | | | | | 24,295,975 | |
Legal Expenses | | | | | | | 379,750 | |
| | | | | | | | |
Total Expenses | | | | | | | 24,675,725 | |
| | | | | | | | |
| | |
Net Investment Income | | | | | | | 27,617,112 | |
| | | | | | | | |
| | |
Realized and Unrealized Gain (Loss) on Investments, Redemption In-Kind, and Foreign Currency Related Transactions | | | | | | | | |
Net Realized Gain (Loss) on Investments and Foreign Currency Related Transactions | | | | | | | | |
Unaffiliated Issuers | | | | | | | 68,060,331 | |
Affiliated Issuers | | | | | | | (68,554,824 | ) |
Net Realized Loss on Redemption In-Kind | | | | | | | (2,649,939 | ) |
Net Change in Unrealized Appreciation (Depreciation) on Investments and Foreign Currency Related Translations | | | | | | | (466,620,782 | ) |
| | | | | | | | |
| | |
Net Realized and Unrealized Gain (Loss) on Investments, Redemption In-Kind, and Foreign Currency Related Transactions | | | | | | | (469,765,214 | ) |
| | | | | | | | |
| | |
NET DECREASE IN NET ASSETS FROM OPERATIONS | | | | | | $ | (442,148,102) | |
| | | | | | | | |
The accompanying notes are an integral part of the financial statements.
17
| | | | |
THE FAIRHOLME FUND | | | | |
| |
| |
| STATEMENTS OF CHANGES IN NET ASSETS | |
| |
| | | | | | | | |
| | | For the Fiscal Year
Ended
November 30, 2017 | | | For the Fiscal Year
Ended
November 30, 2016 | |
CHANGES IN NET ASSETS | | | | | | | | |
From Operations | | | | | | | | |
Net Investment Income | | $ | 27,617,112 | | | $ | 51,679,552 | |
Net Realized Gain (Loss) on Investments, Redemption In-Kind, and Foreign Currency Related Transactions | | | (3,144,432 | ) | | | 162,438,179 | |
Net Change in Unrealized Appreciation (Depreciation) on Investments and Foreign Currency Related Translations | | | (466,620,782 | ) | | | 112,798,128 | |
| | | | | | | | |
Net Increase (Decrease) in Net Assets from Operations | | | (442,148,102 | ) | | | 326,915,859 | |
| | | | | | | | |
From Dividends and Distributions to Shareholders | | | | | | | | |
Net Investment Income | | | (51,680,064 | ) | | | (73,562,659 | ) |
Net Realized Capital Gains from Investment Transactions | | | (150,461,252 | ) | | | (1,509,019,832 | ) |
| | | | | | | | |
Net Decrease in Net Assets from Dividends and Distributions | | | (202,141,316 | ) | | | (1,582,582,491 | ) |
| | | | | | | | |
From Capital Share Transactions | | | | | | | | |
Proceeds from Sale of Shares | | | 156,030,929 | | | | 288,427,843 | |
Shares Issued in Reinvestment of Dividends and Distributions | | | 189,229,486 | | | | 1,450,080,952 | |
Redemption Fees | | | 136,808 | | | | 212,693 | |
Cost of Shares Redeemed | | | (951,869,665 | ) | | | (1,939,699,783 | ) |
Cost of Shares Redeemed In-Kind | | | (33,467,555 | ) | | | — | |
| | | | | | | | |
Net Decrease in Net Assets from Shareholder Activity | | | (639,939,997 | ) | | | (200,978,295 | ) |
| | | | | | | | |
NET ASSETS | | | | | | | | |
Net Decrease in Net Assets | | | (1,284,229,415 | ) | | | (1,456,644,927 | ) |
Net Assets at Beginning of Year | | | 3,155,709,498 | | | | 4,612,354,425 | |
| | | | | | | | |
Net Assets at End of Year | | $ | 1,871,480,083 | | | $ | 3,155,709,498 | |
| | | | | | | | |
Undistributed Net Investment Income at End of Year | | $ | 24,854,693 | | | $ | 51,679,552 | |
| | | | | | | | |
SHARES TRANSACTIONS | | | | | | | | |
Issued | | | 7,652,492 | | | | 15,789,748 | |
Reinvested | | | 8,546,950 | | | | 76,199,735 | |
Redeemed | | | (46,505,476 | ) | | | (96,599,326 | ) |
Redeemed In-Kind | | | (1,799,331 | ) | | | — | |
| | | | | | | | |
Net Decrease in Shares | | | (32,105,365 | ) | | | (4,609,843 | ) |
Shares Outstanding at Beginning of Year | | | 130,094,478 | | | | 134,704,321 | |
| | | | | | | | |
Shares Outstanding at End of Year | | | 97,989,113 | | | | 130,094,478 | |
| | | | | | | | |
The accompanying notes are an integral part of the financial statements.
18
| | | | |
THE FAIRHOLME FUND | | | | |
| |
| |
FINANCIAL HIGHLIGHTS | |
| |
| | | | | | | | | | | | | | | | | | | | |
| | | For the Fiscal Year Ended November 30, | |
| | | 2017 | | | 2016 | | | 2015 | | | 2014 | | | 2013 | |
| | | | | |
| PER SHARE OPERATING PERFORMANCE NET ASSET VALUE, BEGINNING OF YEAR | | | $24.26 | | | | $34.24 | | | | $37.96 | | | | $42.76 | | | | $29.89 | |
| | | | | | | | | | | | | | | | | | | | |
| | | | | |
Investment Operations | | | | | | | | | | | | | | | | | | | | |
Net Investment Income (Loss)(1) | | | 0.23 | | | | 0.33 | | | | 0.46 | | | | (0.19 | ) | | | (0.10 | ) |
Net Realized and Unrealized Gain (Loss) on Investments | | | (3.81 | ) | | | 2.60 | | | | (1.10 | ) | | | (1.21 | ) | | | 12.97 | |
| | | | | | | | | | | | | | | | | | | | |
| | | | | |
Total from Investment Operations | | | (3.58 | ) | | | 2.93 | | | | (0.64 | ) | | | (1.40 | ) | | | 12.87 | |
| | | | | | | | | | | | | | | | | | | | |
| | | | | |
Dividends and Distributions | | | | | | | | | | | | | | | | | | | | |
From Net Investment Income | | | (0.40 | ) | | | (0.60 | ) | | | — | | | | — | | | | — | |
From Realized Capital Gains | | | (1.18 | ) | | | (12.31 | ) | | | (3.08 | ) | | | (3.40 | ) | | | — | |
| | | | | | | | | | | | | | | | | | | | |
Total Dividends and Distributions | | | (1.58 | ) | | | (12.91 | ) | | | (3.08 | ) | | | (3.40 | ) | | | — | |
| | | | | | | | | | | | | | | | | | | | |
Redemption Fees(1) | | | 0.00 | (2) | | | 0.00 | (2) | | | 0.00 | (2) | | | 0.00 | (2) | | | 0.00 | (2) |
| | | | | | | | | | | | | | | | | | | | |
NET ASSET VALUE, END OF YEAR | | | $19.10 | | | | $24.26 | | | | $34.24 | | | | $37.96 | | | | $42.76 | |
| | | | | | | | | | | | | | | | | | | | |
TOTAL RETURN | | | (15.64 | )% | | | 18.93 | % | | | (1.95 | )% | | | (3.50 | )% | | | 43.06 | % |
Ratio/Supplemental Data | | | | | | | | | | | | | | | | | | | | |
Net Assets, End of Year (in 000’s) | | | $1,871,480 | | | | $3,155,709 | | | | $4,612,354 | | | | $6,776,885 | | | | $8,789,849 | |
Ratio of Expenses to Average Net Assets | | | 1.02 | %(3) | | | 1.02 | %(3) | | | 1.03 | %(4) | | | 1.06 | %(5) | | | 1.02 | %(3)(6) |
Ratio of Net Investment Income (Loss) to Average Net Assets | | | 1.14 | % | | | 1.79 | % | | | 1.31 | % | | | (0.48 | )% | | | (0.29 | )% |
Portfolio Turnover Rate | | | 6.57 | % | | | 19.19 | % | | | 40.46 | % | | | 1.62 | % | | | 15.59 | % |
| (1) | Based on average shares outstanding. |
| (2) | Redemption fees represent less than $0.01. |
| (3) | 0.02% is attributable to legal expenses incurred outside of the 1.00% management fee. |
| (4) | 0.03% is attributable to legal expenses incurred outside of the 1.00% management fee and less than 0.01% is attributable to registration fees and miscellaneous expenses incurred outside of the 1.00% management fee. |
| (5) | 0.04% is attributable to legal expenses incurred outside of the 1.00% management fee and 0.02% is attributable to miscellaneous expenses incurred outside of the 1.00% management fee. |
| (6) | Less than 0.01% is attributable to interest expenses incurred outside of the 1.00% management fee. |
The accompanying notes are an integral part of the financial statements.
19
| | | | |
THE FAIRHOLME FOCUSED INCOME FUND | | | | |
| |
| |
SCHEDULE OF INVESTMENTS | |
November 30, 2017 | |
| |
| | | | | | | | |
Shares | | | | | Value | |
| | |
| | | | DOMESTIC EQUITY SECURITIES — 10.4% | | | | |
| | |
| | | | REAL ESTATE INVESTMENT TRUSTS — 10.4% | | | | |
| | 568,000 | | | Seritage Growth Properties | | $ | 23,117,600 | |
| | | | | | | | |
| TOTAL DOMESTIC EQUITY SECURITIES
(COST $22,591,281) | | | 23,117,600 | |
| | | | | | | | |
| | |
| | | | DOMESTIC PREFERRED EQUITY
SECURITIES — 16.2% | | | | |
| |
| | | | CONSUMER FINANCE — 3.1% | |
| | 268,500 | | | GMAC Capital Trust I, Inc. | | | | |
| | | | 7.201%, Series 2 (a) | | | 7,013,220 | |
| | | | | | | | |
| |
| | | | MORTGAGE FINANCE — 9.9% | |
| | | | Federal Home Loan Mortgage Corp. | | | | |
| | 1,029,724 | | | 6.550%, Series Y (b) | | | 5,179,512 | |
| | 396,000 | | | 5.100%, Series H (b) | | | 3,623,400 | |
| | 98,355 | | | 6.000%, Series P (b) | | | 939,290 | |
| | | | Federal National Mortgage Association | | | | |
| | 967,500 | | | 7.000%, Series O (a)(b) | | | 9,771,750 | |
| | 500,000 | | | 6.750%, Series Q (b) | | | 2,575,000 | |
| | | | | | | | |
| | | | | | 22,088,952 | |
| | | | | | | | |
| | | | OIL & NATURAL GAS
EXPLORATION — 1.8% | | | | |
| | | | Chesapeake Energy Corp. | | | | |
| | 44,585 | | | 5.000% | | | 2,519,053 | |
| | 2,000 | | | 5.750% (c) | | | 1,127,180 | |
| | 600 | | | 5.750% (c) | | | 338,154 | |
| | 100 | | | 5.750% (c) | | | 57,279 | |
| | | | | | | | |
| | | | | | | 4,041,666 | |
| | | | | | | | |
| | | | | | | | |
Shares | | | | | Value | |
| | |
| | | | RETAIL DEPARTMENT
STORES — 1.4% | | | | |
| | | | Sears Roebuck Acceptance Corp. | |
| | 178,106 | | | 7.000% (d)(e) | | | $ 1,725,847 | |
| | 149,931 | | | 7.400% (d)(e) | | | 1,430,342 | |
| | | | | | | | |
| | | | | | | 3,156,189 | |
| | | | | | | | |
| TOTAL DOMESTIC PREFERRED EQUITY
SECURITIES
(COST $35,094,695) | | | 36,300,027 | |
| | | | | | | | |
| | |
Principal | | | | | | |
| | | | DOMESTIC CORPORATE BONDS — 20.9% | | | | |
| | |
| | | | CAPITAL GOODS — 9.4% | | | | |
| | $ 9,350,000 | | | HC2 Holdings, Inc. | | | | |
| | | | 11.000%, 12/01/2019 (c) | | | 9,519,235 | |
| | 12,500,000 | | | International Wire Group, Inc. | | | | |
| | | | 10.750%, 08/01/2021 (c) | | | 11,396,250 | |
| | | | | | | | |
| | | | | | | 20,915,485 | |
| | | | | | | | |
| |
| | | | CONSUMER SERVICES — 1.7% | |
| | 4,559,000 | | | Monitronics International, Inc. | | | | |
| | | | 9.125%, 04/01/2020 | | | 3,848,252 | |
| | | | | | | | |
| |
| | | | DIVERSIFIED BANKS — 1.5% | |
| | 3,247,000 | | | Bank of America Corp. | | | | |
| | | | 8.000% (f)(g) | | | 3,268,105 | |
| | | | | | | | |
| | |
| | | | OIL & GAS EQUIPMENT & SERVICES — 1.4% | | | | |
| | 4,000,000 | | | Bristow Group, Inc. | | | | |
| | | | 6.250%, 10/15/2022 | | | 3,233,600 | |
| | | | | | | | |
| | | | RETAIL DEPARTMENT
STORES — 6.9% | | | | |
| | 29,520,500 | | | Sears Holdings Corp. | | | | |
| | | | 8.000%, 12/15/2019 (d)(e) | | | 15,324,092 | |
| | | | Sears Roebuck Acceptance Corp. | | | | |
| | 95,000 | | | 7.500%, 10/15/2027 (d)(e) | | | 40,033 | |
| | 11,000 | | | 6.750%, 01/15/2028 (d)(e) | | | 4,764 | |
| | 40,000 | | | 6.500%, 12/01/2028 (d)(e) | | | 17,000 | |
| | 50,000 | | | 7.000%, 06/01/2032 (d)(e) | | | 21,170 | |
| | | | | | | | |
| | | | | | | 15,407,059 | |
| | | | | | | | |
| TOTAL DOMESTIC CORPORATE BONDS
(COST $59,766,774) | | | 44,672,501 | |
| | | | | | | | |
The accompanying notes are an integral part of the financial statements.
20
|
THE FAIRHOLME FOCUSED INCOME FUND |
|
|
SCHEDULE OF INVESTMENTS (continued) November 30, 2017 |
|
| | | | | | | | |
Principal | | | | | Value | |
| | |
| | | | FOREIGN CORPORATE
BONDS — 11.6% | | | | |
| | |
| | | | CANADA — 11.6% | | | | |
| | |
| | | | METALS & MINING — 11.6% | | | | |
| | | | Imperial Metals Corp. | | | | |
| | $27,725,000 | | | 7.000%, 03/15/2019 (c) | | $ | 25,992,187 | |
| | | | | | | | |
| TOTAL FOREIGN CORPORATE BONDS
(COST $26,869,230) | | | 25,992,187 | |
| | | | | | | | |
| | |
| | | | MUNICIPAL BONDS — 2.5% | | | | |
| | |
| | | | WISCONSIN — 2.5% | | | | |
| | | | Public Finance Authority, Industrial Improvements, Refunding Revenue, Taxable Pass Through, Natgasoline LLC | | | | |
| | 5,512,500 | | | 10.000%, 06/30/2021 (c) | | | 5,519,115 | |
| | | | | | | | |
| |
| TOTAL MUNICIPAL BONDS
(COST $5,491,840) | | | 5,519,115 | |
| | | | | | | | |
| |
| | | | COMMERCIAL PAPER — 22.4% | |
| | | | BEVERAGES — 3.1% | | | | |
| | | | Molson Coors Brewing Co. | | | | |
| | 7,000,000 | | | 1.501%, 12/08/2017 (c)(h) | | | 6,997,866 | |
| | | | | | | | |
| | |
| | | | FOOD PRODUCTS — 4.0% | | | | |
| | | | Conagra Brands, Inc.
| | | | |
| | 9,000,000 | | | 1.300%, 12/01/2017 (c)(h) | | | 8,999,592 | |
| | | | | | | | |
| |
| | | | INSURANCE BROKERS — 2.3% | |
| | | | Marsh & McLennan Co., Inc.
| | | | |
| | 5,000,000 | | | 1.300%, 12/07/2017 (c)(h) | | | 4,998,668 | |
| | | | | | | | |
| | |
| | | | LODGING — 2.7% | | | | |
| | | | Wyndham Worldwide Co.
| | | | |
| | 6,000,000 | | | 1.851%, 12/05/2017 (c)(h) | | | 5,998,552 | |
| | | | | | | | |
| | |
| | | | MULTIMEDIA — 2.7% | | | | |
| | | | Viacom, Inc.
| | | | |
| | 6,000,000 | | | 1.902%, 12/11/2017 (c)(h) | | | 5,997,470 | |
| | | | | | | | |
| | | | | | | | |
Principal | | | | | Value | |
| | |
| | | | COMMERCIAL
PAPER — 22.4% | | | | |
| | |
| | | | OIL & GAS STORAGE &
TRANSPORTATION — 4.0% | | | | |
| | | | Energy Transfer Partners
| | | | |
| | $ 9,000,000 | | | 1.951%, 12/11/2017 (c)(h) | | $ | 8,995,201 | |
| | | | | | | | |
| | |
| | | | OIL & NATURAL GAS EXPLORATION — 3.6% | | | | |
| | | | Canadian Natural Resources Ltd.
| | | | |
| | 8,000,000 | | | 1.521%, 12/04/2017 (c)(h) | | | 7,998,546 | |
| | | | | | | | |
| TOTAL COMMERCIAL PAPER
(COST $49,986,670) | | | 49,985,895 | |
| | | | | | | | |
| | |
| | | | U.S. GOVERNMENT
OBLIGATIONS — 2.2% | | | | |
| | | | U.S. Treasury Bills | | | | |
| | 3,000,000 | | | 1.245%, 04/26/2018 (h) | | | 2,984,396 | |
| | 2,000,000 | | | 1.365%, 10/11/2018 (h) | | | 1,972,721 | |
| | | | | | | | |
| |
| TOTAL U.S. GOVERNMENT OBLIGATIONS
(COST $4,961,065) | | | 4,957,117 | |
| | | | | | | | |
| | |
Shares | | | | | | |
| |
| | | | MONEY MARKET FUNDS — 10.1% | |
| | 22,511,280 | | | Fidelity Investments Money Market Treasury Portfolio - Class I, 0.97% (i) | | | 22,511,280 | |
| | | | | | | | |
| |
| TOTAL MONEY MARKET FUNDS
(COST $22,511,280) | | | 22,511,280 | |
| | | | | | | | |
| |
| TOTAL INVESTMENTS — 96.3%
(COST $227,272,835) | | | 215,055,722 | |
| | | | OTHER ASSETS IN
EXCESS OF
LIABILITIES — 3.7% | | | 8,376,578 | |
| | | | | | | | |
| | NET ASSETS — 100.0% | | $ | 223,432,300 | |
| | | | | | | | |
| (a) | Variable rate security. Rates shown are the effective rates as of November 30, 2017. |
| (b) | Non-income producing security. |
| (c) | Restricted security as defined in Rule 144(a) under the Securities Act of 1933. The Manager has determined that such security is liquid pursuant to the Funds’ liquidity guidelines. The value of these securities totals $103,935,295, which represents 46.52% of The Income Fund’s net assets. |
| (d) | Restricted or controlled security under procedures approved by the Directors. The value of these securities totals $18,563,248, which represents 8.31% of The Income Fund’s net assets. Information related to these securities is as follows: |
The accompanying notes are an integral part of the financial statements.
21
| | | | |
THE FAIRHOLME FOCUSED INCOME FUND | | | | |
| |
| |
SCHEDULE OF INVESTMENTS (continued) | |
November 30, 2017 | |
| |
| | | | | | | | | | | | | | | | | | | | |
Shares/
Principal
Amount | | | | | Issuer | | | | Acquisition
Date | | | | Acquisition
Cost | | | | | 11/30/2017
Carrying Value
Per Unit |
| | $29,520,500 | | | | | Sears Holdings Corp., 8.000% | | | | 08/17/2015-05/25/2017 | | | | $ | 27,103,944 | | | | | $51.91 |
| | 178,106 | | | | | Sears Roebuck Acceptance Corp., 7.000% Preferred Stock | | | | 08/18/2015-08/28/2015 | | | | $ | 2,550,795 | | | | | $ 9.69 |
| | 149,931 | | | | | Sears Roebuck Acceptance Corp., 7.400% Preferred Stock | | | | 08/18/2015-08/26/2015 | | | | $ | 2,150,510 | | | | | $ 9.54 |
| | $ 95,000 | | | | | Sears Roebuck Acceptance Corp., 7.500% | | | | 08/27/2015 | | | | $ | 55,613 | | | | | $42.14 |
| | $ 11,000 | | | | | Sears Roebuck Acceptance Corp., 6.750% | | | | 08/27/2015 | | | | $ | 6,435 | | | | | $43.31 |
| | $ 40,000 | | | | | Sears Roebuck Acceptance Corp., 6.500% | | | | 08/27/2015 | | | | $ | 23,140 | | | | | $42.50 |
| | $ 50,000 | | | | | Sears Roebuck Acceptance Corp., 7.000% | | | | 08/27/2015 | | | | $ | 28,775 | | | | | $42.34 |
| (e) | Security is deemed an illiquid security pursuant to the Funds’ liquidity guidelines. |
| (f) | Security is perpetual in nature and has no stated maturity date. |
| (g) | Security is a fix-to-float security, which carries a fixed coupon until a certain date, upon which it switches to a floating rate. Rate shown is the fixed rate. |
| (h) | Rates shown are the effective yields based on the purchase price. The calculation assumes the security is held to maturity. |
| (i) | Annualized based on the 1-day yield as of November 30, 2017. |
The accompanying notes are an integral part of the financial statements.
22
| | | | |
THE FAIRHOLME FOCUSED INCOME FUND | | | | |
| |
| |
STATEMENT OF ASSETS & LIABILITIES | |
November 30, 2017 | |
| |
| |
Assets | | | | |
Investments, at Fair Value (Cost — $227,272,835) | | $ | 215,055,722 | |
Receivable for Investments Sold | | | 5,686,349 | |
Dividends and Interest Receivable | | | 2,871,107 | |
Receivable for Capital Shares Sold | | | 23,357 | |
| | | | |
| |
Total Assets | | | 223,636,535 | |
| | | | |
| |
Liabilities | | | | |
Accrued Management Fees | | | 183,695 | |
Payable for Capital Shares Redeemed | | | 20,540 | |
| | | | |
| |
Total Liabilities | | | 204,235 | |
| | | | |
NET ASSETS | | $ | 223,432,300 | |
| | | | |
| |
Net Assets Consist of: | | | | |
Paid-In Capital | | $ | 224,384,952 | |
Undistributed Net Investment Income | | | 1,158,154 | |
Accumulated Net Realized Gain on Investments and
Foreign Currency Related Transactions | | | 10,106,307 | |
Net Unrealized Depreciation on Investments and
Foreign Currency Related Translations | | | (12,217,113 | ) |
| | | | |
| |
NET ASSETS | | $ | 223,432,300 | |
| | | | |
| |
Shares of Common Stock Outstanding* ($0.0001 par value) | | | 19,724,137 | |
| | | | |
| |
Net Asset Value, Offering and Redemption Price Per Share
($223,432,300 / 19,724,137 shares) | | $ | 11.33 | |
| | | | |
| * | 200,000,000 shares authorized in total. |
The accompanying notes are an integral part of the financial statements.
23
| | | | | | | | | | | | | | | | | | | | | | | | | | | | |
THE FAIRHOLME FOCUSED INCOME FUND | |
| |
| |
STATEMENT OF OPERATIONS | |
| |
| |
| | | For the Fiscal Year Ended November 30, 2017 | |
Investment Income | | | | | | | | | | | | | | | | | | | | | | | | | | | | |
Interest | | | | | | | | | | | | | | | | | | | | | | | | | | $ | 12,483,211 | |
Dividends | | | | | | | | | | | | | | | | | | | | | | | | | | | 2,445,793 | |
| | | | | | | | | | | | | | | | | | | | | | | | | | | | |
| | | | | | | |
Total Investment Income | | | | | | | | | | | | | | | | | | | | | | | | | | | 14,929,004 | |
| | | | | | | | | | | | | | | | | | | | | | | | | | | | |
| | | | | | | |
Expenses | | | | | | | | | | | | | | | | | | | | | | | | | | | | |
Management Fees | | | | | | | | | | | | | | | | | | | | | | | | | | | 2,478,958 | |
| | | | | | | | | | | | | | | | | | | | | | | | | | | | |
| | | | | | | |
Total Expenses | | | | | | | | | | | | | | | | | | | | | | | | | | | 2,478,958 | |
| | | | | | | | | | | | | | | | | | | | | | | | | | | | |
| | | | | | | |
Net Investment Income | | | | | | | | | | | | | | | | | | | | | | | | | | | 12,450,046 | |
| | | | | | | | | | | | | | | | | | | | | | | | | | | | |
| | | | | | | |
Realized and Unrealized Gain (Loss) on Investments and
Foreign Currency Related Transactions | | | | | | | | | | | | | | | | | | | | | | | | | | | | |
Net Realized Gain on Investments and Foreign Currency
Related Transactions | | | | | | | | | | | | | | | | | | | | | | | | | | | 10,848,748 | |
Net Change in Unrealized Appreciation (Depreciation) on
Investments and Foreign Currency Related Translations | | | | | | | | | | | | | | | | | | | | | | | | | | | (33,646,360 | ) |
| | | | | | | | | | | | | | | | | | | | | | | | | | | | |
Net Realized and Unrealized Gain (Loss) on Investments
and Foreign Currency Related Transactions | | | | | | | | | | | | | | | | | | | | | | | | | | | (22,797,612 | ) |
| | | | | | | | | | | | | | | | | | | | | | | | | | | | |
| | | | | | | |
NET DECREASE IN NET ASSETS FROM OPERATIONS | | | | | | | | | | | | | | | | | | | | | | | | | | $ | (10,347,566 | ) |
| | | | | | | | | | | | | | | | | | | | | | | | | | | | |
The accompanying notes are an integral part of the financial statements.
24
| | | | | | | | | | | | | | | | | | | | | | | | | | | | | | | | | | | | | | | | | | | | | | | | |
THE FAIRHOLME FOCUSED INCOME FUND | |
| |
| |
STATEMENTS OF CHANGES IN NET ASSETS | |
| |
| | |
| | | For the Fiscal Year
Ended
November 30, 2017 | | | For the Fiscal Year
Ended
November 30, 2016 | |
CHANGES IN NET ASSETS | | | | | | | | | | | | | | | | | | | | | | | | | | | | | | | | | | | | | | | | | | | | | | | | |
From Operations | | | | | | | | | | | | | | | | | | | | | | | | | | | | | | | | | | | | | | | | | | | | | | | | |
Net Investment Income | | | | | | | | | | | | | | | | | | | | | | $ | 12,450,046 | | | | | | | | | | | | | | | | | | | | | | | $ | 11,534,166 | |
Net Realized Gain on Investments and Foreign Currency Related Transactions | | | | | | | | | | | | | | | | | | | | | | | 10,848,748 | | | | | | | | | | | | | | | | | | | | | | | | 903,603 | |
Net Change in Unrealized Appreciation (Depreciation) on Investments and Foreign Currency Related Translations | | | | | | | | | | | | | | | | | | | | | | | (33,646,360 | ) | | | | | | | | | | | | | | | | | | | | | | | 29,845,680 | |
| | | | | | | | | | | | | | | | | | | | | | | | | | | | | | | | | | | | | | | | | | | | | | | | |
Net Increase (Decrease) in Net Assets from Operations | | | | | | | | | | | | | | | | | | | | | | | (10,347,566 | ) | | | | | | | | | | | | | | | | | | | | | | | 42,283,449 | |
| | | | | | | | | | | | | | | | | | | | | | | | | | | | | | | | | | | | | | | | | | | | | | | | |
From Dividends and Distributions
to Shareholders | | | | | | | | | | | | | | | | | | | | | | | | | | | | | | | | | | | | | | | | | | | | | | | | |
Net Investment Income | | | | | | | | | | | | | | | | | | | | | | | (12,599,960 | ) | | | | | | | | | | | | | | | | | | | | | | | (11,470,063 | ) |
Net Realized Capital Gains from Investment Transactions | | | | | | | | | | | | | | | | | | | | | | | (903,302 | ) | | | | | | | | | | | | | | | | | | | | | | | (1,662,820 | ) |
| | | | | | | | | | | | | | | | | | | | | | | | | | | | | | | | | | | | | | | | | | | | | | | | |
Net Decrease in Net Assets from Dividends and Distributions | | | | | | | | | | | | | | | | | | | | | | | (13,503,262 | ) | | | | | | | | | | | | | | | | | | | | | | | (13,132,883 | ) |
| | | | | | | | | | | | | | | | | | | | | | | | | | | | | | | | | | | | | | | | | | | | | | | | |
From Capital Share Transactions | | | | | | | | | | | | | | | | | | | | | | | | | | | | | | | | | | | | | | | | | | | | | | | | |
Proceeds from Sale of Shares | | | | | | | | | | | | | | | | | | | | | | | 69,952,576 | | | | | | | | | | | | | | | | | | | | | | | | 44,514,853 | |
Shares Issued in Reinvestment of Dividends and Distributions | | | | | | | | | | | | | | | | | | | | | | | 11,829,533 | | | | | | | | | | | | | | | | | | | | | | | | 12,024,846 | |
Cost of Shares Redeemed | | | | | | | | | | | | | | | | | | | | | | | (74,694,435 | ) | | | | | | | | | | | | | | | | | | | | | | | (88,566,860 | ) |
| | | | | | | | | | | | | | | | | | | | | | | | | | | | | | | | | | | | | | | | | | | | | | | | |
Net Increase (Decrease) in Net Assets from Shareholder Activity | | | | | | | | | | | | | | | | | | | | | | | 7,087,674 | | | | | | | | | | | | | | | | | | | | | | | | (32,027,161 | ) |
| | | | | | | | | | | | | | | | | | | | | | | | | | | | | | | | | | | | | | | | | | | | | | | | |
NET ASSETS | | | | | | | | | | | | | | | | | | | | | | | | | | | | | | | | | | | | | | | | | | | | | | | | |
Net Decrease in Net Assets | | | | | | | | | | | | | | | | | | | | | | | (16,763,154 | ) | | | | | | | | | | | | | | | | | | | | | | | (2,876,595 | ) |
Net Assets at Beginning of Year | | | | | | | | | | | | | | | | | | | | | | | 240,195,454 | | | | | | | | | | | | | | | | | | | | | | | | 243,072,049 | |
| | | | | | | | | | | | | | | | | | | | | | | | | | | | | | | | | | | | | | | | | | | | | | | | |
Net Assets at End of Year | | | | | | | | | | | | | | | | | | | | | | $ | 223,432,300 | | | | | | | | | | | | | | | | | | | | | | | $ | 240,195,454 | |
| | | | | | | | | | | | | | | | | | | | | | | | | | | | | | | | | | | | | | | | | | | | | | | | |
Undistributed Net Investment Income at End of Year | | | | | | | | | | | | | | | | | | | | | | $ | 1,158,154 | | | | | | | | | | | | | | | | | | | | | | | $ | 2,027,146 | |
| | | | | | | | | | | | | | | | | | | | | | | | | | | | | | | | | | | | | | | | | | | | | | | | |
SHARES TRANSACTIONS | | | | | | | | | | | | | | | | | | | | | | | | | | | | | | | | | | | | | | | | | | | | | | | | |
Issued | | | | | | | | | | | | | | | | | | | | | | | 5,609,488 | | | | | | | | | | | | | | | | | | | | | | | | 4,398,347 | |
Reinvested | | | | | | | | | | | | | | | | | | | | | | | 994,924 | | | | | | | | | | | | | | | | | | | | | | | | 1,172,678 | |
Redeemed | | | | | | | | | | | | | | | | | | | | | | | (6,282,407 | ) | | | | | | | | | | | | | | | | | | | | | | | (8,851,045 | ) |
| | | | | | | | | | | | | | | | | | | | | | | | | | | | | | | | | | | | | | | | | | | | | | | | |
Net Increase (Decrease) in Shares | | | | | | | | | | | | | | | | | | | | | | | 322,005 | | | | | | | | | | | | | | | | | | | | | | | | (3,280,020 | ) |
Shares Outstanding at Beginning of Year | | | | | | | | | | | | | | | | | | | | | | | 19,402,132 | | | | | | | | | | | | | | | | | | | | | | | | 22,682,152 | |
| | | | | | | | | | | | | | | | | | | | | | | | | | | | | | | | | | | | | | | | | | | | | | | | |
Shares Outstanding at End of Year | | | | | | | | | | | | | | | | | | | | | | | 19,724,137 | | | | | | | | | | | | | | | | | | | | | | | | 19,402,132 | |
| | | | | | | | | | | | | | | | | | | | | | | | | | | | | | | | | | | | | | | | | | | | | | | | |
The accompanying notes are an integral part of the financial statements.
25
| | | | | | | | | | | | | | | | | | | | | | | | | | | | |
THE FAIRHOLME FOCUSED INCOME FUND | |
| |
| |
FINANCIAL HIGHLIGHTS | |
| |
| |
| | | For the Fiscal Year Ended November 30, | |
| | | | | | | |
| | | | | | | | | 2017 | | | 2016 | | | 2015 | | | 2014 | | | 2013 | |
| | | | | | | |
PER SHARE OPERATING PERFORMANCE | | | | | | | | | | | | | | | | | | | | | | | | | | | | |
NET ASSET VALUE, BEGINNING OF YEAR | | | | | | | | | | | $12.38 | | | | $10.72 | | | | $10.82 | | | | $11.98 | | | | $10.02 | |
| | | | | | | | | | | | | | | | | | | | | | | | | | | | |
| | | | | | | |
Investment Operations | | | | | | | | | | | | | | | | | | | | | | | | | | | | |
Net Investment Income(1) | | | | | | | | | | | 0.60 | | | | 0.57 | | | | 0.45 | | | | 0.22 | | | | 0.46 | |
Net Realized and Unrealized Gain (Loss) on Investments | | | | | | | | | | | (0.99 | ) | | | 1.72 | | | | 0.03 | | | | (0.51 | ) | | | 2.12 | |
| | | | | | | | | | | | | | | | | | | | | | | | | | | | |
| | | | | | | |
Total from Investment Operations | | | | | | | | | | | (0.39 | ) | | | 2.29 | | | | 0.48 | | | | (0.29 | ) | | | 2.58 | |
| | | | | | | | | | | | | | | | | | | | | | | | | | | | |
| | | | | | | |
Dividends and Distributions | | | | | | | | | | | | | | | | | | | | | | | | | | | | |
From Net Investment Income | | | | | | | | | | | (0.61 | ) | | | (0.56 | ) | | | (0.43 | ) | | | (0.19 | ) | | | (0.62 | ) |
From Realized Capital Gains | | | | | | | | | | | (0.05 | ) | | | (0.07 | ) | | | (0.15 | ) | | | (0.68 | ) | | | — | |
| | | | | | | | | | | | | | | | | | | | | | | | | | | | |
| | | | | | | |
Total Dividends and Distributions | | | | | | | | | | | (0.66 | ) | | | (0.63 | ) | | | (0.58 | ) | | | (0.87 | ) | | | (0.62 | ) |
| | | | | | | | | | | | | | | | | | | | | | | | | | | | |
| | | | | | | |
NET ASSET VALUE, END OF YEAR | | | | | | | | | | | $11.33 | | | | $12.38 | | | | $10.72 | | | | $10.82 | | | | $11.98 | |
| | | | | | | | | | | | | | | | | | | | | | | | | | | | |
| | | | | | | |
TOTAL RETURN | | | | | | | | | | | (3.35 | )% | | | 22.77 | % | | | 4.60 | % | | | (2.67 | )% | | | 26.91 | % |
Ratio/Supplemental Data | | | | | | | | | | | | | | | | | | | | | | | | | | | | |
Net Assets, End of Year (in 000’s) | | | | | | | | | | | $223,432 | | | | $240,195 | | | | $243,072 | | | | $216,047 | | | | $246,988 | |
Ratio of Expenses to Average Net Assets | | | | | | | | | | | 1.00 | % | | | 1.00 | % | | | 1.00 | % | | | 1.00 | % | | | 1.00 | % |
Ratio of Net Investment Income to Average Net Assets | | | | | | | | | | | 5.02 | % | | | 5.48 | % | | | 4.14 | % | | | 1.94 | % | | | 4.28 | % |
Portfolio Turnover Rate | | | | | | | | | | | 36.05 | % | | | 28.81 | % | | | 67.05 | % | | | 38.86 | % | | | 42.87 | % |
| (1) | Based on average shares outstanding. |
The accompanying notes are an integral part of the financial statements.
26
|
THE FAIRHOLME ALLOCATION FUND |
|
|
SCHEDULE OF INVESTMENTS |
November 30, 2017 |
|
| | | | | | | | |
| Shares | | | | | Value | |
| | | | | | |
| | | | DOMESTIC EQUITY
SECURITIES — 36.3% | | | | |
| | |
| | | | REAL ESTATE INVESTMENT
TRUSTS — 24.5% | | | | |
| | 687,318 | | | Seritage Growth Properties | | $ | 27,973,843 | |
| | | | | | | | |
| | |
| | | | REAL ESTATE MANAGEMENT
& DEVELOPMENT — 6.9% | | | | |
| | 426,748 | | | The St. Joe Co. (a)(b)(c) | | | 7,835,093 | |
| | | | | | | | |
| | |
| | | | RETAIL DEPARTMENT
STORES — 4.9% | | | | |
| | 1,425,398 | | | Sears Holdings Corp. (a)(b)(c) | | | 5,630,322 | |
| | | | | | | | |
| TOTAL DOMESTIC EQUITY SECURITIES
(COST $89,688,132) | | | 41,439,258 | |
| | | | | | | | |
| | |
| | | | FOREIGN EQUITY
SECURITIES — 3.5% | | | | |
| | |
| | | | CANADA — 3.5% | | | | |
| | |
| | | | METALS & MINING — 3.5% | | | | |
| | 2,239,153 | | | Imperial Metals Corp. (c) | | | 4,026,535 | |
| | | | | | | | |
| TOTAL FOREIGN EQUITY SECURITIES
(COST $26,313,866) | | | 4,026,535 | |
| | | | | | | | |
| | |
| | | | DOMESTIC PREFERRED
EQUITY SECURITIES — 35.0% | | | | |
| | |
| | | | MORTGAGE FINANCE — 32.5% | | | | |
| | 2,795,969 | | | Federal Home Loan Mortgage
Corp.
7.875%, Series Z (c)(d) | | | 18,593,194 | |
| | 2,757,818 | | | Federal National Mortgage
Association
7.750%, Series S (c)(d) | | | 18,449,802 | |
| | | | | | | | |
| | | | | | 37,042,996 | |
| | | | | | | | |
| | |
| | | | OIL & NATURAL GAS
EXPLORATION — 2.5% | | | | |
| | 5,121 | | | Chesapeake Energy Corp.
5.750% (e) | | | 2,886,144 | |
| | | | | | | | |
| TOTAL DOMESTIC PREFERRED
EQUITY SECURITIES
(COST $28,250,699) | | | 39,929,140 | |
| | | | | | | | |
| | | | | | | | |
| Shares | | | | | Value | |
| | | | | | |
| | | | RIGHTS — 0.0% | | | | |
| | |
| | | | METALS & MINING — 0.0% | | | | |
| | 2,239,153 | | | Imperial Metals Corp.,
Expire 12/22/2017 (c) | | $ | 43,389 | |
| | | | | | | | |
| |
| TOTAL RIGHTS
(COST $0) | | | 43,389 | |
| | | | | | | | |
| | |
| | | | WARRANTS — 0.2% | | | | |
| | |
| | | | RETAIL DEPARTMENT
STORES — 0.2% | | | | |
| | 404,785 | | | Sears Holdings Corp.,
Vested, Strike Price $25.686,
Expire 12/15/2019 (a)(b)(c)(f) | | | 182,153 | |
| | | | | | | | |
| TOTAL WARRANTS
(COST $2,980,059) | | | 182,153 | |
| | | | | | | | |
| | |
| Principal | | | | | | |
| | | | | | |
| | |
| | | | DOMESTIC CORPORATE
BONDS — 6.3% | | | | |
| | |
| | | | CAPITAL GOODS — 4.1% | | | | |
| $ | 5,121,000 | | | International Wire Group, Inc.
10.750%, 08/01/2021 (e) | | | 4,668,816 | |
| | | | | | | | |
| | |
| | | | CONSUMER
SERVICES — 2.2% | | | | |
| | 2,929,000 | | | Monitronics International, Inc.
9.125%, 04/01/2020 | | | 2,472,368 | |
| | | | | | | | |
| TOTAL DOMESTIC CORPORATE BONDS
(COST $7,604,951) | | | 7,141,184 | |
| | | | | | | | |
| | |
| | | | COMMERCIAL
PAPER — 13.1% | | | | |
| | |
| | | | BEVERAGES — 3.5% | | | | |
| | 4,000,000 | | | Molson Coors Brewing Co.
1.501%, 12/08/2017 (e)(g) | | | 3,998,781 | |
| | | | | | | | |
| | |
| | | | LODGING — 2.6% | | | | |
| | 3,000,000 | | | Wyndham Worldwide Co.
1.851%, 12/05/2017 (e)(g) | | | 2,999,276 | |
| | | | | | | | |
| | |
| | | | OIL & GAS STORAGE &
TRANSPORTATION — 2.6% | | | | |
| | 3,000,000 | | | Energy Transfer Partners
1.951%, 12/11/2017 (e)(g) | | | 2,998,400 | |
| | | | | | | | |
The accompanying notes are an integral part of the financial statements.
27
|
THE FAIRHOLME ALLOCATION FUND |
|
|
SCHEDULE OF INVESTMENTS (continued) |
November 30, 2017 |
|
| | | | | | |
| Principal | | | | Value | |
| | | | | |
| | COMMERCIAL PAPER
(CONTINUED) — 13.1% | | | | |
| | |
| | OIL & NATURAL GAS
EXPLORATION — 4.4% | | | | |
| $5,000,000 | | Canadian Natural Resources Ltd.
1.430%, 12/07/2017 (e)(g) | | $ | 4,998,406 | |
| | | | | | |
| |
TOTAL COMMERCIAL PAPER
(COST $14,995,399) | | | 14,994,863 | |
| | | | | | |
| | |
| | U.S. GOVERNMENT
OBLIGATIONS — 4.3% | | | | |
| 5,000,000 | | U.S. Treasury Bills 1.404%,
05/17/2018 (g) | | | 4,968,021 | |
| | | | | | |
| |
TOTAL U.S. GOVERNMENT
OBLIGATIONS
(COST $4,968,108) | | | 4,968,021 | |
| | | | | | |
| | | | | | | | |
| Shares | | | | | Value | |
| | | | | | |
| | | | MONEY MARKET
FUNDS — 1.2% | | | | |
| | 1,372,116 | | | Fidelity Investments Money
Market Treasury Portfolio -
Class I, 0.97% (h) | | $ | 1,372,116 | |
| | | | | | | | |
| |
| TOTAL MONEY MARKET FUNDS
(COST $1,372,116) | | | 1,372,116 | |
| | | | | | | | |
| |
| TOTAL INVESTMENTS — 99.9%
(COST $176,173,330) | | | 114,096,659 | |
| | | | OTHER ASSETS IN
EXCESS OF
LIABILITIES — 0.1% | | | 93,490 | |
| | | | | | | | |
| |
| | NET ASSETS — 100.0% | | $ | 114,190,149 | |
| | | | | | | | |
| (a) | Restricted and controlled security under procedures approved by the Directors. The value of these securities totals $13,647,568, which represents 11.95% of The Allocation Fund’s net assets. Information related to these securities is as follows: |
| | | | | | | | | | | | | | | | | | | | |
| Shares | | Issuer | | Acquisition
Date(s) | | Acquisition
Cost | | 11/30/2017
Carrying Value
Per Unit |
| | | 1,425,398 | | | Sears Holdings Corp. | | | | 12/16/2011-12/11/2014 | | | | $ | 53,325,603 | | | | $ | 3.95 | |
| | | 404,785 | | | Sears Holdings Corp., Warrants,
Vested, Strike Price $25.686,
Expire 12/15/2019 | | | | 11/17/2014-11/24/2014 | | | | $ | 2,980,059 | | | | $ | 0.45 | |
| | | 426,748 | | | The St. Joe Co. | | | | 08/08/2017-09/05/2017 | | | | $ | 8,066,747 | | | | $ | 18.36 | |
| (b) | Security is deemed an illiquid security pursuant to the Funds’ liquidity guidelines. |
| (c) | Non-income producing security. |
| (d) | Variable rate security. Rates shown are the effective rates as of November 30, 2017. |
| (e) | Restricted security as defined in Rule 144(a) under the Securities Act of 1933. The Manager has determined that such security is liquid pursuant to the Funds’ liquidity guidelines. The value of these securities totals $22,549,823 which represents 19.75% of The Allocation Fund’s net assets. |
| (f) | Warrants have terms and conditions based on dividends paid and other events that may lower the strike price and raise the shares per warrant conversion ratio. Reported strike prices and conversion ratios are as of the date of this report. All share-to-warrant conversion ratios are currently 1:1.11. |
| (g) | Rates shown are the effective yields based on the purchase price. The calculation assumes the security is held to maturity. |
| (h) | Annualized based on the 1-day yield as of November 30, 2017. |
The accompanying notes are an integral part of the financial statements.
28
| | | | |
THE FAIRHOLME ALLOCATION FUND | | | | |
| |
| |
STATEMENT OF ASSETS & LIABILITIES | |
November 30, 2017 | |
| |
| |
Assets | | | | |
Investments, at Fair Value (Cost — $176,173,330) | | $ | 114,096,659 | |
Interest Receivable | | | 235,974 | |
| | | | |
| |
Total Assets | | | 114,332,633 | |
| | | | |
| |
Liabilities | | | | |
Accrued Management Fees | | | 116,316 | |
Payable for Capital Shares Redeemed | | | 26,168 | |
| | | | |
| |
Total Liabilities | | | 142,484 | |
| | | | |
NET ASSETS | | $ | 114,190,149 | |
| | | | |
| |
Net Assets Consist of: | | | | |
Paid-In Capital | | $ | 175,169,850 | |
Undistributed Net Investment Income | | | 1,633,932 | |
Distributions in Excess of Net Realized Gain on Investments
and Foreign Currency Related Transactions | | | (536,962 | ) |
Net Unrealized Depreciation on Investments and
Foreign Currency Related Translations | | | (62,076,671 | ) |
| | | | |
| |
NET ASSETS | | $ | 114,190,149 | |
| | | | |
| |
Shares of Common Stock Outstanding* ($0.0001 par value) | | | 15,354,878 | |
| | | | |
| |
Net Asset Value, Offering and Redemption Price Per Share
($114,190,149 / 15,354,878 shares) | | $ | 7.44 | |
| | | | |
| * | 200,000,000 shares authorized in total. |
The accompanying notes are an integral part of the financial statements.
29
| | | | | | | | | | | | | | | | | | | | | | | | | | | | |
THE FAIRHOLME ALLOCATION FUND | |
| |
| |
STATEMENT OF OPERATIONS | |
| |
| |
| | | For the Fiscal Year Ended
November 30, 2017 | |
Investment Income | | | | | | | | | | | | | | | | | | | | | | | | | | | | |
Interest | | | | | | | | | | | | | | | | | | | | | | | | | | $ | 3,397,099 | |
Dividends | | | | | | | | | | | | | | | | | | | | | | | | | | | 1,060,300 | |
| | | | | | | | | | | | | | | | | | | | | | | | | | | | |
| | | | | | | |
Total Investment Income | | | | | | | | | | | | | | | | | | | | | | | | | | | 4,457,399 | |
| | | | | | | | | | | | | | | | | | | | | | | | | | | | |
| | | | | | | |
Expenses | | | | | | | | | | | | | | | | | | | | | | | | | | | | |
Management Fees | | | | | | | | | | | | | | | | | | | | | | | | | | | 2,032,317 | |
| | | | | | | | | | | | | | | | | | | | | | | | | | | | |
| | | | | | | |
Total Expenses | | | | | | | | | | | | | | | | | | | | | | | | | | | 2,032,317 | |
| | | | | | | | | | | | | | | | | | | | | | | | | | | | |
| | | | | | | |
Net Investment Income | | | | | | | | | | | | | | | | | | | | | | | | | | | 2,425,082 | |
| | | | | | | | | | | | | | | | | | | | | | | | | | | | |
| | | | | | | |
Realized and Unrealized Loss on Investments, Redemption
In-Kind, and Foreign Currency Related Transactions | | | | | | | | | | | | | | | | | | | | | | | | | | | | |
Net Realized Loss on Investments and Foreign Currency
Related Transactions | | | | | | | | | | | | | | | | | | | | | | | | | | | (230,253 | ) |
Net Realized Loss on Redemption In-Kind | | | | | | | | | | | | | | | | | | | | | | | | | | | (5,852,146 | ) |
Net Change in Unrealized Appreciation (Depreciation) on
Investments and Foreign Currency Related Translations | | | | | | | | | | | | | | | | | | | | | | | | | | | (38,175,810 | ) |
| | | | | | | | | | | | | | | | | | | | | | | | | | | | |
Net Realized and Unrealized Loss on Investments,
Redemption In-Kind, and Foreign Currency Related
Transactions | | | | | | | | | | | | | | | | | | | | | | | | | | | (44,258,209 | ) |
| | | | | | | | | | | | | | | | | | | | | | | | | | | | |
| | | | | | | |
NET DECREASE IN NET ASSETS FROM OPERATIONS | | | | | | | | | | | | | | | | | | | | | | | | | | $ | (41,833,127 | ) |
| | | | | | | | | | | | | | | | | | | | | | | | | | | | |
The accompanying notes are an integral part of the financial statements.
30
| | | | | | | | | | | | | | | | | | | | | | | | | | | | | | | | | | | | | | | | | | | | | | | | |
THE FAIRHOLME ALLOCATION FUND | |
| |
| |
STATEMENTS OF CHANGES IN NET ASSETS | |
| |
| | |
| | | For the Fiscal Year Ended
November 30, 2017 | | | For the Fiscal Year Ended
November 30, 2016 | |
CHANGES IN NET ASSETS | | | | | | | | | | | | | | | | | | | | | | | | | | | | | | | | | | | | | | | | | | | | | | | | |
From Operations | | | | | | | | | | | | | | | | | | | | | | | | | | | | | | | | | | | | | | | | | | | | | | | | |
Net Investment Income | | | | | | | | | | | | | | | | | | | | | | $ | 2,425,082 | | | | | | | | | | | | | | | | | | | | | | | $ | 4,185,984 | |
Net Realized Gain (Loss) on Investments, Redemption In-Kind, and Foreign Currency Related Transactions | | | | | | | | | | | | | | | | | | | | | | | (6,082,399 | ) | | | | | | | | | | | | | | | | | | | | | | | 11,621,080 | |
Net Change in Unrealized Appreciation (Depreciation) on Investments and Foreign Currency Related Translations | | | | | | | | | | | | | | | | | | | | | | | (38,175,810 | ) | | | | | | | | | | | | | | | | | | | | | | | 2,115,196 | |
| | | | | | | | | | | | | | | | | | | | | | | | | | | | | | | | | | | | | | | | | | | | | | | | |
Net Increase (Decrease) in Net Assets from Operations | | | | | | | | | | | | | | | | | | | | | | | (41,833,127 | ) | | | | | | | | | | | | | | | | | | | | | | | 17,922,260 | |
| | | | | | | | | | | | | | | | | | | | | | | | | | | | | | | | | | | | | | | | | | | | | | | | |
From Dividends and Distributions
to Shareholders | | | | | | | | | | | | | | | | | | | | | | | | | | | | | | | | | | | | | | | | | | | | | | | | |
Net Investment Income | | | | | | | | | | | | | | | | | | | | | | | (4,526,968 | ) | | | | | | | | | | | | | | | | | | | | | | | (8,437,431 | ) |
Net Realized Capital Gains from Investment Transactions | | | | | | | | | | | | | | | | | | | | | | | (11,620,764 | ) | | | | | | | | | | | | | | | | | | | | | | | (36,408,537 | ) |
| | | | | | | | | | | | | | | | | | | | | | | | | | | | | | | | | | | | | | | | | | | | | | | | |
Net Decrease in Net Assets from Dividends and Distributions | | | | | | | | | | | | | | | | | | | | | | | (16,147,732 | ) | | | | | | | | | | | | | | | | | | | | | | | (44,845,968 | ) |
| | | | | | | | | | | | | | | | | | | | | | | | | | | | | | | | | | | | | | | | | | | | | | | | |
From Capital Share Transactions | | | | | | | | | | | | | | | | | | | | | | | | | | | | | | | | | | | | | | | | | | | | | | | | |
Proceeds from Sale of Shares | | | | | | | | | | | | | | | | | | | | | | | 6,761,226 | | | | | | | | | | | | | | | | | | | | | | | | 29,640,495 | |
Shares Issued in Reinvestment of Dividends and Distributions | | | | | | | | | | | | | | | | | | | | | | | 15,699,837 | | | | | | | | | | | | | | | | | | | | | | | | 44,238,410 | |
Redemption Fees | | | | | | | | | | | | | | | | | | | | | | | 6,814 | | | | | | | | | | | | | | | | | | | | | | | | 8,431 | |
Cost of Shares Redeemed | | | | | | | | | | | | | | | | | | | | | | | (86,895,673 | ) | | | | | | | | | | | | | | | | | | | | | | | (84,989,762 | ) |
Cost of Shares Redeemed In-Kind | | | | | | | | | | | | | | | | | | | | | | | (22,902,409 | ) | | | | | | | | | | | | | | | | | | | | | | | — | |
| | | | | | | | | | | | | | | | | | | | | | | | | | | | | | | | | | | | | | | | | | | | | | | | |
Net Decrease in Net Assets from Shareholder Activity | | | | | | | | | | | | | | | | | | | | | | | (87,330,205 | ) | | | | | | | | | | | | | | | | | | | | | | | (11,102,426 | ) |
| | | | | | | | | | | | | | | | | | | | | | | | | | | | | | | | | | | | | | | | | | | | | | | | |
NET ASSETS | | | | | | | | | | | | | | | | | | | | | | | | | | | | | | | | | | | | | | | | | | | | | | | | |
Net Decrease in Net Assets | | | | | | | | | | | | | | | | | | | | | | | (145,311,064 | ) | | | | | | | | | | | | | | | | | | | | | | | (38,026,134 | ) |
Net Assets at Beginning of Year | | | | | | | | | | | | | | | | | | | | | | | 259,501,213 | | | | | | | | | | | | | | | | | | | | | | | | 297,527,347 | |
| | | | | | | | | | | | | | | | | | | | | | | | | | | | | | | | | | | | | | | | | | | | | | | | |
Net Assets at End of Year | | | | | | | | | | | | | | | | | | | | | | $ | 114,190,149 | | | | | | | | | | | | | | | | | | | | | | | $ | 259,501,213 | |
| | | | | | | | | | | | | | | | | | | | | | | | | | | | | | | | | | | | | | | | | | | | | | | | |
Undistributed Net Investment Income at End of Year | | | | | | | | | | | | | | | | | | | | | | $ | 1,633,932 | | | | | | | | | | | | | | | | | | | | | | | $ | 3,978,466 | |
| | | | | | | | | | | | | | | | | | | | | | | | | | | | | | | | | | | | | | | | | | | | | | | | |
SHARES TRANSACTIONS | | | | | | | | | | | | | | | | | | | | | | | | | | | | | | | | | | | | | | | | | | | | | | | | |
Issued | | | | | | | | | | | | | | | | | | | | | | | 810,064 | | | | | | | | | | | | | | | | | | | | | | | | 3,699,085 | |
Reinvested | | | | | | | | | | | | | | | | | | | | | | | 1,796,320 | | | | | | | | | | | | | | | | | | | | | | | | 5,323,515 | |
Redeemed | | | | | | | | | | | | | | | | | | | | | | | (10,962,667 | ) | | | | | | | | | | | | | | | | | | | | | | | (10,730,450 | ) |
Redeemed In-Kind | | | | | | | | | | | | | | | | | | | | | | | (3,189,751 | ) | | | | | | | | | | | | | | | | | | | | | | | — | |
| | | | | | | | | | | | | | | | | | | | | | | | | | | | | | | | | | | | | | | | | | | | | | | | |
Net Decrease in Shares | | | | | | | | | | | | | | | | | | | | | | | (11,546,034 | ) | | | | | | | | | | | | | | | | | | | | | | | (1,707,850 | ) |
Shares Outstanding at Beginning of Year | | | | | | | | | | | | | | | | | | | | | | | 26,900,912 | | | | | | | | | | | | | | | | | | | | | | | | 28,608,762 | |
| | | | | | | | | | | | | | | | | | | | | | | | | | | | | | | | | | | | | | | | | | | | | | | | |
Shares Outstanding at End of Year | | | | | | | | | | | | | | | | | | | | | | | 15,354,878 | | | | | | | | | | | | | | | | | | | | | | | | 26,900,912 | |
| | | | | | | | | | | | | | | | | | | | | | | | | | | | | | | | | | | | | | | | | | | | | | | | |
The accompanying notes are an integral part of the financial statements.
31
| | | | | | | | | | | | | | | | | | | | | | | | | | | | |
THE FAIRHOLME ALLOCATION FUND | |
| |
| |
FINANCIAL HIGHLIGHTS | |
| |
| |
| | | For the Fiscal Year Ended November 30, | |
| | | | | | | |
| | | | | | | | | 2017 | | | 2016 | | | 2015 | | | 2014 | | | 2013 | |
| | | | | | | |
PER SHARE OPERATING PERFORMANCE | | | | | | | | | | | | | | | | | | | | | | | | | | | | |
NET ASSET VALUE, BEGINNING OF YEAR | | | | | | | | | | | $9.65 | | | | $10.40 | | | | $12.57 | | | | $13.82 | | | | $9.33 | |
| | | | | | | | | | | | | | | | | | | | | | | | | | | | |
| | | | | | | |
Investment Operations | | | | | | | | | | | | | | | | | | | | | | | | | | | | |
Net Investment Income (Loss)(1) | | | | | | | | | | | 0.10 | | | | 0.14 | | | | 0.35 | | | | (0.10 | ) | | | (0.09 | ) |
Net Realized and Unrealized Gain (Loss) on Investments | | | | | | | | | | | (1.71 | ) | | | 0.75 | | | | (1.38 | ) | | | (1.15 | ) | | | 4.64 | |
| | | | | | | | | | | | | | | | | | | | | | | | | | | | |
Total from Investment Operations | | | | | | | | | | | (1.61 | ) | | | 0.89 | | | | (1.03 | ) | | | (1.25 | ) | | | 4.55 | |
| | | | | | | | | | | | | | | | | | | | | | | | | | | | |
| | | | | | | |
Dividends and Distributions | | | | | | | | | | | | | | | | | | | | | | | | | | | | |
From Net Investment Income | | | | | | | | | | | (0.17 | ) | | | (0.31 | ) | | | — | | | | — | | | | (0.06 | ) |
From Realized Capital Gains | | | | | | | | | | | (0.43 | ) | | | (1.33 | ) | | | (1.14 | ) | | | — | | | | — | |
| | | | | | | | | | | | | | | | | | | | | | | | | | | | |
Total Dividends and Distributions | | | | | | | | | | | (0.60 | ) | | | (1.64 | ) | | | (1.14 | ) | | | — | | | | (0.06 | ) |
| | | | | | | | | | | | | | | | | | | | | | | | | | | | |
| | | | | | | |
| Redemption Fees(1) | | | | | | | | | | | 0.00 | (2) | | | 0.00 | (2) | | | 0.00 | (2) | | | 0.00 | (2) | | | 0.00 | (2) |
| | | | | | | | | | | | | | | | | | | | | | | | | | | | |
NET ASSET VALUE, END OF YEAR | | | | | | | | | | | $7.44 | | | | $9.65 | | | | $10.40 | | | | $12.57 | | | | $13.82 | |
| | | | | | | | | | | | | | | | | | | | | | | | | | | | |
| | | | | | | |
TOTAL RETURN | | | | | | | | | | | (17.59 | )% | | | 11.06 | % | | | (8.88 | )% | | | (9.04 | )% | | | 49.09 | % |
Ratio/Supplemental Data | | | | | | | | | | | | | | | | | | | | | | | | | | | | |
Net Assets, End of Year (in 000’s) | | | | | | | | | | | $114,190 | | | | $259,501 | | | | $297,527 | | | | $378,750 | | | | $359,470 | |
Ratio of Expenses to Average Net Assets | | | | | | | | | | | 1.00 | % | | | 1.00 | % | | | 1.00 | % | | | 1.00 | % | | | 1.01 | %(3) |
Ratio of Net Investment Income (Loss) to Average Net Assets | | | | | | | | | | | 1.19 | % | | | 1.81 | % | | | 3.09 | % | | | (0.73 | )% | | | (0.80 | )% |
Portfolio Turnover Rate | | | | | | | | | | | 31.01 | % | | | 13.65 | % | | | 39.24 | % | | | 33.15 | % | | | 35.97 | % |
| (1) | Based on average shares outstanding. |
| (2) | Redemption fees represent less than $0.01. |
| (3) | 0.01% is attributable to interest expense incurred outside of the 1.00% management fee. |
The accompanying notes are an integral part of the financial statements.
32
| | | | |
FAIRHOLME FUNDS, INC. | | | | |
| |
| |
NOTES TO FINANCIAL STATEMENTS | |
November 30, 2017 | |
| |
Note 1. Organization
Fairholme Funds, Inc. (the “Company”), a Maryland corporation, is registered under the Investment Company Act of 1940, as amended (the “1940 Act”), as an open-end management investment company. The Company’s Articles of Incorporation permit the Board of Directors of the Company (the “Board” or the “Directors”) to issue 1,100,000,000 shares of common stock at $.0001 par value. 700,000,000 shares have been allocated to The Fairholme Fund (“The Fairholme Fund”), 200,000,000 shares have been allocated to The Fairholme Focused Income Fund (“The Income Fund”), and 200,000,000 shares have been allocated to The Fairholme Allocation Fund (“The Allocation Fund”). The Fairholme Fund, The Income Fund, and The Allocation Fund (each a “Fund” and collectively the “Funds”) are non-diversified funds. The Funds may have a greater percentage of their assets invested in particular securities than a diversified fund, exposing the Funds to the risk of unanticipated industry conditions as well as risks specific to a single company or the securities of a single company. Each Fund has different objectives, capitalizations, and considerations that may or may not lead to differing compositions of issuers, securities within an issuer, and cash levels within each Fund. The Board has the power to designate one or more separate and distinct series and/or classes of shares of common stock and to classify or reclassify any unissued shares with respect to such series.
The Fairholme Fund’s investment objective is to provide long-term growth of capital. Under normal circumstances, The Fairholme Fund seeks to achieve its investment objective by investing in a focused portfolio of equity and fixed-income securities. The proportion of The Fairholme Fund’s assets invested in each type of asset class will vary from time to time based upon Fairholme Capital Management, L.L.C.’s (the “Manager”) assessment of general market and economic conditions. The Fairholme Fund may invest in, and may shift frequently among, the asset classes and market sectors. The equity securities in which The Fairholme Fund may invest include common and preferred stock (including convertible preferred stock), partnership interests, business trust shares, interests in real estate investment trusts (“REITs”), rights and warrants to subscribe for the purchase of equity securities, and depository receipts. The Fairholme Fund may invest in equity securities without regard to the jurisdictions in which the issuers of the securities are organized or situated and without regard to the market capitalizations or sectors of such issuers. The fixed-income securities in which The Fairholme Fund may invest include U.S. corporate debt securities, non-U.S. corporate debt securities, bank debt (including bank loans and participations), U.S. government and agency debt securities (including U.S. Treasury bills), short-term debt obligations of foreign governments, and foreign money market instruments. Except for its investments in short-term debt obligations of foreign governments, The Fairholme Fund may invest in fixed-income securities regardless of maturity or the rating of the issuer of the security. The Fairholme Fund may also invest in “special situations” to achieve its objective. “Special situation” investments may include equity securities or fixed-income securities, such as corporate debt, which may be in a distressed position as a result of economic or company specific developments. Although The Fairholme Fund normally holds a focused portfolio of equity and fixed-income securities, The Fairholme Fund is not required to be fully invested in such securities and may maintain a significant portion of its total assets in cash and securities generally considered to be cash equivalents. The Manager serves as investment adviser to The Fairholme Fund.
The Income Fund’s investment objective is to seek current income. Under normal circumstances, The Income Fund seeks to achieve its investment objective by investing in a focused portfolio of cash distributing securities. To maintain maximum flexibility, the securities in which The Income Fund may invest include corporate bonds and other corporate debt securities of issuers in the U.S. and foreign countries, bank debt (including bank loans and loan participations), government and agency debt securities of the U.S. and foreign countries (including U.S. Treasury bills), convertible bonds and other convertible securities, and equity securities, including preferred and common stock and interests in REITs. Although The Income Fund normally holds a focused portfolio of securities, The Income Fund is not required to be fully invested in such securities and may maintain a significant portion of its total assets in cash and securities generally considered to be cash equivalents. The Manager serves as investment adviser to The Income Fund.
The Allocation Fund’s investment objective is to seek long-term total return. Under normal circumstances, The Allocation Fund seeks to achieve its investment objective by investing opportunistically in a focused portfolio of investments in the equity, fixed-income and cash, and cash-equivalent asset classes. The proportion of The Allocation Fund’s portfolio invested
33
| | | | |
FAIRHOLME FUNDS, INC. | | | | |
| |
| |
NOTES TO FINANCIAL STATEMENTS (continued) | |
November 30, 2017 | |
| |
in each asset class will vary from time to time based on the Manager’s assessment of relative fundamental values of securities and other investments in the asset class, the attractiveness of investment opportunities within each asset class, general market and economic conditions, and expected future returns of other investment opportunities. The Allocation Fund seeks to capitalize on anticipated fluctuations in the financial markets by changing the mix of its holdings in the targeted asset classes. The Allocation Fund may maintain a significant portion of its total assets in cash and securities generally considered to be cash equivalents. The Manager serves as investment adviser to The Allocation Fund.
There is no guarantee that the Funds will meet their respective objectives.
Note 2. Significant Accounting Policies
As investment companies, the Funds follow the investment company accounting and reporting guidance, which is part of U.S. generally accepted accounting principles (“U.S. GAAP”). The Funds’ investments are reported at fair value as defined by U.S. GAAP. The Funds calculate their net asset values as soon as practicable following the close of regular trading on the New York Stock Exchange (currently 4:00 p.m. Eastern Time) on each day the New York Stock Exchange is open.
A description of the valuation techniques applied to the Funds’ securities measured at fair value on a recurring basis follows:
Security Valuation:
Equity securities (common and preferred stocks): Securities traded on a national securities exchange or reported on the NASDAQ national market are generally valued at the official closing price, or at the last reported sale price on the exchange or market on which the securities are traded, as of the close of business on the day the securities are being valued or, lacking any sales, at the last available bid price. To the extent these securities are actively traded and valuation adjustments are not applied, they are classified in Level 1 of the fair value hierarchy. If these securities are not actively traded, they are classified in Level 2. The Manager may also employ other valuation methods which the Manager believes would provide a more accurate indication of fair value. In these situations, if the inputs are observable, the valuation will be classified in Level 2 of the fair value hierarchy, otherwise they would be classified in Level 3.
Fixed-income securities (U.S. government obligations, corporate bonds, convertible bonds, and asset backed securities): The fair value of fixed-income securities is determined using market quotations when readily available, but may also be determined by various methods when no such market quotations exist and when the Manager believes these other methods reflect the fair value of such securities. These methods may consider recently executed transactions in securities of the issuer or comparable issuers and market price valuations from independent pricing services and/or brokers (where observable). Where the Manager deems it appropriate to do so (such as when independent prices are unavailable or not deemed to be representative of fair value) long-term fixed income securities will be fair valued in good faith following consideration by, and conclusion of, the Manager’s Valuation Committee. As of November 30, 2017, fixed-income securities are valued by the Manager utilizing observable market prices on the day of valuation or the average bid of independent broker/dealer quotes and/or the average of valuations from independent pricing services. Although fixed-income securities are classified in Level 2 of the fair value hierarchy at November 30, 2017, in instances where significant unobservable inputs are used, they would be classified in Level 3.
Open-end mutual funds: Investments in open-end mutual funds including money market funds are valued at their closing net asset value each business day and are classified in Level 1 of the fair value hierarchy.
Short-term securities: Investments in securities with maturities of less than sixty days when acquired, or which subsequently are within sixty days of maturity, shall be valued at prices supplied by an independent pricing source or by one of the Funds’ pricing agents based on broker or dealer supplied valuations or matrix pricing. To the extent the inputs are observable and timely, the values would be classified in Level 2 of the fair value hierarchy.
34
| | | | |
FAIRHOLME FUNDS, INC. | | | | |
| |
| |
NOTES TO FINANCIAL STATEMENTS (continued) | |
November 30, 2017 | |
| |
Restricted securities: Depending on the relative significance of valuation inputs, these instruments may be classified in any level of the fair value hierarchy. As of December 3, 2015, the Manager was deemed to be an affiliate of Sears Holdings Corporation (“Sears”) for purposes of the Securities Act of 1933 and Rule 144. This determination was made based on a number of factors, including the collective ownership of Sears by the Funds and other investment entities managed by the Manager. The Sears securities are considered control securities under Rule 144 and are treated as restricted securities for purposes of the Company’s valuation and liquidity procedures. Due to the restrictions on resale, the securities are generally valued at a discount to similar publicly traded securities. Depending on the relative significance of valuation inputs, these instruments may be classified in either Level 2 or Level 3 of the fair value hierarchy.
Warrants: The Funds may invest in warrants, which may be acquired either through a direct purchase, included as part of a private placement, or pursuant to corporate actions. Warrants entitle, but do not obligate, the holder to buy equity securities at a specific price for a specific period of time. Warrants may be considered more speculative than certain other types of investments in that they do not entitle a holder to dividends or voting rights with respect to the underlying securities that may be purchased nor do they represent any rights in the assets of the issuing company. Also, the value of a warrant does not necessarily change with the value of the underlying securities and a warrant ceases to have value if it is not exercised prior to its expiration date. Warrants traded on a security exchange are valued at the official closing price on the valuation date and are classified as Level 1 of the fair value hierarchy. Over the counter (OTC) warrants are valued using simulation models utilizing market value of the underlying security, expiration date of the warrants, volatility of the underlying security, strike price of the warrants, risk-free interest rate at the valuation date, and are classified as Level 2 or Level 3 of the fair value hierarchy depending on the observability of the inputs used.
The Funds use several recognized industry third-party pricing services (TPPS) - approved by the Board and unaffiliated with the Manager - to value some of its securities. It also uses other independent market trade data sources (such as TRACE, the FINRA developed mandatory reporting of over-the-counter secondary market transactions), as well as broker quotes provided by market makers. The data within these feeds is ultimately sourced from major stock exchanges and trading systems where these securities trade. If a price obtained from the pricing source is deemed unreliable, it may be discarded and/or challenged. In these cases the pricing decision is made by reference to the reliable market data from the other market data sources.
Subject to the oversight of the Board, the Manager may determine the fair valuation of a security when market quotations are insufficient or not readily available, when securities are determined to be illiquid or restricted, or when in the judgment of the Manager the prices or values available do not represent the fair value of the instrument. Factors which may cause the Manager to make such a judgment include the following: (a) only a bid price or an asked price is available; (b) the spread between bid and asked prices is substantial; (c) the liquidity of the securities; (d) the frequency of sales; (e) the thinness of the market; (f) the size of reported trades; (g) actions of the securities markets, such as the suspension or limitation of trading; and (h) local market closures. Among the factors to be considered to fair value a security are recent prices of comparable securities that are publicly traded, reliable prices of securities not publicly traded, the use of valuation models, current analyst reports, valuing the income or cash flow of the issuer, or cost if the preceding factors do not apply. The circumstances of fair valued securities are frequently monitored to determine if fair valuation measures continue to apply.
The Manager reports quarterly to the Board the results of the application of fair valuation policies and procedures.
The inputs and valuation techniques used to measure fair value of the Funds’ investments are summarized into three levels as described in the hierarchy below:
| | |
• Level 1 — | | quoted prices in active markets for identical securities; |
| |
• Level 2 — | | other significant observable inputs (including quoted prices for similar securities, quoted prices in inactive markets for identical securities, interest rates, prepayment speeds, credit risk, etc.); and |
| |
• Level 3 — | | significant unobservable inputs (including the Manager’s determination as to the fair value of investments). |
35
| | | | |
FAIRHOLME FUNDS, INC. | | | | |
| |
| |
NOTES TO FINANCIAL STATEMENTS (continued) | |
November 30, 2017 | |
| |
The inputs or methodology used for valuing investments are not necessarily an indication of the level of risk associated with investing in those investments. The summary of the Funds’ investments by inputs used to value the Funds’ investments as of November 30, 2017, is as follows:
| | | | | | | | | | | | | | | |
| | | Valuation Inputs | | |
| | | Level 1 –
Quoted Prices | | Level 2 – Other
Significant
Observable Inputs | | Total
Fair Value
at 11/30/17 |
THE FAIRHOLME FUND | | | | | | | | | | | | | | | |
ASSETS: | | | | | | | | | | | | | | | |
INVESTMENTS (Fair Value): | | | | | | | | | | | | | | | |
Domestic Equity Securities | | | | | | | | | | | | | | | |
Retail Department Stores | | | $ | — | | | | $ | 53,467,164 | | | | $ | 53,467,164 | |
Other Industries* | | | | 516,290,022 | | | | | — | | | | | 516,290,022 | |
Foreign Equity Securities* | | | | 12,636,868 | | | | | — | | | | | 12,636,868 | |
Domestic Preferred Equity Securities | | | | | | | | | | | | | | | |
Mortgage Finance | | | | 479,019,453 | | | | | — | | | | | 479,019,453 | |
Retail Department Stores | | | | — | | | | | 144,378 | | | | | 144,378 | |
Rights* | | | | 92,971 | | | | | — | | | | | 92,971 | |
Warrants* | | | | — | | | | | 98,289 | | | | | 98,289 | |
Domestic Corporate Bonds* | | | | — | | | | | 165,259,768 | | | | | 165,259,768 | |
Foreign Corporate Bonds* | | | | — | | | | | 134,271,563 | | | | | 134,271,563 | |
Commercial Paper* | | | | — | | | | | 371,866,987 | | | | | 371,866,987 | |
U.S. Government Obligations | | | | — | | | | | 124,727,812 | | | | | 124,727,812 | |
Money Market Funds | | | | 10,489,864 | | | | | — | | | | | 10,489,864 | |
| | | | | | | | | | | | | | | |
TOTAL INVESTMENTS | | | $ | 1,018,529,178 | | | | $ | 849,835,961 | | | | $ | 1,868,365,139 | |
| | | | | | | | | | | | | | | |
| | | |
THE INCOME FUND | | | | | | | | | | | | | | | |
ASSETS: | | | | | | | | | | | | | | | |
INVESTMENTS (Fair Value): | | | | | | | | | | | | | | | |
Domestic Equity Securities* | | | $ | 23,117,600 | | | | $ | — | | | | $ | 23,117,600 | |
Domestic Preferred Equity Securities | | | | | | | | | | | | | | | |
Oil & Natural Gas Exploration | | | | 2,519,053 | | | | | 1,522,613 | | | | | 4,041,666 | |
Retail Department Stores | | | | — | | | | | 3,156,189 | | | | | 3,156,189 | |
Other Industries* | | | | 29,102,172 | | | | | — | | | | | 29,102,172 | |
Domestic Corporate Bonds* | | | | — | | | | | 46,672,501 | | | | | 46,672,501 | |
Foreign Corporate Bonds* | | | | — | | | | | 25,992,187 | | | | | 25,992,187 | |
Municipal Bonds* | | | | — | | | | | 5,519,115 | | | | | 5,519,115 | |
Commercial Paper* | | | | — | | | | | 49,985,895 | | | | | 49,985,895 | |
U.S. Government Obligations | | | | — | | | | | 4,957,117 | | | | | 4,957,117 | |
Money Market Funds | | | | 22,511,280 | | | | | — | | | | | 22,511,280 | |
| | | | | | | | | | | | | | | |
TOTAL INVESTMENTS | | | $ | 77,250,105 | | | | $ | 137,805,617 | | | | $ | 215,055,722 | |
| | | | | | | | | | | | | | | |
36
| | | | |
FAIRHOLME FUNDS, INC. | | | | |
| |
| |
NOTES TO FINANCIAL STATEMENTS (continued) | |
November 30, 2017 | |
| |
| | | | | | | | | | | | | | | |
| | | Valuation Inputs | | |
| | | Level 1 –
Quoted Prices | | Level 2 – Other
Significant
Observable Inputs | | Total
Fair Value
at 11/30/17 |
THE ALLOCATION FUND | | | | | | | | | | | | | | | |
ASSETS: | | | | | | | | | | | | | | | |
INVESTMENTS (Fair Value): | | | | | | | | | | | | | | | |
Domestic Equity Securities | | | | | | | | | | | | | | | |
Real Estate Investment Trusts | | | $ | 27,973,843 | | | | $ | — | | | | $ | 27,973,843 | |
Retail Department Stores | | | | — | | | | | 5,630,322 | | | | | 5,630,322 | |
Real Estate Management & Development | | | | — | | | | | 7,835,093 | | | | | 7,835,093 | |
Foreign Equity Securities* | | | | 4,026,535 | | | | | — | | | | | 4,026,535 | |
Domestic Preferred Equity Securities | | | | | | | | | | | | | | | |
Oil & Natural Gas Exploration | | | | — | | | | | 2,886,144 | | | | | 2,886,144 | |
Mortgage Finance | | | | 37,042,996 | | | | | — | | | | | 37,042,996 | |
Rights* | | | | 43,389 | | | | | — | | | | | 43,389 | |
Warrants* | | | | — | | | | | 182,153 | | | | | 182,153 | |
Domestic Corporate Bonds* | | | | — | | | | | 7,141,184 | | | | | 7,141,184 | |
Commercial Paper* | | | | — | | | | | 14,994,863 | | | | | 14,994,863 | |
U.S. Government Obligations | | | | — | | | | | 4,968,021 | | | | | 4,968,021 | |
Money Market Funds | | | | 1,372,116 | | | | | — | | | | | 1,372,116 | |
| | | | | | | | | | | | | | | |
TOTAL INVESTMENTS | | | $ | 70,458,879 | | | | $ | 43,637,780 | | | | $ | 114,096,659 | |
| | | | | | | | | | | | | | | |
| | * | Industry classifications for these categories are detailed in the Schedule of Investments. |
The Funds had no transfers between Level 1 and Level 2 during the year ended November 30, 2017. The Funds’ policy is to recognize transfers among Levels as of the beginning of the reporting period.
There were no Level 3 investments at November 30, 2017 or November 30, 2016.
Warrants: The Funds’ investments in warrants as of November 30, 2017 are presented within the Schedules of Investments.
The Fairholme Fund’s and The Allocation Fund’s warrant positions during the year ended November 30, 2017, had an average monthly market value of approximately $535,996 and $1,141,305, respectively.
As of November 30, 2017, The Fairholme Fund’s and The Allocation Fund’s value of warrants with equity risk exposure of $98,289 and $182,153, respectively, is included with Investments at Fair Value on the Statement of Assets and Liabilities. For the year ended November 30, 2017, The Fairholme Fund’s and The Allocation Fund’s effect of the net change in unrealized appreciation/(depreciation) of warrants with equity risk exposure of $(698,237) and $(1,314,528), respectively, is included with the Net Change in Unrealized Appreciation (Depreciation) on Investments and Foreign Currency Related Translations on the Statements of Operations, and realized losses from warrants with equity risk exposure of $(64,707) and $(319,151), respectively, is included in Net Realized Gain (Loss) on Investments and Foreign Currency Related Transactions on the Statements of Operations.
Dividends and Distributions: The Funds record dividends and distributions to shareholders on the ex-dividend date. The Fairholme Fund and The Allocation Fund intend to distribute substantially all of their net investment income (if any) as dividends to their respective shareholders on an annual basis in December. The Income Fund intends to declare and pay net investment income distributions, if any, quarterly in March, June, September, and December. The Funds intend to distribute
37
| | | | |
FAIRHOLME FUNDS, INC. | | | | |
| |
| |
NOTES TO FINANCIAL STATEMENTS (continued) | |
November 30, 2017 | |
| |
any net long-term capital gains and any net short-term capital gains at least once a year. If the total dividends and distributions made in any tax year exceeds net investment income and accumulated realized capital gains, a portion of the total distribution may be treated as a tax return of capital.
Foreign Currency Translation: The books and records of the Funds are maintained in U.S. dollars. Foreign currency amounts are translated into U.S. dollars on the following basis: (i) fair value of investment securities, assets, and liabilities at the current rate of exchange; and (ii) purchases and sales of investment securities, income, and expenses at the relevant rates of exchange prevailing on the respective dates of such transactions. The Funds do not isolate that portion of gains and losses on investment securities which is due to changes in the foreign exchange rates from that which is due to changes in the market prices of such securities.
Estimates: The preparation of financial statements in conformity with U.S. GAAP requires the Funds to make estimates and assumptions that affect the reported amounts of assets and liabilities and disclosure of contingent assets and liabilities at the date of the financial statements and the reported amounts of increases and decreases in net assets from operations during the reported period. Actual results could differ from those estimates.
Redemption Fee: The Fairholme Fund and The Allocation Fund assess a 2% fee on the proceeds of The Fairholme Fund and The Allocation Fund shares that are redeemed within 60 days of their purchase. The redemption fee is paid to The Fairholme Fund and The Allocation Fund, as applicable, for the benefit of remaining shareholders and is recorded as paid-in capital. The redemption fees retained by The Fairholme Fund and The Allocation Fund during the fiscal years ended November 30, 2017 and November 30, 2016, amounted to $136,808 and $212,693, and $6,814 and $8,431, respectively.
During the year ended November 30, 2017, The Fairholme Fund and The Fairholme Allocation Fund delivered portfolio securities and cash in exchange for shares redeemed by shareholders in in-kind redemptions. For financial reporting purposes, the Fund recognized a net loss on the transfer of securities; however, for tax purposes the transaction was treated as a tax free exchange and the loss has been reclassified from undistributed realized gain (loss) to paid-in capital. The Fairholme Fund and The Fairholme Allocation Fund realized ($2,649,939) and ($5,852,146) of net losses attributable to the in-kind redemption, respectively.
Other: The Funds account for security transactions on the trade date for financial statement purposes. The specific identification method is used for determining gains or losses for financial statements and income tax purposes. Dividend income is recorded on the ex-dividend date net of foreign taxes withheld where recovery is uncertain and interest income is recorded on an accrual basis. Discounts and premiums on securities purchased are amortized over the life of the respective securities using the effective yield method. Securities denominated in currencies other than U.S. dollars are subject to changes in value due to fluctuation in exchange rates. The Funds may invest in countries that require governmental approval for the repatriation of investment income, capital, or the proceeds of sales of securities by foreign investors. In addition, if there is deterioration in a country’s balance of payments or for other reasons, a country may impose temporary restrictions on foreign capital remittances abroad.
The Funds paid commissions, other brokerage fees, and registration fees during the period. The Fairholme Fund also paid legal expenses in connection with its investments in Federal National Mortgage Association and the Federal Home Loan Mortgage Corporation.
Note 3. Related Party Transactions
The Manager is a Delaware limited liability company and is registered with the Securities and Exchange Commission as an investment adviser. The Manager’s principal business and occupation is to provide investment management and advisory services to individuals, corporations, and other institutions throughout the world. Pursuant to an Investment Management Agreement, each Fund pays a management fee to the Manager for its provision of investment advisory and operating services to each Fund. Subject to applicable waivers or limitations, the management fee is paid at an annual rate equal to 1.00% of the daily average net assets of each Fund. The Manager is responsible pursuant to the Investment Management Agreement for
38
| | | | |
FAIRHOLME FUNDS, INC. | | | | |
| |
| |
NOTES TO FINANCIAL STATEMENTS (continued) | |
November 30, 2017 | |
| |
paying each Fund’s expenses for the following services: transfer agency, fund accounting, fund administration, custody, legal, audit, compliance, directors’ fees, call center, fulfillment, travel, insurance, rent, printing, postage and other office supplies. The Manager is not responsible for paying for the following costs and expenses of each Fund: commissions, brokerage fees, issue and transfer taxes, and other costs chargeable to each Fund in connection with securities transactions or in connection with securities owned by each Fund, taxes, interest, acquired fund fees and related expenses, expenses in connection with litigation by or against each Fund, and any other extraordinary expenses.
The Manager earned $24,295,975, $2,478,958, and $2,032,317, from The Fairholme Fund, The Income Fund, and The Allocation
Fund, respectively, for its services during the year ended November 30, 2017.
Bruce Berkowitz, both the Chief Investment Officer of the Manager and Chairman of the Funds’ Board, and his affiliates beneficially own an aggregate 7,604,186 shares, 1,750,580 shares, and 6,465,023 shares of The Fairholme Fund, The Income Fund, and The Allocation Fund, respectively, at November 30, 2017.
A Director and Officers of the Funds are also Officers of the Manager or its affiliates.
Note 4. Investments
For the year ended November 30, 2017, aggregated purchases and sales of investment securities other than short-term investments, redemptions in-kind of Fund shares, and U.S. government obligations were as follows:
| | | | | | | | | | | | | | | | |
| | | | | | Purchases | | | | | | Sales | |
The Fairholme Fund | | | | | | $ | 128,833,407 | | | | | | | $ | 1,033,792,819 | |
The Income Fund | | | | | | | 65,869,842 | | | | | | | | 113,116,811 | |
The Allocation Fund | | | | | | | 48,194,875 | | | | | | | | 100,060,589 | |
Note 5. Tax Matters
Federal Income Taxes: Each Fund intends to qualify each year as a “regulated investment company” under Subchapter M of the Internal Revenue Code of 1986, as amended. By so qualifying, each Fund will not be subject to federal income taxes to the extent that it distributes all of its net investment income and any realized capital gains.
For U.S. federal income tax purposes, the cost of securities owned, gross unrealized appreciation, gross unrealized depreciation, and net unrealized depreciation of investments at November 30, 2017, were as follows:
| | | | | | | | | | | | | | | | |
| | | Cost | | | Gross Unrealized
Appreciation | | | Gross Unrealized
Depreciation | | | Net Unrealized
Depreciation | |
The Fairholme Fund | | $ | 2,811,339,020 | | | | $138,590,040 | | | $ | (1,081,563,921 | ) | | $ | (942,973,881 | ) |
The Income Fund | | | 227,376,513 | | | | 6,107,301 | | | | (18,428,092 | ) | | | (12,320,791 | ) |
The Allocation Fund | | | 176,307,321 | | | | 11,844,303 | | | | (74,054,965 | ) | | | (62,210,662 | ) |
The difference between book basis and tax basis for The Fairholme Fund’s net unrealized depreciation is attributable to the tax deferral of losses on wash sales and capitalized cost. The difference between book basis and tax basis for The Income Fund’s and The Allocation Fund’s net unrealized depreciation is attributable to capitalized cost.
39
| | | | |
FAIRHOLME FUNDS, INC. | | | | |
| |
| |
NOTES TO FINANCIAL STATEMENTS (continued) | |
November 30, 2017 | |
| |
The Funds’ tax basis capital gains are determined only at the end of each fiscal year. As of November 30, 2017 the components of distributable earnings on a tax basis were as follows:
| | | | | | |
| | | The Fairholme Fund | | The Income Fund | | The Allocation Fund |
Undistributed Ordinary Income* | | $ 24,854,693 | | $ 2,277,296 | | $ 1,633,932 |
Capital Loss carryforwards | | (3,891,045) | | — | | (402,970) |
Net Long-Term Capital Gain | | — | | 9,090,843 | | — |
Net Unrealized Appreciation/(Depreciation) on Investments and Foreign Currency Related Transactions | | (942,973,881) | | (12,320,791) | | (62,210,663) |
Total | | $(922,010,233) | | $ (952,652) | | $(60,979,701) |
| * | Inclusive of short-term capital gain, if any. |
The Funds are permitted to carry forward for an unlimited period capital losses incurred to reduce future required distributions of net capital gains to shareholders. Capital losses that are carried forward will retain their character as either short term or long term capital losses. As of November 30, 2017, net long term capital loss carryforwards were as follows:
| | | | |
| | | The Fairholme Fund | | The Allocation Fund |
Long term capital loss carryforward | | $3,891,045 | | $402,970 |
The Manager has analyzed the Funds’ tax positions taken on tax returns for all open tax years (current and prior three tax years) and has concluded that there are no uncertain tax positions that require recognition of a tax liability. The Funds’ federal and state income and federal excise tax returns for tax years for which the applicable statutes of limitations have not expired (the current year and prior three years) are subject to examination by the Internal Revenue Service and state departments of revenue. Additionally, the Funds are not aware of any tax position for which it is reasonably possible that the total amounts of unrecognized tax benefits will change materially in the next twelve months.
Note 6. Dividends and Distributions to Shareholders
Ordinary income and capital gain distributions are determined in accordance with federal income tax regulations, which may differ from U.S. GAAP.
The tax character of dividends and distributions paid by each Fund were as follows:
| | | | | | | | | | | | | | | |
| | | The Fairholme Fund |
| | | For the
Fiscal Year Ended
November 30, 2017* | | | | For the
Fiscal Year Ended
November 30, 2016* |
Dividends and Distributions paid from: | | | | | | | | | | | | | | | |
Ordinary Income | | | $ | 54,441,970 | | | | | | | | | $ | 73,575,252 | |
Long-Term Capital Gain | | | | 150,461,057 | | | | | | | | | | 1,509,019,832 | |
| | | | | | | | | | | | | | | |
| | | $ | 204,903,027 | | | | | | | | | $ | 1,582,595,084 | |
| | | | | | | | | | | | | | | |
| * | Total distributions paid differs from the Statement of Changes in Net Assets due to the utilization of equalization. |
40
| | | | |
FAIRHOLME FUNDS, INC. | | | | |
| |
| |
NOTES TO FINANCIAL STATEMENTS (continued) | |
November 30, 2017 | |
| |
| | | | | | | | | | | | |
| | | The Income Fund |
| | | For the
Fiscal Year Ended
November 30, 2017* | | | | For the
Fiscal Year Ended
November 30, 2016 |
Dividends and Distributions paid from: | | | | | | | | | | | | |
Ordinary Income** | | | | $13,445,804 | | | | | | | $11,998,072 | |
Long-Term Capital Gain | | | | 1,401,141 | | | | | | | 1,134,811 | |
| | | | | | | | | | | | |
| | | | $14,846,945 | | | | | | | $13,132,883 | |
| | | | | | | | | | | | |
| | |
* | | Total distributions paid differs from the Statement of Changes in Net Assets due to the utilization of equalization. |
** | | Inclusive of short-term capital gains. |
| | | | | | | | | | | | |
| | | The Allocation Fund |
| | | For the
Fiscal Year Ended
November 30, 2017* | | | | For the
Fiscal Year Ended
November 30, 2016 |
Dividends and Distributions paid from: | | | | | | | | | | | | |
Ordinary Income** | | | | $ 9,301,676 | | | | | | | $14,439,971 | |
Long-Term Capital Gain | | | | 7,088,565 | | | | | | | 30,405,997 | |
| | | | | | | | | | | | |
| | | | $16,390,241 | | | | | | | $44,845,968 | |
| | | | | | | | | | | | |
| | |
* | | Total distributions paid differs from the Statement of Changes in Net Assets due to the utilization of equalization. |
** | | Inclusive of short-term capital gains. |
The Funds declared and made payable the following distribution on December 15, 2017.
| | | | | | | | | | | | | | | |
| | | The Fairholme Fund | | The Income Fund | | The Allocation Fund |
Dividends and Distributions paid from: | | | | | | | | | | | | | | | |
Ordinary Income | | | | $24,854,760 | | | | | $ 2,168,421 | | | | | $1,817,019 | |
Short-Term Capital Gain | | | | — | | | | | 1,108,368 | | | | | — | |
Long-Term Capital Gain | | | | — | | | | | 9,090,968 | | | | | — | |
| | | | | | | | | | | | | | | |
| | | | $24,854,760 | | | | | $12,367,757 | | | | | $1,817,019 | |
| | | | | | | | | | | | | | | |
Note 7. Reclassification in the Capital Accounts
In accordance with U.S. GAAP, the Fund has recorded reclassifications in their capital accounts. These reclassifications have no impact on the net asset value of the Fund and are designed generally to present undistributed income and realized gains on a tax basis which is considered to be more informative to the shareholder. Permanent differences were primarily due to the disallowance of certain non-tax deductible expenses for the Fund. As of November 30, 2017, the Fund recorded the following reclassifications to increase (decrease) the accounts listed below:
| | | | | | | | | | | | | | | |
| | | The Fairholme Fund | | The Income Fund | | The Allocation Fund |
Undistributed Net Investment Income | | | | $(2,761,907) | | | | | $(719,078) | | | | | $ (242,648) | |
Accumulated Net Realized Gain | | | | 2,650,135 | | | | | (624,605) | | | | | 5,852,287 | |
Paid-in-Capital | | | | 111,772 | | | | | 1,343,683 | | | | | (5,609,639) | |
41
| | | | |
FAIRHOLME FUNDS, INC. | | | | |
| |
| |
NOTES TO FINANCIAL STATEMENTS (continued) | |
November 30, 2017 | |
| |
Note 8. Transactions in Shares of Affiliates
Portfolio companies in which The Fairholme Fund owns 5% or more of the outstanding voting securities of the issuer are considered affiliates of The Fairholme Fund. The aggregate fair value of all securities of affiliates held in The Fairholme Fund as of November 30, 2017 amounted to $798,857,260, representing approximately 42.69% of The Fairholme Fund’s net assets.
Transactions in The Fairholme Fund during the year ended November 30, 2017, in which the issuer was an affiliate are as follows:
| | | | | | | | | | | | | | | | | | | | | | | | | | | | | | | | | | | | | | | | |
| | | November 30, 2016 | | Gross Additions | | Gross Deductions | | November 30, 2017 | | | | | | |
| | | Shares/
Par Value | | Shares/
Par Value | | Shares/
Par Value | | Shares/
Par Value | | Fair Value | | Realized
Gain (Loss) | | Investment
Income | | Change in
Unrealized
Appreciation/
Depreciation |
Imperial Metals Corp. | | | | 7,152,813 | | | | | — | | | | | 125,461 | | | | | 7,027,352 | | | | $ | 12,636,868 | | | | $ | (481,375) | | | | $ | — | | | | $ | (18,577,388) | |
Lands’ End, Inc.(a) | | | | 2,415,527 | | | | | — | | | | | 2,415,527 | | | | | — | | | | | — | | | | | — | | | | | — | | | | | — | |
Sears Holdings Corp. | | | | 14,497,773 | | | | | — | | | | | 961,782 | | | | | 13,535,991 | | | | | 53,467,164 | | | | | (67,258,674) | | | | | — | | | | | (55,306,846) | |
Sears Canada, Inc.(a) | | | | 10,075,672 | | | | | — | | | | | 10,075,672 | | | | | — | | | | | — | | | | | — | | | | | — | | | | | — | |
Seritage Growth Properties | | | | 2,084,600 | | | | | 140,000 | | | | | 39,020 | | | | | 2,185,580 | | | | | 88,953,106 | | | | | 69,842 | | | | | 2,189,600 | | | | | (14,445,561) | |
The St. Joe Co. | | | | 23,136,502 | | | | | — | | | | | 405,815 | | | | | 22,730,687 | | | | | 427,336,916 | | | | | 1,251,493 | | | | | — | | | | | (47,605,660) | |
Sears Roebuck Acceptance
Corp. 7.400% | | | | 15,405 | | | | | — | | | | | 271 | | | | | 15,134 | | | | | 144,378 | | | | | (1,837) | | | | | 28,499 | | | | | (25,145) | |
Sears Holdings Corp.,
Vested, Strike Price
$25.686, Expire
12/15/2019 | | | | 222,319 | | | | | — | | | | | 3,900 | | | | | 218,419 | | | | | 98,289 | | | | | (64,707) | | | | | — | | | | | (698,237) | |
Imperial Metals Corp.,
Expire 12/22/2017 | | | | — | | | | | 7,027,352 | | | | | 2,229,500 | | | | | 4,797,852 | | | | | 92,971 | | | | | 70,137 | | | | | — | | | | | 92,971 | |
Imperial Metals Corp.
7.000%, 03/15/2019 | | | $ | 156,780,000 | | | | $ | — | | | | $ | 13,557,000 | | | | $ | 143,223,000 | | | | | 134,271,563 | | | | | (981,985) | | | | | 13,282,897 | | | | | (3,892,717) | |
Sears Holdings Corp.
6.625%, 10/15/2018 | | | $ | 7,715,000 | | | | $ | — | | | | $ | 135,000 | | | | $ | 7,580,000 | | | | | 5,867,678 | | | | | 23,600 | | | | | 496,886 | | | | | (1,325,158) | |
Sears Holdings Corp.
8.000%, 12/15/2019 | | | $ | 143,408,000 | | | | $ | — | | | | $ | 2,515,000 | | | | $ | 140,893,000 | | | | | 73,137,556 | | | | | (1,141,284) | | | | | 11,148,895 | | | | | (57,321,223) | |
Sears Roebuck Acceptance
Corp. 6.875%,
10/15/2017(a) | | | $ | 823,000 | | | | $ | — | | | | $ | 823,000 | | | | $ | — | | | | | — | | | | | — | | | | | — | | | | | — | |
Sears Roebuck Acceptance
Corp. 7.500%,
10/15/2027 | | | $ | 6,886,000 | | | | $ | — | | | | $ | 121,000 | | | | $ | 6,765,000 | | | | | 2,850,771 | | | | | (40,034) | | | | | 599,041 | | | | | (1,035,206) | |
| | | | | | | | | | | | | | | | | | | | | | | | | | | | | | | | | | | | | | | | |
Total | | | | | | | | | | | | | | | | | | | | | | | $ | 798,857,260 | | | | $ | (68,554,824) | | | | $ | 27,745,818 | | | | $ | (200,140,170) | |
| | | | | | | | | | | | | | | | | | | | | | | | | | | | | | | | | | | | | | | | |
| (a) | Security is no longer held in the portfolio at November 30, 2017. |
Note 9. Indemnifications
Under the Company’s organizational documents, its Officers and Directors are indemnified against certain liabilities arising out of the performance of their duties to the Funds. In the normal course of business the Company or the Funds enter into contracts that contain a variety of representations and customary indemnifications. The Funds’ maximum exposure under these arrangements is unknown as this would involve future claims that may be made against the Funds that have not yet occurred. However, based on their experience to date, the Funds expect the risk of loss to be remote.
42
| | | | |
| | | | |
| |
| |
REPORT OF INDEPENDENT REGISTERED PUBLIC ACCOUNTING FIRM | |
| |
To the Board of Directors of Fairholme Funds, Inc. and Shareholders of The Fairholme Fund, The Fairholme Focused Income Fund, and The Fairholme Allocation Fund:
We have audited the accompanying statements of assets and liabilities, including the schedules of investments, of The Fairholme Fund, The Fairholme Focused Income Fund, and The Fairholme Allocation Fund, each a series comprising Fairholme Funds, Inc. (the “Funds”) as of November 30, 2017, and the related statements of operations for the year then ended, the statements of changes in net assets for each of the two years in the period then ended, and the financial highlights for each of the five years in the period then ended. These financial statements and financial highlights are the responsibility of the Funds’ management. Our responsibility is to express an opinion on these financial statements and financial highlights based on our audits.
We conducted our audits in accordance with the standards of the Public Company Accounting Oversight Board (United States). Those standards require that we plan and perform the audit to obtain reasonable assurance about whether the financial statements and financial highlights are free of material misstatement. The Funds are not required to have, nor were we engaged to perform, an audit of their internal control over financial reporting. Our audits included consideration of internal control over financial reporting as a basis for designing audit procedures that are appropriate in the circumstances, but not for the purpose of expressing an opinion on the effectiveness of the Funds’ internal control over financial reporting. Accordingly, we express no such opinion. An audit also includes examining, on a test basis, evidence supporting the amounts and disclosures in the financial statements, assessing the accounting principles used and significant estimates made by management, as well as evaluating the overall financial statement presentation. Our procedures included confirmation of securities owned as of November 30, 2017, by correspondence with the custodians and brokers. We believe that our audits provide a reasonable basis for our opinion.
In our opinion, such financial statements and financial highlights referred to above present fairly, in all material respects, the financial position of The Fairholme Fund, The Fairholme Focused Income Fund, and The Fairholme Allocation Fund as of November 30, 2017, the results of their operations for the year then ended, the changes in their net assets for each of the two years in the period then ended, and the financial highlights for each of the five years in the period then ended, in conformity with accounting principles generally accepted in the United States of America.
DELOITTE & TOUCHE LLP
Philadelphia, Pennsylvania
January 29, 2018
43
| | | | |
FAIRHOLME FUNDS, INC. | | | | |
| |
| |
ADDITIONAL INFORMATION | |
November 30, 2017 | |
| |
Board of Directors (unaudited)
The Board of Directors has overall responsibility for conduct of the Company’s affairs. The day-to-day operations of the Fund are managed by the Manager, subject to the By-Laws of the Company and review by the Company’s Board. The Directors and Officers of the Company, including those Directors who are also officers, are listed below.
| | | | | | | | | | | | | | | | | | | | | | | | |
Name, Age & Address† | | | | Position(s) Held, Term of Office & Length of Time
Served** | | | | Principal Occupation(s) During Past 5 Years§ | | | | | Number of
Portfolios in
Fund Complex
Overseen by
Director | | | | | | Other Current Directorships Held by Director | | |
Interested Directors and Officers | | | | | | | | | | | | | | | | | | | | |
Bruce R. Berkowitz* Age 59 | | | | Mr. Berkowitz has served as a Director of the Company since December 15, 1999. | | | | Manager, Fairholme Holdings LLC since January 2015 and Chief Investment Officer, Fairholme Capital Management, L.L.C. since October 1997; Managing Member, Fairholme Capital Management, L.L.C. from October 1997 to December 2014. | | | | | | | 3 | | | | | | | Director and Chairman of the Board of Directors, The St. Joe Co., and Director, Sears Holdings Corporation (until October 2017) | | |
Cesar L. Alvarez,
Esq.* Age 70 | | | | Mr. Alvarez has served as a Director of the Company since May 19, 2008. | | | | Senior Chairman of Greenberg Traurig, LLP effective January 1, 2016; Executive Chairman and Co-Chairman from 2010 to 2015; and Chief Executive Officer from 1997 to 2010. | | | | | | | 3 | | | | | | | Chairman, Board of Directors, Mednax, Inc.; Director, Intrexon Corp.; Director, The St. Joe Co.; Director, Watsco, Inc.; and Director, Sears Holdings Corporation (until May 2017) | | |
Howard S. Frank* Age 76 | | | | Mr. Frank has served as a Director of the Company since May 7, 2007. | | | | Chairman of the Board of Costa Crociere S.p.A. since 2014; Special Advisor to the CEO and to the Chairman of Carnival Corporation & plc. since 2013; Vice Chairman, Chief Operating Officer and Director, Carnival Corporation & plc. 1989 to 2013 | | | | | | | 3 | | | | | | | Director, New World Symphony; and Director, The St. Joe Co. | | |
Independent Directors^ | | |
Terry L. Baxter Age 72 | | | | Mr. Baxter has served as a Director of the Company since May 19, 2008. | | | | Chairman of the Board, CEO, Source One (retired); President of White Mountain Holdings (retired). | | | | | | | 3 | | | | | | | Director, Main Street America Group | | |
Steven J. Gilbert Age 70 | | | | Mr. Gilbert has served as a Director of the Company since June 16, 2014 | | | | Chairman, Gilbert Global Equity Partners, L.P. since 1998; Vice Chairman, MidOcean Equity Partners, L.P. since 2005; Co-Chairman, Birch Grove Capital since 2013; Senior Managing Director and Chairman, Sun Group (USA) from 2007 to 2009. | | | | | | | 3 | | | | | | | Chairman, CPM Holdings, Inc.; Lead Independent Director, Empire State Realty Trust; Lead Independent Director, TRI Pointe Homes, Inc.; Director, Waterpik, Inc.; Director, Oaktree Capital Group; Director, MBIA, Inc.; and Director, Trade Informatics, Inc. (until March 2016) | | |
Avivith Oppenheim,
Esq. Age 67 | | | | Ms. Oppenheim has served as a Director of the Company since December 15, 1999. | | | | Attorney-at-Law. | | | | | | | 3 | | | | | | | None. | | |
Leigh Walters, Esq. Age 71 | | | | Mr. Walters has served as a Director of the Company since December 15, 1999. | | | | Vice-President and Director, Valcor Engineering Corporation. Attorney-at-Law. | | | | | | | 3 | | | | | | | Director, Valcor Engineering Corporation | | |
| | |
† | | Unless otherwise indicated, the address of each Director of the Company is c/o Fairholme Capital Management, L.L.C., 4400 Biscayne Blvd., 9th Floor, Miami, FL 33137. |
^ | | Directors who are not “interested persons” of the Company as defined under the 1940 Act (“Independent Directors”). |
* | | Each of Mr. Berkowitz and Mr. Alvarez is an interested person of the Company, (“Interested Director”), as defined in the 1940 Act, because of his affiliation with the Manager. Effective May 25, 2017, Mr. Frank is deemed to be an Interested Director because of his material relationship with a Portfolio Company of which a Fund currently has “control” as defined by the 1940 Act. |
** | | Each Director serves for an indefinite term. Each officer serves for an annual term and until his or her successor is elected and qualified. |
§ | | The information reported includes the principal occupation during the last five years for each Director and other information relating to the professional experiences, attributes and skills relevant to each Director’s qualifications to serve as Director. |
44
| | | | |
FAIRHOLME FUNDS, INC. | | | | |
| |
| |
ADDITIONAL INFORMATION (continued) | |
November 30, 2017 | |
| |
Officers (unaudited)
| | | | | | |
Name, Age & Address† | | Position(s) Held with the Company | | Term of Office & Length of Time Served* | | Principal Occupation(s) During Past 5 Years |
Fernando Font Age 43 | | Vice President | | Mr. Font has served as Vice President of the Company since June 2015. | | Chief Administrative Officer of Fairholme Capital Management, L.L.C. since August 2009. |
Wayne Kellner Age 48 | | Treasurer | | Mr. Kellner has served as Treasurer of the Company since March 2012. | | President, Fairholme Holdings L.L.C since January 2017; Chief Operating Officer, Fairholme Capital Management, L.L.C. since June 2014; and Chief Financial Officer, Fairholme Capital Management, L.L.C. since January 2012. |
Paul R. Thomson Age 61 | | Chief Compliance Officer and Secretary | | Mr. Thomson has served as Chief Compliance Officer of the Company since April 2010 and has served as Secretary of the Company since June 2011. | �� | Chief Compliance Officer, Fairholme Capital Management L.L.C. since April 2010; Chief Financial Officer, Fairholme Capital Management L.L.C. from January 2008 to January 2012. |
| | † | Unless otherwise indicated, the address of each Officer of the Company is c/o Fairholme Capital Management, L.L.C., 4400 Biscayne Blvd., 9th Floor, Miami, FL 33137. |
| | * | Each officer serves for an annual term and until his or her successor is elected and qualified. |
45
| | | | |
FAIRHOLME FUNDS, INC. | | | | |
| |
| |
ADDITIONAL INFORMATION (continued) | |
November 30, 2017 | |
| |
Approval of Investment Management Agreement (unaudited)
At its meeting on October 31, 2017, the Board of Directors (the “Board” or the “Directors”) of Fairholme Funds, Inc. (the “Company”) approved the renewal of each of the investment management agreements (each an “Agreement” and collectively, the “Agreements”) between the Company, on behalf of each of The Fairholme Fund (“The Fairholme Fund”), The Fairholme Focused Income Fund (“The Income Fund”) and The Fairholme Allocation Fund (“The Allocation Fund”) (each a “Fund” and collectively, the “Funds”), and Fairholme Capital Management, L.L.C. (the “Manager”). In considering whether to approve the renewal of the Agreements, the Directors considered the factors discussed below, and information made available to them at the meeting relating to such factors, and other information the Directors deemed relevant. The Directors’ approval of the renewal of the Agreements was not, however, based on any single factor, but on an evaluation of the totality of factors and information they reviewed and evaluated.
A. Nature, Extent and Quality of Services
The Directors considered information provided to them concerning the services performed by the Manager for each Fund pursuant to the respective Agreement. The Directors reviewed information concerning the nature, extent and quality of investment advisory and operational services provided, or overseen, by the Manager, including in connection with the Manager’s research and compliance services personnel. The Directors reviewed information concerning the personnel responsible for the day-to-day portfolio and administrative management of each Fund, the overall reputation of the Manager and the Manager’s current and planned staffing levels. The Directors considered the Manager’s commitment to each Fund as evidenced by, among other things, the current share ownership of each Fund by management/owners/employees of the Manager. The Directors considered information describing the Manager’s compliance policies and procedures, including its ongoing reviews of and updates to those policies. They also discussed the Manager’s ongoing reviews of policies designed to address each Fund’s compliance with its investment objective, policies and restrictions, applicable regulatory requirements and potential conflicts of interest relating to the Manager’s providing services to the Funds and other advisory clients.
The Directors did not compare services provided by the Manager to each Fund with the services provided by the Manager to its other advisory accounts because such accounts are not subject to the same regulatory requirements as the Funds, may have different investment restrictions, holdings and goals than the Funds and require different levels of client and back-office servicing than the Funds.
The Directors concluded that the nature, extent and quality of services provided by the Manager to each Fund were appropriate and sufficient to support renewal of the Agreements.
B. Investment Performance
The Directors considered information regarding each Fund’s performance and the Manager’s views on performance. The Directors also considered the holdings of each Fund that contributed negatively and positively to such Fund’s performance, and the Manager’s views of the investment rationale and outlook for the Funds’ holdings. They also discussed the Manager’s long-term investment approach generally, noting that the Funds’ holdings, and the Manager’s management of the Funds’ portfolios, were consistent with disclosures in each Fund’s prospectus.
The Fairholme Fund
The Directors considered information about the short- and long-term investment performance of The Fairholme Fund, including information comparing The Fairholme Fund’s cumulative and annualized performance with the comparable performance of the S&P 500 Index, for the 1-year, 3-year, 5-year, 10-year and since-inception periods ended August 31, 2017. The Directors also reviewed and considered a third-party report (from Lipper/Broadridge (“Lipper”)) comparing The Fairholme Fund’s annualized performance with the annualized performance of similarly situated mutual funds for the 1-year, 3-year, 5-year, 10-year and since inception periods ended August 31, 2017. They noted The Fairholme Fund’s annualized performance lagged (a) both the average and median annualized performance of the Lipper peer group, and (b) the performance of the S&P 500 Index, for all the applicable periods, except for the period since inception through August 31, 2017.
46
| | | | |
FAIRHOLME FUNDS, INC. | | | | |
| |
| |
ADDITIONAL INFORMATION (continued) | |
November 30, 2017 | |
| |
The Income Fund
The Directors considered information about the investment performance of The Income Fund, including information comparing The Income Fund’s performance to that of the Bloomberg Barclays Capital U.S. Aggregate Bond Index (the “Bloomberg Barclays Bond Index”), its benchmark, for the 1-year, 3-year, 5-year and since inception periods ended August 31, 2017. The Directors also reviewed information reflecting The Income Fund’s performance relative to its Lipper peer group’s average and median annualized performance for the same periods. The Directors noted The Income Fund’s annualized performance exceeded both (a) the average and median annualized performance of its Lipper peer group, and (b) the performance of the Bloomberg Barclays Bond Index for all the applicable periods ended August 31, 2017.
The Allocation Fund
The Directors considered information about the investment performance of The Allocation Fund, including information reflecting the performance of The Allocation Fund relative to the annualized performance of both the Bloomberg Barclays Bond Index and the S&P 500 Index for the 1-year, 3-year, 5-year and since inception periods ended August 31, 2017. The Directors also reviewed information reflecting The Allocation Fund’s annualized performance relative to its Lipper peer group’s average and median annualized performance for the same periods. The Directors noted The Allocation Fund’s annualized performance lagged both the average and median annualized performance of the peer group for all the applicable periods ended August 31, 2017. It was also noted that The Allocation Fund’s annualized performance lagged the performance of both the S&P 500 Index and Bloomberg Barclays Bond Index for all the applicable periods ended August 31, 2017, with the exception of the Bloomberg Barclays Bond Index for the 5-year and since inception periods.
As to each Fund, the Directors considered information provided to them concerning the performance of the Fund in light of market events and other factors affecting the Fund’s performance, and information about developments with respect to specific issuers of securities held in the Fund’s portfolio. They also considered information about each Fund’s total returns. In so doing, the Board acknowledged the disciplined, long term value-investing strategy employed by the Manager in advising the Funds.
C. Management Fees and Expense Ratios
The Directors considered information about each Fund’s management fee and expense ratio, including information in the Lipper report comparing each Fund’s management fee and most recent total expense ratio to the advisory fees and expense ratios of other similarly situated mutual funds.
In evaluating the management fee and expense ratio information, the Directors took into account the demands and complexity of portfolio management for each Fund in light of its investment objective, strategies, and asset size. The Directors also considered information regarding the Manager’s payment (in some cases from its resources) of certain expenses for the benefit of each Fund, including shareholder account-level expenses associated with certain omnibus accounts. The Directors also reviewed information concerning the fees paid to the Manager by its other advisory accounts.
The Directors also considered the Manager’s voluntary undertaking to waive a portion of its investment management fee and the terms of that undertaking. Based on all these facts, the Directors concluded that each Fund’s management fee and overall expense ratio are reasonable in light of the services provided by or through the Manager.
D. Profitability
The Directors considered information regarding the estimated profitability of each Fund to the Manager. They considered such profitability in light of each Fund’s assets under management, overall expense ratio, performance and the services provided by or through the Manager, and concluded that the Manager’s estimated profitability was not such as to prevent Directors from approving the renewal of each Agreement.
47
| | | | |
FAIRHOLME FUNDS, INC. | | | | |
| |
| |
ADDITIONAL INFORMATION (continued) | |
November 30, 2017 | |
| |
E. Economies of Scale
The Directors considered information concerning economies of scale for each Fund, including the current assets of each Fund. The Directors concluded for each Fund that no modification to the Fund’s existing arrangements was warranted based on economies of scale.
The Directors, including a majority of the Directors who are not parties to any of the Agreements or interested persons of any such party, concluded, based on their consideration of the foregoing and their evaluation of all of the information they reviewed, that the renewal of the Agreements was in the best interest of the Funds and their shareholders. The Directors noted that their decision was based on an evaluation of the totality of factors and information presented or available to them, and not on any one factor, report, representation or response.
Proxy Voting Policies, Procedures and Records (unaudited)
The Company has adopted policies and procedures that provide guidance and set forth parameters for the voting of proxies relating to securities held in each Fund’s portfolio. A description of these policies and procedures, and records of how each Fund voted proxies relating to their portfolio securities during the most recent twelve month period ended June 30, 2017, are available to you upon request and free of charge by writing to the Fairholme Funds, Inc., c/o BNY Mellon Investment Servicing (US) Inc., P.O. Box 9692, Providence, RI, 02940 or by calling Shareholder Services at (866) 202-2263. They may also be obtained by visiting the Securities and Exchange Commission (“SEC”) website at www.sec.gov. The Company shall respond to all shareholder requests for records within three business days of its receipt of such request by first-class mail or other means designed to ensure prompt delivery.
N-Q Filing (unaudited)
The Company files a complete schedule of the Fund’s portfolio holdings on Form N-Q for the fiscal quarters ending February 28 (February 29 during leap year) and August 31. The Form N-Q filing must be made within 60 days of the end of the quarter. The Forms N-Q relating to the Fund’s portfolio investments are available on the SEC’s website at www.sec.gov, or may be reviewed and copied at the SEC’s Public Reference Room in Washington, DC (call 1-800-732-0330 for information on the operation of the Public Reference Room).
Shareholder Tax Information (unaudited)
The Fairholme Fund, The Income Fund, and The Allocation Fund reported $204,903,027, $14,846,945, and $16,390,241 of total distributions paid during the fiscal year ended November 30, 2017, and $150,461,057, $1,401,141, and $7,088,565 of that represented long-term capital gain distributions, respectively.
The information below is reported for the Funds’ fiscal year and not calendar year. Therefore, shareholders should refer to their Form 1099-DIV or other tax information which will be mailed in 2018 to determine the calendar year amounts to be included on their 2017 tax returns. Shareholders should consult their own tax advisors.
48
| | | | |
FAIRHOLME FUNDS, INC. | | | | |
| |
| |
ADDITIONAL INFORMATION (continued) | |
November 30, 2017 | |
| |
Please note that, for the fiscal year ended November 30, 2017, the respective percentages of ordinary income distributions paid by the Fund were reported as follows:
| | | | | | | | | | | | | | | |
Distribution Period November 30, 2017 | | The Fairholme Fund | | The Income Fund | | The Allocation Fund |
Qualified Dividend Income for Individuals | | | | 8.92 | % | | | | 15.95 | % | | | | 17.64 | % |
Dividends Qualifying for the Dividends | | | | | | | | | | | | | | | |
Received Deduction for Corporations | | | | 6.60 | % | | | | 15.94 | % | | | | 17.04 | % |
Qualifying Interest Income | | | | 56.42 | % | | | | 58.02 | % | | | | 85.38 | % |
Qualifying Short-term Gain | | | | 0.00 | % | | | | 100.00 | % | | | | 100.00 | % |
U.S. Treasury Securities | | | | 0.39 | % | | | | 0.23 | % | | | | 0.23 | % |
* The law varies in each state as to whether and what percentage of dividend income attributable to U.S. Treasury securities is exempt from state and local income tax. It is recommended that you consult your tax advisor to determine if any portion of the dividends you received is exempt from income taxes.
All information reported is based on financial information available as of the date of this annual report and, accordingly, are subject to change. For each item, it is the intention of the Fund to report the maximum amount permitted under the Internal Revenue Code and the regulations thereunder.
49

| | |
Officers of Fairholme Funds, Inc. BRUCE R. BERKOWITZ President FERNANDO M. FONT Vice President WAYNE KELLNER Treasurer PAUL R. THOMSON Chief Compliance Officer & Secretary Board of Directors of Fairholme Funds, Inc. CESAR L. ALVAREZ, Esq. TERRY L. BAXTER BRUCE R. BERKOWITZ HOWARD S. FRANK STEVEN J. GILBERT, Esq. AVIVITH OPPENHEIM, Esq. LEIGH WALTERS, Esq. Investment Manager FAIRHOLME CAPITAL MANAGEMENT, L.L.C. 4400 Biscayne Boulevard, Miami, FL 33137 Transfer Agent BNY MELLON INVESTMENT SERVICING (US) INC. 760 Moore Road, King of Prussia, PA 19406 Fund Accountant & Administrator THE BANK OF NEW YORK MELLON 760 Moore Road, King of Prussia, PA 19406 Custodian THE BANK OF NEW YORK MELLON 225 Liberty Street, New York, NY 10286 Independent Registered Public Accounting Firm DELOITTE & TOUCHE LLP 1700 Market Street, Philadelphia, PA 19103 Legal Counsel SEWARD & KISSEL LLP 901 K Street NW, Washington, DC 20001 | | |
THIS REPORT IS PROVIDED FOR THE GENERAL INFORMATION OF THE SHAREHOLDERS OF FAIRHOLME FUNDS, INC. IT IS NOT INTENDED FOR DISTRIBUTION TO PROSPECTIVE INVESTORS IN THE FUNDS UNLESS PRECEDED OR ACCOMPANIED BY AN EFFECTIVE PROSPECTUS, WHICH CONTAINS MORE INFORMATION ON FEES, CHARGES AND OTHER EXPENSES AND SHOULD BE READ CAREFULLY BEFORE INVESTING OR SENDING MONEY. PAST PERFORMANCE IS NOT A GUARANTEE OF FUTURE RESULTS. SHARES OF THE FUNDS ARE DISTRIBUTED BY FAIRHOLME DISTRIBUTORS, LLC.
| | (a) | The registrant, as of the end of the period covered by this report, has adopted a code of ethics that applies to the registrant’s principal executive officer, principal financial officer, principal accounting officer or controller, or persons performing similar functions, regardless of whether these individuals are employed by the registrant or a third party. |
| | (d) | The registrant has not granted any waivers, during the period covered by this report, including an implicit waiver, from a provision of the code of ethics that applies to the registrant’s principal executive officer, principal financial officer, principal accounting officer or controller, or persons performing similar functions, regardless of whether these individuals are employed by the registrant or a third party, that relates to one or more of the items set forth in paragraph (b) of this Item. |
| Item 3. | Audit Committee Financial Expert. |
The registrant’s board of directors has determined that the registrant has at least one audit committee financial expert serving on its audit committee. Steven Gilbert is the “audit committee financial expert” and is considered to be “independent” as each term is defined in Item 3 of Form N-CSR.
| Item 4. | Principal Accountant Fees and Services. |
Audit Fees
| | (a) | The aggregate fees billed for each of the last two fiscal years for professional services rendered by the principal accountant for the audits of the annual financial statements of each series of the registrant or services that are normally provided by the accountant in connection with statutory and regulatory filings or engagements for those fiscal years were $125,000 in 2016 and $125,000 in 2017. |
Audit-Related Fees
| | (b) | The aggregate fees billed in each of the last two fiscal years for assurance and related services by the principal accountant that are reasonably related to the performance of the audits of the financial statements of each series of the registrant and are not reported under paragraph (a) of this Item were $0 in 2016 and $0 in 2017. |
Tax Fees
| | (c) | The aggregate fees billed in each of the last two fiscal years for professional services rendered by the principal accountant for tax compliance, tax advice, and tax planning were $39,600 in 2016 and $41,580 in 2017. [These fees relate to the preparation and review of the various tax forms of each series of the registrant and also for the review of the dividend and distributions of each series of the registrant.] |
All Other Fees
| | (d) | The aggregate fees billed in each of the last two fiscal years for products and services provided by the principal accountant, other than the services reported in paragraphs (a) through (c) of this Item were $0 in 2016 and $0 in 2017. |
| | (e)(1) | Disclose the audit committee’s pre-approval policies and procedures described in paragraph (c)(7) of Rule 2-01 of Regulation S-X. |
The audit committee has adopted policies and procedures that require the pre-approval by the audit committee of all audit and non-audit services to the registrant by the registrant’s principal accountant, including services provided to any entity affiliated with the registrant to the extent that such services are directly related to the operations or financial reporting of the registrant.
| | (e)(2) | The percentage of services described in each of paragraphs (b) through (d) of this Item that were approved by the audit committee pursuant to paragraph (c)(7)(i)(C) of Rule 2-01 of Regulation S-X are as follows: |
(b) 100%
(c) 100%
(d) Not Applicable
| | (g) | The aggregate non-audit fees billed by the registrant’s accountant for services rendered to the registrant, and rendered to the registrant’s investment adviser, and any entity controlling, controlled by, or under common control with the adviser that provides ongoing services to the registrant for each of the last two fiscal years of the registrant were $0 in 2016 and $0 in 2017. |
| Item 5. | Audit Committee of Listed Registrants. |
Not applicable.
| (a) | Schedule of investments in securities of unaffiliated issuers as of the close of the reporting period is included as part of the report to shareholders filed under Item 1 of this Form. |
| Item 7. | Disclosure of Proxy Voting Policies and Procedures for Closed-End Management Investment Companies. |
Not applicable.
| Item 8. | Portfolio Managers of Closed-End Management Investment Companies. |
Not applicable.
| Item 9. | Purchases of Equity Securities by Closed-End Management Investment Company and Affiliated Purchasers. |
Not applicable.
| Item 10. | Submission of Matters to a Vote of Security Holders. |
There have been no material changes to the procedures by which the shareholders may recommend nominees to the registrant’s board of directors, where those changes were implemented after the registrant last provided disclosure in response to the requirements of Item 407(c)(2)(iv) of Regulation S-K (17 CFR 229.407) (as required by Item 22(b)(15) of Schedule 14A (17 CFR 240.14a-101)), or this Item.
| Item 11. | Controls and Procedures. |
| | (a) | The registrant’s principal executive and principal financial officers, or persons performing similar functions, have concluded that the registrant’s disclosure controls and procedures (as defined in Rule 30a-3(c) under the Investment Company Act of 1940, as amended (the “1940 Act”) (17 CFR 270.30a-3(c))) are effective, as of a date within 90 days of the filing date of the report that includes the disclosure required by this paragraph, based on the evaluation of these controls and procedures required by Rule 30a-3(b) under the 1940 Act (17 CFR 270.30a-3(b)) and Rules 13a-15(b) or 15d-15(b) under the Securities Exchange Act of 1934, as amended (17 CFR 240.13a-15(b) or 240.15d-15(b)). |
| | (b) | There were no changes in the registrant’s internal control over financial reporting (as defined in Rule 30a-3(d) under the 1940 Act (17 CFR 270.30a-3(d))) that occurred during the registrant’s last fiscal quarter that has materially affected, or is reasonably likely to materially affect, the registrant’s internal control over financial reporting. |
| Item 12. | Disclosure of Securities Lending Activities for Closed-End Management Investment Companies. |
Not applicable.
| | (a)(1) | Code of ethics that is the subject of disclosure required by Item 2 is attached hereto as Exhibit (a)(1). |
| | (a)(2) | Certifications pursuant to Rule 30a-2(a) under the 1940 Act and Section 302 of the Sarbanes-Oxley Act of 2002 are attached hereto as Exhibits (a)(2)(i) and (a)(2)(ii). |
| | (b) | Certifications pursuant to Rule 30a-2(b) under the 1940 Act and Section 906 of the Sarbanes- Oxley Act of 2002 are attached hereto as Exhibit (b). |
SIGNATURES
Pursuant to the requirements of the Securities Exchange Act of 1934 and the Investment Company Act of 1940, the registrant has duly caused this report to be signed on its behalf by the undersigned, thereunto duly authorized.
| | |
(Registrant) Fairholme Funds, Inc. |
|
By (Signature and Title)* /s/ Bruce R. Berkowitz |
| | Bruce R. Berkowitz, President |
| | (principal executive officer) |
|
Date 01/29/2018 |
Pursuant to the requirements of the Securities Exchange Act of 1934 and the Investment Company Act of 1940, this report has been signed below by the following persons on behalf of the registrant and in the capacities and on the dates indicated.
| | |
|
By (Signature and Title)* /s/ Bruce R. Berkowitz |
| | Bruce R. Berkowitz, President |
| | (principal executive officer) |
|
Date 01/29/2018 |
|
By (Signature and Title)* /s/ Wayne Kellner |
| | Wayne Kellner, Treasurer |
| | (principal financial officer) |
|
Date 01/29/2018 |
* Print the name and title of each signing officer under his or her signature.