UNITED STATES
SECURITIES AND EXCHANGE COMMISSION
Washington, D.C. 20549
FORM N-CSR
CERTIFIED SHAREHOLDER REPORT OF REGISTERED
MANAGEMENT INVESTMENT COMPANIES
Investment Company Act file number | 811-9631 |
|
Cohen & Steers Institutional Realty Shares, Inc. |
(Exact name of registrant as specified in charter) |
|
280 Park Avenue, New York, NY | | 10017 |
(Address of principal executive offices) | | (Zip code) |
|
Adam M. Derechin Cohen & Steers Capital Management, Inc. 280 Park Avenue New York, New York 10017 |
(Name and address of agent for service) |
|
Registrant’s telephone number, including area code: | (212) 832-3232 | |
|
Date of fiscal year end: | December 31 | |
|
Date of reporting period: | June 30, 2011 | |
| | | | | | | | |
Item 1. Reports to Stockholders.
COHEN & STEERS INSTITUTIONAL REALTY SHARES, INC.
To Our Shareholders:
We would like to share with you our report for the six months ended June 30, 2011. The net asset value (NAV) at that date was $41.79 per share.
The total returns, including income and change in NAV, for the Fund and its comparative benchmarks were:
| | | Six Months Ended
June 30, 2011 | |
| Cohen & Steers Institutional Realty Shares | | | 10.93 | % | |
| FTSE NAREIT Equity REIT Indexa | | | 10.20 | % | |
| S&P 500 Indexa | | | 6.02 | % | |
The performance data quoted represent past performance. Past performance is no guarantee of future results. The investment return and the principal value of an investment will fluctuate and shares, if redeemed, may be worth more or less than their original cost. Current performance may be lower or higher than the performance data quoted. Current total returns of the Fund can be obtained by visiting our Web site at cohenandsteers.com.
Please note that distributions paid by the Fund to shareholders are subject to recharacterization for tax purposes and are taxable up to the amount of the Fund's investment company taxable income and net realized gains. Distributions in excess of the Fund's investment company taxable income and realized gains are a return of capital distributed from the Fund's assets.
Investment Review
For the six-month period ended June 30, 2011, U.S. real estate securities had good performance in absolute terms as well as relative to the broader equity market. REITs benefited from a steady improvement in real estate fundamentals, low and declining capital costs and an increasing number of transactions that revealed rising property values.
However, REITs, along with financial markets in general, faced frequent volatility resulting from natural disasters and economic uncertainty. Stocks came under pressure in March following the earthquake in Japan, and
a The FTSE NAREIT Equity REIT Index is an unmanaged, market-capitalization-weighted index of all publicly traded REITs that invest predominantly in the equity ownership of real estate. The index is designed to reflect the performance of all publicly traded equity REITs as a whole. The S&P 500 Index is an unmanaged index of common stocks that is frequently used as a general measure of stock market performance.
1
COHEN & STEERS INSTITUTIONAL REALTY SHARES, INC.
then again in June amid renewed fears of a Greek default and disappointing U.S. economic reports. The period ended on a positive note on news of passage of an austerity plan by Greece's parliament and encouraging U.S. manufacturing data.
Regional malls paced the rally
Nearly all property sectors had gains, led by regional mall owners (+15.8% total returnb within the index). The sector's strong showing reflected stabilizing retail sales and continued investor interest in acquiring regional malls that the Westfield Group was marketing for sale. Mall owners have also benefited from the improved operating earnings of large department store chains. Mall-based department stores such as Macy's had been losing market share to discounters and online retailers for many years, but during the period, they reported their best sales growth in decades.
The apartment sector (+14.1%) outperformed amid increased demand, strong pricing power and very low new supply. Occupancies have been supported by positive demographics and fewer people having the confidence to purchase single-family homes.
Office companies (+12.5%) performed well as a group, but results varied widely. Those located in urban areas tended to benefit from improving leasing trends and rising global investment demand for office assets located in major cities. Office operators with suburban properties continued to face challenging fundamentals.
Industrial REITs (+11.0%) had a strong first quarter amid improving fundamentals and a merger announcement between ProLogis and AMB Property, but later retreated on concerns of slowing global demand. In June, ProLogis had a $1 billion secondary stock offering to shore up its balance sheet, which became more constrained when the company consolidated the ownership of the majority of the separately-listed ProLogis European Properties it did not already own.
The health care sector (+6.0%) underperformed on relatively high valuations and uncertainty surrounding various Medicare budget proposals. Hotels (–2.4%) struggled amid high oil prices and concerns regarding the durability of global economic growth.
Fund performance
The Fund had a positive total return and outperformed its benchmark in the period. Stock selection in the office, health care and regional mall sectors significantly contributed to relative performance. Within offices, we stayed focused on urban properties located in areas with above-average employment growth. Our underweights in industrial and health care property companies also aided returns, as did our overweight in regional mall owners. Stock selection in the hotel and apartment sectors detracted from performance.
b Sector returns as measured by the FTSE NAREIT Equity REIT Index.
2
COHEN & STEERS INSTITUTIONAL REALTY SHARES, INC.
Investment Outlook
We have modified our estimates for 2011 GDP growth and employment gains very modestly downward, but we expect the economy to remain on an expansionary path. Heading into the second half of the year, we expect to see some normalization as Japan recovers from its recent disaster and as U.S. home prices begin to stabilize.
REITs had traded at a premium to net asset value through much of the six-month period, but ended June trading close to NAV, on average, partly reflecting a trend of rising NAVs due to higher property values revealed by increased transaction activity.
We favor economically sensitive sectors, including hotels, regional malls and high-growth urban offices protected from new supply. Among regional mall companies, we are focused on geographic locations with attractive income profiles that can better withstand inflation in food and gas prices. We are cautious toward health care property stocks based, in part, on their high premiums to net asset value and persistent and likely secular threats to Medicare reimbursement rates.
3
COHEN & STEERS INSTITUTIONAL REALTY SHARES, INC.
Sincerely,
 | |  | |
|
| MARTIN COHEN | | ROBERT H. STEERS | |
|
| Co-chairman | | Co-chairman | |
|
 | |  | |
|
| JOSEPH M. HARVEY | | JON CHEIGH | |
|
| Portfolio Manager | | Portfolio Manager | |
|
The views and opinions in the preceding commentary are subject to change. There is no guarantee that any market forecast set forth in the commentary will be realized. This material represents an assessment of the market environment at a specific point in time, should not be relied upon as investment advice and is not intended to predict or depict performance of any investment.
Visit Cohen & Steers online at cohenandsteers.com
For more information about any of our funds, visit cohenandsteers.com, where you will find daily net asset values, fund fact sheets and portfolio highlights. You can also access newsletters, education tools and market updates covering the global real estate, listed infrastructure, utilities, large cap value and preferred securities sectors.
In addition, our Web site contains comprehensive information about our firm, including our most recent press releases, profiles of our senior investment professionals and an overview of our investment approach.
4
COHEN & STEERS INSTITUTIONAL REALTY SHARES, INC.
Performance Review (Unaudited)
Average Annual Total Returns—For Periods Ended June 30, 2011
| | | 1 Year | | 5 Years | | 10 Years | | Since Inceptiona | |
| Fund | | | 35.38 | % | | | 3.70 | % | | | 11.91 | % | | | 13.63 | % | |
The performance data quoted represent past performance. Past performance is no guarantee of future results. The investment return and principal value of an investment will fluctuate and shares, if redeemed, may be worth more or less than their original cost. Current performance may be lower or higher than the performance data quoted. Performance information current to the most recent month-end can be obtained by visiting our Web site at cohenandsteers.com. The performance table does not reflect the deduction of taxes that a shareholder would pay on Fund distributions or the redemption of Fund shares. During the periods presented above, the manager waived fees and/or reimbursed expenses. Without this arrangement, performance would have been lower.
The annual gross and net expense ratios were 0.77% and 0.75%, respectively, as disclosed in the May 1, 2011 prospectus. The manager has contractually agreed to reimburse the Fund so that its annual operating expenses do not exceed 0.75%. This commitment will remain in place for the life of the Fund.
a Inception date of February 14, 2000.
5
COHEN & STEERS INSTITUTIONAL REALTY SHARES, INC.
Expense Example
(Unaudited)
As a shareholder of the Fund, you incur two types of costs: (1) transaction costs; and (2) ongoing costs including management fees and other Fund expenses. This example is intended to help you understand your ongoing costs (in dollars) of investing in the Fund and to compare these costs with the ongoing costs of investing in other mutual funds.
The example is based on an investment of $1,000 invested at the beginning of the period and held for the entire period January 1, 2011—June 30, 2011.
Actual Expenses
The first line of the following table provides information about actual account values and expenses. You may use the information in this line, together with the amount you invested, to estimate the expenses that you paid over the period. Simply divide your account value by $1,000 (for example, an $8,600 account value divided by $1,000 = 8.6), then multiply the result by the number in the first line under the heading entitled "Expenses Paid During Period" to estimate the expenses you paid on your account during this period.
Hypothetical Example for Comparison Purposes
The second line of the following table provides information about hypothetical account values and hypothetical expenses based on the Fund's actual expense ratio and an assumed rate of return of 5% per year before expenses, which is not the Fund's actual return. The hypothetical account values and expenses may not be used to estimate the actual ending account balance or expenses you paid for the period. You may use this information to compare the ongoing cost of investing in the Fund and other funds. To do so, compare this 5% hypothetical example with the 5% hypothetical examples that appear in the shareholder reports of other funds.
Please note that the expenses shown in the table are meant to highlight your ongoing costs only and do not reflect any transactional costs. Therefore, the second line of the table is useful in comparing ongoing costs only, and will not help you determine the relative total costs of owning different funds. In addition, if these transactional costs were included, your costs would have been higher.
| | | Beginning
Account Value
January 1, 2011 | | Ending
Account Value
June 30, 2011 | | Expenses Paid
During Perioda
January 1, 2011–
June 30, 2011 | |
| Actual (10.93% return) | | $ | 1,000.00 | | | $ | 1,109.30 | | | $ | 3.92 | | |
| Hypothetical (5% annual return before expenses) | | $ | 1,000.00 | | | $ | 1,021.08 | | | $ | 3.76 | | |
a Expenses are equal to the Fund's annualized expense ratio of 0.75% multiplied by the average account value over the period, multiplied by 181/365 (to reflect the one-half year period). If the Fund had borne all of its expenses that were assumed by the manager, the annualized expense ratio would have been 0.77%.
6
COHEN & STEERS INSTITUTIONAL REALTY SHARES, INC.
JUNE 30, 2011
Top Ten Holdings
(Unaudited)
| Security | | Value | | % of
Net
Assets | |
| Simon Property Group | | $ | 170,070,061 | | | | 10.0 | % | |
| Vornado Realty Trust | | | 108,495,903 | | | | 6.4 | | |
| Equity Residential | | | 99,601,140 | | | | 5.8 | | |
| ProLogis | | | 96,087,327 | | | | 5.6 | | |
| Boston Properties | | | 73,903,921 | | | | 4.3 | | |
| Host Hotels & Resorts | | | 70,660,584 | | | | 4.1 | | |
| General Growth Properties | | | 54,414,190 | | | | 3.2 | | |
| Developers Diversified Realty Corp. | | | 52,611,358 | | | | 3.1 | | |
| Macerich Co. | | | 52,557,223 | | | | 3.1 | | |
| UDR | | | 50,154,128 | | | | 2.9 | | |
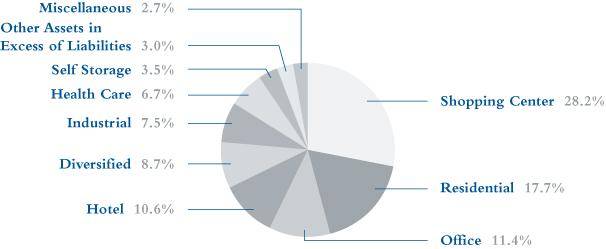
Sector Breakdown
(Based on Net Assets)
(Unaudited)
7
COHEN & STEERS INSTITUTIONAL REALTY SHARES, INC.
SCHEDULE OF INVESTMENTS
June 30, 2011 (Unaudited)
| | | | | Number
of Shares | | Value | |
| COMMON STOCK | | 97.0% | | | | | | | | | |
| BANK | | 0.6% | | | | | | | | | |
| Bond Street Holdings LLC, Class A, 144Aa,b,c,d | | | | | 289,434 | | | $ | 5,933,397 | | |
| SJB Escrow Corp., Class A, 144Aa,b,c,d | | | | | 213,700 | | | | 4,274,000 | | |
| | | | | | | | 10,207,397 | | |
| REAL ESTATE | | 96.4% | | | | | | | | | |
| DIVERSIFIED | | 8.7% | | | | | | | | | |
| Alexander's | | | | | 23,328 | | | | 9,261,216 | | |
| American Assets Trust | | | | | 389,906 | | | | 8,753,390 | | |
| Forest City Enterprisesd | | | | | 1,140,032 | | | | 21,284,398 | | |
| Vornado Realty Trust | | | | | 1,164,369 | | | | 108,495,903 | | |
| | | | | | | | 147,794,907 | | |
| HEALTH CARE | | 6.7% | | | | | | | | | |
| HCP | | | | | 875,305 | | | | 32,114,940 | | |
| Health Care REIT | | | | | 93,333 | | | | 4,893,449 | | |
| Nationwide Health Properties | | | | | 461,518 | | | | 19,111,460 | | |
| Senior Housing Properties Trust | | | | | 668,994 | | | | 15,661,150 | | |
| Ventas | | | | | 818,295 | | | | 43,132,330 | | |
| | | | | | | | 114,913,329 | | |
| HOTEL | | 10.6% | | | | | | | | | |
| FelCor Lodging Trustd | | | | | 1,257,193 | | | | 6,700,839 | | |
| Hersha Hospitality Trust | | | | | 2,205,050 | | | | 12,282,128 | | |
| Host Hotels & Resorts | | | | | 4,168,766 | | | | 70,660,584 | | |
| Hyatt Hotels Corp., Class Ad | | | | | 233,614 | | | | 9,536,123 | | |
| Orient-Express Hotels Ltd., Class A (Bermuda)d | | | | | 1,164,419 | | | | 12,517,504 | | |
| Pebblebrook Hotel Trust | | | | | 503,024 | | | | 10,156,055 | | |
| RLJ Lodging Trust | | | | | 454,811 | | | | 7,900,067 | | |
| Starwood Hotels & Resorts Worldwide | | | | | 455,691 | | | | 25,536,924 | | |
| Strategic Hotels & Resortsd | | | | | 1,837,211 | | | | 13,007,454 | | |
| Sunstone Hotel Investorsd | | | | | 1,301,530 | | | | 12,065,183 | | |
| | | | | | | | 180,362,861 | | |
See accompanying notes to financial statements.
8
COHEN & STEERS INSTITUTIONAL REALTY SHARES, INC.
SCHEDULE OF INVESTMENTS—(Continued)
June 30, 2011 (Unaudited)
| | | | | Number
of Shares | | Value | |
| INDUSTRIAL | | 7.5% | | | | | | | | | |
| DCT Industrial Trust | | | | | 4,772,176 | | | $ | 24,958,480 | | |
| EastGroup Properties | | | | | 181,853 | | | | 7,730,571 | | |
| ProLogis | | | | | 2,681,008 | | | | 96,087,327 | | |
| | | | | | | | 128,776,378 | | |
| OFFICE | | 11.4% | | | | | | | | | |
| BioMed Realty Trust | | | | | 473,928 | | | | 9,118,375 | | |
| Boston Properties | | | | | 696,156 | | | | 73,903,921 | | |
| Brandywine Realty Trust | | | | | 144,019 | | | | 1,669,180 | | |
| Brookfield Office Properties (Canada) | | | | | 761,152 | | | | 14,675,011 | | |
| Hudson Pacific Properties | | | | | 513,410 | | | | 7,973,257 | | |
| Kilroy Realty Corp. | | | | | 508,615 | | | | 20,085,206 | | |
| Liberty Property Trust | | | | | 666,711 | | | | 21,721,444 | | |
| SL Green Realty Corp. | | | | | 551,318 | | | | 45,687,723 | | |
| | | | | | | | 194,834,117 | | |
| OFFICE/INDUSTRIAL | | 0.7% | | | | | | | | | |
| PS Business Parks | | | | | 213,475 | | | | 11,762,472 | | |
| RESIDENTIAL | | 17.7% | | | | | | | | | |
| APARTMENT | | 16.5% | | | | | | | | | |
| Apartment Investment & Management Co. | | | | | 1,031,656 | | | | 26,338,178 | | |
| AvalonBay Communities | | | | | 357,525 | | | | 45,906,210 | | |
| BRE Properties | | | | | 133,425 | | | | 6,655,239 | | |
| Campus Crest Communities | | | | | 531,516 | | | | 6,877,817 | | |
| Colonial Properties Trust | | | | | 652,144 | | | | 13,303,737 | | |
| Education Realty Trust | | | | | 491,759 | | | | 4,214,375 | | |
| Equity Residential | | | | | 1,660,019 | | | | 99,601,140 | | |
| Home Properties | | | | | 205,851 | | | | 12,532,209 | | |
| Post Properties | | | | | 394,517 | | | | 16,080,513 | | |
| UDR | | | | | 2,042,938 | | | | 50,154,128 | | |
| | | | | | | | 281,663,546 | | |
See accompanying notes to financial statements.
9
COHEN & STEERS INSTITUTIONAL REALTY SHARES, INC.
SCHEDULE OF INVESTMENTS—(Continued)
June 30, 2011 (Unaudited)
| | | | | Number
of Shares | | Value | |
| MANUFACTURED HOME | | 1.2% | | | | | | | | | |
| Equity Lifestyle Properties | | | | | 331,765 | | | $ | 20,715,406 | | |
| TOTAL RESIDENTIAL | | | | | | | 302,378,952 | | |
| SELF STORAGE | | 3.5% | | | | | | | | | |
| Extra Space Storage | | | | | 560,580 | | | | 11,957,171 | | |
| Public Storage | | | | | 414,855 | | | | 47,297,619 | | |
| | | | | | | | 59,254,790 | | |
| SHOPPING CENTER | | 28.2% | | | | | | | | | |
| COMMUNITY CENTER | | 10.2% | | | | | | | | | |
| Developers Diversified Realty Corp. | | | | | 3,731,302 | | | | 52,611,358 | | |
| Federal Realty Investment Trust | | | | | 108,375 | | | | 9,231,383 | | |
| Kimco Realty Corp. | | | | | 2,257,817 | | | | 42,085,709 | | |
| Regency Centers Corp. | | | | | 821,659 | | | | 36,128,346 | | |
| Weingarten Realty Investors | | | | | 1,375,108 | | | | 34,597,717 | | |
| | | | | | | | 174,654,513 | | |
| REGIONAL MALL | | 18.0% | | | | | | | | | |
| General Growth Properties | | | | | 3,260,287 | | | | 54,414,190 | | |
| Macerich Co. | | | | | 982,378 | | | | 52,557,223 | | |
| Simon Property Group | | | | | 1,463,220 | | | | 170,070,061 | | |
| Taubman Centers | | | | | 493,191 | | | | 29,196,907 | | |
| | | | | | | | 306,238,381 | | |
| TOTAL SHOPPING CENTER | | | | | | | 480,892,894 | | |
| SPECIALTY | | 1.4% | | | | | | | | | |
| DuPont Fabros Technology | | | | | 267,614 | | | | 6,743,873 | | |
| Rayonier | | | | | 266,723 | | | | 17,430,348 | | |
| | | | | | | | 24,174,221 | | |
| TOTAL REAL ESTATE | | | | | | | 1,645,144,921 | | |
| TOTAL COMMON STOCK (Identified cost—$1,186,929,137) | | | | | | | 1,655,352,318 | | |
See accompanying notes to financial statements.
10
COHEN & STEERS INSTITUTIONAL REALTY SHARES, INC.
SCHEDULE OF INVESTMENTS—(Continued)
June 30, 2011 (Unaudited)
| | | | | Number
of Shares | | Value | |
| SHORT-TERM INVESTMENTS | | | 2.1% | | | | | | | | | | |
| MONEY MARKET FUNDS | | | | | | | | | | | |
| BlackRock Liquidity Funds: FedFund, 0.01%e | | | | | 10,900,000 | | | $ | 10,900,000 | | |
| Federated Government Obligations Fund, 0.01%e | | | | | 24,406,181 | | | | 24,406,181 | | |
TOTAL SHORT-TERM INVESTMENTS
(Identified cost—$35,306,181) | | | | | | | 35,306,181 | | |
| TOTAL INVESTMENTS (Identified cost—$1,222,235,318) | | | 99.1 | % | | | | | | | 1,690,658,499 | | |
| OTHER ASSETS IN EXCESS OF LIABILITIES | | | 0.9 | | | | | | | | 15,832,866 | | |
NET ASSETS (Equivalent to $41.79 per share based on
40,830,789 shares of common stock outstanding) | | | 100.0 | % | | | | | | $ | 1,706,491,365 | | |
Glossary of Portfolio Abbreviation
REIT Real Estate Investment Trust
Note: Percentages indicated are based on the net assets of the Fund.
a Illiquid security. Aggregate holdings equal 0.6% of net assets of the Fund.
b Resale is restricted to qualified institutional investors. Aggregate holdings equal 0.6% of net assets of the Fund, all of which are illiquid.
c Fair valued security. This security has been valued at its fair value as determined in good faith under procedures established by and under the general supervision of the Fund's Board of Directors. Aggregate fair value securities represent 0.6% of the net assets of the Fund.
d Non-income producing security.
e Rate quoted represents the seven day yield of the fund.
See accompanying notes to financial statements.
11
COHEN & STEERS INSTITUTIONAL REALTY SHARES, INC.
STATEMENT OF ASSETS AND LIABILITIES
June 30, 2011 (Unaudited)
| ASSETS: | |
| Investments in securities, at value (Identified cost—$1,222,235,318) | | $ | 1,690,658,499 | | |
| Cash | | | 1,475 | | |
| Receivable for: | |
| Investment securities sold | | | 34,453,362 | | |
| Fund shares sold | | | 3,715,131 | | |
| Dividends | | | 2,878,766 | | |
| Other assets | | | 10,354 | | |
| Total Assets | | | 1,731,717,587 | | |
| LIABILITIES: | |
| Payable for: | |
| Investment securities purchased | | | 20,744,143 | | |
| Fund shares redeemed | | | 2,111,894 | | |
| Dividends declared | | | 1,412,265 | | |
| Manager fees | | | 943,144 | | |
| Directors' fees | | | 1,019 | | |
| Other liabilities | | | 13,757 | | |
| Total Liabilities | | | 25,226,222 | | |
| NET ASSETS applicable to 40,830,789 shares of $0.001 par value of common stock outstanding | | $ | 1,706,491,365 | | |
| NET ASSET VALUE PER SHARE: | |
| ($1,706,491,365 ÷ 40,830,789 shares outstanding) | | $ | 41.79 | | |
| NET ASSETS consist of: | |
| Paid-in capital | | $ | 1,229,520,238 | | |
| Dividends in excess of net investment income | | | (5,863,193 | ) | |
| Accumulated undistributed net realized gain | | | 14,411,139 | | |
| Net unrealized appreciation | | | 468,423,181 | | |
| | | $ | 1,706,491,365 | | |
See accompanying notes to financial statements.
12
COHEN & STEERS INSTITUTIONAL REALTY SHARES, INC.
STATEMENT OF OPERATIONS
For the Six Months Ended June 30, 2011 (Unaudited)
| Investment Income: | |
| Dividend income (net of $14,814 of foreign withholding tax) | | $ | 11,371,529 | | |
| Expenses: | |
| Management fees | | | 5,661,069 | | |
| Registration and filing fees | | | 74,333 | | |
| Directors' fees and expenses | | | 60,166 | | |
| Line of credit fees | | | 23,969 | | |
| Dues and subscriptions | | | 9,230 | | |
| Total Expenses | | | 5,828,767 | | |
| Reduction of Expenses (See Note 2) | | | (167,698 | ) | |
| Net Expenses | | | 5,661,069 | | |
| Net Investment Income | | | 5,710,460 | | |
| Net Realized and Unrealized Gain: | |
| Net realized gain on investments | | | 87,002,140 | | |
| Net change in unrealized appreciation | | | 62,999,103 | | |
| Net realized and unrealized gain | | | 150,001,243 | | |
| Net Increase in Net Assets Resulting from Operations | | $ | 155,711,703 | | |
See accompanying notes to financial statements.
13
COHEN & STEERS INSTITUTIONAL REALTY SHARES, INC.
STATEMENT OF CHANGES IN NET ASSETS (Unaudited)
| | | For the
Six Months Ended
June 30, 2011 | | For the
Year Ended
December 31, 2010 | |
| Change in Net Assets: | |
| From Operations: | |
| Net investment income | | $ | 5,710,460 | | | $ | 15,946,053 | | |
| Net realized gain | | | 87,002,140 | | | | 103,240,375 | | |
| Net change in unrealized appreciation | | | 62,999,103 | | | | 170,810,884 | | |
| Net increase in net assets resulting from operations | | | 155,711,703 | | | | 289,997,312 | | |
| Dividends to Shareholders from Net investment income | | | (13,372,251 | ) | | | (30,624,362 | ) | |
| Capital Stock Transactions: | |
| Increase in net assets from Fund share transactions | | | 156,617,153 | | | | 173,338,798 | | |
| Total increase in net assets | | | 298,956,605 | | | | 432,711,748 | | |
| Net Assets: | |
| Beginning of period | | | 1,407,534,760 | | | | 974,823,012 | | |
| End of perioda | | $ | 1,706,491,365 | | | $ | 1,407,534,760 | | |
a Includes dividends in excess of net investment income and accumulated undistributed net investment income of $5,863,193 and $1,798,598, respectively.
See accompanying notes to financial statements.
14
COHEN & STEERS INSTITUTIONAL REALTY SHARES, INC.
FINANCIAL HIGHLIGHTS (Unaudited)
The following table includes selected data for a share outstanding throughout each period and other performance information derived from the financial statements. It should be read in conjunction with the financial statements and notes thereto.
| | | For the Six
Months Ended | | For Year Ended December 31, | |
| Per Share Operating Performance: | | June 30, 2011 | | 2010 | | 2009 | | 2008 | | 2007 | | 2006 | |
| Net asset value, beginning of period | | $ | 37.99 | | | $ | 30.53 | | | $ | 24.05 | | | $ | 38.30 | | | $ | 56.49 | | | $ | 45.56 | | |
| Income from investment operations: | |
| Net investment income | | | 0.15 | | | | 0.86 | | | | 0.66 | | | | 0.83 | | | | 0.94 | a | | | 0.70 | | |
Net realized and unrealized
gain (loss) | | | 4.00 | | | | 7.47 | | | | 6.81 | | | | (13.69 | ) | | | (11.36 | ) | | | 15.87 | | |
Total income (loss) from
investment operations | | | 4.15 | | | | 8.33 | | | | 7.47 | | | | (12.86 | ) | | | (10.42 | ) | | | 16.57 | | |
Less dividends and distributions
to shareholders from: | |
| Net investment income | | | (0.35 | ) | | | (0.87 | ) | | | (0.66 | ) | | | (0.88 | ) | | | (0.84 | ) | | | (0.70 | ) | |
| Net realized gain | | | — | | | | — | | | | — | | | | — | | | | (6.93 | ) | | | (4.59 | ) | |
| Tax return of capital | | | — | | | | — | | | | (0.33 | ) | | | (0.51 | ) | | | — | | | | (0.35 | ) | |
Total dividends and
distributions to
shareholders | | | (0.35 | ) | | | (0.87 | ) | | | (0.99 | ) | | | (1.39 | ) | | | (7.77 | ) | | | (5.64 | ) | |
Net increase (decrease) in
net asset value | | | 3.80 | | | | 7.46 | | | | 6.48 | | | | (14.25 | ) | | | (18.19 | ) | | | 10.93 | | |
| Net asset value, end of period | | $ | 41.79 | | | $ | 37.99 | | | $ | 30.53 | | | $ | 24.05 | | | $ | 38.30 | | | $ | 56.49 | | |
| Total investment return | | | 10.93 | %b | | | 27.63 | % | | | 32.73 | % | | | –34.42 | % | | | –18.72 | % | | | 37.15 | % | |
| Ratios/Supplemental Data: | |
| Net assets, end of period (in millions) | | $ | 1,706.5 | | | $ | 1,407.5 | | | $ | 974.8 | | | $ | 604.9 | | | $ | 961.3 | | | $ | 1,342.2 | | |
Ratio of expenses to average daily net
assets (before expense reduction) | | | 0.77 | %c | | | 0.77 | % | | | 0.77 | % | | | 0.77 | % | | | 0.76 | % | | | 0.77 | % | |
Ratio of expenses to average daily net
assets (net of expense reduction) | | | 0.75 | %c | | | 0.75 | % | | | 0.75 | % | | | 0.75 | % | | | 0.75 | % | | | 0.75 | % | |
Ratio of net investment income to
average daily net assets
(before expense reduction) | | | 0.73 | %c | | | 1.33 | % | | | 2.76 | % | | | 2.29 | % | | | 1.54 | % | | | 1.26 | % | |
Ratio of net investment income to
average daily net assets
(net of expense reduction) | | | 0.76 | %c | | | 1.35 | % | | | 2.79 | % | | | 2.30 | % | | | 1.55 | % | | | 1.28 | % | |
| Portfolio turnover rate | | | 42 | %b | | | 104 | % | | | 119 | % | | | 106 | % | | | 63 | % | | | 46 | % | |
a 12.7% of net investment income was attributable to a special dividend paid by Boston Properties, Inc.
b Not annualized.
c Annualized.
See accompanying notes to financial statements.
15
COHEN & STEERS INSTITUTIONAL REALTY SHARES, INC.
NOTES TO FINANCIAL STATEMENTS (Unaudited)
Note 1. Significant Accounting Policies
Cohen & Steers Institutional Realty Shares, Inc. (the Fund) was incorporated under the laws of the State of Maryland on October 13, 1999 and is registered under the Investment Company Act of 1940, as amended, as a nondiversified, open-end management investment company. The Fund's investment objective is total return.
The following is a summary of significant accounting policies consistently followed by the Fund in the preparation of its financial statements. The policies are in conformity with accounting principles generally accepted in the United States of America (GAAP). The preparation of the financial statements in accordance with GAAP requires management to make estimates and assumptions that affect the reported amounts of assets and liabilities at the date of the financial statements and the reported amounts of income and expenses during the reporting period. Actual results could differ from those estimates.
Portfolio Valuation: Investments in securities that are listed on the New York Stock Exchange are valued, except as indicated below, at the last sale price reflected at the close of the New York Stock Exchange on the business day as of which such value is being determined. If there has been no sale on such day, the securities are valued at the mean of the closing bid and asked prices on such day or, if no asked price is available, at the bid price.
Securities not listed on the New York Stock Exchange but listed on other domestic or foreign securities exchanges are valued in a similar manner. Securities traded on more than one securities exchange are valued at the last sale price on the business day as of which such value is being determined as reflected on the tape at the close of the exchange representing the principal market for such securities. If after the close of a foreign market, but prior to the close of business on the day the securities are being valued, market conditions change significantly, certain foreign securities may be fair valued pursuant to procedures established by the Board of Directors.
Readily marketable securities traded in the over-the-counter market, including listed securities whose primary market is believed by Cohen & Steers Capital Management, Inc. (the manager) to be over-the-counter, are valued at the official closing prices as reported by sources as the Board of Directors deem appropriate to reflect their fair market value. If there has been no sale on such day, the securities are valued at the mean of the closing bid and asked prices on such day, or if no asked price is available, at the bid price. However, certain fixed-income securities may be valued on the basis of prices provided by a pricing service when such prices are believed by the manager pursuant to delegation by the Board of Directors, to reflect the fair market value of such securities.
Securities for which market prices are unavailable, or securities for which the manager determines that the bid and/or asked price or a counterparty valuation does not reflect market value, will be valued at fair value pursuant to procedures approved by the Fund's Board of Directors. Circumstances in which market prices may be unavailable include, but are not limited to, when trading in a security is suspended, the exchange on which the security is traded is subject to an unscheduled close or disruption or material events occur after the close of the exchange on which the security is principally traded. In these circumstances, the Fund determines fair value in a manner that fairly reflects the market value of the security on the valuation date based on consideration of any
16
COHEN & STEERS INSTITUTIONAL REALTY SHARES, INC.
NOTES TO FINANCIAL STATEMENTS (Unaudited)—(Continued)
information or factors it deems appropriate. These may include, but are not limited to, recent transactions in comparable securities, information relating to the specific security and developments in the markets.
The Fund's use of fair value pricing may cause the net asset value of Fund shares to differ from the net asset value that would be calculated using market quotations. Fair value pricing involves subjective judgments and it is possible that the fair value determined for a security may be materially different than the value that could be realized upon the sale of that security.
Short-term debt securities with a maturity date of 60 days or less are valued at amortized cost, which approximates value. Investments in open-end mutual funds are valued at their closing net asset value.
Fair value is defined as the price that the Fund would receive to sell an investment or pay to transfer a liability in an orderly transaction with an independent buyer in the principal market, or in the absence of a principal market the most advantageous market for the investment or liability. The hierarchy of inputs that are used in determining the fair value of the Fund's investments is summarized below.
• Level 1—quoted prices in active markets for identical investments
• Level 2—other significant observable inputs (including quoted prices for similar investments, interest rates, credit risk, etc.)
• Level 3—significant unobservable inputs (including the Fund's own assumptions in determining the fair value of investments)
The inputs or methodology used for valuing securities are not necessarily an indication of the risk associated with investing in those securities.
The following is a summary of the inputs used as of June 30, 2011 in valuing the Fund's investments carried at value:
| | | Total | | Quoted Prices In
Active Market for
Identical Assets
(Level 1) | | Significant
Other Observable
Inputs
(Level 2) | | Significant
Unobservable
Inputs
(Level 3) | |
| Common Stock—Bank | | $ | 10,207,397 | | | $ | — | | | $ | — | | | $ | 10,207,397 | | |
| Common Stock—Real Estate | | | 1,645,144,921 | | | | 1,645,144,921 | | | | — | | | | — | | |
| Money Market Funds | | | 35,306,181 | | | | — | | | | 35,306,181 | | | | — | | |
| Total Investments | | $ | 1,690,658,499 | | | $ | 1,645,144,921 | | | $ | 35,306,181 | | | $ | 10,207,397 | | |
17
COHEN & STEERS INSTITUTIONAL REALTY SHARES, INC.
NOTES TO FINANCIAL STATEMENTS (Unaudited)—(Continued)
Following is a reconciliation of investments in which significant unobservable inputs (Level 3) were used in determining fair value:
| | | Investments
in Securities | |
| Balance as of December 31, 2010 | | $ | 10,352,114 | | |
| Change in unrealized depreciation | | | (144,717 | ) | |
| Balance as of June 30, 2011 | | $ | 10,207,397 | | |
Investments classified as Level 3 infrequently trade and have significant unobservable inputs. The Level 3 common stock has been fair valued utilizing inputs and assumptions which include book value, recent comparables in similar securities, as well as liquidity and market risk factors.
Security Transactions and Investment Income: Security transactions are recorded on trade date. Realized gains and losses on investments sold are recorded on the basis of identified cost. Interest income is recorded on the accrual basis. Discounts are accreted and premiums are amortized over the life of the respective securities. Dividend income is recorded on the ex-dividend date. The Fund records distributions received in excess of income from underlying investments as a reduction of cost of investments and/or an increase in realized gain. Such amounts are based on estimates if actual amounts are not available, and actual amounts of income, realized gain and return of capital may differ from the estimated amounts. The Fund adjusts the estimated amounts of the components of distributions (and consequently its net investment income) as an increase to unrealized appreciation/(depreciation) and realized gain/(loss) on investments as necessary once the issuers provide information about the actual composition of the distributions.
Dividends and Distributions to Shareholders: Dividends from net investment income and capital gain distributions are determined in accordance with U.S. federal income tax regulations, which may differ from GAAP. Dividends from net investment income, if any, are declared and paid quarterly. Net realized capital gains, unless offset by any available capital loss carryforward, are typically distributed to shareholders at least annually. Dividends and distributions to shareholders are recorded on the ex-dividend date and are automatically reinvested in full and fractional shares of the Fund based on the net asset value per share at the close of business on the payable date unless the shareholder has elected to have them paid in cash. Distributions paid by the Fund are subject to recharacterization for tax purposes.
Income Taxes: It is the policy of the Fund to continue to qualify as a regulated investment company, if such qualification is in the best interest of the shareholders, by complying with the requirements of Subchapter M of the Internal Revenue Code applicable to regulated investment companies, and by distributing substantially all of its taxable earnings to its shareholders. Accordingly, no provision for federal income or excise tax is necessary. Dividend and interest income from holdings in non-U.S. securities is recorded net of non-U.S. taxes paid.
18
COHEN & STEERS INSTITUTIONAL REALTY SHARES, INC.
NOTES TO FINANCIAL STATEMENTS (Unaudited)—(Continued)
Management has analyzed the Fund's tax positions taken on federal income tax returns as well as its tax positions in non-U.S. jurisdictions where it trades for all open tax years and has concluded that as of June 30, 2011, no additional provisions for income tax would be required in the Fund's financial statements. The Fund's tax positions for the tax years for which the applicable statutes of limitations have not expired are subject to examination by the Internal Revenue Service, state departments of revenue and by foreign tax authorities.
Note 2. Investment Management Fees and Other Transactions with Affiliates
Management Fees: The manager serves as the Fund's investment manager pursuant to an investment management agreement (the management agreement). Under the terms of the management agreement, the manager provides the Fund with the day-to-day investment decisions and generally manages the Fund's investments in accordance with the stated policies of the Fund, subject to the supervision of the Fund's Board of Directors. For the services provided to the Fund, the manager receives a fee, accrued daily and paid monthly, at the annual rate of 0.75% of the average daily net assets of the Fund.
The manager is also responsible, under the management agreement, for the performance of certain administrative functions for the Fund. Additionally, the manager pays certain expenses of the Fund, including administration and custody fees, transfer agent fees, professional fees, and reports to shareholders.
The manager has contractually agreed to reimburse the Fund so that its total annual operating expenses do not exceed 0.75% of the average daily net assets. This commitment will remain in place for the life of the Fund.
Directors' and Officers' Fees: Certain directors and officers of the Fund are also directors, officers, and/or employees of the manager. The Fund does not pay compensation to any affiliated directors and officers.
Note 3. Purchases and Sales of Securities
Purchases and sales of securities, excluding short-term investments, for the six months ended June 30, 2011, totaled $806,093,179 and $640,841,315, respectively.
19
COHEN & STEERS INSTITUTIONAL REALTY SHARES, INC.
NOTES TO FINANCIAL STATEMENTS (Unaudited)—(Continued)
Note 4. Income Tax Information
As of June 30, 2011, the federal tax cost and net unrealized appreciation on securities were as follows:
| Cost for federal income tax purposes | | $ | 1,222,235,318 | | |
| Gross unrealized appreciation | | $ | 472,656,662 | | |
| Gross unrealized depreciation | | | (4,233,481 | ) | |
| Net unrealized appreciation | | $ | 468,423,181 | | |
As of December 31, 2010, the Fund had a net capital loss carryforward of $27,220,999, of which $9,270,616 will expire on December 31, 2016 and $17,950,383 which will expire on December 31, 2017. This carryforward may be used to offset future capital gains to the extent provided by regulations.
Note 5. Capital Stock
The Fund is authorized to issue 100 million shares of capital stock, at a par value of $0.001 per share. The Board of Directors of the Fund may increase or decrease the aggregate number of shares of common stock that the Fund has authority to issue. Transactions in Fund shares were as follows:
| | | For the
Six Months Ended
June 30, 2011 | | For the
Year Ended
December 31, 2010 | |
| | | Shares | | Amount | | Shares | | Amount | |
| Sold | | | 9,384,056 | | | $ | 379,741,926 | | | | 13,809,573 | | | $ | 469,612,704 | | |
| Issued as reinvestment of dividends | | | 254,249 | | | | 10,444,082 | | | | 709,046 | | | | 24,175,791 | | |
| Redeemed | | | (5,854,815 | ) | | | (233,568,855 | ) | | | (9,398,084 | ) | | | (320,449,697 | ) | |
| Net increase | | | 3,783,490 | | | $ | 156,617,153 | | | | 5,120,535 | | | $ | 173,338,798 | | |
Note 6. Borrowings
The Fund, in conjunction with other Cohen & Steers funds, is a party to a $200,000,000 syndicated credit agreement (the credit agreement) with State Street Bank and Trust Company, as administrative agent and operations agent, and the lenders identified in the credit agreement, which expires January 27, 2012. The Fund pays a commitment fee of 0.125% per annum on its proportionate share of the unused portion of the credit agreement. (For the period January 1, 2011 through January 28, 2011, the commitment fee was 0.15%).
During the six months ended June 30, 2011, the Fund did not borrow under the credit agreement.
20
COHEN & STEERS INSTITUTIONAL REALTY SHARES, INC.
NOTES TO FINANCIAL STATEMENTS (Unaudited)—(Continued)
Note 7. Other
In the normal course of business, the Fund enters into contracts that provide general indemnifications. The Fund's maximum exposure under these arrangements is dependent on claims that may be made against the Fund in the future and, therefore, cannot be estimated; however, based on experience, the risk of material loss from such claims is considered remote.
Note 8. Subsequent Events
Events and transactions occurring after June 30, 2011 and through the date that the financial statements were issued, have been evaluated in the preparation of the financial statements and no additional disclosure is required.
21
COHEN & STEERS INSTITUTIONAL REALTY SHARES, INC.
OTHER INFORMATION
A description of the policies and procedures that the Fund uses to determine how to vote proxies relating to portfolio securities is available (i) without charge, upon request, by calling 800-330-7348, (ii) on our Web site at cohenandsteers.com or (iii) on the Securities and Exchange Commission's Web site at http://www.sec.gov. In addition, the Fund's proxy voting record for the most recent 12-month period ended June 30 is available by August 31 of each year (i) without charge, upon request, by calling 800-330-7348 or (ii) on the SEC's Web site at http://www.sec.gov.
The Fund files its complete schedule of portfolio holdings with the SEC for the first and third quarters of each fiscal year on Form N-Q. The Fund's Forms N-Q are available (i) without charge, upon request by calling 800-330-7348, or (ii) on the SEC's Web site at http://www.sec.gov. In addition, the Forms N-Q may be reviewed and copied at the SEC's Public Reference Room in Washington, DC. Information on the operation of the Public Reference Room may be obtained by calling 800-SEC-0330.
Please note that the distributions paid by the Fund to shareholders are subject to recharacterization for tax purposes. The Fund may also pay distributions in excess of the Fund's net investment company taxable income and this excess could be a tax free return of capital distributed from the Fund's assets. The final tax treatment of all distributions is reported to shareholders on their 1099-DIV forms, which are mailed after the close of each calendar year.
APPROVAL OF INVESTMENT MANAGEMENT AGREEMENT
The Board of Directors of the Fund, including a majority of the directors who are not parties to the Fund's investment management agreement (the "Management Agreement"), or interested persons of any such party ("Independent Directors"), has the responsibility under the 1940 Act to approve the Fund's Management Agreement for its initial two year term and its continuation annually thereafter at a meeting of the Board of Directors called for the purpose of voting on the approval or continuation. At a telephonic meeting held on June 14, 2011 and at a meeting held in person on June 21-22, 2011, the Management Agreement was discussed and was unanimously continued for a term ending June 30, 2012 by the Fund's Board of Directors, including the Independent Directors. The Independent Directors were represented by independent counsel who assisted them in their deliberations during the meeting and executive session.
In considering whether to continue the Management Agreement, the Board of Directors reviewed materials provided by the Fund's investment manager (the "Investment Manager") and Fund counsel which included, among other things, fee, expense and performance information compared to peer funds ("Peer Funds") and performance comparisons to a larger category universe, prepared by an independent data provider; summary information prepared by the Investment Manager; and a memorandum outlining the legal duties of the Board of Directors. The Board of Directors also spoke directly with representatives of the independent data provider and met with investment management personnel. In addition, the Board of Directors considered information provided from time to time by the Investment Manager throughout the year at meetings of the Board of Directors, including
22
COHEN & STEERS INSTITUTIONAL REALTY SHARES, INC.
presentations by portfolio managers relating to the investment performance of the Fund and the investment strategies used in pursuing the Fund's objective. In particular, the Board of Directors considered the following:
(i) The nature, extent and quality of services provided by the Investment Manager: The Board of Directors reviewed the services that the Investment Manager provides to the Fund, including, but not limited to, making the day-to-day investment decisions for the Fund, and generally managing the Fund's investments in accordance with the stated policies of the Fund. The Board of Directors also discussed with officers and portfolio managers of the Fund the types of transactions that were being done on behalf of the Fund. Additionally, the Board of Directors took into account the services provided by the Investment Manager to its other funds, including those that have investment objectives and strategies similar to the Fund. The Board of Directors next considered the education, background and experience of the Investment Manager's personnel, noting particularly that the favorable history and reputation of the portfolio managers for the Fund has had, and would likely continue to have, a favorable impact on the Fund. The Board of Directors further noted the Investment Manager's ability to attract qualified and experienced personnel. The Board of Directors then considered the administrative services provided by the Investment Manager, including compliance and accounting services. After consideration of the above factors, among others, the Board of Directors concluded that the nature, extent and quality of services provided by the Investment Manager are adequate and appropriate.
(ii) Investment performance of the Fund and the Investment Manager: The Board of Directors considered the investment performance of the Fund compared to Peer Funds and compared to a relevant benchmark. The Board of Directors noted that the Fund outperformed its benchmark and the medians of the Peer Funds for the three-, five and ten-year periods ended March 31, 2011. The Board of Directors noted that the Fund had underperformed the median of the Peer Funds but outperformed the benchmark for the one-year-period ended March 31, 2011. The Board of Directors engaged in discussions with the Investment Manager regarding the contributors and detractors to the Fund's performance during the periods. The Board of Directors also considered supplemental information provided by the Investment Manager, including a narrative summary of various factors affecting performance and the Investment Manager's performance in managing other real estate funds. The Board of Directors then determined that Fund performance, in light of all the considerations noted above, was satisfactory.
(iii) Cost of the services provided and profits realized by the Investment Manager from the relationship with the Fund: Next, the Board of Directors considered the management fees payable by the Fund as well as the Fund's expense ratio. As part of its analysis, the Board of Directors gave consideration to the fee and expense analyses provided by the independent data provider. The Board of Directors noted that the Fund's actual and contractual management fees were lower than the Peer Funds' medians. The Board of Directors further noted that the Fund's overall total expense ratio was lower than the Peer Funds' median. The Board of Directors also considered that the Investment Manager charges the Fund a unitary fee over the life of the Fund, causing the Investment Manager to reimburse expenses to limit total expenses. In light of the considerations above, the Board of Directors concluded that the Fund's expense structure was satisfactory.
23
COHEN & STEERS INSTITUTIONAL REALTY SHARES, INC.
The Board of Directors also reviewed information regarding the profitability to the Investment Manager of its relationship with the Fund. The Board of Directors considered the level of the Investment Manager's profits and whether the profits were reasonable for the Investment Manager. The Board of Directors took into consideration other benefits to be derived by the Investment Manager in connection with the Management Agreement, noting particularly the research and related services, within the meaning of Section 28(e) of the Securities Exchange Act of 1934, as amended, that the Investment Manager receives by allocating the Fund's brokerage transactions. The Board of Directors concluded that the profits realized by the Investment Manager from its relationship with the Fund were reasonable and consistent with fiduciary duties.
(iv) The extent to which economies of scale would be realized as the Fund grows and whether fee levels would reflect such economies of scale: The Board of Directors noted that the Investment Manager pays most of the regular operating costs of the Fund and reimburses the Fund for certain expenses to the extent that total expenses exceed the management fee rate. The Board of Directors determined that there were not at this time significant economies of scale that were not being shared with shareholders.
(v) Comparison of services rendered and fees paid to those under other investment management contracts, such as contracts of the same and other investment advisers or other clients: As discussed above in (iii), the Board of Directors compared the fees paid under the Management Agreement to those under other investment management contracts of other investment advisors managing Peer Funds. The Board of Directors also considered the services rendered, fees paid and profitability under the Management Agreement to the Investment Manager's other fund advisory contracts, as well as the services rendered, fees paid and profitability under the Management Agreement to the Investment Manager's other advisory contracts with institutional and other clients with similar investment mandates, including subadvised mutual funds and proprietary funds. The Board of Directors also considered the entrepreneurial risk and financial exposure assumed by the Investment Manager in developing and managing the Fund that the Investment Manager does not have with institutional and other clients. The Board of Directors determined that on a comparative basis the fees under the Management Agreement were reasonable in relation to the services provided.
No single factor was cited as determinative to the decision of the Board of Directors. Rather, after weighing all of the considerations and conclusions discussed above, the Board of Directors, including the Independent Directors, unanimously approved the continuation of the Management Agreement.
24
COHEN & STEERS INSTITUTIONAL REALTY SHARES, INC.
Cohen & Steers Privacy Policy
| Facts | | What Does Cohen & Steers Do With Your Personal Information? | |
|
| Why? | | Financial companies choose how they share your personal information. Federal law gives consumers the right to limit some but not all sharing. Federal law also requires us to tell you how we collect, share, and protect your personal information. Please read this notice carefully to understand what we do. | |
|
| What? | | The types of personal information we collect and share depend on the product or service you have with us. This information can include:
• Social Security number and account balances
• Transaction history and account transactions
• Purchase history and wire transfer instructions | |
|
| How? | | All financial companies need to share customers' personal information to run their everyday business. In the section below, we list the reasons financial companies can share their customers' personal information; the reasons Cohen & Steers chooses to share; and whether you can limit this sharing. | |
|
| Reasons we can share your personal information | | Does Cohen & Steers
share? | | Can you limit this
sharing? | |
For our everyday business purposes—
such as to process your transactions, maintain your account(s), respond to court orders and legal investigations, or reports to credit bureaus | | Yes | | No | |
|
For our marketing purposes—
to offer our products and services to you | | Yes | | No | |
|
| For joint marketing with other financial companies— | | no | | We don't share | |
|
For our affiliates' everyday business purposes—
information about your transactions and experiences | | No | | We don't share | |
|
For our affiliates' everyday business purposes—
information about your creditworthiness | | No | | We don't share | |
|
| For our affiliates to market to you— | | no | | We don't share | |
|
| For non-affiliates to market to you— | | no | | We don't share | |
|
Questions? Call 800.330.7348
25
COHEN & STEERS INSTITUTIONAL REALTY SHARES, INC.
Cohen & Steers Privacy Policy—(Continued)
| Who we are | | | |
| Who is providing this notice? | | Cohen & Steers Capital Management, Inc., Cohen & Steers Asia Limited, Cohen & Steers UK Limited, Cohen & Steers Europe SA, Cohen & Steers Securities, LLC, Cohen & Steers Private Funds, and Cohen & Steers Open and Closed-End Funds (collectively, "Cohen & Steers"). | |
|
| What we do | | | |
| How does Cohen & Steers protect my personal information? | | To protect your personal information from unauthorized access and use, we use security measures that comply with federal law. These measures include computer safeguards and secured files and buildings. We restrict access to your information to those employees who need it to perform their jobs, and also require companies that provide services on our behalf to protect your information. | |
|
| How does Cohen & Steers collect my personal information? | | We collect your personal information, for example, when you
• Open an account or buy securities from us
• Provide account information or give us your contact information
• Make deposits or withdrawals from your account
We also collect your personal information from other companies. | |
|
| Why can't I limit all sharing? | | Federal law gives you the right to limit only
• sharing for affiliates' everyday business purposes—information about your creditworthiness
• affiliates from using your information to market to you
• sharing for non-affiliates to market to you
State law and individual companies may give you additional rights to limit sharing. | |
|
| Definitions | | | |
| Affiliates | | Companies related by common ownership or control. They can be financial and nonfinancial companies.
• Cohen & Steers does not share with affiliates. | |
|
| Non-affiliates | | Companies not related by common ownership or control. They can be financial and nonfinancial companies
• Cohen & Steers does not share with non-affiliates so they can market to you. | |
|
| Joint marketing | | A formal agreement between nonaffiliated financial companies that together market financial products or services to you.
• Cohen & Steers does not jointly market. | |
|
26
COHEN & STEERS INSTITUTIONAL REALTY SHARES, INC.
Cohen & Steers Investment Solutions
COHEN & STEERS
GLOBAL REALTY SHARES
• Designed for investors seeking total return, investing primarily in global real estate equity securities
• Symbols: CSFAX, CSFBX*, CSFCX, CSSPX
COHEN & STEERS
INSTITUTIONAL GLOBAL REALTY SHARES
• Designed for institutional investors seeking total return, investing primarily in global real estate securities
• Symbol: GRSIX
COHEN & STEERS REALTY INCOME FUND
• Designed for investors seeking total return, investing primarily in real estate securities with an emphasis on both income and capital appreciation
• Symbols: CSEIX, CSBIX*, CSCIX, CSDIX
COHEN & STEERS
INTERNATIONAL REALTY FUND
• Designed for investors seeking total return, investing primarily in international real estate securities
• Symbols: IRFAX, IRFCX, IRFIX
COHEN & STEERS
EMERGING MARKETS REAL ESTATE FUND
• Designed for investors seeking total return, investing primarily in emerging market real estate securities
• Symbols: APFAX, APFCX, APFIX
COHEN & STEERS REALTY SHARES
• Designed for investors seeking total return, investing primarily in REITs
• Symbol: CSRSX
COHEN & STEERS
INSTITUTIONAL REALTY SHARES
• Designed for institutional investors seeking total return, investing primarily in REITs
• Symbol: CSRIX
COHEN & STEERS
GLOBAL INFRASTRUCTURE FUND
• Designed for investors seeking total return, investing primarily in global infrastructure securities
• Symbols: CSUAX, CSUBX*, CSUCX, CSUIX
COHEN & STEERS
DIVIDEND VALUE FUND
• Designed for investors seeking high current income and long-term growth of income and capital appreciation, investing primarily in dividend paying common stocks and preferred stocks
• Symbols: DVFAX, DVFCX, DVFIX
COHEN & STEERS
PREFERRED SECURITIES AND INCOME FUND
• Designed for investors seeking total return (high current income and capital appreciation), investing primarily in preferred and debt securities
• Symbols: CPXAX, CPXCX, CPXIX
Distributed by Cohen & Steers Securities, LLC.
COHEN & STEERS
GLOBAL REALTY MAJORS ETF
• Designed for investors who seek a relatively low-cost "passive" approach for investing in a portfolio of real estate equity securities of companies in a specified index
• Symbol: GRI
Distributed by ALPS Distributors, Inc.
ISHARES COHEN & STEERS
REALTY MAJORS INDEX FUND
• Designed for investors who seek a relatively low-cost "passive" approach for investing in a portfolio of real estate equity securities of companies in a specified index
• Symbol: ICF
Distributed by SEI Investments Distribution Co.
* Class B shares are no longer offered except through dividend reinvestment and permitted exchanges by existing Class B shareholders.
Please consider the investment objectives, risks, charges and expenses of the fund carefully before investing. A prospectus containing this and other information can be obtained by calling 800-330-7348 or by visiting cohenandsteers.com. Please read the prospectus carefully before investing.
27
COHEN & STEERS INSTITUTIONAL REALTY SHARES, INC.
OFFICERS AND DIRECTORS
Robert H. Steers
Director and co-chairman
Martin Cohen
Director and co-chairman
Michael G. Clark
Director
Bonnie Cohen
Director
George Grossman
Director
Richard E. Kroon
Director
Richard J. Norman
Director
Frank K. Ross
Director
Willard H. Smith Jr.
Director
C. Edward Ward, Jr.
Director
Adam M. Derechin
President and chief executive officer
Joseph M. Harvey
Vice president
Jon Cheigh
Vice president
Francis C. Poli
Secretary
James Giallanza
Treasurer and chief financial officer
Lisa D. Phelan
Chief compliance officer
KEY INFORMATION
Manager
Cohen & Steers Capital Management, Inc.
280 Park Avenue
New York, NY 10017
(212) 832-3232
Fund Co-administrator and Custodian
State Street Bank and Trust Company
One Lincoln Street
Boston, MA 02111
Transfer Agent
Boston Financial Data Services, Inc.
30 Dan Road
Canton, MA 02021
(800) 437-9912
Legal Counsel
Stroock & Stroock & Lavan LLP
180 Maiden Lane
New York, NY 10038
Distributor
Cohen & Steers Securities, LLC
280 Park Avenue
New York, NY 10017
Nasdaq Symbol: CSRIX
Web site: cohenandsteers.com
This report is authorized for delivery only to shareholders of Cohen & Steers Institutional Realty Shares, Inc. unless accompanied or preceded by the delivery of a currently effective prospectus setting forth details of the Fund. Past performance is no guarantee of future results and your investment may be worth more or less at the time you sell.
28


COHEN & STEERS
INSTITUTIONAL REALTY SHARES
280 PARK AVENUE
NEW YORK, NY 10017
eDelivery NOW AVAILABLE
Stop traditional mail delivery; receive your shareholder reports and prospectus online.
Sign up at cohenandsteers.com
SEMIANNUAL REPORT
JUNE 30, 2011
CSIRXSAR
Item 2. Code of Ethics.
Not applicable.
Item 3. Audit Committee Financial Expert.
Not applicable.
Item 4. Principal Accountant Fees and Services.
Not applicable.
Item 5. Audit Committee of Listed Registrants.
Not applicable.
Item 6. Schedule of Investments.
Included in Item 1 above.
Item 7. Disclosure of Proxy Voting Policies and Procedures for Closed-End Management Investment Companies.
Not applicable.
Item 8. Portfolio Managers of Closed-End Investment Companies.
Not applicable.
Item 9. Purchases of Equity Securities by Closed-End Management Investment Company and Affiliated Purchasers.
Not applicable.
Item 10. Submission of Matters to a Vote of Security Holders.
Not applicable.
Item 11. Controls and Procedures.
(a) The registrant’s principal executive officer and principal financial officer have concluded that the registrant’s disclosure controls and procedures are reasonably designed to ensure that information required to be disclosed by the registrant in this Form N-CSR was recorded, processed, summarized and reported within the time periods specified in the Securities and Exchange Commission’s rules and forms, based upon such officers’ evaluation of these controls and procedures as of a date within 90 days of the filing date of this report.
(b) There were no changes in the registrant’s internal control over financial reporting that occurred during the second fiscal quarter of the period covered by this report that have materially affected, or are reasonably likely to materially affect, the registrant’s internal control over financial reporting.
Item 12. Exhibits.
(a)(1) Not applicable.
(a)(2) Certifications of principal executive officer and principal financial officer as required by Rule 30a-2(a) under the Investment Company Act of 1940.
(a)(3) Not applicable
(b) Certifications of chief executive officer and chief financial officer as required by Rule 30a- 2(b) under the Investment Company Act of 1940.
SIGNATURES
Pursuant to the requirements of the Securities Exchange Act of 1934 and the Investment Company Act of 1940, the registrant has duly caused this report to be signed on its behalf by the undersigned, thereunto duly authorized.
COHEN & STEERS INSTITUTIONAL REALTY SHARES, INC.
By: | /s/ Adam M. Derechin | |
| Name: | Adam M. Derechin | |
| Title: | President and Chief Executive Officer | |
| |
Date: August 31, 2011 | |
Pursuant to the requirements of the Securities Exchange Act of 1934 and the Investment Company Act of 1940, this report has been signed below by the following persons on behalf of the registrant and in the capacities and on the dates indicated.
By: | /s/ Adam M. Derechin | |
| Name: | Adam M. Derechin | |
| Title: | President and Chief Executive Officer | |
| | (principal executive officer) | |
| | | |
By: | /s/ James Giallanza | |
| Name: | James Giallanza | |
| Title: | Treasurer and Chief Financial Officer | |
| | (principal financial officer) | |
| | | |
| |
Date: August 31, 2011 | |