UNITED STATES
SECURITIES AND EXCHANGE COMMISSION
Washington, D.C. 20549
FORM N-CSR
CERTIFIED SHAREHOLDER REPORT OF REGISTERED
MANAGEMENT INVESTMENT COMPANIES
Investment Company Act file number | 811-9631 | |||||||
| ||||||||
Cohen & Steers Institutional Realty Shares, Inc. | ||||||||
(Exact name of registrant as specified in charter) | ||||||||
| ||||||||
280 Park Avenue, New York, NY |
| 10017 | ||||||
(Address of principal executive offices) |
| (Zip code) | ||||||
| ||||||||
Adam M. Derechin Cohen & Steers Capital Management, Inc. 280 Park Avenue New York, New York 10017 | ||||||||
(Name and address of agent for service) | ||||||||
| ||||||||
Registrant’s telephone number, including area code: | (212) 832-3232 |
| ||||||
| ||||||||
Date of fiscal year end: | December 31 |
| ||||||
| ||||||||
Date of reporting period: | June 30, 2009 |
| ||||||
Item 1. Reports to Stockholders.
COHEN & STEERS INSTITUTIONAL REALTY SHARES, INC.
To Our Shareholders:
We would like to share with you our report for the six months ended June 30, 2009. The net asset value at that date was $20.97 per share.
The total returns, including income and change in net asset value, for the Fund and the comparative benchmarks were:
| Six Months Ended June 30, 2009 | |||||||
| Cohen & Steers Institutional Realty Shares | –10.27 | % | |||||
| FTSE NAREIT Equity REIT Indexa | –12.21 | % | |||||
| S&P 500 Indexa | 3.16 | % | |||||
The performance data quoted represent past performance. Past performance is no guarantee of future results. The investment return and the principal value of an investment will fluctuate and shares, if redeemed, may be worth more or less than their original cost. Current performance may be lower or higher than the performance data quoted. Total returns of the Fund current to the most recent month-end can be obtained by visiting our Web site at cohenandsteers.com.
Investment Review
U.S. real estate securities declined in the six-month period, although they were subject to strong swings in sentiment and performance. REITs entered 2009 with positive momentum from December's rally but quickly sold off as concerns about the economy and banking system took a disproportionate toll on the asset class. The new administration's proposed stimulus package failed to ignite markets when details suggested that the spending would occur slowly. Economic news remained negative.
Property stocks continued their downward trend in February as investors reacted unfavorably to the proposed budget and the lack of specifics on how the government would address the banking crisis. In this environment, real estate securities were positively correlated with troubled financial institutions. Although volatility remained high, conditions for REITs improved in March with greater clarity on the path the U.S. government was taking to improve the equity and liquidity of the financial system. Citigroup jump-started a broad market rally on March 9 when it announced that it expected to be profitable for the first two months of 2009.
a The FTSE NAREIT Equity REIT Index is an unmanaged, market-capitalization-weighted index of all publicly traded REITs that invest predominantly in the equity ownership of real estate. The index is designed to reflect the performance of all publicly traded equity REITs as a whole. The S&P 500 Index is an unmanaged index of common stocks that is frequently used as a general measure of stock market performance.
1
COHEN & STEERS INSTITUTIONAL REALTY SHARES, INC.
Recapitalization comes to the United States
In late March, mall owner Simon Property Group and warehouse operator AMB Property recapitalized, raising $1.2 billion and $500 million, respectively, in the capital markets to strengthen their balance sheets and meet debt maturities. The capital raisings, which followed the earlier success of Australian and U.K. property companies, reassured investors that REITs would survive the current economic downturn and, in a growing number of instances, thrive. In total, U.S. REITs raised $16.8 billion between March and June. Cohen & Steers was instrumental in several capital raisings, and was a cornerstone investor in many of them.
The second quarter saw a continued rally in the broad equity markets but with a distinct acceleration and outperformance by real estate securities (REITs rose 28.9% in the quarter, compared with a total return of 15.9% for the S&P 500 Index). Re-equitization lifted property shares and also encouraged the REIT unsecured bond market; spreads tightened and the market reopened as an additional capital source. Investors were undeterred by General Growth Properties' bankruptcy. The former blue-chip REIT filed for Chapter 11 on April 16 and the market rose. The company's plight had been telegraphed for months. We did not have a position in the company during the period.
REIT performance leveled off from April's blistering pace, although the stream of recapitalizations continued. While earlier capital raisings focused on strengthening balance sheets and meeting debt maturities, some of the more recent activity was undertaken with an eye toward distressed acquisition opportunities, notably Simon, which raised an additional $1.7 billion for that stated purpose.
Hotels had gains while shopping centers struggled
Returns varied widely by property sector. Hotel REITs were the best performers, with a total return of +7.9%. Hotels with the shortest lease terms and more discretionary demand rose the most during the group's second-quarter surge, amid signs of economic stabilization and the possibility of future economic growth. Regional malls (+0.4%) benefited from balance sheet recapitalization and stabilization in retail sales and consumer confidence.
Apartment REITs (–13.8%) modestly underperformed the index as declining fundamentals (increased competition from condominiums and single-family housing, higher unemployment) led to a rotation out of the sector late in the period. Multi-family stocks had found favor with investors because of their access to financing from Fannie Mae and Freddie Mac, but that relative advantage was diminished as the capital markets improved for other property sectors. The office sector (–12.9%) and health care sector (–12.6%) were more in line with the index.
The shopping center and industrial sectors had the poorest performance, with returns of –24.2% and –25.5%, respectively. Both fell more than 40% in the first quarter; shopping centers were under pressure due to leverage concerns and disappointing earnings, while industrial companies bore the brunt of a slowdown in global trade.
2
COHEN & STEERS INSTITUTIONAL REALTY SHARES, INC.
Fund performance
The Fund declined in the period, although it outperformed its benchmark. Factors that contributed to relative performance included our stock selection in the office sector, underweight in the diversified sector (which had a return of –22.1% within the index) and overweight in manufactured homes, a small sector that had a slight gain in the period. Our underweight in the troubled shopping center sector also aided performance; most specifically, we were underweight one of the largest U.S. shopping center owners, whose stock had a sizable decline due to leverage concerns.
Performance was hindered by our underweight in the specialty sector (–1.7%), which largely comprises timber companies. Stock selection in apartment and regional mall REITs also hampered returns. Within apartments, we were overweight a stock that declined sharply in the first quarter on concerns over the company's leverage. It rallied in the second quarter, when the company announced asset sales and better-than-expected earnings largely driven by cost cutting, but underperformed for the period.
Investment Outlook
We are closely monitoring the flow of economic data, and it is our view that the economy will surprise to the upside later this year, possibly in the fourth quarter, and follow through into 2010.
REIT capital raisings will likely resume again later this year after June's pause, as companies continue to take advantage of a receptive market. We had expected to see increased instances of distressed selling at this point in the deleveraging cycle, but the greater access to capital has given private property owners and their lenders time to explore alternatives. We continue to believe that phase will come, and that companies with the balance sheet capacity will be in a position to play offense when these buying opportunities present themselves. As such, these companies and those fundamentally positioned for a better-than-expected recovery remain our primary focus.
3
COHEN & STEERS INSTITUTIONAL REALTY SHARES, INC.
Sincerely,
 |  | ||||||
| MARTIN COHEN | ROBERT H. STEERS | ||||||
| Co-chairman | Co-chairman | ||||||
 |  | ||||||
| JOSEPH M. HARVEY | JON CHEIGH | ||||||
| Portfolio Manager | Portfolio Manager | ||||||
The views and opinions in the preceding commentary are subject to change. This material represents an assessment of the market environment at a specific point in time, should not be relied upon as investment advice and is not intended to predict or depict performance of any investment.
Visit Cohen & Steers online at cohenandsteers.com
For more information about any of our funds, visit cohenandsteers.com, where you will find daily net asset values, fund fact sheets and portfolio highlights. You can also access newsletters, education tools and market updates covering the global real estate, listed infrastructure, utilities, large cap value and preferred securities sectors.
In addition, our Web site contains comprehensive information about our firm, including our most recent press releases, profiles of our senior investment professionals and an overview of our investment approach.
4
COHEN & STEERS INSTITUTIONAL REALTY SHARES, INC.
Performance Review (Unaudited)
Average Annual Total Returns—For the Periods Ended June 30, 2009
| 1 Year | 5 Years | Since Inceptiona | |||||||||||||
| Fund | –39.77 | % | –0.55 | % | 7.91 | % | |||||||||
The performance data quoted represent past performance. Past performance is no guarantee of future results. The investment return and principal value of an investment will fluctuate and shares, when redeemed, may be worth more or less than their original cost. Current performance may be lower or higher than the performance data quoted. Performance information current to the most recent month-end can be obtained by visiting our Web site at cohenandsteers.com. The performance table does not reflect the deduction of taxes that a shareholder would pay on Fund distributions or the redemption of Fund shares.
The gross and net expense ratios, respectively, were 0.77% and 0.75% as disclosed in the May 1, 2009 prospectus. The manager has contractually agreed to reimburse the Fund so that its annual operating expenses do not exceed 0.75%. This commitment will remain in place for the life of the Fund.
a Inception date of February 14, 2000.
5
COHEN & STEERS INSTITUTIONAL REALTY SHARES, INC.
Expense Example (Unaudited)
As a shareholder of the Fund, you incur two types of costs: (1) transaction costs; and (2) ongoing costs including management fees and other Fund expenses. This example is intended to help you understand your ongoing costs (in dollars) of investing in the Fund and to compare these costs with the ongoing costs of investing in other mutual funds.
The example is based on an investment of $1,000 invested at the beginning of the period and held for the entire period January 1, 2009 – June 30, 2009.
Actual Expenses
The first line of the table below provides information about actual account values and expenses. You may use the information in this line, together with the amount you invested, to estimate the expenses that you paid over the period. Simply divide your account value by $1,000 (for example, an $8,600 account value divided by $1,000 = 8.6), then multiply the result by the number in the first line under the heading entitled "Expenses Paid During Period" to estimate the expenses you paid on your account during this period.
Hypothetical Example for Comparison Purposes
The second line of the table below provides information about hypothetical account values and hypothetical expenses based on the Fund's actual expense ratio and an assumed rate of return of 5% per year before expenses, which is not the Fund's actual return. The hypothetical account values and expenses may not be used to estimate the actual ending account balance or expenses you paid for the period. You may use this information to compare the ongoing cost of investing in the Fund and other funds. To do so, compare this 5% hypothetical example with the 5% hypothetical examples that appear in the shareholder reports of other funds.
Please note that the expenses shown in the table are meant to highlight your ongoing costs only and do not reflect any transactional costs. Therefore, the second line of the table is useful in comparing ongoing costs only, and will not help you determine the relative total costs of owning different funds. In addition, if these transactional costs were included, your costs would have been higher.
| Beginning Account Value January 1, 2009 | Ending Account Value June 30, 2009 | Expenses Paid During Period* January 1, 2009– June 30, 2009 | |||||||||||||
| Actual (–10.27% return) | $ | 1,000.00 | $ | 897.30 | $ | 3.53 | |||||||||
| Hypothetical (5% annual return before expenses) | $ | 1,000.00 | $ | 1,021.08 | $ | 3.76 | |||||||||
* Expenses are equal to the Fund's annualized expense ratio of 0.75% multiplied by the average account value over the period, multiplied by 181/365 (to reflect the one-half year period). If the Fund had borne all of its expenses that were assumed by the manager, the annualized expense ratio would have been 0.78%.
6
COHEN & STEERS INSTITUTIONAL REALTY SHARES, INC.
JUNE 30, 2009
Top Ten Holdings
(Unaudited)
| Security | Value | % of Net Assets | |||||||||
| Simon Property Group | $ | 56,438,511 | 9.2 | % | |||||||
| Public Storage | 54,372,628 | 8.9 | |||||||||
| Vornado Realty Trust | 38,339,127 | 6.3 | |||||||||
| Boston Properties | 34,816,373 | 5.7 | |||||||||
| Equity Residential | 21,471,446 | 3.5 | |||||||||
| HCP | 20,717,590 | 3.4 | |||||||||
| SL Green Realty Corp. | 17,567,200 | 2.9 | |||||||||
| ProLogis | 16,699,538 | 2.7 | |||||||||
| Host Hotels & Resorts | 15,474,667 | 2.5 | |||||||||
| Liberty Property Trust | 15,047,424 | 2.5 | |||||||||
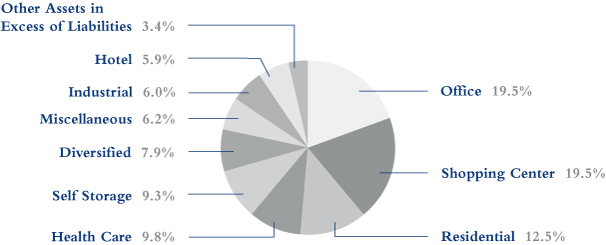
Sector Breakdown
(Based on Net Assets)
(Unaudited)
7
COHEN & STEERS INSTITUTIONAL REALTY SHARES, INC.
SCHEDULE OF INVESTMENTS
June 30, 2009 (Unaudited)
| Number of Shares | Value | ||||||||||||||
| COMMON STOCK | 96.6 | % | |||||||||||||
| DIVERSIFIED | 7.9 | % | |||||||||||||
| Brookfield Properties Corp. | 843,489 | $ | 6,722,607 | ||||||||||||
| Cousins Properties | 176,134 | 1,497,139 | |||||||||||||
| Lexington Realty Trust | 469,721 | 1,597,052 | |||||||||||||
| Vornado Realty Trust | 851,413 | 38,339,127 | |||||||||||||
| 48,155,925 | |||||||||||||||
| HEALTH CARE | 9.8 | % | |||||||||||||
| Brookdale Senior Living | 603,100 | 5,874,194 | |||||||||||||
| HCP | 977,706 | 20,717,590 | |||||||||||||
| Health Care REIT | 261,268 | 8,909,239 | |||||||||||||
| Nationwide Health Properties | 387,375 | 9,971,033 | |||||||||||||
| Omega Healthcare Investors | 141,856 | 2,201,605 | |||||||||||||
| Ventas | 416,455 | 12,435,346 | |||||||||||||
| 60,109,007 | |||||||||||||||
| HOTEL | 5.9 | % | |||||||||||||
| Hospitality Properties Trust | 729,173 | 8,669,867 | |||||||||||||
| Host Hotels & Resorts | 1,844,418 | 15,474,667 | |||||||||||||
| LaSalle Hotel Properties | 495,775 | 6,117,864 | |||||||||||||
| Orient-Express Hotels Ltd. | 428,417 | 3,637,260 | |||||||||||||
| Starwood Hotels & Resorts Worldwide | 89,832 | 1,994,270 | |||||||||||||
| 35,893,928 | |||||||||||||||
| INDUSTRIAL | 6.0 | % | |||||||||||||
| AMB Property Corp. | 470,790 | 8,855,560 | |||||||||||||
| DCT Industrial Trust | 1,485,236 | 6,059,763 | |||||||||||||
| EastGroup Properties | 149,631 | 4,940,816 | |||||||||||||
| ProLogis | 2,071,903 | 16,699,538 | |||||||||||||
| 36,555,677 | |||||||||||||||
| OFFICE | 19.5 | % | |||||||||||||
| BioMed Realty Trust | 934,661 | 9,561,582 | |||||||||||||
| Boston Properties | 729,903 | 34,816,373 | |||||||||||||
| Brandywine Realty Trust | 603,978 | 4,499,636 | |||||||||||||
See accompanying notes to financial statements.
8
COHEN & STEERS INSTITUTIONAL REALTY SHARES, INC.
SCHEDULE OF INVESTMENTS—(Continued)
June 30, 2009 (Unaudited)
| Number of Shares | Value | ||||||||||||||
| Douglas Emmett | 462,586 | $ | 4,158,648 | ||||||||||||
| Highwoods Properties | 340,123 | 7,608,551 | |||||||||||||
| Kilroy Realty Corp. | 684,583 | 14,061,335 | |||||||||||||
| Liberty Property Trust | 653,100 | 15,047,424 | |||||||||||||
| Mack-Cali Realty Corp. | 514,320 | 11,726,496 | |||||||||||||
| SL Green Realty Corp. | 765,789 | 17,567,200 | |||||||||||||
| 119,047,245 | |||||||||||||||
| OFFICE/INDUSTRIAL | 0.9 | % | |||||||||||||
| PS Business Parks | 114,559 | 5,549,238 | |||||||||||||
| RESIDENTIAL | 12.5 | % | |||||||||||||
| APARTMENT | 11.0 | % | |||||||||||||
| American Campus Communities | 257,183 | 5,704,319 | |||||||||||||
| Apartment Investment & Management Co. | 818,861 | 7,246,920 | |||||||||||||
| AvalonBay Communities | 169,061 | 9,457,272 | |||||||||||||
| Camden Property Trust | 128,831 | 3,555,736 | |||||||||||||
| Colonial Properties Trust | 322,743 | 2,388,298 | |||||||||||||
| Education Realty Trust | 216,337 | 928,086 | |||||||||||||
| Equity Residential | 965,877 | 21,471,446 | |||||||||||||
| Essex Property Trust | 47,702 | 2,968,495 | |||||||||||||
| Home Properties | 154,338 | 5,262,926 | |||||||||||||
| UDR | 765,625 | 7,908,906 | |||||||||||||
| 66,892,404 | |||||||||||||||
| MANUFACTURED HOME | 1.5 | % | |||||||||||||
| Equity Lifestyle Properties | 252,347 | 9,382,261 | |||||||||||||
| TOTAL RESIDENTIAL | 76,274,665 | ||||||||||||||
| SELF STORAGE | 9.3 | % | |||||||||||||
| Public Storage | 830,370 | 54,372,628 | |||||||||||||
| Sovran Self Storage | 97,927 | 2,409,004 | |||||||||||||
| 56,781,632 | |||||||||||||||
| SHOPPING CENTER | 19.5 | % | |||||||||||||
| COMMUNITY CENTER | 8.2 | % | |||||||||||||
| Acadia Realty Trust | 136,009 | 1,774,917 | |||||||||||||
| Federal Realty Investment Trust | 210,126 | 10,825,692 | |||||||||||||
See accompanying notes to financial statements.
9
COHEN & STEERS INSTITUTIONAL REALTY SHARES, INC.
SCHEDULE OF INVESTMENTS—(Continued)
June 30, 2009 (Unaudited)
| Number of Shares | Value | ||||||||||||||
| Inland Real Estate Corp. | 605,473 | $ | 4,238,311 | ||||||||||||
| Kimco Realty Corp. | 1,126,415 | 11,320,471 | |||||||||||||
| Regency Centers Corp. | 280,717 | 9,799,830 | |||||||||||||
| Weingarten Realty Investors | 805,126 | 11,682,378 | |||||||||||||
| 49,641,599 | |||||||||||||||
| FREE STANDING | 1.1 | % | |||||||||||||
| Alexander's | 6,478 | 1,746,469 | |||||||||||||
| National Retail Properties | 297,537 | 5,162,267 | |||||||||||||
| 6,908,736 | |||||||||||||||
| REGIONAL MALL | 10.2 | % | |||||||||||||
| CBL & Associates Properties | 231,573 | 1,248,178 | |||||||||||||
| Macerich Co. | 115,741 | 2,038,199 | |||||||||||||
| Simon Property Group | 1,097,385 | 56,438,511 | |||||||||||||
| Taubman Centers | 101,198 | 2,718,178 | |||||||||||||
| 62,443,066 | |||||||||||||||
| TOTAL SHOPPING CENTER | 118,993,401 | ||||||||||||||
| SPECIALTY | 5.3 | % | |||||||||||||
| Digital Realty Trust | 406,247 | 14,563,955 | |||||||||||||
| Plum Creek Timber Co. | 403,241 | 12,008,517 | |||||||||||||
| Rayonier | 155,965 | 5,669,328 | |||||||||||||
| 32,241,800 | |||||||||||||||
| TOTAL COMMON STOCK (Identified cost—$511,625,364) | 589,602,518 | ||||||||||||||
| SHORT-TERM INVESTMENTS | 3.2 | % | |||||||||||||
| MONEY MARKET FUNDS | |||||||||||||||
| Dreyfus Treasury Cash Management Fund, 0.001%a | 6,051,579 | 6,051,579 | |||||||||||||
| Federated U.S. Treasury Cash Reserves Fund, 0.00%a | 8,480,302 | 8,480,302 | |||||||||||||
| Fidelity Institutional Money Market Treasury Only Fund, 0.13%a | 4,783,513 | 4,783,513 | |||||||||||||
| TOTAL SHORT-TERM INVESTMENTS (Identified cost—$19,315,394) | 19,315,394 | ||||||||||||||
See accompanying notes to financial statements.
10
COHEN & STEERS INSTITUTIONAL REALTY SHARES, INC.
SCHEDULE OF INVESTMENTS—(Continued)
June 30, 2009 (Unaudited)
| Value | |||||||||||
| TOTAL INVESTMENTS (Identified cost—$530,940,758) | 99.8 | % | $ | 608,917,912 | |||||||
| OTHER ASSETS IN EXCESS OF LIABILITIES | 0.2 | % | 1,371,176 | ||||||||
| NET ASSETS (Equivalent to $20.97 per share based on 29,099,311 shares of common stock outstanding) | 100.0 | % | $ | 610,289,088 | |||||||
Glossary of Portfolio Abbreviation
REIT Real Estate Investment Trust
Note: Percentages indicated are based on the net assets of the Fund.
a Rate quoted represents the seven day yield of the fund.
See accompanying notes to financial statements.
11
COHEN & STEERS INSTITUTIONAL REALTY SHARES, INC.
STATEMENT OF ASSETS AND LIABILITIES
June 30, 2009 (Unaudited)
| ASSETS: | |||||||
| Investments in securities, at value (Identified cost—$530,940,758) | $ | 608,917,912 | |||||
| Cash | 30,655 | ||||||
| Receivable for: | |||||||
| Investment securities sold | 5,704,683 | ||||||
| Dividends and interest | 2,307,135 | ||||||
| Fund shares sold | 960,175 | ||||||
| Other assets | 4,896 | ||||||
| Total Assets | 617,925,456 | ||||||
| LIABILITIES: | |||||||
| Payable for: | |||||||
| Fund shares redeemed | 3,328,075 | ||||||
| Investment securities purchased | 2,772,494 | ||||||
| Dividends declared | 1,134,417 | ||||||
| Manager fees | 377,822 | ||||||
| Directors' fees | 2,428 | ||||||
| Other liabilities | 21,132 | ||||||
| Total Liabilities | 7,636,368 | ||||||
| NET ASSETS applicable to 29,099,311 shares of $0.001 par value of common stock outstanding | $ | 610,289,088 | |||||
| NET ASSET VALUE PER SHARE: ($610,289,088 ÷ 29,099,311 shares outstanding) | $ | 20.97 | |||||
| NET ASSETS consist of: | |||||||
| Paid-in-capital | $ | 850,678,927 | |||||
| Dividends in excess of net investment income | (3,225,644 | ) | |||||
| Accumulated net realized loss | (315,141,349 | ) | |||||
| Net unrealized appreciation | 77,977,154 | ||||||
| $ | 610,289,088 | ||||||
See accompanying notes to financial statements.
12
COHEN & STEERS INSTITUTIONAL REALTY SHARES, INC.
STATEMENT OF OPERATIONS
For the Six Months Ended June 30, 2009 (Unaudited)
| Investment Income: | |||||||
| Dividend income (net of $30,243 of foreign withholding tax) | $ | 11,944,290 | |||||
| Expenses: | |||||||
| Management fees | 1,981,251 | ||||||
| Directors' fees and expenses | 25,702 | ||||||
| Line of credit fees | 22,378 | ||||||
| Registration and filing fees | 13,416 | ||||||
| Dues and subscriptions | 9,687 | ||||||
| Total Expenses | 2,052,434 | ||||||
| Reduction of Expenses (See Note 2) | (71,183 | ) | |||||
| Net Expenses | 1,981,251 | ||||||
| Net Investment Income | 9,963,039 | ||||||
| Net Realized and Unrealized Gain (Loss): | |||||||
| Net realized loss on investments | (147,764,159 | ) | |||||
| Net change in unrealized appreciation | 80,436,322 | ||||||
| Net realized and unrealized loss | (67,327,837 | ) | |||||
| Net Decrease in Net Assets Resulting from Operations | $ | (57,364,798 | ) | ||||
See accompanying notes to financial statements.
13
COHEN & STEERS INSTITUTIONAL REALTY SHARES, INC.
STATEMENT OF CHANGES IN NET ASSETS (Unaudited)
| For the Six Months Ended June 30, 2009 | For the Year Ended December 31, 2008 | ||||||||||
| Change in Net Assets: | |||||||||||
| From Operations: | |||||||||||
| Net investment income | $ | 9,963,039 | $ | 20,200,314 | |||||||
| Net realized loss | (147,764,159 | ) | (142,846,632 | ) | |||||||
| Net change in unrealized appreciation (depreciation) | 80,436,322 | (182,542,619 | ) | ||||||||
| Net decrease in net assets resulting from operations | (57,364,798 | ) | (305,188,937 | ) | |||||||
| Dividends and Distributions to Shareholders from: | |||||||||||
| Net investment income | (14,496,459 | ) | (21,894,231 | ) | |||||||
| Tax return of capital | — | (12,831,040 | ) | ||||||||
| Total dividends and distributions to shareholders | (14,496,459 | ) | (34,725,271 | ) | |||||||
| Capital Stock Transactions: | |||||||||||
| Increase (decrease) in net assets from Fund share transactions | 77,292,794 | (16,550,892 | ) | ||||||||
| Total increase (decrease) in net assets | 5,431,537 | (356,465,100 | ) | ||||||||
| Net Assets: | |||||||||||
| Beginning of period | 604,857,551 | 961,322,651 | |||||||||
| End of perioda | $ | 610,289,088 | $ | 604,857,551 | |||||||
a Includes dividends in excess of net investment income and undistributed net investment income of $3,225,644 and $1,307,776, respectively.
See accompanying notes to financial statements.
14
COHEN & STEERS INSTITUTIONAL REALTY SHARES, INC.
FINANCIAL HIGHLIGHTS (Unaudited)
The following table includes selected data for a share outstanding throughout each period and other performance information derived from the financial statements. It should be read in conjunction with the financial statements and notes thereto.
| For the Six | For the Year ended December 31, | ||||||||||||||||||||||||||
| Months Ended | |||||||||||||||||||||||||||
| Per Share Operating Performance: | June 30, 2009 | 2008 | 2007 | 2006 | 2005 | 2004 | |||||||||||||||||||||
| Net asset value, beginning of period | $ | 24.05 | $ | 38.30 | $ | 56.49 | $ | 45.56 | $ | 45.47 | $ | 37.34 | |||||||||||||||
| Income from investment operations: | |||||||||||||||||||||||||||
| Net investment income | 0.36 | 0.83 | 0.94 | a | 0.70 | 0.81 | 0.99 | ||||||||||||||||||||
| Net realized and unrealized gain (loss) | (2.91 | ) | (13.69 | ) | (11.36 | ) | 15.87 | 5.77 | 13.11 | ||||||||||||||||||
| Total income (loss) from investment operations | (2.55 | ) | (12.86 | ) | (10.42 | ) | 16.57 | 6.58 | 14.10 | ||||||||||||||||||
| Less dividends and distributions to shareholders from: | |||||||||||||||||||||||||||
| Net investment income | (0.53 | ) | (0.88 | ) | (0.84 | ) | (0.70 | ) | (0.81 | ) | (0.99 | ) | |||||||||||||||
| Net realized gain | — | — | (6.93 | ) | (4.59 | ) | (5.36 | ) | (4.80 | ) | |||||||||||||||||
| Tax return of capital | — | (0.51 | ) | �� | (0.35 | ) | (0.32 | ) | (0.18 | ) | |||||||||||||||||
| Total dividends and distributions to shareholders | (0.53 | ) | (1.39 | ) | (7.77 | ) | (5.64 | ) | (6.49 | ) | (5.97 | ) | |||||||||||||||
| Net increase (decrease) in net asset value | (3.08 | ) | (14.25 | ) | (18.19 | ) | 10.93 | 0.09 | 8.13 | ||||||||||||||||||
| Net asset value, end of period | $ | 20.97 | $ | 24.05 | $ | 38.30 | $ | 56.49 | $ | 45.56 | $ | 45.47 | |||||||||||||||
| Total investment return | –10.27 | %b | –34.42 | % | –18.72 | % | 37.15 | % | 14.70 | % | 38.78 | % | |||||||||||||||
| Ratios/Supplemental Data: | |||||||||||||||||||||||||||
| Net assets, end of period (in millions) | $ | 610.3 | $ | 604.9 | $ | 961.3 | $ | 1,342.2 | $ | 1,012.1 | $ | 1,006.2 | |||||||||||||||
| Ratio of expenses to average daily net assets (before expense reduction) | 0.78 | %c | 0.77 | % | 0.76 | % | 0.77 | % | 0.76 | % | 0.76 | % | |||||||||||||||
| Ratio of expenses to average daily net assets (net of expense reduction) | 0.75 | %c | 0.75 | % | 0.75 | % | 0.75 | % | 0.75 | % | 0.75 | % | |||||||||||||||
| Ratio of net investment income to average daily net assets (before expense reduction) | 3.74 | %c | 2.29 | % | 1.54 | % | 1.26 | % | 1.65 | % | 2.23 | % | |||||||||||||||
| Ratio of net investment income to average daily net assets (net of expense reduction) | 3.77 | %c | 2.30 | % | 1.55 | % | 1.28 | % | 1.67 | % | 2.24 | % | |||||||||||||||
| Portfolio turnover rate | 72 | %b | 106 | % | 63 | % | 46 | % | 34 | % | 29 | % | |||||||||||||||
a 12.7% of net investment income was attributable to a special dividend paid by Boston Properties, Inc.
b Not annualized.
c Annualized.
See accompanying notes to financial statements.
15
COHEN & STEERS INSTITUTIONAL REALTY SHARES, INC.
NOTES TO FINANCIAL STATEMENTS (Unaudited)
Note 1. Significant Accounting Policies
Cohen & Steers Institutional Realty Shares, Inc. (the Fund) was incorporated under the laws of the State of Maryland on October 13, 1999 and is registered under the Investment Company Act of 1940, as amended, as a nondiversified, open-end management investment company. The Fund's investment objective is total return.
The following is a summary of significant accounting policies consistently followed by the Fund in the preparation of its financial statements. The policies are in conformity with accounting principles generally accepted in the United States of America (GAAP). The preparation of the financial statements in accordance with GAAP requires management to make estimates and assumptions that affect the reported amounts of assets and liabilities at the date of the financial statements and the reported amounts of income and expenses during the reporting period. Actual results could differ from those estimates.
Portfolio Valuation: Investments in securities that are listed on the New York Stock Exchange are valued, except as indicated below, at the last sale price reflected at the close of the New York Stock Exchange on the business day as of which such value is being determined. If there has been no sale on such day, the securities are valued at the mean of the closing bid and asked prices for the day or, if no asked price is available, at the bid price.
Securities not listed on the New York Stock Exchange but listed on other domestic or foreign securities exchanges or admitted to trading on the National Association of Securities Dealers Automated Quotations, Inc. (Nasdaq) national market system are valued in a similar manner. Securities traded on more than one securities exchange are valued at the last sale price on the business day as of which such value is being determined as reflected on the tape at the close of the exchange representing the principal market for such securities.
Readily marketable securities traded in the over-the-counter market, including listed securities whose primary market is believed by Cohen & Steers Capital Management, Inc. (the manager) to be over-the-counter are valued at the official closing prices as reported by Nasdaq, the Pink Sheets, or such other comparable sources as the Board of Directors deem appropriate to reflect their fair market value. If there has been no sale on such day, the securities are valued at the mean of the closing bid and asked prices for the day, or if no asked price is available, at the bid price. However, certain fixed-income securities may be valued on the basis of prices provided by a pricing service when such prices are believed by the Board of Directors to reflect the fair market value of such securities. Where securities are traded on more than one exchange and also over-the-counter, the securities will generally be valued using the quotations the Board of Directors believes most closely reflect the value of such securities.
Securities for which market prices are unavailable, or securities for which the manager determines that bid and/or asked price does not reflect market value, will be valued at fair value pursuant to procedures approved by the Fund's Board of Directors. Circumstances in which market prices may be unavailable include, but are not limited to, when trading in a security is suspended, the exchange on which the security is traded is subject to an unscheduled close or disruption or material events occur after the close of the exchange on which the security is principally traded. In these circumstances, the Fund determines fair value in a manner that fairly reflects the
16
COHEN & STEERS INSTITUTIONAL REALTY SHARES, INC.
NOTES TO FINANCIAL STATEMENTS (Unaudited)—(Continued)
market value of the security on the valuation date based on consideration of any information or factors it deems appropriate. These may include recent transactions in comparable securities, information relating to the specific security and developments in the markets.
The Fund's use of fair value pricing may cause the net asset value of Fund shares to differ from the net asset value that would be calculated using market quotations. Fair value pricing involves subjective judgments and it is possible that the fair value determined for a security may be materially different than the value that could be realized upon the sale of that security.
Short-term debt securities, which have a maturity date of 60 days or less, are valued at amortized cost, which approximates value.
The Fund adopted Financial Accounting Standards Board Statement of Financial Accounting Standards No. 157, "Fair Value Measurements" ("FAS 157"), effective January 1, 2008. In accordance with FAS 157, fair value is defined as the price that the Fund would receive to sell an investment or pay to transfer a liability in an orderly transaction with an independent buyer in the principal market, or in the absence of a principal market the most advantageous market for the investment or liability. FAS 157 establishes a single definition of fair value, creates a three-tier hierarchy as a framework for measuring fair value based on inputs used to value the Fund's investments, and requires additional disclosure about fair value. The hierarchy of inputs is summarized below.
• Level 1—quoted prices in active markets for identical investments
• Level 2—other significant observable inputs (including quoted prices for similar investments, interest rates, prepayment speeds, credit risk, etc.)
• Level 3—significant unobservable inputs (including the Fund's own assumptions in determining the fair value of investments)
The Fund adopted Financial Accounting Standards Board Statement of Financial Accounting Standards Staff Position No. 157-4 "Determining Fair Value When the Volume and Level of Activity for the Asset or Liability Have Significantly Decreased and Identifying Transactions That Are Not Orderly" ("FSP 157-4"), effective June 15, 2009. FSP 157-4 provides additional guidance for estimating fair value in accordance with FAS 157, when the volume and level of activity for the asset or liability have significantly decreased as well as guidance on identifying circumstances that indicate a transaction is not orderly.
The inputs or methodology used for valuing securities are not necessarily an indication of the risk associated with investing in those securities.
17
COHEN & STEERS INSTITUTIONAL REALTY SHARES, INC.
NOTES TO FINANCIAL STATEMENTS (Unaudited)—(Continued)
The following is a summary of the inputs used as of June 30, 2009 in valuing the Fund's investments carried at value:
| Fair Value Measurements at June 30, 2009 Using | |||||||||||||||||||
| Total | Quoted Prices In Active Market for Identical Assets (Level 1) | Significant Other Observable Inputs (Level 2) | Significant Unobservable Inputs (Level 3) | ||||||||||||||||
| Common stock—all industries | $ | 589,602,518 | $ | 589,602,518 | $ | — | — | ||||||||||||
| Money Market Funds | 19,315,394 | — | 19,315,394 | — | |||||||||||||||
| Total Investments | $ | 608,917,912 | $ | 589,602,518 | $ | 19,315,394 | — | ||||||||||||
Security Transactions, Investment Income and Expense Allocations: Security transactions are recorded on trade date. Realized gains and losses on investments sold are recorded on the basis of identified cost. Interest income is recorded on the accrual basis. Discounts are accreted and premiums are amortized over the life of the respective securities. Dividend income is recorded on the ex-dividend date. The Fund records distributions received in excess of income from underlying investments as a reduction of cost of investments and/or realized gain. Such amounts are based on estimates if actual amounts are not available, and actual amounts of income, realized gain and return of capital may differ from the estimated amounts. The Fund adjusts the estimated amounts of the components of distributions (and consequently its net investment income) as an increase to unrealiz ed appreciation/(depreciation) and realized gain/(loss) on investments as necessary once the issuers provide information about the actual composition of the distributions.
Dividends and Distributions to Shareholders: Dividends from net investment income and capital gain distributions are determined in accordance with U.S. federal income tax regulations, which may differ from GAAP. Dividends from net investment income are declared and paid quarterly. Net realized capital gains, unless offset by any available capital loss carryforward, are distributed to shareholders at least annually. Dividends and distributions to shareholders are recorded on the ex-dividend date and are automatically reinvested in full and fractional shares of the Fund based on the net asset value per share at the close of business on the payable date unless the shareholder has elected to have them paid in cash.
Distributions paid by the Fund are subject to recharacterization for tax purposes. Based upon the results of operations for the six months ended June 30, 2009, the investment manager considers it likely that a portion of the dividends will be reclassified to return of capital upon the final determination of the Fund's taxable income for the year.
Income Taxes: It is the policy of the Fund to continue to qualify as a regulated investment company, if such qualification is in the best interest of the shareholders, by complying with the requirements of Subchapter M of the Internal Revenue Code applicable to regulated investment companies, and by distributing substantially all of its taxable earnings to its shareholders. Accordingly, no provision for federal income or excise tax is necessary. The
18
COHEN & STEERS INSTITUTIONAL REALTY SHARES, INC.
NOTES TO FINANCIAL STATEMENTS (Unaudited)—(Continued)
Fund has adopted the provisions of FASB Interpretation No. 48, Accounting for Uncertainty in Income Taxes (FIN 48). FIN 48 clarifies the accounting for income taxes by prescribing the minimum recognition threshold a tax position must meet before being recognized in the financial statements. An assessment of the Fund's tax positions has been made and it has been determined that there is no impact to the Fund's financial statements. Each of the Fund's federal tax returns for the prior three fiscal years remains subject to examination by the Internal Revenue Service.
Note 2. Investment Advisory and Administration Fees and Other Transactions with Affiliates
Management Fees: The manager serves as the Fund's investment manager pursuant to an investment management agreement (the investment management agreement). Under the terms of the investment management agreement, the manager provides the Fund with the day-to-day investment decisions and generally manages the Fund's investments in accordance with the stated policies of the Fund, subject to the supervision of the Fund's Board of Directors. For the services provided to the Fund, the manager receives a fee, accrued daily and paid monthly, at the annual rate of 0.75% of the average daily net assets of the Fund.
The manager is also responsible, under the investment management agreement, for the performance of certain administrative functions for the Fund. Additionally, the manager pays certain expenses of the Fund, including administration and custody fees, transfer agent fees, professional fees, and reports to shareholders.
The manager has contractually agreed to reimburse the Fund so that its total annual operating expenses do not exceed 0.75% of the average daily net assets. This commitment will remain in place for the life of the Fund.
Directors' and Officers' Fees: Certain directors and officers of the Fund are also directors, officers, and/or employees of manager. The Fund does not pay compensation to any affiliated directors and officers.
Note 3. Purchases and Sales of Securities
Purchases and sales of securities, excluding short-term investments, for the six months ended June 30, 2009, totaled $465,275,429 and $376,996,337, respectively.
19
COHEN & STEERS INSTITUTIONAL REALTY SHARES, INC.
NOTES TO FINANCIAL STATEMENTS (Unaudited)—(Continued)
Note 4. Income Tax Information
As of June 30, 2009, the federal tax cost and net unrealized appreciation on securities were as follows:
| Gross unrealized appreciation | $ | 99,027,864 | |||||
| Gross unrealized depreciation | (21,050,710 | ) | |||||
| Net unrealized appreciation | $ | 77,977,154 | |||||
| Cost for federal income tax purposes | $ | 530,940,758 | |||||
As of December 31, 2008, the Fund had a net capital loss carryforward of $105,575,474, which will expire on December 31, 2016. This carryforward may be used to offset future capital gains to the extent provided by regulations.
Note 5. Capital Stock
The Fund is authorized to issue 100 million shares of capital stock, at a par value of $0.001 per share. The Board of Directors of the Fund may increase or decrease the aggregate number of shares of common stock that the Fund has authority to issue. Transactions in Fund shares were as follows:
| For the Six Months Ended June 30, 2009 | For the Year Ended December 31, 2008 | ||||||||||||||||||
| Shares | Amount | Shares | Amount | ||||||||||||||||
| Sold | 7,090,166 | $ | 138,717,588 | 12,698,306 | $ | 434,574,459 | |||||||||||||
| Issued as reinvestment of dividends and distributions | 667,550 | 12,166,140 | 882,872 | 27,905,383 | |||||||||||||||
| Redeemed | (3,810,955 | ) | (73,590,934 | ) | (13,526,319 | ) | (479,030,734 | ) | |||||||||||
| Net increase (decrease) | 3,946,761 | $ | 77,292,794 | 54,859 | $ | (16,550,892 | ) | ||||||||||||
Note 6. Borrowings
The Fund, in conjunction with other Cohen & Steers funds, is a party to a $200,000,000 syndicated credit agreement (the credit agreement) with State Street Bank and Trust Company, as administrative agent and operations agent, and the lenders identified in the credit agreement, which expires December 2009. The Fund pays a commitment fee of 0.15% per annum on its proportionate share of the unused portion of the credit agreement.
During the six months ended June 30, 2009, the Fund did not utilize the line of credit.
20
COHEN & STEERS INSTITUTIONAL REALTY SHARES, INC.
NOTES TO FINANCIAL STATEMENTS (Unaudited)—(Continued)
Note 7. Other
In the normal course of business, the Fund enters into contracts that provide general indemnifications. The Fund's maximum exposure under these arrangements is dependent on claims that may be made against the Fund in the future and, therefore, cannot be estimated; however, based on experience, the risk of material loss from such claims is considered remote.
Note 8. Subsequent Events
In May 2009, the Financial Accounting Standards Board (FASB) issued Statement of Financial Accounting Standards No. 165, Subsequent Events (FAS 165), effective for interim or annual periods ending after June 15, 2009. The FASB has established general standards of accounting for and disclosure of events that occur after the balance sheet date but before financial statements are issued or are available to be issued.
With regard to the Fund's financial statements, subsequent to June 30, 2009 and through August 18, 2009, there have been no recognized subsequent events (subsequent events that provide additional evidence about conditions that existed at the date of the balance sheet) nor have there been any nonrecognized subsequent events (subsequent events that provide evidence about conditions that did not exist at the date of the balance sheet but arose after the balance sheet but before the financial statements are issued or are available to be issued).
21
COHEN & STEERS INSTITUTIONAL REALTY SHARES, INC.
OTHER INFORMATION
A description of the policies and procedures that the Fund uses to determine how to vote proxies relating to portfolio securities is available (i) without charge, upon request, by calling 800-330-7348, (ii) on our Web site at cohenandsteers.com or (iii) on the Securities and Exchange Commission's Web site at http://www.sec.gov. In addition, the Fund's proxy voting record for the most recent 12-month period ended June 30 is available (i) without charge, upon request, by calling 800-330-7348 or (ii) on the SEC's Web site at http://www.sec.gov.
The Fund files its complete schedule of portfolio holdings with the SEC for the first and third quarters of each fiscal year on Form N-Q. The Fund's Forms N-Q are available (i) without charge, upon request by calling 800-330-7348, or (ii) on the SEC's Web site at http://www.sec.gov. In addition, the Forms N-Q may be reviewed and copied at the SEC's Public Reference Room in Washington, DC. Information on the operation of the Public Reference Room may be obtained by calling 800-SEC-0330.
Please note that the distributions paid by the Fund to shareholders are subject to recharacterization for tax purposes. The Fund may also pay distributions in excess of the Fund's net investment company taxable income and this excess would be a tax-free return of capital distributed from the Fund's assets. The final tax treatment of all distributions is reported to shareholders on their 1099-DIV forms, which are mailed after the close of each calendar year.
22
COHEN & STEERS INSTITUTIONAL REALTY SHARES, INC.
APPROVAL OF MANAGEMENT AGREEMENT
The Board of Directors of the Fund, including a majority of the directors who are not parties to the Fund's investment management agreement (the "Management Agreement"), or interested persons of any such party ("Independent Directors"), has the responsibility under the 1940 Act to approve the Fund's Management Agreement for its initial two year term and its continuation annually thereafter at a meeting of the board called for the purpose of voting on the approval or continuation. At a meeting held in person on March 17-18, 2009, the Management Agreement was discussed and was unanimously continued for a one-year term by the Fund's Board of Directors, including the Independent Directors. The Independent Directors were represented by independent counsel who assisted them in their deliberations during the meeting and executive session.
In considering whether to continue the Management Agreement, the Board of Directors reviewed materials provided by the Fund's investment manager (the "Investment Manager") and Fund counsel which included, among other things, fee, expense and performance information compared to peer funds ("Peer Funds") prepared by an independent data provider; supplemental performance and summary information prepared by the Investment Manager; and memoranda outlining the legal duties of the Board of Directors. The Board of Directors also spoke directly with representatives of the independent data provider and met with investment advisory personnel. In addition, the Board of Directors considered information provided from time to time by the Investment Manager throughout the year at meetings of the Board of Directors, including presentations by portfolio managers relating to the investment performance of the Fund and the investment strategies used in pursuing the Fund's objective. In particular, the Board of Directors considered the following:
(i) The nature, extent and quality of services to be provided by the Investment Manager: The Board of Directors reviewed the services that the Investment Manager provides to the Fund, including, but not limited to, making the day-to-day investment decisions for the Fund, and generally managing the Fund's investments in accordance with the stated policies of the Fund. The Board of Directors also discussed with officers and portfolio managers of the Fund the amount of time the Investment Manager dedicates to the Fund and the types of transactions that were being done on behalf of the Fund. Additionally, the Board of Directors took into account the services provided by the Investment Manager to its other funds, including those that invest substantially in real estate securities and have investment objectives and strategies similar to the Fund.
The Board of Directors next considered the education, background and experience of the Investment Manager's personnel, noting particularly that the favorable history and reputation of the portfolio managers for the Fund has had, and would likely continue to have, a favorable impact on the Fund. The Board of Directors further noted the Investment Manager's ability to attract quality and experienced personnel. After consideration of the above factors, among others, the Board of Directors concluded that the nature, quality and extent of services provided by the Investment Manager are adequate and appropriate.
23
COHEN & STEERS INSTITUTIONAL REALTY SHARES, INC.
(ii) Investment performance of the Fund and the Investment Manager: The Board of Directors considered the investment performance of the Fund compared to Peer Funds and compared to a relevant benchmark. The Board of Directors noted that the Fund had outperformed the medians of the Peer Funds for the one-, three- and five-year periods ended December 31, 2008, ranking the Fund in the first or second quintile over all periods. The Board of Directors also noted that the Fund had outperformed its benchmark for the same periods. The Board of Directors engaged in discussions with the Investment Manager regarding the Fund's most recent absolute performance, which was hampered by extreme market volatility during 2008 as a result of the recession and credit crisis. The Board of Directors also considered supplemental performance data provided by the Investment Manager, includ ing a narrative summary of various factors affecting performance, and the Investment Manager's performance in managing other real estate funds. The Board of Directors then determined that Fund performance, in light of all the considerations noted above, was satisfactory.
(iii) Cost of the services to be provided and profits to be realized by the Investment Manager from the relationship with the Fund: Next, the Board of Directors considered the management fees payable by the Fund as well as total expense ratios. As part of their analysis, the Board of Directors gave substantial consideration to the fee and expense analyses provided by the independent data provider. The Board of Directors noted that the Fund's actual and contractual management fees were lower than the Peer Funds' medians, ranking the Fund in the second quintile. The Board of Directors also noted that the overall net expense ratio was lower than the Peer Funds' median, ranking the Fund in the first quintile. The Board of Directors considered that the Investment Manager has contractually agreed to reimburse the Fund so that its total annual operating expenses never ex ceed 0.75% of average daily net assets over the life of the Fund. In light of the considerations above, the Board of Directors concluded that the Fund's expense structure was competitive in the peer group.
The Board of Directors also reviewed information regarding the profitability to the Investment Manager of its relationship with the Fund. The Board of Directors considered the level of the Investment Manager's profits and whether the profits were reasonable for the Investment Manager. The Board of Directors took into consideration other benefits to be derived by the Investment Manager in connection with the Management Agreement, noting particularly the research and related services, within the meaning of Section 28(e) of the Securities Exchange Act of 1934, as amended, that the Investment Manager receives by allocating the Fund's brokerage transactions. The Board of Directors concluded that the profits realized by the Investment Manager from its relationship with the Fund were reasonable and consistent with fiduciary duties.
(iv) The extent to which economies of scale would be realized as the Fund grows and whether fee levels would reflect such economies of scale: The Board of Directors noted that the Investment Manager pays certain operating costs of the Fund and reimburses the Fund to the extent that total expenses exceed the advisory fee rate; thus, the shareholders only incur the advisory fee costs. The Board of Directors determined that shareholders appropriately benefited from economies of scale.
24
COHEN & STEERS INSTITUTIONAL REALTY SHARES, INC.
(v) Comparison of services rendered and fees paid to those under other investment advisory contracts, such as contracts of the same and other investment advisers or other clients: As discussed above in (i) and (iii), the Board of Directors compared both the services rendered and the fees paid under the Management Agreement to those under other investment advisory contracts of other investment advisers managing Peer Funds. The Board of Directors also compared the services rendered and fees paid under the Management Agreement to the Investment Manager's other fund management agreements, as well as the profitability under the Management Agreement to the Investment Manager's other management contracts with institutional and other clients with similar investment mandates.
The Board of Directors determined that on a comparative basis the fees under the Management Agreement were reasonable in relation to the services provided.
No single factor was cited as determinative to the decision of the Board of Directors. Rather, after weighing all of the considerations and conclusions discussed above, the Board of Directors, including the Independent Directors, unanimously approved the continuation of the Management Agreement.
25
COHEN & STEERS INSTITUTIONAL REALTY SHARES, INC.
Meet the Cohen & Steers family of open-end funds:
COHEN & STEERS
GLOBAL REALTY SHARES
• Designed for investors seeking total return, investing primarily in global real estate equity securities
• Symbols: CSFAX, CSFBX, CSFCX, CSSPX
COHEN & STEERS
INSTITUTIONAL GLOBAL REALTY SHARES
• Designed for institutional investors seeking total return, investing primarily in global real estate securities
• Symbol: GRSIX
COHEN & STEERS
REALTY SHARES
• Designed for investors seeking total return, investing primarily in REITs
• Symbol: CSRSX
COHEN & STEERS
INSTITUTIONAL REALTY SHARES
• Designed for institutional investors seeking total return, investing primarily in REITs
• Symbol: CSRIX
COHEN & STEERS
REALTY INCOME FUND
• Designed for investors seeking maximum total return, investing primarily in real estate securities with an emphasis on both income and capital appreciation
• Symbols: CSEIX, CSBIX, CSCIX, CSDIX
COHEN & STEERS
INTERNATIONAL REALTY FUND
• Designed for investors seeking total return, investing primarily in international real estate securities
• Symbols: IRFAX, IRFCX, IRFIX
COHEN & STEERS
ASIA PACIFIC REALTY SHARES
• Designed for investors seeking total return, investing primarily in real estate securities located in the Asia Pacific region
• Symbols: APFAX, APFCX, APFIX
COHEN & STEERS
GLOBAL INFRASTRUCTURE FUND
• Designed for investors seeking total return, investing primarily in global infrastructure securities
• Symbols: CSUAX, CSUBX, CSUCX, CSUIX
COHEN & STEERS
DIVIDEND VALUE FUND
• Designed for investors seeking high current income and long-term growth of income and capital appreciation, investing primarily in dividend paying common stocks and preferred stocks
• Symbols: DVFAX, DVFCX, DVFIX
Please consider the investment objectives, risks, charges and expenses of the fund carefully before investing. A prospectus containing this and other information can be obtained by calling 800-330-7348 or by visiting cohenandsteers.com. Please read the prospectus carefully before investing.
Cohen & Steers Securities, LLC, Distributor
26
COHEN & STEERS INSTITUTIONAL REALTY SHARES, INC.
OFFICERS AND DIRECTORS
Robert H. Steers
Director and co-chairman
Martin Cohen
Director and co-chairman
Bonnie Cohen
Director
George Grossman
Director
Richard E. Kroon
Director
Richard J. Norman
Director
Frank K. Ross
Director
Willard H. Smith Jr.
Director
C. Edward Ward, Jr.
Director
Adam M. Derechin
President and chief executive officer
Joseph M. Harvey
Vice president
Jon Cheigh
Vice president
Francis C. Poli
Secretary
James Giallanza
Treasurer and chief financial officer
Lisa D. Phelan
Chief compliance officer
KEY INFORMATION
Manager
Cohen & Steers Capital Management, Inc.
280 Park Avenue
New York, NY 10017
(212) 832-3232
Fund Subadministrator and Custodian
State Street Bank and Trust Company
One Lincoln Street
Boston, MA 02111
Transfer Agent
Boston Financial Data Services, Inc.
30 Dan Road
Canton, MA 02021
(800) 437-9912
Legal Counsel
Stroock & Stroock & Lavan LLP
180 Maiden Lane
New York, NY 10038
Distributor
Cohen & Steers Securities, LLC
280 Park Avenue
New York, NY 10017
Nasdaq Symbol: CSRIX
Web site: cohenandsteers.com
This report is authorized for delivery only to shareholders of Cohen & Steers Institutional Realty Shares, Inc. unless accompanied or preceded by the delivery of a currently effective prospectus setting forth details of the Fund. Past performance is of course no guarantee of future results and your investment may be worth more or less at the time you sell.
27

eDelivery NOW AVAILABLE
Stop traditional mail delivery; receive your shareholder reports and prospectus online.
Sign up at cohenandsteers.com
COHEN & STEERS
INSTITUTIONAL REALTY SHARES
280 PARK AVENUE
NEW YORK, NY 10017
SEMIANNUAL REPORT
JUNE 30, 2009
CSRIXSAR
Item 2. Code of Ethics.
Not applicable.
Item 3. Audit Committee Financial Expert.
Not applicable.
Item 4. Principal Accountant Fees and Services.
Not applicable.
Item 5. Audit Committee of Listed Registrants.
Not applicable.
Item 6. Schedule of Investments.
Included in Item 1 above.
Item 7. Disclosure of Proxy Voting Policies and Procedures for Closed-End Management Investment Companies.
Not applicable.
Item 8. Portfolio Managers of Closed-End Management Investment Companies.
Not applicable.
Item 9. Purchases of Equity Securities by Closed-End Management Investment Company and Affiliated Purchasers.
Not applicable.
Item 10. Submission of Matters to a Vote of Security Holders.
None.
Item 11. Controls and Procedures.
(a) The registrant’s principal executive officer and principal financial officer have concluded, based upon their evaluation of the registrant’s disclosure controls and procedures as conducted within 90 days of the filing date of this report, that these disclosure controls and procedures provide reasonable assurance that material information required to be disclosed by the registrant in the report it files or submits on Form N-CSR is recorded, processed, summarized and reported within the time periods specified in the Securities and Exchange Commission’s rules and forms
and that such material information is accumulated and communicated to the registrant’s management, including its principal executive officer and principal financial officer, as appropriate, in order to allow timely decisions regarding required disclosure.
(b) There were no changes in the registrant’s internal control over financial reporting that occurred during the second fiscal quarter of the period covered by this report that have materially affected, or are reasonably likely to materially affect, the registrant’s internal control over financial reporting.
Item 12. Exhibits.
(a)(1) Not applicable.
(a) (2) Certifications of principal executive officer and principal financial officer as required by Rule 30a-2(a) under the Investment Company Act of 1940.
(a)(3) Not applicable.
(b) Certifications of principal executive officer and principal financial officer as required by Rule 30a- 2(b) under the Investment Company Act of 1940.
SIGNATURES
Pursuant to the requirements of the Securities Exchange Act of 1934 and the Investment Company Act of 1940, the registrant has duly caused this report to be signed on its behalf by the undersigned, thereunto duly authorized.
COHEN & STEERS INSTITUTIONAL REALTY SHARES, INC.
By: | /s/ Adam M. Derechin |
| |
| Name: | Adam M. Derechin |
|
| Title: | President and Chief Executive Officer |
|
|
|
| |
Date: August 25, 2009 |
| ||
Pursuant to the requirements of the Securities Exchange Act of 1934 and the Investment Company Act of 1940, this report has been signed below by the following persons on behalf of the registrant and in the capacities and on the dates indicated.
By: | /s/ Adam M. Derechin |
| |
| Name: | Adam M. Derechin |
|
| Title: | President and Chief Executive Officer |
|
|
| (principal executive officer) |
|
|
|
|
|
By: | /s/ James Giallanza |
| |
| Name: | James Giallanza |
|
| Title: | Treasurer |
|
|
| (principal financial officer) |
|
|
| ||
|
| ||
Date: August 25, 2009 |
| ||