| |
|
|
| |
Notes to Financial Statements (Unaudited) | BlackRock Large Cap Series Funds, Inc. |
1. Organization and Significant Accounting Policies:
BlackRock Large Cap Core Fund, BlackRock Large Cap Growth Fund and BlackRock Large Cap Value Fund (each a “Fund” and collectively the “Funds”), constitute BlackRock Large Cap Series Funds, Inc. (the “Corporation”), which is registered under the Investment Company Act of 1940, as amended (the “1940 Act”), as a diversified, open-end management investment company. The Corporation is organized as a Maryland corporation. Each Fund seeks to achieve its investment objective by investing all, or a portion of, its assets in Master Large Cap Core Portfolio, Master Large Cap Growth Portfolio and Master Large Cap Value Portfolio (collectively the “Portfolios”), respectively, constituting Master Large Cap Series LLC (the “Master LLC”), each of which has the same investment objective and strategies as the corresponding Fund. The value of a Fund’s investment in the applicable Portfolio reflects the Fund’s proportionate interest in the net assets of such Portfolio. As of March 31, 2010, the percentages of Master Large Cap Core Portfolio, Master Large Cap Growth Portfolio and Master Large Cap Value Portfolio owned by BlackRock Large Cap Core Fund, BlackRock Large Cap Growth Fund and BlackRock Large Cap Value Fund, were 77%, 79% and 92%, respectively. The performance of a Fund is directly affected by the performance of the applicable Portfolio. The financial statements of the Portfolios, including the Schedules of Investments, are included elsewhere in this report and should be read in conjunction with the Funds’ financial statements. The Funds’ financial statements are prepared in conformity with accounting principles generally accepted in the United States of America, which may require the use of management accruals and estimates. Actual results may differ from these estimates. The Funds offer multiple classes of shares. Institutional and Service Shares are sold without a sales charge and only to certain eligible investors. Investor A Shares are generally sold with a front-end sales charge. Investor B and Investor C Shares may be subject to a contingent deferred sales charge. Class R Shares are sold only to certain retirement or other similar plans. All classes of shares have identical voting, dividend, liquidation and other rights and the same terms and conditions, except that Service, Investor A, Investor B, Investor C and Class R Shares bear certain expenses related to the shareholder servicing of such shares, and Investor B, Investor C and Class R Shares also bear certain expenses related to the distribution of such shares. Investor B Shares automatically convert to Investor A Shares after approximately eight years. Investor B Shares are only available for purchase through exchanges, dividend reinvestment or the purchase by certain qualified employee benefit plans. Each class has exclusive voting rights with respect to matters relating to its shareholder servicing and distribution expenditures (except that Investor B shareholders may vote on material changes to the Investor A distribution plan).
Valuation: Each Fund records its investment in the corresponding Portfolio at fair value. Valuation of securities held by the Portfolios is discussed in Note 1 of the Portfolios’ Notes to Financial Statements, which are included elsewhere in this report.
Fair Value Measurements: Various inputs are used in determining the fair value of investments, which are as follows:
| | |
| • | Level 1 — price quotations in active markets/exchanges for identical assets and liabilities |
| | |
| • | Level 2 — other observable inputs (including, but not limited to: quoted prices for similar assets or liabilities in markets that are active, quoted prices for identical or similar assets or liabilities in markets that are not active, inputs other than quoted prices that are observable for the assets or liabilities (such as interest rates, yield curves, volatilities, prepayment speeds, loss severities, credit risks and default rates) or other market-corroborated inputs) |
| | |
| • | Level 3 — unobservable inputs based on the best information available in the circumstances, to the extent observable inputs are not available (including the Funds’ own assumptions used in determining the fair value of investments) |
The inputs or methodologies used for valuing securities are not necessarily an indication of the risk associated with investing in those securities.
As of March 31, 2010, each Fund’s investment in the respective Portfolio was classified as Level 2. More relevant disclosure regarding fair value measurements relating to the Portfolios, which is disclosed in the Portfolios’ Schedules of Investments included elsewhere in this report.
Investment Transactions and Net Investment Income: For financial reporting purposes, investment transactions in the Portfolios are accounted for on the dates the transactions are entered into (the trade dates). Each Fund records daily its proportionate share of the Portfolio’s income, expenses and realized and unrealized gains and losses. In addition, the Fund accrues its own expenses. Income and realized and unrealized gains and losses are allocated daily to each class based on its relative net assets.
Dividends and Distributions: Dividends and distributions paid by each Fund are recorded on the ex-dividend dates. The amount and timing of dividends and distributions are determined in accordance with US GAAP.
Income Taxes: It is each Fund’s policy to comply with the requirements of the Internal Revenue Code of 1986, as amended, applicable to regulated investment companies and to distribute substantially all of its taxable income to its shareholders. Therefore, no federal income tax provision is required.
Each Fund files US federal and various state and local tax returns. No income tax returns are currently under examination. The statute of limitations on each Fund’s US federal tax return remains open for each of the three years ended October 31, 2008 and the period ended September 30, 2009. The statutes of limitations on each Fund’s state and local tax returns may remain open for an additional year depending upon the jurisdiction.
Recent Accounting Standard: In January 2010, the Financial Accounting Standards Board issued amended guidance to improve disclosure about fair value measurements which will require additional disclosures about transfers into and out of Levels 1 and 2 and separate disclosures about purchases, sales, issuances and settlements in the reconciliation for fair value measurements using significant unobservable inputs (Level 3). It also clarifies existing disclosure requirements relating to the levels of disaggregation for fair value measurement and inputs and valuation techniques used to measure fair value. The amended guidance is effective for financial statements for fiscal years beginning after December 15, 2009, and interim periods within those fiscal years, except for disclosures about purchases, sales, issuances
| | |
|
|
|
36 | BLACKROCK LARGE CAP SERIES FUNDS, INC. | MARCH 31, 2010 |
| |
|
|
| |
Notes to Financial Statements (continued) | BlackRock Large Cap Series Funds, Inc. |
and settlements in the rollforward of activity in Level 3 fair value measurements, which are effective for fiscal years beginning after December 15, 2010 and for interim periods within those fiscal years. The impact of this guidance on the Fund’s financial statements and disclosures is currently being assessed.
Other: Expenses directly related to each Fund are charged to that Fund. Other operating expenses shared by several funds are pro rated among those funds on the basis of relative net assets or other appropriate methods. Other expenses of each Fund are allocated daily to each class based on its relative net assets.
2. Administration Agreements and Other Transactions with Affiliates:
The PNC Financial Services Group, Inc. (“PNC”), Bank of America Corporation (“BAC”) and Barclays Bank PLC (“Barclays”) are the largest stockholders of BlackRock, Inc. (“BlackRock”). Due to the ownership structure, PNC is an affiliate of the Funds for 1940 Act purposes, but BAC and Barclays are not.
The Corporation, on behalf of each Fund, has entered into an Administration Agreement with BlackRock Advisors, LLC (the “Administrator”), an indirect, wholly owned subsidiary of BlackRock, to provide administrative services (other than investment advice and related portfolio activities). For such services, each Fund pays the Administrator a monthly fee at an annual rate of 0.25% of the average daily value of each Fund’s net assets. The Funds do not pay an advisory fee or investment management fee.
With respect to BlackRock Large Cap Core Fund, the Administrator contractually agreed to waive and/or reimburse fees and/or expenses in order to limit expenses (excluding interest expense, acquired fund fees and expenses and certain other fund expenses) as a percentage of average daily net assets allocated to certain classes of the Fund as follows: 1.14% (for Investor A Shares) and 1.97% (for Investor B Shares). These amounts are shown as transfer agent fees waived or reimbursed in the Statements of Operations. The Administrator has agreed not to reduce or discontinue this contractual waiver or reimbursement until February 1, 2011 unless approved by the Board of Directors (the “Board”), including a majority of the non-interested Directors.
The Corporation, on behalf of each Fund, has entered into a Distribution Agreement and Distribution Plan with BlackRock Investments, LLC (“BRIL”), an affiliate of BlackRock. Pursuant to the Distribution Plan and in accordance with Rule 12b-1 under the 1940 Act, the Funds pay BRIL ongoing service and distribution fees. The fees are accrued daily and paid monthly at annual rates based upon the average daily net assets of the shares of each Fund as follows:
| | | | | | | |
|
|
|
|
|
|
| | Service
Fee | | Distribution
Fee | |
|
|
|
|
|
|
Service | | 0.25 | % | | — | | |
Investor A | | 0.25 | % | | — | | |
Investor B | | 0.25 | % | | 0.75 | % | |
Investor C | | 0.25 | % | | 0.75 | % | |
Class R | | 0.25 | % | | 0.25 | % | |
|
|
|
|
|
|
|
|
Pursuant to sub-agreements with BRIL, broker-dealers and BRIL provide shareholder servicing and distribution services to each Fund. The ongoing service and/or distribution fee compensates BRIL and each broker-dealer for providing shareholder servicing and/or distribution related services to Service, Investor A, Investor B, Investor C and Class R shareholders.
For the six months ended March 31, 2010, affiliates earned underwriting discounts, direct commissions and dealer concessions on sales of each Fund’s Investor A Shares as follows:
| | | | | |
|
|
|
|
|
| | Investor A | |
|
|
|
|
BlackRock Large Cap Core Fund | | $ | 24,487 | | |
BlackRock Large Cap Growth Fund | | $ | 10,460 | | |
BlackRock Large Cap Value Fund | | $ | 15,608 | | |
|
|
|
|
|
For the six months ended March 31, 2010, affiliates received the following contingent deferred sales charges relating to transactions in Investor B and Investor C Shares:
| | | | | | | | | |
|
|
|
|
|
|
| | Investor B | | Investor C | |
|
|
|
|
|
|
BlackRock Large Cap Core Fund | | $ | 77,814 | | | $ | 21,567 | | |
BlackRock Large Cap Growth Fund | | $ | 16,652 | | | $ | 2,881 | | |
BlackRock Large Cap Value Fund | | $ | 39,909 | | | $ | 12,946 | | |
|
|
|
|
|
|
|
|
Furthermore, affiliates received contingent deferred sales charges relating to transactions subject to front-end sales charge waivers on Investor A Shares as follows:
| | | | | |
|
|
|
|
|
| | Investor A | |
|
|
|
|
BlackRock Large Cap Core Fund | | $ | 236 | | |
BlackRock Large Cap Growth Fund | | $ | 215 | | |
BlackRock Large Cap Value Fund | | $ | 546 | | |
|
|
|
|
|
PNC Global Investment Servicing (U.S.) Inc. (“PNCGIS”), an indirect, wholly owned subsidiary of PNC and an affiliate of the Administrator, serves as transfer agent and dividend disbursing agent. Transfer agency fees borne by the Funds are comprised of those fees charged for all shareholder communications including mailing of shareholder reports, dividend and distribution notices, and proxy materials for shareholder meetings, as well as per account and per transaction fees related to servicing and maintenance of shareholder accounts, including the issuing, redeeming and transferring of shares, check writing, anti-money laundering services, and customer identification services.
Pursuant to written agreements, certain affiliates provide the Funds with sub-accounting, recordkeeping, sub-transfer agency and other administrative services with respect to sub-accounts they service. For these services, these affiliates receive an annual fee per shareholder account which will vary depending on share class. For the six months ended March 31, 2010, in return for these services which are included in transfer agent in the Statement of Operations:
| | | | |
|
|
|
|
|
BlackRock Large Cap Core Fund | | $ | 81,448 | |
BlackRock Large Cap Growth Fund | | $ | 14,107 | |
BlackRock Large Cap Value Fund | | $ | 77,562 | |
|
|
|
|
|
| | |
|
|
|
BLACKROCK LARGE CAP SERIES FUNDS, INC. | MARCH 31, 2010 | 37 |
| |
|
|
| |
Notes to Financial Statements (continued) | BlackRock Large Cap Series Funds, Inc. |
The Administrator maintains a call center, which is responsible for providing certain shareholder services to the Funds, such as responding to shareholder inquiries and processing transactions based upon instructions from shareholders with respect to the subscription and redemption of Fund shares. For the six months ended March 31, 2010, each Fund reimbursed the Manager the following amounts for costs incurred in running the call center, which are included in transfer agent — class specific in the Statements of Operations.
| | | | | | | | | | | | | |
|
|
|
|
|
|
|
|
| | BlackRock
Large Cap Core
Fund | | BlackRock
Large Cap Growth
Fund | | BlackRock
Large Cap Value
Fund | |
|
|
|
|
|
|
|
|
|
|
|
Institutional | | $ | 11,982 | | | $ | 211 | | | $ | 1,867 | | |
Service | | $ | 12 | | | $ | 70 | | | $ | 367 | | |
Investor A | | $ | 57,636 | | | $ | 1,306 | | | $ | 8,848 | | |
Investor B | | $ | 9,780 | | | $ | 224 | | | $ | 919 | | |
Investor C | | $ | 9,858 | | | $ | 696 | | | $ | 2,191 | | |
Class R | | $ | 690 | | | $ | 153 | | | $ | 383 | | |
|
|
|
|
|
|
|
|
|
|
|
Certain officers and/or directors of the Corporation are officers and/or directors of BlackRock or its affiliates. Each Fund reimburses the Administrator for compensation paid to the Funds’ Chief Compliance Officer.
3. Capital Loss Carryforwards:
As of September 30, 2009, the Funds had capital loss carryforwards available to offset future realized capital gains through the indicated expiration dates:
| | | | | | | | | | |
|
|
|
|
|
|
|
|
|
|
|
Expires September 30, | | BlackRock
Large Cap Core
Fund | | BlackRock
Large Cap Growth
Fund | | BlackRock
Large Cap Value
Fund | |
|
|
|
|
|
|
|
|
2010 | | $ | 26,458,063 | | $ | 43,580 | | | — | |
2011 | | | 2,999,774 | | | — | | | — | |
2016 | | | 423,595,759 | | | 71,355,323 | | $ | 464,452,445 | |
2017 | | | 703,142,916 | | | 108,285,961 | | | 783,574,227 | |
| |
|
|
|
|
|
|
|
|
|
Total | | $ | 1,156,196,512 | | $ | 179,684,864 | | $ | 1,248,026,672 | |
| |
|
|
|
|
|
|
|
|
|
4. Capital Share Transactions:
Transactions in capital shares for each class were as follows:
| | | | | | | | | | | | | | | | | | | |
| | Six Months Ended
March 31, 2010 | | Period November 1, 2008 to
September 30, 2009 | | Year Ended
October 31, 2008 | |
| |
| |
| |
|
|
BlackRock Large Cap Core Fund | | Shares | | Amount | | Shares | | Amount | | Shares | | Amount | |
|
|
|
|
|
|
|
|
|
|
|
|
|
|
Institutional | | | | | | | | | | | | | | | | | | | |
|
|
|
|
|
|
|
|
|
|
|
|
|
|
|
|
|
|
|
|
Shares sold | | | 5,581,246 | | $ | 56,214,861 | | | 43,838,825 | | $ | 396,894,309 | | | 18,307,143 | | $ | 213,274,693 | |
Shares issued resulting from reorganization | | | — | | | — | | | 9,664,610 | | | 75,542,880 | | | — | | | — | |
Shares issued to shareholders in reinvestment of dividends and distributions | | | 995,657 | | | 10,056,127 | | | — | | | — | | | 2,274,133 | | | 30,541,847 | |
| |
|
|
|
|
| |
|
|
|
|
| |
|
|
|
|
|
|
Total issued | | | 6,576,903 | | | 66,270,988 | | | 53,503,435 | | | 472,437,189 | | | 20,581,276 | | | 243,816,540 | |
Shares redeemed | | | (14,559,226 | ) | | (147,957,252 | ) | | (23,884,724 | ) | | (198,928,273 | ) | | (44,290,807 | ) | | (536,280,456 | ) |
| |
|
|
|
|
| |
|
|
|
|
| |
|
|
|
|
|
|
Net increase (decrease) | | | (7,982,323 | ) | $ | (81,686,264 | ) | | 29,618,711 | | $ | 273,508,916 | | | (23,709,531 | ) | $ | (292,463,916 | ) |
| |
|
|
|
|
| |
|
|
|
|
| |
|
|
|
|
|
|
|
|
|
|
|
|
|
|
|
|
|
|
|
|
|
|
|
|
|
|
Service | | | | | | | | | | | | | | | | | | | |
|
|
|
|
|
|
|
|
|
|
|
|
|
|
|
|
|
|
|
|
Shares sold | | | — | | | — | | | 1,434 | | $ | 12,041 | | | 1,706 | | $ | 20,740 | |
Shares issued to shareholders in reinvestment of dividends and distributions | | | 68 | | $ | 670 | | | — | | | — | | | 207 | | | 2,724 | |
| |
|
|
|
|
| |
|
|
|
|
| |
|
|
|
|
|
|
Total issued | | | 68 | | | 670 | | | 1,434 | | | 12,041 | | | 1,913 | | | 23,464 | |
Shares redeemed | | | (3,823 | ) | | (37,841 | ) | | (3,851 | ) | | (33,636 | ) | | (2,490 | ) | | (29,767 | ) |
| |
|
|
|
|
| |
|
|
|
|
| |
|
|
|
|
|
|
Net decrease | | | (3,755 | ) | $ | (37,171 | ) | | (2,417 | ) | $ | (21,595 | ) | | (577 | ) | $ | (6,303 | ) |
| |
|
|
|
|
| |
|
|
|
|
| |
|
|
|
|
|
|
| | |
|
|
|
38 | BLACKROCK LARGE CAP SERIES FUNDS, INC. | MARCH 31, 2010 |
| |
|
|
| |
Notes to Financial Statements (continued) | BlackRock Large Cap Series Funds, Inc. |
| | | | | | | | | | | | | | | | | | | |
| | Six Months Ended
March 31, 2010 | | Period November 1, 2008 to
September 30, 2009 | | Year Ended
October 31, 2008 | |
| |
| |
| |
|
|
BlackRock Large Cap Core Fund (concluded) | | Shares | | Amount | | Shares | | Amount | | Shares | | Amount | |
|
|
|
|
|
|
|
|
|
|
|
|
|
|
Investor A | | | | | | | | | | | | | | | | | | | |
|
|
|
|
|
|
|
|
|
|
|
|
|
|
|
|
|
|
|
|
Shares sold and automatic conversion of shares | | | 6,683,993 | | $ | 65,910,906 | | | 19,460,075 | | $ | 156,006,893 | | | 25,121,752 | | $ | 287,778,279 | |
Shares issued resulting from reorganization | | | — | | | — | | | 398,482 | | | 3,049,251 | | | — | | | — | |
Shares issued to shareholders in reinvestment of dividends and distributions | | | 1,021,936 | | | 10,096,707 | | | — | | | — | | | 3,501,677 | | | 46,152,207 | |
| |
|
|
|
|
| |
|
|
|
|
| |
|
|
|
|
|
|
Total issued | | | 7,705,929 | | | 76,007,613 | | | 19,858,557 | | | 159,056,144 | | | 28,623,429 | | | 333,930,486 | |
Shares redeemed | | | (14,516,911 | ) | | (142,737,412 | ) | | (29,001,793 | ) | | (232,580,039 | ) | | (36,162,977 | ) | | (410,373,242 | ) |
| |
|
|
|
|
| |
|
|
|
|
| |
|
|
|
|
|
|
Net decrease | | | (6,810,982 | ) | $ | (66,729,799 | ) | | (9,143,236 | ) | $ | (73,523,895 | ) | | (7,539,548 | ) | $ | (76,442,756 | ) |
| |
|
|
|
|
| |
|
|
|
|
| |
|
|
|
|
|
|
|
|
|
|
|
|
|
|
|
|
|
|
|
|
|
|
|
|
|
|
Investor B | | | | | | | | | | | | | | | | | | | |
|
|
|
|
|
|
|
|
|
|
|
|
|
|
|
|
|
|
|
|
Shares sold | | | 282,349 | | $ | 2,609,232 | | | 1,330,571 | | $ | 9,828,180 | | | 1,944,126 | | $ | 21,374,807 | |
Shares issued to shareholders in reinvestment of dividends and distributions | | | 18,880 | | | 175,014 | | | — | | | — | | | 965,784 | | | 12,033,720 | |
| |
|
|
|
|
| |
|
|
|
|
| |
|
|
|
|
|
|
Total issued | | | 301,229 | | | 2,784,246 | | | 1,330,571 | | | 9,828,180 | | | 2,909,910 | | | 33,408,527 | |
Shares redeemed and automatic conversion of shares | | | (3,233,924 | ) | | (29,821,910 | ) | | (10,542,617 | ) | | (78,386,183 | ) | | (16,534,915 | ) | | (175,371,510 | ) |
| |
|
|
|
|
| |
|
|
|
|
| |
|
|
|
|
|
|
Net decrease | | | (2,932,695 | ) | $ | (27,037,664 | ) | | (9,212,046 | ) | $ | (68,558,003 | ) | | (13,625,005 | ) | $ | (141,962,983 | ) |
| |
|
|
|
|
| |
|
|
|
|
| |
|
|
|
|
|
|
|
|
|
|
|
|
|
|
|
|
|
|
|
|
|
|
|
|
|
|
Investor C | | | | | | | | | | | | | | | | | | | |
|
|
|
|
|
|
|
|
|
|
|
|
|
|
|
|
|
|
|
|
Shares sold | | | 4,555,290 | | $ | 41,662,737 | | | 12,253,383 | | $ | 91,559,769 | | | 18,173,395 | | $ | 198,511,648 | |
Shares issued to shareholders in reinvestment of dividends and distributions | | | 184,903 | | | 1,699,248 | | | — | | | — | | | 2,978,085 | | | 36,928,497 | |
| |
|
|
|
|
| |
|
|
|
|
| |
|
|
|
|
|
|
Total issued | | | 4,740,193 | | | 43,361,985 | | | 12,253,383 | | | 91,559,769 | | | 21,151,480 | | | 235,440,145 | |
Shares redeemed | | | (10,630,088 | ) | | (97,104,045 | ) | | (27,245,486 | ) | | (201,291,278 | ) | | (37,605,977 | ) | | (400,427,690 | ) |
| |
|
|
|
|
| |
|
|
|
|
| |
|
|
|
|
|
|
Net decrease | | | (5,889,895 | ) | $ | (53,742,060 | ) | | (14,992,103 | ) | $ | (109,731,509 | ) | | (16,454,497 | ) | $ | (164,987,545 | ) |
| |
|
|
|
|
| |
|
|
|
|
| |
|
|
|
|
|
|
|
|
|
|
|
|
|
|
|
|
|
|
|
|
|
|
|
|
|
|
Class R | | | | | | | | | | | | | | | | | | | |
|
|
|
|
|
|
|
|
|
|
|
|
|
|
|
|
|
|
|
|
Shares sold | | | 1,362,983 | | $ | 12,942,712 | | | 3,485,022 | | $ | 26,708,974 | | | 5,011,848 | | $ | 56,841,792 | |
Shares issued to shareholders in reinvestment of dividends and distributions | | | 64,795 | | | 614,263 | | | — | | | — | | | 351,544 | | | 4,475,160 | |
| |
|
|
|
|
| |
|
|
|
|
| |
|
|
|
|
|
|
Total issued | | | 1,427,778 | | | 13,556,975 | | | 3,485,022 | | | 26,708,974 | | | 5,363,392 | | | 61,316,952 | |
Shares redeemed | | | (2,331,757 | ) | | (22,029,626 | ) | | (4,955,971 | ) | | (38,331,982 | ) | | (5,004,446 | ) | | (54,816,870 | ) |
| |
|
|
|
|
| |
|
|
|
|
| |
|
|
|
|
|
|
Net increase (decrease) | | | (903,979 | ) | $ | (8,472,651 | ) | | (1,470,949 | ) | $ | (11,623,008 | ) | | 358,946 | | $ | 6,500,082 | |
| |
|
|
|
|
| |
|
|
|
|
| |
|
|
|
|
|
|
| | | | | | | | | | | | | | | | | | | |
BlackRock Large Cap Growth Fund | | | | | | | | | | | | | | | | | | | |
|
|
|
|
|
|
|
|
|
|
|
|
|
|
|
|
|
|
|
|
Institutional | | | | | | | | | | | | | | | | | | | |
|
|
|
|
|
|
|
|
|
|
|
|
|
|
|
|
|
|
|
|
Shares sold | | | 698,583 | | $ | 6,603,487 | | | 3,200,408 | | $ | 23,028,793 | | | 7,511,633 | | $ | 73,321,006 | |
Shares issued to shareholders in reinvestment of dividends and distributions | | | 14,930 | | | 140,651 | | | — | | | — | | | 712,440 | | | 8,123,721 | |
| |
|
|
|
|
| |
|
|
|
|
| |
|
|
|
|
|
|
Total issued | | | 713,513 | | | 6,744,138 | | | 3,200,408 | | | 23,028,793 | | | 8,224,073 | | | 81,444,727 | |
Shares redeemed | | | (3,024,173 | ) | | (27,844,699 | ) | | (9,449,134 | ) | | (66,001,834 | ) | | (21,883,831 | ) | | (232,545,666 | ) |
| |
|
|
|
|
| |
|
|
|
|
| |
|
|
|
|
|
|
Net decrease | | | (2,310,660 | ) | $ | (21,100,561 | ) | | (6,248,726 | ) | $ | (42,973,041 | ) | | (13,659,758 | ) | $ | (151,100,939 | ) |
| |
|
|
|
|
| |
|
|
|
|
| |
|
|
|
|
|
|
| | |
|
|
|
BLACKROCK LARGE CAP SERIES FUNDS, INC. | MARCH 31, 2010 | 39 |
| |
|
|
| |
Notes to Financial Statements (continued) | BlackRock Large Cap Series Funds, Inc. |
| | | | | | | | | | | | | | | | | | | |
| | Six Months Ended
March 31, 2010 | | Period November 1, 2008 to
September 30, 2009 | | Year Ended
October 31, 2008 | |
| |
| |
| |
|
|
BlackRock Large Cap Growth Fund (concluded) | | Shares | | Amount | | Shares | | Amount | | Shares | | Amount | |
|
|
|
|
|
|
|
|
|
|
|
|
|
|
|
|
|
|
|
|
Service | | | | | | | | | | | | | | | | | | | |
|
|
|
|
|
|
|
|
|
|
|
|
|
|
|
|
|
|
|
|
Shares sold | | | 140,088 | | $ | 1,305,228 | | | 739,068 | | $ | 5,283,078 | | | 800,038 | | $ | 8,201,394 | |
Shares issued to shareholders in reinvestment of dividends and distributions | | | 2,316 | | | 21,700 | | | — | | | — | | | 25,764 | | | 292,397 | |
| |
|
|
|
|
| |
|
|
|
|
| |
|
|
|
|
|
|
Total issued | | | 142,404 | | | 1,326,928 | | | 739,068 | | | 5,283,078 | | | 825,802 | | | 8,493,791 | |
Shares redeemed | | | (182,693 | ) | | (1,640,728 | ) | | (837,138 | ) | | (6,169,884 | ) | | (343,432 | ) | | (3,339,036 | ) |
| |
|
|
|
|
| |
|
|
|
|
| |
|
|
|
|
|
|
Net increase (decrease) | | | (40,289 | ) | $ | (313,800 | ) | | (98,070 | ) | $ | (886,806 | ) | | 482,370 | | $ | 5,154,755 | |
| |
|
|
|
|
| |
|
|
|
|
| |
|
|
|
|
|
|
|
|
|
|
|
|
|
|
|
|
|
|
|
|
|
|
|
|
|
|
Investor A | | | | | | | | | | | | | | | | | | | |
|
|
|
|
|
|
|
|
|
|
|
|
|
|
|
|
|
|
|
|
Shares sold and automatic conversion of shares | | | 3,615,967 | | $ | 33,374,995 | | | 15,330,815 | | $ | 108,752,602 | | | 11,239,300 | | $ | 111,809,291 | |
Shares issued to shareholders in reinvestment of dividends and distributions | | | 49,226 | | | 451,398 | | | — | | | — | | | 738,365 | | | 8,229,629 | |
| |
|
|
|
|
| |
|
|
|
|
| |
|
|
|
|
|
|
Total issued | | | 3,665,193 | | | 33,826,393 | | | 15,330,815 | | | 108,752,602 | | | 11,977,665 | | | 120,038,920 | |
Shares redeemed | | | (6,116,629 | ) | | (55,477,462 | ) | | (9,279,289 | ) | | (66,682,725 | ) | | (14,146,657 | ) | | (138,339,235 | ) |
| |
|
|
|
|
| |
|
|
|
|
| |
|
|
|
|
|
|
Net increase (decrease) | | | (2,451,436 | ) | $ | (21,651,069 | ) | | 6,051,526 | | $ | 42,069,877 | | | (2,168,992 | ) | $ | (18,300,315 | ) |
| |
|
|
|
|
| |
|
|
|
|
| |
|
|
|
|
|
|
|
|
|
|
|
|
|
|
|
|
|
|
|
|
|
|
|
|
|
|
Investor B | | | | | | | | | | | | | | | | | | | |
|
|
|
|
|
|
|
|
|
|
|
|
|
|
|
|
|
|
|
|
Shares sold | | | 81,822 | | $ | 689,503 | | | 553,780 | | $ | 3,562,794 | | | 1,001,693 | | $ | 9,563,976 | |
Shares issued to shareholders in reinvestment of dividends and distributions | | | — | | | — | | | — | | | — | | | 249,325 | | | 2,610,264 | |
| |
|
|
|
|
| |
|
|
|
|
| |
|
|
|
|
|
|
Total issued | | | 81,822 | | | 689,503 | | | 553,780 | | | 3,562,794 | | | 1,251,018 | | | 12,174,240 | |
Shares redeemed and automatic conversion of shares | | | (1,110,914 | ) | | (9,350,424 | ) | | (3,063,760 | ) | | (19,937,014 | ) | | (4,616,366 | ) | | (41,341,832 | ) |
| |
|
|
|
|
| |
|
|
|
|
| |
|
|
|
|
|
|
Net decrease | | | (1,029,092 | ) | $ | (8,660,921 | ) | | (2,509,980 | ) | $ | (16,374,220 | ) | | (3,365,348 | ) | $ | (29,167,592 | ) |
| |
|
|
|
|
| |
|
|
|
|
| |
|
|
|
|
|
|
|
|
|
|
|
|
|
|
|
|
|
|
|
|
|
|
|
|
|
|
Investor C | | | | | | | | | | | | | | | | | | | |
|
|
|
|
|
|
|
|
|
|
|
|
|
|
|
|
|
|
|
|
Shares sold | | | 1,226,353 | | $ | 10,320,854 | | | 4,024,125 | | $ | 26,137,785 | | | 5,629,306 | | $ | 52,751,745 | |
Shares issued to shareholders in reinvestment of dividends and distributions | | | — | | | — | | | — | | | — | | | 698,980 | | | 7,309,379 | |
| |
|
|
|
|
| |
|
|
|
|
| |
|
|
|
|
|
|
Total issued | | | 1,226,353 | | | 10,320,854 | | | 4,024,125 | | | 26,137,785 | | | 6,328,286 | | | 60,061,124 | |
Shares redeemed | | | (3,053,557 | ) | | (25,798,790 | ) | | (7,506,579 | ) | | (49,077,741 | ) | | (9,646,626 | ) | | (87,478,848 | ) |
| |
|
|
|
|
| |
|
|
|
|
| |
|
|
|
|
|
|
Net decrease | | | (1,827,204 | ) | $ | (15,477,936 | ) | | (3,482,454 | ) | $ | (22,939,956 | ) | | (3,318,340 | ) | $ | (27,417,724 | ) |
| |
|
|
|
|
| |
|
|
|
|
| |
|
|
|
|
|
|
|
|
|
|
|
|
|
|
|
|
|
|
|
|
|
|
|
|
|
|
Class R | | | | | | | | | | | | | | | | | | | |
|
|
|
|
|
|
|
|
|
|
|
|
|
|
|
|
|
|
|
|
Shares sold | | | 1,129,939 | | $ | 9,932,208 | | | 3,385,315 | | $ | 23,673,982 | | | 3,819,354 | | $ | 36,987,224 | |
Shares issued to shareholders in reinvestment of dividends and distributions | | | — | | | — | | | — | | | — | | | 242,342 | | | 2,618,770 | |
| |
|
|
|
|
| |
|
|
|
|
| |
|
|
|
|
|
|
Total issued | | | 1,129,939 | | | 9,932,208 | | | 3,385,315 | | | 23,673,982 | | | 4,061,696 | | | 39,605,994 | |
Shares redeemed | | | (1,876,806 | ) | | (16,551,738 | ) | | (3,807,630 | ) | | (26,171,138 | ) | | (4,306,198 | ) | | (40,459,087 | ) |
| |
|
|
|
|
| |
|
|
|
|
| |
|
|
|
|
|
|
Net decrease | | | (746,867 | ) | $ | (6,619,530 | ) | | (422,315 | ) | $ | (2,497,156 | ) | | (244,502 | ) | $ | (853,093 | ) |
| |
|
|
|
|
| |
|
|
|
|
| |
|
|
|
|
|
|
| | |
|
|
|
40 | BLACKROCK LARGE CAP SERIES FUNDS, INC. | MARCH 31, 2010 |
| |
|
|
| |
Notes to Financial Statements (concluded) | BlackRock Large Cap Series Funds, Inc. |
| | | | | | | | | | | | | | | | | | | |
| | Six Months Ended
March 31, 2010 | | Period November 1, 2008 to
September 30, 2009 | | Year Ended
October 31, 2008 | |
| |
| |
| |
|
|
BlackRock Large Cap Value Fund | | Shares | | Amount | | Shares | | Amount | | Shares | | Amount | |
|
|
|
|
|
|
|
|
|
|
|
|
|
|
|
|
|
|
|
|
Institutional | | | | | | | | | | | | | | | | | | | |
|
|
|
|
|
|
|
|
|
|
|
|
|
|
|
|
|
|
|
|
Shares sold | | | 7,556,007 | | $ | 102,422,977 | | | 32,615,703 | | $ | 371,335,366 | | | 36,894,137 | | $ | 614,681,902 | |
Shares issued to shareholders in reinvestment of dividends and distributions | | | 623,361 | | | 8,446,535 | | | 832,481 | | | 9,823,482 | | | 4,133,919 | | | 77,302,827 | |
| |
|
|
|
|
| |
|
|
|
|
| |
|
|
|
|
|
|
Total issued | | | 8,179,368 | | | 110,869,512 | | | 33,448,184 | | | 381,158,848 | | | 41,028,056 | | | 691,984,729 | |
Shares redeemed | | | (15,905,073 | ) | | (215,383,844 | ) | | (37,939,377 | ) | | (425,168,526 | ) | | (33,791,812 | ) | | (566,502,267 | ) |
| |
|
|
|
|
| |
|
|
|
|
| |
|
|
|
|
|
|
Net increase (decrease) | | | (7,725,705 | ) | $ | (104,514,332 | ) | | (4,491,193 | ) | $ | (44,009,678 | ) | | 7,236,244 | | $ | 125,482,462 | |
| |
|
|
|
|
| |
|
|
|
|
| |
|
|
|
|
|
|
|
|
|
|
|
|
|
|
|
|
|
|
|
|
|
|
|
|
|
|
Service | | | | | | | | | | | | | | | | | | | |
|
|
|
|
|
|
|
|
|
|
|
|
|
|
|
|
|
|
|
|
Shares sold | | | 339,026 | | $ | 4,577,865 | | | 869,931 | | $ | 10,024,519 | | | 706,019 | | $ | 11,959,010 | |
Shares issued to shareholders in reinvestment of dividends and distributions | | | 22,284 | | | 301,721 | | | 25,134 | | | 296,329 | | | 112,372 | | | 2,099,110 | |
| |
|
|
|
|
| |
|
|
|
|
| |
|
|
|
|
|
|
Total issued | | | 361,310 | | | 4,879,586 | | | 895,065 | | | 10,320,848 | | | 818,391 | | | 14,058,120 | |
Shares redeemed | | | (231,381 | ) | | (3,083,985 | ) | | (700,419 | ) | | (7,985,278 | ) | | (420,028 | ) | | (6,793,559 | ) |
| |
|
|
|
|
| |
|
|
|
|
| |
|
|
|
|
|
|
Net increase | | | 129,929 | | $ | 1,795,601 | | | 194,646 | | $ | 2,335,570 | | | 398,363 | | $ | 7,264,561 | |
| |
|
|
|
|
| |
|
|
|
|
| |
|
|
|
|
|
|
|
|
|
|
|
|
|
|
|
|
|
|
|
|
|
|
|
|
|
|
Investor A | | | | | | | | | | | | | | | | | | | |
|
|
|
|
|
|
|
|
|
|
|
|
|
|
|
|
|
|
|
|
Shares sold and automatic conversion of shares | | | 6,395,615 | | $ | 85,308,892 | | | 22,786,796 | | $ | 253,248,797 | | | 48,856,474 | | $ | 810,946,846 | |
Shares issued to shareholders in reinvestment of dividends and distributions | | | 585,808 | | | 7,814,678 | | | 697,851 | | | 8,109,178 | | | 8,148,668 | | | 149,528,060 | |
| |
|
|
|
|
| |
|
|
|
|
| |
|
|
|
|
|
|
Total issued | | | 6,981,423 | | | 93,123,570 | | | 23,484,647 | | | 261,357,975 | | | 57,005,142 | | | 960,474,906 | |
Shares redeemed | | | (14,368,477 | ) | | (191,254,786 | ) | | (56,253,555 | ) | | (638,708,323 | ) | | (71,052,529 | ) | | (1,126,150,477 | ) |
| |
|
|
|
|
| |
|
|
|
|
| |
|
|
|
|
|
|
Net decrease | | | (7,387,054 | ) | $ | (98,131,216 | ) | | (32,768,908 | ) | $ | (377,350,348 | ) | | (14,047,387 | ) | $ | (165,675,571 | ) |
| |
|
|
|
|
| |
|
|
|
|
| |
|
|
|
|
|
|
|
|
|
|
|
|
|
|
|
|
|
|
|
|
|
|
|
|
|
|
Investor B | | | | | | | | | | | | | | | | | | | |
|
|
|
|
|
|
|
|
|
|
|
|
|
|
|
|
|
|
|
|
Shares sold | | | 165,847 | | $ | 2,091,492 | | | 719,124 | | $ | 7,481,609 | | | 1,092,265 | | $ | 17,474,705 | |
Shares issued to shareholders in reinvestment of distributions | | | — | | | — | | | — | | | — | | | 854,376 | | | 14,866,308 | |
| |
|
|
|
|
| |
|
|
|
|
| |
|
|
|
|
|
|
Total issued | | | 165,847 | | | 2,091,492 | | | 719,124 | | | 7,481,609 | | | 1,946,641 | | | 32,341,013 | |
Shares redeemed and automatic conversion of shares | | | (1,430,902 | ) | | (18,043,889 | ) | | (5,053,679 | ) | | (52,822,330 | ) | | (6,636,951 | ) | | (100,755,559 | ) |
| |
|
|
|
|
| |
|
|
|
|
| |
|
|
|
|
|
|
Net decrease | | | (1,265,055 | ) | $ | (15,952,397 | ) | | (4,334,555 | ) | $ | (45,340,721 | ) | | (4,690,310 | ) | $ | (68,414,546 | ) |
| |
|
|
|
|
| |
|
|
|
|
| |
|
|
|
|
|
|
|
|
|
|
|
|
|
|
|
|
|
|
|
|
|
|
|
|
|
|
Investor C | | | | | | | | | | | | | | | | | | | |
|
|
|
|
|
|
|
|
|
|
|
|
|
|
|
|
|
|
|
|
Shares sold | | | 1,983,118 | | $ | 24,345,592 | | | 5,645,722 | | $ | 59,078,869 | | | 8,488,185 | | $ | 132,881,032 | |
Shares issued to shareholders in reinvestment of distributions | | | 7,747 | | | 604,065 | | | — | | | — | | | 3,171,063 | | | 54,954,834 | |
| |
|
|
|
|
| |
|
|
|
|
| |
|
|
|
|
|
|
Total issued | | | 1,990,865 | | | 24,949,657 | | | 5,645,722 | | | 59,078,869 | | | 11,659,248 | | | 187,835,866 | |
Shares redeemed | | | (6,154,791 | ) | | (77,044,686 | ) | | (14,777,083 | ) | | (154,061,182 | ) | | (20,768,438 | ) | | (319,453,157 | ) |
| |
|
|
|
|
| |
|
|
|
|
| |
|
|
|
|
|
|
Net decrease | | | (4,163,926 | ) | $ | (52,095,029 | ) | | (9,131,361 | ) | $ | (94,982,313 | ) | | (9,109,190 | ) | $ | (131,617,291 | ) |
| |
|
|
|
|
| |
|
|
|
|
| |
|
|
|
|
|
|
|
|
|
|
|
|
|
|
|
|
|
|
|
|
|
|
|
|
|
|
Class R | | | | | | | | | | | | | | | | | | | |
|
|
|
|
|
|
|
|
|
|
|
|
|
|
|
|
|
|
|
|
Shares sold | | | 1,582,114 | | $ | 20,396,308 | | | 4,471,624 | | $ | 48,009,946 | | | 5,771,456 | | $ | 92,978,324 | |
Shares issued to shareholders in reinvestment of dividends and distributions | | | 75,054 | | | 968,199 | | | 65,284 | | | 734,458 | | | 788,255 | | | 14,015,179 | |
| |
|
|
|
|
| |
|
|
|
|
| |
|
|
|
|
|
|
Total issued | | | 1,657,168 | | | 21,364,507 | | | 4,536,908 | | | 48,744,404 | | | 6,559,711 | | | 106,993,503 | |
Shares redeemed | | | (2,575,917 | ) | | (33,274,469 | ) | | (5,511,545 | ) | | (59,524,278 | ) | | (4,981,736 | ) | | (78,250,333 | ) |
| |
|
|
|
|
| |
|
|
|
|
| |
|
|
|
|
|
|
Net increase (decrease) | | | (918,749 | ) | $ | (11,909,962 | ) | | (974,637 | ) | $ | (10,779,874 | ) | | 1,577,975 | | $ | 28,743,170 | |
| |
|
|
|
|
| |
|
|
|
|
| |
|
|
|
|
|
|
5. Subsequent Events:
Management has evaluated the impact of all subsequent events on each Fund through the date the financial statements were issued, and has determined that there were no subsequent events requiring adjustment or disclosure in the financial statements.
| | |
|
|
|
BLACKROCK LARGE CAP SERIES FUNDS, INC. | MARCH 31, 2010 | 41 |
| |
|
| |
Portfolio Information as of March 31, 2010 | Master Large Cap Series LLC |
| | | |
Master Large Cap Core Portfolio | | Percent of
Long-Term Investments |
|
|
|
|
Microsoft Corp. | | 3 | % |
International Business Machines Corp. | | 2 | |
Exxon Mobil Corp. | | 2 | |
ConocoPhillips | | 2 | |
Amgen, Inc. | | 2 | |
Verizon Communications, Inc. | | 1 | |
Freeport-McMoRan Copper & Gold, Inc., Class B | | 1 | |
Target Corp. | | 1 | |
UnitedHealth Group, Inc. | | 1 | |
WellPoint, Inc. | | 1 | |
|
|
|
|
| | | |
Master Large Cap Growth Portfolio | | Percent of
Long-Term Investments |
|
|
|
|
Microsoft Corp. | | 5 | % |
International Business Machines Corp. | | 4 | |
Philip Morris International, Inc. | | 3 | |
Amgen, Inc. | | 2 | |
Colgate-Palmolive Co. | | 2 | |
Target Corp. | | 2 | |
Apple, Inc. | | 2 | |
Medco Health Solutions, Inc. | | 1 | |
Automatic Data Processing, Inc. | | 1 | |
Freeport-McMoRan Copper & Gold, Inc., Class B | | 1 | |
|
|
|
|
| | | |
Master Large Cap Value Portfolio | | Percent of
Long-Term Investments |
|
|
|
|
Verizon Communications, Inc. | | 3 | % |
The Goldman Sachs Group, Inc. | | 2 | |
ConocoPhillips | | 2 | |
Exxon Mobil Corp. | | 2 | |
UnitedHealth Group, Inc. | | 2 | |
WellPoint, Inc. | | 2 | |
The Travelers Cos., Inc. | | 1 | |
XTO Energy, Inc. | | 1 | |
Marathon Oil Corp. | | 1 | |
General Electric Co. | | 1 | |
|
|
|
|
| | | |
Master Large Cap Core Portfolio | | Percent of
Long-Term Investments |
|
|
|
|
Health Care | | 19 | % |
Information Technology | | 15 | |
Consumer Discretionary | | 13 | |
Energy | | 13 | |
Materials | | 11 | |
Industrials | | 10 | |
Consumer Staples | | 8 | |
Financials | | 5 | |
Utilities | | 4 | |
Telecommunication Services | | 2 | |
|
|
|
|
| | | |
Master Large Cap Growth Portfolio | | Percent of
Long-Term Investments |
|
|
|
|
Information Technology | | 26 | % |
Health Care | | 23 | |
Industrials | | 12 | |
Consumer Staples | | 11 | |
Consumer Discretionary | | 10 | |
Materials | | 9 | |
Energy | | 6 | |
Utilities | | 3 | |
|
|
|
|
| | | |
Master Large Cap Value Portfolio | | Percent of
Long-Term Investments |
|
|
|
|
Energy | | 17 | % |
Financials | | 16 | |
Health Care | | 15 | |
Industrials | | 13 | |
Materials | | 12 | |
Utilities | | 7 | |
Information Technology | | 7 | |
Consumer Staples | | 6 | |
Consumer Discretionary | | 4 | |
Telecommunication Services | | 3 | |
|
|
|
|
| |
| For Portfolio compliance purposes, sector classifications refer to any one or more of the sector sub-classifications used by one or more widely recognized market indexes or ratings group indexes, and/or as defined by Portfolio management. This definition may not apply for purposes of this report, which may combine sector and industry sub-classifications for reporting ease. |
| | |
|
42 | BLACKROCK LARGE CAP SERIES FUNDS, INC. | MARCH 31, 2010 |
| |
|
| |
Schedule of Investments March 31, 2010 (Unaudited) | Master Large Cap Core Portfolio
(Percentages shown are based on Net Assets) |
| | | | | | | |
Common Stocks | | Shares | | Value | |
|
|
|
|
|
|
|
|
Consumer Discretionary — 12.8% | | | | | | | |
Household Durables — 0.3% | | | | | | | |
Garmin Ltd. (a) | | | 300,000 | | $ | 11,544,000 | |
|
|
|
|
|
|
|
|
Internet & Catalog Retail — 1.1% | | | | | | | |
Liberty Media Holding Corp. — Interactive (b) | | | 2,760,000 | | | 42,255,600 | |
|
|
|
|
|
|
|
|
Multiline Retail — 4.6% | | | | | | | |
Big Lots, Inc. (b) | | | 760,000 | | | 27,679,200 | |
JCPenney Co., Inc. (a) | | | 1,300,000 | | | 41,821,000 | |
Macy’s, Inc. | | | 2,130,000 | | | 46,370,100 | |
Nordstrom, Inc. | | | 300,000 | | | 12,255,000 | |
Target Corp. | | | 1,030,000 | | | 54,178,000 | |
| | | | |
|
|
|
| | | | | | 182,303,300 | |
|
|
|
|
|
|
|
|
Specialty Retail — 6.8% | | | | | | | |
Advance Auto Parts, Inc. | | | 780,000 | | | 32,697,600 | |
AutoNation, Inc. (a)(b) | | | 990,000 | | | 17,899,200 | |
Dick’s Sporting Goods, Inc. (b) | | | 30,000 | | | 783,300 | |
The Gap, Inc. | | | 1,990,000 | | | 45,988,900 | |
Limited Brands, Inc. | | | 1,670,000 | | | 41,115,400 | |
PetSmart, Inc. | | | 1,320,000 | | | 42,187,200 | |
Ross Stores, Inc. | | | 840,000 | | | 44,914,800 | |
TJX Cos., Inc. (a) | | | 1,100,000 | | | 46,772,000 | |
| | | | |
|
|
|
| | | | | | 272,358,400 | |
|
|
|
|
|
|
|
|
Total Consumer Discretionary | | | | | | 508,461,300 | |
|
|
|
|
|
|
|
|
Consumer Staples — 7.6% | | | | | | | |
Beverages — 0.2% | | | | | | | |
The Coca-Cola Co. | | | 120,000 | | | 6,600,000 | |
|
|
|
|
|
|
|
|
Food & Staples Retailing — 0.4% | | | | | | | |
Safeway, Inc. | | | 470,000 | | | 11,684,200 | |
Wal-Mart Stores, Inc. | | | 90,000 | | | 5,004,000 | |
| | | | |
|
|
|
| | | | | | 16,688,200 | |
|
|
|
|
|
|
|
|
Food Products — 3.1% | | | | | | | |
ConAgra Foods, Inc. | | | 850,000 | | | 21,309,500 | |
General Mills, Inc. | | | 290,000 | | | 20,529,100 | |
The Hershey Co. | | | 920,000 | | | 39,385,200 | |
Sara Lee Corp. | | | 3,150,000 | | | 43,879,500 | |
| | | | |
|
|
|
| | | | | | 125,103,300 | |
|
|
|
|
|
|
|
|
Household Products — 0.7% | | | | | | | |
The Procter & Gamble Co. | | | 420,000 | | | 26,573,400 | |
|
|
|
|
|
|
|
|
Personal Products — 1.1% | | | | | | | |
The Estée Lauder Cos., Inc., Class A | | | 680,000 | | | 44,111,600 | |
|
|
|
|
|
|
|
|
Tobacco — 2.1% | | | | | | | |
Lorillard, Inc. | | | 590,000 | | | 44,391,600 | |
Reynolds American, Inc. (a) | | | 760,000 | | | 41,024,800 | |
| | | | |
|
|
|
| | | | | | 85,416,400 | |
|
|
|
|
|
|
|
|
Total Consumer Staples | | | | | | 304,492,900 | |
|
|
|
|
|
|
|
|
Energy — 12.7% | | | | | | | |
Energy Equipment & Services — 5.6% | | | | | | | |
FMC Technologies, Inc. (a)(b) | | | 680,000 | | | 43,948,400 | |
Nabors Industries Ltd. (a)(b) | | | 1,660,000 | | | 32,585,800 | |
National Oilwell Varco, Inc. | | | 1,110,000 | | | 45,043,800 | |
Oceaneering International, Inc. (b) | | | 390,000 | | | 24,761,100 | |
Rowan Cos., Inc. (b) | | | 1,450,000 | | | 42,209,500 | |
Tidewater, Inc. | | | 730,000 | | | 34,507,100 | |
| | | | |
|
|
|
| | | | | | 223,055,700 | |
|
|
|
|
|
|
|
|
| | | | | | | |
Common Stocks | | Shares | | Value | |
|
|
|
|
|
|
|
|
Energy (concluded) | | | | | | | |
Oil, Gas & Consumable Fuels — 7.1% | | | | | | | |
Chevron Corp. | | | 250,000 | | $ | 18,957,500 | |
ConocoPhillips | | | 1,280,000 | | | 65,497,600 | |
Exxon Mobil Corp. | | | 1,120,000 | | | 75,017,600 | |
Marathon Oil Corp. | | | 1,500,000 | | | 47,460,000 | |
Williams Cos., Inc. | | | 1,960,000 | | | 45,276,000 | |
XTO Energy, Inc. | | | 650,000 | | | 30,667,000 | |
| | | | |
|
|
|
| | | | | | 282,875,700 | |
|
|
|
|
|
|
|
|
Total Energy | | | | | | 505,931,400 | |
|
|
|
|
|
|
|
|
Financials — 5.6% | | | | | | | |
Commercial Banks — 0.4% | | | | | | | |
Wells Fargo & Co. | | | 510,000 | | | 15,871,200 | |
|
|
|
|
|
|
|
|
Consumer Finance — 1.0% | | | | | | | |
Capital One Financial Corp. | | | 960,000 | | | 39,753,600 | |
|
|
|
|
|
|
|
|
Diversified Financial Services — 1.0% | | | | | | | |
Bank of America Corp. | | | 1,200,000 | | | 21,420,000 | |
JPMorgan Chase & Co. | | | 410,000 | | | 18,347,500 | |
| | | | |
|
|
|
| | | | | | 39,767,500 | |
|
|
|
|
|
|
|
|
Insurance — 3.2% | | | | | | | |
Assurant, Inc. | | | 470,000 | | | 16,158,600 | |
HCC Insurance Holdings, Inc. | | | 560,000 | | | 15,456,000 | |
Torchmark Corp. | | | 120,000 | | | 6,421,200 | |
The Travelers Cos., Inc. | | | 850,000 | | | 45,849,000 | |
UnumProvident Corp. (a) | | | 1,740,000 | | | 43,099,800 | |
| | | | |
|
|
|
| | | | | | 126,984,600 | |
|
|
|
|
|
|
|
|
Total Financials | | | | | | 222,376,900 | |
|
|
|
|
|
|
|
|
Health Care — 19.7% | | | | | | | |
Biotechnology — 1.5% | | | | | | | |
Amgen, Inc. (b) | | | 1,020,000 | | | 60,955,200 | |
|
|
|
|
|
|
|
|
Health Care Equipment & Supplies — 1.5% | | | | | | | |
Hospira, Inc. (b) | | | 810,000 | | | 45,886,500 | |
Kinetic Concepts, Inc. (b) | | | 250,000 | | | 11,952,500 | |
| | | | |
|
|
|
| | | | | | 57,839,000 | |
|
|
|
|
|
|
|
|
Health Care Providers & Services — 14.0% | | | | | | | |
Aetna, Inc. | | | 1,300,000 | | | 45,643,000 | |
AmerisourceBergen Corp. | | | 1,560,000 | | | 45,115,200 | |
Cardinal Health, Inc. | | | 1,290,000 | | | 46,478,700 | |
Community Health Systems, Inc. (b) | | | 870,000 | | | 32,129,100 | |
Coventry Health Care, Inc. (b) | | | 840,000 | | | 20,764,800 | |
Health Management Associates, Inc., Class A (b) | | | 3,150,000 | | | 27,090,000 | |
Humana, Inc. (b) | | | 910,000 | | | 42,560,700 | |
Lincare Holdings, Inc. (b) | | | 920,000 | | | 41,289,600 | |
McKesson Corp. | | | 700,000 | | | 46,004,000 | |
Medco Health Solutions, Inc. (b) | | | 800,000 | | | 51,648,000 | |
Omnicare, Inc. (a) | | | 350,000 | | | 9,901,500 | |
Quest Diagnostics, Inc. | | | 720,000 | | | 41,968,800 | |
UnitedHealth Group, Inc. | | | 1,650,000 | | | 53,905,500 | |
WellPoint, Inc. (b) | | | 820,000 | | | 52,791,600 | |
| | | | |
|
|
|
| | | | | | 557,290,500 | |
|
|
|
|
|
|
|
|
Pharmaceuticals — 2.7% | | | | | | | |
Endo Pharmaceuticals Holdings, Inc. (b) | | | 580,000 | | | 13,740,200 | |
Forest Laboratories, Inc. (b) | | | 1,400,000 | | | 43,904,000 | |
Johnson & Johnson | | | 350,000 | | | 22,820,000 | |
Perrigo Co. (a) | | | 300,000 | | | 17,616,000 | |
Pfizer, Inc. | | | 640,000 | | | 10,976,000 | |
| | | | |
|
|
|
| | | | | | 109,056,200 | |
|
|
|
|
|
|
|
|
Total Health Care | | | | | | 785,140,900 | |
|
|
|
|
|
|
|
|
| | |
See Notes to Financial Statements. | | |
|
|
|
BLACKROCK LARGE CAP SERIES FUNDS, INC. | MARCH 31, 2010 | 43 |
| |
|
| |
Schedule of Investments (continued) | Master Large Cap Core Portfolio |
| (Percentages shown are based on Net Assets) |
| | | | | | | |
Common Stocks | | Shares | | Value | |
|
|
|
|
|
|
|
|
Industrials — 9.7% | | | | | | | |
Aerospace & Defense — 3.5% | | | | | | | |
L-3 Communications Holdings, Inc. | | | 470,000 | | $ | 43,066,100 | |
Northrop Grumman Corp. | | | 760,000 | | | 49,833,200 | |
Raytheon Co. | | | 830,000 | | | 47,409,600 | |
| | | | |
|
|
|
| | | | | | 140,308,900 | |
|
|
|
|
|
|
|
|
Commercial Services & Supplies — 0.4% | | | | | | | |
R.R. Donnelley & Sons Co. | | | 810,000 | | | 17,293,500 | |
|
|
|
|
|
|
|
|
Construction & Engineering — 1.4% | | | | | | | |
Fluor Corp. | | | 910,000 | | | 42,324,100 | |
KBR, Inc. | | | 550,000 | | | 12,188,000 | |
| | | | |
|
|
|
| | | | | | 54,512,100 | |
|
|
|
|
|
|
|
|
Electrical Equipment — 0.5% | | | | | | | |
General Cable Corp. (b) | | | 740,000 | | | 19,980,000 | |
|
|
|
|
|
|
|
|
Industrial Conglomerates — 0.7% | | | | | | | |
General Electric Co. | | | 1,490,000 | | | 27,118,000 | |
|
|
|
|
|
|
|
|
Machinery — 2.9% | | | | | | | |
Eaton Corp. | | | 610,000 | | | 46,219,700 | |
Parker Hannifin Corp. | | | 670,000 | | | 43,375,800 | |
SPX Corp. | | | 340,000 | | | 22,548,800 | |
Toro Co. (a) | | | 120,000 | | | 5,900,400 | |
| | | | |
|
|
|
| | | | | | 118,044,700 | |
|
|
|
|
|
|
|
|
Road & Rail — 0.3% | | | | | | | |
Ryder System, Inc. | | | 270,000 | | | 10,465,200 | |
|
|
|
|
|
|
|
|
Total Industrials | | | | | | 387,722,400 | |
|
|
|
|
|
|
|
|
Information Technology — 15.7% | | | | | | | |
Communications Equipment — 0.3% | | | | | | | |
Cisco Systems, Inc. (b) | | | 500,000 | | | 13,015,000 | |
|
|
|
|
|
|
|
|
Computers & Peripherals — 3.2% | | | | | | | |
Apple, Inc. (b) | | | 140,000 | | | 32,890,200 | |
Hewlett-Packard Co. | | | 100,000 | | | 5,315,000 | |
Lexmark International, Inc., Class A (b) | | | 910,000 | | | 32,832,800 | |
Seagate Technology Holdings (a) | | | 800,000 | | | 14,608,000 | |
Western Digital Corp. (b) | | | 1,040,000 | | | 40,549,600 | |
| | | | |
|
|
|
| | | | | | 126,195,600 | |
|
|
|
|
|
|
|
|
IT Services — 6.5% | | | | | | | |
Cognizant Technology Solutions Corp. (b) | | | 240,000 | | | 12,235,200 | |
Computer Sciences Corp. (b) | | | 790,000 | | | 43,047,100 | |
Fiserv, Inc. (b) | | | 840,000 | | | 42,638,400 | |
Global Payments, Inc. (a) | | | 680,000 | | | 30,974,000 | |
Hewitt Associates, Inc., Class A (b) | | | 930,000 | | | 36,995,400 | |
International Business Machines Corp. | | | 720,000 | | | 92,340,000 | |
| | | | |
|
|
|
| | | | | | 258,230,100 | |
|
|
|
|
|
|
|
|
Internet Software & Services — 1.2% | | | | | | | |
Google, Inc., Class A (b) | | | 10,000 | | | 5,670,100 | |
VeriSign, Inc. (a)(b) | | | 1,620,000 | | | 42,136,200 | |
| | | | |
|
|
|
| | | | | | 47,806,300 | |
|
|
|
|
|
|
|
|
Software — 4.5% | | | | | | | |
CA, Inc. | | | 1,830,000 | | | 42,950,100 | |
Microsoft Corp. | | | 4,000,000 | | | 117,080,000 | |
Sybase, Inc. (a)(b) | | | 440,000 | | | 20,512,800 | |
| | | | |
|
|
|
| | | | | | 180,542,900 | |
|
|
|
|
|
|
|
|
Total Information Technology | | | | | | 625,789,900 | |
|
|
|
|
|
|
|
|
| | | | | | | |
Common Stocks | | Shares | | Value | |
|
|
|
|
|
|
|
|
Materials — 10.7% | | | | | | | |
Chemicals — 4.8% | | | | | | | |
Ashland, Inc. | | | 610,000 | | $ | 32,189,700 | |
Celanese Corp., Series A | | | 910,000 | | | 28,983,500 | |
Eastman Chemical Co. | | | 640,000 | | | 40,755,200 | |
Huntsman Corp. | | | 2,210,000 | | | 26,630,500 | |
Lubrizol Corp. | | | 460,000 | | | 42,191,200 | |
Nalco Holding Co. | | | 770,000 | | | 18,734,100 | |
| | | | |
|
|
|
| | | | | | 189,484,200 | |
|
|
|
|
|
|
|
|
Containers & Packaging — 1.4% | | | | | | | |
Crown Holdings, Inc. (b) | | | 1,350,000 | | | 36,396,000 | |
Temple-Inland, Inc. | | | 1,010,000 | | | 20,634,300 | |
| | | | |
|
|
|
| | | | | | 57,030,300 | |
|
|
|
|
|
|
|
|
Metals & Mining — 2.9% | | | | | | | |
Freeport-McMoRan Copper & Gold, Inc., Class B | | | 660,000 | | | 55,136,400 | |
Reliance Steel & Aluminum Co. | | | 380,000 | | | 18,707,400 | |
Walter Industries, Inc. | | | 460,000 | | | 42,444,200 | |
| | | | |
|
|
|
| | | | | | 116,288,000 | |
|
|
|
|
|
|
|
|
Paper & Forest Products — 1.6% | | | | | | | |
International Paper Co. | | | 1,750,000 | | | 43,067,500 | |
MeadWestvaco Corp. | | | 840,000 | | | 21,462,000 | |
| | | | |
|
|
|
| | | | | | 64,529,500 | |
|
|
|
|
|
|
|
|
Total Materials | | | | | | 427,332,000 | |
|
|
|
|
|
|
|
|
Telecommunication Services — 1.7% | | | | | | | |
Diversified Telecommunication Services — 1.7% | | | | | | | |
AT&T Inc. | | | 530,000 | | | 13,695,200 | |
Verizon Communications, Inc. | | | 1,780,000 | | | 55,215,600 | |
|
|
|
|
|
|
|
|
Total Telecommunication Services | | | | | | 68,910,800 | |
|
|
|
|
|
|
|
|
Utilities — 4.3% | | | | | | | |
Electric Utilities — 0.4% | | | | | | | |
Edison International | | | 200,000 | | | 6,834,000 | |
Pinnacle West Capital Corp. | | | 200,000 | | | 7,546,000 | |
| | | | |
|
|
|
| | | | | | 14,380,000 | |
|
|
|
|
|
|
|
|
Independent Power Producers & Energy Traders — 2.6% | | | | | | | |
The AES Corp. (b) | | | 3,390,000 | | | 37,290,000 | |
Constellation Energy Group, Inc. | | | 720,000 | | | 25,279,200 | |
Mirant Corp. (b) | | | 810,000 | | | 8,796,600 | |
NRG Energy, Inc. (a)(b) | | | 1,640,000 | | | 34,276,000 | |
| | | | |
|
|
|
| | | | | | 105,641,800 | |
|
|
|
|
|
|
|
|
Multi-Utilities — 1.3% | | | | | | | |
DTE Energy Co. | | | 730,000 | | | 32,558,000 | |
NiSource, Inc. | | | 1,220,000 | | | 19,276,000 | |
| | | | |
|
|
|
| | | | | | 51,834,000 | |
|
|
|
|
|
|
|
|
Total Utilities | | | | | | 171,855,800 | |
|
|
|
|
|
|
|
|
Total Long-Term Investments
(Cost — $3,346,878,913) — 100.5% | | | | | | 4,008,014,300 | |
|
|
|
|
|
|
|
|
| | | | | | | |
|
|
|
|
|
|
|
|
|
Short-Term Securities | | Beneficial
Interest
(000) | | | | |
|
|
|
|
|
|
|
|
BlackRock Liquidity Series, LLC, Money Market
Series, 0.22% (c)(d)(e) | | $ | 284,433 | | | 284,432,850 | |
|
|
|
|
|
|
|
|
Total Short-Term Securities
(Cost — $284,432,850) — 7.1% | | | | | | 284,432,850 | |
|
|
|
|
|
|
|
|
Total Investments (Cost — $3,631,311,763*) — 107.6% | | | | | | 4,292,447,150 | |
Liabilities in Excess of Other Assets — (7.6)% | | | | | | (302,485,961 | ) |
| | | | |
|
|
|
Net Assets — 100.0% | | | | | $ | 3,989,961,189 | |
| | | | |
|
|
|
| | |
See Notes to Financial Statements. |
|
|
|
44 | BLACKROCK LARGE CAP SERIES FUNDS, INC. | MARCH 31, 2010 |
| |
|
| |
Schedule of Investments (concluded) | Master Large Cap Core Portfolio |
| |
* | The cost and unrealized appreciation (depreciation) of investments as of March 31, 2010, as computed for federal income tax purposes, were as follows: |
| | | | |
Aggregate cost | | $ | 3,778,522,746 | |
| |
|
|
|
Gross unrealized appreciation | | $ | 548,760,618 | |
Gross unrealized depreciation | | | (34,836,214 | ) |
| |
|
|
|
Net unrealized appreciation | | $ | 513,924,404 | |
| |
|
|
|
| |
(a) | Security, or a portion of security, is on loan. |
| |
(b) | Non-income producing security. |
| |
(c) | Investments in companies considered to be an affiliate of the Portfolio, for purposes of Section 2(a)(3) of the Investment Company Act of 1940, were as follows: |
| | | | | | | |
|
|
|
|
|
|
|
|
Affiliate | | Net
Activity | | Income | |
|
|
|
|
|
|
BlackRock Liquidity Funds, TempFund,
Institutional Class | | $ | (31,839,442 | ) | $ | 648 | |
BlackRock Liquidity Series, LLC,
Money Market Series | | $ | 154,911,200 | | $ | 194,448 | |
|
|
|
|
|
|
|
|
| | |
(d) | Represents the current yield as of report date. |
| |
(e) | Security was purchased with the cash collateral from loaned securities. |
| |
• | For Portfolio compliance purposes, the Portfolio’s industry classifications refer to any one or more of the industry sub-classifications used by one or more widely recognized market indexes or rating group indexes, and/or as defined by Portfolio management. This definition may not apply for purposes of this report, which may combine such industry sub-classifications for reporting ease. |
| |
• | Fair Value Measurements — Various inputs are used in determining the fair value of investments, which are as follows: |
| |
| • | Level 1 — price quotations in active markets/exchanges for identical assets and liabilities |
| | |
| • | Level 2 — other observable inputs (including, but not limited to: quoted prices for similar assets or liabilities in markets that are active, quoted prices for identical or similar assets or liabilities in markets that are not active, inputs other than quoted prices that are observable for the assets or liabilities (such as interest rates, yield curves, volatilities, prepayment speeds, loss severities, credit risks and default rates) or other market-corroborated inputs) |
| | |
| • | Level 3 — unobservable inputs based on the best information available in the circumstances, to the extent observable inputs are not available (including the Portfolio’s own assumptions used in determining the fair value of investments) |
| | |
| The inputs or methodologies used for valuing securities are not necessarily an indication of the risk associated with investing in those securities. For information about the Portfolio’s policy regarding valuation of investments and other significant accounting policies, please refer to Note 1 of the Notes to Financial Statements. |
| |
| The following table summarizes the inputs used as of March 31, 2010 in determining the fair valuation of the Portfolio’s investments: |
| | | | | | | | | | | | | |
|
|
|
|
|
|
|
|
|
|
|
|
|
|
| | Investments in Securities | |
|
|
|
|
|
|
|
|
|
|
|
|
|
|
Valuation Inputs | | Level 1 | | Level 2 | | Level 3 | | Total | |
|
|
|
|
|
|
|
|
|
|
Assets: | | | | | | | | | | | | | |
Long-Term Investments1 | | $ | 4,008,014,300 | | | — | | | — | | $ | 4,008,014,300 | |
Short-Term Securities | | | — | | $ | 284,432,850 | | | — | | | 284,432,850 | |
| |
|
|
|
|
|
|
|
|
|
|
|
|
Total | | $ | 4,008,014,300 | | $ | 284,432,850 | | | — | | $ | 4,292,447,150 | |
| |
|
|
|
|
|
|
|
|
|
|
|
|
| | |
| 1 | See above Schedule of Investments for values in each industry. |
| | |
See Notes to Financial Statements. |
|
|
|
BLACKROCK LARGE CAP SERIES FUNDS, INC. | MARCH 31, 2010 | 45 |
| |
|
| |
Schedule of Investments March 31, 2010 (Unaudited) | Master Large Cap Growth Portfolio |
| (Percentages shown are based on Net Assets) |
| | | | | | | |
Common Stocks | | | Shares | | | Value | |
|
|
|
|
|
|
|
|
Consumer Discretionary — 10.0% | | | | | | | |
Multiline Retail — 3.9% | | | | | | | |
Big Lots, Inc. (a) | | | 219,000 | | $ | 7,975,980 | |
Dollar Tree, Inc. (a) | | | 144,000 | | | 8,527,680 | |
Target Corp. | | | 241,000 | | | 12,676,600 | |
| | | | |
|
|
|
| | | | | | 29,180,260 | |
|
|
|
|
|
|
|
|
Specialty Retail — 6.1% | | | | | | | |
Dick’s Sporting Goods, Inc. (a) | | | 297,000 | | | 7,754,670 | |
The Gap, Inc. | | | 239,000 | | | 5,523,290 | |
Limited Brands, Inc. | | | 336,000 | | | 8,272,320 | |
PetSmart, Inc. | | | 181,000 | | | 5,784,760 | |
Ross Stores, Inc. | | | 163,000 | | | 8,715,610 | |
TJX Cos., Inc. (b) | | | 230,000 | | | 9,779,600 | |
| | | | |
|
|
|
| | | | | | 45,830,250 | |
|
|
|
|
|
|
|
|
Total Consumer Discretionary | | | | | | 75,010,510 | |
|
|
|
|
|
|
|
|
Consumer Staples — 11.1% | | | | | | | |
Food & Staples Retailing — 0.7% | | | | | | | |
Wal-Mart Stores, Inc. | | | 28,000 | | | 1,556,800 | |
Walgreen Co. | | | 93,000 | | | 3,449,370 | |
| | | | |
|
|
|
| | | | | | 5,006,170 | |
|
|
|
|
|
|
|
|
Food Products — 3.5% | | | | | | | |
General Mills, Inc. | | | 123,000 | | | 8,707,170 | |
H.J. Heinz Co. | | | 24,000 | | | 1,094,640 | |
The Hershey Co. | | | 186,000 | | | 7,962,660 | |
Hormel Foods Corp. | | | 29,000 | | | 1,218,290 | |
Sara Lee Corp. | | | 561,000 | | | 7,814,730 | |
| | | | |
|
|
|
| | | | | | 26,797,490 | |
|
|
|
|
|
|
|
|
Household Products — 1.8% | | | | | | | |
Colgate-Palmolive Co. | | | 151,000 | | | 12,874,260 | |
The Procter & Gamble Co. | | | 11,000 | | | 695,970 | |
| | | | |
|
|
|
| | | | | | 13,570,230 | |
|
|
|
|
|
|
|
|
Personal Products — 1.2% | | | | | | | |
The Estée Lauder Cos., Inc., Class A | | | 138,000 | | | 8,952,060 | |
|
|
|
|
|
|
|
|
Tobacco — 3.9% | | | | | | | |
Lorillard, Inc. | | | 118,000 | | | 8,878,320 | |
Philip Morris International, Inc. | | | 396,000 | | | 20,655,360 | |
| | | | |
|
|
|
| | | | | | 29,533,680 | |
|
|
|
|
|
|
|
|
Total Consumer Staples | | | | | | 83,859,630 | |
|
|
|
|
|
|
|
|
Energy — 6.2% | | | | | | | |
Energy Equipment & Services — 5.1% | | | | | | | |
Atwood Oceanics, Inc. (a) | | | 217,000 | | | 7,514,710 | |
FMC Technologies, Inc. (a) | | | 139,000 | | | 8,983,570 | |
Oceaneering International, Inc. (a) | | | 121,000 | | | 7,682,290 | |
Rowan Cos., Inc. (a) | | | 265,000 | | | 7,714,150 | |
Tidewater, Inc. | | | 130,000 | | | 6,145,100 | |
| | | | |
|
|
|
| | | | | | 38,039,820 | |
|
|
|
|
|
|
|
|
Oil, Gas & Consumable Fuels — 1.1% | | | | | | | |
Peabody Energy Corp. | | | 181,000 | | | 8,271,700 | |
|
|
|
|
|
|
|
|
Total Energy | | | | | | 46,311,520 | |
|
|
|
|
|
|
|
|
Financials — 0.3% | | | | | | | |
Insurance — 0.3% | | | | | | | |
Endurance Specialty Holdings Ltd. | | | 61,000 | | | 2,266,150 | |
|
|
|
|
|
|
|
|
Total Financials | | | | | | 2,266,150 | |
|
|
|
|
|
|
|
|
| | | | | | | |
Common Stocks | | | Shares | | | Value | |
|
|
|
|
|
|
|
|
Health Care — 22.6% | | | | | | | |
Biotechnology — 2.1% | | | | | | | |
Amgen, Inc. (a) | | | 260,000 | | $ | 15,537,600 | |
|
|
|
|
|
|
|
|
Health Care Equipment & Supplies — 2.3% | | | | | | | |
Hospira, Inc. (a) | | | 162,000 | | | 9,177,300 | |
Kinetic Concepts, Inc. (a) | | | 151,000 | | | 7,219,310 | |
Teleflex, Inc. | | | 13,000 | | | 832,910 | |
| | | | |
|
|
|
| | | | | | 17,229,520 | |
|
|
|
|
|
|
|
|
Health Care Providers & Services — 15.2% | | | | | | | |
Aetna, Inc. | | | 225,000 | | | 7,899,750 | |
AmerisourceBergen Corp. | | | 297,000 | | | 8,589,240 | |
Community Health Systems, Inc. (a) | | | 208,000 | | | 7,681,440 | |
Coventry Health Care, Inc. (a) | | | 287,000 | | | 7,094,640 | |
Health Management Associates, Inc., Class A (a) | | | 898,000 | | | 7,722,800 | |
Humana, Inc. (a) | | | 167,000 | | | 7,810,590 | |
Laboratory Corp. of America Holdings (a) | | | 105,000 | | | 7,949,550 | |
Lincare Holdings, Inc. (a) | | | 186,000 | | | 8,347,680 | |
McKesson Corp. | | | 141,000 | | | 9,266,520 | |
Medco Health Solutions, Inc. (a) | | | 179,000 | | | 11,556,240 | |
Omnicare, Inc. | | | 190,000 | | | 5,375,100 | |
Quest Diagnostics, Inc. | | | 148,000 | | | 8,626,920 | |
Tenet Healthcare Corp. (a) | | | 254,000 | | | 1,452,880 | |
UnitedHealth Group, Inc. | | | 210,000 | | | 6,860,700 | |
WellPoint, Inc. (a) | | | 127,000 | | | 8,176,260 | |
| | | | |
|
|
|
| | | | | | 114,410,310 | |
|
|
|
|
|
|
|
|
Pharmaceuticals — 3.0% | | | | | | | |
Endo Pharmaceuticals Holdings, Inc. (a)(b) | | | 172,000 | | | 4,074,680 | |
Forest Laboratories, Inc. (a) | | | 234,000 | | | 7,338,240 | |
Johnson & Johnson | | | 47,000 | | | 3,064,400 | |
Perrigo Co. | | | 142,000 | | | 8,338,240 | |
| | | | |
|
|
|
| | | | | | 22,815,560 | |
|
|
|
|
|
|
|
|
Total Health Care | | | | | | 169,992,990 | |
|
|
|
|
|
|
|
|
Industrials — 12.2% | | | | | | | |
Aerospace & Defense — 2.8% | | | | | | | |
General Dynamics Corp. | | | 43,000 | | | 3,319,600 | |
Northrop Grumman Corp. | | | 125,000 | | | 8,196,250 | |
Raytheon Co. | | | 173,000 | | | 9,881,760 | |
| | | | |
|
|
|
| | | | | | 21,397,610 | |
|
|
|
|
|
|
|
|
Commercial Services & Supplies — 2.1% | | | | | | | |
Cintas Corp. | | | 268,000 | | | 7,528,120 | |
R.R. Donnelley & Sons Co. | | | 371,000 | | | 7,920,850 | |
| | | | |
|
|
|
| | | | | | 15,448,970 | |
|
|
|
|
|
|
|
|
Construction & Engineering — 2.2% | | | | | | | |
Fluor Corp. | | | 183,000 | | | 8,511,330 | |
URS Corp. (a) | | | 157,000 | | | 7,788,770 | |
| | | | |
|
|
|
| | | | | | 16,300,100 | |
|
|
|
|
|
|
|
|
Electrical Equipment — 2.0% | | | | | | | |
Hubbell, Inc., Class B | | | 147,000 | | | 7,413,210 | |
Thomas & Betts Corp. (a) | | | 192,000 | | | 7,534,080 | |
| | | | |
|
|
|
| | | | | | 14,947,290 | |
|
|
|
|
|
|
|
|
Industrial Conglomerates — 1.0% | | | | | | | |
Carlisle Cos., Inc. (b) | | | 206,000 | | | 7,848,600 | |
|
|
|
|
|
|
|
|
Machinery — 2.1% | | | | | | | |
Crane Co. | | | 39,000 | | | 1,384,500 | |
Harsco Corp. | | | 220,000 | | | 7,026,800 | |
Toro Co. (b) | | | 158,000 | | | 7,768,860 | |
| | | | |
|
|
|
| | | | | | 16,180,160 | |
|
|
|
|
|
|
|
|
Total Industrials | | | | | | 92,122,730 | |
|
|
|
|
|
|
|
|
| | |
See Notes to Financial Statements. |
|
|
|
46 | BLACKROCK LARGE CAP SERIES FUNDS, INC. | MARCH 31, 2010 |
| |
|
| |
Schedule of Investments (continued) | Master Large Cap Growth Portfolio |
| (Percentages shown are based on Net Assets) |
| | | | | | | |
Common Stocks | | Shares | | Value | |
|
|
|
|
|
|
|
|
Information Technology — 25.8% | | | | | | | |
Communications Equipment — 0.6% | | | | | | | |
Cisco Systems, Inc. (a) | | | 181,000 | | $ | 4,711,430 | |
|
|
|
|
|
|
|
|
Computers & Peripherals — 4.5% | | | | | | | |
Apple, Inc. (a) | | | 51,000 | | | 11,981,430 | |
Dell, Inc. (a) | | | 421,000 | | | 6,319,210 | |
Seagate Technology Holdings (b) | | | 396,000 | | | 7,230,960 | |
Western Digital Corp. (a) | | | 209,000 | | | 8,148,910 | |
| | | | |
|
|
|
| | | | | | 33,680,510 | |
|
|
|
|
|
|
|
|
Electronic Equipment, Instruments & Components — 1.0% | | | | | | | |
Tech Data Corp. (a) | | | 169,000 | | | 7,081,100 | |
|
|
|
|
|
|
|
|
IT Services — 11.3% | | | | | | | |
Amdocs Ltd. (a) | | | 252,000 | | | 7,587,720 | |
Automatic Data Processing, Inc. | | | 233,000 | | | 10,361,510 | |
DST Systems, Inc. | | | 136,000 | | | 5,637,200 | |
Fiserv, Inc. (a) | | | 167,000 | | | 8,476,920 | |
Global Payments, Inc. (b) | | | 180,000 | | | 8,199,000 | |
Hewitt Associates, Inc., Class A (a) | | | 193,000 | | | 7,677,540 | |
International Business Machines Corp. | | | 226,000 | | | 28,984,500 | |
NeuStar, Inc., Class A (a) | | | 317,000 | | | 7,988,400 | |
| | | | |
|
|
|
| | | | | | 84,912,790 | |
|
|
|
|
|
|
|
|
Internet Software & Services — 1.4% | | | | | | | |
Google, Inc., Class A (a) | | | 4,000 | | | 2,268,040 | |
VeriSign, Inc. (a)(b) | | | 315,000 | | | 8,193,150 | |
| | | | |
|
|
|
| | | | | | 10,461,190 | |
|
|
|
|
|
|
|
|
Software — 7.0% | | | | | | | |
CA, Inc. | | | 350,000 | | | 8,214,500 | |
Microsoft Corp. | | | 1,258,000 | | | 36,821,660 | |
Sybase, Inc. (a)(b) | | | 167,000 | | | 7,785,540 | |
| | | | |
|
|
|
| | | | | | 52,821,700 | |
|
|
|
|
|
|
|
|
Total Information Technology | | | | | | 193,668,720 | |
|
|
|
|
|
|
|
|
Materials — 8.5% | | | | | | | |
Chemicals — 4.9% | | | | | | | |
Ashland, Inc. | | | 148,000 | | | 7,809,960 | |
Celanese Corp., Series A | | | 148,000 | | | 4,713,800 | |
Lubrizol Corp. | | | 89,000 | | | 8,163,080 | |
Nalco Holding Co. | | | 334,000 | | | 8,126,220 | |
RPM International, Inc. | | | 382,000 | | | 8,151,880 | |
| | | | |
|
|
|
| | | | | | 36,964,940 | |
|
|
|
|
|
|
|
|
Containers & Packaging — 1.1% | | | | | | | |
Crown Holdings, Inc. (a) | | | 300,000 | | | 8,088,000 | |
|
|
|
|
|
|
|
|
Metals & Mining — 2.5% | | | | | | | |
Freeport-McMoRan Copper & Gold, Inc., Class B | | | 122,000 | | | 10,191,880 | |
Walter Industries, Inc. (b) | | | 92,000 | | | 8,488,840 | |
| | | | |
|
|
|
| | | | | | 18,680,720 | |
|
|
|
|
|
|
|
|
Total Materials | | | | | | 63,733,660 | |
|
|
|
|
|
|
|
|
| | | | | | | |
Common Stocks | | Shares | | Value | |
|
|
|
|
|
|
|
|
Utilities — 2.6% | | | | | | | |
Electric Utilities — 0.4% | | | | | | | |
NV Energy, Inc. | | | 252,000 | | $ | 3,107,160 | |
|
|
|
|
|
|
|
|
Independent Power Producers & Energy Traders — 1.1% | | | | | | | |
Constellation Energy Group, Inc. | | | 231,000 | | | 8,110,410 | |
|
|
|
|
|
|
|
|
Multi-Utilities — 1.1% | | | | | | | |
Integrys Energy Group, Inc. (b) | | | 172,000 | | | 8,149,360 | |
|
|
|
|
|
|
|
|
Total Utilities | | | | | | 19,366,930 | |
|
|
|
|
|
|
|
|
Total Long-Term Investments
(Cost — $631,523,964) — 99.3% | | | | | | 746,332,840 | |
|
|
|
|
|
|
|
|
| | | | | | | |
Short-Term Securities | | | Beneficial
Interest
(000) | | | | |
|
|
|
|
|
|
|
|
BlackRock Liquidity Series, LLC,
Money Market Series, 0.22% (c)(d)(e) | | $ | 49,514 | | | 49,514,400 | |
|
|
|
|
|
|
|
|
Total Short-Term Securities
(Cost — $49,514,400) — 6.6% | | | | | | 49,514,400 | |
|
|
|
|
|
|
|
|
Total Investments (Cost — $681,038,364*) — 105.9% | | | | | | 795,847,240 | |
Liabilities in Excess of Other Assets — (5.9)% | | | | | | (44,124,502 | ) |
| | | | |
|
|
|
Net Assets — 100.0% | | | | | $ | 751,722,738 | |
| | | | |
|
|
|
| |
|
* | The cost and unrealized appreciation (depreciation) of investments as of March 31, 2010, as computed for federal income tax purposes, were as follows: |
| | | | |
Aggregate cost | | $ | 697,638,462 | |
| |
|
|
|
Gross unrealized appreciation | | $ | 100,441,805 | |
Gross unrealized depreciation | | | (2,233,027 | ) |
| |
|
|
|
Net unrealized appreciation | | $ | 98,208,778 | |
| |
|
|
|
| |
(a) | Non-income producing security. |
| |
(b) | Security, or a portion of security, is on loan. |
| |
(c) | Investments in companies considered to be an affiliate of the Portfolio, for purposes of Section 2(a)(3) of the Investment Company Act of 1940, were as follows: |
| | | | | | | |
|
|
|
|
|
|
|
|
Affiliate | | Net
Activity | | Income | |
|
|
|
|
|
|
BlackRock Liquidity Fund, TempFund, Institutional Class | | | — | | $ | 148 | |
BlackRock Liquidity Series, LLC, Money Market Series | | $ | 34,065,900 | | $ | 19,996 | |
|
|
|
|
|
|
|
|
| |
(d) | Security was purchased with the cash collateral from loaned securities. |
| |
(e) | Represents the current yield as of report date. |
| |
• | For Portfolio compliance purposes,the Portfolio’s industry classifications refer to any one or more of the industry sub-classifications used by one or more widely recognized market indexes or rating group indexes, and/or as defined by Portfolio management. This definition may not apply for purposes of this report, which may combine such industry sub-classifications for reporting ease. |
| | |
See Notes to Financial Statements. |
|
|
|
BLACKROCK LARGE CAP SERIES FUNDS, INC. | MARCH 31, 2010 | 47 |
| |
|
| |
Schedule of Investments (concluded) | Master Large Cap Growth Portfolio |
| | |
• | Fair Value Measurements — Various inputs are used in determining the fair value of investments, which are as follows: |
| |
| • | Level 1 — price quotations in active markets/exchanges for identical assets and liabilities |
| | |
| • | Level 2 — other observable inputs (including, but not limited to: quoted prices for similar assets or liabilities in markets that are active, quoted prices for identical or similar assets or liabilities in markets that are not active, inputs other than quoted prices that are observable for the assets or liabilities (such as interest rates, yield curves, volatilities, prepayment speeds, loss severities, credit risks and default rates) or other market-corroborated inputs) |
| | |
| • | Level 3 — unobservable inputs based on the best information available In the circumstances, to the extent observable inputs are not available (including the Portfolio’s own assumptions used in determining the fair value of investments) |
| | |
| The inputs or methodologies used for valuing securities are not necessarily an indication of the risk associated with investing in those securities. For information about the Portfolio’s policy regarding valuation of investments and other significant accounting policies, please refer to Note 1 of the Notes to Financial Statements. |
| |
| The following table summarizes the inputs used as of March 31, 2010 in determining the fair valuation of the Portfolio’s investments: |
| | | | | | | | | | | | | |
|
|
|
|
|
|
|
|
|
|
|
|
|
|
| | Investments in Securities | |
|
|
|
|
Valuation Inputs | | Level 1 | | Level 2 | | Level 3 | | Total | |
|
|
|
|
|
|
|
|
|
|
Assets: | | | | | | | | | | | | | |
Long-Term Investments1 | | $ | 746,332,840 | | | — | | | — | | $ | 746,332,840 | |
Short-Term Securities | | | — | | $ | 49,514,400 | | | — | | $ | 49,514,400 | |
| |
|
|
|
|
|
|
|
|
|
|
|
|
Total | | $ | 746,332,840 | | $ | 49,514,400 | | | — | | $ | 795,847,240 | |
| |
|
|
|
|
|
|
|
|
|
|
|
|
| | |
| 1 | See above Schedule of Investments for values in each industry. |
| | |
See Notes to Financial Statements. |
|
|
|
48 | BLACKROCK LARGE CAP SERIES FUNDS, INC. | MARCH 31, 2010 |
| |
|
|
| |
Schedule of Investments March 31, 2010 (Unaudited) | Master Large Cap Value Portfolio |
| (Percentages shown are based on Net Assets) |
| | | | | | | |
Common Stocks | | Shares | | Value | |
|
|
|
|
|
|
|
|
Consumer Discretionary — 4.5% | | | | | | | |
Internet & Catalog Retail — 0.1% | | | | | | | |
Liberty Media Holding Corp. — Interactive (a) | | | 160,000 | | $ | 2,449,600 | |
|
|
|
|
|
|
|
|
Multiline Retail — 2.2% | | | | | | | |
Big Lots, Inc. (a) | | | 740,000 | | | 26,950,800 | |
Macy’s, Inc. | | | 1,380,000 | | | 30,042,600 | |
| | | | |
|
|
|
| | | | | | 56,993,400 | |
|
|
|
|
|
|
|
|
Specialty Retail — 2.2% | | | | | | | |
AutoNation, Inc. (a)(b) | | | 580,000 | | | 10,486,400 | |
The Gap, Inc. (b) | | | 320,000 | | | 7,395,200 | |
Limited Brands, Inc. (b) | | | 1,120,000 | | | 27,574,400 | |
Signet Jewelers Ltd. | | | 340,000 | | | 10,995,600 | |
| | | | |
|
|
|
| | | | | | 56,451,600 | |
|
|
|
|
|
|
|
|
Total Consumer Discretionary | | | | | | 115,894,600 | |
|
|
|
|
|
|
|
|
Consumer Staples — 5.8% | | | | | | | |
Food Products — 3.7% | | | | | | | |
ConAgra Foods, Inc. | | | 1,160,000 | | | 29,081,200 | |
Del Monte Foods Co. | | | 1,940,000 | | | 28,324,000 | |
General Mills, Inc. | | | 90,000 | | | 6,371,100 | |
The Hershey Co. | | | 30,000 | | | 1,284,300 | |
Sara Lee Corp. | | | 2,080,000 | | | 28,974,400 | |
| | | | |
|
|
|
| | | | | | 94,035,000 | |
|
|
|
|
|
|
|
|
Tobacco — 2.1% | | | | | | | |
Lorillard, Inc. | | | 350,000 | | | 26,334,000 | |
Reynolds American, Inc. (b) | | | 530,000 | | | 28,609,400 | |
| | | | |
|
|
|
| | | | | | 54,943,400 | |
|
|
|
|
|
|
|
|
Total Consumer Staples | | | | | | 148,978,400 | |
|
|
|
|
|
|
|
|
Energy — 17.1% | | | | | | | |
Energy Equipment & Services — 6.1% | | | | | | | |
Atwood Oceanics, Inc. (a)(b) | | | 700,000 | | | 24,241,000 | |
National Oilwell Varco, Inc. | | | 780,000 | | | 31,652,400 | |
Oil States International, Inc. (a) | | | 580,000 | | | 26,297,200 | |
Rowan Cos., Inc. (a) | | | 960,000 | | | 27,945,600 | |
SEACOR Holdings, Inc. (a) | | | 230,000 | | | 18,551,800 | |
Tidewater, Inc. | | | 570,000 | | | 26,943,900 | |
| | | | |
|
|
|
| | | | | | 155,631,900 | |
|
|
|
|
|
|
|
|
Oil, Gas & Consumable Fuels — 11.0% | | | | | | | |
Chevron Corp. | | | 330,000 | | | 25,023,900 | |
ConocoPhillips | | | 1,200,000 | | | 61,404,000 | |
Exxon Mobil Corp. | | | 860,000 | | | 57,602,800 | |
Marathon Oil Corp. | | | 1,130,000 | | | 35,753,200 | |
Overseas Shipholding Group, Inc. (b) | | | 220,000 | | | 8,630,600 | |
Southern Union Co. | | | 1,000,000 | | | 25,370,000 | |
Williams Cos., Inc. | | | 1,400,000 | | | 32,340,000 | |
XTO Energy, Inc. | | | 800,000 | | | 37,744,000 | |
| | | | |
|
|
|
| | | | | | 283,868,500 | |
|
|
|
|
|
|
|
|
Total Energy | | | | | | 439,500,400 | |
|
|
|
|
|
|
|
|
| | | | | | | |
Common Stocks | | Shares | | Value | |
|
|
|
|
|
|
|
|
Financials — 15.7% | | | | | | | |
Capital Markets — 2.4% | | | | | | | |
The Goldman Sachs Group, Inc. | | | 360,000 | | $ | 61,426,800 | |
|
|
|
|
|
|
|
|
Commercial Banks — 0.4% | | | | | | | |
Wells Fargo & Co. | | | 320,000 | | | 9,958,400 | |
|
|
|
|
|
|
|
|
Consumer Finance — 1.8% | | | | | | | |
AmeriCredit Corp. (a)(b) | | | 600,000 | | | 14,256,000 | |
Capital One Financial Corp. | | | 770,000 | | | 31,885,700 | |
| | | | |
|
|
|
| | | | | | 46,141,700 | |
|
|
|
|
|
|
|
|
Diversified Financial Services — 2.0% | | | | | | | |
Bank of America Corp. | | | 1,560,000 | | | 27,846,000 | |
JPMorgan Chase & Co. | | | 530,000 | | | 23,717,500 | |
| | | | |
|
|
|
| | | | | | 51,563,500 | |
|
|
|
|
|
|
|
|
Insurance — 9.1% | | | | | | | |
Allied World Assurance Holdings Ltd. | | | 300,000 | | | 13,455,000 | |
American Financial Group, Inc. | | | 1,010,000 | | | 28,734,500 | |
Assurant, Inc. | | | 840,000 | | | 28,879,200 | |
Endurance Specialty Holdings Ltd. | | | 510,000 | | | 18,946,500 | |
Everest Re Group Ltd. | | | 180,000 | | | 14,567,400 | |
HCC Insurance Holdings, Inc. | | | 930,000 | | | 25,668,000 | |
Lincoln National Corp. | | | 90,000 | | | 2,763,000 | |
Loews Corp. | | | 600,000 | | | 22,368,000 | |
RenaissanceRe Holdings Ltd. | | | 280,000 | | | 15,892,800 | |
The Travelers Cos., Inc. | | | 700,000 | | | 37,758,000 | |
Unitrin, Inc. | | | 120,000 | | | 3,366,000 | |
UnumProvident Corp. | | | 900,000 | | | 22,293,000 | |
| | | | |
|
|
|
| | | | | | 234,691,400 | |
|
|
|
|
|
|
|
|
Total Financials | | | | | | 403,781,800 | |
|
|
|
|
|
|
|
|
Health Care — 15.1% | | | | | | | |
Biotechnology — 0.9% | | | | | | | |
Amgen, Inc. (a) | | | 410,000 | | | 24,501,600 | |
|
|
|
|
|
|
|
|
Health Care Equipment & Supplies — 1.1% | | | | | | | |
Kinetic Concepts, Inc. (a)(b) | | | 570,000 | | | 27,251,700 | |
|
|
|
|
|
|
|
|
Health Care Providers & Services — 10.4% | | | | | | | |
AmerisourceBergen Corp. | | | 940,000 | | | 27,184,800 | |
Cardinal Health, Inc. | | | 920,000 | | | 33,147,600 | |
Community Health Systems, Inc. (a) | | | 700,000 | | | 25,851,000 | |
Coventry Health Care, Inc. (a) | | | 1,090,000 | | | 26,944,800 | |
Humana, Inc. (a) | | | 600,000 | | | 28,062,000 | |
Lincare Holdings, Inc. (a) | | | 320,000 | | | 14,361,600 | |
McKesson Corp. | | | 450,000 | | | 29,574,000 | |
UnitedHealth Group, Inc. | | | 1,330,000 | | | 43,451,100 | |
WellPoint, Inc. (a) | | | 620,000 | | | 39,915,600 | |
| | | | |
|
|
|
| | | | | | 268,492,500 | |
|
|
|
|
|
|
|
|
Pharmaceuticals — 2.7% | | | | | | | |
Endo Pharmaceuticals Holdings, Inc. (a) | | | 1,130,000 | | | 26,769,700 | |
Forest Laboratories, Inc. (a) | | | 990,000 | | | 31,046,400 | |
Pfizer, Inc. | | | 670,000 | | | 11,490,500 | |
| | | | |
|
|
|
| | | | | | 69,306,600 | |
|
|
|
|
|
|
|
|
Total Health Care | | | | | | 389,552,400 | |
|
|
|
|
|
|
|
|
| | |
See Notes to Financial Statements. | | |
|
|
|
BLACKROCK LARGE CAP SERIES FUNDS, INC. | MARCH 31, 2010 | 49 |
| |
|
|
| |
Schedule of Investments (continued) | Master Large Cap Value Portfolio |
| (Percentages shown are based on Net Assets) |
| | | | | | | |
Common Stocks | | Shares | | Value | |
|
|
|
|
|
|
|
|
Industrials — 12.7% | | | | | | | |
Aerospace & Defense — 3.4% | | | | | | | |
L-3 Communications Holdings, Inc. | | | 330,000 | | $ | 30,237,900 | |
Northrop Grumman Corp. (b) | | | 510,000 | | | 33,440,700 | |
Raytheon Co. | | | 440,000 | | | 25,132,800 | |
| | | | |
|
|
|
| | | | | | 88,811,400 | |
|
|
|
|
|
|
|
|
Commercial Services & Supplies — 1.1% | | | | | | | |
R.R. Donnelley & Sons Co. | | | 1,340,000 | | | 28,609,000 | |
|
|
|
|
|
|
|
|
Construction & Engineering — 0.1% | | | | | | | |
URS Corp. (a) | | | 70,000 | | | 3,472,700 | |
|
|
|
|
|
|
|
|
Electrical Equipment — 0.9% | | | | | | | |
Hubbell, Inc., Class B | | | 100,000 | | | 5,043,000 | |
Thomas & Betts Corp. (a) | | | 440,000 | | | 17,265,600 | |
| | | | |
|
|
|
| | | | | | 22,308,600 | |
|
|
|
|
|
|
|
|
Industrial Conglomerates — 1.8% | | | | | | | |
Carlisle Cos., Inc. | | | 290,000 | | | 11,049,000 | |
General Electric Co. | | | 1,930,000 | | | 35,126,000 | |
| | | | |
|
|
|
| | | | | | 46,175,000 | |
|
|
|
|
|
|
|
|
Machinery — 4.6% | | | | | | | |
Eaton Corp. | | | 440,000 | | | 33,338,800 | |
Harsco Corp. | | | 140,000 | | | 4,471,600 | |
Parker Hannifin Corp. | | | 460,000 | | | 29,780,400 | |
SPX Corp. | | | 380,000 | | | 25,201,600 | |
Timken Co. | | | 830,000 | | | 24,908,300 | |
| | | | |
|
|
|
| | | | | | 117,700,700 | |
|
|
|
|
|
|
|
|
Road & Rail — 0.8% | | | | | | | |
Ryder System, Inc. | | | 510,000 | | | 19,767,600 | |
|
|
|
|
|
|
|
|
Total Industrials | | | | | | 326,845,000 | |
|
|
|
|
|
|
|
|
Information Technology — 6.5% | | | | | | | |
Computers & Peripherals — 2.1% | | | | | | | |
Lexmark International, Inc., Class A (a) | | | 790,000 | | | 28,503,200 | |
Western Digital Corp. (a) | | | 630,000 | | | 24,563,700 | |
| | | | |
|
|
|
| | | | | | 53,066,900 | |
|
|
|
|
|
|
|
|
Electronic Equipment, Instruments & Components — 1.0% | | | | | | | |
Tech Data Corp. (a) | | | 620,000 | | | 25,978,000 | |
|
|
|
|
|
|
|
|
IT Services — 2.4% | | | | | | | |
Amdocs Ltd. (a) | | | 850,000 | | | 25,593,500 | |
Computer Sciences Corp. (a) | | | 550,000 | | | 29,969,500 | |
DST Systems, Inc. (b) | | | 180,000 | | | 7,461,000 | |
| | | | |
|
|
|
| | | | | | 63,024,000 | |
|
|
|
|
|
|
|
|
Software — 1.0% | | | | | | | |
CA, Inc. | | | 1,100,000 | | | 25,817,000 | |
|
|
|
|
|
|
|
|
Total Information Technology | | | | | | 167,885,900 | |
|
|
|
|
|
|
|
|
Materials — 12.0% | | | | | | | |
Chemicals — 7.4% | | | | | | | |
Ashland, Inc. | | | 540,000 | | | 28,495,800 | |
Cabot Corp. | | | 560,000 | | | 17,024,000 | |
Cytec Industries, Inc. | | | 440,000 | | | 20,565,600 | |
Eastman Chemical Co. | | | 430,000 | | | 27,382,400 | |
Huntsman Corp. | | | 2,170,000 | | | 26,148,500 | |
Lubrizol Corp. | | | 300,000 | | | 27,516,000 | |
PPG Industries, Inc. | | | 460,000 | | | 30,084,000 | |
RPM International, Inc. | | | 610,000 | | | 13,017,400 | |
| | | | |
|
|
|
| | | | | | 190,233,700 | |
|
|
|
|
|
|
|
|
| | | | | | | |
Common Stocks | | Shares | | Value | |
|
|
|
|
|
|
|
|
Materials (concluded) | | | | | | | |
Containers & Packaging — 1.0% | | | | | | | |
Bemis Co. | | | 560,000 | | $ | 16,083,200 | |
Sealed Air Corp. | | | 400,000 | | | 8,432,000 | |
| | | | |
|
|
|
| | | | | | 24,515,200 | |
|
|
|
|
|
|
|
|
Metals & Mining — 1.3% | | | | | | | |
Freeport-McMoRan Copper & Gold, Inc., Class B (b) | | | 410,000 | | | 34,251,400 | |
|
|
|
|
|
|
|
|
Paper & Forest Products — 2.3% | | | | | | | |
International Paper Co. | | | 1,220,000 | | | 30,024,200 | |
MeadWestvaco Corp. | | | 1,160,000 | | | 29,638,000 | |
| | | | |
|
|
|
| | | | | | 59,662,200 | |
|
|
|
|
|
|
|
|
Total Materials | | | | | | 308,662,500 | |
|
|
|
|
|
|
|
|
Telecommunication Services — 3.6% | | | | | | | |
Diversified Telecommunication Services — 3.3% | | | | | | | |
AT&T Inc. | | | 710,000 | | | 18,346,400 | |
Verizon Communications, Inc. (b) | | | 2,100,000 | | | 65,142,000 | |
| | | | |
|
|
|
| | | | | | 83,488,400 | |
|
|
|
|
|
|
|
|
Wireless Telecommunication Services — 0.3% | | | | | | | |
Telephone & Data Systems, Inc. | | | 250,000 | | | 8,462,500 | |
|
|
|
|
|
|
|
|
Total Telecommunication Services | | | | | | 91,950,900 | |
|
|
|
|
|
|
|
|
Utilities — 7.1% | | | | | | | |
Electric Utilities — 0.8% | | | | | | | |
Edison International | | | 600,000 | | | 20,502,000 | |
|
|
|
|
|
|
|
|
Gas Utilities — 1.4% | | | | | | | |
Atmos Energy Corp. | | | 450,000 | | | 12,856,500 | |
Oneok, Inc. | | | 60,000 | | | 2,739,000 | |
UGI Corp. | | | 730,000 | | | 19,374,200 | |
| | | | |
|
|
|
| | | | | | 34,969,700 | |
|
|
|
|
|
|
|
|
Independent Power Producers & Energy Traders — 2.7% | | | | | | | |
Constellation Energy Group, Inc. | | | 740,000 | | | 25,981,400 | |
Mirant Corp. (a) | | | 1,710,000 | | | 18,570,600 | |
NRG Energy, Inc. (a)(b) | | | 1,130,000 | | | 23,617,000 | |
| | | | |
|
|
|
| | | | | | 68,169,000 | |
|
|
|
|
|
|
|
|
Multi-Utilities — 2.2% | | | | | | | |
DTE Energy Co. (b) | | | 660,000 | | | 29,436,000 | |
NiSource, Inc. (b) | | | 1,790,000 | | | 28,282,000 | |
| | | | |
|
|
|
| | | | | | 57,718,000 | |
|
|
|
|
|
|
|
|
Total Utilities | | | | | | 181,358,700 | |
|
|
|
|
|
|
|
|
Total Long-Term Investments
(Cost — $2,150,573,906) — 100.1% | | | | | | 2,574,410,600 | |
|
|
|
|
|
|
|
|
| | |
See Notes to Financial Statements. |
|
|
|
50 | BLACKROCK LARGE CAP SERIES FUNDS, INC. | MARCH 31, 2010 |
| |
|
|
| |
Schedule of Investments (concluded) | Master Large Cap Value Portfolio |
| (Percentages shown are based on Net Assets) |
| | | | | | | |
Short-Term Securities | | Beneficial
Interest
(000) | | Value | |
|
|
|
|
|
|
|
|
BlackRock Liquidity Series, LLC,
Money Market Series, 0.22% (c)(d)(e) | | $ | 204,527 | | $ | 204,526,650 | |
|
|
|
|
|
|
|
|
Total Short-Term Securities
(Cost — $204,526,650) — 8.0% | | | | | | 204,526,650 | |
|
|
|
|
|
|
|
|
Total Investments (Cost — $2,355,100,556*) — 108.1% | | | | | | 2,778,937,250 | |
Liabilities in Excess of Other Assets — (8.1)% | | | | | | (208,240,531 | ) |
| | | | |
|
|
|
Net Assets — 100.0% | | | | | $ | 2,570,696,719 | |
| | | | |
|
|
|
|
|
|
|
|
|
|
|
|
| |
* | The cost and unrealized appreciation (depreciation) of investments as of March 31, 2010, as computed for federal income tax purposes, were as follows: |
| | | | |
Aggregate cost | | $ | 2,557,598,217 | |
| |
|
|
|
Gross unrealized appreciation | | $ | 249,601,644 | |
Gross unrealized depreciation | | | (28,262,611 | ) |
| |
|
|
|
Net unrealized appreciation | | $ | 221,339,033 | |
| |
|
|
|
| |
(a) | Non-income producing security. |
| |
(b) | Security, or a portion of security, is on loan. |
| |
(c) | Investments in companies considered to be an affiliate of the Portfolio, for purposes of Section 2(a)(3) of the Investment Company Act of 1940, were as follows: |
| | | | | | | |
|
|
|
|
|
|
|
|
Affiliate | | Net
Activity | | Income | |
|
|
|
|
|
|
|
|
BlackRock Liquidity Funds, TempFund, Institutional Class | | | — | | $ | 608 | |
BlackRock Liquidity Series, LLC, Money Market Series | | $ | 148,788,500 | | $ | 44,920 | |
|
|
|
|
|
|
|
|
| | |
(d) | Represents the current yield as of report date. |
| | |
(e) | Security was purchased with the cash collateral from loaned securities. |
| | |
• | For Portfolio compliance purposes,the Portfolio’s sector and industry classifications refer to any one or more of the sector and industry sub-classifications used by one or more widely recognized market indexes or rating group indexes, and/or as defined by Portfolio management. This definition may not apply for purposes of this report, which may combine such industry sub-classifications for reporting ease. |
| | |
• | Fair Value Measurements — Various inputs are used in determining the fair value of investments, which are as follows: |
| | |
| • | Level 1 — price quotations in active markets/exchanges for identical assets and liabilities |
| | |
| • | Level 2 — other observable inputs (including, but not limited to: quoted prices for similar assets or liabilities in markets that are active, quoted prices for identical or similar assets or liabilities in markets that are not active, inputs other than quoted prices that are observable for the assets or liabilities (such as interest rates, yield curves, volatilities, prepayment speeds, loss severities, credit risks and default rates) or other market-corroborated inputs) |
| | |
| • | Level 3 — unobservable inputs based on the best information available in the circumstances, to the extent observable inputs are not available (including the Portfolio’s own assumptions used in determining the fair value of investments) |
| | |
| The inputs or methodologies used for valuing securities are not necessarily an indication of the risk associated with investing in those securities. For information about the Portfolio’s policy regarding valuation of investments and other significant accounting policies, please refer to Note 1 of the Notes to Financial Statements. |
| | |
| The following table summarizes the inputs used as of March 31, 2010 in determining the fair valuation of the Portfolio’s investments: |
| | | | | | | | | | | | | |
|
|
|
|
| | Investments in Securities | |
|
|
|
|
Valuation Inputs | | Level 1 | | Level 2 | | Level 3 | | Total | |
|
|
|
|
|
|
|
|
|
|
|
|
|
|
Assets: | | | | | | | | | | | | | |
Long-Term Investments1 | | $ | 2,574,410,600 | | | — | | | — | | $ | 2,574,410,600 | |
Short-Term Securities | | | — | | $ | 204,526,650 | | | — | | | 204,526,650 | |
| |
|
|
|
|
|
|
|
|
|
|
|
|
Total | | $ | 2,574,410,600 | | $ | 204,526,650 | | | — | | $ | 2,778,937,250 | |
| |
|
|
|
|
|
|
|
|
|
|
|
|
| | |
| 1 | See above Schedule of Investments for values in each sector and industry. |
| | |
See Notes to Financial Statements. | | |
|
|
|
BLACKROCK LARGE CAP SERIES FUNDS, INC. | MARCH 31, 2010 | 51 |
| |
|
|
|
Statements of Assets and Liabilities | Master Large Cap Series LLC |
| | | | | | | | | | |
March 31, 2010 (Unaudited) | | Master Large
Cap Core
Portfolio | | Master Large
Cap Growth
Portfolio | | Master Large
Cap Value
Portfolio | |
|
|
|
|
|
|
|
|
|
|
|
Assets | | | | | | | | | | |
|
|
|
|
|
|
|
|
|
|
|
Investments at value — unaffiliated1,2 | | $ | 4,008,014,300 | | $ | 746,332,840 | | $ | 2,574,410,600 | |
Investments at value — affiliated3 | | | 284,432,850 | | | 49,514,400 | | | 204,526,650 | |
Investments sold receivable | | | 42,121,687 | | | 15,338,833 | | | 28,385,493 | |
Dividends receivable | | | 4,512,725 | | | 683,005 | | | 3,855,951 | |
Contributions receivable from investors | | | 3,730,128 | | | 5,092,526 | | | 374,354 | |
Securities lending income receivable — affiliated | | | 97,120 | | | 10,767 | | | 19,804 | |
Prepaid expenses | | | 77,788 | | | 17,280 | | | 77,439 | |
Other assets | | | 36,617 | | | 4,043 | | | 28,551 | |
| |
|
|
|
|
|
|
|
|
|
Total assets | | | 4,343,023,215 | | | 816,993,694 | | | 2,811,678,842 | |
| |
|
|
|
|
|
|
|
|
|
| | | | | | | | | | |
|
|
|
|
|
|
|
|
|
|
|
Liabilities | | | | | | | | | | |
|
|
|
|
|
|
|
|
|
|
|
Collateral at value — securities loaned | | | 284,432,850 | | | 49,514,400 | | | 204,526,650 | |
Bank overdraft | | | 7,408,729 | | | 2,885,848 | | | 6,901,772 | |
Withdrawals payable to investors | | | 30,961,664 | | | — | | | 6,424,373 | |
Investments purchased payable | | | 28,573,729 | | | 12,514,441 | | | 21,928,858 | |
Investment advisory fees payable | | | 1,565,992 | | | 313,481 | | | 1,091,233 | |
Other affiliates payable | | | 18,420 | | | 3,426 | | | 11,799 | |
Directors’ fees payable | | | 206 | | | 120 | | | 440 | |
Other accrued expenses payable | | | 99,764 | | | 39,102 | | | 96,265 | |
Other liabilities | | | 672 | | | 138 | | | 733 | |
| |
|
|
|
|
|
|
|
|
|
Total liabilities | | | 353,062,026 | | | 65,270,956 | | | 240,982,123 | |
| |
|
|
|
|
|
|
|
|
|
Net Assets | | $ | 3,989,961,189 | | $ | 751,722,738 | | $ | 2,570,696,719 | |
| |
|
|
|
|
|
|
|
|
|
| | | | | | | | | | |
|
|
|
|
|
|
|
|
|
|
|
Net Assets Consist of | | | | | | | | | | |
|
|
|
|
|
|
|
|
|
|
|
Investors’ capital | | $ | 3,328,825,802 | | $ | 636,913,862 | | $ | 2,146,860,025 | |
Net unrealized appreciation/depreciation | | | 661,135,387 | | | 114,808,876 | | | 423,836,694 | |
| |
|
|
|
|
|
|
|
|
|
Net Assets | | $ | 3,989,961,189 | | $ | 751,722,738 | | $ | 2,570,696,719 | |
| |
|
|
|
|
|
|
|
|
|
1 Investments at cost — unaffiliated | | $ | 3,346,878,913 | | $ | 631,523,964 | | $ | 2,150,573,906 | |
| |
|
|
|
|
|
|
|
|
|
2 Securities loaned at value | | $ | 274,877,149 | | $ | 48,156,803 | | $ | 196,493,785 | |
| |
|
|
|
|
|
|
|
|
|
3 Investments at cost — affiliated | | $ | 284,432,850 | | $ | 49,514,400 | | $ | 204,526,650 | |
| |
|
|
|
|
|
|
|
|
|
| | |
See Notes to Financial Statements. |
|
|
|
52 | BLACKROCK LARGE CAP SERIES FUNDS, INC. | MARCH 31, 2010 |
| |
|
|
|
Statements of Operations | Master Large Cap Series LLC |
| | | | | | | | | | |
Six Months Ended March 31, 2010 (Unaudited) | | Master Large
Cap Core
Portfolio | | Master Large
Cap Growth
Portfolio | | Master Large
Cap Value
Portfolio | |
|
|
|
|
|
|
|
|
|
|
|
Investment Income | | | | | | | | | | |
|
|
|
|
|
|
|
|
|
|
|
Dividends | | $ | 33,956,931 | | $ | 4,910,773 | | $ | 26,123,390 | |
Securities lending — affiliated | | | 194,448 | | | 19,996 | | | 44,920 | |
Income — affiliated | | | 648 | | | 148 | | | 608 | |
Interest | | | 216,115 | | | 41,481 | | | 69 | |
| |
|
|
|
|
|
|
|
|
|
Total income | | | 34,368,142 | | | 4,972,398 | | | 26,168,987 | |
| |
|
|
|
|
|
|
|
|
|
| | | | | | | | | | |
|
|
|
|
|
|
|
|
|
|
|
Expenses | | | | | | | | | | |
|
|
|
|
|
|
|
|
|
|
|
Investment advisory | | | 9,096,377 | | | 1,818,452 | | | 6,408,141 | |
Accounting services | | | 309,016 | | | 142,848 | | | 268,506 | |
Custodian | | | 109,964 | | | 32,124 | | | 80,907 | |
Professional | | | 38,364 | | | 28,170 | | | 37,013 | |
Directors | | | 35,692 | | | 8,854 | | | 31,960 | |
Printing | | | 4,056 | | | 838 | | | 2,227 | |
Miscellaneous | | | 38,519 | | | 10,218 | | | 31,654 | |
| |
|
|
|
|
|
|
|
|
|
Total expenses | | | 9,631,988 | | | 2,041,504 | | | 6,860,408 | |
Less fees waived by advisor | | | (576 | ) | | (58 | ) | | (147 | ) |
| |
|
|
|
|
|
|
|
|
|
Total expenses after fees waived | | | 9,631,412 | | | 2,041,446 | | | 6,860,261 | |
| |
|
|
|
|
|
|
|
|
|
Net investment income | | | 24,736,730 | | | 2,930,952 | | | 19,308,726 | |
| |
|
|
|
|
|
|
|
|
|
| | | | | | | | | | |
|
|
|
|
|
|
|
|
|
|
|
Realized and Unrealized Gain (Loss) | | | | | | | | | | |
|
|
|
|
|
|
|
|
|
|
|
Net realized gain (loss) from: | | | | | | | | | | |
Investments | | | 294,755,230 | | | 78,127,695 | | | 185,523,055 | |
Payment by affiliate | | | 2,319,220 | | | 68,976 | | | — | |
| |
|
|
|
|
|
|
|
|
|
| | | 297,074,450 | | | 78,196,671 | | | 185,523,055 | |
| |
|
|
|
|
|
|
|
|
|
Net change in unrealized appreciation/depreciation on investments | | | 120,603,879 | | | 7,166,417 | | | 27,149,982 | |
| |
|
|
|
|
|
|
|
|
|
Total realized and unrealized gain (loss) | | | 417,678,329 | | | 85,363,088 | | | 212,673,037 | |
| |
|
|
|
|
|
|
|
|
|
Net Increase (Decrease) in Net Assets Resulting from Operations | | $ | 442,415,059 | | $ | 88,294,040 | | $ | 231,981,763 | |
| |
|
|
|
|
|
|
|
|
|
| | |
See Notes to Financial Statements. | | |
|
|
|
BLACKROCK LARGE CAP SERIES FUNDS, INC. | MARCH 31, 2010 | 53 |
| |
|
|
|
Statements of Changes in Net Assets | Master Large Cap Series LLC |
| | | | | | | | | | | | | | | | | | | |
| | Master Large Cap Core Portfolio | | Master Large Cap Growth Portfolio |
| |
| |
|
Increase (Decrease) in Net Assets: | | Six Months
Ended
March 31,
2010
(Unaudited) | | Period
November 1,
2008 to
September 30,
2009 | | Year Ended
October 31,
2008 | | Six Months
Ended
March 31,
2010
(Unaudited) | | Period
November 1,
2008 to
September 30,
2009 | | Year Ended
October 31,
2008 | |
|
|
|
|
|
|
|
|
|
|
|
|
|
|
Operations | | | | | | | | | | | | | | | | | | | |
|
|
|
|
|
|
|
|
|
|
|
|
|
|
|
|
|
|
|
|
Net investment income | | $ | 24,736,730 | | $ | 45,398,506 | | $ | 41,118,548 | | $ | 2,930,952 | | $ | 4,690,392 | | $ | 5,455,044 | |
Net realized gain (loss) | | | 297,074,450 | | | (778,429,718 | ) | | (521,502,159 | ) | | 78,196,671 | | | (130,730,353 | ) | | (114,597,872 | ) |
Net change in unrealized appreciation/depreciation | | | 120,603,879 | | | 1,174,704,782 | | | (1,536,726,590 | ) | | 7,166,417 | | | 248,627,811 | | | (333,142,941 | ) |
| |
|
|
|
|
|
|
|
| |
|
|
|
|
|
|
|
|
|
Net increase (decrease) in net assets resulting from operations | | | 442,415,059 | | | 441,673,570 | | | (2,017,110,201 | ) | | 88,294,040 | | | 122,587,850 | | | (442,285,769 | ) |
| |
|
|
|
|
|
|
|
| |
|
|
|
|
|
|
|
|
|
| | | | | | | | | | | | | | | | | | | |
|
|
|
|
|
|
|
|
|
|
|
|
|
|
|
|
|
|
|
|
Capital Transactions | | | | | | | | | | | | | | | | | | | |
|
|
|
|
|
|
|
|
|
|
|
|
|
|
|
|
|
|
|
|
Proceeds from contributions | | | 211,327,919 | | | 1,506,405,011 | | | 986,366,566 | | | 82,746,983 | | | 215,325,909 | | | 469,632,427 | |
Value of withdrawals | | | (610,104,107 | ) | | (845,271,038 | ) | | (1,775,472,579 | ) | | (153,205,961 | ) | | (269,988,785 | ) | | (595,379,184 | ) |
| |
|
|
|
|
|
|
|
| |
|
|
|
|
|
|
|
|
|
Net increase (decrease) in net assets derived from capital transactions | | | (398,776,188 | ) | | 661,133,973 | | | (789,106,013 | ) | | (70,458,978 | ) | | (54,662,876 | ) | | (125,746,757 | ) |
| |
|
|
|
|
|
|
|
| |
|
|
|
|
|
|
|
|
|
| | | | | | | | | | | | | | | | | | | |
|
|
|
|
|
|
|
|
|
|
|
|
|
|
|
|
|
|
|
|
Net Assets | | | | | | | | | | | | | | | | | | | |
|
|
|
|
|
|
|
|
|
|
|
|
|
|
|
|
|
|
|
|
Total increase (decrease) in net assets | | | 43,638,871 | | | 1,102,807,543 | | | (2,806,216,214 | ) | | 17,835,062 | | | 67,924,974 | | | (568,032,526 | ) |
Beginning of period | | | 3,946,322,318 | | | 2,843,514,775 | | | 5,649,730,989 | | | 733,887,676 | | | 665,962,702 | | | 1,233,995,228 | |
| |
|
|
|
|
|
|
|
| |
|
|
|
|
|
|
|
|
|
End of period | | $ | 3,989,961,189 | | $ | 3,946,322,318 | | $ | 2,843,514,775 | | $ | 751,722,738 | | $ | 733,887,676 | | $ | 665,962,702 | |
| |
|
|
|
|
|
|
|
| |
|
|
|
|
|
|
|
|
|
Master Large Cap Series LLC
| | | | | | | | | | |
| | Master Large Cap Value Portfolio | |
| |
|
|
Increase (Decrease) in Net Assets: | | Six Months
Ended
March 31,
2010
(Unaudited) | | Period
November 1,
2008 to
September 30,
2009 | | Year Ended
October 31,
2008 | |
|
|
|
|
|
|
|
|
|
|
|
Operations | | | | | | | | | | |
|
|
|
|
|
|
|
|
|
|
|
Net investment income | | $ | 19,308,726 | | $ | 44,699,454 | | $ | 56,250,234 | |
Net realized gain (loss) | | | 185,523,055 | | | (907,436,935 | ) | | (586,455,313 | ) |
Net change in unrealized appreciation/depreciation | | | 27,149,982 | | | 1,046,928,266 | | | (1,366,434,994 | ) |
| |
|
|
|
|
|
|
|
|
|
Net increase (decrease) in net assets resulting from operations | | | 231,981,763 | | | 184,190,785 | | | (1,896,640,073 | ) |
| |
|
|
|
|
|
|
|
|
|
| | | | | | | | | | |
|
|
|
|
|
|
|
|
|
|
|
Capital Transactions | | | | | | | | | | |
|
|
|
|
|
|
|
|
|
|
|
Proceeds from contributions | | | 282,572,624 | | | 812,993,042 | | | 1,889,127,025 | |
Value of withdrawals | | | (589,715,779 | ) | | (1,414,441,343 | ) | | (2,321,525,876 | ) |
| |
|
|
|
|
|
|
|
|
|
Net decrease in net assets derived from capital transactions | | | (307,143,155 | ) | | (601,448,301 | ) | | (432,398,851 | ) |
| |
|
|
|
|
|
|
|
|
|
| | | | | | | | | | |
|
|
|
|
|
|
|
|
|
|
|
Net Assets | | | | | | | | | | |
|
|
|
|
|
|
|
|
|
|
|
Total decrease in net assets | | | (75,161,392 | ) | | (417,257,516 | ) | | (2,329,038,924 | ) |
Beginning of period | | | 2,645,858,111 | | | 3,063,115,627 | | | 5,392,154,551 | |
| |
|
|
|
|
|
|
|
|
|
End of period | | $ | 2,570,696,719 | | $ | 2,645,858,111 | | $ | 3,063,115,627 | |
| |
|
|
|
|
|
|
|
|
|
| | |
See Notes to Financial Statements. | |
|
|
54 | BLACKROCK LARGE CAP SERIES FUNDS, INC. | MARCH 31, 2010 |
| |
|
|
|
Financial Highlights | Master Large Cap Series LLC |
| | | | | | | | | | | | | | | | | | | | | | |
| | Master Large Cap Core Portfolio |
| |
|
| | Six Months
Ended
March 31,
2010
(Unaudited) | | Period
November 1,
2008 to
September 30,
2009 | | | | | | | | | | | |
| | | | Year Ended October 31, |
| | | |
|
| | | | 2008 | | 2007 | | 2006 | | 2005 | | 2004 | |
|
|
|
|
|
|
|
|
|
|
|
|
|
|
|
|
|
|
|
|
|
|
|
Total Investment Return | | | | | | | | | | | | | | | | | | | | | | |
|
|
|
|
|
|
|
|
|
|
|
|
|
|
|
|
|
|
|
|
|
|
|
Total investment return | | | 11.86 | %1 | | 12.63 | %1,2 | | (38.84 | )% | | 13.94 | % | | 17.32 | % | | 18.35 | % | | 9.61 | % |
| |
|
|
|
|
|
|
|
|
|
|
|
|
|
|
|
|
|
|
|
|
|
| | | | | | | | | | | | | | | | | | | | | | |
|
|
|
|
|
|
|
|
|
|
|
|
|
|
|
|
|
|
|
|
|
|
|
Ratios to Average Net Assets | | | | | | | | | | | | | | | | | | | | | | |
|
|
|
|
|
|
|
|
|
|
|
|
|
|
|
|
|
|
|
|
|
|
|
Total expenses | | | 0.49 | %3 | | 0.50 | %3 | | 0.50 | % | | 0.49 | % | | 0.49 | % | | 0.51 | % | | 0.52 | % |
| |
|
|
|
|
|
|
|
|
|
|
|
|
|
|
|
|
|
|
|
|
|
Total expenses after fees waived | | | 0.49 | %3 | | 0.50 | %3 | | 0.50 | % | | 0.49 | % | | 0.49 | % | | 0.51 | % | | 0.52 | % |
| |
|
|
|
|
|
|
|
|
|
|
|
|
|
|
|
|
|
|
|
|
|
Net investment income | | | 1.26 | %3 | | 1.56 | %3 | | 0.93 | % | | 0.63 | % | | 0.58 | % | | 0.72 | % | | 0.57 | % |
| |
|
|
|
|
|
|
|
|
|
|
|
|
|
|
|
|
|
|
|
|
|
| | | | | | | | | | | | | | | | | | | | | | |
|
|
|
|
|
|
|
|
|
|
|
|
|
|
|
|
|
|
|
|
|
|
|
Supplemental Data | | | | | | | | | | | | | | | | | | | | | | |
|
|
|
|
|
|
|
|
|
|
|
|
|
|
|
|
|
|
|
|
|
|
|
Net assets, end of period (000) | | $ | 3,989,961 | | $ | 3,946,423 | | $ | 2,843,515 | | $ | 5,649,731 | | $ | 3,876,639 | | $ | 2,666,699 | | $ | 1,831,300 | |
| |
|
|
|
|
|
|
|
|
|
|
|
|
|
|
|
|
|
|
|
|
|
Portfolio turnover | | | 73 | % | | 168 | % | | 109 | % | | 96 | % | | 88 | % | | 94 | % | | 136 | % |
| |
|
|
|
|
|
|
|
|
|
|
|
|
|
|
|
|
|
|
|
|
|
| | | | | | | | | | | | | | | | | | | | | | |
| | Master Large Cap Growth Portfolio |
| |
|
| | Six Months
Ended
March 31,
2010
(Unaudited) | | Period
November 1,
2008 to
September 30,
2009 | | | | | | | | | | | |
| | | | Year Ended October 31, |
| | | |
|
| | | | 2008 | | 2007 | | 2006 | | 2005 | | 2004 | |
|
|
|
|
|
|
|
|
|
|
|
|
|
|
|
|
|
|
|
|
|
|
|
Total Investment Return | | | | | | | | | | | | | | | | | | | | | | |
|
|
|
|
|
|
|
|
|
|
|
|
|
|
|
|
|
|
|
|
|
|
|
Total investment return | | | 12.88 | %1 | | 20.49 | %1,4 | | (37.96 | )% | | 17.47 | % | | 14.05 | % | | 12.47 | % | | 5.42 | % |
| |
|
|
|
|
|
|
|
|
|
|
|
|
|
|
|
|
|
|
|
|
|
| | | | | | | | | | | | | | | | | | | | | | |
|
|
|
|
|
|
|
|
|
|
|
|
|
|
|
|
|
|
|
|
|
|
|
Ratios to Average Net Assets | | | | | | | | | | | | | | | | | | | | | | |
|
|
|
|
|
|
|
|
|
|
|
|
|
|
|
|
|
|
|
|
|
|
|
Total expenses | | | 0.56 | %3 | | 0.57 | %3 | | 0.56 | % | | 0.56 | % | | 0.56 | % | | 0.57 | % | | 0.59 | % |
| |
|
|
|
|
|
|
|
|
|
|
|
|
|
|
|
|
|
|
|
|
|
Total expenses after fees waived | | | 0.56 | %3 | | 0.57 | %3 | | 0.56 | % | | 0.56 | % | | 0.56 | % | | 0.57 | % | | 0.59 | % |
| |
|
|
|
|
|
|
|
|
|
|
|
|
|
|
|
|
|
|
|
|
|
Net investment income | | | 0.81 | %3 | | 0.81 | %3 | | 0.54 | % | | 0.25 | % | | 0.26 | % | | 0.33 | % | | 0.09 | % |
| |
|
|
|
|
|
|
|
|
|
|
|
|
|
|
|
|
|
|
|
|
|
| | | | | | | | | | | | | | | | | | | | | | |
|
|
|
|
|
|
|
|
|
|
|
|
|
|
|
|
|
|
|
|
|
|
|
Supplemental Data | | | | | | | | | | | | | | | | | | | | | | |
|
|
|
|
|
|
|
|
|
|
|
|
|
|
|
|
|
|
|
|
|
|
|
Net assets, end of period (000) | | $ | 751,723 | | $ | 733,888 | | $ | 665,963 | | $ | 1,233,995 | | $ | 785,377 | | $ | 489,398 | | $ | 344,400 | |
| |
|
|
|
|
|
|
|
|
|
|
|
|
|
|
|
|
|
|
|
|
|
Portfolio turnover | | | 97 | % | | 242 | % | | 144 | % | | 87 | % | | 117 | % | | 132 | % | | 165 | % |
| |
|
|
|
|
|
|
|
|
|
|
|
|
|
|
|
|
|
|
|
|
|
| | |
| 1 | Aggregate total investment return. |
| | |
| 2 | Includes proceeds received from a settlement of litigation, which impacted the Portfolio’s total investment return. Not including these proceeds, the Portfolio’s total investment return would have been 12.39%. |
| | |
| 3 | Annualized. |
| | |
| 4 | Includes proceeds from a settlement of litigation, which impacted the Portfolio’s total investment return. Not including these proceeds, the Portfolio’s total investment return would have been 20.23%. |
| | |
See Notes to Financial Statements. |
|
|
|
BLACKROCK LARGE CAP SERIES FUNDS, INC. | MARCH 31, 2010 | 55 |
| |
|
|
|
Financial Highlights (concluded) | Master Large Cap Series LLC |
| | | | | | | | | | | | | | | | | | | | | | |
| | Master Large Cap Value Portfolio |
| |
|
| | Six Months
Ended
March 31,
2010
(Unaudited) | | Period
November 1,
2008 to
September 30,
2009 | | | | | | | | | | | |
| | | | Year Ended October 31, |
| | | |
|
| | | | 2008 | | 2007 | | 2006 | | 2005 | | 2004 | |
|
|
|
|
|
|
|
|
|
|
|
|
|
|
|
|
|
|
|
|
|
|
|
Total Investment Return | | | | | | | | | | | | | | | | | | | | | | |
|
|
|
|
|
|
|
|
|
|
|
|
|
|
|
|
|
|
|
|
|
|
|
Total investment return | | | 9.43 | %1 | | 9.03 | %1,2 | | (36.54 | )% | | 12.72 | % | | 18.48 | % | | 21.93 | % | | 14.57 | % |
| |
|
|
|
|
|
|
|
|
|
|
|
|
|
|
|
|
|
|
|
|
|
| | | | | | | | | | | | | | | | | | | | | | |
|
|
|
|
|
|
|
|
|
|
|
|
|
|
|
|
|
|
|
|
|
|
|
Ratios to Average Net Assets | | | | | | | | | | | | | | | | | | | | | | |
|
|
|
|
|
|
|
|
|
|
|
|
|
|
|
|
|
|
|
|
|
|
|
Total expenses | | | 0.54 | %3 | | 0.54 | %3 | | 0.51 | % | | 0.51 | % | | 0.53 | % | | 0.55 | % | | 0.56 | % |
| |
|
|
|
|
|
|
|
|
|
|
|
|
|
|
|
|
|
|
|
|
|
Total expenses after fees waived | | | 0.54 | %3 | | 0.54 | %3 | | 0.51 | % | | 0.51 | % | | 0.53 | % | | 0.55 | % | | 0.56 | % |
| |
|
|
|
|
|
|
|
|
|
|
|
|
|
|
|
|
|
|
|
|
|
Net investment income | | | 1.51 | %3 | | 1.88 | %3 | | 1.22 | % | | 0.95 | % | | 0.73 | % | | 0.80 | % | | 0.93 | % |
| |
|
|
|
|
|
|
|
|
|
|
|
|
|
|
|
|
|
|
|
|
|
| | | | | | | | | | | | | | | | | | | | | | |
|
|
|
|
|
|
|
|
|
|
|
|
|
|
|
|
|
|
|
|
|
|
|
Supplemental Data | | | | | | | | | | | | | | | | | | | | | | |
|
|
|
|
|
|
|
|
|
|
|
|
|
|
|
|
|
|
|
|
|
|
|
Net assets, end of period (000) | | $ | 2,570,697 | | $ | 2,645,858 | | $ | 3,063,116 | | $ | 5,392,155 | | $ | 3,927,926 | | $ | 1,535,988 | | $ | 810,489 | |
| |
|
|
|
|
|
|
|
|
|
|
|
|
|
|
|
|
|
|
|
|
|
Portfolio turnover | | | 64 | % | | 151 | % | | 108 | % | | 72 | % | | 71 | % | | 95 | % | | 128 | % |
| |
|
|
|
|
|
|
|
|
|
|
|
|
|
|
|
|
|
|
|
|
|
| | |
| 1 | Aggregate total investment return. |
| | |
| 2 | Includes proceeds received from a settlement of litigation, which impacted the Portfolio’s total investment return. Not including these proceeds, the Portfolio’s total investment return would have been 8.61%. |
| | |
| 3 | Annualized. |
| | |
See Notes to Financial Statements. | |
|
|
56 | BLACKROCK LARGE CAP SERIES FUNDS, INC. | MARCH 31, 2010 |
| |
|
| |
Notes to Financial Statements (Unaudited) | Master Large Cap Series LLC |
1. Organization and Significant Accounting Policies:
Master Large Cap Core Portfolio, Master Large Cap Growth Portfolio and Master Large Cap Value Portfolio (the “Portfolios”) constitute the Master Large Cap Series LLC (collectively, the “Master LLC”). The Master LLC is registered under the Investment Company Act of 1940, as amended (the “1940 Act”), as a diversified open-end management investment company and is organized as a Delaware limited liability company. The Master LLC’s Limited Liability Company Agreement permits the Board of Directors (the “Board”) to issue non-transferable interests in the Master LLC, subject to certain limitations. The Portfolios’ financial statements are prepared in conformity with accounting principles generally accepted in the United States of America, which may require the use of management accruals and estimates. Actual results may differ from these estimates.
On January 30, 2009, Master Large Cap Core Portfolio received an in-kind contribution of portfolio securities from an affiliated investor valued at $771,174,100.
The following is a summary of significant accounting policies followed by the Portfolios:
Valuation: The Portfolios’ policy is to fair value their financial instruments at market value. Equity investments traded on a recognized securities exchange or the NASDAQ Global Market System are valued at the last reported sale price that day or the NASDAQ official closing price, if applicable. For equity investments traded on more than one exchange, the last reported sale price on the exchange where the stock is primarily traded is used. Equity investments traded on a recognized exchange for which there were no sales on that day are valued at the last available bid price. If no bid price is available, the prior day’s price will be used, unless it is determined that such prior day’s price no longer reflects the fair value of the security. Short-term securities with remaining maturities of 60 days or less may be valued at amortized cost, which approximates fair value. Investments in open-end investment companies are valued at net asset value each business day.
The Portfolios value their investments in BlackRock Liquidity Series, LLC Money Market Series (the “Money Market Series”) at fair value, which is ordinarily based upon their pro rata ownership in the net assets of the underlying fund. The Money Market Series seeks current income consistent with maintaining liquidity and preserving capital. Although the Money Market Series is not registered under the 1940 Act, its investments will follow the parameters of investments by a money market fund that is subject to Rule 2a-7 promulgated by the Securities and Exchange Commission (“SEC”) under the 1940 Act. The Portfolios may withdraw up to 25% of their investment daily, although the manager of the Money Market Series, in its sole discretion, may permit an investor to withdraw more than 25% on any one day.
In the event that application of these methods of valuation results in a price for an investment which is deemed not to be representative of the market value of such investment or is not available, the investment will be valued by a method approved by the Board as reflecting fair value (“Fair Value Assets”). When determining the price for Fair Value Assets, the investment advisor and/or sub-advisor seeks to determine the price that a Portfolio might reasonably expect to receive from the current sale of that asset in an arm’s-length transaction. Fair value determinations shall be based upon all available factors that the investment advisor and/or sub-advisor deems relevant. The pricing of all Fair Value Assets is subsequently reported to the Board or a committee thereof.
Investment Transactions and Investment Income: For financial reporting purposes, investment transactions are recorded on the dates the transactions are entered into (the trade dates). Realized gains and losses on investment transactions are determined on the identified cost basis. Dividend income is recorded on the ex-dividend dates. Dividends from foreign securities where the ex-dividend date may have passed are subsequently recorded when the Portfolios have determined the ex-dividend dates. Upon notification from issuers, some of the dividend income received from a real estate investment trust may be redesignated as a reduction of cost of the related investment and/or realized gain. Interest income is recognized on the accrual basis.
Securities Lending: The Portfolios may lend securities to financial institutions that provide cash as collateral, which will be maintained at all times in an amount equal to at least 100% of the current market value of the loaned securities. The market value of the loaned securities is determined at the close of business of each Portfolio and any additional required collateral is delivered to the Portfolio on the next business day. Securities lending income, as disclosed in the Statements of Operations, represents the income earned from the investment of the cash collateral, net of rebates paid to, or fees paid by, borrowers and less the fees paid to the securities lending agent. Loans of securities are terminable at any time and the borrower, after notice, is required to return borrowed securities within the standard time period for settlement of securities transactions. In the event that the borrower defaults on its obligation to return borrowed securities because of insolvency or for any other reason, the Portfolios could experience delays and costs in gaining access to the collateral. The Portfolios also could suffer a loss if the value of an investment purchased with cash collateral falls below the market value of loaned securities or if the value of an investment purchased with cash collateral falls below the value of the original cash collateral received.
Income Taxes: Each Portfolio is classified as a partnership for federal income tax purposes. As such, each investor in a Portfolio is treated as owner of its proportionate share of the net assets, income, expenses and realized and unrealized gains and losses of the Portfolio. Therefore, no federal income tax provision is required. It is intended that each Portfolio’s assets will be managed so an investor in the Portfolio can satisfy the requirements of Subchapter M of the Internal Revenue Code of 1986, as amended.
| | |
|
|
|
BLACKROCK LARGE CAP SERIES FUNDS, INC. | MARCH 31, 2010 | 57 |
| |
|
| |
Notes to Financial Statements (continued) | Master Large Cap Series LLC |
Recent Accounting Standard: In January 2010, the Financial Accounting Standards Board issued amended guidance to improve disclosure about fair value measurements which will require additional disclosures about transfers into and out of Levels 1 and 2 and separate disclosures about purchases, sales, issuances and settlements in the reconciliation for fair value measurements using significant unobservable inputs (Level 3). It also clarifies existing disclosure requirements relating to the levels of disaggregation for fair value measurement and inputs and valuation techniques used to measure fair value. The amended guidance is effective for financial statements for fiscal years beginning after December 15, 2009, and interim periods within those fiscal years, except for disclosures about purchases, sales, issuances and settlements in the rollforward of activity in Level 3 fair value measurements, which are effective for fiscal years beginning after December 15, 2010 and for interim periods within those fiscal years. The impact of this guidance on each Portfolio’s financial statements and disclosures is currently being assessed.
Other: Expenses directly related to one of the Portfolios are charged to that Portfolio. Other operating expenses shared by several funds are pro rated among those funds on the basis of relative net assets or other appropriate methods. Each Portfolio has an arrangement with its custodian whereby fees may be reduced by credits earned on uninvested cash balances, which if applicable are shown as fees paid indirectly in the Statements of Operations. The custodians impose fees on overdrawn cash balances, which can be offset by accumulated credits earned or may result in additional custody charges.
2. Investment Advisory Agreement and Other Transactions with Affiliates:
The PNC Financial Services Group, Inc. (“PNC”), Bank of America Corporation (“BAC”) and Barclays Bank PLC (“Barclays”) are the largest stockholders of BlackRock, Inc. (“BlackRock”). Due to the ownership structure, PNC is an affiliate of the Portfolios for 1940 Act purposes, but BAC and Barclays are not.
The Master LLC, on behalf of each Portfolio has entered into an Investment Advisory Agreement with BlackRock Advisors, LLC (the “Manager”), the Portfolios’ investment advisor, an indirect, wholly owned subsidiary of BlackRock, to provide investment advisory and administration services.
The Manager is responsible for the management of each Portfolio’s investments and provides the necessary personnel, facilities, equipment and certain other services necessary to the operations of each Portfolio. For such services, each Portfolio pays the Manager a monthly fee at the following annual rates of each Portfolio’s average daily net assets:
Master Large Cap Core Portfolio
| | |
|
|
|
Portion of Average Daily Value of Net Assets: | | Rate |
|
|
|
Not exceeding $1 billion | | 0.50% |
In excess of $1 billion but not exceeding $5 billion | | 0.45% |
In excess of $5 billion | | 0.40% |
|
|
|
| | |
Master Large Cap Growth Portfolio | | |
| | |
|
|
|
Portion of Average Daily Value of Net Assets: | | Rate |
|
|
|
Not exceeding $5 billion | | 0.50% |
In excess of $5 billion | | 0.45% |
|
|
|
| | |
Master Large Cap Value Portfolio | | |
| | |
|
|
|
Portion of Average Daily Value of Net Assets: | | Rate |
|
|
|
Not exceeding $3 billion | | 0.50% |
In excess of $3 billion | | 0.45% |
|
|
|
The Manager has voluntarily agreed to waive its advisory fees by the amount of investment advisory fees each Portfolio pays to the Manager indirectly through its investment in affiliated money market funds, however the Manager does not waive its advisory fees by the amount of investment advisory fees through its investment in other affiliated investment companies. These amounts are included in fees waived by advisor in the Statements of Operations.
The Manager has entered into a separate sub-advisory agreement with BlackRock Investment Management, LLC (“BIM”), an affiliate of the Manager, under which the Manager pays BIM for services it provides, a monthly fee that is a percentage of the investment advisory fees paid by each Portfolio to the Manager.
For the six months ended March 31, 2010, each Portfolio reimbursed the Manager for certain accounting services, which are included in accounting services in the Statements of Operations. The reimbursements were as follows:
| | | | |
|
|
|
|
|
| | Accounting
Services | |
|
|
|
|
|
Master Large Cap Core Portfolio | | $ | 35,618 | |
Master Large Cap Growth Portfolio | | $ | 6,940 | |
Master Large Cap Value Portfolio | | $ | 23,539 | |
|
|
|
|
|
The Master LLC has received an exemptive order from the SEC permitting it, among other things, to pay an affiliated securities lending agent a fee based on a share of the income derived from the securities lending activities and has retained BIM as the securities lending agent. BIM may, on behalf of the Portfolios, invest cash collateral received by the Portfolios for such loans, among other things, in a private investment company managed by the Manager or in registered money market funds advised by the Manager or its affiliates. The market value of securities on loan and the value of the related collateral are shown on the Statements of Assets and Liabilities as securities loaned and collateral at value — securities loaned, respectively. The cash collateral invested by BIM is disclosed in each Portfolio’s Schedule of Investments. The share of income earned by the Portfolios on such investments is shown as securities lending — affiliated in the Statements of Operations. For the six months ended March 31, 2010, BIM received $69,947 in securities lending agent fees related to securities lending activities for the Portfolios.
| | |
|
58 | BLACKROCK LARGE CAP SERIES FUNDS, INC. | MARCH 31, 2010 |
| |
|
| |
Notes to Financial Statements (concluded) | Master Large Cap Series LLC |
The Manager reimbursed Master Large Cap Core Portfolio and Master Large Cap Growth Portfolio $2,319,220 and $68,976, respectively, for net losses associated with certain investment transactions.
Certain officers and/or directors of the Master LLC are officers and/or directors of BlackRock or its affiliates.
3. Investments:
Purchases and sales of investments, excluding short-term securities, for the six months ended March 31, 2010 were as follows:
| | | | | | | |
|
|
|
|
|
|
|
|
| | Purchases | | Sales | |
|
|
|
|
|
|
Master Large Cap Core Portfolio | | $ | 2,826,147,213 | | $ | 3,184,084,965 | |
Master Large Cap Growth Portfolio | | $ | 700,633,766 | | $ | 775,583,699 | |
Master Large Cap Value Portfolio | | $ | 1,625,391,062 | | $ | 1,916,744,216 | |
|
|
|
|
|
|
|
|
4. Borrowings:
The Master LLC, on behalf of the Portfolios, along with certain other funds managed by the Manager and its affiliates, is a party to a $500 million credit agreement with a group of lenders, which was renewed until November 2010. Each Portfolio may borrow under the credit agreement to fund shareholder redemptions. Prior to its renewal, the credit agreement had the following terms: 0.02% upfront fee on the aggregate commitment amount which was allocated to each Portfolio based on its net assets as of October 31, 2008; a commitment fee of 0.08% per annum based on each Portfolio’s pro rata share of the unused portion of the credit agreement, which is included in miscellaneous in the Statements of Operations, and interest at a rate equal to the higher of the (a) federal funds effective rate and (b) reserve adjusted one-month LIBOR, plus, in each case, the higher of (i) 1.50% and (ii) 50% of the CDX Index (as defined in the credit agreement) on amounts borrowed. Effective November 2009, the credit agreement was renewed with the following terms: 0.02% upfront fee on the aggregate commitment amount which was allocated to each Portfolio based on its net assets as of October 31, 2009, a commitment fee of 0.10% per annum based on each Portfolio’s pro rata share of the unused portion of the credit agreement and interest at a rate equal to the higher of the (a) one-month LIBOR plus 1.25% per annum and (b) the Fed Funds rate plus 1.25% per annum on amounts borrowed. The Portfolios did not borrow under the credit agreement during the six months ended March 31, 2010.
5. Concentration, Market and Credit Risk:
Master Large Cap Growth Portfolio invests a significant portion of its assets in securities in the health care and information technology sectors. Changes in economic conditions affecting the health care and information technology sectors would have a greater impact on Master Large Cap Growth Portfolio and could affect the value, income and/or liquidity of positions in such securities.
In the normal course of business, the Portfolios invest in securities and enter into transactions where risks exist due to fluctuations in the market (market risk) or failure of the issuer of a security to meet all its obligations (credit risk). The value of securities held by the Portfolios may decline in response to certain events, including those directly involving the issuers whose securities are owned by the portfolios; conditions affecting the general economy; overall market changes; local, regional or global political, social or economic instability; and currency and interest rate and price fluctuations. Similar to credit risk, the Portfolios may be exposed to counterparty risk, or the risk that an entity with which the Portfolios have unsettled or open transactions may default. The Portfolios manage counterparty risk by entering into transactions only with counterparties that it believes have the financial resources to honor their obligations and by monitoring the financial stability of those counterparties. Financial assets, which potentially expose the Portfolios to credit and counterparty risks, consist principally of investments and cash due from counterparties. The extent of the Portfolios’ exposure to credit and counterparty risks with respect to these financial assets is generally approximated by their value recorded in the Portfolios’ Statements of Assets and Liabilities, less any collateral held by the Master LLC.
6. Reorganization:
Master Large Cap Core Portfolio
On November 14, 2008, an investor of the Portfolio acquired all of the assets and certain stated liabilities of PNC Growth & Income Fund (the “PNC Fund”), a series of PNC Funds, Inc. The reorganization was pursuant to an Agreement and Plan of Reorganization, which was approved by the shareholders of the PNC Fund on October 31, 2008. As a result of the reorganization, which included $59,817,678 of net unrealized depreciation, the Portfolio received an in-kind contribution of portfolio securities.
7. Subsequent Events:
Management has evaluated the impact of all subsequent events on each Portfolio through the date the financial statements were issued and has determined that there were no subsequent events requiring adjustment or disclosure in the financial statements.
| | |
|
|
|
BLACKROCK LARGE CAP SERIES FUNDS, INC. | MARCH 31, 2010 | 59 |
Ronald W. Forbes, Co-Chairman of the Board and Director
Rodney D. Johnson, Co-Chairman of the Board and Director
David O. Beim, Director
Richard S. Davis, Director
Henry Gabbay, Director
Dr. Matina Horner, Director
Herbert I. London, Director and Member of the Audit Committee
Cynthia A. Montgomery, Director
Joseph P. Platt, Jr., Director
Robert C. Robb, Jr., Director
Toby Rosenblatt, Director
Kenneth L. Urish, Chairman of the Audit Committee and Director
Frederick W. Winter, Director and Member of the Audit Committee
Anne Ackerley, President and Chief Executive Officer
Jeffrey Holland, Vice President
Brendan Kyne, Vice President
Brian Schmidt, Vice President
Neal Andrews, Chief Financial Officer
Jay Fife, Treasurer
Brian Kindelan, Chief Compliance Officer
Howard Surloff, Secretary
Investment Advisor
BlackRock Advisors, LLC
Wilmington, DE 19809
Sub-Advisor
BlackRock Investment Management, LLC
Plainsboro, NJ 08536
Custodian
Brown Brothers Harriman & Co.
Boston, MA 02109
Transfer Agent
PNC Global Investment Servicing (U.S.) Inc.
Wilmington, DE 19809
Accounting Agent
State Street Bank and Trust Company
Princeton, NJ 08540
Distributor
BlackRock Investments, LLC
New York, NY 10022
Independent Registered Public Accounting Firm
Deloitte & ToucheLLP
Princeton, NJ 08540
Legal Counsel
Sidley AustinLLP
New York, NY 10019
Address of the Funds
100 Bellevue Parkway
Wilmington, DE 19809
| | |
|
60 | BLACKROCK LARGE CAP SERIES FUNDS, INC. | MARCH 31, 2010 |
|
|
|
Additional Information |
|
|
General Information |
|
Electronic Delivery
Electronic copies of most financial reports and prospectuses are available on the Funds’ website or shareholders can sign up for e-mail notifications of quarterly statements, annual and semi-annual reports and prospectuses by enrolling in the Funds’ electronic delivery program.
To enroll:
Shareholders Who Hold Accounts with Investment Advisors, Banks or Brokerages:
Please contact your financial advisor. Please note that not all investment advisors, banks or brokerages may offer this service.
Shareholders Who Hold Accounts Directly with BlackRock:
| |
1) | Access the BlackRock website at http://www.blackrock.com/edelivery |
| |
2) | Select “eDelivery” under the “More Information” section |
| |
3) | Log into your account |
Householding
The Funds will mail only one copy of shareholder documents, including prospectuses, annual and semi-annual reports and proxy statements, to shareholders with multiple accounts at the same address. This practice is commonly called “householding” and is intended to reduce expenses and eliminate duplicate mailings of shareholder documents. Mailings of your shareholder documents may be householded indefinitely unless you instruct us otherwise. If you do not want the mailing of these documents to be combined with those for other members of your household, please call (800) 441-7762.
Availability of Quarterly Portfolio Schedule
Each Fund/Portfolio files its complete schedule of portfolio holdings with the Securities and Exchange Commission (the “SEC”) for the first and third quarters of each fiscal year on Form N-Q. Each Fund’s/Portfolio’s Forms N-Q are available on the SEC’s website at http://www.sec.gov and may also be reviewed and copied at the SEC’s Public Reference Room in Washington, D.C. Information on the operation of the Public Reference Room may be obtained by calling (800) SEC-0330. Each Fund’s/Portfolio’s Forms N-Q may also be obtained upon request and without charge by calling (800) 441-7762.
Availability of Proxy Voting Policies and Procedures
A description of the policies and procedures that the Funds/Portfolios use to determine how to vote proxies relating to portfolio securities is available (1) without charge, upon request, by calling (800) 441-7762; (2) at www.blackrock.com; and (3) on the Securities and Exchange Commission’s (the “SEC”) website at http://www.sec.gov.
Availability of Proxy Voting Record
Information about how the Funds/Portfolios voted proxies relating to securities held in the Funds’/Portfolios’ portfolios during the most recent 12-month period ended June 30 is available upon request and without charge (1) at www.blackrock.com or by calling (800) 441-7762 and (2) on the SEC’s website at http://www.sec.gov.
| | |
|
|
|
BLACKROCK LARGE CAP SERIES FUNDS, INC. | MARCH 31, 2010 | 61 |
|
|
|
Additional Information (concluded) |
|
|
Shareholder Privileges |
|
Account Information
Call us at (800) 441-7762 from 8:00 AM to 6:00 PM EST on any business day to get information about your account balances, recent transactions and share prices. You can also reach us on the Web at www.blackrock.com/funds.
Automatic Investment Plans
Investor Class shareholders who want to invest regularly can arrange to have $50 or more automatically deducted from their checking or savings account and invested in any of the BlackRock funds.
Systematic Withdrawal Plans
Investor Class shareholders can establish a systematic withdrawal plan and receive periodic payments of $50 or more from their BlackRock funds, as long as their account balance is at least $10,000.
Retirement Plans
Shareholders may make investments in conjunction with Traditional, Rollover, Roth, Coverdell, Simple IRAs, SEP IRAs and 403(b) Plans.
|
|
BlackRock Privacy Principles |
|
BlackRock is committed to maintaining the privacy of its current and former fund investors and individual clients (collectively, “Clients”) and to safeguarding their non-public personal information. The following information is provided to help you understand what personal information BlackRock collects, how we protect that information and why in certain cases we share such information with select parties.
If you are located in a jurisdiction where specific laws, rules or regulations require BlackRock to provide you with additional or different privacy-related rights beyond what is set forth below, then BlackRock will comply with those specific laws, rules or regulations.
BlackRock obtains or verifies personal non-public information from and about you from different sources, including the following: (i) information we receive from you or, if applicable, your financial intermediary, on applications, forms or other documents; (ii) information about your transactions with us, our affiliates, or others; (iii) information we receive from a consumer reporting agency; and (iv) from visits to our websites.
BlackRock does not sell or disclose to non-affiliated third parties any non-public personal information about its Clients, except as permitted by law or as is necessary to respond to regulatory requests or to service Client accounts. These non-affiliated third parties are required to protect the confidentiality and security of this information and to use it only for its intended purpose.
We may share information with our affiliates to service your account or to provide you with information about other BlackRock products or services that may be of interest to you. In addition, BlackRock restricts access to non-public personal information about its Clients to those BlackRock employees with a legitimate business need for the information. BlackRock maintains physical, electronic and procedural safeguards that are designed to protect the non-public personal information of its Clients, including procedures relating to the proper storage and disposal of such information.
| | |
|
62 | BLACKROCK LARGE CAP SERIES FUNDS, INC. | MARCH 31, 2010 |
|
|
|
A World-Class Mutual Fund Family |
BlackRock offers a diverse lineup of open-end mutual funds crossing all investment styles and managed by experts in equity, fixed income and tax-exempt investing.
BlackRock All-Cap Energy & Resources Portfolio
BlackRock Asset Allocation Portfolio†
BlackRock Aurora Portfolio
BlackRock Balanced Capital Fund†
BlackRock Basic Value Fund
BlackRock Capital Appreciation Portfolio
BlackRock Energy & Resources Portfolio
BlackRock Equity Dividend Fund
BlackRock EuroFund
BlackRock Focus Growth Fund
BlackRock Focus Value Fund
BlackRock Fundamental Growth Fund
BlackRock Global Allocation Fund†
BlackRock Global Dynamic Equity Fund
BlackRock Global Emerging Markets Fund
BlackRock Global Financial Services Fund
BlackRock Global Growth Fund
BlackRock Global Opportunities Portfolio
BlackRock Global SmallCap Fund
BlackRock Health Sciences Opportunities Portfolio
BlackRock Healthcare Fund
BlackRock Index Equity Portfolio*
BlackRock International Fund
BlackRock International Index Fund
BlackRock International Opportunities Portfolio
BlackRock International Value Fund
BlackRock Large Cap Core Fund
BlackRock Large Cap Core Plus Fund
BlackRock Large Cap Growth Fund
BlackRock Large Cap Value Fund
BlackRock Latin America Fund
BlackRock Mid-Cap Growth Equity Portfolio
BlackRock Mid-Cap Value Equity Portfolio
BlackRock Mid Cap Value Opportunities Fund
BlackRock Natural Resources Trust
BlackRock Pacific Fund
BlackRock Science & Technology Opportunities Portfolio
BlackRock Small Cap Core Equity Portfolio
BlackRock Small Cap Growth Equity Portfolio
BlackRock Small Cap Growth Fund II
BlackRock Small Cap Index Fund
BlackRock Small/Mid-Cap Growth Portfolio
BlackRock S&P 500 Index Fund
BlackRock U.S. Opportunities Portfolio
BlackRock Utilities and Telecommunications Fund
BlackRock Value Opportunities Fund
BlackRock Bond Portfolio
BlackRock Emerging Market Debt Portfolio
BlackRock GNMA Portfolio
BlackRock Government Income Portfolio
BlackRock High Income Fund
BlackRock High Yield Bond Portfolio
BlackRock Income Portfolio†
BlackRock Income Builder Portfolio†
BlackRock Inflation Protected Bond Portfolio
BlackRock Intermediate Government Bond Portfolio
BlackRock International Bond Portfolio
BlackRock Long Duration Bond Portfolio
BlackRock Low Duration Bond Portfolio
BlackRock Managed Income Portfolio
BlackRock Multi-Sector Bond Portfolio
BlackRock Short-Term Bond Fund
BlackRock Strategic Income Opportunities Portfolio
BlackRock Total Return Fund
BlackRock Total Return Portfolio II
BlackRock World Income Fund
BlackRock AMT-Free Municipal Bond Portfolio
BlackRock California Municipal Bond Fund
BlackRock High Yield Municipal Fund
BlackRock Intermediate Municipal Fund
BlackRock Kentucky Municipal Bond Portfolio
BlackRock Municipal Insured Fund
BlackRock National Municipal Fund
BlackRock New Jersey Municipal Bond Fund
BlackRock New York Municipal Bond Fund
BlackRock Ohio Municipal Bond Portfolio
BlackRock Pennsylvania Municipal Bond Fund
BlackRock Short-Term Municipal Fund
|
|
Target Risk & Target Date Funds |
|
BlackRock Prepared Portfolios
Conservative Prepared Portfolio
Moderate Prepared Portfolio
Growth Prepared Portfolio
Aggressive Growth Prepared Portfolio
BlackRock Lifecycle Prepared Portfolios
Prepared Portfolio 2010
Prepared Portfolio 2015
Prepared Portfolio 2020
Prepared Portfolio 2025
Prepared Portfolio 2030
Prepared Portfolio 2035
Prepared Portfolio 2040
Prepared Portfolio 2045
Prepared Portfolio 2050
| | |
| * | See the prospectus for information on specific limitations on investments in the fund. |
| | |
| † | Mixed asset fund. |
BlackRock mutual funds are currently distributed by BlackRock Investments, LLC. You should consider the investment objectives, risks, charges and expenses of the funds under consideration carefully before investing. Each fund’s prospectus contains this and other information and is available at www.blackrock.com or by calling (800) 441-7762 or from your financial advisor. The prospectus should be read carefully before investing.
| | |
|
|
|
BLACKROCK LARGE CAP SERIES FUNDS, INC. | MARCH 31, 2010 | 63 |
These reports are not authorized for use as an offer of sale or a solicitation of an offer to buy shares of the Funds unless accompanied or preceded by the Funds’ current prospectus. Past performance results shown in these reports should not be considered a representation of future performance. Investment returns and principal value of shares will fluctuate so that shares, when redeemed, may be worth more or less than their original cost. Statements and other information herein are as dated and are subject to change.
| |

| 
|
| |
|
| #CAPSERIES-3/10 |
| |
BlackRock
Large Cap Series Funds, Inc. | 
|
|
SEMI-ANNUAL REPORT
MARCH 31, 2010 | (UNAUDITED) |
|
BlackRock Large Cap Core Retirement Portfolio |
|
BlackRock Large Cap Growth Retirement Portfolio |
|
BlackRock Large Cap Value Retirement Portfolio |
|
NOT FDIC INSURED
MAY LOSE VALUE
NO BANK GUARANTEE | |
| | |
|
2 | BLACKROCK LARGE CAP SERIES FUNDS, INC. | MARCH 31, 2010 |
The past year has seen a remarkable turnaround from the conditions that plagued the global economy and financial markets in 2008 through early 2009. In our opinion, the “Great Recession” likely ended at some point last summer, thanks primarily to massive fiscal and monetary stimulus. From that point, the global economy has moved into recovery mode and, we believe, is getting ready to start transitioning into an expansion.
Global equity markets bottomed in early 2009 and since that time have soared dramatically higher as investors were lured back into the markets by depressed valuations, desire for higher yields and increasing confidence that all-out financial disaster had been averted. There have been several corrections along the way and volatility levels have remained elevated — reflections of mixed economic data, lingering deflation issues (especially in Europe) and concerns over the future direction of interest rates. On balance, however, strong corporate earnings and a positive macro backdrop have helped keep the equity bull market intact. From a geographic perspective, US equities have generally outpaced their international counterparts in recent months, as the domestic economic recovery has been more pronounced.
Within fixed income markets, improving economic conditions, concerns over the US deficit and a lack of demand at recent Treasury auctions have recently conspired to push Treasury yields higher (and prices correspondingly lower). In this environment, Treasuries have dramatically underperformed other areas of the bond market, particularly the high yield sector, which has been benefiting from increased investor demand. Meanwhile, municipal bonds outperformed taxable sectors over the twelve-month period thanks to continued high demand levels, but have struggled in recent months against a weak fundamental backdrop marked by ongoing state and local budget problems. As in the taxable arena, high yield municipals have been outperforming the rest of the market.
Regarding cash investments, yields on money market securities remain near all-time lows (producing returns only marginally above zero percent), with the Federal Open Market Committee reiterating that economic circumstances are likely to necessitate an accommodative interest rate stance for an “extended period.”
Against this backdrop, the major market averages posted the following returns:
| | | | | | | |
Total Returns as of March 31, 2010 | | 6-month | | 12-month | |
|
|
|
|
|
|
US equities (S&P 500 Index) | | 11.75 | % | | 49.77 | % | |
|
|
|
|
|
|
|
|
Small cap US equities (Russell 2000 Index) | | 13.07 | | | 62.76 | | |
|
|
|
|
|
|
|
|
International equities (MSCI Europe, Australasia, Far East Index) | | 3.06 | | | 54.44 | | |
|
|
|
|
|
|
|
|
3-month Treasury bill (BofA Merrill Lynch 3-Month Treasury Bill Index) | | 0.05 | | | 0.17 | | |
|
|
|
|
|
|
|
|
US Treasury securities (BofA Merrill Lynch 10-Year US Treasury Index) | | (2.62 | ) | | (6.30 | ) | |
|
|
|
|
|
|
|
|
Taxable fixed income (Barclays Capital US Aggregate Bond Index) | | 1.99 | | | 7.69 | | |
|
|
|
|
|
|
|
|
Tax-exempt fixed income (Barclays Capital Municipal Bond Index) | | 0.28 | | | 9.69 | | |
|
|
|
|
|
|
|
|
High yield bonds (Barclays Capital US Corporate High Yield 2% Issuer Capped Index) | | 10.97 | | | 55.64 | | |
|
|
|
|
|
|
|
|
|
Past performance is no guarantee of future results. Index performance shown for illustrative purposes only. You cannot invest directly in an index. |
Global financial markets continue to show signs of improvement, but questions about the strength and sustainability of the recovery abound. Through periods of uncertainty, as ever, BlackRock’s full resources are dedicated to the management of our clients’ assets. For additional market perspective and investment insight, visit www.blackrock.com/shareholdermagazine, where you’ll find the most recent issue of our award-winning Shareholder® magazine, as well as its quarterly companion newsletter, Shareholder Perspectives. As always, we thank you for entrusting BlackRock with your investments, and we look forward to your continued partnership in the months and years ahead.
Sincerely,

Rob Kapito
President, BlackRock Advisors, LLC
| | |
|
|
|
| THIS PAGE NOT PART OF YOUR FUND REPORT | 3 |
| |
|
| |
Fund Summary as of March 31, 2010 | BlackRock Large Cap Core Retirement Portfolio |
| |
|
Portfolio Management Commentary |
|
| |
| How did the Fund perform? |
| |
• | BlackRock Large Cap Core Retirement Portfolio (the “Fund”), through its investment in Master Large Cap Core Portfolio (the “Portfolio”), generated strong returns for the six-month period ended March 31, 2010, but underperformed its benchmark, the Russell 1000 Index. |
| |
| What factors influenced performance? |
| |
• | Health care was the largest contributor to performance during the reporting period, as the passage of the reform bill resolved uncertainty that had previously clouded the sector’s outlook. Although it is too early to assess the long-term impact of the legislation, the near-term impact on operating results should be minimal. Underlying fundamentals continue to improve, valuations are attractive and we believe that broader participation will be a net positive for our holdings. Fund returns were also aided by positive results in the materials sector, where specialty chemicals outperformed on renewed industrial demand, volume increases and pricing power. The consumer staples sector, particularly food products, benefited performance as well. |
| |
• | The largest individual contributors to performance were Walter Industries, Inc., Limited Brands, Inc., Lincare Holdings, Inc., The Estée Lauder Cos., Inc. and Mylan, Inc. |
| |
• | In contrast, the information technology (IT) sector detracted for the period as software and IT services holdings underperformed. Nevertheless, we remain comfortable with the stable and recurring cash flow characteristics of our holdings within these industries, especially as compared to semiconductors and communications equipment, where we believe expectations are high for the sustainability of recent trends. Stock selection within industrials also drove underperformance. While our preference for lower-beta aerospace and defense holdings over higher cyclical areas of the sector hindered results, we believe the more cyclical areas are priced for a more robust 2011 economic forecast than we expect. The utilities sector was another source of underperformance, as falling natural gas and rising thermal coal prices hurt the performance of independent power producers. Still, these stocks traded near record-low valuations on replacement cost and with leverage to a cyclical rebound in the de-regulated power markets. Falling natural gas prices had a negative effect on our energy holdings as well, particularly equipment and service names. |
| |
• | The largest individual detractors from performance were The AES Corp., NRG Energy, Inc., General Cable Corp., Tesoro Corp. and Microsoft Corp. |
| |
| Describe recent portfolio activity. |
| |
• | During the six months ended March 31, 2010, we increased exposure to the IT, consumer discretionary and materials sectors. The largest purchases within the Portfolio included Microsoft Corp., International Business Machines Corp., ConocoPhillips, Freeport-McMoRan Copper & Gold, Inc., Class B and Target Corp. |
| |
• | We reduced exposure to energy and industrials. The largest sales included Philip Morris International, Inc., Johnson & Johnson, Schering-Plough Corp., Anadarko Petroleum Corp. and Amazon.com, Inc. |
| |
| Describe portfolio positioning at period end. |
| |
• | At period end, the Portfolio was overweight relative to the benchmark in the health care, materials, consumer discretionary, energy and utilities sectors; it was underweight in financials, consumer staples, information technology, telecommunications services and industrials. |
| |
• | As always, we rely on a disciplined investment process and a belief in the importance of portfolio construction and risk management to strive to deliver consistent outperformance over the long term. We continue to focus on quality companies with strong balance sheets and positive free cash flow in light of our view that the economy is recovering, but at a slower than normal pace. |
| |
| The views expressed reflect the opinions of BlackRock as of the date of this report and are subject to change based on changes in market, economic or other conditions. These views are not intended to be a forecast of future events and are no guarantee of future results. |
| | |
|
4 | BLACKROCK LARGE CAP SERIES FUNDS, INC. | MARCH 31, 2010 |
|
|
|
BlackRock Large Cap Core Retirement Portfolio |
|
|
Total Return Based on a $10,000 Investment |
|
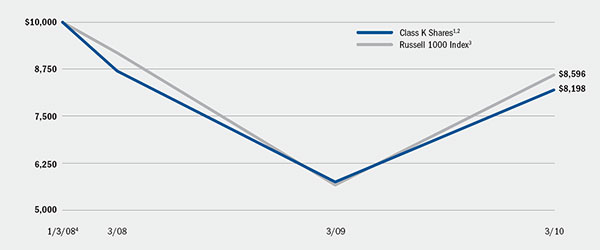
| | |
| 1 | Assuming transaction costs and other operating expenses, including administration fees, if any. |
| | |
| 2 | The Fund invests all of its assets in Master Large Cap Core Portfolio of Master Large Cap Series LLC. The Portfolio invests primarily in a diversified portfolio of equity securities of large cap companies located in the United States that the investment advisor believes blends growth and value. |
| | |
| 3 | This unmanaged broad-based index measures the performance of the 1,000 largest companies in the Russell 3000 Index, which represents approximately 90% of the total market capitalization of the Russell 3000 Index. |
| | |
| 4 | Commencement of operations. |
|
|
Performance Summary for the Period Ended March 31, 2010 |
|
| | | | | | | | | | |
| | | | | Average Annual Total Returns5 |
| | 6-Month
Total Returns | |
|
|
| | | 1 Year | | Since Inception6 | |
|
|
|
|
|
|
|
|
|
|
|
Class K | | 11.70 | % | | 42.55 | % | | (8.49 | )% | |
Russell 1000 Index | | 12.11 | | | 51.60 | | | (6.53 | ) | |
|
|
|
|
|
|
|
|
|
|
|
| | |
| 5 | See “About Fund Performance” on page 10 for a detailed description of the share class, including any related sales charges and fees. |
| | |
| 6 | The Fund commenced operations on January 3, 2008. |
| | |
| | Past performance is not indicative of future results. |
| | | | | | | | | | | | | | | | | | | | | | | | | | | | | | | |
| | Actual | | Hypothetical8 | |
| |
| |
|
|
| | Beginning
Account Value
October 1, 2009 | | Ending
Account Value
March 31, 2010 | | Expenses Paid
During the Period7 | | Beginning
Account Value
October 1, 2009 | | Ending
Account Value
March 31, 2010 | | Expenses Paid
During the Period7 | |
|
|
|
|
|
|
|
|
|
|
|
|
|
|
Class K | | | $ | 1,000 | | | | $ | 1,117.00 | | | | $ | 3.54 | | | | $ | 1,000 | | | | $ | 1,021.56 | | | | $ | 3.38 | | |
|
|
|
|
|
|
|
|
|
|
|
|
|
|
|
|
|
|
|
|
|
|
|
|
|
|
|
|
|
|
|
|
| | |
| 7 | Expenses are equal to the Fund’s annualized expense ratio of 0.67% multiplied by the average account value over the period, multiplied by 182/365 (to reflect the one-half year period shown). Because the Fund is a feeder fund, the expense table reflects the expenses of both the feeder fund and the master portfolio in which it invests. |
| | |
| 8 | Hypothetical 5% annual return before expenses is calculated by pro rating the number of days in the most recent half-year period divided by 365.
See “Disclosure of Expenses” on page 10 for further information on how expenses were calculated. |
| | |
|
|
|
BLACKROCK LARGE CAP SERIES FUNDS, INC. | MARCH 31, 2010 | 5 |
| |
|
|
| |
Fund Summary as of March 31, 2010 | BlackRock Large Cap Growth Retirement Portfolio |
|
|
Portfolio Management Commentary |
|
| |
| How did the Fund perform? |
| |
• | BlackRock Large Cap Growth Retirement Portfolio (the “Fund”), through its investment in Master Large Cap Growth Portfolio (the “Portfolio”), generated strong returns for the six-month period ended March 31, 2010, but underperformed its benchmark, the Russell 1000 Growth Index. |
| |
| What factors influenced performance? |
| |
• | Health care was a significant contributor to performance during the reporting period, as the passage of the reform bill resolved uncertainty that had previously clouded the sector’s outlook. Although it is early to assess the long-term impact of the legislation, near-term impact on operating results should be minimal. Underlying fundamentals continue to improve, valuations are attractive and we believe that broader participation will be a net positive for our holdings. Fund returns were also aided by positive results in the materials sector, where specialty chemicals outperformed on renewed industrial demand, volume increases and pricing power. Lastly, performance benefited from household and personal products holdings (notably The Estée Lauder Cos., Inc.) in consumer staples. |
| |
• | The largest individual contributors to performance were Walter Industries, Inc., IMS Health Inc., Lincare Holdings, Inc. and Mylan, Inc. Our underweighting of QUALCOMM, Inc. also proved advantageous. |
| |
• | In contrast, the information technology (IT) sector detracted for the period as software and IT services holdings underperformed. Nevertheless, we remain comfortable with the stable and recurring cash flow characteristics of our holdings within these industries, especially as compared to semiconductors and communications equipment, where we believe expectations are high for the sustainability of recent trends. Stock selection within industrials also drove underperformance. While our preference for lower-beta aerospace and defense holdings over higher cyclical areas of the sector hindered results, we believe the more cyclical areas are priced for a more robust 2011 economic forecast than we expect. Elsewhere, falling natural gas prices hurt our energy holdings, especially equipment and service names. Within utilities, falling natural gas and rising thermal coal prices had a negative effect on independent power producers. Still, these stocks traded near record-low valuations on replacement cost, with leverage to a cyclical rebound in the de-regulated power markets. |
| |
• | The largest individual detractors from performance were The AES Corp., Microsoft Corp., Tesoro Corp. and Global Payments, Inc. Underweighting Amazon.com, Inc. also hurt performance. |
| |
| Describe recent portfolio activity. |
| |
• | During the six months ended March 31, 2010, we increased exposure to the consumer staples, materials and information technology sectors. The largest purchases within the Portfolio included Colgate-Palmolive Co., Automatic Data Processing, Inc., Target Corp., Freeport-McMoRan Copper & Gold, Inc., Class B and General Mills, Inc. |
| |
• | We reduced exposure to energy and health care. The largest sales included Schering-Plough Corp., Oracle Corp., Texas Instruments, Inc. and Lockheed Martin Corp. |
| |
| Describe portfolio positioning at period end. |
| |
• | At period end, the Portfolio was overweight relative to the benchmark in the health care, materials, energy, utilities and industrials sectors; it was underweight information technology, financials, consumer staples, consumer discretionary and telecommunications services. |
| |
• | As always, we rely on a disciplined investment process and a belief in the importance of portfolio construction and risk management to strive to deliver consistent outperformance over the long term. We continue to focus on quality companies with strong balance sheets and positive free cash flow in light of our view that the economy is recovering, but at a slower than normal pace. |
| |
| The views expressed reflect the opinions of BlackRock as of the date of this report and are subject to change based on changes in market, economic or other conditions. These views are not intended to be a forecast of future events and are no guarantee of future results. |
| | |
|
6 | BLACKROCK LARGE CAP SERIES FUNDS, INC. | MARCH 31, 2010 |
|
|
|
BlackRock Large Cap Growth Retirement Portfolio |
|
|
Total Return Based on a $10,000 Investment |
|
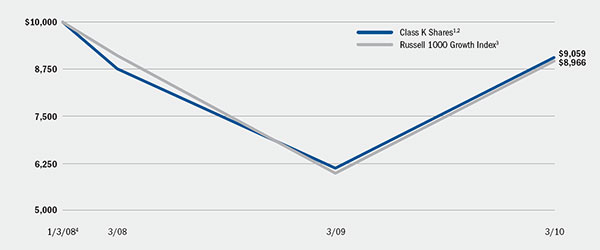
| | |
| 1 | Assuming transaction costs and other operating expenses, including administration fees, if any. |
|
| 2 | The Fund invests all of its assets in Master Large Cap Growth Portfolio of Master Large Cap Series LLC. The Portfolio invests primarily in a diversified portfolio of equity securities of large cap companies located in the United States that the investment advisor believes have good prospects for earnings growth. |
|
| 3 | This unmanaged broad-based index is a subset of the Russell 1000 Index consisting of those Russell 1000 securities with a greater-than-average growth orientation. |
|
| 4 | Commencement of operations. |
|
|
Performance Summary for the Period Ended March 31, 2010 |
|
| | | | | | | | | | |
| | | | | Average Annual Total Returns5 |
| | 6-Month
Total Returns | |
|
|
| | | 1 Year | | Since Inception6 | |
|
|
|
|
|
|
|
|
|
|
|
Class K | | 12.87 | % | | 48.00 | % | | (4.31 | )% | |
Russell 1000 Growth Index | | 12.96 | | | 49.75 | | | (4.75 | ) | |
|
|
|
|
|
|
|
|
|
|
|
| | |
| 5 | See “About Fund Performance” on page 10 for a detailed description of the share class, including any related sales charges and fees. |
|
| 6 | The Fund commenced operations on January 3, 2008.
Past performance is not indicative of future results. |
| | | | | | | | | | | | | | | | | | | | | | | | | | | | | | | |
| | Actual | | Hypothetical8 | |
| |
| |
|
|
| | Beginning
Account Value
October 1, 2009 | | Ending
Account Value
March 31, 2010 | | Expenses Paid
During the Period7 | | Beginning
Account Value
October 1, 2009 | | Ending
Account Value
March 31, 2010 | | Expenses Paid
During the Period7 | |
|
|
|
|
|
|
|
|
|
|
|
|
|
|
Class K | | | $ | 1,000 | | | | $ | 1,128.70 | | | | $ | 3.56 | | | | $ | 1,000 | | | | $ | 1,021.56 | | | | $ | 3.38 | | |
|
|
|
|
|
|
|
|
|
|
|
|
|
|
|
|
|
|
|
|
|
|
|
|
|
|
|
|
|
|
|
|
| | |
| 7 | Expenses are equal to the Fund’s annualized expense ratio of 0.67% multiplied by the average account value over the period, multiplied by 182/365 (to reflect the one-half year period shown). Because the Fund is a feeder fund, the expense table reflects the expenses of both the feeder fund and the master portfolio in which it invests. |
|
| 8 | Hypothetical 5% annual return before expenses is calculated by pro rating the number of days in the most recent half-year period divided by 365.
See “Disclosure of Expenses” on page 10 for further information on how expenses were calculated. |
| | |
|
|
|
BLACKROCK LARGE CAP SERIES FUNDS, INC. | MARCH 31, 2010 | 7 |
| |
|
|
Fund Summary as of March 31, 2010 | BlackRock Large Cap Value Retirement Portfolio |
|
|
Portfolio Management Commentary |
|
| |
| How did the Fund perform? |
| |
• | BlackRock Large Cap Value Retirement Portfolio (the “Fund”), through its investment in Master Large Cap Value Portfolio (the “Portfolio”), generated solid returns for the six-month period ended March 31, 2010, but underperformed its benchmark, the Russell 1000 Value Index. |
| |
| What factors influenced performance? |
| |
• | Health care was the largest contributor to performance during the reporting period, as the passage of the reform bill resolved uncertainty that had previously clouded the sector’s outlook. Although it is early to assess the long-term impact of the legislation, near-term impact on operating results should be minimal. Underlying fundamentals continue to improve, valuations are attractive and we believe that broader participation will be a net positive for our holdings. Performance also benefited from specific holdings in the food, beverage & tobacco sub-sector within consumer staples. |
| |
• | The largest individual contributors to performance were Limited Brands, Inc., IMS Health, Inc., Lincare Holdings, Inc. and Big Lots, Inc. Our avoidance of Citigroup, Inc. was positive as well. |
| |
• | Conversely, the utilities sector detracted for the period as falling natural gas and rising thermal coal prices hurt the performance of independent power producers, in which the Portfolio invested. Falling natural gas prices had a negative effect on our energy holdings as well, especially equipment and service names. Within industrials, stock selection drove underperformance. While our preference for lower-beta aerospace and defense holdings over higher cyclical areas of the sector hindered results, we believe the more cyclical areas are priced for a more robust 2011 economic forecast than we expect. |
| |
• | Elsewhere, underweights in media holdings and automobiles hindered performance within consumer discretionary. Specifically, our bias for higher-quality companies hurt during a period when the market rewarded lower-quality, more cyclically leveraged companies. Lastly, stock selection amongst insurers detracted in the financials sector; still, we maintain our preference for insurers over banks and select diversified financials, as long-term issues remain for these industries. |
| |
• | The largest individual detractors from performance were Mirant Corp., NRG Energy, Inc., The AES Corp. and Helix Energy Solutions, Inc. Our underweighting of Ford Motor Co. hurt performance as well. |
| |
| Describe recent portfolio activity. |
| |
• | During the six months ended March 31, 2010, we increased exposure to the materials and industrials sectors. The largest purchases within the Portfolio included XTO Energy, Inc., Freeport-McMoRan Cooper & Gold, Inc., Class B, Capital One Financial Corp., Macy’s, Inc., L-3 Communications Holdings, Inc. and ConAgra Foods, Inc. |
| |
• | We reduced exposure to energy, health care and telecommunication services. The largest sales included Anadarko Petroleum Corp., Chubb Corp., Nabors Industries Ltd., CMS Energy Corp. and Murphy Oil Corp. |
| |
| Describe portfolio positioning at period end. |
| |
• | At period end, the Portfolio was overweight relative to the benchmark in the materials, health care, industrials, information technology and utilities sectors; it was underweight in financials, consumer discretionary, telecommunication services and energy. |
| |
• | As always, we rely on a disciplined investment process and a belief in the importance of portfolio construction and risk management to strive to deliver consistent outperformance over the long term. We continue to focus on quality companies with strong balance sheets and positive free cash flow in light of our view that the economy is recovering, but at a slower than normal pace. |
| |
| The views expressed reflect the opinions of BlackRock as of the date of this report and are subject to change based on changes in market, economic or other conditions. These views are not intended to be a forecast of future events and are no guarantee of future results. |
| | |
|
8 | BLACKROCK LARGE CAP SERIES FUNDS, INC. | MARCH 31, 2010 |
| |
|
| |
| BlackRock Large Cap Value Retirement Portfolio |
| |
|
Total Return Based on a $10,000 Investment | |
|
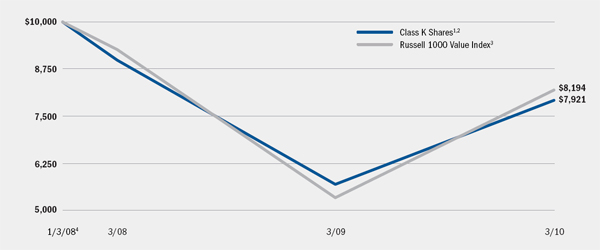
| | |
| 1 | Assuming transaction costs and other operating expenses, including administration fees, if any. |
| | |
| 2 | The Fund invests all of its assets in Master Large Cap Value Portfolio of the Master Large Cap Series LLC. The Portfolio invests primarily in a diversified portfolio of equity securities of large cap companies located in the United States that the investment advisor believes are undervalued. |
| | |
| 3 | This unmanaged broad-based index is a subset of the Russell 1000 Index consisting of those Russell 1000 securities with lower price/book ratios and lower forecasted growth values. |
| | |
| 4 | Commencement of operations. |
| | | | | | | |
|
Performance Summary for the Period Ended March 31, 2010 |
|
| | | | | | | |
| | | | Average Annual Total Returns5 |
| | 6-Month
Total Returns | |
|
| | | 1 Year | | Since Inception6 |
|
|
|
|
|
|
|
|
Class K | | 9.33 | % | | 39.21 | % | | (9.88 | )% |
Russell 1000 Value Index | | 11.28 | | | 53.56 | | | (8.50 | ) |
|
|
|
|
|
|
|
|
|
|
| | |
| 5 | See “About Fund Performance” on page 10 for a detailed description of the share class, including any related sales charges and fees. |
| | |
| 6 | The Fund commenced operations on January 3, 2008.
Past performance is not indicative of future results. |
| | | | | | | | | | | | | | | | | | | |
|
|
|
|
|
|
|
|
|
|
|
|
|
|
|
|
|
|
|
|
Expense Example |
|
| | | | | | | | | | | | | |
| | Actual | | Hypothetical8 |
| |
| |
|
| | Beginning
Account Value
October 1, 2009 | | Ending
Account Value
March 31, 2010 | | Expenses Paid
During the Period7 | | Beginning
Account Value
October 1, 2009 | | Ending
Account Value
March 31, 2010 | | Expenses Paid
During the Period7 | |
|
|
|
|
|
|
|
|
|
|
|
|
|
|
Class K | | $1,000 | | $1,093.30 | | $3.50 | | $1,000 | | $1,021.56 | | $3.38 | |
|
|
|
|
|
|
|
|
|
|
|
|
|
|
|
|
|
|
|
|
| | |
| 7 | Expenses are equal to the Fund’s annualized expense ratio of 0.67% multiplied by the average account value over the period, multiplied by 182/365 (to reflect the one-half year period shown). Because the Fund is a feeder fund, the expense table reflects the expenses of both the feeder fund and the master portfolio in which it invests. |
| | |
| 8 | Hypothetical 5% annual return before expenses is calculated by pro rating the number of days in the most recent half-year period divided by 365.
See “Disclosure of Expenses” on page 10 for further information on how expenses were calculated. |
| | |
|
|
|
BLACKROCK LARGE CAP SERIES FUNDS, INC. | MARCH 31, 2010 | 9 |
| |
|
| |
About Fund Performance | BlackRock Large Cap Series Funds, Inc. |
| |
• | Class K Shares are not subject to any sales charge. Class K Shares bear no ongoing distribution or service fees and are available only to eligible investors. |
| |
| Performance information reflects past performance and does not guarantee future results. Current performance may be lower or higher than the performance data quoted. Refer to www.blackrock.com/funds to obtain performance data current to the most recent month-end. Performance results do not reflect the deduction of taxes that a shareholder would pay on fund distributions or the redemption of fund shares. Performance data does not reflect this potential fee. Figures shown in each of the performance tables on the previous pages assume reinvestment of all dividends and capital gain distributions, if any, at net asset value on the ex-dividend date. Investment return and principal value of shares will fluctuate so that shares, when redeemed, may be worth more or less than their original cost. The Funds’ administrator waived or reimbursed a portion of each of the Fund’s expenses. Without such waiver and reimbursement, the Funds’ performance would have been lower. BlackRock Advisors, LLC is under no obligation to waive or continue waiving its fees. |
|
Shareholders of these Funds may incur the following charges: (a) expenses related to transactions, including sales charges, redemption fees and exchange fees; and (b) operating expenses including administration fees, service and distribution fees including 12b-1 fees and other Fund expenses. The expense examples on the previous pages (which are based on a hypothetical investment of $1,000 invested on October 1, 2009 and held through March 31, 2010) are intended to assist shareholders both in calculating expenses based on an investment in each Fund and in comparing these expenses with similar costs of investing in other mutual funds. |
|
The tables provide information about actual account values and actual expenses. In order to estimate the expenses a shareholder paid during the period covered by this report, shareholders can divide their account value by $1,000 and then multiply the result by the number corresponding to their Fund and share class under the heading entitled “Expenses Paid During the Period.” |
|
The tables also provide information about hypothetical account values and hypothetical expenses based on the Funds’ actual expense ratio and an assumed rate of return of 5% per year before expenses. In order to assist shareholders in comparing the ongoing expenses of investing in these Funds and other funds, compare the 5% hypothetical example with the 5% hypothetical examples that appear in other funds’ shareholder reports. |
|
The expenses shown in the tables are intended to highlight shareholders’ ongoing costs only and do not reflect any transactional expenses, such as sales charges, redemption fees or exchange fees. Therefore, the hypothetical examples are useful in comparing ongoing expenses only, and will not help shareholders determine the relative total expenses of owning different funds. If these transactional expenses were included, shareholder expenses would have been higher. |
| | |
|
|
|
10 | BLACKROCK LARGE CAP SERIES FUNDS, INC. | MARCH 31, 2010 |
| |
|
| |
Statements of Assets and Liabilities | BlackRock Large Cap Series Funds, Inc. |
| | | | | | | | | | |
March 31, 2010 (Unaudited) | | BlackRock
Large Cap Core
Retirement
Portfolio | | BlackRock
Large Cap Growth
Retirement
Portfolio | | BlackRock
Large Cap Value
Retirement
Portfolio | |
|
|
|
|
|
|
|
|
Assets | | | | | | | | | | |
|
|
|
|
|
|
|
|
|
|
|
Investments at value — Master Large Cap Core Portfolio, Master Large Cap Growth Portfolio and Master Large Cap Value Portfolio (the “Portfolios”), respectively1 | | $ | 121,047,263 | | $ | 92,409,517 | | $ | 173,066,413 | |
Capital shares sold receivable | | | 478,619 | | | 504,557 | | | 554,321 | |
Receivable from administrator | | | 504 | | | 9,907 | | | 4,240 | |
Prepaid expenses | | | 67 | | | — | | | 227 | |
| |
|
|
|
|
|
|
|
|
|
Total assets | | | 121,526,453 | | | 92,923,981 | | | 173,625,201 | |
| |
|
|
|
|
|
|
|
|
|
| | | | | | | | | | |
|
|
|
|
|
|
|
|
|
|
|
Liabilities | | | | | | | | | | |
|
|
|
|
|
|
|
|
|
|
|
Capital shares redeemed payable | | | 71,660 | | | 126,863 | | | 179,967 | |
Other affiliates payable | | | 12 | | | — | | | 347 | |
Officer’s and Directors’ fees payable | | | 13 | | | 10 | | | 19 | |
Withdrawals payable to the Portfolios | | | 406,959 | | | 377,694 | | | 374,354 | |
Other accrued expenses payable | | | 52,998 | | | 69,054 | | | 62,195 | |
| |
|
|
|
|
|
|
|
|
|
Total liabilities | | | 531,642 | | | 573,621 | | | 616,882 | |
| |
|
|
|
|
|
|
|
|
|
Net Assets | | $ | 120,994,811 | | $ | 92,350,360 | | $ | 173,008,319 | |
| |
|
|
|
|
|
|
|
|
|
| | | | | | | | | | |
|
|
|
|
|
|
|
|
|
|
|
Net Assets Consist of | | | | | | | | | | |
|
|
|
|
|
|
|
|
|
|
|
Paid-in capital2 | | $ | 155,020,692 | | $ | 109,816,390 | | $ | 187,751,420 | |
Undistributed net investment income | | | 188,883 | | | 87,936 | | | 516,148 | |
Accumulated net realized loss allocated from the Portfolios | | | (53,926,655 | ) | | (30,694,929 | ) | | (30,549,577 | ) |
Net unrealized appreciation/depreciation allocated from the Portfolios | | | 19,711,891 | | | 13,140,963 | | | 15,290,328 | |
| |
|
|
|
|
|
|
|
|
|
Net Assets | | $ | 120,994,811 | | $ | 92,350,360 | | $ | 173,008,319 | |
| |
|
|
|
|
|
|
|
|
|
Class K — Net asset value per common share, 200 million shares authorized, $0.10 par value | | $ | 10.60 | | $ | 10.02 | | $ | 14.34 | |
| |
|
|
|
|
|
|
|
|
|
1 Cost | | $ | 101,335,372 | | $ | 79,268,554 | | $ | 157,776,085 | |
| |
|
|
|
|
|
|
|
|
|
2 Shares outstanding | | | 11,412,937 | | | 9,220,628 | | | 12,065,017 | |
| |
|
|
|
|
|
|
|
|
|
| | |
See Notes to Financial Statements. | | |
|
|
|
BLACKROCK LARGE CAP SERIES FUNDS, INC. | MARCH 31, 2010 | 11 |
| |
|
| |
Statements of Operations | BlackRock Large Cap Series Funds, Inc. |
| | | | | | | | | | |
Six Months Ended March 31, 2010 (Unaudited) | | BlackRock
Large Cap Core
Retirement
Portfolio | | BlackRock
Large Cap Growth
Retirement
Portfolio | | BlackRock
Large Cap Value
Retirement
Portfolio | |
|
|
|
|
|
|
|
|
Investment Income | | | | | | | | | | |
|
|
|
|
|
|
|
|
|
|
|
Net investment income allocated from the Portfolios: | | | | | | | | | | |
Dividends | | $ | 968,784 | | $ | 576,672 | | $ | 1,638,002 | |
Securities lending — affiliated | | | 5,571 | | | 2,357 | | | 2,850 | |
Income — affiliated | | | 20 | | | 17 | | | 37 | |
Interest | | | 6,094 | | | 4,871 | | | 4 | |
Expenses | | | (273,918 | ) | | (239,294 | ) | | (429,645 | ) |
| |
|
|
|
|
|
|
|
|
|
Total income | | | 706,551 | | | 344,623 | | | 1,211,248 | |
| |
|
|
|
|
|
|
|
|
|
| | | | | | | | | | |
|
|
|
|
|
|
|
|
|
|
|
Expenses | | | | | | | | | | |
|
|
|
|
|
|
|
|
|
|
|
Transfer agent | | | 74,920 | | | 77,466 | | | 96,992 | |
Printing | | | 12,288 | | | 9,344 | | | 13,942 | |
Professional | | | 9,241 | | | 8,744 | | | 10,882 | |
Registration | | | 8,232 | | | 7,827 | | | 8,154 | |
Officer and Directors | | | 27 | | | 21 | | | 37 | |
Miscellaneous | | | 2,823 | | | 2,868 | | | 2,822 | |
| |
|
|
|
|
|
|
|
|
|
Total expenses | | | 107,531 | | | 106,270 | | | 132,829 | |
Less fees reimbursed by administrator | | | (7,056 | ) | | (60,129 | ) | | (24,878 | ) |
| |
|
|
|
|
|
|
|
|
|
Total expenses after reimbursement | | | 100,475 | | | 46,141 | | | 107,951 | |
| |
|
|
|
|
|
|
|
|
|
Net investment income | | | 606,076 | | | 298,482 | | | 1,103,297 | |
| |
|
|
|
|
|
|
|
|
|
| | | | | | | | | | |
|
|
|
|
|
|
|
|
|
|
|
Realized and Unrealized Gain Allocated From | | | | | | | | | | |
|
|
|
|
|
|
|
|
|
|
|
Net realized gain from investments and payment by affiliate | | | 8,479,087 | | | 9,196,992 | | | 11,533,511 | |
Net change in unrealized appreciation/depreciation on investments | | | 3,664,631 | | | 998,697 | | | 1,743,875 | |
| |
|
|
|
|
|
|
|
|
|
Total realized and unrealized gain | | | 12,143,718 | | | 10,195,689 | | | 13,277,386 | |
| |
|
|
|
|
|
|
|
|
|
Net Increase in Net Assets Resulting from Operations | | $ | 12,749,794 | | $ | 10,494,171 | | $ | 14,380,683 | |
| |
|
|
|
|
|
|
|
|
|
| | |
See Notes to Financial Statements. |
|
|
|
12 | BLACKROCK LARGE CAP SERIES FUNDS, INC. | MARCH 31, 2010 |
| |
|
| |
Statements of Changes in Net Assets | BlackRock Large Cap Series Funds, Inc. |
| | | | | | | | | | | | | | | | | | | | | | | | | | | | |
| | BlackRock
Large Cap Core
Retirement
Portfolio | | BlackRock
Large Cap Growth
Retirement
Portfolio | | BlackRock
Large Cap Value
Retirement
Portfolio | |
| |
| |
| |
|
|
| | Six Months
Ended
March 31,
2010
(Unaudited) | | Period
November 1,
2008 to
September 30,
2009 | | Period
January 3,
20081 to
October 31,
2008 | | Six Months
Ended
March 31,
2010
(Unaudited) | | Period
November 1,
2008 to
September 30,
2009 | | Period
January 3,
20081 to
October 31,
2008 | | Six Months
Ended
March 31,
2010
(Unaudited) | | Period
November 1,
2008 to
September 30,
2009 | | Period
January 3,
20081 to
October 31,
2008 | |
|
|
|
|
|
|
|
|
|
|
|
|
|
|
|
|
|
|
|
|
|
|
|
|
|
|
|
|
|
Operations | | | | | | | | | | | | | | | | | | | | | | | | | |
|
|
|
|
|
|
|
|
|
|
|
|
|
|
|
|
|
|
|
|
|
|
|
|
|
|
|
|
|
Net investment income | | $ | 606,076 | | $ | 1,269,155 | | $ | 890,928 | | $ | 298,482 | | $ | 498,698 | | $ | 278,830 | | $ | 1,103,297 | | $ | 1,899,074 | | $ | 895,410 | |
Net realized gain (loss) | | | 8,479,087 | | | (25,295,594 | ) | | (37,110,148 | ) | | 9,196,992 | | | (17,833,904 | ) | | (22,058,017 | ) | | 11,533,511 | | | (17,904,084 | ) | | (24,176,745 | ) |
Net change in unrealized appreciation/depreciation | | | 3,664,631 | | | 36,497,446 | | | (20,450,186 | ) | | 998,697 | | | 31,525,033 | | | (19,382,767 | ) | | 1,743,875 | | | 26,258,149 | | | (12,711,696 | ) |
| |
|
|
|
|
|
|
|
| |
|
|
|
|
|
|
|
| |
|
|
|
|
|
|
|
|
|
Net increase (decrease) in net assets resulting from operations | | | 12,749,794 | | | 12,471,007 | | | (56,669,406 | ) | | 10,494,171 | | | 14,189,827 | | | (41,161,954 | ) | | 14,380,683 | | | 10,253,139 | | | (35,993,031 | ) |
| |
|
|
|
|
|
|
|
| |
|
|
|
|
|
|
|
| |
|
|
|
|
|
|
|
|
|
| | | | | | | | | | | | | | | | | | | | | | | | | | | | |
|
|
|
|
|
|
|
|
|
|
|
|
|
|
|
|
|
|
|
|
|
|
|
|
|
|
|
|
|
Dividends to Shareholders From | | | | | | | | | | | | | | | | | | | | | | |
|
|
|
|
|
|
|
|
|
|
|
|
|
|
|
|
|
|
|
|
|
|
|
|
|
|
|
|
|
Net investment income | | | (1,400,002 | ) | | (1,200,011 | ) | | — | | | (500,007 | ) | | (500,011 | ) | | — | | | (2,000,004 | ) | | (1,400,005 | ) | | — | |
| |
|
|
|
|
|
|
|
| |
|
|
|
|
|
|
|
| |
|
|
|
|
|
|
|
|
|
| | | | | | | | | | | | | | | | | | | | | | | | | | | | |
|
|
|
|
|
|
|
|
|
|
|
|
|
|
|
|
|
|
|
|
|
|
|
|
|
|
|
|
|
Capital Share Transactions | | | | | | | | | | | | | | | | | | | | | | | | |
|
|
|
|
|
|
|
|
|
|
|
|
|
|
|
|
|
|
|
|
|
|
|
|
|
|
|
|
|
Net increase (decrease) in net assets derived from capital share transactions | | | 457,065 | | | (7,307,145 | ) | | 161,893,509 | | | (741,936 | ) | | (11,474,101 | ) | | 122,044,371 | | | 28,067,561 | | | (4,452,214 | ) | | 164,152,190 | |
| |
|
|
|
|
|
|
|
| |
|
|
|
|
|
|
|
| |
|
|
|
|
|
|
|
|
|
| | | | | | | | | | | | | | | | | | | | | | | | | | | | |
|
|
|
|
|
|
|
|
|
|
|
|
|
|
|
|
|
|
|
|
|
|
|
|
|
|
|
|
|
Net Assets | | | | | | | | | | | | | | | | | | | | | | | | | |
|
|
|
|
|
|
|
|
|
|
|
|
|
|
|
|
|
|
|
|
|
|
|
|
|
|
|
|
|
Total increase in net assets | | | 11,806,857 | | | 3,963,851 | | | 105,224,103 | | | 9,252,228 | | | 2,215,715 | | | 80,882,417 | | | 40,448,240 | | | 4,400,920 | | | 128,159,159 | |
Beginning of period | | | 109,187,954 | | | 105,224,103 | | | — | | | 83,098,132 | | | 80,882,417 | | | — | | | 132,560,079 | | | 128,159,159 | | | — | |
| |
|
|
|
|
|
|
|
| |
|
|
|
|
|
|
|
| |
|
|
|
|
|
|
|
|
|
End of period | | $ | 120,994,811 | | $ | 109,187,954 | | $ | 105,224,103 | | $ | 92,350,360 | | $ | 83,098,132 | | $ | 80,882,417 | | $ | 173,008,319 | | $ | 132,560,079 | | $ | 128,159,159 | |
| |
|
|
|
|
|
|
|
| |
|
|
|
|
|
|
|
| |
|
|
|
|
|
|
|
|
|
Undistributed net investment income | | $ | 188,883 | | $ | 982,809 | | $ | 908,495 | | $ | 87,936 | | $ | 289,461 | | $ | 289,143 | | $ | 516,148 | | $ | 1,412,855 | | $ | 910,850 | |
| |
|
|
|
|
|
|
|
| |
|
|
|
|
|
|
|
| |
|
|
|
|
|
|
|
|
|
| | |
| 1 | Commencement of operations. |
| | |
See Notes to Financial Statements. | | |
|
|
|
BLACKROCK LARGE CAP SERIES FUNDS, INC. | MARCH 31, 2010 | 13 |
| |
|
|
Financial Highlights | BlackRock Large Cap Series Funds, Inc. |
| | | | | | | | | | | | | | | | | | | | | | | | | | | | |
| | Class K | |
| |
|
|
| | BlackRock
Large Cap Core
Retirement
Portfolio | | BlackRock
Large Cap Growth
Retirement
Portfolio | | BlackRock
Large Cap Value
Retirement
Portfolio | |
| |
| |
| |
|
|
| | Six Months
Ended
March 31,
2010
(Unaudited) | | Period
November 1,
2008 to
September 30,
2009 | | Period
January 3,
20081 to
October 31,
2008 | | Six Months
Ended
March 31,
2010
(Unaudited) | | Period
November 1,
2008 to
September 30,
2009 | | Period
January 3,
20081 to
October 31,
2008 | | Six Months
Ended
March 31,
2010
(Unaudited) | | Period
November 1,
2008 to
September 30,
2009 | | Period
January 3,
20081 to
October 31,
2008 | |
|
|
|
|
|
|
|
|
|
|
|
|
|
|
|
|
|
|
|
|
|
|
|
|
|
|
|
|
|
Per Share Operating Performance | | | | | | | | | | | | | | | | | | | | | | | | |
|
|
|
|
|
|
|
|
|
|
|
|
|
|
|
|
|
|
|
|
|
|
|
|
|
|
|
|
|
Net asset value, beginning of period | | $ | 9.61 | | $ | 8.64 | | $ | 13.25 | | $ | 8.93 | | $ | 7.45 | | $ | 11.20 | | $ | 13.28 | | $ | 12.33 | | $ | 18.54 | |
| |
|
|
|
|
|
|
|
| |
|
|
|
|
|
|
|
| |
|
|
|
|
|
|
|
|
|
Net investment income2 | | | 0.05 | | | 0.11 | | | 0.07 | | | 0.03 | | | 0.05 | | | 0.02 | | | 0.10 | | | 0.18 | | | 0.13 | |
Net realized and unrealized gain (loss) | | | 1.07 | | | 0.96 | | | (4.68 | ) | | 1.12 | | | 1.48 | | | (3.77 | ) | | 1.13 | | | 0.91 | | | (6.34 | ) |
| |
|
|
|
|
|
|
|
| |
|
|
|
|
|
|
|
| |
|
|
|
|
|
|
|
|
|
Net increase (decrease) from investment operations | | | 1.12 | | | 1.07 | | | (4.61 | ) | | 1.15 | | | 1.53 | | | (3.75 | ) | | 1.23 | | | 1.09 | | | (6.21 | ) |
| |
|
|
|
|
|
|
|
| |
|
|
|
|
|
|
|
| |
|
|
|
|
|
|
|
|
|
Dividends from net investment income | | | (0.13 | ) | | (0.10 | ) | | — | | | (0.06 | ) | | (0.05 | ) | | — | | | (0.17 | ) | | (0.14 | ) | | — | |
| |
|
|
|
|
|
|
|
| |
|
|
|
|
|
|
|
| |
|
|
|
|
|
|
|
|
|
Net asset value, end of period | | $ | 10.60 | | $ | 9.61 | | $ | 8.64 | | $ | 10.02 | | $ | 8.93 | | $ | 7.45 | | $ | 14.34 | | $ | 13.28 | | $ | 12.33 | |
| |
|
|
|
|
|
|
|
| |
|
|
|
|
|
|
|
| |
|
|
|
|
|
|
|
|
|
| | | | | | | | | | | | | | | | | | | | | | | | | | | | |
|
|
|
|
|
|
|
|
|
|
|
|
|
|
|
|
|
|
|
|
|
|
|
|
|
|
|
|
|
Total Investment Return3 | | | | | | | | | | | | | | | | | | | | | | | | |
|
|
|
|
|
|
|
|
|
|
|
|
|
|
|
|
|
|
|
|
|
|
|
|
|
|
|
|
|
Total investment return | | | 11.70 | %4 | | 12.55 | %4,5 | | (34.79 | )%4 | | 12.87 | %4 | | 20.66 | %4,6 | | (33.48 | )%4 | | 9.33 | %4 | | 8.93 | %4,7 | | (33.50 | )%4 |
| |
|
|
|
|
|
|
|
| |
|
|
|
|
|
|
|
| |
|
|
|
|
|
|
|
|
|
| | | | | | | | | | | | | | | | | | | | | | | | | | | | |
|
|
|
|
|
|
|
|
|
|
|
|
|
|
|
|
|
|
|
|
|
|
|
|
|
|
|
|
|
Ratios to Average Net Assets8,9 | | | | | | | | | | | | | | | | | | | | | | | | | |
|
|
|
|
|
|
|
|
|
|
|
|
|
|
|
|
|
|
|
|
|
|
|
|
|
|
|
|
|
Total expenses | | | 0.68 | % | | 0.73 | % | | 0.71 | % | | 0.81 | % | | 0.88 | % | | 0.81 | % | | 0.70 | % | | 0.77 | % | | 0.78 | % |
| |
|
|
|
|
|
|
|
| |
|
|
|
|
|
|
|
| |
|
|
|
|
|
|
|
|
|
Total expenses after reimbursement | | | 0.67 | % | | 0.66 | % | | 0.62 | % | | 0.67 | % | | 0.66 | % | | 0.65 | % | | 0.67 | % | | 0.66 | % | | 0.63 | % |
| |
|
|
|
|
|
|
|
| |
|
|
|
|
|
|
|
| |
|
|
|
|
|
|
|
|
|
Net investment income | | | 1.08 | % | | 1.39 | % | | 0.76 | % | | 0.70 | % | | 0.73 | % | | 0.30 | % | | 1.38 | % | | 1.74 | % | | 1.03 | % |
| |
|
|
|
|
|
|
|
| |
|
|
|
|
|
|
|
| |
|
|
|
|
|
|
|
|
|
| | | | | | | | | | | | | | | | | | | | | | | | | | | | |
|
|
|
|
|
|
|
|
|
|
|
|
|
|
|
|
|
|
|
|
|
|
|
|
|
|
|
|
|
Supplemental Data | | | | | | | | | | | | | | | | | | | | | | | | | | |
|
|
|
|
|
|
|
|
|
|
|
|
|
|
|
|
|
|
|
|
|
|
|
|
|
|
|
|
|
Net assets, end of period (000) | | $ | 120,995 | | $ | 109,188 | | $ | 105,224 | | $ | 92,350 | | $ | 83,098 | | $ | 80,882 | | $ | 173,008 | | $ | 132,560 | | $ | 128,159 | |
| |
|
|
|
|
|
|
|
| |
|
|
|
|
|
|
|
| |
|
|
|
|
|
|
|
|
|
Portfolio turnover of the Portfolio | | | 73 | % | | 168 | % | | 109 | % | | 97 | % | | 242 | % | | 144 | % | | 64 | % | | 151 | % | | 108 | % |
| |
|
|
|
|
|
|
|
| |
|
|
|
|
|
|
|
| |
|
|
|
|
|
|
|
|
|
| | |
| 1 | Commencement of operations. |
| | |
| 2 | Based on average shares outstanding. |
| | |
| 3 | Where applicable, total investment returns include the reinvestment of dividends and distributions. |
| | |
| 4 | Aggregate total investment return. |
| | |
| 5 | Includes proceeds received from a settlement of litigation, through its investment in the Portfolio, which impacted the Fund’s total investment return. Not including these proceeds, the total investment return would have been 12.08%. |
| | |
| 6 | Includes proceeds received from a settlement of litigation, through its investment in the Portfolio, which impacted the Fund’s total investment return. Not including these proceeds, the total investment return would have been 20.25%. |
| | |
| 7 | Includes proceeds received from a settlement of litigation, through its investment in the Portfolio, which impacted the Fund’s total investment return. Not including these proceeds, the total investment return would have been 8.52%. |
| | |
| 8 | Includes the Fund’s share of the applicable Portfolio’s allocated expenses and/or net investment income. |
| | |
| 9 | Annualized. |
| | |
See Notes to Financial Statements. |
|
14 | BLACKROCK LARGE CAP SERIES FUNDS, INC. | MARCH 31, 2010 |
| |
|
| |
Notes to Financial Statements (Unaudited) | BlackRock Large Cap Series Funds, Inc. |
1. Organization and Significant Accounting Policies:
BlackRock Large Cap Core Retirement Portfolio, BlackRock Large Cap Growth Retirement Portfolio and BlackRock Large Cap Value Retirement Portfolio (collectively the “Funds”), constitute three of the series of BlackRock Large Cap Series Funds, Inc. (the “Corporation”), which is registered under the Investment Company Act of 1940, as amended (the “1940 Act”), as a diversified, open-end management investment company. The Corporation is organized as a Maryland corporation. Each Fund seeks to achieve its investment objective by investing all, or a portion of, its assets in Master Large Cap Core Portfolio, Master Large Cap Growth Portfolio and Master Large Cap Value Portfolio (collectively the “Portfolios”), as applicable, constituting Master Large Cap Series LLC (the “Master LLC”), each of which has the same investment objective and strategies as the corresponding Fund. The value of a Fund’s investment in the applicable Portfolio reflects the Fund’s proportionate interest in the net assets of such Portfolio. As of March 31, 2010, the percentages of Master Large Cap Core Portfolio, Master Large Cap Growth Portfolio and Master Large Cap Value Portfolio owned by BlackRock Large Cap Core Retirement Portfolio, BlackRock Large Cap Growth Retirement Portfolio and BlackRock Large Cap Value Retirement Portfolio, were 3%, 12% and 7%, respectively. The performance of a Fund is directly affected by the performance of the applicable Portfolio. The financial statements of the Portfolios, including the Schedules of Investments, are included elsewhere in this report and should be read in conjunction with the Funds’ financial statements. The Funds’ financial statements are prepared in conformity with accounting principles generally accepted in the United States of America, which may require the use of management accruals and estimates. Actual results may differ from these estimates.
The following is a summary of significant accounting policies followed by the Funds:
Valuation: Each Fund records its investment in the corresponding Portfolio at fair value. Valuation of securities held by the Portfolios is discussed in Note 1 of the Portfolios’ Notes to Financial Statements, which are included elsewhere in this report.
Fair Value Measurements: Various inputs are used in determining the fair value of investments, which are as follows:
| | |
| • | Level 1 — price quotations in active markets/exchanges for identical assets and liabilities |
| | |
| • | Level 2 — other observable inputs (including, but not limited to: quoted prices for similar assets or liabilities in markets that are active, quoted prices for identical or similar assets or liabilities in markets that are not active, inputs other than quoted prices that are observable for the assets or liabilities (such as interest rates, yield curves, volatilities, prepayment speeds, loss severities, credit risks and default rates) or other market-corroborated inputs) |
| | |
| • | Level 3 — unobservable inputs based on the best information available in the circumstances, to the extent observable inputs are not available (including the Funds’ own assumptions used in determining the fair value of investments) |
The inputs or methodologies used for valuing securities are not necessarily an indication of the risk associated with investing in those securities.
As of March 31, 2010, each Fund’s investment in the respective Portfolio was classified as Level 2. More relevant disclosure regarding fair value measurements relating to the Portfolios is disclosed in the Portfolios’ Schedules of Investments included elsewhere in this report.
Investment Transactions and Net Investment Income: For financial reporting purposes, investment transactions in the Portfolios are accounted for on a trade date basis. Each Fund records daily its proportionate share of the Portfolio’s income, expenses and realized and unrealized gains and losses. In addition, the Fund accrues its own expenses.
Dividends and Distributions: Dividends and distributions paid by each Fund are recorded on the ex-dividend dates.
Income Taxes: It is each Fund’s policy to comply with the requirements of the Internal Revenue Code of 1986, as amended, applicable to regulated investment companies and to distribute substantially all of its taxable income to its shareholders. Therefore, no federal income tax provision is required.
Each Fund files US federal and various state and local tax returns. No income tax returns are currently under examination. The statute of limitations on each Fund’s US federal tax return remains open for the periods ended October 31, 2008 and September 30, 2009. The statutes of limitations on each Fund’s state and local tax returns may remain open for an additional year depending upon the jurisdiction.
Recent Accounting Standard: In January 2010, the Financial Accounting Standards Board issued amended guidance to improve disclosure about fair value measurements which will require additional disclosures about transfers into and out of Levels 1 and 2 and separate disclosures about purchases, sales, issuances and settlements in the reconciliation for fair value measurements using significant unobservable inputs (Level 3). It also clarifies existing disclosure requirements relating to the levels of disaggregation for fair value measurement and inputs and valuation techniques used to measure fair value. The amended guidance is effective for financial statements for fiscal years beginning after December 15, 2009, and interim periods within those fiscal years, except for disclosures about purchases, sales, issuances and settlements in the rollforward of activity in Level 3 fair value measurements, which are effective for fiscal years beginning after December 15, 2010 and for interim periods within those fiscal years. The impact of this guidance on the Funds’ financial statements and disclosures is currently being assessed.
Other: Expenses directly related to each Fund are charged to that Fund. Other operating expenses shared by several funds are pro rated among those funds on the basis of relative net assets or other appropriate methods.
| | |
|
|
|
BLACKROCK LARGE CAP SERIES FUNDS, INC. | MARCH 31, 2010 | 15 |
| |
|
|
Notes to Financial Statements (continued) | BlackRock Large Cap Series Funds, Inc. |
2. Administration Agreements and Other Transactions with Affiliates:
The PNC Financial Services Group, Inc. (“PNC”), Bank of America Corporation (“BAC”) and Barclays Bank PLC (“Barclays”) are the largest stockholders of BlackRock, Inc. (“BlackRock”). Due to the ownership structure, PNC is an affiliate of the Funds for 1940 Act purposes, but BAC and Barclays are not.
The Corporation, on behalf of each Fund, has entered into an Administration Agreement with BlackRock Advisors, LLC (the “Administrator”), an indirect, wholly owned subsidiary of BlackRock, to provide administrative services (other than investment advice and related portfolio activities).
The Administrator does not receive an administration fee. The Administrator has contractually agreed to waive and/or reimburse fees and/or expenses of each Fund in order to limit expenses (excluding interest expense, acquired fund fees and expenses and other fund expenses) of each Fund to 0.67% of the average daily net assets of such Fund. This arrangement has a one-year term and is renewable. The Administrator has agreed not to reduce or discontinue this contractual waiver or reimbursement until February 1, 2011 unless approved by the Board of Directors including a majority of the non-interested Directors. For the six months ended March 31, 2010, the Administrator reimbursed the Funds, which are shown as fees reimbursed by administrator in the Statements of Operations.
The Corporation, on behalf of each Fund, has entered into a Distribution Agreement and Distribution Plan with BlackRock Investments, LLC (“BRIL”), an affiliate of BlackRock.
PNC Global Investment Servicing (U.S.) Inc. (“PNCGIS”), an indirect, wholly owned subsidiary of PNC and an affiliate of the Administrator, serves as transfer agent and dividend disbursing agent. Transfer agency fees borne by each of the Funds are comprised of those fees charged for all shareholder communications including mailing of shareholder reports, dividend and distribution notices, and proxy materials for shareholder meetings, as well as per account and per transaction fees related to servicing and maintenance of shareholder accounts, including the issuing, redeeming and transferring of shares, check writing, anti-money laundering services, and customer identification services.
Certain officers and/or directors of the Corporation are officers and/or directors of BlackRock or its affiliates. Each Fund reimburses the Administrator for compensation paid to the Fund’s Chief Compliance Officer.
3. Capital Loss Carryforwards:
As of September 30, 2009, the Funds had capital loss carryforwards available to offset future realized capital gains through the indicated expiration dates:
| | | | | | | | | | |
|
|
|
|
|
|
|
|
|
|
|
Expires September 30, | | BlackRock
Large Cap Core
Retirement
Portfolio | | BlackRock
Large Cap Growth
Retirement
Portfolio | | BlackRock
Large Cap Value
Retirement
Portfolio | |
|
|
|
|
|
|
|
|
2016 | | $ | 34,359,084 | | $ | 19,880,162 | | $ | 21,158,813 | |
2017 | | | 24,488,876 | | | 18,251,218 | | | 15,908,520 | |
| |
|
|
|
|
|
|
|
|
|
Total | | $ | 58,847,960 | | $ | 38,131,380 | | $ | 37,067,333 | |
| |
|
|
|
|
|
|
|
|
|
| | |
|
|
|
16 | BLACKROCK LARGE CAP SERIES FUNDS, INC. | MARCH 31, 2010 |
| |
|
|
Notes to Financial Statements (concluded) | BlackRock Large Cap Series Funds, Inc. |
4. Capital Share Transactions:
Transactions in capital shares for Class K were as follows:
| | | | | | | | | | | | | | | | |
| | Six Months Ended
March 31, 2010 | | Period November 1, 2008 to
September 30, 2009 | | Period January 3, 20081 to
October 31, 2008 | |
BlackRock Large Cap Core
Retirement Portfolio | |
| |
| |
|
|
| Shares | | Amount | | Shares | | Amount | | Shares | | Amount | |
|
|
|
|
|
|
|
|
|
|
|
|
|
|
|
|
|
Class K | | | | | | | | | | | | | | | | |
|
|
|
|
|
|
|
|
|
|
|
|
|
|
|
|
|
Shares sold | | 1,635,176 | | $ | 16,361,904 | | 3,221,197 | | $ | 25,865,214 | | 15,728,260 | | $ | 202,504,200 | |
Shares issued to shareholders in reinvestment of dividends | | 132,186 | | | 1,324,321 | | 140,867 | | | 1,171,704 | | — | | | — | |
| |
|
|
|
| |
|
|
|
| |
|
|
|
|
|
Total issued | | 1,767,362 | | | 17,686,225 | | 3,362,064 | | | 27,036,918 | | 15,728,260 | | | 202,504,200 | |
Shares redeemed | | (1,719,572 | ) | | (17,229,160 | ) | (4,181,262 | ) | | (34,344,063 | ) | (3,543,915 | ) | | (40,610,691 | ) |
| |
|
|
|
| |
|
|
|
| |
|
|
|
|
|
Net increase (decrease) | | 47,790 | | $ | 457,065 | | (819,198 | ) | $ | (7,307,145 | ) | 12,184,345 | | $ | 161,893,509 | |
| |
|
|
|
| |
|
|
|
| |
|
|
|
|
|
| | | | | | | | | | | | | | | | |
BlackRock Large Cap Growth
Retirement Portfolio | | | | | | | | | | | | | | | | |
|
|
|
|
|
|
|
|
|
|
|
|
|
|
|
|
|
Class K | | | | | | | | | | | | | | | | |
|
|
|
|
|
|
|
|
|
|
|
|
|
|
|
|
|
Shares sold | | 1,312,184 | | $ | 12,320,708 | | 2,606,730 | | $ | 18,886,875 | | 14,459,452 | | $ | 157,367,603 | |
Shares issued to shareholders in reinvestment of dividends | | 49,515 | | | 465,344 | | 67,964 | | | 481,662 | | — | | | — | |
| |
|
|
|
| |
|
|
|
| |
|
|
|
|
|
Total issued | | 1,361,699 | | | 12,786,052 | | 2,674,694 | | | 19,368,537 | | 14,459,452 | | | 157,367,603 | |
Shares redeemed | | (1,449,723 | ) | | (13,527,988 | ) | (4,220,846 | ) | | (30,842,638 | ) | (3,604,648 | ) | | (35,323,232 | ) |
| |
|
|
|
| |
|
|
|
| |
|
|
|
|
|
Net increase (decrease) | | (88,024 | ) | $ | (741,936 | ) | (1,546,152 | ) | $ | (11,474,101 | ) | 10,854,804 | | $ | 122,044,371 | |
| |
|
|
|
| |
|
|
|
| |
|
|
|
|
|
| | | | | | | | | | | | | | | | |
BlackRock Large Cap Value
Retirement Portfolio | | | | | | | | | | | | | | | | |
|
|
|
|
|
|
|
|
|
|
|
|
|
|
|
|
|
Class K | | | | | | | | | | | | | | | | |
|
|
|
|
|
|
|
|
|
|
|
|
|
|
|
|
|
Shares sold | | 3,195,631 | | $ | 43,325,787 | | 2,120,540 | | $ | 24,422,164 | | 12,490,568 | | $ | 198,023,858 | |
Shares issued to shareholders in reinvestment of dividends | | 142,672 | | | 1,950,228 | | 116,254 | | | 1,380,656 | | — | | | — | |
| |
|
|
|
| |
|
|
|
| |
|
|
|
|
|
Total issued | | 3,338,303 | | | 45,276,015 | | 2,236,794 | | | 25,802,820 | | 12,490,568 | | | 198,023,858 | |
Shares redeemed | | (1,256,027 | ) | | (17,208,454 | ) | (2,650,582 | ) | | (30,255,034 | ) | (2,094,039 | ) | | (33,871,668 | ) |
| |
|
|
|
| |
|
|
|
| |
|
|
|
|
|
Net increase (decrease) | | 2,082,276 | | $ | 28,067,561 | | (413,788 | ) | $ | (4,452,214 | ) | 10,396,529 | | $ | 164,152,190 | |
| |
|
|
|
| |
|
|
|
| |
|
|
|
|
|
| | |
| 1 | Commencement of operations. |
5. Subsequent Events:
Management has evaluated the impact of all subsequent events on the Fund through the date the financial statements were issued, and has determined that there were no subsequent events requiring adjustment or disclosure in the financial statements.
| | |
|
|
|
BLACKROCK LARGE CAP SERIES FUNDS, INC. | MARCH 31, 2010 | 17 |
| |
|
| |
Portfolio Information as of March 31, 2010 | Master Large Cap Series LLC |
| | | | |
Master Large Cap Core Portfolio | | Percent of
Long-Term Investments | |
|
|
|
|
|
Microsoft Corp. | | 3 | % | |
International Business Machines Corp. | | 2 | | |
Exxon Mobil Corp. | | 2 | | |
ConocoPhillips | | 2 | | |
Amgen, Inc. | | 2 | | |
Verizon Communications, Inc. | | 1 | | |
Freeport-McMoRan Copper & Gold, Inc., Class B | | 1 | | |
Target Corp. | | 1 | | |
UnitedHealth Group, Inc. | | 1 | | |
WellPoint, Inc. | | 1 | | |
|
|
|
|
|
| | | | |
Master Large Cap Growth Portfolio | | Percent of
Long-Term Investments | |
|
|
|
|
|
Microsoft Corp. | | 5 | % | |
International Business Machines Corp. | | 4 | | |
Philip Morris International, Inc. | | 3 | | |
Amgen, Inc. | | 2 | | |
Colgate-Palmolive Co. | | 2 | | |
Target Corp. | | 2 | | |
Apple, Inc. | | 2 | | |
Medco Health Solutions, Inc. | | 1 | | |
Automatic Data Processing, Inc. | | 1 | | |
Freeport-McMoRan Copper & Gold, Inc., Class B | | 1 | | |
|
|
|
|
|
| | | | |
Master Large Cap Value Portfolio | | Percent of
Long-Term Investments | |
|
|
|
|
|
Verizon Communications, Inc. | | 3 | % | |
The Goldman Sachs Group, Inc. | | 2 | | |
ConocoPhillips | | 2 | | |
Exxon Mobil Corp. | | 2 | | |
UnitedHealth Group, Inc. | | 2 | | |
WellPoint, Inc. | | 2 | | |
The Travelers Cos., Inc. | | 1 | | |
XTO Energy, Inc. | | 1 | | |
Marathon Oil Corp. | | 1 | | |
General Electric Co. | | 1 | | |
|
|
|
|
|
| | | | |
Master Large Cap Core Portfolio | | Percent of
Long-Term Investments | |
|
|
|
|
|
Health Care | | 19 | % | |
Information Technology | | 15 | | |
Consumer Discretionary | | 13 | | |
Energy | | 13 | | |
Materials | | 11 | | |
Industrials | | 10 | | |
Consumer Staples | | 8 | | |
Financials | | 5 | | |
Utilities | | 4 | | |
Telecommunication Services | | 2 | | |
|
|
|
|
|
| | | | |
Master Large Cap Growth Portfolio | | Percent of
Long-Term Investments | |
|
|
|
|
|
Information Technology | | 26 | % | |
Health Care | | 23 | | |
Industrials | | 12 | | |
Consumer Staples | | 11 | | |
Consumer Discretionary | | 10 | | |
Materials | | 9 | | |
Energy | | 6 | | |
Utilities | | 3 | | |
|
|
|
|
|
| | | | |
Master Large Cap Value Portfolio | | Percent of
Long-Term Investments | |
|
|
|
|
|
Energy | | 17 | % | |
Financials | | 16 | | |
Health Care | | 15 | | |
Industrials | | 13 | | |
Materials | | 12 | | |
Utilities | | 7 | | |
Information Technology | | 7 | | |
Consumer Staples | | 6 | | |
Consumer Discretionary | | 4 | | |
Telecommunication Services | | 3 | | |
|
|
|
|
|
| |
| For Portfolio compliance purposes, sector classifications refer to any one or more of the sector sub-classifications used by one or more widely recognized market indexes or ratings group indexes, and/or as defined by Portfolio management. This definition may not apply for purposes of this report, which may combine sector and industry sub-classifications for reporting ease. |
| | |
|
|
|
18 | BLACKROCK LARGE CAP SERIES FUNDS, INC. | MARCH 31, 2010 |
| |
|
| |
Schedule of Investments March 31, 2010 (Unaudited) | Master Large Cap Core Portfolio |
| (Percentages shown are based on Net Assets) |
| | | | | | | |
Common Stocks | | Shares | | Value | |
|
|
|
|
|
|
|
|
Consumer Discretionary — 12.8% | | | | | | | |
Household Durables — 0.3% | | | | | | | |
Garmin Ltd. (a) | | | 300,000 | | $ | 11,544,000 | |
|
|
|
|
|
|
|
|
Internet & Catalog Retail — 1.1% | | | | | | | |
Liberty Media Holding Corp. — Interactive (b) | | | 2,760,000 | | | 42,255,600 | |
|
|
|
|
|
|
|
|
Multiline Retail — 4.6% | | | | | | | |
Big Lots, Inc. (b) | | | 760,000 | | | 27,679,200 | |
JCPenney Co., Inc. (a) | | | 1,300,000 | | | 41,821,000 | |
Macy’s, Inc. | | | 2,130,000 | | | 46,370,100 | |
Nordstrom, Inc. | | | 300,000 | | | 12,255,000 | |
Target Corp. | | | 1,030,000 | | | 54,178,000 | |
| | | | |
|
|
|
| | | | | | 182,303,300 | |
|
|
|
|
|
|
|
|
Specialty Retail — 6.8% | | | | | | | |
Advance Auto Parts, Inc. | | | 780,000 | | | 32,697,600 | |
AutoNation, Inc. (a)(b) | | | 990,000 | | | 17,899,200 | |
Dick’s Sporting Goods, Inc. (b) | | | 30,000 | | | 783,300 | |
The Gap, Inc. | | | 1,990,000 | | | 45,988,900 | |
Limited Brands, Inc. | | | 1,670,000 | | | 41,115,400 | |
PetSmart, Inc. | | | 1,320,000 | | | 42,187,200 | |
Ross Stores, Inc. | | | 840,000 | | | 44,914,800 | |
TJX Cos., Inc. (a) | | | 1,100,000 | | | 46,772,000 | |
| | | | |
|
|
|
| | | | | | 272,358,400 | |
|
|
|
|
|
|
|
|
Total Consumer Discretionary | | | | | | 508,461,300 | |
|
|
|
|
|
|
|
|
Consumer Staples — 7.6% | | | | | | | |
Beverages — 0.2% | | | | | | | |
The Coca-Cola Co. | | | 120,000 | | | 6,600,000 | |
|
|
|
|
|
|
|
|
Food & Staples Retailing — 0.4% | | | | | | | |
Safeway, Inc. | | | 470,000 | | | 11,684,200 | |
Wal-Mart Stores, Inc. | | | 90,000 | | | 5,004,000 | |
| | | | |
|
|
|
| | | | | | 16,688,200 | |
|
|
|
|
|
|
|
|
Food Products — 3.1% | | | | | | | |
ConAgra Foods, Inc. | | | 850,000 | | | 21,309,500 | |
General Mills, Inc. | | | 290,000 | | | 20,529,100 | |
The Hershey Co. | | | 920,000 | | | 39,385,200 | |
Sara Lee Corp. | | | 3,150,000 | | | 43,879,500 | |
| | | | |
|
|
|
| | | | | | 125,103,300 | |
|
|
|
|
|
|
|
|
Household Products — 0.7% | | | | | | | |
The Procter & Gamble Co. | | | 420,000 | | | 26,573,400 | |
|
|
|
|
|
|
|
|
Personal Products — 1.1% | | | | | | | |
The Estée Lauder Cos., Inc., Class A | | | 680,000 | | | 44,111,600 | |
|
|
|
|
|
|
|
|
Tobacco — 2.1% | | | | | | | |
Lorillard, Inc. | | | 590,000 | | | 44,391,600 | |
Reynolds American, Inc. (a) | | | 760,000 | | | 41,024,800 | |
| | | | |
|
|
|
| | | | | | 85,416,400 | |
|
|
|
|
|
|
|
|
Total Consumer Staples | | | | | | 304,492,900 | |
|
|
|
|
|
|
|
|
Energy — 12.7% | | | | | | | |
Energy Equipment & Services — 5.6% | | | | | | | |
FMC Technologies, Inc. (a)(b) | | | 680,000 | | | 43,948,400 | |
Nabors Industries Ltd. (a)(b) | | | 1,660,000 | | | 32,585,800 | |
National Oilwell Varco, Inc. | | | 1,110,000 | | | 45,043,800 | |
Oceaneering International, Inc. (b) | | | 390,000 | | | 24,761,100 | |
Rowan Cos., Inc. (b) | | | 1,450,000 | | | 42,209,500 | |
Tidewater, Inc. | | | 730,000 | | | 34,507,100 | |
| | | | |
|
|
|
| | | | | | 223,055,700 | |
|
|
|
|
|
|
|
|
| | | | | | | |
Common Stocks | | Shares | | Value | |
|
|
|
|
|
|
|
|
Energy (concluded) | | | | | | | |
Oil, Gas & Consumable Fuels — 7.1% | | | | | | | |
Chevron Corp. | | | 250,000 | | $ | 18,957,500 | |
ConocoPhillips | | | 1,280,000 | | | 65,497,600 | |
Exxon Mobil Corp. | | | 1,120,000 | | | 75,017,600 | |
Marathon Oil Corp. | | | 1,500,000 | | | 47,460,000 | |
Williams Cos., Inc. | | | 1,960,000 | | | 45,276,000 | |
XTO Energy, Inc. | | | 650,000 | | | 30,667,000 | |
| | | | |
|
|
|
| | | | | | 282,875,700 | |
|
|
|
|
|
|
|
|
Total Energy | | | | | | 505,931,400 | |
|
|
|
|
|
|
|
|
Financials — 5.6% | | | | | | | |
Commercial Banks — 0.4% | | | | | | | |
Wells Fargo & Co. | | | 510,000 | | | 15,871,200 | |
|
|
|
|
|
|
|
|
Consumer Finance — 1.0% | | | | | | | |
Capital One Financial Corp. | | | 960,000 | | | 39,753,600 | |
|
|
|
|
|
|
|
|
Diversified Financial Services — 1.0% | | | | | | | |
Bank of America Corp. | | | 1,200,000 | | | 21,420,000 | |
JPMorgan Chase & Co. | | | 410,000 | | | 18,347,500 | |
| | | | |
|
|
|
| | | | | | 39,767,500 | |
|
|
|
|
|
|
|
|
Insurance — 3.2% | | | | | | | |
Assurant, Inc. | | | 470,000 | | | 16,158,600 | |
HCC Insurance Holdings, Inc. | | | 560,000 | | | 15,456,000 | |
Torchmark Corp. | | | 120,000 | | | 6,421,200 | |
The Travelers Cos., Inc. | | | 850,000 | | | 45,849,000 | |
UnumProvident Corp. (a) | | | 1,740,000 | | | 43,099,800 | |
| | | | |
|
|
|
| | | | | | 126,984,600 | |
|
|
|
|
|
|
|
|
Total Financials | | | | | | 222,376,900 | |
|
|
|
|
|
|
|
|
Health Care — 19.7% | | | | | | | |
Biotechnology — 1.5% | | | | | | | |
Amgen, Inc. (b) | | | 1,020,000 | | | 60,955,200 | |
|
|
|
|
|
|
|
|
Health Care Equipment & Supplies — 1.5% | | | | | | | |
Hospira, Inc. (b) | | | 810,000 | | | 45,886,500 | |
Kinetic Concepts, Inc. (b) | | | 250,000 | | | 11,952,500 | |
| | | | |
|
|
|
| | | | | | 57,839,000 | |
|
|
|
|
|
|
|
|
Health Care Providers & Services — 14.0% | | | | | | | |
Aetna, Inc. | | | 1,300,000 | | | 45,643,000 | |
AmerisourceBergen Corp. | | | 1,560,000 | | | 45,115,200 | |
Cardinal Health, Inc. | | | 1,290,000 | | | 46,478,700 | |
Community Health Systems, Inc. (b) | | | 870,000 | | | 32,129,100 | |
Coventry Health Care, Inc. (b) | | | 840,000 | | | 20,764,800 | |
Health Management Associates, Inc., Class A (b) | | | 3,150,000 | | | 27,090,000 | |
Humana, Inc. (b) | | | 910,000 | | | 42,560,700 | |
Lincare Holdings, Inc. (b) | | | 920,000 | | | 41,289,600 | |
McKesson Corp. | | | 700,000 | | | 46,004,000 | |
Medco Health Solutions, Inc. (b) | | | 800,000 | | | 51,648,000 | |
Omnicare, Inc. (a) | | | 350,000 | | | 9,901,500 | |
Quest Diagnostics, Inc. | | | 720,000 | | | 41,968,800 | |
UnitedHealth Group, Inc. | | | 1,650,000 | | | 53,905,500 | |
WellPoint, Inc. (b) | | | 820,000 | | | 52,791,600 | |
| | | | |
|
|
|
| | | | | | 557,290,500 | |
|
|
|
|
|
|
|
|
Pharmaceuticals — 2.7% | | | | | | | |
Endo Pharmaceuticals Holdings, Inc. (b) | | | 580,000 | | | 13,740,200 | |
Forest Laboratories, Inc. (b) | | | 1,400,000 | | | 43,904,000 | |
Johnson & Johnson | | | 350,000 | | | 22,820,000 | |
Perrigo Co. (a) | | | 300,000 | | | 17,616,000 | |
Pfizer, Inc. | | | 640,000 | | | 10,976,000 | |
| | | | |
|
|
|
| | | | | | 109,056,200 | |
|
|
|
|
|
|
|
|
Total Health Care | | | | | | 785,140,900 | |
|
|
|
|
|
|
|
|
| | |
See Notes to Financial Statements. |
|
|
|
BLACKROCK LARGE CAP SERIES FUNDS, INC. | MARCH 31, 2010 | 19 |
| |
|
|
| |
Schedule of Investments (continued) | Master Large Cap Core Portfolio
(Percentages shown are based on Net Assets) |
| | | | | | | |
Common Stocks | | Shares | | Value | |
|
|
|
|
|
|
|
|
Industrials — 9.7% | | | | | | | |
Aerospace & Defense — 3.5% | | | | | | | |
L-3 Communications Holdings, Inc. | | | 470,000 | | $ | 43,066,100 | |
Northrop Grumman Corp. | | | 760,000 | | | 49,833,200 | |
Raytheon Co. | | | 830,000 | | | 47,409,600 | |
| | | | |
|
|
|
| | | | | | 140,308,900 | |
|
|
|
|
|
|
|
|
Commercial Services & Supplies — 0.4% | | | | | | | |
R.R. Donnelley & Sons Co. | | | 810,000 | | | 17,293,500 | |
|
|
|
|
|
|
|
|
Construction & Engineering — 1.4% | | | | | | | |
Fluor Corp. | | | 910,000 | | | 42,324,100 | |
KBR, Inc. | | | 550,000 | | | 12,188,000 | |
| | | | |
|
|
|
| | | | | | 54,512,100 | |
|
|
|
|
|
|
|
|
Electrical Equipment — 0.5% | | | | | | | |
General Cable Corp. (b) | | | 740,000 | | | 19,980,000 | |
|
|
|
|
|
|
|
|
Industrial Conglomerates — 0.7% | | | | | | | |
General Electric Co. | | | 1,490,000 | | | 27,118,000 | |
|
|
|
|
|
|
|
|
Machinery — 2.9% | | | | | | | |
Eaton Corp. | | | 610,000 | | | 46,219,700 | |
Parker Hannifin Corp. | | | 670,000 | | | 43,375,800 | |
SPX Corp. | | | 340,000 | | | 22,548,800 | |
Toro Co. (a) | | | 120,000 | | | 5,900,400 | |
| | | | |
|
|
|
| | | | | | 118,044,700 | |
|
|
|
|
|
|
|
|
Road & Rail — 0.3% | | | | | | | |
Ryder System, Inc. | | | 270,000 | | | 10,465,200 | |
|
|
|
|
|
|
|
|
Total Industrials | | | | | | 387,722,400 | |
|
|
|
|
|
|
|
|
Information Technology — 15.7% | | | | | | | |
Communications Equipment — 0.3% | | | | | | | |
Cisco Systems, Inc. (b) | | | 500,000 | | | 13,015,000 | |
|
|
|
|
|
|
|
|
Computers & Peripherals — 3.2% | | | | | | | |
Apple, Inc. (b) | | | 140,000 | | | 32,890,200 | |
Hewlett-Packard Co. | | | 100,000 | | | 5,315,000 | |
Lexmark International, Inc., Class A (b) | | | 910,000 | | | 32,832,800 | |
Seagate Technology Holdings (a) | | | 800,000 | | | 14,608,000 | |
Western Digital Corp. (b) | | | 1,040,000 | | | 40,549,600 | |
| | | | |
|
|
|
| | | | | | 126,195,600 | |
|
|
|
|
|
|
|
|
IT Services — 6.5% | | | | | | | |
Cognizant Technology Solutions Corp. (b) | | | 240,000 | | | 12,235,200 | |
Computer Sciences Corp. (b) | | | 790,000 | | | 43,047,100 | |
Fiserv, Inc. (b) | | | 840,000 | | | 42,638,400 | |
Global Payments, Inc. (a) | | | 680,000 | | | 30,974,000 | |
Hewitt Associates, Inc., Class A (b) | | | 930,000 | | | 36,995,400 | |
International Business Machines Corp. | | | 720,000 | | | 92,340,000 | |
| | | | |
|
|
|
| | | | | | 258,230,100 | |
|
|
|
|
|
|
|
|
Internet Software & Services — 1.2% | | | | | | | |
Google, Inc., Class A (b) | | | 10,000 | | | 5,670,100 | |
VeriSign, Inc. (a)(b) | | | 1,620,000 | | | 42,136,200 | |
| | | | |
|
|
|
| | | | | | 47,806,300 | |
|
|
|
|
|
|
|
|
Software — 4.5% | | | | | | | |
CA, Inc. | | | 1,830,000 | | | 42,950,100 | |
Microsoft Corp. | | | 4,000,000 | | | 117,080,000 | |
Sybase, Inc. (a)(b) | | | 440,000 | | | 20,512,800 | |
| | | | |
|
|
|
| | | | | | 180,542,900 | |
|
|
|
|
|
|
|
|
Total Information Technology | | | | | | 625,789,900 | |
|
|
|
|
|
|
|
|
| | | | | | | |
Common Stocks | | Shares | | Value | |
|
|
|
|
|
|
Materials — 10.7% | | | | | | | |
Chemicals — 4.8% | | | | | | | |
Ashland, Inc. | | | 610,000 | | $ | 32,189,700 | |
Celanese Corp., Series A | | | 910,000 | | | 28,983,500 | |
Eastman Chemical Co. | | | 640,000 | | | 40,755,200 | |
Huntsman Corp. | | | 2,210,000 | | | 26,630,500 | |
Lubrizol Corp. | | | 460,000 | | | 42,191,200 | |
Nalco Holding Co. | | | 770,000 | | | 18,734,100 | |
| | | | |
|
|
|
| | | | | | 189,484,200 | |
|
|
|
|
|
|
|
|
Containers & Packaging — 1.4% | | | | | | | |
Crown Holdings, Inc. (b) | | | 1,350,000 | | | 36,396,000 | |
Temple-Inland, Inc. | | | 1,010,000 | | | 20,634,300 | |
| | | | |
|
|
|
| | | | | | 57,030,300 | |
|
|
|
|
|
|
|
|
Metals & Mining — 2.9% | | | | | | | |
Freeport-McMoRan Copper & Gold, Inc., Class B | | | 660,000 | | | 55,136,400 | |
Reliance Steel & Aluminum Co. | | | 380,000 | | | 18,707,400 | |
Walter Industries, Inc. | | | 460,000 | | | 42,444,200 | |
| | | | |
|
|
|
| | | | | | 116,288,000 | |
|
|
|
|
|
|
|
|
Paper & Forest Products — 1.6% | | | | | | | |
International Paper Co. | | | 1,750,000 | | | 43,067,500 | |
MeadWestvaco Corp. | | | 840,000 | | | 21,462,000 | |
| | | | |
|
|
|
| | | | | | 64,529,500 | |
|
|
|
|
|
|
|
|
Total Materials | | | | | | 427,332,000 | |
|
|
|
|
|
|
|
|
Telecommunication Services — 1.7% | | | | | | | |
Diversified Telecommunication Services — 1.7% | | | | | | | |
AT&T Inc. | | | 530,000 | | | 13,695,200 | |
Verizon Communications, Inc. | | | 1,780,000 | | | 55,215,600 | |
|
|
|
|
|
|
|
|
Total Telecommunication Services | | | | | | 68,910,800 | |
|
|
|
|
|
|
|
|
Utilities — 4.3% | | | | | | | |
Electric Utilities — 0.4% | | | | | | | |
Edison International | | | 200,000 | | | 6,834,000 | |
Pinnacle West Capital Corp. | | | 200,000 | | | 7,546,000 | |
| | | | |
|
|
|
| | | | | | 14,380,000 | |
|
|
|
|
|
|
|
|
Independent Power Producers & Energy Traders — 2.6% | | | | | | | |
The AES Corp. (b) | | | 3,390,000 | | | 37,290,000 | |
Constellation Energy Group, Inc. | | | 720,000 | | | 25,279,200 | |
Mirant Corp. (b) | | | 810,000 | | | 8,796,600 | |
NRG Energy, Inc. (a)(b) | | | 1,640,000 | | | 34,276,000 | |
| | | | |
|
|
|
| | | | | | 105,641,800 | |
|
|
|
|
|
|
|
|
Multi-Utilities — 1.3% | | | | | | | |
DTE Energy Co. | | | 730,000 | | | 32,558,000 | |
NiSource, Inc. | | | 1,220,000 | | | 19,276,000 | |
| | | | |
|
|
|
| | | | | | 51,834,000 | |
|
|
|
|
|
|
|
|
Total Utilities | | | | | | 171,855,800 | |
|
|
|
|
|
|
|
|
Total Long-Term Investments
(Cost — $3,346,878,913) — 100.5% | | | | | | 4,008,014,300 | |
|
|
|
|
|
|
|
|
| | | | | | | |
|
|
|
|
|
|
|
|
| | | | | | | |
Short-Term Securities | | Beneficial
Interest
(000) | | | | |
|
|
|
|
|
|
|
BlackRock Liquidity Series, LLC, Money Market
Series, 0.22% (c)(d)(e) | | $ | 284,433 | | | 284,432,850 | |
|
|
|
|
|
|
|
|
Total Short-Term Securities
(Cost — $284,432,850) — 7.1% | | | | | | 284,432,850 | |
|
|
|
|
|
|
|
|
Total Investments (Cost — $3,631,311,763*) — 107.6% | | | | | | 4,292,447,150 | |
Liabilities in Excess of Other Assets — (7.6)% | | | | | | (302,485,961 | ) |
| | | | |
|
|
|
Net Assets — 100.0% | | | | | $ | 3,989,961,189 | |
| | | | |
|
|
|
| | |
See Notes to Financial Statements. |
|
20 | BLACKROCK LARGE CAP SERIES FUNDS, INC. | MARCH 31, 2010 |
| |
|
|
| |
Schedule of Investments (concluded) | Master Large Cap Core Portfolio |
| |
* | The cost and unrealized appreciation (depreciation) of investments as of March 31, 2010, as computed for federal income tax purposes, were as follows: |
| | | | | |
| Aggregate cost | | $ | 3,778,522,746 | |
| | |
|
|
|
| Gross unrealized appreciation | | $ | 548,760,618 | |
| Gross unrealized depreciation | | | (34,836,214 | ) |
| | |
|
|
|
| Net unrealized appreciation | | $ | 513,924,404 | |
| | |
|
|
|
| |
(a) | Security, or a portion of security, is on loan. |
| |
(b) | Non-income producing security. |
| |
(c) | Investments in companies considered to be an affiliate of the Portfolio, for purposes of Section 2(a)(3) of the Investment Company Act of 1940, were as follows: |
| | | | | | | |
|
|
|
|
|
|
|
|
Affiliate | | Net
Activity | | Income | |
|
|
|
|
|
|
BlackRock Liquidity Funds, TempFund,
Institutional Class | | $ | (31,839,442 | ) | $ | 648 | |
BlackRock Liquidity Series, LLC,
Money Market Series | | $ | 154,911,200 | | $ | 194,448 | |
|
|
|
|
|
|
|
|
| | |
(d) | Represents the current yield as of report date. |
| | |
(e) | Security was purchased with the cash collateral from loaned securities. |
| | |
• | For Portfolio compliance purposes, the Portfolio’s industry classifications refer to any one or more of the industry sub-classifications used by one or more widely recognized market indexes or rating group indexes, and/or as defined by Portfolio management. This definition may not apply for purposes of this report, which may combine such industry sub-classifications for reporting ease. |
| | |
• | Fair Value Measurements — Various inputs are used in determining the fair value of investments, which are as follows: |
| | |
| • | Level 1 — price quotations in active markets/exchanges for identical assets and liabilities |
| | |
| • | Level 2 — other observable inputs (including, but not limited to: quoted prices for similar assets or liabilities in markets that are active, quoted prices for identical or similar assets or liabilities in markets that are not active, inputs other than quoted prices that are observable for the assets or liabilities (such as interest rates, yield curves, volatilities, prepayment speeds, loss severities, credit risks and default rates) or other market-corroborated inputs) |
| | |
| • | Level 3 — unobservable inputs based on the best information available in the circumstances, to the extent observable inputs are not available (including the Portfolio’s own assumptions used in determining the fair value of investments) |
| | |
| The inputs or methodologies used for valuing securities are not necessarily an indication of the risk associated with investing in those securities. For information about the Portfolio’s policy regarding valuation of investments and other significant accounting policies, please refer to Note 1 of the Notes to Financial Statements. |
| | |
| The following table summarizes the inputs used as of March 31, 2010 in determining the fair valuation of the Portfolio’s investments: |
| | | | | | | | | | | | |
|
|
|
|
| | Investments in Securities | |
|
|
|
|
Valuation Inputs | | Level 1 | | Level 2 | | Level 3 | | Total | |
|
|
|
|
|
|
|
|
|
|
Assets: | | | | | | | | | | | | |
Long-Term Investments1 | | $ | 4,008,014,300 | | | — | | — | | $ | 4,008,014,300 | |
Short-Term Securities | | | — | | $ | 284,432,850 | | — | | | 284,432,850 | |
| |
|
|
|
|
|
|
|
|
|
|
|
Total | | $ | 4,008,014,300 | | $ | 284,432,850 | | — | | $ | 4,292,447,150 | |
| |
|
|
|
|
|
|
|
|
|
|
|
| | |
| 1 | See above Schedule of Investments for values in each industry. |
| | |
See Notes to Financial Statements. |
|
BLACKROCK LARGE CAP SERIES FUNDS, INC. | MARCH 31, 2010 | 21 |
| |
|
|
| |
Schedule of Investments March 31, 2010 (Unaudited) | Master Large Cap Growth Portfolio |
| (Percentages shown are based on Net Assets) |
| | | | | | | |
Common Stocks | | Shares | | Value | |
|
|
|
|
|
|
|
|
Consumer Discretionary — 10.0% | | | | | | | |
Multiline Retail — 3.9% | | | | | | | |
Big Lots, Inc. (a) | | | 219,000 | | $ | 7,975,980 | |
Dollar Tree, Inc. (a) | | | 144,000 | | | 8,527,680 | |
Target Corp. | | | 241,000 | | | 12,676,600 | |
| | | | |
|
|
|
| | | | | | 29,180,260 | |
|
|
|
|
|
|
|
|
Specialty Retail — 6.1% | | | | | | | |
Dick’s Sporting Goods, Inc. (a) | | | 297,000 | | | 7,754,670 | |
The Gap, Inc. | | | 239,000 | | | 5,523,290 | |
Limited Brands, Inc. | | | 336,000 | | | 8,272,320 | |
PetSmart, Inc. | | | 181,000 | | | 5,784,760 | |
Ross Stores, Inc. | | | 163,000 | | | 8,715,610 | |
TJX Cos., Inc. (b) | | | 230,000 | | | 9,779,600 | |
| | | | |
|
|
|
| | | | | | 45,830,250 | |
|
|
|
|
|
|
|
|
Total Consumer Discretionary | | | | | | 75,010,510 | |
|
|
|
|
|
|
|
|
Consumer Staples — 11.1% | | | | | | | |
Food & Staples Retailing — 0.7% | | | | | | | |
Wal-Mart Stores, Inc. | | | 28,000 | | | 1,556,800 | |
Walgreen Co. | | | 93,000 | | | 3,449,370 | |
| | | | |
|
|
|
| | | | | | 5,006,170 | |
|
|
|
|
|
|
|
|
Food Products — 3.5% | | | | | | | |
General Mills, Inc. | | | 123,000 | | | 8,707,170 | |
H.J. Heinz Co. | | | 24,000 | | | 1,094,640 | |
The Hershey Co. | | | 186,000 | | | 7,962,660 | |
Hormel Foods Corp. | | | 29,000 | | | 1,218,290 | |
Sara Lee Corp. | | | 561,000 | | | 7,814,730 | |
| | | | |
|
|
|
| | | | | | 26,797,490 | |
|
|
|
|
|
|
|
|
Household Products — 1.8% | | | | | | | |
Colgate-Palmolive Co. | | | 151,000 | | | 12,874,260 | |
The Procter & Gamble Co. | | | 11,000 | | | 695,970 | |
| | | | |
|
|
|
| | | | | | 13,570,230 | |
|
|
|
|
|
|
|
|
Personal Products — 1.2% | | | | | | | |
The Estée Lauder Cos., Inc., Class A | | | 138,000 | | | 8,952,060 | |
|
|
|
|
|
|
|
|
Tobacco — 3.9% | | | | | | | |
Lorillard, Inc. | | | 118,000 | | | 8,878,320 | |
Philip Morris International, Inc. | | | 396,000 | | | 20,655,360 | |
| | | | |
|
|
|
| | | | | | 29,533,680 | |
|
|
|
|
|
|
|
|
Total Consumer Staples | | | | | | 83,859,630 | |
|
|
|
|
|
|
|
|
Energy — 6.2% | | | | | | | |
Energy Equipment & Services — 5.1% | | | | | | | |
Atwood Oceanics, Inc. (a) | | | 217,000 | | | 7,514,710 | |
FMC Technologies, Inc. (a) | | | 139,000 | | | 8,983,570 | |
Oceaneering International, Inc. (a) | | | 121,000 | | | 7,682,290 | |
Rowan Cos., Inc. (a) | | | 265,000 | | | 7,714,150 | |
Tidewater, Inc. | | | 130,000 | | | 6,145,100 | |
| | | | |
|
|
|
| | | | | | 38,039,820 | |
|
|
|
|
|
|
|
|
Oil, Gas & Consumable Fuels — 1.1% | | | | | | | |
Peabody Energy Corp. | | | 181,000 | | | 8,271,700 | |
|
|
|
|
|
|
|
|
Total Energy | | | | | | 46,311,520 | |
|
|
|
|
|
|
|
|
Financials — 0.3% | | | | | | | |
Insurance — 0.3% | | | | | | | |
Endurance Specialty Holdings Ltd. | | | 61,000 | | | 2,266,150 | |
|
|
|
|
|
|
|
|
Total Financials | | | | | | 2,266,150 | |
|
|
|
|
|
|
|
|
| | | | | | | |
Common Stocks | | Shares | | Value | |
|
|
|
|
|
|
|
|
Health Care — 22.6% | | | | | | | |
Biotechnology — 2.1% | | | | | | | |
Amgen, Inc. (a) | | | 260,000 | | $ | 15,537,600 | |
|
|
|
|
|
|
|
|
Health Care Equipment & Supplies — 2.3% | | | | | | | |
Hospira, Inc. (a) | | | 162,000 | | | 9,177,300 | |
Kinetic Concepts, Inc. (a) | | | 151,000 | | | 7,219,310 | |
Teleflex, Inc. | | | 13,000 | | | 832,910 | |
| | | | |
|
|
|
| | | | | | 17,229,520 | |
|
|
|
|
|
|
|
|
Health Care Providers & Services — 15.2% | | | | | | | |
Aetna, Inc. | | | 225,000 | | | 7,899,750 | |
AmerisourceBergen Corp. | | | 297,000 | | | 8,589,240 | |
Community Health Systems, Inc. (a) | | | 208,000 | | | 7,681,440 | |
Coventry Health Care, Inc. (a) | | | 287,000 | | | 7,094,640 | |
Health Management Associates, Inc., Class A (a) | | | 898,000 | | | 7,722,800 | |
Humana, Inc. (a) | | | 167,000 | | | 7,810,590 | |
Laboratory Corp. of America Holdings (a) | | | 105,000 | | | 7,949,550 | |
Lincare Holdings, Inc. (a) | | | 186,000 | | | 8,347,680 | |
McKesson Corp. | | | 141,000 | | | 9,266,520 | |
Medco Health Solutions, Inc. (a) | | | 179,000 | | | 11,556,240 | |
Omnicare, Inc. | | | 190,000 | | | 5,375,100 | |
Quest Diagnostics, Inc. | | | 148,000 | | | 8,626,920 | |
Tenet Healthcare Corp. (a) | | | 254,000 | | | 1,452,880 | |
UnitedHealth Group, Inc. | | | 210,000 | | | 6,860,700 | |
WellPoint, Inc. (a) | | | 127,000 | | | 8,176,260 | |
| | | | |
|
|
|
| | | | | | 114,410,310 | |
|
|
|
|
|
|
|
|
Pharmaceuticals — 3.0% | | | | | | | |
Endo Pharmaceuticals Holdings, Inc. (a)(b) | | | 172,000 | | | 4,074,680 | |
Forest Laboratories, Inc. (a) | | | 234,000 | | | 7,338,240 | |
Johnson & Johnson | | | 47,000 | | | 3,064,400 | |
Perrigo Co. | | | 142,000 | | | 8,338,240 | |
| | | | |
|
|
|
| | | | | | 22,815,560 | |
|
|
|
|
|
|
|
|
Total Health Care | | | | | | 169,992,990 | |
|
|
|
|
|
|
|
|
Industrials — 12.2% | | | | | | | |
Aerospace & Defense — 2.8% | | | | | | | |
General Dynamics Corp. | | | 43,000 | | | 3,319,600 | |
Northrop Grumman Corp. | | | 125,000 | | | 8,196,250 | |
Raytheon Co. | | | 173,000 | | | 9,881,760 | |
| | | | |
|
|
|
| | | | | | 21,397,610 | |
|
|
|
|
|
|
|
|
Commercial Services & Supplies — 2.1% | | | | | | | |
Cintas Corp. | | | 268,000 | | | 7,528,120 | |
R.R. Donnelley & Sons Co. | | | 371,000 | | | 7,920,850 | |
| | | | |
|
|
|
| | | | | | 15,448,970 | |
|
|
|
|
|
|
|
|
Construction & Engineering — 2.2% | | | | | | | |
Fluor Corp. | | | 183,000 | | | 8,511,330 | |
URS Corp. (a) | | | 157,000 | | | 7,788,770 | |
| | | | |
|
|
|
| | | | | | 16,300,100 | |
|
|
|
|
|
|
|
|
Electrical Equipment — 2.0% | | | | | | | |
Hubbell, Inc., Class B | | | 147,000 | | | 7,413,210 | |
Thomas & Betts Corp. (a) | | | 192,000 | | | 7,534,080 | |
| | | | |
|
|
|
| | | | | | 14,947,290 | |
|
|
|
|
|
|
|
|
Industrial Conglomerates — 1.0% | | | | | | | |
Carlisle Cos., Inc. (b) | | | 206,000 | | | 7,848,600 | |
|
|
|
|
|
|
|
|
Machinery — 2.1% | | | | | | | |
Crane Co. | | | 39,000 | | | 1,384,500 | |
Harsco Corp. | | | 220,000 | | | 7,026,800 | |
Toro Co. (b) | | | 158,000 | | | 7,768,860 | |
| | | | |
|
|
|
| | | | | | 16,180,160 | |
|
|
|
|
|
|
|
|
Total Industrials | | | | | | 92,122,730 | |
|
|
|
|
|
|
|
|
| | |
See Notes to Financial Statements. | |
|
22 | BLACKROCK LARGE CAP SERIES FUNDS, INC. | MARCH 31, 2010 |
| |
|
|
| |
Schedule of Investments (continued) | Master Large Cap Growth Portfolio
(Percentages shown are based on Net Assets) |
| | | | | | | |
Common Stocks | | Shares | | Value | |
|
|
|
|
|
|
Information Technology — 25.8% | | | | | | | |
Communications Equipment — 0.6% | | | | | | | |
Cisco Systems, Inc. (a) | | | 181,000 | | $ | 4,711,430 | |
|
|
|
|
|
|
|
|
Computers & Peripherals — 4.5% | | | | | | | |
Apple, Inc. (a) | | | 51,000 | | | 11,981,430 | |
Dell, Inc. (a) | | | 421,000 | | | 6,319,210 | |
Seagate Technology Holdings (b) | | | 396,000 | | | 7,230,960 | |
Western Digital Corp. (a) | | | 209,000 | | | 8,148,910 | |
| | | | |
|
|
|
| | | | | | 33,680,510 | |
|
|
|
|
|
|
|
|
Electronic Equipment, Instruments & Components — 1.0% | | | | | | | |
Tech Data Corp. (a) | | | 169,000 | | | 7,081,100 | |
|
|
|
|
|
|
|
|
IT Services — 11.3% | | | | | | | |
Amdocs Ltd. (a) | | | 252,000 | | | 7,587,720 | |
Automatic Data Processing, Inc. | | | 233,000 | | | 10,361,510 | |
DST Systems, Inc. | | | 136,000 | | | 5,637,200 | |
Fiserv, Inc. (a) | | | 167,000 | | | 8,476,920 | |
Global Payments, Inc. (b) | | | 180,000 | | | 8,199,000 | |
Hewitt Associates, Inc., Class A (a) | | | 193,000 | | | 7,677,540 | |
International Business Machines Corp. | | | 226,000 | | | 28,984,500 | |
NeuStar, Inc., Class A (a) | | | 317,000 | | | 7,988,400 | |
| | | | |
|
|
|
| | | | | | 84,912,790 | |
|
|
|
|
|
|
|
|
Internet Software & Services — 1.4% | | | | | | | |
Google, Inc., Class A (a) | | | 4,000 | | | 2,268,040 | |
VeriSign, Inc. (a)(b) | | | 315,000 | | | 8,193,150 | |
| | | | |
|
|
|
| | | | | | 10,461,190 | |
|
|
|
|
|
|
|
|
Software — 7.0% | | | | | | | |
CA, Inc. | | | 350,000 | | | 8,214,500 | |
Microsoft Corp. | | | 1,258,000 | | | 36,821,660 | |
Sybase, Inc. (a)(b) | | | 167,000 | | | 7,785,540 | |
| | | | |
|
|
|
| | | | | | 52,821,700 | |
|
|
|
|
|
|
|
|
Total Information Technology | | | | | | 193,668,720 | |
|
|
|
|
|
|
|
|
Materials — 8.5% | | | | | | | |
Chemicals — 4.9% | | | | | | | |
Ashland, Inc. | | | 148,000 | | | 7,809,960 | |
Celanese Corp., Series A | | | 148,000 | | | 4,713,800 | |
Lubrizol Corp. | | | 89,000 | | | 8,163,080 | |
Nalco Holding Co. | | | 334,000 | | | 8,126,220 | |
RPM International, Inc. | | | 382,000 | | | 8,151,880 | |
| | | | |
|
|
|
| | | | | | 36,964,940 | |
|
|
|
|
|
|
|
|
Containers & Packaging — 1.1% | | | | | | | |
Crown Holdings, Inc. (a) | | | 300,000 | | | 8,088,000 | |
|
|
|
|
|
|
|
|
Metals & Mining — 2.5% | | | | | | | |
Freeport-McMoRan Copper & Gold, Inc., Class B | | | 122,000 | | | 10,191,880 | |
Walter Industries, Inc. (b) | | | 92,000 | | | 8,488,840 | |
| | | | |
|
|
|
| | | | | | 18,680,720 | |
|
|
|
|
|
|
|
|
Total Materials | | | | | | 63,733,660 | |
|
|
|
|
|
|
|
|
| | | | | | | |
Common Stocks | | Shares | | Value | |
|
|
|
|
|
|
Utilities — 2.6% | | | | | | | |
Electric Utilities — 0.4% | | | | | | | |
NV Energy, Inc. | | | 252,000 | | $ | 3,107,160 | |
|
|
|
|
|
|
|
|
Independent Power Producers & Energy Traders — 1.1% | | | | | | | |
Constellation Energy Group, Inc. | | | 231,000 | | | 8,110,410 | |
|
|
|
|
|
|
|
|
Multi-Utilities — 1.1% | | | | | | | |
Integrys Energy Group, Inc. (b) | | | 172,000 | | | 8,149,360 | |
|
|
|
|
|
|
|
|
Total Utilities | | | | | | 19,366,930 | |
|
|
|
|
|
|
|
|
Total Long-Term Investments
(Cost — $631,523,964) — 99.3% | | | | | | 746,332,840 | |
|
|
|
|
|
|
|
|
| | | | | | | |
|
|
|
|
|
|
|
|
|
Short-Term Securities | | Beneficial
Interest
(000) | | | | |
|
|
|
|
|
|
|
|
BlackRock Liquidity Series, LLC,
Money Market Series, 0.22% (c)(d)(e) | | $ | 49,514 | | | 49,514,400 | |
|
|
|
|
|
|
|
|
Total Short-Term Securities
(Cost — $49,514,400) — 6.6% | | | | | | 49,514,400 | |
|
|
|
|
|
|
|
|
Total Investments (Cost — $681,038,364*) — 105.9% | | | | | | 795,847,240 | |
Liabilities in Excess of Other Assets — (5.9)% | | | | | | (44,124,502 | ) |
| | | | |
|
|
|
Net Assets — 100.0% | | | | | $ | 751,722,738 | |
| | | | |
|
|
|
|
|
* | The cost and unrealized appreciation (depreciation) of investments as of March 31, 2010, as computed for federal income tax purposes, were as follows: |
| | | | |
Aggregate cost | | $ | 697,638,462 | |
| |
|
|
|
Gross unrealized appreciation | | $ | 100,441,805 | |
Gross unrealized depreciation | | | (2,233,027 | ) |
| |
|
|
|
Net unrealized appreciation | | $ | 98,208,778 | |
| |
|
|
|
| |
(a) | Non-income producing security. |
| |
(b) | Security, or a portion of security, is on loan. |
| |
(c) | Investments in companies considered to be an affiliate of the Portfolio, for purposes of Section 2(a)(3) of the Investment Company Act of 1940, were as follows: |
| | | | | | | |
|
|
|
|
|
|
Affiliate | | Net
Activity | | Income | |
|
|
|
|
|
|
BlackRock Liquidity Fund, TempFund, Institutional Class | | | — | | $ | 148 | |
BlackRock Liquidity Series, LLC, Money Market Series | | $ | 34,065,900 | | $ | 19,996 | |
|
|
|
|
|
|
|
|
| |
(d) | Security was purchased with the cash collateral from loaned securities. |
| |
(e) | Represents the current yield as of report date. |
| |
• | For Portfolio compliance purposes, the Portfolio’s industry classifications refer to any one or more of the industry sub-classifications used by one or more widely recognized market indexes or rating group indexes, and/or as defined by Portfolio management. This definition may not apply for purposes of this report, which may combine such industry sub-classifications for reporting ease. |
| | |
See Notes to Financial Statements. | | |
|
|
|
BLACKROCK LARGE CAP SERIES FUNDS, INC. | MARCH 31, 2010 | 23 |
| |
|
|
| |
Schedule of Investments (concluded) | Master Large Cap Growth Portfolio |
| | |
• | Fair Value Measurements — Various inputs are used in determining the fair value of investments, which are as follows: |
| |
| • | Level 1 — price quotations in active markets/exchanges for identical assets and liabilities |
| | |
| • | Level 2 — other observable inputs (including, but not limited to: quoted prices for similar assets or liabilities in markets that are active, quoted prices for identical or similar assets or liabilities in markets that are not active, inputs other than quoted prices that are observable for the assets or liabilities (such as interest rates, yield curves, volatilities, prepayment speeds, loss severities, credit risks and default rates) or other market-corroborated inputs) |
| | |
| • | Level 3 — unobservable inputs based on the best information available In the circumstances, to the extent observable inputs are not available (including the Portfolio’s own assumptions used in determining the fair value of investments) |
| | |
| The inputs or methodologies used for valuing securities are not necessarily an indication of the risk associated with investing in those securities. For information about the Portfolio’s policy regarding valuation of investments and other significant accounting policies, please refer to Note 1 of the Notes to Financial Statements. |
| |
| The following table summarizes the inputs used as of March 31, 2010 in determining the fair valuation of the Portfolio’s investments: |
| | | | | | | | | | | | | |
|
|
|
|
| | Investments in Securities | |
|
|
|
|
Valuation Inputs | | Level 1 | | Level 2 | | Level 3 | | Total | |
|
|
|
|
|
|
|
|
|
|
|
|
|
|
Assets: | | | | | | | | | | | | | |
Long-Term Investments1 | | $ | 746,332,840 | | | — | | | — | | $ | 746,332,840 | |
Short-Term Securities | | | — | | $ | 49,514,400 | | | — | | $ | 49,514,400 | |
| |
|
|
|
|
|
|
|
|
|
|
|
|
Total | | $ | 746,332,840 | | $ | 49,514,400 | | | — | | $ | 795,847,240 | |
| |
|
|
|
|
|
|
|
|
|
|
|
|
| | | |
| | 1 | See above Schedule of Investments for values in each industry. |
| | |
See Notes to Financial Statements. | |
|
24 | BLACKROCK LARGE CAP SERIES FUNDS, INC. | MARCH 31, 2010 |
| |
|
|
| |
Schedule of Investments March 31, 2010 (Unaudited) | Master Large Cap Value Portfolio |
| (Percentages shown are based on Net Assets) |
| | | | | | | |
Common Stocks | | | Shares | | | Value | |
|
|
|
|
|
|
|
|
Consumer Discretionary — 4.5% | | | | | | | |
Internet & Catalog Retail — 0.1% | | | | | | | |
Liberty Media Holding Corp. — Interactive (a) | | | 160,000 | | $ | 2,449,600 | |
|
|
|
|
|
|
|
|
Multiline Retail — 2.2% | | | | | | | |
Big Lots, Inc. (a) | | | 740,000 | | | 26,950,800 | |
Macy’s, Inc. | | | 1,380,000 | | | 30,042,600 | |
| | | | |
|
|
|
| | | | | | 56,993,400 | |
|
|
|
|
|
|
|
|
Specialty Retail — 2.2% | | | | | | | |
AutoNation, Inc. (a)(b) | | | 580,000 | | | 10,486,400 | |
The Gap, Inc. (b) | | | 320,000 | | | 7,395,200 | |
Limited Brands, Inc. (b) | | | 1,120,000 | | | 27,574,400 | |
Signet Jewelers Ltd. | | | 340,000 | | | 10,995,600 | |
| | | | |
|
|
|
| | | | | | 56,451,600 | |
|
|
|
|
|
|
|
|
Total Consumer Discretionary | | | | | | 115,894,600 | |
|
|
|
|
|
|
|
|
Consumer Staples — 5.8% | | | | | | | |
Food Products — 3.7% | | | | | | | |
ConAgra Foods, Inc. | | | 1,160,000 | | | 29,081,200 | |
Del Monte Foods Co. | | | 1,940,000 | | | 28,324,000 | |
General Mills, Inc. | | | 90,000 | | | 6,371,100 | |
The Hershey Co. | | | 30,000 | | | 1,284,300 | |
Sara Lee Corp. | | | 2,080,000 | | | 28,974,400 | |
| | | | |
|
|
|
| | | | | | 94,035,000 | |
|
|
|
|
|
|
|
|
Tobacco — 2.1% | | | | | | | |
Lorillard, Inc. | | | 350,000 | | | 26,334,000 | |
Reynolds American, Inc. (b) | | | 530,000 | | | 28,609,400 | |
| | | | |
|
|
|
| | | | | | 54,943,400 | |
|
|
|
|
|
|
|
|
Total Consumer Staples | | | | | | 148,978,400 | |
|
|
|
|
|
|
|
|
Energy — 17.1% | | | | | | | |
Energy Equipment & Services — 6.1% | | | | | | | |
Atwood Oceanics, Inc. (a)(b) | | | 700,000 | | | 24,241,000 | |
National Oilwell Varco, Inc. | | | 780,000 | | | 31,652,400 | |
Oil States International, Inc. (a) | | | 580,000 | | | 26,297,200 | |
Rowan Cos., Inc. (a) | | | 960,000 | | | 27,945,600 | |
SEACOR Holdings, Inc. (a) | | | 230,000 | | | 18,551,800 | |
Tidewater, Inc. | | | 570,000 | | | 26,943,900 | |
| | | | |
|
|
|
| | | | | | 155,631,900 | |
|
|
|
|
|
|
|
|
Oil, Gas & Consumable Fuels — 11.0% | | | | | | | |
Chevron Corp. | | | 330,000 | | | 25,023,900 | |
ConocoPhillips | | | 1,200,000 | | | 61,404,000 | |
Exxon Mobil Corp. | | | 860,000 | | | 57,602,800 | |
Marathon Oil Corp. | | | 1,130,000 | | | 35,753,200 | |
Overseas Shipholding Group, Inc. (b) | | | 220,000 | | | 8,630,600 | |
Southern Union Co. | | | 1,000,000 | | | 25,370,000 | |
Williams Cos., Inc. | | | 1,400,000 | | | 32,340,000 | |
XTO Energy, Inc. | | | 800,000 | | | 37,744,000 | |
| | | | |
|
|
|
| | | | | | 283,868,500 | |
|
|
|
|
|
|
|
|
Total Energy | | | | | | 439,500,400 | |
|
|
|
|
|
|
|
|
| | | | | | | |
Common Stocks | | Shares | | Value | |
|
|
|
|
|
|
|
|
Financials — 15.7% | | | | | | | |
Capital Markets — 2.4% | | | | | | | |
The Goldman Sachs Group, Inc. | | | 360,000 | | $ | 61,426,800 | |
|
|
|
|
|
|
|
|
Commercial Banks — 0.4% | | | | | | | |
Wells Fargo & Co. | | | 320,000 | | | 9,958,400 | |
|
|
|
|
|
|
|
|
Consumer Finance — 1.8% | | | | | | | |
AmeriCredit Corp. (a)(b) | | | 600,000 | | | 14,256,000 | |
Capital One Financial Corp. | | | 770,000 | | | 31,885,700 | |
| | | | |
|
|
|
| | | | | | 46,141,700 | |
|
|
|
|
|
|
|
|
Diversified Financial Services — 2.0% | | | | | | | |
Bank of America Corp. | | | 1,560,000 | | | 27,846,000 | |
JPMorgan Chase & Co. | | | 530,000 | | | 23,717,500 | |
| | | | |
|
|
|
| | | | | | 51,563,500 | |
|
|
|
|
|
|
|
|
Insurance — 9.1% | | | | | | | |
Allied World Assurance Holdings Ltd. | | | 300,000 | | | 13,455,000 | |
American Financial Group, Inc. | | | 1,010,000 | | | 28,734,500 | |
Assurant, Inc. | | | 840,000 | | | 28,879,200 | |
Endurance Specialty Holdings Ltd. | | | 510,000 | | | 18,946,500 | |
Everest Re Group Ltd. | | | 180,000 | | | 14,567,400 | |
HCC Insurance Holdings, Inc. | | | 930,000 | | | 25,668,000 | |
Lincoln National Corp. | | | 90,000 | | | 2,763,000 | |
Loews Corp. | | | 600,000 | | | 22,368,000 | |
RenaissanceRe Holdings Ltd. | | | 280,000 | | | 15,892,800 | |
The Travelers Cos., Inc. | | | 700,000 | | | 37,758,000 | |
Unitrin, Inc. | | | 120,000 | | | 3,366,000 | |
UnumProvident Corp. | | | 900,000 | | | 22,293,000 | |
| | | | |
|
|
|
| | | | | | 234,691,400 | |
|
|
|
|
|
|
|
|
Total Financials | | | | | | 403,781,800 | |
|
|
|
|
|
|
|
|
Health Care — 15.1% | | | | | | | |
Biotechnology — 0.9% | | | | | | | |
Amgen, Inc. (a) | | | 410,000 | | | 24,501,600 | |
|
|
|
|
|
|
|
|
Health Care Equipment & Supplies — 1.1% | | | | | | | |
Kinetic Concepts, Inc. (a)(b) | | | 570,000 | | | 27,251,700 | |
|
|
|
|
|
|
|
|
Health Care Providers & Services — 10.4% | | | | | | | |
AmerisourceBergen Corp. | | | 940,000 | | | 27,184,800 | |
Cardinal Health, Inc. | | | 920,000 | | | 33,147,600 | |
Community Health Systems, Inc. (a) | | | 700,000 | | | 25,851,000 | |
Coventry Health Care, Inc. (a) | | | 1,090,000 | | | 26,944,800 | |
Humana, Inc. (a) | | | 600,000 | | | 28,062,000 | |
Lincare Holdings, Inc. (a) | | | 320,000 | | | 14,361,600 | |
McKesson Corp. | | | 450,000 | | | 29,574,000 | |
UnitedHealth Group, Inc. | | | 1,330,000 | | | 43,451,100 | |
WellPoint, Inc. (a) | | | 620,000 | | | 39,915,600 | |
| | | | |
|
|
|
| | | | | | 268,492,500 | |
|
|
|
|
|
|
|
|
Pharmaceuticals — 2.7% | | | | | | | |
Endo Pharmaceuticals Holdings, Inc. (a) | | | 1,130,000 | | | 26,769,700 | |
Forest Laboratories, Inc. (a) | | | 990,000 | | | 31,046,400 | |
Pfizer, Inc. | | | 670,000 | | | 11,490,500 | |
| | | | |
|
|
|
| | | | | | 69,306,600 | |
|
|
|
|
|
|
|
|
Total Health Care | | | | | | 389,552,400 | |
|
|
|
|
|
|
|
|
| | |
See Notes to Financial Statements. | | |
|
|
|
BLACKROCK LARGE CAP SERIES FUNDS, INC. | MARCH 31, 2010 | 25 |
| |
|
|
| |
Schedule of Investments (continued) | Master Large Cap Value Portfolio |
| (Percentages shown are based on Net Assets) |
| | | | | | | |
Common Stocks | | Shares | | Value | |
|
|
|
|
|
|
|
|
Industrials — 12.7% | | | | | | | |
Aerospace & Defense — 3.4% | | | | | | | |
L-3 Communications Holdings, Inc. | | | 330,000 | | $ | 30,237,900 | |
Northrop Grumman Corp. (b) | | | 510,000 | | | 33,440,700 | |
Raytheon Co. | | | 440,000 | | | 25,132,800 | |
| | | | |
|
|
|
| | | | | | 88,811,400 | |
|
|
|
|
|
|
|
|
Commercial Services & Supplies — 1.1% | | | | | | | |
R.R. Donnelley & Sons Co. | | | 1,340,000 | | | 28,609,000 | |
|
|
|
|
|
|
|
|
Construction & Engineering — 0.1% | | | | | | | |
URS Corp. (a) | | | 70,000 | | | 3,472,700 | |
|
|
|
|
|
|
|
|
Electrical Equipment — 0.9% | | | | | | | |
Hubbell, Inc., Class B | | | 100,000 | | | 5,043,000 | |
Thomas & Betts Corp. (a) | | | 440,000 | | | 17,265,600 | |
| | | | |
|
|
|
| | | | | | 22,308,600 | |
|
|
|
|
|
|
|
|
Industrial Conglomerates — 1.8% | | | | | | | |
Carlisle Cos., Inc. | | | 290,000 | | | 11,049,000 | |
General Electric Co. | | | 1,930,000 | | | 35,126,000 | |
| | | | |
|
|
|
| | | | | | 46,175,000 | |
|
|
|
|
|
|
|
|
Machinery — 4.6% | | | | | | | |
Eaton Corp. | | | 440,000 | | | 33,338,800 | |
Harsco Corp. | | | 140,000 | | | 4,471,600 | |
Parker Hannifin Corp. | | | 460,000 | | | 29,780,400 | |
SPX Corp. | | | 380,000 | | | 25,201,600 | |
Timken Co. | | | 830,000 | | | 24,908,300 | |
| | | | |
|
|
|
| | | | | | 117,700,700 | |
|
|
|
|
|
|
|
|
Road & Rail — 0.8% | | | | | | | |
Ryder System, Inc. | | | 510,000 | | | 19,767,600 | |
|
|
|
|
|
|
|
|
Total Industrials | | | | | | 326,845,000 | |
|
|
|
|
|
|
|
|
Information Technology — 6.5% | | | | | | | |
Computers & Peripherals — 2.1% | | | | | | | |
Lexmark International, Inc., Class A (a) | | | 790,000 | | | 28,503,200 | |
Western Digital Corp. (a) | | | 630,000 | | | 24,563,700 | |
| | | | |
|
|
|
| | | | | | 53,066,900 | |
|
|
|
|
|
|
|
|
Electronic Equipment, Instruments & Components — 1.0% | | | | | | | |
Tech Data Corp. (a) | | | 620,000 | | | 25,978,000 | |
|
|
|
|
|
|
|
|
IT Services — 2.4% | | | | | | | |
Amdocs Ltd. (a) | | | 850,000 | | | 25,593,500 | |
Computer Sciences Corp. (a) | | | 550,000 | | | 29,969,500 | |
DST Systems, Inc. (b) | | | 180,000 | | | 7,461,000 | |
| | | | |
|
|
|
| | | | | | 63,024,000 | |
|
|
|
|
|
|
|
|
Software — 1.0% | | | | | | | |
CA, Inc. | | | 1,100,000 | | | 25,817,000 | |
|
|
|
|
|
|
|
|
Total Information Technology | | | | | | 167,885,900 | |
|
|
|
|
|
|
|
|
Materials — 12.0% | | | | | | | |
Chemicals — 7.4% | | | | | | | |
Ashland, Inc. | | | 540,000 | | | 28,495,800 | |
Cabot Corp. | | | 560,000 | | | 17,024,000 | |
Cytec Industries, Inc. | | | 440,000 | | | 20,565,600 | |
Eastman Chemical Co. | | | 430,000 | | | 27,382,400 | |
Huntsman Corp. | | | 2,170,000 | | | 26,148,500 | |
Lubrizol Corp. | | | 300,000 | | | 27,516,000 | |
PPG Industries, Inc. | | | 460,000 | | | 30,084,000 | |
RPM International, Inc. | | | 610,000 | | | 13,017,400 | |
| | | | |
|
|
|
| | | | | | 190,233,700 | |
|
|
|
|
|
|
|
|
| | | | | | | |
Common Stocks | | Shares | | Value | |
|
|
|
|
|
|
|
|
Materials (concluded) | | | | | | | |
Containers & Packaging — 1.0% | | | | | | | |
Bemis Co. | | | 560,000 | | $ | 16,083,200 | |
Sealed Air Corp. | | | 400,000 | | | 8,432,000 | |
| | | | |
|
|
|
| | | | | | 24,515,200 | |
|
|
|
|
|
|
|
|
Metals & Mining — 1.3% | | | | | | | |
Freeport-McMoRan Copper & Gold, Inc., Class B (b) | | | 410,000 | | | 34,251,400 | |
|
|
|
|
|
|
|
|
Paper & Forest Products — 2.3% | | | | | | | |
International Paper Co. | | | 1,220,000 | | | 30,024,200 | |
MeadWestvaco Corp. | | | 1,160,000 | | | 29,638,000 | |
| | | | |
|
|
|
| | | | | | 59,662,200 | |
|
|
|
|
|
|
|
|
Total Materials | | | | | | 308,662,500 | |
|
|
|
|
|
|
|
|
Telecommunication Services — 3.6% | | | | | | | |
Diversified Telecommunication Services — 3.3% | | | | | | | |
AT&T Inc. | | | 710,000 | | | 18,346,400 | |
Verizon Communications, Inc. (b) | | | 2,100,000 | | | 65,142,000 | |
| | | | |
|
|
|
| | | | | | 83,488,400 | |
|
|
|
|
|
|
|
|
Wireless Telecommunication Services — 0.3% | | | | | | | |
Telephone & Data Systems, Inc. | | | 250,000 | | | 8,462,500 | |
|
|
|
|
|
|
|
|
Total Telecommunication Services | | | | | | 91,950,900 | |
|
|
|
|
|
|
|
|
Utilities — 7.1% | | | | | | | |
Electric Utilities — 0.8% | | | | | | | |
Edison International | | | 600,000 | | | 20,502,000 | |
|
|
|
|
|
|
|
|
Gas Utilities — 1.4% | | | | | | | |
Atmos Energy Corp. | | | 450,000 | | | 12,856,500 | |
Oneok, Inc. | | | 60,000 | | | 2,739,000 | |
UGI Corp. | | | 730,000 | | | 19,374,200 | |
| | | | |
|
|
|
| | | | | | 34,969,700 | |
|
|
|
|
|
|
|
|
Independent Power Producers & Energy | | | | | | | |
Traders — 2.7% | | | | | | | |
Constellation Energy Group, Inc. | | | 740,000 | | | 25,981,400 | |
Mirant Corp. (a) | | | 1,710,000 | | | 18,570,600 | |
NRG Energy, Inc. (a)(b) | | | 1,130,000 | | | 23,617,000 | |
| | | | |
|
|
|
| | | | | | 68,169,000 | |
|
|
|
|
|
|
|
|
Multi-Utilities — 2.2% | | | | | | | |
DTE Energy Co. (b) | | | 660,000 | | | 29,436,000 | |
NiSource, Inc. (b) | | | 1,790,000 | | | 28,282,000 | |
| | | | |
|
|
|
| | | | | | 57,718,000 | |
|
|
|
|
|
|
|
|
Total Utilities | | | | | | 181,358,700 | |
|
|
|
|
|
|
|
|
Total Long-Term Investments
(Cost — $2,150,573,906) — 100.1% | | | | | | 2,574,410,600 | |
|
|
|
|
|
|
|
|
| | |
See Notes to Financial Statements. |
|
26 | BLACKROCK LARGE CAP SERIES FUNDS, INC. | MARCH 31, 2010 |
| |
|
|
| |
Schedule of Investments (concluded) | Master Large Cap Value Portfolio |
| (Percentages shown are based on Net Assets) |
| | | | | | | |
Short-Term Securities | | Beneficial
Interest
(000) | | Value | |
|
|
|
|
|
|
BlackRock Liquidity Series, LLC,
Money Market Series, 0.22% (c)(d)(e) | | $ | 204,527 | | $ | 204,526,650 | |
|
|
|
|
|
|
|
|
Total Short-Term Securities
(Cost — $204,526,650) — 8.0% | | | | | | 204,526,650 | |
|
|
|
|
|
|
|
|
Total Investments (Cost — $2,355,100,556*) — 108.1% | | | | | | 2,778,937,250 | |
Liabilities in Excess of Other Assets — (8.1)% | | | | | | (208,240,531 | ) |
| | | | |
|
|
|
Net Assets — 100.0% | | | | | $ | 2,570,696,719 | |
| | | | |
|
|
|
|
|
| |
* | The cost and unrealized appreciation (depreciation) of investments as of March 31, 2010, as computed for federal income tax purposes, were as follows: |
| | | | | | | |
Aggregate cost | | | | | $ | 2,557,598,217 | |
| | | | |
|
|
|
Gross unrealized appreciation | | | | | $ | 249,601,644 | |
Gross unrealized depreciation | | | | | | (28,262,611 | ) |
| | | | |
|
|
|
Net unrealized appreciation | | | | | $ | 221,339,033 | |
| | | | |
|
|
|
| |
(a) | Non-income producing security. |
| |
(b) | Security, or a portion of security, is on loan. |
| |
(c) | Investments in companies considered to be an affiliate of the Portfolio, for purposes of Section 2(a)(3) of the Investment Company Act of 1940, were as follows: |
| | | | | | | |
|
|
|
|
|
|
Affiliate | | Net
Activity | | Income | |
|
|
|
|
|
|
BlackRock Liquidity Funds, TempFund, Institutional Class | | | — | | $ | 608 | |
BlackRock Liquidity Series, LLC, Money Market Series | | $ | 148,788,500 | | $ | 44,920 | |
|
|
|
|
|
|
|
|
| | |
(d) | Represents the current yield as of report date. |
| |
(e) | Security was purchased with the cash collateral from loaned securities. |
| |
• | For Portfolio compliance purposes, the Portfolio’s sector and industry classifications refer to any one or more of the sector and industry sub-classifications used by one or more widely recognized market indexes or rating group indexes, and/or as defined by Portfolio management. This definition may not apply for purposes of this report, which may combine such industry sub-classifications for reporting ease. |
| |
• | Fair Value Measurements — Various inputs are used in determining the fair value of investments, which are as follows: |
| |
| • | Level 1 — price quotations in active markets/exchanges for identical assets and liabilities |
| | |
| • | Level 2 — other observable inputs (including, but not limited to: quoted prices for similar assets or liabilities in markets that are active, quoted prices for identical or similar assets or liabilities in markets that are not active, inputs other than quoted prices that are observable for the assets or liabilities (such as interest rates, yield curves, volatilities, prepayment speeds, loss severities, credit risks and default rates) or other market-corroborated inputs) |
| | |
| • | Level 3 — unobservable inputs based on the best information available in the circumstances, to the extent observable inputs are not available (including the Portfolio’s own assumptions used in determining the fair value of investments) |
| | |
| The inputs or methodologies used for valuing securities are not necessarily an indication of the risk associated with investing in those securities. For information about the Portfolio’s policy regarding valuation of investments and other significant accounting policies, please refer to Note 1 of the Notes to Financial Statements. |
| |
| The following table summarizes the inputs used as of March 31, 2010 in determining the fair valuation of the Portfolio’s investments: |
| | | | | | | | | | | | | |
|
|
|
|
| | Investments in Securities | |
|
|
|
|
Valuation Inputs | | Level 1 | | Level 2 | | Level 3 | | Total | |
|
|
|
|
|
|
|
|
|
|
Assets: | | | | | | | | | | | | | |
Long-Term Investments1 | | $ | 2,574,410,600 | | | — | | | — | | $ | 2,574,410,600 | |
Short-Term Securities | | | — | | $ | 204,526,650 | | | — | | | 204,526,650 | |
| |
|
|
|
|
|
|
|
|
|
|
|
|
Total | | $ | 2,574,410,600 | | $ | 204,526,650 | | | — | | $ | 2,778,937,250 | |
| |
|
|
|
|
|
|
|
|
|
|
|
|
| | |
| 1 | See above Schedule of Investments for values in each sector and industry. |
| | |
See Notes to Financial Statements. | | |
|
|
|
BLACKROCK LARGE CAP SERIES FUNDS, INC. | MARCH 31, 2010 | 27 |
| |
|
|
Statements of Assets and Liabilities | Master Large Cap Series LLC |
| | | | | | | | | | |
March 31, 2010 (Unaudited) | | Master Large
Cap Core
Portfolio | | Master Large
Cap Growth
Portfolio | | Master Large
Cap Value
Portfolio | |
|
|
|
|
|
|
|
|
|
|
|
Assets | | | | | | | | | | |
|
|
|
|
|
|
|
|
|
|
|
Investments at value — unaffiliated1,2 | | $ | 4,008,014,300 | | $ | 746,332,840 | | $ | 2,574,410,600 | |
Investments at value — affiliated3 | | | 284,432,850 | | | 49,514,400 | | | 204,526,650 | |
Investments sold receivable | | | 42,121,687 | | | 15,338,833 | | | 28,385,493 | |
Dividends receivable | | | 4,512,725 | | | 683,005 | | | 3,855,951 | |
Contributions receivable from investors | | | 3,730,128 | | | 5,092,526 | | | 374,354 | |
Securities lending income receivable — affiliated | | | 97,120 | | | 10,767 | | | 19,804 | |
Prepaid expenses | | | 77,788 | | | 17,280 | | | 77,439 | |
Other assets | | | 36,617 | | | 4,043 | | | 28,551 | |
| |
|
|
|
|
|
|
|
|
|
Total assets | | | 4,343,023,215 | | | 816,993,694 | | | 2,811,678,842 | |
| |
|
|
|
|
|
|
|
|
|
| | | | | | | | | | |
|
|
|
|
|
|
|
|
|
|
|
Liabilities | | | | | | | | | | |
|
|
|
|
|
|
|
|
|
|
|
Collateral at value — securities loaned | | | 284,432,850 | | | 49,514,400 | | | 204,526,650 | |
Bank overdraft | | | 7,408,729 | | | 2,885,848 | | | 6,901,772 | |
Withdrawals payable to investors | | | 30,961,664 | | | — | | | 6,424,373 | |
Investments purchased payable | | | 28,573,729 | | | 12,514,441 | | | 21,928,858 | |
Investment advisory fees payable | | | 1,565,992 | | | 313,481 | | | 1,091,233 | |
Other affiliates payable | | | 18,420 | | | 3,426 | | | 11,799 | |
Directors’ fees payable | | | 206 | | | 120 | | | 440 | |
Other accrued expenses payable | | | 99,764 | | | 39,102 | | | 96,265 | |
Other liabilities | | | 672 | | | 138 | | | 733 | |
| |
|
|
|
|
|
|
|
|
|
Total liabilities | | | 353,062,026 | | | 65,270,956 | | | 240,982,123 | |
| |
|
|
|
|
|
|
|
|
|
Net Assets | | $ | 3,989,961,189 | | $ | 751,722,738 | | $ | 2,570,696,719 | |
| |
|
|
|
|
|
|
|
|
|
| | | | | | | | | | |
|
|
|
|
|
|
|
|
|
|
|
Net Assets Consist of | | | | | | | | | | |
|
|
|
|
|
|
|
|
|
|
|
Investors’ capital | | $ | 3,328,825,802 | | $ | 636,913,862 | | $ | 2,146,860,025 | |
Net unrealized appreciation/depreciation | | | 661,135,387 | | | 114,808,876 | | | 423,836,694 | |
| |
|
|
|
|
|
|
|
|
|
Net Assets | | $ | 3,989,961,189 | | $ | 751,722,738 | | $ | 2,570,696,719 | |
| |
|
|
|
|
|
|
|
|
|
1 Investments at cost — unaffiliated | | $ | 3,346,878,913 | | $ | 631,523,964 | | $ | 2,150,573,906 | |
| |
|
|
|
|
|
|
|
|
|
2 Securities loaned at value | | $ | 274,877,149 | | $ | 48,156,803 | | $ | 196,493,785 | |
| |
|
|
|
|
|
|
|
|
|
3 Investments at cost — affiliated | | $ | 284,432,850 | | $ | 49,514,400 | | $ | 204,526,650 | |
| |
|
|
|
|
|
|
|
|
|
See Notes to Financial Statements.
| | |
|
28 | BLACKROCK LARGE CAP SERIES FUNDS, INC. | MARCH 31, 2010 |
| |
|
|
Statements of Operations | Master Large Cap Series LLC |
| | | | | | | | | | |
Six Months Ended March 31, 2010 (Unaudited) | | Master Large
Cap Core
Portfolio | | Master Large
Cap Growth
Portfolio | | Master Large
Cap Value
Portfolio | |
|
|
|
|
|
|
|
|
|
|
|
Investment Income | | | | | | | | | | |
|
|
|
|
|
|
|
|
|
|
|
Dividends | | $ | 33,956,931 | | $ | 4,910,773 | | $ | 26,123,390 | |
Securities lending — affiliated | | | 194,448 | | | 19,996 | | | 44,920 | |
Income — affiliated | | | 648 | | | 148 | | | 608 | |
Interest | | | 216,115 | | | 41,481 | | | 69 | |
| |
|
|
|
|
|
|
|
|
|
Total income | | | 34,368,142 | | | 4,972,398 | | | 26,168,987 | |
| |
|
|
|
|
|
|
|
|
|
| | | | | | | | | | |
|
|
|
|
|
|
|
|
|
|
|
Expenses | | | | | | | | | | |
|
|
|
|
|
|
|
|
|
|
|
Investment advisory | | | 9,096,377 | | | 1,818,452 | | | 6,408,141 | |
Accounting services | | | 309,016 | | | 142,848 | | | 268,506 | |
Custodian | | | 109,964 | | | 32,124 | | | 80,907 | |
Professional | | | 38,364 | | | 28,170 | | | 37,013 | |
Directors | | | 35,692 | | | 8,854 | | | 31,960 | |
Printing | | | 4,056 | | | 838 | | | 2,227 | |
Miscellaneous | | | 38,519 | | | 10,218 | | | 31,654 | |
| |
|
|
|
|
|
|
|
|
|
Total expenses | | | 9,631,988 | | | 2,041,504 | | | 6,860,408 | |
Less fees waived by advisor | | | (576 | ) | | (58 | ) | | (147 | ) |
| |
|
|
|
|
|
|
|
|
|
Total expenses after fees waived | | | 9,631,412 | | | 2,041,446 | | | 6,860,261 | |
| |
|
|
|
|
|
|
|
|
|
Net investment income | | | 24,736,730 | | | 2,930,952 | | | 19,308,726 | |
| |
|
|
|
|
|
|
|
|
|
| | | | | | | | | | |
|
|
|
|
|
|
|
|
|
|
|
Realized and Unrealized Gain (Loss) | | | | | | | | | | |
|
|
|
|
|
|
|
|
|
|
|
Net realized gain (loss) from: | | | | | | | | | | |
Investments | | | 294,755,230 | | | 78,127,695 | | | 185,523,055 | |
Payment by affiliate | | | 2,319,220 | | | 68,976 | | | — | |
| |
|
|
|
|
|
|
|
|
|
| | | 297,074,450 | | | 78,196,671 | | | 185,523,055 | |
| |
|
|
|
|
|
|
|
|
|
Net change in unrealized appreciation/depreciation on investments | | | 120,603,879 | | | 7,166,417 | | | 27,149,982 | |
| |
|
|
|
|
|
|
|
|
|
Total realized and unrealized gain (loss) | | | 417,678,329 | | | 85,363,088 | | | 212,673,037 | |
| |
|
|
|
|
|
|
|
|
|
Net Increase (Decrease) in Net Assets Resulting from Operations | | $ | 442,415,059 | | $ | 88,294,040 | | $ | 231,981,763 | |
| |
|
|
|
|
|
|
|
|
|
See Notes to Financial Statements.
| | |
|
BLACKROCK LARGE CAP SERIES FUNDS, INC. | MARCH 31, 2010 | 29 |
| |
|
| |
Statements of Changes in Net Assets | Master Large Cap Series LLC |
| | | | | | | | | | | | | | | | | | | |
| | Master Large Cap Core Portfolio | | Master Large Cap Growth Portfolio | |
| |
| |
|
|
Increase (Decrease) in Net Assets: | | Six Months
Ended
March 31,
2010
(Unaudited) | | Period
November 1,
2008 to
September 30,
2009 | | Year Ended
October 31,
2008 | | Six Months
Ended
March 31,
2010
(Unaudited) | | Period
November 1,
2008 to
September 30,
2009 | | Year Ended
October 31,
2008 | |
|
|
|
|
|
|
|
|
|
|
|
|
|
|
Operations | | | | | | | | | | | | | | | | | | | |
|
|
|
|
|
|
|
|
|
|
|
|
|
|
|
|
|
|
|
|
Net investment income | | $ | 24,736,730 | | $ | 45,398,506 | | $ | 41,118,548 | | $ | 2,930,952 | | $ | 4,690,392 | | $ | 5,455,044 | |
Net realized gain (loss) | | | 297,074,450 | | | (778,429,718 | ) | | (521,502,159 | ) | | 78,196,671 | | | (130,730,353 | ) | | (114,597,872 | ) |
Net change in unrealized appreciation/depreciation | | | 120,603,879 | | | 1,174,704,782 | | | (1,536,726,590 | ) | | 7,166,417 | | | 248,627,811 | | | (333,142,941 | ) |
| |
|
|
|
|
|
|
|
| |
|
|
|
|
|
|
|
|
|
Net increase (decrease) in net assets resulting from operations | | | 442,415,059 | | | 441,673,570 | | | (2,017,110,201 | ) | | 88,294,040 | | | 122,587,850 | | | (442,285,769 | ) |
| |
|
|
|
|
|
|
|
| |
|
|
|
|
|
|
|
|
|
| | | | | | | | | | | | | | | | | | | |
|
|
|
|
|
|
|
|
|
|
|
|
|
|
|
|
|
|
|
|
Capital Transactions | | | | | | | | | | | | | | | | | | | |
|
|
|
|
|
|
|
|
|
|
|
|
|
|
|
|
|
|
|
|
Proceeds from contributions | | | 211,327,919 | | | 1,506,405,011 | | | 986,366,566 | | | 82,746,983 | | | 215,325,909 | | | 469,632,427 | |
Value of withdrawals | | | (610,104,107 | ) | | (845,271,038 | ) | | (1,775,472,579 | ) | | (153,205,961 | ) | | (269,988,785 | ) | | (595,379,184 | ) |
| |
|
|
|
|
|
|
|
| |
|
|
|
|
|
|
|
|
|
Net increase (decrease) in net assets derived from capital transactions | | | (398,776,188 | ) | | 661,133,973 | | | (789,106,013 | ) | | (70,458,978 | ) | | (54,662,876 | ) | | (125,746,757 | ) |
| |
|
|
|
|
|
|
|
| |
|
|
|
|
|
|
|
|
|
| | | | | | | | | | | | | | | | | | | |
|
|
|
|
|
|
|
|
|
|
|
|
|
|
|
|
|
|
|
|
Net Assets | | | | | | | | | | | | | | | | | | | |
|
|
|
|
|
|
|
|
|
|
|
|
|
|
|
|
|
|
|
|
Total increase (decrease) in net assets | | | 43,638,871 | | | 1,102,807,543 | | | (2,806,216,214 | ) | | 17,835,062 | | | 67,924,974 | | | (568,032,526 | ) |
Beginning of period | | | 3,946,322,318 | | | 2,843,514,775 | | | 5,649,730,989 | | | 733,887,676 | | | 665,962,702 | | | 1,233,995,228 | |
| |
|
|
|
|
|
|
|
| |
|
|
|
|
|
|
|
|
|
End of period | | $ | 3,989,961,189 | | $ | 3,946,322,318 | | $ | 2,843,514,775 | | $ | 751,722,738 | | $ | 733,887,676 | | $ | 665,962,702 | |
| |
|
|
|
|
|
|
|
| |
|
|
|
|
|
|
|
|
|
|
Master Large Cap Series LLC |
| | | | | | | | | | |
| | Master Large Cap Value Portfolio | |
| |
|
|
Increase (Decrease) in Net Assets: | | Six Months
Ended
March 31,
2010
(Unaudited) | | Period
November 1,
2008 to
September 30,
2009 | | Year Ended
October 31,
2008 | |
|
|
|
|
|
|
|
|
Operations | | | | | | | | | | |
|
|
|
|
|
|
|
|
|
|
|
Net investment income | | $ | 19,308,726 | | $ | 44,699,454 | | $ | 56,250,234 | |
Net realized gain (loss) | | | 185,523,055 | | | (907,436,935 | ) | | (586,455,313 | ) |
Net change in unrealized appreciation/depreciation | | | 27,149,982 | | | 1,046,928,266 | | | (1,366,434,994 | ) |
| |
|
|
|
|
|
|
|
|
|
Net increase (decrease) in net assets resulting from operations | | | 231,981,763 | | | 184,190,785 | | | (1,896,640,073 | ) |
| |
|
|
|
|
|
|
|
|
|
| | | | | | | | | | |
|
|
|
|
|
|
|
|
|
|
|
Capital Transactions | | | | | | | | | | |
|
|
|
|
|
|
|
|
|
|
|
Proceeds from contributions | | | 282,572,624 | | | 812,993,042 | | | 1,889,127,025 | |
Value of withdrawals | | | (589,715,779 | ) | | (1,414,441,343 | ) | | (2,321,525,876 | ) |
| |
|
|
|
|
|
|
|
|
|
Net decrease in net assets derived from capital transactions | | | (307,143,155 | ) | | (601,448,301 | ) | | (432,398,851 | ) |
| |
|
|
|
|
|
|
|
|
|
| | | | | | | | | | |
|
|
|
|
|
|
|
|
|
|
|
Net Assets | | | | | | | | | | |
|
|
|
|
|
|
|
|
|
|
|
Total decrease in net assets | | | (75,161,392 | ) | | (417,257,516 | ) | | (2,329,038,924 | ) |
Beginning of period | | | 2,645,858,111 | | | 3,063,115,627 | | | 5,392,154,551 | |
| |
|
|
|
|
|
|
|
|
|
End of period | | $ | 2,570,696,719 | | $ | 2,645,858,111 | | $ | 3,063,115,627 | |
| |
|
|
|
|
|
|
|
|
|
| | |
See Notes to Financial Statements. |
|
|
|
30 | BLACKROCK LARGE CAP SERIES FUNDS, INC. | MARCH 31, 2010 |
| |
|
| |
Financial Highlights | Master Large Cap Series LLC |
| | | | | | | | | | | | | | | | | | | | | | |
| | Master Large Cap Core Portfolio | |
| |
|
|
| | Six Months
Ended
March 31,
2010
(Unaudited) | | Period
November 1,
2008 to
September 30,
2009 | | | | | | | | | | | |
| | | | | | | | | | | | | |
| | | | Year Ended October 31, | |
| | | |
|
|
| | | | 2008 | | 2007 | | 2006 | | 2005 | | 2004 | |
|
|
|
|
|
|
|
|
|
|
|
|
|
|
|
|
|
|
|
|
|
|
|
Total Investment Return | | | | | | | | | | | | | | | | | | | | | | |
|
|
|
|
|
|
|
|
|
|
|
|
|
|
|
|
|
|
|
|
|
|
|
Total investment return | | | 11.86 | %1 | | 12.63 | %1,2 | | (38.84 | )% | | 13.94 | % | | 17.32 | % | | 18.35 | % | | 9.61 | % |
| |
|
|
|
|
|
|
|
|
|
|
|
|
|
|
|
|
|
|
|
|
|
| | | | | | | | | | | | | | | | | | | | | | |
|
|
|
|
|
|
|
|
|
|
|
|
|
|
|
|
|
|
|
|
|
|
|
Ratios to Average Net Assets | | | | | | | | | | | | | | | | | | | | | | |
|
|
|
|
|
|
|
|
|
|
|
|
|
|
|
|
|
|
|
|
|
|
|
Total expenses | | | 0.49 | %3 | | 0.50 | %3 | | 0.50 | % | | 0.49 | % | | 0.49 | % | | 0.51 | % | | 0.52 | % |
| |
|
|
|
|
|
|
|
|
|
|
|
|
|
|
|
|
|
|
|
|
|
Total expenses after fees waived | | | 0.49 | %3 | | 0.50 | %3 | | 0.50 | % | | 0.49 | % | | 0.49 | % | | 0.51 | % | | 0.52 | % |
| |
|
|
|
|
|
|
|
|
|
|
|
|
|
|
|
|
|
|
|
|
|
Net investment income | | | 1.26 | %3 | | 1.56 | %3 | | 0.93 | % | | 0.63 | % | | 0.58 | % | | 0.72 | % | | 0.57 | % |
| |
|
|
|
|
|
|
|
|
|
|
|
|
|
|
|
|
|
|
|
|
|
| | | | | | | | | | | | | | | | | | | | | | |
|
|
|
|
|
|
|
|
|
|
|
|
|
|
|
|
|
|
|
|
|
|
|
Supplemental Data | | | | | | | | | | | | | | | | | | | | | | |
|
|
|
|
|
|
|
|
|
|
|
|
|
|
|
|
|
|
|
|
|
|
|
Net assets, end of period (000) | | $ | 3,989,961 | | $ | 3,946,423 | | $ | 2,843,515 | | $ | 5,649,731 | | $ | 3,876,639 | | $ | 2,666,699 | | $ | 1,831,300 | |
| |
|
|
|
|
|
|
|
|
|
|
|
|
|
|
|
|
|
|
|
|
|
Portfolio turnover | | | 73 | % | | 168 | % | | 109 | % | | 96 | % | | 88 | % | | 94 | % | | 136 | % |
| |
|
|
|
|
|
|
|
|
|
|
|
|
|
|
|
|
|
|
|
|
|
| | | | | | | | | | | | | | | | | | | | | | |
| | Master Large Cap Growth Portfolio | |
| |
|
|
| | Six Months
Ended
March 31,
2010
(Unaudited) | | Period
November 1,
2008 to
September 30,
2009 | | | | | | | | | | | |
| | | | | | | | | | | | | |
| | | | Year Ended October 31, | |
| | | |
|
|
| | | | 2008 | | 2007 | | 2006 | | 2005 | | 2004 | |
|
|
|
|
|
|
|
|
|
|
|
|
|
|
|
|
|
|
|
|
|
|
|
Total Investment Return | | | | | | | | | | | | | | | | | | | | | | |
|
|
|
|
|
|
|
|
|
|
|
|
|
|
|
|
|
|
|
|
|
|
|
Total investment return | | | 12.88 | %1 | | 20.49 | %1,4 | | (37.96 | )% | | 17.47 | % | | 14.05 | % | | 12.47 | % | | 5.42 | % |
| |
|
|
|
|
|
|
|
|
|
|
|
|
|
|
|
|
|
|
|
|
|
| | | | | | | | | | | | | | | | | | | | | | |
|
|
|
|
|
|
|
|
|
|
|
|
|
|
|
|
|
|
|
|
|
|
|
Ratios to Average Net Assets | | | | | | | | | | | | | | | | | | | | | | |
|
|
|
|
|
|
|
|
|
|
|
|
|
|
|
|
|
|
|
|
|
|
|
Total expenses | | | 0.56 | %3 | | 0.57 | %3 | | 0.56 | % | | 0.56 | % | | 0.56 | % | | 0.57 | % | | 0.59 | % |
| |
|
|
|
|
|
|
|
|
|
|
|
|
|
|
|
|
|
|
|
|
|
Total expenses after fees waived | | | 0.56 | %3 | | 0.57 | %3 | | 0.56 | % | | 0.56 | % | | 0.56 | % | | 0.57 | % | | 0.59 | % |
| |
|
|
|
|
|
|
|
|
|
|
|
|
|
|
|
|
|
|
|
|
|
Net investment income | | | 0.81 | %3 | | 0.81 | %3 | | 0.54 | % | | 0.25 | % | | 0.26 | % | | 0.33 | % | | 0.09 | % |
| |
|
|
|
|
|
|
|
|
|
|
|
|
|
|
|
|
|
|
|
|
|
| | | | | | | | | | | | | | | | | | | | | | |
|
|
|
|
|
|
|
|
|
|
|
|
|
|
|
|
|
|
|
|
|
|
|
Supplemental Data | | | | | | | | | | | | | | | | | | | | | | |
|
|
|
|
|
|
|
|
|
|
|
|
|
|
|
|
|
|
|
|
|
|
|
Net assets, end of period (000) | | $ | 751,723 | | $ | 733,888 | | $ | 665,963 | | $ | 1,233,995 | | $ | 785,377 | | $ | 489,398 | | $ | 344,400 | |
| |
|
|
|
|
|
|
|
|
|
|
|
|
|
|
|
|
|
|
|
|
|
Portfolio turnover | | | 97 | % | | 242 | % | | 144 | % | | 87 | % | | 117 | % | | 132 | % | | 165 | % |
| |
|
|
|
|
|
|
|
|
|
|
|
|
|
|
|
|
|
|
|
|
|
| | |
| 1 | Aggregate total investment return. |
| | |
| 2 | Includes proceeds received from a settlement of litigation, which impacted the Portfolio’s total investment return. Not including these proceeds, the Portfolio’s total investment return would have been 12.39%. |
| | |
| 3 | Annualized. |
| | |
| 4 | Includes proceeds from a settlement of litigation, which impacted the Portfolio’s total investment return. Not including these proceeds, the Portfolio’s total investment return would have been 20.23%. |
| | |
See Notes to Financial Statements. | | |
|
|
|
BLACKROCK LARGE CAP SERIES FUNDS, INC. | MARCH 31, 2010 | 31 |
| |
|
| |
Financial Highlights (concluded) | Master Large Cap Series LLC |
| | | | | | | | | | | | | | | | | | | | | | |
| | Master Large Cap Value Portfolio | |
| |
|
|
| | Six Months
Ended
March 31,
2010
(Unaudited) | | Period
November 1,
2008 to
September 30,
2009 | | | | | | | | | | | |
| | | | | | | | | | | | | |
| | | | Year Ended October 31, | |
| | | |
|
|
| | | | 2008 | | 2007 | | 2006 | | 2005 | | 2004 | |
|
|
|
|
|
|
|
|
|
|
|
|
|
|
|
|
|
|
|
|
|
|
|
Total Investment Return | | | | | | | | | | | | | | | | | | | | | | |
|
|
|
|
|
|
|
|
|
|
|
|
|
|
|
|
|
|
|
|
|
|
|
Total investment return | | | 9.43 | %1 | | 9.03 | %1,2 | | (36.54 | )% | | 12.72 | % | | 18.48 | % | | 21.93 | % | | 14.57 | % |
| |
|
|
|
|
|
|
|
|
|
|
|
|
|
|
|
|
|
|
|
|
|
| | | | | | | | | | | | | | | | | | | | | | |
|
|
|
|
|
|
|
|
|
|
|
|
|
|
|
|
|
|
|
|
|
|
|
Ratios to Average Net Assets | | | | | | | | | | | | | | | | | | | | | | |
|
|
|
|
|
|
|
|
|
|
|
|
|
|
|
|
|
|
|
|
|
|
|
Total expenses | | | 0.54 | %3 | | 0.54 | %3 | | 0.51 | % | | 0.51 | % | | 0.53 | % | | 0.55 | % | | 0.56 | % |
| |
|
|
|
|
|
|
|
|
|
|
|
|
|
|
|
|
|
|
|
|
|
Total expenses after fees waived | | | 0.54 | %3 | | 0.54 | %3 | | 0.51 | % | | 0.51 | % | | 0.53 | % | | 0.55 | % | | 0.56 | % |
| |
|
|
|
|
|
|
|
|
|
|
|
|
|
|
|
|
|
|
|
|
|
Net investment income | | | 1.51 | %3 | | 1.88 | %3 | | 1.22 | % | | 0.95 | % | | 0.73 | % | | 0.80 | % | | 0.93 | % |
| |
|
|
|
|
|
|
|
|
|
|
|
|
|
|
|
|
|
|
|
|
|
| | | | | | | | | | | | | | | | | | | | | | |
|
|
|
|
|
|
|
|
|
|
|
|
|
|
|
|
|
|
|
|
|
|
|
Supplemental Data | | | | | | | | | | | | | | | | | | | | | | |
|
|
|
|
|
|
|
|
|
|
|
|
|
|
|
|
|
|
|
|
|
|
|
Net assets, end of period (000) | | $ | 2,570,697 | | $ | 2,645,858 | | $ | 3,063,116 | | $ | 5,392,155 | | $ | 3,927,926 | | $ | 1,535,988 | | $ | 810,489 | |
| |
|
|
|
|
|
|
|
|
|
|
|
|
|
|
|
|
|
|
|
|
|
Portfolio turnover | | | 64 | % | | 151 | % | | 108 | % | | 72 | % | | 71 | % | | 95 | % | | 128 | % |
| |
|
|
|
|
|
|
|
|
|
|
|
|
|
|
|
|
|
|
|
|
|
| | |
| 1 | Aggregate total investment return. |
| | |
| 2 | Includes proceeds received from a settlement of litigation, which impacted the Portfolio’s total investment return. Not including these proceeds, the Portfolio’s total investment return would have been 8.61%. |
| | |
| 3 | Annualized. |
| | |
See Notes to Financial Statements. |
|
|
|
32 | BLACKROCK LARGE CAP SERIES FUNDS, INC. | MARCH 31, 2010 |
| |
|
| |
Notes to Financial Statements (Unaudited) | Master Large Cap Series LLC |
1. Organization and Significant Accounting Policies:
Master Large Cap Core Portfolio, Master Large Cap Growth Portfolio and Master Large Cap Value Portfolio (the “Portfolios”) constitute the Master Large Cap Series LLC (collectively, the “Master LLC”). The Master LLC is registered under the Investment Company Act of 1940, as amended (the “1940 Act”), as a diversified open-end management investment company and is organized as a Delaware limited liability company. The Master LLC’s Limited Liability Company Agreement permits the Board of Directors (the “Board”) to issue non-transferable interests in the Master LLC, subject to certain limitations. The Portfolios’ financial statements are prepared in conformity with accounting principles generally accepted in the United States of America, which may require the use of management accruals and estimates. Actual results may differ from these estimates.
On January 30, 2009, Master Large Cap Core Portfolio received an in-kind contribution of portfolio securities from an affiliated investor valued at $771,174,100.
The following is a summary of significant accounting policies followed by the Portfolios:
Valuation: The Portfolios’ policy is to fair value their financial instruments at market value. Equity investments traded on a recognized securities exchange or the NASDAQ Global Market System are valued at the last reported sale price that day or the NASDAQ official closing price, if applicable. For equity investments traded on more than one exchange, the last reported sale price on the exchange where the stock is primarily traded is used. Equity investments traded on a recognized exchange for which there were no sales on that day are valued at the last available bid price. If no bid price is available, the prior day’s price will be used, unless it is determined that such prior day’s price no longer reflects the fair value of the security. Short-term securities with remaining maturities of 60 days or less may be valued at amortized cost, which approximates fair value. Investments in open-end investment companies are valued at net asset value each business day.
The Portfolios value their investments in BlackRock Liquidity Series, LLC Money Market Series (the “Money Market Series”) at fair value, which is ordinarily based upon their pro rata ownership in the net assets of the underlying fund. The Money Market Series seeks current income consistent with maintaining liquidity and preserving capital. Although the Money Market Series is not registered under the 1940 Act, its investments will follow the parameters of investments by a money market fund that is subject to Rule 2a-7 promulgated by the Securities and Exchange Commission (“SEC”) under the 1940 Act. The Portfolios may withdraw up to 25% of their investment daily, although the manager of the Money Market Series, in its sole discretion, may permit an investor to withdraw more than 25% on any one day.
In the event that application of these methods of valuation results in a price for an investment which is deemed not to be representative of the market value of such investment or is not available, the investment will be valued by a method approved by the Board as reflecting fair value (“Fair Value Assets”). When determining the price for Fair Value Assets, the investment advisor and/or sub-advisor seeks to determine the price that a Portfolio might reasonably expect to receive from the current sale of that asset in an arm’s-length transaction. Fair value determinations shall be based upon all available factors that the investment advisor and/or sub-advisor deems relevant. The pricing of all Fair Value Assets is subsequently reported to the Board or a committee thereof.
Investment Transactions and Investment Income: For financial reporting purposes, investment transactions are recorded on the dates the transactions are entered into (the trade dates). Realized gains and losses on investment transactions are determined on the identified cost basis. Dividend income is recorded on the ex-dividend dates. Dividends from foreign securities where the ex-dividend date may have passed are subsequently recorded when the Portfolios have determined the ex-dividend dates. Upon notification from issuers, some of the dividend income received from a real estate investment trust may be redesignated as a reduction of cost of the related investment and/or realized gain. Interest income is recognized on the accrual basis.
Securities Lending: The Portfolios may lend securities to financial institutions that provide cash as collateral, which will be maintained at all times in an amount equal to at least 100% of the current market value of the loaned securities. The market value of the loaned securities is determined at the close of business of each Portfolio and any additional required collateral is delivered to the Portfolio on the next business day. Securities lending income, as disclosed in the Statements of Operations, represents the income earned from the investment of the cash collateral, net of rebates paid to, or fees paid by, borrowers and less the fees paid to the securities lending agent. Loans of securities are terminable at any time and the borrower, after notice, is required to return borrowed securities within the standard time period for settlement of securities transactions. In the event that the borrower defaults on its obligation to return borrowed securities because of insolvency or for any other reason, the Portfolios could experience delays and costs in gaining access to the collateral. The Portfolios also could suffer a loss if the value of an investment purchased with cash collateral falls below the market value of loaned securities or if the value of an investment purchased with cash collateral falls below the value of the original cash collateral received.
Income Taxes: Each Portfolio is classified as a partnership for federal income tax purposes. As such, each investor in a Portfolio is treated as owner of its proportionate share of the net assets, income, expenses and realized and unrealized gains and losses of the Portfolio. Therefore, no federal income tax provision is required. It is intended that each Portfolio’s assets will be managed so an investor in the Portfolio can satisfy the requirements of Subchapter M of the Internal Revenue Code of 1986, as amended.
| | |
|
BLACKROCK LARGE CAP SERIES FUNDS, INC. | MARCH 31, 2010 | 33 |
| |
|
| |
Notes to Financial Statements (continued) | Master Large Cap Series LLC |
Recent Accounting Standard: In January 2010, the Financial Accounting Standards Board issued amended guidance to improve disclosure about fair value measurements which will require additional disclosures about transfers into and out of Levels 1 and 2 and separate disclosures about purchases, sales, issuances and settlements in the reconciliation for fair value measurements using significant unobservable inputs (Level 3). It also clarifies existing disclosure requirements relating to the levels of disaggregation for fair value measurement and inputs and valuation techniques used to measure fair value. The amended guidance is effective for financial statements for fiscal years beginning after December 15, 2009, and interim periods within those fiscal years, except for disclosures about purchases, sales, issuances and settlements in the rollforward of activity in Level 3 fair value measurements, which are effective for fiscal years beginning after December 15, 2010 and for interim periods within those fiscal years. The impact of this guidance on each Portfolio’s financial statements and disclosures is currently being assessed.
Other: Expenses directly related to one of the Portfolios are charged to that Portfolio. Other operating expenses shared by several funds are pro rated among those funds on the basis of relative net assets or other appropriate methods. Each Portfolio has an arrangement with its custodian whereby fees may be reduced by credits earned on uninvested cash balances, which if applicable are shown as fees paid indirectly in the Statements of Operations. The custodians impose fees on overdrawn cash balances, which can be offset by accumulated credits earned or may result in additional custody charges.
2. Investment Advisory Agreement and Other Transactions with Affiliates:
The PNC Financial Services Group, Inc. (“PNC”), Bank of America Corporation (“BAC”) and Barclays Bank PLC (“Barclays”) are the largest stockholders of BlackRock, Inc. (“BlackRock”). Due to the ownership structure, PNC is an affiliate of the Portfolios for 1940 Act purposes, but BAC and Barclays are not.
The Master LLC, on behalf of each Portfolio has entered into an Investment Advisory Agreement with BlackRock Advisors, LLC (the “Manager”), the Portfolios’ investment advisor, an indirect, wholly owned subsidiary of BlackRock, to provide investment advisory and administration services.
The Manager is responsible for the management of each Portfolio’s investments and provides the necessary personnel, facilities, equipment and certain other services necessary to the operations of each Portfolio. For such services, each Portfolio pays the Manager a monthly fee at the following annual rates of each Portfolio’s average daily net assets:
Master Large Cap Core Portfolio
| | | | |
|
|
|
|
|
Portion of Average Daily Value of Net Assets: | | | Rate | |
|
|
|
|
|
Not exceeding $1 billion | | | 0.50% | |
In excess of $1 billion but not exceeding $5 billion | | | 0.45% | |
In excess of $5 billion | | | 0.40% | |
|
|
|
|
|
Master Large Cap Growth Portfolio
| | | | |
|
|
|
|
|
Portion of Average Daily Value of Net Assets: | | | Rate | |
|
|
|
|
|
Not exceeding $5 billion | | | 0.50% | |
In excess of $5 billion | | | 0.45% | |
|
|
|
|
|
Master Large Cap Value Portfolio
| | | | |
|
|
|
|
|
Portion of Average Daily Value of Net Assets: | | | Rate | |
|
|
|
|
|
Not exceeding $3 billion | | | 0.50% | |
In excess of $3 billion | | | 0.45% | |
|
|
|
|
|
The Manager has voluntarily agreed to waive its advisory fees by the amount of investment advisory fees each Portfolio pays to the Manager indirectly through its investment in affiliated money market funds, however the Manager does not waive its advisory fees by the amount of investment advisory fees through its investment in other affiliated investment companies. These amounts are included in fees waived by advisor in the Statements of Operations.
The Manager has entered into a separate sub-advisory agreement with BlackRock Investment Management, LLC (“BIM”), an affiliate of the Manager, under which the Manager pays BIM for services it provides, a monthly fee that is a percentage of the investment advisory fees paid by each Portfolio to the Manager.
For the six months ended March 31, 2010, each Portfolio reimbursed the Manager for certain accounting services, which are included in accounting services in the Statements of Operations. The reimbursements were as follows:
| | | | | |
|
|
|
|
|
|
| | Accounting
Services |
|
|
|
|
|
|
Master Large Cap Core Portfolio | | | $ | 35,618 | |
Master Large Cap Growth Portfolio | | | $ | 6,940 | |
Master Large Cap Value Portfolio | | | $ | 23,539 | |
|
|
|
|
|
|
The Master LLC has received an exemptive order from the SEC permitting it, among other things, to pay an affiliated securities lending agent a fee based on a share of the income derived from the securities lending activities and has retained BIM as the securities lending agent. BIM may, on behalf of the Portfolios, invest cash collateral received by the Portfolios for such loans, among other things, in a private investment company managed by the Manager or in registered money market funds advised by the Manager or its affiliates. The market value of securities on loan and the value of the related collateral are shown on the Statements of Assets and Liabilities as securities loaned and collateral at value — securities loaned, respectively. The cash collateral invested by BIM is disclosed in each Portfolio’s Schedule of Investments. The share of income earned by the Portfolios on such investments is shown as securities lending — affiliated in the Statements of Operations. For the six months ended March 31, 2010, BIM received $69,947 in securities lending agent fees related to securities lending activities for the Portfolios.
| | |
|
34 | BLACKROCK LARGE CAP SERIES FUNDS, INC. | MARCH 31, 2010 |
| |
|
| |
Notes to Financial Statements (concluded) | Master Large Cap Series LLC |
The Manager reimbursed Master Large Cap Core Portfolio and Master Large Cap Growth Portfolio $2,319,220 and $68,976, respectively, for net losses associated with certain investment transactions.
Certain officers and/or directors of the Master LLC are officers and/or directors of BlackRock or its affiliates.
3. Investments:
Purchases and sales of investments, excluding short-term securities, for the six months ended March 31, 2010 were as follows:
| | | | | | | |
|
|
|
|
|
|
|
|
| | Purchases | | Sales | |
|
|
|
|
|
|
|
|
Master Large Cap Core Portfolio | | $ | 2,826,147,213 | | $ | 3,184,084,965 | |
Master Large Cap Growth Portfolio | | $ | 700,633,766 | | $ | 775,583,699 | |
Master Large Cap Value Portfolio | | $ | 1,625,391,062 | | $ | 1,916,744,216 | |
|
|
|
|
|
|
|
|
4. Borrowings:
The Master LLC, on behalf of the Portfolios, along with certain other funds managed by the Manager and its affiliates, is a party to a $500 million credit agreement with a group of lenders, which was renewed until November 2010. Each Portfolio may borrow under the credit agreement to fund shareholder redemptions. Prior to its renewal, the credit agreement had the following terms: 0.02% upfront fee on the aggregate commitment amount which was allocated to each Portfolio based on its net assets as of October 31, 2008; a commitment fee of 0.08% per annum based on each Portfolio’s pro rata share of the unused portion of the credit agreement, which is included in miscellaneous in the Statements of Operations, and interest at a rate equal to the higher of the (a) federal funds effective rate and (b) reserve adjusted one-month LIBOR, plus, in each case, the higher of (i) 1.50% and (ii) 50% of the CDX Index (as defined in the credit agreement) on amounts borrowed. Effective November 2009, the credit agreement was renewed with the following terms: 0.02% upfront fee on the aggregate commitment amount which was allocated to each Portfolio based on its net assets as of October 31, 2009, a commitment fee of 0.10% per annum based on each Portfolio’s pro rata share of the unused portion of the credit agreement and interest at a rate equal to the higher of the (a) one-month LIBOR plus 1.25% per annum and (b) the Fed Funds rate plus 1.25% per annum on amounts borrowed. The Portfolios did not borrow under the credit agreement during the six months ended March 31, 2010.
5. Concentration, Market and Credit Risk:
Master Large Cap Growth Portfolio invests a significant portion of its assets in securities in the health care and information technology sectors. Changes in economic conditions affecting the health care and information technology sectors would have a greater impact on Master Large Cap Growth Portfolio and could affect the value, income and/or liquidity of positions in such securities.
In the normal course of business, the Portfolios invest in securities and enter into transactions where risks exist due to fluctuations in the market (market risk) or failure of the issuer of a security to meet all its obligations (credit risk). The value of securities held by the Portfolios may decline in response to certain events, including those directly involving the issuers whose securities are owned by the portfolios; conditions affecting the general economy; overall market changes; local, regional or global political, social or economic instability; and currency and interest rate and price fluctuations. Similar to credit risk, the Portfolios may be exposed to counterparty risk, or the risk that an entity with which the Portfolios have unsettled or open transactions may default. The Portfolios manage counterparty risk by entering into transactions only with counterparties that it believes have the financial resources to honor their obligations and by monitoring the financial stability of those counterparties. Financial assets, which potentially expose the Portfolios to credit and counterparty risks, consist principally of investments and cash due from counterparties. The extent of the Portfolios’ exposure to credit and counterparty risks with respect to these financial assets is generally approximated by their value recorded in the Portfolios’ Statements of Assets and Liabilities, less any collateral held by the Master LLC.
6. Reorganization:
Master Large Cap Core Portfolio
On November 14, 2008, an investor of the Portfolio acquired all of the assets and certain stated liabilities of PNC Growth & Income Fund (the “PNC Fund”), a series of PNC Funds, Inc. The reorganization was pursuant to an Agreement and Plan of Reorganization, which was approved by the shareholders of the PNC Fund on October 31, 2008. As a result of the reorganization, which included $59,817,678 of net unrealized depreciation, the Portfolio received an in-kind contribution of portfolio securities.
7. Subsequent Events:
Management has evaluated the impact of all subsequent events on each Portfolio through the date the financial statements were issued and has determined that there were no subsequent events requiring adjustment or disclosure in the financial statements.
| | |
|
BLACKROCK LARGE CAP SERIES FUNDS, INC. | MARCH 31, 2010 | 35 |
Officers and Directors
Ronald W. Forbes, Co-Chairman of the Board and Director
Rodney D. Johnson, Co-Chairman of the Board and Director
David O. Beim, Director
Richard S. Davis, Director
Henry Gabbay, Director
Dr. Matina Horner, Director
Herbert I. London, Director and Member of the Audit Committee
Cynthia A. Montgomery, Director
Joseph P. Platt, Jr., Director
Robert C. Robb, Jr., Director
Toby Rosenblatt, Director
Kenneth L. Urish, Chairman of the Audit Committee and Director
Frederick W. Winter, Director and Member of the Audit Committee
Anne Ackerley, President and Chief Executive Officer
Jeffrey Holland, Vice President
Brendan Kyne, Vice President
Brian Schmidt, Vice President
Neal Andrews, Chief Financial Officer
Jay Fife, Treasurer
Brian Kindelan, Chief Compliance Officer
Howard Surloff, Secretary
Investment Advisor
BlackRock Advisors, LLC
Wilmington, DE 19809
Sub-Advisor
BlackRock Investment Management, LLC
Plainsboro, NJ 08536
Custodian
Brown Brothers Harriman & Co.
Boston, MA 02109
Transfer Agent
PNC Global Investment Servicing (U.S.) Inc.
Wilmington, DE 19809
Accounting Agent
State Street Bank and Trust Company
Princeton, NJ 08540
Distributor
BlackRock Investments, LLC
New York, NY 10022
Independent Registered Public Accounting Firm
Deloitte & ToucheLLP
Princeton, NJ 08540
Legal Counsel
Sidley AustinLLP
New York, NY 10019
Address of the Funds
100 Bellevue Parkway
Wilmington, DE 19809
| | |
|
36 | BLACKROCK LARGE CAP SERIES FUNDS, INC. | MARCH 31, 2010 |
Additional Information
Electronic Delivery
Electronic copies of most financial reports and prospectuses are available on the Funds’ website or shareholders can sign up for e-mail notifications of quarterly statements, annual and semi-annual reports and prospectuses by enrolling in the Funds’ electronic delivery program.
To enroll:
Shareholders Who Hold Accounts with Investment Advisors, Banks or Brokerages:
Please contact your financial advisor. Please note that not all investment advisors, banks or brokerages may offer this service.
Shareholders Who Hold Accounts Directly with BlackRock:
1) Access the BlackRock website at http://www.blackrock.com/edelivery
2) Select “eDelivery” under the “More Information” section
3) Log into your account
Householding
The Funds will mail only one copy of shareholder documents, including prospectuses, annual and semi-annual reports and proxy statements, to shareholders with multiple accounts at the same address. This practice is commonly called “householding” and is intended to reduce expenses and eliminate duplicate mailings of shareholder documents. Mailings of your shareholder documents may be householded indefinitely unless you instruct us otherwise. If you do not want the mailing of these documents to be combined with those for other members of your household, please call (800) 441-7762.
Availability of Quarterly Portfolio Schedule
Each Fund/Portfolio files its complete schedule of portfolio holdings with the Securities and Exchange Commission (the “SEC”) for the first and third quarters of each fiscal year on Form N-Q. Each Fund’s/Portfolio’s Forms N-Q are available on the SEC’s website at http://www.sec.gov and may also be reviewed and copied at the SEC’s Public Reference Room in Washington, D.C. Information on the operation of the Public Reference Room may be obtained by calling (800) SEC-0330. Each Fund’s/Portfolio’s Forms N-Q may also be obtained upon request and without charge by calling (800) 441-7762.
Availability of Proxy Voting Policies and Procedures
A description of the policies and procedures that the Funds/Portfolios use to determine how to vote proxies relating to portfolio securities is available (1) without charge, upon request, by calling (800) 441-7762; (2) at www.blackrock.com; and (3) on the SEC’s website at http://www.sec.gov.
Availability of Proxy Voting Record
Information about how the Funds/Portfolios voted proxies relating to securities held in the Funds’/Portfolios’ portfolios, during the most recent 12-month period ended June 30 is available upon request and without charge (1) at www.blackrock.com or by calling (800) 441-7762 and (2) on the SEC’s website at http://www.sec.gov.
| | |
|
|
|
BLACKROCK LARGE CAP SERIES FUNDS, INC. | MARCH 31, 2010 | 37 |
| |
|
| |
Additional Information (concluded) | |
Account Information
Call us at (800) 441-7762 from 8:00 AM to 6:00 PM EST on any business day to get information about your account balances, recent transactions and share prices. You can also reach us on the Web at www.blackrock.com/funds.
Automatic Investment Plans
Investor Class shareholders who want to invest regularly can arrange to have $50 or more automatically deducted from their checking or savings account and invested in any of the BlackRock funds.
Systematic Withdrawal Plans
Investor Class shareholders can establish a systematic withdrawal plan and receive periodic payments of $50 or more from their BlackRock funds, as long as their account balance is at least $10,000.
Retirement Plans
Shareholders may make investments in conjunction with Traditional, Rollover, Roth, Coverdell, Simple IRAs, SEP IRAs and 403(b) Plans.
|
|
BlackRock Privacy Principles |
|
BlackRock is committed to maintaining the privacy of its current and former fund investors and individual clients (collectively, “Clients”) and to safeguarding their non-public personal information. The following information is provided to help you understand what personal information BlackRock collects, how we protect that information and why in certain cases we share such information with select parties.
If you are located in a jurisdiction where specific laws, rules or regulations require BlackRock to provide you with additional or different privacy-related rights beyond what is set forth below, then BlackRock will comply with those specific laws, rules or regulations.
BlackRock obtains or verifies personal non-public information from and about you from different sources, including the following: (i) information we receive from you or, if applicable, your financial intermediary, on applications, forms or other documents; (ii) information about your transactions with us, our affiliates, or others; (iii) information we receive from a consumer reporting agency; and (iv) from visits to our websites.
BlackRock does not sell or disclose to non-affiliated third parties any non-public personal information about its Clients, except as permitted by law or as is necessary to respond to regulatory requests or to service Client accounts. These non-affiliated third parties are required to protect the confidentiality and security of this information and to use it only for its intended purpose.
We may share information with our affiliates to service your account or to provide you with information about other BlackRock products or services that may be of interest to you. In addition, BlackRock restricts access to non-public personal information about its Clients to those BlackRock employees with a legitimate business need for the information. BlackRock maintains physical, electronic and procedural safeguards that are designed to protect the non-public personal information of its Clients, including procedures relating to the proper storage and disposal of such information.
| | |
|
38 | BLACKROCK LARGE CAP SERIES FUNDS, INC. | MARCH 31, 2010 |
| |
|
| |
A World-Class Mutual Fund Family | |
BlackRock offers a diverse lineup of open-end mutual funds crossing all investment styles and managed by experts in equity, fixed income and tax-exempt investing.
BlackRock All-Cap Energy & Resources Portfolio
BlackRock Asset Allocation Portfolio†
BlackRock Aurora Portfolio
BlackRock Balanced Capital Fund†
BlackRock Basic Value Fund
BlackRock Capital Appreciation Portfolio
BlackRock Energy & Resources Portfolio
BlackRock Equity Dividend Fund
BlackRock EuroFund
BlackRock Focus Growth Fund
BlackRock Focus Value Fund
BlackRock Fundamental Growth Fund
BlackRock Global Allocation Fund†
BlackRock Global Dynamic Equity Fund
BlackRock Global Emerging Markets Fund
BlackRock Global Financial Services Fund
BlackRock Global Growth Fund
BlackRock Global Opportunities Portfolio
BlackRock Global SmallCap Fund
BlackRock Health Sciences Opportunities Portfolio
BlackRock Healthcare Fund
BlackRock Index Equity Portfolio*
BlackRock International Fund
BlackRock International Index Fund
BlackRock International Opportunities Portfolio
BlackRock International Value Fund
BlackRock Large Cap Core Fund
BlackRock Large Cap Core Plus Fund
BlackRock Large Cap Growth Fund
BlackRock Large Cap Value Fund
BlackRock Latin America Fund
BlackRock Mid-Cap Growth Equity Portfolio
BlackRock Mid-Cap Value Equity Portfolio
BlackRock Mid Cap Value Opportunities Fund
BlackRock Natural Resources Trust
BlackRock Pacific Fund
BlackRock Science & Technology Opportunities Portfolio
BlackRock Small Cap Core Equity Portfolio
BlackRock Small Cap Growth Equity Portfolio
BlackRock Small Cap Growth Fund II
BlackRock Small Cap Index Fund
BlackRock Small/Mid-Cap Growth Portfolio
BlackRock S&P 500 Index Fund
BlackRock U.S. Opportunities Portfolio
BlackRock Utilities and Telecommunications Fund
BlackRock Value Opportunities Fund
BlackRock Bond Portfolio
BlackRock Emerging Market Debt Portfolio
BlackRock GNMA Portfolio
BlackRock Government Income Portfolio
BlackRock High Income Fund
BlackRock High Yield Bond Portfolio
BlackRock Income Portfolio†
BlackRock Income Builder Portfolio†
BlackRock Inflation Protected Bond Portfolio
BlackRock Intermediate Government Bond Portfolio
BlackRock International Bond Portfolio
BlackRock Long Duration Bond Portfolio
BlackRock Low Duration Bond Portfolio
BlackRock Managed Income Portfolio
BlackRock Multi-Sector Bond Portfolio
BlackRock Short-Term Bond Fund
BlackRock Strategic Income Opportunities Portfolio
BlackRock Total Return Fund
BlackRock Total Return Portfolio II
BlackRock World Income Fund
BlackRock AMT-Free Municipal Bond Portfolio
BlackRock California Municipal Bond Fund
BlackRock High Yield Municipal Fund
BlackRock Intermediate Municipal Fund
BlackRock Kentucky Municipal Bond Portfolio
BlackRock Municipal Insured Fund
BlackRock National Municipal Fund
BlackRock New Jersey Municipal Bond Fund
BlackRock New York Municipal Bond Fund
BlackRock Ohio Municipal Bond Portfolio
BlackRock Pennsylvania Municipal Bond Fund
BlackRock Short-Term Municipal Fund
|
|
Target Risk & Target Date Funds |
|
|
BlackRock Prepared Portfolios |
Conservative Prepared Portfolio |
Moderate Prepared Portfolio |
Growth Prepared Portfolio |
Aggressive Growth Prepared Portfolio |
|
BlackRock Lifecycle Prepared Portfolios |
Prepared Portfolio 2010 |
Prepared Portfolio 2015 |
Prepared Portfolio 2020 |
Prepared Portfolio 2025 |
Prepared Portfolio 2030 |
Prepared Portfolio 2035 |
Prepared Portfolio 2040 |
Prepared Portfolio 2045 |
Prepared Portfolio 2050 |
| |
* | See the prospectus for information on specific limitations on investments in the fund. |
| |
† | Mixed asset fund. |
BlackRock mutual funds are currently distributed by BlackRock Investments, LLC. You should consider the investment objectives, risks, charges and expenses of the funds under consideration carefully before investing. Each fund’s prospectus contains this and other information and is available at www.blackrock.com or by calling (800) 441-7762 or from your financial advisor. The prospectus should be read carefully before investing.
| | |
|
|
|
BLACKROCK LARGE CAP SERIES FUNDS, INC. | MARCH 31, 2010 | 39 |
These reports are not authorized for use as an offer of sale or a solicitation of an offer to buy shares of the Funds unless accompanied or preceded by the Funds’ current prospectus. Past performance results shown in these reports should not be considered a representation of future performance. Investment returns and principal value of shares will fluctuate so that shares, when redeemed, may be worth more or less than their original cost. Statements and other information herein are as dated and are subject to change.
| |

| 
|
| |
|
#LCSRP-3/10 |
Item 2 – | Code of Ethics – Not Applicable to this semi-annual report |
| |
Item 3 – | Audit Committee Financial Expert – Not Applicable to this semi-annual report |
| |
Item 4 – | Principal Accountant Fees and Services – Not Applicable to this semi-annual report |
| |
Item 5 – | Audit Committee of Listed Registrants – Not Applicable |
| |
Item 6 – | Investments |
| (a) The registrant’s Schedule of Investments is included as part of the Report to Stockholders filed under Item 1 of this form. |
| (b) Not Applicable due to no such divestments during the semi-annual period covered since the previous Form N-CSR filing. |
| |
Item 7 – | Disclosure of Proxy Voting Policies and Procedures for Closed-End Management Investment Companies – Not Applicable |
| |
Item 8 – | Portfolio Managers of Closed-End Management Investment Companies – Not Applicable |
| |
Item 9 – | Purchases of Equity Securities by Closed-End Management Investment Company and Affiliated Purchasers – Not Applicable |
| |
Item 10 – | Submission of Matters to a Vote of Security Holders – The registrant’s Nominating and Governance Committee will consider nominees to the board of directors recommended by shareholders when a vacancy becomes available. Shareholders who wish to recommend a nominee should send nominations that include biographical information and set forth the qualifications of the proposed nominee to the registrant’s Secretary. There have been no material changes to these procedures. |
| |
Item 11 – | Controls and Procedures |
| |
11(a) – | The registrant’s principal executive and principal financial officers or persons performing similar functions have concluded that the registrant’s disclosure controls and procedures (as defined in Rule 30a-3(c) under the Investment Company Act of 1940, as amended (the “1940 Act”)) are effective as of a date within 90 days of the filing of this report based on the evaluation of these controls and procedures required by Rule 30a-3(b) under the 1940 Act and Rule 15(d)-15(b) under the Securities Exchange Act of 1934, as amended. |
| |
11(b) – | There were no changes in the registrant’s internal control over financial reporting (as defined in Rule 30a-3(d) under the 1940 Act) that occurred during the second fiscal quarter of the period covered by this report that have materially affected, or are reasonably likely to materially affect, the registrant’s internal control over financial reporting. |
| |
Item 12 – | Exhibits attached hereto |
| |
12(a)(1) – | Code of Ethics – Not Applicable to this semi-annual report |
| |
12(a)(2) – | Certifications – Attached hereto |
| |
12(a)(3) – | Not Applicable |
| |
12(b) – | Certifications – Attached hereto |
| |
| Pursuant to the requirements of the Securities Exchange Act of 1934 and the Investment Company Act of 1940, the registrant has duly caused this report to be signed on its behalf by the undersigned, thereunto duly authorized. |
| |
| BlackRock Large Cap Series Funds, Inc. and Master Large Cap Series LLC |
| | |
| | By: | /s/ Anne F. Ackerley | |
| | | Anne F. Ackerley |
| | | Chief Executive Officer of |
| | | BlackRock Large Cap Series Funds, Inc. and Master Large Cap Series LLC |
| | |
| | Date: May 27, 2010 |
| | |
| | Pursuant to the requirements of the Securities Exchange Act of 1934 and the Investment Company Act of 1940, this report has been signed below by the following persons on behalf of the registrant and in the capacities and on the dates indicated. |
| | |
| | By: | /s/ Anne F. Ackerley | |
| | | Anne F. Ackerley |
| | | Chief Executive Officer (principal executive officer) of |
| | | BlackRock Large Cap Series Funds, Inc. and Master Large Cap Series LLC |
| | |
| | Date: May 27, 2010 |
| | |
| | By: | /s/ Neal J. Andrews | |
| | | Neal J. Andrews |
| | | Chief Financial Officer (principal financial officer) of |
| | | BlackRock Large Cap Series Funds, Inc. and Master Large Cap Series LLC |
| | | |
| | Date: May 27, 2010 |
| | | | |