on its cash collateral deposited with the broker-dealer. The Fund is exposed to market risk based on the amount, if any, that the market value of the security increases beyond the market value at which the position was sold. Thus, a short sale of a security involves the risk that instead of declining, the price of the security sold short will rise. The short sale of securities involves the possibility of a theoretically unlimited loss since there is a theoretically unlimited potential for the market price of the security sold short to increase. A gain, limited to the price at which the Fund sold the security short, or a loss, unlimited as to the dollar amount, will be recognized upon the termination of a short sale if the market price is greater or less than the proceeds originally received. There is no assurance the Fund will be able to close out a short position at a particular time or at an acceptable price.
Each Fund files US federal and various state and local tax returns. No income tax returns are currently under examination. The statute of limitations for Large Cap Core, Large Cap Growth, and Large Cap Value’s US federal income tax returns remains open for each of the two years ended September 30, 2011, the period ended September 30, 2009 and the year ended October 31, 2008. The statute of limitations for Large Cap Core Plus’ US federal tax returns remains open for each of the two years ended September 30, 2011 and the two periods ended September 30, 2009 and October 31, 2008. The statutes of limitations on each Fund’s state and local tax returns may remain open for an additional year depending upon the jurisdiction. Management does not believe there are any uncertain tax positions that require recognition of a tax liability.
In December 2011, the FASB issued guidance that will expand current disclosure requirements on the offsetting of certain assets and liabilities. The new disclosures will be required for investments and derivative financial instruments subject to master netting or similar agreements which are eligible for offset in the Statements of Assets and Liabilities and will require an entity to disclose both gross and net information about such investments and transactions in the financial statements. The guidance is effective for financial statements with fiscal years beginning on or after January 1, 2013, and interim periods within those fiscal years. Management is evaluating the impact of this guidance on the Funds’ financial statement disclosures.
Large Cap Core Plus has an arrangement with the custodian whereby fees may be reduced by credits earned on uninvested cash balances, which, if applicable, are shown as fees paid indirectly in the Statements of Operations.
| |
| |
Notes to Financial Statements (continued) | BlackRock Large Cap Series Funds, Inc. |
The custodian imposes fees on overdrawn cash balances, which can be offset by accumulated credits earned or may result in additional custody charges.
2. Investment Advisory Agreement and Other Transactions with Affiliates:
The PNC Financial Services Group, Inc. (“PNC”) and Barclays Bank PLC (“Barclays”) are the largest stockholders of BlackRock, Inc. (“BlackRock”). Due to the ownership structure, PNC is an affiliate for 1940 Act purposes, but Barclays is not.
The Corporation, on behalf of Large Cap Core Plus, entered into an Investment Advisory Agreement with BlackRock Advisors, LLC (the “Manager”), the Fund’s investment advisor, an indirect, wholly owned subsidiary of BlackRock, to provide investment advisory and administration services. The Manager is responsible for the management of the Fund’s portfolio and provides the necessary personnel, facilities, equipment and certain other series necessary to the operations of the Fund. For such services, the Fund pays the Manager a monthly fee based on a percentage of the Fund’s average daily net assets at the following annual rates:
| | | | |
Average Daily Net Assets | | Investment
Advisory
Fee | |
First $1 billion | | | 1.20 | % |
$1 billion – $3 billion | | | 1.13 | % |
$3 billion – $5 billion | | | 1.08 | % |
$5 billion – $10 billion | | | 1.04 | % |
Greater than $10 billion | | | 1.02 | % |
The Corporation, on behalf of Large Cap Core, Large Cap Growth, and Large Cap Value, entered into an Administration Agreement with BlackRock Advisors, LLC (the “Administrator”), an indirect, wholly owned subsidiary of BlackRock, to provide administrative services (other than investment advice and related portfolio activities). For such services, each Fund pays the Administrator a monthly fee at an annual rate of 0.25% of the average daily value of each Fund’s net assets. The Funds do not pay an investment advisory fee or investment management fee.
With respect to Large Cap Core Plus, the Manager voluntarily agreed to waive and/or reimburse fees or expenses, excluding interest expense, dividend expense, acquired fund fees and expenses and certain other fund expenses, in order to limit expenses. The current expense limitation as a percentage of average daily net assets is as follows: 1.50% for Institutional; 1.80% for Investor A; and 2.50% for Investor C.
These amounts are included in fees waived and/or reimbursed by advisor and transfer agent fees reimbursed — class specific, respectively in the Statements of Operations. For the six months ended March 31, 2012, the Manager waived or reimbursed $17,251, which is included in fees waived and/or reimbursed by advisor in the Statements of Operations.
The Manager also reimbursed Large Cap Core Plus for transfer agent fees which are shown as transfer agent fees reimbursed — class specific in the Statements of Operations. For the six months ended March 31, 2012, the class specific reimbursements were as follows:
| | | | |
Institutional | | $ | 4,362 | |
Investor A | | $ | 90 | |
Investor C | | $ | 3,308 | |
The Manager voluntarily agreed to waive its investment advisory fees by the amount of investment advisory fees Large Cap Core Plus pays to the Manager indirectly through its investment in affiliated money market funds. However, the Manager does not waive its investment advisory fees by the amount of investment advisory fees paid in connection with the Fund’s investment in other affiliated investment companies, if any. This amount is included in fees waived by advisor in the Statements of Operations. For the six months ended March 31, 2012, the Manager waived $133.
With respect to Large Cap Core Plus, the Manager entered into a sub-advisory agreement with BlackRock Investment Management, LLC (“BIM”), an affiliate of the Manager. The Manager pays BIM, for services it provides, a monthly fee that is a percentage of the investment advisory fees paid by each Fund to the Manager.
For the six months ended March 31, 2012, Large Cap Core Plus reimbursed by Manager $6,445 for certain accounting services, which are included in accounting services in the Statements of Operations.
With respect to BlackRock Large Cap Core Fund, the Administrator contractually agreed to waive and/or reimburse fees or expenses, excluding interest expense, dividend expense, acquired fund fees and expenses and certain other fund expenses, in order to limit expenses. The expense limitation as a percentage of average daily net assets is as follows: 1.14% for Investor A and 1.97% for Investor B. The Administrator has agreed not to reduce or discontinue this contractual waiver or reimbursement prior to February 1, 2013, unless approved by the Board, including a majority of the Independent Directors. These amounts are shown as transfer agent fees waived and/or reimbursed — class specific on the Statements of Operations. For the six-months ended March 31, 2012, the amounts were as follows:
| | | | | | | |
| | Investor A | | Investor B | |
Large Cap Core | | $ | 510,749 | | $ | 45,135 | |
The Corporation, on behalf of the Funds, entered into a Distribution Agreement and Distribution Plan with BlackRock Investments, LLC (“BRIL”), an affiliate of BlackRock. Pursuant to the Distribution and in accordance with Rule 12b-1 under the 1940 Act, each Fund pays BRIL ongoing service and distribution fees. The fees are accrued daily and paid monthly at annual rates based upon the average daily net assets of the shares of each Fund as follows:
| | | | | | | |
| | Service
Fee | | Distribution
Fee | |
Service | | | 0.25 | % | | — | |
Investor A | | | 0.25 | % | | — | |
Investor B | | | 0.25 | % | | 0.75 | % |
Investor C | | | 0.25 | % | | 0.75 | % |
Class R | | | 0.25 | % | | 0.25 | % |
| | |
| | |
46 | BLACKROCK LARGE CAP SERIES FUNDS, INC. | MARCH 31, 2012 |
| |
| |
Notes to Financial Statements (continued) | BlackRock Large Cap Series Funds, Inc. |
Pursuant to sub-agreements with BRIL, broker-dealers and BRIL provide shareholder servicing and distribution services to each Fund. The ongoing service and/or distribution fee compensates BRIL and each broker-dealer for providing shareholder servicing and/or distribution related services to Service, Investor A, Investor B, Investor C and Class R shareholders.
For the six months ended March 31, 2012, affiliates earned underwriting discounts, direct commissions and dealer concessions on sales of the Funds’ Investor A Shares as follows:
| | | | |
| | Investor A | |
Large Cap Core Plus | | $ | 2,549 | |
Large Cap Core | | $ | 20,209 | |
Large Cap Growth | | $ | 21,302 | |
Large Cap Value | | $ | 3,390 | |
For the six months ended March 31, 2012, affiliates received the following CDSC relating to transactions in Investor B and Investor C Shares:
| | | | | | | |
| | Investor B | | Investor C | |
Large Cap Core Plus | | | — | | $ | 2,109 | |
Large Cap Core | | $ | 20,349 | | $ | 16,381 | |
Large Cap Growth | | $ | 4,550 | | $ | 7,228 | |
Large Cap Value | | $ | 9,891 | | $ | 3,611 | |
Furthermore, affiliates received CDSC relating to transactions subject to front-end sales charge waivers on Investor A Shares as follows:
| | | | |
| | Investor A | |
Large Cap Core | | $ | 13,564 | |
Large Cap Growth | | $ | 66 | |
Large Cap Value | | $ | 25 | |
Pursuant to written agreements, certain financial intermediaries, some of which may be affiliates, provide the Fund with sub-accounting, recordkeeping, sub-transfer agency and other administrative services with respect to sub-accounts they service. For these services, these entities receive an annual fee per shareholder account, which will vary depending on share class and/or net assets. For the six months ended March 31, 2012, the Fund paid the following to affiliates in return for these services, which is included in transfer agent in the Statements of Operations:
| | | | | | | | | | |
| | Large Cap
Core | | Large Cap
Growth | | Large Cap
Value | |
Institutional | | $ | 141,136 | | $ | 24,400 | | $ | 104,150 | |
Service | | $ | 382 | | $ | 1,363 | | $ | 1,116 | |
Investor A | | $ | 1,187 | | $ | 349 | | $ | 19,241 | |
Investor C | | $ | 5 | | | — | | $ | 62 | |
The Manager maintains a call center, which is responsible for providing certain shareholder services to the Funds, such as responding to shareholder inquiries and processing transactions based upon instructions from shareholders with respect to the subscription and redemption of Fund shares. For the six months ended March 31, 2012, the Funds reimbursed the Manager the following amounts for costs incurred in running the call center, which are included in transfer agent — class specific in the Statements of Operations:
| | | | | | | | | | | | | |
| | Large Cap
Core Plus | | Large Cap
Core | | Large Cap
Growth | | Large Cap
Value | |
Institutional | | $ | 690 | | $ | 6,478 | | $ | 744 | | $ | 2,574 | |
Service | | | — | | $ | 7 | | $ | 174 | | $ | 822 | |
Investor A | | $ | 276 | | $ | 32,847 | | $ | 1,986 | | $ | 12,516 | |
Investor B | | | — | | $ | 3,740 | | $ | 264 | | $ | 1,080 | |
Investor C | | $ | 144 | | $ | 4,995 | | $ | 1,050 | | $ | 3,054 | |
Class R | | | — | | $ | 353 | | $ | 240 | | $ | 594 | |
Certain officers and/or directors of the Corporation are officers and/or directors of BlackRock or its affiliates. The Funds reimburse the Manager for compensation paid to the Corporation’s Chief Compliance Officer.
3. Investments:
With respect to Large Cap Core Plus, purchases and sales of investments, excluding short-term securities, for the six months ended March 31, 2012, were $50,652,310 and $41,820,116, respectively.
4. Capital Loss Carryforwards:
As of September 30, 2011, the Funds had capital loss carryforwards available to offset future realized capital gains through the indicated expiration dates as follows:
| | | | | | | | | | | | | |
Expires
September 30, | | Large Cap
Core Plus | | Large Cap
Core | | Large Cap
Growth | | Large Cap
Value | |
2016 | | $ | 474,766 | | | — | | | — | | $ | 76,062,363 | |
2017 | | | 5,739,252 | | $ | 605,060,516 | | $ | 16,978,928 | | | 783,578,280 | |
Total | | $ | 6,214,018 | | $ | 605,060,516 | | $ | 16,978,928 | | $ | 859,640,643 | |
Under the Regulated Investment Company Modernization Act of 2010, capital losses incurred by the Funds after September 30, 2011 will not be subject to expiration. In addition any such losses must be utilized prior to the losses incurred in pre-enactment taxable years.
As of March 31, 2012, gross unrealized appreciation and gross unrealized depreciation based on cost for federal income tax purposes for BlackRock Large Cap Core Plus was as follows:
| | | | |
Tax cost | | $ | 60,569,188 | |
Gross unrealized appreciation | | $ | 8,053,143 | |
Gross unrealized depreciation | | | (1,902,456 | ) |
Net unrealized appreciation | | $ | 6,150,687 | |
5. Borrowings:
The Corporation on behalf of, Large Cap Core Plus, along with certain other funds managed by the Manager and its affiliates, is a party to a $500 million credit agreement with a group of lenders. The Fund may borrow under the credit agreement to fund shareholder redemptions. Effective November 2010 to November 2011, the credit agreement had the following terms: a commitment fee of 0.08% per annum based on the Fund’s pro rata share of the unused portion of the credit agreement and interest at a rate equal to
| | | |
| | | |
| BLACKROCK LARGE CAP SERIES FUNDS, INC. | MARCH 31, 2012 | 47 |
| |
| |
Notes to Financial Statements (continued) | BlackRock Large Cap Series Funds, Inc. |
the higher of (a) the one-month LIBOR plus 1.00% per annum or (b) the Fed Funds rate plus 1.00% per annum on amounts borrowed. In addition, the Fund paid administration and arrangement fees which were allocated to the Fund based on its net assets as of October 31, 2010. The credit agreement, which expired in November 2011, was renewed until November 2012. Effective November 2011 to November 2012, the credit agreement has the following terms: a commitment fee of 0.065% per annum based on the Fund’s pro rata share of the unused portion of the credit agreement and interest at a rate equal to the higher of (a) the one-month LIBOR plus 0.80% per annum or (b) the Fed Funds rate plus 0.80% per annum on amounts borrowed. In addition, the Fund paid administration and arrangement fees which were allocated to the Fund based on its net assets as of October 31, 2011. The Fund did not borrow under the credit agreement during the year ended March 31, 2012.
6. Concentration, Market and Credit Risk:
In the normal course of business, BlackRock Large Cap Core Plus Fund invests in securities and enters into transactions where risks exist due to fluctuations in the market (market risk) or failure of the issuer of a security to meet all its obligations (issuer credit risk). The value of securities held by the Fund may decline in response to certain events, including those directly involving the issuers whose securities are owned by the Fund; conditions affecting the general economy; overall market changes; local, regional or global political, social or economic instability; and currency and interest rate and price fluctuations. Similar to issuer credit risk, the Fund may be exposed to counterparty credit risk, or the risk that an entity with which the Fund has unsettled or open transactions may fail to or be unable to perform on its commitments. The Fund manages counterparty credit risk by entering into transactions only with counterparties that it believes have the financial resources to honor their obligations and by monitoring the financial stability of those counterparties. Financial assets, which potentially expose the Fund to market, issuer and counterparty credit risks, consist principally of financial instruments and receivables due from counterparties. The extent of the Fund’s exposure to market, issuer and counterparty credit risks with respect to these financial assets is generally approximated by their value recorded in the Fund’s Statements of Assets and Liabilities, less any collateral held by the Fund.
As of March 31, 2012, the Fund invested a significant portion of its assets in securities in the information technology sector. Changes in economic conditions affecting the information technology sector would have a greater impact on the Fund and could affect the value, income and/or liquidity of positions in such securities.
7. Capital Share Transactions:
Transactions in capital shares for each class were as follows:
| | | | | | | | | | | | | | |
| | Six Months Ended
March 31, 2012 | | | Year Ended
September 30, 2011 | |
Large Cap Core Plus | | Shares | | Amount | | | Shares | | Amount | |
Institutional | | | | | | | | | | | | | | |
Shares sold | | | 1,148,112 | | $ | 10,639,170 | | | | 2,133,655 | | $ | 20,844,248 | |
Shares redeemed | | | (849,456 | ) | | (8,383,365 | ) | | | (415,601 | ) | | (3,702,176 | ) |
Net increase | | | 298,656 | | $ | 2,255,805 | | | | 1,718,054 | | $ | 17,142,072 | |
| | | | | | | | | | | | | | |
Investor A | | | | | | | | | | | | | | |
Shares sold | | | 913,281 | | $ | 8,474,318 | | | | 1,193,824 | | $ | 11,679,983 | |
Shares redeemed | | | (454,613 | ) | | (4,251,357 | ) | | | (176,828 | ) | | (1,620,082 | ) |
Net increase | | | 458,668 | | $ | 4,222,961 | | | | 1,016,996 | | $ | 10,059,901 | |
| | | | | | | | | | | | | | |
Investor C | | | | | | | | | | | | | | |
Shares sold | | | 124,711 | | $ | 1,149,195 | | | | 737,958 | | $ | 7,181,826 | |
Shares redeemed | | | (107,207 | ) | | (971,523 | ) | | | (440,081 | ) | | (3,825,815 | ) |
Net increase | | | 17,504 | | $ | 177,672 | | | | 297,877 | | $ | 3,356,011 | |
Total Net Increase | | | 774,828 | | $ | 6,656,438 | | | | 3,032,927 | | $ | 30,557,984 | |
| | |
| | |
48 | BLACKROCK LARGE CAP SERIES FUNDS, INC. | MARCH 31, 2012 |
| |
| |
Notes to Financial Statements (continued) | BlackRock Large Cap Series Funds, Inc. |
| | | | | | | | | | | | | | |
| | Six Months Ended
March 31, 2012 | | | Year Ended
September 30, 2011 | |
Large Cap Core | | Shares | | Amount | | | Shares | | Amount | |
Institutional | | | | | | | | | | | | | | |
Shares sold | | | 5,981,895 | | $ | 65,341,536 | | | | 7,173,736 | | $ | 82,240,972 | |
Shares issued to shareholders in reinvestment of dividends | | | 110,083 | | | 2,265,724 | | | | 215,803 | | | 2,378,099 | |
Shares redeemed | | | (9,185,660 | ) | | (104,095,930 | ) | | | (21,532,537 | ) | | (241,556,878 | ) |
Net decrease | | | (3,093,682 | ) | $ | (36,488,670 | ) | | | (14,142,998 | ) | $ | (156,937,807 | ) |
| | | | | | | | | | | | | | |
Service | | | | | | | | | | | | | | |
Shares sold | | | 123,506 | | $ | 1,377,807 | | | | 2,201 | | $ | 24,500 | |
Shares issued to shareholders in reinvestment of dividends | | | — | | | — | | | | 64 | | | 694 | |
Shares redeemed | | | (23,315 | ) | | (264,779 | ) | | | (11,490 | ) | | (131,218 | ) |
Net increase (decrease) | | | 100,191 | | $ | 1,113,028 | | | | (9,225 | ) | $ | (106,024 | ) |
| | | | | | | | | | | | | | |
Investor A | | | | | | | | | | | | | | |
Shares sold | | | 3,708,008 | | $ | 40,873,093 | | | | 13,561,310 | | $ | 150,420,583 | |
Shares issued to shareholders in reinvestment of dividends | | | 138,488 | | | 2,516,863 | | | | 450,984 | | | 4,857,051 | |
Shares redeemed | | | (8,959,201 | ) | | (99,908,939 | ) | | | (46,399,082 | ) | | (502,745,701 | ) |
Net decrease | | | (5,112,705 | ) | $ | (56,518,983 | ) | | | (32,386,788 | ) | $ | (347,468,067 | ) |
| | | | | | | | | | | | | | |
Investor B | | | | | | | | | | | | | | |
Shares sold | | | 88,060 | | $ | 923,129 | | | | 294,803 | | $ | 3,058,182 | |
Shares issued to shareholders in reinvestment of dividends | | | — | | | — | | | | — | | | — | |
Shares redeemed | | | (1,201,403 | ) | | (12,556,997 | ) | | | (3,496,594 | ) | | (36,406,633 | ) |
Net decrease | | | (1,113,343 | ) | $ | (11,633,868 | ) | | | (3,201,791 | ) | $ | (33,348,451 | ) |
| | | | | | | | | | | | | | |
Investor C | | | | | | | | | | | | | | |
Shares sold | | | 1,800,930 | | $ | 18,500,730 | | | | 6,660,260 | | $ | 69,205,654 | |
Shares issued to shareholders in reinvestment of dividends | | | — | | | — | | | | — | | | — | |
Shares redeemed | | | (9,529,258 | ) | | (96,789,849 | ) | | | (27,295,774 | ) | | (282,572,715 | ) |
Net decrease | | | (7,728,328 | ) | $ | (78,289,119 | ) | | | (20,635,514 | ) | $ | (213,367,061 | ) |
| | | | | | | | | | | | | | |
Class R | | | | | | | | | | | | | | |
Shares sold | | | 700,779 | | $ | 7,514,812 | | | | 2,019,491 | | $ | 21,805,353 | |
Shares issued to shareholders in reinvestment of dividends | | | — | | | — | | | | 14,026 | | | 144,890 | |
Shares redeemed | | | (1,502,871 | ) | | (16,081,719 | ) | | | (5,188,049 | ) | | (56,120,263 | ) |
Net decrease | | | (802,092 | ) | $ | (8,566,907 | ) | | | (3,154,532 | ) | $ | (34,170,020 | ) |
Total Net Decrease | | | (17,749,959 | ) | $ | (190,384,519 | ) | | | (73,530,848 | ) | $ | (785,397,430 | ) |
| | | |
| | | |
| BLACKROCK LARGE CAP SERIES FUNDS, INC. | MARCH 31, 2012 | 49 |
| |
| |
Notes to Financial Statements (continued) | BlackRock Large Cap Series Funds, Inc. |
| | | | | | | | | | | | | | |
| | Six Months Ended
March 31, 2012 | | | Year Ended
September 30, 2011 | |
Large Cap Growth | | Shares | | Amount | | | Shares | | Amount | |
Institutional | | | | | | | | | | | | | | |
Shares sold | | | 6,432,561 | | $ | 68,979,418 | | | | 36,254,869 | | $ | 360,977,633 | |
Shares issued to shareholders in reinvestment of dividends | | | 131,077 | | | 1,335,674 | | | | — | | | — | |
Shares redeemed | | | (1,679,019 | ) | | (18,584,720 | ) | | | (11,916,027 | ) | | (127,286,518 | ) |
Net increase | | | 4,884,619 | | $ | 51,730,372 | | | | 24,338,842 | | $ | 233,691,115 | |
| | | | | | | | | | | | | | |
Service | | | | | | | | | | | | | | |
Shares sold | | | 101,423 | | $ | 1,138,801 | | | | 425,705 | | $ | 4,465,992 | |
Shares issued to shareholders in reinvestment of dividends | | | 647 | | | 6,547 | | | | — | | | — | |
Shares redeemed | | | (108,821 | ) | | (1,201,045 | ) | | | (486,957 | ) | | (5,539,931 | ) |
Net decrease | | | (6,751 | ) | $ | (55,697 | ) | | | (61,252 | ) | $ | (1,073,939 | ) |
| | | | | | | | | | | | | | |
Investor A | | | | | | | | | | | | | | |
Shares sold and automatic conversion of shares | | | 4,132,470 | | $ | 45,317,546 | | | | 21,482,644 | | $ | 216,765,520 | |
Shares issued to shareholders in reinvestment of dividends | | | 57,008 | | | 563,246 | | | | — | | | — | |
Shares redeemed | | | (3,870,471 | ) | | (41,750,031 | ) | | | (14,593,706 | ) | | (153,165,637 | ) |
Net increase | | | 319,007 | | $ | 4,130,761 | | | | 6,888,938 | | $ | 63,599,883 | |
| | | | | | | | | | | | | | |
Investor B | | | | | | | | | | | | | | |
Shares sold | | | 40,521 | | $ | 398,594 | | | | 148,217 | | $ | 1,458,988 | |
Shares redeemed and automatic conversion of shares | | | (340,004 | ) | | (3,344,914 | ) | | | (674,646 | ) | | (6,547,986 | ) |
Net decrease | | | (299,483 | ) | $ | (2,946,320 | ) | | | (526,429 | ) | $ | (5,088,998 | ) |
| | | | | | | | | | | | | | |
Investor C | | | | | | | | | | | | | | |
Shares sold | | | 2,514,079 | | $ | 24,506,257 | | | | 5,076,302 | | $ | 49,685,155 | |
Shares redeemed | | | (1,999,705 | ) | | (19,674,128 | ) | | | (4,105,714 | ) | | (39,715,367 | ) |
Net increase | | | 514,374 | | $ | 4,832,129 | | | | 970,588 | | $ | 9,969,788 | |
| | | | | | | | | | | | | | |
Class R | | | | | | | | | | | | | | |
Shares sold | | | 499,683 | | $ | 5,184,143 | | | | 1,455,910 | | $ | 14,915,477 | |
Shares redeemed | | | (1,000,690 | ) | | (10,380,664 | ) | | | (3,604,915 | ) | | (37,125,959 | ) |
Net decrease | | | (501,007 | ) | $ | (5,196,521 | ) | | | (2,149,005 | ) | $ | (22,210,482 | ) |
Total Net Decrease | | | 4,910,759 | | $ | 52,494,724 | | | | 29,461,682 | | $ | 278,887,367 | |
| | |
| | |
50 | BLACKROCK LARGE CAP SERIES FUNDS, INC. | MARCH 31, 2012 |
| |
| |
Notes to Financial Statements (concluded) | BlackRock Large Cap Series Funds, Inc. |
| | | | | | | | | | | | | | |
| | Six Months Ended
March 31, 2012 | | | Year Ended
September 30, 2011 | |
Large Cap Value | | Shares | | Amount | | | Shares | | Amount | |
Institutional | | | | | | | | | | | | | | |
Shares sold | | | 2,543,328 | | $ | 36,442,302 | | | | 17,128,246 | | $ | 260,069,874 | |
Shares issued to shareholders in reinvestment of dividends | | | 161,177 | | | 3,198,578 | | | | 431,235 | | | 6,278,751 | |
Shares redeemed | | | (8,071,947 | ) | | (119,815,413 | ) | | | (43,526,100 | ) | | (667,594,229 | ) |
Net decrease | | | (5,367,442 | ) | $ | (80,174,533 | ) | | | (25,966,619 | ) | $ | (401,245,604 | ) |
| | | | | | | | | | | | | | |
Service | | | | | | | | | | | | | | |
Shares sold | | | 42,419 | | $ | 589,838 | | | | 464,797 | | $ | 6,870,875 | |
Shares issued to shareholders in reinvestment of dividends | | | 20,001 | | | 273,611 | | | | 18,056 | | | 262,530 | |
Shares redeemed | | | (274,865 | ) | | (3,989,385 | ) | | | (421,927 | ) | | (6,478,719 | ) |
Net increase (decrease) | | | (212,445 | ) | $ | (3,125,936 | ) | | | 60,926 | | $ | 654,686 | |
| | | | | | | | | | | | | | |
Investor A | | | | | | | | | | | | | | |
Shares sold | | | 2,556,703 | | $ | 35,767,372 | | | | 8,470,988 | | $ | 126,638,660 | |
Shares issued to shareholders in reinvestment of dividends | | | 149,490 | | | 3,124,215 | | | | 357,439 | | | 5,125,675 | |
Shares redeemed | | | (7,841,481 | ) | | (113,043,556 | ) | | | (27,447,313 | ) | | (407,122,176 | ) |
Net decrease | | | (5,135,288 | ) | $ | (74,151,969 | ) | | | (18,618,886 | ) | $ | (275,357,841 | ) |
| | | | | | | | | | | | | | |
Investor B | | | | | | | | | | | | | | |
Shares sold | | | 47,610 | | $ | 646,119 | | | | 148,504 | | $ | 2,074,101 | |
Shares issued to shareholders in reinvestment of dividends | | | — | | | — | | | | — | | | — | |
Shares redeemed | | | (419,795 | ) | | (5,790,728 | ) | | | (1,280,558 | ) | | (17,866,981 | ) |
Net increase (decrease) | | | (372,185 | ) | $ | (5,144,609 | ) | | | (1,132,054 | ) | $ | (15,792,880 | ) |
| | | | | | | | | | | | | | |
Investor C | | | | | | | | | | | | | | |
Shares sold | | | 1,005,626 | | $ | 13,635,955 | | | | 2,738,603 | | $ | 38,600,925 | |
Shares issued to shareholders in reinvestment of dividends | | | — | | | — | | | | — | | | — | |
Shares redeemed | | | (3,110,820 | ) | | (42,233,319 | ) | | | (7,868,468 | ) | | (109,530,116 | ) |
Net decrease | | | (2,105,194 | ) | $ | (28,597,364 | ) | | | (5,129,865 | ) | $ | (70,929,191 | ) |
| | | | | | | | | | | | | | |
Class R | | | | | | | | | | | | | | |
Shares sold | | | 633,036 | | $ | 8,603,522 | | | | 1,831,487 | | $ | 26,255,486 | |
Shares issued to shareholders in reinvestment of dividends | | | 4,637 | | | 266,800 | | | | 32,466 | | | 449,659 | |
Shares redeemed | | | (1,555,925 | ) | | (21,832,407 | ) | | | (5,299,700 | ) | | (76,705,344 | ) |
Net decrease | | | (918,252 | ) | $ | (12,962,085 | ) | | | (3,435,747 | ) | $ | (50,000,199 | ) |
Total Net Decrease | | | (14,110,806 | ) | $ | (204,156,496 | ) | | | (54,222,245 | ) | $ | (812,671,029 | ) |
8. Subsequent Events:
Management has evaluated the impact of all subsequent events on each Fund through the date the financial statements were issued and has determined that there were no subsequent events requiring adjustment or additional disclosure in the financial statements.
| | | |
| | | |
| BLACKROCK LARGE CAP SERIES FUNDS, INC. | MARCH 31, 2012 | 51 |
| |
| |
Portfolio Information as of March 31, 2012 | Master Large Cap Series LLC |
| | | | | | |
Master Large Cap Core Portfolio | | Percent of
Long-Term Investments | |
Apple, Inc. | | | | 3 | % | |
Chevron Corp. | | | | 3 | | |
Pfizer, Inc. | | | | 2 | | |
Exxon Mobil Corp. | | | | 2 | | |
ConocoPhillips | | | | 2 | | |
UnitedHealth Group, Inc. | | | | 2 | | |
Abbott Laboratories | | | | 1 | | |
Apache Corp. | | | | 1 | | |
Eli Lilly & Co. | | | | 1 | | |
General Dynamics Corp. | | | | 1 | | |
| | | | | | |
Master Large Cap Growth Portfolio | | Percent of
Long-Term Investments | |
Apple, Inc. | | | | 6 | % | |
Exxon Mobil Corp. | | | | 5 | | |
International Business Machines Corp. | | | | 4 | | |
Microsoft Corp. | | | | 4 | | |
Philip Morris International, Inc. | | | | 3 | | |
Abbott Laboratories | | | | 2 | | |
Accenture Plc, Class A | | | | 2 | | |
Gilead Sciences, Inc. | | | | 2 | | |
DIRECTV, Class A | | | | 1 | | |
Cummins, Inc. | | | | 1 | | |
| | | | | | |
Master Large Cap Value Portfolio | | Percent of
Long-Term Investments | |
Chevron Corp. | | | | 4 | % | |
JPMorgan Chase & Co. | | | | 4 | | |
Pfizer, Inc. | | | | 3 | | |
ConocoPhillips | | | | 2 | | |
UnitedHealth Group, Inc. | | | | 2 | | |
Apache Corp. | | | | 1 | | |
Prudential Financial, Inc. | | | | 1 | | |
Eli Lilly & Co. | | | | 1 | | |
Tyco International Ltd. | | | | 1 | | |
General Dynamics Corp. | | | | 1 | | |
| | | | | | |
Master Large Cap Core Portfolio | | Percent of
Long-Term Investments | |
Information Technology | | | | 20 | % | |
Health Care | | | | 16 | | |
Consumer Discretionary | | | | 15 | | |
Energy | | | | 14 | | |
Industrials | | | | 12 | | |
Consumer Staples | | | | 8 | | |
Financials | | | | 6 | | |
Materials | | | | 4 | | |
Utilities | | | | 3 | | |
Telecommunication Services | | | | 2 | | |
| | | | | | |
Master Large Cap Growth Portfolio | | Percent of
Long-Term Investments | |
Information Technology | | | | 32 | % | |
Consumer Discretionary | | | | 19 | | |
Health Care | | | | 15 | | |
Energy | | | | 10 | | |
Industrials | | | | 9 | | |
Consumer Staples | | | | 7 | | |
Materials | | | | 3 | | |
Financials | | | | 3 | | |
Telecommunication Services | | | | 2 | | |
| | | | | | |
Master Large Cap Value Portfolio | | Percent of
Long-Term Investments | |
Financials | | | | 17 | % | |
Industrials | | | | 16 | | |
Health Care | | | | 15 | | |
Information Technology | | | | 15 | | |
Energy | | | | 14 | | |
Consumer Discretionary | | | | 9 | | |
Consumer Staples | | | | 5 | | |
Materials | | | | 4 | | |
Utilities | | | | 3 | | |
Telecommunication Services | | | | 2 | | |
| |
| For Portfolio compliance purposes, the Portfolio’s sector classifications refer to any one or more of the sector sub-classifications used by one or more widely recognized market indexes or rating group indexes, and/or as defined by Portfolio management. These definitions may not apply for purposes of this report, which may combine such sector sub-classifications for reporting ease. |
| | |
| | |
52 | BLACKROCK LARGE CAP SERIES FUNDS, INC. | MARCH 31, 2012 |
| |
| |
Schedule of Investments March 31, 2012 (Unaudited) | Master Large Cap Core Portfolio |
(Percentages shown are based on Net Assets) |
| | | | | | | |
Common Stocks | | Shares | | Value | |
Consumer Discretionary — 15.2% | | | | | | | |
Auto Components — 0.7% | | | | | | | |
Lear Corp. | | | 390,000 | | $ | 18,131,100 | |
Diversified Consumer Services — 2.5% | | | | | | | |
Apollo Group, Inc., Class A (a) | | | 670,000 | | | 25,888,800 | |
Career Education Corp. (a) | | | 820,000 | | | 6,609,200 | |
H&R Block, Inc. | | | 400,000 | | | 6,588,000 | |
ITT Educational Services, Inc. (a)(b) | | | 380,000 | | | 25,133,200 | |
| | | | | | 64,219,200 | |
Hotels, Restaurants & Leisure — 0.9% | | | | | | | |
Brinker International, Inc. | | | 10,000 | | | 275,500 | |
Wyndham Worldwide Corp. | | | 480,000 | | | 22,324,800 | |
| | | | | | 22,600,300 | |
Internet & Catalog Retail — 1.0% | | | | | | | |
Expedia, Inc. | | | 740,000 | | | 24,745,600 | |
Media — 4.4% | | | | | | | |
DISH Network Corp., Class A (a) | | | 810,000 | | | 26,673,300 | |
Gannett Co., Inc. | | | 1,690,000 | | | 25,907,700 | |
The Interpublic Group of Cos., Inc. | | | 2,430,000 | | | 27,726,300 | |
Time Warner Cable, Inc. | | | 370,000 | | | 30,155,000 | |
| | | | | | 110,462,300 | |
Multiline Retail — 1.1% | | | | | | | |
Dillard’s, Inc., Class A | | | 420,000 | | | 26,468,400 | |
Specialty Retail — 4.6% | | | | | | | |
Best Buy Co., Inc. | | | 1,070,000 | | | 25,337,600 | |
Foot Locker, Inc. | | | 830,000 | | | 25,771,500 | |
GameStop Corp., Class A (b) | | | 1,150,000 | | | 25,116,000 | |
Limited Brands, Inc. | | | 310,000 | | | 14,880,000 | |
PetSmart, Inc. | | | 460,000 | | | 26,321,200 | |
| | | | | | 117,426,300 | |
Total Consumer Discretionary | | | | | | 384,053,200 | |
Consumer Staples — 8.0% | | | | | | | |
Beverages — 1.9% | | | | | | | |
Constellation Brands, Inc., Class A (a) | | | 1,100,000 | | | 25,949,000 | |
Dr. Pepper Snapple Group, Inc. | | | 530,000 | | | 21,311,300 | |
| | | | | | 47,260,300 | |
Food & Staples Retailing — 2.2% | | | | | | | |
The Kroger Co. | | | 1,240,000 | | | 30,045,200 | |
Safeway, Inc. | | | 1,340,000 | | | 27,081,400 | |
| | | | | | 57,126,600 | |
Food Products — 1.9% | | | | | | | |
ConAgra Foods, Inc. | | | 980,000 | | | 25,734,800 | |
Smithfield Foods, Inc. (a) | | | 990,000 | | | 21,809,700 | |
| | | | | | 47,544,500 | |
Household Products — 0.4% | | | | | | | |
The Procter & Gamble Co. | | | 140,000 | | | 9,409,400 | |
Personal Products — 0.7% | | | | | | | |
Herbalife Ltd. | | | 270,000 | | | 18,581,400 | |
Tobacco — 0.9% | | | | | | | |
Philip Morris International, Inc. | | | 250,000 | | | 22,152,500 | |
Total Consumer Staples | | | | | | 202,074,700 | |
| | | | | | | |
Common Stocks | | Shares | | Value | |
Energy — 14.2% | | | | | | | |
Energy Equipment & Services — 0.7% | | | | | | | |
Nabors Industries Ltd. (a) | | | 1,040,000 | | $ | 18,189,600 | |
Oil, Gas & Consumable Fuels — 13.5% | | | | | | | |
Apache Corp. | | | 340,000 | | | 34,149,600 | |
Chevron Corp. | | | 600,000 | | | 64,344,000 | |
ConocoPhillips | | | 570,000 | | | 43,325,700 | |
Exxon Mobil Corp. | | | 670,000 | | | 58,109,100 | |
HollyFrontier Corp. | | | 600,000 | | | 19,290,000 | |
Marathon Oil Corp. | | | 850,000 | | | 26,945,000 | |
Marathon Petroleum Corp. | | | 520,000 | | | 22,547,200 | |
Murphy Oil Corp. | | | 330,000 | | | 18,569,100 | |
Tesoro Corp. (a) | | | 990,000 | | | 26,571,600 | |
Valero Energy Corp. | | | 1,120,000 | | | 28,862,400 | |
| | | | | | 342,713,700 | |
Total Energy | | | | | | 360,903,300 | |
Financials — 5.7% | | | | | | | |
Commercial Banks — 0.2% | | | | | | | |
Wells Fargo & Co. | | | 140,000 | | | 4,779,600 | |
Consumer Finance — 1.1% | | | | | | | |
Discover Financial Services | | | 860,000 | | | 28,672,400 | |
Diversified Financial Services — 1.2% | | | | | | | |
JPMorgan Chase & Co. | | | 150,000 | | | 6,897,000 | |
The NASDAQ OMX Group, Inc. (a) | | | 860,000 | | | 22,274,000 | |
| | | | | | 29,171,000 | |
Insurance — 3.2% | | | | | | | |
Allied World Assurance Co. Holdings AG | | | 110,000 | | | 7,553,700 | |
American Financial Group, Inc. | | | 130,000 | | | 5,015,400 | |
Assurant, Inc. | | | 630,000 | | | 25,515,000 | |
Protective Life Corp. | | | 280,000 | | | 8,293,600 | |
Prudential Financial, Inc. | | | 130,000 | | | 8,240,700 | |
Reinsurance Group of America, Inc. | | | 60,000 | | | 3,568,200 | |
Unum Group | | | 950,000 | | | 23,256,000 | |
| | | | | | 81,442,600 | |
Total Financials | | | | | | 144,065,600 | |
Health Care — 16.5% | | | | | | | |
Biotechnology — 0.2% | | | | | | | |
Myriad Genetics, Inc. (a) | | | 250,000 | | | 5,915,000 | |
Health Care Equipment & Supplies — 1.1% | | | | | | | |
Zimmer Holdings, Inc. | | | 430,000 | | | 27,640,400 | |
Health Care Providers & Services — 8.8% | | | | | | | |
Aetna, Inc. | | | 620,000 | | | 31,099,200 | |
AmerisourceBergen Corp. | | | 710,000 | | | 28,172,800 | |
Cardinal Health, Inc. | | | 460,000 | | | 19,830,600 | |
Coventry Health Care, Inc. | | | 760,000 | | | 27,033,200 | |
Humana, Inc. | | | 190,000 | | | 17,571,200 | |
McKesson Corp. | | | 330,000 | | | 28,964,100 | |
UnitedHealth Group, Inc. | | | 670,000 | | | 39,489,800 | |
WellPoint, Inc. | | | 420,000 | | | 30,996,000 | |
| | | | | | 223,156,900 | |
Pharmaceuticals — 6.4% | | | | | | | |
Abbott Laboratories | | | 580,000 | | | 35,548,200 | |
Eli Lilly & Co. | | | 820,000 | | | 33,021,400 | |
Forest Laboratories, Inc. (a)(b) | | | 780,000 | | | 27,058,200 | |
Johnson & Johnson | | | 120,000 | | | 7,915,200 | |
Pfizer, Inc. | | | 2,570,000 | | | 58,236,200 | |
| | | | | | 161,779,200 | |
Total Health Care | | | | | | 418,491,500 | |
| | | |
See Notes to Financial Statements. |
| | | |
| BLACKROCK LARGE CAP SERIES FUNDS, INC. | MARCH 31, 2012 | 53 |
| |
| |
Schedule of Investments (continued) | Master Large Cap Core Portfolio |
| (Percentages shown are based on Net Assets) |
| | | | | | | |
Common Stocks | | Shares | | Value | |
Industrials — 11.7% | | | | | | | |
Aerospace & Defense — 4.6% | | | | | | | |
General Dynamics Corp. | | | 430,000 | | $ | 31,553,400 | |
L-3 Communications Holdings, Inc. | | | 380,000 | | | 26,892,600 | |
Lockheed Martin Corp. | | | 330,000 | | | 29,653,800 | |
Northrop Grumman Corp. | | | 460,000 | | | 28,096,800 | |
| | | | | | 116,196,600 | |
Commercial Services & Supplies — 0.2% | | | | | | | |
Corrections Corp. of America (a) | | | 140,000 | | | 3,823,400 | |
Construction & Engineering — 1.4% | | | | | | | |
Chicago Bridge & Iron Co. NV | | | 530,000 | | | 22,890,700 | |
URS Corp. | | | 320,000 | | | 13,606,400 | |
| | | | | | 36,497,100 | |
Industrial Conglomerates — 1.8% | | | | | | | |
General Electric Co. | | | 710,000 | | | 14,249,700 | |
Tyco International Ltd. | | | 540,000 | | | 30,337,200 | |
| | | | | | 44,586,900 | |
Machinery — 3.7% | | | | | | | |
AGCO Corp. (a) | | | 540,000 | | | 25,493,400 | |
CNH Global NV (a) | | | 130,000 | | | 5,161,000 | |
ITT Corp. | | | 1,120,000 | | | 25,692,800 | |
Oshkosh Corp. (a) | | | 430,000 | | | 9,963,100 | |
Parker Hannifin Corp. | | | 330,000 | | | 27,901,500 | |
| | | | | | 94,211,800 | |
Total Industrials | | | | | | 295,315,800 | |
Information Technology — 20.3% | | | | | | | |
Computers & Peripherals — 7.3% | | | | | | | |
Apple, Inc. (a) | | | 130,000 | | | 77,931,100 | |
Dell, Inc. (a) | | | 1,830,000 | | | 30,378,000 | |
Lexmark International, Inc., Class A | | | 780,000 | | | 25,927,200 | |
Seagate Technology Plc | | | 910,000 | | | 24,524,500 | |
Western Digital Corp. (a) | | | 640,000 | | | 26,489,600 | |
| | | | | | 185,250,400 | |
Electronic Equipment, Instruments &
Components — 4.2% | | | | | | | |
Avnet, Inc. (a) | | | 740,000 | | | 26,928,600 | |
Ingram Micro, Inc., Class A (a) | | | 650,000 | | | 12,064,000 | |
Jabil Circuit, Inc. | | | 1,030,000 | | | 25,873,600 | |
Tech Data Corp. (a) | | | 300,000 | | | 16,278,000 | |
Vishay Intertechnology, Inc. (a) | | | 2,050,000 | | | 24,928,000 | |
| | | | | | 106,072,200 | |
Internet Software & Services — 0.9% | | | | | | | |
AOL, Inc. (a) | | | 650,000 | | | 12,330,500 | |
Google, Inc., Class A (a) | | | 10,000 | | | 6,412,400 | |
IAC/InterActiveCorp. | | | 110,000 | | | 5,399,900 | |
| | | | | | 24,142,800 | |
IT Services — 5.8% | | | | | | | |
Accenture Plc, Class A | | | 50,000 | | | 3,225,000 | |
Alliance Data Systems Corp. (a)(b) | | | 210,000 | | | 26,451,600 | |
Computer Sciences Corp. | | | 380,000 | | | 11,377,200 | |
Global Payments, Inc. | | | 490,000 | | | 23,260,300 | |
International Business Machines Corp. | | | 110,000 | | | 22,951,500 | |
Lender Processing Services, Inc. | | | 860,000 | | | 22,360,000 | |
SAIC, Inc. (a) | | | 730,000 | | | 9,636,000 | |
The Western Union Co. | | | 1,520,000 | | | 26,752,000 | |
| | | | | | 146,013,600 | |
Software — 2.1% | | | | | | | |
Microsoft Corp. | | | 790,000 | | | 25,477,500 | |
Symantec Corp. (a) | | | 1,510,000 | | | 28,237,000 | |
| | | | | | 53,714,500 | |
Total Information Technology | | | | | | 515,193,500 | |
| | | | | | | |
Common Stocks | | Shares | | Value | |
Materials — 3.7% | | | | | | | |
Chemicals — 2.2% | | | | | | | |
CF Industries Holdings, Inc. | | | 150,000 | | $ | 27,397,500 | |
Cytec Industries, Inc. | | | 450,000 | | | 27,355,500 | |
| | | | | | 54,753,000 | |
Paper & Forest Products — 1.5% | | | | | | | |
Domtar Corp. | | | 270,000 | | | 25,752,600 | |
International Paper Co. | | | 390,000 | | | 13,689,000 | |
| | | | | | 39,441,600 | |
Total Materials | | | | | | 94,194,600 | |
Telecommunication Services — 2.0% | | | | | | | |
Diversified Telecommunication Services — 1.0% | | | | | | | |
AT&T, Inc. | | | 240,000 | | | 7,495,200 | |
Verizon Communications, Inc. | | | 440,000 | | | 16,821,200 | |
| | | | | | 24,316,400 | |
Wireless Telecommunication Services — 1.0% | | | | | | | |
MetroPCS Communications, Inc. (a) | | | 2,830,000 | | | 25,526,600 | |
Total Telecommunication Services | | | | | | 49,843,000 | |
Utilities — 2.8% | | | | | | | |
Independent Power Producers &
Energy Traders — 1.8% | | | | | | | |
The AES Corp. (a) | | | 2,110,000 | | | 27,577,700 | |
NRG Energy, Inc. (a) | | | 1,200,000 | | | 18,804,000 | |
| | | | | | 46,381,700 | |
Multi-Utilities — 1.0% | | | | | | | |
Ameren Corp. | | | 790,000 | | | 25,738,200 | |
Total Utilities | | | | | | 72,119,900 | |
Total Long-Term Investments
(Cost — $2,090,590,329) — 100.1% | | | | | | 2,536,255,100 | |
| | | | | | | |
|
| | | | | | | |
Short-Term Securities | | Beneficial
Interest
(000) | | | | |
BlackRock Liquidity Series, LLC
Money Market Series, 0.24% (c)(d)(e) | | $ | 87,183 | | | 87,182,715 | |
Total Short-Term Securities
(Cost — $87,182,715) — 3.5% | | | | | | 87,182,715 | |
Total Investments (Cost — $2,177,773,044*) — 103.6% | | | | | | 2,623,437,815 | |
Liabilities in Excess of Other Assets — (3.6)% | | | | | | (90,753,442 | ) |
Net Assets — 100.0% | | | | | $ | 2,532,684,373 | |
| |
| |
| |
* | As of March 31, 2012, gross unrealized appreciation and gross unrealized depreciation based on cost for federal income tax purposes were as follows: |
| | | | | |
| Tax cost | | $ | 2,194,281,551 | |
| Gross unrealized appreciation | | $ | 492,512,247 | |
| Gross unrealized depreciation | | | (63,355,983 | ) |
| Net unrealized appreciation | | $ | 429,156,264 | |
| |
(a) | Non-income producing security. |
| |
(b) | Security, or a portion of security, is on loan. |
| | |
See Notes to Financial Statements. | |
| | |
54 | BLACKROCK LARGE CAP SERIES FUNDS, INC. | MARCH 31, 2012 |
| |
| |
Schedule of Investments (concluded) | Master Large Cap Core Portfolio |
| |
(c) | Investments in companies considered to be an affiliate of the Portfolio during the period, for purposes of Section 2(a)(3) of the Investment Company Act of 1940, as amended, were as follows: |
| | | | | | | | | | | | | | |
| Affiliate | | Shares/
Beneficial
Interest Held at
September 30,
2011 | | Net
Activity | | Shares/
Beneficial
Interest Held at
March 31,
2012 | | Income | |
| BlackRock Liquidity | | | | | | | | | | | | | |
| Funds, TempFund, | | | | | | | | | | | | | |
| Institutional Class | | | — | | | — | | | — | | $ | 790 | |
| BlackRock Liquidity | | | | | | | | | | | | | |
| Series, LLC Money | | | | | | | | | | | | | |
| Market Series | | $ | 72,082,895 | | $ | 15,099,820 | | $ | 87,182,715 | | $ | 768,236 | |
| | | | |
(d) | Represents the current yield as of report date. |
| |
(e) | Security was purchased with the cash collateral from loaned securities. |
| |
• | For Portfolio compliance purposes, the Portfolio’s sector and industry classifications refer to any one or more of the sector and industry sub-classifications used by one or more widely recognized market indexes or rating group indexes, and/or as defined by Portfolio management. These definitions may not apply for purposes of this report, which may combine such sector and industry sub-classifications for reporting ease. |
| | |
• | Fair Value Measurements — Various inputs are used in determining the fair value of investments. These inputs are categorized into a disclosure hierarchy consisting of three broad levels for financial statement purposes as follows: |
| | |
| • | Level 1 — unadjusted price quotations in active markets/exchanges for identical assets and liabilities |
| | | |
| • | Level 2 — other observable inputs (including, but not limited to: quoted prices for similar assets or liabilities in markets that are active, quoted prices for identical or similar assets or liabilities in markets that are not active, inputs other than quoted prices that are observable for the assets or liabilities (such as interest rates, yield curves, volatilities, prepayment speeds, loss severities, credit risks and default rates) or other market-corroborated inputs) |
| | | |
| • | Level 3 — unobservable inputs based on the best information available in the circumstances, to the extent observable inputs are not available (including the Portfolio’s own assumptions used in determining the fair value of investments) |
Changes in valuation techniques may result in transfers into or out of an assigned level within the disclosure hierarchy. The categorization of a value determined for investments is based on the pricing transparency of the investment and is not necessarily an indication of the risks associated with investing in those securities. For information about the Portfolio’s policy regarding valuation of investments and other significant accounting policies, please refer to Note 1 of the Notes to Financial Statements.
The following table summarizes the inputs used as of March 31, 2012 in determining the fair valuation of the Portfolio’s investments:
| | | | | | | | | | | | | |
Valuation Inputs | | Level 1 | | Level 2 | | Level 3 | | Total | |
Assets: | | | | | | | | | | | | | |
Investments: | | | | | | | | | | | | | |
Long-Term
Investments1 | | $ | 2,536,255,100 | | | — | | | — | | $ | 2,536,255,100 | |
Short-Term
Securities | | | — | | $ | 87,182,715 | | | — | | | 87,182,715 | |
Total | | $ | 2,536,255,100 | | $ | 87,182,715 | | | — | | $ | 2,623,437,815 | |
| | |
| 1 | See above Schedule of Investments for values in each sector and industry. |
| | | |
See Notes to Financial Statements. |
| | | |
| BLACKROCK LARGE CAP SERIES FUNDS, INC. | MARCH 31, 2012 | 55 |
| |
Schedule of Investments March 31, 2012 (Unaudited) | Master Large Cap Growth Portfolio |
| (Percentages shown are based on Net Assets) |
| | | | | | | |
Common Stocks | | Shares | | Value | |
Consumer Discretionary — 18.9% | | | | | | | |
Diversified Consumer Services — 3.0% | | | | | | | |
Apollo Group, Inc., Class A (a) | | | 310,000 | | $ | 11,978,400 | |
Career Education Corp. (a) | | | 440,000 | | | 3,546,400 | |
H&R Block, Inc. | | | 380,000 | | | 6,258,600 | |
ITT Educational Services, Inc. (a)(b) | | | 180,000 | | | 11,905,200 | |
| | | | | | 33,688,600 | |
Hotels, Restaurants & Leisure — 1.0% | | | | | | | |
Brinker International, Inc. | | | 410,000 | | | 11,295,500 | |
Internet & Catalog Retail — 1.0% | | | | | | | |
Expedia, Inc. | | | 340,000 | | | 11,369,600 | |
Leisure Equipment & Products — 1.0% | | | | | | | |
Polaris Industries, Inc. | | | 160,000 | | | 11,544,000 | |
Media — 7.3% | | | | | | | |
Cablevision Systems Corp., New York Group, Class A | | | 800,000 | | | 11,744,000 | |
DIRECTV, Class A (a) | | | 340,000 | | | 16,775,600 | |
DISH Network Corp., Class A (a) | | | 370,000 | | | 12,184,100 | |
The Interpublic Group of Cos., Inc. | | | 1,100,000 | | | 12,551,000 | |
The McGraw-Hill Cos., Inc. | | | 280,000 | | | 13,571,600 | |
Time Warner Cable, Inc. | | | 190,000 | | | 15,485,000 | |
| | | | | | 82,311,300 | |
Multiline Retail — 3.0% | | | | | | | |
Big Lots, Inc. (a) | | | 120,000 | | | 5,162,400 | |
Dollar Tree, Inc. (a) | | | 50,000 | | | 4,724,500 | |
Macy’s, Inc. | | | 290,000 | | | 11,521,700 | |
Nordstrom, Inc. | | | 230,000 | | | 12,815,600 | |
| | | | | | 34,224,200 | |
Specialty Retail — 2.6% | | | | | | | |
Advance Auto Parts, Inc. | | | 140,000 | | | 12,399,800 | |
AutoZone, Inc. (a) | | | 10,000 | | | 3,718,000 | |
PetSmart, Inc. | | | 230,000 | | | 13,160,600 | |
TJX Cos., Inc. | | | 10,000 | | | 397,100 | |
| | | | | | 29,675,500 | |
Total Consumer Discretionary | | | | | | 214,108,700 | |
Consumer Staples — 6.5% | | | | | | | |
Beverages — 1.1% | | | | | | | |
Dr. Pepper Snapple Group, Inc. | | | 320,000 | | | 12,867,200 | |
Food & Staples Retailing — 1.1% | | | | | | | |
The Kroger Co. | | | 540,000 | | | 13,084,200 | |
Food Products — 0.2% | | | | | | | |
ConAgra Foods, Inc. | | | 70,000 | | | 1,838,200 | |
Personal Products — 1.1% | | | | | | | |
Herbalife Ltd. | | | 180,000 | | | 12,387,600 | |
Tobacco — 3.0% | | | | | | | |
Philip Morris International, Inc. | | | 380,000 | | | 33,671,800 | |
Total Consumer Staples | | | | | | 73,849,000 | |
Energy — 10.4% | | | | | | | |
Oil, Gas & Consumable Fuels — 10.4% | | | | | | | |
Apache Corp. | | | 140,000 | | | 14,061,600 | |
Chevron Corp. | | | 120,000 | | | 12,868,800 | |
Denbury Resources, Inc. (a) | | | 680,000 | | | 12,396,400 | |
Exxon Mobil Corp. | | | 640,000 | | | 55,507,200 | |
HollyFrontier Corp. | | | 380,000 | | | 12,217,000 | |
Marathon Oil Corp. | | | 200,000 | | | 6,340,000 | |
Murphy Oil Corp. | | | 90,000 | | | 5,064,300 | |
Total Energy | | | | | | 118,455,300 | |
| | | | | | | |
Common Stocks | | Shares | | Value | |
Financials — 2.7% | | | | | | | |
Consumer Finance — 1.1% | | | | | | | |
Discover Financial Services | | | 360,000 | | $ | 12,002,400 | |
Diversified Financial Services — 1.6% | | | | | | | |
Moody’s Corp. | | | 180,000 | | | 7,578,000 | |
The NASDAQ OMX Group, Inc. (a) | | | 420,000 | | | 10,878,000 | |
| | | | | | 18,456,000 | |
Total Financials | | | | | | 30,458,400 | |
Health Care — 15.3% | | | | | | | |
Biotechnology — 2.9% | | | | | | | |
Gilead Sciences, Inc. (a) | | | 360,000 | | | 17,586,000 | |
Myriad Genetics, Inc. (a) | | | 490,000 | | | 11,593,400 | |
United Therapeutics Corp. (a) | | | 70,000 | | | 3,299,100 | |
| | | | | | 32,478,500 | |
Health Care Providers & Services — 7.5% | | | | | | | |
Aetna, Inc. | | | 227,000 | | | 11,386,320 | |
AmerisourceBergen Corp. | | | 340,000 | | | 13,491,200 | |
Cardinal Health, Inc. | | | 300,000 | | | 12,933,000 | |
Coventry Health Care, Inc. | | | 287,000 | | | 10,208,590 | |
McKesson Corp. | | | 170,000 | | | 14,920,900 | |
Patterson Cos., Inc. | | | 350,000 | | | 11,690,000 | |
UnitedHealth Group, Inc. | | | 187,000 | | | 11,021,780 | |
| | | | | | 85,651,790 | |
Life Sciences Tools & Services — 0.2% | | | | | | | |
Charles River Laboratories International, Inc. (a) | | | 70,000 | | | 2,526,300 | |
Pharmaceuticals — 4.7% | | | | | | | |
Abbott Laboratories | | | 410,000 | | | 25,128,900 | |
Bristol-Myers Squibb Co. | | | 224,000 | | | 7,560,000 | |
Eli Lilly & Co. | | | 340,000 | | | 13,691,800 | |
Warner Chilcott Plc, Class A (a) | | | 430,000 | | | 7,228,300 | |
| | | | | | 53,609,000 | |
Total Health Care | | | | | | 174,265,590 | |
Industrials — 9.4% | | | | | | | |
Aerospace & Defense — 2.7% | | | | | | | |
Alliant Techsystems, Inc. | | | 220,000 | | | 11,026,400 | |
Lockheed Martin Corp. | | | 160,000 | | | 14,377,600 | |
United Technologies Corp. | | | 60,000 | | | 4,976,400 | |
| | | | | | 30,380,400 | |
Airlines — 1.1% | | | | | | | |
Copa Holdings SA, Class A | | | 150,000 | | | 11,880,000 | |
Commercial Services & Supplies — 1.9% | | | | | | | |
Covanta Holding Corp. | | | 690,000 | | | 11,198,700 | |
Iron Mountain, Inc. | | | 370,000 | | | 10,656,000 | |
| | | | | | 21,854,700 | |
Construction & Engineering — 1.3% | | | | | | | |
AECOM Technology Corp. (a) | | | 160,000 | | | 3,579,200 | |
Chicago Bridge & Iron Co. NV | | | 270,000 | | | 11,661,300 | |
| | | | | | 15,240,500 | |
Machinery — 2.4% | | | | | | | |
Cummins, Inc. | | | 130,000 | | | 15,605,200 | |
Parker Hannifin Corp. | | | 140,000 | | | 11,837,000 | |
| | | | | | 27,442,200 | |
Total Industrials | | | | | | 106,797,800 | |
| | |
See Notes to Financial Statements. | |
| | |
56 | BLACKROCK LARGE CAP SERIES FUNDS, INC. | MARCH 31, 2012 |
| |
|
Schedule of Investments (continued) | Master Large Cap Growth Portfolio |
| (Percentages shown are based on Net Assets) |
| | | | | | | |
Common Stocks | | Shares | | Value | |
Information Technology — 31.6% | | | | | | | |
Computers & Peripherals — 10.5% | | | | | | | |
Apple, Inc. (a) | | | 120,000 | | $ | 71,936,400 | |
Dell, Inc. (a) | | | 870,000 | | | 14,442,000 | |
QLogic Corp. (a) | | | 660,000 | | | 11,721,600 | |
Seagate Technology Plc | | | 400,000 | | | 10,780,000 | |
Western Digital Corp. (a) | | | 260,000 | | | 10,761,400 | |
| | | | | | 119,641,400 | |
Electronic Equipment, Instruments &
Components — 1.9% | | | | | | | |
Arrow Electronics, Inc. (a) | | | 240,000 | | | 10,072,800 | |
Jabil Circuit, Inc. | | | 470,000 | | | 11,806,400 | |
| | | | | | 21,879,200 | |
Internet Software & Services — 0.6% | | | | | | | |
Google, Inc., Class A (a) | | | 10,000 | | | 6,412,400 | |
IT Services — 12.4% | | | | | | | |
Accenture Plc, Class A (b) | | | 280,000 | | | 18,060,000 | |
Alliance Data Systems Corp. (a)(b) | | | 100,000 | | | 12,596,000 | |
DST Systems, Inc. | | | 230,000 | | | 12,472,900 | |
Global Payments, Inc. | | | 230,000 | | | 10,918,100 | |
International Business Machines Corp. | | | 240,000 | | | 50,076,000 | |
Lender Processing Services, Inc. | | | 470,000 | | | 12,220,000 | |
SAIC, Inc. (a)(b) | | | 870,000 | | | 11,484,000 | |
The Western Union Co. | | | 740,000 | | | 13,024,000 | |
| | | | | | 140,851,000 | |
Software — 6.2% | | | | | | | |
Microsoft Corp. | | | 1,510,000 | | | 48,697,500 | |
Symantec Corp. (a) | | | 740,000 | | | 13,838,000 | |
Synopsys, Inc. (a) | | | 250,000 | | | 7,665,000 | |
| | | | | | 70,200,500 | |
Total Information Technology | | | | | | 358,984,500 | |
Materials — 2.8% | | | | | | | |
Chemicals — 1.8% | | | | | | | |
CF Industries Holdings, Inc. | | | 70,000 | | | 12,785,500 | |
PPG Industries, Inc. | | | 80,000 | | | 7,664,000 | |
| | | | | | 20,449,500 | |
Paper & Forest Products — 1.0% | | | | | | | |
International Paper Co. | | | 330,000 | | | 11,583,000 | |
Total Materials | | | | | | 32,032,500 | |
Telecommunication Services — 2.4% | | | | | | | |
Diversified Telecommunication Services — 1.4% | | | | | | | |
Verizon Communications, Inc. | | | 400,000 | | | 15,292,000 | |
Wireless Telecommunication Services — 1.0% | | | | | | | |
MetroPCS Communications, Inc. (a) | | | 1,310,000 | | | 11,816,200 | |
Total Telecommunication Services | | | | | | 27,108,200 | |
Total Long-Term Investments
(Cost — $933,679,570) — 100.0% | | | | | | 1,136,059,990 | |
| | | | | | | |
Short-Term Securities | | Beneficial
Interest
(000) | | Value | |
BlackRock Liquidity Series, LLC
Money Market Series, 0.24% (c)(d)(e) | | $ | 46,238 | | $ | 46,238,405 | |
Total Short-Term Securities
(Cost — $46,238,405) — 4.1% | | | | | | 46,238,405 | |
Total Investments (Cost — $979,917,975*) — 104.1% | | | | | | 1,182,298,395 | |
Liabilities in Excess of Other Assets — (4.1)% | | | | | | (46,903,105 | ) |
Net Assets — 100.0% | | | | | $ | 1,135,395,290 | |
| | | | | | | |
| | | | | | | | |
* | As of March 31, 2012, gross unrealized appreciation and gross unrealized depreciation based on cost for federal income tax purposes were as follows: |
| | | | | | | |
Tax cost | | | | | $ | 991,655,508 | |
Gross unrealized appreciation | | | | | $ | 213,783,633 | |
Gross unrealized depreciation | | | | | | (23,140,746 | ) |
Net unrealized appreciation | | | | | $ | 190,642,887 | |
| |
(a) | Non-income producing security. |
| |
(b) | Security, or a portion of security, is on loan. |
| |
(c) | Investments in companies considered to be an affiliate of the Portfolio during the period, for purposes of Section 2(a)(3) of the Investment Company Act of 1940, as amended, were as follows: |
| | | | | | | | | | | | | |
Affiliate | | Shares/
Beneficial
Interest Held at
September 30,
2011 | | Net
Activity | | Shares/
Beneficial
Interest Held at
March 31,
2012 | | Income | |
BlackRock Liquidity
Funds, TempFund,
Institutional Class | | | 2,585,122 | | | (2,585,122 | ) | | — | | $ | 1,375 | |
BlackRock Liquidity
Series, LLC Money
Market Series | | $ | 24,184,509 | | $ | 22,053,896 | | $ | 46,238,405 | | $ | 358,564 | |
| | |
(d) | Represents the current yield as of report date. |
| | |
(e) | Security was purchased with the cash collateral from loaned securities. |
| | |
• | For Portfolio compliance purposes, the Portfolio’s sector and industry classifications refer to any one or more of the sector and industry sub-classifications used by one or more widely recognized market indexes or rating group indexes, and/or as defined by Portfolio management. These definitions may not apply for purposes of this report, which may combine such sector and industry sub-classifications for reporting ease. |
| | |
• | Fair Value Measurements — Various inputs are used in determining the fair value of investments. These inputs are categorized into a disclosure hierarchy consisting of three broad levels for financial statement purposes as follows: |
| | |
| • | Level 1 — unadjusted price quotations in active markets/exchanges for identical assets and liabilities |
| | |
| • | Level 2 — other observable inputs (including, but not limited to: quoted prices for similar assets or liabilities in markets that are active, quoted prices for identical or similar assets or liabilities in markets that are not active, inputs other than quoted prices that are observable for the assets or liabilities (such as interest rates, yield curves, volatilities, prepayment speeds, loss severities, credit risks and default rates) or other market-corroborated inputs) |
| | |
| • | Level 3 — unobservable inputs based on the best information available in the circumstances, to the extent observable inputs are not available (including the Portfolio’s own assumptions used in determining the fair value of investments) |
| | |
See Notes to Financial Statements. | | |
| | |
BLACKROCK LARGE CAP SERIES FUNDS, INC. | MARCH 31, 2012 | 57 |
| |
Schedule of Investments (concluded) | Master Large Cap Growth Portfolio |
Changes in valuation techniques may result in transfers into or out of an assigned level within the disclosure hierarchy. The categorization of a value determined for investments is based on the pricing transparency of the investment and is not necessarily an indication of the risks associated with investing in those securities. For information about the Portfolio’s policy regarding valuation of investments and other significant accounting policies, please refer to Note 1 of the Notes to Financial Statements.
The following table summarizes the inputs used as of March 31, 2012 in determining the fair valuation of the Portfolio’s investments:
| | | | | | | | | | | | | |
Valuation Inputs | | Level 1 | | Level 2 | | Level 3 | | Total | |
Assets: | | | | | | | | | | | | | |
Investments: | | | | | | | | | | | | | |
Long-Term
Investments1 | | $ | 1,136,059,990 | | | — | | | — | | $ | 1,136,059,990 | |
Short-Term
Securities | | | — | | $ | 46,238,405 | | | — | | | 46,238,405 | |
Total | | $ | 1,136,059,990 | | $ | 46,238,405 | | | — | | $ | 1,182,298,395 | |
| | |
| 1 | See above Schedule of Investments for values in each sector and industry. |
| | |
See Notes to Financial Statements. | |
| | |
58 | BLACKROCK LARGE CAP SERIES FUNDS, INC. | MARCH 31, 2012 |
| |
| |
Schedule of Investments March 31, 2012 (Unaudited) | Master Large Cap Value Portfolio |
| (Percentages shown are based on Net Assets) |
| | | | | | | |
Common Stocks | | Shares | | Value | |
Consumer Discretionary — 9.2% | | | | | | | |
Auto Components — 0.4% | | | | | | | |
Lear Corp. | | | 120,000 | | $ | 5,578,800 | |
Diversified Consumer Services — 0.9% | | | | | | | |
Career Education Corp. (a)(b) | | | 750,000 | | | 6,045,000 | |
Education Management Corp. (a)(b) | | | 350,000 | | | 4,791,500 | |
H&R Block, Inc. | | | 30,000 | | | 494,100 | |
| | | | | | 11,330,600 | |
Internet & Catalog Retail — 1.0% | | | | | | | |
Expedia, Inc. | | | 410,000 | | | 13,710,400 | |
Media — 3.0% | | | | | | | |
DISH Network Corp., Class A (a) | | | 430,000 | | | 14,159,900 | |
Gannett Co., Inc. | | | 800,000 | | | 12,264,000 | |
The Interpublic Group of Cos., Inc. | | | 1,300,000 | | | 14,833,000 | |
| | | | | | 41,256,900 | |
Multiline Retail — 1.0% | | | | | | | |
Dillard’s, Inc., Class A | | | 220,000 | | | 13,864,400 | |
Specialty Retail — 2.9% | | | | | | | |
Best Buy Co., Inc. | | | 610,000 | | | 14,444,800 | |
Foot Locker, Inc. | | | 370,000 | | | 11,488,500 | |
GameStop Corp., Class A (b) | | | 640,000 | | | 13,977,600 | |
| | | | | | 39,910,900 | |
Total Consumer Discretionary | | | | | | 125,652,000 | |
Consumer Staples — 5.0% | | | | | | | |
Beverages — 1.0% | | | | | | | |
Constellation Brands, Inc., Class A (a) | | | 610,000 | | | 14,389,900 | |
Food & Staples Retailing — 1.6% | | | | | | | |
The Kroger Co. | | | 590,000 | | | 14,295,700 | |
Safeway, Inc. | | | 400,000 | | | 8,084,000 | |
| | | | | | 22,379,700 | |
Food Products — 0.7% | | | | | | | |
Smithfield Foods, Inc. (a) | | | 410,000 | | | 9,032,300 | |
Household Products — 0.5% | | | | | | | |
The Procter & Gamble Co. | | | 100,000 | | | 6,721,000 | |
Tobacco — 1.2% | | | | | | | |
Philip Morris International, Inc. | | | 190,000 | | | 16,835,900 | |
Total Consumer Staples | | | | | | 69,358,800 | |
Energy — 13.7% | | | | | | | |
Oil, Gas & Consumable Fuels — 13.7% | | | | | | | |
Apache Corp. | | | 200,000 | | | 20,088,000 | |
Chevron Corp. | | | 500,000 | | | 53,620,000 | |
ConocoPhillips | | | 440,000 | | | 33,444,400 | |
Devon Energy Corp. | | | 130,000 | | | 9,245,600 | |
Marathon Oil Corp. | | | 560,000 | | | 17,752,000 | |
Marathon Petroleum Corp. | | | 390,000 | | | 16,910,400 | |
Murphy Oil Corp. | | | 90,000 | | | 5,064,300 | |
Tesoro Corp. (a) | | | 530,000 | | | 14,225,200 | |
Valero Energy Corp. | | | 660,000 | | | 17,008,200 | |
Total Energy | | | | | | 187,358,100 | |
| | | | | | | |
Common Stocks | | Shares | | Value | |
Financials — 16.9% | | | | | | | |
Consumer Finance — 1.3% | | | | | | | |
Discover Financial Services | | | 520,000 | | $ | 17,336,800 | |
Diversified Financial Services — 4.9% | | | | | | | |
JPMorgan Chase & Co. | | | 1,080,000 | | | 49,658,400 | |
The NASDAQ OMX Group, Inc. (a) | | | 550,000 | | | 14,245,000 | |
Wells Fargo & Co. | | | 90,000 | | | 3,072,600 | |
| | | | | | 66,976,000 | |
Insurance — 9.7% | | | | | | | |
Allied World Assurance Co. Holdings AG | | | 210,000 | | | 14,420,700 | |
American Financial Group, Inc. | | | 400,000 | | | 15,432,000 | |
Assurant, Inc. | | | 360,000 | | | 14,580,000 | |
Chubb Corp. | | | 90,000 | | | 6,219,900 | |
Fidelity National Financial, Inc., Class A | | | 300,000 | | | 5,409,000 | |
HCC Insurance Holdings, Inc. | | | 60,000 | | | 1,870,200 | |
Protective Life Corp. | | | 520,000 | | | 15,402,400 | |
Prudential Financial, Inc. | | | 310,000 | | | 19,650,900 | |
Reinsurance Group of America, Inc. | | | 250,000 | | | 14,867,500 | |
Unum Group | | | 610,000 | | | 14,932,800 | |
W.R. Berkley Corp. | | | 280,000 | | | 10,113,600 | |
| | | | | | 132,899,000 | |
Thrifts & Mortgage Finance — 1.0% | | | | | | | |
Capitol Federal Financial, Inc. | | | 200,000 | | | 2,372,000 | |
Washington Federal, Inc. | | | 700,000 | | | 11,774,000 | |
| | | | | | 14,146,000 | |
Total Financials | | | | | | 231,357,800 | |
Health Care — 15.3% | | | | | | | |
Health Care Equipment & Supplies — 1.2% | | | | | | | |
Zimmer Holdings, Inc. | | | 250,000 | | | 16,070,000 | |
Health Care Providers & Services — 7.0% | | | | | | | |
Aetna, Inc. | | | 350,000 | | | 17,556,000 | |
Cardinal Health, Inc. | | | 350,000 | | | 15,088,500 | |
Coventry Health Care, Inc. | | | 430,000 | | | 15,295,100 | |
Humana, Inc. | | | 190,000 | | | 17,571,200 | |
UnitedHealth Group, Inc. | | | 460,000 | | | 27,112,400 | |
WellPoint, Inc. | | | 50,000 | | | 3,690,000 | |
| | | | | | 96,313,200 | |
Pharmaceuticals — 7.1% | | | | | | | |
Abbott Laboratories | | | 240,000 | | | 14,709,600 | |
Eli Lilly & Co. | | | 480,000 | | | 19,329,600 | |
Forest Laboratories, Inc. (a) | | | 450,000 | | | 15,610,500 | |
Pfizer, Inc. | | | 2,110,000 | | | 47,812,600 | |
| | | | | | 97,462,300 | |
Total Health Care | | | | | | 209,845,500 | |
Industrials — 15.7% | | | | | | | |
Aerospace & Defense — 5.8% | | | | | | | |
Alliant Techsystems, Inc. | | | 120,000 | | | 6,014,400 | |
General Dynamics Corp. | | | 250,000 | | | 18,345,000 | |
L-3 Communications Holdings, Inc. | | | 220,000 | | | 15,569,400 | |
Lockheed Martin Corp. | | | 160,000 | | | 14,377,600 | |
Northrop Grumman Corp. | | | 300,000 | | | 18,324,000 | |
Raytheon Co. | | | 140,000 | | | 7,389,200 | |
| | | | | | 80,019,600 | |
Airlines — 1.0% | | | | | | | |
Copa Holdings SA, Class A | | | 170,000 | | | 13,464,000 | |
| | | |
See Notes to Financial Statements. |
| | | |
| BLACKROCK LARGE CAP SERIES FUNDS, INC. | MARCH 31, 2012 | 59 |
| |
| |
Schedule of Investments (continued) | Master Large Cap Value Portfolio |
(Percentages shown are based on Net Assets) |
| | | | | | | |
Common Stocks | | Shares | | Value | |
Industrials (concluded) | | | | | | | |
Commercial Services & Supplies — 1.1% | | | | | | | |
Corrections Corp. of America (a) | | | 550,000 | | $ | 15,020,500 | |
Construction & Engineering — 2.0% | | | | | | | |
Chicago Bridge & Iron Co. NV | | | 320,000 | | | 13,820,800 | |
URS Corp. | | | 330,000 | | | 14,031,600 | |
| | | | | | 27,852,400 | |
Industrial Conglomerates — 2.5% | | | | | | | |
General Electric Co. | | | 730,000 | | | 14,651,100 | |
Tyco International Ltd. | | | 340,000 | | | 19,101,200 | |
| | | | | | 33,752,300 | |
Machinery — 3.3% | | | | | | | |
AGCO Corp. (a) | | | 180,000 | | | 8,497,800 | |
CNH Global NV (a) | | | 370,000 | | | 14,689,000 | |
Oshkosh Corp. (a) | | | 280,000 | | | 6,487,600 | |
Parker Hannifin Corp. | | | 180,000 | | | 15,219,000 | |
| | | | | | 44,893,400 | |
Total Industrials | | | | | | 215,002,200 | |
Information Technology — 15.2% | | | | | | | |
Computers & Peripherals — 5.7% | | | | | | | |
Dell, Inc. (a)(b) | | | 970,000 | | | 16,102,000 | |
Hewlett-Packard Co. (a) | | | 180,000 | | | 4,289,400 | |
Lexmark International, Inc., Class A | | | 440,000 | | | 14,625,600 | |
QLogic Corp. (a) | | | 820,000 | | | 14,563,200 | |
Seagate Technology Plc | | | 490,000 | | | 13,205,500 | |
Western Digital Corp. (a) | | | 370,000 | | | 15,314,300 | |
| | | | | | 78,100,000 | |
Electronic Equipment, Instruments &
Components — 5.0% | | | | | | | |
Avnet, Inc. (a) | | | 410,000 | | | 14,919,900 | |
Ingram Micro, Inc., Class A (a) | | | 790,000 | | | 14,662,400 | |
Jabil Circuit, Inc. | | | 410,000 | | | 10,299,200 | |
Tech Data Corp. (a)(b) | | | 280,000 | | | 15,192,800 | |
Vishay Intertechnology, Inc. (a)(b) | | | 1,150,000 | | | 13,984,000 | |
| | | | | | 69,058,300 | |
Internet Software & Services — 0.2% | | | | | | | |
IAC/InterActive Corp | | | 50,000 | | | 2,454,500 | |
IT Services — 3.2% | | | | | | | |
Computer Sciences Corp. | | | 480,000 | | | 14,371,200 | |
DST Systems, Inc. | | | 270,000 | | | 14,642,100 | |
SAIC, Inc. (a)(b) | | | 1,130,000 | | | 14,916,000 | |
| | | | | | 43,929,300 | |
Semiconductors & Semiconductor
Equipment — 0.1% | | | | | | | |
Intel Corp. | | | 60,000 | | | 1,686,600 | |
Software — 1.0% | | | | | | | |
Symantec Corp. (a) | | | 750,000 | | | 14,025,000 | |
Total Information Technology | | | | | | 209,253,700 | |
Materials — 4.3% | | | | | | | |
Chemicals — 2.1% | | | | | | | |
CF Industries Holdings, Inc. | | | 80,000 | | | 14,612,000 | |
Cytec Industries, Inc. | | | 230,000 | | | 13,981,700 | |
| | | | | | 28,593,700 | |
Paper & Forest Products — 2.2% | | | | | | | |
Domtar Corp. | | | 160,000 | | | 15,260,800 | |
International Paper Co. | | | 450,000 | | | 15,795,000 | |
| | | | | | 31,055,800 | |
Total Materials | | | | | | 59,649,500 | |
| | | | | | | |
Common Stocks | | Shares | | Value | |
Telecommunication Services — 2.0% | | | | | | | |
Diversified Telecommunication Services — 1.3% | | | | | | | |
AT&T, Inc. | | | 310,000 | | $ | 9,681,300 | |
Verizon Communications, Inc. | | | 200,000 | | | 7,646,000 | |
| | | | | | 17,327,300 | |
Wireless Telecommunication Services — 0.7% | | | | | | | |
MetroPCS Communications, Inc. (a) | | | 1,060,000 | | | 9,561,200 | |
Total Telecommunication Services | | | | | | 26,888,500 | |
Utilities — 3.1% | | | | | | | |
Independent Power Producers &
Energy Traders — 1.9% | | | | | | | |
The AES Corp. (a) | | | 1,210,000 | | | 15,814,700 | |
NRG Energy, Inc. (a) | | | 680,000 | | | 10,655,600 | |
| | | | | | 26,470,300 | |
Multi-Utilities — 1.2% | | | | | | | |
Ameren Corp. | | | 490,000 | | | 15,964,200 | |
Total Utilities | | | | | | 42,434,500 | |
Total Long-Term Investments
(Cost — $1,167,861,649) — 100.4% | | | | | | 1,376,800,600 | |
| | | | | | |
| | | | | | | |
| | | | | | | |
Short-Term Securities | | Beneficial
Interest
(000) | | | | |
BlackRock Liquidity Series, LLC
Money Market Series, 0.24% (c)(d)(e) | | $ | 26,455 | | | 26,455,449 | |
Total Short-Term Securities
(Cost — $26,455,449) — 1.9% | | | | | | 26,455,449 | |
Total Investments (Cost — $1,194,317,098*) — 102.3% | | | | | | 1,403,256,049 | |
Liabilities in Excess of Other Assets — (2.3)% | | | | | | (31,585,175 | ) |
Net Assets — 100.0% | | | | | $ | 1,371,670,874 | |
| |
|
* | As of March 31, 2012, gross unrealized appreciation and gross unrealized depreciation based on cost for federal income tax purposes were as follows: |
| | | | |
Tax cost | | $ | 1,232,139,650 | |
Gross unrealized appreciation | | $ | 229,495,388 | |
Gross unrealized depreciation | | | (58,378,989 | ) |
Net unrealized appreciation | | $ | 171,116,399 | |
| |
(a) | Non-income producing security. |
| |
(b) | Security, or a portion of security, is on loan. |
| |
(c) | Investments in companies considered to be an affiliate of the Portfolio during the period, for purposes of Section 2(a)(3) of the Investment Company Act of 1940, as amended, were as follows: |
| | | | | | | | | | | | | |
Affiliate | | Shares/
Beneficial
Interest Held at
September 30,
2011 | | Net
Activity | | Shares/
Beneficial
Interest Held at
March 31,
2012 | | Income | |
BlackRock Liquidity
Funds, TempFund,
Institutional Class | | | — | | | — | | | — | | $ | 42 | |
BlackRock Liquidity
Series, LLC Money
Market Series | | $ | 23,226,367 | | $ | 3,229,082 | | $ | 26,455,449 | | $ | 1,041,696 | |
| |
(d) | Represents the current yield as of report date. |
| |
(e) | Security was purchased with the cash collateral from loaned securities. |
| | |
See Notes to Financial Statements. |
| | |
60 | BLACKROCK LARGE CAP SERIES FUNDS, INC. | MARCH 31, 2012 |
| |
| |
Schedule of Investments (concluded) | Master Large Cap Value Portfolio |
| | |
• | For Portfolio compliance purposes, the Portfolio’s sector and industry classifications refer to any one or more of the sector and industry sub-classifications used by one or more widely recognized market indexes or rating group indexes, and/or as defined by Portfolio management. These definitions may not apply for purposes of this report, which may combine such sector and industry sub-classifications for reporting ease. |
| | |
• | Fair Value Measurements — Various inputs are used in determining the fair value of investments. These inputs are categorized into a disclosure hierarchy consisting of three broad levels for financial statement purposes as follows: |
| | |
| • | Level 1 — unadjusted price quotations in active markets/exchanges for identical assets and liabilities |
| | |
| • | Level 2 — other observable inputs (including, but not limited to: quoted prices for similar assets or liabilities in markets that are active, quoted prices for identical or similar assets or liabilities in markets that are not active, inputs other than quoted prices that are observable for the assets or liabilities (such as interest rates, yield curves, volatilities, prepayment speeds, loss severities, credit risks and default rates) or other market-corroborated inputs) |
| | |
| • | Level 3 — unobservable inputs based on the best information available in the circumstances, to the extent observable inputs are not available (including the Portfolio’s own assumptions used in determining the fair value of investments) |
| | |
| Changes in valuation techniques may result in transfers into or out of an assigned level within the disclosure hierarchy. The categorization of a value determined for investments is based on the pricing transparency of the investment and is not necessarily an indication of the risks associated with investing in those securities. For information about the Portfolio’s policy regarding valuation of investments and other significant accounting policies, please refer to Note 1 of the Notes to Financial Statements. |
| | |
| The following table summarizes the inputs used as of March 31, 2012 in determining the fair valuation of the Portfolio’s investments: |
| | | | | | | | | | | | | |
Valuation Inputs | | Level 1 | | Level 2 | | Level 3 | | Total | |
Assets: | | | | | | | | | | | | | |
Investments: | | | | | | | | | | | | | |
Long-Term
Investments1 | | $ | 1,376,800,600 | | | — | | | — | | $ | 1,376,800,600 | |
Short-Term
Securities | | | — | | $ | 26,455,449 | | | — | | | 26,455,449 | |
Total | | $ | 1,376,800,600 | | $ | 26,455,449 | | | — | | $ | 1,403,256,049 | |
| | |
| 1 | See above Schedule of Investments for values in each sector and industry. |
| | | |
See Notes to Financial Statements. |
| | | |
| BLACKROCK LARGE CAP SERIES FUNDS, INC. | MARCH 31, 2012 | 61 |
| |
|
Statements of Assets and Liabilities | Master Large Cap Series LLC |
| | | | | | | | | | |
March 31, 2012 (Unaudited) | | Master Large
Cap Core
Portfolio | | Master Large
Cap Growth
Portfolio | | Master Large
Cap Value
Portfolio | |
Assets | | | | | | | | | | |
Investments at value — unaffiliated1,2 | | $ | 2,536,255,100 | | $ | 1,136,059,990 | | $ | 1,376,800,600 | |
Investments at value — affiliated3 | | | 87,182,715 | | | 46,238,405 | | | 26,455,449 | |
Investments sold receivable | | | 11,860,184 | | | 4,495,229 | | | 20,969,651 | |
Dividends receivable — unaffiliated | | | 2,035,752 | | | 990,375 | | | 1,085,187 | |
Securities lending income receivable — affiliated | | | 304,519 | | | 145,691 | | | 15,704 | |
Contributions receivable from investors | | | — | | | 418,602 | | | — | |
Dividends receivable — affiliated | | | — | | | 91 | | | 3 | |
Prepaid expenses | | | 33,801 | | | 7,088 | | | 31,059 | |
Total assets | | | 2,637,672,071 | | | 1,188,355,471 | | | 1,425,357,653 | |
| | | | | | | | | | |
Liabilities | | | | | | | | | | |
Collateral on securities loaned, at value | | | 87,182,715 | | | 46,238,405 | | | 26,455,449 | |
Bank overdraft | | | 4,592,397 | | | 634,091 | | | 2,148,619 | |
Investments purchased payable | | | 7,419,604 | | | 5,456,989 | | | 18,906,833 | |
Investment advisory fees payable | | | 1,168,061 | | | 518,111 | | | 608,624 | |
Other affiliates payable | | | 17,880 | | | 5,238 | | | 8,041 | |
Directors’ fees payable | | | 32,921 | | | 14,618 | | | 19,490 | |
Withdrawals payable to investors | | | 4,392,663 | | | — | | | 5,330,464 | |
Other accrued expenses payable | | | 181,457 | | | 92,729 | | | 209,259 | |
Total liabilities | | | 104,987,698 | | | 52,960,181 | | | 53,686,779 | |
Net Assets | | $ | 2,532,684,373 | | $ | 1,135,395,290 | | $ | 1,371,670,874 | |
| | | | | | | | | | |
Net Assets Consist of | | | | | | | | | | |
Investors’ capital | | $ | 2,087,019,602 | | $ | 933,014,870 | | $ | 1,162,731,923 | |
Net unrealized appreciation/depreciation | | | 445,664,771 | | | 202,380,420 | | | 208,938,951 | |
Net Assets | | $ | 2,532,684,373 | | $ | 1,135,395,290 | | $ | 1,371,670,874 | |
1 Investments at cost — unaffiliated | | $ | 2,090,590,329 | | $ | 933,679,570 | | $ | 1,167,861,649 | |
2 Securities loaned at value | | $ | 84,592,325 | | $ | 45,300,628 | | $ | 25,317,438 | |
3 Investments at cost — affiliated | | $ | 87,182,715 | | $ | 46,238,405 | | $ | 26,455,449 | |
| | | |
See Notes to Financial Statements. |
|
62 | | BLACKROCK LARGE CAP SERIES FUNDS, INC. | MARCH 31, 2012 |
| |
|
Statements of Operations | Master Large Cap Series LLC |
| | | | | | | | | | |
Six Months Ended March 31, 2012 (Unaudited) | | Master Large
Cap Core
Portfolio | | Master Large
Cap Growth
Portfolio | | Master Large
Cap Value
Portfolio | |
Investment Income | | | | | | | | | | |
Dividends — unaffiliated | | $ | 28,857,623 | | $ | 11,185,488 | | $ | 15,876,802 | |
Foreign taxes withheld | | | (553,988 | ) | | (225,075 | ) | | (342,563 | ) |
Securities lending — affiliated | | | 768,236 | | | 358,564 | | | 1,041,696 | |
Dividends — affiliated | | | 790 | | | 1,375 | | | 42 | |
Total income | | | 29,072,661 | | | 11,320,352 | | | 16,575,977 | |
| | | | | | | | | | |
Expenses | | | | | | | | | | |
Investment advisory | | | 6,032,059 | | | 2,852,578 | | | 3,583,264 | |
Accounting services | | | 245,110 | | | 106,478 | | | 169,908 | |
Custodian | | | 92,980 | | | 35,699 | | | 59,398 | |
Professional | | | 56,088 | | | 32,155 | | | 43,068 | |
Directors | | | 38,234 | | | 13,618 | | | 24,151 | |
Printing | | | 6,916 | | | 9,824 | | | 6,374 | |
Miscellaneous | | | 29,434 | | | 15,706 | | | 27,165 | |
Total expenses | | | 6,500,821 | | | 3,066,058 | | | 3,913,328 | |
Less fees waived by advisor | | | (689 | ) | | (774 | ) | | — | |
Total expenses after fees waived | | | 6,500,132 | | | 3,065,284 | | | 3,913,328 | |
Net investment income | | | 22,572,529 | | | 8,255,068 | | | 12,662,649 | |
| | | | | | | | | | |
Realized and Unrealized Gain | | | | | | | | | | |
Net realized gain from investments | | | 84,596,612 | | | 32,434,495 | | | 27,468,377 | |
Net change in unrealized appreciation/depreciation on investments | | | 517,981,627 | | | 254,248,483 | | | 294,100,280 | |
Total realized and unrealized gain | | | 602,578,239 | | | 286,682,978 | | | 321,568,657 | |
Net Increase in Net Assets Resulting from Operations | | $ | 625,150,768 | | $ | 294,938,046 | | $ | 334,231,306 | |
| | | |
See Notes to Financial Statements. |
| | | |
| BLACKROCK LARGE CAP SERIES FUNDS, INC. | MARCH 31, 2012 | 63 |
| |
|
Statements of Changes in Net Assets | Master Large Cap Series LLC |
| | | | | | | | | | | | | | |
| | Master Large Cap Core Portfolio | | | Master Large Cap Growth Portfolio | |
Increase (Decrease) in Net Assets: | | Six Months
Ended
March 31,
2012
(Unaudited) | | Year Ended
September 30,
2011 | | | Six Months
Ended
March 31,
2012
(Unaudited) | | Year Ended
September 30,
2011 | |
Operations | | | | | | | | | | | | | | |
Net investment income | | $ | 22,572,529 | | $ | 36,709,241 | | | $ | 8,255,068 | | $ | 9,136,074 | |
Net realized gain | | | 84,596,612 | | | 416,733,032 | | | | 32,434,495 | | | 98,414,186 | |
Net change in unrealized appreciation/depreciation | | | 517,981,627 | | | (385,934,163 | ) | | | 254,248,483 | | | (104,232,883 | ) |
Net increase in net assets resulting from operations | | | 625,150,768 | | | 67,508,110 | | | | 294,938,046 | | | 3,317,377 | |
| | | | | | | | | | | | | | |
Capital Transactions | | | | | | | | | | | | | | |
Proceeds from contributions | | | 232,807,352 | | | 406,268,108 | | | | 182,728,459 | | | 735,119,380 | |
Value of withdrawals | | | (631,987,324 | ) | | (1,376,548,462 | ) | | | (337,550,428 | ) | | (414,991,509 | ) |
Net increase (decrease) in net assets derived from capital transactions | | | (399,179,972 | ) | | (970,280,354 | ) | | | (154,821,969 | ) | | 320,127,871 | |
| | | | | | | | | | | | | | |
Net Assets | | | | | | | | | | | | | | |
Total increase (decrease) in net assets | | | 225,970,796 | | | (902,772,244 | ) | | | 140,116,077 | | | 323,445,248 | |
Beginning of period | | | 2,306,713,577 | | | 3,209,485,821 | | | | 995,279,213 | | | 671,833,965 | |
End of period | | $ | 2,532,684,373 | | $ | 2,306,713,577 | | | $ | 1,135,395,290 | | $ | 995,279,213 | |
| | | |
See Notes to Financial Statements. |
|
64 | | BLACKROCK LARGE CAP SERIES FUNDS, INC. | MARCH 31, 2012 |
| |
|
Statements of Changes in Net Assets (concluded) | Master Large Cap Series LLC |
| | | | | | | |
| | Master Large Cap Value Portfolio | |
Increase (Decrease) in Net Assets: | | Six Months
Ended
March 31,
2012
(Unaudited) | | Year Ended
September 30,
2011 | |
Operations | | | | | | | |
Net investment income | | $ | 12,662,649 | | $ | 25,257,741 | |
Net realized gain | | | 27,468,377 | | | 213,756,849 | |
Net change in unrealized appreciation/depreciation | | | 294,100,280 | | | (191,911,553 | ) |
Net increase in net assets resulting from operations | | | 334,231,306 | | | 47,103,037 | |
| | | | | | | |
Capital Transactions | | | | | | | |
Proceeds from contributions | | | 117,433,520 | | | 499,193,583 | |
Value of withdrawals | | | (411,095,778 | ) | | (1,388,336,955 | ) |
Net decrease in net assets derived from capital transactions | | | (293,662,258 | ) | | (889,143,372 | ) |
| | | | | | | |
Net Assets | | | | | | | |
Total increase (decrease) in net assets | | | 40,569,048 | | | (842,040,335 | ) |
Beginning of period | | | 1,331,101,826 | | | 2,173,142,161 | |
End of period | | $ | 1,371,670,874 | | $ | 1,331,101,826 | |
| | | |
See Notes to Financial Statements. |
| | | |
| BLACKROCK LARGE CAP SERIES FUNDS, INC. | MARCH 31, 2012 | 65 |
| |
| |
Financial Highlights | Master Large Cap Series LLC |
| | | | | | | | | | | | | | | | | | | | | | |
| | Master Large Cap Core Portfolio | |
| | Six Months
Ended
March 31,
2012
(Unaudited)
| | | | | | Period
November 1,
2008 to
September 30,
2009
| | | | | | | |
| | | Year Ended
September 30,
| | | | | | | | |
| | | | | Year Ended October 31, | |
| | | 2011 | | 2010 | | | 2008 | | 2007 | | 2006 | |
Total Investment Return | | | | | | | | | | | | | | | | | | | | | | |
Total investment return | | | 27.98 | %1 | | (1.61 | )% | | 6.16 | % | | 12.63 | %1,2 | | (38.84 | )% | | 13.94 | % | | 17.32 | % |
| | | | | | | | | | | | | | | | | | | | | | |
Ratios to Average Net Assets | | | | | | | | | | | | | | | | | | | | | | |
Total expenses | | | 0.51 | %3 | | 0.49 | % | | 0.49 | % | | 0.50 | %3 | | 0.50 | % | | 0.49 | % | | 0.49 | % |
Total expenses after fees waived | | | 0.51 | %3 | | 0.49 | % | | 0.49 | % | | 0.50 | %3 | | 0.50 | % | | 0.49 | % | | 0.49 | % |
Net investment income | | | 1.76 | %3 | | 1.13 | % | | 1.11 | % | | 1.56 | %3 | | 0.93 | % | | 0.63 | % | | 0.58 | % |
| | | | | | | | | | | | | | | | | | | | | | |
Supplemental Data | | | | | | | | | | | | | | | | | | | | | | |
Net assets, end of period (000) | | $ | 2,532,684 | | $ | 2,306,714 | | $ | 3,209,486 | | $ | 3,946,322 | | $ | 2,843,515 | | $ | 5,649,731 | | $ | 3,876,639 | |
Portfolio turnover | | | 59 | % | | 129 | % | | 173 | % | | 168 | % | | 109 | % | | 96 | % | | 88 | % |
| | |
| 1 | Aggregate total investment return. |
| | |
| 2 | Includes proceeds received from a settlement of litigation, which impacted the Portfolio’s total investment return. Not including these proceeds, the Portfolio’s total investment return would have been 12.39%. |
| | |
| 3 | Annualized. |
| | |
See Notes to Financial Statements. |
| | |
66 | BLACKROCK LARGE CAP SERIES FUNDS, INC. | MARCH 31, 2012 |
| |
| |
Financial Highlights (continued) | Master Large Cap Series LLC |
| | | | | | | | | | | | | | | | | | | | | | |
| | Master Large Cap Growth Portfolio | |
| | Six Months
Ended
March 31,
2012
(Unaudited)
| | | | | | Period
November 1,
2008 to
September 30,
2009
| | | | | | | |
| | | Year Ended
September 30,
| | | | | | | | |
| | | | | Year Ended October 31, | |
| | | 2011 | | 2010 | | | 2008 | | 2007 | | 2006 | |
Total Investment Return | | | | | | | | | | | | | | | | | | | | | | |
Total investment return | | | 29.93 | %1 | | 0.72 | % | | 7.68 | % | | 20.49 | %1,2 | | (37.96 | )% | | 17.47 | % | | 14.05 | % |
| | | | | | | | | | | | | | | | | | | | | | |
Ratios to Average Net Assets | | | | | | | | | | | | | | | | | | | | | | |
Total expenses | | | 0.54 | %3 | | 0.54 | % | | 0.56 | % | | 0.57 | %3 | | 0.56 | % | | 0.56 | % | | 0.56 | % |
Total expenses after fees waived | | | 0.54 | %3 | | 0.54 | % | | 0.56 | % | | 0.57 | %3 | | 0.56 | % | | 0.56 | % | | 0.56 | % |
Net investment income | | | 1.45 | %3 | | 0.93 | % | | 0.73 | % | | 0.81 | %3 | | 0.54 | % | | 0.25 | % | | 0.26 | % |
| | | | | | | | | | | | | | | | | | | | | | |
Supplemental Data | | | | | | | | | | | | | | | | | | | | | | |
Net assets, end of period (000) | | $ | 1,135,395 | | $ | 995,279 | | $ | 671,834 | | $ | 733,888 | | $ | 665,963 | | $ | 1,233,995 | | $ | 785,377 | |
Portfolio turnover | | | 69 | % | | 169 | % | | 232 | % | | 242 | % | | 144 | % | | 87 | % | | 117 | % |
| | |
| 1 | Aggregate total investment return. |
| | |
| 2 | Includes proceeds received from a settlement of litigation, which impacted the Portfolio’s total investment return. Not including these proceeds, the Portfolio’s total investment return would have been 20.23%. |
| | |
| 3 | Annualized. |
| | | |
See Notes to Financial Statements. |
| | | |
| BLACKROCK LARGE CAP SERIES FUNDS, INC. | MARCH 31, 2012 | 67 |
| |
| |
Financial Highlights (concluded) | Master Large Cap Series LLC |
| | | | | | | | | | | | | | | | | | | | | | |
| | Master Large Cap Value Portfolio | |
| | Six Months
Ended
March 31,
2012
(Unaudited)
| | | | | | | | Period
November 1,
2008 to
September 30,
2009
| | | | | | | | | | |
| | | Year Ended
September 30,
| | | | | | | | | | | |
| | | | | Year Ended October 31, | |
| | | 2011 | | 2010 | | | 2008 | | 2007 | | 2006 | |
Total Investment Return | | | | | | | | | | | | | | | | | | | | | | |
Total investment return | | | 26.52 | %1 | | (4.34 | )% | | 4.36 | % | | 9.03 | %1,2 | | (36.54 | )% | | 12.72 | % | | 18.48 | % |
| | | | | | | | | | | | | | | | | | | | | | |
Ratios to Average Net Assets | | | | | | | | | | | | | | | | | | | | | | |
Total expenses | | | 0.55 | %3 | | 0.54 | % | | 0.53 | % | | 0.54 | %3 | | 0.51 | % | | 0.51 | % | | 0.53 | % |
Total expenses after fees waived | | | 0.55 | %3 | | 0.54 | % | | 0.53 | % | | 0.54 | %3 | | 0.51 | % | | 0.51 | % | | 0.53 | % |
Net investment income | | | 1.77 | %3 | | 1.28 | % | | 1.35 | % | | 1.88 | %3 | | 1.22 | % | | 0.95 | % | | 0.73 | % |
| | | | | | | | | | | | | | | | | | | | | | |
Supplemental Data | | | | | | | | | | | | | | | | | | | | | | |
Net assets, end of period (000) | | $ | 1,371,671 | | $ | 1,331,102 | | $ | 2,173,142 | | $ | 2,645,858 | | $ | 3,063,116 | | $ | 5,392,155 | | $ | 3,927,926 | |
Portfolio turnover | | | 79 | % | | 156 | % | | 183 | % | | 151 | % | | 108 | % | | 72 | % | | 71 | % |
| | |
| 1 | Aggregate total investment return. |
| | |
| 2 | Includes proceeds received from a settlement of litigation, which impacted the Portfolio’s total investment return. Not including these proceeds, the Portfolio’s total investment return would have been 8.61%. |
| | |
| 3 | Annualized. |
| | |
See Notes to Financial Statements. |
| | |
68 | BLACKROCK LARGE CAP SERIES FUNDS, INC. | MARCH 31, 2012 |
| |
| |
Notes to Financial Statements (Unaudited) | Master Large Cap Series LLC |
1. Organization and Significant Accounting Policies:
Master Large Cap Core Portfolio, Master Large Cap Growth Portfolio and Master Large Cap Value Portfolio (collectively the “Portfolios” or individually a “Portfolio”) are each Series of Master Large Cap Series LLC (the “Master LLC”). The Master LLC is registered under the Investment Company Act of 1940, as amended (the “1940 Act”), as an open-end management investment company and is organized as a Delaware limited liability company. Each Portfolio is classified as diversified. The Limited Liability Company Agreement permits the Board of Directors of the Master LLC (the “Board”) to issue nontransferable interests in the Master LLC, subject to certain limitations. The Portfolio’s financial statements are prepared in conformity with accounting principles generally accepted in the United States of America (“US GAAP”), which may require management to make estimates and assumptions that affect the reported amounts and disclosures in the financial statements. Actual results could differ from those estimates.
The following is a summary of significant accounting policies followed by the Portfolios:
Valuation: US GAAP defines fair value as the price the Portfolios would receive to sell an asset or pay to transfer a liability in an orderly transaction between market participants at the measurement date. The Portfolios fair value their financial instruments at market value using independent dealers or pricing services under policies approved by the Board. Equity investments traded on a recognized securities exchange or the NASDAQ Global Market System (“NASDAQ”) are valued at the last reported sale price that day or the NASDAQ official closing price, if applicable. For equity investments traded on more than one exchange, the last reported sale price on the exchange where the stock is primarily traded is used. Equity investments traded on a recognized exchange for which there were no sales on that day are valued at the last available bid (long positions) or ask (short positions) price. If no bid or ask price is available, the prior day’s price will be used, unless it is determined that such prior day’s price no longer reflects the fair value of the security. Investments in open-end registered investment companies are valued at NAV each business day. Short-term securities with remaining maturities of 60 days or less may be valued at amortized cost, which approximates fair value.
The Portfolios value their investments in BlackRock Liquidity Series, LLC Money Market Series (the “Money Market Series”) at fair value, which is ordinarily based upon their pro rata ownership in the underlying fund’s net assets. The Money Market Series seeks current income consistent with maintaining liquidity and preserving capital. Although the Money Market Series is not registered under the 1940 Act, its investments will follow the parameters of investments by a money market fund that is subject to Rule 2a-7 under the 1940 Act. The Portfolios may withdraw up to 25% of their investment daily, although the manager of the Money Market Series, in its sole discretion, may permit an investor to withdraw more than 25% on any one day.
In the event that application of these methods of valuation results in a price for an investment which is deemed not to be representative of the market value of such investment or if a price is not available, the investment will be valued in accordance with a policy approved by the Board as reflecting fair value (“Fair Value Assets”). When determining the price for Fair Value Assets, the investment advisor and/or the sub-advisor seeks to determine the price that each Portfolio might reasonably expect to receive from the current sale of that asset in an arm’s-length transaction. Fair value determinations shall be based upon all available factors that the investment advisor and/or sub-advisor deems relevant. The pricing of all Fair Value Assets is subsequently reported to the Board or a committee thereof.
Investment Transactions and Investment Income: For financial reporting purposes, investment transactions are recorded on the dates the transactions are entered into (the trade dates). Realized gains and losses on investment transactions are determined on the identified cost basis. Dividend income is recorded on the ex-dividend dates. Dividends from foreign securities where the ex-dividend date may have passed are subsequently recorded when the Portfolios are informed of the ex-dividend date. Under the applicable foreign tax laws, a withholding tax at various rates may be imposed on capital gains, dividends and interest. Upon notification from issuers, some of the dividend income received from a real estate investment trust may be redesignated as a reduction of cost of the related investment and/or realized gain. Interest income, including amortization and accretion of premiums and discounts on debt securities, is recognized on the accrual basis.
Securities Lending: The Portfolios may lend securities to approved borrowers, such as banks, brokers and other financial institutions. The borrower pledges cash, securities issued or guaranteed by the US government or irrevocable letters of credit issued by a bank as collateral, which will be maintained at all times in an amount equal to at least 100% of the current market value of the loaned securities. The market value of the loaned securities is determined at the close of business of the Portfolios and any additional required collateral is delivered to the Portfolios on the next business day. Securities lending income, as disclosed in the Statements of Operations, represents the income earned from the investment of the cash collateral, net of rebates paid to, or fees paid by, borrowers and less the fees paid to the securities lending agent. During the term of the loan, the Portfolios earn dividend or interest income on the securities loaned but does not receive interest income on the securities received as collateral. Loans of securities are terminable at any time and the borrower, after notice, is required to return borrowed securities within the standard time period for settlement of securities transactions. In the event that the borrower defaults on its obligation to return borrowed securities because of insolvency or for any other reason, the Portfolios could experience delays and costs in gaining access to the collateral. The Portfolios also could suffer a loss if the value of an investment purchased with cash collateral falls below the market value of loaned securities or if the value of an investment purchased with cash collateral falls below the value of the original cash collateral received. During the six months ended March 31, 2012, any securities on loan were collateralized by cash.
Income Taxes: Each Portfolio of the Master LLC is classified as a partnership for federal income tax purposes. As such, each investor in each Portfolio is treated as the owner of its proportionate share of net assets, income, expenses and realized and unrealized gains and losses of each Portfolio. Therefore, no federal income tax provision is required. It is intended that each Portfolio’s assets will be managed so an investor in each Portfolio can satisfy the requirements of Subchapter M of the Internal Revenue Code of 1986, as amended.
The Portfolios file US federal and various state and local tax returns. The statute of limitations on the Portfolios’ US federal tax returns remains open
| | | |
| | | |
| BLACKROCK LARGE CAP SERIES FUNDS, INC. | MARCH 31, 2012 | 69 |
| |
| |
Notes to Financial Statements (continued) | Master Large Cap Series LLC |
for each of the two years ended September 30, 2011, the period ended September 30, 2009 and the year ended October 31, 2008. In May, 2011, the Internal Revenue Service commenced an examination of Master Large Cap Growth’s US federal tax return for the year ended September 30, 2009. The examination was completed in February 2012 and did not result in any adjustments to the tax return. The statutes of limitations on the Portfolios’ state and local tax returns may remain open for an additional year depending upon the jurisdiction. Management does not believe there are any uncertain tax positions that require recognition of a tax liability.
Recent Accounting Standards: In May 2011, the Financial Accounting Standards Board (the ��FASB”) issued amended guidance to improve disclosure about fair value measurements which will require the following disclosures for fair value measurements categorized as Level 3: quantitative information about unobservable inputs and assumptions used in the fair value measurement, a description of the valuation policies and procedures and a narrative description of the sensitivity of the fair value measurement to changes in unobservable inputs and the interrelationships between those unobservable inputs. In addition, the amounts and reasons for all transfers in and out of Level 1 and Level 2 will be required to be disclosed as well as disclosure of the level in the fair value hierarchy of assets and liabilities not recorded at fair value but where fair value is disclosed. The amended guidance is effective for financial statements for fiscal years beginning after December 15, 2011, and interim periods within those fiscal years. Management is evaluating the impact of this guidance on the Portfolios’ financial statement disclosures.
In December 2011, the FASB issued guidance that will expand current disclosure requirements on the offsetting of certain assets and liabilities. The new disclosures will be required for investments and derivative financial instruments subject to master netting or similar agreements which are eligible for offset in the Statements of Assets and Liabilities and will require an entity to disclose both gross and net information about such investments and transactions in the financial statements. The guidance is effective for financial statements with fiscal years beginning on or after January 1, 2013, and interim periods within those fiscal years. Management is evaluating the impact of this guidance on the Portfolios’ financial statement disclosures.
Other: Expenses directly related to one of the Portfolios is charged to that Portfolio. Other operating expenses shared by several funds are pro rated among those funds on the basis of relative net assets or other appropriate methods.
Each Portfolio has an arrangement with the custodian whereby fees may be reduced by credits earned on uninvested cash balances, which, if applicable, are shown as fees paid indirectly in the Statements of Operations. The custodian imposes fees on overdrawn cash balances, which can be offset by accumulated credits earned or may result in additional custody charges.
2. Investment Advisory Agreement and Other Transactions with Affiliates:
The PNC Financial Services Group, Inc. (“PNC”) and Barclays Bank PLC (“Barclays”) are the largest stockholders of BlackRock, Inc. (“BlackRock”). Due to the ownership structure, PNC is an affiliate for 1940 Act purposes, but Barclays is not.
The Master LLC, on behalf of each Portfolio, entered into an Investment Advisory Agreement with BlackRock Advisors, LLC (the “Manager”), the Portfolios’ investment advisor, an indirect, wholly owned subsidiary of BlackRock, to provide investment advisory and administration services. The Manager is responsible for the management of each Portfolio and provides the necessary personnel, facilities, equipment and certain other services necessary to the operations of each Portfolio. For such services, each Portfolio pays the Manager a monthly fee based on a percentage of each Portfolio’s average daily net assets at the following annual rates:
| | | | |
Master Large Cap Core Portfolio | | | | |
| | | | |
Average Daily Net Assets | | Rate | |
Not exceeding $1 billion | | | 0.50 | % |
In excess of $1 billion, but not exceeding $5 billion | | | 0.45 | % |
In excess of $5 billion | | | 0.40 | % |
| | | | |
Master Large Cap Growth Portfolio | | | | |
| | | | |
Average Daily Net Assets | | Rate | |
Not exceeding $5 billion | | | 0.50 | % |
In excess of $5 billion | | | 0.45 | % |
| | | | |
Master Large Cap Value Portfolio | | | | |
| | | | |
Average Daily Net Assets | | Rate | |
Not exceeding $3 billion | | | 0.50 | % |
In excess of $3 billion | | | 0.45 | % |
The Manager voluntarily agreed to waive its investment advisory fees by the amount of investment advisory fees each Portfolio pays to the Manager indirectly through its investment in affiliated money market funds. However, the Manager does not waive its investment advisory fees by the amount of investment advisory fees paid in connection with each Portfolio’s investment in other affiliated investment companies, if any. These amounts are shown as, or included in, fees waived by advisor in the Statements of Operations.
The Manager entered into a sub-advisory agreement with BlackRock Investment Management LLC (“BIM”), an affiliate of the Manager. The Manager pays BIM, for services it provides, a monthly fee that is a percentage of the investment advisory fees paid by each Portfolio to the Manager.
For the six months ended March 31, 2012, the Portfolios reimbursed the Manager for certain accounting services, which is included in accounting services in the Statements of Operations. The reimbursements were as follows:
| | | | |
Master Large Cap Core Portfolio | | $ | 19,917 | |
Master Large Cap Growth Portfolio | | $ | 5,022 | |
Master Large Cap Value Portfolio | | $ | 8,673 | |
The Portfolios received an exemptive order from the SEC permitting them, among other things, to pay an affiliated securities lending agent a fee based on a share of the income derived from the securities lending activities and has retained BIM as the securities lending agent. BIM may, on behalf of the Portfolios, invest cash collateral received by the Portfolios for such loans, among other things, in a private investment company managed by the
| | |
| | |
70 | BLACKROCK LARGE CAP SERIES FUNDS, INC. | MARCH 31, 2012 |
| |
| |
Notes to Financial Statements (concluded) | Master Large Cap Series LLC |
Manager or in registered money market funds advised by the Manager or its affiliates. As securities lending agent, BIM is responsible for all transaction fees and all other operational costs relating to securities lending activities, other than extraordinary expenses. BIM does not receive any fees for managing the cash collateral. The market value of securities on loan and the value of the related collateral, if applicable, are shown in the Statements of Assets and Liabilities as securities loaned at value and collateral on securities loaned at value, respectively. The cash collateral invested by BIM is disclosed in the Schedules of Investments, if any. Securities lending income is equal to the total of income earned from the reinvestment of cash collateral, net of rebates paid to, or fees paid by, borrowers of securities. The Portfolios retain 65% of securities lending income and pays a fee to BIM equal to 35% of such income. The share of income earned by the Portfolios on the reinvestment of cash collateral is shown as securities lending — affiliated in the Statements of Operations. For the six months ended March 31, 2012, BIM received the following in securities lending agent fees related to securities lending activities for the Portfolios:
| | | | |
Master Large Cap Core Portfolio | | $ | 413,516 | |
Master Large Cap Growth Portfolio | | $ | 192,988 | |
Master Large Cap Value Portfolio | | $ | 558,183 | |
Certain officers and/or directors of the Master LLC are officers and/or directors of BlackRock or its affiliates.
3. Investments:
Purchases and sales of investments, excluding short-term securities for the six months ended March 31, 2012, were as follows:
| | | | | | | |
| | Purchases | | Sales | |
Master Large Cap Core Portfolio | | $ | 1,488,911,894 | | $ | 1,865,811,756 | |
Master Large Cap Growth Portfolio | | $ | 776,697,355 | | $ | 921,615,071 | |
Master Large Cap Value Portfolio | | $ | 1,118,280,646 | | $ | 1,395,697,843 | |
4. Borrowings:
The Master LLC, on behalf of the Portfolios, along with certain other funds managed by the Manager and its affiliates, is a party to a $500 million credit agreement with a group of lenders. Each Portfolio may borrow under the credit agreement to fund shareholder redemptions. Effective November 2010 to November 2011, the credit agreement had the following terms: a commitment fee of 0.08% per annum based on each Portfolio’s pro rata share of the unused portion of the credit agreement and interest at a rate equal to the higher of (a) the one-month LIBOR plus 1.00% per annum or (b) the Fed Funds rate plus 1.00% per annum on amounts borrowed. In addition, each Portfolio paid administration and arrangement fees which were allocated to each Portfolio based on its net assets as of October 31, 2010. The credit agreement which expired in November 2011, was renewed until November 2012. Effective November 2011 to November 2012, the credit agreement has the following terms: a commitment fee of 0.065% per annum based on each Portfolio’s pro rata share of the unused portion of the credit agreement and interest at a rate equal to the higher of (a) the one-month LIBOR plus 0.80% per annum or (b) the Fed Funds rate plus 0.80% per annum on amounts borrowed. In addition, each Portfolio paid administration and arrangement fees which were allocated to the Portfolios based on their net assets as of October 31, 2011. The Portfolios did not borrow under the credit agreement during the six months ended March 31, 2012.
5. Concentration, Market and Credit Risk:
In the normal course of business, the Portfolios invest in securities and enter into transactions where risks exist due to fluctuations in the market (market risk) or failure of the issuer of a security to meet all its obligations (issuer credit risk). The value of securities held by the Portfolios may decline in response to certain events, including those directly involving the issuers whose securities are owned by the Portfolios; conditions affecting the general economy; overall market changes; local, regional or global political, social or economic instability; and currency and interest rate and price fluctuations. Similar to issuer credit risk, the Portfolios may be exposed to counterparty credit risk, or the risk that an entity with which the Portfolios have unsettled or open transactions may fail to or be unable to perform on its commitments. The Portfolios manage counterparty credit risk by entering into transactions only with counterparties that they believe have the financial resources to honor their obligations and by monitoring the financial stability of those counterparties. Financial assets, which potentially expose the Portfolios to market, issuer and counterparty credit risks, consist principally of financial instruments and receivables due from counterparties. The extent of the Portfolios’ exposure to market, issuer and counterparty credit risks with respect to these financial assets is generally approximated by their value recorded in the Portfolios’ Statements of Assets and Liabilities, less any collateral held by the Portfolios.
As of March 31, 2012, Master Large Cap Core Portfolio and Master Large Cap Growth Portfolio invested a significant portion of their assets in securities in the information technology sector. Changes in economic conditions affecting the information technology sector would have a greater impact on the Portfolios and could affect the value, income and/or liquidity of positions in such securities.
6. Subsequent Events:
Management has evaluated the impact of all subsequent events on each Portfolio through the date the financial statements were issued and has determined that there were no subsequent events requiring adjustment or additional disclosure in the financial statements.
| | | |
| | | |
| BLACKROCK LARGE CAP SERIES FUNDS, INC. | MARCH 31, 2012 | 71 |
|
Ronald W. Forbes, Co-Chairman of the Board and Director |
Rodney D. Johnson, Co-Chairman of the Board and Director |
Paul L. Audet, Director |
David O. Beim, Director |
Henry Gabbay, Director |
Dr. Matina S. Horner, Director |
Herbert I. London, Director |
Cynthia A. Montgomery, Director |
Joseph P. Platt, Director |
Robert C. Robb, Jr., Director |
Toby Rosenblatt, Director |
Kenneth L. Urish, Director |
Frederick W. Winter, Director |
John M. Perlowski, President and Chief Executive Officer |
Brendan Kyne, Vice President |
Neal Andrews, Chief Financial Officer |
Jay Fife, Treasurer |
Brian Kindelan, Chief Compliance Officer and
Anti-Money Laundering Officer |
Ira P. Shapiro, Secretary |
|
Investment Advisor |
BlackRock Advisors, LLC |
Wilmington, DE 19809 |
|
Sub-Advisor1 |
BlackRock Investment Management, LLC |
Princeton, NJ 08540 |
|
Custodian |
Brown Brothers Harriman & Co. |
Boston, MA 02109 |
|
Transfer Agent |
BNY Mellon Investment Servicing (US) Inc. |
Wilmington, DE 19809 |
|
Accounting Agent |
State Street Bank and Trust Company |
Boston, MA 02110 |
|
Distributor |
BlackRock Investments, LLC
New York, NY 10022 |
|
Independent Registered Public Accounting Firm |
Deloitte & Touche LLP |
Boston, MA 02116 |
|
Legal Counsel |
Sidley Austin LLP |
New York, NY 10019 |
|
Address of the Funds |
100 Bellevue Parkway |
Wilmington, DE 19809 |
| |
1 | For BlackRock Large Cap Core Plus Fund. |
| | |
| | |
72 | BLACKROCK LARGE CAP SERIES FUNDS, INC. | MARCH 31, 2012 |
|
|
Additional Information |
|
General Information |
Electronic Delivery
Electronic copies of most financial reports and prospectuses are available on the Funds’ website or shareholders can sign up for e-mail notifications of quarterly statements, annual and semi-annual reports and prospectuses by enrolling in the Funds’ electronic delivery program.
To enroll:
Shareholders Who Hold Accounts with Investment Advisors, Banks or Brokerages:
Please contact your financial advisor. Please note that not all investment advisors, banks or brokerages may offer this service.
Shareholders Who Hold Accounts Directly with BlackRock:
1) Access the BlackRock website at
http://www.blackrock.com/edelivery
2) Select “eDelivery” under the “More Information” section
3) Log into your account
Householding
The Funds will mail only one copy of shareholder documents, including prospectuses, annual and semi-annual reports and proxy statements, to shareholders with multiple accounts at the same address. This practice is commonly called “householding” and is intended to reduce expenses and eliminate duplicate mailings of shareholder documents. Mailings of your shareholder documents may be householded indefinitely unless you instruct us otherwise. If you do not want the mailing of these documents to be combined with those for other members of your household, please call the Funds at (800) 441-7762.
Availability of Quarterly Schedule of Investments
The Funds/Master LLC file their complete schedule of portfolio holdings with the SEC for the first and third quarters of each fiscal year on Form N-Q. The Funds’/Master LLC’s Forms N-Q are available on the SEC’s website at http://www.sec.gov and may also be reviewed and copied at the SEC’s Public Reference Room in Washington, D.C. Information on how to access documents on the SEC’s website without charge may be obtained by calling (800) SEC-0330. The Funds’/Master LLC’s Forms N-Q may also be obtained upon request and without charge by calling (800) 441-7762.
Availability of Proxy Voting Policies and Procedures
A description of the policies and procedures that each Fund/Master LLC uses to determine how to vote proxies relating to portfolio securities is available (1) without charge, upon request, by calling (800) 441-7762; (2) at http://www.blackrock.com; and (3) on the SEC’s website at http://www.sec.gov.
Availability of Proxy Voting Record
Information about how the Funds/Master LLC voted proxies relating to securities held in each Fund’s/Master LLC’s portfolios during the most recent 12-month period ended June 30 is available upon request and without charge (1) at http://www.blackrock.com or by calling (800) 441-7762 and (2) on the SEC’s website at http://www.sec.gov.
| | | |
| | | |
| BLACKROCK LARGE CAP SERIES FUNDS, INC. | MARCH 31, 2012 | 73 |
|
|
Additional Information (concluded) |
|
Shareholder Privileges |
Account Information
Call us at (800) 441-7762 from 8:00 AM to 6:00 PM EST on any business day to get information about your account balances, recent transactions and share prices. You can also reach us on the Web at http://www.blackrock.com/funds.
Automatic Investment Plans
Investor Class shareholders who want to invest regularly can arrange to have $50 or more automatically deducted from their checking or savings account and invested in any of the BlackRock funds.
Systematic Withdrawal Plans
Investor Class shareholders can establish a systematic withdrawal plan and receive periodic payments of $50 or more from their BlackRock funds, as long as their account balance is at least $10,000.
Retirement Plans
Shareholders may make investments in conjunction with Traditional, Rollover, Roth, Coverdell, Simple IRAs, SEP IRAs and 403(b) Plans.
|
BlackRock Privacy Principles |
BlackRock is committed to maintaining the privacy of its current and former fund investors and individual clients (collectively, “Clients”) and to safeguarding their non-public personal information. The following information is provided to help you understand what personal information BlackRock collects, how we protect that information and why in certain cases we share such information with select parties.
If you are located in a jurisdiction where specific laws, rules or regulations require BlackRock to provide you with additional or different privacy-related rights beyond what is set forth below, then BlackRock will comply with those specific laws, rules or regulations.
BlackRock obtains or verifies personal non-public information from and about you from different sources, including the following: (i) information we receive from you or, if applicable, your financial intermediary, on applications, forms or other documents; (ii) information about your transactions with us, our affiliates, or others; (iii) information we receive from a consumer reporting agency; and (iv) from visits to our websites.
BlackRock does not sell or disclose to non-affiliated third parties any non-public personal information about its Clients, except as permitted by law or as is necessary to respond to regulatory requests or to service Client accounts. These non-affiliated third parties are required to protect the confidentiality and security of this information and to use it only for its intended purpose.
We may share information with our affiliates to service your account or to provide you with information about other BlackRock products or services that may be of interest to you. In addition, BlackRock restricts access to non-public personal information about its Clients to those BlackRock employees with a legitimate business need for the information. BlackRock maintains physical, electronic and procedural safeguards that are designed to protect the non-public personal information of its Clients, including procedures relating to the proper storage and disposal of such information.
| | |
| | |
74 | BLACKROCK LARGE CAP SERIES FUNDS, INC. | MARCH 31, 2012 |
|
|
A World-Class Mutual Fund Family |
BlackRock offers a diverse lineup of open-end mutual funds crossing all investment styles and managed by experts in equity, fixed income and tax-exempt investing.
|
Equity Funds |
|
BlackRock ACWI ex-US Index Fund |
BlackRock All-Cap Energy & Resources Portfolio |
BlackRock Balanced Capital Fund† |
BlackRock Basic Value Fund |
BlackRock Capital Appreciation Fund |
BlackRock China Fund |
BlackRock Commodity Strategies Fund |
BlackRock Emerging Markets Fund |
BlackRock Emerging Markets Long/Short Equity Fund |
BlackRock Energy & Resources Portfolio |
BlackRock Equity Dividend Fund |
BlackRock EuroFund |
BlackRock Focus Growth Fund |
BlackRock Global Allocation Fund† |
BlackRock Global Dividend Income Portfolio |
BlackRock Global Dynamic Equity Fund |
BlackRock Global Opportunities Portfolio |
BlackRock Global SmallCap Fund |
BlackRock Health Sciences Opportunities Portfolio |
BlackRock Index Equity Portfolio |
BlackRock India Fund |
BlackRock International Fund |
BlackRock International Index Fund |
BlackRock International Opportunities Portfolio |
BlackRock Large Cap Core Fund |
BlackRock Large Cap Core Plus Fund |
BlackRock Large Cap Growth Fund |
BlackRock Large Cap Value Fund |
BlackRock Latin America Fund |
BlackRock Managed Volatility Portfolio† |
BlackRock Mid-Cap Growth Equity Portfolio |
BlackRock Mid-Cap Value Equity Portfolio |
BlackRock Mid Cap Value Opportunities Fund |
BlackRock Natural Resources Trust |
BlackRock Pacific Fund |
BlackRock Russell 1000 Index Fund |
BlackRock Science & Technology Opportunities Portfolio |
BlackRock Small Cap Growth Equity Portfolio |
BlackRock Small Cap Growth Fund II |
BlackRock Small Cap Index Fund |
BlackRock S&P 500 Index Fund |
BlackRock S&P 500 Stock Fund |
BlackRock U.S. Opportunities Portfolio |
BlackRock Value Opportunities Fund |
BlackRock World Gold Fund |
|
Fixed Income Funds |
|
BlackRock Bond Index Fund |
BlackRock Core Bond Portfolio |
BlackRock CoreAlpha Bond Fund |
BlackRock Emerging Market Debt Portfolio |
BlackRock Floating Rate Income Portfolio |
BlackRock Global Long/Short Credit Fund |
BlackRock GNMA Portfolio |
BlackRock High Yield Bond Portfolio |
BlackRock Inflation Protected Bond Portfolio |
BlackRock International Bond Portfolio |
BlackRock Long Duration Bond Portfolio |
BlackRock Low Duration Bond Portfolio |
BlackRock Multi-Asset Income Portfolio† |
BlackRock Multi-Sector Bond Portfolio |
BlackRock Strategic Income Opportunities Portfolio |
BlackRock Total Return Fund |
BlackRock US Government Bond Portfolio |
BlackRock US Mortgage Portfolio |
BlackRock World Income Fund |
|
Municipal Bond Funds |
|
BlackRock California Municipal Bond Fund |
BlackRock High Yield Municipal Fund |
BlackRock Intermediate Municipal Fund |
BlackRock National Municipal Fund |
BlackRock New Jersey Municipal Bond Fund |
BlackRock New York Municipal Bond Fund |
BlackRock Pennsylvania Municipal Bond Fund |
BlackRock Short-Term Municipal Fund |
|
Target Risk & Target Date Funds† |
|
BlackRock Prepared Portfolios
Conservative Prepared Portfolio
Moderate Prepared Portfolio
Growth Prepared Portfolio
Aggressive Growth Prepared Portfolio |
|
BlackRock Lifecycle Prepared Portfolios |
2015 |
2020 |
2025 |
2030 |
2035 |
2040 |
2045 |
2050 |
|
LifePath Portfolios
Retirement |
2020 |
2025 |
2030 |
2035 |
2040 |
2045 |
2050 |
2055 |
|
LifePath Index Portfolios
Retirement |
2020 |
2025 |
2030 |
2035 |
2040 |
2045 |
2050 |
2055 |
BlackRock mutual funds are currently distributed by BlackRock Investments, LLC. You should consider the investment objectives, risks, charges and expenses of the funds under consideration carefully before investing. Each fund’s prospectus contains this and other information and is available at www.blackrock.com or by calling (800) 441-7762 or from your financial advisor. The prospectus should be read carefully before investing.
| | | |
| | | |
| BLACKROCK LARGE CAP SERIES FUNDS, INC. | MARCH 31, 2012 | 75 |
These reports are not authorized for use as an offer of sale or a solicitation of an offer to buy shares of the Funds unless accompanied or preceded by the Funds’ current prospectus. Past performance results shown in these reports should not be considered a representation of future performance. Investment returns and principal value of shares will fluctuate so that shares, when redeemed, may be worth more or less than their original cost. Statements and other information herein are as dated and are subject to change.
| |

|
#CAPSERIESCP-3/12-SAR | 
|
| |

| March 31, 2012 |
| |
Semi-Annual Report (Unaudited) |
| |
BlackRock Large Cap Series Funds, Inc. |
| |
4 | BlackRock Large Cap Core Retirement Portfolio |
| |
4 | BlackRock Large Cap Growth Retirement Portfolio |
| |
4 | BlackRock Large Cap Value Retirement Portfolio |
|
Not FDIC Insured § No Bank Guarantee § May Lose Value |
| | |
| | |
2 | BLACKROCK LARGE CAP SERIES FUNDS, INC. | MARCH 31, 2012 |
Twelve months ago, risk assets were charging forward, only to be met with a sharp reversal in May 2011 when escalating political strife in Greece rekindled fears about sovereign debt problems spreading across Europe. Concurrently, global economic indicators signaled that the recovery had slowed. Confidence was further shaken by the prolonged debt ceiling debate in Washington, DC. On August 5, 2011, Standard & Poor’s made history by downgrading the US government’s credit rating, and turmoil erupted in financial markets around the world. Extraordinary levels of volatility persisted in the months that followed as the European debt crisis intensified. Macro news flow became a greater influence on trading decisions than the fundamentals of the securities traded, resulting in high correlations between asset prices. By the end of the third quarter, equity markets had fallen nearly 20% from their April peak while safe-haven assets such as US Treasuries and gold had rallied to historic highs.
October brought enough positive economic data to assuage fears of a global double-dip recession. Additionally, European leaders began to show progress toward stemming the region’s debt crisis. Investors began to reenter the markets, putting risk assets on the road to recovery. Improving investor sentiment carried over into the first several months of 2012. Debt problems in Europe stabilized as policymakers secured a bailout plan for Greece and completed the nation’s debt restructuring without significant market disruptions. While concerns about slowing growth in China and a European recession weighed on the outlook for the global economy, an acceleration of the US recovery lifted sentiment. Several consecutive months of stronger jobs data signaled solid improvement in the US labor market, a pivotal factor for economic growth. Meanwhile, the European Central Bank revived financial markets with additional liquidity through its long-term refinancing operations. The improving market conditions and generally better-than-expected economic news lured investors still holding cash on the sidelines back to risk assets. Stocks, commodities and high yield bonds rallied through the first two months of the year while rising Treasury yields pressured higher-quality fixed income assets. The rally softened in late March, however, as concerns about slowing growth in China were refueled by negative signals from the world’s second-largest economy. Additionally, concerns over the European debt crisis resurfaced given uncertainty around policies for sovereign debt financing in peripheral countries and rising yields in Portugal and Spain.
Thanks in large part to an exceptionally strong first quarter of 2012, risk assets, including equities and high yield bonds, posted solid returns for the 6-month period ended March 31, 2012. On a 12-month basis, US large-cap stocks and high yield bonds delivered positive results, while small-cap stocks finished in slightly negative territory. International and emerging markets, which experienced significant downturns in 2011, lagged the broader rebound. Fixed income securities experienced mixed results, given recent volatility in yields. US Treasury bonds performed particularly well for the 12-month period; however, an early-2012 sell-off resulted in a negative return for the 6–month period. Municipal bonds staged a solid advance over the past year. Continued low short-term interest rates kept yields on money market securities near their all-time lows.
While markets have improved in recent months, considerable headwinds remain. Europe faces a prolonged recession and the financial situations in Italy, Portugal and Spain remain worrisome. Higher oil and gasoline prices along with slowing growth in China and other emerging-market countries weigh heavily on the future of the global economy. But, we believe that with these challenges come opportunities. We remain committed to working with you and your financial professional to identify actionable ideas for your portfolio. We encourage you to visit www.blackrock.com/newworld for more information.
|
Sincerely, |

|
Rob Kapito |
President, BlackRock Advisors, LLC |
|

|
|
“While markets have improved in recent months, considerable headwinds remain.” |
|
Rob Kapito |
President, BlackRock Advisors, LLC |
|
|
Total Returns as of March 31, 2012 |
| | | | | | | |
| | 6-month | | 12-month | |
US large cap equities | | | 25.89 | % | | 8.54 | % |
(S&P 500® Index) | | | | | | | |
US small cap equities | | | 29.83 | | | (0.18 | ) |
(Russell 2000® Index) | | | | | | | |
International equities | | | 14.56 | | | (5.77 | ) |
(MSCI Europe, Australasia, | | | | | | | |
Far East Index) | | | | | | | |
Emerging market | | | 19.12 | | | (8.81 | ) |
equities (MSCI Emerging | | | | | | | |
Markets Index) | | | | | | | |
3-month Treasury | | | 0.01 | | | 0.06 | |
bill (BofA Merrill Lynch | | | | | | | |
3-Month Treasury | | | | | | | |
Bill Index) | | | | | | | |
US Treasury securities | | | (1.05 | ) | | 14.92 | |
(BofA Merrill Lynch 10- | | | | | | | |
Year US Treasury Index) | | | | | | | |
US investment grade | | | 1.43 | | | 7.71 | |
bonds (Barclays US | | | | | | | |
Aggregate Bond Index) | | | | | | | |
Tax-exempt municipal | | | 4.16 | | | 12.56 | |
bonds (S&P Municipal | | | | | | | |
Bond Index) | | | | | | | |
US high yield bonds | | | 12.17 | | | 6.43 | |
(Barclays US Corporate | | | | | | | |
High Yield 2% Issuer | | | | | | | |
Capped Index) | | | | | | | |
|
Past performance is no guarantee of future results. Index performance is shown for illustrative purposes only. You cannot invest directly in an index. |
|
| | |
| | |
| THIS PAGE NOT PART OF YOUR FUND REPORT | 3 |
| |
| |
Fund Summary as of March 31, 2012 | BlackRock Large Cap Core Retirement Portfolio |
| | |
Investment Objective |
|
BlackRock Large Cap Core Retirement Portfolio’s (the “Fund”) investment objective is to seek long-term capital growth. In other words, the Fund tries to choose investments that will increase in value. |
| | |
Portfolio Management Commentary |
| |
| How did the Fund perform? |
| | |
• | For the six-month period ended March 31, 2012, the Fund, through its investment in Master Large Cap Core Portfolio (the “Portfolio”), outperformed its benchmark, the Russell 1000® Index. |
| | |
| What factors influenced performance? |
| | |
• | Overall, positive performance in the information technology (“IT”), materials and health care sectors offset negative results in financials, industrials and consumer discretionary. |
| | |
• | Stock selection in the computers & peripherals industry was the leading contributor to outperformance in IT. Specifically, select hard disk drive manufacturers strongly outperformed on a faster-than-anticipated recovery from last summer’s massive flooding in Thailand, which damaged manufacturing plants and crippled production. The successful completion of strategic acquisitions provided a further boost to earnings for key holdings. Companies, in turn, shared some of those excess profits with investors by way of dividends and stock buybacks. |
| | |
• | Within the materials sector, select chemical company holdings benefited from input cost advantages stemming from their reliance on low-cost US natural gas versus higher-priced crude oil. Natural gas prices declined to new lows during the six-month period, lifting profit margins for companies in the industry. |
| | |
• | Favorable stock selection aided relative performance in health care, with particularly strong results in pharmaceuticals and biotechnology. Within pharmaceuticals, the Portfolio benefited from an underweight/absence in select large-cap benchmark names that lagged during the period. Positive pipeline developments drove the outperformance for select biotechnology holdings. |
| | |
• | In contrast, the financial sector was the largest detractor from Portfolio results, with negative performance due primarily to an underweight allocation, especially in diversified financial services, commercial banks and capital markets names. The sector surged during the reporting period as investor confidence improved, spurring demand for the higher-risk investments that struggled amid the extreme volatility in the summer and fall of 2011. |
| | |
• | In the same way, an underweight in industrials, particularly the economically sensitive machinery industry, hampered relative results. |
| | |
• | Education services and consumer electronics retail holdings were the primary detractors in consumer discretionary. Ongoing weakness in new student enrollments hampered the results of education services providers, as changes to company business models in response to regulatory pressures are driving increased competition for higher quality students. Meanwhile, consumer electronics retailers lagged on product cycle weakness and competitive pressures. Core business segments (e.g., televisions, gaming) are in secular decline, while at the same time, big-ticket purchases are increasingly moving online. The noxious combination has hurt pricing and margins for companies in the industry. |
| | |
| Describe recent portfolio activity. |
| | |
• | During the six months, the Portfolio’s exposures to the industrials and energy sectors were significantly increased, and additions were made to financials. The Portfolio’s weightings in health care, materials and IT were reduced. |
| | |
| Describe portfolio positioning at period end. |
| | |
• | At period end, the Portfolio continues to maintain a balance between domestic cyclicals and more dependable growth names. The Portfolio’s largest sector overweight relative to the Russell 1000® Index was health care, followed by energy and consumer discretionary; financials remained the largest underweight, followed by consumer staples. As always, management relies on a disciplined investment process and a belief in the importance of portfolio construction and risk management to strive to deliver consistent outperformance over the long term. |
| | |
| | The views expressed reflect the opinions of BlackRock as of the date of this report and are subject to change based on changes in market, economic or other conditions. These views are not intended to be a forecast of future events and are no guarantee of future results. |
| | |
| | |
4 | BLACKROCK LARGE CAP SERIES FUNDS, INC. | MARCH 31, 2012 |
|
|
|
BlackRock Large Cap Core Retirement Portfolio |
|
Total Return Based on a $10,000 Investment |
| | |
| 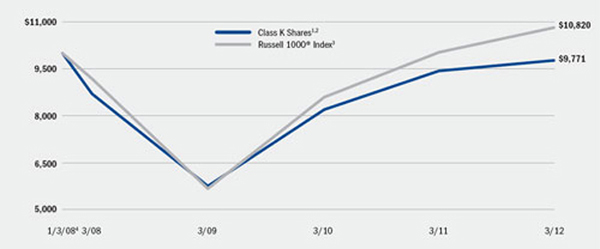
|
| | |
| 1 | Assuming transaction costs and other operating expenses, including administration fees, if any. |
| | |
| 2 | The Fund invests all of its assets in the Portfolio, a series of Master Large Cap Series LLC. The Portfolio invests at least 80% of its assets in equity securities of large cap companies located in the United States that the investment advisor selects from among those that are, at the time of purchase, included in the Russell 1000® Index. |
| | |
| 3 | This unmanaged broad-based index measures the performance of the 1,000 largest companies in the Russell 3000® Index, which represents approximately 92% of the total market capitalization of the Russell 3000® Index. |
| | |
| 4 | Commencement of operations. |
|
Performance Summary for the Period Ended March 31, 2012 |
| | | | | | | | | | |
| | | | | Average Annual Total Returns5 | |
| | 6-Month
Total Returns | | 1 Year | | Since Inception6 | |
Class K | | | 27.91 | % | | 3.55 | % | | (0.55 | )% |
Russell 1000® Index | | | 26.27 | | | 7.86 | | | 1.88 | |
| | |
| 5 | See “About Fund Performance” on page 10 for a detailed description of the share class, including any related sales charges and fees. |
| | |
| 6 | The Fund commenced operations on January 3, 2008.
Past performance is not indicative of future results. |
| | | | | | | | | | | | | | | | | | | | | | |
| | Actual | | Hypothetical8 | | | | |
| | Beginning
Account Value
October 1, 2011 | | Ending
Account Value
March 31, 2012 | | Expenses Paid
During the Period7 | | Beginning
Account Value
October 1, 2011 | | Ending
Account Value
March 31, 2012 | | Expenses Paid
During the Period7 | | Annualized
Expense Ratio | |
Class K | | $ | 1,000.00 | | $ | 1,279.10 | | $ | 3.70 | | $ | 1,000.00 | | $ | 1,021.80 | | $ | 3.29 | | | 0.65 | % |
| | |
| 7 | Expenses are equal to the Fund’s annualized expense ratio multiplied by the average account value over the period, multiplied by 183/366 (to reflect the one-half year period shown). Because the Fund is a feeder fund, the expense table reflects the expenses of both the Fund and the Portfolio in which it invests. |
| | |
| 8 | Hypothetical 5% annual return before expenses is calculated by pro rating the number of days in the most recent fiscal half year divided by 366.
See “Disclosure of Expenses” on page 10 for further information on how expenses were calculated. |
| | | |
| | | |
| BLACKROCK LARGE CAP SERIES FUNDS, INC. | MARCH 31, 2012 | 5 |
| |
|
| |
Fund Summary as of March 31, 2012 | BlackRock Large Cap Growth Retirement Portfolio |
BlackRock Large Cap Growth Retirement Portfolio’s (the “Fund”) investment objective is to seek long-term capital growth. In other words, the Fund tries to choose investments that will increase in value.
|
Portfolio Management Commentary |
| |
| How did the Fund perform? |
| |
• | For the six-month period ended March 31, 2012, the Fund, through its investment in Master Large Cap Growth Portfolio (the “Portfolio”), outperformed its benchmark, the Russell 1000® Growth Index. |
| |
| What factors influenced performance? |
| |
• | Overall, positive performance in the IT, materials and consumer staples sectors offset negative results in industrials and telecommunication services (“telecom”). |
| |
• | Stock selection in the semiconductor and computers & peripherals industries was the leading contributor to outperformance in IT. In particular, select hard disk drive manufacturers strongly outperformed on a faster-than-anticipated recovery from last summer’s massive flooding in Thailand, which damaged manufacturing plants and crippled production. The successful completion of strategic acquisitions provided a further boost to earnings for key holdings. Companies, in turn, shared some of those excess profits with investors by way of dividends and stock buybacks. |
| |
• | Within the materials sector, select chemical company holdings benefited from input cost advantages stemming from their reliance on low-cost US natural gas versus higher-priced crude oil. Natural gas prices declined to new lows during the six months, lifting profit margins for companies in the industry. |
| |
• | A general underweight and favorable stock selection were the main contributors within the consumer staples sector. Specifically, the Portfolio was underweight in mega-cap benchmark names, especially in the beverage and food products industries, which underperformed during the period as investors rotated out of defensive, low-risk investments in favor of more cyclical areas. |
| |
• | In contrast, the industrials sector was the largest detractor from Portfolio results, with underperformance due primarily to an underweight allocation, especially in machinery names. The sector posted strong gains for the period as investor confidence improved, spurring demand for the higher-risk investments that struggled amid the extreme volatility in the summer and fall of 2011. Aerospace & defense was also a source of weakness as defense spending concerns weighed on select holdings. |
| |
• | Stock selection was the primary detractor in telecom, due mainly to negative performance in a key diversified telecom holding that lagged on acquisition-related concerns. In addition, an unexpected uptick in the competitive environment and customer churn rates hurt the results of key wireless holdings. |
| |
| Describe recent portfolio activity. |
| |
• | During the six months, the Portfolio’s weightings in the industrials and energy sectors were increased, while its allocations to health care, IT and materials were reduced. |
| |
| Describe portfolio positioning at period end. |
| |
• | At period end, the Portfolio continues to maintain a balance between domestic cyclicals and more dependable growth names. The Portfolio’s largest sector overweights at period end relative to the Russell 1000® Growth Index were in health care and consumer discretionary, while consumer staples was the largest underweight, followed by industrials and materials. As always, management relies on a disciplined investment process and a belief in the importance of portfolio construction and risk management to strive to deliver consistent outperformance over the long term. |
The views expressed reflect the opinions of BlackRock as of the date of this report and are subject to change based on changes in market, economic or other conditions. These views are not intended to be a forecast of future events and are no guarantee of future results.
| | |
| | |
6 | BLACKROCK LARGE CAP SERIES FUNDS, INC. | MARCH 31, 2012 |
| |
| |
| BlackRock Large Cap Growth Retirement Portfolio |
|
Total Return Based on a $10,000 Investment |
| | |
| 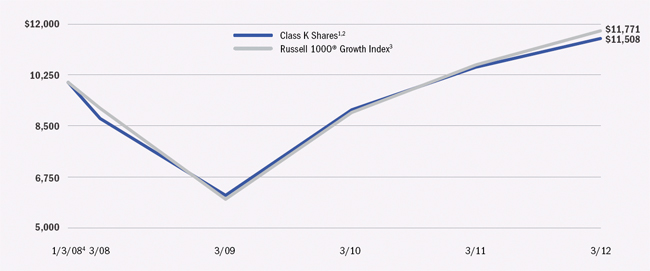
|
| | |
| 1 | Assuming transaction costs and other operating expenses, including administration fees, if any. |
| | |
| 2 | The Fund invests all of its assets in the Portfolio, a series of Master Large Cap Series LLC. The Portfolio invests at least 80% of its assets in equity securities of large cap companies located in the United States that the investment advisor selects from among those that are, at the time of purchase, included in the Russell 1000® Growth Index. |
| | |
| 3 | This unmanaged broad-based index is a subset of the Russell 1000® Index consisting of those Russell 1000® securities with a greater-than-average growth orientation. |
| | |
| 4 | Commencement of operations. |
|
Performance Summary for the Period Ended March 31, 2012 |
| | | | | | | | | | |
| | 6-Month
Total Returns | | Average Annual Total Returns5 | |
| | | 1 Year | | Since Inception6 | |
Class K | | | 32.53 | % | | 9.35 | % | | 3.37 | % |
Russell 1000® Growth Index | | | 26.85 | | | 11.02 | | | 3.92 | |
| | |
| 5 | See “About Fund Performance” on page 10 for a detailed description of the share class, including any related sales charges and fees. |
| | |
| 6 | The Fund commenced operations on January 3, 2008.
Past performance is not indicative of future results. |
| | |
Expense Example |
| | | | | | | | | | | | | | | | | | | | | | |
| | Actual | | Hypothetical8 | | | |
| | Beginning
Account Value
October 1, 2011 | | Ending
Account Value
March 31, 2012 | | Expenses Paid
During the Period7 | | Beginning
Account Value
October 1, 2011 | | Ending
Account Value
March 31, 2012 | | Expenses Paid
During the Period7 | | Annualized
Expense Ratio | |
Class K | | $ | 1,000.00 | | $ | 1,325.30 | | $ | 3.89 | | $ | 1,000.00 | | $ | 1,021.65 | | $ | 3.39 | | | 0.67 | % |
| | |
| 7 | Expenses are equal to the Fund’s annualized expense ratio multiplied by the average account value over the period, multiplied by 183/366 (to reflect the one-half year period shown). Because the Fund is a feeder fund, the expense table reflects the expenses of both the Fund and the Portfolio in which it invests. |
| | |
| 8 | Hypothetical 5% annual return before expenses is calculated by pro rating the number of days in the most recent fiscal half year divided by 366.
See “Disclosure of Expenses” on page 10 for further information on how expenses were calculated. |
| | | |
| | | |
| BLACKROCK LARGE CAP SERIES FUNDS, INC. | MARCH 31, 2012 | 7 |
| |
| |
Fund Summary as of March 31, 2012 | BlackRock Large Cap Value Retirement Portfolio |
| |
Investment Objective |
BlackRock Large Cap Value Retirement Portfolio’s (the “Fund”) investment objective is to seek long-term capital growth. In other words, the Fund tries to choose investments that will increase in value.
|
Portfolio Management Commentary |
| |
| How did the Fund perform? |
| |
• | For the six-month period ended March 31, 2012, the Fund, through its investment in Master Large Cap Value Portfolio (the “Portfolio”), outperformed its benchmark, the Russell 1000® Value Index. |
| |
| What factors influenced performance? |
| |
• | Overall, positive performance in the materials, IT and utilities sectors offset negative results in financials and consumer discretionary. |
| |
• | An overweight and stock selection accounted for the majority of strength within materials. Chemical holdings, in particular, were standouts as select names benefited from input cost advantages stemming from their reliance on low-cost US natural gas versus higher-priced crude oil. Natural gas prices declined to new lows during the six months, lifting profit margins for companies in the industry. An overweight in the paper & forest products industry also proved advantageous. |
| |
• | Stock selection in the computers & peripherals industry was the leading contributor to outperformance in IT. Specifically, select hard disk drive manufacturers strongly outperformed on a faster-than-anticipated recovery from last summer’s massive flooding in Thailand, which damaged manufacturing plants and crippled production. The successful completion of strategic acquisitions provided a further boost to earnings for key holdings. Companies, in turn, shared some of those excess profits with investors by way of dividends and stock buybacks. |
| |
• | Positive performance in utilities was due entirely to the Portfolio’s under-weight in the sector, especially traditional regulated utilities. Utilities trailed other sectors over the period as investors moved out of the defensive group in order to take advantage of the broader market turnaround. |
| |
• | In contrast, the financial sector was the largest detractor from Portfolio results, with negative performance due primarily to an underweight allocation, especially in diversified financial services, commercial banks and capital markets names. The sector surged during the reporting period as investor confidence improved, spurring demand for the higher-risk investments that struggled amid the extreme volatility in the summer and fall of 2011. |
| |
• | Education services and consumer electronics retailers detracted within consumer discretionary. Ongoing weakness in new student enrollments hampered the results of education services providers, as changes to company business models in response to regulatory pressures are driving increased competition for higher quality students. Meanwhile, consumer electronics retailers lagged on product cycle weakness and competitive pressures. Core business segments (e.g., televisions, gaming) are in secular decline, while at the same time, big-ticket purchases are increasingly moving online. The noxious combination has hurt pricing and margins for companies in the industry. |
| |
| Describe recent portfolio activity. |
| |
• | During the six months, the Portfolio’s weightings in the industrials and energy sectors were considerably increased, and additions were made to financials. The Portfolio’s weightings in health care, materials and consumer staples were reduced. |
| |
| Describe portfolio positioning at period end. |
| |
• | At period end, the Portfolio continues to maintain a balance between domestic cyclicals and more dependable growth names. The Portfolio’s largest sector overweights relative to the Russell 1000® Value Index were industrials and IT, while financials remained the largest underweight, followed by utilities, consumer staples and telecommunication services. As always, management relies on a disciplined investment process and a belief in the importance of portfolio construction and risk management to strive to deliver consistent outperformance over the long term. |
| |
| The views expressed reflect the opinions of BlackRock as of the date of this report and are subject to change based on changes in market, economic or other conditions. These views are not intended to be a forecast of future events and are no guarantee of future results. |
| | |
| | |
8 | BLACKROCK LARGE CAP SERIES FUNDS, INC. | MARCH 31, 2012 |
| |
| |
| BlackRock Large Cap Value Retirement Portfolio |
|
Total Return Based on a $10,000 Investment |
| | |
| 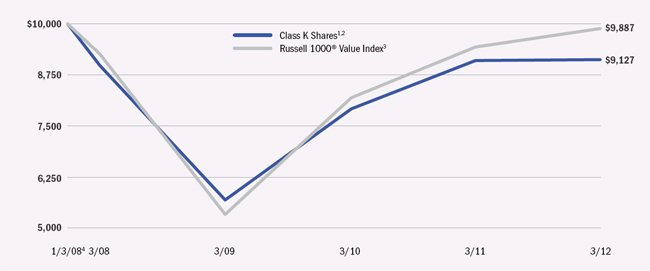
|
| | |
| 1 | Assuming transaction costs and other operating expenses, including administration fees, if any. |
| | |
| 2 | The Fund invests all of its assets in the Portfolio, a series of Master Large Cap Series LLC. The Portfolio invests at least 80% of its assets in equity securities of large cap companies located in the United States that the investment advisor selects from among those that are, at the time of purchase, included in the Russell 1000® Value Index. |
| | |
| 3 | This unmanaged broad-based index is a subset of the Russell 1000® Index consisting of those Russell 1000® securities with lower price/book ratios and lower forecasted growth values. |
| | |
| 4 | Commencement of operations. |
|
Performance Summary for the Period Ended March 31, 2012 |
| | | | | | | | | | |
| | 6-Month
Total Returns | | Average Annual Total Returns5 | |
| | | 1 Year | | Since Inception6 | |
Class K | | | 26.49 | % | | 0.24 | % | | (2.13 | )% |
Russell 1000® Value Index | | | 25.68 | | | 4.79 | | | (0.27 | ) |
| | |
| 5 | See “About Fund Performance” on page 10 for a detailed description of the share class, including any related sales charges and fees. |
| | |
| 6 | The Fund commenced operations on January 3, 2008.
Past performance is not indicative of future results. |
| | |
Expense Example |
| | | | | | | | | | | | | | | | | | | | | | |
| | Actual | | Hypothetical8 | | | |
| | Beginning
Account Value
October 1, 2011 | | Ending
Account Value
March 31, 2012 | | Expenses Paid
During the Period7 | | Beginning
Account Value
October 1, 2011 | | Ending
Account Value
March 31, 2012 | | Expenses Paid
During the Period7 | | Annualized
Expense Ratio | |
Class K | | $ | 1,000.00 | | $ | 1,264.90 | | $ | 3.79 | | $ | 1,000.00 | | $ | 1,021.60 | | $ | 3.39 | | | 0.67 | % |
| | |
| 7 | Expenses are equal to the Fund’s annualized expense ratio multiplied by the average account value over the period, multiplied by 183/366 (to reflect the one-half year period shown). Because the Fund is a feeder fund, the expense table reflects the expenses of both the Fund and the Portfolio in which it invests. |
|
| 8 | Hypothetical 5% annual return before expenses is calculated by pro rating the number of days in the most recent fiscal half year divided by 366.
See “Disclosure of Expenses” on page 10 for further information on how expenses were calculated. |
| | | |
| | | |
| BLACKROCK LARGE CAP SERIES FUNDS, INC. | MARCH 31, 2012 | 9 |
| |
| |
About Fund Performance | BlackRock Large Cap Series Funds, Inc. |
| |
• | Class K Shares are not subject to any sales charge. These shares bear no ongoing distribution or service fees and are available only to eligible investors. |
| |
| Performance information reflects past performance and does not guarantee future results. Current performance may be lower or higher than the performance data quoted. Refer to www.blackrock.com/funds to obtain performance data current to the most recent month end. Performance results do not reflect the deduction of taxes that a shareholder would pay on fund distributions or the redemption of fund shares. Figures shown in each of the performance tables on the previous pages assume reinvestment of all dividends and capital gain distributions, if any, at net asset value (“NAV”) on the ex-dividend date. Investment return and principal value of shares will fluctuate so that shares, when redeemed, may be worth more or less than their original cost. The Funds’ administrator waived and/or reimbursed a portion of each of the Fund’s expenses. Without such waiver and/or reimbursement, the Funds’ performance would have been lower. The administrator is under no obligation to waive and/or reimburse or continue waiving and/or reimbursing its fees. |
| |
| |
Disclosure of Expenses |
Shareholders of the Funds may incur the following charges: (a) expenses related to transactions, including sales charges and exchange fees; and (b) operating expenses, including administration fees, service and distribution fees, including 12b-1 fees, and other Fund expenses. The expense examples shown on the previous pages (which are based on a hypothetical investment of $1,000 invested on October 1, 2011 and held through March 31, 2012) are intended to assist shareholders both in calculating expenses based on an investment in each Fund and in comparing these expenses with similar costs of investing in other mutual funds.
The tables provide information about actual account values and actual expenses. In order to estimate the expenses a shareholder paid during the period covered by this report, shareholders can divide their account value by $1,000 and then multiply the result by the number corresponding to their Fund under the heading entitled “Expenses Paid During the Period.”
The tables also provide information about hypothetical account values and hypothetical expenses based on each Fund’s actual expense ratio and an assumed rate of return of 5% per year before expenses. In order to assist shareholders in comparing the ongoing expenses of investing in these Funds and other funds, compare the 5% hypothetical example with the 5% hypothetical examples that appear in other funds’ shareholder reports.
The expenses shown in the tables are intended to highlight shareholders’ ongoing costs only and do not reflect any transactional expenses, such as sales charges or exchange fees, if any. Therefore, the hypothetical examples are useful in comparing ongoing expenses only, and will not help shareholders determine the relative total expenses of owning different funds. If these transactional expenses were included, shareholder expenses would have been higher.
| | |
| | |
10 | BLACKROCK LARGE CAP SERIES FUNDS, INC. | MARCH 31, 2012 |
| |
|
Statements of Assets and Liabilities | BlackRock Large Cap Series Funds, Inc. |
| | | | | | | | | | |
March 31, 2012 (Unaudited) | | BlackRock
Large Cap Core
Retirement
Portfolio | | BlackRock
Large Cap Growth
Retirement
Portfolio | | BlackRock
Large Cap Value
Retirement
Portfolio | |
Assets | | | | | | | | | | |
Investments at value — Master Large Cap Core Portfolio, Master Large Cap Growth Portfolio, Master Large Cap Value Portfolio (the “Portfolios”), respectively1 | | $ | 83,038,174 | | $ | 2,456,437 | | $ | 106,924,095 | |
Capital shares sold receivable | | | 195,263 | | | — | | | 198,012 | |
Receivable from administrator | | | 977 | | | 43,233 | | | 10,614 | |
Prepaid expenses | | | — | | | — | | | 150 | |
Total assets | | | 83,234,414 | | | 2,499,670 | | | 107,132,871 | |
| | | | | | | | | | |
Liabilities | | | | | | | | | | |
Capital shares redeemed payable | | | 48,945 | | | — | | | 24,978 | |
Officer’s fees payable | | | 54 | | | 45 | | | 67 | |
Contributions payable to the Portfolios | | | 146,318 | | | — | | | 173,034 | |
Other affiliate payable | | | — | | | — | | | 10 | |
Other accrued expenses payable | | | 87,066 | | | 65,236 | | | 143,349 | |
Total liabilities | | | 282,383 | | | 65,281 | | | 341,438 | |
Net Assets | | $ | 82,952,031 | | $ | 2,434,389 | | $ | 106,791,433 | |
| | | | | | | | | | |
Net Assets Consist of | | | | | | | | | | |
Paid-in capital2 | | $ | 93,497,342 | | $ | (1,945,014 | ) | $ | 99,470,429 | |
Undistributed net investment income | | | 400,427 | | | 203,025 | | | 347,255 | |
Accumulated net realized loss allocated from the Portfolios | | | (39,821,215 | ) | | (16,917,333 | ) | | (5,253,679 | ) |
Net unrealized appreciation/depreciation allocated from the Portfolios | | | 28,875,477 | | | 21,093,711 | | | 12,227,428 | |
Net Assets | | $ | 82,952,031 | | $ | 2,434,389 | | $ | 106,791,433 | |
Class K — Net asset value per common share, 200 million shares authorized, $0.10 par value | | $ | 12.34 | | $ | 12.52 | | $ | 16.09 | |
1 Investments at cost | | $ | 54,162,697 | | $ | 2,051,676 | | $ | 94,696,667 | |
2 Shares outstanding | | | 6,723,933 | | | 194,435 | | | 6,638,217 | |
| | | |
See Notes to Financial Statements. |
|
| BLACKROCK LARGE CAP SERIES FUNDS, INC. | MARCH 31, 2012 | 11 |
| |
|
Statements of Operations | BlackRock Large Cap Series Funds, Inc. |
| | | | | | | | | | |
Six Months Ended March 31, 2012 (Unaudited) | | BlackRock
Large Cap Core
Retirement
Portfolio | | BlackRock
Large Cap Growth
Retirement
Portfolio | | BlackRock
Large Cap Value
Retirement
Portfolio | |
Investment Income | | | | | | | | | | |
Net investment income allocated from the Portfolios: | | | | | | | | | | |
Dividends — unaffiliated | | $ | 1,763,892 | | $ | 1,117,962 | | $ | 1,821,040 | |
Foreign taxes withheld | | | (31,257 | ) | | (23,086 | ) | | (38,139 | ) |
Securities lending — affiliated | | | 48,501 | | | 33,242 | | | 118,552 | |
Dividends — affiliated | | | 53 | | | 141 | | | 5 | |
Expenses | | | (400,911 | ) | | (306,131 | ) | | (451,826 | ) |
Fees waived | | | 47 | | | 80 | | | — | |
Total income | | | 1,380,325 | | | 822,208 | | | 1,449,632 | |
| | | | | | | | | | |
Expenses | | | | | | | | | | |
Transfer agent | | | 84,189 | | | 69,747 | | | 113,871 | |
Professional | | | 11,405 | | | 12,010 | | | 17,696 | |
Printing | | | 12,631 | | | 9,224 | | | 16,872 | |
Registration | | | 9,292 | | | 8,708 | | | 9,271 | |
Officer | | | 36 | | | 30 | | | 143 | |
Miscellaneous | | | 3,095 | | | 3,287 | | | 3,396 | |
Total expenses | | | 120,648 | | | 103,006 | | | 161,249 | |
Less fees reimbursed by administrator | | | (8,010 | ) | | (27,681 | ) | | (59,586 | ) |
Total expenses after reimbursement | | | 112,638 | | | 75,325 | | | 101,663 | |
Net investment income | | | 1,267,687 | | | 746,883 | | | 1,347,969 | |
| | | | | | | | | | |
Realized and Unrealized Gain Allocation From the Portfolios | | | | | | | | | | |
Net realized gain from investments | | | 5,027,160 | | | 2,398,091 | | | 3,292,867 | |
Net change in unrealized appreciation/depreciation on investments | | | 32,695,756 | | | 26,834,374 | | | 33,568,290 | |
Total realized and unrealized gain | | | 37,722,916 | | | 29,232,465 | | | 36,861,157 | |
Net Increase in Net Assets Resulting from Operations | | $ | 38,990,603 | | $ | 29,979,348 | | $ | 38,209,126 | |
| | | |
See Notes to Financial Statements. |
|
12 | | BLACKROCK LARGE CAP SERIES FUNDS, INC. | MARCH 31, 2012 |
| |
|
Statements of Changes in Net Assets | BlackRock Large Cap Series Funds, Inc. |
| | | | | | | | | | | | | | |
| | BlackRock
Large Cap Core
Retirement
Portfolio | | | BlackRock
Large Cap Growth
Retirement
Portfolio | |
Increase (Decrease) in Net Assets | | Six Months
Ended
March 31,
2012
(Unaudited) | | Year
Ended
September 30,
2011 | | | Six Months
Ended
March 31,
2012
(Unaudited) | | Year
Ended
September 30,
2011 | |
Operations | | | | | | | | | | | | | | |
Net investment income | | $ | 1,267,687 | | $ | 1,289,709 | | | $ | 746,883 | | $ | 829,462 | |
Net realized gain | | | 5,027,160 | | | 6,820,142 | | | | 2,398,091 | | | 9,241,396 | |
Net change in unrealized appreciation/depreciation | | | 32,695,756 | | | (14,449,811 | ) | | | 26,834,374 | | | (12,013,168 | ) |
Net increase (decrease) in net assets resulting from operations | | | 38,990,603 | | | (6,339,960 | ) | | | 29,979,348 | | | (1,942,310 | ) |
| | | | | | | | | | | | | | |
Dividends to Shareholders From | | | | | | | | | | | | | | |
Net investment income | | | (1,600,010 | ) | | (1,200,010 | ) | | | (950,003 | ) | | (750,002 | ) |
| | | | | | | | | | | | | | |
Capital Share Transactions | | | | | | | | | | | | | | |
Net increase (decrease) in net assets derived from capital share transactions | | | (83,929,605 | ) | | 23,789,672 | | | | (126,764,377 | ) | | 16,200,136 | |
| | | | | | | | | | | | | | |
Net Assets | | | | | | | | | | | | | | |
Total increase (decrease) in net assets | | | (46,539,012 | ) | | 16,249,702 | | | | (97,735,032 | ) | | 13,507,824 | |
Beginning of period | | | 129,491,043 | | | 113,241,341 | | | | 100,169,421 | | | 86,661,597 | |
End of period | | $ | 82,952,031 | | $ | 129,491,043 | | | $ | 2,434,389 | | $ | 100,169,421 | |
Undistributed net investment income | | $ | 400,427 | | $ | 732,750 | | | $ | 203,025 | | $ | 406,145 | |
| | | | | | | |
| | BlackRock
Large Cap Value
Retirement
Portfolio | |
Increase (Decrease) in Net Assets | | Six Months
Ended
March 31,
2012
(Unaudited) | | Year
Ended
September 30,
2011 | |
Operations | | | | | | | |
Net investment income | | $ | 1,347,969 | | $ | 2,029,580 | |
Net realized gain | | | 3,292,867 | | | 14,573,605 | |
Net change in unrealized appreciation/depreciation | | | 33,568,290 | | | (20,336,791 | ) |
Net increase (decrease) in net assets resulting from operations | | | 38,209,126 | | | (3,733,606 | ) |
| | | | | | | |
Dividends to Shareholders From | | | | | | | |
Net investment income | | | (2,300,002 | ) | | (2,100,008 | ) |
| | | | | | | |
Capital Share Transactions | | | | | | | |
Net decrease in net assets derived from capital share transactions | | | (74,081,536 | ) | | (16,085,289 | ) |
| | | | | | | |
Net Assets | | | | | | | |
Total decrease in net assets | | | (38,172,412 | ) | | (21,918,903 | ) |
Beginning of period | | | 144,963,845 | | | 166,882,748 | |
End of period | | $ | 106,791,433 | | $ | 144,963,845 | |
Undistributed net investment income | | $ | 347,255 | | $ | 1,299,288 | |
| | | |
See Notes to Financial Statements. |
|
| BLACKROCK LARGE CAP SERIES FUNDS, INC. | MARCH 31, 2012 | 13 |
| |
|
Financial Highlights | BlackRock Large Cap Series Funds, Inc. |
| | | | | | | | | | | | | | | | |
| | BlackRock Large Cap Core Retirement Portfolio | |
| | Class K | |
| | Six Months
Ended
March 31,
2012
(Unaudited) | | Year Ended
September 30, | | Period
November 1,
2008 to
September 30,
2009 | | Period
January 3,
20081 to
October 31,
2008 | |
| | | | | |
| | | | | |
| | | | | |
| | | 2011 | | 2010 | | | |
Per Share Operating Performance | | | | | | | | | | | | | | | | |
Net asset value, beginning of period | | $ | 9.78 | | $ | 10.06 | | $ | 9.61 | | $ | 8.64 | | $ | 13.25 | |
Net investment income2 | | | 0.10 | | | 0.11 | | | 0.09 | | | 0.11 | | | 0.07 | |
Net realized and unrealized gain (loss) | | | 2.60 | | | (0.28 | ) | | 0.49 | | | 0.96 | | | (4.68 | ) |
Net increase (decrease) from investment operations | | | 2.70 | | | (0.17 | ) | | 0.58 | | | 1.07 | | | (4.61 | ) |
Dividends from net investment income | | | (0.14 | ) | | (0.11 | ) | | (0.13 | ) | | (0.10 | ) | | — | |
Net asset value, end of period | | $ | 12.34 | | $ | 9.78 | | $ | 10.06 | | $ | 9.61 | | $ | 8.64 | |
| | | | | | | | | | | | | | | | |
Total Investment Return3 | | | | | | | | | | | | | | | | |
Based on net asset value | | | 27.91 | %4 | | (1.81 | )% | | 6.01 | % | | 12.55 | %4,5 | | (34.79 | )%4 |
| | | | | | | | | | | | | | | | |
Ratios to Average Net Assets6 | | | | | | | | | | | | | | | | |
Total expenses | | | 0.66 | %7,8 | | 0.67 | % | | 0.68 | % | | 0.73 | %8 | | 0.71 | %8 |
Total expenses after reimbursement | | | 0.65 | %7,8 | | 0.67 | % | | 0.67 | % | | 0.66 | %8 | | 0.62 | %8 |
Net investment income | | | 1.59 | %7,8 | | 0.96 | % | | 0.93 | % | | 1.39 | %8 | | 0.76 | %8 |
| | | | | | | | | | | | | | | | |
Supplemental Data | | | | | | | | | | | | | | | | |
Net assets, end of period (000) | | $ | 82,952 | | $ | 129,491 | | $ | 113,241 | | $ | 109,188 | | $ | 105,224 | |
Portfolio turnover of the Portfolio | | | 59 | % | | 129 | % | | 173 | % | | 168 | % | | 109 | % |
| | |
| 1 | Commencement of operations. |
| | |
| 2 | Based on average shares outstanding. |
| | |
| 3 | Where applicable, total investment returns include the reinvestment of dividends and distributions. |
| | |
| 4 | Aggregate total investment return. |
| | |
| 5 | Includes proceeds received from a settlement of litigation, through its investments in the Portfolio, which impacted the Fund’s total investment return. Not including these proceeds, the total investment return would have been 12.08%. |
| | |
| 6 | Includes the Fund’s share of the Portfolio’s allocated expenses and/or net investment income. |
| | |
| 7 | Includes the Fund’s share of the Portfolio’s allocated fees waived of less than 0.01%. |
| | |
| 8 | Annualized. |
| | | |
See Notes to Financial Statements. |
|
14 | | BLACKROCK LARGE CAP SERIES FUNDS, INC. | MARCH 31, 2012 |
| |
| |
Financial Highlights (continued) | BlackRock Large Cap Series Funds, Inc. |
| | | | | | | | | | | | | | | | |
| | BlackRock Large Cap Growth Retirement Portfolio | |
| | Class K | |
| | Six Months
Ended
March 31,
2012
(Unaudited) | | | | | | Period
November 1,
2008 to
September 30,
2009 | | Period
January 3,
20081 to
October 31,
2008 | |
| | | | | | | | |
| | | Year Ended
September 30, | | | |
| | | | | |
| | | 2011 | | 2010 | | | |
| | | | | | | | | | | | | | | | |
Per Share Operating Performance | | | | | | | | | | | | | | | | |
Net asset value, beginning of period | | $ | 9.53 | | $ | 9.54 | | $ | 8.93 | | $ | 7.45 | | $ | 11.20 | |
Net investment income2 | | | 0.08 | | | 0.08 | | | 0.06 | | | 0.05 | | | 0.02 | |
Net realized and unrealized gain (loss) | | | 3.00 | | | (0.01 | ) | | 0.61 | | | 1.48 | | | (3.77 | ) |
Net increase (decrease) from investment operations | | | 3.08 | | | 0.07 | | | 0.67 | | | 1.53 | | | (3.75 | ) |
Dividends from net investment income | | | (0.09 | ) | | (0.08 | ) | | (0.06 | ) | | (0.05 | ) | | — | |
Net asset value, end of period | | $ | 12.52 | | $ | 9.53 | | $ | 9.54 | | $ | 8.93 | | $ | 7.45 | |
| | | | | | | | | | | | | | | | |
Total Investment Return3 | | | | | | | | | | | | | | | | |
Based on net asset value | | | 32.53 | %4 | | 0.68 | % | | 7.46 | % | | 20.66 | %4,5 | | (33.48 | )%4 |
| | | | | | | | | | | | | | | | |
Ratios to Average Net Assets6 | | | | | | | | | | | | | | | | |
Total expenses | | | 0.72 | %7,8 | | 0.71 | % | | 0.79 | % | | 0.88 | %8 | | 0.81 | %8 |
Total expenses after reimbursement | | | 0.67 | %7,8 | | 0.67 | % | | 0.67 | % | | 0.66 | %8 | | 0.65 | %8 |
Net investment income | | | 1.31 | %7,8 | | 0.77 | % | | 0.62 | % | | 0.73 | %8 | | 0.30 | %8 |
| | | | | | | | | | | | | | | | |
Supplemental Data | | | | | | | | | | | | | | | | |
Net assets, end of period (000) | | $ | 2,434 | | $ | 100,169 | | $ | 86,662 | | $ | 83,098 | | $ | 80,882 | |
Portfolio turnover of the Portfolio | | | 69 | % | | 169 | % | | 232 | % | | 242 | % | | 144 | % |
| | |
| 1 | Commencement of operations. |
| | |
| 2 | Based on average shares outstanding. |
| | |
| 3 | Where applicable, total investment returns include the reinvestment of dividends and distributions. |
| | |
| 4 | Aggregate total investment return. |
| | |
| 5 | Includes proceeds received from a settlement of litigation, through its investments in the Portfolio, which impacted the Fund’s total investment return. Not including these proceeds, the total investment return would have been 20.25%. |
| | |
| 6 | Includes the Fund’s share of the Portfolio’s allocated expenses and/or net investment income. |
| | |
| 7 | Includes the Fund’s share of the Portfolio’s allocated fees waived of less than 0.01%. |
| | |
| 8 | Annualized. |
| | |
See Notes to Financial Statements. | | |
| | |
BLACKROCK LARGE CAP SERIES FUNDS, INC. | MARCH 31, 2012 | 15 |
| |
| |
Financial Highlights (concluded) | BlackRock Large Cap Series Funds, Inc. |
| | | | | | | | | | | | | | | | |
| | BlackRock Large Cap Value Retirement Portfolio | |
| | Class K | |
| | Six Months
Ended
March 31,
2012
(Unaudited) | | | | | | Period
November 1,
2008 to
September 30,
2009 | | Period
January 3,
20081 to
October 31,
2008 | |
| | | | | | | | |
| | | Year Ended
September 30, | | | |
| | | | | |
| | | 2011 | | 2010 | | | |
| | | | | | | | | | | | | | | | |
Per Share Operating Performance | | | | | | | | | | | | | | | | |
Net asset value, beginning of period | | $ | 12.91 | | $ | 13.67 | | $ | 13.28 | | $ | 12.33 | | $ | 18.54 | |
Net investment income2 | | | 0.13 | | | 0.17 | | | 0.17 | | | 0.18 | | | 0.13 | |
Net realized and unrealized gain (loss) | | | 3.26 | | | (0.76 | ) | | 0.39 | | | 0.91 | | | (6.34 | ) |
Net increase (decrease) from investment operations | | | 3.39 | | | (0.59 | ) | | 0.56 | | | 1.09 | | | (6.21 | ) |
Dividends from net investment income | | | (0.21 | ) | | (0.17 | ) | | (0.17 | ) | | (0.14 | ) | | — | |
Net asset value, end of period | | $ | 16.09 | | $ | 12.91 | | $ | 13.67 | | $ | 13.28 | | $ | 12.33 | |
| | | | | | | | | | | | | | | | |
Total Investment Return3 | | | | | | | | | | | | | | | | |
Based on net asset value | | | 26.49 | %4 | | (4.44 | )% | | 4.23 | % | | 8.93 | %4,5 | | (33.50 | )%4 |
| | | | | | | | | | | | | | | | |
Ratios to Average Net Assets6 | | | | | | | | | | | | | | | | |
Total expenses | | | 0.74 | %7 | | 0.70 | % | | 0.72 | % | | 0.77 | %7 | | 0.78 | %7 |
Total expenses after reimbursement | | | 0.67 | %7 | | 0.67 | % | | 0.67 | % | | 0.66 | %7 | | 0.63 | %7 |
Net investment income | | | 1.63 | %7 | | 1.13 | % | | 1.21 | % | | 1.74 | %7 | | 1.03 | %7 |
| | | | | | | | | | | | | | | | |
Supplemental Data | | | | | | | | | | | | | | | | |
Net assets, end of period (000) | | $ | 106,791 | | $ | 144,964 | | $ | 166,883 | | $ | 132,560 | | $ | 128,159 | |
Portfolio turnover of the Portfolio | | | 79 | % | | 156 | % | | 183 | % | | 151 | % | | 108 | % |
| | |
| 1 | Commencement of operations. |
| | |
| 2 | Based on average shares outstanding. |
| | |
| 3 | Where applicable, total investment returns include the reinvestment of dividends and distributions. |
| | |
| 4 | Aggregate total investment return. |
| | |
| 5 | Includes proceeds received from a settlement of litigation, through its investment in the Portfolio, which impacted the Fund’s total investment return. Not including these proceeds, the total investment return would have been 8.52%. |
| | |
| 6 | Includes the Fund’s share of the applicable Portfolio’s allocated expenses and/or net investment income. |
| | |
| 7 | Annualized. |
| | |
See Notes to Financial Statements. | |
| | |
16 | BLACKROCK LARGE CAP SERIES FUNDS, INC. | MARCH 31, 2012 |
| |
| |
Notes to Financial Statements (Unaudited) | BlackRock Large Cap Series Funds, Inc. |
1. Organization and Significant Accounting Policies:
BlackRock Large Cap Core Retirement Portfolio, BlackRock Large Cap Growth Retirement Portfolio and BlackRock Large Cap Value Retirement Portfolio (collectively the “Funds” or individually a “Fund”), constitute three of the series of BlackRock Large Cap Series Funds, Inc. (the “Corporation”), which is registered under the Investment Company Act of 1940, as amended (the “1940 Act”), as an open-end management investment company. The Corporation is organized as a Maryland corporation. Each Fund is classified as diversified. Each Fund seeks to achieve its investment objective by investing all of its assets in Master Large Cap Core Portfolio, Master Large Cap Growth Portfolio and Master Large Cap Value Portfolio (collectively the “Portfolios” or individually a “Portfolio”), respectively, constituting Master Large Cap Series LLC (the “Master LLC”), each of which has the same investment objective and strategies as the corresponding Fund. The value of a Fund’s investment in the applicable Portfolio reflects the Fund’s proportionate interest in the net assets of such Portfolio. As of March 31, 2012, the percentages of Master Large Cap Core Portfolio, Master Large Cap Growth Portfolio and Master Large Cap Value Portfolio owned by BlackRock Large Cap Core Retirement Portfolio, BlackRock Large Cap Growth Retirement Portfolio and BlackRock Large Cap Value Retirement Portfolio were 3.3%, 0.2% and 7.8%, respectively. The performance of a Fund is directly affected by the performance of the applicable Portfolio. The financial statements of the Portfolios, including the Schedules of Investments, are included elsewhere in this report and should be read in conjunction with the Funds’ financial statements. The Funds’ financial statements are prepared in conformity with accounting principles generally accepted in the United States of America (“US GAAP”), which may require management to make estimates and assumptions that affect the reported amounts and disclosures in the financial statements. Actual results could differ from those estimates.
The following is a summary of significant accounting policies followed by the Funds:
Valuation: US GAAP defines fair value as the price the Funds would receive to sell an asset or pay to transfer a liability in an orderly transaction between market participants at the measurement date. The Funds fair value their financial instruments at market value. Each Fund records its investment in the corresponding Portfolio at fair value based on the Fund’s proportionate interest in the net assets of the corresponding Portfolio. Valuation of securities held by a Portfolio is discussed in Note 1 of the Master LLC’s Notes to Financial Statements, which are included elsewhere in this report.
Investment Transactions and Investment Income: For financial reporting purposes, contributions to and withdrawals from the corresponding Portfolio are accounted for on a trade date basis. Each Fund records daily its proportionate share of the corresponding Portfolio’s income, expenses and realized and unrealized gains and losses. In addition, each Fund accrues its own expenses.
Dividends and Distributions: Dividends and distributions paid by the Funds are recorded on the ex-dividend dates. The amount and timing of dividends and distributions are determined in accordance with federal income tax regulations, which may differ from US GAAP.
Income Taxes: It is each Fund’s policy to comply with the requirements of the Internal Revenue Code of 1986, as amended, applicable to regulated investment companies and to distribute substantially all of its taxable income to its shareholders. Therefore, no federal income tax provision is required.
Each Fund files US federal and various state and local tax returns. No income tax returns are currently under examination. The statute of limitations on each Fund’s US federal tax returns remains open for the two years ended September 30, 2011 and the periods ended September 30, 2009 and October 31, 2008. The statutes of limitations on each Fund’s state and local tax returns may remain open for an additional year depending upon the jurisdiction. Management does not believe there are any uncertain tax positions that require recognition of a tax liability.
Other: Expenses directly related to a Fund are charged to that Fund. Other operating expenses shared by several funds are pro rated among those funds on the basis of relative net assets or other appropriate methods.
2. Administration Agreement and Other Transactions with Affiliates:
The PNC Financial Services Group, Inc. (“PNC”) and Barclays Bank PLC (“Barclays”) are the largest stockholders of BlackRock, Inc. (“BlackRock”). Due to the ownership structure, PNC is an affiliate for 1940 Act purposes, but Barclays is not.
The Corporation, on behalf of each Fund, entered into an Administration Agreement with BlackRock Advisors, LLC (the “Administrator”), an indirect, wholly owned subsidiary of BlackRock, to provide administrative services (other than investment advice and related portfolio activities).
The Administrator does not receive an administration fee. The Administrator has contractually agreed to waive and/or reimburse fees or expenses, excluding interest expense, dividend expense, acquired fund fees and expenses and certain other fund expenses, in order to limit expenses. The Administrator has agreed not to reduce or discontinue this contractual waiver or reimbursement prior to February 1, 2013 unless approved by the Board, including a majority of the Independent Directors. These amounts are shown as administrator fees waived and/or reimbursed in the Statements of Operations. The expense limitation of each fund is 0.67% of the percentage of average daily net assets of such Fund.
Certain officers and/or directors of the Corporation are officers and/or directors of BlackRock or its affiliates. The Funds reimburse the Administrator for compensation paid to the Funds’ Chief Compliance Officer.
| | |
| | |
| | |
BLACKROCK LARGE CAP SERIES FUNDS, INC. | MARCH 31, 2012 | 17 |
| |
| |
Notes to Financial Statements (concluded) | BlackRock Large Cap Series Funds, Inc. |
3. Capital Loss Carryforwards:
As of September 30, 2011, the Funds had capital loss carryforwards available to offset future realized capital gains through the indicated expiration dates as follows:
| | | | | | | | | | |
Expires September 30, | | BlackRock
Large Cap Core
Retirement
Portfolio | | BlackRock
Large Cap Growth
Retirement
Portfolio | | BlackRock
Large Cap Value
Retirement
Portfolio | |
2016 | | $ | 19,032,662 | | $ | 93,243 | | | — | |
2017 | | | 24,488,876 | | | 18,251,218 | | $ | 15,706,504 | |
Total | | $ | 43,521,538 | | $ | 18,344,461 | | $ | 15,706,504 | |
Under the Regulated Investment Company Modernization Act of 2010, capital losses incurred by the Funds after September 30, 2011 will not be subject to expiration. In addition, any such losses must be utilized prior to the losses incurred in pre-enactment taxable years.
4. Capital Share Transactions:
Transactions in capital shares for Class K were as follows:
| | | | | | | | | | | | | | |
BlackRock Large Cap Core
Retirement Portfolio | | Six Months Ended
March 31, 2012 | | | Year Ended
September 30, 2011 | |
| Shares | | Amount | | | Shares | | Amount | |
Class K | | | | | | | | | | | | | | |
Shares sold | | | 7,437,759 | | $ | 83,276,245 | | | | 5,752,366 | | $ | 66,509,887 | |
Shares issued to shareholders in reinvestment of dividends | | | 146,850 | | | 1,539,158 | | | | 105,992 | | | 1,157,136 | |
Shares redeemed | | | (14,101,949 | ) | | (168,745,008 | ) | | | (3,874,726 | ) | | (43,877,351 | ) |
Net increase (decrease) | | | (6,517,340 | ) | $ | (83,929,605 | ) | | | 1,983,632 | | $ | 23,789,672 | |
| | | | | | | | | | | | | | |
BlackRock Large Cap Growth
Retirement Portfolio | | | | | | | | | | | | | | |
Class K | | | | | | | | | | | | | | |
Shares sold | | | 2,138,394 | | $ | 24,055,829 | | | | 4,007,792 | | $ | 44,093,163 | |
Shares issued to shareholders in reinvestment of dividends | | | 88,991 | | | 899,819 | | | | 67,861 | | | 711,630 | |
Shares redeemed | | | (12,541,034 | ) | | (151,720,025 | ) | | | (2,647,144 | ) | | (28,604,657 | ) |
Net increase (decrease) | | | (10,313,649 | ) | $ | (126,764,377 | ) | | | 1,428,509 | | $ | 16,200,136 | |
| | | | | | | | | | | | | | |
BlackRock Large Cap Value
Retirement Portfolio | | | | | | | | | | | | | | |
Class K | | | | | | | | | | | | | | |
Shares sold | | | 1,239,304 | | $ | 18,466,256 | | | | 2,518,610 | | $ | 38,683,662 | |
Shares issued to shareholders in reinvestment of dividends | | | 163,003 | | | 2,254,488 | | | | 140,336 | | | 2,062,642 | |
Shares redeemed | | | (5,993,254 | ) | | (94,802,280 | ) | | | (3,634,075 | ) | | (56,831,593 | ) |
Net decrease | | | (4,590,947 | ) | $ | (74,081,536 | ) | | | (975,129 | ) | $ | (16,085,289 | ) |
5. Subsequent Events:
Management has evaluated the impact of all subsequent events on each Fund through the date the financial statements were issued and has determined that there were no subsequent events requiring adjustment or additional disclosure in the financial statements.
| | |
| | |
18 | BLACKROCK LARGE CAP SERIES FUNDS, INC. | MARCH 31, 2012 |
| |
| |
Portfolio Information as of March 31, 2012 | Master Large Cap Series LLC |
| | | | | | |
Master Large Cap Core Portfolio | | Percent of
Long-Term Investments | |
Apple, Inc. | | | | 3 | % | |
Chevron Corp. | | | | 3 | | |
Pfizer, Inc. | | | | 2 | | |
Exxon Mobil Corp. | | | | 2 | | |
ConocoPhillips | | | | 2 | | |
UnitedHealth Group, Inc. | | | | 2 | | |
Abbott Laboratories | | | | 1 | | |
Apache Corp. | | | | 1 | | |
Eli Lilly & Co. | | | | 1 | | |
General Dynamics Corp. | | | | 1 | | |
| | | | | | |
Master Large Cap Growth Portfolio | | Percent of
Long-Term Investments | |
Apple, Inc. | | | | 6 | % | |
Exxon Mobil Corp. | | | | 5 | | |
International Business Machines Corp. | | | | 4 | | |
Microsoft Corp. | | | | 4 | | |
Philip Morris International, Inc. | | | | 3 | | |
Abbott Laboratories | | | | 2 | | |
Accenture Plc, Class A | | | | 2 | | |
Gilead Sciences, Inc. | | | | 2 | | |
DIRECTV, Class A | | | | 1 | | |
Cummins, Inc. | | | | 1 | | |
| | | | | | |
Master Large Cap Value Portfolio | | Percent of
Long-Term Investments | |
Chevron Corp. | | | | 4 | % | |
JPMorgan Chase & Co. | | | | 4 | | |
Pfizer, Inc. | | | | 3 | | |
ConocoPhillips | | | | 2 | | |
UnitedHealth Group, Inc. | | | | 2 | | |
Apache Corp. | | | | 1 | | |
Prudential Financial, Inc. | | | | 1 | | |
Eli Lilly & Co. | | | | 1 | | |
Tyco International Ltd. | | | | 1 | | |
General Dynamics Corp. | | | | 1 | | |
| | | | | | |
Master Large Cap Core Portfolio | | Percent of
Long-Term Investments | |
Information Technology | | | | 20 | % | |
Health Care | | | | 16 | | |
Consumer Discretionary | | | | 15 | | |
Energy | | | | 14 | | |
Industrials | | | | 12 | | |
Consumer Staples | | | | 8 | | |
Financials | | | | 6 | | |
Materials | | | | 4 | | |
Utilities | | | | 3 | | |
Telecommunication Services | | | | 2 | | |
| | | | | | |
Master Large Cap Growth Portfolio | | | Percent of
Long-Term Investments | |
Information Technology | | | | 32 | % | |
Consumer Discretionary | | | | 19 | | |
Health Care | | | | 15 | | |
Energy | | | | 10 | | |
Industrials | | | | 9 | | |
Consumer Staples | | | | 7 | | |
Materials | | | | 3 | | |
Financials | | | | 3 | | |
Telecommunication Services | | | | 2 | | |
| | | | | | |
Master Large Cap Value Portfolio | | Percent of
Long-Term Investments | |
Financials | | | | 17 | % | |
Industrials | | | | 16 | | |
Health Care | | | | 15 | | |
Information Technology | | | | 15 | | |
Energy | | | | 14 | | |
Consumer Discretionary | | | | 9 | | |
Consumer Staples | | | | 5 | | |
Materials | | | | 4 | | |
Utilities | | | | 3 | | |
Telecommunication Services | | | | 2 | | |
For Portfolio compliance purposes, the Portfolio’s sector classifications refer to any one or more of the sector sub-classifications used by one or more widely recognized market indexes or rating group indexes, and/or as defined by Portfolio management. These definitions may not apply for purposes of this report, which may combine such sector sub-classifications for reporting ease.
| | | |
| | | |
| BLACKROCK LARGE CAP SERIES FUNDS, INC. | MARCH 31, 2012 | 19 |
| |
| |
Schedule of Investments March 31, 2012 (Unaudited) | Master Large Cap Core Portfolio |
(Percentages shown are based on Net Assets) |
| | | | | | | |
Common Stocks | | Shares | | Value | |
Consumer Discretionary — 15.2% | | | | | | | |
Auto Components — 0.7% | | | | | | | |
Lear Corp. | | | 390,000 | | $ | 18,131,100 | |
Diversified Consumer Services — 2.5% | | | | | | | |
Apollo Group, Inc., Class A (a) | | | 670,000 | | | 25,888,800 | |
Career Education Corp. (a) | | | 820,000 | | | 6,609,200 | |
H&R Block, Inc. | | | 400,000 | | | 6,588,000 | |
ITT Educational Services, Inc. (a)(b) | | | 380,000 | | | 25,133,200 | |
| | | | | | 64,219,200 | |
Hotels, Restaurants & Leisure — 0.9% | | | | | | | |
Brinker International, Inc. | | | 10,000 | | | 275,500 | |
Wyndham Worldwide Corp. | | | 480,000 | | | 22,324,800 | |
| | | | | | 22,600,300 | |
Internet & Catalog Retail — 1.0% | | | | | | | |
Expedia, Inc. | | | 740,000 | | | 24,745,600 | |
Media — 4.4% | | | | | | | |
DISH Network Corp., Class A (a) | | | 810,000 | | | 26,673,300 | |
Gannett Co., Inc. | | | 1,690,000 | | | 25,907,700 | |
The Interpublic Group of Cos., Inc. | | | 2,430,000 | | | 27,726,300 | |
Time Warner Cable, Inc. | | | 370,000 | | | 30,155,000 | |
| | | | | | 110,462,300 | |
Multiline Retail — 1.1% | | | | | | | |
Dillard’s, Inc., Class A | | | 420,000 | | | 26,468,400 | |
Specialty Retail — 4.6% | | | | | | | |
Best Buy Co., Inc. | | | 1,070,000 | | | 25,337,600 | |
Foot Locker, Inc. | | | 830,000 | | | 25,771,500 | |
GameStop Corp., Class A (b) | | | 1,150,000 | | | 25,116,000 | |
Limited Brands, Inc. | | | 310,000 | | | 14,880,000 | |
PetSmart, Inc. | | | 460,000 | | | 26,321,200 | |
| | | | | | 117,426,300 | |
Total Consumer Discretionary | | | | | | 384,053,200 | |
Consumer Staples — 8.0% | | | | | | | |
Beverages — 1.9% | | | | | | | |
Constellation Brands, Inc., Class A (a) | | | 1,100,000 | | | 25,949,000 | |
Dr. Pepper Snapple Group, Inc. | | | 530,000 | | | 21,311,300 | |
| | | | | | 47,260,300 | |
Food & Staples Retailing — 2.2% | | | | | | | |
The Kroger Co. | | | 1,240,000 | | | 30,045,200 | |
Safeway, Inc. | | | 1,340,000 | | | 27,081,400 | |
| | | | | | 57,126,600 | |
Food Products — 1.9% | | | | | | | |
ConAgra Foods, Inc. | | | 980,000 | | | 25,734,800 | |
Smithfield Foods, Inc. (a) | | | 990,000 | | | 21,809,700 | |
| | | | | | 47,544,500 | |
Household Products — 0.4% | | | | | | | |
The Procter & Gamble Co. | | | 140,000 | | | 9,409,400 | |
Personal Products — 0.7% | | | | | | | |
Herbalife Ltd. | | | 270,000 | | | 18,581,400 | |
Tobacco — 0.9% | | | | | | | |
Philip Morris International, Inc. | | | 250,000 | | | 22,152,500 | |
Total Consumer Staples | | | | | | 202,074,700 | |
| | | | | | | |
Common Stocks | | Shares | | Value | |
Energy — 14.2% | | | | | | | |
Energy Equipment & Services — 0.7% | | | | | | | |
Nabors Industries Ltd. (a) | | | 1,040,000 | | $ | 18,189,600 | |
Oil, Gas & Consumable Fuels — 13.5% | | | | | | | |
Apache Corp. | | | 340,000 | | | 34,149,600 | |
Chevron Corp. | | | 600,000 | | | 64,344,000 | |
ConocoPhillips | | | 570,000 | | | 43,325,700 | |
Exxon Mobil Corp. | | | 670,000 | | | 58,109,100 | |
HollyFrontier Corp. | | | 600,000 | | | 19,290,000 | |
Marathon Oil Corp. | | | 850,000 | | | 26,945,000 | |
Marathon Petroleum Corp. | | | 520,000 | | | 22,547,200 | |
Murphy Oil Corp. | | | 330,000 | | | 18,569,100 | |
Tesoro Corp. (a) | | | 990,000 | | | 26,571,600 | |
Valero Energy Corp. | | | 1,120,000 | | | 28,862,400 | |
| | | | | | 342,713,700 | |
Total Energy | | | | | | 360,903,300 | |
Financials — 5.7% | | | | | | | |
Commercial Banks — 0.2% | | | | | | | |
Wells Fargo & Co. | | | 140,000 | | | 4,779,600 | |
Consumer Finance — 1.1% | | | | | | | |
Discover Financial Services | | | 860,000 | | | 28,672,400 | |
Diversified Financial Services — 1.2% | | | | | | | |
JPMorgan Chase & Co. | | | 150,000 | | | 6,897,000 | |
The NASDAQ OMX Group, Inc. (a) | | | 860,000 | | | 22,274,000 | |
| | | | | | 29,171,000 | |
Insurance — 3.2% | | | | | | | |
Allied World Assurance Co. Holdings AG | | | 110,000 | | | 7,553,700 | |
American Financial Group, Inc. | | | 130,000 | | | 5,015,400 | |
Assurant, Inc. | | | 630,000 | | | 25,515,000 | |
Protective Life Corp. | | | 280,000 | | | 8,293,600 | |
Prudential Financial, Inc. | | | 130,000 | | | 8,240,700 | |
Reinsurance Group of America, Inc. | | | 60,000 | | | 3,568,200 | |
Unum Group | | | 950,000 | | | 23,256,000 | |
| | | | | | 81,442,600 | |
Total Financials | | | | | | 144,065,600 | |
Health Care — 16.5% | | | | | | | |
Biotechnology — 0.2% | | | | | | | |
Myriad Genetics, Inc. (a) | | | 250,000 | | | 5,915,000 | |
Health Care Equipment & Supplies — 1.1% | | | | | | | |
Zimmer Holdings, Inc. | | | 430,000 | | | 27,640,400 | |
Health Care Providers & Services — 8.8% | | | | | | | |
Aetna, Inc. | | | 620,000 | | | 31,099,200 | |
AmerisourceBergen Corp. | | | 710,000 | | | 28,172,800 | |
Cardinal Health, Inc. | | | 460,000 | | | 19,830,600 | |
Coventry Health Care, Inc. | | | 760,000 | | | 27,033,200 | |
Humana, Inc. | | | 190,000 | | | 17,571,200 | |
McKesson Corp. | | | 330,000 | | | 28,964,100 | |
UnitedHealth Group, Inc. | | | 670,000 | | | 39,489,800 | |
WellPoint, Inc. | | | 420,000 | | | 30,996,000 | |
| | | | | | 223,156,900 | |
Pharmaceuticals — 6.4% | | | | | | | |
Abbott Laboratories | | | 580,000 | | | 35,548,200 | |
Eli Lilly & Co. | | | 820,000 | | | 33,021,400 | |
Forest Laboratories, Inc. (a)(b) | | | 780,000 | | | 27,058,200 | |
Johnson & Johnson | | | 120,000 | | | 7,915,200 | |
Pfizer, Inc. | | | 2,570,000 | | | 58,236,200 | |
| | | | | | 161,779,200 | |
Total Health Care | | | | | | 418,491,500 | |
| | |
See Notes to Financial Statements. |
| | |
20 | BLACKROCK LARGE CAP SERIES FUNDS, INC. | MARCH 31, 2012 |
| |
|
| |
Schedule of Investments (continued) | Master Large Cap Core Portfolio |
| (Percentages shown are based on Net Assets) |
| | | | | | | |
Common Stocks | | Shares | | Value | |
Industrials — 11.7% | | | | | | | |
Aerospace & Defense — 4.6% | | | | | | | |
General Dynamics Corp. | | | 430,000 | | $ | 31,553,400 | |
L-3 Communications Holdings, Inc. | | | 380,000 | | | 26,892,600 | |
Lockheed Martin Corp. | | | 330,000 | | | 29,653,800 | |
Northrop Grumman Corp. | | | 460,000 | | | 28,096,800 | |
| | | | | | 116,196,600 | |
Commercial Services & Supplies — 0.2% | | | | | | | |
Corrections Corp. of America (a) | | | 140,000 | | | 3,823,400 | |
Construction & Engineering — 1.4% | | | | | | | |
Chicago Bridge & Iron Co. NV | | | 530,000 | | | 22,890,700 | |
URS Corp. | | | 320,000 | | | 13,606,400 | |
| | | | | | 36,497,100 | |
Industrial Conglomerates — 1.8% | | | | | | | |
General Electric Co. | | | 710,000 | | | 14,249,700 | |
Tyco International Ltd. | | | 540,000 | | | 30,337,200 | |
| | | | | | 44,586,900 | |
Machinery — 3.7% | | | | | | | |
AGCO Corp. (a) | | | 540,000 | | | 25,493,400 | |
CNH Global NV (a) | | | 130,000 | | | 5,161,000 | |
ITT Corp. | | | 1,120,000 | | | 25,692,800 | |
Oshkosh Corp. (a) | | | 430,000 | | | 9,963,100 | |
Parker Hannifin Corp. | | | 330,000 | | | 27,901,500 | |
| | | | | | 94,211,800 | |
Total Industrials | | | | | | 295,315,800 | |
Information Technology — 20.3% | | | | | | | |
Computers & Peripherals — 7.3% | | | | | | | |
Apple, Inc. (a) | | | 130,000 | | | 77,931,100 | |
Dell, Inc. (a) | | | 1,830,000 | | | 30,378,000 | |
Lexmark International, Inc., Class A | | | 780,000 | | | 25,927,200 | |
Seagate Technology Plc | | | 910,000 | | | 24,524,500 | |
Western Digital Corp. (a) | | | 640,000 | | | 26,489,600 | |
| | | | | | 185,250,400 | |
Electronic Equipment, Instruments &
Components — 4.2% | | | | | | | |
Avnet, Inc. (a) | | | 740,000 | | | 26,928,600 | |
Ingram Micro, Inc., Class A (a) | | | 650,000 | | | 12,064,000 | |
Jabil Circuit, Inc. | | | 1,030,000 | | | 25,873,600 | |
Tech Data Corp. (a) | | | 300,000 | | | 16,278,000 | |
Vishay Intertechnology, Inc. (a) | | | 2,050,000 | | | 24,928,000 | |
| | | | | | 106,072,200 | |
Internet Software & Services — 0.9% | | | | | | | |
AOL, Inc. (a) | | | 650,000 | | | 12,330,500 | |
Google, Inc., Class A (a) | | | 10,000 | | | 6,412,400 | |
IAC/InterActiveCorp. | | | 110,000 | | | 5,399,900 | |
| | | | | | 24,142,800 | |
IT Services — 5.8% | | | | | | | |
Accenture Plc, Class A | | | 50,000 | | | 3,225,000 | |
Alliance Data Systems Corp. (a)(b) | | | 210,000 | | | 26,451,600 | |
Computer Sciences Corp. | | | 380,000 | | | 11,377,200 | |
Global Payments, Inc. | | | 490,000 | | | 23,260,300 | |
International Business Machines Corp. | | | 110,000 | | | 22,951,500 | |
Lender Processing Services, Inc. | | | 860,000 | | | 22,360,000 | |
SAIC, Inc. (a) | | | 730,000 | | | 9,636,000 | |
The Western Union Co. | | | 1,520,000 | | | 26,752,000 | |
| | | | | | 146,013,600 | |
Software — 2.1% | | | | | | | |
Microsoft Corp. | | | 790,000 | | | 25,477,500 | |
Symantec Corp. (a) | | | 1,510,000 | | | 28,237,000 | |
| | | | | | 53,714,500 | |
Total Information Technology | | | | | | 515,193,500 | |
| | | | | | | |
Common Stocks | | Shares | | Value | |
Materials — 3.7% | | | | | | | |
Chemicals — 2.2% | | | | | | | |
CF Industries Holdings, Inc. | | | 150,000 | | $ | 27,397,500 | |
Cytec Industries, Inc. | | | 450,000 | | | 27,355,500 | |
| | | | | | 54,753,000 | |
Paper & Forest Products — 1.5% | | | | | | | |
Domtar Corp. | | | 270,000 | | | 25,752,600 | |
International Paper Co. | | | 390,000 | | | 13,689,000 | |
| | | | | | 39,441,600 | |
Total Materials | | | | | | 94,194,600 | |
Telecommunication Services — 2.0% | | | | | | | |
Diversified Telecommunication Services — 1.0% | | | | | | | |
AT&T, Inc. | | | 240,000 | | | 7,495,200 | |
Verizon Communications, Inc. | | | 440,000 | | | 16,821,200 | |
| | | | | | 24,316,400 | |
Wireless Telecommunication Services — 1.0% | | | | | | | |
MetroPCS Communications, Inc. (a) | | | 2,830,000 | | | 25,526,600 | |
Total Telecommunication Services | | | | | | 49,843,000 | |
Utilities — 2.8% | | | | | | | |
Independent Power Producers &
Energy Traders — 1.8% | | | | | | | |
The AES Corp. (a) | | | 2,110,000 | | | 27,577,700 | |
NRG Energy, Inc. (a) | | | 1,200,000 | | | 18,804,000 | |
| | | | | | 46,381,700 | |
Multi-Utilities — 1.0% | | | | | | | |
Ameren Corp. | | | 790,000 | | | 25,738,200 | |
Total Utilities | | | | | | 72,119,900 | |
Total Long-Term Investments
(Cost — $2,090,590,329) — 100.1% | | | | | | 2,536,255,100 | |
|
| | | | | | | |
Short-Term Securities | | Beneficial
Interest
(000) | | | | |
BlackRock Liquidity Series, LLC
Money Market Series, 0.24% (c)(d)(e) | | $ | 87,183 | | | 87,182,715 | |
Total Short-Term Securities
(Cost — $87,182,715) — 3.5% | | | | | | 87,182,715 | |
Total Investments (Cost — $2,177,773,044*) — 103.6% | | | | | | 2,623,437,815 | |
Liabilities in Excess of Other Assets — (3.6)% | | | | | | (90,753,442 | ) |
Net Assets — 100.0% | | | | | $ | 2,532,684,373 | |
| |
| |
|
* | As of March 31, 2012, gross unrealized appreciation and gross unrealized depreciation based on cost for federal income tax purposes were as follows: |
| | | | | |
| Tax cost | | $ | 2,194,281,551 | |
| Gross unrealized appreciation | | $ | 492,512,247 | |
| Gross unrealized depreciation | | | (63,355,983 | ) |
| Net unrealized appreciation | | $ | 429,156,264 | |
| |
(a) | Non-income producing security. |
| |
(b) | Security, or a portion of security, is on loan. |
| | | |
See Notes to Financial Statements. |
| | | |
| BLACKROCK LARGE CAP SERIES FUNDS, INC. | MARCH 31, 2012 | 21 |
| |
| |
Schedule of Investments (concluded) | Master Large Cap Core Portfolio |
| |
(c) | Investments in companies considered to be an affiliate of the Portfolio during the period, for purposes of Section 2(a)(3) of the Investment Company Act of 1940, as amended, were as follows: |
| | | | | | | | | | | | | | |
| Affiliate | | Shares/
Beneficial
Interest Held at
September 30,
2011 | | Net
Activity | | Shares/
Beneficial
Interest Held at
March 31,
2012 | | Income | |
| BlackRock Liquidity | | | | | | | | | | | | | |
| Funds, TempFund, | | | | | | | | | | | | | |
| Institutional Class | | | — | | | — | | | — | | $ | 790 | |
| BlackRock Liquidity | | | | | | | | | | | | | |
| Series, LLC Money | | | | | | | | | | | | | |
| Market Series | | $ | 72,082,895 | | $ | 15,099,820 | | $ | 87,182,715 | | $ | 768,236 | |
| | |
(d) | Represents the current yield as of report date. |
| |
(e) | Security was purchased with the cash collateral from loaned securities. |
| |
• | For Portfolio compliance purposes, the Portfolio’s sector and industry classifications refer to any one or more of the sector and industry sub-classifications used by one or more widely recognized market indexes or rating group indexes, and/or as defined by Portfolio management. These definitions may not apply for purposes of this report, which may combine such sector and industry sub-classifications for reporting ease. |
| | |
• | Fair Value Measurements — Various inputs are used in determining the fair value of investments. These inputs are categorized into a disclosure hierarchy consisting of three broad levels for financial statement purposes as follows: |
| | |
| • | Level 1 — unadjusted price quotations in active markets/exchanges for identical assets and liabilities |
| | |
| • | Level 2 — other observable inputs (including, but not limited to: quoted prices for similar assets or liabilities in markets that are active, quoted prices for identical or similar assets or liabilities in markets that are not active, inputs other than quoted prices that are observable for the assets or liabilities (such as interest rates, yield curves, volatilities, prepayment speeds, loss severities, credit risks and default rates) or other market-corroborated inputs) |
| | |
| • | Level 3 — unobservable inputs based on the best information available in the circumstances, to the extent observable inputs are not available (including the Portfolio’s own assumptions used in determining the fair value of investments) |
Changes in valuation techniques may result in transfers into or out of an assigned level within the disclosure hierarchy. The categorization of a value determined for investments is based on the pricing transparency of the investment and is not necessarily an indication of the risks associated with investing in those securities. For information about the Portfolio’s policy regarding valuation of investments and other significant accounting policies, please refer to Note 1 of the Notes to Financial Statements.
The following table summarizes the inputs used as of March 31, 2012 in determining the fair valuation of the Portfolio’s investments:
| | | | | | | | | | | | | |
Valuation Inputs | | Level 1 | | Level 2 | | Level 3 | | Total | |
Assets: | | | | | | | | | | | | | |
Investments: | | | | | | | | | | | | | |
Long-Term
Investments1 | | $ | 2,536,255,100 | | | — | | | — | | $ | 2,536,255,100 | |
Short-Term
Securities | | | — | | $ | 87,182,715 | | | — | | | 87,182,715 | |
Total | | $ | 2,536,255,100 | | $ | 87,182,715 | | | — | | $ | 2,623,437,815 | |
| | |
| 1 | See above Schedule of Investments for values in each sector and industry. |
| | |
See Notes to Financial Statements. |
| | |
22 | BLACKROCK LARGE CAP SERIES FUNDS, INC. | MARCH 31, 2012 |
| |
| |
Schedule of Investments March 31, 2012 (Unaudited) | Master Large Cap Growth Portfolio |
(Percentages shown are based on Net Assets) |
| | | | | | | |
Common Stocks | | Shares | | Value | |
Consumer Discretionary — 18.9% | | | | | | | |
Diversified Consumer Services — 3.0% | | | | | | | |
Apollo Group, Inc., Class A (a) | | | 310,000 | | $ | 11,978,400 | |
Career Education Corp. (a) | | | 440,000 | | | 3,546,400 | |
H&R Block, Inc. | | | 380,000 | | | 6,258,600 | |
ITT Educational Services, Inc. (a)(b) | | | 180,000 | | | 11,905,200 | |
| | | | | | 33,688,600 | |
Hotels, Restaurants & Leisure — 1.0% | | | | | | | |
Brinker International, Inc. | | | 410,000 | | | 11,295,500 | |
Internet & Catalog Retail — 1.0% | | | | | | | |
Expedia, Inc. | | | 340,000 | | | 11,369,600 | |
Leisure Equipment & Products — 1.0% | | | | | | | |
Polaris Industries, Inc. | | | 160,000 | | | 11,544,000 | |
Media — 7.3% | | | | | | | |
Cablevision Systems Corp., New York Group, Class A | | | 800,000 | | | 11,744,000 | |
DIRECTV, Class A (a) | | | 340,000 | | | 16,775,600 | |
DISH Network Corp., Class A (a) | | | 370,000 | | | 12,184,100 | |
The Interpublic Group of Cos., Inc. | | | 1,100,000 | | | 12,551,000 | |
The McGraw-Hill Cos., Inc. | | | 280,000 | | | 13,571,600 | |
Time Warner Cable, Inc. | | | 190,000 | | | 15,485,000 | |
| | | | | | 82,311,300 | |
Multiline Retail — 3.0% | | | | | | | |
Big Lots, Inc. (a) | | | 120,000 | | | 5,162,400 | |
Dollar Tree, Inc. (a) | | | 50,000 | | | 4,724,500 | |
Macy’s, Inc. | | | 290,000 | | | 11,521,700 | |
Nordstrom, Inc. | | | 230,000 | | | 12,815,600 | |
| | | | | | 34,224,200 | |
Specialty Retail — 2.6% | | | | | | | |
Advance Auto Parts, Inc. | | | 140,000 | | | 12,399,800 | |
AutoZone, Inc. (a) | | | 10,000 | | | 3,718,000 | |
PetSmart, Inc. | | | 230,000 | | | 13,160,600 | |
TJX Cos., Inc. | | | 10,000 | | | 397,100 | |
| | | | | | 29,675,500 | |
Total Consumer Discretionary | | | | | | 214,108,700 | |
Consumer Staples — 6.5% | | | | | | | |
Beverages — 1.1% | | | | | | | |
Dr. Pepper Snapple Group, Inc. | | | 320,000 | | | 12,867,200 | |
Food & Staples Retailing — 1.1% | | | | | | | |
The Kroger Co. | | | 540,000 | | | 13,084,200 | |
Food Products — 0.2% | | | | | | | |
ConAgra Foods, Inc. | | | 70,000 | | | 1,838,200 | |
Personal Products — 1.1% | | | | | | | |
Herbalife Ltd. | | | 180,000 | | | 12,387,600 | |
Tobacco — 3.0% | | | | | | | |
Philip Morris International, Inc. | | | 380,000 | | | 33,671,800 | |
Total Consumer Staples | | | | | | 73,849,000 | |
Energy — 10.4% | | | | | | | |
Oil, Gas & Consumable Fuels — 10.4% | | | | | | | |
Apache Corp. | | | 140,000 | | | 14,061,600 | |
Chevron Corp. | | | 120,000 | | | 12,868,800 | |
Denbury Resources, Inc. (a) | | | 680,000 | | | 12,396,400 | |
Exxon Mobil Corp. | | | 640,000 | | | 55,507,200 | |
HollyFrontier Corp. | | | 380,000 | | | 12,217,000 | |
Marathon Oil Corp. | | | 200,000 | | | 6,340,000 | |
Murphy Oil Corp. | | | 90,000 | | | 5,064,300 | |
Total Energy | | | | | | 118,455,300 | |
| | | | | | | |
Common Stocks | | Shares | | Value | |
Financials — 2.7% | | | | | | | |
Consumer Finance — 1.1% | | | | | | | |
Discover Financial Services | | | 360,000 | | $ | 12,002,400 | |
Diversified Financial Services — 1.6% | | | | | | | |
Moody’s Corp. | | | 180,000 | | | 7,578,000 | |
The NASDAQ OMX Group, Inc. (a) | | | 420,000 | | | 10,878,000 | |
| | | | | | 18,456,000 | |
Total Financials | | | | | | 30,458,400 | |
Health Care — 15.3% | | | | | | | |
Biotechnology — 2.9% | | | | | | | |
Gilead Sciences, Inc. (a) | | | 360,000 | | | 17,586,000 | |
Myriad Genetics, Inc. (a) | | | 490,000 | | | 11,593,400 | |
United Therapeutics Corp. (a) | | | 70,000 | | | 3,299,100 | |
| | | | | | 32,478,500 | |
Health Care Providers & Services — 7.5% | | | | | | | |
Aetna, Inc. | | | 227,000 | | | 11,386,320 | |
AmerisourceBergen Corp. | | | 340,000 | | | 13,491,200 | |
Cardinal Health, Inc. | | | 300,000 | | | 12,933,000 | |
Coventry Health Care, Inc. | | | 287,000 | | | 10,208,590 | |
McKesson Corp. | | | 170,000 | | | 14,920,900 | |
Patterson Cos., Inc. | | | 350,000 | | | 11,690,000 | |
UnitedHealth Group, Inc. | | | 187,000 | | | 11,021,780 | |
| | | | | | 85,651,790 | |
Life Sciences Tools & Services — 0.2% | | | | | | | |
Charles River Laboratories International, Inc. (a) | | | 70,000 | | | 2,526,300 | |
Pharmaceuticals — 4.7% | | | | | | | |
Abbott Laboratories | | | 410,000 | | | 25,128,900 | |
Bristol-Myers Squibb Co. | | | 224,000 | | | 7,560,000 | |
Eli Lilly & Co. | | | 340,000 | | | 13,691,800 | |
Warner Chilcott Plc, Class A (a) | | | 430,000 | | | 7,228,300 | |
| | | | | | 53,609,000 | |
Total Health Care | | | | | | 174,265,590 | |
Industrials — 9.4% | | | | | | | |
Aerospace & Defense — 2.7% | | | | | | | |
Alliant Techsystems, Inc. | | | 220,000 | | | 11,026,400 | |
Lockheed Martin Corp. | | | 160,000 | | | 14,377,600 | |
United Technologies Corp. | | | 60,000 | | | 4,976,400 | |
| | | | | | 30,380,400 | |
Airlines — 1.1% | | | | | | | |
Copa Holdings SA, Class A | | | 150,000 | | | 11,880,000 | |
Commercial Services & Supplies — 1.9% | | | | | | | |
Covanta Holding Corp. | | | 690,000 | | | 11,198,700 | |
Iron Mountain, Inc. | | | 370,000 | | | 10,656,000 | |
| | | | | | 21,854,700 | |
Construction & Engineering — 1.3% | | | | | | | |
AECOM Technology Corp. (a) | | | 160,000 | | | 3,579,200 | |
Chicago Bridge & Iron Co. NV | | | 270,000 | | | 11,661,300 | |
| | | | | | 15,240,500 | |
Machinery — 2.4% | | | | | | | |
Cummins, Inc. | | | 130,000 | | | 15,605,200 | |
Parker Hannifin Corp. | | | 140,000 | | | 11,837,000 | |
| | | | | | 27,442,200 | |
Total Industrials | | | | | | 106,797,800 | |
| | | |
See Notes to Financial Statements. |
| | | |
| BLACKROCK LARGE CAP SERIES FUNDS, INC. | MARCH 31, 2012 | 23 |
| |
| |
Schedule of Investments (continued) | Master Large Cap Growth Portfolio |
(Percentages shown are based on Net Assets) |
| | | | | | | |
Common Stocks | | Shares | | Value | |
Information Technology — 31.6% | | | | | | | |
Computers & Peripherals — 10.5% | | | | | | | |
Apple, Inc. (a) | | | 120,000 | | $ | 71,936,400 | |
Dell, Inc. (a) | | | 870,000 | | | 14,442,000 | |
QLogic Corp. (a) | | | 660,000 | | | 11,721,600 | |
Seagate Technology Plc | | | 400,000 | | | 10,780,000 | |
Western Digital Corp. (a) | | | 260,000 | | | 10,761,400 | |
| | | | | | 119,641,400 | |
Electronic Equipment, Instruments &
Components — 1.9% | | | | | | | |
Arrow Electronics, Inc. (a) | | | 240,000 | | | 10,072,800 | |
Jabil Circuit, Inc. | | | 470,000 | | | 11,806,400 | |
| | | | | | 21,879,200 | |
Internet Software & Services — 0.6% | | | | | | | |
Google, Inc., Class A (a) | | | 10,000 | | | 6,412,400 | |
IT Services — 12.4% | | | | | | | |
Accenture Plc, Class A (b) | | | 280,000 | | | 18,060,000 | |
Alliance Data Systems Corp. (a)(b) | | | 100,000 | | | 12,596,000 | |
DST Systems, Inc. | | | 230,000 | | | 12,472,900 | |
Global Payments, Inc. | | | 230,000 | | | 10,918,100 | |
International Business Machines Corp. | | | 240,000 | | | 50,076,000 | |
Lender Processing Services, Inc. | | | 470,000 | | | 12,220,000 | |
SAIC, Inc. (a)(b) | | | 870,000 | | | 11,484,000 | |
The Western Union Co. | | | 740,000 | | | 13,024,000 | |
| | | | | | 140,851,000 | |
Software — 6.2% | | | | | | | |
Microsoft Corp. | | | 1,510,000 | | | 48,697,500 | |
Symantec Corp. (a) | | | 740,000 | | | 13,838,000 | |
Synopsys, Inc. (a) | | | 250,000 | | | 7,665,000 | |
| | | | | | 70,200,500 | |
Total Information Technology | | | | | | 358,984,500 | |
Materials — 2.8% | | | | | | | |
Chemicals — 1.8% | | | | | | | |
CF Industries Holdings, Inc. | | | 70,000 | | | 12,785,500 | |
PPG Industries, Inc. | | | 80,000 | | | 7,664,000 | |
| | | | | | 20,449,500 | |
Paper & Forest Products — 1.0% | | | | | | | |
International Paper Co. | | | 330,000 | | | 11,583,000 | |
Total Materials | | | | | | 32,032,500 | |
Telecommunication Services — 2.4% | | | | | | | |
Diversified Telecommunication Services — 1.4% | | | | | | | |
Verizon Communications, Inc. | | | 400,000 | | | 15,292,000 | |
Wireless Telecommunication Services — 1.0% | | | | | | | |
MetroPCS Communications, Inc. (a) | | | 1,310,000 | | | 11,816,200 | |
Total Telecommunication Services | | | | | | 27,108,200 | |
Total Long-Term Investments
(Cost — $933,679,570) — 100.0% | | | | | | 1,136,059,990 | |
| | | | | | | |
Short-Term Securities | | Beneficial
Interest
(000) | | Value | |
BlackRock Liquidity Series, LLC
Money Market Series, 0.24% (c)(d)(e) | | $ | 46,238 | | $ | 46,238,405 | |
Total Short-Term Securities
(Cost — $46,238,405) — 4.1% | | | | | | 46,238,405 | |
Total Investments (Cost — $979,917,975*) — 104.1% | | | | | | 1,182,298,395 | |
Liabilities in Excess of Other Assets — (4.1)% | | | | | | (46,903,105 | ) |
Net Assets — 100.0% | | | | | $ | 1,135,395,290 | |
| |
|
* | As of March 31, 2012, gross unrealized appreciation and gross unrealized depreciation based on cost for federal income tax purposes were as follows: |
| | | | |
Tax cost | | $ | 991,655,508 | |
Gross unrealized appreciation | | $ | 213,783,633 | |
Gross unrealized depreciation | | | (23,140,746 | ) |
Net unrealized appreciation | | $ | 190,642,887 | |
| |
(a) | Non-income producing security. |
| |
(b) | Security, or a portion of security, is on loan. |
| |
(c) | Investments in companies considered to be an affiliate of the Portfolio during the period, for purposes of Section 2(a)(3) of the Investment Company Act of 1940, as amended, were as follows: |
| | | | | | | | | | | | | |
Affiliate | | Shares/
Beneficial
Interest Held at
September 30,
2011 | | Net
Activity | | Shares/
Beneficial
Interest Held at
March 31,
2012 | | Income | |
BlackRock Liquidity
Funds, TempFund,
Institutional Class | | | 2,585,122 | | | (2,585,122 | ) | | — | | $ | 1,375 | |
BlackRock Liquidity
Series, LLC Money
Market Series | | $ | 24,184,509 | | $ | 22,053,896 | | $ | 46,238,405 | | $ | 358,564 | |
| |
(d) | Represents the current yield as of report date. |
| |
(e) | Security was purchased with the cash collateral from loaned securities. |
| | |
• | For Portfolio compliance purposes,the Portfolio’s sector and industry classifications refer to any one or more of the sector and industry sub-classifications used by one or more widely recognized market indexes or rating group indexes, and/or as defined by Portfolio management. These definitions may not apply for purposes of this report, which may combine such sector and industry sub-classifications for reporting ease. |
| | |
• | Fair Value Measurements — Various inputs are used in determining the fair value of investments. These inputs are categorized into a disclosure hierarchy consisting of three broad levels for financial statement purposes as follows: |
| | |
| • | Level 1 — unadjusted price quotations in active markets/exchanges for identical assets and liabilities |
| | |
| • | Level 2 — other observable inputs (including, but not limited to: quoted prices for similar assets or liabilities in markets that are active, quoted prices for identical or similar assets or liabilities in markets that are not active, inputs other than quoted prices that are observable for the assets or liabilities (such as interest rates, yield curves, volatilities, prepayment speeds, loss severities, credit risks and default rates) or other market-corroborated inputs) |
| | |
| • | Level 3 — unobservable inputs based on the best information available in the circumstances, to the extent observable inputs are not available (including the Portfolio’s own assumptions used in determining the fair value of investments) |
| | |
See Notes to Financial Statements. |
| | |
24 | BLACKROCK LARGE CAP SERIES FUNDS, INC. | MARCH 31, 2012 |
| |
| |
Schedule of Investments (concluded) | Master Large Cap Growth Portfolio |
Changes in valuation techniques may result in transfers into or out of an assigned level within the disclosure hierarchy. The categorization of a value determined for investments is based on the pricing transparency of the investment and is not necessarily an indication of the risks associated with investing in those securities. For information about the Portfolio’s policy regarding valuation of investments and other significant accounting policies, please refer to Note 1 of the Notes to Financial Statements.
The following table summarizes the inputs used as of March 31, 2012 in determining the fair valuation of the Portfolio’s investments:
| | | | | | | | | | | | | |
Valuation Inputs | | Level 1 | | Level 2 | | Level 3 | | Total | |
Assets: | | | | | | | | | | | | | |
Investments: | | | | | | | | | | | | | |
Long-Term
Investments1 | | $ | 1,136,059,990 | | | — | | | — | | $ | 1,136,059,990 | |
Short-Term
Securities | | | — | | $ | 46,238,405 | | | — | | | 46,238,405 | |
Total | | $ | 1,136,059,990 | | $ | 46,238,405 | | | — | | $ | 1,182,298,395 | |
| | |
| 1 | See above Schedule of Investments for values in each sector and industry. |
| | | |
See Notes to Financial Statements. |
| | | |
| BLACKROCK LARGE CAP SERIES FUNDS, INC. | MARCH 31, 2012 | 25 |
| |
| |
Schedule of Investments March 31, 2012 (Unaudited) | Master Large Cap Value Portfolio |
| (Percentages shown are based on Net Assets) |
| | | | | | | |
Common Stocks | | Shares | | Value | |
Consumer Discretionary — 9.2% | | | | | | | |
Auto Components — 0.4% | | | | | | | |
Lear Corp. | | | 120,000 | | $ | 5,578,800 | |
Diversified Consumer Services — 0.9% | | | | | | | |
Career Education Corp. (a)(b) | | | 750,000 | | | 6,045,000 | |
Education Management Corp. (a)(b) | | | 350,000 | | | 4,791,500 | |
H&R Block, Inc. | | | 30,000 | | | 494,100 | |
| | | | | | 11,330,600 | |
Internet & Catalog Retail — 1.0% | | | | | | | |
Expedia, Inc. | | | 410,000 | | | 13,710,400 | |
Media — 3.0% | | | | | | | |
DISH Network Corp., Class A (a) | | | 430,000 | | | 14,159,900 | |
Gannett Co., Inc. | | | 800,000 | | | 12,264,000 | |
The Interpublic Group of Cos., Inc. | | | 1,300,000 | | | 14,833,000 | |
| | | | | | 41,256,900 | |
Multiline Retail — 1.0% | | | | | | | |
Dillard’s, Inc., Class A | | | 220,000 | | | 13,864,400 | |
Specialty Retail — 2.9% | | | | | | | |
Best Buy Co., Inc. | | | 610,000 | | | 14,444,800 | |
Foot Locker, Inc. | | | 370,000 | | | 11,488,500 | |
GameStop Corp., Class A (b) | | | 640,000 | | | 13,977,600 | |
| | | | | | 39,910,900 | |
Total Consumer Discretionary | | | | | | 125,652,000 | |
Consumer Staples — 5.0% | | | | | | | |
Beverages — 1.0% | | | | | | | |
Constellation Brands, Inc., Class A (a) | | | 610,000 | | | 14,389,900 | |
Food & Staples Retailing — 1.6% | | | | | | | |
The Kroger Co. | | | 590,000 | | | 14,295,700 | |
Safeway, Inc. | | | 400,000 | | | 8,084,000 | |
| | | | | | 22,379,700 | |
Food Products — 0.7% | | | | | | | |
Smithfield Foods, Inc. (a) | | | 410,000 | | | 9,032,300 | |
Household Products — 0.5% | | | | | | | |
The Procter & Gamble Co. | | | 100,000 | | | 6,721,000 | |
Tobacco — 1.2% | | | | | | | |
Philip Morris International, Inc. | | | 190,000 | | | 16,835,900 | |
Total Consumer Staples | | | | | | 69,358,800 | |
Energy — 13.7% | | | | | | | |
Oil, Gas & Consumable Fuels — 13.7% | | | | | | | |
Apache Corp. | | | 200,000 | | | 20,088,000 | |
Chevron Corp. | | | 500,000 | | | 53,620,000 | |
ConocoPhillips | | | 440,000 | | | 33,444,400 | |
Devon Energy Corp. | | | 130,000 | | | 9,245,600 | |
Marathon Oil Corp. | | | 560,000 | | | 17,752,000 | |
Marathon Petroleum Corp. | | | 390,000 | | | 16,910,400 | |
Murphy Oil Corp. | | | 90,000 | | | 5,064,300 | |
Tesoro Corp. (a) | | | 530,000 | | | 14,225,200 | |
Valero Energy Corp. | | | 660,000 | | | 17,008,200 | |
Total Energy | | | | | | 187,358,100 | |
| | | | | | | |
Common Stocks | | Shares | | Value | |
Financials — 16.9% | | | | | | | |
Consumer Finance — 1.3% | | | | | | | |
Discover Financial Services | | | 520,000 | | $ | 17,336,800 | |
Diversified Financial Services — 4.9% | | | | | | | |
JPMorgan Chase & Co. | | | 1,080,000 | | | 49,658,400 | |
The NASDAQ OMX Group, Inc. (a) | | | 550,000 | | | 14,245,000 | |
Wells Fargo & Co. | | | 90,000 | | | 3,072,600 | |
| | | | | | 66,976,000 | |
Insurance — 9.7% | | | | | | | |
Allied World Assurance Co. Holdings AG | | | 210,000 | | | 14,420,700 | |
American Financial Group, Inc. | | | 400,000 | | | 15,432,000 | |
Assurant, Inc. | | | 360,000 | | | 14,580,000 | |
Chubb Corp. | | | 90,000 | | | 6,219,900 | |
Fidelity National Financial, Inc., Class A | | | 300,000 | | | 5,409,000 | |
HCC Insurance Holdings, Inc. | | | 60,000 | | | 1,870,200 | |
Protective Life Corp. | | | 520,000 | | | 15,402,400 | |
Prudential Financial, Inc. | | | 310,000 | | | 19,650,900 | |
Reinsurance Group of America, Inc. | | | 250,000 | | | 14,867,500 | |
Unum Group | | | 610,000 | | | 14,932,800 | |
W.R. Berkley Corp. | | | 280,000 | | | 10,113,600 | |
| | | | | | 132,899,000 | |
Thrifts & Mortgage Finance — 1.0% | | | | | | | |
Capitol Federal Financial, Inc. | | | 200,000 | | | 2,372,000 | |
Washington Federal, Inc. | | | 700,000 | | | 11,774,000 | |
| | | | | | 14,146,000 | |
Total Financials | | | | | | 231,357,800 | |
Health Care — 15.3% | | | | | | | |
Health Care Equipment & Supplies — 1.2% | | | | | | | |
Zimmer Holdings, Inc. | | | 250,000 | | | 16,070,000 | |
Health Care Providers & Services — 7.0% | | | | | | | |
Aetna, Inc. | | | 350,000 | | | 17,556,000 | |
Cardinal Health, Inc. | | | 350,000 | | | 15,088,500 | |
Coventry Health Care, Inc. | | | 430,000 | | | 15,295,100 | |
Humana, Inc. | | | 190,000 | | | 17,571,200 | |
UnitedHealth Group, Inc. | | | 460,000 | | | 27,112,400 | |
WellPoint, Inc. | | | 50,000 | | | 3,690,000 | |
| | | | | | 96,313,200 | |
Pharmaceuticals — 7.1% | | | | | | | |
Abbott Laboratories | | | 240,000 | | | 14,709,600 | |
Eli Lilly & Co. | | | 480,000 | | | 19,329,600 | |
Forest Laboratories, Inc. (a) | | | 450,000 | | | 15,610,500 | |
Pfizer, Inc. | | | 2,110,000 | | | 47,812,600 | |
| | | | | | 97,462,300 | |
Total Health Care | | | | | | 209,845,500 | |
Industrials — 15.7% | | | | | | | |
Aerospace & Defense — 5.8% | | | | | | | |
Alliant Techsystems, Inc. | | | 120,000 | | | 6,014,400 | |
General Dynamics Corp. | | | 250,000 | | | 18,345,000 | |
L-3 Communications Holdings, Inc. | | | 220,000 | | | 15,569,400 | |
Lockheed Martin Corp. | | | 160,000 | | | 14,377,600 | |
Northrop Grumman Corp. | | | 300,000 | | | 18,324,000 | |
Raytheon Co. | | | 140,000 | | | 7,389,200 | |
| | | | | | 80,019,600 | |
Airlines — 1.0% | | | | | | | |
Copa Holdings SA, Class A | | | 170,000 | | | 13,464,000 | |
| | |
See Notes to Financial Statements. |
| | |
26 | BLACKROCK LARGE CAP SERIES FUNDS, INC. | MARCH 31, 2012 |
| |
| |
Schedule of Investments (continued) | Master Large Cap Value Portfolio |
| (Percentages shown are based on Net Assets) |
| | | | | | | |
Common Stocks | | Shares | | Value | |
Industrials (concluded) | | | | | | | |
Commercial Services & Supplies — 1.1% | | | | | | | |
Corrections Corp. of America (a) | | | 550,000 | | $ | 15,020,500 | |
Construction & Engineering — 2.0% | | | | | | | |
Chicago Bridge & Iron Co. NV | | | 320,000 | | | 13,820,800 | |
URS Corp. | | | 330,000 | | | 14,031,600 | |
| | | | | | 27,852,400 | |
Industrial Conglomerates — 2.5% | | | | | | | |
General Electric Co. | | | 730,000 | | | 14,651,100 | |
Tyco International Ltd. | | | 340,000 | | | 19,101,200 | |
| | | | | | 33,752,300 | |
Machinery — 3.3% | | | | | | | |
AGCO Corp. (a) | | | 180,000 | | | 8,497,800 | |
CNH Global NV (a) | | | 370,000 | | | 14,689,000 | |
Oshkosh Corp. (a) | | | 280,000 | | | 6,487,600 | |
Parker Hannifin Corp. | | | 180,000 | | | 15,219,000 | |
| | | | | | 44,893,400 | |
Total Industrials | | | | | | 215,002,200 | |
Information Technology — 15.2% | | | | | | | |
Computers & Peripherals — 5.7% | | | | | | | |
Dell, Inc. (a)(b) | | | 970,000 | | | 16,102,000 | |
Hewlett-Packard Co. (a) | | | 180,000 | | | 4,289,400 | |
Lexmark International, Inc., Class A | | | 440,000 | | | 14,625,600 | |
QLogic Corp. (a) | | | 820,000 | | | 14,563,200 | |
Seagate Technology Plc | | | 490,000 | | | 13,205,500 | |
Western Digital Corp. (a) | | | 370,000 | | | 15,314,300 | |
| | | | | | 78,100,000 | |
Electronic Equipment, Instruments &
Components — 5.0% | | | | | | | |
Avnet, Inc. (a) | | | 410,000 | | | 14,919,900 | |
Ingram Micro, Inc., Class A (a) | | | 790,000 | | | 14,662,400 | |
Jabil Circuit, Inc. | | | 410,000 | | | 10,299,200 | |
Tech Data Corp. (a)(b) | | | 280,000 | | | 15,192,800 | |
Vishay Intertechnology, Inc. (a)(b) | | | 1,150,000 | | | 13,984,000 | |
| | | | | | 69,058,300 | |
Internet Software & Services — 0.2% | | | | | | | |
IAC/InterActiveCorp. | | | 50,000 | | | 2,454,500 | |
IT Services — 3.2% | | | | | | | |
Computer Sciences Corp. | | | 480,000 | | | 14,371,200 | |
DST Systems, Inc. | | | 270,000 | | | 14,642,100 | |
SAIC, Inc. (a)(b) | | | 1,130,000 | | | 14,916,000 | |
| | | | | | 43,929,300 | |
Semiconductors & Semiconductor
Equipment — 0.1% | | | | | | | |
Intel Corp. | | | 60,000 | | | 1,686,600 | |
Software — 1.0% | | | | | | | |
Symantec Corp. (a) | | | 750,000 | | | 14,025,000 | |
Total Information Technology | | | | | | 209,253,700 | |
Materials — 4.3% | | | | | | | |
Chemicals — 2.1% | | | | | | | |
CF Industries Holdings, Inc. | | | 80,000 | | | 14,612,000 | |
Cytec Industries, Inc. | | | 230,000 | | | 13,981,700 | |
| | | | | | 28,593,700 | |
Paper & Forest Products — 2.2% | | | | | | | |
Domtar Corp. | | | 160,000 | | | 15,260,800 | |
International Paper Co. | | | 450,000 | | | 15,795,000 | |
| | | | | | 31,055,800 | |
Total Materials | | | | | | 59,649,500 | |
| | | | | | | |
Common Stocks | | Shares | | Value | |
Telecommunication Services — 2.0% | | | | | | | |
Diversified Telecommunication Services — 1.3% | | | | | | | |
AT&T, Inc. | | | 310,000 | | $ | 9,681,300 | |
Verizon Communications, Inc. | | | 200,000 | | | 7,646,000 | |
| | | | | | 17,327,300 | |
Wireless Telecommunication Services — 0.7% | | | | | | | |
MetroPCS Communications, Inc. (a) | | | 1,060,000 | | | 9,561,200 | |
Total Telecommunication Services | | | | | | 26,888,500 | |
Utilities — 3.1% | | | | | | | |
Independent Power Producers &
Energy Traders — 1.9% | | | | | | | |
The AES Corp. (a) | | | 1,210,000 | | | 15,814,700 | |
NRG Energy, Inc. (a) | | | 680,000 | | | 10,655,600 | |
| | | | | | 26,470,300 | |
Multi-Utilities — 1.2% | | | | | | | |
Ameren Corp. | | | 490,000 | | | 15,964,200 | |
Total Utilities | | | | | | 42,434,500 | |
Total Long-Term Investments
(Cost — $1,167,861,649) — 100.4% | | | | | | 1,376,800,600 | |
| | | | | | | |
| | | | | | | |
Short-Term Securities | | Beneficial
Interest
(000) | | | | |
BlackRock Liquidity Series, LLC
Money Market Series, 0.24% (c)(d)(e) | | $ | 26,455 | | | 26,455,449 | |
Total Short-Term Securities
(Cost — $26,455,449) — 1.9% | | | | | | 26,455,449 | |
Total Investments (Cost — $1,194,317,098*) — 102.3% | | | | | | 1,403,256,049 | |
Liabilities in Excess of Other Assets — (2.3)% | | | | | | (31,585,175 | ) |
Net Assets — 100.0% | | | | | $ | 1,371,670,874 | |
| |
|
* | As of March 31, 2012, gross unrealized appreciation and gross unrealized depreciation based on cost for federal income tax purposes were as follows: |
| | | | |
Tax cost | | $ | 1,232,139,650 | |
Gross unrealized appreciation | | $ | 229,495,388 | |
Gross unrealized depreciation | | | (58,378,989 | ) |
Net unrealized appreciation | | $ | 171,116,399 | |
| |
(a) | Non-income producing security. |
| |
(b) | Security, or a portion of security, is on loan. |
| |
(c) | Investments in companies considered to be an affiliate of the Portfolio during the period, for purposes of Section 2(a)(3) of the Investment Company Act of 1940, as amended, were as follows: |
| | | | | | | | | | | | | |
Affiliate | | Shares/
Beneficial
Interest Held at
September 30,
2011 | | Net
Activity | | Shares/
Beneficial
Interest Held at
March 31,
2012 | | Income | |
BlackRock Liquidity
Funds, TempFund,
Institutional Class | | | — | | | — | | | — | | $ | 42 | |
BlackRock Liquidity
Series, LLC Money
Market Series | | $ | 23,226,367 | | $ | 3,229,082 | | $ | 26,455,449 | | $ | 1,041,696 | |
| |
(d) | Represents the current yield as of report date. |
| |
(e) | Security was purchased with the cash collateral from loaned securities. |
| | | |
See Notes to Financial Statements. |
| | | |
| BLACKROCK LARGE CAP SERIES FUNDS, INC. | MARCH 31, 2012 | 27 |
| |
| |
Schedule of Investments (concluded) | Master Large Cap Value Portfolio |
| | |
• | For Portfolio compliance purposes, the Portfolio’s sector and industry classifications refer to any one or more of the sector and industry sub-classifications used by one or more widely recognized market indexes or rating group indexes, and/or as defined by Portfolio management. These definitions may not apply for purposes of this report, which may combine such sector and industry sub-classifications for reporting ease. |
| | |
• | Fair Value Measurements — Various inputs are used in determining the fair value of investments. These inputs are categorized into a disclosure hierarchy consisting of three broad levels for financial statement purposes as follows: |
| | |
| • | Level 1 — unadjusted price quotations in active markets/exchanges for identical assets and liabilities |
| | |
| • | Level 2 — other observable inputs (including, but not limited to: quoted prices for similar assets or liabilities in markets that are active, quoted prices for identical or similar assets or liabilities in markets that are not active, inputs other than quoted prices that are observable for the assets or liabilities (such as interest rates, yield curves, volatilities, prepayment speeds, loss severities, credit risks and default rates) or other market-corroborated inputs) |
| | |
| • | Level 3 — unobservable inputs based on the best information available in the circumstances, to the extent observable inputs are not available (including the Portfolio’s own assumptions used in determining the fair value of investments) |
| | |
| Changes in valuation techniques may result in transfers into or out of an assigned level within the disclosure hierarchy. The categorization of a value determined for investments is based on the pricing transparency of the investment and is not necessarily an indication of the risks associated with investing in those securities. For information about the Portfolio’s policy regarding valuation of investments and other significant accounting policies, please refer to Note 1 of the Notes to Financial Statements. |
| | |
| The following table summarizes the inputs used as of March 31, 2012 in determining the fair valuation of the Portfolio’s investments: |
| | | | | | | | | | | | | |
Valuation Inputs | | Level 1 | | Level 2 | | Level 3 | | Total | |
Assets: | | | | | | | | | | | | | |
Investments: | | | | | | | | | | | | | |
Long-Term
Investments1 | | $ | 1,376,800,600 | | | — | | | — | | $ | 1,376,800,600 | |
Short-Term
Securities | | | — | | $ | 26,455,449 | | | — | | | 26,455,449 | |
Total | | $ | 1,376,800,600 | | $ | 26,455,449 | | | — | | $ | 1,403,256,049 | |
| | |
| 1 | See above Schedule of Investments for values in each sector and industry. |
| | |
See Notes to Financial Statements. |
| | |
28 | BLACKROCK LARGE CAP SERIES FUNDS, INC. | MARCH 31, 2012 |
| |
| |
Statements of Assets and Liabilities | Master Large Cap Series LLC |
| | | | | | | | | | | |
March 31, 2012 (Unaudited) | | Master Large
Cap Core
Portfolio | | Master Large
Cap Growth
Portfolio | | Master Large
Cap Value
Portfolio | |
Assets | | | | | | | | | | |
Investments at value — unaffiliated1,2 | | $ | 2,536,255,100 | | $ | 1,136,059,990 | | $ | 1,376,800,600 | |
Investments at value — affiliated3 | | | 87,182,715 | | | 46,238,405 | | | 26,455,449 | |
Investments sold receivable | | | 11,860,184 | | | 4,495,229 | | | 20,969,651 | |
Dividends receivable — unaffiliated | | | 2,035,752 | | | 990,375 | | | 1,085,187 | |
Securities lending income receivable — affiliated | | | 304,519 | | | 145,691 | | | 15,704 | |
Contributions receivable from investors | | | — | | | 418,602 | | | — | |
Dividends receivable — affiliated | | | — | | | 91 | | | 3 | |
Prepaid expenses | | | 33,801 | | | 7,088 | | | 31,059 | |
Total assets | | | 2,637,672,071 | | | 1,188,355,471 | | | 1,425,357,653 | |
| | | | | | | | | | |
Liabilities | | | | | | | | | | |
Collateral on securities loaned, at value | | | 87,182,715 | | | 46,238,405 | | | 26,455,449 | |
Bank overdraft | | | 4,592,397 | | | 634,091 | | | 2,148,619 | |
Investments purchased payable | | | 7,419,604 | | | 5,456,989 | | | 18,906,833 | |
Investment advisory fees payable | | | 1,168,061 | | | 518,111 | | | 608,624 | |
Other affiliates payable | | | 17,880 | | | 5,238 | | | 8,041 | |
Directors’ fees payable | | | 32,921 | | | 14,618 | | | 19,490 | |
Withdrawals payable to investors | | | 4,392,663 | | | — | | | 5,330,464 | |
Other accrued expenses payable | | | 181,457 | | | 92,729 | | | 209,259 | |
Total liabilities | | | 104,987,698 | | | 52,960,181 | | | 53,686,779 | |
Net Assets | | $ | 2,532,684,373 | | $ | 1,135,395,290 | | $ | 1,371,670,874 | |
| | | | | | | | | | |
Net Assets Consist of | | | | | | | | | | |
Investors’ capital | | $ | 2,087,019,602 | | $ | 933,014,870 | | $ | 1,162,731,923 | |
Net unrealized appreciation/depreciation | | | 445,664,771 | | | 202,380,420 | | | 208,938,951 | |
Net Assets | | $ | 2,532,684,373 | | $ | 1,135,395,290 | | $ | 1,371,670,874 | |
1 | Investments at cost — unaffiliated | | $ | 2,090,590,329 | | $ | 933,679,570 | | $ | 1,167,861,649 | |
2 | Securities loaned at value | | $ | 84,592,325 | | $ | 45,300,628 | | $ | 25,317,438 | |
3 | Investments at cost — affiliated | | $ | 87,182,715 | | $ | 46,238,405 | | $ | 26,455,449 | |
| | | |
See Notes to Financial Statements. |
| | | |
| BLACKROCK LARGE CAP SERIES FUNDS, INC. | MARCH 31, 2012 | 29 |
| |
| |
Statements of Operations | Master Large Cap Series LLC |
| | | | | | | | | | |
Six Months Ended March 31, 2012 (Unaudited) | | Master Large
Cap Core
Portfolio | | Master Large
Cap Growth
Portfolio | | Master Large
Cap Value
Portfolio | |
Investment Income | | | | | | | | | | |
Dividends — unaffiliated | | $ | 28,857,623 | | $ | 11,185,488 | | $ | 15,876,802 | |
Foreign taxes withheld | | | (553,988 | ) | | (225,075 | ) | | (342,563 | ) |
Securities lending — affiliated | | | 768,236 | | | 358,564 | | | 1,041,696 | |
Dividends — affiliated | | | 790 | | | 1,375 | | | 42 | |
Total income | | | 29,072,661 | | | 11,320,352 | | | 16,575,977 | |
| | | | | | | | | | |
Expenses | | | | | | | | | | |
Investment advisory | | | 6,032,059 | | | 2,852,578 | | | 3,583,264 | |
Accounting services | | | 245,110 | | | 106,478 | | | 169,908 | |
Custodian | | | 92,980 | | | 35,699 | | | 59,398 | |
Professional | | | 56,088 | | | 32,155 | | | 43,068 | |
Directors | | | 38,234 | | | 13,618 | | | 24,151 | |
Printing | | | 6,916 | | | 9,824 | | | 6,374 | |
Miscellaneous | | | 29,434 | | | 15,706 | | | 27,165 | |
Total expenses | | | 6,500,821 | | | 3,066,058 | | | 3,913,328 | |
Less fees waived by advisor | | | (689 | ) | | (774 | ) | | — | |
Total expenses after fees waived | | | 6,500,132 | | | 3,065,284 | | | 3,913,328 | |
Net investment income | | | 22,572,529 | | | 8,255,068 | | | 12,662,649 | |
| | | | | | | | | | |
Realized and Unrealized Gain | | | | | | | | | | |
Net realized gain from investments | | | 84,596,612 | | | 32,434,495 | | | 27,468,377 | |
Net change in unrealized appreciation/depreciation on investments | | | 517,981,627 | | | 254,248,483 | | | 294,100,280 | |
Total realized and unrealized gain | | | 602,578,239 | | | 286,682,978 | | | 321,568,657 | |
Net Increase in Net Assets Resulting from Operations | | $ | 625,150,768 | | $ | 294,938,046 | | $ | 334,231,306 | |
| | |
See Notes to Financial Statements. |
| | |
30 | BLACKROCK LARGE CAP SERIES FUNDS, INC. | MARCH 31, 2012 |
| |
| |
Statements of Changes in Net Assets | Master Large Cap Series LLC |
| | | | | | | | | | | | | | |
| | Master Large Cap Core Portfolio | | | Master Large Cap Growth Portfolio | |
Increase (Decrease) in Net Assets: | | Six Months
Ended
March 31,
2012
(Unaudited) | | Year Ended
September 30,
2011 | | | Six Months
Ended
March 31,
2012
(Unaudited) | | Year Ended
September 30,
2011 | |
Operations | | | | | | | | | | | | | | |
Net investment income | | $ | 22,572,529 | | $ | 36,709,241 | | | $ | 8,255,068 | | $ | 9,136,074 | |
Net realized gain | | | 84,596,612 | | | 416,733,032 | | | | 32,434,495 | | | 98,414,186 | |
Net change in unrealized appreciation/depreciation | | | 517,981,627 | | | (385,934,163 | ) | | | 254,248,483 | | | (104,232,883 | ) |
Net increase in net assets resulting from operations | | | 625,150,768 | | | 67,508,110 | | | | 294,938,046 | | | 3,317,377 | |
| | | | | | | | | | | | | | |
Capital Transactions | | | | | | | | | | | | | | |
Proceeds from contributions | | | 232,807,352 | | | 406,268,108 | | | | 182,728,459 | | | 735,119,380 | |
Value of withdrawals | | | (631,987,324 | ) | | (1,376,548,462 | ) | | | (337,550,428 | ) | | (414,991,509 | ) |
Net increase (decrease) in net assets derived from capital transactions | | | (399,179,972 | ) | | (970,280,354 | ) | | | (154,821,969 | ) | | 320,127,871 | |
| | | | | | | | | | | | | | |
Net Assets | | | | | | | | | | | | | | |
Total increase (decrease) in net assets | | | 225,970,796 | | | (902,772,244 | ) | | | 140,116,077 | | | 323,445,248 | |
Beginning of period | | | 2,306,713,577 | | | 3,209,485,821 | | | | 995,279,213 | | | 671,833,965 | |
End of period | | $ | 2,532,684,373 | | $ | 2,306,713,577 | | | $ | 1,135,395,290 | | $ | 995,279,213 | |
| | | |
See Notes to Financial Statements. |
| | | |
| BLACKROCK LARGE CAP SERIES FUNDS, INC. | MARCH 31, 2012 | 31 |
| |
| |
Statements of Changes in Net Assets (concluded) | Master Large Cap Series LLC |
| | | | | | | |
| | Master Large Cap Value Portfolio | |
Increase (Decrease) in Net Assets: | | Six Months
Ended
March 31,
2012
(Unaudited) | | Year Ended
September 30,
2011 | |
Operations | | | | | | | |
Net investment income | | $ | 12,662,649 | | $ | 25,257,741 | |
Net realized gain | | | 27,468,377 | | | 213,756,849 | |
Net change in unrealized appreciation/depreciation | | | 294,100,280 | | | (191,911,553 | ) |
Net increase in net assets resulting from operations | | | 334,231,306 | | | 47,103,037 | |
| | | | | | | |
Capital Transactions | | | | | | | |
Proceeds from contributions | | | 117,433,520 | | | 499,193,583 | |
Value of withdrawals | | | (411,095,778 | ) | | (1,388,336,955 | ) |
Net decrease in net assets derived from capital transactions | | | (293,662,258 | ) | | (889,143,372 | ) |
| | | | | | | |
Net Assets | | | | | | | |
Total increase (decrease) in net assets | | | 40,569,048 | | | (842,040,335 | ) |
Beginning of period | | | 1,331,101,826 | | | 2,173,142,161 | |
End of period | | $ | 1,371,670,874 | | $ | 1,331,101,826 | |
| | |
See Notes to Financial Statements. |
| | |
32 | BLACKROCK LARGE CAP SERIES FUNDS, INC. | MARCH 31, 2012 |
| |
| |
Financial Highlights | Master Large Cap Series LLC |
| | | | | | | | | | | | | | | | | | | | | | |
| | Master Large Cap Core Portfolio | |
| | Six Months
Ended
March 31,
2012
(Unaudited) | | | | Period
November 1,
2008 to
September 30,
2009 | | | |
| | | Year Ended
September 30, | | | Year Ended October 31, | |
| | | 2011 | | 2010 | | | 2008 | | 2007 | | 2006 | |
Total Investment Return | | | | | | | | | | | | | | | | | | | | | | |
Total investment return | | | 27.98 | %1 | | (1.61 | )% | | 6.16 | % | | 12.63 | %1,2 | | (38.84 | )% | | 13.94 | % | | 17.32 | % |
| | | | | | | | | | | | | | | | | | | | | | |
Ratios to Average Net Assets | | | | | | | | | | | | | | | | | | | | | | |
Total expenses | | | 0.51 | %3 | | 0.49 | % | | 0.49 | % | | 0.50 | %3 | | 0.50 | % | | 0.49 | % | | 0.49 | % |
Total expenses after fees waived | | | 0.51 | %3 | | 0.49 | % | | 0.49 | % | | 0.50 | %3 | | 0.50 | % | | 0.49 | % | | 0.49 | % |
Net investment income | | | 1.76 | %3 | | 1.13 | % | | 1.11 | % | | 1.56 | %3 | | 0.93 | % | | 0.63 | % | | 0.58 | % |
| | | | | | | | | | | | | | | | | | | | | | |
Supplemental Data | | | | | | | | | | | | | | | | | | | | | | |
Net assets, end of period (000) | | $ | 2,532,684 | | $ | 2,306,714 | | $ | 3,209,486 | | $ | 3,946,322 | | $ | 2,843,515 | | $ | 5,649,731 | | $ | 3,876,639 | |
Portfolio turnover | | | 59 | % | | 129 | % | | 173 | % | | 168 | % | | 109 | % | | 96 | % | | 88 | % |
| | |
| 1 | Aggregate total investment return. |
| | |
| 2 | Includes proceeds received from a settlement of litigation, which impacted the Portfolio’s total investment return. Not including these proceeds, the Portfolio’s total investment return would have been 12.39%. |
| | |
| 3 | Annualized. |
| | | |
See Notes to Financial Statements. |
| | | |
| BLACKROCK LARGE CAP SERIES FUNDS, INC. | MARCH 31, 2012 | 33 |
| |
| |
Financial Highlights (continued) | Master Large Cap Series LLC |
| | | | | | | | | | | | | | | | | | | | | | |
| | Master Large Cap Growth Portfolio | |
| | Six Months
Ended
March 31,
2012
(Unaudited) | | | | | | Period
November 1,
2008 to
September 30,
2009 | | | | | | | |
| | | Year Ended
September 30, | | | | | | | | |
| | | | | Year Ended October 31, | |
| | | 2011 | | 2010 | | | 2008 | | 2007 | | 2006 | |
Total Investment Return | | | | | | | | | | | | | | | | | | | | | | |
Total investment return | | | 29.93 | %1 | | 0.72 | % | | 7.68 | % | | 20.49 | %1,2 | | (37.96 | )% | | 17.47 | % | | 14.05 | % |
| | | | | | | | | | | | | | | | | | | | | | |
Ratios to Average Net Assets | | | | | | | | | | | | | | | | | | | | | | |
Total expenses | | | 0.54 | %3 | | 0.54 | % | | 0.56 | % | | 0.57 | %3 | | 0.56 | % | | 0.56 | % | | 0.56 | % |
Total expenses after fees waived | | | 0.54 | %3 | | 0.54 | % | | 0.56 | % | | 0.57 | %3 | | 0.56 | % | | 0.56 | % | | 0.56 | % |
Net investment income | | | 1.45 | %3 | | 0.93 | % | | 0.73 | % | | 0.81 | %3 | | 0.54 | % | | 0.25 | % | | 0.26 | % |
| | | | | | | | | | | | | | | | | | | | | | |
Supplemental Data | | | | | | | | | | | | | | | | | | | | | | |
Net assets, end of period (000) | | $ | 1,135,395 | | $ | 995,279 | | $ | 671,834 | | $ | 733,888 | | $ | 665,963 | | $ | 1,233,995 | | $ | 785,377 | |
Portfolio turnover | | | 69 | % | | 169 | % | | 232 | % | | 242 | % | | 144 | % | | 87 | % | | 117 | % |
| | |
| 1 | Aggregate total investment return. |
|
| 2 | Includes proceeds received from a settlement of litigation, which impacted the Portfolio’s total investment return. Not including these proceeds, the Portfolio’s total investment return would have been 20.23%. |
|
| 3 | Annualized. |
| | |
See Notes to Financial Statements. |
| | |
34 | BLACKROCK LARGE CAP SERIES FUNDS, INC. | MARCH 31, 2012 |
| |
| |
Financial Highlights (concluded) | Master Large Cap Series LLC |
| | | | | | | | | | | | | | | | | | | | | | |
| | Master Large Cap Value Portfolio | |
| | Six Months
Ended
March 31,
2012
(Unaudited) | | | | | | Period
November 1,
2008 to
September 30,
2009 | | | | | | | |
| | | Year Ended
September 30, | | | | | | | | |
| | | | | Year Ended October 31, | |
| | | 2011 | | 2010 | | | 2008 | | 2007 | | 2006 | |
Total Investment Return | | | | | | | | | | | | | | | | | | | | | | |
Total investment return | | | 26.52 | %1 | | (4.34 | )% | | 4.36 | % | | 9.03 | %1,2 | | (36.54 | )% | | 12.72 | % | | 18.48 | % |
| | | | | | | | | | | | | | | | | | | | | | |
Ratios to Average Net Assets | | | | | | | | | | | | | | | | | | | | | | |
Total expenses | | | 0.55 | %3 | | 0.54 | % | | 0.53 | % | | 0.54 | %3 | | 0.51 | % | | 0.51 | % | | 0.53 | % |
Total expenses after fees waived | | | 0.55 | %3 | | 0.54 | % | | 0.53 | % | | 0.54 | %3 | | 0.51 | % | | 0.51 | % | | 0.53 | % |
Net investment income | | | 1.77 | %3 | | 1.28 | % | | 1.35 | % | | 1.88 | %3 | | 1.22 | % | | 0.95 | % | | 0.73 | % |
| | | | | | | | | | | | | | | | | | | | | | |
Supplemental Data | | | | | | | | | | | | | | | | | | | | | | |
Net assets, end of period (000) | | $ | 1,371,671 | | $ | 1,331,102 | | $ | 2,173,142 | | $ | 2,645,858 | | $ | 3,063,116 | | $ | 5,392,155 | | $ | 3,927,926 | |
Portfolio turnover | | | 79 | % | | 156 | % | | 183 | % | | 151 | % | | 108 | % | | 72 | % | | 71 | % |
| | |
| 1 | Aggregate total investment return. |
|
| 2 | Includes proceeds received from a settlement of litigation, which impacted the Portfolio’s total investment return. Not including these proceeds, the Portfolio’s total investment return would have been 8.61%. |
|
| 3 | Annualized. |
| | | |
See Notes to Financial Statements. |
| | | |
| BLACKROCK LARGE CAP SERIES FUNDS, INC. | MARCH 31, 2012 | 35 |
| |
| |
Notes to Financial Statements (Unaudited) | Master Large Cap Series LLC |
1. Organization and Significant Accounting Policies:
Master Large Cap Core Portfolio, Master Large Cap Growth Portfolio and Master Large Cap Value Portfolio (collectively the “Portfolios” or individually a “Portfolio”) are each Series of Master Large Cap Series LLC (the “Master LLC”). The Master LLC is registered under the Investment Company Act of 1940, as amended (the “1940 Act”), as an open-end management investment company and is organized as a Delaware limited liability company. Each Portfolio is classified as diversified. The Limited Liability Company Agreement permits the Board of Directors of the Master LLC (the “Board”) to issue nontransferable interests in the Master LLC, subject to certain limitations. The Portfolio’s financial statements are prepared in conformity with accounting principles generally accepted in the United States of America (“US GAAP”), which may require management to make estimates and assumptions that affect the reported amounts and disclosures in the financial statements. Actual results could differ from those estimates.
The following is a summary of significant accounting policies followed by the Portfolios:
Valuation: US GAAP defines fair value as the price the Portfolios would receive to sell an asset or pay to transfer a liability in an orderly transaction between market participants at the measurement date. The Portfolios fair value their financial instruments at market value using independent dealers or pricing services under policies approved by the Board. Equity investments traded on a recognized securities exchange or the NASDAQ Global Market System (“NASDAQ”) are valued at the last reported sale price that day or the NASDAQ official closing price, if applicable. For equity investments traded on more than one exchange, the last reported sale price on the exchange where the stock is primarily traded is used. Equity investments traded on a recognized exchange for which there were no sales on that day are valued at the last available bid (long positions) or ask (short positions) price. If no bid or ask price is available, the prior day’s price will be used, unless it is determined that such prior day’s price no longer reflects the fair value of the security. Investments in open-end registered investment companies are valued at NAV each business day. Short-term securities with remaining maturities of 60 days or less may be valued at amortized cost, which approximates fair value.
The Portfolios value their investments in BlackRock Liquidity Series, LLC Money Market Series (the “Money Market Series”) at fair value, which is ordinarily based upon their pro rata ownership in the underlying fund’s net assets. The Money Market Series seeks current income consistent with maintaining liquidity and preserving capital. Although the Money Market Series is not registered under the 1940 Act, its investments will follow the parameters of investments by a money market fund that is subject to Rule 2a-7 under the 1940 Act. The Portfolios may withdraw up to 25% of their investment daily, although the manager of the Money Market Series, in its sole discretion, may permit an investor to withdraw more than 25% on any one day.
In the event that application of these methods of valuation results in a price for an investment which is deemed not to be representative of the market value of such investment or if a price is not available, the investment will be valued in accordance with a policy approved by the Board as reflecting fair value (“Fair Value Assets”). When determining the price for Fair Value Assets, the investment advisor and/or the sub-advisor seeks to determine the price that each Portfolio might reasonably expect to receive from the current sale of that asset in an arm’s-length transaction. Fair value determinations shall be based upon all available factors that the investment advisor and/or sub-advisor deems relevant. The pricing of all Fair Value Assets is subsequently reported to the Board or a committee thereof.
Investment Transactions and Investment Income: For financial reporting purposes, investment transactions are recorded on the dates the transactions are entered into (the trade dates). Realized gains and losses on investment transactions are determined on the identified cost basis. Dividend income is recorded on the ex-dividend dates. Dividends from foreign securities where the ex-dividend date may have passed are subsequently recorded when the Portfolios are informed of the ex-dividend date. Under the applicable foreign tax laws, a withholding tax at various rates may be imposed on capital gains, dividends and interest. Upon notification from issuers, some of the dividend income received from a real estate investment trust may be redesignated as a reduction of cost of the related investment and/or realized gain. Interest income, including amortization and accretion of premiums and discounts on debt securities, is recognized on the accrual basis.
Securities Lending: The Portfolios may lend securities to approved borrowers, such as banks, brokers and other financial institutions. The borrower pledges cash, securities issued or guaranteed by the US government or irrevocable letters of credit issued by a bank as collateral, which will be maintained at all times in an amount equal to at least 100% of the current market value of the loaned securities. The market value of the loaned securities is determined at the close of business of the Portfolios and any additional required collateral is delivered to the Portfolios on the next business day. Securities lending income, as disclosed in the Statements of Operations, represents the income earned from the investment of the cash collateral, net of rebates paid to, or fees paid by, borrowers and less the fees paid to the securities lending agent. During the term of the loan, the Portfolios earn dividend or interest income on the securities loaned but does not receive interest income on the securities received as collateral. Loans of securities are terminable at any time and the borrower, after notice, is required to return borrowed securities within the standard time period for settlement of securities transactions. In the event that the borrower defaults on its obligation to return borrowed securities because of insolvency or for any other reason, the Portfolios could experience delays and costs in gaining access to the collateral. The Portfolios also could suffer a loss if the value of an investment purchased with cash collateral falls below the market value of loaned securities or if the value of an investment purchased with cash collateral falls below the value of the original cash collateral received. During the six months ended March 31, 2012, any securities on loan were collateralized by cash.
Income Taxes: Each Portfolio of the Master LLC is classified as a partnership for federal income tax purposes. As such, each investor in each Portfolio is treated as the owner of its proportionate share of net assets, income, expenses and realized and unrealized gains and losses of each Portfolio. Therefore, no federal income tax provision is required. It is intended that each Portfolio’s assets will be managed so an investor in each Portfolio can satisfy the requirements of Subchapter M of the Internal Revenue Code of 1986, as amended.
The Portfolios file US federal and various state and local tax returns. The statute of limitations on the Portfolios’ US federal tax returns remains open
| | |
| | |
36 | BLACKROCK LARGE CAP SERIES FUNDS, INC. | MARCH 31, 2012 |
| |
| |
Notes to Financial Statements (continued) | Master Large Cap Series LLC |
for each of the two years ended September 30, 2011, the period ended September 30, 2009 and the year ended October 31, 2008. In May, 2011, the Internal Revenue Service commenced an examination of Master Large Cap Growth’s US federal tax return for the year ended September 30, 2009. The examination was completed in February 2012 and did not result in any adjustments to the tax return. The statutes of limitations on the Portfolios’ state and local tax returns may remain open for an additional year depending upon the jurisdiction. Management does not believe there are any uncertain tax positions that require recognition of a tax liability.
Recent Accounting Standards: In May 2011, the Financial Accounting Standards Board (the “FASB”) issued amended guidance to improve disclosure about fair value measurements which will require the following disclosures for fair value measurements categorized as Level 3: quantitative information about unobservable inputs and assumptions used in the fair value measurement, a description of the valuation policies and procedures and a narrative description of the sensitivity of the fair value measurement to changes in unobservable inputs and the interrelationships between those unobservable inputs. In addition, the amounts and reasons for all transfers in and out of Level 1 and Level 2 will be required to be disclosed as well as disclosure of the level in the fair value hierarchy of assets and liabilities not recorded at fair value but where fair value is disclosed. The amended guidance is effective for financial statements for fiscal years beginning after December 15, 2011, and interim periods within those fiscal years. Management is evaluating the impact of this guidance on the Portfolios’ financial statement disclosures.
In December 2011, the FASB issued guidance that will expand current disclosure requirements on the offsetting of certain assets and liabilities. The new disclosures will be required for investments and derivative financial instruments subject to master netting or similar agreements which are eligible for offset in the Statements of Assets and Liabilities and will require an entity to disclose both gross and net information about such investments and transactions in the financial statements. The guidance is effective for financial statements with fiscal years beginning on or after January 1, 2013, and interim periods within those fiscal years. Management is evaluating the impact of this guidance on the Portfolios’ financial statement disclosures.
Other: Expenses directly related to one of the Portfolios is charged to that Portfolio. Other operating expenses shared by several funds are pro rated among those funds on the basis of relative net assets or other appropriate methods.
Each Portfolio has an arrangement with the custodian whereby fees may be reduced by credits earned on uninvested cash balances, which, if applicable, are shown as fees paid indirectly in the Statements of Operations. The custodian imposes fees on overdrawn cash balances, which can be offset by accumulated credits earned or may result in additional custody charges.
2. Investment Advisory Agreement and Other Transactions with Affiliates:
The PNC Financial Services Group, Inc. (“PNC”) and Barclays Bank PLC (“Barclays”) are the largest stockholders of BlackRock, Inc. (“BlackRock”). Due to the ownership structure, PNC is an affiliate for 1940 Act purposes, but Barclays is not.
The Master LLC, on behalf of each Portfolio, entered into an Investment Advisory Agreement with BlackRock Advisors, LLC (the “Manager”), the Portfolios’ investment advisor, an indirect, wholly owned subsidiary of BlackRock, to provide investment advisory and administration services. The Manager is responsible for the management of each Portfolio and provides the necessary personnel, facilities, equipment and certain other services necessary to the operations of each Portfolio. For such services, each Portfolio pays the Manager a monthly fee based on a percentage of each Portfolio’s average daily net assets at the following annual rates:
Master Large Cap Core Portfolio
| | | | |
Average Daily Net Assets | | Rate | |
Not exceeding $1 billion | | | 0.50 | % |
In excess of $1 billion, but not exceeding $5 billion | | | 0.45 | % |
In excess of $5 billion | | | 0.40 | % |
Master Large Cap Growth Portfolio
| | | | |
Average Daily Net Assets | | Rate | |
Not exceeding $5 billion | | | 0.50 | % |
In excess of $5 billion | | | 0.45 | % |
Master Large Cap Value Portfolio
| | | | |
Average Daily Net Assets | | Rate | |
Not exceeding $3 billion | | | 0.50 | % |
In excess of $3 billion | | | 0.45 | % |
The Manager voluntarily agreed to waive its investment advisory fees by the amount of investment advisory fees each Portfolio pays to the Manager indirectly through its investment in affiliated money market funds. However, the Manager does not waive its investment advisory fees by the amount of investment advisory fees paid in connection with each Portfolio’s investment in other affiliated investment companies, if any. These amounts are shown as, or included in, fees waived by advisor in the Statements of Operations.
The Manager entered into a sub-advisory agreement with BlackRock Investment Management LLC (“BIM”), an affiliate of the Manager. The Manager pays BIM, for services it provides, a monthly fee that is a percentage of the investment advisory fees paid by each Portfolio to the Manager.
For the six months ended March 31, 2012, the Portfolios reimbursed the Manager for certain accounting services, which is included in accounting services in the Statements of Operations. The reimbursements were as follows:
| | | | |
Master Large Cap Core Portfolio | | $ | 19,917 | |
Master Large Cap Growth Portfolio | | $ | 5,022 | |
Master Large Cap Value Portfolio | | $ | 8,673 | |
The Portfolios received an exemptive order from the SEC permitting them, among other things, to pay an affiliated securities lending agent a fee based on a share of the income derived from the securities lending activities and has retained BIM as the securities lending agent. BIM may, on behalf of the Portfolios, invest cash collateral received by the Portfolios for such loans, among other things, in a private investment company managed by the
| | | |
| | | |
| BLACKROCK LARGE CAP SERIES FUNDS, INC. | MARCH 31, 2012 | 37 |
| |
| |
Notes to Financial Statements (concluded) | Master Large Cap Series LLC |
Manager or in registered money market funds advised by the Manager or its affiliates. As securities lending agent, BIM is responsible for all transaction fees and all other operational costs relating to securities lending activities, other than extraordinary expenses. BIM does not receive any fees for managing the cash collateral. The market value of securities on loan and the value of the related collateral, if applicable, are shown in the Statements of Assets and Liabilities as securities loaned at value and collateral on securities loaned at value, respectively. The cash collateral invested by BIM is disclosed in the Schedules of Investments, if any. Securities lending income is equal to the total of income earned from the reinvestment of cash collateral, net of rebates paid to, or fees paid by, borrowers of securities. The Portfolios retain 65% of securities lending income and pays a fee to BIM equal to 35% of such income. The share of income earned by the Portfolios on the reinvestment of cash collateral is shown as securities lending — affiliated in the Statements of Operations. For the six months ended March 31, 2012, BIM received the following in securities lending agent fees related to securities lending activities for the Portfolios:
| | | | |
Master Large Cap Core Portfolio | | $ | 413,516 | |
Master Large Cap Growth Portfolio | | $ | 192,988 | |
Master Large Cap Value Portfolio | | $ | 558,183 | |
Certain officers and/or directors of the Master LLC are officers and/or directors of BlackRock or its affiliates.
3. Investments:
Purchases and sales of investments, excluding short-term securities for the six months ended March 31, 2012, were as follows:
| | | | | | | |
| | Purchases | | Sales | |
Master Large Cap Core Portfolio | | $ | 1,488,911,894 | | $ | 1,865,811,756 | |
Master Large Cap Growth Portfolio | | $ | 776,697,355 | | $ | 921,615,071 | |
Master Large Cap Value Portfolio | | $ | 1,118,280,646 | | $ | 1,395,697,843 | |
4. Borrowings:
The Master LLC, on behalf of the Portfolios, along with certain other funds managed by the Manager and its affiliates, is a party to a $500 million credit agreement with a group of lenders. Each Portfolio may borrow under the credit agreement to fund shareholder redemptions. Effective November 2010 to November 2011, the credit agreement had the following terms: a commitment fee of 0.08% per annum based on each Portfolio’s pro rata share of the unused portion of the credit agreement and interest at a rate equal to the higher of (a) the one-month LIBOR plus 1.00% per annum or (b) the Fed Funds rate plus 1.00% per annum on amounts borrowed. In addition, each Portfolio paid administration and arrangement fees which were allocated to each Portfolio based on its net assets as of October 31, 2010. The credit agreement which expired in November 2011, was renewed until November 2012. Effective November 2011 to November 2012, the credit agreement has the following terms: a commitment fee of 0.065% per annum based on each Portfolio’s pro rata share of the unused portion of the credit agreement and interest at a rate equal to the higher of (a) the one-month LIBOR plus 0.80% per annum or (b) the Fed Funds rate plus 0.80% per annum on amounts borrowed. In addition, each Portfolio paid administration and arrangement fees which were allocated to the Portfolios based on their net assets as of October 31, 2011. The Portfolios did not borrow under the credit agreement during the six months ended March 31, 2012.
5. Concentration, Market and Credit Risk:
In the normal course of business, the Portfolios invest in securities and enter into transactions where risks exist due to fluctuations in the market (market risk) or failure of the issuer of a security to meet all its obligations (issuer credit risk). The value of securities held by the Portfolios may decline in response to certain events, including those directly involving the issuers whose securities are owned by the Portfolios; conditions affecting the general economy; overall market changes; local, regional or global political, social or economic instability; and currency and interest rate and price fluctuations. Similar to issuer credit risk, the Portfolios may be exposed to counterparty credit risk, or the risk that an entity with which the Portfolios have unsettled or open transactions may fail to or be unable to perform on its commitments. The Portfolios manage counterparty credit risk by entering into transactions only with counterparties that they believe have the financial resources to honor their obligations and by monitoring the financial stability of those coun-terparties. Financial assets, which potentially expose the Portfolios to market, issuer and counterparty credit risks, consist principally of financial instruments and receivables due from counterparties. The extent of the Portfolios’ exposure to market, issuer and counterparty credit risks with respect to these financial assets is generally approximated by their value recorded in the Portfolios’ Statements of Assets and Liabilities, less any collateral held by the Portfolios.
As of March 31, 2012, Master Large Cap Core Portfolio and Master Large Cap Growth Portfolio invested a significant portion of their assets in securities in the information technology sector. Changes in economic conditions affecting the information technology sector would have a greater impact on the Portfolios and could affect the value, income and/or liquidity of positions in such securities.
6. Subsequent Events:
Management has evaluated the impact of all subsequent events on each Portfolio through the date the financial statements were issued and has determined that there were no subsequent events requiring adjustment or additional disclosure in the financial statements.
| | |
| | |
38 | BLACKROCK LARGE CAP SERIES FUNDS, INC. | MARCH 31, 2012 |
|
Ronald W. Forbes, Co-Chairman of the Board and Director |
Rodney D. Johnson, Co-Chairman of the Board and Director |
Paul L. Audet, Director |
David O. Beim, Director |
Henry Gabbay, Director |
Dr. Matina S. Horner, Director |
Herbert I. London, Director |
Cynthia A. Montgomery, Director |
Joseph P. Platt, Director |
Robert C. Robb, Jr., Director |
Toby Rosenblatt, Director |
Kenneth L. Urish, Director |
Frederick W. Winter, Director |
John M. Perlowski, President and Chief Executive Officer |
Brendan Kyne, Vice President |
Neal Andrews, Chief Financial Officer |
Jay Fife, Treasurer |
Brian Kindelan, Chief Compliance Officer and |
Anti-Money Laundering Officer |
Ira P. Shapiro, Secretary |
|
Investment Advisor |
BlackRock Advisors, LLC |
Wilmington, DE 19809 |
|
Sub-Advisor |
BlackRock Investment Management, LLC |
Princeton, NJ 08540 |
|
Custodian |
Brown Brothers Harriman & Co. |
Boston, MA 02109 |
|
Transfer Agent |
BNY Mellon Investment Servicing (US) Inc. |
Wilmington, DE 19809 |
|
Accounting Agent |
State Street Bank and Trust Company |
Boston, MA 02110 |
|
Distributor |
BlackRock Investments, LLC |
New York, NY 10022 |
|
Independent Registered Public Accounting Firm |
Deloitte & Touche LLP |
Boston, MA 02116 |
|
Legal Counsel |
Sidley Austin LLP |
New York, NY 10019 |
|
Address of the Fund |
100 Bellevue Parkway |
Wilmington, DE 19809 |
| | | |
| | | |
| BLACKROCK LARGE CAP SERIES FUNDS, INC. | MARCH 31, 2012 | 39 |
Electronic Delivery
Electronic copies of most financial reports and prospectuses are available on the Funds’ website or shareholders can sign up for e-mail notifications of quarterly statements, annual and semi-annual reports and prospectuses by enrolling in the Funds’ electronic delivery program.
To enroll:
Shareholders Who Hold Accounts with Investment Advisors, Banks or Brokerages:
Please contact your financial advisor. Please note that not all investment advisors, banks or brokerages may offer this service.
Shareholders Who Hold Accounts Directly with BlackRock:
1) Access the BlackRock website at http://www.blackrock.com/edelivery
2) Select “eDelivery” under the “More Information” section
3) Log into your account
Householding
The Funds will mail only one copy of shareholder documents, including prospectuses, annual and semi-annual reports and proxy statements, to shareholders with multiple accounts at the same address. This practice is commonly called “householding” and is intended to reduce expenses and eliminate duplicate mailings of shareholder documents. Mailings of your shareholder documents may be householded indefinitely unless you instruct us otherwise. If you do not want the mailing of these documents to be combined with those for other members of your household, please call the Funds at (800) 441-7762.
Availability of Quarterly Schedule of Investments
The Funds/Master LLC file their complete schedule of portfolio holdings with the SEC for the first and third quarters of each fiscal year on Form N-Q. The Funds’/Master LLC’s Forms N-Q are available on the SEC’s website at http://www.sec.gov and may also be reviewed and copied at the SEC’s Public Reference Room in Washington, D.C. Information on how to access documents on the SEC’s website without charge may be obtained by calling (800) SEC-0330. The Funds’/Master LLC’s Forms N-Q may also be obtained upon request and without charge by calling (800) 441-7762.
Availability of Proxy Voting Policies and Procedures
A description of the policies and procedures that each Fund/Master LLC uses to determine how to vote proxies relating to portfolio securities is available (1) without charge, upon request, by calling (800) 441-7762; (2) at http://www.blackrock.com; and (3) on the SEC’s website at http://www.sec.gov.
Availability of Proxy Voting Record
Information about how the Funds/Master LLC voted proxies relating to securities held in each Fund/Master LLC’s portfolios, during the most recent 12-month period ended June 30 is available upon request and without charge (1) at http://www.blackrock.com or by calling (800) 441-7762 and (2) on the SEC’s website at http://www.sec.gov.
| | |
| | |
40 | BLACKROCK LARGE CAP SERIES FUNDS, INC. | MARCH 31, 2012 |
|
|
Additional Information (concluded) |
|
Shareholder Privileges |
Account Information
Call us at (800) 441-7762 from 8:00 AM to 6:00 PM EST on any business day to get information about your account balances, recent transactions and share prices. You can also reach us on the Web at http://www.blackrock.com/funds.
Automatic Investment Plans
Investor Class shareholders who want to invest regularly can arrange to have $50 or more automatically deducted from their checking or savings account and invested in any of the BlackRock funds.
Systematic Withdrawal Plans
Investor Class shareholders can establish a systematic withdrawal plan and receive periodic payments of $50 or more from their BlackRock funds, as long as their account balance is at least $10,000.
Retirement Plans
Shareholders may make investments in conjunction with Traditional, Rollover, Roth, Coverdell, Simple IRAs, SEP IRAs and 403(b) Plans.
|
BlackRock Privacy Principles |
BlackRock is committed to maintaining the privacy of its current and former fund investors and individual clients (collectively, “Clients”) and to safeguarding their non-public personal information. The following information is provided to help you understand what personal information BlackRock collects, how we protect that information and why in certain cases we share such information with select parties.
If you are located in a jurisdiction where specific laws, rules or regulations require BlackRock to provide you with additional or different privacy-related rights beyond what is set forth below, then BlackRock will comply with those specific laws, rules or regulations.
BlackRock obtains or verifies personal non-public information from and about you from different sources, including the following: (i) information we receive from you or, if applicable, your financial intermediary, on applications, forms or other documents; (ii) information about your transactions with us, our affiliates, or others; (iii) information we receive from a consumer reporting agency; and (iv) from visits to our websites.
BlackRock does not sell or disclose to non-affiliated third parties any non-public personal information about its Clients, except as permitted by law or as is necessary to respond to regulatory requests or to service Client accounts. These non-affiliated third parties are required to protect the confidentiality and security of this information and to use it only for its intended purpose.
We may share information with our affiliates to service your account or to provide you with information about other BlackRock products or services that may be of interest to you. In addition, BlackRock restricts access to non-public personal information about its Clients to those BlackRock employees with a legitimate business need for the information. BlackRock maintains physical, electronic and procedural safeguards that are designed to protect the non-public personal information of its Clients, including procedures relating to the proper storage and disposal of such information.
| | | |
| | | |
| BLACKROCK LARGE CAP SERIES FUNDS, INC. | MARCH 31, 2012 | 41 |
|
|
A World-Class Mutual Fund Family |
BlackRock offers a diverse lineup of open-end mutual funds crossing all investment styles and managed by experts in equity, fixed income and tax-exempt investing.
|
Equity Funds |
|
BlackRock ACWI ex-US Index Fund |
BlackRock All-Cap Energy & Resources Portfolio |
BlackRock Balanced Capital Fund† |
BlackRock Basic Value Fund |
BlackRock Capital Appreciation Fund |
BlackRock China Fund |
BlackRock Commodity Strategies Fund |
BlackRock Emerging Markets Fund |
BlackRock Emerging Markets Long/Short Equity Fund |
BlackRock Energy & Resources Portfolio |
BlackRock Equity Dividend Fund |
BlackRock EuroFund |
BlackRock Focus Growth Fund |
BlackRock Global Allocation Fund† |
BlackRock Global Dividend Income Portfolio |
BlackRock Global Dynamic Equity Fund |
BlackRock Global Opportunities Portfolio |
BlackRock Global SmallCap Fund |
BlackRock Health Sciences Opportunities Portfolio |
BlackRock Index Equity Portfolio |
BlackRock India Fund |
BlackRock International Fund |
BlackRock International Index Fund |
BlackRock International Opportunities Portfolio |
BlackRock Large Cap Core Fund |
BlackRock Large Cap Core Plus Fund |
BlackRock Large Cap Growth Fund |
BlackRock Large Cap Value Fund |
BlackRock Latin America Fund |
BlackRock Managed Volatility Portfolio† |
BlackRock Mid-Cap Growth Equity Portfolio |
BlackRock Mid-Cap Value Equity Portfolio |
BlackRock Mid Cap Value Opportunities Fund |
BlackRock Natural Resources Trust |
BlackRock Pacific Fund |
BlackRock Russell 1000 Index Fund |
BlackRock Science & Technology Opportunities Portfolio |
BlackRock Small Cap Growth Equity Portfolio |
BlackRock Small Cap Growth Fund II |
BlackRock Small Cap Index Fund |
BlackRock S&P 500 Index Fund |
BlackRock S&P 500 Stock Fund |
BlackRock U.S. Opportunities Portfolio |
BlackRock Value Opportunities Fund |
BlackRock World Gold Fund |
|
Fixed Income Funds |
|
BlackRock Bond Index Fund |
BlackRock Core Bond Portfolio |
BlackRock CoreAlpha Bond Fund |
BlackRock Emerging Market Debt Portfolio |
BlackRock Floating Rate Income Portfolio |
BlackRock Global Long/Short Credit Fund |
BlackRock GNMA Portfolio |
BlackRock High Yield Bond Portfolio |
BlackRock Inflation Protected Bond Portfolio |
BlackRock International Bond Portfolio |
BlackRock Long Duration Bond Portfolio |
BlackRock Low Duration Bond Portfolio |
BlackRock Multi-Asset Income Portfolio† |
BlackRock Multi-Sector Bond Portfolio |
BlackRock Strategic Income Opportunities Portfolio |
BlackRock Total Return Fund |
BlackRock US Government Bond Portfolio |
BlackRock US Mortgage Portfolio |
BlackRock World Income Fund |
|
Municipal Bond Funds |
|
BlackRock California Municipal Bond Fund |
BlackRock High Yield Municipal Fund |
BlackRock Intermediate Municipal Fund |
BlackRock National Municipal Fund |
BlackRock New Jersey Municipal Bond Fund |
BlackRock New York Municipal Bond Fund |
BlackRock Pennsylvania Municipal Bond Fund |
BlackRock Short-Term Municipal Fund |
|
Target Risk & Target Date Funds† |
|
BlackRock Prepared Portfolios
Conservative Prepared Portfolio
Moderate Prepared Portfolio
Growth Prepared Portfolio
Aggressive Growth Prepared Portfolio |
|
BlackRock Lifecycle Prepared Portfolios |
2015 |
2020 |
2025 |
2030 |
2035 |
2040 |
2045 |
2050 |
|
LifePath Portfolios
Retirement |
2020 |
2025 |
2030 |
2035 |
2040 |
2045 |
2050 |
2055 |
|
LifePath Index Portfolios
Retirement |
2020 |
2025 |
2030 |
2035 |
2040 |
2045 |
2050 |
2055 |
BlackRock mutual funds are currently distributed by BlackRock Investments, LLC. You should consider the investment objectives, risks, charges and expenses of the funds under consideration carefully before investing. Each fund’s prospectus contains this and other information and is available at www.blackrock.com or by calling (800) 441-7762 or from your financial advisor. The prospectus should be read carefully before investing.
| | |
| | |
42 | BLACKROCK LARGE CAP SERIES FUNDS, INC. | MARCH 31, 2012 |
These reports are not authorized for use as an offer of sale or a solicitation of an offer to buy shares of the Funds unless accompanied or preceded by the Funds’ current prospectus. Past performance results shown in these reports should not be considered a representation of future performance. Investment returns and principal value of shares will fluctuate so that shares, when redeemed, may be worth more or less than their original cost. Statements and other information herein are as dated and are subject to change.
| |

|
#LCSRP-3/12-SAR | 
|
Item 2 – | Code of Ethics – Not Applicable to this semi-annual report |
| |
Item 3 – | Audit Committee Financial Expert – Not Applicable to this semi-annual report |
| |
Item 4 – | Principal Accountant Fees and Services – Not Applicable to this semi-annual report |
| |
Item 5 – | Audit Committee of Listed Registrants – Not Applicable |
| |
Item 6 – | Investments |
| (a) The registrants’ Schedules of Investments are included as part of the Report to Stockholders filed under Item 1 of this Form. |
| (b) Not Applicable due to no such divestments during the semi-annual period covered since the previous Form N-CSR filing. |
| |
Item 7 – | Disclosure of Proxy Voting Policies and Procedures for Closed-End Management Investment Companies – Not Applicable |
| |
Item 8 – | Portfolio Managers of Closed-End Management Investment Companies – Not Applicable |
| |
Item 9 – | Purchases of Equity Securities by Closed-End Management Investment Company and Affiliated Purchasers – Not Applicable |
| |
Item 10 – | Submission of Matters to a Vote of Security Holders –There have been no material changes to these procedures. |
| |
Item 11 – | Controls and Procedures |
| |
(a) – | The registrants’ principal executive and principal financial officers, or persons performing similar functions, have concluded that the registrants’ disclosure controls and procedures (as defined in Rule 30a-3(c) under the Investment Company Act of 1940, as amended (the “1940 Act”)) are effective as of a date within 90 days of the filing of this report based on the evaluation of these controls and procedures required by Rule 30a-3(b) under the 1940 Act and Rule 15d-15(b) under the Securities Exchange Act of 1934, as amended. |
| |
(b) – | There were no changes in the registrants’ internal control over financial reporting (as defined in Rule 30a-3(d) under the 1940 Act) that occurred during the second fiscal quarter of the period covered by this report that have materially affected, or are reasonably likely to materially affect, the registrants’ internal control over financial reporting. |
| |
Item 12 – | Exhibits attached hereto |
| |
(a)(1) – | Code of Ethics – Not Applicable to this semi-annual report |
| |
(a)(2) – | Certifications – Attached hereto |
| |
(a)(3) – | Not Applicable |
| |
(b) – | Certifications – Attached hereto |
| |
| Pursuant to the requirements of the Securities Exchange Act of 1934 and the Investment Company Act of 1940, each registrant has duly caused this report to be signed on its behalf by the undersigned, thereunto duly authorized. |
| |
| BlackRock Large Cap Series Funds, Inc. and Master Large Cap Series LLC |
| | |
| | By: | /s/ John M. Perlowski | |
| | | John M. Perlowski |
| | | Chief Executive Officer (principal executive officer) of |
| | | BlackRock Large Cap Series Funds, Inc. and Master Large Cap Series LLC |
| | |
| | Date: June 4, 2012 |
| | |
| | Pursuant to the requirements of the Securities Exchange Act of 1934 and the Investment Company Act of 1940, this report has been signed below by the following persons on behalf of each registrant and in the capacities and on the dates indicated. |
| | |
| | By: | /s/ John M. Perlowski | |
| | | John M. Perlowski |
| | | Chief Executive Officer (principal executive officer) of |
| | | BlackRock Large Cap Series Funds, Inc. and Master Large Cap Series LLC |
| | |
| | Date: June 4, 2012 |
| | |
| | By: | /s/ Neal J. Andrews | |
| | | Neal J. Andrews |
| | | Chief Financial Officer (principal financial officer) of |
| | | BlackRock Large Cap Series Funds, Inc. and Master Large Cap Series LLC |
| | | |
| | Date: June 4, 2012 |
| | | | |