UNITED STATES
SECURITIES AND EXCHANGE COMMISSION
Washington, D.C. 20549
FORM N-CSR
CERTIFIED SHAREHOLDER REPORT OF REGISTERED MANAGEMENT INVESTMENT COMPANIES
Investment Company Act file number: 811-09637 and 811-09739
Name of Fund: BlackRock Large Cap Series Funds, Inc.
BlackRock Large Cap Core Fund
BlackRock Event Driven Equity Fund (formerly BlackRock Large Cap Core Plus Fund)
BlackRock Large Cap Core Retirement Portfolio
BlackRock Large Cap Growth Fund
BlackRock Large Cap Growth Retirement Portfolio
BlackRock Large Cap Value Fund
BlackRock Large Cap Value Retirement Portfolio
Master Large Cap Series LLC
Master Large Cap Core Portfolio
Master Large Cap Growth Portfolio
Master Large Cap Value Portfolio
Fund Address: 100 Bellevue Parkway, Wilmington, DE 19809
Name and address of agent for service: John M. Perlowski, Chief Executive Officer, BlackRock Large Cap Series Funds, Inc. and Master Large Cap Series LLC, 55 East 52nd Street, New York, NY 10055
Registrants’ telephone number, including area code: (800) 441-7762
Date of fiscal year end: 09/30/2015
Date of reporting period: 03/31/2015
Item 1 – Report to Stockholders
MARCH 31, 2015
| | | | |
SEMI-ANNUAL REPORT (UNAUDITED) | | | | BLACKROCK® |
BlackRock Large Cap Series Funds, Inc.
▶ BlackRock Large Cap Core Fund
▶ BlackRock Large Cap Growth Fund
▶ BlackRock Large Cap Value Fund
▶ BlackRock Large Cap Core Retirement Portfolio
▶ BlackRock Large Cap Growth Retirement Portfolio
▶ BlackRock Large Cap Value Retirement Portfolio
| | |
| Not FDIC Insured ¡ May Lose Value ¡ No Bank Guarantee | | |
| | | | | | |
| | | | |
| | |  | | Shareholders can sign up for e-mail notifications of quarterly statements, annual and semi-annual shareholder reports and prospectuses by enrolling in the electronic delivery program. Electronic copies of shareholder reports and prospectuses are also available on BlackRock’s website. | | |
| | | TO ENROLL IN ELECTRONIC DELIVERY: Shareholders Who Hold Accounts with Investment Advisors, Banks or Brokerages: Please contact your financial advisor. Please note that not all investment advisors, banks or brokerages may offer this service. | | |
| | | Shareholders Who Hold Accounts Directly with BlackRock: 1. Access the BlackRock website at blackrock.com 2. Select “Access Your Account” 3. Next, select “eDelivery” in the “Related Resources” box and follow the sign-up instructions | | |
| | | | | | |
| 2 | | BLACKROCK LARGE CAP SERIES FUNDS, INC. | | MARCH 31, 2015 | | |
Dear Shareholder,
Market volatility has remained low from a long-term perspective, but increased over the course of 2014 amid higher valuations in risk assets (such as equities and high yield bonds), geopolitical risks, uneven global economic growth and uncertainty around policy moves from the world’s largest central banks. As the U.S. Federal Reserve (the “Fed”) gradually reduced its bond buying program (which ultimately ended in October 2014), U.S. interest rates surprisingly trended lower and stock prices forged ahead despite high valuations on the back of a multi-year bull market. Geopolitical tensions intensified in Ukraine and the Middle East and oil prices became highly volatile in the middle of the summer, stoking worries about economic growth outside the United States. As the U.S. economy continued to show steady improvement, the stronger data caused concern among investors that the Fed would raise short-term rates sooner than previously anticipated. The U.S. dollar appreciated and global credit markets tightened, ultimately putting a strain on investor flows, and financial markets broadly weakened in the third quarter.
U.S. economic growth picked up considerably in the fourth quarter while the broader global economy showed signs of slowing. U.S. markets significantly outperformed international markets even as the European Central Bank (“ECB”) and the Bank of Japan eased monetary policy, which drove further strengthening in the U.S. dollar. Oil prices plummeted in the fourth quarter due to a global supply-and-demand imbalance, sparking a selloff in energy-related assets and stress in emerging markets. Fixed income investors piled into U.S. Treasuries as their persistently low yields became relatively attractive as compared to international sovereign debt.
Equity markets reversed in the first quarter of 2015 and U.S. stocks underperformed international markets, notably Europe and Japan, but also emerging markets. Investors had held high expectations for the U.S. economy, but after a harsh winter, first-quarter data disappointed and high valuations took their toll on U.S. stocks. Meanwhile, economic reports in Europe and Asia easily beat investors’ very low expectations for those economies, and accommodative policies from global central banks helped international equities rebound. The ECB’s asset purchase program (announced in January and commenced in March) was the largest in scale and effect on the markets. Overall, market volatility decreased in the first quarter as global risks abated, with a ceasefire in Ukraine and an improving outlook for Greece’s continued membership in the Eurozone.
At BlackRock, we believe investors need to think globally, extend their scope across a broad array of asset classes and be prepared to move freely as market conditions change over time. We encourage you to talk with your financial advisor and visit blackrock.com for further insight about investing in today’s markets.
Sincerely,

Rob Kapito
President, BlackRock Advisors, LLC

Rob Kapito
President, BlackRock Advisors, LLC
| | | | | | | | |
| Total Returns as of March 31, 2015 | |
| | | 6-month | | | 12-month | |
U.S. large cap equities
(S&P 500® Index) | | | 5.93 | % | | | 12.73 | % |
U.S. small cap equities
(Russell 2000® Index) | | | 14.46 | | | | 8.21 | |
International equities
(MSCI Europe, Australasia,
Far East Index) | | | 1.13 | | | | (0.92 | ) |
Emerging market equities
(MSCI Emerging
Markets Index) | | | (2.37 | ) | | | 0.44 | |
3-month Treasury bill
(BofA Merrill Lynch
3-Month U.S. Treasury
Bill Index) | | | 0.01 | | | | 0.03 | |
U.S. Treasury securities
(BofA Merrill Lynch
10-Year U.S.
Treasury Index) | | | 6.25 | | | | 9.88 | |
U.S. investment grade
bonds (Barclays U.S.
Aggregate Bond Index) | | | 3.43 | | | | 5.72 | |
Tax-exempt municipal
bonds (S&P Municipal
Bond Index) | | | 2.29 | | | | 6.60 | |
U.S. high yield bonds
(Barclays U.S. Corporate
High Yield 2% Issuer Capped Index) | | | 1.50 | | | | 2.00 | |
|
| Past performance is no guarantee of future results. Index performance is shown for illustrative purposes only. You cannot invest directly in an index. | |
| | | | | | | | |
| | | THIS PAGE NOT PART OF YOUR FUND REPORT | | | | | 3 | |
| | | | |
| Fund Summary as of March 31, 2015 | | | BlackRock Large Cap Core Fund | |
BlackRock Large Cap Core Fund’s (the “Fund”) investment objective is to seek long-term capital growth. In other words, the Fund tries to choose investments that will increase in value.
|
| Portfolio Management Commentary |
How did the Fund perform?
| • | | For the six-month period ended March 31, 2015, the Fund, through its investment in Master Large Cap Core Portfolio (the “Portfolio”), underperformed its benchmark, the Russell 1000® Index. |
What factors influenced performance?
| • | | Information technology (“IT”) was the prime detractor from relative performance, largely owing to the Portfolio’s emphasis on enterprise hardware and compute-intensive semiconductor companies. Key names underperformed as the combination of slow economic growth in many emerging markets and a strong dollar dampened personal computer sales expectations. Micron Technology Inc. was the leading individual detractor within the Portfolio for the six-month period. An underweight in strong-performing Apple Inc. also dampened relative performance in the sector. |
| • | | Financials were a second source of underperformance. The Portfolio’s most interest-rate-sensitive bank holdings (particularly Bank of America) lagged amid a further decline in long-term Treasury rates. In addition, multi-line insurer Genworth Financial Inc. underperformed as the company announced reserve charges related to its long-term care business that caused its shares to sharply decline. The position was eliminated from the Portfolio by the end of the reporting period. Elsewhere in the sector, the Portfolio’s underweight in real estate investment trusts (“REITs”) detracted, as the industry benefited from declining interest rates. Exposure to Discover Financial Services was an additional drag on performance. |
| • | | The weakness in energy over the period impacted the Portfolio as well, notably through its weighting toward energy services companies whose stock prices tend to be correlated with the price of oil. The Portfolio’s position in Halliburton Co. was a particular laggard, as its shares were further weighed upon by the market’s negative reaction to its plan to purchase competitor Baker Hughes. |
| • | | Relative performance was supported by strong selection in the health care sector, especially the Portfolio’s tilt toward managed-care companies. Strong earnings from several bellwether stocks boosted sentiment across the group, with better-than-feared preliminary Medicare Advantage payment rates from the Centers for Medicare & Medicaid Services (CMS) providing an additional lift. Market speculation about further consolidation in the industry was a driver in the period as well. |
| • | | Additional contributions came from Lowe’s Companies Inc. and CVS Health Corp., the top individual contributors within the Portfolio over the six months. Lowe’s Companies Inc. outperformed given solid business execution, dominant (and growing) market share, and a favorable industry backdrop. Overall, home-improvement retailers delivered standout results relative to the broader retail universe, benefiting from the consumer spending shift towards durables. CVS Health Corp. outperformed on consistently strong earnings reports, market share gains (particularly in its pharmacy benefit management unit), and a robust business outlook. |
Describe recent portfolio activity.
| • | | Due to a combination of portfolio trading activity and market movement during the six-month period, the Portfolio’s weighting increased in the health care sector, specifically within the health care providers & services industry. The allocation to consumer staples increased as well, mainly within food & staples retailing. The Portfolio’s weighting in energy decreased, both in oil, gas & consumable fuels and energy equipment & services. Exposure to financials also declined, largely with respect to banks and insurance. |
Describe portfolio positioning at period end.
| • | | Relative to the Russell 1000® Index, the Portfolio ended the period with its largest sector overweight position in IT, followed by health care. Utilities, telecommunication services and consumer staples were the most significant underweights. |
The views expressed reflect the opinions of BlackRock as of the date of this report and are subject to change based on changes in market, economic or other conditions. These views are not intended to be a forecast of future events and are no guarantee of future results.
| | | | | | |
| 4 | | BLACKROCK LARGE CAP SERIES FUNDS, INC. | | MARCH 31, 2015 | | |
| | | | |
| | | | BlackRock Large Cap Core Fund | |
|
| Total Return Based on a $10,000 Investment |
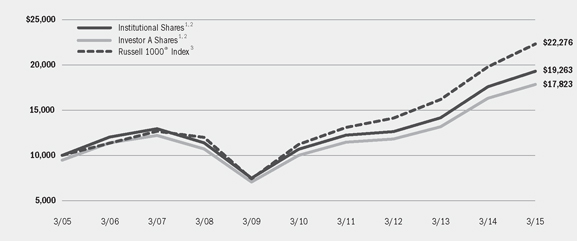
| | 1 | Assuming maximum sales charges, if any, transaction costs and other operating expenses, including administration fees, if any Institutional Shares do not have a sales charge. |
| | 2 | The Fund invests all of its assets in the Portfolio, a series of Master Large Cap Series LLC. The Portfolio invests at least 80% of its assets in equity securities, primarily common stock, of large cap companies located in the United States that the investment advisor selects from among those that are, at the time of purchase, included in the Russell 1000® Index. |
| | 3 | The index measures the performance of the large cap segment of the U.S. equity universe. It is a subset of the Russell 3000® Index and includes approximately 1,000 of the largest securities based on a combination of their market capitalization and current index membership. The index represents approximately 92% of the total market capitalization of the Russell 3000® Index. |
| | | | | | | | | | | | | | | | | | | | | | | | | | | | |
| Performance Summary for the Period Ended March 31, 2015 | |
| | | | | | Average Annual Total Returns4 | |
| | | | | | 1 Year | | | 5 Years | | | 10 Years | |
| | | 6-Month Total Returns | | | w/o sales charge | | | w/ sales charge | | | w/o sales charge | | | w/ sales charge | | | w/o sales charge | | | w/ sales charge | |
Institutional | | | 5.41 | % | | | 9.69 | % | | | N/A | | | | 12.56 | % | | | N/A | | | | 6.78 | % | | | N/A | |
Service | | | 5.25 | | | | 9.36 | | | | N/A | | | | 12.21 | | | | N/A | | | | 6.49 | | | | N/A | |
Investor A | | | 5.28 | | | | 9.41 | | | | 3.67 | % | | | 12.29 | | | | 11.09 | % | | | 6.52 | | | | 5.95 | % |
Investor B | | | 4.83 | | | | 8.51 | | | | 4.01 | | | | 11.36 | | | | 11.10 | | | | 5.83 | | | | 5.83 | |
Investor C | | | 4.91 | | | | 8.58 | | | | 7.58 | | | | 11.34 | | | | 11.34 | | | | 5.62 | | | | 5.62 | |
Class R | | | 5.16 | | | | 9.14 | | | | N/A | | | | 11.91 | | | | N/A | | | | 6.14 | | | | N/A | |
Russell 1000® Index | | | 6.55 | | | | 12.73 | | | | N/A | | | | 14.73 | | | | N/A | | | | 8.34 | | | | N/A | |
| | 4 | | Assuming maximum sales charges, if any. Average annual total returns with and without sales charges reflect reductions for distribution and service fees. See “About Fund Performance” on page 16 for a detailed description of share classes, including any related sales charges and fees. |
| | | | N/A—Not applicable as share class and index do not have a sales charge. |
| | | | Past performance is not indicative of future results. |
| | | | | | | | | | | | | | |
| Expense Example |
| | | Actual | | Hypothetical6 | | |
| | | Beginning Account Value October 1, 2014 | | Ending Account Value March 31, 2015 | | Expenses Paid During the Period5 | | Beginning Account Value October 1, 2014 | | Ending Account Value March 31, 2015 | | Expenses Paid During the Period5 | | Annualized Expense Ratio |
Institutional | | $1,000.00 | | $1,054.10 | | $4.46 | | $1,000.00 | | $1,020.59 | | $4.38 | | 0.87% |
Service | | $1,000.00 | | $1,052.50 | | $6.14 | | $1,000.00 | | $1,018.95 | | $6.04 | | 1.20% |
Investor A | | $1,000.00 | | $1,052.80 | | $5.83 | | $1,000.00 | | $1,019.25 | | $5.74 | | 1.14% |
Investor B | | $1,000.00 | | $1,048.30 | | $10.06 | | $1,000.00 | | $1,015.11 | | $9.90 | | 1.97% |
Investor C | | $1,000.00 | | $1,049.10 | | $10.01 | | $1,000.00 | | $1,015.16 | | $9.85 | | 1.96% |
Class R | | $1,000.00 | | $1,051.60 | | $7.42 | | $1,000.00 | | $1,017.70 | | $7.29 | | 1.45% |
| | 5 | | For each class of the Fund, expenses are equal to the annualized expense ratio for the class, multiplied by the average account value over the period, multiplied by 182/365 (to reflect the one-half year period shown). Because the Fund invests all of its assets in the Portfolio, the expense table reflects the net expenses of both the Fund and the Portfolio in which it invests. |
| | 6 | | Hypothetical 5% annual return before expenses is calculated by pro rating the number of days in the most recent fiscal half year divided by 365. |
| | | | See “Disclosure of Expenses” on page 16 for further information on how expenses were calculated. |
| | | | | | |
| | | BLACKROCK LARGE CAP SERIES FUNDS, INC. | | MARCH 31, 2015 | | 5 |
| | | | |
| Fund Summary as of March 31, 2015 | | | BlackRock Large Cap Growth Fund | |
BlackRock Large Cap Growth Fund’s (the “Fund”) investment objective is to seek long-term capital growth. In other words, the Fund tries to choose investments that will increase in value.
|
| Portfolio Management Commentary |
How did the Fund perform?
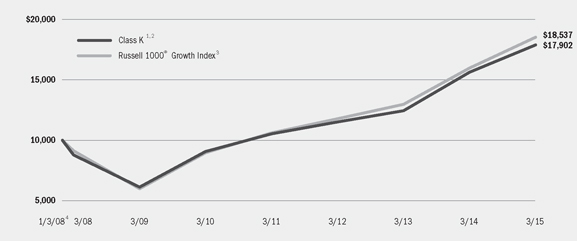
| • | | For the six-month period ended March 31, 2015, the Fund, through its investment in Master Large Cap Growth Portfolio (the “Portfolio”), underperformed its benchmark, the Russell 1000® Growth Index. |
What factors influenced performance?
| • | | Information technology (IT) was the prime detractor from relative performance, largely owing to the Portfolio’s emphasis on enterprise hardware and compute-intensive semiconductor companies. Key names underperformed as the combination of slow economic growth in many emerging markets and a strong dollar dampened personal computer sales expectations. Micron Technology Inc. was the leading individual detractor within the Portfolio for the six-month period. The Portfolio’s overweight in both Microsoft Corp. and EMC Corp. also dampened relative performance in the sector, as did an underweight in strong-performing Apple Inc. |
| • | | The weakness in energy over the period impacted the Portfolio as well, notably through its weighting toward energy services companies whose stock prices tend to be correlated with the price of oil. Shares of holding Halliburton Co. were further weighed upon by the market’s negative reaction to its plan to purchase competitor Baker Hughes. |
| • | | Financials was an additional source of underperformance, due largely to the Portfolio’s position in consumer finance name Discover Financial Services. The company’s shares declined in the second half of the reporting period as a result of an earnings miss and disappointing guidance on 2015 loss provisions. |
| • | | Relative performance was supported by strong selection in the health care sector, especially the Portfolio’s tilt toward managed-care companies. Strong earnings from several bellwether stocks boosted sentiment |
| | | across the group, with better-than-feared preliminary Medicare Advantage payment rates from the Centers for Medicare & Medicaid Services (CMS) providing an additional lift. Market speculation about further consolidation in the industry was a driver in the period as well. |
| • | | Additional contributions came from Lowe’s Companies Inc. and CVS Health Corp. Lowe’s Companies Inc. was the top individual contributor within the Portfolio over the six months as the stock outperformed on solid business execution, dominant (and growing) market share, and a favorable industry backdrop. Overall, home-improvement retailers delivered standout results relative to the broader retail universe, benefiting from the consumer spending shift towards durables. CVS Health Corp. outperformed on consistently strong earnings reports, market share gains (particularly in its pharmacy benefit management unit), and a robust business outlook. Lastly, zero exposure to poor-performing International Business Machines Corp. aided relative returns. |
Describe recent portfolio activity.
| • | | Due to a combination of portfolio trading activity and market movement during the six-month period, the Portfolio’s weighting increased in the health care sector, specifically within the health care providers & services industry. The allocation to consumer staples increased as well, mainly within food & staples retailing. The Portfolio’s weighting in energy decreased, largely energy equipment & services. Exposure to IT also declined, particularly with respect to internet software & services and communications equipment. |
Describe portfolio positioning at period end.
| • | | Relative to the Russell 1000® Growth Index, the Portfolio ended the period with its largest sector overweight position in IT, followed by health care. Consumer staples was the most significant underweight, followed by consumer discretionary and telecommunication services. |
The views expressed reflect the opinions of BlackRock as of the date of this report and are subject to change based on changes in market, economic or other conditions. These views are not intended to be a forecast of future events and are no guarantee of future results.
| | | | | | |
| 6 | | BLACKROCK LARGE CAP SERIES FUNDS, INC. | | MARCH 31, 2015 | | |
| | | | |
| | | | BlackRock Large Cap Growth Fund | |
|
| Total Return Based on a $10,000 Investment |
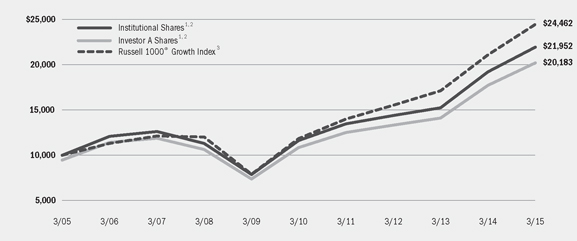
| | 1 | Assuming maximum sales charges, if any, transaction costs and other operating expenses, including administration fees, if any. Institutional Shares do not have a sales charge. |
| | 2 | The Fund invests all of its assets in the Portfolio, a series of Master Large Cap Series LLC. The Portfolio invests at least 80% of its assets in equity securities, primarily common stock, of large cap companies located in the United States that the investment advisor selects from among those that are, at the time of purchase, included in the Russell 1000® Growth Index. |
| | 3 | This unmanaged index measures the performance of the large cap growth segment of the U.S. equity universe and consists of those Russell 1000® securities with higher price-to-book ratios and higher forecasted growth values. |
| | | | | | | | | | | | | | | | | | | | | | | | | | | | |
| Performance Summary for the Period Ended March 31, 2015 | |
| | | | | | Average Annual Total Returns4 | |
| | | | | | 1 Year | | | 5 Years | | | 10 Years | |
| | | 6-Month Total Returns | | | w/o sales charge | | | w/ sales charge | | | w/o sales charge | | | w/ sales charge | | | w/o sales charge | | | w/ sales charge | |
Institutional | | | 8.05 | % | | | 14.21 | % | | | N/A | | | | 13.59 | % | | | N/A | | | | 8.18 | % | | | N/A | |
Service | | | 7.89 | | | | 13.99 | | | | N/A | | | | 13.26 | | | | N/A | | | | 7.91 | | | | N/A | |
Investor A | | | 7.96 | | | | 13.97 | | | | 7.98 | % | | | 13.23 | | | | 12.02 | % | | | 7.86 | | | | 7.28 | % |
Investor B | | | 7.47 | | | | 13.06 | | | | 8.61 | | | | 12.31 | | | | 12.06 | | | | 7.18 | | | | 7.18 | |
Investor C | | | 7.50 | | | | 13.13 | | | | 12.15 | | | | 12.36 | | | | 12.36 | | | | 7.02 | | | | 7.02 | |
Class R | | | 7.78 | | | | 13.74 | | | | N/A | | | | 12.92 | | | | N/A | | | | 7.54 | | | | N/A | |
Russell 1000® Growth Index | | | 8.81 | | | | 16.09 | | | | N/A | | | | 15.63 | | | | N/A | | | | 9.36 | | | | N/A | |
| | 4 | | Assuming maximum sales charges, if any. Average annual total returns with and without sales charges reflect reductions for distribution and service fees. See “About Fund Performance” on page 16 for a detailed description of share classes, including any related sales charges and fees. |
| | | | N/A—Not applicable as share class and index do not have a sales charge. |
| | | | Past performance is not indicative of future results. |
| | | | | | | | | | | | | | |
| Expense Example |
| | | Actual | | Hypothetical6 | | |
| | | Beginning Account Value October 1, 2014 | | Ending Account Value March 31, 2015 | | Expenses Paid During the Period5 | | Beginning Account Value October 1, 2014 | | Ending Account Value March 31, 2015 | | Expenses Paid During the Period5 | | Annualized Expense Ratio |
Institutional | | $1,000.00 | | $1,080.50 | | $4.77 | | $1,000.00 | | $1,020.34 | | $4.63 | | 0.92% |
Service | | $1,000.00 | | $1,078.90 | | $6.27 | | $1,000.00 | | $1,018.90 | | $6.09 | | 1.21% |
Investor A | | $1,000.00 | | $1,079.60 | | $6.33 | | $1,000.00 | | $1,018.85 | | $6.14 | | 1.22% |
Investor B | | $1,000.00 | | $1,074.70 | | $10.71 | | $1,000.00 | | $1,014.61 | | $10.40 | | 2.07% |
Investor C | | $1,000.00 | | $1,075.00 | | $10.24 | | $1,000.00 | | $1,015.06 | | $9.95 | | 1.98% |
Class R | | $1,000.00 | | $1,077.80 | | $7.61 | | $1,000.00 | | $1,017.60 | | $7.39 | | 1.47% |
| | 5 | | For each class of the Fund, expenses are equal to the annualized expense ratio for the class, multiplied by the average account value over the period, multiplied by 182/365 (to reflect the one-half year period shown). Because the Fund invests all of its assets in the Portfolio, the expense table reflects the net expenses of both the Fund and the Portfolio in which it invests. |
| | 6 | | Hypothetical 5% annual return before expenses is calculated by pro rating the number of days in the most recent fiscal half year divided by 365. |
| | | | See “Disclosure of Expenses” on page 16 for further information on how expenses were calculated. |
| | | | | | |
| | | BLACKROCK LARGE CAP SERIES FUNDS, INC. | | MARCH 31, 2015 | | 7 |
| | | | |
| Fund Summary as of March 31, 2015 | | | BlackRock Large Cap Value Fund | |
BlackRock Large Cap Value Fund’s (the “Fund”) investment objective is to seek long-term capital growth. In other words, the Fund tries to choose investments that will increase in value.
|
| Portfolio Management Commentary |
How did the Fund perform?
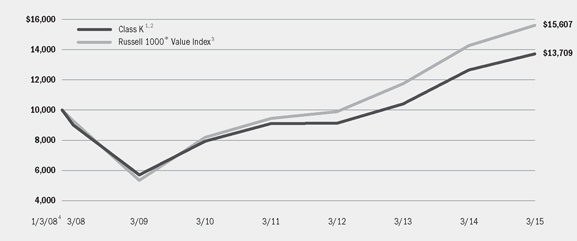
| • | | For the six-month period ended March 31, 2015, through its investment in Master Large Cap Value Portfolio (the “Portfolio”), the Fund’s Institutional, Service and Investor A Shares outperformed its benchmark, the Russell 1000® Value Index, while the Fund’s Investor B and Investor C Shares underperformed and Class R Shares performed in line with the benchmark. |
What factors influenced performance?
| • | | Industrials was among the largest contributors to relative performance, particularly the Portfolio’s exposure to United Continental Holdings, Inc. and Southwest Airlines Co. Both airlines benefited from an optimal combination of industry consolidation, capacity discipline and healthy domestic demand growth. A decline in jet-fuel prices, typically an airline’s largest expense, provided an additional tailwind in the latter part of the reporting period. Selection within the industrial conglomerates segment also proved advantageous, notably the Portfolio’s overweight position in 3M Co. and underweight in General Electric Co. |
| • | | Additional contributions came from consumer staples and health care. Consumer staples outperformance was led by the Portfolio’s position in CVS Health Corp., which soared on consistently strong earnings reports, market share gains (particularly in its pharmacy benefit management unit), and a robust business outlook. The Portfolio’s emphasis toward managed-care companies buoyed results in health care. Strong earnings from several bellwether stocks boosted sentiment across the group, with better-than-feared preliminary Medicare Advantage payment rates from the Centers for Medicare & Medicaid Services (CMS) providing an additional lift. Market speculation about further consolidation in the industry was a driver in the period as well. |
| • | | Lastly, a position in home-improvement retailer Lowe’s Companies Inc. added significant value; the stock was the top individual contributor within the Portfolio over the six months. Lowe’s Companies Inc. outperformed given solid business execution, dominant (and growing) market share, and a favorable industry backdrop. Overall, home-improvement retailers delivered standout results relative to the broader retail universe, benefiting from the consumer spending shift towards durables. |
| • | | Financials was the prime detractor from relative performance in the period. The Portfolio’s underweight in real estate investment trusts |
| | | (“REITs”) hindered relative returns, as the industry benefited from declining interest rates. Meanwhile, the Portfolio’s most interest-rate-sensitive bank holdings (particularly Bank of America) lagged amid a further decline in long-term Treasury rates. Elsewhere in the sector, multi-line insurer Genworth Financial Inc. underperformed as the company announced reserve charges related to its long-term care business that caused its shares to sharply decline. The position was eliminated from the Portfolio by the end of the reporting period. Exposure to Discover Financial Services was an additional drag on performance. |
| • | | Information technology (“IT”) was a second source of underperformance, largely owing to the Portfolio’s tilt toward enterprise hardware and compute-intensive semiconductor companies. Key names underperformed as the combination of slow economic growth in many emerging markets and a strong dollar dampened personal computer sales expectations. Micron Technology Inc. was the leading individual detractor within the Portfolio for the six-month period. |
| • | | The weakness in energy over the period impacted the Portfolio as well, notably through its weighting toward energy services companies whose stock prices tend to be correlated with the price of oil. The Portfolio’s position in Halliburton Co. was a particular laggard, as its shares were further weighed upon by the market’s negative reaction to its plan to purchase competitor Baker Hughes. |
Describe recent portfolio activity.
| • | | Due to a combination of portfolio trading activity and market movement during the six-month period, the Portfolio’s weighting increased in the health care sector, specifically within the health care providers & services industry. The allocation to consumer staples increased as well, mainly within food & staples retailing. The Portfolio’s weighting in energy decreased, both in oil, gas & consumable fuels and energy equipment & services. Exposure to financials also declined, largely with respect to banks and insurance. |
Describe portfolio positioning at period end.
| • | | Relative to the Russell 1000® Value Index, the Portfolio ended the period with its largest sector overweight position in IT, followed by health care. Utilities was the most significant underweight. |
The views expressed reflect the opinions of BlackRock as of the date of this report and are subject to change based on changes in market, economic or other conditions. These views are not intended to be a forecast of future events and are no guarantee of future results.
| | | | | | |
| 8 | | BLACKROCK LARGE CAP SERIES FUNDS, INC. | | MARCH 31, 2015 | | |
| | | | |
| | | | BlackRock Large Cap Value Fund | |
|
| Total Return Based on a $10,000 Investment |
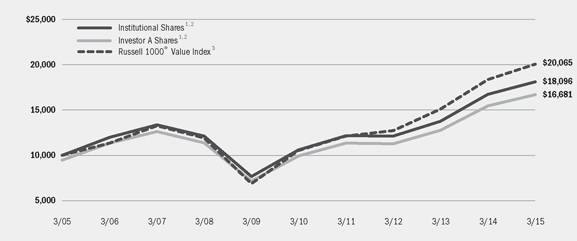
| | 1 | Assuming maximum sales charges, if any, transaction costs and other operating expenses, including administration fees, if any. Institutional Shares do not have a sales charge. |
| | 2 | The Fund invests all of its assets in the Portfolio, a series of Master Large Cap Series LLC. The Portfolio invests at least 80% of its assets in equity securities, primarily common stock, of large cap companies located in the United States that the investment advisor selects from among those that are, at the time of purchase, included in the Russell 1000® Value Index. |
| | 3 | This unmanaged index is a subset of the Russell 1000® Index that consists of those Russell 1000® securities with lower price-to-book ratios and lower forecasted growth values. |
| | | | | | | | | | | | | | | | | | | | | | | | | | | | |
| Performance Summary for the Period Ended March 31, 2015 | |
| | | | | | Average Annual Total Returns4 | |
| | | | | | 1 Year | | | 5 Years | | | 10 Years | |
| | | 6-Month Total Returns | | | w/o sales charge | | | w/ sales charge | | | w/o sales charge | | | w/ sales charge | | | w/o sales charge | | | w/ sales
charge | |
Institutional | | | 4.46 | % | | | 8.16 | % | | | N/A | | | | 11.27 | % | | | N/A | | | | 6.11 | % | | | N/A | |
Service | | | 4.31 | | | | 7.83 | | | | N/A | | | | 10.98 | | | | N/A | | | | 5.85 | | | | N/A | |
Investor A | | | 4.34 | | | | 7.85 | | | | 2.19 | % | | | 10.98 | | | | 9.79 | % | | | 5.82 | | | | 5.25 | % |
Investor B | | | 3.83 | | | | 6.98 | | | | 2.48 | | | | 10.00 | | | | 9.73 | | | | 5.11 | | | | 5.11 | |
Investor C | | | 3.89 | | | | 6.96 | | | | 5.96 | | | | 10.06 | | | | 10.06 | | | | 4.96 | | | | 4.96 | |
Class R | | | 4.20 | | | | 7.59 | | | | N/A | | | | 10.65 | | | | N/A | | | | 5.50 | | | | N/A | |
Russell 1000® Value Index | | | 4.22 | | | | 9.33 | | | | N/A | | | | 13.75 | | | | N/A | | | | 7.21 | | | | N/A | |
| | 4 | | Assuming maximum sales charges, if any. Average annual total returns with and without sales charges reflect reductions for distribution and service fees. See “About Fund Performance” on page 16 for a detailed description of share classes, including any related sales charges and fees. |
| | | | N/A—Not applicable as share class and index do not have a sales charge. |
| | | | Past performance is not indicative of future results. |
| | | | | | | | | | | | | | |
| Expense Example |
| | | Actual | | Hypothetical6 | | |
| | | Beginning Account Value October 1, 2014 | | Ending Account Value March 31, 2015 | | Expenses Paid During the Period5 | | Beginning Account Value October 1, 2014 | | Ending Account Value March 31, 2015 | | Expenses Paid During the Period5 | | Annualized Expense Ratio |
Institutional | | $1,000.00 | | $1,044.60 | | $4.43 | | $1,000.00 | | $1,020.59 | | $4.38 | | 0.87% |
Service | | $1,000.00 | | $1,043.10 | | $5.91 | | $1,000.00 | | $1,019.15 | | $5.84 | | 1.16% |
Investor A | | $1,000.00 | | $1,043.40 | | $6.01 | | $1,000.00 | | $1,019.05 | | $5.94 | | 1.18% |
Investor B | | $1,000.00 | | $1,038.30 | | $10.42 | | $1,000.00 | | $1,014.71 | | $10.30 | | 2.05% |
Investor C | | $1,000.00 | | $1,038.90 | | $9.86 | | $1,000.00 | | $1,015.26 | | $9.75 | | 1.94% |
Class R | | $1,000.00 | | $1,042.00 | | $7.33 | | $1,000.00 | | $1,017.75 | | $7.24 | | 1.44% |
| | 5 | | For each class of the Fund, expenses are equal to the annualized expense ratio for the class, multiplied by the average account value over the period, multiplied by 182/365 (to reflect the one-half year period shown). Because the Fund invests all of its assets in the Portfolio, the expense table reflects the net expenses of both the Fund and the Portfolio in which it invests. |
| | 6 | | Hypothetical 5% annual return before expenses is calculated by pro rating the number of days in the most recent fiscal half year divided by 365. |
| | | | See “Disclosure of Expenses” on page 16 for further information on how expenses were calculated. |
| | | | | | |
| | | BLACKROCK LARGE CAP SERIES FUNDS, INC. | | MARCH 31, 2015 | | 9 |
| | | | |
| Fund Summary as of March 31, 2015 | | | BlackRock Large Cap Core Retirement Portfolio | |
BlackRock Large Cap Core Retirement Portfolio’s (the “Fund”) investment objective is to seek long-term capital growth. In other words, the Fund tries to choose investments that will increase in value.
|
| Portfolio Management Commentary |
How did the Fund perform?
| • | | For the six-month period ended March 31, 2015, the Fund, through its investment in Master Large Cap Core Portfolio (the “Portfolio”), underperformed its benchmark, the Russell 1000® Index. |
What factors influenced performance?
| • | | Information technology (“IT”) was the prime detractor from relative performance, largely owing to the Portfolio’s emphasis on enterprise hardware and compute-intensive semiconductor companies. Key names underperformed as the combination of slow economic growth in many emerging markets and a strong dollar dampened personal computer sales expectations. Micron Technology Inc. was the leading individual detractor within the Portfolio for the six-month period. An underweight in strong-performing Apple Inc. also dampened relative performance in the sector. |
| • | | Financials were a second source of underperformance. The Portfolio’s most interest-rate-sensitive bank holdings (particularly Bank of America) lagged amid a further decline in long-term Treasury rates. In addition, multi-line insurer Genworth Financial Inc. underperformed as the company announced reserve charges related to its long-term care business that caused its shares to sharply decline. The position was eliminated from the Portfolio by the end of the reporting period. Elsewhere in the sector, the Portfolio’s underweight in real estate investment trusts (“REITs”) detracted, as the industry benefited from declining interest rates. Exposure to Discover Financial Services was an additional drag on performance. |
| • | | The weakness in energy over the period impacted the Portfolio as well, notably through its weighting toward energy services companies whose stock prices tend to be correlated with the price of oil. The Portfolio’s position in Halliburton Co. was a particular laggard, as its shares were further weighed upon by the market’s negative reaction to its plan to purchase competitor Baker Hughes. |
| • | | Relative performance was supported by strong selection in the health care sector, especially the Portfolio’s tilt toward managed-care companies. Strong earnings from several bellwether stocks boosted sentiment across the group, with better-than-feared preliminary Medicare Advantage payment rates from the Centers for Medicare & Medicaid Services (CMS) providing an additional lift. Market speculation about further consolidation in the industry was a driver in the period as well. |
| • | | Additional contributions came from Lowe’s Companies Inc. and CVS Health Corp., the top individual contributors within the Portfolio over the six months. Lowe’s Companies Inc. outperformed given solid business execution, dominant (and growing) market share, and a favorable industry backdrop. Overall, home-improvement retailers delivered standout results relative to the broader retail universe, benefiting from the consumer spending shift towards durables. CVS Health Corp. outperformed on consistently strong earnings reports, market share gains (particularly in its pharmacy benefit management unit), and a robust business outlook. |
Describe recent portfolio activity.
| • | | Due to a combination of portfolio trading activity and market movement during the six-month period, the Portfolio’s weighting increased in the health care sector, specifically within the health care providers & services industry. The allocation to consumer staples increased as well, mainly within food & staples retailing. The Portfolio’s weighting in energy decreased, both in oil, gas & consumable fuels and energy equipment & services. Exposure to financials also declined, largely with respect to banks and insurance. |
Describe portfolio positioning at period end.
| • | | Relative to the Russell 1000® Index, the Portfolio ended the period with its largest sector overweight position in IT, followed by health care. Utilities, telecommunication services and consumer staples were the most significant underweights. |
The views expressed reflect the opinions of BlackRock as of the date of this report and are subject to change based on changes in market, economic or other conditions. These views are not intended to be a forecast of future events and are no guarantee of future results.
| | | | | | |
| 10 | | BLACKROCK LARGE CAP SERIES FUNDS, INC. | | MARCH 31, 2015 | | |
| | | | |
| | | | BlackRock Large Cap Core Retirement Portfolio | |
|
| Total Return Based on a $10,000 Investment |
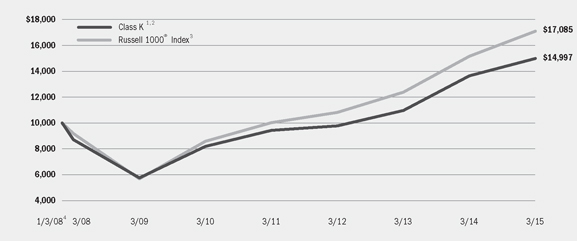
| | 1 | Assuming transaction costs and other operating expenses, including administration fees, if any. |
| | 2 | The Fund invests all of its assets in the Portfolio, a series of Master Large Cap Series LLC. The Portfolio invests at least 80% of its assets in equity securities, primarily common stock, of large cap companies located in the United States that the investment advisor selects from among those that are, at the time of purchase, included in the Russell 1000® Index. |
| | 3 | The index measures the performance of the large cap segment of the U.S. equity universe. It is a subset of the Russell 3000® Index and includes approximately 1,000 of the largest securities based on a combination of their market capitalization and current index membership. The index represents approximately 92% of the total market capitalization of the Russell 3000® Index. |
| | 4 | Commencement of operations. |
| | | | | | | | | | | | | | | | |
| Performance Summary for the Period Ended March 31, 2015 | |
| | | | | | Average Annual Total Returns5 | |
| | | 6-Month Total Returns | | | 1 Year | | | 5 Years | | | Since Inception6 | |
Class K | | | 5.50 | % | | | 9.96 | % | | | 12.84 | % | | | 5.76 | % |
Russell 1000® Index | | | 6.55 | | | | 12.73 | | | | 14.73 | | | | 7.68 | |
| | 5 | | See “About Fund Performance” on page 16 for a detailed description of the share class, including any related sales charges and fees. |
| | 6 | | The Fund commenced operations on January 3, 2008. |
| | | | Past performance is not indicative of future results. |
| | | | | | | | | | | | | | |
| Expense Example |
| | | Actual | | Hypothetical8 | | |
| | | Beginning Account Value October 1, 2014 | | Ending Account Value March 31, 2015 | | Expenses Paid During the Period7 | | Beginning Account Value October 1, 2014 | | Ending Account Value March 31, 2015 | | Expenses Paid During the Period7 | | Annualized Expense Ratio |
Class K | | $1,000.00 | | $1,055.00 | | $3.69 | | $1,000.00 | | $1,021.34 | | $3.63 | | 0.72% |
| | 7 | | Expenses are equal to the Fund’s annualized expense ratio, multiplied by the average account value over the period, multiplied by 182/365 (to reflect the one-half year period shown). Because the Fund invests all of its assets in the Portfolio, the expense example reflects the net expenses of both the Fund and the Portfolio in which it invests. |
| | 8 | | Hypothetical 5% annual return before expenses is calculated by pro rating the number of days in the most recent fiscal half year divided by 365. |
| | | | See “Disclosure of Expenses” on page 16 for further information on how expenses were calculated. |
| | | | | | |
| | | BLACKROCK LARGE CAP SERIES FUNDS, INC. | | MARCH 31, 2015 | | 11 |
| | | | |
| Fund Summary as of March 31, 2015 | | | BlackRock Large Cap Growth Retirement Portfolio | |
BlackRock Large Cap Growth Retirement Portfolio’s (the “Fund”) investment objective is to seek long-term capital growth. In other words, the Fund tries to choose investments that will increase in value.
|
| Portfolio Management Commentary |
How did the Fund perform?
| • | | For the six-month period ended March 31, 2015, the Fund, through its investment in Master Large Cap Growth Portfolio (the “Portfolio”), underperformed its benchmark, the Russell 1000® Growth Index. |
What factors influenced performance?
| • | | Information technology (IT) was the prime detractor from relative performance, largely owing to the Portfolio’s emphasis on enterprise hardware and compute-intensive semiconductor companies. Key names underperformed as the combination of slow economic growth in many emerging markets and a strong dollar dampened personal computer sales expectations. Micron Technology Inc. was the leading individual detractor within the Portfolio for the six-month period. The Portfolio’s overweight in both Microsoft Corp. and EMC Corp. also dampened relative performance in the sector, as did an underweight in strong-performing Apple Inc. |
| • | | The weakness in energy over the period impacted the Portfolio as well, notably through its weighting toward energy services companies whose stock prices tend to be correlated with the price of oil. Shares of holding Halliburton Co. were further weighed upon by the market’s negative reaction to its plan to purchase competitor Baker Hughes. |
| • | | Financials was an additional source of underperformance, due largely to the Portfolio’s position in consumer finance name Discover Financial Services. The company’s shares declined in the second half of the reporting period as a result of an earnings miss and disappointing guidance on 2015 loss provisions. |
| • | | Relative performance was supported by strong selection in the health care sector, especially the Portfolio’s tilt toward managed-care companies. Strong earnings from several bellwether stocks boosted sentiment |
| | | across the group, with better-than-feared preliminary Medicare Advantage payment rates from the Centers for Medicare & Medicaid Services (CMS) providing an additional lift. Market speculation about further consolidation in the industry was a driver in the period as well. |
| • | | Additional contributions came from Lowe’s Companies Inc. and CVS Health Corp. Lowe’s Companies Inc. was the top individual contributor within the Portfolio over the six months as the stock outperformed on solid business execution, dominant (and growing) market share, and a favorable industry backdrop. Overall, home-improvement retailers delivered standout results relative to the broader retail universe, benefiting from the consumer spending shift towards durables. CVS Health Corp. outperformed on consistently strong earnings reports, market share gains (particularly in its pharmacy benefit management unit), and a robust business outlook. Lastly, zero exposure to poor-performing International Business Machines Corp. aided relative returns. |
Describe recent portfolio activity.
| • | | Due to a combination of portfolio trading activity and market movement during the six-month period, the Portfolio’s weighting increased in the health care sector, specifically within the health care providers & services industry. The allocation to consumer staples increased as well, mainly within food & staples retailing. The Portfolio’s weighting in energy decreased, largely energy equipment & services. Exposure to IT also declined, particularly with respect to internet software & services and communications equipment. |
Describe portfolio positioning at period end.
| • | | Relative to the Russell 1000® Growth Index, the Portfolio ended the period with its largest sector overweight position in IT, followed by health care. Consumer staples was the most significant underweight, followed by consumer discretionary and telecommunication services. |
The views expressed reflect the opinions of BlackRock as of the date of this report and are subject to change based on changes in market, economic or other conditions. These views are not intended to be a forecast of future events and are no guarantee of future results.
| | | | | | |
| 12 | | BLACKROCK LARGE CAP SERIES FUNDS, INC. | | MARCH 31, 2015 | | |
| | | | |
| | | | BlackRock Large Cap Growth Retirement Portfolio | |
|
| Total Return Based on a $10,000 Investment |
| | 1 | Assuming transaction costs and other operating expenses, including administration fees, if any. |
| | 2 | The Fund invests all of its assets in the Portfolio, a series of Master Large Cap Series LLC. The Portfolio invests at least 80% of its assets in equity securities, primarily common stock, of large cap companies located in the United States that the investment advisor selects from among those that are, at the time of purchase, included in the Russell 1000® Growth Index. |
| | 3 | This unmanaged index measures the performance of the large cap growth segment of the U.S. equity universe and consists of those Russell 1000® securities with higher price-to-book ratios and higher forecasted growth values. |
| | 4 | Commencement of operations. |
| | | | | | | | | | | | | | | | |
| Performance Summary for the Period Ended March 31, 2015 | | | | | | | | | | | | | | | | |
| | | | | | Average Annual Total Returns5 | |
| | | 6-Month
Total Returns | | | 1 Year | | | 5 Years | | | Since
Inception6 | |
Class K | | | 8.12 | % | | | 14.55 | % | | | 14.60 | % | | | 8.37 | % |
Russell 1000® Growth Index | | | 8.81 | | | | 16.09 | | | | 15.63 | | | | 8.90 | |
| | 5 | | See “About Fund Performance” on page 16 for a detailed description of the share class, including any related sales charges and fees. |
| | 6 | | The Fund commenced operations on January 3, 2008. |
| | | | Past performance is not indicative of future results. |
| | | | | | | | | | | | | | |
| Expense Example |
| | | Actual | | Hypothetical8 | | |
| | | Beginning
Account Value
October 1, 2014 | | Ending
Account Value
March 31, 2015 | | Expenses Paid
During the Period7 | | Beginning
Account Value
October 1, 2014 | | Ending
Account Value
March 31, 2015 | | Expenses Paid
During the Period7 | | Annualized
Expense Ratio |
Class K | | $1,000.00 | | $1,081.20 | | $4.00 | | $1,000.00 | | $1,021.09 | | $3.88 | | 0.77% |
| | 7 | | Expenses are equal to the Fund’s annualized expense ratio, multiplied by the average account value over the period, multiplied by 182/365 (to reflect the one-half year period shown). Because the Fund invests all of its assets in the Portfolio, the expense example reflects the net expenses of both the Fund and the Portfolio in which it invests. |
| | 8 | | Hypothetical 5% annual return before expenses is calculated by pro rating the number of days in the most recent fiscal half year divided by 365. |
| | | | See “Disclosure of Expenses” on page 16 for further information on how expenses were calculated. |
| | | | | | |
| | | BLACKROCK LARGE CAP SERIES FUNDS, INC. | | MARCH 31, 2015 | | 13 |
| | | | |
| Fund Summary as of March 31, 2015 | | | BlackRock Large Cap Value Retirement Portfolio | |
BlackRock Large Cap Value Retirement Portfolio’s (the “Fund”) investment objective is to seek long-term capital growth. In other words, the Fund tries to choose investments that will increase in value.
|
| Portfolio Management Commentary |
How did the Fund perform?
| • | | For the six-month period ended March 31, 2015, the Fund, through its investment in Master Large Cap Value Portfolio (the “Portfolio”), outperformed its benchmark, the Russell 1000® Value Index. |
What factors influenced performance?
| • | | Industrials was among the largest contributors to relative performance, particularly the Portfolio’s exposure to United Continental Holdings, Inc. and Southwest Airlines Co. Both airlines benefited from an optimal combination of industry consolidation, capacity discipline and healthy domestic demand growth. A decline in jet-fuel prices, typically an airline’s largest expense, provided an additional tailwind in the latter part of the reporting period. Selection within the industrial conglomerates segment also proved advantageous, notably the Portfolio’s overweight position in 3M Co. and underweight in General Electric Co. |
| • | | Additional contributions came from consumer staples and health care. Consumer staples outperformance was led by the Portfolio’s position in CVS Health Corp., which soared on consistently strong earnings reports, market share gains (particularly in its pharmacy benefit management unit), and a robust business outlook. The Portfolio’s emphasis toward managed-care companies buoyed results in health care. Strong earnings from several bellwether stocks boosted sentiment across the group, with better-than-feared preliminary Medicare Advantage payment rates from the Centers for Medicare & Medicaid Services (CMS) providing an additional lift. Market speculation about further consolidation in the industry was a driver in the period as well. |
| • | | Lastly, a position in home-improvement retailer Lowe’s Companies Inc. added significant value; the stock was the top individual contributor within the Portfolio over the six months. Lowe’s Companies Inc. outperformed given solid business execution, dominant (and growing) market share, and a favorable industry backdrop. Overall, home-improvement retailers delivered standout results relative to the broader retail universe, benefiting from the consumer spending shift towards durables. |
| • | | Financials was the prime detractor from relative performance in the period. The Portfolio’s underweight in real estate investment trusts (“REITs”) hindered relative returns, as the industry benefited from |
| | | declining interest rates. Meanwhile, the Portfolio’s most interest-rate-sensitive bank holdings (particularly Bank of America) lagged amid a further decline in long-term Treasury rates. Elsewhere in the sector, multiline insurer Genworth Financial Inc. underperformed as the company announced reserve charges related to its long-term care business that caused its shares to sharply decline. The position was eliminated from the Portfolio by the end of the reporting period. Exposure to Discover Financial Services was an additional drag on performance. |
| • | | Information technology (“IT”) was a second source of underperformance, largely owing to the Portfolio’s tilt toward enterprise hardware and compute-intensive semiconductor companies. Key names underperformed as the combination of slow economic growth in many emerging markets and a strong dollar dampened personal computer sales expectations. Micron Technology Inc. was the leading individual detractor within the Portfolio for the six-month period. |
| • | | The weakness in energy over the period impacted the Portfolio as well, notably through its weighting toward energy services companies whose stock prices tend to be correlated with the price of oil. The Portfolio’s position in Halliburton Co. was a particular laggard, as its shares were further weighed upon by the market’s negative reaction to its plan to purchase competitor Baker Hughes. |
Describe recent portfolio activity.
| • | | Due to a combination of portfolio trading activity and market movement during the six-month period, the Portfolio’s weighting increased in the health care sector, specifically within the health care providers & services industry. The allocation to consumer staples increased as well, mainly within food & staples retailing. The Portfolio’s weighting in energy decreased, both in oil, gas & consumable fuels and energy equipment & services. Exposure to financials also declined, largely with respect to banks and insurance. |
Describe portfolio positioning at period end.
| • | | Relative to the Russell 1000® Value Index, the Portfolio ended the period with its largest sector overweight position in IT, followed by health care. Utilities was the most significant underweight. |
The views expressed reflect the opinions of BlackRock as of the date of this report and are subject to change based on changes in market, economic or other conditions. These views are not intended to be a forecast of future events and are no guarantee of future results.
| | | | | | |
| 14 | | BLACKROCK LARGE CAP SERIES FUNDS, INC. | | MARCH 31, 2015 | | |
| | | | |
| | | | BlackRock Large Cap Value Retirement Portfolio | |
|
| Total Return Based on a $10,000 Investment |
| | 1 | Assuming transaction costs and other operating expenses, including administration fees, if any. |
| | 2 | The Fund invests all of its assets in the Portfolio, a series of Master Large Cap Series LLC. The Portfolio invests at least 80% of its assets in equity securities, primarily common stock, of large cap companies located in the United States that the investment advisor selects from among those that are, at the time of purchase, included in the Russell 1000® Value Index. |
| | 3 | This unmanaged index is a subset of the Russell 1000® Index that consists of those Russell 1000® securities with lower price-to-book ratios and lower forecasted growth values. |
| | 4 | Commencement of operations. |
| | | | | | | | | | | | | | | | |
| Performance Summary for the Period Ended March 31, 2015 | |
| | | | | | Average Annual Total Returns5 | |
| | | 6-Month
Total Returns | | | 1 Year | | | 5 Years | | | Since
Inception6 | |
Class K | | | 4.58 | % | | | 8.38 | % | | | 11.60 | % | | | 4.45 | % |
Russell 1000® Value Index | | | 4.22 | | | | 9.33 | | | | 13.75 | | | | 6.34 | |
| | 5 | | See “About Fund Performance” on page 16 for a detailed description of the share class, including any related sales charges and fees. |
| | 6 | | The Fund commenced operations on January 3, 2008. |
| | | | Past performance is not indicative of future results. |
| | | | | | | | | | | | | | |
| Expense Example |
| | | Actual | | Hypothetical8 | | |
| | | Beginning
Account Value
October 1, 2014 | | Ending
Account Value
March 31, 2015 | | Expenses Paid
During the Period7 | | Beginning
Account Value
October 1, 2014 | | Ending Account Value
March 31, 2015 | | Expenses Paid
During the Period7 | | Annualized
Expense Ratio |
Class K | | $1,000.00 | | $1,045.80 | | $3.42 | | $1,000.00 | | $1,021.59 | | $3.38 | | 0.67% |
| | 7 | | Expenses are equal to the Fund’s annualized expense ratio, multiplied by the average account value over the period, multiplied by 182/365 (to reflect the one-half year period shown). Because the Fund invests all of its assets in the Portfolio, the expense example reflects the net expenses of both the Fund and the Portfolio in which it invests. |
| | 8 | | Hypothetical 5% annual return before expenses is calculated by pro rating the number of days in the most recent fiscal half year divided by 365. |
| | | | See “Disclosure of Expenses” on page 16 for further information on how expenses were calculated. |
| | | | | | |
| | | BLACKROCK LARGE CAP SERIES FUNDS, INC. | | MARCH 31, 2015 | | 15 |
| | | | |
| About Fund Performance | | | BlackRock Large Cap Series Funds, Inc. | |
| • | | Institutional and Class K Shares are not subject to any sales charge. These shares bear no ongoing distribution or service fees and are available only to certain eligible investors. |
| • | | Service Shares are not subject to any sales charge. These shares are subject to a service fee of 0.25% per year (but no distribution fee) and are available only to certain eligible investors. Service Share performance results for BlackRock Large Cap Growth Fund and BlackRock Large Cap Value Fund, prior to October 2, 2006, and for BlackRock Large Cap Core Fund, prior to September 24, 2007, are those of the applicable Fund’s Institutional Shares (which have no distribution or service fees) restated to reflect the Service Share fees. |
| • | | Investor A Shares are subject to a maximum initial sales charge (front-end load) of 5.25% and a service fee of 0.25% per year (but no distribution fee). Certain redemptions of these shares may be subject to a contingent deferred sales charge (“CDSC”) where no initial sales charge was paid at the time of purchase. These shares are generally available through financial intermediaries. |
| • | | Investor B Shares are subject to a maximum CDSC of 4.50%, declining to 0% after six years. In addition, these shares are subject to a distribution fee of 0.75% per year and a service fee of 0.25% per year. These shares automatically convert to Investor A Shares after approximately eight years. (There is no initial sales charge for automatic share conversions.) All returns for periods greater than eight years reflect this conversion. These shares are only available through exchanges and distribution reinvestments by current holders and for purchase by certain employer-sponsored retirement plans. |
| • | | Investor C Shares are subject to a 1.00% CDSC if redeemed within one year of purchase. In addition, these shares are subject to a distribution fee of 0.75% per year and a service fee of 0.25% per year. These shares are generally available through financial intermediaries. |
| • | | Class R Shares are not subject to any sales charge. These shares are subject to a distribution fee of 0.25% per year and a service fee of 0.25% per year. These shares are available only to certain employer-sponsored retirement plans. |
Performance information reflects past performance and does not guarantee future results. Current performance may be lower or higher than the performance data quoted. Refer to www.blackrock.com/funds to obtain performance data current to the most recent month end. Performance results do not reflect the deduction of taxes that a shareholder would pay on Fund distributions or the redemption of Fund shares. Figures shown in the performance tables on the previous pages assume reinvestment of all distributions, if any, at net asset value (“NAV”) on the ex-dividend date. Investment return and principal value of shares will fluctuate so that shares, when redeemed, may be worth more or less than their original cost. Distributions paid to each class of shares will vary because of the different levels of service, distribution and transfer agency fees applicable to each class, which are deducted from the income available to be paid to shareholders.
BlackRock Advisors, LLC (“the Administrator”), the administrator of BlackRock Large Cap Core Fund, BlackRock Large Cap Core Retirement Portfolio, BlackRock Large Cap Growth Retirement Portfolio and BlackRock Large Cap Value Retirement Portfolio, has contractually agreed to waive and/or reimburse a portion of each Fund’s expenses. Without such waiver and/or reimbursement, each Fund’s performance would have been lower. The Administrator is under no obligation to waive and/or reimburse or continue waiving and/or reimbursing its fees after the applicable termination date of such agreement. See Note 3 of the Notes to Financial Statements for additional information on waivers and/or reimbursements.
Shareholders of each Fund may incur the following charges: (a) transactional expenses, such as sales charges and (b) operating expenses, including administration, service and distribution fees, including 12b-1 fees, and other Fund expenses. The expense examples shown on the previous pages (which are based on a hypothetical investment of $1,000 invested on October 1, 2014 and held through March 31, 2015) are intended to assist shareholders both in calculating expenses based on an investment in each Fund and in comparing these expenses with similar costs of investing in other mutual funds.
The expense examples on the previous pages provide information about actual account values and actual expenses. In order to estimate the expenses a shareholder paid during the period covered by this report, shareholders can divide their account value by $1,000 and then multiply the result by the number corresponding to their Fund and share class under the heading entitled “Expenses Paid During the Period.”
The expense examples also provide information about hypothetical account values and hypothetical expenses based on each Fund’s actual expense ratio and an assumed rate of return of 5% per year before expenses. In order to assist shareholders in comparing the ongoing expenses of investing in these Funds and other funds, compare the 5% hypothetical example with the 5% hypothetical examples that appear in other funds’ shareholder reports.
The expenses shown in the expense examples are intended to highlight shareholders’ ongoing costs only and do not reflect any transactional expenses, such as sales charges or exchange fees, if any. Therefore, the hypothetical example is useful in comparing ongoing expenses only, and will not help shareholders determine the relative total expenses of owning different funds. If these transactional expenses were included, shareholder expenses would have been higher.
|
| Derivative Financial Instruments |
Master Large Cap Growth Portfolio (the “Portfolio”) may invest in various derivative financial instruments. Derivative financial instruments are used to obtain exposure to a security, index and/or market without owning or taking physical custody of securities or to manage market, equity, credit, interest rate, foreign currency exchange rate, commodity and/or other risks. Derivative financial instruments may give rise to a form of economic leverage. Derivative financial instruments also involve risks, including the imperfect correlation between the value of a derivative financial instrument and the underlying asset, possible default of the counterparty to the transaction or
illiquidity of the derivative financial instrument. The Portfolio’s ability to use a derivative financial instrument successfully depends on the investment advisor’s ability to predict pertinent market movements accurately, which cannot be assured. The use of derivative financial instruments may result in losses greater than if they had not been used, may limit the amount of appreciation the Portfolio can realize on an investment and/or may result in lower distributions paid to shareholders. The Portfolio’s investment in these instruments are discussed in detail in the Notes to Financial Statements.
| | | | | | |
| 16 | | BLACKROCK LARGE CAP SERIES FUNDS, INC. | | MARCH 31, 2015 | | |
| | | | |
| Statements of Assets and Liabilities | | | BlackRock Large Cap Series Funds, Inc. | |
| | | | | | | | | | | | | | | | | | | | | | | | |
| March 31, 2015 (Unaudited) | | BlackRock
Large Cap
Core Fund | | | BlackRock
Large Cap
Growth Fund | | | BlackRock
Large Cap
Value Fund | | | BlackRock
Large Cap
Core
Retirement
Portfolio | | | BlackRock
Large Cap
Growth
Retirement
Portfolio | | | BlackRock
Large Cap
Value
Retirement
Portfolio | |
| | | | | | | | | | | | | | | | | | | | | | | | |
| Assets | | | | | | | | | | | | | | | | | | | | | | | | |
Investments at value — from the applicable Portfolio1 | | $ | 1,774,030,450 | | | $ | 1,218,744,673 | | | $ | 779,815,103 | | | $ | 1,794,125 | | | $ | 926,448 | | | $ | 169,390,596 | |
Withdrawals receivable from the Portfolio | | | 1,080,008 | | | | 586,511 | | | | 1,437,375 | | | | — | | | | — | | | | — | |
Capital shares sold receivable | | | 1,117,449 | | | | 1,500,091 | | | | 290,806 | | | | 2,956 | | | | — | | | | 127,664 | |
Receivable from administrator | | | 75,560 | | | | — | | | | — | | | | 4,519 | | | | 1,517 | | | | 9,163 | |
Prepaid expenses | | | 121,203 | | | | 28,367 | | | | 9,413 | | | | 7,186 | | | | 8,087 | | | | 49,588 | |
| | | | |
Total assets | | | 1,776,424,670 | | | | 1,220,859,642 | | | | 781,552,697 | | | | 1,808,786 | | | | 936,052 | | | | 169,577,011 | |
| | | | |
| | | | | | | | | | | | | | | | | | | | | | | | |
| Liabilities | | | | | | | | | | | | | | | | | | | | | | | | |
Capital shares redeemed payable | | | 2,197,458 | | | | 2,086,602 | | | | 1,728,182 | | | | — | | | | — | | | | 83,466 | |
Contributions payable to the Portfolio | | | — | | | | — | | | | — | | | | 2,956 | | | | — | | | | 44,199 | |
Transfer agent fees payable | | | 857,482 | | | | 324,441 | | | | 410,022 | | | | 107 | | | | 183 | | | | 39,916 | |
Service and distribution fees payable | | | 550,861 | | | | 315,403 | | | | 269,400 | | | | — | | | | — | | | | — | |
Administration fees payable | | | 380,226 | | | | 259,320 | | | | 134,027 | | | | — | | | | — | | | | — | |
Other affiliates payable | | | 34,868 | | | | 75,118 | | | | 23,432 | | | | 455 | | | | 13 | | | | 254 | |
Professional fees payable | | | 23,253 | | | | 18,872 | | | | 21,342 | | | | 14,110 | | | | 10,302 | | | | 8,679 | |
Printing fees payable | | | 20,198 | | | | 15,062 | | | | 11,543 | | | | 2,290 | | | | 3,305 | | | | 4,491 | |
Officer’s fees payable | | | 335 | | | | 220 | | | | 165 | | | | — | | | | — | | | | 30 | |
Other accrued expenses payable | | | 6,495 | | | | 5,594 | | | | 5,002 | | | | 3,918 | | | | 3,912 | | | | 5,109 | |
| | | | |
Total liabilities | | | 4,071,176 | | | | 3,100,632 | | | | 2,603,115 | | | | 23,836 | | | | 17,715 | | | | 186,144 | |
| | | | |
Net Assets | | $ | 1,772,353,494 | | | $ | 1,217,759,010 | | | $ | 778,949,582 | | | $ | 1,784,950 | | | $ | 918,337 | | | $ | 169,390,867 | |
| | | | |
| | | | | | | | | | | | | | | | | | | | | | | | |
| Net Assets Consist of | | | | | | | | | | | | | | | | | | | | | | | | |
Paid-in capital | | $ | 1,347,592,644 | | | $ | 888,503,004 | | | $ | 1,160,375,360 | | | $ | 1,482,664 | | | $ | 515,759 | | | $ | 135,814,800 | |
Undistributed net investment income | | | 3,194,351 | | | | 545,262 | | | | 2,316,023 | | | | 9,209 | | | | 1,095 | | | | 583,370 | |
Accumulated net realized gain (loss) allocated from the Portfolio | | | (7,068,513 | ) | | | 18,140,277 | | | | (599,330,922 | ) | | | 831,337 | | | | (392,406 | ) | | | 16,491,187 | |
Net unrealized appreciation/depreciation allocated from the Portfolio | | | 428,635,012 | | | | 310,570,467 | | | | 215,589,121 | | | | (538,260 | ) | | | 793,889 | | | | 16,501,510 | |
| | | | |
Net Assets | | $ | 1,772,353,494 | | | $ | 1,217,759,010 | | | $ | 778,949,582 | | | $ | 1,784,950 | | | $ | 918,337 | | | $ | 169,390,867 | |
| | | | |
1 Investments at cost | | $ | 1,345,395,438 | | | $ | 908,174,206 | | | $ | 564,225,982 | | | $ | 2,332,385 | | | $ | 132,559 | | | $ | 152,889,086 | |
See Notes to Financial Statements.
| | | | | | |
| | | BLACKROCK LARGE CAP SERIES FUNDS, INC. | | MARCH 31, 2015 | | 17 |
| | | | |
| Statements of Assets and Liabilities (concluded) | | | BlackRock Large Cap Series Funds, Inc. | |
| | | | | | | | | | | | | | | | | | | | | | | | |
| March 31, 2015 (Unaudited) | | BlackRock
Large Cap
Core Fund | | | BlackRock
Large Cap
Growth Fund | | | BlackRock
Large Cap
Value Fund | | | BlackRock
Large Cap
Core
Retirement
Portfolio | | | BlackRock
Large Cap
Growth
Retirement
Portfolio | | | BlackRock
Large Cap
Value
Retirement
Portfolio | |
| | | | | | | | | | | | | | | | | | | | | | | | |
| Net Asset Value | | | | | | | | | | | | | | | | | | | | | | | | |
Institutional | | | | | | | | | | | | | | | | | | | | | | | | |
Net assets | | $ | 480,553,887 | | | $ | 403,050,041 | | | $ | 184,808,148 | | | | — | | | | — | | | | — | |
| | | | |
Shares outstanding, $0.10 par value2 | | | 25,928,236 | | | | 28,088,152 | | | | 8,037,528 | | | | — | | | | — | | | | — | |
| | | | |
Net asset value | | $ | 18.53 | | | $ | 14.35 | | | $ | 22.99 | | | | — | | | | — | | | | — | |
| | | | |
Service | | | | | | | | | | | | | | | | | | | | | | | | |
Net assets | | $ | 1,148,325 | | | $ | 1,769,041 | | | $ | 13,095,346 | | | | — | | | | — | | | | — | |
| | | | |
Shares outstanding, $0.10 par value3 | | | 62,356 | | | | 123,772 | | | | 573,341 | | | | — | | | | — | | | | — | |
| | | | |
Net asset value | | $ | 18.42 | | | $ | 14.29 | | | $ | 22.84 | | | | — | | | | — | | | | — | |
| | | | |
Investor A | | | | | | | | | | | | | | | | | | | | | | | | |
Net assets | | $ | 836,658,617 | | | $ | 573,464,916 | | | $ | 335,222,881 | | | | — | | | | — | | | | — | |
| | | | |
Shares outstanding, $0.10 par value4 | | | 46,246,080 | | | | 41,810,508 | | | | 14,859,992 | | | | — | | | | — | | | | — | |
| | | | |
Net asset value | | $ | 18.09 | | | $ | 13.72 | | | $ | 22.56 | | | | — | | | | — | | | | — | |
| | | | |
Investor B | | | | | | | | | | | | | | | | | | | | | | | | |
Net assets | | $ | 10,174,408 | | | $ | 2,502,036 | | | $ | 4,619,068 | | | | — | | | | — | | | | — | |
| | | | |
Shares outstanding, $0.10 par value5 | | | 609,324 | | | | 205,628 | | | | 218,471 | | | | — | | | | — | | | | — | |
| | | | |
Net asset value | | $ | 16.70 | | | $ | 12.17 | | | $ | 21.14 | | | | — | | | | — | | | | — | |
| | | | |
Investor C | | | | | | | | | | | | | | | | | | | | | | | | |
Net assets | | $ | 403,352,728 | | | $ | 213,481,406 | | | $ | 200,980,351 | | | | — | | | | — | | | | — | |
| | | | |
Shares outstanding, $0.10 par value6 | | | 24,509,478 | | | | 17,735,494 | | | | 9,586,520 | | | | — | | | | — | | | | — | |
| | | | |
Net asset value | | $ | 16.46 | | | $ | 12.04 | | | $ | 20.96 | | | | — | | | | — | | | | — | |
| | | | |
Class R | | | | | | | | | | | | | | | | | | | | | | | | |
Net assets | | $ | 40,465,529 | | | $ | 23,491,570 | | | $ | 40,223,788 | | | | — | | | | — | | | | — | |
| | | | |
Shares outstanding, $0.10 par value7 | | | 2,336,787 | | | | 1,808,951 | | | | 1,851,307 | | | | — | | | | — | | | | — | |
| | | | |
Net asset value | | $ | 17.32 | | | $ | 12.99 | | | $ | 21.73 | | | | — | | | | — | | | | — | |
| | | | |
Class K | | | | | | | | | | | | | | | | | | | | | | | | |
Net assets | | | — | | | | — | | | | — | | | $ | 1,784,950 | | | $ | 918,337 | | | $ | 169,390,867 | |
| | | | |
Shares outstanding, $0.10 par value8 | | | — | | | | — | | | | — | | | | 290,640 | | | | 445,636 | | | | 8,538,667 | |
| | | | |
Net asset value | | | — | | | | — | | | | — | | | $ | 6.14 | | | $ | 2.06 | | | $ | 19.84 | |
| | | | |
2 Shares Authorized — Institutional | | | 400 million | | | | 100 million | | | | 400 million | | | | — | | | | — | | | | — | |
3 Shares Authorized — Service | | | 50 million | | | | 50 million | | | | 50 million | | | | — | | | | — | | | | — | |
4 Shares Authorized — Investor A | | | 300 million | | | | 100 million | | | | 400 million | | | | — | | | | — | | | | — | |
5 Shares Authorized — Investor B | | | 200 million | | | | 200 million | | | | 200 million | | | | — | | | | — | | | | — | |
6 Shares Authorized — Investor C | | | 400 million | | | | 100 million | | | | 400 million | | | | — | | | | — | | | | — | |
7 Shares Authorized — Class R | | | 200 million | | | | 200 million | | | | 200 million | | | | — | | | | — | | | | — | |
8 Shares Authorized — Class K | | | — | | | | — | | | | — | | | | 200 million | | | | 200 million | | | | 200 million | |
See Notes to Financial Statements.
| | | | | | |
| 18 | | BLACKROCK LARGE CAP SERIES FUNDS, INC. | | MARCH 31, 2015 | | |
| | | | |
| Statements of Operations | | | BlackRock Large Cap Series Funds, Inc. | |
| | | | | | | | | | | | | | | | | | | | | | | | |
| Six Months Ended March 31, 2015 (Unaudited) | | BlackRock
Large Cap
Core Fund | | | BlackRock
Large Cap
Growth Fund | | | BlackRock
Large Cap
Value Fund | | | BlackRock
Large Cap
Core
Retirement
Portfolio | | | BlackRock
Large Cap
Growth
Retirement
Portfolio | | | BlackRock
Large Cap
Value
Retirement
Portfolio | |
| | | | | | | | | | | | | | | | | | | | | | | | |
| Investment Income | | | | | | | | | | | | | | | | | | | | | | | | |
Net investment income allocated from the applicable Portfolio: | | | | | | | | | | | | | | | | | | | | | | | | |
Dividends — unaffiliated | | $ | 14,495,708 | | | $ | 7,918,062 | | | $ | 7,641,277 | | | $ | 16,550 | | | $ | 6,558 | | | $ | 1,595,770 | |
Dividends — affiliated | | | 9,969 | | | | 10,290 | | | | 3,085 | | | | 11 | | | | 9 | | | | 636 | |
Securities lending — affiliated — net | | | 7,862 | | | | 51,486 | | | | 3,657 | | | | 8 | | | | 40 | | | | 787 | |
Foreign taxes withheld | | | (123,030 | ) | | | (73,487 | ) | | | (55,841 | ) | | | (138 | ) | | | (62 | ) | | | (11,668 | ) |
Expenses | | | (4,419,858 | ) | | | (3,130,882 | ) | | | (2,145,636 | ) | | | (4,972 | ) | | | (2,599 | ) | | | (446,219 | ) |
Fees waived | | | 14,767 | | | | 21,764 | | | | 4,621 | | | | 18 | | | | 18 | | | | 955 | |
| | | | |
Total income | | | 9,985,418 | | | | 4,797,233 | | | | 5,451,163 | | | | 11,477 | | | | 3,964 | | | | 1,140,261 | |
| | | | |
| | | | | | | | | | | | | | | | | | | | | | | | |
| Fund Expenses | | | | | | | | | | | | | | | | | | | | | | | | |
Administration | | | 2,213,879 | | | | 1,464,599 | | | | 996,474 | | | | — | | | | — | | | | — | |
Service — Service | | | 1,417 | | | | 2,375 | | | | 17,285 | | | | — | | | | — | | | | — | |
Service — Investor A | | | 1,032,226 | | | | 681,794 | | | | 430,524 | | | | — | | | | — | | | | — | |
Service and distribution — Investor B | | | 58,603 | | | | 13,389 | | | | 29,262 | | | | — | | | | — | | | | — | |
Service and distribution — Investor C | | | 2,003,674 | | | | 1,020,133 | | | | 1,021,372 | | | | — | | | | — | | | | — | |
Service and distribution — Class R | | | 104,321 | | | | 60,025 | | | | 106,074 | | | | — | | | | — | | | | — | |
Transfer agent — Institutional | | | 276,685 | | | | 239,979 | | | | 104,730 | | | | — | | | | — | | | | — | |
Transfer agent — Service | | | 1,067 | | | | 1,586 | | | | 10,669 | | | | — | | | | — | | | | — | |
Transfer agent — Investor A | | | 905,989 | | | | 472,629 | | | | 304,792 | | | | — | | | | — | | | | — | |
Transfer agent — Investor B | | | 42,882 | | | | 3,650 | | | | 8,689 | | | | — | | | | — | | | | — | |
Transfer agent — Investor C | | | 393,509 | | | | 187,837 | | | | 192,156 | | | | — | | | | — | | | | — | |
Transfer agent — Class R | | | 39,187 | | | | 21,529 | | | | 39,244 | | | | — | | | | — | | | | — | |
Transfer agent — Class K | | | — | | | | — | | | | — | | | | 69 | | | | 130 | | | | 77,829 | |
Registration | | | 52,453 | | | | 30,750 | | | | 26,227 | | | | 8,157 | | | | 8,685 | | | | 23,286 | |
Printing | | | 33,701 | | | | 22,899 | | | | 18,406 | | | | 3,666 | | | | 3,241 | | | | 5,600 | |
Professional | | | 24,939 | | | | 20,199 | | | | 19,389 | | | | 11,889 | | | | 9,423 | | | | 15,075 | |
Officer | | | 449 | | | | 295 | | | | 205 | | | | — | | | | — | | | | 41 | |
Miscellaneous | | | 10,181 | | | | 9,435 | | | | 8,919 | | | | 3,905 | | | | 3,801 | | | | 4,320 | |
| | | | |
Total expenses | | | 7,195,162 | | | | 4,253,103 | | | | 3,334,417 | | | | 27,686 | | | | 25,280 | | | | 126,151 | |
Less fees waived and/or reimbursed by administrator | | | — | | | | — | | | | (199,295 | ) | | | (25,349 | ) | | | (23,983 | ) | | | — | |
Less transfer agent fees reimbursed — Investor A | | | (374,099 | ) | | | — | | | | — | | | | — | | | | — | | | | — | |
Less transfer agent fees reimbursed — Investor B | | | (30,343 | ) | | | — | | | | — | | | | — | | | | — | | | | — | |
Less transfer agent fees reimbursed — Class K | | | — | | | | — | | | | — | | | | (69 | ) | | | (130 | ) | | | (16,304 | ) |
| | | | |
Total expenses after fees waived and/or reimbursed | | | 6,790,720 | | | | 4,253,103 | | | | 3,135,122 | | | | 2,268 | | | | 1,167 | | | | 109,847 | |
| | | | |
Net investment income | | | 3,194,698 | | | | 544,130 | | | | 2,316,041 | | | | 9,209 | | | | 2,797 | | | | 1,030,414 | |
| | | | |
| | | | | | | | | | | | | | | | | | | | | | | | |
| Realized and Unrealized Gain (Loss) Allocated from the Applicable Portfolio | |
Net realized gain from investments and financial futures contracts | | | 71,867,167 | | | | 32,410,124 | | | | 36,657,116 | | | | 80,598 | | | | 29,330 | | | | 7,533,802 | |
Net change in unrealized appreciation/depreciation on investments | | | 14,563,298 | | | | 55,253,914 | | | | (5,724,095 | ) | | | (67,147 | ) | | | 44,476 | | | | (1,193,020 | ) |
| | | | |
Total realized and unrealized gain | | | 86,430,465 | | | | 87,664,038 | | | | 30,933,021 | | | | 13,451 | | | | 73,806 | | | | 6,340,782 | |
| | | | |
Net Increase in Net Assets Resulting from Operations | | $ | 89,625,163 | | | $ | 88,208,168 | | | $ | 33,249,062 | | | $ | 22,660 | | | $ | 76,603 | | | $ | 7,371,196 | |
| | | | |
See Notes to Financial Statements.
| | | | | | |
| | | BLACKROCK LARGE CAP SERIES FUNDS, INC. | | MARCH 31, 2015 | | 19 |
| | | | |
| Statements of Changes in Net Assets | | | BlackRock Large Cap Series Funds, Inc. | |
| | | | | | | | | | | | | | | | |
| | | BlackRock
Large Cap Core Fund | | | BlackRock
Large Cap Growth Fund | |
| Increase (Decrease) in Net Assets: | | Six Months
Ended March 31, 2015 (Unaudited) | | | Year Ended
September 30,
2014 | | | Six Months
Ended March 31, 2015 (Unaudited) | | | Year Ended
September 30,
2014 | |
| | | | | | | | | | | | | | | | |
| Operations | | | | | | | | | | | | | | | | |
Net investment income | | $ | 3,194,698 | | | $ | 5,525,645 | | | $ | 544,130 | | | $ | 1,846,539 | |
Net realized gain | | | 71,867,167 | | | | 271,483,709 | | | | 32,410,124 | | | | 130,795,032 | |
Net change in unrealized appreciation/depreciation | | | 14,563,298 | | | | 22,348,388 | | | | 55,253,914 | | | | 70,848,709 | |
| | | | | | | | |
Net increase in net assets resulting from operations | | | 89,625,163 | | | | 299,357,742 | | | | 88,208,168 | | | | 203,490,280 | |
| | | | | | | | |
| | | | | | | | | | | | | | | | |
| Distributions to Shareholders From1 | | | | | | | | | | | | | | | | |
Net investment income: | | | | | | | | | | | | | | | | |
Institutional | | | (2,772,492 | ) | | | — | | | | (970,747 | ) | | | (500,033 | ) |
Service | | | (3,118 | ) | | | — | | | | (1,738 | ) | | | — | |
Investor A | | | (2,750,357 | ) | | | — | | | | (372,889 | ) | | | — | |
Investor C | | | (25 | ) | | | — | | | | — | | | | — | |
Net realized gain: | | | | | | | | | | | | | | | | |
Institutional | | | — | | | | — | | | | (44,583,980 | ) | | | (27,649,167 | ) |
Service | | | — | | | | — | | | | (221,822 | ) | | | (102,614 | ) |
Investor A | | | — | | | | — | | | | (63,450,782 | ) | | | (32,072,876 | ) |
Investor B | | | — | | | | — | | | | (339,605 | ) | | | (303,232 | ) |
Investor C | | | — | | | | — | | | | (25,959,863 | ) | | | (12,861,838 | ) |
Class R | | | — | | | | — | | | | (2,951,170 | ) | | | (1,731,807 | ) |
| | | | | | | | |
Decrease in net assets resulting from distributions to shareholders | | | (5,525,992 | ) | | | — | | | | (138,852,596 | ) | | | (75,221,567 | ) |
| | | | | | | | |
| | | | | | | | | | | | | | | | |
| Capital Share Transactions | | | | | | | | | | | | | | | | |
Net increase (decrease) in net assets derived from capital share transactions | | | (77,907,204 | ) | | | (230,046,220 | ) | | | 158,210,296 | | | | 18,950,966 | |
| | | | | | | | |
| | | | | | | | | | | | | | | | |
| Net Assets | | | | | | | | | | | | | | | | |
Total increase in net assets | | | 6,191,967 | | | | 69,311,522 | | | | 107,565,868 | | | | 147,219,679 | |
Beginning of period | | | 1,766,161,527 | | | | 1,696,850,005 | | | | 1,110,193,142 | | | | 962,973,463 | |
| | | | | | | | |
End of period | | $ | 1,772,353,494 | | | $ | 1,766,161,527 | | | $ | 1,217,759,010 | | | $ | 1,110,193,142 | |
| | | | | | | | |
Undistributed net investment income, end of period | | $ | 3,194,351 | | | $ | 5,525,645 | | | $ | 545,262 | | | $ | 1,346,506 | |
| | | | | | | | |
| | 1 | | Distributions for annual periods determined in accordance with federal income tax regulations. |
See Notes to Financial Statements.
| | | | | | |
| 20 | | BLACKROCK LARGE CAP SERIES FUNDS, INC. | | MARCH 31, 2015 | | |
| | | | |
| Statements of Changes in Net Assets (continued) | | | BlackRock Large Cap Series Funds, Inc. | |
| | | | | | | | | | | | | | | | |
| | | BlackRock
Large Cap Value Fund | | | BlackRock
Large Cap Core Retirement Portfolio | |
| Increase (Decrease) in Net Assets: | | Six Months
Ended
March 31, 2015
(Unaudited) | | | Year Ended
September 30,
2014 | | | Six Months
Ended
March 31,
2015
(Unaudited) | | | Year Ended
September 30,
2014 | |
| | | | | | | | | | | | | | | | |
| Operations | | | | | | | | | | | | | | | | |
Net investment income | | $ | 2,316,041 | | | $ | 5,196,499 | | | $ | 9,209 | | | $ | 57,687 | |
Net realized gain | | | 36,657,116 | | | | 116,448,502 | | | | 80,598 | | | | 26,343,802 | |
Net change in unrealized appreciation/depreciation | | | (5,724,095 | ) | | | 16,911,264 | | | | (67,147 | ) | | | (23,051,777 | ) |
| | | | | | | | |
Net increase in net assets resulting from operations | | | 33,249,062 | | | | 138,556,265 | | | | 22,660 | | | | 3,349,712 | |
| | | | | | | | |
| | | | | | | | | | | | | | | | |
| Distributions to Shareholders From1 | | | | | | | | | | | | | | | | |
Net investment income: | | | | | | | | | | | | | | | | |
Institutional | | | (2,056,550 | ) | | | — | | | | — | | | | — | |
Service | | | (108,934 | ) | | | — | | | | — | | | | — | |
Investor A | | | (2,671,957 | ) | | | — | | | | — | | | | — | |
Investor C | | | (143,899 | ) | | | — | | | | — | | | | — | |
Class R | | | (215,177 | ) | | | — | | | | — | | | | — | |
Class K | | | — | | | | — | | | | (15,687 | ) | | | (42,000 | ) |
Net realized gains: | | | | | | | | | | | | | | | | |
Class K | | | — | | | | — | | | | (4,667,078 | ) | | | — | |
| | | | | | | | |
Decrease in net assets resulting from distributions to shareholders | | | (5,196,517 | ) | | | — | | | | (4,682,765 | ) | | | (42,000 | ) |
| | | | | | | | |
| | | | | | | | | | | | | | | | |
| Capital Share Transactions | | | | | | | | | | | | | | | | |
Net increase (decrease) in net assets derived from capital share transactions | | | (54,720,500 | ) | | | (153,437,496 | ) | | | 4,813,284 | | | | (71,896,943 | ) |
| | | | | | | | |
| | | | | | | | | | | | | | | | |
| Net Assets | | | | | | | | | | | | | | | | |
Total increase (decrease) in net assets | | | (26,667,955 | ) | | | (14,881,231 | ) | | | 153,179 | | | | (68,589,231 | ) |
Beginning of period | | | 805,617,537 | | | | 820,498,768 | | | | 1,631,771 | | | | 70,221,002 | |
| | | | | | | | |
End of period | | $ | 778,949,582 | | | $ | 805,617,537 | | | $ | 1,784,950 | | | $ | 1,631,771 | |
| | | | | | | | |
Undistributed net investment income, end of period | | $ | 2,316,023 | | | $ | 5,196,499 | | | $ | 9,209 | | | $ | 15,687 | |
| | | | | | | | |
| | 1 | | Distributions for annual periods determined in accordance with federal income tax regulations. |
See Notes to Financial Statements.
| | | | | | |
| | | BLACKROCK LARGE CAP SERIES FUNDS, INC. | | MARCH 31, 2015 | | 21 |
| | | | |
| Statements of Changes in Net Assets (concluded) | | | BlackRock Large Cap Series Funds, Inc. | |
| | | | | | | | | | | | | | | | |
| | | BlackRock
Large Cap Growth Retirement Portfolio | | | BlackRock
Large Cap Value Retirement Portfolio | |
| Increase (Decrease) in Net Assets: | | Six Months
Ended
March 31, 2015
(Unaudited) | | | Year Ended
September 30,
2014 | | | Six Months
Ended
March 31, 2015
(Unaudited) | | | Year Ended
September 30,
2014 | |
| | | | | | | | | | | | | | | | |
| Operations | | | | | | | | | | | | | | | | |
Net investment income | | $ | 2,797 | | | $ | 7,122 | | | $ | 1,030,414 | | | $ | 1,918,608 | |
Net realized gain | | | 29,330 | | | | 548,353 | | | | 7,533,802 | | | | 17,046,326 | |
Net change in unrealized appreciation/depreciation | | | 44,476 | | | | (349,807 | ) | | | (1,193,020 | ) | | | 6,116,167 | |
| | | | | | | | |
Net increase in net assets resulting from operations | | | 76,603 | | | | 205,668 | | | | 7,371,196 | | | | 25,081,101 | |
| | | | | | | | |
| | | | | | | | | | | | | | | | |
| Distributions to Shareholders From1 | | | | | | | | | | | | | | | | |
Net investment income: | | | | | | | | | | | | | | | | |
Class K | | | (6,265 | ) | | | (2,559 | ) | | | (1,916,633 | ) | | | (1,008,006 | ) |
Net realized gains: | | | | | | | | | | | | | | | | |
Class K | | | (593,933 | ) | | | (736,831 | ) | | | (16,604,930 | ) | | | (6,968,371 | ) |
| | | | | | | | |
Decrease in net assets resulting from distributions to shareholders | | | (600,198 | ) | | | (739,390 | ) | | | (18,521,563 | ) | | | (7,976,377 | ) |
| | | | | | | | |
| | | | | | | | | | | | | | | | |
| Capital Share Transactions | | | | | | | | | | | | | | | | |
Net increase in net assets derived from capital share transactions | | | 391,451 | | | | 302,550 | | | | 20,676,317 | | | | 8,838,873 | |
| | | | | | | | |
| | | | | | | | | | | | | | | | |
| Net Assets | | | | | | | | | | | | | | | | |
Total increase (decrease) in net assets | | | (132,144 | ) | | | (231,172 | ) | | | 9,525,950 | | | | 25,943,597 | |
Beginning of period | | | 1,050,481 | | | | 1,281,653 | | | | 159,864,917 | | | | 133,921,320 | |
| | | | | | | | |
End of period | | $ | 918,337 | | | $ | 1,050,481 | | | $ | 169,390,867 | | | $ | 159,864,917 | |
| | | | | | | | |
Undistributed net investment income, end of period | | $ | 1,095 | | | $ | 4,563 | | | $ | 583,370 | | | $ | 1,469,589 | |
| | | | | | | | |
| | 1 | | Distributions for annual periods determined in accordance with federal income tax regulations. |
See Notes to Financial Statements.
| | | | | | |
| 22 | | BLACKROCK LARGE CAP SERIES FUNDS, INC. | | MARCH 31, 2015 | | |
| | | | |
| Financial Highlights | | | BlackRock Large Cap Core Fund | |
| | | | | | | | | | | | | | | | | | | | | | | | |
| | | Institutional | |
| | | Six Months
Ended
March 31,
2015 (Unaudited) | | | Year Ended September 30, | |
| | | | 2014 | | | 2013 | | | 2012 | | | 2011 | | | 2010 | |
| Per Share Operating Performance | | | | | | | | | | | | | | | | | | | | | | | | |
Net asset value, beginning of period | | $ | 17.68 | | | $ | 14.85 | | | $ | 12.64 | | | $ | 9.84 | | | $ | 10.11 | | | $ | 9.68 | |
| | | | |
Net investment income1 | | | 0.07 | | | | 0.12 | | | | 0.12 | | | | 0.16 | | | | 0.07 | | | | 0.06 | |
Net realized and unrealized gain (loss) | | | 0.88 | | | | 2.71 | | | | 2.36 | | | | 2.73 | | | | (0.28 | ) | | | 0.49 | |
| | | | |
Net increase (decrease) from investment operations | | | 0.95 | | | | 2.83 | | | | 2.48 | | | | 2.89 | | | | (0.21 | ) | | | 0.55 | |
| | | | |
Distributions from net investment income2 | | | (0.10 | ) | | | — | | | | (0.27 | ) | | | (0.09 | ) | | | (0.06 | ) | | | (0.12 | ) |
| | | | |
Net asset value, end of period | | $ | 18.53 | | | $ | 17.68 | | | $ | 14.85 | | | $ | 12.64 | | | $ | 9.84 | | | $ | 10.11 | |
| | | | |
| | | | | | | | | | | | | | | | | | | | | | | | |
| Total Return3 | | | | | | | | | | | | | | | | | | | | | | | | |
Based on net asset value | | | 5.41 | %4 | | | 19.06 | % | | | 20.00 | % | | | 29.55 | % | | | (2.16 | )% | | | 5.69 | % |
| | | | |
| | | | | | | | | | | | | | | | | | | | | | | | |
| Ratios to Average Net Assets5 | | | | | | | | | | | | | | | | | | | | | | | | |
Total expenses | | | 0.88 | %6,7 | | | 0.88 | %7 | | | 0.88 | %7 | | | 0.77 | %7,8 | | | 1.05 | %7 | | | 0.98 | % |
| | | | |
Total expenses after fees waived and/or reimbursed | | | 0.87 | %6,7 | | | 0.87 | %7 | | | 0.88 | %7 | | | 0.77 | %7,8 | | | 1.05 | %7 | | | 0.98 | % |
| | | | |
Net investment income | | | 0.75 | %6,7 | | | 0.70 | %7 | | | 0.90 | %7 | | | 1.41 | %7,8 | | | 0.58 | %7 | | | 0.63 | % |
| | | | |
| | | | | | | | | | | | | | | | | | | | | | | | |
| Supplemental Data | | | | | | | | | | | | | | | | | | | | | | | | |
Net assets, end of period (000) | | $ | 480,554 | | | $ | 503,035 | | | $ | 527,236 | | | $ | 513,245 | | | $ | 489,847 | | | $ | 646,562 | |
| | | | |
Portfolio turnover rate of the Portfolio | | | 23 | % | | | 40 | % | | | 50 | % | | | 128 | % | | | 129 | % | | | 173 | % |
| | | | |
| | 1 | | Based on average shares outstanding. |
| | 2 | | Distributions for annual periods determined in accordance with federal income tax regulations. |
| | 3 | | Where applicable, assumes the reinvestment of distributions. |
| | 4 | | Aggregate total return. |
| | 5 | | Includes the Fund’s share of the Portfolio’s allocated expenses and/or net investment income. |
| | 7 | | Includes the Fund’s share of the Portfolio’s allocated fees waived of less than 0.01%. |
| | 8 | | Includes a non-recurring expense adjustment, which impacted the ratios for total expenses, total expenses after fees waived and/or reimbursed and net investment income. Excluding this adjustment, the ratios would have been 0.90%, 0.90% and 1.28%, respectively. |
See Notes to Financial Statements.
| | | | | | |
| | | BLACKROCK LARGE CAP SERIES FUNDS, INC. | | MARCH 31, 2015 | | 23 |
| | | | |
| Financial Highlights (continued) | | | BlackRock Large Cap Core Fund | |
| | | | | | | | | | | | | | | | | | | | | | | | |
| | | Service | |
| | | Six Months
Ended
March 31,
2015 (Unaudited) | | | Year Ended September 30, | |
| | | | 2014 | | | 2013 | | | 2012 | | | 2011 | | | 2010 | |
| Per Share Operating Performance | | | | | | | | | | | | | | | | | | | | | | | | |
Net asset value, beginning of period | | $ | 17.55 | | | $ | 14.78 | | | $ | 12.39 | | | $ | 9.60 | | | $ | 9.89 | | | $ | 9.47 | |
| | | | |
Net investment income1 | | | 0.04 | | | | 0.06 | | | | 0.07 | | | | 0.11 | | | | 0.04 | | | | 0.05 | |
Net realized and unrealized gain (loss) | | | 0.88 | | | | 2.71 | | | | 2.33 | | | | 2.68 | | | | (0.27 | ) | | | 0.47 | |
| | | | |
Net increase (decrease) from investment operations | | | 0.92 | | | | 2.77 | | | | 2.40 | | | | 2.79 | | | | (0.23 | ) | | | 0.52 | |
| | | | |
Distributions from net investment income2 | | | (0.05 | ) | | | — | | | | (0.01 | ) | | | — | | | | (0.06 | ) | | | (0.10 | ) |
| | | | |
Net asset value, end of period | | $ | 18.42 | | | $ | 17.55 | | | $ | 14.78 | | | $ | 12.39 | | | $ | 9.60 | | | $ | 9.89 | |
| | | | |
| | | | | | | | | | | | | | | | | | | | | | | | |
| Total Return3 | | | | | | | | | | | | | | | | | | | | | | | | |
Based on net asset value | | | 5.25 | %4 | | | 18.74 | % | | | 19.42 | % | | | 29.06 | % | | | (2.41 | )% | | | 5.53 | % |
| | | | |
| | | | | | | | | | | | | | | | | | | | | | | | |
| Ratios to Average Net Assets5 | | | | | | | | | | | | | | | | | | | | | | | | |
Total expenses | | | 1.20 | %6,7 | | | 1.20 | %7 | | | 1.20 | %7 | | | 1.05 | %7 | | | 1.25 | %7 | | | 1.12 | % |
| | | | |
Total expenses after fees waived and/or reimbursed | | | 1.20 | %6,7 | | | 1.20 | %7 | | | 1.20 | %7 | | | 1.05 | %7 | | | 1.25 | %7 | | | 1.12 | % |
| | | | |
Net investment income | | | 0.43 | %6,7 | | | 0.38 | %7 | | | 0.55 | %7 | | | 0.96 | %7 | | | 0.39 | %7 | | | 0.49 | % |
| | | | |
| | | | | | | | | | | | | | | | | | | | | | | | |
| Supplemental Data | | | | | | | | | | | | | | | | | | | | | | | | |
Net assets, end of period (000) | | $ | 1,148 | | | $ | 1,096 | | | $ | 968 | | | $ | 1,578 | | | $ | 270 | | | $ | 369 | |
| | | | |
Portfolio turnover rate of the Portfolio | | | 23 | % | | | 40 | % | | | 50 | % | | | 128 | % | | | 129 | % | | | 173 | % |
| | | | |
| | 1 | | Based on average shares outstanding. |
| | 2 | | Distributions for annual periods determined in accordance with federal income tax regulations. |
| | 3 | | Where applicable, assumes the reinvestment of distributions. |
| | 4 | | Aggregate total return. |
| | 5 | | Includes the Fund’s share of the Portfolio’s allocated expenses and/or net investment income. |
| | 7 | | Includes the Fund’s share of the Portfolio’s allocated fees waived of less than 0.01%. |
See Notes to Financial Statements.
| | | | | | |
| 24 | | BLACKROCK LARGE CAP SERIES FUNDS, INC. | | MARCH 31, 2015 | | |
| | | | |
| Financial Highlights (continued) | | | BlackRock Large Cap Core Fund | |
| | | | | | | | | | | | | | | | | | | | | | | | |
| | | Investor A | |
| | | Six Months
Ended
March 31,
2015 (Unaudited) | | | Year Ended September 30, | |
| | | | 2014 | | | 2013 | | | 2012 | | | 2011 | | | 2010 | |
| Per Share Operating Performance | | | | | | | | | | | | | | | | | | | | | | | | |
Net asset value, beginning of period | | $ | 17.24 | | | $ | 14.52 | | | $ | 12.34 | | | $ | 9.61 | | | $ | 9.88 | | | $ | 9.46 | |
| | | | |
Net investment income1 | | | 0.04 | | | | 0.07 | | | | 0.09 | | | | 0.12 | | | | 0.06 | | | | 0.05 | |
Net realized and unrealized gain (loss) | | | 0.87 | | | | 2.65 | | | | 2.30 | | | | 2.65 | | | | (0.28 | ) | | | 0.47 | |
| | | | |
Net increase (decrease) from investment operations | | | 0.91 | | | | 2.72 | | | | 2.39 | | | | 2.77 | | | | (0.22 | ) | | | 0.52 | |
| | | | |
Distributions from net investment income2 | | | (0.06 | ) | | | — | | | | (0.21 | ) | | | (0.04 | ) | | | (0.05 | ) | | | (0.10 | ) |
| | | | |
Net asset value, end of period | | $ | 18.09 | | | $ | 17.24 | | | $ | 14.52 | | | $ | 12.34 | | | $ | 9.61 | | | $ | 9.88 | |
| | | | |
| | | | | | | | | | | | | | | | | | | | | | | | |
| Total Return3 | | | | | | | | | | | | | | | | | | | | | | | | |
Based on net asset value | | | 5.28 | %4 | | | 18.73 | % | | | 19.71 | % | | | 28.96 | % | | | (2.24 | )% | | | 5.50 | % |
| | | | |
| | | | | | | | | | | | | | | | | | | | | | | | |
| Ratios to Average Net Assets5 | | | | | | | | | | | | | | | | | | | | | | | | |
Total expenses | | | 1.23 | %6,7 | | | 1.24 | %7 | | | 1.26 | %7 | | | 1.28 | %7 | | | 1.23 | %7 | | | 1.25 | % |
| | | | |
Total expenses after fees waived and/or reimbursed | | | 1.14 | %6,7 | | | 1.14 | %7 | | | 1.14 | %7 | | | 1.14 | %7 | | | 1.14 | %7 | | | 1.14 | % |
| | | | |
Net investment income | | | 0.49 | %6,7 | | | 0.44 | %7 | | | 0.65 | %7 | | | 1.04 | %7 | | | 0.48 | %7 | | | 0.47 | % |
| | | | |
| | | | | | | | | | | | | | | | | | | | | | | | |
| Supplemental Data | | | | | | | | | | | | | | | | | | | | | | | | |
Net assets, end of period (000) | | $ | 836,659 | | | $ | 810,944 | | | $ | 732,669 | | | $ | 696,484 | | | $ | 634,822 | | | $ | 973,066 | |
| | | | |
Portfolio turnover rate of the Portfolio | | | 23 | % | | | 40 | % | | | 50 | % | | | 128 | % | | | 129 | % | | | 173 | % |
| | | | |
| | 1 | | Based on average shares outstanding. |
| | 2 | | Distributions for annual periods determined in accordance with federal income tax regulations. |
| | 3 | | Where applicable, excludes the effects of any sales charges and assumes the reinvestment of distributions. |
| | 4 | | Aggregate total return. |
| | 5 | | Includes the Fund’s share of the Portfolio’s allocated expenses and/or net investment income. |
| | 7 | | Includes the Fund’s share of the Portfolio’s allocated fees waived of less than 0.01%. |
See Notes to Financial Statements.
| | | | | | |
| | | BLACKROCK LARGE CAP SERIES FUNDS, INC. | | MARCH 31, 2015 | | 25 |
| | | | |
| Financial Highlights (continued) | | | BlackRock Large Cap Core Fund | |
| | | | | | | | | | | | | | | | | | | | | | | | |
| | | Investor B | |
| | | Six Months Ended March 31, 2015 (Unaudited) | | | Year Ended September 30, | |
| | | | 2014 | | | 2013 | | | 2012 | | | 2011 | | | 2010 | |
| Per Share Operating Performance | | | | | | | | | | | | | | | | | | | | | | | | |
Net asset value, beginning of period | | $ | 15.93 | | | $ | 13.52 | | | $ | 11.43 | | | $ | 8.93 | | | $ | 9.22 | | | $ | 8.82 | |
| | | | |
Net investment income (loss)1 | | | (0.03 | ) | | | (0.06 | ) | | | (0.02 | ) | | | 0.03 | | | | (0.04 | ) | | | (0.03 | ) |
Net realized and unrealized gain (loss) | | | 0.80 | | | | 2.47 | | | | 2.15 | | | | 2.47 | | | | (0.25 | ) | | | 0.45 | |
| | | | |
Net increase (decrease) from investment operations | | | 0.77 | | | | 2.41 | | | | 2.13 | | | | 2.50 | | | | (0.29 | ) | | | 0.42 | |
| | | | |
Distributions from net investment income2 | | | — | | | | — | | | | (0.04 | ) | | | — | | | | — | | | | (0.02 | ) |
| | | | |
Net asset value, end of period | | $ | 16.70 | | | $ | 15.93 | | | $ | 13.52 | | | $ | 11.43 | | | $ | 8.93 | | | $ | 9.22 | |
| | | | |
| | | | | | | | | | | | | | | | | | | | | | | | |
| Total Return3 | | | | | | | | | | | | | | | | | | | | | | | | |
Based on net asset value | | | 4.83 | %4 | | | 17.83 | % | | | 18.65 | % | | | 28.00 | % | | | (3.15 | )% | | | 4.71 | % |
| | | | |
| | | | | | | | | | | | | | | | | | | | | | | | |
| Ratios to Average Net Assets5 | | | | | | | | | | | | | | | | | | | | | | | | |
Total expenses | | | 2.49 | %6,7 | | | 2.29 | %7 | | | 2.30 | %7 | | | 2.18 | %7 | | | 2.14 | %7 | | | 2.16 | % |
| | | | |
Total expenses after fees waived and/or reimbursed | | | 1.97 | %6,7 | | | 1.97 | %7 | | | 1.97 | %7 | | | 1.96 | %7 | | | 1.97 | %7 | | | 1.97 | % |
| | | | |
Net investment income (loss) | | | (0.37 | )%6,7 | | | (0.39 | )%7 | | | (0.15 | )%7 | | | 0.24 | %7 | | | (0.34 | )%7 | | | (0.35 | )% |
| | | | |
| | | | | | | | | | | | | | | | | | | | | | | | |
| Supplemental Data | | | | | | | | | | | | | | | | | | | | | | | | |
Net assets, end of period (000) | | $ | 10,174 | | | $ | 13,359 | | | $ | 21,835 | | | $ | 33,719 | | | $ | 47,836 | | | $ | 78,876 | |
| | | | |
Portfolio turnover rate of the Portfolio | | | 23 | % | | | 40 | % | | | 50 | % | | | 128 | % | | | 129 | % | | | 173 | % |
| | | | |
| | 1 | | Based on average shares outstanding. |
| | 2 | | Distributions for annual periods determined in accordance with federal income tax regulations. |
| | 3 | | Where applicable, excludes the effects of any sales charges and assumes the reinvestment of distributions. |
| | 4 | | Aggregate total return. |
| | 5 | | Includes the Fund’s share of the Portfolio’s allocated expenses and/or net investment income. |
| | 7 | | Includes the Fund’s share of the Portfolio’s allocated fees waived of less than 0.01%. |
See Notes to Financial Statements.
| | | | | | |
| 26 | | BLACKROCK LARGE CAP SERIES FUNDS, INC. | | MARCH 31, 2015 | | |
| | | | |
| Financial Highlights (continued) | | | BlackRock Large Cap Core Fund | |
| | | | | | | | | | | | | | | | | | | | | | | | |
| | | Investor C | |
| | | Six Months
Ended
March 31,
2015 (Unaudited) | | | Year Ended September 30, | |
| | | | 2014 | | | 2013 | | | 2012 | | | 2011 | | | 2010 | |
| Per Share Operating Performance | | | | | | | | | | | | | | | | | | | | | | | | |
Net asset value, beginning of period | | $ | 15.69 | | | $ | 13.32 | | | $ | 11.31 | | | $ | 8.85 | | | $ | 9.13 | | | $ | 8.76 | |
| | | | |
Net investment income (loss)1 | | | (0.03 | ) | | | (0.06 | ) | | | (0.03 | ) | | | 0.02 | | | | (0.04 | ) | | | (0.04 | ) |
Net realized and unrealized gain (loss) | | | 0.80 | | | | 2.43 | | | | 2.12 | | | | 2.44 | | | | (0.24 | ) | | | 0.44 | |
| | | | |
Net increase (decrease) from investment operations | | | 0.77 | | | | 2.37 | | | | 2.09 | | | | 2.46 | | | | (0.28 | ) | | | 0.40 | |
| | | | |
Distributions from net investment income2 | | | (0.00 | )3 | | | — | | | | (0.08 | ) | | | — | | | | — | | | | (0.03 | ) |
| | | | |
Net asset value, end of period | | $ | 16.46 | | | $ | 15.69 | | | $ | 13.32 | | | $ | 11.31 | | | $ | 8.85 | | | $ | 9.13 | |
| | | | |
| | | | | | | | | | | | | | | | | | | | | | | | |
| Total Return4 | | | | | | | | | | | | | | | | | | | | | | | | |
Based on net asset value | | | 4.91 | %5 | | | 17.79 | % | | | 18.62 | % | | | 27.80 | % | | | (3.07 | )% | | | 4.51 | % |
| | | | |
| | | | | | | | | | | | | | | | | | | | | | | | |
| Ratios to Average Net Assets6 | | | | | | | | | | | | | | | | | | | | | | | | |
Total expenses | | | 1.96 | %7,8 | | | 1.97 | %8 | | | 2.01 | %8 | | | 1.97 | %8,9 | | | 2.00 | %8 | | | 2.02 | % |
| | | | |
Total expenses after fees waived and/or reimbursed | | | 1.96 | %7,8 | | | 1.97 | %8 | | | 2.01 | %8 | | | 1.97 | %8,9 | | | 2.00 | %8 | | | 2.02 | % |
| | | | |
Net investment income (loss) | | | (0.33 | )%7,8 | | | (0.39 | )%8 | | | (0.22 | )%8 | | | 0.22 | %8,9 | | | (0.38 | )%8 | | | (0.41 | )% |
| | | | |
| | | | | | | | | | | | | | | | | | | | | | | | |
| Supplemental Data | | | | | | | | | | | | | | | | | | | | | | | | |
Net assets, end of period (000) | | $ | 403,353 | | | $ | 394,765 | | | $ | 369,812 | | | $ | 363,613 | | | $ | 393,172 | | | $ | 594,396 | |
| | | | |
Portfolio turnover rate of the Portfolio | | | 23 | % | | | 40 | % | | | 50 | % | | | 128 | % | | | 129 | % | | | 173 | % |
| | | | |
| | 1 | | Based on average shares outstanding. |
| | 2 | | Distributions for annual periods determined in accordance with federal income tax regulations. |
| | 3 | | Amount is greater than $(0.005) per share. |
| | 4 | | Where applicable, excludes the effects of any sales charges and assumes the reinvestment of distributions. |
| | 5 | | Aggregate total return. |
| | 6 | | Includes the Fund’s share of the Portfolio’s allocated expenses and/or net investment income. |
| | 8 | | Includes the Fund’s share of the Portfolio’s allocated fees waived of less than 0.01%. |
| | 9 | | Includes a non-recurring expense adjustment, which impacted the ratios for total expenses, total expenses after fees waived and/or reimbursed and net investment income. Excluding this adjustment, the ratios would have been 2.05%, 2.05% and 0.14%, respectively. |
See Notes to Financial Statements.
| | | | | | |
| | | BLACKROCK LARGE CAP SERIES FUNDS, INC. | | MARCH 31, 2015 | | 27 |
| | | | |
| Financial Highlights (concluded) | | | BlackRock Large Cap Core Fund | |
| | | | | | | | | | | | | | | | | | | | | | | | |
| | | Class R | |
| | | Six Months
Ended
March 31,
2015 (Unaudited) | | | Year Ended September 30, | |
| | | | 2014 | | | 2013 | | | 2012 | | | 2011 | | | 2010 | |
| Per Share Operating Performance | | | | | | | | | | | | | | | | | | | | | | | | |
Net asset value, beginning of period | | $ | 16.47 | | | $ | 13.91 | | | $ | 11.81 | | | $ | 9.19 | | | $ | 9.46 | | | $ | 9.06 | |
| | | | |
Net investment income1 | | | 0.01 | | | | 0.02 | | | | 0.04 | | | | 0.07 | | | | 0.01 | | | | 0.01 | |
Net realized and unrealized gain (loss) | | | 0.84 | | | | 2.54 | | | | 2.21 | | | | 2.55 | | | | (0.26 | ) | | | 0.45 | |
| | | | |
Net increase (decrease) from investment operations | | | 0.85 | | | | 2.56 | | | | 2.25 | | | | 2.62 | | | | (0.25 | ) | | | 0.46 | |
| | | | |
Distributions from net investment income2 | | | — | | | | — | | | | (0.15 | ) | | | — | | | | (0.02 | ) | | | (0.06 | ) |
| | | | |
Net asset value, end of period | | $ | 17.32 | | | $ | 16.47 | | | $ | 13.91 | | | $ | 11.81 | | | $ | 9.19 | | | $ | 9.46 | |
| | | | |
| | | | | | | | | | | | | | | | | | | | | | | | |
| Total Return3 | | | | | | | | | | | | | | | | | | | | | | | | |
Based on net asset value | | | 5.16 | %4 | | | 18.40 | % | | | 19.26 | % | | | 28.51 | % | | | (2.68 | )% | | | 5.09 | % |
| | | | |
| | | | | | | | | | | | | | | | | | | | | | | | |
| Ratios to Average Net Assets5 | | | | | | | | | | | | | | | | | | | | | | | | |
Total expenses | | | 1.45 | %6,7 | | | 1.43 | %7 | | | 1.48 | %7 | | | 1.53 | %7 | | | 1.51 | %7 | | | 1.54 | % |
| | | | |
Total expenses after fees waived and/or reimbursed | | | 1.45 | %6,7 | | | 1.43 | %7 | | | 1.48 | %7 | | | 1.53 | %7 | | | 1.51 | %7 | | | 1.54 | % |
| | | | |
Net investment income | | | 0.17 | %6,7 | | | 0.15 | %7 | | | 0.32 | %7 | | | 0.66 | %7 | | | 0.12 | %7 | | | 0.07 | % |
| | | | |
| | | | | | | | | | | | | | | | | | | | | | | | |
| Supplemental Data | | | | | | | | | | | | | | | | | | | | | | | | |
Net assets, end of period (000) | | $ | 40,466 | | | $ | 42,962 | | | $ | 44,330 | | | $ | 48,790 | | | $ | 49,665 | | | $ | 80,950 | |
| | | | |
Portfolio turnover rate of the Portfolio | | | 23 | % | | | 40 | % | | | 50 | % | | | 128 | % | | | 129 | % | | | 173 | % |
| | | | |
| | 1 | | Based on average shares outstanding. |
| | 2 | | Distributions for annual periods determined in accordance with federal income tax regulations. |
| | 3 | | Where applicable, assumes the reinvestment of distributions. |
| | 4 | | Aggregate total return. |
| | 5 | | Includes the Fund’s share of the Portfolio’s allocated expenses and/or net investment income. |
| | 7 | | Includes the Fund’s share of the Portfolio’s allocated fees waived of less than 0.01%. |
See Notes to Financial Statements.
| | | | | | |
| 28 | | BLACKROCK LARGE CAP SERIES FUNDS, INC. | | MARCH 31, 2015 | | |
| | | | |
| Financial Highlights | | | BlackRock Large Cap Growth Fund | |
| | | | | | | | | | | | | | | | | | | | | | | | |
| | | Institutional | |
| | | Six Months
Ended
March 31,
2015 (Unaudited) | | | Year Ended September 30, | |
| | | | 2014 | | | 2013 | | | 2012 | | | 2011 | | | 2010 | |
| Per Share Operating Performance | | | | | | | | | | | | | | | | | | | | | | | | |
Net asset value, beginning of period | | $ | 15.02 | | | $ | 13.32 | | | $ | 12.50 | | | $ | 9.57 | | | $ | 9.54 | | | $ | 8.92 | |
| | | | |
Net investment income1 | | | 0.03 | | | | 0.07 | | | | 0.10 | | | | 0.14 | | | | 0.06 | | | | 0.03 | |
Net realized and unrealized gain (loss) | | | 1.10 | | | | 2.63 | | | | 1.65 | | | | 2.83 | | | | (0.03 | ) | | | 0.62 | |
| | | | |
Net increase from investment operations | | | 1.13 | | | | 2.70 | | | | 1.75 | | | | 2.97 | | | | 0.03 | | | | 0.65 | |
| | | | |
Distributions from:2 | | | | | | | | | | | | | | | | | | | | | | | | |
Net investment income | | | (0.04 | ) | | | (0.02 | ) | | | (0.24 | ) | | | (0.04 | ) | | | — | | | | (0.03 | ) |
Net realized gain | | | (1.76 | ) | | | (0.98 | ) | | | (0.69 | ) | | | — | | | | — | | | | — | |
| | | | |
Total distributions | | | (1.80 | ) | | | (1.00 | ) | | | (0.93 | ) | | | (0.04 | ) | | | — | | | | (0.03 | ) |
| | | | |
Net asset value, end of period | | $ | 14.35 | | | $ | 15.02 | | | $ | 13.32 | | | $ | 12.50 | | | $ | 9.57 | | | $ | 9.54 | |
| | | | |
| | | | | | | | | | | | | | | | | | | | | | | | |
| Total Return3 | | | | | | | | | | | | | | | | | | | | | | | | |
Based on net asset value | | | 8.05 | %4 | | | 21.16 | % | | | 15.33 | % | | | 31.16 | % | | | 0.31 | % | | | 7.25 | % |
| | | | |
| | | | | | | | | | | | | | | | | | | | | | | | |
| Ratios to Average Net Assets5 | | | | | | | | | | | | | | | | | | | | | | | | |
Total expenses | | | 0.92 | %6,7 | | | 0.94 | %7 | | | 0.96 | %7 | | | 0.97 | %7 | | | 0.96 | %7 | | | 1.01 | % |
| | | | |
Net investment income | | | 0.43 | %6,7 | | | 0.50 | %7 | | | 0.81 | %7 | | | 1.19 | %7 | | | 0.52 | %7 | | | 0.28 | % |
| | | | |
| | | | | | | | | | | | | | | | | | | | | | | | |
| Supplemental Data | | | | | | | | | | | | | | | | | | | | | | | | |
Net assets, end of period (000) | | $ | 403,050 | | | $ | 369,854 | | | $ | 311,127 | | | $ | 267,083 | | | $ | 300,111 | | | $ | 66,857 | |
| | | | |
Portfolio turnover rate of the Portfolio | | | 20 | % | | | 49 | % | | | 54 | % | | | 132 | % | | | 169 | % | | | 232 | % |
| | | | |
| | 1 | | Based on average shares outstanding. |
| | 2 | | Distributions for annual periods determined in accordance with federal income tax regulations. |
| | 3 | | Where applicable, assumes the reinvestment of distributions. |
| | 4 | | Aggregate total return. |
| | 5 | | Includes the Fund’s share of the Portfolio’s allocated expenses and/or net investment income. |
| | 7 | | Includes the Fund’s share of the Portfolio’s allocated fees waived of less than 0.01%. |
See Notes to Financial Statements.
| | | | | | |
| | | BLACKROCK LARGE CAP SERIES FUNDS, INC. | | MARCH 31, 2015 | | 29 |
| | | | |
| Financial Highlights (continued) | | | BlackRock Large Cap Growth Fund | |
| | | | | | | | | | | | | | | | | | | | | | | | |
| | | Service | |
| | | Six Months
Ended
March 31,
2015 (Unaudited) | | | Year Ended September 30, | |
| | | | 2014 | | | 2013 | | | 2012 | | | 2011 | | | 2010 | |
| Per Share Operating Performance | | | | | | | | | | | | | | | | | | | | | | | | |
Net asset value, beginning of period | | $ | 14.96 | | | $ | 13.18 | | | $ | 12.38 | | | $ | 9.48 | | | $ | 9.47 | | | $ | 8.87 | |
| | | | |
Net investment income1 | | | 0.01 | | | | 0.03 | | | | 0.07 | | | | 0.09 | | | | 0.03 | | | | 0.01 | |
Net realized and unrealized gain (loss) | | | 1.09 | | | | 2.60 | | | | 1.62 | | | | 2.82 | | | | (0.02 | ) | | | 0.61 | |
| | | | |
Net increase from investment operations | | | 1.10 | | | | 2.63 | | | | 1.69 | | | | 2.91 | | | | 0.01 | | | | 0.62 | |
| | | | |
Distributions from:2 | | | | | | | | | | | | | | | | | | | | | | | | |
Net investment income | | | (0.01 | ) | | | — | | | | (0.20 | ) | | | (0.01 | ) | | | — | | | | (0.02 | ) |
Net realized gain | | | (1.76 | ) | | | (0.85 | ) | | | (0.69 | ) | | | — | | | | — | | | | — | |
| | | | |
Total distributions | | | (1.77 | ) | | | (0.85 | ) | | | (0.89 | ) | | | (0.01 | ) | | | — | | | | (0.02 | ) |
| | | | |
Net asset value, end of period | | $ | 14.29 | | | $ | 14.96 | | | $ | 13.18 | | | $ | 12.38 | | | $ | 9.48 | | | $ | 9.47 | |
| | | | |
| | | | | | | | | | | | | | | | | | | | | | | | |
| Total Return3 | | | | | | | | | | | | | | | | | | | | | | | | |
Based on net asset value | | | 7.89 | %4 | | | 20.77 | % | | | 14.98 | % | | | 30.67 | % | | | 0.11 | % | | | 6.97 | % |
| | | | |
| | | | | | | | | | | | | | | | | | | | | | | | |
| Ratios to Average Net Assets5 | | | | | | | | | | | | | | | | | | | | | | | | |
Total expenses | | | 1.21 | %6,7 | | | 1.24 | %7 | | | 1.23 | %7 | | | 1.33 | %7 | | | 1.16 | %7 | | | 1.22 | % |
| | | | |
Net investment income | | | 0.13 | %6,7 | | | 0.19 | %7 | | | 0.62 | %7 | | | 0.81 | %7 | | | 0.29 | %7 | | | 0.07 | % |
| | | | |
| | | | | | | | | | | | | | | | | | | | | | | | |
| Supplemental Data | | | | | | | | | | | | | | | | | | | | | | | | |
Net assets, end of period (000) | | $ | 1,769 | | | $ | 1,912 | | | $ | 1,624 | | | $ | 11,865 | | | $ | 10,734 | | | $ | 11,299 | |
| | | | |
Portfolio turnover rate of the Portfolio | | | 20 | % | | | 49 | % | | | 54 | % | | | 132 | % | | | 169 | % | | | 232 | % |
| | | | |
| | 1 | | Based on average shares outstanding. |
| | 2 | | Distributions for annual periods determined in accordance with federal income tax regulations. |
| | 3 | | Where applicable, assumes the reinvestment of distributions. |
| | 4 | | Aggregate total return. |
| | 5 | | Includes the Fund’s share of the Portfolio’s allocated expenses and/or net investment income. |
| | 7 | | Includes the Fund’s share of the Portfolio’s allocated fees waived of less than 0.01%. |
See Notes to Financial Statements.
| | | | | | |
| 30 | | BLACKROCK LARGE CAP SERIES FUNDS, INC. | | MARCH 31, 2015 | | |
| | | | |
| Financial Highlights (continued) | | | BlackRock Large Cap Growth Fund | |
| | | | | | | | | | | | | | | | | | | | | | | | |
| | | Investor A | |
| | | Six Months
Ended
March 31,
2015 (Unaudited) | | | Year Ended September 30, | |
| | | | 2014 | | | 2013 | | | 2012 | | | 2011 | | | 2010 | |
| Per Share Operating Performance | | | | | | | | | | | | | | | | | | | | | | | | |
Net asset value, beginning of period | | $ | 14.42 | | | $ | 12.82 | | | $ | 12.09 | | | $ | 9.26 | | | $ | 9.26 | | | $ | 8.68 | |
| | | | |
Net investment income (loss)1 | | | 0.01 | | | | 0.03 | | | | 0.06 | | | | 0.10 | | | | 0.02 | | | | (0.00 | )2 |
Net realized and unrealized gain (loss) | | | 1.06 | | | | 2.52 | | | | 1.58 | | | | 2.75 | | | | (0.02 | ) | | | 0.60 | |
| | | | |
Net increase from investment operations | | | 1.07 | | | | 2.55 | | | | 1.64 | | | | 2.85 | | | | — | | | | 0.60 | |
| | | | |
Distributions from:3 | | | | | | | | | | | | | | | | | | | | | | | | |
Net investment income | | | (0.01 | ) | | | — | | | | (0.22 | ) | | | (0.02 | ) | | | — | | | | (0.02 | ) |
Net realized gain | | | (1.76 | ) | | | (0.95 | ) | | | (0.69 | ) | | | — | | | | — | | | | — | |
| | | | |
Total distributions | | | (1.77 | ) | | | (0.95 | ) | | | (0.91 | ) | | | (0.02 | ) | | | — | | | | (0.02 | ) |
| | | | |
Net asset value, end of period | | $ | 13.72 | | | $ | 14.42 | | | $ | 12.82 | | | $ | 12.09 | | | $ | 9.26 | | | $ | 9.26 | |
| | | | |
| | | | | | | | | | | | | | | | | | | | | | | | |
| Total Return4 | | | | | | | | | | | | | | | | | | | | | | | | |
Based on net asset value | | | 7.96 | %5 | | | 20.82 | % | | | 14.90 | % | | | 30.78 | % | | | 0.00 | % | | | 6.86 | % |
| | | | |
| | | | | | | | | | | | | | | | | | | | | | | | |
| Ratios to Average Net Assets6 | | | | | | | | | | | | | | | | | | | | | | | | |
Total expenses | | | 1.22 | %7,8 | | | 1.23 | %8 | | | 1.25 | %8 | | | 1.26 | %8 | | | 1.27 | %8 | | | 1.31 | % |
| | | | |
Net investment income (loss) | | | 0.13 | %7,8 | | | 0.20 | %8 | | | 0.54 | %8 | | | 0.90 | %8 | | | 0.21 | %8 | | | (0.01 | )% |
| | | | |
| | | | | | | | | | | | | | | | | | | | | | | | |
| Supplemental Data | | | | | | | | | | | | | | | | | | | | | | | | |
Net assets, end of period (000) | | $ | 573,465 | | | $ | 518,858 | | | $ | 449,729 | | | $ | 405,154 | | | $ | 318,230 | | | $ | 254,354 | |
| | | | |
Portfolio turnover rate of the Portfolio | | | 20 | % | | | 49 | % | | | 54 | % | | | 132 | % | | | 169 | % | | | 232 | % |
| | | | |
| | 1 | | Based on average shares outstanding. |
| | 2 | | Amount is greater than $(0.005) per share. |
| | 3 | | Distributions for annual periods determined in accordance with federal income tax regulations. |
| | 4 | | Where applicable, excludes the effects of any sales charges and assumes the reinvestment of distributions. |
| | 5 | | Aggregate total return. |
| | 6 | | Includes the Fund’s share of the Portfolio’s allocated expenses and/or net investment income. |
| | 8 | | Includes the Fund’s share of the Portfolio’s allocated fees waived of less than 0.01%. |
See Notes to Financial Statements.
| | | | | | |
| | | BLACKROCK LARGE CAP SERIES FUNDS, INC. | | MARCH 31, 2015 | | 31 |
| | | | |
| Financial Highlights (continued) | | | BlackRock Large Cap Growth Fund | |
| | | | | | | | | | | | | | | | | | | | | | | | |
| | | Investor B | |
| | | Six Months
Ended
March 31,
2015 (Unaudited) | | | Year Ended September 30, | |
| | | | 2014 | | | 2013 | | | 2012 | | | 2011 | | | 2010 | |
| Per Share Operating Performance | | | | | | | | | | | | | | | | | | | | | | | | |
Net asset value, beginning of period | | $ | 12.94 | | | $ | 11.56 | | | $ | 10.96 | | | $ | 8.45 | | | $ | 8.52 | | | $ | 8.03 | |
| | | | |
Net investment loss1 | | | (0.05 | ) | | | (0.07 | ) | | | (0.03 | ) | | | (0.00 | )2 | | | (0.06 | ) | | | (0.07 | ) |
Net realized and unrealized gain (loss) | | | 0.95 | | | | 2.27 | | | | 1.42 | | | | 2.51 | | | | (0.01 | ) | | | 0.56 | |
| | | | |
Net increase (decrease) from investment operations | | | 0.90 | | | | 2.20 | | | | 1.39 | | | | 2.51 | | | | (0.07 | ) | | | 0.49 | |
| | | | |
Distributions from:3 | | | | | | | | | | | | | | | | | | | | | | | | |
Net investment income | | | — | | | | — | | | | (0.10 | ) | | | — | | | | — | | | | — | |
Net realized gain | | | (1.67 | ) | | | (0.82 | ) | | | (0.69 | ) | | | — | | | | — | | | | — | |
| | | | |
Total distributions | | | (1.67 | ) | | | (0.82 | ) | | | (0.79 | ) | | | — | | | | — | | | | — | |
| | | | |
Net asset value, end of period | | $ | 12.17 | | | $ | 12.94 | | | $ | 11.56 | | | $ | 10.96 | | | $ | 8.45 | | | $ | 8.52 | |
| | | | |
| | | | | | | | | | | | | | | | | | | | | | | | |
| Total Return4 | | | | | | | | | | | | | | | | | | | | | | | | |
Based on net asset value | | | 7.47 | %5 | | | 19.87 | % | | | 13.92 | % | | | 29.70 | % | | | (0.82 | )% | | | 6.10 | % |
| | | | |
| | | | | | | | | | | | | | | | | | | | | | | | |
| Ratios to Average Net Assets6 | | | | | | | | | | | | | | | | | | | | | | | | |
Total expenses | | | 2.07 | %7,8 | | | 2.04 | %8 | | | 2.14 | %8 | | | 2.13 | %8 | | | 2.08 | %8 | | | 2.11 | % |
| | | | |
Total expenses after fees waived and/or reimbursed | | | 2.07 | %7,8 | | | 2.03 | %8 | | | 2.14 | %8 | | | 2.13 | %8 | | | 2.08 | %8 | | | 2.11 | % |
| | | | |
Net investment loss | | | (0.72 | )%7,8 | | | (0.60 | )%8 | | | (0.30 | )%8 | | | (0.01 | )%8 | | | (0.61 | )%8 | | | (0.81 | )% |
| | | | |
| | | | | | | | | | | | | | | | | | | | | | | | |
| Supplemental Data | | | | | | | | | | | | | | | | | | | | | | | | |
Net assets, end of period (000) | | $ | 2,502 | | | $ | 2,771 | | | $ | 4,656 | | | $ | 7,826 | | | $ | 10,372 | | | $ | 14,937 | |
| | | | |
Portfolio turnover rate of the Portfolio | | | 20 | % | | | 49 | % | | | 54 | % | | | 132 | % | | | 169 | % | | | 232 | % |
| | | | |
| | 1 | | Based on average shares outstanding. |
| | 2 | | Amount is greater than $(0.005) per share. |
| | 3 | | Distributions for annual periods determined in accordance with federal income tax regulations. |
| | 4 | | Where applicable, excludes the effects of any sales charges and assumes the reinvestment of distributions. |
| | 5 | | Aggregate total return. |
| | 6 | | Includes the Fund’s share of the Portfolio’s allocated expenses and/or net investment income. |
| | 8 | | Includes the Fund’s share of the Portfolio’s allocated fees waived of less than 0.01%. |
See Notes to Financial Statements.
| | | | | | |
| 32 | | BLACKROCK LARGE CAP SERIES FUNDS, INC. | | MARCH 31, 2015 | | |
| | | | |
| Financial Highlights (continued) | | | BlackRock Large Cap Growth Fund | |
| | | | | | | | | | | | | | | | | | | | | | | | |
| | | Investor C | |
| | | Six Months
Ended
March 31,
2015 (Unaudited) | | | Year Ended September 30, | |
| | | | 2014 | | | 2013 | | | 2012 | | | 2011 | | | 2010 | |
| Per Share Operating Performance | | | | | | | | | | | | | | | | | | | | | | | | |
Net asset value, beginning of period | | $ | 12.85 | | | $ | 11.52 | | | $ | 10.95 | | | $ | 8.44 | | | $ | 8.51 | | | $ | 8.03 | |
| | | | |
Net investment income (loss)1 | | | (0.04 | ) | | | (0.07 | ) | | | (0.03 | ) | | | 0.01 | | | | (0.06 | ) | | | (0.07 | ) |
Net realized and unrealized gain (loss) | | | 0.93 | | | | 2.27 | | | | 1.42 | | | | 2.50 | | | | (0.01 | ) | | | 0.55 | |
| | | | |
Net increase (decrease) from investment operations | | | 0.89 | | | | 2.20 | | | | 1.39 | | | | 2.51 | | | | (0.07 | ) | | | 0.48 | |
| | | | |
Distributions from:2 | | | | | | | | | | | | | | | | | | | | | | | | |
Net investment income | | | — | | | | — | | | | (0.13 | ) | | | — | | | | — | | | | — | |
Net realized gain | | | (1.70 | ) | | | (0.87 | ) | | | (0.69 | ) | | | — | | | | — | | | | — | |
| | | | |
Total distributions | | | (1.70 | ) | | | (0.87 | ) | | | (0.82 | ) | | | — | | | | — | | | | — | |
| | | | |
Net asset value, end of period | | $ | 12.04 | | | $ | 12.85 | | | $ | 11.52 | | | $ | 10.95 | | | $ | 8.44 | | | $ | 8.51 | |
| | | | |
| | | | | | | | | | | | | | | | | | | | | | | | |
| Total Return3 | | | | | | | | | | | | | | | | | | | | | | | | |
Based on net asset value | | | 7.50 | %4 | | | 19.96 | % | | | 14.02 | % | | | 29.74 | % | | | (0.82 | )% | | | 5.98 | % |
| | | | |
| | | | | | | | | | | | | | | | | | | | | | | | |
| Ratios to Average Net Assets5 | | | | | | | | | | | | | | | | | | | | | | | | |
Total expenses | | | 1.98 | %6,7 | | | 2.00 | %7 | | | 2.04 | %7 | | | 2.07 | %7 | | | 2.05 | %7 | | | 2.12 | % |
| | | | |
Net investment income (loss) | | | (0.63 | )%6,7 | | | (0.57 | )%7 | | | (0.24 | )%7 | | | 0.09 | %7 | | | (0.60 | )%7 | | | (0.82 | )% |
| | | | |
| | | | | | | | | | | | | | | | | | | | | | | | |
| Supplemental Data | | | | | | | | | | | | | | | | | | | | | | | | |
Net assets, end of period (000) | | $ | 213,481 | | | $ | 193,491 | | | $ | 171,430 | | | $ | 167,518 | | | $ | 129,227 | | | $ | 121,936 | |
| | | | |
Portfolio turnover rate of the Portfolio | | | 20 | % | | | 49 | % | | | 54 | % | | | 132 | % | | | 169 | % | | | 232 | % |
| | | | |
| | 1 | | Based on average shares outstanding. |
| | 2 | | Distributions for annual periods determined in accordance with federal income tax regulations. |
| | 3 | | Where applicable, excludes the effects of any sales charges and assumes the reinvestment of distributions. |
| | 4 | | Aggregate total return. |
| | 5 | | Includes the Fund’s share of the Portfolio’s allocated expenses and/or net investment income. |
| | 7 | | Includes the Fund’s share of the Portfolio’s allocated fees waived of less than 0.01%. |
See Notes to Financial Statements.
| | | | | | |
| | | BLACKROCK LARGE CAP SERIES FUNDS, INC. | | MARCH 31, 2015 | | 33 |
| | | | |
| Financial Highlights (concluded) | | | BlackRock Large Cap Growth Fund | |
| | | | | | | | | | | | | | | | | | | | | | | | |
| | | Class R | |
| | | Six Months
Ended
March 31,
2015 (Unaudited) | | | Year Ended September 30, | |
| | | | 2014 | | | 2013 | | | 2012 | | | 2011 | | | 2010 | |
| Per Share Operating Performance | | | | | | | | | | | | | | | | | | | | | | | | |
Net asset value, beginning of period | | $ | 13.74 | | | $ | 12.25 | | | $ | 11.58 | | | $ | 8.88 | | | $ | 8.91 | | | $ | 8.36 | |
| | | | |
Net investment income (loss)1 | | | (0.01 | ) | | | (0.01 | ) | | | 0.03 | | | | 0.06 | | | | (0.01 | ) | | | (0.03 | ) |
Net realized and unrealized gain (loss) | | | 1.00 | | | | 2.41 | | | | 1.51 | | | | 2.64 | | | | (0.02 | ) | | | 0.58 | |
| | | | |
Net increase (decrease) from investment operations | | | 0.99 | | | | 2.40 | | | | 1.54 | | | | 2.70 | | | | (0.03 | ) | | | 0.55 | |
| | | | |
Distributions from:2 | | | | | | | | | | | | | | | | | | | | | | | | |
Net investment income | | | — | | | | — | | | | (0.18 | ) | | | — | | | | — | | | | — | |
Net realized gain | | | (1.74 | ) | | | (0.91 | ) | | | (0.69 | ) | | | — | | | | — | | | | — | |
| | | | |
Total distributions | | | (1.74 | ) | | | (0.91 | ) | | | (0.87 | ) | | | — | | | | — | | | | — | |
| | | | |
Net asset value, end of period | | $ | 12.99 | | | $ | 13.74 | | | $ | 12.25 | | | $ | 11.58 | | | $ | 8.88 | | | $ | 8.91 | |
| | | | |
| | | | | | | | | | | | | | | | | | | | | | | | |
| Total Return3 | | | | | | | | | | | | | | | | | | | | | | | | |
Based on net asset value | | | 7.78 | %4 | | | 20.50 | % | | | 14.61 | % | | | 30.41 | % | | | (0.34 | )% | | | 6.58 | % |
| | | | |
| | | | | | | | | | | | | | | | | | | | | | | | |
| Ratios to Average Net Assets5 | | | | | | | | | | | | | | | | | | | | | | | | |
Total expenses | | | 1.48 | %6,7 | | | 1.48 | %7 | | | 1.54 | %7 | | | 1.56 | %7 | | | 1.60 | %7 | | | 1.65 | %7 |
| | | | |
Total expenses after fees waived and/or reimbursed | | | 1.47 | %6,7 | | | 1.48 | %7 | | | 1.54 | %7 | | | 1.56 | %7 | | | 1.60 | %7 | | | 1.65 | %7 |
| | | | |
Net investment income (loss) | | | (0.13 | )%6,7 | | | (0.05 | )%7 | | | 0.27 | %7 | | | 0.57 | %7 | | | (0.12 | )%7 | | | (0.35 | )% |
| | | | |
| | | | | | | | | | | | | | | | | | | | | | | | |
| Supplemental Data | | | | | | | | | | | | | | | | | | | | | | | | |
Net assets, end of period (000) | | $ | 23,492 | | | $ | 23,308 | | | $ | 24,408 | | | $ | 30,101 | | | $ | 30,868 | | | $ | 50,093 | |
| | | | |
Portfolio turnover rate of the Portfolio | | | 20 | % | | | 49 | % | | | 54 | % | | | 132 | % | | | 169 | % | | | 232 | % |
| | | | |
| | 1 | | Based on average shares outstanding. |
| | 2 | | Distributions for annual periods determined in accordance with federal income tax regulations. |
| | 3 | | Where applicable, assumes the reinvestment of distributions. |
| | 4 | | Aggregate total return. |
| | 5 | | Includes the Fund’s share of the Portfolio’s allocated expenses and/or net investment income. |
| | 7 | | Includes the Fund’s share of the Portfolio’s allocated fees waived of less than 0.01%. |
See Notes to Financial Statements.
| | | | | | |
| 34 | | BLACKROCK LARGE CAP SERIES FUNDS, INC. | | MARCH 31, 2015 | | |
| | | | |
| Financial Highlights | | | BlackRock Large Cap Value Fund | |
| | | | | | | | | | | | | | | | | | | | | | | | |
| | | Institutional | |
| | | Six Months
Ended
March 31,
2015 (Unaudited) | | | Year Ended September 30, | |
| | | | 2014 | | | 2013 | | | 2012 | | | 2011 | | | 2010 | |
| Per Share Operating Performance | | | | | | | | | | | | | | | | | | | | | | | | |
Net asset value, beginning of period | | $ | 22.25 | | | $ | 18.85 | | | $ | 15.75 | | | $ | 12.74 | | | $ | 13.51 | | | $ | 13.16 | |
| | | | |
Net investment income1 | | | 0.12 | | | | 0.22 | | | | 0.21 | | | | 0.20 | | | | 0.12 | | | | 0.11 | |
Net realized and unrealized gain (loss) | | | 0.87 | | | | 3.18 | | | | 3.25 | | | | 2.94 | | | | (0.75 | ) | | | 0.40 | |
| | | | |
Net increase (decrease) from investment operations | | | 0.99 | | | | 3.40 | | | | 3.46 | | | | 3.14 | | | | (0.63 | ) | | | 0.51 | |
| | | | |
Distributions from net investment income2 | | | (0.25 | ) | | | — | | | | (0.36 | ) | | | (0.13 | ) | | | (0.14 | ) | | | (0.16 | ) |
| | | | |
Net asset value, end of period | | $ | 22.99 | | | $ | 22.25 | | | $ | 18.85 | | | $ | 15.75 | | | $ | 12.74 | | | $ | 13.51 | |
| | | | |
| | | | | | | | | | | | | | | | | | | | | | | | |
| Total Return3 | | | | | | | | | | | | | | | | | | | | | | | | |
Based on net asset value | | | 4.46 | %4 | | | 18.04 | % | | | 22.38 | % | | | 24.84 | % | | | (4.82 | )% | | | 3.88 | % |
| | | | |
| | | | | | | | | | | | | | | | | | | | | | | | |
| Ratios to Average Net Assets5 | | | | | | | | | | | | | | | | | | | | | | | | |
Total expenses | | | 0.92 | %6,7 | | | 0.89 | %7 | | | 1.00 | %7 | | | 0.96 | % | | | 1.03 | % | | | 1.03 | % |
| | | | |
Total expenses after fees waived and/or reimbursed | | | 0.87 | %6,7 | | | 0.84 | %7 | | | 0.94 | %7 | | | 0.95 | % | | | 1.03 | % | | | 1.03 | % |
| | | | |
Net investment income | | | 1.04 | %6,7 | | | 1.07 | %7 | | | 1.19 | %7 | | | 1.33 | % | | | 0.81 | % | | | 0.85 | % |
| | | | |
| | | | | | | | | | | | | | | | | | | | | | | | |
| Supplemental Data | | | | | | | | | | | | | | | | | | | | | | | | |
Net assets, end of period (000) | | $ | 184,808 | | | $ | 184,691 | | | $ | 190,423 | | | $ | 251,764 | | | $ | 364,624 | | | $ | 737,610 | |
| | | | |
Portfolio turnover rate of the Portfolio | | | 16 | % | | | 32 | % | | | 40 | % | | | 147 | % | | | 156 | % | | | 183 | % |
| | | | |
| | 1 | | Based on average shares outstanding. |
| | 2 | | Distributions for annual periods determined in accordance with federal income tax regulations. |
| | 3 | | Where applicable, assumes the reinvestment of distributions. |
| | 4 | | Aggregate total return. |
| | 5 | | Includes the Fund’s share of the Portfolio’s allocated expenses and/or net investment income. |
| | 7 | | Includes the Fund’s share of the Portfolio’s allocated fees waived of less than 0.01%. |
See Notes to Financial Statements.
| | | | | | |
| | | BLACKROCK LARGE CAP SERIES FUNDS, INC. | | MARCH 31, 2015 | | 35 |
| | | | |
| Financial Highlights (continued) | | | BlackRock Large Cap Value Fund | |
| | | | | | | | | | | | | | | | | | | | | | | | |
| | | Service | |
| | | Six Months
Ended
March 31,
2015 (Unaudited) | | | Year Ended September 30, | |
| | | | 2014 | | | 2013 | | | 2012 | | | 2011 | | | 2010 | |
| Per Share Operating Performance | | | | | | | | | | | | | | | | | | | | | | | | |
Net asset value, beginning of period | | $ | 22.07 | | | $ | 18.75 | | | $ | 15.67 | | | $ | 12.71 | | | $ | 13.48 | | | $ | 13.13 | |
| | | | |
Net investment income1 | | | 0.08 | | | | 0.16 | | | | 0.16 | | | | 0.15 | | | | 0.10 | | | | 0.09 | |
Net realized and unrealized gain (loss) | | | 0.87 | | | | 3.16 | | | | 3.23 | | | | 2.94 | | | | (0.75 | ) | | | 0.40 | |
| | | | |
Net increase (decrease) from investment operations | | | 0.95 | | | | 3.32 | | | | 3.39 | | | | 3.09 | | | | (0.65 | ) | | | 0.49 | |
| | | | |
Distributions from net investment income2 | | | (0.18 | ) | | | — | | | | (0.31 | ) | | | (0.13 | ) | | | (0.12 | ) | | | (0.14 | ) |
| | | | |
Net asset value, end of period | | $ | 22.84 | | | $ | 22.07 | | | $ | 18.75 | | | $ | 15.67 | | | $ | 12.71 | | | $ | 13.48 | |
| | | | |
| | | | | | | | | | | | | | | | | | | | | | | | |
| Total Return3 | | | | | | | | | | | | | | | | | | | | | | | | |
Based on net asset value | | | 4.31 | %4 | | | 17.71 | % | | | 21.98 | % | | | 24.43 | % | | | (4.95 | )% | | | 3.75 | % |
| | | | |
| | | | | | | | | | | | | | | | | | | | | | | | |
| Ratios to Average Net Assets5 | | | | | | | | | | | | | | | | | | | | | | | | |
Total expenses | | | 1.21 | %6,7 | | | 1.20 | %7 | | | 1.23 | %7 | | | 1.27 | % | | | 1.17 | % | | | 1.18 | % |
| | | | |
Total expenses after fees waived and/or reimbursed | | | 1.16 | %6,7 | | | 1.15 | %7 | | | 1.18 | %7 | | | 1.25 | % | | | 1.17 | % | | | 1.18 | % |
| | | | |
Net investment income | | | 0.75 | %6,7 | | | 0.76 | %7 | | | 0.93 | %7 | | | 0.99 | % | | | 0.64 | % | | | 0.70 | % |
| | | | |
| | | | | | | | | | | | | | | | | | | | | | | | |
| Supplemental Data | | | | | | | | | | | | | | | | | | | | | | | | |
Net assets, end of period (000) | | $ | 13,095 | | | $ | 14,155 | | | $ | 13,296 | | | $ | 28,746 | | | $ | 29,586 | | | $ | 30,564 | |
| | | | |
Portfolio turnover rate of the Portfolio | | | 16 | % | | | 32 | % | | | 40 | % | | | 147 | % | | | 156 | % | | | 183 | % |
| | | | |
| | 1 | | Based on average shares outstanding. |
| | 2 | | Distributions for annual periods determined in accordance with federal income tax regulations. |
| | 3 | | Where applicable, assumes the reinvestment of distributions. |
| | 4 | | Aggregate total return. |
| | 5 | | Includes the Fund’s share of the Portfolio’s allocated expenses and/or net investment income. |
| | 7 | | Includes the Fund’s share of the Portfolio’s allocated fees waived of less than 0.01%. |
See Notes to Financial Statements.
| | | | | | |
| 36 | | BLACKROCK LARGE CAP SERIES FUNDS, INC. | | MARCH 31, 2015 | | |
| | | | |
| Financial Highlights (continued) | | | BlackRock Large Cap Value Fund | |
| | | | | | | | | | | | | | | | | | | | | | | | |
| | | Investor A | |
| | | Six Months
Ended
March 31,
2015 (Unaudited) | | | Year Ended September 30, | |
| | | | 2014 | | | 2013 | | | 2012 | | | 2011 | | | 2010 | |
| Per Share Operating Performance | | | | | | | | | | | | | | | | | | | | | | | | |
Net asset value, beginning of period | | $ | 21.79 | | | $ | 18.52 | | | $ | 15.48 | | | $ | 12.53 | | | $ | 13.29 | | | $ | 12.92 | |
| | | | |
Net investment income1 | | | 0.08 | | | | 0.15 | | | | 0.15 | | | | 0.14 | | | | 0.08 | | | | 0.09 | |
Net realized and unrealized gain (loss) | | | 0.86 | | | | 3.12 | | | | 3.21 | | | | 2.90 | | | | (0.74 | ) | | | 0.40 | |
| | | | |
Net increase (decrease) from investment operations | | | 0.94 | | | | 3.27 | | | | 3.36 | | | | 3.04 | | | | (0.66 | ) | | | 0.49 | |
| | | | |
Distributions from net investment income2 | | | (0.17 | ) | | | — | | | | (0.32 | ) | | | (0.09 | ) | | | (0.10 | ) | | | (0.12 | ) |
| | | | |
Net asset value, end of period | | $ | 22.56 | | | $ | 21.79 | | | $ | 18.52 | | | $ | 15.48 | | | $ | 12.53 | | | $ | 13.29 | |
| | | | |
| | | | | | | | | | | | | | | | | | | | | | | | |
| Total Return3 | | | | | | | | | | | | | | | | | | | | | | | | |
Based on net asset value | | | 4.34 | %4 | | | 17.66 | % | | | 22.07 | % | | | 24.38 | % | | | (5.04 | )% | | | 3.75 | % |
| | | | |
| | | | | | | | | | | | | | | | | | | | | | | | |
| Ratios to Average Net Assets5 | | | | | | | | | | | | | | | | | | | | | | | | |
Total expenses | | | 1.23 | %6,7 | | | 1.22 | %7 | | | 1.26 | %7 | | | 1.27 | % | | | 1.24 | % | | | 1.23 | % |
| | | | |
Total expenses after fees waived and/or reimbursed | | | 1.18 | %6,7 | | | 1.17 | %7 | | | 1.21 | %7 | | | 1.26 | % | | | 1.24 | % | | | 1.23 | % |
| | | | |
Net investment income | | | 0.72 | %6,7 | | | 0.74 | %7 | | | 0.91 | %7 | | | 0.99 | % | | | 0.57 | % | | | 0.67 | % |
| | | | |
| | | | | | | | | | | | | | | | | | | | | | | | |
| Supplemental Data | | | | | | | | | | | | | | | | | | | | | | | | |
Net assets, end of period (000) | | $ | 335,223 | | | $ | 352,267 | | | $ | 353,445 | | | $ | 392,575 | | | $ | 479,707 | | | $ | 756,124 | |
| | | | |
Portfolio turnover rate of the Portfolio | | | 16 | % | | | 32 | % | | | 40 | % | | | 147 | % | | | 156 | % | | | 183 | % |
| | | | |
| | 1 | | Based on average shares outstanding. |
| | 2 | | Distributions for annual periods determined in accordance with federal income tax regulations. |
| | 3 | | Where applicable, excludes the effects of any sales charges and assumes the reinvestment of distributions. |
| | 4 | | Aggregate total return. |
| | 5 | | Includes the Fund’s share of the Portfolio’s allocated expenses and/or net investment income. |
| | 7 | | Includes the Fund’s share of the Portfolio’s allocated fees waived of less than 0.01%. |
See Notes to Financial Statements.
| | | | | | |
| | | BLACKROCK LARGE CAP SERIES FUNDS, INC. | | MARCH 31, 2015 | | 37 |
| | | | |
| Financial Highlights (continued) | | | BlackRock Large Cap Value Fund | |
| | | | | | | | | | | | | | | | | | | | | | | | |
| | | Investor B | |
| | | Six Months
Ended
March 31,
2015 (Unaudited) | | | Year Ended September 30, | |
| | | | 2014 | | | 2013 | | | 2012 | | | 2011 | | | 2010 | |
| Per Share Operating Performance | | | | | | | | | | | | | | | | | | | | | | | | |
Net asset value, beginning of period | | $ | 20.36 | | | $ | 17.44 | | | $ | 14.52 | | | $ | 11.78 | | | $ | 12.52 | | | $ | 12.18 | |
| | | | |
Net investment income (loss)1 | | | (0.02 | ) | | | (0.01 | ) | | | 0.00 | 2 | | | 0.01 | | | | (0.04 | ) | | | (0.03 | ) |
Net realized and unrealized gain (loss) | | | 0.80 | | | | 2.93 | | | | 3.03 | | | | 2.73 | | | | (0.70 | ) | | | 0.37 | |
| | | | |
Net increase (decrease) from investment operations | | | 0.78 | | | | 2.92 | | | | 3.03 | | | | 2.74 | | | | (0.74 | ) | | | 0.34 | |
| | | | |
Distributions from net investment income3 | | | — | | | | — | | | | (0.11 | ) | | | — | | | | — | | | | — | |
| | | | |
Net asset value, end of period | | $ | 21.14 | | | $ | 20.36 | | | $ | 17.44 | | | $ | 14.52 | | | $ | 11.78 | | | $ | 12.52 | |
| | | | |
| | | | | | | | | | | | | | | | | | | | | | | | |
| Total Return4 | | | | | | | | | | | | | | | | | | | | | | | | |
Based on net asset value | | | 3.83 | %5 | | | 16.74 | % | | | 20.98 | % | | | 23.26 | % | | | (5.91 | )% | | | 2.79 | % |
| | | | |
| | | | | | | | | | | | | | | | | | | | | | | | |
| Ratios to Average Net Assets6 | | | | | | | | | | | | | | | | | | | | | | | | |
Total expenses | | | 2.11 | %7,8 | | | 2.01 | %8 | | | 2.20 | %8 | | | 2.21 | % | | | 2.12 | % | | | 2.14 | % |
| | | | |
Total expenses after fees waived and/or reimbursed | | | 2.05 | %7,8 | | | 1.96 | %8 | | | 2.15 | %8 | | | 2.20 | % | | | 2.12 | % | | | 2.14 | % |
| | | | |
Net investment income (loss) | | | (0.17 | )%7,8 | | | (0.05 | )%8 | | | 0.00 | %8 | | | 0.07 | % | | | (0.31 | )% | | | (0.24 | )% |
| | | | |
| | | | | | | | | | | | | | | | | | | | | | | | |
| Supplemental Data | | | | | | | | | | | | | | | | | | | | | | | | |
Net assets, end of period (000) | | $ | 4,619 | | | $ | 6,816 | | | $ | 9,377 | | | $ | 15,404 | | | $ | 22,168 | | | $ | 37,720 | |
| | | | |
Portfolio turnover rate of the Portfolio | | | 16 | % | | | 32 | % | | | 40 | % | | | 147 | % | | | 156 | % | | | 183 | % |
| | | | |
| | 1 | | Based on average shares outstanding. |
| | 2 | | Amount is less than $0.005 per share. |
| | 3 | | Distributions for annual periods determined in accordance with federal income tax regulations. |
| | 4 | | Where applicable, excludes the effects of any sales charges and assumes the reinvestment of distributions. |
| | 5 | | Aggregate total return. |
| | 6 | | Includes the Fund’s share of the Portfolio’s allocated expenses and/or net investment income. |
| | 8 | | Includes the Fund’s share of the Portfolio’s allocated fees waived of less than 0.01%. |
See Notes to Financial Statements.
| | | | | | |
| 38 | | BLACKROCK LARGE CAP SERIES FUNDS, INC. | | MARCH 31, 2015 | | |
| | | | |
| Financial Highlights (continued) | | | BlackRock Large Cap Value Fund | |
| | | | | | | | | | | | | | | | | | | | | | | | |
| | | Investor C | |
| | | Six Months
Ended
March 31,
2015 (Unaudited) | | | Year Ended September 30, | |
| | | | 2014 | | | 2013 | | | 2012 | | | 2011 | | | 2010 | |
| Per Share Operating Performance | | | | | | | | | | | | | | | | | | | | | | | | |
Net asset value, beginning of period | | $ | 20.19 | | | $ | 17.29 | | | $ | 14.45 | | | $ | 11.72 | | | $ | 12.44 | | | $ | 12.13 | |
| | | | |
Net investment income (loss)1 | | | (0.00 | )2 | | | (0.01 | ) | | | 0.02 | | | | 0.02 | | | | (0.04 | ) | | | (0.03 | ) |
Net realized and unrealized gain (loss) | | | 0.78 | | | | 2.91 | | | | 2.99 | | | | 2.71 | | | | (0.68 | ) | | | 0.36 | |
| | | | |
Net increase (decrease) from investment operations | | | 0.78 | | | | 2.90 | | | | 3.01 | | | | 2.73 | | | | (0.72 | ) | | | 0.33 | |
| | | | |
Distributions from net investment income3 | | | (0.01 | ) | | | — | | | | (0.17 | ) | | | — | | | | — | | | | (0.02 | ) |
| | | | |
Net asset value, end of period | | $ | 20.96 | | | $ | 20.19 | | | $ | 17.29 | | | $ | 14.45 | | | $ | 11.72 | | | $ | 12.44 | |
| | | | |
| | | | | | | | | | | | | | | | | | | | | | | | |
| Total Return4 | | | | | | | | | | | | | | | | | | | | | | | | |
Based on net asset value | | | 3.89 | %5 | | | 16.77 | % | | | 21.06 | % | | | 23.29 | % | | | (5.79 | )% | | | 2.74 | % |
| | | | |
| | | | | | | | | | | | | | | | | | | | | | | | |
| Ratios to Average Net Assets6 | | | | | | | | | | | | | | | | | | | | | | | | |
Total expenses | | | 2.00 | %7,8 | | | 2.01 | %8 | | | 2.07 | %8 | | | 2.12 | % | | | 2.10 | % | | | 2.11 | % |
| | | | |
Total expenses after fees waived and/or reimbursed | | | 1.94 | %7,8 | | | 1.95 | %8 | | | 2.02 | %8 | | | 2.11 | % | | | 2.10 | % | | | 2.11 | % |
| | | | |
Net investment income (loss) | | | (0.04 | )%7,8 | | | (0.05 | )%8 | | | 0.09 | %8 | | | 0.14 | % | | | (0.29 | )% | | | (0.22 | )% |
| | | | |
| | | | | | | | | | | | | | | | | | | | | | | | |
| Supplemental Data | | | | | | | | | | | | | | | | | | | | | | | | |
Net assets, end of period (000) | | $ | 200,980 | | | $ | 204,312 | | | $ | 204,690 | | | $ | 210,681 | | | $ | 220,527 | | | $ | 298,040 | |
| | | | |
Portfolio turnover rate of the Portfolio | | | 16 | % | | | 32 | % | | | 40 | % | | | 147 | % | | | 156 | % | | | 183 | % |
| | | | |
| | 1 | | Based on average shares outstanding. |
| | 2 | | Amount is greater than $(0.005) per share. |
| | 3 | | Distributions for annual periods determined in accordance with federal income tax regulations. |
| | 4 | | Where applicable, excludes the effects of any sales charges and assumes the reinvestment of distributions. |
| | 5 | | Aggregate total return. |
| | 6 | | Includes the Fund’s share of the Portfolio’s allocated expenses and/or net investment income. |
| | 8 | | Includes the Fund’s share of the Portfolio’s allocated fees waived of less than 0.01%. |
See Notes to Financial Statements.
| | | | | | |
| | | BLACKROCK LARGE CAP SERIES FUNDS, INC. | | MARCH 31, 2015 | | 39 |
| | | | |
| Financial Highlights (concluded) | | | BlackRock Large Cap Value Fund | |
| | | | | | | | | | | | | | | | | | | | | | | | |
| | | Class R | |
| | | Six Months
Ended
March 31,
2015 (Unaudited) | | | Year Ended September 30, | |
| | | | 2014 | | | 2013 | | | 2012 | | | 2011 | | | 2010 | |
| Per Share Operating Performance | | | | | | | | | | | | | | | | | | | | | | | | |
Net asset value, beginning of period | | $ | 20.96 | | | $ | 17.86 | | | $ | 14.92 | | | $ | 12.08 | | | $ | 12.81 | | | $ | 12.48 | |
| | | | |
Net investment income1 | | | 0.05 | | | | 0.09 | | | | 0.10 | | | | 0.09 | | | | 0.04 | | | | 0.04 | |
Net realized and unrealized gain (loss) | | | 0.83 | | | | 3.01 | | | | 3.09 | | | | 2.80 | | | | (0.72 | ) | | | 0.38 | |
| | | | |
Net increase (decrease) from investment operations | | | 0.88 | | | | 3.10 | | | | 3.19 | | | | 2.89 | | | | (0.68 | ) | | | 0.42 | |
| | | | |
Distributions from net investment income2 | | | (0.11 | ) | | | — | | | | (0.25 | ) | | | (0.05 | ) | | | (0.05 | ) | | | (0.09 | ) |
| | | | |
Net asset value, end of period | | $ | 21.73 | | | $ | 20.96 | | | $ | 17.86 | | | $ | 14.92 | | | $ | 12.08 | | | $ | 12.81 | |
| | | | |
| | | | | | | | | | | | | | | | | | | | | | | | |
| Total Return3 | | | | | | | | | | | | | | | | | | | | | | | | |
Based on net asset value | | | 4.20 | %4 | | | 17.36 | % | | | 21.70 | % | | | 23.98 | % | | | (5.32 | )% | | | 3.35 | % |
| | | | |
| | | | | | | | | | | | | | | | | | | | | | | | |
| Ratios to Average Net Assets5 | | | | | | | | | | | | | | | | | | | | | | | | |
Total expenses | | | 1.49 | %6,7 | | | 1.48 | %7 | | | 1.54 | %7 | | | 1.57 | % | | | 1.56 | % | | | 1.60 | % |
| | | | |
Total expenses after fees waived and/or reimbursed | | | 1.44 | %6,7 | | | 1.43 | %7 | | | 1.49 | %7 | | | 1.56 | % | | | 1.56 | % | | | 1.60 | % |
| | | | |
Net investment income | | | 0.46 | %6,7 | | | 0.48 | %7 | | | 0.63 | %7 | | | 0.70 | % | | | 0.25 | % | | | 0.29 | % |
| | | | |
| | | | | | | | | | | | | | | | | | | | | | | | |
| Supplemental Data | | | | | | | | | | | | | | | | | | | | | | | | |
Net assets, end of period (000) | | $ | 40,224 | | | $ | 43,377 | | | $ | 49,267 | | | $ | 59,934 | | | $ | 67,672 | | | $ | 115,763 | |
| | | | |
Portfolio turnover rate of the Portfolio | | | 16 | % | | | 32 | % | | | 40 | % | | | 147 | % | | | 156 | % | | | 183 | % |
| | | | |
| | 1 | | Based on average shares outstanding. |
| | 2 | | Distributions for annual periods determined in accordance with federal income tax regulations. |
| | 3 | | Where applicable, assumes the reinvestment of distributions. |
| | 4 | | Aggregate total return. |
| | 5 | | Includes the Fund’s share of the Portfolio’s allocated expenses and/or net investment income. |
| | 7 | | Includes the Fund’s share of the Portfolio’s allocated fees waived of less than 0.01%. |
See Notes to Financial Statements.
| | | | | | |
| 40 | | BLACKROCK LARGE CAP SERIES FUNDS, INC. | | MARCH 31, 2015 | | |
| | | | |
| Financial Highlights | | | BlackRock Large Cap Core Retirement Portfolio | |
| | | | | | | | | | | | | | | | | | | | | | | | |
| | | Class K | |
| | | Six Months
Ended
March 31,
2015 (Unaudited) | | | Year Ended September 30, | |
| | | | 2014 | | | 2013 | | | 2012 | | | 2011 | | | 2010 | |
| Per Share Operating Performance | | | | | | | | | | | | | | | | | | | | | | | | |
Net asset value, beginning of period | | $ | 17.01 | | | $ | 14.69 | | | $ | 12.51 | | | $ | 9.78 | | | $ | 10.06 | | | $ | 9.61 | |
| | | | |
Net investment income1 | | | 0.04 | | | | 0.11 | | | | 0.16 | | | | 0.18 | | | | 0.11 | | | | 0.09 | |
Net realized and unrealized gain (loss) | | | 0.47 | | | | 2.68 | | | | 2.32 | | | | 2.69 | | | | (0.28 | ) | | | 0.49 | |
| | | | |
Net increase (decrease) from investment operations | | | 0.51 | | | | 2.79 | | | | 2.48 | | | | 2.87 | | | | (0.17 | ) | | | 0.58 | |
| | | | |
Distributions from:2 | | | | | | | | | | | | | | | | | | | | | | | | |
Net investment income | | | (0.04 | ) | | | (0.47 | ) | | | (0.30 | ) | | | (0.14 | ) | | | (0.11 | ) | | | (0.13 | ) |
Net realized gain | | | (11.34 | ) | | | — | | | | — | | | | — | | | | — | | | | — | |
| | | | |
Total distributions | | | (11.38 | ) | | | (0.47 | ) | | | (0.30 | ) | | | (0.14 | ) | | | (0.11 | ) | | | (0.13 | ) |
| | | | |
Net asset value, end of period | | $ | 6.14 | | | $ | 17.01 | | | $ | 14.69 | | | $ | 12.51 | | | $ | 9.78 | | | $ | 10.06 | |
| | | | |
| | | | | | | | | | | | | | | | | | | | | | | | |
| Total Return3 | | | | | | | | | | | | | | | | | | | | | | | | |
Based on net asset value | | | 5.50 | %4 | | | 19.33 | % | | | 20.27 | % | | | 29.67 | % | | | (1.81 | )% | | | 6.01 | % |
| | | | |
| | | | | | | | | | | | | | | | | | | | | | | | |
| Ratios to Average Net Assets5 | | | | | | | | | | | | | | | | | | | | | | | | |
Total expenses | | | 3.28 | %6,7 | | | 1.08 | %7 | | | 0.59 | %7 | | | 0.60 | %7 | | | 0.67 | %7 | | | 0.68 | % |
| | | | |
Total expenses after fees waived and/or reimbursed | | | 0.72 | %6,7 | | | 0.50 | %7 | | | 0.59 | %7 | | | 0.59 | %7 | | | 0.67 | %7 | | | 0.67 | % |
| | | | |
Net investment income | | | 0.92 | %6,7 | | | 0.72 | %7 | | | 1.21 | %7 | | | 1.59 | %7 | | | 0.96 | %7 | | | 0.93 | % |
| | | | |
| | | | | | | | | | | | | | | | | | | | | | | | |
| Supplemental Data | | | | | | | | | | | | | | | | | | | | | | | | |
Net assets, end of period (000) | | $ | 1,785 | | | $ | 1,632 | | | $ | 70,221 | | | $ | 81,221 | | | $ | 129,491 | | | $ | 113,241 | |
| | | | |
Portfolio turnover rate of the Portfolio | | | 23 | % | | | 40 | % | | | 50 | % | | | 128 | % | | | 129 | % | | | 173 | % |
| | | | |
| | 1 | | Based on average shares outstanding. |
| | 2 | | Distributions for annual periods determined in accordance with federal income tax regulations. |
| | 3 | | Where applicable, assumes the reinvestment of distributions. |
| | 4 | | Aggregate total return. |
| | 5 | | Includes the Fund’s share of the Portfolio’s allocated expenses and/or net investment income. |
| | 7 | | Includes the Fund’s share of the Portfolio’s allocated fees waived of less than 0.01%. |
See Notes to Financial Statements.
| | | | | | |
| | | BLACKROCK LARGE CAP SERIES FUNDS, INC. | | MARCH 31, 2015 | | 41 |
| | | | |
| Financial Highlights | | | BlackRock Large Cap Growth Retirement Portfolio | |
| | | | | | | | | | | | | | | | | | | | | | | | |
| | | Class K | |
| | | Six Months
Ended
March 31,
2015 (Unaudited) | | | Year Ended September 30, | |
| | | | 2014 | | | 2013 | | | 2012 | | | 2011 | | | 2010 | |
| Per Share Operating Performance | | | | | | | | | | | | | | | | | | | | | | | | |
Net asset value, beginning of period | | $ | 4.27 | | | $ | 7.86 | | | $ | 12.78 | | | $ | 9.53 | | | $ | 9.54 | | | $ | 8.93 | |
| | | | |
Net investment income1 | | | 0.01 | | | | 0.03 | | | | 0.10 | | | | 0.15 | | | | 0.08 | | | | 0.06 | |
Net realized and unrealized gain (loss) | | | 0.23 | | | | 1.04 | | | | 0.86 | | | | 3.19 | | | | (0.01 | ) | | | 0.61 | |
| | | | |
Net increase from investment operations | | | 0.24 | | | | 1.07 | | | | 0.96 | | | | 3.34 | | | | 0.07 | | | | 0.67 | |
| | | | |
Distributions from:2 | | | | | | | | | | | | | | | | | | | | | | | | |
Net investment income | | | (0.03 | ) | | | (0.02 | ) | | | (1.50 | ) | | | (0.09 | ) | | | (0.08 | ) | | | (0.06 | ) |
Net realized gains | | | (2.42 | ) | | | (4.64 | ) | | | (4.38 | ) | | | — | | | | — | | | | — | |
| | | | |
Total distributions | | | (2.45 | ) | | | (4.66 | ) | | | (5.88 | ) | | | (0.09 | ) | | | (0.08 | ) | | | (0.06 | ) |
| | | | |
Net asset value, end of period | | $ | 2.06 | | | $ | 4.27 | | | $ | 7.86 | | | $ | 12.78 | | | $ | 9.53 | | | $ | 9.54 | |
| | | | |
| | | | | | | | | | | | | | | | | | | | | | | | |
| Total Return3 | | | | | | | | | | | | | | | | | | | | | | | | |
Based on net asset value | | | 8.12 | %4 | | | 20.89 | % | | | 16.60 | % | | | 35.29 | % | | | 0.68 | % | | | 7.46 | % |
| | | | |
| | | | | | | | | | | | | | | | | | | | | | | | |
| Ratios to Average Net Assets5 | | | | | | | | | | | | | | | | | | | | | | | | |
Total expenses | | | 5.74 | %6,7 | | | 5.25 | %7 | | | 2.83 | %7 | | | 0.70 | %7 | | | 0.71 | %7 | | | 0.79 | % |
| | | | |
Total expenses after fees waived and/or reimbursed | | | 0.77 | %6,7 | | | 0.74 | %7 | | | 0.67 | %7 | | | 0.64 | %7 | | | 0.67 | %7 | | | 0.67 | % |
| | | | |
Net investment income | | | 0.58 | %6,7 | | | 0.69 | %7 | | | 1.23 | %7 | | | 1.35 | %7 | | | 0.77 | %7 | | | 0.62 | % |
| | | | |
| | | | | | | | | | | | | | | | | | | | | | | | |
| Supplemental Data | | | | | | | | | | | | | | | | | | | | | | | | |
Net assets, end of period (000) | | $ | 918 | | | $ | 1,050 | | | $ | 1,282 | | | $ | 2,243 | | | $ | 100,169 | | | $ | 86,662 | |
| | | | |
Portfolio turnover rate of the Portfolio | | | 20 | % | | | 49 | % | | | 54 | % | | | 132 | % | | | 169 | % | | | 232 | % |
| | | | |
| | 1 | | Based on average shares outstanding. |
| | 2 | | Distributions for annual periods determined in accordance with federal income tax regulations. |
| | 3 | | Where applicable, assumes the reinvestment of distributions. |
| | 4 | | Aggregate total return. |
| | 5 | | Includes the Fund’s share of the Portfolio’s allocated expenses and/or net investment income. |
| | 7 | | Includes the Fund’s share of the Portfolio’s allocated fees waived of less than 0.01%. |
See Notes to Financial Statements.
| | | | | | |
| 42 | | BLACKROCK LARGE CAP SERIES FUNDS, INC. | | MARCH 31, 2015 | | |
| | | | |
| Financial Highlights | | | BlackRock Large Cap Value Retirement Portfolio | |
| | | | | | | | | | | | | | | | | | | | | | | | |
| | | Class K | |
| | | Six Months
Ended
March 31,
2015 (Unaudited) | | | Year Ended September 30, | |
| | | | 2014 | | | 2013 | | | 2012 | | | 2011 | | | 2010 | |
| Per Share Operating Performance | | | | | | | | | | | | | | | | | | | | | | | | |
Net asset value, beginning of period | | $ | 21.39 | | | $ | 19.12 | | | $ | 15.93 | | | $ | 12.91 | | | $ | 13.67 | | | $ | 13.28 | |
| | | | |
Net investment income1 | | | 0.13 | | | | 0.25 | | | | 0.25 | | | | 0.24 | | | | 0.17 | | | | 0.17 | |
Net realized and unrealized gain (loss) | | | 0.78 | | | | 3.12 | | | | 3.30 | | | | 2.99 | | | | (0.76 | ) | | | 0.39 | |
| | | | |
Net increase (decrease) from investment operations | | | 0.91 | | | | 3.37 | | | | 3.55 | | | | 3.23 | | | | (0.59 | ) | | | 0.56 | |
| | | | |
Distributions from:2 | | | | | | | | | | | | | | | | | | | | | | | | |
Net investment income | | | (0.25 | ) | | | (0.14 | ) | | | (0.36 | ) | | | (0.21 | ) | | | (0.17 | ) | | | (0.17 | ) |
Net realized gain | | | (2.21 | ) | | | (0.96 | ) | | | — | | | | — | | | | — | | | | — | |
| | | | |
Total distributions | | | (2.46 | ) | | | (1.10 | ) | | | (0.36 | ) | | | (0.21 | ) | | | (0.17 | ) | | | (0.17 | ) |
| | | | |
Net asset value, end of period | | $ | 19.84 | | | $ | 21.39 | | | $ | 19.12 | | | $ | 15.93 | | | $ | 12.91 | | | $ | 13.67 | |
| | | | |
| | | | | | | | | | | | | | | | | | | | | | | | |
| Total Return3 | | | | | | | | | | | | | | | | | | | | | | | | |
Based on net asset value | | | 4.58 | %4 | | | 18.23 | % | | | 22.71 | % | | | 25.23 | % | | | (4.44 | )% | | | 4.23 | % |
| | | | |
| | | | | | | | | | | | | | | | | | | | | | | | |
| Ratios to Average Net Assets5 | | | | | | | | | | | | | | | | | | | | | | | | |
Total expenses | | | 0.69 | %6,7 | | | 0.68 | %7 | | | 0.68 | %7 | | | 0.67 | % | | | 0.70 | % | | | 0.72 | % |
| | | | |
Total expenses after reimbursement | | | 0.67 | %6,7 | | | 0.67 | %7 | | | 0.67 | %7 | | | 0.62 | % | | | 0.67 | % | | | 0.67 | % |
| | | | |
Net investment income | | | 1.24 | %6,7 | | | 1.24 | %7 | | | 1.42 | %7 | | | 1.63 | % | | | 1.13 | % | | | 1.21 | % |
| | | | |
| | | | | | | | | | | | | | | | | | | | | | | | |
| Supplemental Data | | | | | | | | | | | | | | | | | | | | | | | | |
Net assets, end of period (000) | | $ | 169,391 | | | $ | 159,865 | | | $ | 133,921 | | | $ | 103,636 | | | $ | 144,964 | | | $ | 166,883 | |
| | | | |
Portfolio turnover rate of the Portfolio | | | 16 | % | | | 32 | % | | | 40 | % | | | 147 | % | | | 156 | % | | | 183 | % |
| | | | |
| | 1 | | Based on average shares outstanding. |
| | 2 | | Distributions for annual periods determined in accordance with federal income tax regulations. |
| | 3 | | Where applicable, assumes the reinvestment of distributions. |
| | 4 | | Aggregate total return. |
| | 5 | | Includes the Fund’s share of the Portfolio’s allocated expenses and/or net investment income. |
| | 7 | | Includes the Fund’s share of the Portfolio’s allocated fees waived of less than 0.01%. |
See Notes to Financial Statements.
| | | | | | |
| | | BLACKROCK LARGE CAP SERIES FUNDS, INC. | | MARCH 31, 2015 | | 43 |
| | | | |
| Notes to Financial Statements (Unaudited) | | | BlackRock Large Cap Series Funds, Inc. | |
1. Organization:
BlackRock Large Cap Series Funds, Inc. (the “Corporation”) is registered under the Investment Company Act of 1940, as amended (the “1940 Act”), as an open-end management investment company. The Corporation is organized as a Maryland corporation. The following are herein collectively referred to as the “Feeder Funds” or individually, a “Feeder Fund”:
| | | | |
| Fund Name | | Herein Referred To As | | Diversification Classification |
BlackRock Large Cap Core Fund | | Large Cap Core | | Diversified |
BlackRock Large Cap Growth Fund | | Large Cap Growth | | Diversified |
BlackRock Large Cap Value Fund | | Large Cap Value | | Diversified |
BlackRock Large Cap Core Retirement Portfolio | | Large Cap Core Retirement | | Diversified |
BlackRock Large Cap Growth Retirement Portfolio | | Large Cap Growth Retirement | | Diversified |
BlackRock Large Cap Value Retirement Portfolio | | Large Cap Value Retirement | | Diversified |
The Feeder Funds seek to achieve their investment objectives by investing all of their assets in the corresponding master portfolios (individually, a “Portfolio” or collectively, the “Portfolios”) of Master Large Cap Series LLC (the “Master LLC”), an affiliate of the Feeder Funds. Large Cap Core and Large Cap Core Retirement invest all of their assets in Master Large Cap Core Portfolio. Large Cap Growth and Large Cap Growth Retirement invest all of their assets in Master Large Cap Growth Portfolio. Large Cap Value and Large Cap Value Retirement invest all of their assets in Master Large Cap Value Portfolio. Each Portfolio has the same investment objective and strategies as the corresponding Feeder Fund. The value of a Feeder Fund’s investment in the applicable Portfolio reflects the Feeder Fund’s proportionate interest in the net assets of such Portfolio. The performance of a Feeder Fund is directly affected by the performance of the applicable Portfolio. At March 31, 2015, the percentages of Master Large Cap Core Portfolio owned by Large Cap Core and Large Cap Core Retirement were 74.8% and 0.1%, respectively, the percentages of Master Large Cap Growth Portfolio owned by Large Cap Growth and Large Cap Growth Retirement were 95.5% and 0.1%, respectively, and the percentages of Master Large Cap Value Portfolio owned by Large Cap Value and Large Cap Value Retirement were 82.2% and 17.8%, respectively. As such, the financial statements of the Portfolios, including the Schedules of Investments, are included elsewhere in this report and should be read in conjunction with the Feeder Funds’ financial statements.
Large Cap Core, Large Cap Growth and Large Cap Value each offer multiple classes of shares. Institutional and Service Shares are sold only to certain eligible investors. Class R Shares are sold only to certain employer-sponsored retirement plans. Large Cap Core Retirement, Large Cap Growth Retirement and Large Cap Value Retirement each offer Class K Shares. Class K Shares are only available to certain eligible investors. All classes of shares have identical voting, dividend, liquidation and other rights and the same terms and conditions. Service, Investor A, Investor B, Investor C and Class R Shares bear certain expenses related to shareholder servicing of such shares, and Investor B, Investor C and Class R Shares also bear certain expenses related to the distribution of such shares. Investor B Shares are only available through exchanges and dividend reinvestments by existing shareholders and for purchase by certain employer-sponsored retirement plans. Each class has exclusive voting rights with respect to matters relating to its shareholder servicing and distribution expenditures (except that Investor B shareholders may vote on material changes to the Investor A distribution plan). For distribution and service fee breakdown see Note 3.
| | | | | | |
| Share Class | | Initial Sales Charge | | CDSC | | Conversion Privilege |
Institutional, Service and Class R Shares | | No | | No | | None |
Investor A Shares | | Yes | | No1 | | None |
Investor B Shares | | No | | Yes | | To Investor A Shares after approximately 8 years |
Investor C Shares | | No | | Yes | | None |
Class K Shares | | No | | No | | None |
| | 1 | | Investor A Shares may be subject to a CDSC where no initial sales charge was paid at the time of purchase. |
2. Significant Accounting Policies:
The Feeder Funds’ financial statements are prepared in conformity with accounting principles generally accepted in the United States of America (“U.S. GAAP”), which may require management to make estimates and assumptions that affect the reported amounts of assets and liabilities in the financial statements and the reported amounts of increases and decreases in net assets from operations during the reported period. Actual results could differ from those estimates. Each Feeder Fund is considered an investment company under U.S. GAAP and follows the accounting and reporting guidance applicable to investment companies. The following is a summary of significant accounting policies followed by the Feeder Funds:
Valuation: Each Feeder Fund’s policy is to fair value its financial instruments at market value. Each Feeder Fund records its investments in the corresponding Portfolio at fair value based on the Feeder Fund’s proportionate interest in the net assets of the Portfolio. Valuation of securities held by a Portfolio is discussed in Note 2 of the Master LLC’s Notes to Financial Statements, which are included elsewhere in this report.
Investment Transactions and Investment Income: For financial reporting purposes, contributions to and withdrawals from the corresponding Portfolio are accounted for on a trade date basis. The Feeder Funds record daily their proportionate share of the corresponding Portfolio’s income, expenses and realized and unrealized gains and losses. In addition, each Feeder Fund accrues its own expenses. Income, expenses and realized and unrealized gains and losses are allocated daily to each class based on its relative net assets.
| | | | | | |
| 44 | | BLACKROCK LARGE CAP SERIES FUNDS, INC. | | MARCH 31, 2015 | | |
| | | | |
| Notes to Financial Statements (continued) | | | BlackRock Large Cap Series Funds, Inc. | |
Distributions: Distributions paid by the Feeder Funds are recorded on the ex-dividend date. Portions of return of capital distributions under U.S. GAAP may be taxed at ordinary income rates. The character of distributions is determined in accordance with federal income tax regulations, which may differ from U.S. GAAP. The portion of distributions that exceeds a Feeder Fund’s current and accumulated earnings and profits, which are measured on a tax basis, will constitute a non-taxable return of capital. Realized net capital gains can be offset by capital losses carried forward from prior years. However, certain Feeder Funds have capital loss carryforwards from pre-2012 tax years that offset realized net capital gains but do not offset current and accumulated earnings and profits. Consequently, if distributions in any tax year are less than the Feeder Fund’s current earnings and profits but greater than net investment income and net realized capital gains (taxable income), distributions in excess of taxable income are not treated as non-taxable return of capital, but rather may be taxable to shareholders at ordinary income rates. Under certain circumstances, taxable excess distributions could be significant.
Other: Expenses directly related to a Feeder Fund or its classes are charged to that Feeder Fund or the applicable class. Other operating expenses shared by several funds are prorated among those funds on the basis of relative net assets or other appropriate methods. Expenses directly related to a Feeder Fund and other shared expenses prorated to a Feeder Fund are allocated daily to each class based on its relative net assets or other appropriate methods.
3. Administration Agreement and Other Transactions with Affiliates:
The PNC Financial Services Group, Inc. is the largest stockholder and an affiliate of BlackRock, Inc. for 1940 Act purposes.
The Corporation, on behalf of the Feeder Funds, entered into an Administration Agreement with BlackRock Advisors, LLC (the “Administrator”), an indirect, wholly owned subsidiary of BlackRock, to provide administrative services (other than investment advice and related portfolio activities). For such services, Large Cap Core, Large Cap Growth and Large Cap Value each pay the Administrator a monthly fee at an annual rate of 0.25% of the average daily value of such Feeder Fund’s net assets. The Feeder Funds do not pay an investment advisory fee or investment management fee. With respect to Large Cap Core Retirement, Large Cap Growth Retirement and Large Cap Value Retirement, the Administrator does not receive an administration fee.
With respect to Large Cap Core, Large Cap Core Retirement, Large Cap Growth Retirement and Large Cap Value Retirement, the Administrator contractually agreed to waive and/or reimburse fees or expenses in order to limit expenses, excluding interest expense, dividend expense, tax expense, acquired fund fees and expenses and certain other fund expenses, which constitute extraordinary expenses not incurred in the ordinary course of the Feeder Fund’s business. The expense limitations as a percentage of average daily net assets are as follows:
| | | | | | | | | | | | |
| | | Investor A | | | Investor B | | | Class K | |
Large Cap Core | | | 1.14 | % | | | 1.97 | % | | | — | |
Large Cap Core Retirement | | | — | | | | — | | | | 0.67 | % |
Large Cap Growth Retirement | | | — | | | | — | | | | 0.67 | % |
Large Cap Value Retirement | | | — | | | | — | | | | 0.67 | % |
The Administrator has agreed not to reduce or discontinue this contractual waiver or reimbursement prior to February 1, 2016, unless approved by the Board of Directors of the Corporation (the “Board”), including a majority of the independent directors. These amounts waived and/or reimbursed, if any, are shown as fees waived and/or reimbursed by administrator and transfer agent fees reimbursed — class specific, respectively, in the Statements of Operations.
With respect to Large Cap Value, the Administrator voluntarily agreed to waive 0.05%, as a percentage of average daily net assets, of the administration fee payable. This voluntary waiver may be reduced or discontinued at any time without notice. This amount waived, if any, is shown as fees waived and/or reimbursed by administrator, in the Statements of Operations.
The Corporation, on behalf of Large Cap Core, Large Cap Growth and Large Cap Value, entered into a Distribution Agreement and Distribution Plans with BlackRock Investments, LLC (“BRIL”), an affiliate of the Administrator. Pursuant to the Distribution Plans and in accordance with Rule 12b-1 under the 1940 Act, each Feeder Fund pays BRIL ongoing service and distribution fees. The fees are accrued daily and paid monthly at annual rates based upon the average daily net assets of the shares of each Feeder Fund as follows:
| | | | | | | | | | | | | | | | | | | | |
| | | Service | | | Investor A | | | Investor B | | | Investor C | | | Class R | |
Service Fee | | | 0.25 | % | | | 0.25 | % | | | 0.25 | % | | | 0.25 | % | | | 0.25 | % |
Distribution Fee | | | — | | | | — | | | | 0.75 | % | | | 0.75 | % | | | 0.25 | % |
Pursuant to sub-agreements with BRIL, broker-dealers and BRIL provide shareholder servicing and distribution services to each of Large Cap Core, Large Cap Growth and Large Cap Value. The ongoing service and/or distribution fee compensates BRIL and each broker-dealer for providing shareholder servicing and/or distribution related services to Service, Investor A, Investor B, Investor C and Class R shareholders.
Pursuant to written agreements, certain financial intermediaries, some of which may be affiliates, provide the Feeder Funds with sub-accounting, recordkeeping, sub-transfer agency and other administrative services with respect to sub-accounts they service. For these services, these entities
| | | | | | |
| | | BLACKROCK LARGE CAP SERIES FUNDS, INC. | | MARCH 31, 2015 | | 45 |
| | | | |
| Notes to Financial Statements (continued) | | | BlackRock Large Cap Series Funds, Inc. | |
receive an asset-based fee or annual fee per shareholder account, which will vary depending on share class and/or net assets. For the six months ended March 31, 2015, the Feeder Funds paid the following amounts to affiliates of BlackRock in return for these services, which are included in transfer agent — class specific in the Statements of Operations:
| | | | | | | | | | | | | | | | |
| | | Institutional | | | Service | | | Investor A | | | Investor C | |
Large Cap Core | | $ | 36,436 | | | $ | 892 | | | $ | 56 | | | | — | |
Large Cap Growth | | $ | 197,850 | | | $ | 196 | | | $ | 1,124 | | | | — | |
Large Cap Value | | $ | 3,454 | | | $ | 600 | | | $ | 2,463 | | | $ | 51 | |
The Administrator maintains a call center, which is responsible for providing certain shareholder services to the Feeder Funds, such as responding to shareholder inquiries and processing transactions based upon instructions from shareholders with respect to the subscription and redemption of Feeder Fund shares. For the six months ended March 31, 2015, the Feeder Funds reimbursed the Administrator the following amounts for costs incurred in running the call center, which are included in transfer agent — class specific in the Statements of Operations:
| | | | | | | | | | | | | | | | | | | | | | | | | | | | |
| | | Institutional | | | Service | | | Investor A | | | Investor B | | | Investor C | | | Class R | | | Class K | |
Large Cap Core | | $ | 16,031 | | | $ | 7 | | | $ | 121,248 | | | $ | 7,527 | | | $ | 3,048 | | | $ | 68 | | | | — | |
Large Cap Growth | | $ | 723 | | | $ | 327 | | | $ | 4,440 | | | $ | 219 | | | $ | 1,205 | | | $ | 41 | | | | — | |
Large Cap Value | | $ | 619 | | | $ | 2,190 | | | $ | 15,237 | | | $ | 725 | | | $ | 998 | | | $ | 70 | | | | — | |
Large Cap Core Retirement | | | — | | | | — | | | | — | | | | — | | | | — | | | | — | | | $ | 2 | |
Large Cap Growth Retirement | | | — | | | | — | | | | — | | | | — | | | | — | | | | — | | | $ | 3 | |
Large Cap Value Retirement | | | — | | | | — | | | | — | | | | — | | | | — | | | | — | | | $ | 166 | |
For the six months ended March 31, 2015, affiliates earned underwriting discounts, direct commissions and dealer concessions on sales of the Feeder Funds’ Investor A Shares as follows:
| | | | | | | | | | | | |
| | | Large Cap Core | | | Large Cap Growth | | | Large Cap Value | |
Investor A | | $ | 25,179 | | | $ | 50,049 | | | $ | 7,054 | |
For the six months ended March 31, 2015, affiliates received the following CDSCs as follows:
| | | | | | | | | | | | |
| | | Investor A | | | Investor B | | | Investor C | |
Large Cap Core | | $ | 818 | | | $ | 1,919 | | | $ | 9,651 | |
Large Cap Growth | | $ | 2,221 | | | $ | 3 | | | $ | 7,900 | |
Large Cap Value | | $ | 65 | | | $ | 1,463 | | | $ | 1,064 | |
Certain officers and/or directors of the Corporation are officers and/or directors of BlackRock or its affiliates. The Feeder Funds reimburse the Administrator for a portion of the compensation paid to the Corporation’s Chief Compliance Officer, which is included in Officer in the Statements of Operations.
4. Income Tax Information:
It is each Feeder Fund’s policy to comply with the requirements of the Internal Revenue Code of 1986, as amended, applicable to regulated investment companies, and to distribute substantially all of its taxable income to its shareholders. Therefore, no federal income tax provision is required.
Each Feeder Fund files U.S. federal and various state and local tax returns. No income tax returns are currently under examination. The statute of limitations on each Feeder Fund’s U.S. federal tax returns remains open for each of the four years ended September 30, 2014. The statutes of limitations on each Feeder Fund’s state and local tax returns may remain open for an additional year depending upon the jurisdiction.
Management has analyzed tax laws and regulations and their application to the Feeder Funds as of March 31, 2015, inclusive of open tax years, and does not believe that there are any uncertain tax positions that require recognition of a tax liability in the Feeder Funds’ financial statements.
As of March 31, 2015, the Feeder Funds listed below had capital loss carryforwards available to offset future realized capital gains through the indicated expiration dates as follows:
| | | | | | | | |
| Expires September 30, | | Large Cap Core | | | Large Cap Value | |
2017 | | $ | 65,226,901 | | | $ | 608,349,945 | |
| | | | | | |
| 46 | | BLACKROCK LARGE CAP SERIES FUNDS, INC. | | MARCH 31, 2015 | | |
| | | | |
| Notes to Financial Statements (continued) | | | BlackRock Large Cap Series Funds, Inc. | |
5. Capital Share Transactions:
Transactions in capital shares for each class were as follows:
| | | | | | | | | | | | | | | | | | |
| | | Six Months Ended
March 31, 2015 | | | | | Year Ended
September 30, 2014 | |
| Large Cap Core | | Shares | | | Amount | | | | | Shares | | | Amount | |
Institutional | | | | | | | | | | | | | | | | | | |
Shares sold | | | 1,280,477 | | | $ | 23,247,290 | | | | | | 2,992,748 | | | $ | 50,275,810 | |
Shares issued in reinvestment of distributions | | | 126,388 | | | | 2,258,546 | | | | | | — | | | | — | |
Shares redeemed | | | (3,928,533 | ) | | | (71,129,842 | ) | | | | | (10,055,531 | ) | | | (163,938,490 | ) |
| | | | | | | | | | |
Net decrease | | | (2,521,668 | ) | | $ | (45,624,006 | ) | | | | | (7,062,783 | ) | | $ | (113,662,680 | ) |
| | | | | | | | | | |
| | | | | | | | | | | | | | | | | | |
Service | | | | | | | | | | | | | | | | | | |
Shares sold | | | 1,975 | | | $ | 36,086 | | | | | | 5,466 | | | $ | 88,821 | |
Shares issued in reinvestment of distributions | | | 175 | | | | 3,095 | | | | | | — | | | | — | |
Shares redeemed | | | (2,276 | ) | | | (42,343 | ) | | | | | (8,485 | ) | | | (138,522 | ) |
| | | | | | | | | | |
Net decrease | | | (126 | ) | | $ | (3,162 | ) | | | | | (3,019 | ) | | $ | (49,701 | ) |
| | | | | | | | | | |
| | | | | | | | | | | | | | | | | | |
Investor A | | | | | | | | | | | | | | | | | | |
Shares sold and automatic conversion of shares | | | 3,099,348 | | | $ | 55,018,037 | | | | | | 4,704,178 | | | $ | 76,734,749 | |
Shares issued in reinvestment of distributions | | | 142,959 | | | | 2,496,056 | | | | | | — | | | | — | |
Shares redeemed | | | (4,029,460 | ) | | | (71,282,114 | ) | | | | | (8,146,523 | ) | | | (133,412,611 | ) |
| | | | | | | | | | |
Net decrease | | | (787,153 | ) | | $ | (13,768,021 | ) | | | | | (3,442,345 | ) | | $ | (56,677,862 | ) |
| | | | | | | | | | |
| | | | | | | | | | | | | | | | | | |
Investor B | | | | | | | | | | | | | | | | | | |
Shares sold | | | 12,716 | | | $ | 213,754 | | | | | | 27,288 | | | $ | 402,852 | |
Shares redeemed and automatic conversion of shares | | | (242,248 | ) | | | (3,931,692 | ) | | | | | (803,615 | ) | | | (12,017,540 | ) |
| | | | | | | | | | |
Net decrease | | | (229,532 | ) | | $ | (3,717,938 | ) | | | | | (776,327 | ) | | $ | (11,614,688 | ) |
| | | | | | | | | | |
| | | | | | | | | | | | | | | | | | |
Investor C | | | | | | | | | | | | | | | | | | |
Shares sold | | | 2,408,195 | | | $ | 38,945,593 | | | | | | 3,141,253 | | | $ | 46,778,889 | |
Shares issued in reinvestment of distributions | | | — | | | | 10 | | | | | | — | | | | — | |
Shares redeemed | | | (3,051,264 | ) | | | (49,172,244 | ) | | | | | (5,745,578 | ) | | | (85,612,256 | ) |
| | | | | | | | | | |
Net decrease | | | (643,069 | ) | | $ | (10,226,641 | ) | | | | | (2,604,325 | ) | | $ | (38,833,367 | ) |
| | | | | | | | | | |
| | | | | | | | | | | | | | | | | | |
Class R | | | | | | | | | | | | | | | | | | |
Shares sold | | | 314,043 | | | $ | 5,309,236 | | | | | | 791,125 | | | $ | 12,269,917 | |
Shares redeemed | | | (585,172 | ) | | | (9,876,672 | ) | | | | | (1,370,168 | ) | | | (21,477,839 | ) |
| | | | | | | | | | |
Net decrease | | | (271,129 | ) | | $ | (4,567,436 | ) | | | | | (579,043 | ) | | $ | (9,207,922 | ) |
| | | | | | | | | | |
| | | | | | | | | | | | | | | | | | |
Total Net Decrease | | | (4,452,677 | ) | | $ | (77,907,204 | ) | | | | | (14,467,842 | ) | | $ | (230,046,220 | ) |
| | | | | | | | | | |
| | | | | | |
| | | BLACKROCK LARGE CAP SERIES FUNDS, INC. | | MARCH 31, 2015 | | 47 |
| | | | |
| Notes to Financial Statements (continued) | | | BlackRock Large Cap Series Funds, Inc. | |
| | | | | | | | | | | | | | | | | | |
| | | Six Months Ended
March 31, 2015 | | | | | Year Ended
September 30, 2014 | |
| Large Cap Growth | | Shares | | | Amount | | | | | Shares | | | Amount | |
Institutional | | | | | | | | | | | | | | | | | | |
Shares sold | | | 2,840,714 | | | $ | 41,011,406 | | | | | | 15,401,823 | | | $ | 221,443,838 | |
Shares issued in reinvestment of distributions | | | 2,755,379 | | | | 37,803,785 | | | | | | 1,743,155 | | | | 23,271,108 | |
Shares redeemed | | | (2,139,970 | ) | | | (30,609,704 | ) | | | | | (15,879,273 | ) | | | (231,480,900 | ) |
| | | | | | | | | | |
Net increase | | | 3,456,123 | | | $ | 48,205,487 | | | | | | 1,265,705 | | | $ | 13,234,046 | |
| | | | | | | | | | |
| | | | | | | | | | | | | | | | | | |
Service | | | | | | | | | | | | | | | | | | |
Shares sold | | | 3,592 | | | $ | 51,187 | | | | | | 11,640 | | | $ | 164,379 | |
Shares issued in reinvestment of distributions | | | 16,280 | | | | 222,707 | | | | | | 7,698 | | | | 102,610 | |
Shares redeemed | | | (23,925 | ) | | | (339,772 | ) | | | | | (14,762 | ) | | | (207,668 | ) |
| | | | | | | | | | |
Net increase (decrease) | | | (4,053 | ) | | $ | (65,878 | ) | | | | | 4,576 | | | $ | 59,321 | |
| | | | | | | | | | |
| | | | | | | | | | | | | | | | | | |
Investor A | | | | | | | | | | | | | | | | | | |
Shares sold and automatic conversion of shares | | | 4,840,969 | | | $ | 67,464,955 | | | | | | 9,572,445 | | | $ | 132,608,831 | |
Shares issued in reinvestment of distributions | | | 4,716,368 | | | | 61,925,853 | | | | | | 2,420,903 | | | | 31,108,416 | |
Shares redeemed | | | (3,725,947 | ) | | | (51,827,245 | ) | | | | | (11,088,685 | ) | | | (153,190,010 | ) |
| | | | | | | | | | |
Net increase | | | 5,831,390 | | | $ | 77,563,563 | | | | | | 904,663 | | | $ | 10,527,237 | |
| | | | | | | | | | |
| | | | | | | | | | | | | | | | | | |
Investor B | | | | | | | | | | | | | | | | | | |
Shares sold | | | 18,401 | | | $ | 223,435 | | | | | | 30,332 | | | $ | 371,358 | |
Shares issued in reinvestment of distributions | | | 28,425 | | | | 331,709 | | | | | | 25,280 | | | | 293,253 | |
Shares redeemed and automatic conversion of shares | | | (55,321 | ) | | | (680,005 | ) | | | | | (244,247 | ) | | | (2,992,861 | ) |
| | | | | | | | | | |
Net decrease | | | (8,495 | ) | | $ | (124,861 | ) | | | | | (188,635 | ) | | $ | (2,328,250 | ) |
| | | | | | | | | | |
| | | | | | | | | | | | | | | | | | |
Investor C | | | | | | | | | | | | | | | | | | |
Shares sold | | | 2,483,901 | | | $ | 30,449,856 | | | | | | 2,593,102 | | | $ | 31,840,431 | |
Shares issued in reinvestment of distributions | | | 2,119,680 | | | | 24,482,215 | | | | | | 1,052,182 | | | | 12,120,921 | |
Shares redeemed | | | (1,931,048 | ) | | | (23,613,466 | ) | | | | | (3,457,989 | ) | | | (42,472,402 | ) |
| | | | | | | | | | |
Net increase | | | 2,672,533 | | | $ | 31,318,605 | | | | | | 187,295 | | | $ | 1,488,950 | |
| | | | | | | | | | |
| | | | | | | | | | | | | | | | | | |
Class R | | | | | | | | | | | | | | | | | | |
Shares sold | | | 242,478 | | | $ | 3,212,844 | | | | | | 453,933 | | | $ | 5,928,279 | |
Shares issued in reinvestment of distributions | | | 236,435 | | | | 2,941,251 | | | | | | 140,833 | | | | 1,726,614 | |
Shares redeemed | | | (366,831 | ) | | | (4,840,715 | ) | | | | | (890,948 | ) | | | (11,685,231 | ) |
| | | | | | | | | | |
Net increase (decrease) | | | 112,082 | | | $ | 1,313,380 | | | | | | (296,182 | ) | | $ | (4,030,338 | ) |
| | | | | | | | | | |
| | | | | | | | | | | | | | | | | | |
Total Net Increase | | | 12,059,580 | | | $ | 158,210,296 | | | | | | 1,877,422 | | | $ | 18,950,966 | |
| | | | | | | | | | |
| | | | | | | | | | |
Large Cap Value | | | | | | | | | | | | | | | | | | |
Institutional | | | | | | | | | | | | | | | | | | |
Shares sold | | | 806,698 | | | $ | 18,446,946 | | | | | | 3,702,495 | | | $ | 76,363,878 | |
Shares issued in reinvestment of distributions | | | 67,082 | | | | 1,503,310 | | | | | | — | | | | — | |
Shares redeemed | | | (1,137,460 | ) | | | (25,875,954 | ) | | | | | (5,504,497 | ) | | | (116,732,133 | ) |
| | | | | | | | | | |
Net decrease | | | (263,680 | ) | | $ | (5,925,698 | ) | | | | | (1,802,002 | ) | | $ | (40,368,255 | ) |
| | | | | | | | | | |
| | | | | | | | | | | | | | | | | | |
Service | | | | | | | | | | | | | | | | | | |
Shares sold | | | 877 | | | $ | 19,870 | | | | | | 9,071 | | | $ | 188,605 | |
Shares issued in reinvestment of distributions | | | 4,792 | | | | 106,764 | | | | | | — | | | | — | |
Shares redeemed | | | (73,766 | ) | | | (1,676,807 | ) | | | | | (76,704 | ) | | | (1,624,610 | ) |
| | | | | | | | | | |
Net decrease | | | (68,097 | ) | | $ | (1,550,173 | ) | | | | | (67,633 | ) | | $ | (1,436,005 | ) |
| | | | | | | | | | |
| | | | | | |
| 48 | | BLACKROCK LARGE CAP SERIES FUNDS, INC. | | MARCH 31, 2015 | | |
| | | | |
| Notes to Financial Statements (continued) | | | BlackRock Large Cap Series Funds, Inc. | |
| | | | | | | | | | | | | | | | | | |
| | | Six Months Ended
March 31, 2015 | | | | | Year Ended
September 30, 2014 | |
| Large Cap Value (concluded) | | Shares | | | Amount | | | | | Shares | | | Amount | |
Investor A | | | | | | | | | | | | | | | | | | |
Shares sold and automatic conversion of shares | | | 1,168,872 | | | $ | 26,005,406 | | | | | | 1,940,793 | | | $ | 39,757,324 | |
Shares issued in reinvestment of distributions | | | 113,425 | | | | 2,496,477 | | | | | | — | | | | — | |
Shares redeemed | | | (2,586,776 | ) | | | (57,590,247 | ) | | | | | (4,858,918 | ) | | | (100,797,699 | ) |
| | | | | | | | | | |
Net decrease | | | (1,304,479 | ) | | $ | (29,088,364 | ) | | | | | (2,918,125 | ) | | $ | (61,040,375 | ) |
| | | | | | | | | | |
| | | | | | | | | | | | | | | | | | |
Investor B | | | | | | | | | | | | | | | | | | |
Shares sold | | | 4,070 | | | $ | 84,581 | | | | | | 9,979 | | | $ | 194,158 | |
Shares redeemed and automatic conversion of shares | | | (120,471 | ) | | | (2,505,778 | ) | | | | | (212,952 | ) | | | (4,103,470 | ) |
| | | | | | | | | | |
Net decrease | | | (116,401 | ) | | $ | (2,421,197 | ) | | | | | (202,973 | ) | | $ | (3,909,312 | ) |
| | | | | | | | | | |
| | | | | | | | | | | | | | | | | | |
Investor C | | | | | | | | | | | | | | | | | | |
Shares sold | | | 719,647 | | | $ | 14,942,484 | | | | | | 1,026,622 | | | $ | 19,671,192 | |
Shares issued in reinvestment of distributions | | | 6,485 | | | | 132,965 | | | | | | — | | | | — | |
Shares redeemed | | | (1,260,564 | ) | | | (26,070,681 | ) | | | | | (2,742,275 | ) | | | (52,631,364 | ) |
| | | | | | | | | | |
Net decrease | | | (534,432 | ) | | $ | (10,995,232 | ) | | | | | (1,715,653 | ) | | $ | (32,960,172 | ) |
| | | | | | | | | | |
| | | | | | | | | | | | | | | | | | |
Class R | | | | | | | | | | | | | | | | | | |
Shares sold | | | 226,534 | | | $ | 4,872,267 | | | | | | 477,835 | | | $ | 9,394,712 | |
Shares issued in reinvestment of distributions | | | 10,143 | | | | 215,130 | | | | | | — | | | | — | |
Shares redeemed | | | (454,933 | ) | | | (9,827,233 | ) | | | | | (1,166,589 | ) | | | (23,118,089 | ) |
| | | | | | | | | | |
Net decrease | | | (218,256 | ) | | $ | (4,739,836 | ) | | | | | (688,754 | ) | | $ | (13,723,377 | ) |
| | | | | | | | | | |
| | | | | | | | | | |
Total Net Decrease | | | (2,505,345 | ) | | $ | (54,720,500 | ) | | | | | (7,395,140 | ) | | $ | (153,437,496 | ) |
| | | | | | | | | | |
| | | | | | | | | | | | | | | | | | |
Large Cap Core Retirement | | | | | | | | | | | | | | | | | | |
Class K | | | | | | | | | | | | | | | | | | |
Shares sold | | | 399,421 | | | $ | 6,046,891 | | | | | | 76,133 | | | $ | 1,164,751 | |
Shares issued in reinvestment of distributions | | | 147,593 | | | | 873,764 | | | | | | 1,215 | | | | 18,529 | |
Shares redeemed | | | (352,319 | ) | | | (2,107,371 | ) | | | | | (4,762,052 | ) | | | (73,080,223 | ) |
| | | | | | | | | | |
Net increase (decrease) | | | 194,695 | | | $ | 4,813,284 | | | | | | (4,684,704 | ) | | $ | (71,896,943 | ) |
| | | | | | | | | | |
| | | | | | | | | | | | | | | | | | |
Large Cap Growth Retirement | | | | | | | | | | | | | | | | | | |
Class K | | | | | | | | | | | | | | | | | | |
Shares sold | | | 13,271 | | | $ | 30,893 | | | | | | 18,042 | | | $ | 75,663 | |
Shares issued in reinvestment of distributions | | | 214,170 | | | | 421,914 | | | | | | 77,582 | | | | 294,812 | |
Shares redeemed | | | (27,891 | ) | | | (61,356 | ) | | | | | (12,552 | ) | | | (67,925 | ) |
| | | | | | | | | | |
Net increase | | | 199,550 | | | $ | 391,451 | | | | | | 83,072 | | | $ | 302,550 | |
| | | | | | | | | | |
| | | | | | | | | | | | | | | | | | |
Large Cap Value Retirement | | | | | | | | | | | | | | | | | | |
Class K | | | | | | | | | | | | | | | | | | |
Shares sold | | | 795,477 | | | $ | 16,212,229 | | | | | | 1,408,252 | | | $ | 28,657,042 | |
Shares issued in reinvestment of distributions | | | 953,992 | | | | 18,431,120 | | | | | | 411,612 | | | | 7,931,773 | |
Shares redeemed | | | (685,117 | ) | | | (13,967,032 | ) | | | | | (1,350,778 | ) | | | (27,749,942 | ) |
| | | | | | | | | | |
Net increase | | | 1,064,352 | | | $ | 20,676,317 | | | | | | 469,086 | | | $ | 8,838,873 | |
| | | | | | | | | | |
| | | | | | |
| | | BLACKROCK LARGE CAP SERIES FUNDS, INC. | | MARCH 31, 2015 | | 49 |
| | | | |
| Notes to Financial Statements (concluded) | | | BlackRock Large Cap Series Funds, Inc. | |
6. Subsequent Events:
Management’s evaluation of the impact of all subsequent events on the Funds’ financial statements was completed through the date the financial statements were issued and the following items were noted:
On May 19, 2015, the Board approved a proposal to close Large Cap Core Retirement and Large Cap Growth Retirement to new investors and thereafter to liquidate the Funds. Effective on or about June 25, 2015, each Fund will no longer accept purchase orders from new investors. On or about August 24, 2015 (the “Liquidation Date”), all of the assets of the Funds will be liquidated completely, the shares of any shareholders holding shares on the Liquidation Date will be redeemed at the net asset value per share and each Fund will then be terminated.
Additionally, Large Cap Core Retirement and Large Cap Growth Retirement paid a distribution on May 4, 2015 to shareholders of record on April 30, 2015 as follows:
| | | | |
| | | Dividend Per Share
Declared | |
Large Cap Core Retirement | | $ | 5.048937 | |
Large Cap Growth Retirement | | | 2.018772 | |
| | | | | | |
| 50 | | BLACKROCK LARGE CAP SERIES FUNDS, INC. | | MARCH 31, 2015 | | |
| | | | |
| Portfolio Information as of March 31, 2015 (Unaudited) | | | Master Large Cap Series LLC | |
| | |
| Master Large Cap Core Portfolio | | Percent of Long-Term Investments |
| | | | |
CVS Health Corp. | | | 3 | % |
JPMorgan Chase & Co. | | | 3 | |
Comcast Corp., Class A | | | 3 | |
Lowe’s Cos., Inc. | | | 3 | |
3M Co. | | | 3 | |
U.S. Bancorp | | | 3 | |
Bank of America Corp. | | | 2 | |
American International Group, Inc. | | | 2 | |
Aetna, Inc. | | | 2 | |
Citigroup, Inc. | | | 2 | |
| | |
| Master Large Cap Growth Portfolio | | Percent of Long-Term Investments |
| | | | |
Apple Inc. | | | 5 | % |
Microsoft Corp. | | | 4 | |
Comcast Corp., Class A | | | 3 | |
Amgen, Inc. | | | 3 | |
CVS Health Corp. | | | 3 | |
3M Co. | | | 3 | |
Lowe’s Cos., Inc. | | | 3 | |
The Home Depot, Inc. | | | 3 | |
Facebook, Inc., Class A | | | 2 | |
Google, Inc., Class C | | | 2 | |
| | |
| Master Large Cap Value Portfolio | | Percent of Long-Term Investments |
| | | | |
CVS Health Corp. | | | 5 | % |
JPMorgan Chase & Co. | | | 4 | |
Bank of America Corp. | | | 4 | |
Citigroup, Inc. | | | 3 | |
U.S. Bancorp | | | 3 | |
American International Group, Inc. | | | 3 | |
Lowe’s Cos., Inc. | | | 3 | |
Exxon Mobil Corp. | | | 3 | |
Cisco Systems, Inc. | | | 3 | |
UnitedHealth Group, Inc. | | | 3 | |
| | |
| Master Large Cap Core Portfolio | | Percent of Long-Term Investments |
| | | | |
Information Technology | | | 24 | % |
Financials | | | 19 | |
Health Care | | | 19 | |
Consumer Discretionary | | | 12 | |
Industrials | | | 10 | |
Consumer Staples | | | 7 | |
Energy | | | 7 | |
Materials | | | 2 | |
| | |
| Master Large Cap Growth Portfolio | | Percent of Long-Term Investments |
| | | | |
Information Technology | | | 33 | % |
Consumer Discretionary | | | 17 | |
Health Care | | | 17 | |
Industrials | | | 12 | |
Consumer Staples | | | 7 | |
Financials | | | 6 | |
Energy | | | 5 | |
Materials | | | 3 | |
| | |
| Master Large Cap Value Portfolio | | Percent of Long-Term Investments |
| | | | |
Financials | | | 29 | % |
Health Care | | | 18 | |
Information Technology | | | 15 | |
Industrials | | | 11 | |
Energy | | | 9 | |
Consumer Discretionary | | | 8 | |
Consumer Staples | | | 7 | |
Materials | | | 2 | |
Utilities | | | 1 | |
For Portfolio compliance purposes, the Portfolios’ sector classifications refer to any one or more of the sector sub-classifications used by one or more widely recognized market indexes or ratings group indexes, and/or as defined by the investment advisor. These definitions may not apply for purposes of this report, which may combine sector sub-classifications for reporting ease.
| | | | | | |
| | | BLACKROCK LARGE CAP SERIES FUNDS, INC. | | MARCH 31, 2015 | | 51 |
| | | | |
| Schedule of Investments March 31, 2015 (Unaudited) | | | Master Large Cap Core Portfolio | |
| | | (Percentages shown are based on Net Assets) | |
| | | | | | | | |
| Common Stocks | | Shares | | | Value | |
Aerospace & Defense — 1.2% | | | | | | | | |
Honeywell International, Inc. | | | 34,400 | | | $ | 3,588,264 | |
Raytheon Co. | | | 225,920 | | | | 24,681,760 | |
| | | | | | | | |
| | | | | | | | 28,270,024 | |
Air Freight & Logistics — 1.1% | | | | | | | | |
FedEx Corp. | | | 161,600 | | | | 26,736,720 | |
Airlines — 1.7% | | | | | | | | |
Southwest Airlines Co. | | | 372,400 | | | | 16,497,320 | |
United Continental Holdings, Inc. (a) | | | 371,700 | | | | 24,996,825 | |
| | | | | | | | |
| | | | | | | | 41,494,145 | |
Auto Components — 0.5% | | | | | | | | |
Lear Corp. | | | 118,200 | | | | 13,098,924 | |
Banks — 11.8% | | | | | | | | |
Bank of America Corp. | | | 3,758,536 | | | | 57,843,869 | |
Citigroup, Inc. | | | 1,011,418 | | | | 52,108,255 | |
JPMorgan Chase & Co. | | | 1,112,024 | | | | 67,366,414 | |
SunTrust Banks, Inc. | | | 765,640 | | | | 31,460,148 | |
U.S. Bancorp | | | 1,347,625 | | | | 58,850,784 | |
Wells Fargo & Co. | | | 209,930 | | | | 11,420,192 | |
| | | | | | | | |
| | | | | | | | 279,049,662 | |
Beverages — 2.7% | | | | | | | | |
Dr Pepper Snapple Group, Inc. | | | 491,400 | | | | 38,565,072 | |
Molson Coors Brewing Co., Class B | | | 344,300 | | | | 25,633,135 | |
| | | | | | | | |
| | | | | | | | 64,198,207 | |
Biotechnology — 1.9% | | | | | | | | |
Amgen, Inc. | | | 280,200 | | | | 44,789,970 | |
Capital Markets — 1.1% | | | | | | | | |
The Goldman Sachs Group, Inc. | | | 136,480 | | | | 25,654,146 | |
Chemicals — 0.6% | | | | | | | | |
Cabot Corp. | | | 139,874 | | | | 6,294,330 | |
The Dow Chemical Co. | | | 165,500 | | | | 7,940,690 | |
| | | | | | | | |
| | | | | | | | 14,235,020 | |
Communications Equipment — 3.2% | | | | | | | | |
Brocade Communications Systems, Inc. | | | 1,684,342 | | | | 19,984,718 | |
Cisco Systems, Inc. | | | 1,408,720 | | | | 38,775,018 | |
QUALCOMM, Inc. | | | 255,690 | | | | 17,729,545 | |
| | | | | | | | |
| | | | | | | | 76,489,281 | |
Construction & Engineering — 0.7% | | | | | | | | |
AECOM (a) | | | 558,500 | | | | 17,212,970 | |
Consumer Finance — 2.5% | | | | | | | | |
Discover Financial Services | | | 687,770 | | | | 38,755,839 | |
SLM Corp. (a) | | | 2,106,040 | | | | 19,544,051 | |
| | | | | | | | |
| | | | | | | | 58,299,890 | |
Containers & Packaging — 0.7% | | | | | | | | |
Packaging Corp. of America | | | 218,413 | | | | 17,077,712 | |
| | | | | | | | |
| Common Stocks | | Shares | | | Value | |
Electronic Equipment, Instruments & Components — 0.6% | |
TE Connectivity Ltd. | | | 33,370 | | | $ | 2,389,959 | |
Zebra Technologies Corp., Class A (a) | | | 133,203 | | | | 12,083,510 | |
| | | | | | | | |
| | | | | | | | 14,473,469 | |
Energy Equipment & Services — 2.3% | | | | | | | | |
Atwood Oceanics, Inc. | | | 211,300 | | | | 5,939,643 | |
Halliburton Co. | | | 102,110 | | | | 4,480,587 | |
Schlumberger Ltd. | | | 443,320 | | | | 36,990,621 | |
Weatherford International PLC (a) | | | 593,890 | | | | 7,304,847 | |
| | | | | | | | |
| | | | | | | | 54,715,698 | |
Food & Staples Retailing — 4.1% | | | | | | | | |
CVS Health Corp. | | | 744,025 | | | | 76,790,820 | |
The Kroger Co. | | | 34,600 | | | | 2,652,436 | |
Wal-Mart Stores, Inc. | | | 218,040 | | | | 17,933,790 | |
| | | | | | | | |
| | | | | | | | 97,377,046 | |
Food Products — 0.4% | | | | | | | | |
Pilgrim’s Pride Corp. (b) | | | 158,300 | | | | 3,575,997 | |
Tyson Foods, Inc., Class A | | | 170,000 | | | | 6,511,000 | |
| | | | | | | | |
| | | | | | | | 10,086,997 | |
Health Care Equipment & Supplies — 0.1% | | | | | | | | |
Medtronic PLC | | | 32,140 | | | | 2,506,599 | |
Health Care Providers & Services — 11.7% | | | | | | | | |
Aetna, Inc. | | | 498,100 | | | | 53,062,593 | |
Centene Corp. (a) | | | 419,600 | | | | 29,661,524 | |
Cigna Corp. | | | 284,100 | | | | 36,773,904 | |
Express Scripts Holding Co. (a) | | | 82,500 | | | | 7,158,525 | |
Humana, Inc. | | | 112,800 | | | | 20,080,656 | |
Laboratory Corp. of America Holdings (a) | | | 214,040 | | | | 26,988,304 | |
McKesson Corp. | | | 142,525 | | | | 32,239,155 | |
UnitedHealth Group, Inc. | | | 357,500 | | | | 42,288,675 | |
Universal Health Services, Inc., Class B | | | 247,450 | | | | 29,127,339 | |
| | | | | | | | |
| | | | | | | | 277,380,675 | |
Hotels, Restaurants & Leisure — 1.7% | | | | | | | | |
Carnival Corp. | | | 576,038 | | | | 27,557,658 | |
Las Vegas Sands Corp. | | | 213,400 | | | | 11,745,536 | |
| | | | | | | | |
| | | | | | | | 39,303,194 | |
Industrial Conglomerates — 2.5% | | | | | | | | |
3M Co. | | | 357,175 | | | | 58,916,016 | |
Insurance — 3.5% | | | | | | | | |
American International Group, Inc. | | | 980,400 | | | | 53,716,116 | |
The Travelers Cos., Inc. | | | 276,730 | | | | 29,922,815 | |
| | | | | | | | |
| | | | | | | | 83,638,931 | |
Internet & Catalog Retail — 0.5% | | | | | | | | |
The Priceline Group, Inc. (a) | | | 9,420 | | | | 10,966,293 | |
| | | | | | | | | | |
| Portfolio Abbreviations | | | | | | | | |
| ADR | | American Depositary Receipts | | | | | | |
| SPDR | | Standard & Poor’s Depositary Receipts | | | | | | |
See Notes to Financial Statements.
| | | | | | |
| 52 | | BLACKROCK LARGE CAP SERIES FUNDS, INC. | | MARCH 31, 2015 | | |
| | | | |
| Schedule of Investments (continued) | | | Master Large Cap Core Portfolio | |
| | | (Percentages shown are based on Net Assets) | |
| | | | | | | | |
| Common Stocks | | Shares | | | Value | |
Internet Software & Services — 3.9% | | | | | | | | |
Facebook, Inc., Class A (a) | | | 402,100 | | | $ | 33,058,651 | |
Google, Inc., Class A (a) | | | 53,285 | | | | 29,557,190 | |
Google, Inc., Class C (a) | | | 54,445 | | | | 29,835,860 | |
| | | | | | | | |
| | | | | | | | 92,451,701 | |
IT Services — 3.9% | | | | | | | | |
Alliance Data Systems Corp. (a) | | | 15,640 | | | | 4,633,350 | |
Amdocs Ltd. | | | 310,279 | | | | 16,879,178 | |
Cognizant Technology Solutions Corp., Class A (a) | | | 165,500 | | | | 10,325,545 | |
DST Systems, Inc. | | | 46,044 | | | | 5,097,531 | |
MasterCard, Inc., Class A | | | 479,160 | | | | 41,394,632 | |
Total System Services, Inc. | | | 349,354 | | | | 13,327,855 | |
| | | | | | | | |
| | | | | | | | 91,658,091 | |
Machinery — 1.5% | | | | | | | | |
Parker Hannifin Corp. | | | 147,266 | | | | 17,492,255 | |
WABCO Holdings, Inc. (a) | | | 138,300 | | | | 16,994,304 | |
| | | | | | | | |
| | | | | | | | 34,486,559 | |
Media — 3.1% | | | | | | | | |
Comcast Corp., Class A | | | 1,136,000 | | | | 64,149,920 | |
Omnicom Group, Inc. | | | 130,500 | | | | 10,176,390 | |
| | | | | | | | |
| | | | | | | | 74,326,310 | |
Multiline Retail — 0.7% | | | | | | | | |
Macy’s, Inc. | | | 258,400 | | | | 16,772,744 | |
Multi-Utilities — 0.4% | | | | | | | | |
Public Service Enterprise Group, Inc. | | | 204,500 | | | | 8,572,640 | |
Oil, Gas & Consumable Fuels — 4.4% | | | | | | | | |
BP PLC — ADR | | | 678,410 | | | | 26,532,615 | |
Exxon Mobil Corp. | | | 90,770 | | | | 7,715,450 | |
Hess Corp. | | | 231,552 | | | | 15,715,434 | |
Marathon Petroleum Corp. | | | 110,053 | | | | 11,268,327 | |
PBF Energy, Inc., Class A | | | 176,240 | | | | 5,978,061 | |
Suncor Energy, Inc. | | | 1,014,410 | | | | 29,671,493 | |
Tesoro Corp. | | | 71,893 | | | | 6,563,112 | |
| | | | | | | | |
| | | | | | | | 103,444,492 | |
Paper & Forest Products — 0.7% | | | | | | | | |
Domtar Corp. | | | 360,100 | | | | 16,643,822 | |
Pharmaceuticals — 4.7% | | | | | | | | |
AstraZeneca PLC — ADR | | | 348,800 | | | | 23,868,384 | |
Johnson & Johnson | | | 80,095 | | | | 8,057,557 | |
Merck & Co., Inc. | | | 103,243 | | | | 5,934,408 | |
Pfizer, Inc. | | | 72,690 | | | | 2,528,885 | |
Shire PLC — ADR | | | 95,400 | | | | 22,828,266 | |
Teva Pharmaceutical Industries Ltd. — ADR | | | 767,036 | | | | 47,786,343 | |
| | | | | | | | |
| | | | | | | | 111,003,843 | |
Road & Rail — 0.9% | | | | | | | | |
Norfolk Southern Corp. | | | 146,700 | | | | 15,098,364 | |
Union Pacific Corp. | | | 60,700 | | | | 6,574,417 | |
| | | | | | | | |
| | | | | | | | 21,672,781 | |
Semiconductors & Semiconductor Equipment — 4.1% | |
Intel Corp. | | | 1,467,970 | | | | 45,903,422 | |
Micron Technology, Inc. (a) | | | 1,538,870 | | | | 41,749,543 | |
NVIDIA Corp. | | | 479,900 | | | | 10,041,907 | |
| | | | | | | | |
| | | | | | | | 97,694,872 | |
Software — 2.1% | | | | | | | | |
Microsoft Corp. | | | 754,940 | | | | 30,692,086 | |
Oracle Corp. | | | 459,450 | | | | 19,825,267 | |
| | | | | | | | |
| | | | | | | | 50,517,353 | |
| | | | | | | | |
| Common Stocks | | Shares | | | Value | |
Specialty Retail — 5.0% | | | | | | | | |
The Home Depot, Inc. | | | 330,800 | | | $ | 37,582,188 | |
Lowe’s Cos., Inc. | | | 840,800 | | | | 62,547,112 | |
Ross Stores, Inc. | | | 187,139 | | | | 19,716,965 | |
| | | | | | | | |
| | | | | | | | 119,846,265 | |
Technology Hardware, Storage & Peripherals — 5.4% | |
Apple Inc. | | | 270,870 | | | | 33,704,354 | |
EMC Corp. | | | 1,216,070 | | | | 31,082,749 | |
Hewlett-Packard Co. | | | 751,966 | | | | 23,431,261 | |
Western Digital Corp. | | | 449,110 | | | | 40,873,501 | |
| | | | | | | | |
| | | | | | | | 129,091,865 | |
Textiles, Apparel & Luxury Goods — 0.6% | |
Deckers Outdoor Corp. (a) | | | 62,500 | | | | 4,554,375 | |
Fossil Group, Inc. (a) | | | 105,300 | | | | 8,681,985 | |
| | | | | | | | |
| | | | | | | | 13,236,360 | |
Total Common Stocks — 98.5% | | | | | | | 2,337,391,287 | |
| | | | | | | | |
| Investment Companies — 0.1% | | | | | | |
Utilities Select Sector SPDR Fund | | | 81,300 | | | | 3,612,159 | |
Total Long-Term Investments (Cost — $1,761,376,729) — 98.6% | | | | | | | 2,341,003,446 | |
| | | | | | | | |
| Short-Term Securities | | | | | | |
BlackRock Liquidity Funds, TempFund, Institutional Class, 0.06% (c)(d) | | | 25,332,154 | | | | 25,332,154 | |
| | | Beneficial
Interest
(000) | | | | |
BlackRock Liquidity Series, LLC, Money Market Series, 0.22% (c)(d)(e) | | $ | 2,699 | | | | 2,698,794 | |
Total Short-Term Securities (Cost — $28,030,948) — 1.2% | | | | | | | 28,030,948 | |
Total Investments (Cost — $1,789,407,677) — 99.8% | | | | 2,369,034,394 | |
Other Assets Less Liabilities — 0.2% | | | | 4,076,177 | |
| | | | | | | | |
Net Assets — 100.0% | | | | | | $ | 2,373,110,571 | |
| | | | | | | | |
See Notes to Financial Statements.
| | | | | | |
| | | BLACKROCK LARGE CAP SERIES FUNDS, INC. | | MARCH 31, 2015 | | 53 |
| | | | |
| Schedule of Investments (concluded) | | | Master Large Cap Core Portfolio | |
|
| Notes to Schedule of Investments |
| (a) | Non-income producing security. |
| (b) | Security, or a portion of security, is on loan. |
| (c) | During the six months ended March 31, 2015, investments in issuers considered to be affiliates of the Portfolio for purposes of Section 2(a)(3) of the Investment Company Act of 1940, as amended, were as follows: |
| | | | | | | | | | | | | | | | | | | | |
| Affiliate | | Shares/Beneficial
Interest Held at
September 30, 2014 | | | Net Activity | | | Shares/Beneficial
Interest Held at
March 31, 2015 | | | Income | | | Realized
Gain | |
BlackRock Liquidity Funds, TempFund, Institutional Class | | | 11,267,596 | | | | 14,064,558 | | | | 25,332,154 | | | $ | 13,477 | | | $ | 6,359 | |
BlackRock Liquidity Series, LLC, Money Market Series | | | — | | | $ | 2,698,794 | | | $ | 2,698,794 | | | $ | 10,580 | | | | — | |
| (d) | Represents the current yield as of report date. |
| (e) | Security was purchased with the cash collateral from loaned securities. The Portfolio may withdraw up to 25% of its investment daily, although the manager of the BlackRock Liquidity Series, LLC, Money Market Series, in its sole discretion, may permit an investor to withdraw more than 25% on any one day. |
| • | | For Portfolio compliance purposes, the Portfolio’s industry classifications refer to any one or more of the industry sub-classifications used by one or more widely recognized market indexes or ratings group indexes, and/or as defined by the investment advisor. These definitions may not apply for purposes of this report, which may combine such industry sub-classifications for reporting ease. |
| • | | Fair Value Measurements — Various inputs are used in determining the fair value of investments. These inputs to valuation techniques are categorized into a disclosure hierarchy consisting of three broad levels for financial statement purposes. The hierarchy gives the highest priority to unadjusted quoted prices in active markets for identical assets or liabilities (Level 1 measurements) and the lowest priority to unobservable inputs (Level 3 measurements). Accordingly, the degree of judgment exercised in determining fair value is greatest for instruments categorized in Level 3. The inputs used to measure fair value may fall into different levels of the fair value hierarchy. In such cases, for disclosure purposes, the fair value hierarchy classification is determined based on the lowest level input that is significant to the fair value measurement in its entirety. The categorization of a value determined for investments is based on the pricing transparency of the investment and is not necessarily an indication of the risks associated with investing in those securities. The three levels of the fair value hierarchy are as follows: |
| | • | | Level 1 — unadjusted quoted prices in active markets/exchanges for identical assets or liabilities that the Portfolio has the ability to access |
| | • | | Level 2 — other observable inputs (including, but not limited to, quoted prices for similar assets or liabilities in markets that are active, quoted prices for identical or similar assets or liabilities in markets that are not active, inputs other than quoted prices that are observable for the assets or liabilities (such as interest rates, yield curves, volatilities, prepayment speeds, loss severities, credit risks and default rates) or other market–corroborated inputs) |
| | • | | Level 3 — unobservable inputs based on the best information available in the circumstances, to the extent observable inputs are not available (including the Portfolio’s own assumptions used in determining the fair value of investments) |
Changes in valuation techniques may result in transfers into or out of an assigned level within the disclosure hierarchy. In accordance with the Portfolio’s policy, transfers between different levels of the fair value disclosure hierarchy are deemed to have occurred as of the beginning of the reporting period. For information about the Portfolio’s policy regarding valuation of investments, refer to Note 2 of the Notes to Financial Statements.
As of March 31, 2015, the following table summarizes the Portfolio’s investments categorized in the disclosure hierarchy:
| | | | | | | | | | | | | | |
| | | Level 1 | | | Level 2 | | | Level 3 | | Total | |
Assets: | | | | | | | | | | | | | | |
Investments: | | | | | | | | | | | | | | |
Long-Term Investments: | | | | | | | | | | | | | | |
Common Stocks1 | | $ | 2,337,391,287 | | | | — | | | — | | $ | 2,337,391,287 | |
Investment Companies | | | 3,612,159 | | | | — | | | — | | | 3,612,159 | |
Short-Term Securities | | | 25,332,154 | | | $ | 2,698,794 | | | — | | | 28,030,948 | |
| | | | |
Total | | $ | 2,366,335,600 | | | $ | 2,698,794 | | | — | | $ | 2,369,034,394 | |
| | | | |
| | 1 | | See above Schedule of Investments for values in each industry. |
The Portfolio may hold liabilities in which the fair value approximates the carrying amount for financial statement purposes. As of March 31, 2015, collateral on securities loaned at value of $2,698,794 is categorized as Level 2 within the disclosure hierarchy.
During the six months ended March 31, 2015, there were no transfers between levels.
See Notes to Financial Statements.
| | | | | | |
| 54 | | BLACKROCK LARGE CAP SERIES FUNDS, INC. | | MARCH 31, 2015 | | |
| | | | |
| Schedule of Investments March 31, 2015 (Unaudited) | | | Master Large Cap Growth Portfolio | |
| | | (Percentages shown are based on Net Assets) | |
| | | | | | | | |
| Common Stocks | | Shares | | | Value | |
Aerospace & Defense — 1.1% | | | | | | | | |
Honeywell International, Inc. | | | 18,300 | | | $ | 1,908,873 | |
Lockheed Martin Corp. | | | 23,370 | | | | 4,743,175 | |
Rockwell Collins, Inc. | | | 76,600 | | | | 7,395,730 | |
| | | | | | | | |
| | | | | | | | 14,047,778 | |
Air Freight & Logistics — 1.2% | | | | | | | | |
FedEx Corp. | | | 90,930 | | | | 15,044,369 | |
Airlines — 2.0% | | | | | | | | |
Delta Air Lines, Inc. | | | 29,640 | | | | 1,332,614 | |
Southwest Airlines Co. | | | 216,500 | | | | 9,590,950 | |
United Continental Holdings, Inc. (a) | | | 219,730 | | | | 14,776,843 | |
| | | | | | | | |
| | | | | | | | 25,700,407 | |
Auto Components — 0.6% | | | | | | | | |
Lear Corp. | | | 66,000 | | | | 7,314,120 | |
Banks — 2.4% | | | | | | | | |
U.S. Bancorp | | | 560,410 | | | | 24,473,105 | |
Wells Fargo & Co. | | | 103,400 | | | | 5,624,960 | |
| | | | | | | | |
| | | | | | | | 30,098,065 | |
Beverages — 2.6% | | | | | | | | |
The Coca-Cola Co. | | | 311,820 | | | | 12,644,301 | |
Dr Pepper Snapple Group, Inc. | | | 265,870 | | | | 20,865,478 | |
| | | | | | | | |
| | | | | | | | 33,509,779 | |
Biotechnology — 2.9% | | | | | | | | |
Amgen, Inc. | | | 232,600 | | | | 37,181,110 | |
Chemicals — 2.2% | | | | | | | | |
The Dow Chemical Co. | | | 108,060 | | | | 5,184,719 | |
PPG Industries, Inc. | | | 101,215 | | | | 22,828,031 | |
| | | | | | | | |
| | | | | | | | 28,012,750 | |
Communications Equipment — 1.4% | | | | | | | | |
QUALCOMM, Inc. | | | 252,830 | | | | 17,531,232 | |
Construction & Engineering — 0.5% | | | | | | | | |
AECOM (a) | | | 215,290 | | | | 6,635,238 | |
Consumer Finance — 2.4% | | | | | | | | |
Discover Financial Services | | | 329,325 | | | | 18,557,464 | |
SLM Corp. (a) | | | 1,277,663 | | | | 11,856,713 | |
| | | | | | | | |
| | | | | | | | 30,414,177 | |
Containers & Packaging — 0.7% | | | | | | | | |
Packaging Corp. of America | | | 112,900 | | | | 8,827,651 | |
Electrical Equipment — 0.4% | | | | | | | | |
SolarCity Corp. (a)(b) | | | 90,450 | | | | 4,638,276 | |
Electronic Equipment, Instruments & Components — 0.8% | |
TE Connectivity Ltd. | | | 45,980 | | | | 3,293,088 | |
Zebra Technologies Corp., Class A (a) | | | 72,430 | | | | 6,570,487 | |
| | | | | | | | |
| | | | | | | | 9,863,575 | |
Energy Equipment & Services — 3.1% | | | | | | | | |
Atwood Oceanics, Inc. | | | 84,190 | | | | 2,366,581 | |
Halliburton Co. | | | 97,000 | | | | 4,256,360 | |
Oceaneering International, Inc. | | | 113,500 | | | | 6,121,055 | |
Schlumberger Ltd. | | | 326,610 | | | | 27,252,338 | |
| | | | | | | | |
| | | | | | | | 39,996,334 | |
Food & Staples Retailing — 3.5% | | | | | | | | |
CVS Health Corp. | | | 347,500 | | | | 35,865,475 | |
The Kroger Co. | | | 17,530 | | | | 1,343,850 | |
Wal-Mart Stores, Inc. | | | 90,030 | | | | 7,404,968 | |
| | | | | | | | |
| | | | | | | | 44,614,293 | |
| | | | | | | | |
| Common Stocks | | Shares | | | Value | |
Food Products — 0.3% | | | | | | | | |
Pilgrim’s Pride Corp. (b) | | | 61,440 | | | $ | 1,387,930 | |
Tyson Foods, Inc., Class A | | | 65,920 | | | | 2,524,736 | |
| | | | | | | | |
| | | | | | | | 3,912,666 | |
Health Care Providers & Services — 9.9% | | | | | | | | |
Aetna, Inc. | | | 242,800 | | | | 25,865,484 | |
Centene Corp. (a) | | | 269,660 | | | | 19,062,265 | |
Cigna Corp. | | | 132,330 | | | | 17,128,795 | |
Laboratory Corp. of America Holdings (a) | | | 81,540 | | | | 10,281,379 | |
McKesson Corp. | | | 97,040 | | | | 21,950,448 | |
UnitedHealth Group, Inc. | | | 95,320 | | | | 11,275,403 | |
Universal Health Services, Inc., Class B | | | 177,766 | | | | 20,924,836 | |
| | | | | | | | |
| | | | | | | | 126,488,610 | |
Hotels, Restaurants & Leisure — 0.8% | | | | | | | | |
Las Vegas Sands Corp. | | | 192,500 | | | | 10,595,200 | |
Industrial Conglomerates — 2.6% | | | | | | | | |
3M Co. | | | 201,605 | | | | 33,254,745 | |
Insurance — 1.2% | | | | | | | | |
The Travelers Cos., Inc. | | | 136,820 | | | | 14,794,347 | |
Internet & Catalog Retail — 1.0% | | | | | | | | |
The Priceline Group, Inc. (a) | | | 11,320 | | | | 13,178,178 | |
Internet Software & Services — 6.6% | | | | | | | | |
Facebook, Inc., Class A (a) | | | 355,820 | | | | 29,253,741 | |
Google, Inc., Class A (a) | | | 48,325 | | | | 26,805,878 | |
Google, Inc., Class C (a) | | | 50,795 | | | | 27,835,660 | |
| | | | | | | | |
| | | | | | | | 83,895,279 | |
IT Services — 7.6% | | | | | | | | |
Alliance Data Systems Corp. (a) | | | 78,975 | | | | 23,396,344 | |
Amdocs Ltd. | | | 92,020 | | | | 5,005,888 | |
Cognizant Technology Solutions Corp., Class A (a) | | | 173,770 | | | | 10,841,510 | |
DST Systems, Inc. | | | 141,690 | | | | 15,686,500 | |
FleetCor Technologies, Inc. (a) | | | 8,500 | | | | 1,282,820 | |
MasterCard, Inc., Class A | | | 310,000 | | | | 26,780,900 | |
Total System Services, Inc. | | | 266,628 | | | | 10,171,858 | |
Visa, Inc., Class A | | | 59,040 | | | | 3,861,806 | |
| | | | | | | | |
| | | | | | | | 97,027,626 | |
Machinery — 2.4% | | | | | | | | |
Dover Corp. | | | 41,010 | | | | 2,834,611 | |
Parker Hannifin Corp. | | | 117,290 | | | | 13,931,706 | |
Snap-On, Inc. | | | 17,600 | | | | 2,588,256 | |
WABCO Holdings, Inc. (a) | | | 91,600 | | | | 11,255,808 | |
| | | | | | | | |
| | | | | | | | 30,610,381 | |
Media — 4.4% | | | | | | | | |
Comcast Corp., Class A | | | 696,100 | | | | 39,308,767 | |
Omnicom Group, Inc. | | | 138,710 | | | | 10,816,606 | |
The Walt Disney Co. | | | 62,790 | | | | 6,586,043 | |
| | | | | | | | |
| | | | | | | | 56,711,416 | |
Multiline Retail — 0.4% | | | | | | | | |
Macy’s, Inc. | | | 88,330 | | | | 5,733,500 | |
Oil, Gas & Consumable Fuels — 1.8% | | | | | | | | |
Marathon Petroleum Corp. | | | 28,406 | | | | 2,908,490 | |
PBF Energy, Inc., Class A | | | 103,994 | | | | 3,527,476 | |
Suncor Energy, Inc. | | | 553,285 | | | | 16,183,586 | |
| | | | | | | | |
| | | | | | | | 22,619,552 | |
Pharmaceuticals — 3.1% | | | | | | | | |
Shire PLC — ADR | | | 58,360 | | | | 13,964,964 | |
See Notes to Financial Statements.
| | | | | | |
| | | BLACKROCK LARGE CAP SERIES FUNDS, INC. | | MARCH 31, 2015 | | 55 |
| | | | |
| Schedule of Investments (continued) | | | Master Large Cap Growth Portfolio | |
| | | (Percentages shown are based on Net Assets) | |
| | | | | | | | |
| Common Stocks | | Shares | | | Value | |
Pharmaceuticals (concluded) | | | | | | | | |
Teva Pharmaceutical Industries Ltd. — ADR | | | 408,302 | | | $ | 25,437,215 | |
| | | | | | | | |
| | | | | | | | 39,402,179 | |
Road & Rail — 1.1% | | | | | | | | |
Norfolk Southern Corp. | | | 77,850 | | | | 8,012,322 | |
Union Pacific Corp. | | | 54,930 | | | | 5,949,468 | |
| | | | | | | | |
| | | | | | | | 13,961,790 | |
Semiconductors & Semiconductor Equipment — 3.5% | | | | | | | | |
Intel Corp. | | | 466,320 | | | | 14,581,826 | |
Micron Technology, Inc. (a) | | | 861,800 | | | | 23,380,634 | |
NVIDIA Corp. | | | 288,900 | | | | 6,045,233 | |
| | | | | | | | |
| | | | | | | | 44,007,693 | |
Software — 5.3% | | | | | | | | |
Microsoft Corp. | | | 1,111,110 | | | | 45,172,177 | |
Oracle Corp. | | | 519,650 | | | | 22,422,898 | |
| | | | | | | | |
| | | | | | | | 67,595,075 | |
Specialty Retail — 7.3% | | | | | | | | |
The Home Depot, Inc. | | | 278,580 | | | | 31,649,474 | |
Lowe’s Cos., Inc. | | | 447,000 | | | | 33,252,330 | |
Ross Stores, Inc. | | | 105,605 | | | | 11,126,543 | |
The TJX Cos., Inc. | | | 248,900 | | | | 17,435,445 | |
| | | | | | | | |
| | | | | | | | 93,463,792 | |
Technology Hardware, Storage & Peripherals — 6.8% | | | | | | | | |
Apple Inc. | | | 484,145 | | | | 60,242,162 | |
EMC Corp. | | | 710,840 | | | | 18,169,070 | |
Western Digital Corp. | | | 85,600 | | | | 7,790,456 | |
| | | | | | | | |
| | | | | | | | 86,201,688 | |
| | | | | | | | |
| Common Stocks | | Shares | | | Value | |
Textiles, Apparel & Luxury Goods — 1.3% | | | | | | | | |
Deckers Outdoor Corp. (a) | | | 39,400 | | | $ | 2,871,078 | |
Fossil Group, Inc. (a) | | | 69,060 | | | | 5,693,997 | |
VF Corp. | | | 112,410 | | | | 8,465,597 | |
| | | | | | | | |
| | | | | | | | 17,030,672 | |
Total Long-Term Investments (Cost — $867,169,559) — 95.2% | | | | 1,213,913,543 | |
| | | | | | | | |
| Short-Term Securities | | | | | | |
BlackRock Liquidity Funds, TempFund, Institutional Class, 0.06% (c)(d) | | | 53,899,187 | | | | 53,899,187 | |
| | | Beneficial
Interest
(000) | | | | |
BlackRock Liquidity Series, LLC, Money Market Series, 0.22% (c)(d)(e) | | $ | 5,504 | | | | 5,503,704 | |
Total Short-Term Securities (Cost — $59,402,891) — 4.6% | | | | 59,402,891 | |
Total Investments (Cost — $926,572,450) — 99.8% | | | | 1,273,316,434 | |
Other Assets Less Liabilities — 0.2% | | | | | | | 2,199,242 | |
| | | | | | | | |
Net Assets — 100.0% | | | | | | $ | 1,275,515,676 | |
| | | | | | | | |
|
| Notes to Schedule of Investments |
| (a) | Non-income producing security. |
| (b) | Security, or a portion of security, is on loan. |
| (c) | During the six months ended March 31, 2015, investments in issuers considered to be affiliates of the Portfolio for purposes of Section 2(a)(3) of the Investment Company Act of 1940, as amended, were as follows: |
| | | | | | | | | | | | | | | | | | | | |
| Affiliate | | Shares/Beneficial
Interest Held at
September 30, 2014 | | | Net Activity | | | Shares/Beneficial
Interest Held at
March 31, 2015 | | | Income | | | Realized
Gain | |
BlackRock Liquidity Funds, TempFund, Institutional Class | | | 36,003,192 | | | | 17,895,995 | | | | 53,899,187 | | | $ | 10,727 | | | $ | 5,416 | |
BlackRock Liquidity Series, LLC, Money Market Series | | | — | | | $ | 5,503,704 | | | $ | 5,503,704 | | | $ | 53,786 | | | | — | |
| (d) | Represents the current yield as of report date. |
| (e) | Security was purchased with the cash collateral from loaned securities. The Portfolio may withdraw up to 25% of its investment daily, although the manager of the BlackRock Liquidity Series, LLC, Money Market Series, in its sole discretion, may permit an investor to withdraw more than 25% on any one day. |
| • | | For Portfolio compliance purposes, the Portfolio’s industry classifications refer to any one or more of the industry sub-classifications used by one or more widely recognized market indexes or ratings group indexes, and/or as defined by the investment advisor. These definitions may not apply for purposes of this report, which may combine such industry sub-classifications for reporting ease. |
| • | | As of March 31, 2015, financial futures contracts outstanding were as follows: |
| | | | | | | | | | | | | | | | | | | | | | |
Contracts
Long | | | Issue | | | Exchange | | | Expiration | | | Notional
Value | | | Unrealized
Appreciation | |
| | 136 | | | | S&P 500 E-Mini Futures | | | | Chicago Mercantile | | | | June 2015 | | | $ | 14,013,440 | | | $ | 29,558 | |
| • | | Fair Value Measurements — Various inputs are used in determining the fair value of investments and derivative financial instruments. These inputs to valuation techniques are categorized into a disclosure hierarchy consisting of three broad levels for financial statement purposes. The hierarchy gives the highest priority to unadjusted quoted prices in active markets for identical assets or liabilities (Level 1 measurements) and the lowest priority to unobservable inputs (Level 3 measurements). Accordingly, the degree of judgment exercised in determining fair value is greatest for instruments categorized in Level 3. The inputs used to measure fair value may fall into different levels of the fair value hierarchy. In such cases, for disclosure purposes, the fair value hierarchy classification is determined based on the lowest level input that is significant to the fair value measurement in its entirety. The categorization of a value determined for investments and derivative financial instruments is based on the pricing transparency of the investment and is not necessarily an indication of the risks associated with investing in those securities. The three levels of the fair value hierarchy are as follows: |
| | • | | Level 1 — unadjusted quoted prices in active markets/exchanges for identical assets or liabilities that the Portfolio has the ability to access |
See Notes to Financial Statements.
| | | | | | |
| 56 | | BLACKROCK LARGE CAP SERIES FUNDS, INC. | | MARCH 31, 2015 | | |
| | | | |
| Schedule of Investments (concluded) | | | Master Large Cap Growth Portfolio | |
| | • | | Level 2 — other observable inputs (including, but not limited to, quoted prices for similar assets or liabilities in markets that are active, quoted prices for identical or similar assets or liabilities in markets that are not active, inputs other than quoted prices that are observable for the assets or liabilities (such as interest rates, yield curves, volatilities, prepayment speeds, loss severities, credit risks and default rates) or other market–corroborated inputs) |
| | • | | Level 3 — unobservable inputs based on the best information available in the circumstances, to the extent observable inputs are not available (including the Portfolio’s own assumptions used in determining the fair value of investments and derivative financial instruments) |
Changes in valuation techniques may result in transfers into or out of an assigned level within the disclosure hierarchy. In accordance with the Portfolio’s policy, transfers between different levels of the fair value disclosure hierarchy are deemed to have occurred as of the beginning of the reporting period. For information about the Portfolio’s policy regarding valuation of investments, refer to Note 2 of the Notes to Financial Statements.
As of March 31, 2015, the following tables summarize the Portfolio’s investments and derivative financial instruments categorized in the disclosure hierarchy:
| | | | | | | | | | | | | | | | | | | | |
| | | Level 1 | | Level 2 | | Level 3 | | Total |
Assets: | | | | | | | | | | | | | | | | | | | | |
Investments: | | | | | | | | | | | | | | | | | | | | |
Long-Term Investments1 | | | $ | 1,213,913,543 | | | | | — | | | | | — | | | | $ | 1,213,913,543 | |
Short-Term Securities | | | | 53,899,187 | | | | $ | 5,503,704 | | | | | — | | | | | 59,402,891 | |
| | | | | |
Total | | | $ | 1,267,812,730 | | | | $ | 5,503,704 | | | | | — | | | | $ | 1,273,316,434 | |
| | | | | |
1 See above Schedule of Investments for values in each industry. | |
| | | | | | | | | | | | | | | | | | | | |
| | | Level 1 | | Level 2 | | Level 3 | | Total |
Derivative Financial Instruments2 | | | | | | | | | | | | | | | | | | | | |
Assets: | | | | | | | | | | | | | | | | | | | | |
Equity contracts | | | $ | 29,558 | | | | | — | | | | | — | | | | $ | 29,558 | |
| | | | | |
2 Derivative financial instruments are financial futures contracts which are valued at the unrealized appreciation/depreciation on the instrument. | |
|
| The Portfolio may hold assets and/or liabilities in which the fair value approximates the carrying amount for financial statement purposes. As of March 31, 2015, such assets and/or liabilities are categorized within the disclosure hierarchy as follows: | |
| | | | | | | | | | | | | | | | | | | | |
| | | Level 1 | | Level 2 | | Level 3 | | Total |
Assets: | | | | | | | | | | | | | | | | | | | | |
Cash pledged for financial futures contracts | | | $ | 630,000 | | | | | — | | | | | — | | | | $ | 630,000 | |
Liabilities: | | | | | | | | | | | | | | | | | | | | |
Collateral on securities loaned at value | | | | — | | | | $ | (5,503,704 | ) | | | | — | | | | | (5,503,704 | ) |
| | | | | |
Total | | | $ | 630,000 | | | | $ | (5,503,704 | ) | | | | — | | | | $ | (4,873,704 | ) |
| | | | | |
During the six months ended March 31, 2015, there were no transfers between levels.
See Notes to Financial Statements.
| | | | | | |
| | | BLACKROCK LARGE CAP SERIES FUNDS, INC. | | MARCH 31, 2015 | | 57 |
| | | | |
| Schedule of Investments March 31, 2015 (Unaudited) | | | Master Large Cap Value Portfolio | |
| | | (Percentages shown are based on Net Assets) | |
| | | | | | | | |
Common Stocks | | | Shares | | | | Value | |
Aerospace & Defense — 2.0% | | | | | | | | |
Raytheon Co. | | | 134,830 | | | $ | 14,730,177 | |
Rockwell Collins, Inc. | | | 45,600 | | | | 4,402,680 | |
| | | | | | | | |
| | | | | | | | 19,132,857 | |
Air Freight & Logistics — 1.3% | | | | | | | | |
FedEx Corp. | | | 75,110 | | | | 12,426,949 | |
Airlines — 1.9% | | | | | | | | |
Southwest Airlines Co. | | | 180,800 | | | | 8,009,440 | |
United Continental Holdings, Inc. (a) | | | 147,400 | | | | 9,912,650 | |
| | | | | | | | |
| | | | | | | | 17,922,090 | |
Auto Components — 0.5% | | | | | | | | |
Lear Corp. | | | 45,100 | | | | 4,997,982 | |
Banks — 18.1% | | | | | | | | |
Bank of America Corp. | | | 2,198,958 | | | | 33,841,964 | |
Citigroup, Inc. | | | 608,826 | | | | 31,366,716 | |
JPMorgan Chase & Co. | | | 653,585 | | | | 39,594,179 | |
SunTrust Banks, Inc. | | | 401,200 | | | | 16,485,308 | |
U.S. Bancorp | | | 674,185 | | | | 29,441,659 | |
Wells Fargo & Co. | | | 382,525 | | | | 20,809,360 | |
| | | | | | | | |
| | | | | | | | 171,539,186 | |
Beverages — 1.2% | | | | | | | | |
Molson Coors Brewing Co., Class B | | | 155,300 | | | | 11,562,085 | |
Biotechnology — 1.0% | | | | | | | | |
Amgen, Inc. | | | 61,500 | | | | 9,830,775 | |
Capital Markets — 1.9% | | | | | | | | |
The Goldman Sachs Group, Inc. | | | 97,958 | | | | 18,413,165 | |
Chemicals — 1.0% | | | | | | | | |
Cabot Corp. | | | 65,294 | | | | 2,938,230 | |
The Dow Chemical Co. | | | 129,100 | | | | 6,194,218 | |
| | | | | | | | |
| | | | | | | | 9,132,448 | |
Communications Equipment — 3.6% | | | | | | | | |
Brocade Communications Systems, Inc. | | | 698,681 | | | | 8,289,850 | |
Cisco Systems, Inc. | | | 949,210 | | | | 26,127,005 | |
| | | | | | | | |
| | | | | | | | 34,416,855 | |
Construction & Engineering — 0.9% | | | | | | | | |
AECOM (a) | | | 287,500 | | | | 8,860,750 | |
Consumer Finance — 2.7% | | | | | | | | |
Discover Financial Services | | | 307,540 | | | | 17,329,879 | |
SLM Corp. (a) | | | 888,245 | | | | 8,242,914 | |
| | | | | | | | |
| | | | | | | | 25,572,793 | |
Diversified Financial Services — 0.7% | | | | | | | | |
Berkshire Hathaway, Inc., Class B (a) | | | 43,960 | | | | 6,344,307 | |
Electronic Equipment, Instruments & Components — 0.1% | | | | | |
TE Connectivity Ltd. | | | 10,750 | | | | 769,915 | |
Energy Equipment & Services — 0.7% | | | | | | | | |
Atwood Oceanics, Inc. | | | 86,800 | | | | 2,439,948 | |
Halliburton Co. | | | 45,430 | | | | 1,993,468 | |
Weatherford International PLC (a) | | | 175,500 | | | | 2,158,650 | |
| | | | | | | | |
| | | | | | | | 6,592,066 | |
Food & Staples Retailing — 5.6% | | | | | | | | |
CVS Health Corp. | | | 412,360 | | | | 42,559,676 | |
Wal-Mart Stores, Inc. | | | 126,420 | | | | 10,398,045 | |
| | | | | | | | |
| | | | | | | | 52,957,721 | |
Food Products — 0.4% | | | | | | | | |
Pilgrim’s Pride Corp. (b) | | | 65,900 | | | | 1,488,681 | |
| | | | | | | | |
| Common Stocks | | Shares | | | Value | |
Food Products (concluded) | | | | | | | | |
Tyson Foods, Inc., Class A | | | 70,500 | | | $ | 2,700,150 | |
| | | | | | | | |
| | | | | | | | 4,188,831 | |
Health Care Equipment & Supplies — 0.1% | | | | | | | | |
Medtronic PLC | | | 13,130 | | | | 1,024,009 | |
Health Care Providers & Services — 10.1% | | | | | | | | |
Aetna, Inc. | | | 218,460 | | | | 23,272,544 | |
Cigna Corp. | | | 128,800 | | | | 16,671,872 | |
Humana, Inc. | | | 46,490 | | | | 8,276,150 | |
Laboratory Corp. of America Holdings (a) | | | 86,050 | | | | 10,850,045 | |
UnitedHealth Group, Inc. | | | 198,180 | | | | 23,442,712 | |
Universal Health Services, Inc., Class B | | | 111,868 | | | | 13,167,982 | |
| | | | | | | | |
| | | | | | | | 95,681,305 | |
Hotels, Restaurants & Leisure — 1.3% | | | | | | | | |
Carnival Corp. | | | 251,457 | | | | 12,029,703 | |
Household Products — 0.1% | | | | | | | | |
The Procter & Gamble Co. | | | 11,500 | | | | 942,310 | |
Industrial Conglomerates — 3.0% | | | | | | | | |
3M Co. | | | 135,655 | | | | 22,376,292 | |
General Electric Co. | | | 259,865 | | | | 6,447,251 | |
| | | | | | | | |
| | | | | | | | 28,823,543 | |
Insurance — 4.9% | | | | | | | | |
American International Group, Inc. | | | 536,730 | | | | 29,407,437 | |
The Chubb Corp. | | | 34,990 | | | | 3,537,489 | |
The Travelers Cos., Inc. | | | 127,420 | | | | 13,777,925 | |
| | | | | | | | |
| | | | | | | | 46,722,851 | |
IT Services — 2.3% | | | | | | | | |
Amdocs Ltd. | | | 132,968 | | | | 7,233,459 | |
DST Systems, Inc. | | | 76,040 | | | | 8,418,388 | |
Total System Services, Inc. | | | 156,176 | | | | 5,958,114 | |
| | | | | | | | |
| | | | | | | | 21,609,961 | |
Machinery — 1.2% | | | | | | | | |
Parker Hannifin Corp. | | | 92,500 | | | | 10,987,150 | |
Media — 2.2% | | | | | | | | |
Comcast Corp., Class A | | | 364,950 | | | | 20,608,727 | |
Multiline Retail — 0.9% | | | | | | | | |
Macy’s, Inc. | | | 133,900 | | | | 8,691,449 | |
Multi-Utilities — 0.6% | | | | | | | | |
Public Service Enterprise Group, Inc. | | | 133,200 | | | | 5,583,744 | |
Oil, Gas & Consumable Fuels — 8.2% | | | | | | | | |
BP PLC — ADR | | | 399,300 | | | | 15,616,623 | |
Chevron Corp. | | | 34,865 | | | | 3,660,128 | |
Exxon Mobil Corp. | | | 314,915 | | | | 26,767,775 | |
Hess Corp. | | | 123,260 | | | | 8,365,656 | |
Marathon Petroleum Corp. | | | 32,852 | | | | 3,363,716 | |
PBF Energy, Inc., Class A | | | 89,890 | | | | 3,049,069 | |
Suncor Energy, Inc. | | | 452,400 | | | | 13,232,700 | |
Tesoro Corp. | | | 44,327 | | | | 4,046,612 | |
| | | | | | | | |
| | | | | | | | 78,102,279 | |
Paper & Forest Products — 1.0% | | | | | | | | |
Domtar Corp. | | | 197,920 | | | | 9,147,862 | |
Pharmaceuticals — 6.4% | | | | | | | | |
AstraZeneca PLC — ADR | | | 141,200 | | | | 9,662,316 | |
Johnson & Johnson | | | 77,250 | | | | 7,771,350 | |
Merck & Co., Inc. | | | 192,680 | | | | 11,075,246 | |
See Notes to Financial Statements.
| | | | | | |
| 58 | | BLACKROCK LARGE CAP SERIES FUNDS, INC. | | MARCH 31, 2015 | | |
| | | | |
| Schedule of Investments (continued) | | | Master Large Cap Value Portfolio | |
| | | (Percentages shown are based on Net Assets) | |
| | | | | | | | |
| Common Stocks | | Shares | | | Value | |
Pharmaceuticals (concluded) | | | | | | | | |
Pfizer, Inc. | | | 342,475 | | | $ | 11,914,705 | |
Teva Pharmaceutical Industries Ltd. — ADR | | | 326,552 | | | | 20,344,190 | |
| | | | | | | | |
| | | | | | | | 60,767,807 | |
Road & Rail — 0.4% | | | | | | | | |
Norfolk Southern Corp. | | | 33,560 | | | | 3,453,995 | |
Semiconductors & Semiconductor Equipment — 4.0% | | | | | | | | |
Intel Corp. | | | 652,100 | | | | 20,391,167 | |
Micron Technology, Inc. (a) | | | 579,940 | | | | 15,733,772 | |
NVIDIA Corp. | | | 85,700 | | | | 1,793,273 | |
| | | | | | | | |
| | | | | | | | 37,918,212 | |
Software — 0.9% | | | | | | | | |
Microsoft Corp. | | | 102,890 | | | | 4,182,993 | |
Oracle Corp. | | | 103,590 | | | | 4,469,909 | |
| | | | | | | | |
| | | | | | | | 8,652,902 | |
Specialty Retail — 2.8% | | | | | | | | |
Lowe’s Cos., Inc. | | | 362,160 | | | | 26,941,082 | |
Technology Hardware, Storage & Peripherals — 4.4% | | | | | | | | |
EMC Corp. | | | 425,910 | | | | 10,886,260 | |
Hewlett-Packard Co. | | | 393,904 | | | | 12,274,049 | |
Seagate Technology PLC | | | 13,610 | | | | 708,128 | |
Western Digital Corp. | | | 191,320 | | | | 17,412,033 | |
| | | | | | | | |
| | | | | | | | 41,280,470 | |
Total Common Stocks — 98.4% | | | | | | | 933,630,136 | |
| | | | | | | | |
| Investment Companies — 0.3% | | Shares | | | Value | |
Utilities Select Sector SPDR Fund | | | 65,300 | | | $ | 2,901,279 | |
Total Long-Term Investments (Cost — $703,177,850) — 98.7% | | | | 936,531,415 | |
| | | | | | | | |
| Short-Term Securities | | | | | | |
BlackRock Liquidity Funds, TempFund, Institutional Class, 0.06% (c)(d) | | | 7,021,580 | | | | 7,021,580 | |
| | | Beneficial
Interest
(000) | | | | |
BlackRock Liquidity Series, LLC, Money Market Series, 0.22% (c)(d)(e) | | $ | 1,126 | | | | 1,126,285 | |
Total Short-Term Securities (Cost — $8,147,865) — 0.8% | | | | 8,147,865 | |
Total Investments (Cost — $711,325,715) — 99.5% | | | | 944,679,280 | |
Other Assets Less Liabilities — 0.5% | | | | 4,565,600 | |
| | | | | | | | |
Net Assets — 100.0% | | | | | | $ | 949,244,880 | |
| | | | | | | | |
|
| Notes to Schedule of Investments |
| (a) | Non-income producing security. |
| (b) | Security, or a portion of security, is on loan. |
| (c) | During the six months ended March 31, 2015, investments in issuers considered to be an affiliate of the Portfolio for purposes of Section 2(a)(3) of the Investment Company Act of 1940, as amended, were as follows: |
| | | | | | | | | | | | | | | | | | | | |
| Affiliate | | Shares/Beneficial
Interest Held at
September 30, 2014 | | | Net Activity | | | Shares/Beneficial
Interest Held at
March 31, 2015 | | | Income | | | Realized
Gain | |
BlackRock Liquidity Funds, TempFund, Institutional Class | | | 15,209,518 | | | | (8,187,938 | ) | | | 7,021,580 | | | $ | 3,720 | | | $ | 1,522 | |
BlackRock Liquidity Series, LLC, Money Market Series | | | — | | | $ | 1,126,285 | | | $ | 1,126,285 | | | $ | 4,444 | | | | — | |
| (d) | Represents the current yield as of report date. |
| (e) | Security was purchased with the cash collateral from loaned securities. The Portfolio may withdraw up to 25% of its investment daily, although the manager of the BlackRock Liquidity Series, LLC, Money Market Series, in its sole discretion, may permit an investor to withdraw more than 25% on any one day. |
| • | | For Portfolio compliance purposes, the Portfolio’s industry classifications refer to any one or more of the industry sub-classifications used by one or more widely recognized market indexes or ratings group indexes, and/or as defined by the investment advisor. These definitions may not apply for purposes of this report, which may combine such industry sub-classifications for reporting ease. |
| • | | Fair Value Measurements — Various inputs are used in determining the fair value of investments. These inputs to valuation techniques are categorized into a disclosure hierarchy consisting of three broad levels for financial statement purposes. The hierarchy gives the highest priority to unadjusted quoted prices in active markets for identical assets or liabilities (Level 1 measurements) and the lowest priority to unobservable inputs (Level 3 measurements). Accordingly, the degree of judgment exercised in determining fair value is greatest for instruments categorized in Level 3. The inputs used to measure fair value may fall into different levels of the fair value hierarchy. In such cases, for disclosure purposes, the fair value hierarchy classification is determined based on the lowest level input that is significant to the fair value measurement in its entirety. The categorization of a value determined for investments is based on the pricing transparency of the investment and is not necessarily an indication of the risks associated with investing in those securities. The three levels of the fair value hierarchy are as follows: |
| | • | | Level 1 — unadjusted quoted prices in active markets/exchanges for identical assets or liabilities that the Portfolio has the ability to access |
| | • | | Level 2 — other observable inputs (including, but not limited to, quoted prices for similar assets or liabilities in markets that are active, quoted prices for identical or similar assets or liabilities in markets that are not active, inputs other than quoted prices that are observable for the assets or liabilities (such as interest rates, yield curves, volatilities, prepayment speeds, loss severities, credit risks and default rates) or other market–corroborated inputs) |
| | • | | Level 3 — unobservable inputs based on the best information available in the circumstances, to the extent observable inputs are not available (including the Portfolio’s own assumptions used in determining the fair value of investments) |
See Notes to Financial Statements.
| | | | | | |
| | | BLACKROCK LARGE CAP SERIES FUNDS, INC. | | MARCH 31, 2015 | | 59 |
| | | | |
| Schedule of Investments (concluded) | | | Master Large Cap Value Portfolio | |
| | | | |
Changes in valuation techniques may result in transfers into or out of an assigned level within the disclosure hierarchy. In accordance with the Portfolio’s policy, transfers between different levels of the fair value disclosure hierarchy are deemed to have occurred as of the beginning of the reporting period. For information about the Portfolio’s policy regarding valuation of investments, refer to Note 2 of the Notes to Financial Statements.
As of March 31, 2015, the following table summarizes the Portfolio’s investments categorized in the disclosure hierarchy:
| | | | | | | | | | | | | | |
| | | Level 1 | | | Level 2 | | | Level 3 | | Total | |
Assets: | | | | | | | | | | | | | | |
Investments: | | | | | | | | | | | | | | |
Long-Term Investments: | | | | | | | | | | | | | | |
Common Stocks1 | | $ | 933,630,136 | | | | — | | | — | | $ | 933,630,136 | |
Investment Companies | | | 2,901,279 | | | | — | | | — | | | 2,901,279 | |
Short-Term Securities | | | 7,021,580 | | | $ | 1,126,285 | | | — | | | 8,147,865 | |
| | | | |
Total | | $ | 943,552,995 | | | $ | 1,126,285 | | | — | | $ | 944,679,280 | |
| | | | |
| | 1 | | See above Schedule of Investments for values in each industry. |
The Portfolio may hold liabilities in which the fair value approximates the carrying amount for financial statement purposes. As of March 31, 2015, collateral on securities loaned at value of $1,126,285 is categorized as Level 2 within the disclosure hierarchy.
During the six months ended March 31, 2015, there were no transfers between levels.
See Notes to Financial Statements.
| | | | | | |
| 60 | | BLACKROCK LARGE CAP SERIES FUNDS, INC. | | MARCH 31, 2015 | | |
| | | | |
| Statements of Assets and Liabilities | | | Master Large Cap Series LLC | |
| | | | | | | | | | | | |
| March 31, 2015 (Unaudited) | | Master Large
Cap Core
Portfolio | | | Master Large
Cap Growth
Portfolio | | | Master Large
Cap Value
Portfolio | |
| | | | | | | | | | | | |
| Assets | | | | | | | | | | | | |
Investments at value — unaffiliated1,2 | | $ | 2,341,003,446 | | | $ | 1,213,913,543 | | | $ | 936,531,415 | |
Investments at value — affiliated3 | | | 28,030,948 | | | | 59,402,891 | | | | 8,147,865 | |
Cash pledged for financial futures contracts | | | — | | | | 630,000 | | | | — | |
Investments sold receivable | | | 5,832,425 | | | | 7,071,865 | | | | 6,273,735 | |
Contributions receivable from investors | | | 1,723,734 | | | | 1,733,389 | | | | 601,546 | |
Receivable from Manager | | | — | | | | — | | | | 878 | |
Dividends receivable — unaffiliated | | | 3,074,189 | | | | 1,236,843 | | | | 1,297,582 | |
Securities lending income receivable — affiliated | | | 6,185 | | | | 18,460 | | | | 2,581 | |
Dividends receivable — affiliated | | | 2,211 | | | | 3,542 | | | | 696 | |
Prepaid expenses | | | 8,664 | | | | 4,304 | | | | 3,494 | |
| | | | |
Total assets | | | 2,379,681,802 | | | | 1,284,014,837 | | | | 952,859,792 | |
| | | | |
| | | | | | | | | | | | |
| Liabilities | | | | | | | | | | | | |
Collateral on securities loaned at value | | | 2,698,794 | | | | 5,503,704 | | | | 1,126,285 | |
Variation margin payable on financial futures contracts | | | — | | | | 100,640 | | | | — | |
Withdrawals payable to investors | | | 2,800,189 | | | | 2,261,956 | | | | 1,995,525 | |
Investment advisory fees payable | | | 956,450 | | | | 545,549 | | | | 408,181 | |
Directors’ fees payable | | | 14,955 | | | | 8,269 | | | | 7,105 | |
Other affiliates payable | | | 11,724 | | | | 6,046 | | | | 5,291 | |
Other accrued expenses payable | | | 89,119 | | | | 72,997 | | | | 72,525 | |
| | | | |
Total liabilities | | | 6,571,231 | | | | 8,499,161 | | | | 3,614,912 | |
| | | | |
Net Assets | | $ | 2,373,110,571 | | | $ | 1,275,515,676 | | | $ | 949,244,880 | |
| | | | |
| | | | | | | | | | | | |
| Net Assets Consist of | | | | | | | | | | | | |
Investors’ capital | | $ | 1,793,483,854 | | | $ | 928,742,134 | | | $ | 715,891,315 | |
Net unrealized appreciation/depreciation | | | 579,626,717 | | | | 346,773,542 | | | | 233,353,565 | |
| | | | |
Net Assets | | $ | 2,373,110,571 | | | $ | 1,275,515,676 | | | $ | 949,244,880 | |
| | | | |
1 Investments at cost — unaffiliated | | $ | 1,761,376,729 | | | $ | 867,169,559 | | | $ | 703,177,850 | |
2 Securities loaned at value | | $ | 2,556,217 | | | $ | 5,404,566 | | | $ | 1,066,768 | |
3 Investments at cost — affiliated | | $ | 28,030,948 | | | $ | 59,402,891 | | | $ | 8,147,865 | |
See Notes to Financial Statements.
| | | | | | |
| | | BLACKROCK LARGE CAP SERIES FUNDS, INC. | | MARCH 31, 2015 | | 61 |
| | | | |
| Statements of Operations | | | Master Large Cap Series LLC | |
| | | | | | | | | | | | |
| Six Months Ended March 31, 2015 (Unaudited) | | Master Large
Cap Core
Portfolio | | | Master Large
Cap Growth
Portfolio | | | Master Large
Cap Value
Portfolio | |
| | | | | | | | | | | | |
| Investment Income | | | | | | | | | | | | |
Dividends — unaffiliated | | $ | 19,571,853 | | | $ | 8,256,689 | | | $ | 9,237,417 | |
Dividends — affiliated | | | 13,477 | | | | 10,727 | | | | 3,720 | |
Securities lending — affiliated — net | | | 10,580 | | | | 53,786 | | | | 4,444 | |
Foreign taxes withheld | | | (166,414 | ) | | | (76,589 | ) | | | (67,512 | ) |
| | | | |
Total income | | | 19,429,496 | | | | 8,244,613 | | | | 9,178,069 | |
| | | | |
| | | | | | | | | | | | |
| Expenses | | | | | | | | | | | | |
Investment advisory | | | 5,632,982 | | | | 3,062,574 | | | | 2,410,854 | |
Accounting services | | | 210,438 | | | | 125,687 | | | | 109,595 | |
Professional | | | 36,902 | | | | 30,167 | | | | 30,192 | |
Directors | | | 34,924 | | | | 18,725 | | | | 15,651 | |
Custodian | | | 34,458 | | | | 19,468 | | | | 17,296 | |
Printing | | | 1,095 | | | | 750 | | | | 686 | |
Miscellaneous | | | 14,813 | | | | 7,370 | | | | 7,682 | |
| | | | |
Total expenses | | | 5,965,612 | | | | 3,264,741 | | | | 2,591,956 | |
Less fees waived by the Manager | | | (19,973 | ) | | | (22,689 | ) | | | (5,576 | ) |
| | | | |
Total expenses after fees waived | | | 5,945,639 | | | | 3,242,052 | | | | 2,586,380 | |
| | | | |
Net investment income | | | 13,483,857 | | | | 5,002,561 | | | | 6,591,689 | |
| | | | |
| | | | | | | | | | | | |
| Realized and Unrealized Gain (Loss) | | | | | | | | | | | | |
Net realized gain from: | | | | | | | | | | | | |
Investments | | | 96,916,681 | | | | 31,450,902 | | | | 44,191,148 | |
Capital gain distributions received from affiliated investment companies | | | 6,359 | | | | 5,416 | | | | 1,522 | |
Financial futures contracts | | | — | | | | 2,274,075 | | | | — | |
| | | | |
| | | 96,923,040 | | | | 33,730,393 | | | | 44,192,670 | |
| | | | |
Net change in unrealized appreciation/depreciation on: | | | | | | | | | | | | |
Investments | | | 24,169,516 | | | | 57,412,661 | | | | (6,917,392 | ) |
Financial futures contracts | | | — | | | | 29,558 | | | | — | |
| | | | |
| | | 24,169,516 | | | | 57,442,219 | | | | (6,917,392 | ) |
| | | | |
Total realized and unrealized gain | | | 121,092,556 | | | | 91,172,612 | | | | 37,275,278 | |
| | | | |
Net Increase in Net Assets Resulting from Operations | | $ | 134,576,413 | | | $ | 96,175,173 | | | $ | 43,866,967 | |
| | | | |
See Notes to Financial Statements.
| | | | | | |
| 62 | | BLACKROCK LARGE CAP SERIES FUNDS, INC. | | MARCH 31, 2015 | | |
| | | | |
| Statements of Changes in Net Assets | | | Master Large Cap Series LLC | |
| | | | | | | | | | | | | | | | |
| | | Master Large Cap Core Portfolio | | | Master Large Cap Growth Portfolio | |
| Increase (Decrease) in Net Assets: | | Six Months Ended March 31, 2015 (Unaudited) | | | Year Ended September 30, 2014 | | | Six Months Ended March 31, 2015 (Unaudited) | | | Year Ended September 30, 2014 | |
| | | | | | | | | | | | | | | | |
| Operations | | | | | | | | | | | | | | | | |
Net investment income | | $ | 13,483,857 | | | $ | 25,125,980 | | | $ | 5,002,561 | | | $ | 10,370,700 | |
Net realized gain | | | 96,923,040 | | | | 363,322,933 | | | | 33,730,393 | | | | 136,172,533 | |
Net change in unrealized appreciation/depreciation | | | 24,169,516 | | | | 28,704,584 | | | | 57,442,219 | | | | 73,741,646 | |
| | | | | | | | |
Net increase in net assets resulting from operations | | | 134,576,413 | | | | 417,153,497 | | | | 96,175,173 | | | | 220,284,879 | |
| | | | | | | | |
| | | | | | | | | | | | | | | | |
| Capital Transactions | | | | | | | | | | | | | | | | |
Proceeds from contributions | | | 133,313,097 | | | | 155,850,428 | | | | 152,242,040 | | | | 415,255,505 | |
Value of withdrawals | | | (230,282,109 | ) | | | (546,397,150 | ) | | | (129,596,719 | ) | | | (483,853,525 | ) |
| | | | | | | | |
Net increase (decrease) in net assets derived from capital transactions | | | (96,969,012 | ) | | | (390,546,722 | ) | | | 22,645,321 | | | | (68,598,020 | ) |
| | | | | | | | |
| | | | | | | | | | | | | | | | |
| Net Assets | | | | | | | | | | | | | | | | |
Total increase in net assets | | | 37,607,401 | | | | 26,606,775 | | | | 118,820,494 | | | | 151,686,859 | |
Beginning of period | | | 2,335,503,170 | | | | 2,308,896,395 | | | | 1,156,695,182 | | | | 1,005,008,323 | |
| | | | | | | | |
End of period | | $ | 2,373,110,571 | | | $ | 2,335,503,170 | | | $ | 1,275,515,676 | | | $ | 1,156,695,182 | |
| | | | | | | | |
| | | | | | | | | | | | | | | | |
| | | | | | | | | Master Large Cap Value Portfolio | |
| Increase (Decrease) in Net Assets: | | | | | | | | Six Months Ended March 31, 2015 (Unaudited) | | | Year Ended September 30, 2014 | |
| | | | | | | | | | | | | | | | |
| Operations | | | | | | | | | | | | | | | | |
Net investment income | | | | | | | | | | $ | 6,591,689 | | | $ | 13,903,047 | |
Net realized gain | | | | | | | | | | | 44,192,670 | | | | 133,498,817 | |
Net change in unrealized appreciation/depreciation | | | | | | | | | | | (6,917,392 | ) | | | 23,028,770 | |
| | | | | | | | | | | | |
Net increase in net assets resulting from operations | | | | | | | | | | | 43,866,967 | | | | 170,430,634 | |
| | | | | | | | | | | | |
| | | | | | | | | | | | | | | | |
| Capital Transactions | | | | | | | | | | | | | | | | |
Proceeds from contributions | | | | | | | | | | | 80,609,868 | | | | 174,244,142 | |
Value of withdrawals | | | | | | | | | | | (141,583,368 | ) | | | (333,870,192 | ) |
| | | | | | | | | | | | |
Net decrease in net assets derived from capital transactions | | | | | | | | | | | (60,973,500 | ) | | | (159,626,050 | ) |
| | | | | | | | | | | | |
| | | | | | | | | | | | | | | | |
| Net Assets | | | | | | | | | | | | | | | | |
Total increase (decrease) in net assets | | | | | | | | | | | (17,106,533 | ) | | | 10,804,584 | |
Beginning of period | | | | | | | | | | | 966,351,413 | | | | 955,546,829 | |
| | | | | | | | | | | | |
End of period | | | | | | | | | | $ | 949,244,880 | | | $ | 966,351,413 | |
| | | | | | | | | | | | |
See Notes to Financial Statements.
| | | | | | |
| | | BLACKROCK LARGE CAP SERIES FUNDS, INC. | | MARCH 31, 2015 | | 63 |
| | | | |
| Financial Highlights | | | Master Large Cap Series LLC | |
| | | | | | | | | | | | | | | | | | | | | | | | |
| | | Master Large Cap Core Portfolio | |
| | | Six Months
Ended
March 31, 2015 (Unaudited) | | | Year Ended September 30, | |
| | | | 2014 | | | 2013 | | | 2012 | | | 2011 | | | 2010 | |
| Total Return | | | | | | | | | | | | | | | | | | | | | | | | |
Total return | | | 5.59 | %1 | | | 19.44 | % | | | 20.39 | % | | | 29.97 | % | | | (1.61 | )% | | | 6.16 | % |
| | | | |
| | | | | | | | | | | | | | | | | | | | | | | | |
| Ratios to Average Net Assets | | | | | | | | | | | | | | | | | | | | | | | | |
Total expenses | | | 0.50 | %2 | | | 0.50 | % | | | 0.50 | % | | | 0.50 | % | | | 0.49 | % | | | 0.49 | % |
| | | | |
Total expenses after fees waived | | | 0.50 | %2 | | | 0.50 | % | | | 0.50 | % | | | 0.50 | % | | | 0.49 | % | | | 0.49 | % |
| | | | |
Net investment income | | | 1.13 | %2 | | | 1.08 | % | | | 1.29 | % | | | 1.67 | % | | | 1.13 | % | | | 1.11 | % |
| | | | |
| | | | | | | | | | | | | | | | | | | | | | | | |
| Supplemental Data | | | | | | | | | | | | | | | | | | | | | | | | |
Net assets, end of period (000) | | $ | 2,373,111 | | | $ | 2,335,503 | | | $ | 2,308,896 | | | $ | 2,318,851 | | | $ | 2,306,714 | | | $ | 3,209,486 | |
| | | | |
Portfolio turnover rate | | | 23 | % | | | 40 | % | | | 50 | % | | | 128 | % | | | 129 | % | | | 173 | % |
| | | | |
| | | | | | | | | | | | | | | | | | | | | | | | |
| | | Master Large Cap Growth Portfolio | |
| | | Six Months
Ended
March 31,
2015
(Unaudited) | | | Year Ended September 30, | |
| | | | 2014 | | | 2013 | | | 2012 | | | 2011 | | | 2010 | |
| Total Return | | | | | | | | | | | | | | | | | | | | | | | | |
Total return | | | 8.24 | %1 | | | 21.59 | % | | | 15.76 | % | | | 31.61 | % | | | 0.72 | % | | | 7.68 | % |
| | | | |
| | | | | | | | | | | | | | | | | | | | | | | | |
| Ratios to Average Net Assets | | | | | | | | | | | | | | | | | | | | | | | | |
Total expenses | | | 0.53 | %2 | | | 0.53 | % | | | 0.54 | % | | | 0.55 | % | | | 0.54 | % | | | 0.56 | % |
| | | | |
Total expenses after fees waived | | | 0.53 | %2 | | | 0.53 | % | | | 0.54 | % | | | 0.55 | % | | | 0.54 | % | | | 0.56 | % |
| | | | |
Net investment income | | | 0.82 | %2 | | | 0.90 | % | | | 1.25 | % | | | 1.61 | % | | | 0.93 | % | | | 0.73 | % |
| | | | |
| | | | | | | | | | | | | | | | | | | | | | | | |
| Supplemental Data | | | | | | | | | | | | | | | | | | | | | | | | |
Net assets, end of period (000) | | $ | 1,275,516 | | | $ | 1,156,695 | | | $ | 1,005,008 | | | $ | 913,632 | | | $ | 995,279 | | | $ | 671,834 | |
| | | | |
Portfolio turnover rate | | | 20 | % | | | 49 | % | | | 54 | % | | | 132 | % | | | 169 | % | | | 232 | % |
| | | | |
| | | | | | | | | | | | | | | | | | | | | | | | |
| | | Master Large Cap Value Portfolio | |
| | | Six Months
Ended
March 31,
2015
(Unaudited) | | | Year Ended September 30, | |
| | | | 2014 | | | 2013 | | | 2012 | | | 2011 | | | 2010 | |
| Total Return | | | | | | | | | | | | | | | | | | | | | | | | |
Total return | | | 4.62 | %1 | | | 18.35 | % | | | 22.80 | % | | | 25.26 | % | | | (4.34 | )% | | | 4.36 | % |
| | | | |
| | | | | | | | | | | | | | | | | | | | | | | | |
| Ratios to Average Net Assets | | | | | | | | | | | | | | | | | | | | | | | | |
Total expenses | | | 0.54 | %2 | | | 0.54 | % | | | 0.54 | % | | | 0.54 | % | | | 0.54 | % | | | 0.53 | % |
| | | | |
Total expenses after fees waived | | | 0.54 | %2 | | | 0.54 | % | | | 0.54 | % | | | 0.54 | % | | | 0.54 | % | | | 0.53 | % |
| | | | |
Net investment income | | | 1.37 | %2 | | | 1.37 | % | | | 1.58 | % | | | 1.71 | % | | | 1.28 | % | | | 1.35 | % |
| | | | |
| | | | | | | | | | | | | | | | | | | | | | | | |
| Supplemental Data | | | | | | | | | | | | | | | | | | | | | | | | |
Net assets, end of period (000) | | $ | 949,245 | | | $ | 966,351 | | | $ | 955,547 | | | $ | 1,063,824 | | | $ | 1,331,102 | | | $ | 2,173,142 | |
| | | | |
Portfolio turnover rate | | | 16 | % | | | 32 | % | | | 40 | % | | | 147 | % | | | 156 | % | | | 183 | % |
| | | | |
| | 1 | | Aggregate total return. |
See Notes to Financial Statements.
| | | | | | |
| 64 | | BLACKROCK LARGE CAP SERIES FUNDS, INC. | | MARCH 31, 2015 | | |
| | | | |
| Notes to Financial Statements (Unaudited) | | | Master Large Cap Series LLC | |
1. Organization:
Master Large Cap Core Portfolio, Master Large Cap Growth Portfolio and Master Large Cap Value Portfolio (collectively, the “Portfolios” or individually, a “Portfolio”) are each a series of Master Large Cap Series LLC (the “Master LLC”). The Master LLC is registered under the Investment Company Act of 1940, as amended (the “1940 Act”), as an open-end management investment company and is organized as a Delaware limited liability company. Each Portfolio is classified as diversified. The Limited Liability Company Agreement of the Master LLC permits the Board of Directors of the Master LLC (the “Board”) to issue non-transferable interests in the Master LLC, subject to certain limitations.
The Portfolios, together with certain other registered investment companies advised by BlackRock Advisors, LLC (the “Manager”) or its affiliates, are included in a complex of open-end funds referred to as the Equity-Liquidity Complex.
2. Significant Accounting Policies:
The Portfolios’ financial statements are prepared in conformity with accounting principles generally accepted in the United States of America (“U.S. GAAP”), which may require management to make estimates and assumptions that affect the reported amounts of assets and liabilities in the financial statements and the reported amount of increases and decreases in net assets from operations during the reporting period. Actual results could differ from those estimates. Each Portfolio is considered an investment company under U.S. GAAP and follows the accounting and reporting guidance applicable to investment companies. The following is a summary of significant accounting policies followed by the Portfolios:
Valuation: The Portfolios’ investments are valued at fair value as of the close of trading on the New York Stock Exchange (“NYSE”) (generally 4:00 p.m., Eastern time). U.S. GAAP defines fair value as the price the Portfolios would receive to sell an asset or pay to transfer a liability in an orderly transaction between market participants at the measurement date. The Portfolios determine the fair value of their financial instruments at market value using independent dealers or pricing services under policies approved by the Board. The BlackRock Global Valuation Methodologies Committee (the “Global Valuation Committee”) is the committee formed by management to develop global pricing policies and procedures and to provide oversight of the pricing function for the Portfolios for all financial instruments.
Equity investments traded on a recognized securities exchange are valued at the official close price each day, if available. For equity investments traded on more than one exchange, the official close price on the exchange where the stock is primarily traded is used. Equity investments traded on a recognized exchange for which there were no sales on that day may be valued at the last available bid (long positions) or ask (short positions) price. Financial futures contracts traded on exchanges are valued at their last sale price. Investments in open-end registered investment companies are valued at NAV each business day.
The Portfolios value their investments in BlackRock Liquidity Series, LLC, Money Market Series (the “Money Market Series”) at fair value, which is ordinarily based upon their pro rata ownership in the underlying fund’s net assets. The Money Market Series seeks current income consistent with maintaining liquidity and preserving capital. Although the Money Market Series is not registered under the 1940 Act, its investments will follow the parameters of investments by a money market fund that is subject to Rule 2a-7 under the 1940 Act. The Portfolios may withdraw up to 25% of their investment daily, although the Manager of the Money Market Series, in its sole discretion, may permit an investor to withdraw more than 25% on any one day.
In the event that the application of these methods of valuation results in a price for an investment which is deemed not to be representative of the market value of such investment, or if a price is not available, the investment will be valued by the Global Valuation Committee, or its delegate, in accordance with a policy approved by the Board as reflecting fair value (“Fair Value Investments”). When determining the price for Fair Value Investments, the Global Valuation Committee, or its delegate, seeks to determine the price that each Portfolio might reasonably expect to receive or pay from the current sale or purchase of that asset or liability in an arm’s-length transaction. Fair value determinations shall be based upon all available factors that the Global Valuation Committee, or its delegate, deems relevant consistent with the principles of fair value measurement. The pricing of all Fair Value Investments is subsequently reported to the Board or a committee thereof on a quarterly basis.
Segregation and Collateralization: In cases where a Portfolio enters into certain investments (e.g., financial futures contracts), that would be “senior securities” for 1940 Act purposes, the Portfolios may segregate or designate on their books and records cash or liquid securities having a market value at least equal to the amount of the Portfolios’ future obligations under such investments or borrowings. Doing so allows the investment to be excluded from treatment as a “senior security.” Furthermore, if required by an exchange or counterparty agreement, the Portfolios may be required to deliver/ deposit cash and/or securities to/with an exchange, or broker-dealer or custodian as collateral for certain investments or obligations.
Investment Transactions and Investment Income: For financial reporting purposes, investment transactions are recorded on the dates the transactions are entered into (the trade dates). Realized gains and losses on investment transactions are determined on the identified cost basis. Dividend income is recorded on the ex-dividend dates. Dividends from foreign securities where the ex-dividend date may have passed are subsequently recorded when the Portfolios are informed of the ex-dividend date. Under the applicable foreign tax laws, a withholding tax at various rates may be imposed on capital gains, dividends and interest. Upon notification from issuers, some of the dividend income received from a real estate investment trust may be redesignated as a reduction of cost of the related investment and/or realized gain.
| | | | | | |
| | | BLACKROCK LARGE CAP SERIES FUNDS, INC. | | MARCH 31, 2015 | | 65 |
| | | | |
| Notes to Financial Statements (continued) | | | Master Large Cap Series LLC | |
Recent Accounting Standard: In June 2014, the Financial Accounting Standards Board issued guidance to improve the financial reporting of reverse repurchase agreements and other similar transactions. The guidance will require expanded disclosure for entities that enter into reverse repurchase agreements and similar transactions accounted for as secured borrowings. It is effective for financial statements with fiscal years beginning on or after December 15, 2014 and for interim periods beginning after March 15, 2015. Management is evaluating the impact, if any, of this guidance on the Portfolios’ financial statement disclosures.
Other: Expenses directly related to a Portfolio are charged to that Portfolio. Other operating expenses shared by several funds are prorated among those funds on the basis of relative net assets or other appropriate methods.
Each Portfolio has an arrangement with its custodian whereby fees may be reduced by credits earned on uninvested cash balances, which, if applicable, are shown as fees paid indirectly in the Statements of Operations. The custodian imposes fees on overdrawn cash balances, which can be offset by accumulated credits earned or may result in additional custody charges.
3. Securities and Other Investments:
Securities Lending: Each Portfolio may lend its securities to approved borrowers, such as brokers, dealers and other financial institutions. The borrower pledges and maintains with the Portfolios collateral consisting of cash, an irrevocable letter of credit issued by a bank, or securities issued or guaranteed by the U.S. Government. The initial collateral received by each Portfolio is required to have a value of at least 102% of the current value of the loaned securities for securities traded on U.S. exchanges and a value of at least 105% for all other securities. The collateral is maintained thereafter at a value equal to at least 100% of the current market value of the securities on loan. The market value of the loaned securities is determined at the close of each business day of the Portfolio and any additional required collateral is delivered to the Portfolio on the next business day. During the term of the loan, each Portfolio is entitled to all distributions made on or in respect of the loaned securities. Loans of securities are terminable at any time and the borrower, after notice, is required to return borrowed securities within the standard time period for settlement of securities transactions.
The market value of securities on loan and the value of the related collateral are shown separately in the Statements of Assets and Liabilities as a component of investments at value — unaffiliated, and collateral on securities loaned at value, respectively. As of March 31, 2015, any securities on loan were collateralized by cash. The cash collateral invested by the securities lending agent, BlackRock Investment Management, LLC (“BIM”), if any, is disclosed in the Schedules of Investments.
Securities lending transactions are entered into by the Portfolios under Master Securities Lending Agreements (each, an “MSLA”) which provide the right, in the event of default (including bankruptcy or insolvency), for the non-defaulting party to liquidate the collateral and calculate a net exposure to the defaulting party or request additional collateral. In the event that a borrower defaults, each Portfolio, as lender, would offset the market value of the collateral received against the market value of the securities loaned. When the value of the collateral is greater than that of the market value of the securities loaned, the lender is left with a net amount payable to the defaulting party. However, bankruptcy or insolvency laws of a particular jurisdiction may impose restrictions on or prohibitions against such a right of offset in the event of an MSLA counterparty’s bankruptcy or insolvency. Under the MSLA, the borrower can resell or re-pledge the loaned securities, and the Portfolio can reinvest cash collateral, or, upon an event of default, resell or re-pledge the collateral.
As of March 31, 2015, the following tables are a summary of the Portfolios’ securities lending agreements by counterparty, which are subject to offset under an MSLA:
| | | | | | | | | | | | |
| | | Securities
Loaned at Value | | | Cash Collateral
Received1 | | | Net Amount | |
| Master Large Cap Core Portfolio | |
| Counterparty | |
Citigroup Global Markets, Inc. | | $ | 2,556,217 | | | $ | (2,556,217 | ) | | | — | |
| | | | |
| | | | | | | | | | | | |
| | | | | | | | | | | | | |
| Master Large Cap Growth Portfolio | |
| Counterparty | |
Barclays Capital, Inc. | | $ | 1,538,400 | | | $ | (1,538,400 | ) | | | — | |
Citigroup Global Markets, Inc. | | | 474,119 | | | | (474,119 | ) | | | — | |
Goldman Sachs & Co. | | | 338,579 | | | | (338,579 | ) | | | — | |
JP Morgan Securities LLC | | | 743,560 | | | | (743,560 | ) | | | — | |
Morgan Stanley | | | 2,258,166 | | | | (2,258,166 | ) | | | — | |
UBS Securities LLC | | | 51,742 | | | | (51,742 | ) | | | — | |
| | | | |
Total | | $ | 5,404,566 | | | $ | (5,404,566 | ) | | | — | |
| | | | |
| | | | | | |
| 66 | | BLACKROCK LARGE CAP SERIES FUNDS, INC. | | MARCH 31, 2015 | | |
| | | | |
| Notes to Financial Statements (continued) | | | Master Large Cap Series LLC | |
| | | | | | | | | | | | |
| | | Securities
Loaned at Value | | | Cash Collateral
Received1 | | | Net Amount | |
| Master Large Cap Value Portfolio | |
| Counterparty | |
Citigroup Global Markets, Inc. | | $ | 1,062,566 | | | $ | (1,062,566 | ) | | | — | |
Goldman Sachs & Co. | | | 2,530 | | | | (2,530 | ) | | | — | |
JP Morgan Securities LLC | | | 1,672 | | | | (1,672 | ) | | | — | |
| | | | |
Total | | $ | 1,066,768 | | | $ | (1,066,768 | ) | | | — | |
| | | | |
| | 1 | | Collateral with a value of $2,698,794, $5,503,704 and $1,126,285 has been received in connection with securities lending agreements. Collateral received in excess of the value of securities loaned from the individual counterparty is not shown for financial reporting purposes. |
The risks of securities lending include the risk that the borrower may not provide additional collateral when required or may not return the securities when due. To mitigate these risks, the Portfolios benefit from a borrower default indemnity provided by BIM. BIM’s indemnity allows for full replacement of the securities loaned if the collateral received does not cover the value on the securities loaned in the event of borrower default. Each Portfolio could suffer a loss if the value of an investment purchased with cash collateral falls below the market value of loaned securities or if the value of an investment purchased with cash collateral falls below the value of the original cash collateral received.
4. Derivative Financial Instruments:
The Portfolios engage in various portfolio investment strategies using derivative contracts both to increase the returns of the Portfolios and/or to economically manage their exposure to certain risks such as equity risk, interest rate risk and foreign currency exchange rate risk. These contracts may be transacted on an exchange or OTC.
Financial Futures Contracts: The Portfolios purchase and/or sell financial futures contracts and options on financial futures contracts to gain exposure to, or economically hedge against, changes in interest rates (interest rate risk), changes in the value of equity securities (equity risk) or foreign currencies (foreign currency exchange rate risk). Financial futures contracts are agreements between the Portfolio and a counterparty to buy or sell a specific quantity of an underlying instrument at a specified price and at a specified date. Depending on the terms of the particular contract, financial futures contracts are settled either through physical delivery of the underlying instrument on the settlement date or by payment of a cash settlement amount on the settlement date.
Upon entering into a financial futures contract, the Portfolios are required to deposit initial margin with the broker in the form of cash or securities in an amount that varies depending on a contract’s size and risk profile. The initial margin deposit must then be maintained at an established level over the life of the contract. Securities deposited as initial margin are designated on the Schedules of Investments and cash deposited, if any, is recorded on the Statements of Assets and Liabilities as cash pledged for financial futures contracts. Pursuant to the contract, the Portfolios agree to receive from or pay to the broker an amount of cash equal to the daily fluctuation in value of the contract. Such receipts or payments are known as variation margin. Variation margin is recorded by the Portfolios as unrealized appreciation or depreciation and, if applicable, as a receivable or payable for variation margin in the Statements of Assets and Liabilities.
When the contract is closed, the Portfolios record a realized gain or loss equal to the difference between the value of the contract at the time it was opened and the value at the time it was closed. The use of financial futures contracts involves the risk of an imperfect correlation in the movements in the price of financial futures contracts, interest or foreign currency exchange rates and the underlying assets.
The following is a summary of the Portfolios’ derivative financial instruments categorized by risk exposure:
| | | | | | |
| Fair Values of Derivative Financial Instruments as of March 31, 2015 | |
| | | | | Master Large Cap
Growth Portfolio | |
| | | | | Value | |
| | | Statements of Assets and Liabilities Location | | Derivative Assets | |
Equity contracts | | Net unrealized appreciation/depreciation1 | | $ | 29,558 | |
| | 1 | | Includes cumulative appreciation/depreciation on financial futures contracts as reported in the Schedules of Investments. Only current day’s variation margin is reported within the Statements of Assets and Liabilities. |
| | | | | | |
| | | BLACKROCK LARGE CAP SERIES FUNDS, INC. | | MARCH 31, 2015 | | 67 |
| | | | |
| Notes to Financial Statements (continued) | | | Master Large Cap Series LLC | |
| | | | | | | | |
The Effect of Derivative Financial Instruments in the Statements of Operations Six Months Ended March 31, 2015 | |
| | | Master Large Cap Growth Portfolio | |
| | | Net Realized Gain From | | | Net Change in Unrealized
Appreciation/Depreciation on | |
Equity contracts: | | | | | | | | |
Financial futures contracts | | $ | 2,274,075 | | | $ | 29,558 | |
For the six months ended March 31, 2015, the average quarterly balances of outstanding derivative financial instruments were as follows:
| | | | |
| | | Master Large Cap
Growth Portfolio | |
Financial futures contracts: | | | | |
Average notional value of contracts — long | | $ | 13,984,880 | |
Counterparty Credit Risk: A derivative contract may suffer a mark-to-market loss if the value of the contract decreases due to an unfavorable change in the market rates or values of the underlying instrument. Losses can also occur if the counterparty does not perform under the contract.
A Portfolio’s risk of loss from counterparty credit risk on OTC derivatives is generally limited to the aggregate unrealized gain less the value of any collateral held by such Portfolio.
With exchange-traded futures, there is less counterparty credit risk to the Portfolios since the exchange or clearinghouse, as counterparty to such instruments, guarantees against a possible default. The clearinghouse stands between the buyer and the seller of the contract; therefore, the credit risk is limited to failure of the clearinghouse. While offset rights may exist under applicable law, a Portfolio does not have a contractual right of offset against a clearing broker or clearinghouse in the event of a default (including the bankruptcy or insolvency) of the clearing broker or clearinghouse. Additionally, credit risk exists in exchange-traded futures with respect to initial and variation margin that is held in a clearing broker’s customer accounts. While clearing brokers are required to segregate customer margin from their own assets, in the event that a clearing broker becomes insolvent or goes into bankruptcy and at that time there is a shortfall in the aggregate amount of margin held by the clearing broker for all its clients, typically the shortfall would be allocated on a pro rata basis across all the clearing broker’s customers, potentially resulting in losses to the Portfolios.
5. Investment Advisory Agreement and Other Transactions with Affiliates:
The PNC Financial Services Group, Inc. is the largest stockholder and an affiliate of BlackRock, Inc. (“BlackRock”) for 1940 Act purposes.
The Master LLC, on behalf of each Portfolio, entered into an Investment Advisory Agreement with the Manager, the Portfolios’ investment advisor, an indirect, wholly owned subsidiary of BlackRock, to provide investment advisory and administration services. The Manager is responsible for the management of each Portfolio and provides the necessary personnel, facilities, equipment and certain other services to the operations of each Portfolio. For such services, each Portfolio pays the Manager a monthly fee based on a percentage of each Portfolio’s average daily net assets at the following annual rates:
Master Large Cap Core Portfolio
| | | | |
| Average Daily Net Assets | | Investment
Advisory Fee | |
Not exceeding $1 Billion | | | 0.50 | % |
In excess of $1 Billion, but not exceeding $5 Billion | | | 0.45 | % |
In excess of $5 Billion | | | 0.40 | % |
Master Large Cap Growth Portfolio
| | | | |
| Average Daily Net Assets | | Investment
Advisory Fee | |
Not exceeding $5 Billion | | | 0.50 | % |
In excess of $5 Billion | | | 0.45 | % |
| | | | | | |
| 68 | | BLACKROCK LARGE CAP SERIES FUNDS, INC. | | MARCH 31, 2015 | | |
| | | | |
| Notes to Financial Statements (continued) | | | Master Large Cap Series LLC | |
Master Large Cap Value Portfolio
| | | | |
| Average Daily Net Assets | | Investment
Advisory Fee | |
Not exceeding $3 Billion | | | 0.50 | % |
In excess of $3 Billion | | | 0.45 | % |
The Manager voluntarily agreed to waive its investment advisory fees by the amount of investment advisory fees each Portfolio pays to the Manager indirectly through its investment in affiliated money market funds. However, the Manager does not waive its investment advisory fees by the amount of investment advisory fees paid in connection with each Portfolio’s investment in other affiliated investment companies, if any. These amounts are shown as fees waived by the Manager in the Statements of Operations.
For the six months ended March 31, 2015, the Portfolios reimbursed the Manager for certain accounting services, which are included in accounting services in the Statements of Operations. The reimbursements were as follows:
| | | | |
Master Large Cap
Core Portfolio | | Master Large Cap
Growth Portfolio | | Master Large Cap
Value Portfolio |
| $11,802 | | $6,083 | | $5,098 |
The U.S. Securities and Exchange Commission has issued an exemptive order which permits BIM, an affiliate of the Manager, to serve as securities lending agent for the Portfolios, subject to applicable conditions. As securities lending agent, BIM bears all operational costs directly related to securities lending. The Portfolios are responsible for expenses in connection with the investment of cash collateral received for securities on loan (the “collateral investment expenses”). The cash collateral is invested in a private investment company managed by the Manager or its affiliates. However, BIM has agreed to cap the collateral investment expenses of the private investment company to an annual rate of 0.04%. The investment advisor to the private investment company will not charge any advisory fees with respect to shares purchased by the Portfolios.
Securities lending income is equal to the total of income earned from the reinvestment of cash collateral, net of fees and other payments to and from borrowers of securities, and less the collateral investment expenses. Each Portfolio retains a portion of securities lending income and remits a remaining portion to BIM as compensation for its services as securities lending agent. Pursuant to a securities lending agreement, BIM may lend securities only when the difference between the borrower rebate rate and the risk free rate exceeds a certain level (such securities, the “specials only securities”).
Pursuant to such agreement, each Portfolio retains 80% of securities lending income. In addition, commencing the business day following the date that the aggregate securities lending income earned across certain funds in the Equity-Liquidity Complex in a calendar year exceeds a specified threshold, each Portfolio, pursuant to the securities lending agreement, will retain for the remainder of the calendar year securities lending income in an amount equal to 85% of securities lending income.
The share of securities lending income earned by each Portfolio is shown as securities lending — affiliated — net in the Statements of Operations. For the six months ended March 31, 2015, each Portfolio paid BIM the following amounts for securities lending agent services:
| | | | |
Master Large Cap
Core Portfolio | | Master Large Cap
Growth Portfolio | | Master Large Cap
Value Portfolio |
| $2,645 | | $11,179 | | $1,111 |
Certain officers and/or directors of the Master LLC are officers and/or directors of BlackRock or its affiliates.
The Portfolios may purchase securities from, or sell securities to, an affiliated fund provided the affiliation is due solely to having a common investment advisor, common officers, or common trustees. For the six months ended March 31, 2015, the purchase and sale transactions with an affiliated fund in compliance with Rule 17a-7 under the 1940 Act were as follows:
| | | | | | | | |
| | | Purchases | | | Sales | |
Master Large Cap Core Portfolio | | | — | | | $ | 12,220,775 | |
Master Large Cap Growth Portfolio | | | — | | | $ | 8,853,705 | |
| | | | | | |
| | | BLACKROCK LARGE CAP SERIES FUNDS, INC. | | MARCH 31, 2015 | | 69 |
| | | | |
| Notes to Financial Statements (continued) | | | Master Large Cap Series LLC | |
6. Purchases and Sales:
Purchases and sales of investments, excluding short-term securities, for the six months ended March 31, 2015, were as follows:
| | | | | | | | | | | | |
| | | Master Large Cap
Core Portfolio | | | Master Large Cap
Growth Portfolio | | | Master Large Cap
Value Portfolio | |
Purchases | | $ | 537,653,919 | | | $ | 238,497,104 | | | $ | 156,353,381 | |
Sales | | $ | 638,573,778 | | | $ | 228,059,952 | | | $ | 206,727,654 | |
7. Income Tax Information
Each Portfolio is classified as a partnership for federal income tax purposes. As such, each investor in the Portfolios is treated as the owner of its proportionate share of net assets, income, expenses and realized and unrealized gains and losses of the Portfolios. Therefore, no federal income tax provision is required. It is intended that the Portfolios’ assets will be managed so an investor in the Portfolios can satisfy the requirements of Subchapter M of the Internal Revenue Code of 1986, as amended.
Each Portfolio files U.S. federal and various state and local tax returns. No income tax returns are currently under examination. The statute of limitations on each Portfolio’s U.S. federal tax returns remains open for each of the four years ended September 30, 2014. The statutes of limitations on each Portfolio’s state and local tax returns may remain open for an additional year depending upon the jurisdiction.
Management has analyzed tax laws and regulations and their application to the Portfolios as of March 31, 2015, and does not believe that there are any uncertain tax positions that require recognition of a tax liability in the Portfolios’ financial statements.
As of March 31, 2015, gross unrealized appreciation and depreciation based on cost for federal income tax purposes were as follows:
| | | | | | | | | | | | |
| | | Master Large Cap
Core Portfolio | | | Master Large Cap
Growth Portfolio | | | Master Large Cap
Value Portfolio | |
Tax cost | | $ | 1,793,001,400 | | | $ | 927,874,071 | | | $ | 728,624,588 | |
| | | | |
Gross unrealized appreciation | | $ | 619,590,193 | | | $ | 362,716,694 | | | $ | 232,364,398 | |
Gross unrealized depreciation | | | (43,557,199 | ) | | | (17,274,331 | ) | | | (16,309,706 | ) |
| | | | |
Net unrealized appreciation | | $ | 576,032,994 | | | $ | 345,442,363 | | | $ | 216,054,692 | |
| | | | |
| | | | | | | | | | | | |
| | | | | | | | | | | | | |
8. Bank Borrowings:
The Master LLC, on behalf of the Portfolios, along with certain other funds managed by the Manager and its affiliates (“Participating Funds”), was a party to a 364-day, $1.1 billion credit agreement with a group of lenders, under which the Portfolios may borrow to fund shareholder redemptions. Excluding commitments designated for a certain individual fund, the Participating Funds, including the Portfolios, could borrow up to an aggregate commitment amount of $650 million, subject to asset coverage and other limitations as specified in the agreement. Effective November 25, 2014, the credit agreement was amended to an aggregate commitment amount of $2.1 billion, of which the Participating Funds, including the Portfolios, can borrow up to $1.6 billion at any time outstanding, subject to asset coverage and other limitations as specified in the agreement. The agreement terminates on April 23, 2015, unless otherwise extended to November 24, 2015 or renewed for a period of 364 days from April 23, 2015. The amended agreement has the following terms: a fee of 0.06% per annum on unused commitment amounts and interest at a rate equal to the higher of (a) one-month LIBOR (but, in any event, not less than 0.00%) on the date the loan is made plus 0.80% per annum or (b) the Fed Funds rate (but, in any event, not less than 0.00%) in effect from time to time plus 0.80% per annum on amounts borrowed. Participating Funds paid administration, legal and arrangement fees, which are included in miscellaneous expenses in the Statements of Operations, and along with commitment fees, were allocated among such funds based upon portions of the aggregate commitment available to them and relative net assets of Participating Funds. During the six months ended March 31, 2015, the Portfolios did not borrow under the credit agreement.
9. Principal Risks:
In the normal course of business, the Portfolios invest in securities and enter into transactions where risks exist due to fluctuations in the market (market risk) or failure of the issuer of a security to meet all its obligations (issuer credit risk). The value of securities held by the Portfolios may decline in response to certain events, including those directly involving the issuers whose securities are owned by the Portfolios; conditions affecting the general economy; overall market changes; local, regional or global political, social or economic instability; and currency and interest rate and price fluctuations. Similar to issuer credit risk, the Portfolios may be exposed to counterparty credit risk, or the risk that an entity with which the Portfolios have unsettled or open transactions may fail to or be unable to perform on its commitments. The Portfolios manage counterparty credit risk by entering into transactions only with counterparties that they believe have the financial resources to honor their obligations and by monitoring the financial stability of those counterparties. Financial assets, which potentially expose the Portfolios to market, issuer and counterparty credit risks, consist principally of financial instruments and receivables due from counterparties. The extent of the Portfolios’ exposure to market, issuer and counterparty credit risks with respect to these financial assets is generally approximated by their value recorded in the Statements of Assets and Liabilities, less any collateral held by the Portfolios.
| | | | | | |
| 70 | | BLACKROCK LARGE CAP SERIES FUNDS, INC. | | MARCH 31, 2015 | | |
| | | | |
| Notes to Financial Statements (concluded) | | | Master Large Cap Series LLC | |
As of March 31, 2015, Master Large Cap Core Portfolio and Master Large Cap Growth Portfolio invested a significant portion of their assets in securities in the Information Technology sector and Master Large Cap Value Portfolio invested a significant portion of its assets in securities in the Financials sector. Changes in economic conditions affecting such sectors would have a greater impact on the Portfolios and could affect the value, income and/or liquidity of positions in such securities.
10. Subsequent Events:
Management’s evaluation of the impact of all subsequent events on the Portfolios’ financial statements was completed through the date the financial statements were issued and the following item was noted:
Effective April 23, 2015, the 364-day, $2.1 billion credit agreement to which the Master LLC is a party, was further amended to expire on April 21, 2016, unless otherwise extended or renewed.
| | | | | | |
| | | BLACKROCK LARGE CAP SERIES FUNDS, INC. | | MARCH 31, 2015 | | 71 |
Rodney D. Johnson, Chair of the Board and Director
David O. Beim, Director
Collette Chilton, Director
Frank J. Fabozzi, Director
Dr. Matina S. Horner, Director
Herbert I. London, Director
Ian A. MacKinnon, Director
Cynthia A. Montgomery, Director
Barbara G. Novick, Director
Joseph P. Platt, Director
Robert C. Robb, Jr., Director
Toby Rosenblatt, Director
Mark Stalnecker, Director
Kenneth L. Urish, Director
Frederick W. Winter, Director
John M. Perlowski, President and Chief Executive Officer
Jennifer McGovern, Vice President
Neal Andrews, Chief Financial Officer
Jay Fife, Treasurer
Charles Park, Chief Compliance Officer
Fernanda Piedra, Anti-Money Laundering Compliance Officer
Benjamin Archibald, Secretary
Effective December 31, 2014, Paul L. Audet and Henry Gabbay resigned as Directors of the Corporation/Master LLC and Ronald W. Forbes resigned as a Director of the Corporation/Master LLC and Co-Chair of the Board. Effective January 1, 2015, Collette Chilton, Barbara G. Novick and Mark Stalnecker were appointed to serve as Directors of the Corporation/Master LLC.
Effective March 1, 2015, Charles Park resigned as Anti-Money Laundering Compliance Officer of the Corporation/Master LLC and Fernanda Piedra became Anti-Money Laundering Compliance Officer of the Corporation/Master LLC.
| | | | | | |
| | | | |
Investment Advisor BlackRock Advisors, LLC Wilmington, DE 19809 | | Custodian Brown Brothers Harriman & Co. Boston, MA 02109 | | Distributor BlackRock Investments, LLC New York, NY 10022 | | Address of the Corporation/ Master LLC 100 Bellevue Parkway Wilmington, DE 19809 |
| | | | | | |
Legal Counsel Sidley Austin LLP New York, NY 10019 | | Independent Registered Public Accounting Firm Deloitte & Touche LLP Philadelphia, PA 19103 | | Accounting Agent and Transfer Agent BNY Mellon Investment Servicing (US) Inc. Wilmington, DE 19809 | | |
| | | | | | |
| 72 | | BLACKROCK LARGE CAP SERIES FUNDS, INC. | | MARCH 31, 2015 | | |
Householding
The Feeder Funds will mail only one copy of shareholder documents, including prospectuses, annual and semi-annual reports and proxy statements, to shareholders with multiple accounts at the same address. This practice is commonly called “householding” and is intended to reduce expenses and eliminate duplicate mailings of shareholder documents. Mailings of your shareholder documents may be householded indefinitely unless you instruct us otherwise. If you do not want the mailing of these documents to be combined with those for other members of your household, please call the Fund at (800) 441-7762.
Availability of Quarterly Schedule of Investments
The Feeder Funds/Portfolios file their complete schedule of portfolio holdings with the SEC for the first and third quarters of each fiscal year on Form N-Q. The Feeder Funds’/Portfolios’ Forms N-Q are available on the SEC’s website at http://www.sec.gov and may also be reviewed and copied at the SEC’s Public Reference Room in Washington, DC. Information on how to access documents on the SEC’s website without charge may be obtained by calling (800) SEC-0330. The Feeder Funds’/Portfolios’ Forms N-Q may also be obtained upon request and without charge by calling (800) 441-7762.
Availability of Proxy Voting Policies and Procedures
A description of the policies and procedures that the Feeder Funds/Portfolios use to determine how to vote proxies relating to portfolio securities is available upon request and without charge, (1) by calling (800) 441-7762; (2) at http://www.blackrock.com; and (3) on the SEC’s website at http://www.sec.gov.
Availability of Proxy Voting Record
Information about how the Feeder Funds/Portfolios voted proxies relating to securities held in the Portfolios’ portfolio during the most recent 12-month period ended June 30 is available upon request and without charge (1) at http://www.blackrock.com or by calling (800) 441-7762 and (2) on the SEC’s website at http://www.sec.gov.
BlackRock’s Mutual Fund Family
BlackRock offers a diverse lineup of open-end mutual funds crossing all investment styles and managed by experts in equity, fixed income and tax-exempt investing. Visit http://www.blackrock.com for more information.
Account Information
Call us at (800) 441-7762 from 8:00 AM to 6:00 PM EST on any business day to get information about your account balances, recent transactions and share prices. You can also reach us on the Web at http://www.blackrock.com/funds.
Automatic Investment Plans
Investor Class shareholders who want to invest regularly can arrange to have $50 or more automatically deducted from their checking or savings account and invested in any of the BlackRock funds.
Systematic Withdrawal Plans
Investor Class shareholders can establish a systematic withdrawal plan and receive periodic payments of $50 or more from their BlackRock funds, as long as their account balance is at least $10,000.
Retirement Plans
Shareholders may make investments in conjunction with Traditional, Rollover, Roth, Coverdell, Simple IRAs, SEP IRAs and 403(b) Plans.
| | | | | | |
| | | BLACKROCK LARGE CAP SERIES FUNDS, INC. | | MARCH 31, 2015 | | 73 |
| | |
| Additional Information (concluded) | | |
|
| BlackRock Privacy Principles |
BlackRock is committed to maintaining the privacy of its current and former fund investors and individual clients (collectively, “Clients”) and to safeguarding their non-public personal information. The following information is provided to help you understand what personal information BlackRock collects, how we protect that information and why in certain cases we share such information with select parties.
If you are located in a jurisdiction where specific laws, rules or regulations require BlackRock to provide you with additional or different privacy-related rights beyond what is set forth below, then BlackRock will comply with those specific laws, rules or regulations.
BlackRock obtains or verifies personal non-public information from and about you from different sources, including the following: (i) information we receive from you or, if applicable, your financial intermediary, on applications, forms or other documents; (ii) information about your transactions with us, our affiliates, or others; (iii) information we receive from a consumer reporting agency; and (iv) from visits to our websites.
BlackRock does not sell or disclose to non-affiliated third parties any non-public personal information about its Clients, except as permitted by law or as is necessary to respond to regulatory requests or to service Client accounts. These non-affiliated third parties are required to protect the confidentiality and security of this information and to use it only for its intended purpose.
We may share information with our affiliates to service your account or to provide you with information about other BlackRock products or services that may be of interest to you. In addition, BlackRock restricts access to non-public personal information about its Clients to those BlackRock employees with a legitimate business need for the information. BlackRock maintains physical, electronic and procedural safeguards that are designed to protect the non-public personal information of its Clients, including procedures relating to the proper storage and disposal of such information.
| | | | | | |
| 74 | | BLACKROCK LARGE CAP SERIES FUNDS, INC. | | MARCH 31, 2015 | | |
This report is intended for current holders. It is not authorized for use as an offer of sale or a solicitation of an offer to buy shares of a Fund unless accompanied or preceded by that Fund’s current prospectus. Past performance results shown in this report should not be considered a representation of future performance. Investment returns and principal value of shares will fluctuate so that shares, when redeemed, may be worth more or less than their original cost. Statements and other information herein are as dated and are subject to change.

| | |
CAPSERIES-3/15-SAR | |  |
MARCH 31, 2015
| | | | |
SEMI-ANNUAL REPORT (UNAUDITED) | | | | BLACKROCK® |
| | | | |
| | BlackRock Large Cap Core Plus Fund | | of BlackRock Large Cap Series Funds, Inc. |
| | |
| Not FDIC Insured ¡ May Lose Value ¡ No Bank Guarantee | | |
| | |
| |
 | | Shareholders can sign up for e-mail notifications of quarterly statements, annual and semi-annual shareholder reports and prospectuses by enrolling in the electronic delivery program. Electronic copies of shareholder reports and prospectuses are also available on BlackRock’s website. TO ENROLL IN ELECTRONIC DELIVERY: |
| | Shareholders Who Hold Accounts with Investment Advisors, Banks or Brokerages: |
| | Please contact your financial advisor. Please note that not all investment advisors, banks or brokerages may offer this service. Shareholders Who Hold Accounts Directly with BlackRock: 1. Access the BlackRock website at blackrock.com 2. Select “Access Your Account” 3. Next, select “eDelivery” in the “Related Resources” box and follow the sign-up instructions |
| | | | | | |
| 2 | | BLACKROCK LARGE CAP CORE PLUS FUND | | MARCH 31, 2015 | | |
Dear Shareholder,
Market volatility has remained low from a long-term perspective, but increased over the course of 2014 amid higher valuations in risk assets (such as equities and high yield bonds), geopolitical risks, uneven global economic growth and uncertainty around policy moves from the world’s largest central banks. As the U.S. Federal Reserve (the “Fed”) gradually reduced its bond buying program (which ultimately ended in October 2014), U.S. interest rates surprisingly trended lower and stock prices forged ahead despite high valuations on the back of a multi-year bull market. Geopolitical tensions intensified in Ukraine and the Middle East and oil prices became highly volatile in the middle of the summer, stoking worries about economic growth outside the United States. As the U.S. economy continued to show steady improvement, the stronger data caused concern among investors that the Fed would raise short-term rates sooner than previously anticipated. The U.S. dollar appreciated and global credit markets tightened, ultimately putting a strain on investor flows, and financial markets broadly weakened in the third quarter.
U.S. economic growth picked up considerably in the fourth quarter while the broader global economy showed signs of slowing. U.S. markets significantly outperformed international markets even as the European Central Bank (“ECB”) and the Bank of Japan eased monetary policy, which drove further strengthening in the U.S. dollar. Oil prices plummeted in the fourth quarter due to a global supply-and-demand imbalance, sparking a selloff in energy-related assets and stress in emerging markets. Fixed income investors piled into U.S. Treasuries as their persistently low yields became relatively attractive as compared to international sovereign debt.
Equity markets reversed in the first quarter of 2015 and U.S. stocks underperformed international markets, notably Europe and Japan, but also emerging markets. Investors had held high expectations for the U.S. economy, but after a harsh winter, first-quarter data disappointed and high valuations took their toll on U.S. stocks. Meanwhile, economic reports in Europe and Asia easily beat investors’ very low expectations for those economies, and accommodative policies from global central banks helped international equities rebound. The ECB’s asset purchase program (announced in January and commenced in March) was the largest in scale and effect on the markets. Overall, market volatility decreased in the first quarter as global risks abated, with a ceasefire in Ukraine and an improving outlook for Greece’s continued membership in the Eurozone.
At BlackRock, we believe investors need to think globally, extend their scope across a broad array of asset classes and be prepared to move freely as market conditions change over time. We encourage you to talk with your financial advisor and visit blackrock.com for further insight about investing in today’s markets.
Sincerely,

Rob Kapito
President, BlackRock Advisors, LLC

Rob Kapito
President, BlackRock Advisors, LLC
| | | | | | | | |
| Total Returns as of March 31, 2015 | |
| | | 6-month | | | 12-month | |
U.S. large cap equities
(S&P 500® Index) | | | 5.93 | % | | | 12.73 | % |
U.S. small cap equities
(Russell 2000® Index) | | | 14.46 | | | | 8.21 | |
International equities
(MSCI Europe, Australasia, Far East Index) | | | 1.13 | | | | (0.92 | ) |
Emerging market equities
(MSCI Emerging Markets Index) | | | (2.37 | ) | | | 0.44 | |
3-month Treasury bills
(BofA Merrill Lynch
3-Month U.S. Treasury
Bill Index) | | | 0.01 | | | | 0.03 | |
U.S. Treasury securities
(BofA Merrill Lynch
10-Year U.S. Treasury
Index) | | | 6.25 | | | | 9.88 | |
U.S. investment grade
bonds (Barclays U.S.
Aggregate Bond Index) | | | 3.43 | | | | 5.72 | |
Tax-exempt
municipal bonds (S&P Municipal Bond Index) | | | 2.29 | | | | 6.60 | |
U.S. high yield bonds
(Barclays U.S. Corporate
High Yield 2% Issuer
Capped Index) | | | 1.50 | | | | 2.00 | |
|
| Past performance is no guarantee of future results. Index performance is shown for illustrative purposes only. You cannot invest directly in an index. | |
| | | | | | |
| | | THIS PAGE NOT PART OF YOUR FUND REPORT | | | | 3 |
| | |
| Fund Summary as of March 31, 2015 | | |
BlackRock Large Cap Core Plus Fund’s (the “Fund”) investment objective is to seek long-term capital growth. In other words, the Fund tries to choose investments that will increase in value.
On February 19, 2015, the Board of Directors of BlackRock Large Cap Series Funds, Inc. approved changes to the Fund’s name and investment strategies which became effective on May 8, 2015. The Fund changed its name to BlackRock Event Driven Equity Fund. Under its new investment strategies, the Fund will continue to seek to achieve its investment objective by investing, under normal circumstances, at least 80% of its net assets (plus any borrowings for investment purposes) in equity securities and related derivative instruments with similar economic characteristics. The Fund will seek to achieve its investment objective by employing an event driven strategy, primarily investing in companies that have announced a material change or in companies that the Fund’s investment advisor expects to undergo a material change. In addition, effective March 13, 2015, the Fund was closed to new investors.
|
| Portfolio Management Commentary |
How did the Fund perform?
| • | | For the six-month period ended March 31, 2015, the Fund underperformed its benchmark, the Russell 1000® Index. |
| • | | The Fund pursued long-term capital growth by taking long positions (i.e., purchases the security outright) primarily in large cap companies identified as attractive, and short positions (i.e., sells a security that it has borrowed) in securities identified as overvalued or poised for underperformance. |
What factors influenced performance?
| • | | The Fund’s long positions within financials were a principal detractor from performance. The Fund’s most interest-rate-sensitive bank holdings (particularly Bank of America) lagged amid a further decline in long-term Treasury rates. In addition, multi-line insurer Genworth Financial Inc. underperformed as the company announced reserve charges related to its long-term care business that caused its shares to sharply decline. The position was removed from the Fund by the end of the reporting period. Elsewhere in the sector, the Fund’s underweight in real estate investment trusts (“REITs”) detracted, as the industry benefited from declining interest rates. Exposure to Discover Financial Services was an additional drag on performance. |
| • | | Information technology (IT) was a second source of underperformance, largely owing to a tilt toward enterprise hardware and compute-intensive semiconductor companies. Key names underperformed as the combination of slow economic growth in many emerging markets and a strong dollar dampened PC sales expectations. Micron Technology Inc. was the leading individual detractor within the long segment of the Fund for the six-month period. The Fund’s overweight in EMC Corp. also dampened relative performance in the sector, as did an underweight in strong-performing Apple Inc. |
| • | | The weakness in energy over the period impacted the Fund as well, notably through its weighting toward energy services companies whose stock prices tend to be correlated with the price of oil. The Fund’s position in Halliburton Co. was a particular laggard, as its shares were further weighed upon by the market’s negative reaction to its plan to purchase competitor Baker Hughes. |
| • | | The Fund’s short positions detracted from performance, most notably on names in the health care and consumer discretionary sectors. |
| • | | Conversely, in the long segment of the Fund, relative performance was supported by strong selection in the health care sector, especially the Fund’s positions in managed-care companies. Strong earnings from several bellwether stocks boosted sentiment across the group, with better-than-feared preliminary Medicare Advantage payment rates from the Centers for Medicare & Medicaid Services (CMS) providing an additional lift. Market speculation about further consolidation in the industry was a driver in the period as well. |
| • | | Additional contributions came from Lowe’s Companies Inc. and CVS Health Corp. Lowe’s Companies Inc. was the top individual contributor within the Fund over the six months as the stock outperformed on solid business execution, dominant (and growing) market share, and a favorable industry backdrop. Overall, home-improvement retailers delivered standout results relative to the broader retail universe, benefiting from the consumer spending shift towards durables. CVS Health Corp. outperformed on consistently strong earnings reports, market share gains (particularly in its pharmacy benefit management unit), and a robust business outlook. Lastly, a position in refiner Tesoro Corp. aided relative returns. |
| • | | Among short positions, the Fund generated strong performance in the energy sector. |
Describe recent portfolio activity.
| • | | Due to a combination of portfolio trading activity and market movement during the six-month period, the Fund’s long exposure increased in the health care sector, specifically within health care providers & services, as well as in consumer discretionary, particularly the specialty retail and hotels, restaurants & leisure industries. The allocation to consumer staples also increased, mainly within food & staples retailing. The Fund’s weighting in energy decreased, both in oil, gas & consumable fuels and energy equipment & services. Exposure to financials and IT also declined. |
Describe portfolio positioning at period end.
| • | | Relative to the Russell 1000® Index, the long segment of the Fund ended the period with its largest sector overweight positions in IT and health care. Energy and utilities were the most significant underweights. |
The views expressed reflect the opinions of BlackRock as of the date of this report and are subject to change based on changes in market, economic or other conditions. These views are not intended to be a forecast of future events and are no guarantee of future results.
| | | | | | |
| 4 | | BLACKROCK LARGE CAP CORE PLUS FUND | | MARCH 31, 2015 | | |
|
| Total Return Based on a $10,000 Investment |
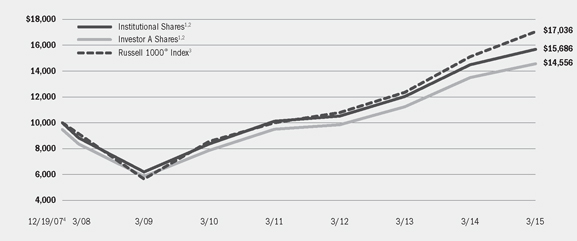
| | 1 | Assuming maximum sales charges, if any, transaction costs and other operating expenses, including investment advisory fees. Institutional Shares do not have a sales charge. |
| | 2 | The Fund invests by establishing long and short positions in a diversified portfolio of equity securities issued primarily by large cap companies located in the United States. |
| | 3 | An index that measures the performance of the large cap segment of the U.S. equity universe. It is a subset of the Russell 3000® Index and includes approximately 1,000 of the largest securities based on a combination of their market capitalization and current index membership. The index represents approximately 92% of the total market capitalization of the Russell 3000® Index. |
| | 4 | Commencement of operations. |
| | | | | | | | | | | | | | | | | | | | | | | | | | | | |
| Performance Summary for the Period Ended March 31, 2015 | |
| | | | | | Average Annual Total Returns5 | |
| | | | | | 1 Year | | | 5 Years | | | Since Inception6 | |
| | | 6-Month
Total Returns | | | w/o sales
charge | | | w/sales
charge | | | w/o sales
charge | | | w/sales
charge | | | w/o sales
charge | | | w/sales
charge | |
Institutional | | | 5.55 | % | | | 8.23 | % | | | N/A | | | | 13.44 | % | | | N/A | | | | 6.38 | % | | | N/A | |
Investor A | | | 5.36 | | | | 7.93 | | | | 2.26 | % | | | 13.09 | | | | 11.88 | % | | | 6.07 | | | | 5.29 | % |
Investor C | | | 5.01 | | | | 7.12 | | | | 6.12 | | | | 12.29 | | | | 12.29 | | | | 5.30 | | | | 5.30 | |
Russell 1000® Index | | | 6.55 | | | | 12.73 | | | | N/A | | | | 14.73 | | | | N/A | | | | 7.59 | | | | N/A | |
| | 5 | | Assuming maximum sales charges, if any. Average annual total returns with and without sales charges reflect reductions for distribution and service fees. See “About Fund Performance” on page 6 for a detailed description of share classes, including any related sales charges and fees. |
| | 6 | | The Fund commenced operations on December 19, 2007. |
| | | | N/A—Not applicable as share class and index do not have a sales charge. |
| | | | Past performance is not indicative of future results. |
| | | | | | | | | | | | | | | | | | | | | | | | | | | | | | | | | | | | |
| Expense Example | |
| | | Actual | | | Hypothetical9 | |
| | | | | | | | | Expenses Paid During the Period | | | | | | Including Dividend Expense,
Stock Loan Fees and
Interest Expense | | | Excluding Dividend Expense,
Stock Loan Fees and
Interest Expense | |
| | | Beginning
Account Value
October 1, 2014 | | | Ending
Account Value
March 31, 2015 | | | Including Dividend
Expense, Stock
Loan Fees and
Interest Expense7 | | | Excluding Dividend
Expense, Stock
Loan Fees and
Interest Expense8 | | | Beginning
Account Value
October 1, 2014 | | | Ending
Account Value
March 31, 2015 | | | Expenses
Paid During
the Period7 | | | Ending
Account Value
March 31, 2015 | | | Expenses
Paid During
the Period8 | |
Institutional | | $ | 1,000.00 | | | $ | 1,055.50 | | | $ | 11.02 | | | $ | 7.07 | | | $ | 1,000.00 | | | $ | 1,014.21 | | | $ | 10.80 | | | $ | 1,018.05 | | | $ | 6.94 | |
Investor A | | $ | 1,000.00 | | | $ | 1,053.60 | | | $ | 12.39 | | | $ | 8.45 | | | $ | 1,000.00 | | | $ | 1,012.86 | | | $ | 12.14 | | | $ | 1,016.70 | | | $ | 8.30 | |
Investor C | | $ | 1,000.00 | | | $ | 1,050.10 | | | $ | 16.15 | | | $ | 12.22 | | | $ | 1,000.00 | | | $ | 1,009.17 | | | $ | 15.83 | | | $ | 1,013.01 | | | $ | 11.99 | |
| | 7 | | For each class of the Fund, expenses are equal to the annualized expense ratio for the class (2.15% for Institutional, 2.42% for Investor A, and 3.16% for Investor C), multiplied by the average account value over the period, multiplied by 182/365 (to reflect the one-half year period shown). |
| | 8 | | For each class of the Fund, expenses are equal to the annualized expense ratio for the class (1.38% for Institutional, 1.65% for Investor A, and 2.39% for Investor C), multiplied by the average account value over the period, multiplied by 182/365 (to reflect the one-half year period shown). |
| | 9 | | Hypothetical 5% annual return before expenses is calculated by pro rating the number of days in the most recent fiscal half year divided by 365. |
| | | | See “Disclosure of Expenses” on page 6 for further information on how expenses were calculated. |
| | | | | | |
| | | BLACKROCK LARGE CAP CORE PLUS FUND | | MARCH 31, 2015 | | 5 |
| • | | Institutional Shares are not subject to any sales charge. These shares bear no ongoing distribution or service fees and are available only to certain eligible investors. |
| • | | Investor A Shares are subject to a maximum initial sales charge (front-end load) of 5.25% and a service fee of 0.25% per year (but no distribution fee). Certain redemptions of these shares may be subject to a contingent deferred sales charge (“CDSC”) where no initial sales charge was paid at the time of purchase. These shares are generally available through financial intermediaries. |
| • | | Investor C Shares are subject to a 1.00% CDSC if redeemed within one year of purchase. In addition, these shares are subject to a distribution fee of 0.75% per year and a service fee of 0.25% per year. These shares are generally available through financial intermediaries. |
Performance information reflects past performance and does not guarantee future results. Current performance may be lower or higher than the performance data quoted. Refer to www.blackrock.com/funds to obtain performance data current to the most recent month end. Performance results do not reflect the deduction of taxes that a shareholder
would pay on fund distributions or the redemption of fund shares. Figures shown in the performance table on the previous page assume reinvestment of all distributions, if any, at net asset value (“NAV”) on the ex-dividend date. Investment return and principal value of shares will fluctuate so that shares, when redeemed, may be worth more or less than their original cost. Distributions paid to each class of shares will vary because of the different levels of service, distribution and transfer agency fees applicable to each class, which are deducted from the income available to be paid to shareholders.
BlackRock Advisors, LLC (the “Manager”), the Fund’s investment advisor, has contractually agreed to waive and/or reimburse a portion of the Fund’s expenses. Without such waiver and/or reimbursement, the Fund’s performance would have been lower. The Manager is under no obligation to continue waiving and/or reimbursing its fees after the applicable termination date of such agreement. See Note 4 of the Notes to Financial Statements for additional information on waivers and/or reimbursements.
Shareholders of the Fund may incur the following charges: (a) transactional expenses, such as sales charges and (b) operating expenses, including investment advisory fees, service and distribution fees, including 12b-1 fees, and other Fund expenses. The expense example shown on the previous page (which is based on a hypothetical investment of $1,000 invested on October 1, 2014 and held through March 31, 2015) is intended to assist shareholders both in calculating expenses based on an investment in the Fund and in comparing these expenses with similar costs of investing in other mutual funds.
The expense example provides information about actual account values and actual expenses. In order to estimate the expenses a shareholder paid during the period covered by this report, shareholders can divide their account value by $1,000 and then multiply the result by the number corresponding to their share class under the heading entitled “Expenses Paid During the Period.”
The expense example also provides information about hypothetical account values and hypothetical expenses based on the Fund’s actual expense ratio and an assumed rate of return of 5% per year before expenses. In order to assist shareholders in comparing the ongoing expenses of investing in the Fund and other funds, compare the 5% hypothetical example with the 5% hypothetical examples that appear in shareholder reports of other funds.
The expenses shown in the expense example are intended to highlight shareholders’ ongoing costs only and do not reflect any transactional expenses, such as sales charges, if any. Therefore, the hypothetical example is useful in comparing ongoing expenses only, and will not help shareholders determine the relative total expenses of owning different funds. If these transactional expenses were included, shareholder expenses would have been higher.
|
| Derivative Financial Instruments |
The Fund may invest in various derivative financial instruments. Derivative financial instruments are used to obtain exposure to a security, index and/or market without owning or taking physical custody of securities or to hedge market, equity, credit, interest rate, foreign currency exchange rate, commodity and/or other risks. Derivative financial instruments involve risks, including the imperfect correlation between the value of a derivative financial instrument and the underlying asset, possible default of the counterparty to the transaction or illiquidity of the derivative financial instrument. The Fund’s ability to use a derivative financial instrument successfully depends on the investment advisor’s ability to predict
pertinent market movements accurately, which cannot be assured. The use of derivative financial instruments may result in losses greater than if they had not been used, may require the Fund to sell or purchase portfolio investments at inopportune times or for distressed values, may limit the amount of appreciation the Fund can realize on an investment, may result in lower distributions paid to shareholders and/or may cause the Fund to hold an investment that it might otherwise sell. The Fund’s investments in these instruments are discussed in detail in the Notes to Financial Statements.
| | | | | | |
| 6 | | BLACKROCK LARGE CAP CORE PLUS FUND | | MARCH 31, 2015 | | |
| | |
| Fund Information as of March 31, 2015 (Unaudited) | | |
| | |
| Ten Largest Holdings | | Percent of
Long-Term Investments |
| | | | |
CVS Health Corp. | | | 3 | % |
JPMorgan Chase & Co. | | | 3 | |
Lowe’s Companies, Inc. | | | 3 | |
Comcast Corp., Class A | | | 2 | |
3M Co. | | | 2 | |
U.S. Bancorp | | | 2 | |
Aetna, Inc. | | | 2 | |
Citigroup, Inc. | | | 2 | |
Bank of America Corp. | | | 2 | |
Teva Pharmaceutical Industries Ltd. - ADR | | | 2 | |
| | |
| Sector Allocation | | Percent of
Long-Term Investments |
| | | | |
Information Technology | | | 24 | % |
Health Care | | | 18 | |
Financials | | | 18 | |
Consumer Discretionary | | | 12 | |
Industrials | | | 10 | |
Energy | | | 8 | |
Consumer Staples | | | 7 | |
Materials | | | 3 | |
| | |
| Ten Largest Investments Sold Short | | Percent of
Investments Sold Short |
| | | | |
Kraft Foods Group, Inc. | | | 2 | % |
SM Energy Co. | | | 1 | |
Zynga, Inc., Class A | | | 1 | |
SandRidge Energy, Inc. | | | 1 | |
BioMarin Pharmaceutical, Inc. | | | 1 | |
Range Resources Corp. | | | 1 | |
Laredo Petroleum, Inc. | | | 1 | |
Sears Holdings Corp. | | | 1 | |
Pandora Media, Inc. | | | 1 | |
Intercept Pharmaceuticals, Inc. | | | 1 | |
| | |
| Sector Allocation | | Percent of
Investments Sold Short |
| | | | |
Information Technology | | | 22 | % |
Energy | | | 21 | |
Consumer Discretionary | | | 14 | |
Health Care | | | 12 | |
Industrials | | | 8 | |
Financials | | | 7 | |
Materials | | | 6 | |
Consumer Staples | | | 5 | |
Utilities | | | 3 | |
Telecommunication Services | | | 2 | |
For Fund compliance purposes, the Fund’s sector classifications refer to any one or more of the sector sub-classifications used by one or more widely recognized market indexes or ratings group indexes, and/or as defined by the investment advisor. These definitions may not apply for purposes of this report, which may combine such sector sub-classifications for reporting ease.
| | | | | | |
| | | BLACKROCK LARGE CAP CORE PLUS FUND | | MARCH 31, 2015 | | 7 |
| | | | |
| Schedule of Investments March 31, 2015 (Unaudited) | | | | |
| | | (Percentages shown are based on Net Assets) | |
| | | | | | | | |
| Common Stocks | | Shares | | | Value | |
Aerospace & Defense — 1.6% | | | | | | | | |
Honeywell International, Inc. | | | 660 | | | $ | 68,845 | |
Raytheon Co. | | | 4,020 | | | | 439,185 | |
| | | | | | | | |
| | | | | | | | 508,030 | |
Air Freight & Logistics — 1.5% | | | | | | | | |
FedEx Corp. | | | 2,880 | | | | 476,496 | |
Airlines — 2.3% | | | | | | | | |
Southwest Airlines Co. | | | 6,530 | | | | 289,279 | |
United Continental Holdings, Inc. (a)(b) | | | 6,580 | | | | 442,505 | |
| | | | | | | | |
| | | | | | | | 731,784 | |
Auto Components — 0.8% | | | | | | | | |
Lear Corp. | | | 2,200 | | | | 243,804 | |
Banks — 14.9% | | | | | | | | |
Bank of America Corp. | | | 57,207 | | | | 880,416 | |
Citigroup, Inc. (b) | | | 17,950 | | | | 924,784 | |
JPMorgan Chase & Co. (b) | | | 19,723 | | | | 1,194,819 | |
SunTrust Banks, Inc. | | | 14,960 | | | | 614,706 | |
U.S. Bancorp (b) | | | 22,570 | | | | 985,632 | |
Wells Fargo & Co. | | | 3,740 | | | | 203,456 | |
| | | | | | | | |
| | | | | | | | 4,803,813 | |
Beverages — 3.5% | | | | | | | | |
Dr Pepper Snapple Group, Inc. | | | 8,710 | | | | 683,561 | |
Molson Coors Brewing Co., Class B | | | 6,080 | | | | 452,656 | |
| | | | | | | | |
| | | | | | | | 1,136,217 | |
Biotechnology — 2.4% | | | | | | | | |
Amgen, Inc. (b) | | | 4,950 | | | | 791,257 | |
Capital Markets — 1.1% | | | | | | | | |
The Goldman Sachs Group, Inc. | | | 1,810 | | | | 340,226 | |
Chemicals — 1.5% | | | | | | | | |
Cabot Corp. | | | 3,494 | | | | 157,230 | |
The Dow Chemical Co. | | | 2,820 | | | | 135,304 | |
PPG Industries, Inc. | | | 840 | | | | 189,454 | |
| | | | | | | | |
| | | | | | | | 481,988 | |
Communications Equipment — 4.2% | | | | | | | | |
Brocade Communications Systems, Inc. | | | 30,060 | | | | 356,662 | |
Cisco Systems, Inc. | | | 24,980 | | | | 687,574 | |
QUALCOMM, Inc. (b) | | | 4,580 | | | | 317,577 | |
| | | | | | | | |
| | | | | | | | 1,361,813 | |
Construction & Engineering — 1.0% | | | | | | | | |
AECOM (a) | | | 10,000 | | | | 308,200 | |
Consumer Finance — 3.2% | | | | | | | | |
Discover Financial Services (b) | | | 12,180 | | | | 686,343 | |
SLM Corp. | | | 37,105 | | | | 344,334 | |
| | | | | | | | |
| | | | | | | | 1,030,677 | |
Containers & Packaging — 0.9% | | | | | | | | |
Packaging Corp. of America | | | 3,876 | | | | 303,064 | |
| | | | | | | | |
| Common Stocks | | Shares | | | Value | |
Electronic Equipment, Instruments & Components — 0.8% | |
TE Connectivity Ltd. | | | 580 | | | $ | 41,540 | |
Zebra Technologies Corp., Class A (a) | | | 2,372 | | | | 215,176 | |
| | | | | | | | |
| | | | | | | | 256,716 | |
Energy Equipment & Services — 3.0% | | | | | | | | |
Atwood Oceanics, Inc. | | | 3,820 | | | | 107,380 | |
Halliburton Co. | | | 1,830 | | | | 80,300 | |
Schlumberger Ltd. | | | 7,850 | | | | 655,004 | |
Weatherford International PLC (a) | | | 10,540 | | | | 129,642 | |
| | | | | | | | |
| | | | | | | | 972,326 | |
Food & Staples Retailing — 5.1% | | | | | | | | |
CVS Health Corp. (b) | | | 12,430 | | | | 1,282,900 | |
The Kroger Co. | | | 620 | | | | 47,529 | |
Wal-Mart Stores, Inc. | | | 3,790 | | | | 311,728 | |
| | | | | | | | |
| | | | | | | | 1,642,157 | |
Food Products — 0.6% | | | | | | | | |
Pilgrim’s Pride Corp. | | | 2,850 | | | | 64,382 | |
Tyson Foods, Inc., Class A | | | 3,000 | | | | 114,900 | |
| | | | | | | | |
| | | | | | | | 179,282 | |
Health Care Equipment & Supplies — 0.1% | | | | | | | | |
Medtronic PLC | | | 570 | | | | 44,454 | |
Health Care Providers & Services — 15.0% | | | | | | | | |
Aetna, Inc. (b) | | | 8,760 | | | | 933,203 | |
Centene Corp. (a) | | | 7,400 | | | | 523,106 | |
Cigna Corp. | | | 5,000 | | | | 647,200 | |
Express Scripts Holding Co. (a) | | | 1,460 | | | | 126,684 | |
Humana, Inc. | | | 1,970 | | | | 350,699 | |
Laboratory Corp. of America Holdings (a) | | | 3,720 | | | | 469,055 | |
McKesson Corp. | | | 2,460 | | | | 556,452 | |
UnitedHealth Group, Inc. | | | 6,170 | | | | 729,849 | |
Universal Health Services, Inc., Class B | | | 4,328 | | | | 509,449 | |
| | | | | | | | |
| | | | | | | | 4,845,697 | |
Hotels, Restaurants & Leisure — 2.3% | | | | | | | | |
Carnival Corp. | | | 10,799 | | | | 516,624 | |
Las Vegas Sands Corp. | | | 3,820 | | | | 210,253 | |
| | | | | | | | |
| | | | | | | | 726,877 | |
Industrial Conglomerates — 3.2% | | | | | | | | |
3M Co. | | | 6,290 | | | | 1,037,536 | |
Insurance — 3.8% | | | | | | | | |
American International Group, Inc. (b) | | | 12,920 | | | | 707,887 | |
The Travelers Cos., Inc. | | | 4,865 | | | | 526,052 | |
| | | | | | | | |
| | | | | | | | 1,233,939 | |
Internet & Catalog Retail — 0.6% | | | | | | | | |
The Priceline Group, Inc. (a) | | | 156 | | | | 181,607 | |
Internet Software & Services — 5.0% | | | | | | | | |
Facebook, Inc., Class A (a) | | | 7,100 | | | | 583,726 | |
| | |
| Portfolio Abbreviation |
| ADR | | American Depositary Receipts |
| SPDR | | Standard & Poor’s Depositary Receipts |
See Notes to Financial Statements.
| | | | | | |
| 8 | | BLACKROCK LARGE CAP CORE PLUS FUND | | MARCH 31, 2015 | | |
| | | | |
| Schedule of Investments (continued) | | | | |
| | | (Percentages shown are based on Net Assets) | |
| | | | | | | | |
| Common Stocks | | Shares | | | Value | |
Internet Software & Services (concluded) | | | | | | | | |
Google, Inc., Class A (a) | | | 939 | | | $ | 520,863 | |
Google, Inc., Class C (a) | | | 959 | | | | 525,532 | |
| | | | | | | | |
| | | | | | | | 1,630,121 | |
IT Services — 6.2% | | | | | | | | |
Alliance Data Systems Corp. (a) | | | 290 | | | | 85,912 | |
Amdocs Ltd. | | | 5,468 | | | | 297,459 | |
Cognizant Technology Solutions Corp., Class A (a) | | | 3,170 | | | | 197,776 | |
DST Systems, Inc. (b) | | | 3,915 | | | | 433,430 | |
MasterCard, Inc., Class A (b) | | | 8,520 | | | | 736,043 | |
Total System Services, Inc. | | | 6,177 | | | | 235,653 | |
| | | | | | | | |
| | | | | | | | 1,986,273 | |
Machinery — 2.5% | | | | | | | | |
Dover Corp. | | | 1,630 | | | | 112,666 | |
Parker Hannifin Corp. | | | 2,618 | | | | 310,966 | |
WABCO Holdings, Inc. (a) | | | 3,240 | | | | 398,131 | |
| | | | | | | | |
| | | | | | | | 821,763 | |
Media — 3.8% | | | | | | | | |
Comcast Corp., Class A (b) | | | 18,600 | | | | 1,050,342 | |
Omnicom Group, Inc. | | | 2,230 | | | | 173,895 | |
| | | | | | | | |
| | | | | | | | 1,224,237 | |
Multiline Retail — 0.9% | | | | | | | | |
Macy’s, Inc. | | | 4,600 | | | | 298,586 | |
Multi-Utilities — 0.5% | | | | | | | | |
Public Service Enterprise Group, Inc. | | | 3,640 | | | | 152,589 | |
Oil, Gas & Consumable Fuels — 6.8% | | | | | | | | |
BP PLC — ADR | | | 11,870 | | | | 464,236 | |
Exxon Mobil Corp. (b) | | | 1,555 | | | | 132,175 | |
Hess Corp. | | | 4,153 | | | | 281,864 | |
Marathon Petroleum Corp. | | | 1,956 | | | | 200,275 | |
PBF Energy, Inc., Class A | | | 3,660 | | | | 124,147 | |
Suncor Energy, Inc. (b) | | | 17,995 | | | | 526,354 | |
Tesoro Corp. (b) | | | 5,290 | | | | 482,924 | |
| | | | | | | | |
| | | | | | | | 2,211,975 | |
Paper & Forest Products — 1.1% | | | | | | | | |
Domtar Corp. | | | 7,660 | | | | 354,045 | |
Pharmaceuticals — 6.0% | | | | | | | | |
AstraZeneca PLC — ADR | | | 6,090 | | | | 416,739 | |
Johnson & Johnson | | | 1,380 | | | | 138,828 | |
Merck & Co., Inc. (b) | | | 1,836 | | | | 105,533 | |
Pfizer, Inc. | | | 1,150 | | | | 40,010 | |
Shire PLC — ADR | | | 1,680 | | | | 402,007 | |
Teva Pharmaceutical Industries Ltd. — ADR | | | 13,608 | | | | 847,778 | |
| | | | | | | | |
| | | | | | | | 1,950,895 | |
Road & Rail — 1.2% | | | | | | | | |
Norfolk Southern Corp. | | | 2,620 | | | | 269,650 | |
Union Pacific Corp. | | | 1,020 | | | | 110,476 | |
| | | | | | | | |
| | | | | | | | 380,126 | |
Semiconductors & Semiconductor Equipment — 5.4% | | | | | | | | |
Intel Corp. (b) | | | 25,850 | | | | 808,330 | |
Micron Technology, Inc. (a)(b) | | | 27,470 | | | | 745,261 | |
NVIDIA Corp. | | | 9,000 | | | | 188,325 | |
| | | | | | | | |
| | | | | | | | 1,741,916 | |
| | | | | | | | |
| Common Stocks | | Shares | | | Value | |
Software — 2.7% | | | | | | | | |
Microsoft Corp. (b) | | | 13,260 | | | $ | 539,085 | |
Oracle Corp. | | | 8,070 | | | | 348,222 | |
| | | | | | | | |
| | | | | | | | 887,307 | |
Specialty Retail — 6.7% | | | | | | | | |
The Home Depot, Inc. | | | 6,270 | | | | 712,335 | |
Lowe’s Companies, Inc. (b) | | | 14,980 | | | | 1,114,362 | |
Ross Stores, Inc. | | | 3,277 | | | | 345,265 | |
| | | | | | | | |
| | | | | | | | 2,171,962 | |
Technology Hardware, Storage & Peripherals — 7.4% | |
Apple Inc. (b) | | | 5,280 | | | | 656,990 | |
EMC Corp. | | | 21,560 | | | | 551,074 | |
Hewlett-Packard Co. (b) | | | 13,233 | | | | 412,340 | |
Western Digital Corp. | | | 8,530 | | | | 776,315 | |
| | | | | | | | |
| | | | | | | | 2,396,719 | |
Textiles, Apparel & Luxury Goods — 0.7% | | | | | | | | |
Deckers Outdoor Corp. (a) | | | 1,090 | | | | 79,428 | |
Fossil Group, Inc. (a) | | | 1,820 | | | | 150,059 | |
| | | | | | | | |
| | | | | | | | 229,487 | |
Total Common Stock (Cost — $31,153,954) — 130.3% | | | | 42,075,961 | |
| | | | | | | | |
| Investment Companies — 0.2% | | | | | | |
Utilities Select Sector SPDR Fund | | | 1,500 | | | | 66,645 | |
Total Investments Before Investments Sold Short (Cost — $31,219,960) — 130.5% | | | | 42,142,606 | |
| | | | | | | | |
| Investments Sold Short | | | | | | |
Aerospace & Defense — (0.4)% | | | | | | | | |
B/E Aerospace, Inc. | | | 1,810 | | | | (115,152 | ) |
Automobiles — (0.3)% | | | | | | | | |
Tesla Motors, Inc. | | | 590 | | | | (111,374 | ) |
Beverages — (0.4)% | | | | | | | | |
Brown-Forman Corp., Class B | | | 1,260 | | | | (113,841 | ) |
Biotechnology — (1.8)% | | | | | | | | |
Alnylam Pharmaceuticals, Inc. | | | 1,060 | | | | (110,685 | ) |
BioMarin Pharmaceutical, Inc. | | | 1,000 | | | | (124,620 | ) |
Intercept Pharmaceuticals, Inc. | | | 430 | | | | (121,269 | ) |
Seattle Genetics, Inc. | | | 3,240 | | | | (114,534 | ) |
Vertex Pharmaceuticals, Inc. | | | 890 | | | | (104,993 | ) |
| | | | | | | | |
| | | | | | | | (576,101 | ) |
Building Products — (1.1)% | | | | | | | | |
Allegion PLC | | | 1,950 | | | | (119,281 | ) |
Armstrong World Industries, Inc. | | | 2,050 | | | | (117,813 | ) |
USG Corp. | | | 3,970 | | | | (105,999 | ) |
| | | | | | | | |
| | | | | | | | (343,093 | ) |
Capital Markets — (0.3)% | | | | | | | | |
Artisan Partners Asset Management, Inc., Class A | | | 2,430 | | | | (110,468 | ) |
See Notes to Financial Statements.
| | | | | | |
| | | BLACKROCK LARGE CAP CORE PLUS FUND | | MARCH 31, 2015 | | 9 |
| | | | |
| Schedule of Investments (continued) | | | | |
| | | (Percentages shown are based on Net Assets) | |
| | | | | | | | |
| Investments Sold Short | | Shares | | | Value | |
Chemicals — (0.7)% | | | | | | | | |
FMC Corp. | | | 1,840 | | | $ | (105,340 | ) |
WR Grace & Co. | | | 1,150 | | | | (113,701 | ) |
| | | | | | | | |
| | | | | | | | (219,041 | ) |
Commercial Services & Supplies — (0.4)% | | | | | | | | |
Covanta Holding Corp. | | | 5,150 | | | | (115,514 | ) |
Communications Equipment — (0.7)% | | | | | | | | |
JDS Uniphase Corp. | | | 8,070 | | | | (105,878 | ) |
Motorola Solutions, Inc. | | | 1,690 | | | | (112,672 | ) |
| | | | | | | | |
| | | | | | | | (218,550 | ) |
Diversified Financial Services — (0.3)% | | | | | | | | |
FNFV Group | | | 7,530 | | | | (106,173 | ) |
Diversified Telecommunication Services — (0.4)% | | | | | | | | |
Zayo Group Holdings , Inc. | | | 4,310 | | | | (120,508 | ) |
Energy Equipment & Services — (0.7)% | | | | | | | | |
RPC, Inc. | | | 8,650 | | | | (110,806 | ) |
Seventy Seven Energy, Inc. | | | 27,370 | | | | (113,585 | ) |
| | | | | | | | |
| | | | | | | | (224,391 | ) |
Food Products — (0.8)% | | | | | | | | |
Kraft Foods Group, Inc. | | | 1,810 | | | | (157,678 | ) |
Mondelez International, Inc., Class A | | | 3,190 | | | | (115,127 | ) |
| | | | | | | | |
| | | | | | | | (272,805 | ) |
Gas Utilities — (0.3)% | | | | | | | | |
National Fuel Gas Co. | | | 1,820 | | | | (109,801 | ) |
Health Care Providers & Services — (0.7)% | | | | | | | | |
Brookdale Senior Living, Inc. | | | 3,080 | | | | (116,301 | ) |
Tenet Healthcare Corp. | | | 2,280 | | | | (112,883 | ) |
| | | | | | | | |
| | | | | | | | (229,184 | ) |
Health Care Technology — (1.1)% | | | | | | | | |
Allscripts Healthcare Solutions, Inc. | | | 9,300 | | | | (111,228 | ) |
athenahealth, Inc. | | | 930 | | | | (111,033 | ) |
IMS Health Holdings, Inc. | | | 4,350 | | | | (117,755 | ) |
| | | | | | | | |
| | | | | | | | (340,016 | ) |
Hotels, Restaurants & Leisure — (1.0)% | | | | | | | | |
Starwood Hotels & Resorts Worldwide, Inc. | | | 1,390 | | | | (116,065 | ) |
Wynn Resorts Ltd. | | | 850 | | | | (106,998 | ) |
Yum! Brands, Inc. | | | 1,420 | | | | (111,782 | ) |
| | | | | | | | |
| | | | | | | | (334,845 | ) |
Household Products — (0.4)% | | | | | | | | |
Colgate-Palmolive Co. | | | 1,610 | | | | (111,637 | ) |
Internet & Catalog Retail — (1.3)% | | | | | | | | |
Amazon.com, Inc. | | | 300 | | | | (111,630 | ) |
Netflix, Inc. | | | 250 | | | | (104,173 | ) |
TripAdvisor, Inc. | | | 1,300 | | | | (108,121 | ) |
Zulily, Inc., Class A | | | 8,380 | | | | (108,856 | ) |
| | | | | | | | |
| | | | | | | | (432,780 | ) |
Internet Software & Services — (1.7)% | | | | | | | | |
Equinix, Inc. | | | 480 | | | | (111,768 | ) |
HomeAway, Inc. | | | 3,670 | | | | (110,724 | ) |
Pandora Media, Inc. | | | 7,510 | | | | (121,737 | ) |
Yelp, Inc. | | | 2,440 | | | | (115,534 | ) |
| | | | | | | | |
| Investments Sold Short | | Shares | | | Value | |
Internet Software & Services (concluded) | | | | | | | | |
Zillow Group, Inc., Class A | | | 1,000 | | | $ | (100,300 | ) |
| | | | | | | | |
| | | | | | | | (560,063 | ) |
Life Sciences Tools & Services — (0.3)% | | | | | | | | |
Agilent Technologies, Inc. | | | 2,680 | | | | (111,354 | ) |
Machinery — (0.4)% | | | | | | | | |
Navistar International Corp. | | | 3,790 | | | | (111,805 | ) |
Media — (0.4)% | | | | | | | | |
Charter Communications, Inc., Class A | | | 610 | | | | (117,797 | ) |
Metals & Mining — (1.3)% | | | | | | | | |
Allegheny Technologies, Inc. | | | 3,430 | | | | (102,934 | ) |
Royal Gold, Inc. | | | 1,840 | | | | (116,122 | ) |
Tahoe Resources, Inc. | | | 9,330 | | | | (102,257 | ) |
TimkenSteel Corp. | | | 4,050 | | | | (107,203 | ) |
| | | | | | | | |
| | | | | | | | (428,516 | ) |
Multiline Retail — (0.4)% | | | | | | | | |
Sears Holdings Corp. | | | 2,950 | | | | (122,071 | ) |
Multi-Utilities — (0.7)% | | | | | | | | |
Dominion Resources, Inc. | | | 1,610 | | | | (114,101 | ) |
Sempra Energy | | | 1,040 | | | | (113,381 | ) |
| | | | | | | | |
| | | | | | | | (227,482 | ) |
Oil, Gas & Consumable Fuels — (6.0)% | | | | | | | | |
Anadarko Petroleum Corp. | | | 1,360 | | | | (112,622 | ) |
Cheniere Energy, Inc. | | | 1,460 | | | | (113,004 | ) |
Cimarex Energy Co. | | | 1,020 | | | | (117,392 | ) |
Cobalt International Energy, Inc. | | | 11,300 | | | | (106,333 | ) |
Continental Resources, Inc. | | | 2,570 | | | | (112,232 | ) |
Golar LNG Ltd. | | | 3,370 | | | | (112,154 | ) |
Laredo Petroleum, Inc. | | | 9,400 | | | | (122,576 | ) |
Memorial Resource Development Corp. | | | 5,440 | | | | (96,506 | ) |
ONEOK, Inc. | | | 2,340 | | | | (112,882 | ) |
Pioneer Natural Resources Co. | | | 690 | | | | (112,822 | ) |
Range Resources Corp. | | | 2,380 | | | | (123,855 | ) |
SandRidge Energy, Inc. | | | 70,590 | | | | (125,650 | ) |
SM Energy Co. | | | 2,490 | | | | (128,683 | ) |
Teekay Corp. | | | 2,510 | | | | (116,891 | ) |
Ultra Petroleum Corp. | | | 7,210 | | | | (112,692 | ) |
The Williams Cos., Inc. | | | 2,310 | | | | (116,863 | ) |
WPX Energy, Inc. | | | 9,910 | | | | (108,316 | ) |
| | | | | | | | |
| | | | | | | | (1,951,473 | ) |
Professional Services — (0.4)% | | | | | | | | |
IHS, Inc., Class A | | | 990 | | | | (112,622 | ) |
Real Estate Investment Trusts (REITs) — (1.2)% | |
NorthStar Realty Finance Corp. | | | 2,980 | | | | (53,998 | ) |
Outfront Media, Inc. | | | 1,826 | | | | (54,634 | ) |
Plum Creek Timber Co., Inc. | | | 1,280 | | | | (55,616 | ) |
Rayonier, Inc. | | | 1,990 | | | | (53,650 | ) |
Taubman Centers, Inc. | | | 750 | | | | (57,848 | ) |
Vornado Realty Trust | | | 520 | | | | (58,240 | ) |
WP GLIMCHER, Inc. | | | 3,330 | | | | (55,378 | ) |
| | | | | | | | |
| | | | | | | | (389,364 | ) |
Real Estate Management & Development — (0.3)% | |
The Howard Hughes Corp. | | | 370 | | | | (57,357 | ) |
See Notes to Financial Statements.
| | | | | | |
| 10 | | BLACKROCK LARGE CAP CORE PLUS FUND | | MARCH 31, 2015 | | |
| | | | |
| Schedule of Investments (continued) | | | | |
| | | (Percentages shown are based on Net Assets) | |
| | | | | | | | |
| Investments Sold Short | | Shares | | | Value | |
Real Estate Management & Development (concluded) | | | | | | | | |
Realogy Holdings Corp. | | | 1,130 | | | $ | (51,392 | ) |
| | | | | | | | |
| | | | | | | | (108,749 | ) |
Road & Rail — (0.3)% | | | | | | | | |
Hertz Global Holdings, Inc. | | | 5,080 | | | | (110,134 | ) |
Semiconductors & Semiconductor Equipment — (2.3)% | | | | | | | | |
Advanced Micro Devices, Inc. | | | 38,240 | | | | (102,483 | ) |
Atmel Corp. | | | 12,730 | | | | (104,768 | ) |
Cree, Inc. | | | 2,880 | | | | (102,211 | ) |
KLA-Tencor Corp. | | | 1,830 | | | | (106,671 | ) |
SunEdison, Inc. | | | 4,940 | | | | (118,560 | ) |
SunPower Corp. | | | 3,390 | | | | (106,141 | ) |
Teradyne, Inc. | | | 5,850 | | | | (110,273 | ) |
| | | | | | | | |
| | | | | | | | (751,107 | ) |
Software — (1.8)% | | | | | | | | |
FireEye, Inc. | | | 2,620 | | | | (102,835 | ) |
NetSuite, Inc. | | | 1,210 | | | | (112,240 | ) |
Nuance Communications, Inc. | | | 7,990 | | | | (114,657 | ) |
Solera Holdings, Inc. | | | 2,100 | | | | (108,486 | ) |
Zynga, Inc., Class A | | | 44,630 | | | | (127,196 | ) |
| | | | | | | | |
| | | | | | | | (565,414 | ) |
| | | | | | | | |
| Investments Sold Short | | Shares | | | Value | |
Specialty Retail — (0.7)% | | | | | | | | |
Cabela’s, Inc. | | | 2,010 | | | $ | (112,520 | ) |
Tiffany & Co. | | | 1,330 | | | | (117,053 | ) |
| | | | | | | | |
| | | | | | | | (229,573 | ) |
Technology Hardware, Storage & Peripherals — (0.6)% | |
3D Systems Corp. | | | 3,980 | | | | (109,132 | ) |
Stratasys Ltd. | | | 1,820 | | | | (96,060 | ) |
| | | | | | | | |
| | | | | | | | (205,192 | ) |
Textiles, Apparel & Luxury Goods — (0.4)% | |
Kate Spade & Co. | | | 3,470 | | | | (115,863 | ) |
Wireless Telecommunication Services — (0.3)% | |
Sprint Corp. | | | 21,080 | | | | (99,919 | ) |
Total Investments Sold Short (Proceeds — $11,013,520) — (32.6)% | | | | (10,523,772 | ) |
Total Investments — 97.9% | | | | | | | 31,618,834 | |
Other Assets in Excess of Liabilities — 2.1% | | | | | | | 671,261 | |
| | | | | | | | |
Net Assets — 100.0% | | | | | | $ | 32,290,095 | |
| | | | | | | | |
|
| Notes to Schedule of Investments |
| (a) | Non-income producing security. |
| (b) | All or a portion of security has been pledged as collateral in connection with short sales. |
| • | | During the six months ended March 31, 2015, investments in issuers considered to be an affiliate of the Fund for purposes of Section 2(a)(3) of the Investment Company Act of 1940, as amended, were as follows: |
| | | | | | | | | | | | | | | | |
| Affiliate | | Shares Held at
September 30, 2014 | | | Net
Activity | | | Shares Held at
March 31, 2015 | | | Income | |
BlackRock Liquidity Funds, TempFund, Institutional Class | | | 299,052 | | | | (299,052 | ) | | | — | | | $ | 168 | |
| • | | For Fund compliance purposes, the Fund’s industry classifications refer to any one or more of the industry sub-classifications used by one or more widely recognized market indexes or ratings group indexes, and/or as defined by the investment advisor. These definitions may not apply for purposes of this report, which may combine such industry sub-classifications for reporting ease. |
| • | | Fair Value Measurements — Various inputs are used in determining the fair value of investments. These inputs to valuation techniques are categorized into a disclosure hierarchy consisting of three broad levels for financial statement purposes. The hierarchy gives the highest priority to unadjusted quoted prices in active markets for identical assets or liabilities (Level 1 measurements) and the lowest priority to unobservable inputs (Level 3 measurements). Accordingly, the degree of judgment exercised in determining fair value is greatest for instruments categorized in Level 3. The inputs used to measure fair value may fall into different levels of the fair value hierarchy. In such cases, for disclosure purposes, the fair value hierarchy classification is determined based on the lowest level input that is significant to the fair value measurement in its entirety. The categorization of a value determined for investments is based on the pricing transparency of the investment and is not necessarily an indication of the risks associated with investing in those securities. The three levels of the fair value hierarchy are as follows: |
| | • | | Level 1 — unadjusted quoted prices in active markets/exchanges for identical assets or liabilities that the Fund has the ability to access |
| | • | | Level 2 — other observable inputs (including, but not limited to, quoted prices for similar assets or liabilities in markets that are active, quoted prices for identical or similar assets or liabilities in markets that are not active, inputs other than quoted prices that are observable for the assets or liabilities (such as interest rates, yield curves, volatilities, prepayment speeds, loss severities, credit risks and default rates) or other market–corroborated inputs) |
| | • | | Level 3 — unobservable inputs based on the best information available in the circumstances, to the extent observable inputs are not available (including the Fund’s own assumptions used in determining the fair value of investments) |
Changes in valuation techniques may result in transfers into or out of an assigned level within the disclosure hierarchy. In accordance with the Fund’s policy, transfers between different levels of the fair value disclosure hierarchy are deemed to have occurred as of the beginning of the reporting period. For information about the Fund’s policy regarding valuation of investments, refer to Note 2 of the Notes to Financial Statements.
See Notes to Financial Statements.
| | | | | | |
| | | BLACKROCK LARGE CAP CORE PLUS FUND | | MARCH 31, 2015 | | 11 |
| | |
| Schedule of Investments (concluded) | | |
As of March 31, 2015, the following table summarizes the Fund’s investments categorized in the disclosure hierarchy:
| | | | | | | | | | | | | | | | | | | | |
| | | Level 1 | | Level 2 | | Level 3 | | Total |
Assets: | | | | | | | | | | | | | | | | | | | | |
Investments: | | | | | | | | | | | | | | | | | | | | |
Common Stocks1 | | | $ | 42,075,961 | | | | | — | | | | | — | | | | $ | 42,075,961 | |
Investment Companies | | | | 66,645 | | | | | — | | | | | — | | | | | 66,645 | |
Liabilities: | | | | | | | | | | | | | | | | | | | | |
Investments: | | | | | | | | | | | | | | | | | | | | |
Investments Sold Short1 | | | | (10,523,772 | ) | | | | — | | | | | — | | | | | (10,523,772 | ) |
| | | | | |
Total | | | $ | 31,618,834 | | | | | — | | | | | — | | | | $ | 31,618,834 | |
| | | | | |
1 See above Schedule of Investments for values in each industry. | |
The Fund may hold assets and/or liabilities in which the fair value approximates the carrying amount for financial statement purposes. As of March 31, 2015, bank overdraft of $1,058,868 was categorized as Level 2 within the disclosure hierarchy.
During the six months ended March 31, 2015, there were no transfers between levels.
See Notes to Financial Statements.
| | | | | | |
| 12 | | BLACKROCK LARGE CAP CORE PLUS FUND | | MARCH 31, 2015 | | |
| | |
| Statement of Assets and Liabilities | | |
| | | | |
| March 31, 2015 (Unaudited) | | | |
| | | | |
| Assets | | | | |
Investments at value — unaffiliated (cost — $31,219,960) | | $ | 42,142,606 | |
Investments sold receivable | | | 2,000,722 | |
Capital shares sold receivable | | | 1,392 | |
Dividends receivable — unaffiliated | | | 57,630 | |
Receivable from Manager | | | 4,313 | |
Prepaid expenses | | | 26,610 | |
| | | | |
Total assets | | | 44,233,273 | |
| | | | |
| | | | |
| Liabilities | | | | |
Bank overdraft | | | 1,058,868 | |
Payable to broker for short sales | | | 2,373 | |
Investments sold short at value (proceeds — $11,013,520) | | | 10,523,772 | |
Interest expense payable | | | 3,375 | |
Dividends on short sales payable | | | 5,642 | |
Capital shares redeemed payable | | | 238,946 | |
Investment advisory fees payable | | | 24,554 | |
Service and distribution fees payable | | | 9,405 | |
Officer’s and Directors’ fees payable | | | 1,013 | |
Other affiliates payable | | | 279 | |
Other accrued expenses payable | | | 74,951 | |
| | | | |
Total liabilities | | | 11,943,178 | |
| | | | |
Net Assets | | $ | 32,290,095 | |
| | | | |
| | | | |
| Net Assets Consist of | | | | |
Paid-in capital | | $ | 19,986,756 | |
Accumulated net investment loss | | | (159,167 | ) |
Accumulated net realized gain | | | 1,050,112 | |
Net unrealized appreciation/depreciation | | | 11,412,394 | |
| | | | |
Net Assets | | $ | 32,290,095 | |
| | | | |
| | | | |
| Net Asset Value | | | | |
Institutional — Based on net assets of $12,245,603 and 815,226 shares outstanding, 400,000,000 shares authorized, $0.10 par value | | $ | 15.02 | |
| | | | |
Investor A — Based on net assets of $12,230,015 and 829,657 shares outstanding, 300,000,000 shares authorized, $0.10 par value | | $ | 14.74 | |
| | | | |
Investor C — Based on net assets of $7,814,477 and 556,142 shares outstanding, 400,000,000 shares authorized, $0.10 par value | | $ | 14.05 | |
| | | | |
See Notes to Financial Statements.
| | | | | | |
| | | BLACKROCK LARGE CAP CORE PLUS FUND | | MARCH 31, 2015 | | 13 |
| | | | |
| Six Months Ended March 31, 2015 (Unaudited) | | | |
| | | | |
| Investment Income | |
Dividends — unaffiliated | | $ | 382,854 | |
Dividends — affiliated | | | 168 | |
Foreign taxes withheld | | | (3,223 | ) |
| | | | |
Total income | | | 379,799 | |
| | | | |
| | | | |
| Expenses | | | | |
Investment advisory | | | 213,157 | |
Service — Investor A | | | 15,625 | |
Service and distribution — Investor C | | | 39,599 | |
Professional | | | 29,559 | |
Registration | | | 20,821 | |
Transfer agent — Institutional | | | 4,901 | |
Transfer agent — Investor A | | | 7,028 | |
Transfer agent — Investor C | | | 4,680 | |
Printing | | | 7,944 | |
Custodian | | | 11,617 | |
Accounting services | | | 7,623 | |
Officer and Directors | | | 2,592 | |
Miscellaneous | | | 10,431 | |
| | | | |
Total expenses excluding dividend expense, stock loan fees and interest expense | | | 375,577 | |
Dividend expense | | | 71,137 | |
Stock loan fees | | | 44,743 | |
Interest expense | | | 19,787 | |
| | | | |
Total expenses | | | 511,244 | |
Less fees waived and/or reimbursed by the Manager | | | (58,012 | ) |
Less transfer agent fees reimbursed — Institutional | | | (4,897 | ) |
Less transfer agent fees reimbursed — Investor A | | | (5,787 | ) |
Less transfer agent fees reimbursed — Investor C | | | (4,312 | ) |
| | | | |
Total expenses after fees waived and/or reimbursed | | | 438,236 | |
| | | | |
Net investment loss | | | (58,437 | ) |
| | | | |
| | | | |
| Realized and Unrealized Gain (Loss) | | | | |
Net realized gain (loss) from: | | | | |
Investments — unaffiliated | | | 2,903,246 | |
Short sales | | | (1,141,346 | ) |
| | | | |
| | | 1,761,900 | |
| | | | |
Net change in unrealized appreciation/depreciation on: | | | | |
Investments — unaffiliated | | | (218,043 | ) |
Short sales | | | 376,519 | |
| | | | |
| | | 158,476 | |
| | | | |
Total realized and unrealized gain | | | 1,920,376 | |
| | | | |
Net Increase in Net Assets Resulting from Operations | | $ | 1,861,939 | |
| | | | |
See Notes to Financial Statements.
| | | | | | |
| 14 | | BLACKROCK LARGE CAP CORE PLUS FUND | | MARCH 31, 2015 | | |
| | |
| Statements of Changes in Net Assets | | |
| | | | | | | | |
| Increase (Decrease) in Net Assets: | | Six Months
Ended
March 31,
2015
(Unaudited) | | | Year Ended
September 30,
2014 | |
| | | | | | | | |
| Operations | | | | | | | | |
Net investment loss | | $ | (58,437 | ) | | $ | (146,412 | ) |
Net realized gain | | | 1,761,900 | | | | 4,720,300 | |
Net change in unrealized appreciation/depreciation | | | 158,476 | | | | 1,823,308 | |
| | | | |
Net increase in net assets resulting from operations | | | 1,861,939 | | | | 6,397,196 | |
| | | | |
| | | | | | | | |
| Distributions to Shareholders From1 | | | | | | | | |
Net realized gain: | | | | | | | | |
Institutional | | | (341,277 | ) | | | — | |
Investor A | | | (279,709 | ) | | | — | |
Investor C | | | (187,638 | ) | | | — | |
| | | | |
Decrease in net assets resulting from distributions to shareholders | | | (808,624 | ) | | | — | |
| | | | |
| | | | | | | | |
| Capital Share Transactions | | | | | | | | |
Net decrease in net assets derived from capital share transactions | | | (4,133,602 | ) | | | (11,324,312 | ) |
| | | | |
| | | | | | | | |
| Net Assets | | | | | | | | |
Total decrease in net assets | | | (3,080,287 | ) | | | (4,927,116 | ) |
Beginning of period | | | 35,370,382 | | | | 40,297,498 | |
| | | | |
End of period | | $ | 32,290,095 | | | $ | 35,370,382 | |
| | | | |
Accumulated net investment loss, end of period | | $ | (159,167 | ) | | $ | (100,730 | ) |
| | | | |
| | 1 | | Distributions for annual periods determined in accordance with federal income tax regulations. |
See Notes to Financial Statements.
| | | | | | |
| | | BLACKROCK LARGE CAP CORE PLUS FUND | | MARCH 31, 2015 | | 15 |
| | | | |
| Six Months Ended March 31, 2015 (Unaudited) | | | |
| | | | |
| Cash Provided by Operating Activities | | | | |
Net increase in net assets resulting from operations | | $ | 1,861,939 | |
Adjustments to reconcile net increase in net assets resulting from operations to net cash provided by operating activities: | | | | |
Increase in dividends receivable | | | (2,771 | ) |
Increase in receivable from Manager | | | (1,274 | ) |
Increase in prepaid expenses | | | (17,841 | ) |
Decrease in investment advisory fees payable | | | (4,569 | ) |
Increase in service and distribution fees payable | | | 424 | |
Increase in officer’s and Directors’ fees payable | | | 141 | |
Decrease in other accrued expenses payable | | | (13,880 | ) |
Increase in other affiliates payable | | | 48 | |
Increase in dividends on short sales payable | | | 1,517 | |
Increase in interest expense payable | | | 272 | |
Decrease in payable to broker for short sales | | | (1,329 | ) |
Net realized (gain) loss on investments and securities sold short | | | (1,761,900 | ) |
Net change in unrealized (gain) loss on investments and securities sold short | | | (158,476 | ) |
Proceeds from investments sold short | | | 15,009,134 | |
Purchases to cover investments sold short | | | (16,014,195 | ) |
Purchases of long-term investments | | | (10,573,106 | ) |
Proceeds from sales of long-term investments | | | 15,024,256 | |
Net proceeds from sales of short-term securities | | | 299,052 | |
| | | | |
Net cash provided by operating activities | | | 3,647,442 | |
| | | | |
| | | | |
| Cash Used for Financing Activities | | | | |
Proceeds from issuance of capital shares | | | 3,335,720 | |
Payments on redemption of capital shares | | | (7,973,604 | ) |
Cash dividends paid to shareholders | | | (68,426 | ) |
Increase in bank overdraft | | | 1,058,868 | |
| | | | |
Net cash used for financing activities | | | (3,647,442 | ) |
| | | | |
| | | | |
| Cash | | | | |
Net increase in cash | | | — | |
Cash at beginning of period | | | — | |
| | | | |
Cash at end of period | | | — | |
| | | | |
| | | | |
| Supplemental Disclosure of Cash Flow Information | | | | |
Cash paid during the period for interest expense, dividend expense and stock loan fees | | $ | 133,878 | |
| | | | |
| | | | |
| Non-Cash Financing Activities | | | | |
Capital shares issued in reinvestment of distributions | | $ | 740,198 | |
| | | | |
See Notes to Financial Statements.
| | | | | | |
| 16 | | BLACKROCK LARGE CAP CORE PLUS FUND | | MARCH 31, 2015 | | |
| | | | | | | | | | | | | | | | | | | | | | | | |
| | | Institutional | |
| | | Six Months
Ended
March 31,
2015 (Unaudited) | | | Year Ended September 30, | |
| | | | 2014 | | | 2013 | | | 2012 | | | 2011 | | | 2010 | |
| Per Share Operating Performance | | | | | | | | | | | | | | | | | | | | | | | | |
Net asset value, beginning of period | | $ | 14.55 | | | $ | 12.48 | | | $ | 10.58 | | | $ | 8.11 | | | $ | 7.98 | | | $ | 7.58 | |
| | | | |
Net investment income (loss)1 | | | (0.00 | )2 | | | (0.01 | ) | | | 0.01 | | | | 0.03 | | | | (0.03 | ) | | | 0.05 | |
Net realized and unrealized gain | | | 0.80 | | | | 2.08 | | | | 1.90 | | | | 2.44 | | | | 0.16 | | | | 0.51 | |
| | | | |
Net increase from investment operations | | | 0.80 | | | | 2.07 | | | | 1.91 | | | | 2.47 | | | | 0.13 | | | | 0.56 | |
| | | | |
Distributions from:3 | | | | | | | | | | | | | | | | | | | | | | | | |
Net investment income | | | — | | | | — | | | | (0.01 | ) | | | — | | | | — | | | | (0.16 | ) |
Net realized gain | | | (0.33 | ) | | | — | | | | — | | | | — | | | | — | | | | — | |
| | | | |
Total distributions | | | (0.33 | ) | | | — | | | | (0.01 | ) | | | — | | | | — | | | | (0.16 | ) |
| | | | |
Net asset value, end of period | | $ | 15.02 | | | $ | 14.55 | | | $ | 12.48 | | | $ | 10.58 | | | $ | 8.11 | | | $ | 7.98 | |
| | | | |
| | | | | | | | | | | | | | | | | | | | | | | | |
| Total Return4 | | | | | | | | | | | | | | | | | | | | | | | | |
Based on net asset value | | | 5.55 | %5 | | | 16.59 | % | | | 18.03 | % | | | 30.46 | % | | | 1.63 | % | | | 7.46 | % |
| | | | |
| | | | | | | | | | | | | | | | | | | | | | | | |
| Ratios to Average Net Assets | | | | | | | | | | | | | | | | | | | | | | | | |
Total expenses | | | 2.54 | %6 | | | 2.35 | % | | | 2.41 | % | | | 2.51 | % | | | 2.56 | % | | | 4.11 | % |
| | | | |
Total expenses after fees waived and/or reimbursed | | | 2.15 | %6 | | | 2.08 | % | | | 2.12 | % | | | 2.25 | % | | | 2.08 | % | | | 1.50 | % |
| | | | |
Total expenses after fees waived and/or reimbursed and excluding dividend expense | | | 1.75 | %6 | | | 1.66 | % | | | 1.72 | % | | | 1.86 | % | | | 1.72 | % | | | 0.91 | % |
| | | | |
Total expenses after fees waived and/or reimbursed and excluding dividend expense, stock loan fees and interest expense | | | 1.38 | %6 | | | 1.38 | % | | | 1.41 | % | | | 1.50 | % | | | 1.50 | % | | | 0.66 | % |
| | | | |
Net investment income (loss) | | | (0.02 | )%6 | | | (0.05 | )% | | | 0.07 | % | | | 0.29 | % | | | (0.29 | )% | | | 0.66 | % |
| | | | |
| | | | | | | | | | | | | | | | | | | | | | | | |
| Supplemental Data | | | | | | | | | | | | | | | | | | | | | | | | |
Net assets, end of period (000) | | $ | 12,246 | | | $ | 15,497 | | | $ | 15,373 | | | $ | 12,050 | | | $ | 16,688 | | | $ | 2,700 | |
| | | | |
Portfolio turnover rate | | | 23 | % | | | 44 | % | | | 65 | % | | | 172 | % | | | 126 | % | | | 192 | % |
| | | | |
| | 1 | | Based on average shares outstanding. |
| | 2 | | Amount is greater than $(0.005) per share. |
| | 3 | | Distributions for annual periods determined in accordance with federal income tax regulations. |
| | 4 | | Where applicable, assumes the reinvestment of distributions. |
| | 5 | | Aggregate total return. |
See Notes to Financial Statements.
| | | | | | |
| | | BLACKROCK LARGE CAP CORE PLUS FUND | | MARCH 31, 2015 | | 17 |
| | |
| Financial Highlights (continued) | | |
| | | | | | | | | | | | | | | | | | | | | | | | |
| | | Investor A | |
| | | Six Months
Ended
March 31,
2015 (Unaudited) | | | Year Ended September 30, | |
| | | | 2014 | | | 2013 | | | 2012 | | | 2011 | | | 2010 | |
| Per Share Operating Performance | | | | | | | | | | | | | | | | | | | | | | | | |
Net asset value, beginning of period | | $ | 14.31 | | | $ | 12.30 | | | $ | 10.46 | | | $ | 8.04 | | | $ | 7.93 | | | $ | 7.55 | |
| | | | |
Net investment income (loss)1 | | | (0.02 | ) | | | (0.04 | ) | | | (0.03 | ) | | | (0.00 | )2 | | | (0.05 | ) | | | 0.02 | |
Net realized and unrealized gain | | | 0.78 | | | | 2.05 | | | | 1.87 | | | | 2.42 | | | | 0.16 | | | | 0.51 | |
| | | | |
Net increase from investment operations | | | 0.76 | | | | 2.01 | | | | 1.84 | | | | 2.42 | | | | 0.11 | | | | 0.53 | |
| | | | |
Distributions from:3 | | | | | | | | | | | | | | | | | | | | | | | | |
Net investment income | | | — | | | | — | | | | — | | | | — | | | | — | | | | (0.15 | ) |
Net realized gain | | | (0.33 | ) | | | — | | | | — | | | | — | | | | — | | | | — | |
| | | | |
Total distributions | | | (0.33 | ) | | | — | | | | — | | | | — | | | | — | | | | (0.15 | ) |
| | | | |
Net asset value, end of period | | $ | 14.74 | | | $ | 14.31 | | | $ | 12.30 | | | $ | 10.46 | | | $ | 8.04 | | | $ | 7.93 | |
| | | | |
| | | | | | | | | | | | | | | | | | | | | | | | |
| Total Return4 | | | | | | | | | | | | | | | | | | | | | | | | |
Based on net asset value | | | 5.36 | %5 | | | 16.34 | % | | | 17.59 | % | | | 30.10 | % | | | 1.39 | % | | | 7.02 | % |
| | | | |
| | | | | | | | | | | | | | | | | | | | | | | | |
| Ratios to Average Net Assets | | | | | | | | | | | | | | | | | | | | | | | | |
Total expenses | | | 2.84 | %6 | | | 2.64 | % | | | 2.65 | % | | | 2.79 | % | | | 2.90 | % | | | 4.37 | % |
| | | | |
Total expenses after fees waived and/or reimbursed | | | 2.42 | %6 | | | 2.35 | % | | | 2.42 | % | | | 2.59 | % | | | 2.36 | % | | | 1.84 | % |
| | | | |
Total expenses after fees waived and/or reimbursed and excluding dividend expense | | | 2.02 | %6 | | | 1.93 | % | | | 2.02 | % | | | 2.19 | % | | | 2.00 | % | | | 1.25 | % |
| | | | |
Total expenses after fees waived and/or reimbursed and excluding dividend expense, stock loan fees and interest expense | | | 1.65 | %6 | | | 1.65 | % | | | 1.71 | % | | | 1.80 | % | | | 1.79 | % | | | 1.00 | % |
| | | | |
Net investment income (loss) | | | (0.27 | )%6 | | | (0.32 | )% | | | (0.24 | )% | | | (0.02 | )% | | | (0.54 | )% | | | 0.30 | % |
| | | | |
| | | | | | | | | | | | | | | | | | | | | | | | |
| Supplemental Data | | | | | | | | | | | | | | | | | | | | | | | | |
Net assets, end of period (000) | | $ | 12,230 | | | $ | 12,238 | | | $ | 17,792 | | | $ | 15,935 | | | $ | 10,749 | | | $ | 2,536 | |
| | | | |
Portfolio turnover rate | | | 23 | % | | | 44 | % | | | 65 | % | | | 172 | % | | | 126 | % | | | 192 | % |
| | | | |
| | 1 | | Based on average shares outstanding. |
| | 2 | | Amount is greater than $(0.005) per share. |
| | 3 | | Distributions for annual periods determined in accordance with federal income tax regulations. |
| | 4 | | Where applicable, excludes the effects of any sales charges and assumes the reinvestment of distributions. |
| | 5 | | Aggregate total return. |
See Notes to Financial Statements.
| | | | | | |
| 18 | | BLACKROCK LARGE CAP CORE PLUS FUND | | MARCH 31, 2015 | | |
| | |
| Financial Highlights (concluded) | | |
| | | | | | | | | | | | | | | | | | | | | | | | |
| | | Investor C | |
| | | Six Months
Ended
March 31,
2015 (Unaudited) | | | Year Ended September 30, | |
| | | | 2014 | | | 2013 | | | 2012 | | | 2011 | | | 2010 | |
| Per Share Operating Performance | | | | | | | | | | | | | | | | | | | | | | | | |
Net asset value, beginning of period | | $ | 13.70 | | | $ | 11.87 | | | $ | 10.16 | | | $ | 7.87 | | | $ | 7.82 | | | $ | 7.45 | |
| | | | |
Net investment loss1 | | | (0.07 | ) | | | (0.14 | ) | | | (0.10 | ) | | | (0.07 | ) | | | (0.10 | ) | | | (0.03 | ) |
Net realized and unrealized gain | | | 0.75 | | | | 1.97 | | | | 1.81 | | | | 2.36 | | | | 0.15 | | | | 0.50 | |
| | | | |
Net increase from investment operations | | | 0.68 | | | | 1.83 | | | | 1.71 | | | | 2.29 | | | | 0.05 | | | | 0.47 | |
| | | | |
Distributions from:2 | | | | | | | | | | | | | | | | | | | | | | | | |
Net investment income | | | — | | | | — | | | | — | | | | — | | | | — | | | | (0.10 | ) |
Net realized gain | | | (0.33 | ) | | | — | | | | — | | | | — | | | | — | | | | — | |
| | | | |
Total distributions | | | (0.33 | ) | | | — | | | | — | | | | — | | | | — | | | | (0.10 | ) |
| | | | |
Net asset value, end of period | | $ | 14.05 | | | $ | 13.70 | | | $ | 11.87 | | | $ | 10.16 | | | $ | 7.87 | | | $ | 7.82 | |
| | | | |
| | | | | | | | | | | | | | | | | | | | | | | | |
| Total Return3 | | | | | | | | | | | | | | | | | | | | | | | | |
Based on net asset value | | | 5.01 | %4 | | | 15.42 | % | | | 16.83 | % | | | 29.10 | % | | | 0.64 | % | | | 6.29 | % |
| | | | |
| | | | | | | | | | | | | | | | | | | | | | | | |
| Ratios to Average Net Assets | | | | | | | | | | | | | | | | | | | | | | | | |
Total expenses | | | 3.59 | %5 | | | 3.44 | % | | | 3.46 | % | | | 3.57 | % | | | 3.83 | % | | | 5.14 | % |
| | | | |
Total expenses after fees waived and/or reimbursed | | | 3.16 | %5 | | | 3.09 | % | | | 3.14 | % | | | 3.28 | % | | | 3.04 | % | | | 2.54 | % |
| | | | |
Total expenses after fees waived and/or reimbursed and excluding dividend expense | | | 2.76 | %5 | | | 2.67 | % | | | 2.74 | % | | | 2.88 | % | | | 2.70 | % | | | 1.95 | % |
| | | | |
Total expenses after fees waived and/or reimbursed and excluding dividend expense, stock loan fees and interest expense | | | 2.39 | %5 | | | 2.39 | % | | | 2.43 | % | | | 2.50 | % | | | 2.50 | % | | | 1.70 | % |
| | | | |
Net investment loss | | | (1.01 | )%5 | | | (1.06 | )% | | | (0.95 | )% | | | (0.70 | )% | | | (1.13 | )% | | | (0.40 | )% |
| | | | |
| | | | | | | | | | | | | | | | | | | | | | | | |
| Supplemental Data | | | | | | | | | | | | | | | | | | | | | | | | |
Net assets, end of period (000) | | $ | 7,814 | | | $ | 7,636 | | | $ | 7,133 | | | $ | 6,587 | | | $ | 6,586 | | | $ | 4,213 | |
| | | | |
Portfolio turnover rate | | | 23 | % | | | 44 | % | | | 65 | % | | | 172 | % | | | 126 | % | | | 192 | % |
| | | | |
| | 1 | | Based on average shares outstanding. |
| | 2 | | Distributions for annual periods determined in accordance with federal income tax regulations. |
| | 3 | | Where applicable, excludes the effects of any sales charges and assumes the reinvestment of distributions. |
| | 4 | | Aggregate total return. |
See Notes to Financial Statements.
| | | | | | |
| | | BLACKROCK LARGE CAP CORE PLUS FUND | | MARCH 31, 2015 | | 19 |
| | |
| Notes to Financial Statements (Unaudited) | | |
1. Organization:
BlackRock Large Cap Series Funds, Inc. (the “Corporation”) is registered under the Investment Company Act of 1940, as amended (the “1940 Act”), as an open-end management investment company. The Corporation is organized as a Maryland corporation. BlackRock Large Cap Core Plus Fund (the “Fund”) is a series of the Corporation. The Fund is classified as diversified.
The Fund offers multiple classes of shares. All classes of shares have identical voting, dividend, liquidation and other rights and are subject to the same terms and conditions, except that each bears certain expenses and may have a conversion privilege as outlined below. Institutional Shares are sold only to certain eligible investors. Investor A and Investor C Shares are generally available through financial intermediaries. Each class has exclusive voting rights with respect to matters relating to its shareholder servicing and distribution expenditures. For distribution and service fee breakdown see Note 4.
| | | | | | |
| Share Class | | Initial Sales Charge | | CDSC | | Conversion
Privilege |
Institutional Shares | | No | | No | | None |
Investor A Shares | | Yes | | No1 | | None |
Investor C Shares | | No | | Yes | | None |
| | 1 | | Investor A Shares may be subject to a CDSC where no initial sales charge was paid at the time of purchase. |
The Fund, together with certain other registered investment companies advised by BlackRock Advisors, LLC (the “Manager”) or its affiliates, is included in a complex of open-end funds referred to as the Equity-Liquidity Complex.
2. Significant Accounting Policies:
The Fund’s financial statements are prepared in conformity with accounting principles generally accepted in the United States of America (“U.S. GAAP”), which may require management to make estimates and assumptions that affect the reported amounts of assets and liabilities in the financial statements and the reported amounts of increases and decreases in net assets from operations during the reporting period. Actual results could differ from those estimates. The Fund is considered an investment company under U.S. GAAP and follows the accounting and reporting guidance applicable to investment companies. The following is a summary of significant accounting policies followed by the Fund:
Valuation: The Fund’s investments are valued at fair value as of the close of trading on the New York Stock Exchange (“NYSE”) (generally 4:00 p.m., Eastern time). U.S. GAAP defines fair value as the price the Fund would receive to sell an asset or pay to transfer a liability in an orderly transaction between market participants at the measurement date. The Fund determines the fair values of its financial instruments at market value using independent dealers or pricing services under policies approved by the Board of Directors of the Corporation (the “Board”). The BlackRock Global Valuation Methodologies Committee (the “Global Valuation Committee”) is the committee formed by management to develop global pricing policies and procedures and to provide oversight of the pricing function for the Fund for all financial instruments.
Equity investments traded on a recognized securities exchange are valued at the official close price each day, if available. For equity investments traded on more than one exchange, the official close price on the exchange where the stock is primarily traded is used. Equity investments traded on a recognized exchange for which there were no sales on that day may be valued at the last available bid (long positions) or ask (short positions) price. Investments in open-end registered investment companies are valued at NAV each business day.
In the event that the application of these methods of valuation results in a price for an investment that is deemed not to be representative of the market value of such investment, or if a price is not available, the investment will be valued by the Global Valuation Committee, or its delegate, in accordance with a policy approved by the Board as reflecting fair value (“Fair Value Investments”). When determining the price for Fair Value Investments, the Global Valuation Committee, or its delegate, seeks to determine the price that each Fund might reasonably expect to receive or pay from the current sale or purchase of that asset or liability in an arm’s-length transaction. Fair value determinations shall be based upon all available factors that the Global Valuation Committee, or its delegate, deems relevant consistent with the principles of fair value measurement. The pricing of all Fair Value Investments is subsequently reported to the Board or a committee thereof on a quarterly basis.
Segregation and Collateralization: In cases where the Fund enters into certain investments (e.g., short sales), that would be “senior securities” for 1940 Act purposes, the Fund may segregate or designate on its books and records cash or liquid securities having a market value at least equal to the amount of the Fund’s future obligations under such investments. Doing so allows the investment to be excluded from treatment as a “senior security.” Furthermore, if required by an exchange or counterparty agreement, the Fund may be required to deliver/deposit cash and/or securities to/with an exchange, or broker-dealer or custodian as collateral for certain investments or obligations.
| | | | | | |
| 20 | | BLACKROCK LARGE CAP CORE PLUS FUND | | MARCH 31, 2015 | | |
| | |
| Notes to Financial Statements (continued) | | |
Investment Transactions and Investment Income: For financial reporting purposes, investment transactions are recorded on the dates the transactions are entered into (the trade dates). Realized gains and losses on investment transactions are determined on the identified cost basis. Dividend income is recorded on the ex-dividend dates. Dividends from foreign securities where the ex-dividend date may have passed are subsequently recorded when the Fund is informed of the ex-dividend date. Under the applicable foreign tax laws, a withholding tax at various rates may be imposed on capital gains, dividends and interest. Upon notification from issuers, some of the dividend income received from a real estate investment trust may be redesignated as a reduction of cost of the related investment and/or realized gain. Income, expenses and realized and unrealized gains and losses are allocated daily to each class based on its relative net assets.
Distributions: Distributions paid by the Fund are recorded on the ex-dividend date. The character and timing of distributions are determined in accordance with federal income tax regulations, which may differ from U.S. GAAP.
Other: Expenses directly related to the Fund or its classes are charged to the Fund or the applicable class. Other operating expenses shared by several funds are prorated among those funds on the basis of relative net assets or other appropriate methods. Expenses directly related to the Fund and other shared expenses prorated to the Fund are allocated daily to each class based on its relative net assets or other appropriate methods.
The Fund has an arrangement with its custodian whereby fees may be reduced by credits earned on uninvested cash balances, which, if applicable, are shown as fees paid indirectly in the Statement of Operations. The custodian imposes fees on overdrawn cash balances, which can be offset by accumulated credits earned or may result in additional custody charges.
3. Securities and Other Investments:
Short Sales: The Fund may enter into short sale transactions in which the Fund sells a security it does not hold in anticipation of a decline in the market price of that security. When the Fund makes a short sale, it will borrow the security sold short from a broker/counterparty and deliver the security to the purchaser. To close out a short position, the Fund delivers the same security to the broker and records a liability to reflect the obligation to return the security to the broker. The amount of the liability is subsequently marked-to-market to reflect the market value of the short sale. The Fund maintains a segregated account of securities or deposits cash with the broker-dealer as collateral for the short sales. Cash deposited with the broker, if any, is recorded as an asset in the Statement of Assets and Liabilities. Securities segregated as collateral are denoted in the Schedule of Investments. The Fund may pay a financing fee for the difference between the market value of the short position and the cash collateral deposited with the broker which would be recorded as interest expense. The Fund is required to repay the counterparty any dividends received on the security sold short, which is shown as dividend expense in the Statement of Operations. The Fund may pay a fee on the assets borrowed from the counterparty, which is shown as stock loan fees in the Statement of Operations. The Fund is exposed to market risk based on the amount, if any, that the market value of the security increases beyond the market value at which the position was sold. Thus, a short sale of a security involves the risk that instead of declining, the price of the security sold short will rise. The short sale of securities involves the possibility of a theoretically unlimited loss since there is a theoretically unlimited potential for the market price of the security sold short to increase. A gain, limited to the price at which the Fund sold the security short, or a loss, unlimited as to the dollar amount, will be recognized upon the termination of a short sale if the market price is either less than or greater than the proceeds originally received. There is no assurance the Fund will be able to close out a short position at a particular time or at an acceptable price.
4. Investment Advisory Agreement and Other Transactions with Affiliates:
The PNC Financial Services Group, Inc. is the largest stockholder and an affiliate, of BlackRock, Inc. (“BlackRock”) for 1940 Act purposes.
The Corporation, on behalf of the Fund, entered into an Investment Advisory Agreement with BlackRock Advisors, LLC (the “Manager”), the Fund’s investment advisor, an indirect, wholly owned subsidiary of BlackRock, to provide investment advisory and administration services. The Manager is responsible for the management of the Fund’s portfolio and provides the necessary personnel, facilities, equipment and certain other services to the operations of the Fund. For such services, the Fund pays the Manager a monthly fee based on a percentage of the Fund’s average daily net assets at the following annual rates:
| | | | |
| Average Daily Net Assets | | Investment
Advisory
Fee | |
First $1 Billion | | | 1.20 | % |
$1 Billion - $3 Billion | | | 1.13 | % |
$3 Billion - $5 Billion | | | 1.08 | % |
$5 Billion - $10 Billion | | | 1.04 | % |
Greater than $10 Billion | | | 1.02 | % |
| | | | | | |
| | | BLACKROCK LARGE CAP CORE PLUS FUND | | MARCH 31, 2015 | | 21 |
| | |
| Notes to Financial Statements (continued) | | |
The Manager contractually agreed to waive and/or reimburse fees or expenses in order to limit expenses, excluding interest expense, dividend expense, tax expense, acquired fund fees and expenses and certain other Fund expenses, which constitute extraordinary expenses not incurred in the ordinary course of the Fund’s business. The expense limitations as a percentage of average daily net assets are as follows: 1.38% for Institutional; 1.65% for Investor A; and 2.39% for Investor C. The Manager has agreed not to reduce or discontinue this contractual waiver or reimbursement prior to February 1, 2016 unless approved by the Board, including a majority of the independent directors.
For the six months ended March 31, 2015, the Manager waived and/or reimbursed $57,841, which is included in fees waived and/or reimbursed by the Manager in the Statement of Operations.
The Manager also reimbursed the Fund for transfer agent fees which are shown as transfer agent fees reimbursed — class specific in the Statement of Operations.
The Manager voluntarily agreed to waive its investment advisory fees by the amount of investment advisory fees the Fund pays to the Manager indirectly through its investment in affiliated money market funds. However, the Manager does not waive its investment advisory fees by the amount of investment advisory fees paid in connection with the Fund’s investment in other affiliated investment companies, if any. This amount is included in fees waived and/or reimbursed by the Manager in the Statement of Operations. For the six months ended March 31, 2015, the Manager waived $171.
For the six months ended March 31, 2015, the Fund reimbursed the Manager $196 for certain accounting services, which is included in accounting services in the Statement of Operations.
The Corporation, on behalf of the Fund, entered into a Distribution Agreement and Distribution Plans with BlackRock Investments, LLC (“BRIL”), an affiliate of the Manager. Pursuant to the Distribution Plans and in accordance with Rule 12b-1 under the 1940 Act, the Fund pays BRIL ongoing service and distribution fees. The fees are accrued daily and paid monthly at annual rates based upon the average daily net assets of the relevant share class of the Fund as follows:
| | | | | | | | |
| | | Service
Fee | | | Distribution
Fee | |
Investor A | | | 0.25 | % | | | — | |
Investor C | | | 0.25 | % | | | 0.75 | % |
Pursuant to sub-agreements with BRIL, broker-dealers and BRIL provide shareholder servicing and distribution services to the Fund. The ongoing service and/or distribution fees compensate BRIL and each broker-dealer for providing shareholder servicing and/or distribution related services to Investor A and Investor C shareholders.
The Manager maintains a call center, which is responsible for providing certain shareholder services to the Fund, such as responding to shareholder inquiries and processing transactions based upon instructions from shareholders with respect to the subscription and redemption of Fund shares. For the six months ended March 31, 2015, the Fund reimbursed the Manager the following amounts for costs incurred in running the call center, which are included in transfer agent — class specific in the Statement of Operations:
| | | | |
| | | | |
Institutional | | $ | 93 | |
Investor A | | $ | 588 | |
Investor C | | $ | 355 | |
For the six months ended March 31, 2015, affiliates earned underwriting discounts, direct commissions and dealer concessions on sales of the Fund’s Investor A Shares of $851.
For the six months ended March 31, 2015, affiliates received CDSCs as follows:
| | |
| Investor A | | Investor C |
$66 | | $180 |
Certain officers and/or directors of the Corporation are officers and/or directors of BlackRock or its affiliates. The Fund reimburses the Manager for a portion of the compensation paid to the Corporation’s Chief Compliance Officer, which is included in officer and Directors in the Statement of Operations.
| | | | | | |
| 22 | | BLACKROCK LARGE CAP CORE PLUS FUND | | MARCH 31, 2015 | | |
| | |
| Notes to Financial Statements (continued) | | |
The Fund may purchase securities from, or sell securities to, an affiliated fund provided the affiliation is due solely to having a common investment advisor, common officers, or common trustees. For the six months ended March 31, 2015, the sale transactions with an affiliated fund in compliance with Rule 17a-7 under the 1940 Act were $235,692.
5. Purchases and Sales:
Purchases and sales of investments, excluding short-term securities, for the six months ended March 31, 2015, were $10,447,269 and $16,806,696, respectively.
6. Income Tax Information:
It is the Fund’s policy to comply with the requirements of the Internal Revenue Code of 1986, as amended, applicable to regulated investment companies, and to distribute substantially all of its taxable income to its shareholders. Therefore, no federal income tax provision is required.
The Fund files U.S. federal and various state and local tax returns. No income tax returns are currently under examination. The statute of limitations on the Fund’s U.S. federal tax returns remains open for each of the four years ended September 30, 2014. The statutes of limitations on the Fund’s state and local tax returns may remain open for an additional year depending upon the jurisdiction.
Management has analyzed tax laws and regulations and their application to the Fund as of March 31, 2015, and does not believe there are any uncertain tax positions that require recognition of a tax liability in the Fund’s financial statements.
As of March 31, 2015, gross unrealized appreciation and depreciation based on cost for federal income tax purposes were as follows:
| | | | |
Tax cost | | $ | 31,329,113 | |
| | | | |
Gross unrealized appreciation | | $ | 11,546,090 | |
Gross unrealized depreciation | | | (732,597 | ) |
| | | | |
Net unrealized appreciation | | $ | 10,813,493 | |
| | | | |
7. Bank Borrowings:
The Corporation, on behalf of the Fund, along with certain other funds managed by the Manager and its affiliates (“Participating Funds”), was a party to a 364-day, $1.1 billion credit agreement with a group of lenders, under which the Fund may borrow to fund shareholder redemptions. Excluding commitments designated for a certain individual fund, the Participating Funds, including the Fund, could borrow up to an aggregate commitment amount of $650 million, subject to asset coverage and other limitations as specified in the agreement. Effective November 25, 2014, the credit agreement was amended to an aggregate commitment amount of $2.1 billion, of which the Participating Funds, including the Fund, can borrow up to $1.6 billion at any time outstanding, subject to asset coverage and other limitations as specified in the agreement. The agreement terminates on April 23, 2015, unless otherwise extended to November 24, 2015 or renewed for a period of 364 days from April 23, 2015. The amended agreement has the following terms: a fee of 0.06% per annum on unused commitment amounts and interest at a rate equal to the higher of (a) one-month LIBOR (but in any event, not less than 0.00%) on the date the loan is made plus 0.80% per annum or (b) the Fed Funds rate (but in any event, not less than 0.00%) in effect from time to time plus 0.80% per annum on amounts borrowed. Participating Funds paid administration, legal and arrangement fees, which are included in miscellaneous expenses in the Statement of Operations, and along with commitment fees, were allocated among such funds based upon portions of the aggregate commitment available to them and relative net assets of Participating Funds. During the six months ended March 31, 2015, the Fund did not borrow under the credit agreement.
8. Principal Risks:
In the normal course of business, the Fund invests in securities and enters into transactions where risks exist due to fluctuations in the market (market risk) or failure of the issuer of a security to meet all its obligations (issuer credit risk). The value of securities held by the Fund may decline in response to certain events, including those directly involving the issuers whose securities are owned by the Fund; conditions affecting the general economy; overall market changes; local, regional or global political, social or economic instability; and currency, interest rate and price fluctuations. Similar to issuer credit risk, the Fund may be exposed to counterparty credit risk, or the risk that an entity with which the Fund has unsettled or open transactions may fail to or be unable to perform on its commitments. The Fund manages counterparty credit risk by entering into transactions only with counterparties that it believes have the financial resources to honor their obligations and by monitoring the financial stability of those counterparties. Financial assets, which potentially expose the Fund to market, issuer and counterparty credit risks, consist principally of financial instruments and receivables due from counterparties. The extent of the Fund’s exposure to market, issuer and counterparty credit risks with respect to these financial assets is generally approximated by their value recorded in the Statement of Assets and Liabilities, less any collateral held by the Fund.
| | | | | | |
| | | BLACKROCK LARGE CAP CORE PLUS FUND | | MARCH 31, 2015 | | 23 |
| | |
| Notes to Financial Statements (concluded) | | |
As of March 31, 2015, a significant portion of the Fund’s assets or liabilities were exposed to the information technology and energy sectors. Changes in economic conditions affecting such sectors would have a greater impact on the Fund and could affect the value, income and/or liquidity of positions in such securities.
9. Capital Share Transactions:
Transactions in capital shares for each class were as follows:
| | | | | | | | | | | | | | | | | | |
| | | Six Months Ended
March 31, 2015 | | | | | Year Ended
September 30, 2014 | |
| | | Shares | | | Amount | | | | | Shares | | | Amount | |
Institutional | | | | | | | | | | | | | | | | | | |
Shares sold | | | 88,313 | | | $ | 1,318,689 | | | | | | 348,819 | | | $ | 4,888,368 | |
Shares issued in reinvestment of distributions | | | 19,773 | | | | 291,656 | | | | | | — | | | | — | |
Shares redeemed | | | (357,639 | ) | | | (5,368,139 | ) | | | | | (516,276 | ) | | | (7,405,603 | ) |
| | | | | | | | | | |
Net decrease | | | (249,553 | ) | | $ | (3,757,794 | ) | | | | | (167,457 | ) | | $ | (2,517,235 | ) |
| | | | | | | | | | |
| | | | | | | | | | | | | | | | | | |
Investor A | | | | | | | | | | | | | | | | | | |
Shares sold | | | 76,978 | | | $ | 1,118,849 | | | | | | 121,085 | | | $ | 1,646,476 | |
Shares issued in reinvestment of distributions | | | 18,653 | | | | 270,273 | | | | | | — | | | | — | |
Shares redeemed | | | (121,258 | ) | | | (1,756,190 | ) | | | | | (712,501 | ) | | | (9,864,090 | ) |
| | | | | | | | | | |
Net decrease | | | (25,627 | ) | | $ | (367,068 | ) | | | | | (591,416 | ) | | $ | (8,217,614 | ) |
| | | | | | | | | | |
| | | | | | | | | | | | | | | | | | |
Investor C | | | | | | | | | | | | | | | | | | |
Shares sold | | | 63,361 | | | $ | 893,582 | | | | | | 131,942 | | | $ | 1,720,820 | |
Shares issued in reinvestment of distributions | | | 12,881 | | | | 178,269 | | | | | | — | | | | — | |
Shares redeemed | | | (77,262 | ) | | | (1,080,591 | ) | | | | | (175,953 | ) | | | (2,310,283 | ) |
| | | | | | | | | | |
Net decrease | | | (1,020 | ) | | $ | (8,740 | ) | | | | | (44,011 | ) | | $ | (589,463 | ) |
| | | | | | | | | | |
Total Net Decrease | | | (276,200 | ) | | $ | (4,133,602 | ) | | | | | (802,884 | ) | | $ | (11,324,312 | ) |
| | | | | | | | | | |
10. Subsequent Events:
Management’s evaluation of the impact of all subsequent events on the Fund’s financial statements was completed through the date the financial statements were issued and the following item was noted:
Effective April 23, 2015, the 364-day, $2.1 billion credit agreement to which the Fund is a party, was further amended to expire on April 21, 2016, unless otherwise extended or renewed.
On February 19, 2015, the Board approved certain changes to the Fund. In particular, the Board approved a change in the name of the Fund to BlackRock Event Driven Equity Fund and certain changes to the Fund’s principal investment strategies. These changes were effective on May 8, 2015.
| | | | | | |
| 24 | | BLACKROCK LARGE CAP CORE PLUS FUND | | MARCH 31, 2015 | | |
Rodney D. Johnson, Chair of the Board and Director
David O. Beim, Director
Collette Chilton, Director
Frank J. Fabozzi, Director
Dr. Matina S. Horner, Director
Herbert I. London, Director
Ian A. MacKinnon, Director
Cynthia A. Montgomery, Director
Barbara G. Novick, Director
Joseph P. Platt, Director
Robert C. Robb, Jr., Director
Toby Rosenblatt, Director
Mark Stalnecker, Director
Kenneth L. Urish, Director
Frederick W. Winter, Director
John M. Perlowski, President and Chief Executive Officer
Jennifer McGovern, Vice President
Neal Andrews, Chief Financial Officer
Jay Fife, Treasurer
Charles Park, Chief Compliance Officer
Fernanda Piedra, Anti-Money Laundering Compliance Officer
Benjamin Archibald, Secretary
Effective December 31, 2014, Paul L. Audet and Henry Gabbay resigned as Directors of the Corporation and Ronald W. Forbes resigned as a Director of the Corporation and Co-Chair of the Board. Effective January 1, 2015, Collette Chilton, Barbara G. Novick and Mark Stalnecker were appointed to serve as Directors of the Corporation.
Effective March 1, 2015, Charles Park resigned as Anti-Money Laundering Compliance Officer of the Corporation and Fernanda Piedra became Anti-Money Laundering Compliance Officer of the Corporation.
| | | | | | |
| | | | |
Investment Advisor BlackRock Advisors, LLC Wilmington, DE 19809 | | Custodian Brown Brothers Harriman & Co. Boston, MA 02109 | | Distributor BlackRock Investments, LLC New York, NY 10022 | | Address of the Corporation 100 Bellevue Parkway Wilmington, DE 19809 |
| | | | | | |
Legal Counsel Sidley Austin LLP New York, NY 10019 | | Independent Registered Public Accounting Firm Deloitte & Touche LLP Philadelphia, PA 19103 | | Accounting Agent and Transfer Agent BNY Mellon Investment Servicing (US) Inc. Wilmington, DE 19809 | | |
| | | | | | |
| | | BLACKROCK LARGE CAP CORE PLUS FUND | | MARCH 31, 2015 | | 25 |
Householding
The Fund will mail only one copy of shareholder documents, including prospectuses, annual and semi-annual reports and proxy statements, to shareholders with multiple accounts at the same address. This practice is commonly called “householding” and is intended to reduce expenses and eliminate duplicate mailings of shareholder documents. Mailings of your shareholder documents may be householded indefinitely unless you instruct us otherwise. If you do not want the mailing of these documents to be combined with those for other members of your household, please call the Fund at (800) 441-7762.
Availability of Quarterly Schedule of Investments
The Fund/Master LLC file their complete schedule of portfolio holdings with the SEC for the first and third quarters of each fiscal year on Form N-Q. The Fund/Master LLC’s Forms N-Q are available on the SEC’s website at http://www.sec.gov and may also be reviewed and copied at the SEC’s Public Reference Room in Washington, DC. Information on how to access documents on the SEC’s website without charge may be obtained by calling (800) SEC-0330. The Fund/Master LLC’s Forms N-Q may also be obtained upon request and without charge by calling (800) 441-7762.
Availability of Proxy Voting Policies and Procedures
A description of the policies and procedures that the Fund/Master LLC uses to determine how to vote proxies relating to portfolio securities is available upon request and without charge, (1) by calling (800) 441-7762; (2) at http://www.blackrock.com; and (3) on the SEC’s website at http:// www.sec.gov.
Availability of Proxy Voting Record
Information about how the Fund/Master LLC voted proxies relating to securities held in the Fund/Master LLC’s portfolio during the most recent 12-month period ended June 30 is available upon request and without charge (1) at http://www.blackrock.com or by calling (800) 441-7762 and (2) on the SEC’s website at http://www.sec.gov.
BlackRock’s Mutual Fund Family
BlackRock offers a diverse lineup of open-end mutual funds crossing all investment styles and managed by experts in equity, fixed income and tax-exempt investing. Visit http://www.blackrock.com for more information.
Account Information
Call us at (800) 441-7762 from 8:00 AM to 6:00 PM EST on any business day to get information about your account balances, recent transactions and share prices. You can also reach us on the Web at http://www.blackrock.com/funds.
Automatic Investment Plans
Investor Class shareholders who want to invest regularly can arrange to have $50 or more automatically deducted from their checking or savings account and invested in any of the BlackRock funds.
Systematic Withdrawal Plans
Investor Class shareholders can establish a systematic withdrawal plan and receive periodic payments of $50 or more from their BlackRock funds, as long as their account balance is at least $10,000.
Retirement Plans
Shareholders may make investments in conjunction with Traditional, Rollover, Roth, Coverdell, Simple IRAs, SEP IRAs and 403(b) Plans.
| | | | | | |
| 26 | | BLACKROCK LARGE CAP CORE PLUS FUND | | MARCH 31, 2015 | | |
| | |
| Additional Information (concluded) | | |
|
| BlackRock Privacy Principles |
BlackRock is committed to maintaining the privacy of its current and former fund investors and individual clients (collectively, “Clients”) and to safeguarding their non-public personal information. The following information is provided to help you understand what personal information BlackRock collects, how we protect that information and why in certain cases we share such information with select parties.
If you are located in a jurisdiction where specific laws, rules or regulations require BlackRock to provide you with additional or different privacy-related rights beyond what is set forth below, then BlackRock will comply with those specific laws, rules or regulations.
BlackRock obtains or verifies personal non-public information from and about you from different sources, including the following: (i) information we receive from you or, if applicable, your financial intermediary, on applications, forms or other documents; (ii) information about your transactions with us, our affiliates, or others; (iii) information we receive from a consumer reporting agency; and (iv) from visits to our websites.
BlackRock does not sell or disclose to non-affiliated third parties any non-public personal information about its Clients, except as permitted by law or as is necessary to respond to regulatory requests or to service Client accounts. These non-affiliated third parties are required to protect the confidentiality and security of this information and to use it only for its intended purpose.
We may share information with our affiliates to service your account or to provide you with information about other BlackRock products or services that may be of interest to you. In addition, BlackRock restricts access to non-public personal information about its Clients to those BlackRock employees with a legitimate business need for the information. BlackRock maintains physical, electronic and procedural safeguards that are designed to protect the non-public personal information of its Clients, including procedures relating to the proper storage and disposal of such information.
| | | | | | |
| | | BLACKROCK LARGE CAP CORE PLUS FUND | | MARCH 31, 2015 | | 27 |
| | |
This report is intended for current holders. It is not authorized for use as an offer of sale or a solicitation of an offer to buy shares of the Fund unless preceded or accompanied by the Fund’s current prospectus. Past performance results shown in this report should not be considered a representation of future performance. Investment returns and principal value of shares will fluctuate so that shares, when redeemed, may be worth more or less than their original cost. Statements and other information herein are as dated and are subject to change. | |  |
| | |
EDE-3/15-SAR | |  |
| Item 2 – | Code of Ethics – Not Applicable to this semi-annual report |
| Item 3 – | Audit Committee Financial Expert – Not Applicable to this semi-annual report |
| Item 4 – | Principal Accountant Fees and Services – Not Applicable to this semi-annual report |
| Item 5 – | Audit Committee of Listed Registrants – Not Applicable |
| | (a) The registrants’ Schedule of Investments is included as part of the Report to Stockholders filed under Item 1 of this Form. |
| | (b) Not Applicable due to no such divestments during the semi-annual period covered since the previous Form N-CSR filing. |
| Item 7 – | Disclosure of Proxy Voting Policies and Procedures for Closed-End Management Investment Companies – Not Applicable |
| Item 8 – | Portfolio Managers of Closed-End Management Investment Companies – Not Applicable |
| Item 9 – | Purchases of Equity Securities by Closed-End Management Investment Company and Affiliated Purchasers – Not Applicable |
| Item 10 – | Submission of Matters to a Vote of Security Holders – There have been no material changes to these procedures. |
| Item 11 – | Controls and Procedures |
| | (a) – The registrants’ principal executive and principal financial officers, or persons performing similar functions, have concluded that the registrants’ disclosure controls and procedures (as defined in Rule 30a-3(c) under the Investment Company Act of 1940, as amended (the “1940 Act”)) are effective as of a date within 90 days of the filing of this report based on the evaluation of these controls and procedures required by Rule 30a-3(b) under the 1940 Act and Rule 15d-15(b) under the Securities Exchange Act of 1934, as amended. |
| | (b) – There were no changes in the registrants’ internal control over financial reporting (as defined in Rule 30a-3(d) under the 1940 Act) that occurred during the second fiscal quarter of the period covered by this report that have materially affected, or are reasonably likely to materially affect, the registrants’ internal control over financial reporting. |
| Item 12 – | Exhibits attached hereto |
| | (a)(1) – Code of Ethics – Not Applicable to this semi-annual report |
| | (a)(2) – Certifications – Attached hereto |
| | (b) – Certifications – Attached hereto |
2
Pursuant to the requirements of the Securities Exchange Act of 1934 and the Investment Company Act of 1940, each registrant has duly caused this report to be signed on its behalf by the undersigned, thereunto duly authorized.
BlackRock Large Cap Series Funds, Inc. and Master Large Cap Series LLC
| | |
| By: | | /s/ John M. Perlowski |
| | John M. Perlowski |
| | Chief Executive Officer (principal executive officer) of |
| | BlackRock Large Cap Series Funds, Inc. and Master Large Cap Series LLC |
Date: June 2, 2015
Pursuant to the requirements of the Securities Exchange Act of 1934 and the Investment Company Act of 1940, this report has been signed below by the following persons on behalf of each registrant and in the capacities and on the dates indicated.
| | |
| By: | | /s/ John M. Perlowski |
| | John M. Perlowski |
| | Chief Executive Officer (principal executive officer) of |
| | BlackRock Large Cap Series Funds, Inc. and Master Large Cap Series LLC |
Date: June 2, 2015 |
| By: | | /s/ Neal J. Andrews |
| | Neal J. Andrews |
| | Chief Financial Officer (principal financial officer) of |
| | BlackRock Large Cap Series Funds, Inc. and Master Large Cap Series LLC |
Date: June 2, 2015
3