UNITED STATES
SECURITIES AND EXCHANGE COMMISSION
Washington, D.C. 20549
FORM N-CSR
CERTIFIED SHAREHOLDER REPORT OF REGISTERED MANAGEMENT INVESTMENT COMPANIES
Investment Company Act file number 811-09637 and 811-09739
Name of Fund: BlackRock Large Cap Series Funds, Inc. and Master Large Cap Series LLC
BlackRock Large Cap Series Funds, Inc.
BlackRock Large Cap Core Fund
BlackRock Large Cap Core Plus Fund
BlackRock Large Cap Core Retirement Portfolio
BlackRock Large Cap Growth Fund
BlackRock Large Cap Growth Retirement Portfolio
BlackRock Large Cap Value Fund
BlackRock Large Cap Value Retirement Portfolio
Master Large Cap Series LLC
Master Large Cap Core Portfolio
Master Large Cap Growth Portfolio
Master Large Cap Value Portfolio
Fund Address: 100 Bellevue Parkway, Wilmington, DE 19809
Name and address of agent for service: John M. Perlowski, Chief Executive Officer, BlackRock Large Cap Series Funds, Inc. and Master Large Cap Series LLC, 55 East 52nd Street, New York, NY 10055
Registrants’ telephone number, including area code: (800) 441-7762
Date of fiscal year end: 09/30/2013
Date of reporting period: 03/31/2013
Item 1 – Report to Stockholders
| | | | | | |
| | | | | | | |
| 2 | | BLACKROCK LARGE CAP SERIES FUNDS, INC. | | MARCH 31, 2013 | | |
Dear Shareholder
Despite continued global headwinds, risk assets (such as equities) have generated strong performance as investors sought meaningful yields in the ongoing low-interest-rate environment. About this time one year ago, concerns about Europe’s debt crisis dominated the markets as political instability in Greece and severe deficit and liquidity problems in Spain raised the specter of a full-blown euro collapse. Investors were also discouraged by gloomy economic reports from various parts of the world, particularly in China. As the outlook for the global economy worsened, however, investors grew increasingly optimistic that the world’s largest central banks would intervene to stimulate growth. This theme, along with the European Central Bank’s (“ECB’s”) firm commitment to preserve the euro currency bloc, drove most asset classes higher through the summer of 2012. In early September, the ECB announced it would purchase unlimited amounts of short term sovereign bonds to support the region’s debt-laden countries. Days later, the US Federal Reserve announced its own much-anticipated stimulus package.
Although financial markets world-wide were buoyed by these aggressive policy actions, risk assets weakened in the fall of 2012. Global trade began to slow as many European countries fell into recession and growth continued to decelerate in China. In the United States, stocks slid on lackluster corporate earnings and volatility rose in advance of the US Presidential election. In the post-election environment, investors grew increasingly concerned over the “fiscal cliff,” the automatic tax increases and spending cuts that had been scheduled to take effect at the beginning of 2013. There was widespread fear that the fiscal cliff would push the United States into recession unless politicians could agree upon alternate measures to reduce the nation’s deficit. Worries that bipartisan gridlock would preclude a timely budget deal triggered high levels of volatility in financial markets around the world in the months leading up to the last day of the year. Ultimately, the worst of the fiscal cliff was averted with a last-minute tax deal, although the postponement of decisions relating to spending cuts and the debt ceiling left some lingering uncertainty.
Investors shook off the nerve-wracking finale to 2012 and the New Year began with a powerful relief rally in risk assets. Money that had been pulled to the sidelines amid year-end tax-rate uncertainty poured back into the markets in January. Key indicators signaling modest but broad-based improvements in the world’s major economies underpinned the rally. Underlying this aura of comfort was the absence of negative headlines out of Europe. Against this backdrop, global equities surged through January while rising US Treasury yields pressured high quality fixed income assets (as prices move in the opposite direction as yields).
However, bond markets regained strength in February when economic momentum slowed and investors toned down their risk appetite. US stocks continued to rise, but at a more moderate pace. Uncertainty about how long the Federal Reserve would maintain its monetary easing bias drove high levels of volatility later in the month, but these fears abated as the budget sequester (automatic spending cuts scheduled to take effect March 1) began to appear imminent and was deemed likely to deter any near-term changes in the central bank’s policy stance. Improving labor market data and rising home prices pushed US stocks higher at the end of the period, with major indices reaching new all-time highs. Outside the United States, equity prices weakened in the final two months of the period due to a resurgence of macro risk out of Europe. Italy’s February presidential election ended in a stalemate, further propagating the ongoing theme of political instability in the eurozone. In March, a severe banking crisis in Cyprus underscored the fragility of the broader European banking system.
For the 6- and 12-month periods ended March 31, 2013, US and international stocks and high yield bonds posted strong gains, while emerging market equities lagged as the pace of global growth failed to impress investors. US Treasury yields were highly volatile over the past 12 months. While remaining relatively low from a historical standpoint, yields began inching higher in the later part of the period, pressuring Treasuries and investment-grade bonds. Tax-exempt municipal bonds, however, benefited from favorable supply-and-demand dynamics. Near-zero short term interest rates continued to keep yields on money market securities near their all-time lows.
Markets have always been unpredictable, but that does not mean investors can delay taking action. At BlackRock, we believe it’s time for a different approach to investing. One that seeks out more opportunities in more places across a broader array of investments in a portfolio designed to move freely as the markets move up and down. People everywhere are asking, “So what do I do with my money?” Visit www.blackrock.com for answers.
Sincerely,

Rob Kapito
President, BlackRock Advisors, LLC

“Despite continued global headwinds, risk assets (such as equities) have generated strong performance as investors sought meaningful yields in the ongoing low-interest-rate environment.”
Rob Kapito
President, BlackRock Advisors, LLC
Total Returns as of March 31, 2013
| | | | | | |
| | | | | 6-month | | 12-month |
US large cap equities (S&P 500® Index) | | | | 10.19% | | 13.96% |
US small cap equities (Russell 2000® Index) | | | | 14.48 | | 16.30 |
International equities (MSCI Europe, Australasia, Far East Index) | | | | 12.04 | | 11.25 |
Emerging market equities (MSCI Emerging Markets Index) | | | | 3.87 | | 1.96 |
3-month Treasury bill (BofA Merrill Lynch 3-Month US Treasury Bill Index) | | | | 0.06 | | 0.12 |
US Treasury securities (BofA Merrill Lynch 10- Year US Treasury Index) | | | | (0.55) | | 6.19 |
US investment grade bonds (Barclays US Aggregate Bond Index) | | | | 0.09 | | 3.77 |
Tax-exempt municipal bonds (S&P Municipal Bond Index) | | | | 1.26 | | 5.82 |
US high yield bonds (Barclays US Corporate High Yield 2% Issuer Capped Index) | | | | 6.28 | | 13.08 |
Past performance is no guarantee of future results. Index performance is shown for illustrative purposes only. You cannot invest directly in an index.
| | | | | | |
| | | | | | | |
| | THIS PAGE NOT PART OF YOUR FUND REPORT | | | | 3 |
| | |
| | |
Fund Summary as of March 31, 2013 | | BlackRock Large Cap Core Fund |
BlackRock Large Cap Core Fund’s (the “Fund”) investment objective is to seek long-term capital growth. In other words, the Fund tries to choose investments that will increase in value.
|
Portfolio Management Commentary |
How did the Fund perform?
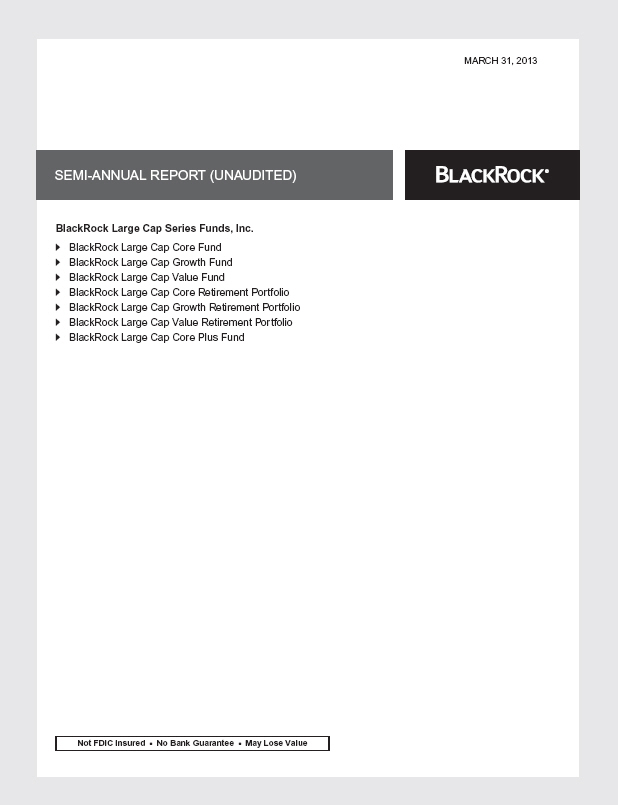
| | — | | For the six-month period ended March 31, 2013, the Fund, through its investment in Master Large Cap Core Portfolio (the “Portfolio”), underperformed its benchmark, the Russell 1000® Index. |
What factors influenced performance?
| | — | | Relative to the benchmark index, negative performance in the information technology (“IT”) and health care sectors overshadowed positive results in industrials, financials and materials. |
| | — | | Positioning within the IT sector was the largest detractor from performance, with holdings in the computers & peripherals and IT services industries representing the majority of the underperformance. In computers & peripherals, an overweight in Apple, Inc. detracted as the stock tumbled during the period due to investors’ increasing concerns about weakening profit margins and the company’s ability to continue to innovate and drive demand for its products. An overweight in data storage provider EMC Corp. also hurt results. The stock posted a negative return for the period as a slightly disappointing earnings outlook and poor performance by the company’s subsidiary, VMware, Inc., weighed on the shares. Within IT services, shares of data analytics firm Teradata Corp. lagged after the company issued a cautious growth forecast for the first half of 2013. Additionally, shares of money transfer company The Western Union Co. plummeted on a lowered earnings forecast due to rising competition. |
| | — | | Within health care, a lack of exposure to biotechnology names hurt relative returns as the industry was the top performer in the sector during the period. Positioning within the health care providers & services industry was another area of notable weakness. Shares of pharmacy benefit manager Express Scripts Holding Co. plunged on a cautious outlook for 2013 before the stock was sold from the Portfolio. Additionally, health insurer UnitedHealth Group, Inc. had a negative impact on relative performance. The Portfolio sold the stock due to concerns about possible cuts to Medicare Advantage reimbursement rates, which would significantly erode the company’s profitability. Shares later rallied, however, as the Centers for Medicare and Medicaid Services reversed some of the |
rate changes. Elsewhere, pharmaceutical holding Merck & Co., Inc. hindered relative returns as modest disappointments relating to its research and development pipeline weighed on the stock price.
| | — | | Conversely, stock selection drove outperformance in industrials, financials and materials. The industrials sector was the most notable source of strength, with an overweight in airline names, including United Continental Holdings, Inc. and Delta Air Lines, Inc., providing the greatest benefit. Airline stocks soared during the six-month period as a combination of strong demand, higher ticket prices and slimmed-down operations resulted in increased profits industry-wide. Within financials, an overweight in US money center banks was especially additive. The Portfolio’s key holdings in this segment, including Citigroup, Inc. and The Goldman Sachs Group, Inc., surged on a strong recovery in capital markets activity, progress in cost-saving initiatives and improving trends across the broader US economy. An overweight in containerboard manufacturers provided the greatest lift in the materials sector. Top names such as International Paper Co., Packaging Corp. of America and Rock-Tenn Co. recorded strong gains as industry consolidation has led to improved competitive conditions and increased pricing power. Relative performance was also aided by a lack of exposure to the poor-performing metals & mining industry. |
Describe recent portfolio activity.
| | — | | During the six-month period, the Portfolio significantly increased exposure to the industrials, financials and IT sectors and reduced its weightings in health care and utilities. |
Describe portfolio positioning at period end.
| | — | | Portfolio management continues to maintain a positive view on equities for the long term and, in particular, seeks to invest in companies with strong and consistent free cash flows, the ability to maintain or improve profit margins and/or the ability to innovate and grow their businesses. Relative to the Russell 1000® Index, the Portfolio ended the period with its largest sector overweights in IT and financials, while consumer staples and utilities were the most significant underweights. |
The views expressed reflect the opinions of BlackRock as of the date of this report and are subject to change based on changes in market, economic or other conditions. These views are not intended to be a forecast of future events and are no guarantee of future results.
| | | | | | |
| | | | | | | |
| 4 | | BLACKROCK LARGE CAP SERIES FUNDS, INC. | | MARCH 31, 2013 | | |
| | |
| | |
| | BlackRock Large Cap Core Fund |
|
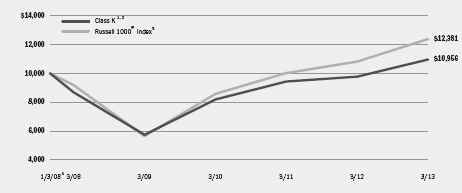
Total Return Based on a $10,000 Investment |
| | 1 | Assuming maximum sales charges, if any, transaction costs and other operating expenses, including investment advisory fees. Institutional Shares do not have a sales charge. |
| | 2 | The Fund invests all of its assets in the Portfolio, a series of Master Large Cap Series LLC. The Portfolio invests at least 80% of its assets in equity securities of large cap companies located in the United States that the investment advisor selects from among those that are, at the time of purchase, included in the Russell 1000® Index. |
| | 3 | This unmanaged broad-based index measures the performance of the 1,000 largest companies in the Russell 3000® Index, which represents approximately 90% of the total market capitalization of the Russell 3000® Index. |
|
Performance Summary for the Period Ended March 31, 2013 |
| | | | | | | | | | | | | | | | | | |
| | | | | Average Annual Total Returns4 |
| | | | | 1 Year | | | 5 Years | | | 10 Years |
| | | 6-Month
Total Returns | | w/o sales
charge | | w/ sales
charge | | | w/o sales
charge | | w/ sales
charge | | | w/o sales
charge | | w/ sales
charge |
Institutional | | 10.46% | | 12.02% | | | N/A | | | 4.45% | | | N/A | | | 8.44% | | N/A |
Service | | 10.20% | | 11.47% | | | N/A | | | 4.19% | | | N/A | | | 8.17% | | N/A |
Investor A | | 10.39% | | 11.57% | | | 5.71% | | | 4.23% | | | 3.11% | | | 8.18% | | 7.60% |
Investor B | | 9.88% | | 10.65% | | | 6.15% | | | 3.39% | | | 3.04% | | | 7.50% | | 7.50% |
Investor C | | 9.89% | | 10.58% | | | 9.58% | | | 3.29% | | | 3.29% | | | 7.27% | | 7.27% |
Class R | | 10.17% | | 11.11% | | | N/A | | | 3.79% | | | N/A | | | 7.83% | | N/A |
Russell 1000® Index | | 11.10% | | 14.43% | | | N/A | | | 6.15% | | | N/A | | | 8.97% | | N/A |
| | 4 | Assuming maximum sales charges, if any. Average annual total returns with and without sales charges reflect reductions for distribution and service fees. See “About Fund Performance” on page 18 for a detailed description of share classes, including any related sales charges and fees. |
N/A - Not applicable as share class and index do not have a sales charge.
Past performance is not indicative of future results.
| | | | | | | | | | | | | | |
| | | Actual | | Hypothetical6 | | |
| | | Beginning
Account Value
October 1, 2012 | | Ending
Account Value
March 31, 2013 | | Expenses Paid
During the Period5 | | Beginning
Account Value
October 1, 2012 | | Ending
Account Value
March 31, 2013 | | Expenses Paid
During the Period5 | | Annualized
Expense
Ratio |
Institutional | | $1,000.00 | | $1,104.60 | | $ 4.67 | | $1,000.00 | | $1,020.49 | | $ 4.48 | | 0.89% |
Service | | $1,000.00 | | $1,102.00 | | $ 6.29 | | $1,000.00 | | $1,018.95 | | $ 6.04 | | 1.20% |
Investor A | | $1,000.00 | | $1,103.90 | | $ 5.98 | | $1,000.00 | | $1,019.25 | | $ 5.74 | | 1.14% |
Investor B | | $1,000.00 | | $1,098.80 | | $10.31 | | $1,000.00 | | $1,015.11 | | $ 9.90 | | 1.97% |
Investor C | | $1,000.00 | | $1,098.90 | | $10.68 | | $1,000.00 | | $1,014.76 | | $10.25 | | 2.04% |
Class R | | $1,000.00 | | $1,101.70 | | $ 8.02 | | $1,000.00 | | $1,017.30 | | $ 7.70 | | 1.53% |
| | 5 | For each class of the Fund, expenses are equal to the annualized expense ratio for the class, multiplied by the average account value over the period, multiplied by 182/365 (to reflect the one-half year period shown). Because the Fund invests significantly in the Portfolio, the expense table reflects the net expenses of both the Fund and the Port- folio in which it invests. |
| | 6 | Hypothetical 5% annual return before expenses is calculated by pro rating the number of days in the most recent fiscal half year divided by 365. |
| | | See “Disclosure of Expenses” on page 18 for further information on how expenses were calculated. |
| | | | | | |
| | | | | | | |
| | BLACKROCK LARGE CAP SERIES FUNDS, INC. | | MARCH 31, 2013 | | 5 |
| | |
| | |
Fund Summary as of March 31, 2013 | | BlackRock Large Cap Growth Fund |
BlackRock Large Cap Growth Fund’s (the “Fund”) investment objective is to seek long-term capital growth. In other words, the Fund tries to choose investments that will increase in value.
|
Portfolio Management Commentary |
How did the Fund perform?
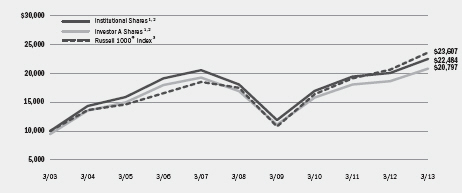
| — | | For the six-month period ended March 31, 2013, the Fund, through its investment in Master Large Cap Growth Portfolio (the “Portfolio”), underperformed its benchmark, the Russell 1000® Growth Index. |
What factors influenced performance?
| — | | Relative to the benchmark index, negative performance in the information technology (“IT”), health care and consumer staples sectors overshadowed positive results in industrials and materials. |
| — | | Positioning within the IT sector was the largest detractor from performance, with holdings in the IT services and computers & peripherals industries representing the majority of the underperformance. In IT services, shares of money transfer company The Western Union Co. plummeted on a lowered earnings forecast due to rising competition. Additionally, shares of data analytics firm Teradata Corp. lagged after the company issued a cautious growth forecast for the first half of 2013. Within computers & peripherals, an overweight in Apple, Inc. detracted as the stock tumbled during the period due to investors’ increasing concerns about weakening profit margins and the company’s ability to continue to innovate and drive demand for its products. An overweight in data storage provider EMC Corp. also hurt results. The stock posted a negative return for the period as a slightly disappointing earnings outlook and poor performance by the company’s subsidiary, VMware, Inc., weighed on the shares. |
| — | | The most significant detractor in health care was the Portfolio’s lack of exposure to biotechnology names as the industry was the top performer in the sector. Positioning within the pharmaceuticals industry was another area of notable weakness due to a lack of exposure to certain benchmark index constituents that posted particularly strong performance for the period. |
| — | | In consumer staples, the Portfolio’s lack of exposure to food product companies hurt relative results as these stocks performed well amid industry consolidation and strong investor demand for high-yielding equities. Personal products was another source of underperformance, |
primarily due to the Portfolio’s position in nutritional supplements company Herbalife Ltd. Shares plummeted in the fourth quarter of 2012 when a prominent, media-savvy investor raised pointed questions about the company’s business model, triggering a probe by securities regulators. Lastly, retailing titan Wal-Mart Stores, Inc. detracted as shares came under pressure on a revenue miss and weaker-than-expected profit outlook for the 2012 fourth quarter, as well as concerns about potential headwinds to consumer spending.
| — | | Conversely, selection drove outperformance in industrials and materials. The industrials sector was the most notable source of strength, with an overweight in airline names, including United Continental Holdings, Inc. and Delta Air Lines, Inc., providing the greatest benefit. Airline stocks soared during the six-month period as a combination of strong demand, higher ticket prices and slimmed-down operations resulted in increased profits industry-wide. An overweight in containerboard manufacturers provided the greatest lift in the materials sector. Top names such as International Paper Co. and Packaging Corp. of America recorded strong gains as industry consolidation has led to improved competitive conditions and increased pricing power. |
Describe recent portfolio activity.
| — | | During the six-month period, the Portfolio materially increased exposure to the industrials sector, and also added to IT and consumer discretionary. The Portfolio considerably reduced its weightings in health care, consumer staples and energy. |
Describe portfolio positioning at period end.
| — | | Portfolio management continues to maintain a positive view on equities for the long term and, in particular, seeks to invest in companies with strong and consistent free cash flows, the ability to maintain or improve profit margins and/or the ability to innovate and grow their businesses. Relative to the Russell 1000® Growth Index, the Portfolio ended the period with its largest sector overweight in IT, followed by materials and industrials, while health care, consumer staples and consumer discretionary were the most significant underweights. |
The views expressed reflect the opinions of BlackRock as of the date of this report and are subject to change based on changes in market, economic or other conditions. These views are not intended to be a forecast of future events and are no guarantee of future results.
| | | | | | |
| | | | | | | |
| 6 | | BLACKROCK LARGE CAP SERIES FUNDS, INC. | | MARCH 31, 2013 | | |
| | |
| | |
| | BlackRock Large Cap Growth Fund |
|
Total Return Based on a $10,000 Investment |
| | 1 | Assuming maximum sales charges, if any, transaction costs and other operating expenses, including investment advisory fees. Institutional Shares do not have a sales charge. |
| | 2 | The Fund invests all of its assets in the Portfolio, a series of Master Large Cap Series LLC. The Portfolio invests at least 80% of its assets in equity securities of large cap companies located in the United States that the investment advisor selects from among those that are, at the time of purchase, included in the Russell 1000® Growth Index. |
| | 3 | This unmanaged broad-based index is a subset of the Russell 1000® Index consisting of those Russell 1000® securities with a greater-than-average growth orientation. |
|
Performance Summary for the Period Ended March 31, 2013 |
| | | | | | | | | | | | | | |
| | | | | Average Annual Total Returns4 |
| | | | | 1 Year | | 5 Years | | 10 Years |
| | | 6-Month Total Returns | | w/o sales charge | | w/sales charge | | w/o sales charge | | w/sales charge | | w/o sales charge | | w/sales charge |
Institutional | | 4.77% | | 5.95% | | N/A | | 6.14% | | N/A | | 8.44% | | N/A |
Service | | 4.60% | | 5.63% | | N/A | | 5.88% | | N/A | | 8.18% | | N/A |
Investor A | | 4.59% | | 5.64% | | 0.10% | | 5.79% | | 4.65% | | 8.14% | | 7.56% |
Investor B | | 4.06% | | 4.64% | | 0.28% | | 4.95% | | 4.62% | | 7.44% | | 7.44% |
Investor C | | 4.22% | | 4.80% | | 3.83% | | 4.96% | | 4.96% | | 7.29% | | 7.29% |
Class R | | 4.41% | | 5.32% | | N/A | | 5.46% | | N/A | | 7.84% | | N/A |
Russell 1000® Growth Index | | 8.10% | | 10.09% | | N/A | | 7.30% | | N/A | | 8.62% | | N/A |
| | 4 | Assuming maximum sales charges, if any. Average annual total returns with and without sales charges reflect reductions for distribution and service fees. See “About Fund Performance” on page 18 for a detailed description of share classes, including any related sales charges and fees. |
N/A - Not applicable as share class and index do not have a sales charge.
Past performance is not indicative of future results.
| | | | | | | | | | | | | | |
| | | Actual | | Hypothetical6 | | |
| | | Beginning
Account Value
October 1, 2012 | | Ending
Account Value
March 31, 2013 | | Expenses Paid
During the Period5 | | Beginning
Account Value
October 1, 2012 | | Ending
Account Value
March 31, 2013 | | Expenses Paid
During the Period5 | | Annualized
Expense
Ratio |
Institutional | | $1,000.00 | | $1,047.70 | | $ 5.05 | | $1,000.00 | | $1,020.00 | | $ 4.99 | | 0.99% |
Service | | $1,000.00 | | $1,046.00 | | $ 6.33 | | $1,000.00 | | $1,018.75 | | $ 6.24 | | 1.24% |
Investor A | | $1,000.00 | | $1,045.90 | | $ 6.43 | | $1,000.00 | | $1,018.65 | | $ 6.34 | | 1.26% |
Investor B | | $1,000.00 | | $1,040.60 | | $11.04 | | $1,000.00 | | $1,014.11 | | $10.90 | | 2.17% |
Investor C | | $1,000.00 | | $1,042.20 | | $10.44 | | $1,000.00 | | $1,014.71 | | $10.30 | | 2.05% |
Class R | | $1,000.00 | | $1,044.10 | | $ 8.05 | | $1,000.00 | | $1,017.05 | | $ 7.95 | | 1.58% |
| | 5 | For each class of the Fund, expenses are equal to the annualized expense ratio for the class, multiplied by the average account value over the period, multiplied by 182/365 (to reflect the one-half year period shown). Because the Fund invests significantly in the Portfolio, the expense table reflects the net expenses of both the Fund and the Portfolio in which it invests. |
| | 6 | Hypothetical 5% annual return before expenses is calculated by pro rating the number of days in the most recent fiscal half year divided by 365. |
See “Disclosure of Expenses” on page 18 for further information on how expenses were calculated.
| | | | | | |
| | | | | | | |
| | BLACKROCK LARGE CAP SERIES FUNDS, INC. | | MARCH 31, 2013 | | 7 |
| | |
| | |
Fund Summary as of March 31, 2013 | | BlackRock Large Cap Value Fund |
BlackRock Large Cap Value Fund’s (the “Fund”) investment objective is to seek long-term capital growth. In other words, the Fund tries to choose investments that will increase in value.
|
Portfolio Management Commentary |
How did the Fund perform?
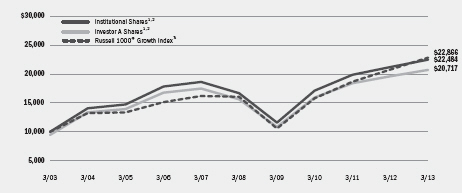
| — | | For the six-month period ended March 31, 2013, the Fund, through its investment in Master Large Cap Value Portfolio (the “Portfolio”), outperformed its benchmark, the Russell 1000® Value Index. |
What factors influenced performance?
| — | | Relative to the benchmark index, positive performance in the industrials, materials and financials sectors more than offset negative results in health care and consumer staples. |
| — | | Stock selection drove the Portfolio’s outperformance in industrials, materials and financials. The industrials sector was the most notable source of strength, with an overweight in airline names, including United Continental Holdings, Inc. and Delta Air Lines, Inc., providing the greatest benefit. Airline stocks soared during the six-month period as a combination of strong demand, higher ticket prices and slimmed-down operations resulted in increased profits industry-wide. In the materials sector, a lack of exposure to the poor-performing metals & mining industry proved beneficial. Also aiding relative returns was an overweight in containerboard manufacturers, where top names such as International Paper Co., Packaging Corp. of America and Rock-Tenn Co. recorded strong gains as industry consolidation has led to improved competitive conditions and increased pricing power. Within financials, an overweight in select insurers such as The Travelers Cos., Inc., American Financial Group, Inc. and PartnerRe Ltd. proved advantageous as these names posted strong returns on the back of continued improvement in pricing trends. The Portfolio’s lack of exposure to poor-performing real estate investment trusts also aided relative results. |
| — | | Conversely, positioning within the health care sector was the largest detractor from performance. Weakness was notable in the providers & services segment, where health insurer UnitedHealth Group, Inc. had a negative impact. The Portfolio sold the stock due to concerns about |
possible cuts to Medicare Advantage reimbursement rates, which would significantly erode the company’s profitability. Shares later rallied, however, as the Centers for Medicare and Medicaid Services reversed some of the rate changes. Positioning within the pharmaceuticals industry also had a negative impact. An overweight to Merck & Co., Inc. hindered relative returns as modest disappointments relating to its research and development pipeline weighed on the stock price. At the same time, the Portfolio was underexposed to benchmark index constituent Johnson & Johnson, which posted a strong gain for the period. In consumer staples, the largest source of underperformance came from the food & staples retailing industry, where Wal-Mart Stores, Inc. shares came under pressure on a revenue miss and weaker-than-expected profit outlook for the 2012 fourth quarter, as well as concerns about potential headwinds to consumer spending. The Portfolio’s lack of exposure to food product companies also hurt relative results as these stocks performed well amid industry consolidation and strong investor demand for high-yielding equities.
Describe recent portfolio activity.
| — | | During the six-month period, the Portfolio significantly increased exposure to the industrials and financials sectors and reduced its weightings in health care, consumer discretionary and utilities. |
Describe portfolio positioning at period end.
| — | | Portfolio management continues to maintain a positive view on equities for the long term and, in particular, seeks to invest in companies with strong and consistent free cash flows, the ability to maintain or improve profit margins and/or the ability to innovate and grow their businesses. Relative to the Russell 1000® Value Index, the Portfolio ended the period with its largest sector overweight in industrials, while utilities was the most significant underweight. |
The views expressed reflect the opinions of BlackRock as of the date of this report and are subject to change based on changes in market, economic or other conditions. These views are not intended to be a forecast of future events and are no guarantee of future results.
| | | | | | |
| | | | | | | |
| 8 | | BLACKROCK LARGE CAP SERIES FUNDS, INC. | | MARCH 31, 2013 | | |
| | |
| | |
| | BlackRock Large Cap Value Fund |
|
Total Return Based on a $10,000 Investment |
| | 1 | Assuming maximum sales charges, if any, transaction costs and other operating expenses, including investment advisory fees. Institutional Shares do not have a sales charge. |
| | 2 | The Fund invests all of its assets in the Portfolio, a series of Master Large Cap Series LLC. The Portfolio invests at least 80% of its assets in equity securities of large cap companies located in the United States that the investment advisor selects from among those that are, at the time of purchase, included in the Russell 1000® Value Index. |
| | 3 | This unmanaged broad-based index is a subset of the Russell 1000® Index consisting of those Russell 1000® securities with lower price-to-book ratios and lower forecasted growth values. |
|
Performance Summary for the Period Ended March 31, 2013 |
| | | | | | | | | | | | | | |
| | | | | Average Annual Total Returns4 |
| | | | | 1 Year | | 5 Years | | 10 Years |
| | | 6-Month
Total Returns | | w/o sales
charge | | w/sales
charge | | w/o sales
charge | | w/sales
charge | | w/o sales
charge | | w/sales
charge |
|
|
Institutional | | 14.78% | | 13.49% | | N/A | | 2.58% | | N/A | | 8.86% | | N/A |
Service | | 14.70% | | 13.18% | | N/A | | 2.39% | | N/A | | 8.62% | | N/A |
Investor A | | 14.69% | | 13.16% | | 7.22% | | 2.31% | | 1.22% | | 8.58% | | 8.00% |
Investor B | | 14.11% | | 12.03% | | 7.53% | | 1.41% | | 1.03% | | 7.88% | | 7.88% |
Investor C | | 14.20% | | 12.18% | | 11.18% | | 1.45% | | 1.45% | | 7.70% | | 7.70% |
Class R | | 14.47% | | 12.81% | | N/A | | 1.98% | | N/A | | 8.28% | | N/A |
Russell 1000® Value Index | | 14.02% | | 18.77% | | N/A | | 4.85% | | N/A | | 9.18% | | N/A |
|
| | 4 | Assuming maximum sales charges, if any. Average annual total returns with and without sales charges reflect reductions for distribution and service fees. See “About Fund Performance” on page 18 for a detailed description of share classes, including any related sales charges and fees. |
N/A - Not applicable as share class and index do not have a sales charge.
Past performance is not indicative of future results.
| | | | | | | | | | | | | | |
| | | Actual | | Hypothetical6 | | |
| | | Beginning
Account Value
October 1, 2012 | | Ending
Account Value
March 31, 2013 | | Expenses Paid
During the Period5 | | Beginning Account Value
October 1, 2012 | | Ending
Account Value
March 31, 2013 | | Expenses Paid
During the Period5 | | Annualized
Expense
Ratio |
|
Institutional | | $1,000.00 | | $1,147.80 | | $ 5.35 | | $1,000.00 | | $1,019.95 | | $ 5.04 | | 1.00% |
Service | | $1,000.00 | | $1,147.00 | | $ 6.32 | | $1,000.00 | | $1,019.05 | | $ 5.94 | | 1.18% |
Investor A | | $1,000.00 | | $1,146.90 | | $ 6.74 | | $1,000.00 | | $1,018.65 | | $ 6.34 | | 1.26% |
Investor B | | $1,000.00 | | $1,141.10 | | $11.85 | | $1,000.00 | | $1,013.86 | | $11.15 | | 2.22% |
Investor C | | $1,000.00 | | $1,142.00 | | $11.16 | | $1,000.00 | | $1,014.51 | | $10.50 | | 2.09% |
Class R | | $1,000.00 | | $1,144.70 | | $ 8.34 | | $1,000.00 | | $1,017.15 | | $ 7.85 | | 1.56% |
|
| | 5 | For each class of the Fund, expenses are equal to the annualized expense ratio for the class, multiplied by the average account value over the period, multiplied by 182/365 (to reflect the one-half year period shown). Because the Fund invests significantly in the Portfolio, the expense table reflects the net expenses of both the Fund and the Portfolio in which it invests. |
| | 6 | Hypothetical 5% annual return before expenses is calculated by pro rating the number of days in the most recent fiscal half year divided by 365. |
See “Disclosure of Expenses” on page 18 for further information on how expenses were calculated.
| | | | | | |
| | | | | | | |
| | BLACKROCK LARGE CAP SERIES FUNDS, INC. | | MARCH 31, 2013 | | 9 |
| | |
| | |
Fund Summary as of March 31, 2013 | | BlackRock Large Cap Core Retirement Portfolio |
BlackRock Large Cap Core Retirement Portfolio’s (the “Fund”) investment objective is to seek long-term capital growth. In other words, the Fund tries to choose investments that will increase in value.
|
| Portfolio Management Commentary |
How did the Fund perform?
| — | | For the six-month period ended March 31, 2013, the Fund, through its investment in Master Large Cap Core Portfolio (the “Portfolio”), underperformed its benchmark, the Russell 1000® Index. |
What factors influenced performance?
| — | | Relative to the benchmark index, negative performance in the information technology (“IT”) and health care sectors overshadowed positive results in industrials, financials and materials. |
| — | | Positioning within the IT sector was the largest detractor from performance, with holdings in the computers & peripherals and IT services industries representing the majority of the underperformance. In computers & peripherals, an overweight in Apple, Inc. detracted as the stock tumbled during the period due to investors’ increasing concerns about weakening profit margins and the company’s ability to continue to innovate and drive demand for its products. An overweight in data storage provider EMC Corp. also hurt results. The stock posted a negative return for the period as a slightly disappointing earnings outlook and poor performance by the company’s subsidiary, VMware, Inc., weighed on the shares. Within IT services, shares of data analytics firm Teradata Corp. lagged after the company issued a cautious growth forecast for the first half of 2013. Additionally, shares of money transfer company The Western Union Co. plummeted on a lowered earnings forecast due to rising competition. |
| — | | Within health care, a lack of exposure to biotechnology names hurt relative returns as the industry was the top performer in the sector during the period. Positioning within the health care providers & services industry was another area of notable weakness. Shares of pharmacy benefit manager Express Scripts Holding Co. plunged on a cautious outlook for 2013 before the stock was sold from the Portfolio. Additionally, health insurer UnitedHealth Group, Inc. had a negative impact on relative performance. The Portfolio sold the stock due to concerns about possible cuts to Medicare Advantage reimbursement rates, which would significantly erode the company’s profitability. Shares later rallied, however, as the Centers for Medicare and Medicaid Services reversed some of the |
rate changes. Elsewhere, pharmaceutical holding Merck & Co., Inc. hindered relative returns as modest disappointments relating to its research and development pipeline weighed on the stock price.
| — | | Conversely, stock selection drove outperformance in industrials, financials and materials. The industrials sector was the most notable source of strength, with an overweight in airline names, including United Continental Holdings, Inc. and Delta Air Lines, Inc., providing the greatest benefit. Airline stocks soared during the six-month period as a combination of strong demand, higher ticket prices and slimmed-down operations resulted in increased profits industry-wide. Within financials, an overweight in US money center banks was especially additive. The Portfolio’s key holdings in this segment, including Citigroup, Inc. and The Goldman Sachs Group, Inc., surged on a strong recovery in capital markets activity, progress in cost-saving initiatives and improving trends across the broader US economy. An overweight in containerboard manufacturers provided the greatest lift in the materials sector. Top names such as International Paper Co., Packaging Corp. of America and Rock-Tenn Co. recorded strong gains as industry consolidation has led to improved competitive conditions and increased pricing power. Relative performance was also aided by a lack of exposure to the poor-performing metals & mining industry. |
Describe recent portfolio activity.
| — | | During the six-month period, the Portfolio significantly increased exposure to the industrials, financials and IT sectors and reduced its weightings in health care and utilities. |
Describe portfolio positioning at period end.
| — | | Portfolio management continues to maintain a positive view on equities for the long term and, in particular, seeks to invest in companies with strong and consistent free cash flows, the ability to maintain or improve profit margins and/or the ability to innovate and grow their businesses. Relative to the Russell 1000® Index, the Portfolio ended the period with its largest sector overweights in IT and financials, while consumer staples and utilities were the most significant underweights. |
The views expressed reflect the opinions of BlackRock as of the date of this report and are subject to change based on changes in market, economic or other conditions. These views are not intended to be a forecast of future events and are no guarantee of future results.
| | | | | | |
| | | | | | | |
| 10 | | BLACKROCK LARGE CAP SERIES FUNDS, INC. | | MARCH 31, 2013 | | |
| | |
| | |
| | BlackRock Large Cap Core Retirement Portfolio |
|
Total Return Based on a $10,000 Investment |
| | 1 | Assuming transaction costs and other operating expenses, including administration fees, if any. |
| | 2 | The Fund invests all of its assets in the Portfolio, a Series of Master Large Cap Series LLC. The Portfolio invests at least 80% of its assets in equity securities of large cap companies located in the United States that the investment advisor selects from among these that are, at the time of purchase, included in the Russell 1000® Index. |
| | 3 | The unmanaged broad-based index measures the performance of the 1,000 largest companies in the Russell 3000® Index, which represents approximately 90% of the total market capitalization of the Russell 3000® Index. |
| | 4 | Commencement of operations. |
|
Performance Summary for the Period Ended March 31, 2013 |
| | | | | | | | |
| | | | | Average Annual Total Returns5 |
| | | 6-Month
Total Returns | | 1 Year | | 5 Years | | Since
Inception6 |
Class K | | 10.61% | | 12.13% | | 4.71% | | 1.76% |
Russell 1000® Index | | 11.10% | | 14.43% | | 6.15% | | 4.16% |
| | 5 | See “About Fund Performance” on page 18 for a detailed description of the share class, including any related sales charges and fees. |
| | 6 | The Fund commenced operations on January 3, 2008. |
| | | Past performance is not indicative of future results. |
| | | | | | | | | | | | | | |
| | | Actual | | Hypothetical8 | | |
| | | Beginning Account Value October 1, 2012 | | Ending Account Value March 31, 2013 | | Expenses Paid During the Period7 | | Beginning Account Value October 1, 2012 | | Ending Account Value March 31, 2013 | | Expenses Paid During the Period7 | | Annualized Expense Ratio |
Class K | | $1,000.00 | | $1,106.10 | | $3.20 | | $1,000.00 | | $1,021.89 | | $3.07 | | 0.61% |
| | 7 | Expenses are equal to the Fund’s annualized expense ratio, multiplied by the average account value over the period, multiplied by 182/365 (to reflect the one-half year period shown). Because the Fund invests significantly in the Portfolio, the expense example reflects the net expenses of both the Fund and the Portfolio in which it invests. |
| | 8 | Hypothetical 5% annual return before expenses is calculated by pro rating the number of days in the most recent fiscal half year divided by 365. |
| | | See “Disclosure of Expenses” on page 18 for further information on how expenses were calculated. |
| | | | | | |
| | | | | | | |
| | BLACKROCK LARGE CAP SERIES FUNDS, INC. | | MARCH 31, 2013 | | 11 |
| | |
| | |
Fund Summary as of March 31, 2013 | | BlackRock Large Cap Growth Retirement Portfolio |
BlackRock Large Cap Growth Retirement Portfolio’s (the “Fund”) investment objective is to seek long-term capital growth. In other words, the Fund tries to choose investments that will increase in value.
|
Portfolio Management Commentary |
How did the Fund perform?
| | — | | For the six-month period ended March 31, 2013, the Fund, through its investment in Master Large Cap Growth Portfolio (the “Portfolio”), underperformed its benchmark, the Russell 1000® Growth Index. |
What factors influenced performance?
| | — | | Relative to the benchmark index, negative performance in the information technology (“IT”), health care and consumer staples sectors overshadowed positive results in industrials and materials. |
| | — | | Positioning within the IT sector was the largest detractor from performance, with holdings in the IT services and computers & peripherals industries representing the majority of the underperformance. In IT services, shares of money transfer company The Western Union Co. plummeted on a lowered earnings forecast due to rising competition. Additionally, shares of data analytics firm Teradata Corp. lagged after the company issued a cautious growth forecast for the first half of 2013. Within computers & peripherals, an overweight in Apple, Inc. detracted as the stock tumbled during the period due to investors’ increasing concerns about weakening profit margins and the company’s ability to continue to innovate and drive demand for its products. An overweight in data storage provider EMC Corp. also hurt results. The stock posted a negative return for the period as a slightly disappointing earnings outlook and poor performance by the company’s subsidiary, VMware, Inc., weighed on the shares. |
| | — | | The most significant detractor in health care was the Portfolio’s lack of exposure to biotechnology names as the industry was the top performer in the sector. Positioning within the pharmaceuticals industry was another area of notable weakness due to a lack of exposure to certain benchmark index constituents that posted particularly strong performance for the period. |
| | — | | In consumer staples, the Portfolio’s lack of exposure to food product companies hurt relative results as these stocks performed well amid industry consolidation and strong investor demand for high-yielding equities. Personal products was another source of underperformance, |
| | primarily due to the Portfolio’s position in nutritional supplements company Herbalife Ltd. Shares plummeted in the fourth quarter of 2012 when a prominent, media-savvy investor raised pointed questions about the company’s business model, triggering a probe by securities regulators. Lastly, retailing titan Wal-Mart Stores, Inc. detracted as shares came under pressure on a revenue miss and weaker-than-expected profit outlook for the 2012 fourth quarter, as well as concerns about potential headwinds to consumer spending. |
| | — | | Conversely, selection drove outperformance in industrials and materials. The industrials sector was the most notable source of strength, with an overweight in airline names, including United Continental Holdings, Inc. and Delta Air Lines, Inc., providing the greatest benefit. Airline stocks soared during the six-month period as a combination of strong demand, higher ticket prices and slimmed-down operations resulted in increased profits industry-wide. An overweight in containerboard manufacturers provided the greatest lift in the materials sector. Top names such as International Paper Co. and Packaging Corp. of America recorded strong gains as industry consolidation has led to improved competitive conditions and increased pricing power. |
Describe recent portfolio activity.
| | — | | During the six-month period, the Portfolio materially increased exposure to the industrials sector, and also added to IT and consumer discretionary. The Portfolio considerably reduced its weightings in health care, consumer staples and energy. |
Describe portfolio positioning at period end.
| | — | | Portfolio management continues to maintain a positive view on equities for the long term and, in particular, seeks to invest in companies with strong and consistent free cash flows, the ability to maintain or improve profit margins and/or the ability to innovate and grow their businesses. Relative to the Russell 1000® Growth Index, the Portfolio ended the period with its largest sector overweight in IT, followed by materials and industrials, while health care, consumer staples and consumer discretionary were the most significant underweights. |
The views expressed reflect the opinions of BlackRock as of the date of this report and are subject to change based on changes in market, economic or other conditions. These views are not intended to be a forecast of future events and are no guarantee of future results.
| | | | | | |
| | | | | | | |
| 12 | | BLACKROCK LARGE CAP SERIES FUNDS, INC. | | MARCH 31, 2013 | | |
| | |
| | |
| | BlackRock Large Cap Growth Retirement Portfolio |
|
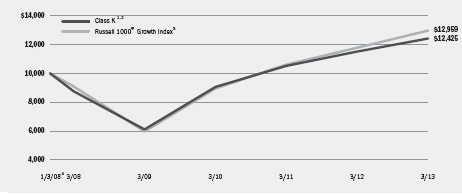
Total Return Based on a $10,000 Investment |
| | 1 | Assuming transaction costs and other operating expenses, including administration fees, if any. |
| | 2 | The Fund invests all of its assets in the Portfolio, a series of Master Large Cap Series LLC. The Portfolio invests at least 80% of its assets in equity securities of large cap companies located in the United States that the investment advisor selects from among these that are, at the time of pur- chase, included in the Russell 1000® Growth Index. |
| | 3 | The unmanaged broad-based index is a subset of the Russell 1000® Index consisting of those Russell® securities with greater-than-average growth orientation. |
| | 4 | Commencement of operations. |
|
Performance Summary for the Period Ended March 31, 2013 |
| | | | | | | | |
| | | 6-Month Total Returns | | Average Annual Total Returns5 |
| | | | 1 Year | | 5 Years | | Since Inception6 |
Class K | | 5.77% | | 7.97% | | 7.24% | | 4.23% |
Russell 1000® Growth Index | | 8.10% | | 10.09% | | 7.30% | | 5.07% |
| | 5 | See “About Fund Performance” on page 18 for a detailed description of the share class, including any related sales charges and fees. |
| | 6 | The Fund commenced operations on January 3, 2008. |
Past performance is not indicative of future results.
| | | | | | | | | | | | | | |
| | | Actual | | Hypothetical8 | | |
| | | Beginning Account Value October 1, 2012 | | Ending Account Value March 31, 2013 | | Expenses Paid During the Period7 | | Beginning Account Value October 1, 2012 | | Ending Account Value March 31, 2013 | | Expenses Paid During the Period7 | | Annualized Expense Ratio |
Class K | | $1,000.00 | | $1,057.70 | | $3.44 | | $1,000.00 | | $1,021.59 | | $3.38 | | 0.67% |
| | 7 | Expenses are equal to the Fund’s annualized expense ratio, multiplied by the average account value over the period, multiplied by 182/365 (to reflect the one-half year period shown). Because the Fund invests significantly in the Portfolio, the expense example reflects the net expenses of both the Fund and the Portfolio in which it invests. |
| | 8 | Hypothetical 5% annual return before expenses is calculated by pro rating the number of days in the most recent fiscal half year divided by 365. |
See “Disclosure of Expenses” on page 18 for further information on how expenses were calculated.
| | | | | | |
| | | | | | | |
| | BLACKROCK LARGE CAP SERIES FUNDS, INC. | | MARCH 31, 2013 | | 13 |
| | |
| | |
Fund Summary as of March 31, 2013 | | BlackRock Large Cap Value Retirement Portfolio |
BlackRock Large Cap Value Retirement Portfolio’s (the “Fund”) investment objective is to seek long-term capital growth. In other words, the Fund tries to choose investments that will increase in value.
|
Portfolio Management Commentary |
How did the Fund perform?
| — | | For the six-month period ended March 31, 2013, the Fund, through its investment in Master Large Cap Value Portfolio (the “Portfolio”), outperformed its benchmark, the Russell 1000® Value Index. |
What factors influenced performance?
| — | | Relative to the benchmark index, positive performance in the industrials, materials and financials sectors more than offset negative results in health care and consumer staples. |
| — | | Stock selection drove the Portfolio’s outperformance in industrials, materials and financials. The industrials sector was the most notable source of strength, with an overweight in airline names, including United Continental Holdings, Inc. and Delta Air Lines, Inc., providing the greatest benefit. Airline stocks soared during the six-month period as a combination of strong demand, higher ticket prices and slimmed-down operations resulted in increased profits industry-wide. In the materials sector, a lack of exposure to the poor-performing metals & mining industry proved beneficial. Also aiding relative returns was an overweight in containerboard manufacturers, where top names such as International Paper Co., Packaging Corp. of America and Rock-Tenn Co. recorded strong gains as industry consolidation has led to improved competitive conditions and increased pricing power. Within financials, an overweight in select insurers such as The Travelers Cos., Inc., American Financial Group, Inc. and PartnerRe Ltd. proved advantageous as these names posted strong returns on the back of continued improvement in pricing trends. The Portfolio’s lack of exposure to poor-performing real estate investment trusts also aided relative results. |
| — | | Conversely, positioning within the health care sector was the largest detractor from performance. Weakness was notable in the providers & services segment, where health insurer UnitedHealth Group, Inc. had a negative impact. The Portfolio sold the stock due to concerns about |
possible cuts to Medicare Advantage reimbursement rates, which would significantly erode the company’s profitability. Shares later rallied, however, as the Centers for Medicare and Medicaid Services reversed some of the rate changes. Positioning within the pharmaceuticals industry also had a negative impact. An overweight to Merck & Co., Inc. hindered relative returns as modest disappointments relating to its research and development pipeline weighed on the stock price. At the same time, the Portfolio was underexposed to benchmark index constituent Johnson & Johnson, which posted a strong gain for the period. In consumer staples, the largest source of underperformance came from the food & staples retailing industry, where Wal-Mart Stores, Inc. shares came under pressure on a revenue miss and weaker-than-expected profit outlook for the 2012 fourth quarter, as well as concerns about potential headwinds to consumer spending. The Portfolio’s lack of exposure to food product companies also hurt relative results as these stocks performed well amid industry consolidation and strong investor demand for high-yielding equities.
Describe recent portfolio activity.
| — | | During the six-month period, the Portfolio significantly increased exposure to the industrials and financials sectors and reduced its weightings in health care, consumer discretionary and utilities. |
Describe portfolio positioning at period end.
| — | | Portfolio management continues to maintain a positive view on equities for the long term and, in particular, seeks to invest in companies with strong and consistent free cash flows, the ability to maintain or improve profit margins and/or the ability to innovate and grow their businesses. Relative to the Russell 1000® Value Index, the Portfolio ended the period with its largest sector overweight in industrials, while utilities was the most significant underweight. |
The views expressed reflect the opinions of BlackRock as of the date of this report and are subject to change based on changes in market, economic or other conditions. These views are not intended to be a forecast of future events and are no guarantee of future results.
| | | | | | |
| | | | | | | |
| 14 | | BLACKROCK LARGE CAP SERIES FUNDS, INC. | | MARCH 31, 2013 | | |
| | |
| | |
| | BlackRock Large Cap Value Retirement Portfolio |
|
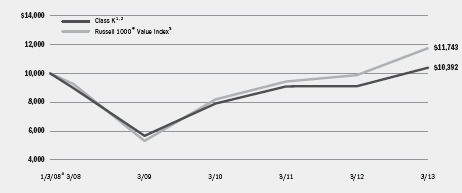
Total Return Based on a $10,000 Investment |
| | 1 | Assuming transaction costs and other operating expenses, including administration fees, if any. |
| | 2 | The Fund invests all of its assets in the Portfolio, a Series of Master Large Cap Series LLC. The Portfolio invests at least 80% of its assets in equity securities of large cap companies located in the United States that the investment advisor selects from among these that are, at the time of purchase, included in the Russell 1000® Value Index. |
| | 3 | The unmanaged broad-based index is a subset of the Russell 1000® Index consisting of those Russell 1000® securities with lower price-to-book ratios and lower forecasted growth values. |
| | 4 | Commencement of operations. |
|
Performance Summary for the Period Ended March 31, 2013 |
| | | | | | | | |
| | | 6-Month
Total Returns | | Average Annual Total Returns5 |
| | | | 1 Year | | 5 Years | | Since Inception6 |
Class K | | 15.00% | | 13.86% | | 2.95% | | 0.74% |
Russell 1000® Value Index | | 14.02% | | 18.77% | | 4.85% | | 3.11% |
| | 5 | See “About Fund Performance” on page 18 for a detailed description of the share class, including any related sales charges and fees. |
| | 6 | The Fund commenced operations on January 3, 2008. |
Past performance is not indicative of future results.
| | | | | | | | | | | | | | |
| | | Actual | | Hypothetical8 | | |
| | | Beginning Account Value October 1, 2012 | | Ending Account Value March 31, 2013 | | Expenses Paid During the Period7 | | Beginning Account Value October 1, 2012 | | Ending Account Value March 31, 2013 | | Expenses Paid During the Period7 | | Annualized Expense Ratio |
Class K | | $1,000.00 | | $1,150.00 | | $3.54 | | $1,000.00 | | $1,021.64 | | $3.33 | | 0.66% |
| | 7 | Expenses are equal to the Fund’s annualized expense ratio, multiplied by the average account value over the period, multiplied by 182/365 (to reflect the one-half year period shown). Because the Fund invests significantly in the Portfolio, the expense example reflects the net expenses of both the Fund and the Portfolio in which it invests. |
| | 8 | Hypothetical 5% annual return before expenses is calculated by pro rating the number of days in the most recent fiscal half year divided by 365. |
See “Disclosure of Expenses” on page 18 for further information on how expenses were calculated.
| | | | | | |
| | | | | | | |
| | BLACKROCK LARGE CAP SERIES FUNDS, INC. | | MARCH 31, 2013 | | 15 |
| | |
| | |
Fund Summary as of March 31, 2013 | | BlackRock Large Cap Core Plus Fund |
BlackRock Large Cap Core Plus Fund’s (the “Fund”) investment objective is to seek long-term capital growth. In other words, the Fund tries to choose investments that will increase in value.
|
Portfolio Management Commentary |
How did the Fund perform?
| | — | | For the six-month period ended March 31, 2013, the Fund’s Institutional and Investor A Shares outperformed the benchmark, the Russell 1000® Index, while its Investor C Shares underperformed the benchmark index. |
| | — | | The Fund pursues long-term capital growth by taking long positions (i.e., purchases the security outright) primarily in large cap companies identified as attractive, and short positions (i.e., sells a security that it has borrowed) in securities identified as overvalued or poised for underperformance. |
What factors influenced performance?
| | — | | The long segment of the Fund generated positive results for the period, while the short segment slightly detracted. |
| | — | | Long positions in the industrials and financials sectors were the largest contributors to performance. Within industrials, an overweight in airline names, including United Continental Holdings, Inc. and Delta Air Lines, Inc., provided the greatest benefit. Airline stocks soared during the six-month period as a combination of strong demand, higher ticket prices and slimmed-down operations resulted in increased profits industry-wide. Within financials, an overweight in US money center banks was especially additive. The Fund’s key holdings in this segment, including Citigroup, Inc. and The Goldman Sachs Group, Inc., surged on a strong recovery in capital markets activity, progress in cost-saving initiatives and improving trends across the broader US economy. An overweight in select insurers such as The Travelers Cos., Inc., PartnerRe Ltd. and American Financial Group, Inc. also helped as these names posted strong returns on the back of continued improvement in pricing trends. With respect to short positions, the Fund generated outperformance in the materials and telecommunication services sectors. |
| | — | | Detracting from performance were the Fund’s long positions in the IT sector, where an overweight in Apple, Inc. hurt results as the stock tumbled during the period due to investors’ increasing concerns about |
| | weakening profit margins and the company’s ability to continue to innovate and drive demand for its products. An overweight in data storage provider EMC Corp. also detracted due to a slightly disappointing earnings outlook and poor performance by the company’s subsidiary, VMware, Inc. In the IT services industry, shares of money transfer company The Western Union Co. plummeted on a lowered earnings forecast, while shares of data analytics firm Teradata Corp. lagged after the company issued a cautious growth forecast for the first half of 2013. Long positions in the health care sector also had a negative impact on relative performance. In particular, shares of pharmacy benefit manager Express Scripts Holding Co. plunged on a cautious outlook for 2013 before the stock was sold from the Fund. Additionally, health insurer UnitedHealth Group, Inc. had a negative impact on relative performance. The Fund sold the stock due to concerns about possible cuts to Medicare Advantage reimbursement rates, which would significantly erode the company’s profitability. Shares later rallied, however, when some of the rate changes were reversed. Lastly, the Fund’s short positions in the industrials and consumer discretionary sectors detracted from relative performance. |
Describe recent portfolio activity.
| | — | | During the six-month period, the Fund notably increased its long exposures to the industrials and financials sectors and reduced its weightings in IT and utilities. |
Describe portfolio positioning at period end.
| | — | | Fund management continues to maintain a positive view on equities for the long term and, in particular, seeks to invest in companies with strong and consistent free cash flows, the ability to maintain or improve profit margins and/or the ability to innovate and grow their businesses. Relative to the Russell 1000® Index, the long segment of the Fund held its largest sector overweights in IT and financials, while utilities, telecommunication services and consumer staples were the most significant underweights. |
The views expressed reflect the opinions of BlackRock as of the date of this report and are subject to change based on changes in market, economic or other conditions. These views are not intended to be a forecast of future events and are no guarantee of future results.
| | | | | | |
| | | | | | | |
| 16 | | BLACKROCK LARGE CAP SERIES FUNDS, INC. | | MARCH 31, 2013 | | |
| | |
| | |
| | BlackRock Large Cap Core Plus Fund |
|
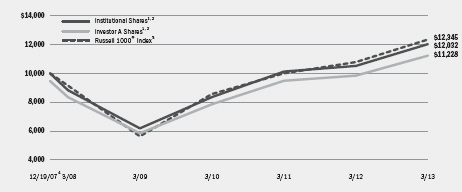
Total Return Based on a $10,000 Investment |
| | |
| | 
|
| | 1 Assuming maximum sales charges, if any, transaction costs and other operating expenses, including investment advisory fees. Institutional Shares do not have a sales charge. 2 The Fund invests by establishing long and short positions in a diversified portfolio of equity securities issued primarily by large cap companies located in the United States. 3 This unmanaged broad-based index measures the performance of the 1,000 largest companies in the Russell 3000® Index, which represents approximately 90% of the total market capitalization of the Russell 3000® Index. 4 Commencement of operations. |
|
Performance Summary for the Period Ended March 31, 2013 |
| | | | | | | | | | | | | | |
| | | | | Average Annual Total Returns5 |
| | | | |
| | | | | 1 Year | | 5 Years | | Since Inception6 |
| | | | | | | | |
| | | 6-Month
Total Returns | | w/o sales
charge | | w/sales
charge | | w/o sales
charge | | w/sales
charge | | w/o sales
charge | | w/sales
charge |
Institutional | | 11.41% | | 14.33% | | N/A | | 6.36% | | N/A | | 3.56% | | N/A |
Investor A | | 11.19% | | 14.02% | | 8.03% | | 6.06% | | 4.92% | | 3.27% | | 2.22% |
Investor C | | 10.93% | | 13.27% | | 12.27% | | 5.31% | | 5.31% | | 2.53% | | 2.53% |
Russell 1000® Index | | 11.10% | | 14.43% | | N/A | | 6.15% | | N/A | | 4.07% | | N/A |
| | 5 | Assuming maximum sales charges, if any. Average annual total returns with and without sales charges reflect reductions for distribution and service fees. See “About Fund Performance” on page 18 for a detailed description of share classes, including any related sales charges and fees. |
| | 6 | The Fund commenced operations on December 19, 2007. |
| | | N/A - Not applicable as share class and index do not have a sales charge. |
| | | Past performance is not indicative of future results. |
| | | | | | | | | | | | | | | | | | |
| | | Actual | | Hypothetical9 |
| | | | |
| | | | | | | Expenses Paid During the Period | | | | Including Dividend Expense, Stock Loan
Fees and
Interest Expense | | Excluding Dividend Expense, Stock Loan
Fees and Interest Expense |
| | | | | | | | | | | | |
| | | Beginning
Account Value
October 1,
2012 | | Ending
Account Value
March 31,
2013 | | Including Dividend
Expense, Stock
Loan Fees and
Interest Expense7 | | Excluding Dividend
Expense, Stock
Loan Fees and
Interest Expense8 | | Beginning
Account Value
October 1,
2012 | | Ending
Account Value
March 31, 2013 | | Expenses
Paid During
the Period7 | | Ending
Account Value
March 31, 2013 | | Expenses
Paid During
the Period8 |
Institutional | | $1,000.00 | | $1,114.10 | | $12.18 | | $ 7.91 | | $1,000.00 | | $1,013.41 | | $11.60 | | $1,017.45 | | $ 7.54 |
Investor A | | $1,000.00 | | $1,111.90 | | $13.74 | | $ 9.48 | | $1,000.00 | | $1,011.92 | | $13.09 | | $1,015.96 | | $ 9.05 |
Investor C | | $1,000.00 | | $1,109.30 | | $17.41 | | $13.15 | | $1,000.00 | | $1,008.43 | | $16.57 | | $1,012.47 | | $12.54 |
| | 7 | For each class of the Fund, expenses are equal to the annualized expense ratio for the class (2.31% for Institutional, 2.61% for Investor A, and 3.31% for Investor C), multiplied by the average account value over the period, multiplied by 182/365 (to reflect the one-half year period shown). Expenses are net of waiver. |
| | 8 | For each class of the Fund, expenses are equal to the annualized expense ratio for the class (1.50% for Institutional, 1.80% for Investor A, and 2.50% for Investor C), multiplied by the average account value over the period, multiplied by 182/365 (to reflect the one-half year period shown). Expenses are net of waiver. |
| | 9 | Hypothetical 5% annual return before expenses is calculated by pro rating the number of days in the most recent fiscal half year divided by 365. |
| | | See “Disclosure of Expenses” on page 18 for further information on how expenses were calculated. |
| | | | | | |
| | | | | | | |
| | BLACKROCK LARGE CAP SERIES FUNDS, INC. | | MARCH 31, 2013 | | 17 |
| | |
| | |
About Fund Performance | | BlackRock Large Cap Series Funds, Inc. |
| | • | | Institutional Shares are not subject to any sales charge. These shares bear no ongoing distribution or service fees and are available only to eligible investors. |
| | • | | Service Shares are not subject to any sales charge.These shares are subject to a service fee of 0.25% per year (but no distribution fee) and are available only to eligible investors. For BlackRock Large Cap Growth Fund and BlackRock Large Cap Value Fund, prior to October 2, 2006 and for BlackRock Large Cap Core Fund, prior to September 24, 2007, Service Share performance results are those of the Fund’s Institutional Shares (which have no distribution or service fees) restated to reflect the Service Share fees. |
| | • | | Investor A Shares are subject to a maximum initial sales charge (front-end load) of 5.25% and a service fee of 0.25% per year (but no distribution fee). |
| | • | | Investor B Shares are subject to a maximum contingent deferred sales charge (“CDSC”) of 4.50% declining to 0% after six years. In addition, these shares are subject to a distribution fee of 0.75% per year and a service fee of 0.25% per year. These shares automatically convert to Investor A Shares after approximately eight years. (There is no initial sales charge for automatic share conversions.) All returns for periods greater than eight years reflect this conversion. These Shares are only available through exchanges and dividend reinvestments by existing shareholders and for purchase by certain employer-sponsored retirement plans. |
| | • | | Investor C Shares are subject to a 1.00% CDSC if redeemed within one year of purchase. In addition, these shares are subject to a distribution fee of 0.75% per year and a service fee of 0.25% per year. |
| | • | | Class R Shares are not subject to any sales charge. These shares are subject to a distribution fee of 0.25% per year and a service fee of 0.25% per year. These shares are available only to certain employer-sponsored retirement plans. |
| | • | | Class K Shares are not subject to any sales charge. These shares bear no ongoing distribution or service fees and are available only to eligible investors. |
Performance information reflects past performance and does not guarantee future results. Current performance may be lower or higher than the performance data quoted. Refer to www.blackrock.com/funds to obtain performance data current to the most recent month end. Performance results do not reflect the deduction of taxes that a shareholder would pay on fund distributions or the redemption of fund shares. Figures shown in the performance table on the previous page assume reinvestment of all dividends and distributions, if any, at net asset value (“NAV”) on the ex-dividend date. Investment return and principal value of shares will fluctuate so that shares, when redeemed, may be worth more or less than their original cost. Dividends paid to each class of shares will vary because of the different levels of service, distribution and transfer agency fees applicable to each class, which are deducted from the income available to be paid to shareholders.
BlackRock Large Cap Core Fund’s administrator waived and/or reimbursed a portion of the Fund’s expenses. Without such waiver and/or reimbursement, the Fund’s performance would have been lower. The administrator is under no obligation to waive and/or reimburse or continue waiving and/or reimbursing its fees. See Note 3 of the Notes to Financial Statements for additional information on waivers and reimbursements.
Disclosure of Expenses
Shareholders of each Fund may incur the following charges: (a) expenses related to transactions, such as sales charges and (b) operating expenses, including administration and investment advisory fees, service and distribution fees, including 12b-1 fees, and other Fund expenses. The expense examples shown on the previous pages (which are based on a hypothetical investment of $1,000 invested on October 1, 2012 and held through March 31, 2013) are intended to assist shareholders both in calculating expenses based on an investment in each Fund and in comparing these expenses with similar costs of investing in other mutual funds.
The expense examples provide information about actual account values and actual expenses. In order to estimate the expenses a shareholder paid during the period covered by this report, shareholders can divide their account value by $1,000 and then multiply the result by the number corresponding to their share class under the heading entitled “Expenses Paid During the Period.”
The expense examples also provide information about hypothetical account values and hypothetical expenses based on each Fund’s actual expense ratio and an assumed rate of return of 5% per year before expenses. In order to assist shareholders in comparing the ongoing expenses of investing in these Funds and other funds, compare the 5% hypothetical example with the 5% hypothetical examples that appear in other funds’ shareholder reports.
The expenses shown in the expense examples are intended to highlight shareholders’ ongoing costs only and do not reflect any transactional expenses, such as sales charges or exchange fees, if any. Therefore, the hypothetical example is useful in comparing ongoing expenses only, and will not help shareholders determine the relative total expenses of owning different funds. If these transactional expenses were included, shareholder expenses would have been higher.
Derivative Financial Instruments
BlackRock Large Cap Core Plus Fund (the “Fund”), Master Large Cap Core Portfolio, Master Large Cap Core Growth Portfolio and Master Large Cap Value Portfolio (the “Portfolios”) may invest in various derivative financial instruments, including financial futures contracts and foreign currency exchange contracts, as specified in Note 2 of the Fund’s and Portfolios’ Notes to Financial Statements, which may constitute forms of economic leverage. Such derivative financial instruments are used to obtain exposure to a market without owning or taking physical custody of securities or to hedge market and foreign currency exchange rate risks. Derivative financial instruments involve risks, including the imperfect correlation between the value of a derivative financial instrument and the underlying asset, possible default of the counterparty to the transaction or illiquidity of the derivative financial instrument. The Fund’s and
Portfolios’ ability to use a derivative financial instrument successfully depends on the investment advisor’s ability to predict pertinent market movements accurately, which cannot be assured. The use of derivative financial instruments may result in losses greater than if they had not been used, may require the Fund and Portfolios to sell or purchase portfolio investments at inopportune times or for distressed values, may limit the amount of appreciation the Fund and Portfolios can realize on an investment, may result in lower dividends paid to shareholders or may cause the Portfolios to hold an investment that it might otherwise sell. The Fund’s and Portfolios’ investments in these instruments are discussed in detail in the Fund’s and the Portfolios’ Notes to Financial Statements.
| | | | | | |
| | | | | | | |
18 | | BLACKROCK LARGE CAP SERIES FUNDS, INC. | | MARCH 31, 2013 | | |
| | |
| | |
Fund Information | | BlackRock Large Cap Core Plus Fund |
| | | | | |
| Ten Largest Holdings | | Percent of
Long-Term
Investments |
Google, Inc., Class A | | | | 4 | % |
Pfizer, Inc. | | | | 3 | |
JPMorgan Chase & Co. | | | | 3 | |
Bank of America Corp. | | | | 3 | |
Merck & Co., Inc. | | | | 3 | |
Citigroup, Inc. | | | | 3 | |
3M Co. | | | | 3 | |
News Corp., Class A | | | | 3 | |
Apple, Inc. | | | | 3 | |
CVS Caremark Corp. | | | | 3 | |
| |
| Sector Allocation | | Percent of
Long-Term
Investments |
Information Technology | | | | 22 | % |
Financials | | | | 21 | |
Energy | | | | 13 | |
Industrials | | | | 11 | |
Health Care | | | | 11 | |
Consumer Discretionary | | | | 11 | |
Consumer Staples | | | | 6 | |
Materials | | | | 4 | |
Other | | | | 1 | |
| | | | | |
| Ten Largest Investments Sold Short | | Percent of
Investments
Sold Short |
Cheniere Energy, Inc. | | | | 1 | % |
Tahoe Resources, Inc. | | | | 1 | |
Polycom, Inc. | | | | 1 | |
Pandora Media, Inc. | | | | 1 | |
Vertex Pharmaceuticals, Inc. | | | | 1 | |
Micron Technology, Inc. | | | | 1 | |
Royal Gold, Inc. | | | | 1 | |
Cobalt International Energy, Inc. | | | | 1 | |
DreamWorks Animation SKG, Inc., Class A | | | | 1 | |
Hospira, Inc. | | | | 1 | |
| |
| Sector Allocation | | Percent of
Investments
Sold Short |
Information Technology | | | | 23 | % |
Energy | | | | 16 | |
Consumer Discretionary | | | | 13 | |
Materials | | | | 12 | |
Industrials | | | | 12 | |
Health Care | | | | 7 | |
Utilities | | | | 7 | |
Consumer Staples | | | | 4 | |
Financials | | | | 3 | |
Telecommunication Services | | | | 3 | |
For Fund compliance purposes, the Fund’s sector classifications refer to any one or more of the sector sub-classifications used by one or more widely recognized market indexes or ratings group indexes, and/or as defined by Fund management. These definitions may not apply for purposes of this report, which may combine such sector sub-classifications for reporting ease.
| | | | | | |
| | | | | | | |
| | BLACKROCK LARGE CAP SERIES FUNDS, INC. | | MARCH 31, 2013 | | 19 |
| | |
| | |
Schedule of Investments March 31, 2013 (Unaudited) | | BlackRock Large Cap Core Plus Fund (Percentages shown are based on Net Assets) |
| | | | | | | | |
| Common Stocks | | Shares | | | Value | |
| |
Aerospace & Defense — 1.2% | | | | | | | | |
The Boeing Co. | | | 5,170 | | | $ | 443,846 | |
| |
Airlines — 4.0% | | | | | | | | |
Delta Air Lines, Inc. (a) | | | 26,820 | | | | 442,798 | |
United Continental Holdings, Inc. (a) | | | 31,640 | | | | 1,012,796 | |
| | | | | | | | |
| | | | | | | 1,455,594 | |
| |
Auto Components — 1.3% | | | | | | | | |
TRW Automotive Holdings Corp. (a) | | | 8,750 | | | | 481,250 | |
| |
Beverages — 2.0% | | | | | | | | |
The Coca-Cola Co. (b) | | | 17,910 | | | | 724,280 | |
| |
Capital Markets — 1.9% | | | | | | | | |
The Goldman Sachs Group, Inc. | | | 4,650 | | | | 684,248 | |
| |
Chemicals — 0.4% | | | | | | | | |
Cabot Corp. | | | 4,074 | | | | 139,331 | |
| |
Commercial Banks — 3.9% | | | | | | | | |
SunTrust Banks, Inc. (a) | | | 9,500 | | | | 273,695 | |
U.S. Bancorp | | | 33,740 | | | | 1,144,798 | |
| | | | | | | | |
| | | | | | | 1,418,493 | |
| |
Commercial Services & Supplies — 0.9% | | | | | | | | |
Tyco International Ltd. (a) | | | 10,320 | | | | 330,240 | |
| |
Computers & Peripherals — 5.2% | | | | | | | | |
Apple, Inc. (b) | | | 2,779 | | | | 1,230,069 | |
EMC Corp. (a) | | | 27,600 | | | | 659,364 | |
| | | | | | | | |
| | | | | | | 1,889,433 | |
| |
Construction & Engineering — 2.2% | | | | | |
KBR, Inc. | | | 24,900 | | | | 798,792 | |
| |
Consumer Finance — 2.3% | | | | | | | | |
Discover Financial Services (b) | | | 18,540 | | | | 831,334 | |
| |
Containers & Packaging — 2.3% | | | | | |
Packaging Corp. of America | | | 12,676 | | | | 568,772 | |
Rock-Tenn Co., Class A | | | 2,857 | | | | 265,101 | |
| | | | | | | | |
| | | | | | | 833,873 | |
| |
Diversified Financial Services — 11.2% | | | | | |
Bank of America Corp. | | | 110,500 | | | | 1,345,890 | |
Citigroup, Inc. | | | 29,160 | | | | 1,290,038 | |
JPMorgan Chase & Co. | | | 30,293 | | | | 1,437,706 | |
| | | | | | | | |
| | | | | | | 4,073,634 | |
| |
Electronic Equipment, Instruments & Components — 1.3% | |
Avnet, Inc. (a) | | | 13,000 | | | | 470,600 | |
| |
Energy Equipment & Services — 0.8% | | | | | | | | |
Oceaneering International, Inc. | | | 4,500 | | | | 298,845 | |
| |
Food & Staples Retailing — 5.4% | | | | | | | | |
CVS Caremark Corp. | | | 21,610 | | | | 1,188,334 | |
| | | | | | | | |
| Common Stocks | | Shares | | | Value | |
| |
Food & Staples Retailing (concluded) | | | | | |
Wal-Mart Stores, Inc. (b) | | | 10,245 | | | $ | 766,633 | |
| | | | | | | | |
| | | | | | | 1,954,967 | |
| |
Health Care Equipment & Supplies — 1.3% | | | | | |
Abbott Laboratories (b) | | | 12,870 | | | | 454,568 | |
| |
Health Care Providers & Services — 1.9% | | | | | |
McKesson Corp. (b) | | | 6,520 | | | | 703,899 | |
| |
Industrial Conglomerates — 3.6% | | | | | |
3M Co. (b) | | | 12,100 | | | | 1,286,351 | |
| |
Insurance — 7.9% | | | | | | | | |
Allied World Assurance Co. Holdings AG (a) | | | 4,400 | | | | 407,968 | |
American Financial Group, Inc. (b) | | | 10,290 | | | | 487,540 | |
American International Group, Inc. (a) | | | 15,800 | | | | 613,356 | |
The Chubb Corp. | | | 1,855 | | | | 162,368 | |
PartnerRe Ltd. (a) | | | 5,230 | | | | 486,965 | |
The Travelers Cos., Inc. | | | 8,465 | | | | 712,668 | |
| | | | | | | | |
| | | | | | | 2,870,865 | |
| |
Internet Software & Services — 5.1% | | | | | |
Google, Inc., Class A (a) | | | 2,339 | | | | 1,857,236 | |
| |
IT Services — 7.5% | | | | | | | | |
DST Systems, Inc. (b) | | | 9,185 | | | | 654,615 | |
Mastercard, Inc., Class A | | | 2,186 | | | | 1,182,910 | |
Teradata Corp. (a) | | | 14,840 | | | | 868,288 | |
| | | | | | | | |
| | | | | | | 2,705,813 | |
| |
Machinery — 2.8% | | | | | | | | |
Ingersoll-Rand Plc (a) | | | 11,200 | | | | 616,112 | |
Oshkosh Corp. (a) | | | 9,005 | | | | 382,622 | |
| | | | | | | | |
| | | | | | | 998,734 | |
| |
Media — 8.1% | | | | | | | | |
Comcast Corp., Class A | | | 25,620 | | | | 1,076,296 | |
News Corp., Class A (b) | | | 41,380 | | | | 1,262,918 | |
Time Warner Cable, Inc. | | | 6,280 | | | | 603,257 | |
| | | | | | | | |
| | | | | | | 2,942,471 | |
| |
Oil, Gas & Consumable Fuels — 16.0% | | | | | |
Chevron Corp. | | | 8,515 | | | | 1,011,752 | |
Exxon Mobil Corp. (b) | | | 11,395 | | | | 1,026,803 | |
Marathon Oil Corp. (b) | | | 16,440 | | | | 554,357 | |
Marathon Petroleum Corp. | | | 11,435 | | | | 1,024,576 | |
PBF Energy, Inc. | | | 11,576 | | | | 430,280 | |
Suncor Energy, Inc. | | | 28,565 | | | | 857,236 | |
Tesoro Corp. (b) | | | 15,670 | | | | 917,480 | |
| | | | | | | | |
| | | | | | | 5,822,484 | |
| |
Paper & Forest Products — 3.0% | | | | | |
Domtar Corp. | | | 3,725 | | | | 289,136 | |
| | | | | | |
See Notes to Financial Statements. | | | | |
| | | | | | | |
| 20 | | BLACKROCK LARGE CAP SERIES FUNDS, INC. | | MARCH 31, 2013 | | |
| | |
| | |
Schedule of Investments (continued) | | BlackRock Large Cap Core Plus Fund (Percentages shown are based on Net Assets) |
| | | | | | | | |
| Common Stocks | | Shares | | | Value | |
| |
Paper & Forest Products (concluded) | | | | | | | | |
International Paper Co. | | | 17,400 | | | $ | 810,492 | |
| | | | | | | | |
| | | | | | | 1,099,628 | |
| |
Pharmaceuticals — 10.8% | | | | | | | | |
AbbVie, Inc. (b) | | | 11,170 | | | | 455,513 | |
Eli Lilly & Co. (b) | | | 8,555 | | | | 485,838 | |
Merck & Co., Inc. | | | 30,410 | | | | 1,345,034 | |
Pfizer, Inc. (b) | | | 54,700 | | | | 1,578,642 | |
Zoetis, Inc. | | | 2,000 | | | | 66,800 | |
| | | | | | | | |
| | | | | | | 3,931,827 | |
| |
Semiconductors & Semiconductor Equipment — 2.3% | |
KLA-Tencor Corp. | | | 11,540 | | | | 608,620 | |
Teradyne, Inc. (a) | | | 14,800 | | | | 240,056 | |
| | | | | | | | |
| | | | | | | 848,676 | |
| |
Software — 6.8% | | | | | | | | |
Activision Blizzard, Inc. | | | 33,600 | | | | 489,552 | |
Microsoft Corp. (b) | | | 38,805 | | | | 1,110,211 | |
Oracle Corp. | | | 26,700 | | | | 863,478 | |
| | | | | | | | |
| | | | | | | 2,463,241 | |
| |
Specialty Retail — 3.0% | | | | | | | | |
PetSmart, Inc. (b) | | | 4,135 | | | | 256,784 | |
Ross Stores, Inc. | | | 13,400 | | | | 812,308 | |
| | | | | | | | |
| | | | | | | 1,069,092 | |
| |
Textiles, Apparel & Luxury Goods — 1.1% | | | | | |
NIKE, Inc., Class B | | | 6,932 | | | | 409,057 | |
| |
Tobacco — 0.2% | | | | | | | | |
Philip Morris International, Inc. | | | 710 | | | | 65,824 | |
| |
Total Common Stocks — 127.7% | | | | | | | 46,358,526 | |
| | | | | | | | |
| | | | | | | | |
| | | | | | | | |
Exchange-Traded Funds — 1.3% | | | | | | | | |
| |
iShares Core S&P 500 ETF | | | 3,030 | | | | 476,710 | |
| |
Total Long-Term Investments | | | | | | | | |
(Cost — $37,741,436) — 129.0% | | | | | | | 46,835,236 | |
| |
| | | | | | | | |
| | | | | | | | |
| | | | | | | | |
Short-Term Securities | | | | | | | | |
| |
BlackRock Liquidity Funds, TempFund, Institutional Class, 0.09% (c)(d) | | | 969,448 | | | | 969,448 | |
| |
| |
| Par
(000 |
) | | | | |
| |
Time Deposits — 0.0% | | | | | | | | |
Brown Brothers Harriman & Co., 0.08%,
4/01/13 | | $ | 9 | | | | 9,048 | |
| |
Total Short-Term Securities | | | | | | | | |
(Cost — $978,496) — 2.7% | | | | | | | 978,496 | |
| |
Total Investments Before Investments Sold Short | | | | | |
(Cost — $38,719,932) — 131.7% | | | | | | | 47,813,732 | |
| |
| | | | | | | | |
| | | | | | | | |
| | | | | | | | |
| Investments Sold Short | | Shares | | | Value | |
| |
Air Freight & Logistics — (0.6)% | | | | | | | | |
Expeditors International of Washington, Inc. | | | 2,930 | | | $ | (104,630 | ) |
UTi Worldwide, Inc. | | | 7,470 | | | | (108,166 | ) |
| | | | | | | | |
| | | | | | | (212,796 | ) |
| |
Auto Components — (0.4)% | | | | | | | | |
Johnson Controls, Inc. | | | 3,630 | | | | (127,304 | ) |
| |
Automobiles — (0.3)% | | | | | | | | |
Tesla Motors, Inc. | | | 3,170 | | | | (120,111 | ) |
| |
Beverages — (0.3)% | | | | | | | | |
Beam, Inc. | | | 1,890 | | | | (120,091 | ) |
| |
Biotechnology — (0.7)% | | | | | | | | |
BioMarin Pharmaceutical, Inc. | | | 1,920 | | | | (119,539 | ) |
Vertex Pharmaceuticals, Inc. | | | 2,450 | | | | (134,701 | ) |
| | | | | | | | |
| | | | | | | (254,240 | ) |
| |
Capital Markets — (0.3)% | | | | | | | | |
The Charles Schwab Corp. | | | 6,810 | | | | (120,469 | ) |
| |
Chemicals — (1.6)% | | | | | | | | |
Air Products & Chemicals, Inc. | | | 1,340 | | | | (116,741 | ) |
Ecolab, Inc. | | | 1,500 | | | | (120,270 | ) |
Intrepid Potash, Inc. | | | 6,070 | | | | (113,873 | ) |
Rockwood Holdings, Inc. | | | 1,830 | | | | (119,755 | ) |
The Scotts Miracle-Gro Co., Class A | | | 2,550 | | | | (110,262 | ) |
| | | | | | | | |
| | | | | | | (580,901 | ) |
| |
Communications Equipment — (1.6)% | | | | | | | | |
EchoStar Corp., Class A | | | 3,030 | | | | (118,079 | ) |
JDS Uniphase Corp. | | | 8,150 | | | | (108,966 | ) |
Juniper Networks, Inc. | | | 5,750 | | | | (106,605 | ) |
Palo Alto Networks, Inc. | | | 2,050 | | | | (116,030 | ) |
Polycom, Inc. | | | 12,280 | | | | (136,062 | ) |
| | | | | | | | |
| | | | | | | (585,742 | ) |
| |
Computers & Peripherals — (0.3)% | | | | | | | | |
Fusion-io, Inc. | | | 6,970 | | | | (114,099 | ) |
| |
Diversified Telecommunication Services — (0.6)% | |
Level 3 Communications, Inc. | | | 5,750 | | | | (116,668 | ) |
TW Telecom, Inc. | | | 4,600 | | | | (115,874 | ) |
| | | | | | | | |
| | | | | | | (232,542 | ) |
| |
Electric Utilities — (0.7)% | | | | | | | | |
Hawaiian Electric Industries, Inc. | | | 4,250 | | | | (117,768 | ) |
Northeast Utilities | | | 2,720 | | | | (118,211 | ) |
| | | | | | | | |
| | | | | | | (235,979 | ) |
| |
Electrical Equipment — (0.6)% | | | | | | | | |
Eaton Corp. Plc | | | 1,850 | | | | (113,313 | ) |
Polypore International, Inc. | | | 2,940 | | | | (118,129 | ) |
| | | | | | | | |
| | | | | | | (231,442 | ) |
| |
Electronic Equipment, Instruments & Components — (0.4)% | |
National Instruments Corp. | | | 3,800 | | | | (124,450 | ) |
| |
Energy Equipment & Services — (0.3)% | | | | | | | | |
Rowan Cos. Plc, Class A | | | 3,370 | | | | (119,163 | ) |
| |
Food & Staples Retailing — (0.3)% | | | | | | | | |
Whole Foods Market, Inc. | | | 1,350 | | | | (117,112 | ) |
| |
Food Products — (0.3)% | | | | | | | | |
Mondelez International, Inc., Class A | | | 4,060 | | | | (124,277 | ) |
| |
| | | | | | |
See Notes to Financial Statements. | | | | |
| | | | | | | |
| | BLACKROCK LARGE CAP SERIES FUNDS, INC. | | MARCH 31, 2013 | | 21 |
| | |
| | |
Schedule of Investments (continued) | | BlackRock Large Cap Core Plus Fund (Percentages shown are based on Net Assets) |
| | | | | | | | |
| Investments Sold Short | | Shares | | | Value | |
| |
Gas Utilities — (0.7)% | | | | | | | | |
AGL Resources, Inc. | | | 2,870 | | | $ | (120,397 | ) |
ONEOK, Inc. | | | 2,560 | | | | (122,035 | ) |
| | | | | | | | |
| | | | | | | (242,432 | ) |
| |
Health Care Equipment & Supplies — (0.3)% | | | | | |
Hologic, Inc. | | | 5,210 | | | | (117,746 | ) |
| |
Health Care Providers & Services — (0.3)% | | | | | | | | |
Brookdale Senior Living, Inc. | | | 4,030 | | | | (112,356 | ) |
| |
Household Durables — (0.3)% | | | | | |
Toll Brothers, Inc. | | | 3,320 | | | | (113,677 | ) |
| |
Insurance — (0.3)% | | | | | | | | |
Erie Indemnity Co., Class A | | | 1,550 | | | | (117,072 | ) |
| |
Internet & Catalog Retail — (0.4)% | | | | | |
Groupon, Inc. | | | 20,580 | | | | (125,950 | ) |
| |
Internet Software & Services — (0.3)% | | | | | |
Facebook, Inc., Class A | | | 4,160 | | | | (106,413 | ) |
| |
Life Sciences Tools & Services — (0.3)% | | | | | |
Illumina, Inc. | | | 2,190 | | | | (118,260 | ) |
| |
Machinery — (1.6)% | | | | | |
Caterpillar, Inc. | | | 1,280 | | | | (111,322 | ) |
Colfax Corp. | | | 2,590 | | | | (120,539 | ) |
Harsco Corp. | | | 4,850 | | | | (120,135 | ) |
Pentair Ltd. | | | 2,190 | | | | (115,523 | ) |
SPX Corp. | | | 1,430 | | | | (112,913 | ) |
| | | | | | | | |
| | | | | | | (580,432 | ) |
| |
Media — (1.4)% | | | | | |
Clear Channel Outdoor Holdings, Inc., Class A | | | 15,090 | | | | (113,024 | ) |
DreamWorks Animation SKG, Inc., Class A | | | 6,880 | | | | (130,445 | ) |
Madison Square Garden, Inc., Class A | | | 2,060 | | | | (118,656 | ) |
Pandora Media, Inc. | | | 9,560 | | | | (135,370 | ) |
| | | | | | | | |
| | | | | | | (497,495 | ) |
| |
Metals & Mining — (2.2)% | | | | | |
Allied Nevada Gold Corp. | | | 6,730 | | | | (110,776 | ) |
Cliffs Natural Resources, Inc. | | | 4,760 | | | | (90,488 | ) |
Compass Minerals International, Inc. | | | 1,520 | | | | (119,928 | ) |
Molycorp, Inc. | | | 19,470 | | | | (101,244 | ) |
Royal Gold, Inc. | | | 1,840 | | | | (130,695 | ) |
Tahoe Resources, Inc. | | | 7,760 | | | | (136,498 | ) |
Walter Energy, Inc. | | | 3,820 | | | | (108,870 | ) |
| | | | | | | | |
| | | | | | | (798,499 | ) |
| |
Multiline Retail — (0.7)% | | | | | |
JC Penney Co., Inc. | | | 7,640 | | | | (115,440 | ) |
Sears Holdings Corp. | | | 2,450 | | | | (122,427 | ) |
| | | | | | | | |
| | | | | | | (237,867 | ) |
| |
Multi-Utilities — (1.0)% | | | | | |
Dominion Resources, Inc. | | | 2,050 | | | | (119,269 | ) |
NiSource, Inc. | | | 4,100 | | | | (120,294 | ) |
Sempra Energy | | | 1,460 | | | | (116,712 | ) |
| | | | | | | | |
| | | | | | | (356,275 | ) |
| |
Oil, Gas & Consumable Fuels — (4.5)% | | | | | |
Cheniere Energy, Inc. | | | 5,350 | | | | (149,800 | ) |
Cobalt International Energy, Inc. | | | 4,630 | | | | (130,566 | ) |
Concho Resources, Inc. | | | 1,300 | | | | (126,659 | ) |
CONSOL Energy, Inc. | | | 3,820 | | | | (128,543 | ) |
EXCO Resources, Inc. | | | 17,580 | | | | (125,345 | ) |
Golar LNG Ltd. | | | 3,080 | | | | (113,837 | ) |
Kosmos Energy Ltd. | | | 10,870 | | | | (122,831 | ) |
Newfield Exploration Co. | | | 5,110 | | | | (114,566 | ) |
Pioneer Natural Resources Co. | | | 930 | | | | (115,552 | ) |
| | | | | | | | |
| Investments Sold Short | | Shares | | | Value | |
| |
Oil, Gas & Consumable Fuels (concluded) | |
QEP Resources, Inc. | | | 3,880 | | | $ | (123,539 | ) |
Range Resources Corp. | | | 1,470 | | | | (119,129 | ) |
SM Energy Co. | | | 2,050 | | | | (121,401 | ) |
The Williams Cos., Inc. | | | 3,440 | | | | (128,862 | ) |
| | | | | | | | |
| | | | | | | (1,620,630 | ) |
| |
Personal Products — (0.3)% | | | | | |
Avon Products, Inc. | | | 5,860 | | | | (121,478 | ) |
| |
Pharmaceuticals — (0.4)% | | | | | |
Hospira, Inc. | | | 3,940 | | | | (129,350 | ) |
| |
Professional Services — (0.3)% | | | | | |
IHS, Inc., Class A | | | 1,050 | | | | (109,956 | ) |
| |
Semiconductors & Semiconductor Equipment — (3.0)% | |
Advanced Micro Devices, Inc. | | | 47,960 | | | | (122,298 | ) |
Atmel Corp. | | | 17,970 | | | | (125,071 | ) |
Broadcom Corp., Class A | | | 3,470 | | | | (120,305 | ) |
Cypress Semiconductor Corp. | | | 10,880 | | | | (120,006 | ) |
Fairchild Semiconductor International, Inc. | | | 8,100 | | | | (114,534 | ) |
Micron Technology, Inc. | | | 13,350 | | | | (133,233 | ) |
PMC-Sierra, Inc. | | | 17,750 | | | | (120,523 | ) |
Silicon Laboratories, Inc. | | | 2,820 | | | | (116,635 | ) |
Skyworks Solutions, Inc. | | | 5,700 | | | | (125,571 | ) |
| | | | | | | | |
| | | | | | | (1,098,176 | ) |
| |
Software — (1.9)% | |
Concur Technologies, Inc. | | | 1,650 | | | | (113,289 | ) |
Informatica Corp. | | | 3,330 | | | | (114,785 | ) |
NetSuite, Inc. | | | 1,590 | | | | (127,295 | ) |
Salesforce.com, Inc. | | | 630 | | | | (112,663 | ) |
ServiceNow, Inc. | | | 3,330 | | | | (120,546 | ) |
Zynga, Inc., Class A | | | 32,780 | | | | (110,141 | ) |
| | | | | | | | |
| | | | | | | (698,719 | ) |
| |
Specialty Retail — (0.7)% | |
CarMax, Inc. | | | 2,890 | | | | (120,513 | ) |
Tiffany & Co. | | | 1,660 | | | | (115,436 | ) |
| | | | | | | | |
| | | | | | | (235,949 | ) |
| |
Thrifts & Mortgage Finance — (0.3)% | | | | | |
TFS Financial Corp. | | | 11,010 | | | | (119,238 | ) |
| |
Trading Companies & Distributors — (0.6)% | | | | | |
Air Lease Corp. | | | 4,020 | | | | (117,866 | ) |
Fastenal Co. | | | 2,220 | | | | (113,997 | ) |
| | | | | | | | |
| | | | | | | (231,863 | ) |
| |
Wireless Telecommunication Services — (0.3)% | |
NII Holdings, Inc. | | | 23,350 | | | | (101,106 | ) |
| |
Total Investments Sold Short | | | | | | | | |
(Proceeds — $11,018,012) — (31.4)% | | | | | | | (11,411,657 | ) |
| |
Total Investments — 100.3% | | | | | | | 36,402,075 | |
Liabilities in Excess of Other Assets — (0.3)% | | | | (109,595 | ) |
| | | | | | | | |
Net Assets — 100.0% | | | | | | $ | 36,292,480 | |
| | | | | | | | |
| | | | | | |
See Notes to Financial Statements. | | | | |
| | | | | | | |
| 22 | | BLACKROCK LARGE CAP SERIES FUNDS, INC. | | MARCH 31, 2013 | | |
| | |
| | |
Schedule of Investments (continued) | | BlackRock Large Cap Core Plus Fund |
|
Notes to Schedule of Investments |
| (a) | Non-income producing security. |
| (b) | All or a portion of security has been pledged as collateral in connection with short sales. |
| (c) | Investments in issuers considered to be an affiliate of the Fund during the period ended March 31, 2013, for purposes of Section 2(a)(3) of the Investment Company Act of 1940, as amended, were as follows: |
| | | | | | | | | | | | | | | | | | | | | | | | | | | | |
| Affiliate | | Shares
Held at
September 30,
2012 | | | Shares
Purchased | | | Shares
Sold | | | Shares
Held at
March 31,
2013 | | | Value at
March 31,
2013 | | | Income | | | Realized
Gain | |
BlackRock Liquidity Funds, TempFund, Institutional Class | | | 385,464 | | | | 583,984 | 1 | | | — | | | | 969,448 | | | $ | 969,448 | | | $ | 452 | | | | — | |
iShares Core S&P 500 ETF | | | — | | | | 4,800 | | | | (1,770 | ) | | | 3,030 | | | $ | 476,710 | | | $ | 6,713 | | | | $8,552 | |
| | 1 | Represents net shares purchased. |
| (d) | Represents the current yield as of report date. |
| — | | For Fund compliance purposes, the Fund’s industry classifications refer to any one or more of the industry sub-classifications used by one or more widely recognized market indexes or ratings group indexes, and/or as defined by Fund management. These definitions may not apply for purposes of this report, which may combine such industry sub-classifications for reporting ease. |
| — | | Fair Value Measurements – Various inputs are used in determining the fair value of investments. These inputs to valuation techniques are categorized into a disclosure hierarchy consisting of three broad levels for financial statement purposes as follows: |
| | — | | Level 1 - unadjusted price quotations in active markets/exchanges for identical assets and liabilities that the Fund has the ability to access |
| | — | | Level 2 - other observable inputs (including, but not limited to, quoted prices for similar assets or liabilities in markets that are active, quoted prices for identical or similar assets or liabilities in markets that are not active, inputs other than quoted prices that are observable for the assets or liabilities (such as interest rates, yield curves, volatilities, prepayment speeds, loss severities, credit risks and default rates) or other market–corroborated inputs) |
| | — | | Level 3 - unobservable inputs based on the best information available in the circumstances, to the extent observable inputs are not available (including the Fund’s own assumptions used in determining the fair value of investments) |
The hierarchy gives the highest priority to unadjusted quoted prices in active markets for identical assets or liabilities (Level 1 measurements) and the lowest priority to unobservable inputs (Level 3 measurements). Accordingly, the degree of judgment exercised in determining fair value is greatest for instruments categorized in Level 3. The inputs used to measure fair value may fall into different levels of the fair value hierarchy. In such cases, for disclosure purposes, the level in the fair value hierarchy within which the fair value measurement falls in its entirety is determined based on the lowest level input that is significant to the fair value measurement in its entirety.
Changes in valuation techniques may result in transfers into or out of an assigned level within the disclosure hierarchy. In accordance with the Fund’s policy, transfers between different levels of the fair value disclosure hierarchy are deemed to have occurred as of the beginning of the reporting period. The categorization of a value determined for investments is based on the pricing transparency of the investment and is not necessarily an indication of the risks associated with investing in those securities. For information about the Fund’s policy regarding valuation of investments and other significant accounting policies, please refer to Note 1 of the Notes to Financial Statements.
| | | | | | |
See Notes to Financial Statements. | | | | |
| | | | | | | |
| | BLACKROCK LARGE CAP SERIES FUNDS, INC. | | MARCH 31, 2013 | | 23 |
| | |
| | |
Schedule of Investments (concluded) | | BlackRock Large Cap Core Plus Fund |
The following table summarizes the Fund’s investments categorized in the disclosure hierarchy as of March 31, 2013:
| | | | | | | | | | | | | | |
| | | Level 1 | | | Level 2 | | | Level 3 | | Total | |
Assets: | | | | | | | | | | | | | | |
Investments: | | | | | | | | | | | | | | |
Long-Term Investments1 | | $ | 46,835,236 | | | | — | | | — | | $ | 46,835,236 | |
Short-Term Securities | | | 969,448 | | | $ | 9,048 | | | — | | | 978,496 | |
Liabilities: | | | | | | | | | | | | | | |
Investments: | | | | | | | | | | | | | | |
Investments Sold Short 1 | | | (11,411,657) | | | | — | | | — | | | (11,411,657) | |
Total | | $ | 36,393,027 | | | $ | 9,048 | | | — | | $ | 36,402,075 | |
1 See above Schedule of Investments for values in each industry.
Certain of the Fund’s liabilities are held at carrying amount, which approximates fair value for financial statement purposes. As of March 31, 2013, cash received as collateral for securities sold short of $1,073 is categorized as Level 1 within the disclosure hierarchy.
There were no transfers between levels during the period ended March 31, 2013.
| | | | | | |
See Notes to Financial Statements. | | | | |
| | | | | | | |
| 24 | | BLACKROCK LARGE CAP SERIES FUNDS, INC. | | MARCH 31, 2013 | | |
| | |
| | |
Statements of Assets and Liabilities | | BlackRock Large Cap Series Funds, Inc. |
| | | | | | | | | | | | | | | | | | | | | | | | |
| March 31, 2013 (Unaudited) | | BlackRock Large Cap Core Fund | | | BlackRock
Large Cap Growth Fund | | | BlackRock Large Cap Value Fund | | | BlackRock
Large Cap
Core
Retirement
Portfolio | | | BlackRock
Large Cap
Growth
Retirement
Portfolio | | | BlackRock
Large Cap
Value
Retirement
Portfolio | |
| |
Assets | | | | | | | | | | | | | | | | | | | | | | | | |
| |
Investments at value — from the applicable Portfolio1 | | $ | 1,680,391,943 | | | $ | 942,455,251 | | | $ | 902,061,835 | | | $ | 66,685,493 | | | $ | 1,301,008 | | | $ | 121,165,300 | |
Withdrawals receivable from the Portfolio | | | 1,317,338 | | | | 966,132 | | | | 1,027,515 | | | | 115,371 | | | | — | | | | — | |
Capital shares sold receivable | | | 990,453 | | | | 1,114,362 | | | | 501,299 | | | | 14,619 | | | | — | | | | 59,749 | |
Receivable from Manager | | | 48,253 | | | | — | | | | — | | | | — | | | | 8,651 | | | | — | |
Prepaid expenses | | | 40,909 | | | | 45,890 | | | | 43,266 | | | | 6,314 | | | | — | | | | 5,562 | |
| | | | |
Total assets | | | 1,682,788,896 | | | | 944,581,635 | | | | 903,633,915 | | | | 66,821,797 | | | | 1,309,659 | | | | 121,230,611 | |
| | | | |
| | | | | | | | | | | | | | | | | | | | | | | | |
| |
Liabilities | | | | | | | | | | | | | | | | | | | | | | | | |
| |
Capital shares redeemed payable | | | 2,307,790 | | | | 2,080,494 | | | | 1,528,814 | | | | 129,990 | | | | — | | | | 22,791 | |
Contributions payable to the Portfolio | | | — | | | | — | | | | — | | | | — | | | | — | | | | 36,958 | |
Service and distribution fees payable | | | 492,489 | | | | 243,387 | | | | 299,428 | | | | — | | | | — | | | | — | |
Administration fees payable | | | 354,664 | | | | 196,986 | | | | 153,559 | | | | — | | | | — | | | | — | |
Transfer agent fees payable | | | 889,609 | | | | 367,344 | | | | 738,976 | | | | 9,104 | | | | 624 | | | | 24,417 | |
Officer’s and Directors’ fees payable | | | 466 | | | | 81 | | | | 275 | | | | 16 | | | | — | | | | 17 | |
Other accrued expenses payable | | | 157,826 | | | | 64,380 | | | | 101,221 | | | | 17,383 | | | | 22,245 | | | | 18,025 | |
| | | | |
Total liabilities | | | 4,202,844 | | | | 2,952,672 | | | | 2,822,273 | | | | 156,493 | | | | 22,869 | | | | 102,208 | |
| | | | |
Net Assets | | $ | 1,678,586,052 | | | $ | 941,628,963 | | | $ | 900,811,642 | | | $ | 66,665,304 | | | $ | 1,286,790 | | | $ | 121,128,403 | |
| | | | |
| | | | | | | | | | | | | | | | | | | | | | | | |
| |
Net Assets Consist of | | | | | | | | | | | | | | | | | | | | | | | | |
| |
Paid-in capital | | $ | 1,779,866,974 | | | $ | 780,592,089 | | | $ | 1,503,947,328 | | | $ | 71,001,696 | | | $ | (253,558) | | | $ | 101,610,273 | |
Distributions in excess of net investment income | | | (4,328,543) | | | | (3,782,239) | | | | (2,899,062) | | | | (366,641) | | | | (8,932) | | | | (252,589) | |
Accumulated net realized gain (loss) allocated from the Portfolio | | | (461,314,913) | | | | 19,921,800 | | | | (801,418,105) | | | | (30,679,184) | | | | 684,514 | | | | 8,770,091 | |
Net unrealized appreciation/depreciation allocated from the Portfolio | | | 364,362,534 | | | | 144,897,313 | | | | 201,181,481 | | | | 26,709,433 | | | | 864,766 | | | | 11,000,628 | |
| | | | |
Net Assets | | $ | 1,678,586,052 | | | $ | 941,628,963 | | | $ | 900,811,642 | | | $ | 66,665,304 | | | $ | 1,286,790 | | | $ | 121,128,403 | |
| | | | |
| | | | | | |
1 Investments at cost | | $ | 1,316,029,409 | | | $ | 797,557,938 | | | $ | 700,880,354 | | | $ | 39,976,060 | | | $ | 436,242 | | | $ | 110,164,672 | |
| | | | | | |
See Notes to Financial Statements. | | | | |
| | | | | | | |
| | BLACKROCK LARGE CAP SERIES FUNDS, INC. | | MARCH 31, 2013 | | 25 |
| | |
| | |
Statements of Assets and Liabilities (concluded) | | BlackRock Large Cap Series Funds, Inc. |
| | | | | | | | | | | | | | | | | | | | | | | | |
| March 31, 2013 (Unaudited) | | BlackRock
Large Cap Core Fund | | | BlackRock
Large Cap
Growth Fund | | | BlackRock
Large Cap
Value Fund | | | BlackRock
Large Cap
Core
Retirement
Portfolio | | | BlackRock
Large Cap
Growth
Retirement
Portfolio | | | BlackRock
Large Cap
Value
Retirement
Portfolio | |
| |
Net Asset Value | | | | | | | | | | | | | | | | | | | | | | | | |
| |
Institutional: | | | | | | | | | | | | | | | | | | | | | | | | |
Net assets | | $ | 535,161,243 | | | $ | 316,395,401 | | | $ | 207,024,413 | | | | — | | | | — | | | | — | |
| | | | |
Shares outstanding, $ 0.10 par value2 | | | 39,134,735 | | | | 26,150,280 | | | | 11,707,420 | | | | — | | | | — | | | | — | |
| | | | |
Net asset value | | $ | 13.67 | | | $ | 12.10 | | | $ | 17.68 | | | | — | | | | — | | | | — | |
| | | | |
Service: | | | | | | | | | | | | | | | | | | | | | | | | |
Net assets | | $ | 193,987 | | | $ | 11,266,011 | | | $ | 30,493,811 | | | | — | | | | — | | | | — | |
| | | | |
Shares outstanding, $ 0.10 par value3 | | | 14,221 | | | | 939,607 | | | | 1,729,848 | | | | — | | | | — | | | | — | |
| | | | |
Net asset value | | $ | 13.64 | | | $ | 11.99 | | | $ | 17.63 | | | | — | | | | — | | | | — | |
| | | | |
Investor A: | | | | | | | | | | | | | | | | | | | | | | | | |
Net assets | | $ | 704,881,548 | | | $ | 417,318,095 | | | $ | 385,896,776 | | | | — | | | | — | | | | — | |
| | | | |
Shares outstanding, $ 0.10 par value4 | | | 52,652,128 | | | | 35,762,538 | | | | 22,177,337 | | | | — | | | | — | | | | — | |
| | | | |
Net asset value | | $ | 13.39 | | | $ | 11.67 | | | $ | 17.40 | | | | — | | | | — | | | | — | |
| | | | |
Investor B: | | | | | | | | | | | | | | | | | | | | | | | | |
Net assets | | $ | 28,155,024 | | | $ | 6,128,688 | | | $ | 12,704,963 | | | | — | | | | — | | | | — | |
| | | | |
Shares outstanding, $ 0.10 par value5 | | | 2,248,839 | | | | 580,160 | | | | 772,130 | | | | — | | | | — | | | | — | |
| | | | |
Net asset value | | $ | 12.52 | | | $ | 10.56 | | | $ | 16.45 | | | | — | | | | — | | | | — | |
| | | | |
Investor C: | | | | | | | | | | | | | | | | | | | | | | | | |
Net assets | | $ | 364,876,013 | | | $ | 163,850,805 | | | $ | 208,634,243 | | | | — | | | | — | | | | — | |
| | | | |
Shares outstanding, $ 0.10 par value6 | | | 29,570,671 | | | | 15,561,258 | | | | 12,790,982 | | | | — | | | | — | | | | — | |
| | | | |
Net asset value | | $ | 12.34 | | | $ | 10.53 | | | $ | 16.31 | | | | — | | | | — | | | | — | |
| | | | |
Class R: | | | | | | | | | | | | | | | | | | | | | | | | |
Net assets | | $ | 45,318,237 | | | $ | 26,669,963 | | | $ | 56,057,436 | | | | — | | | | — | | | | — | |
| | | | |
Shares outstanding, $ 0.10 par value7 | | | 3,527,596 | | | | 2,390,180 | | | | 3,336,474 | | | | — | | | | — | | | | — | |
| | | | |
Net asset value | | $ | 12.85 | | | $ | 11.16 | | | $ | 16.80 | | | | — | | | | — | | | | — | |
| | | | |
Class K: | | | | | | | | | | | | | | | | | | | | | | | | |
Net assets | | | — | | | | — | | | | — | | | $ | 66,665,304 | | | $ | 1,286,631 | | | $ | 121,128,403 | |
| | | | |
Shares outstanding, $ 0.10 par value8 | | | — | | | | — | | | | — | | | | 4,934,622 | | | | 180,361 | | | | 6,760,002 | |
| | | | |
Net asset value | | | — | | | | — | | | | — | | | $ | 13.51 | | | $ | 7.13 | | | $ | 17.92 | |
| | | | |
| | | | | | |
2 Shares Authorized — Institutional | | | 400 million | | | | 100 million | | | | 400 million | | | | — | | | | — | | | | — | |
3 Shares Authorized — Service | | | 50 million | | | | 50 million | | | | 50 million | | | | — | | | | — | | | | — | |
4 Shares Authorized — Investor A | | | 300 million | | | | 100 million | | | | 400 million | | | | — | | | | — | | | | — | |
5 Shares Authorized — Investor B | | | 200 million | | | | 200 million | | | | 200 million | | | | — | | | | — | | | | — | |
6 Shares Authorized — Investor C | | | 400 million | | | | 100 million | | | | 400 million | | | | — | | | | — | | | | — | |
7 Shares Authorized — Class R | | | 200 million | | | | 200 million | | | | 200 million | | | | — | | | | — | | | | — | |
8 Shares Authorized — Class K | | | — | | | | — | | | | — | | | | 200 million | | | | 200 million | | | | 200 million | |
| | | | | | |
See Notes to Financial Statements. | | | | |
| | | | | | | |
| 26 | | BLACKROCK LARGE CAP SERIES FUNDS, INC. | | MARCH 31, 2013 | | |
| | |
| | |
Statements of Assets and Liabilities | | BlackRock Large Cap Series Funds, Inc. |
| | | | |
| March 31, 2013 (Unaudited) | | BlackRock Large Cap Core Plus Fund | |
Assets | | | | |
| | | | |
Investments at value — unaffiliated (cost — $37,296,344) | | $ | 46,367,574 | |
Investments at value — affiliated (cost — $1,423,588) | | | 1,446,158 | |
Investments sold receivable | | | 72,596 | |
Capital shares sold receivable | | | 6,225 | |
Dividends receivable — affiliated | | | 2,305 | |
Receivable from Manager | | | 1,569 | |
Dividends receivable — unaffiliated | | | 53,076 | |
Prepaid expenses | | | 22,091 | |
| | | | |
Total assets | | | 47,971,594 | |
| | | | |
|
| |
Liabilities | | | | |
Investments sold short at value (proceeds — $11,018,012) | | | 11,411,657 | |
Cash received as collateral for investments sold short | | | 1,073 | |
Investments purchased payable | | | 106,437 | |
Dividends on short sales payable | | | 6,613 | |
Stock loan fees payable | | | 6,863 | |
Interest expense payable | | | 3,935 | |
Capital shares redeemed payable | | | 221 | |
Investment advisory fees payable | | | 30,902 | |
Service and distribution fees payable | | | 9,421 | |
Transfer agent fees payable | | | 14,848 | |
Officer’s and Directors’ fees payable | | | 659 | |
Other affiliates payable | | | 604 | |
Other accrued expenses payable | | | 85,881 | |
| | | | |
Total liabilities | | | 11,679,114 | |
| | | | |
Net Assets | | $ | 36,292,480 | |
| | | | |
|
| |
Net Assets Consist of | | | | |
Paid-in capital | | $ | 33,585,451 | |
Accumulated net investment loss | | | (50,126) | |
Accumulated net realized loss | | | (5,943,000) | |
Net unrealized appreciation/depreciation | | | 8,700,155 | |
| | | | |
Net Assets | | $ | 36,292,480 | |
| | | | |
| | | | | | |
See Notes to Financial Statements. | | | | |
| | | | | | | |
| | BLACKROCK LARGE CAP SERIES FUNDS, INC. | | MARCH 31, 2013 | | 27 |
| | |
| | |
Statements of Assets and Liabilities (concluded) | | BlackRock Large Cap Series Funds, Inc. |
| | | | |
| March 31, 2013 (Unaudited) | | BlackRock Large Cap Core Plus Fund | |
Net Asset Value | | | | |
Institutional: | | | | |
Net assets | | $ | 11,959,386 | |
| | | | |
Shares outstanding, $ 0.10 par value1 | | | 1,014,869 | |
| | | | |
Net asset value | | $ | 11.78 | |
| | | | |
| |
Investor A: | | | | |
Net assets | | $ | 17,190,984 | |
| | | | |
Shares outstanding, $ 0.10 par value2 | | | 1,477,797 | |
| | | | |
Net asset value | | $ | 11.63 | |
| | | | |
| |
Investor C: | | | | |
Net assets | | $ | 7,142,110 | |
| | | | |
Shares outstanding, $ 0.10 par value3 | | | 634,008 | |
| | | | |
Net asset value | | $ | 11.27 | |
| | | | |
| |
1 Shares Authorized — Institutional | | | 400 million | |
2 Shares Authorized — Investor A | | | 300 million | |
3 Shares Authorized — Investor C | | | 400 million | |
| | | | | | |
See Notes to Financial Statements. | | | | |
| | | | | | | |
| 28 | | BLACKROCK LARGE CAP SERIES FUNDS, INC. | | MARCH 31, 2013 | | |
| | |
| | |
Statements of Operations | | BlackRock Large Cap Series Funds, Inc. |
| | | | | | | | | | | | | | | | | | | | | | | | |
Six Months Ended March 31, 2013 (Unaudited) | | BlackRock
Large Cap Core Fund | | | BlackRock
Large Cap Growth Fund | | | BlackRock
Large Cap Value Fund | | | BlackRock Large Cap Core Retirement Portfolio | | | BlackRock Large Cap Growth Retirement
Portfolio | | | BlackRock Large Cap Value
Retirement
Portfolio | |
Investment Income | | | | | | | | | | | | | | | | | |
| | | | | | |
Net investment income allocated from the Portfolio: | | | | | | | | | | | | | | | | | | | | | | | | |
Dividends — unaffiliated | | $ | 16,026,468 | | | $ | 8,909,736 | | | $ | 10,487,214 | | | $ | 733,139 | | | $ | 17,627 | | | $ | 1,242,201 | |
Foreign taxes withheld | | | (38,762 | ) | | | (21,976 | ) | | | (23,167 | ) | | | (1,703 | ) | | | (42 | ) | | | (2,796 | ) |
Securities lending — affiliated | | | 8,246 | | | | 194,999 | | | | 2,858 | | | | 375 | | | | 278 | | | | 336 | |
Dividends — affiliated | | | 7,470 | | | | 14,772 | | | | 5,068 | | | | 345 | | | | 29 | | | | 591 | |
Expenses | | | (4,083,629 | ) | | | (2,420,016 | ) | | | (2,485,339 | ) | | | (184,942 | ) | | | (4,505 | ) | | | (297,363 | ) |
Fees waived | | | 4,019 | | | | 8,849 | | | | 2,738 | | | | 181 | | | | 16 | | | | 332 | |
Total income | | | 11,923,812 | | | | 6,686,364 | | | | 7,989,372 | | | | 547,395 | | | | 13,403 | | | | 943,301 | |
| | | | | | | | | | | | | | | | | | | | | | | | |
Fund Expenses | | | | | | | | | | | | | | | | | |
Administration | | | 2,026,655 | | | | 1,107,219 | | | | 1,047,027 | | | | — | | | | — | | | | — | |
Service — Service | | | 362 | | | | 14,103 | | | | 38,983 | | | | — | | | | — | | | | — | |
Service — Investor A | | | 852,241 | | | | 500,614 | | | | 509,162 | | | | — | | | | — | | | | — | |
Service and distribution — Investor B | | | 151,970 | | | | 34,517 | | | | 70,381 | | | | — | | | | — | | | | — | |
Service and distribution — Investor C | | | 1,774,225 | | | | 803,723 | | | | 1,042,776 | | | | — | | | | — | | | | — | |
Service and distribution — Class R | | | 114,855 | | | | 68,361 | | | | 144,774 | | | | — | | | | — | | | | — | |
Transfer agent — Institutional | | | 325,086 | | | | 243,166 | | | | 266,604 | | | | — | | | | — | | | | — | |
Transfer agent — Service | | | 267 | | | | 9,793 | | | | 21,560 | | | | — | | | | — | | | | — | |
Transfer agent — Investor A | | | 834,144 | | | | 384,601 | | | | 432,657 | | | | — | | | | — | | | | — | |
Transfer agent — Investor B | | | 85,418 | | | | 12,052 | | | | 29,968 | | | | — | | | | — | | | | — | |
Transfer agent — Investor C | | | 483,777 | | | | 186,753 | | | | 309,924 | | | | — | | | | — | | | | — | |
Transfer agent — Class R | | | 59,522 | | | | 36,292 | | | | 77,189 | | | | — | | | | — | | | | — | |
Transfer agent — Class K | | | — | | | | — | | | | — | | | | 14,316 | | | | 219 | | | | 48,619 | |
Registration | | | 30,004 | | | | 43,937 | | | | 26,991 | | | | 8,974 | | | | 7,047 | | | | 8,209 | |
Printing | | | 43,109 | | | | 23,176 | | | | 36,828 | | | | 2,976 | | | | 877 | | | | 2,406 | |
Professional | | | 24,719 | | | | 19,448 | | | | 22,722 | | | | 10,801 | | | | 8,017 | | | | 11,198 | |
Officer and Directors | | | 525 | | | | 329 | | | | 492 | | | | 5 | | | | 66 | | | | — | |
Miscellaneous | | | 8,917 | | | | 10,234 | | | | 9,789 | | | | 2,988 | | | | 2,772 | | | | 2,929 | |
Total expenses | | | 6,815,796 | | | | 3,498,318 | | | | 4,087,827 | | | | 40,060 | | | | 18,998 | | | | 73,361 | |
Less fees waived by administrator | | | — | | | | — | | | | (135,869 | ) | | | — | | | | (14,590 | ) | | | — | |
Less distribution fees waived — class specific | | | — | | | | — | | | | — | | | | — | | | | (3,054 | ) | | | (2,471 | ) |
Less transfer agent fees reimbursed — class specific | | | (467,585 | ) | | | — | | | | — | | | | — | | | | (309 | ) | | | (6,564 | ) |
Total expenses after fees waived and/or reimbursed | | | 6,348,211 | | | | 3,498,318 | | | | 3,951,958 | | | | 40,060 | | | | 1,045 | | | | 64,326 | |
Net investment income | | | 5,575,601 | �� | | | 3,188,046 | | | | 4,037,414 | | | | 507,335 | | | | 12,358 | | | | 878,975 | |
| | | | | | | | | | | | | | | | | | | | | | | | |
Realized and Unrealized Gain (Loss) | | | | | | | | | | | | | | | | | |
Net realized gain from investments and foreign currency transactions allocated from the Portfolio | | | 95,323,646 | | | | 35,006,931 | | | | 58,544,239 | | | | 4,295,902 | | | | 63,681 | | | | 7,022,341 | |
Net change in unrealized appreciation/depreciation on investments allocated from the Portfolio | | | 58,035,133 | | | | 2,899,430 | | | | 60,343,388 | | | | 2,290,025 | | | | (27,484 | ) | | | 7,698,615 | |
Total realized and unrealized gain | | | 153,358,779 | | | | 37,906,361 | | | | 118,887,627 | | | | 6,585,927 | | | | 36,197 | | | | 14,720,956 | |
Net Increase in Net Assets Resulting from Operations | | $ | 158,934,380 | | | $ | 41,094,407 | | | $ | 122,925,041 | | | $ | 7,093,262 | | | $ | 48,555 | | | $ | 15,599,931 | |
| | | | | | |
See Notes to Financial Statements. | | | | |
| | | | | | | |
| | BLACKROCK LARGE CAP SERIES FUNDS, INC. | | MARCH 31, 2013 | | 29 |
| | |
| | |
Statements of Operations | | BlackRock Large Cap Series Funds, Inc. |
| | | | |
| Six Months Ended March 31, 2013 (Unaudited) | | BlackRock Large Cap Core Plus Fund | |
| |
Investment Income | | | | |
| |
Dividends – unaffiliated | | $ | 399,618 | |
Dividends – affiliated | | | 7,165 | |
Foreign taxes withheld | | | (1,119) | |
| | | | |
Total income | | | 405,664 | |
| | | | |
|
| |
| |
Fund Expenses | | | | |
| |
Investment advisory | | | 206,557 | |
Service – Investor A | | | 19,920 | |
Service and distribution – Investor C | | | 33,423 | |
Transfer agent – Institutional | | | 9,041 | |
Transfer agent – Investor A | | | 6,650 | |
Transfer agent – Investor C | | | 5,037 | |
Professional | | | 27,090 | |
Registration | | | 22,789 | |
Custodian | | | 13,450 | |
Printing | | | 9,740 | |
Accounting services | | | 8,181 | |
Officer and Directors | | | 2,050 | |
Miscellaneous | | | 4,483 | |
| | | | |
Total expenses excluding dividend expense, stock loan fees and interest expense | | | 368,411 | |
Dividend expense | | | 82,669 | |
Stock loan fees | | | 34,205 | |
Interest expense | | | 23,390 | |
| | | | |
Total expenses | | | 508,675 | |
Less fees waived and/or reimbursed by Manager | | | (36,168) | |
Less transfer agent fees reimbursed – class specific | | | (16,718) | |
| | | | |
Total expenses after fees waived and/or reimbursed | | | 455,789 | |
| | | | |
Net investment loss | | | (50,125) | |
| | | | |
|
| |
| |
Realized and Unrealized Gain (Loss) | | | | |
| |
Net realized gain (loss) from: | | | | |
Investments | | | 2,258,368 | |
Foreign currency transactions | | | (7) | |
Short sales | | | (964,451) | |
| | | | |
| | | 1,293,910 | |
| | | | |
| |
Net change in unrealized appreciation/depreciation on: | | | | |
Investments | | | 2,718,913 | |
Short sales | | | (307,169) | |
| | | | |
| | | 2,411,744 | |
| | | | |
Total realized and unrealized gain | | | 3,705,654 | |
| | | | |
Net Increase in Net Assets Resulting from Operations | | $ | 3,655,529 | |
| | | | |
| | | | | | |
See Notes to Financial Statements. | | | | |
| | | | | | | |
| 30 | | BLACKROCK LARGE CAP SERIES FUNDS, INC. | | MARCH 31, 2013 | | |
| | |
| | |
Statements of Changes in Net Assets | | BlackRock Large Cap Series Funds, Inc. |
| | | | | | | | | | | | | | | | |
| | | BlackRock Large Cap Core Fund | | | BlackRock Large Cap Growth Fund | |
| | | | | | | | |
| Increase (Decrease) in Net Assets: | | Six Months Ended
March 31, 2013
(Unaudited) | | | Year Ended
September 30,
2012 | | | Six Months Ended
March 31, 2013
(Unaudited) | | | Year Ended
September 30,
2012 | |
| |
Operations | | | | | | | | | | | | | | | | |
| |
Net investment income | | $ | 5,575,601 | | | $ | 16,132,564 | | | $ | 3,188,046 | | | $ | 8,609,897 | |
Net realized gain | | | 95,323,646 | | | | 76,617,478 | | | | 35,006,931 | | | | 63,189,611 | |
Net change in unrealized appreciation/depreciation | | | 58,035,133 | | | | 343,135,730 | | | | 2,899,430 | | | | 182,192,544 | |
| | | | | | | | |
Net increase in net assets resulting from operations | | | 158,934,380 | | | | 435,885,772 | | | | 41,094,407 | | | | 253,992,052 | |
| | | | | | | | |
| | | | | | | | | | | | | | | | |
| |
Dividends and Distributions to Shareholders From | | | | | | | | | | | | | | | | |
| |
Net investment income: | | | | | | | | | | | | | | | | |
Institutional | | | (10,378,743) | | | | (4,352,889) | 1 | | | (5,073,393) | | | | (1,412,861) | 1 |
Service | | | (185) | | | | — | | | | (187,426) | | | | (6,869) | 1 |
Investor A | | | (11,473,397) | | | | (2,849,708) | 1 | | | (7,269,585) | | | | (580,273) | 1 |
Investor B | | | (95,166) | | | | — | | | | (65,126) | | | | — | |
Investor C | | | (2,487,652) | | | | — | | | | (1,983,615) | | | | — | |
Class R | | | (564,840) | | | | — | | | | (420,926) | | | | — | |
Net realized gains: | | | | | | | | | | | | | | | | |
Institutional | | | — | | | | — | | | | (14,860,180) | | | | — | |
Service. | | | — | | | | — | | | | (637,431) | | | | — | |
Investor A | | | — | | | | — | | | | (23,081,522) | | | | — | |
Investor B | | | — | | | | — | | | | (454,536) | | | | — | |
Investor C | | | — | | | | — | | | | (10,278,287) | | | | — | |
Class R | | | — | | | | — | | | | (1,639,203) | | | | — | |
| | | | | | | | |
Decrease in net assets resulting from dividends and distributions to shareholders | | | (24,999,983) | | | | (7,202,597) | | | | (65,951,230) | | | | (2,000,003) | |
| | | | | | | | |
| | | | | | | | | | | | | | | | |
| |
Capital Share Transactions | | | | | | | | | | | | | | | | |
| |
Net increase (decrease) in net assets derived from capital share transactions | | | (112,778,269) | | | | (386,865,700) | | | | 76,938,992 | | | | (161,987,457) | |
| | | | | | | | |
| | | | | | | | | | | | | | | | |
| |
Net Assets | | | | | | | | | | | | | | | | |
| |
Total increase in net assets | | | 21,156,128 | | | | 41,817,475 | | | | 52,082,169 | | | | 90,004,592 | |
Beginning of period | | | 1,657,429,924 | | | | 1,615,612,449 | | | | 889,546,794 | | | | 799,542,202 | |
| | | | | | | | |
End of period | | $ | 1,678,586,052 | | | $ | 1,657,429,924 | | | $ | 941,628,963 | | | $ | 889,546,794 | |
| | | | | | | | |
Undistributed (distributions in excess of) net investment income | | $ | (4,328,543) | | | $ | 15,095,839 | | | $ | (3,782,239) | | | $ | 8,029,786 | |
| | | | | | | | |
1 Dividends are determined in accordance with federal income tax regulations. | |
| | | | | | |
See Notes to Financial Statements. | | | | |
| | | | | | | |
| | BLACKROCK LARGE CAP SERIES FUNDS, INC. | | MARCH 31, 2013 | | 31 |
| | |
| | |
Statements of Changes in Net Assets (continued) | | BlackRock Large Cap Series Funds, Inc. |
| | | | | | | | | | | | | | | | |
| | | BlackRock Large Cap Value Fund | | | BlackRock Large Cap Core Retirement Portfolio | |
| | | | | | | | |
| Increase (Decrease) in Net Assets: | | Six Months Ended
March 31, 2013 (Unaudited) | | | Year Ended
September 30, 2012 | | | Six Months Ended
March 31, 2013 (Unaudited) | | | Year Ended
September 30,
2012 | |
| |
Operations | | | | | | | | | | | | | | | | |
| |
Net investment income | | $ | 4,037,414 | | | $ | 10,258,790 | | | $ | 507,335 | | | $ | 1,892,265 | |
Net realized gain | | | 58,544,239 | | | | 44,982,388 | | | | 4,295,902 | | | | 9,881,530 | |
Net change in unrealized appreciation/depreciation | | | 60,343,388 | | | | 205,886,296 | | | | 2,290,025 | | | | 28,239,687 | |
| | | | | | | | |
Net increase in net assets resulting from operations | | | 122,925,041 | | | | 261,127,474 | | | | 7,093,262 | | | | 40,013,482 | |
| | | | | | | | |
| | | | | | | | | | | | | | | | |
| |
Dividends to Shareholders From | | | | | | | | | | | | | | | | |
| |
Net investment income: | | | | | | | | | | | | | | | | |
Institutional | | | (5,127,680) | | | | (3,669,706) | 1 | | | — | | | | — | |
Service | | | (544,205) | | | | (278,874) | 1 | | | — | | | | — | |
Investor A | | | (7,511,800) | | | | (3,284,247) | 1 | | | — | | | | — | |
Investor B | | | (99,626) | | | | — | | | | — | | | | — | |
Investor C | | | (2,331,994) | | | | — | | | | — | | | | — | |
Class R | | | (884,702) | | | | (267,234) | 1 | | | — | | | | — | |
Class K | | | — | | | | — | | | | (1,900,001) | | | | (1,597,998) | 1 |
| | | | | | | | |
Decrease in net assets resulting from dividends to shareholders | | | (16,500,007) | | | | (7,500,061) | | | | (1,900,001) | | | | (1,597,998) | |
| | | | | | | | |
| | | | | | | | | | | | | | | | |
| |
Capital Share Transactions | | | | | | | | | | | | | | | | |
| |
Net decrease in net assets derived from capital share transactions | | | (164,715,784) | | | | (478,809,563) | | | | (19,749,352) | | | | (86,685,132) | |
| | | | | | | | |
| | | | | | | | | | | | | | | | |
| |
Net Assets | | | | | | | | | | | | | | | | |
| |
Total decrease in net assets | | | (58,290,750) | | | | (225,182,150) | | | | (14,556,091) | | | | (48,269,648) | |
Beginning of period | | | 959,102,392 | | | | 1,184,284,542 | | | | 81,221,395 | | | | 129,491,043 | |
| | | | | | | | |
End of period | | $ | 900,811,642 | | | $ | 959,102,392 | | | $ | 66,665,304 | | | $ | 81,221,395 | |
| | | | | | | | |
Undistributed (distributions in excess of) net investment income | | $ | (2,899,062) | | | $ | 9,563,531 | | | $ | (366,641) | | | $ | 1,026,025 | |
| | | | | | | | |
1 Dividends are determined in accordance with federal income tax regulations. | |
| | | | | | |
See Notes to Financial Statements. | | | | |
| | | | | | | |
| 32 | | BLACKROCK LARGE CAP SERIES FUNDS, INC. | | MARCH 31, 2013 | | |
| | |
| | |
Statements of Changes in Net Assets (concluded) | | BlackRock Large Cap Series Funds, Inc. |
| | | | | | | | | | | | | | | | |
| | | BlackRock Large Cap Growth Retirement Portfolio | | | BlackRock Large Cap Value Retirement Portfolio | |
| | | | | | | | |
| Increase (Decrease) in Net Assets: | | Six Months Ended
March 31, 2013
(Unaudited) | | | Year Ended September 30,
2012 | | | Six Months Ended
March 31, 2013
(Unaudited) | | | Year Ended
September 30,
2012 | |
| |
Operations | | | | | | | | | | | | | | | | |
| |
Net investment income | | $ | 12,358 | | | $ | 782,587 | | | $ | 878,975 | | | $ | 2,169,991 | |
Net realized gain | | | 63,681 | | | | 21,871,504 | | | | 7,022,341 | | | | 10,293,461 | |
Net change in unrealized appreciation/depreciation | | | (27,484) | | | | 7,364,220 | | | | 7,698,615 | | | | 24,642,875 | |
| | | | | | | | |
Net increase in net assets resulting from operations | | | 48,555 | | | | 30,018,311 | | | | 15,599,931 | | | | 37,106,327 | |
| | | | | | | | |
| | | | | | | | | | | | | | | | |
| |
Dividends and Distributions to Shareholders From | | | | | | | | | | | | | | | | |
| |
Net investment income: | | | | | | | | | | | | | | | | |
Class K | | | (260,000) | | | | (950,003) | 1 | | | (2,300,006) | | | | (2,300,002) | 1 |
Net realized gains: | | | | | | | | | | | | | | | | |
Class K | | | (758,868) | | | | — | | | | — | | | | — | |
| | | | | | | | |
Decrease in net assets resulting from dividends and distributions to shareholders | | | (1,018,868) | | | | (950,003) | | | | (2,300,006) | | | | (2,300,002) | |
| | | | | | | | |
| | | | | | | | | | | | | | | | |
| |
Capital Share Transactions | | | | | | | | | | | | | | | | |
| |
Net increase (decrease) in net assets derived from capital share transactions | | | 14,360 | | | | (126,994,986) | | | | 4,192,090 | | | | (76,133,782) | |
| | | | | | | | |
| | | | | | | | | | | | | | | | |
| |
Net Assets | | | | | | | | | | | | | | | | |
| |
Total increase (decrease) in net assets | | | (955,953) | | | | (97,926,678) | | | | 17,492,015 | | | | (41,327,457) | |
Beginning of period | | | 2,242,743 | | | | 100,169,421 | | | | 103,636,388 | | | | 144,963,845 | |
| | | | | | | | |
End of period | | $ | 1,286,790 | | | $ | 2,242,743 | | | $ | 121,128,403 | | | $ | 103,636,388 | |
| | | | | | | | |
1 Dividends are determined in accordance with federal income tax regulations. | |
| | | | | | | | |
| | | BlackRock Large Cap Core Plus Fund | |
| | | | |
| Increase (Decrease) in Net Assets: | | Six Months Ended
March 31, 2013
(Unaudited) | | | Year Ended
September 30,
2012 | |
| |
Operations | | | | | | | | |
| |
Net investment income (loss) | | $ | (50,125) | | | $ | 2,831 | |
Net realized gain | | | 1,293,910 | | | | 4,810 | |
Net change in unrealized appreciation/depreciation | | | 2,411,744 | | | | 10,832,065 | |
| | | | |
Net increase in net assets resulting from operations | | | 3,655,529 | | | | 10,839,706 | |
| | | | |
| | | | | | | | |
| |
Dividends to Shareholders From | | | | | | | | |
| |
Net investment income: | | | | | | | | |
Institutional | | | (7,055) | | | | — | |
| | | | |
| | | | | | | | |
| |
Capital Share Transactions | | | | | | | | |
| |
Net decrease in net assets derived from capital share transactions | | | (1,927,754) | | | | (10,290,946) | |
| | | | |
| | | | | | | | |
| |
Net Assets | | | | | | | | |
| |
Total increase in net assets | | | 1,720,720 | | | | 548,760 | |
Beginning of period | | | 34,571,760 | | | | 34,023,000 | |
| | | | |
End of period | | $ | 36,292,480 | | | $ | 34,571,760 | |
| | | | |
Undistributed (distributions in excess of) net investment income | | $ | (50,126) | | | $ | 7,054 | |
| | | | |
| | | | | | |
See Notes to Financial Statements. | | | | |
| | | | | | | |
| | BLACKROCK LARGE CAP SERIES FUNDS, INC. | | MARCH 31, 2013 | | 33 |
| | |
| | |
Statement of Cash Flows | | BlackRock Large Cap Series Funds, Inc. |
| | | | |
| Six Months Ended March 31, 2013 (Unaudited) | | BlackRock
Large Cap
Core Plus Fund | |
| |
Cash Provided by Operating Activities | | | | |
| |
Net increase in net assets resulting from operations | | $ | 3,655,529 | |
Adjustments to reconcile net increase in net assets resulting from operations to net cash provided by operating activities: | | | | |
Increase in receivable from Manager | | | (1,569) | |
Increase in prepaid expenses | | | (22,070) | |
Increase in dividends receivable | | | (31,389) | |
Increase in cash received as collateral for investments sold short | | | 1,073 | |
Increase in interest expense payable | | | 3,935 | |
Decrease in dividends on short sales payable | | | (2,856) | |
Increase in other accrued expense payable | | | 15,611 | |
Increase in service and distribution fees payable | | | 699 | |
Increase in investment advisory fees payable | | | 18,519 | |
Increase in other affiliates payable | | | 259 | |
Increase in Officer’s and Directors’ fees payable | | | 390 | |
Net realized and unrealized gain on investments | | | (3,705,654) | |
Proceeds from sales of long-term investments | | | 18,858,633 | |
Purchases of long-term investments | | | (15,082,531) | |
Proceeds from investments sold short | | | 15,241,890 | |
Buys to cover of investments sold short | | | (16,367,186) | |
Net proceeds from sales (purchases) of short-term securities. | | | (593,039) | |
| | | | |
Cash provided by operating activities | | | 1,990,244 | |
| | | | |
| | | | |
| |
Cash Used for Financing Activities | | | | |
| |
Proceeds from issuance capital shares | | | 3,621,856 | |
Payments on redemption of capital shares | | | (5,605,972) | |
Cash dividends paid to shareholders | | | (7,055) | |
| | | | |
Cash used for financing activities | | | (1,991,171) | |
| | | | |
| | | | |
| |
Cash | | | | |
| |
Net decrease in cash | | | (927) | |
Cash at beginning of period | | | 927 | |
| | | | |
Cash at end of period | | $ | — | |
| | | | |
| | | | |
| |
Non-Cash Financing Activities | | | | |
| |
Capital shares issued in reinvestment of dividends paid to shareholders | | $ | 1,803 | |
| | | | |
Cash paid during the period for interest and stock loan fees | | $ | 57,595 | |
| | | | |
| | | | | | |
See Notes to Financial Statements. | | | | |
| | | | | | | |
| 34 | | BLACKROCK LARGE CAP SERIES FUNDS, INC. | | MARCH 31, 2013 | | |
| | |
| | |
Financial Highlights | | BlackRock Large Cap Core Fund |
| | | | | | | | | | | | | | | | | | | | | | | | | | | | |
| | | Institutional | |
| | | | |
| | | Six Months
Ended
March 31, | | | | | | | | | | | | Period
November 1,
2008 to | | | | | | | |
| | | 2013 | | | Year Ended September 30, | | | September 30, | | | Year Ended October 31, | |
| | | | | | | | | | | | | | | | |
| | | (Unaudited) | | | 2012 | | | 2011 | | | 2010 | | | 2009 | | | 2008 | | | 2007 | |
| | | | | | | | | | | | | | | | | | | | | | | | | | | | |
| |
Per Share Operating Performance | | | | | | | | | | | | | | | | | | | | | | | | | | | | |
| |
Net asset value, beginning of period | | $ | 12.64 | | | $ | 9.84 | | | $ | 10.11 | | | $ | 9.68 | | | $ | 8.62 | | | $ | 14.60 | | | $ | 14.20 | |
| | | | |
Net investment income1 | | | 0.07 | | | | 0.16 | | | | 0.07 | | | | 0.06 | | | | 0.09 | | | | 0.07 | | | | 0.04 | |
Net realized and unrealized gain (loss) | | | 1.23 | | | | 2.73 | | | | (0.28) | | | | 0.49 | | | | 0.97 | | | | (5.66) | | | | 1.83 | |
| | | | |
Net increase (decrease) from investment operations | | | 1.30 | | | | 2.89 | | | | (0.21) | | | | 0.55 | | | | 1.06 | | | | (5.59) | | | | 1.87 | |
| | | | |
Dividends and distributions from: | | | | | | | | | | | | | | | | | | | | | | | | | | | | |
Net investment income | | | (0.27) | | | | (0.09) | 2 | | | (0.06) | 2 | | | (0.12) | 2 | | | — | | | | — | | | | — | |
Net realized gain | | | — | | | | — | | | | — | | | | — | | | | — | | | | (0.39) | 2 | | | (1.47)2 | |
| | | | |
Total dividends and distributions | | | (0.27) | | | | (0.09) | | | | (0.06) | | | | (0.12) | | | | — | | | | (0.39) | | | | (1.47) | |
| | | | |
Net asset value, end of period | | $ | 13.67 | | | $ | 12.64 | | | $ | 9.84 | | | $ | 10.11 | | | $ | 9.68 | | | $ | 8.62 | | | $ | 14.60 | |
| | | | |
| | | | | | | | | | | | | |
| |
Total Investment Return3 | | | | | | | | | | | | | | | | | | | | | | | | | | | | |
| |
Based on net asset value | | | 10.46% | 4 | | | 29.55% | | | | (2.16)% | | | | 5.69% | | | | 12.30% | 4,5 | | | (39.25)% | | | | 13.55% | |
| | | | |
| | | | | | | | | | | | | |
| |
Ratios to Average Net Assets6 | | | | | | | | | | | | | | | | | | | | | | | | | | | | |
| |
Total expenses | | | 0.89% | 7,8 | | | 0.77% | 8,9 | | | 1.05% | 8 | | | 0.98% | | | | 0.89% | 7 | | | 0.86% | | | | 0.87% | |
| | | | |
Total expenses after fees waived and reimbursed | | | 0.89% | 7,8 | | | 0.77% | 8,9 | | | 1.05% | 8 | | | 0.98% | | | | 0.89% | 7 | | | 0.86% | | | | 0.87% | |
| | | | |
Net investment income | | | 1.08% | 7,8 | | | 1.41% | 8,9 | | | 0.58% | 8 | | | 0.63% | | | | 1.15% | 7 | | | 0.58% | | | | 0.24% | |
| | | | |
| | | | | | | | | | | | | |
| |
Supplemental Data | | | | | | | | | | | | | | | | | | | | | | | | | | | | |
| |
Net assets, end of period (000) | | $ | 535,161 | | | $ | 513,245 | | | $ | 489,847 | | | $ | 646,562 | | | $ | 1,073,342 | | | $ | 700,113 | | | $ | 1,532,235 | |
| | | | |
Portfolio turnover of the Fund | | | — | | | | — | | | | — | | | | — | | | | — | | | | — | | | | 0%10 | |
| | | | |
Portfolio turnover of the Portfolio | | | 29% | | | | 128% | | | | 129% | | | | 173% | | | | 168% | | | | 109% | | | | 96% | |
| | | | |
| | 1 | Based on average shares outstanding. |
| | 2 | Dividends and distributions are determined in accordance with federal income tax regulations. |
| | 3 | Where applicable, total investment returns include the reinvestment of dividends and distributions. |
| | 4 | Aggregate total investment return. |
| | 5 | Includes proceeds received from a settlement of litigation, through its investment in the Portfolio, which impacted the Fund’s total investment return. Not including these proceeds, the total investment return would have been 12.06%. |
| | 6 | Includes the Fund’s share of the Portfolio’s allocated expenses and/or net investment income. |
| | 8 | Includes the Fund’s share of the Portfolio’s allocated fees waived of less than 0.01%. |
| | 9 | Includes a non-recurring expense adjustment, which impacted the ratios for total expenses, total expenses after fees waived and/or reimbursed and net investment income. Excluding this adjustment, the ratios would have been 0.90%, 0.90% and 1.28%, respectively. |
| | 10 | BlackRock Large Cap Core Fund (the “Fund”). |
| | | | | | |
See Notes to Financial Statements. | | | | |
| | | | | | | |
| | BLACKROCK LARGE CAP SERIES FUNDS, INC. | | MARCH 31, 2013 | | 35 |
| | |
| | |
Financial Highlights (continued) | | BlackRock Large Cap Core Fund |
| | | | | | | | | | | | | | | | | | | | | | | | | | | | | | |
| | | Service | | | |
| | | Six Months
Ended
March 31,
2013 | | | Year Ended September 30, | | | Period
November 1,
2008 to
September 30, | | | Year
Ended
October 31, | | | Period
September
24, 20071 to
October 31, | | | |
| | | (Unaudited) | | | 2012 | | | 2011 | | | 2010 | | | 2009 | | | 2008 | | | 2007 | | | |
Per Share Operating Performance | | | | | | | | | | | | | | | | | | | | | | | | | | | | | | |
Net asset value, beginning of period | | $ | 12.39 | | | $ | 9.60 | | | $ | 9.89 | | | $ | 9.47 | | | $ | 8.44 | | | $ | 14.33 | | | $ | 14.02 | | | |
| | | |
Net investment income2 | | | 0.05 | | | | 0.11 | | | | 0.04 | | | | 0.05 | | | | 0.07 | | | | 0.04 | | | | (0.01) | | | |
Net realized and unrealized gain (loss) | | | 1.21 | | | | 2.68 | | | | (0.27) | | | | 0.47 | | | | 0.96 | | | | (5.55) | | | | 0.32 | | | |
| | | |
Net increase (decrease) from investment operations | | | 1.26 | | | | 2.79 | | | | (0.23) | | | | 0.52 | | | | 1.03 | | | | (5.51) | | | | 0.31 | | | |
| | | |
Dividends and distributions from: | | | | | | | | | | | | | | | | | | | | | | | | | | | | | | |
Net investment income (loss) | | | (0.01) | | | | — | | | | (0.06) | 3 | | | (0.10) | 3 | | | — | | | | — | | | | — | | | |
Net realized gain | | | — | | | | — | | | | — | | | | — | | | | — | | | | (0.38) | 3 | | | — | | | |
| | | |
Total dividends and distributions | | | (0.01) | | | | — | | | | (0.06) | | | | (0.10) | | | | — | | | | (0.38) | | | | — | | | |
| | | |
Net asset value, end of period. | | $ | 13.64 | | | $ | 12.39 | | | $ | 9.60 | | | $ | 9.89 | | | $ | 9.47 | | | $ | 8.44 | | | $ | 14.33 | | | |
| | | |
|
Total Investment Return4 | | | | | | | | | | | | | | | | | | | | | | | | | | | | | | |
|
Based on net asset value | | | 10.20% | 5 | | | 29.06% | | | | (2.41)% | | | | 5.53% | | | | 12.20% | 5,6 | | | (39.39)% | | | | 2.21%5 | | | |
| | | |
|
Ratios to Average Net Assets7 | | | | | | | | | | | | | | | | | | | | | | | | | | | | | | |
|
Total expenses. | | | 1.20% | 8,9 | | | 1.05% | 9 | | | 1.25% | 9 | | | 1.12% | | | | 1.09% | 8 | | | 1.06% | | | | 1.14% | | | |
| | | |
Total expenses after fees waived and reimbursed | | | 1.20% | 8,9 | | | 1.05% | 9 | | | 1.25% | 9 | | | 1.12% | | | | 1.09% | 8 | | | 1.06% | | | | 1.14% | | | |
| | | |
Net investment income (loss) | | | 0.74% | 8,9 | | | 0.96% | 9 | | | 0.39% | 9 | | | 0.49% | | | | 0.95% | 8 | | | 0.37% | | | | (0.52)% | | | |
| | | |
|
Supplemental Data | | | | | | | | | | | | | | | | | | | | | | | | | | | | | | |
|
Net assets, end of period (000) | | $ | 194 | | | $ | 1,578 | | | $ | 270 | | | $ | 369 | | | $ | 395 | | | $ | 372 | | | $ | 640 | | | |
| | | |
Portfolio turnover of the Portfolio | | | 29% | | | | 128% | | | | 129% | | | | 173% | | | | 168% | | | | 109% | | | | 96% | | | |
| | | |
| | 1 | Commencement of operations. |
| | 2 | Based on average shares outstanding. |
| | 3 | Dividends and distributions are determined in accordance with federal income tax regulations. |
| | 4 | Where applicable, total investment returns include the reinvestment of dividends and distributions. |
| | 5 | Aggregate total investment return. |
| | 6 | Includes proceeds received from a settlement of litigation, through its investment in the Portfolio, which impacted the Fund’s total investment return. Not including these proceeds, the total investment return would have been 11.85%. |
| | 7 | Includes the Fund’s share of the Portfolio’s allocated expenses and/or net investment income. |
| | 9 | Includes the Fund’s share of the Portfolio’s allocated fees waived of less than 0.01%. |
| | | | | | |
See Notes to Financial Statements. | | | | |
| | | | | | | |
| 36 | | BLACKROCK LARGE CAP SERIES FUNDS, INC. | | MARCH 31, 2013 | | |
| | |
| | |
Financial Highlights (continued) | | BlackRock Large Cap Core Fund |
| | | | | | | | | | | | | | | | | | | | | | | | | | | | | | |
| | | Investor A |
| | | Six Months
Ended
March 31,
2013 | | | Year Ended September 30, | | | Period
November 1,
2008 to
September 30, | | | Year Ended October 31, |
| | | (Unaudited) | | | 2012 | | | 2011 | | | 2010 | | | 2009 | | | 2008 | | | 2007 | | | |
|
Per Share Operating Performance | | | | | | | | | | | | | | | | | | | | | | | | | | | | | | |
|
Net asset value, beginning of period | | $ | 12.34 | | | $ | 9.61 | | | $ | 9.88 | | | $ | 9.46 | | | $ | 8.44 | | | $ | 14.33 | | | $ | 13.97 | | | |
| | | |
Net investment income1 | | | 0.05 | | | | 0.12 | | | | 0.06 | | | | 0.05 | | | | 0.07 | | | | 0.04 | | | | 0.002 | | | |
Net realized and unrealized gain (loss) | | | 1.21 | | | | 2.65 | | | | (0.28) | | | | 0.47 | | | | 0.95 | | | | (5.54) | | | | 1.79 | | | |
| | | |
Net increase (decrease) from investment operations | | | 1.26 | | | | 2.77 | | | | (0.22) | | | | 0.52 | | | | 1.02 | | | | (5.50) | | | | 1.79 | | | |
| | | |
Dividends and distributions from: | | | | | | | | | | | | | | | | | | | | | | | | | | | | | | |
Net investment income | | | (0.21) | | | | (0.04)3 | | | | (0.05)3 | | | | (0.10)3 | | | | — | | | | — | | | | — | | | |
Net realized gain | | | — | | | | — | | | | — | | | | — | | | | — | | | | (0.39) | 3 | | | (1.43) | 3 | | |
| | | |
Total dividends and distributions | | | (0.21) | | | | (0.04) | | | | (0.05) | | | | (0.10) | | | | — | | | | (0.39) | | | | (1.43) | | | |
| | | |
Net asset value, end of period. | | $ | 13.39 | | | $ | 12.34 | | | $ | 9.61 | | | $ | 9.88 | | | $ | 9.46 | | | $ | 8.44 | | | $ | 14.33 | | | |
| | | |
|
Total Investment Return4 | | | | | | | | | | | | | | | | | | | | | | | | | | | | | | |
|
Based on net asset value | | | 10.39% | 5 | | | 28.96% | | | | (2.24)% | | | | 5.50% | | | | 12.09% | 5,6 | | | (39.38)% | | | | 13.23% | | | |
| | | |
|
Ratios to Average Net Assets7 | | | | | | | | | | | | | | | | | | | | | | | | | | | | | | |
|
Total expenses. | | | 1.26%8,9 | | | | 1.28%9 | | | | 1.23%9 | | | | 1.25% | | | | 1.32%8 | | | | 1.23% | | | | 1.16% | | | |
| | | |
Total expenses after fees waived and reimbursed | | | 1.14%8,9 | | | | 1.14%9 | | | | 1.14%9 | | | | 1.14% | | | | 1.12%8 | | | | 1.11% | | | | 1.14% | | | |
| | | |
Net investment income (loss) | | | 0.84%8,9 | | | | 1.04%9 | | | | 0.48%9 | | | | 0.47% | | | | 0.93%8 | | | | 0.32% | | | | (0.03)% | | | |
| | | |
|
Supplemental Data | | | | | | | | | | | | | | | | | | | | | | | | | | | | | | |
|
Net assets, end of period (000) | | $ | 704,882 | | | $ | 696,484 | | | $ | 634,822 | | | $ | 973,066 | | | $ | 1,060,517 | | | $ | 1,023,005 | | | $ | 1,846,007 | | | |
| | | |
Portfolio turnover of the Fund | | | — | | | | — | | | | — | | | | — | | | | — | | | | — | | | | 0%10 | | | |
| | | |
Portfolio turnover of the Portfolio | | | 29% | | | | 128% | | | | 129% | | | | 173% | | | | 168% | | | | 109% | | | | 96% | | | |
| | | |
| | 1 | Based on average shares outstanding. |
| | 2 | Amount is less than $0.005 per share. |
| | 3 | Dividends and distributions are determined in accordance with federal income tax regulations. |
| | 4 | Where applicable, total investment returns include the reinvestment of dividends and distributions. |
| | 5 | Aggregate total investment return. |
| | 6 | Includes proceeds received from a settlement of litigation, through its investment in the Portfolio, which impacted the Fund’s total investment return. Not including these proceeds, the total investment return would have been 11.73%. |
| | 7 | Includes the Fund’s share of the Portfolio’s allocated expenses and/or net investment income. |
| | 9 | Includes the Fund’s share of the Portfolio’s allocated fees waived of less than 0.01%. |
| | 10 | BlackRock Large Cap Core Fund (the “Fund”). |
| | | | | | |
See Notes to Financial Statements. | | | | |
| | | | | | | |
| | BLACKROCK LARGE CAP SERIES FUNDS, INC. | | MARCH 31, 2013 | | 37 |
| | |
| | |
Financial Highlights (continued) | | BlackRock Large Cap Core Fund |
| | | | | | | | | | | | | | | | | | | | | | | | | | | | |
| | | Investor B | |
| | Six Months Ended March 31, 2013 | | | Year Ended September 30, | | | Period November 1, 2008 to September 30, | | | Year Ended October 31, | |
| | (Unaudited) | | | 2012 | | | 2011 | | | 2010 | | | 2009 | | | 2008 | | | 2007 | |
|
| |
Per Share Operating Performance | | | | | | | | | | | | | | | | | | | | | | | | | | | | |
| |
Net asset value, beginning of period | | $ | 11.43 | | | $ | 8.93 | | | $ | 9.22 | | | $ | 8.82 | | | $ | 7.92 | | | $ | 13.57 | | | $ | 13.30 | |
| | | | |
Net investment income (loss)1 | | | 0.00 | 2 | | | 0.03 | | | | (0.04) | | | | (0.03) | | | | 0.01 | | | | (0.05) | | | | (0.10) | |
Net realized and unrealized gain (loss) | | | 1.13 | | | | 2.47 | | | | (0.25) | | | | 0.45 | | | | 0.89 | | | | (5.23) | | | | 1.69 | |
| | | | |
Net increase (decrease) from investment operations | | | 1.13 | | | | 2.50 | | | | (0.29) | | | | 0.42 | | | | 0.90 | | | | (5.28) | | | | 1.59 | |
| | | | |
Dividends and distributions from: | | | | | | | | | | | | | | | | | | | | | | | | | | | | |
Net investment income | | | (0.04) | | | | — | | | | — | | | | (0.02) | 3 | | | — | | | | — | | | | — | |
Net realized gain | | | — | | | | — | | | | — | | | | — | | | | — | | | | (0.37) | 3 | | | (1.32)3 | |
| | | | |
Total dividends and distributions | | | (0.04) | | | | — | | | | — | | | | (0.02) | | | | — | | | | (0.37) | | | | (1.32) | |
| | | | |
Net asset value, end of period | | $ | 12.52 | | | $ | 11.43 | | | $ | 8.93 | | | $ | 9.22 | | | $ | 8.82 | | | $ | 7.92 | | | $ | 13.57 | |
| | | | |
|
| |
| |
Total Investment Return4 | | | | | | | | | | | | | | | | | | | | | | | | | | | | |
| |
Based on net asset value | | | 9.88% | 5 | | | 28.00% | | | | (3.15)% | | | | 4.71% | | | | 11.36% | 5,6 | | | (39.90)% | | | | 12.30% | |
| | | | |
|
| |
| |
Ratios to Average Net Assets7 | | | | | | | | | | | | | | | | | | | | | | | | | | | | |
| |
Total expenses | | | 2.33% | 8,9 | | | 2.18% | 9 | | | 2.14% | 9 | | | 2.16% | | | | 2.25% | 8 | | | 2.04% | | | | 1.94% | |
| | | | |
Total expenses after fees waived and reimbursed | | | 1.97% | 8,9 | | | 1.96% | 9 | | | 1.97% | 9 | | | 1.97% | | | | 1.91% | 8 | | | 1.88% | | | | 1.93% | |
| | | | |
Net investment income (loss) | | | 0.02% | 8,9 | | | 0.24% | 9 | | | (0.34)% | 9 | | | (0.35)% | | | | 0.18% | 8 | | | (0.45)% | | | | (0.78)% | |
| | | | |
|
| |
| |
Supplemental Data | | | | | | | | | | | | | | | | | | | | | | | | | | | | |
| |
Net assets, end of period (000) | | $ | 28,155 | | | $ | 33,719 | | | $ | 47,836 | | | $ | 78,876 | | | $ | 119,910 | | | $ | 180,730 | | | $ | 494,478 | |
| | | | |
Portfolio turnover of the Fund | | | — | | | | — | | | | — | | | | — | | | | — | | | | — | | | | 0%10 | |
| | | | |
Portfolio turnover of the Portfolio | | | 29% | | | | 128% | | | | 129% | | | | 173% | | | | 168% | | | | 109% | | | | 96% | |
| | | | |
| | 1 | Based on average shares outstanding. |
| | 2 | Amount is less than $0.005 per share. |
| | 3 | Dividends and distributions are determined in accordance with federal income tax regulations. |
| | 4 | Where applicable, total investment returns include the reinvestment of dividends and distributions. |
| | 5 | Aggregate total investment return. |
| | 6 | Includes proceeds received from a settlement of litigation, through its investment in the Portfolio, which impacted the Fund’s total investment return. Not including these proceeds, the total investment return would have been 10.86%. |
| | 7 | Includes the Fund’s share of the Portfolio’s allocated expenses and/or net investment income. |
| | 9 | Includes the Fund’s share of the Portfolio’s allocated fees waived of less than 0.01%. |
| | 10 | BlackRock Large Cap Core Fund (the “Fund”). |
| | | | | | |
See Notes to Financial Statements. | | | | |
| | | | | | | |
| 38 | | BLACKROCK LARGE CAP SERIES FUNDS, INC. | | MARCH 31, 2013 | | |
| | |
| | |
Financial Highlights (continued) | | BlackRock Large Cap Core Fund |
| | | | | | | | | | | | | | | | | | | | | | | | | | | | |
| | | Investor C | |
| | Six Months Ended March 31, 2013 | | | Year Ended September 30, | | | Period November 1, 2008 to September 30, | | | Year Ended October 31, | |
| | (Unaudited) | | | 2012 | | | 2011 | | | 2010 | | | 2009 | | | 2008 | | | 2007 | |
|
| |
Per Share Operating Performance | | | | | | | | | | | | | | | | | | | | | | | | | | | | |
| |
Net asset value, beginning of period | | $ | 11.31 | | | $ | 8.85 | | | $ | 9.13 | | | $ | 8.76 | | | $ | 7.88 | | | $ | 13.51 | | | $ | 13.26 | |
| | | | |
Net investment income (loss)1 | | | (0.00) | 2 | | | 0.02 | | | | (0.04) | | | | (0.04) | | | | (0.00) | 2 | | | (0.06) | | | | (0.11) | |
Net realized and unrealized gain (loss) | | | 1.11 | | | | 2.44 | | | | (0.24) | | | | 0.44 | | | | 0.88 | | | | (5.20) | | | | 1.71 | |
| | | | |
Net increase (decrease) from investment operations | | | 1.11 | | | | 2.46 | | | | (0.28) | | | | 0.40 | | | | 0.88 | | | | (5.26) | | | | 1.60 | |
| | | | |
Dividends and distributions from: | | | | | | | | | | | | | | | | | | | | | | | | | | | | |
Net investment income | | | (0.08) | | | | — | | | | — | | | | (0.03) | 3 | | | — | | | | — | | | | — | |
Net realized gain | | | — | | | | — | | | | — | | | | — | | | | — | | | | (0.37) | 3 | | | (1.35)3 | |
| | | | |
Total dividends and distributions | | | (0.08) | | | | — | | | | — | | | | (0.03) | | | | — | | | | (0.37) | | | | (1.35) | |
| | | | |
Net asset value, end of period | | $ | 12.34 | | | $ | 11.31 | | | $ | 8.85 | | | $ | 9.13 | | | $ | 8.76 | | | $ | 7.88 | | | $ | 13.51 | |
| | | | |
|
| |
| |
Total Investment Return4 | | | | | | | | | | | | | | | | | | | | | | | | | | | | |
| |
Based on net asset value | | | 9.89% | 5 | | | 27.80% | | | | (3.07)% | | | | 4.51% | | | | 11.17% | 5,6 | | | (39.93)% | | | | 12.40% | |
| | | | |
|
| |
| |
Ratios to Average Net Assets7 | | | | | | | | | | | | | | | | | | | | | | | | | | | | |
| |
Total expenses | | | 2.04% | 8,9 | | | 1.97% | 9,10 | | | 2.00% | 9 | | | 2.02% | | | | 2.09% | 8 | | | 1.97% | | | | 1.93% | |
| | | | |
Total expenses after fees waived and reimbursed | | | 2.04% | 8,9 | | | 1.97% | 9,10 | | | 2.00% | 9 | | | 2.02% | | | | 2.09% | 8 | | | 1.97% | | | | 1.93% | |
| | | | |
Net investment income (loss) | | | (0.06)% | 8,9 | | | 0.22% | 9,10 | | | (0.38)% | 9 | | | (0.41)% | | | | (0.03)% | 8 | | | (0.54)% | | | | (0.79)% | |
| | | | |
|
| |
| |
Supplemental Data | | | | | | | | | | | | | | | | | | | | | | | | | | | | |
| |
Net assets, end of period (000) | | $ | 364,876 | | | $ | 363,613 | | | $ | 393,172 | | | $ | 594,396 | | | $ | 662,591 | | | $ | 714,368 | | | $ | 1,447,336 | |
| | | | |
Portfolio turnover of the Fund | | | — | | | | — | | | | — | | | | — | | | | — | | | | — | | | | 0%11 | |
| | | | |
Portfolio turnover of the Portfolio | | | 29% | | | | 128% | | | | 129% | | | | 173% | | | | 168% | | | | 109% | | | | 96% | |
| | | | |
| | 1 | Based on average shares outstanding. |
| | 2 | Amount is greater than $(0.005) per share. |
| | 3 | Dividends and distributions are determined in accordance with federal income tax regulations. |
| | 4 | Where applicable, total investment returns include the reinvestment of dividends and distributions. |
| | 5 | Aggregate total investment return. |
| | 6 | Includes proceeds received from a settlement of litigation, through its investment in the Portfolio, which impacted the Fund’s total investment return. Not including these proceeds, the total investment return would have been 10.66%. |
| | 7 | Includes the Fund’s share of the Portfolio’s allocated expenses and/or net investment income. |
| | 9 | Includes the Fund’s share of the Portfolio’s allocated fees waived of less than 0.01%. |
| | 10 | Includes a non-recurring expense adjustment, which impacted the ratios for total expenses, total expenses after fees waived and/or reimbursed and net investment income. Excluding this adjustment, the ratios would have been 2.05%, 2.05% and 0.14%, respectively. |
| | 11 | BlackRock Large Cap Core Fund (the “Fund”). |
| | | | | | |
See Notes to Financial Statements. | | | | |
| | | | | | | |
| | BLACKROCK LARGE CAP SERIES FUNDS, INC. | | MARCH 31, 2013 | | 39 |
| | |
| | |
Financial Highlights (concluded) | | BlackRock Large Cap Core Fund |
| | | | | | | | | | | | | | | | | | | | | | | | | | | | |
| | | Class R | |
| | | Six Months
Ended
March 31,
2013 | | | Year Ended September 30, | | | Period
November 1,
2008 to
September 30, | | | Year Ended October 31, | |
| | | (Unaudited) | | | 2012 | | | 2011 | | | 2010 | | | 2009 | | | 2008 | | | 2007 | |
|
| |
Per Share Operating Performance | | | | | | | | | | | | | | | | | | | | | | | | | | | | |
| |
Net asset value, beginning of period | | $ | 11.81 | | | $ | 9.19 | | | $ | 9.46 | | | $ | 9.06 | | | $ | 8.11 | | | $ | 13.85 | | | $ | 13.56 | |
| | | | |
Net investment income (loss)1 | | | 0.03 | | | | 0.07 | | | | 0.01 | | | | 0.01 | | | | 0.03 | | | | (0.01) | | | | (0.05) | |
Net realized and unrealized gain (loss) | | | 1.16 | | | | 2.55 | | | | (0.26) | | | | 0.45 | | | | 0.92 | | | | (5.35) | | | | 1.75 | |
| | | | |
Net increase (decrease) from investment operations | | | 1.19 | | | | 2.62 | | | | (0.25) | | | | 0.46 | | | | 0.95 | | | | (5.36) | | | | 1.70 | |
| | | | |
Dividends and distributions from: | | | | | | | | | | | | | | | | | | | | | | | | | | | | |
Net investment income | | | (0.15) | | | | — | | | | (0.02) | 2 | | | (0.06) | 2 | | | — | | | | — | | | | — | |
Net realized gain | | | — | | | | — | | | | — | | | | — | | | | — | | | | (0.38) | 2 | | | (1.41)2 | |
| | | | |
Total dividends and distributions | | | (0.15) | | | | — | | | | (0.02) | | | | (0.06) | | | | — | | | | (0.38) | | | | (1.41) | |
| | | | |
Net asset value, end of period | | $ | 12.85 | | | $ | 11.81 | | | $ | 9.19 | | | $ | 9.46 | | | $ | 9.06 | | | $ | 8.11 | | | $ | 13.85 | |
| | | | |
|
| |
| |
Total Investment Return3 | | | | | | | | | | | | | | | | | | | | | | | | | | | | |
| |
Based on net asset value | | | 10.17% | 4 | | | 28.51% | | | | (2.68)% | | | | 5.09% | | | | 11.71% | 4,5 | | | (39.71)% | | | | 12.90% | |
| | | | |
|
| |
| |
Ratios to Average Net Assets6 | | | | | | | | | | | | | | | | | | | | | | | | | | | | |
| |
Total expenses | | | 1.53% | 7,8 | | | 1.53% | 8 | | | 1.51% | 8 | | | 1.54% | | | | 1.61% | 7 | | | 1.54% | | | | 1.45% | |
| | | | |
Total expenses after fees waived and reimbursed | | | 1.53% | 7,8 | | | 1.53% | 8 | | | 1.51% | 8 | | | 1.54% | | | | 1.61% | 7 | | | 1.54% | | | | 1.45% | |
| | | | |
Net investment income (loss) | | | 0.45% | 7,8 | | | 0.66% | 8 | | | 0.12% | 8 | | | 0.07% | | | | 0.44% | 7 | | | (0.12)% | | | | (0.33)% | |
| | | | |
|
| |
| |
Supplemental Data | | | | | | | | | | | | | | | | | | | | | | | | | | | | |
| |
Net assets, end of period (000) | | $ | 45,318 | | | $ | 48,790 | | | $ | 49,665 | | | $ | 80,950 | | | $ | 95,098 | | | $ | 97,139 | | | $ | 160,861 | |
| | | | |
Portfolio turnover of the Fund | | | — | | | | — | | | | — | | | | — | | | | — | | | | — | | | | 0%9 | |
| | | | |
Portfolio turnover of the Portfolio | | | 29% | | | | 128% | | | | 129% | | | | 173% | | | | 168% | | | | 109% | | | | 96% | |
| | | | |
| | 1 | Based on average shares outstanding. |
| | 2 | Dividends and distributions are determined in accordance with federal income tax regulations. |
| | 3 | Where applicable, total investment returns include the reinvestment of dividends and distributions. |
| | 4 | Aggregate total investment return. |
| | 5 | Includes proceeds received from a settlement of litigation, through its investment in the Portfolio, which impacted the Fund’s total investment return. Not including these proceeds, the total investment return would have been 11.22%. |
| | 6 | Includes the Fund’s share of the Portfolio’s allocated expenses and/or net investment income. |
| | 8 | Includes the Fund’s share of the Portfolio’s allocated fees waived of less than 0.01%. |
| | 9 | BlackRock Large Cap Core Fund (the “Fund”). |
| | | | | | |
See Notes to Financial Statements. | | | | |
| | | | | | | |
| 40 | | BLACKROCK LARGE CAP SERIES FUNDS, INC. | | MARCH 31, 2013 | | |
| | |
| | |
Financial Highlights | | BlackRock Large Cap Growth Fund |
| | | | | | | | | | | | | | | | | | | | | | | | | | | | |
| | | Institutional | |
| | | Six Months
Ended
March 31,
2013 | | | Year Ended September 30, | | | Period
November 1,
2008 to
September 30, | | | Year Ended October 31, | |
| | | (Unaudited) | | | 2012 | | | 2011 | | | 2010 | | | 2009 | | | 2008 | | | 2007 | |
|
| |
Per Share Operating Performance | | | | | | | | | | | | | | | | | | | | | | | | | | | | |
| |
Net asset value, beginning of period | | $ | 12.50 | | | $ | 9.57 | | | $ | 9.54 | | | $ | 8.92 | | | $ | 7.43 | | | $ | 12.40 | | | $ | 10.63 | |
| | | | |
Net investment income (loss)1 | | | 0.06 | | | | 0.14 | | | | 0.06 | | | | 0.03 | | | | 0.02 | | | | 0.02 | | | | (0.02) | |
Net realized and unrealized gain (loss) | | | 0.47 | | | | 2.83 | | | | (0.03) | | | | 0.62 | | | | 1.47 | | | | (4.67) | | | | 1.83 | |
| | | | |
Net increase (decrease) from investment operations | | | 0.53 | | | | 2.97 | | | | 0.03 | | | | 0.65 | | | | 1.49 | | | | (4.65) | | | | 1.81 | |
| | | | |
Dividends and distributions from: | | | | | | | | | | | | | | | | | | | | | | | | | | | | |
Net investment income | | | (0.24) | | | | (0.04) | 2 | | | — | | | | (0.03) | 2 | | | — | | | | — | | | | — | |
Net realized gain | | | (0.69) | | | | — | | | | — | | | | — | | | | — | | | | (0.32) | 2 | | | (0.04)2 | |
| | | | |
Total dividends and distributions | | | (0.93) | | | | (0.04) | | | | — | | | | (0.03) | | | | — | | | | (0.32) | | | | (0.04) | |
| | | | |
Net asset value, end of period | | $ | 12.10 | | | $ | 12.50 | | | $ | 9.57 | | | $ | 9.54 | | | $ | 8.92 | | | $ | 7.43 | | | $ | 12.40 | |
| | | | |
|
| |
| |
Total Investment Return3 | | | | | | | | | | | | | | | | | | | | | | | | | | | | |
| |
Based on net asset value | | | 4.77% | 4 | | | 31.16% | | | | 0.31% | | | | 7.25% | | | | 20.05% | 4,5 | | | (38.41)% | | | | 17.07% | |
| | | | |
|
| |
| |
Ratios to Average Net Assets6 | | | | | | | | | | | | | | | | | | | | | | | | | | | | |
| |
Total expenses | | | 0.99% | 7,8 | | | 0.97% | 8 | | | 0.96% | 8 | | | 1.01% | | | | 1.07% | 7 | | | 0.96% | | | | 0.95% | |
Net investment income (loss) | | | 1.05% | 7,8 | | | 1.19% | 8 | | | 0.52% | 8 | | | 0.28% | | | | 0.35% | 7 | | | 0.21% | | | | (0.16)% | |
| | | | |
|
| |
| |
Supplemental Data | | | | | | | | | | | | | | | | | | | | | | | | | | | | |
| |
Net assets, end of period (000) | | $ | 316,395 | | | $ | 267,083 | | | $ | 300,111 | | | $ | 66,857 | | | $ | 87,078 | | | $ | 118,873 | | | $ | 368,001 | |
| | | | |
Portfolio turnover of the Portfolio | | | 29% | | | | 132% | | | | 169% | | | | 232% | | | | 242% | | | | 144% | | | | 87% | |
| | | | |
| | 1 | Based on average shares outstanding. |
| | 2 | Dividends and distributions are determined in accordance with federal income tax regulations. |
| | 3 | Where applicable, total investment returns include the reinvestment of dividends and distributions. |
| | 4 | Aggregate total investment return. |
| | 5 | Includes proceeds received from a settlement of litigation, through its investment in the Portfolio, which impacted the Fund’s total investment return. Not including these proceeds, the total investment return would have been 19.79%. |
| | 6 | Includes the Fund’s share of the Portfolio’s allocated expenses and/or net investment income. |
| | 8 | Includes the Fund’s share of the Portfolio’s allocated fees waived of less than 0.01%. |
| | | | | | |
See Notes to Financial Statements. | | | | |
| | | | | | | |
| | BLACKROCK LARGE CAP SERIES FUNDS, INC. | | MARCH 31, 2013 | | 41 |
| | |
| | |
Financial Highlights (continued) | | BlackRock Large Cap Growth Fund |
| | | | | | | | | | | | | | | | | | | | | | | | | | | | |
| | | Service | |
| | | Six Months Ended March 31, 2013 | | | Year Ended September 30, | | | Period
November 1,
2008 to
September 30, | | | Year Ended October 31, | |
| | | (Unaudited) | | | 2012 | | | 2011 | | | 2010 | | | 2009 | | | 2008 | | | 2007 | |
|
| |
Per Share Operating Performance | | | | | | | | | | | | | | | | | | | | | | | | | | | | |
| |
Net asset value, beginning of period | | $ | 12.38 | | | $ | 9.48 | | | $ | 9.47 | | | $ | 8.87 | | | $ | 7.39 | | | $ | 12.37 | | | $ | 10.62 | |
| | | | |
Net investment income (loss)1 | | | 0.05 | | | | 0.09 | | | | 0.03 | | | | 0.01 | | | | 0.01 | | | | (0.01) | | | | (0.05) | |
Net realized and unrealized gain (loss) | | | 0.45 | | | | 2.82 | | | | (0.02) | | | | 0.61 | | | | 1.47 | | | | (4.65) | | | | 1.84 | |
| | | | |
Net increase (decrease) from investment operations | | | 0.50 | | | | 2.91 | | | | 0.01 | | | | 0.62 | | | | 1.48 | | | | (4.66) | | | | 1.79 | |
| | | | |
Dividends and distributions from: | | | | | | | | | | | | | | | | | | | | | | | | | | | | |
Net investment income | | | (0.20) | | | | (0.01) | 2 | | | — | | | | (0.02) | 2 | | | — | | | | — | | | | — | |
Net realized gain | | | (0.69) | | | | — | | | | — | | | | — | | | | — | | | | (0.32) | 2 | | | (0.04)2 | |
| | | | |
Total dividends and distributions | | | (0.89) | | | | (0.01) | | | | — | | | | (0.02) | | | | — | | | | (0.32) | | | | (0.04) | |
| | | | |
Net asset value, end of period | | $ | 11.99 | | | $ | 12.38 | | | $ | 9.48 | | | $ | 9.47 | | | $ | 8.87 | | | $ | 7.39 | | | $ | 12.37 | |
| | | | |
|
| |
| |
Total Investment Return3 | | | | | | | | | | | | | | | | | | | | | | | | | | | | |
| |
Based on net asset value | | | 4.60% | 4 | | | 30.67% | | | | 0.11% | | | | 6.97% | | | | 20.03% | 4,5 | | | (38.59)% | | | | 16.89%4 | |
| | | | |
|
| |
| |
Ratios to Average Net Assets6 | | | | | | | | | | | | | | | | | | | | | | | | | | | | |
| |
Total expenses | | | 1.24% | 7,8 | | | 1.33% | 8 | | | 1.16% | 8 | | | 1.22% | | | | 1.22% | 7 | | | 1.14% | | | | 1.20% | |
| | | | |
Net investment income (loss) | | | 0.82% | 7,8 | | | 0.81% | 8 | | | 0.29% | 8 | | | 0.07% | | | | 0.16% | 7 | | | (0.07)% | | | | (0.42)% | |
| | | | |
|
| |
| |
Supplemental Data | | | | | | | | | | | | | | | | | | | | | | | | | | | | |
| |
Net assets, end of period (000) | | $ | 11,266 | | | $ | 11,865 | | | $ | 10,734 | | | $ | 11,299 | | | $ | 11,392 | | | $ | 10,218 | | | $ | 11,134 | |
| | | | |
Portfolio turnover of the Portfolio | | | 29% | | | | 132% | | | | 169% | | | | 232% | | | | 242% | | | | 144% | | | | 87% | |
| | | | |
| | 1 | Based on average shares outstanding. |
| | 2 | Dividends and distributions are determined in accordance with federal income tax regulations. |
| | 3 | Where applicable, total investment returns include the reinvestment of dividends and distributions. |
| | 4 | Aggregate total investment return. |
| | 5 | Includes proceeds received from a settlement of litigation, through its investment in the Portfolio, which impacted the Fund’s total investment return. Not including these proceeds, the total investment return would have been 19.62%. |
| | 6 | Includes the Fund’s share of the Portfolio’s allocated expenses and/or net investment income. |
| | 8 | Includes the Fund’s share of the Portfolio’s allocated fees waived of less than 0.01%. |
| | | | | | |
See Notes to Financial Statements. | | | | |
| | | | | | | |
| 42 | | BLACKROCK LARGE CAP SERIES FUNDS, INC. | | MARCH 31, 2013 | | |
| | |
| | |
Financial Highlights (continued) | | BlackRock Large Cap Growth Fund |
| | | | | | | | | | | | | | | | | | | | | | | | | | | | |
| | | Investor A | |
| | | Six Months
Ended
March 31,
2013 | | | Year Ended September 30, | | | Period
November 1,
2008 to
September 30, | | | Year Ended October 31, | |
| | | (Unaudited) | | | 2012 | | | 2011 | | | 2010 | | | 2009 | | | 2008 | | | 2007 | |
|
| |
Per Share Operating Performance | |
| |
Net asset value, beginning of period | | $ | 12.09 | | | $ | 9.26 | | | $ | 9.26 | | | $ | 8.68 | | | $ | 7.24 | | | $ | 12.15 | | | $ | 10.44 | |
| | | | |
Net investment income (loss)1 | | | 0.05 | | | | 0.10 | | | | 0.02 | | | | (0.00) | 2 | | | (0.00) | 2 | | | (0.02) | | | | (0.05) | |
Net realized and unrealized gain (loss) | | | 0.44 | | | | 2.75 | | | | (0.02) | | | | 0.60 | | | | 1.44 | | | | (4.57) | | | | 1.80 | |
| | | | |
Net increase (decrease) from investment operations | | | 0.49 | | | | 2.85 | | | | — | | | | 0.60 | | | | 1.44 | | | | (4.59) | | | | 1.75 | |
| | | | |
Dividends and distributions from: | | | | | | | | | | | | | | | | | | | | | | | | | | | | |
Net investment income | | | (0.22) | | | | (0.02) | 3 | | | — | | | | (0.02) | 3 | | | — | | | | — | | | | — | |
Net realized gain | | | (0.69) | | | | — | | | | — | | | | — | | | | — | | | | (0.32) | 3 | | | (0.04)3 | |
| | | | |
Total dividends and distributions | | | (0.91) | | | | (0.02) | | | | — | | | | (0.02) | | | | — | | | | (0.32) | | | | (0.04) | |
| | | | |
Net asset value, end of period | | $ | 11.67 | | | $ | 12.09 | | | $ | 9.26 | | | $ | 9.26 | | | $ | 8.68 | | | $ | 7.24 | | | $ | 12.15 | |
| | | | |
|
| |
Total Investment Return4 | |
| |
Based on net asset value | | | 4.59% | 5 | | | 30.78% | | | | 0.00% | | | | 6.86% | | | | 19.89% | 5,6 | | | (38.72)% | | | | 16.80% | |
| | | | |
| |
|
| |
Ratios to Average Net Assets7 | |
| |
Total expenses | | | 1.26% | 8,9 | | | 1.26% | 9 | | | 1.27% | 9 | | | 1.31% | | | | 1.39% | 8 | | | 1.31% | | | | 1.27% | |
| | | | |
Net investment income (loss) | | | 0.80% | 8,9 | | | 0.90% | 9 | | | 0.21% | 9 | | | (0.01)% | | | | (0.02)% | 8 | | | (0.21)% | | | | (0.46)% | |
| | | | |
|
| |
Supplemental Data | |
| |
Net assets, end of period (000) | | $ | 417,318 | | | $ | 405,154 | | | $ | 318,230 | | | $ | 254,354 | | | | 267,606 | | | $ | 179,528 | | | $ | 327,501 | |
| | | | |
Portfolio turnover of the Portfolio | | | 29% | | | | 132% | | | | 169% | | | | 232% | | | | 242% | | | | 144% | | | | 87% | |
| | | | |
| | 1 | Based on average shares outstanding. |
| | 2 | Amount is greater than $(0.005) per share. |
| | 3 | Dividends and distributions are determined in accordance with federal income tax regulations. |
| | 4 | Where applicable, total investment returns include the reinvestment of dividends and distributions. |
| | 5 | Aggregate total investment return. |
| | 6 | Includes proceeds received from a settlement of litigation, through its investment in the Portfolio, which impacted the Fund’s total investment return. Not including these proceeds, the total investment return would have been 19.47%. |
| | 7 | Includes the Fund’s share of the Portfolio’s allocated expenses and/or net investment income. |
| | 9 | Includes the Fund’s share of the Portfolio’s allocated fees waived of less than 0.01%. |
| | | | | | |
See Notes to Financial Statements. | | | | |
| | | | | | | |
| | BLACKROCK LARGE CAP SERIES FUNDS, INC. | | MARCH 31, 2013 | | 43 |
| | |
| | |
Financial Highlights (continued) | | BlackRock Large Cap Growth Fund |
| | | | | | | | | | | | | | | | | | | | | | | | | | | | |
| | | Investor B | |
| | | Six Months
Ended
March 31,
2013 | | | Year Ended September 30, | | | Period
November 1,
2008 to
September 30, 2009 | | | Year Ended October 31, | |
| | | (Unaudited) | | | 2012 | | | 2011 | | | 2010 | | | | 2008 | | | 2007 | |
|
| |
Per Share Operating Performance | |
| |
Net asset value, beginning of period | | $ | 10.96 | | | $ | 8.45 | | | $ | 8.52 | | | $ | 8.03 | | | $ | 6.75 | | | $ | 11.43 | | | $ | 9.91 | |
| | | | |
Net investment income (loss)1 | | | (0.01) | | | | (0.00) | 2 | | | (0.06) | | | | (0.07) | | | | (0.05) | | | | (0.09) | | | | (0.13) | |
Net realized and unrealized gain (loss) | | | 0.40 | | | | 2.51 | | | | (0.01) | | | | 0.56 | | | | 1.33 | | | | (4.27) | | | | 1.69 | |
| | | | |
Net increase (decrease) from investment operations | | | 0.39 | | | | 2.51 | | | | (0.07) | | | | 0.49 | | | | 1.28 | | | | (4.36) | | | | 1.56 | |
| | | | |
Dividends and distributions from: | | | | | | | | | | | | | | | | | | | | | | | | | | | | |
Net investment income | | | (0.10) | | | | — | | | | — | | | | — | | | | — | | | | — | | | | — | |
Net realized gain | | | (0.69) | | | | — | | | | — | | | | — | | | | — | | | | (0.32) | 3 | | | (0.04) | 3 |
| | | | |
Total dividends and distributions | | | (0.79) | | | | — | | | | — | | | | — | | | | — | | | | (0.32) | | | | (0.04) | |
| | | | |
Net asset value, end of period | | $ | 10.56 | | | $ | 10.96 | | | $ | 8.45 | | | $ | 8.52 | | | $ | 8.03 | | | $ | 6.75 | | | $ | 11.43 | |
| | | | |
|
| |
Total Investment Return4 | |
| |
Based on net asset value | | | 4.06% | 5 | | | 29.70% | | | | (0.82)% | | | | 6.10% | | | | 18.96% | 5,6 | | | (39.15)% | | | | 15.78% | |
| | | | |
|
| |
Ratios to Average Net Assets7 | |
| |
Total expenses | | | 2.17% | 8,9 | | | 2.13% | 9 | | | 2.08% | 9 | | | 2.11% | | | | 2.17% | 8 | | | 2.05% | | | | 2.08% | |
| | | | |
Net investment loss | | | (0.10)% | 8,9 | | | (0.01)% | 9 | | | (0.61)% | 9 | | | (0.81)% | | | | (0.75)% | 8 | | | (0.93)% | | | | (1.26)% | |
| | | | |
|
| |
Supplemental Data | |
| |
Net assets, end of period (000) | | $ | 6,129 | | | $ | 7,826 | | | $ | 10,372 | | | $ | 14,937 | | | $ | 26,959 | | | $ | 39,608 | | | $ | 105,513 | |
| | | | |
Portfolio turnover of the Portfolio | | | 29% | | | | 132% | | | | 169% | | | | 232% | | | | 242% | | | | 144% | | | | 87% | |
| | | | |
| | 1 | Based on average shares outstanding. |
| | 2 | Amount is greater than $(0.005) per share. |
| | 3 | Distributions are determined in accordance with federal income tax regulations. |
| | 4 | Where applicable, total investment returns include the reinvestment of dividends and distributions. |
| | 5 | Aggregate total investment return. |
| | 6 | Includes proceeds received from a settlement of litigation, through its investment in the Portfolio, which impacted the Fund’s total investment return. Not including these proceeds, the total investment return would have been 18.66%. |
| | 7 | Includes the Fund’s share of the Portfolio’s allocated expenses and/or net investment income. |
| | 9 | Includes the Fund’s share of the Portfolio’s allocated fees waived of less than 0.01%. |
| | | | | | |
See Notes to Financial Statements. | | | | |
| | | | | | | |
| 44 | | BLACKROCK LARGE CAP SERIES FUNDS, INC. | | MARCH 31, 2013 | | |
| | |
| | |
Financial Highlights (continued) | | BlackRock Large Cap Growth Fund |
| | | | | | | | | | | | | | | | | | | | | | | | | | | | |
| | | Investor C | |
| | | Six Months
Ended
March 31,
2013 | | | Year Ended September 30, | | | Period
November 1,
2008 to
September 30, 2009 | | | Year Ended October 31, | |
| | | (Unaudited) | | | 2012 | | | 2011 | | | 2010 | | | | 2008 | | | 2007 | |
| |
Per Share Operating Performance | |
| |
Net asset value, beginning of period | | $ | 10.95 | | | $ | 8.44 | | | $ | 8.51 | | | $ | 8.03 | | | $ | 6.75 | | | $ | 11.42 | | | $ | 9.90 | |
| | | | |
Net investment income (loss)1 | | | 0.00 | 2 | | | 0.01 | | | | (0.06 | ) | | | (0.07 | ) | | | (0.05 | ) | | | (0.09 | ) | | | (0.13 | ) |
Net realized and unrealized gain (loss) | | | 0.40 | | | | 2.50 | | | | (0.01 | ) | | | 0.55 | | | | 1.33 | | | | (4.26 | ) | | | 1.69 | |
| | | | |
Net increase (decrease) from investment operations | | | 0.40 | | | | 2.51 | | | | (0.07 | ) | | | 0.48 | | | | 1.28 | | | | (4.35 | ) | | | 1.56 | |
| | | | |
Dividends and distributions from: | | | | | | | | | | | | | | | | | | | | | | | | | | | | |
Net investment income | | | (0.13 | ) | | | — | | | | — | | | | — | | | | — | | | | — | | | | — | |
Net realized gain | | | (0.69 | ) | | | — | | | | — | | | | — | | | | — | | | | (0.32 | )3 | | | (0.04 | )3 |
| | | | |
Total dividends and distributions | | | (0.82 | ) | | | — | | | | — | | | | — | | | | — | | | | (0.32 | ) | | | (0.04 | ) |
| | | | |
Net asset value, end of period | | $ | 10.53 | | | $ | 10.95 | | | $ | 8.44 | | | $ | 8.51 | | | $ | 8.03 | | | $ | 6.75 | | | $ | 11.42 | |
| | | | |
|
| |
Total Investment Return4 | |
| |
Based on net asset value | | | 4.22% | 5 | | | 29.74% | | | | (0.82)% | | | | 5.98% | | | | 18.96% | 5,6 | | | (39.10 | )% | | | 15.79% | |
| |
| | | | |
|
| |
Ratios to Average Net Assets7 | |
| |
Total expenses | | | 2.05% | 8,9 | | | 2.07% | 9 | | | 2.05% | 9 | | | 2.12% | | | | 2.20% | 8 | | | 2.05% | | | | 2.04% | |
| | | | |
Net investment income (loss) | | | 0.01% | 8,9 | | | 0.09% | 9 | | | (0.60)% | 9 | | | (0.82)% | | | | (0.81)% | 8 | | | (0.95)% | | | | (1.24)% | |
| | | | |
|
| |
Supplemental Data | |
| |
Net assets, end of period (000) | | $ | 163,851 | | | $ | 167,518 | | | $ | 129,227 | | | $ | 121,936 | | | $ | 142,215 | | | $ | 143,081 | | | $ | 280,142 | |
| | | | |
Portfolio turnover of the Portfolio | | | 29% | | | | 132% | | | | 169% | | | | 232% | | | | 242% | | | | 144% | | | | 87% | |
| | | | |
| | 1 | Based on average shares outstanding. |
| | 2 | Amount is less than $0.005 per share. |
| | 3 | Distributions are determined in accordance with federal income tax regulations. |
| | 4 | Where applicable, total investment returns include the reinvestment of dividends and distributions. |
| | 5 | Aggregate total investment return. |
| | 6 | Includes proceeds received from a settlement of litigation, through its investment in the Portfolio, which impacted the Fund’s total investment return. Not including these proceeds, the total investment return would have been 18.52%. |
| | 7 | Includes the Fund’s share of the Portfolio’s allocated expenses and/or net investment income. |
| | 9 | Includes the Fund’s share of the Portfolio’s allocated fees waived of less than 0.01%. |
| | | | | | |
See Notes to Financial Statements. | | | | |
| | | | | | | |
| | BLACKROCK LARGE CAP SERIES FUNDS, INC. | | MARCH 31, 2013 | | 45 |
| | |
| | |
Financial Highlights (concluded) | | BlackRock Large Cap Growth Fund |
| | | | | | | | | | | | | | | | | | | | | | | | | | | | |
| | | Class R | |
| | | Six Months
Ended March 31, 2013 | | | Year Ended September 30, | | | Period
November 1,
2008 to
September 30, | | | Year Ended October 31, | |
| | | (Unaudited) | | | 2012 | | | 2011 | | | 2010 | | | 2009 | | | 2008 | | | 2007 | |
Per Share Operating Performance | | | | | | | | | | | | | | | | | | | | | | | | | | | | |
Net asset value, beginning of period | | $ | 11.58 | | | $ | 8.88 | | | $ | 8.91 | | | $ | 8.36 | | | $ | 7.00 | | | $ | 11.79 | | | $ | 10.17 | |
Net investment income (loss)1 | | | 0.03 | | | | 0.06 | | | | (0.01 | ) | | | (0.03 | ) | | | (0.02 | ) | | | (0.05 | ) | | | (0.09 | ) |
Net realized and unrealized gain (loss) | | | 0.42 | | | | 2.64 | | | | (0.02 | ) | | | 0.58 | | | | 1.38 | | | | (4.42 | ) | | | 1.75 | |
Net increase (decrease) from investment operations | | | 0.45 | | | | 2.70 | | | | (0.03 | ) | | | 0.55 | | | | 1.36 | | | | (4.47 | ) | | | 1.66 | |
Dividends and distributions from: | | | | | | | | | | | | | | | | | | | | | | | | | | | | |
Net investment income | | | (0.18 | ) | | | — | | | | — | | | | — | | | | — | | | | — | | | | — | |
Net realized gain | | | (0.69 | ) | | | — | | | | — | | | | — | | | | — | | | | (0.32 | )2 | | | (0.04 | )2 |
Total dividends and distributions | | | (0.87 | ) | | | — | | | | — | | | | — | | | | — | | | | (0.32 | ) | | | (0.04 | ) |
Net asset value, end of period | | $ | 11.16 | | | $ | 11.58 | | | $ | 8.88 | | | $ | 8.91 | | | $ | 8.36 | | | $ | 7.00 | | | $ | 11.79 | |
| | | | | | | | | | | | | | | | | | | | | | | | | | | | |
| | | | | | | | | | | | | |
Total Investment Return3 | | | | | | | | | | | | | | | | | | | | | | | | | | | | |
Based on net asset value | | | 4.41% | 4 | | | 30.41% | | | | (0.34)% | | | | 6.58% | | | | 19.43% | 4,5 | | | (38.88)% | | | | 16.36% | |
| | | | | | | | | | | | | | | | | | | | | | | | | | | | |
| | | | | | | | | | | | | |
Ratios to Average Net Assets6 | | | | | | | | | | | | | | | | | | | | | | | | | | | | |
Total expenses | | | 1.58% | 7,8 | | | 1.56% | 8 | | | 1.60% | 8 | | | 1.65% | | | | 1.76% | 7 | | | 1.64% | | | | 1.58% | |
Net investment income (loss) | | | 0.48% | 7,8 | | | 0.57% | 8 | | | (0.12)% | 8 | | | (0.35)% | | | | (0.37)% | 7 | | | (0.53)% | | | | (0.79)% | |
| | | | | | | | | | | | | | | | | | | | | | | | | | | | |
| | | | | | | | | | | | | |
Supplemental Data | | | | | | | | | | | | | | | | | | | | | | | | | | | | |
Net assets, end of period (000) | | $ | 26,670 | | | $ | 30,101 | | | $ | 30,868 | | | $ | 50,093 | | | $ | 62,231 | | | $ | 55,073 | | | $ | 95,637 | |
Portfolio turnover of the Portfolio | | | 29% | | | | 132% | | | | 169% | | | | 232% | | | | 242% | | | | 144% | | | | 87% | |
| | 1 | Based on average shares outstanding. |
| | 2 | Distributions are determined in accordance with federal income tax regulations. |
| | 3 | Where applicable, total investment returns include the reinvestment of dividends and distributions. |
| | 4 | Aggregate total investment return. |
| | 5 | Includes proceeds received from a settlement of litigation, through its investment in the Portfolio, which impacted the Fund’s total investment return. Not including these proceeds, the total investment return would have been 19.15%. |
| | 6 | Includes the Fund’s share of the Portfolio’s allocated expenses and/or net investment income. |
| | 8 | Includes the Fund’s share of the Portfolio’s allocated fees waived of less than 0.01%. |
| | | | | | |
See Notes to Financial Statements. | | | | |
| | | | | | | |
| 46 | | BLACKROCK LARGE CAP SERIES FUNDS, INC. | | MARCH 31, 2013 | | |
| | |
| | |
Financial Highlights | | BlackRock Large Cap Value Fund |
| | | | | | | | | | | | | | | | | | | | | | | | | | | | |
| | | Institutional | |
| | Six Months Ended March 31, 2013 | | | Year Ended September 30, | | | Period
November 1, 2008 to September 30, | | | Year Ended October 31, | |
| | (Unaudited) | | | 2012 | | | 2011 | | | 2010 | | | 2009 | | | 2008 | | | 2007 | |
|
| |
Per Share Operating Performance | | | | | | | | | | | | | | | | | | | | | | | | | | | | |
| |
Net asset value, beginning of period | | $ | 15.75 | | | $ | 12.74 | | | $ | 13.51 | | | $ | 13.16 | | | $ | 12.29 | | | $ | 20.95 | | | $ | 18.96 | |
| | | | |
Net investment income1 | | | 0.11 | | | | 0.20 | | | | 0.12 | | | | 0.11 | | | | 0.14 | | | | 0.14 | | | | 0.12 | |
Net realized and unrealized gain (loss) | | | 2.18 | | | | 2.94 | | | | (0.75) | | | | 0.40 | | | | 0.90 | | | | (7.42) | | | | 2.19 | |
| | | | |
Net increase (decrease) from investment operations | | | 2.29 | | | | 3.14 | | | | (0.63) | | | | 0.51 | | | | 1.04 | | | | (7.28) | | | | 2.31 | |
| | | | |
Dividends and distributions from: | | | | | | | | | | | | | | | | | | | | | | | | | | | | |
Net investment income | | | (0.36) | | | | (0.13) | 2 | | | (0.14) | 2 | | | (0.16) | 2 | | | (0.17) | 2 | | | (0.05) | 2 | | | (0.02)2 | |
Net realized gain | | | — | | | | — | | | | — | | | | — | | | | — | | | | (1.33) | 2 | | | (0.30)2 | |
| | | | |
Total dividends and distributions | | | (0.36) | | | | (0.13) | | | | (0.14) | | | | (0.16) | | | | (0.17) | | | | (1.38) | | | | (0.32) | |
| | | | |
Net asset value, end of period. | | $ | 17.68 | | | $ | 15.75 | | | $ | 12.74 | | | $ | 13.51 | | | $ | 13.16 | | | $ | 12.29 | | | $ | 20.95 | |
| | | | |
| | | |
| | | | | | | | | | | | | |
| |
| |
Total Investment Return3 | | | | | | | | | | | | | | | | | | | | | | | | | | | | |
| |
Based on net asset value | | | 14.78% | 4 | | | 24.84% | | | | (4.82)% | | | | 3.88% | | | | 8.60% | 4,5 | | | (37.01)% | | | | 12.35% | |
| | | | |
| | | |
| | | | | | | | | | | | | |
| |
Ratios to Average Net Assets6 | | | | | | | | | | | | | | | | | | | | | | | | | | | | |
| |
Total expenses. | | | 1.03% | 7 | | | 0.96% | | | | 1.03% | | | | 1.03% | | | | 1.05% | 7 | | | 0.93% | | | | 0.88% | |
| | | | |
Total expenses after fees waived and/or reimbursed | | | 1.00% | 7 | | | 0.95% | | | | 1.03% | | | | 1.03% | | | | 1.05% | 7 | | | 0.93% | | | | 0.88% | |
| | | | |
Net investment income | | | 1.31% | 7 | | | 1.33% | | | | 0.81% | | | | 0.85% | | | | 1.35% | 7 | | | 0.81% | | | | 0.59% | |
| | | | |
| | | |
| | | | | | | | | | | | | |
| |
Supplemental Data | | | | | | | | | | | | | | | | | | | | | | | | | | | | |
| |
Net assets, end of period (000) | | $ | 207,024 | | | $ | 251,764 | | | $ | 364,624 | | | $ | 737,610 | | | $ | 869,863 | | | $ | 867,750 | | | $ | 1,327,046 | |
| | | | |
Portfolio turnover of the Portfolio | | | 22% | | | | 147% | | | | 156% | | | | 183% | | | | 151% | | | | 108% | | | | 72% | |
| | | | |
| | 1 | Based on average shares outstanding. |
| | 2 | Dividends and distributions are determined in accordance with federal income tax regulations. |
| | 3 | Where applicable, total investment returns include the reinvestment of dividends and distributions. |
| | 4 | Aggregate total investment return. |
| | 5 | Includes proceeds received from a settlement of litigation, through its investment in the Portfolio, which impacted the Fund’s total investment return. Not including these proceeds, the total investment return would have been 8.18%. |
| | 6 | Includes the Fund’s share of the Portfolio’s allocated expenses and/or net investment income. |
| | | | | | |
See Notes to Financial Statements. | | | | |
| | | | | | | |
| | BLACKROCK LARGE CAP SERIES FUNDS, INC. | | MARCH 31, 2013 | | 47 |
| | |
| | |
Financial Highlights (continued) | | BlackRock Large Cap Value Fund |
| | | | | | | | | | | | | | | | | | | | | | | | | | | | |
| | | Service | |
| | | Six Months Ended March 31, 2013 | | | Year Ended September 30, | | | Period November 1, 2008 to September 30, | | | Year Ended October 31, | |
| | | (Unaudited) | | | 2012 | | | 2011 | | | 2010 | | | 2009 | | | 2008 | | | 2007 | |
Per Share Operating Performance | | | | | | | | | | | | | | | | | | | | | | | | | | | | |
Net asset value, beginning of period | | $ | 15.67 | | | $ | 12.71 | | | $ | 13.48 | | | $ | 13.13 | | | $ | 12.26 | | | $ | 20.89 | | | $ | 18.95 | |
Net investment income1 | | | 0.09 | | | | 0.15 | | | | 0.10 | | | | 0.09 | | | | 0.12 | | | | 0.10 | | | | 0.06 | |
Net realized and unrealized gain (loss) | | | 2.18 | | | | 2.94 | | | | (0.75 | ) | | | 0.40 | | | | 0.89 | | | | (7.38 | ) | | | 2.19 | |
Net increase (decrease) from investment operations | | | 2.27 | | | | 3.09 | | | | (0.65 | ) | | | 0.49 | | | | 1.01 | | | | (7.28 | ) | | | 2.25 | |
Dividends and distributions from: | | | | | | | | | | | | | | | | | | | | | | | | | | | | |
Net investment income | | | (0.31 | ) | | | (0.13 | )2 | | | (0.12 | )2 | | | (0.14 | )2 | | | (0.14 | )2 | | | (0.02 | )2 | | | (0.01 | )2 |
Net realized gain | | | — | | | | — | | | | — | | | | — | | | | — | | | | (1.33 | )2 | | | (0.30 | )2 |
Total dividends and distributions | | | (0.31 | ) | | | (0.13 | ) | | | (0.12 | ) | | | (0.14 | ) | | | (0.14 | ) | | | (1.35 | ) | | | (0.31 | ) |
Net asset value, end of period | | $ | 17.63 | | | $ | 15.67 | | | $ | 12.71 | | | $ | 13.48 | | | $ | 13.13 | | | $ | 12.26 | | | $ | 20.89 | |
| | | | | | | | | | | | | | | | | | | | | | | | | | | | |
| | | | | | | | | | | | | |
Total Investment Return3 | | | | | | | | | | | | | | | | | | | | | | | | | | | | |
Based on net asset value | | | 14.70% | 4 | | | 24.43% | | | | (4.95)% | | | | 3.75% | | | | 8.37% | 4,5 | | | (37.10)% | | | | 12.01% | |
| | | | | | | | | | | | | | | | | | | | | | | | | | | | |
| | | | | | | | | | | | | |
Ratios to Average Net Assets6 | | | | | | | | | | | | | | | | | | | | | | | | | | | | |
Total expenses | | | 1.21% | 7 | | | 1.27% | | | | 1.17% | | | | 1.18% | | | | 1.22% | 7 | | | 1.12% | | | | 1.18% | |
Total expenses after fees waived and/or reimbursed | | | 1.18% | 7 | | | 1.25% | | | | 1.17% | | | | 1.18% | | | | 1.22% | 7 | | | 1.12% | | | | 1.18% | |
Net investment income | | | 1.10% | 7 | | | 0.99% | | | | 0.64% | | | | 0.70% | | | | 1.16% | 7 | | | 0.62% | | | | 0.29% | |
| | | | | | | | | | | | | | | | | | | | | | | | | | | | |
| | | | | | | | | | | | | |
Supplemental Data | | | | | | | | | | | | | | | | | | | | | | | | | | | | |
Net assets, end of period (000) | | $ | 30,494 | | | $ | 28,746 | | | $ | 29,586 | | | $ | 30,564 | | | $ | 29,033 | | | $ | 24,717 | | | $ | 33,790 | |
Portfolio turnover of the Portfolio | | | 22% | | | | 147% | | | | 156% | | | | 183% | | | | 151% | | | | 108% | | | | 72% | |
| | 1 | Based on average shares outstanding. |
| | 2 | Dividends and distributions are determined in accordance with federal income tax regulations. |
| | 3 | Where applicable, total investment returns include the reinvestment of dividends and distributions. |
| | 4 | Aggregate total investment return. |
| | 5 | Includes proceeds received from a settlement of litigation, through its investment in the Portfolio, which impacted the Fund’s total investment return. Not including these proceeds, the total investment return would have been 7.96%. |
| | 6 | Includes the Fund’s share of the Portfolio’s allocated expenses and/or net investment income. |
| | | | | | |
See Notes to Financial Statements. | | | | |
| | | | | | | |
| 48 | | BLACKROCK LARGE CAP SERIES FUNDS, INC. | | MARCH 31, 2013 | | |
| | |
| | |
Financial Highlights (continued) | | BlackRock Large Cap Value Fund |
| | | | | | | | | | | | | | | | | | | | | | | | | | | | |
| | | Investor A | |
| | | Six Months
Ended
March 31,
2013 | | | Year Ended September 30, | | | Period
November 1,
2008 to
September 30, | | | Year Ended October 31, | |
| | | (Unaudited) | | | 2012 | | | 2011 | | | 2010 | | | 2009 | | | 2008 | | | 2007 | |
Per Share Operating Performance | |
Net asset value, beginning of period | | $ | 15.48 | | | $ | 12.53 | | | $ | 13.29 | | | $ | 12.92 | | | $ | 12.03 | | | $ | 20.54 | | | $ | 18.64 | |
Net investment income1 | | | 0.08 | | | | 0.14 | | | | 0.08 | | | | 0.09 | | | | 0.11 | | | | 0.09 | | | | 0.06 | |
Net realized and unrealized gain (loss) | | | 2.16 | | | | 2.90 | | | | (0.74 | ) | | | 0.40 | | | | 0.87 | | | | (7.26 | ) | | | 2.16 | |
Net increase (decrease) from investment operations | | | 2.24 | | | | 3.04 | | | | (0.66 | ) | | | 0.49 | | | | 0.98 | | | | (7.17 | ) | | | 2.22 | |
Dividends and distributions from: | | | | | | | | | | | | | | | | | | | | | | | | | | | | |
Net investment income | | | (0.32 | ) | | | (0.09 | )2 | | | (0.10 | )2 | | | (0.12 | )2 | | | (0.09 | )2 | | | (0.01 | )2 | | | (0.02 | )2 |
Net realized gain | | | — | | | | — | | | | — | | | | — | | | | — | | | | (1.33 | )2 | | | (0.30 | )2 |
Total dividends and distributions | | | (0.32 | ) | | | (0.09 | ) | | | (0.10 | ) | | | (0.12 | ) | | | (0.09 | ) | | | (1.34 | ) | | | (0.32 | ) |
Net asset value, end of period | | $ | 17.40 | | | $ | 15.48 | | | $ | 12.53 | | | $ | 13.29 | | | $ | 12.92 | | | $ | 12.03 | | | $ | 20.54 | |
| | | | | | | | | | | | | | | | | | | | | | | | | | | | |
Total Investment Return3 | |
Based on net asset value | | | 14.69% | 4 | | | 24.38% | | | | (5.04)% | | | | 3.75% | | | | 8.22% | 4,5 | | | (37.17)% | | | | 12.04% | |
| | | | | | | | | | | | | | | | | | | | | | | | | | | | |
Ratios to Average Net Assets6 | |
Total expenses | | | 1.29% | 7 | | | 1.27% | | | | 1.24% | | | | 1.23% | | | | 1.40% | 7 | | | 1.22% | | | | 1.17% | |
Total expenses after fees waived and/or reimbursed | | | 1.26% | 7 | | | 1.26% | | | | 1.24% | | | | 1.23% | | | | 1.40% | 7 | | | 1.22% | | | | 1.17% | |
Net investment income | | | 1.02% | 7 | | | 0.99% | | | | 0.57% | | | | 0.67% | | | | 1.04% | 7 | | | 0.52% | | | | 0.28% | |
| | | | | | | | | | | | | | | | | | | | | | | | | | | | |
Supplemental Data | |
Net assets, end of period (000) | | $ | 385,897 | | | $ | 392,575 | | | $ | 479,707 | | | $ | 756,124 | | | $ | 967,445 | | | $ | 1,295,100 | | | $ | 2,499,604 | |
Portfolio turnover of the Portfolio | | | 22% | | | | 147% | | | | 156% | | | | 183% | | | | 151% | | | | 108% | | | | 72% | |
| | 1 | Based on average shares outstanding. |
| | 2 | Dividends and distributions are determined in accordance with federal income tax regulations. |
| | 3 | Where applicable, total investment returns include the reinvestment of dividends and distributions. |
| | 4 | Aggregate total investment return. |
| | 5 | Includes proceeds received from a settlement of litigation, through its investment in the Portfolio, which impacted the Fund’s total investment return. Not including these proceeds, the total investment return would have been 7.80%. |
| | 6 | Includes the Fund’s share of the Portfolio’s allocated expenses and/or net investment income. |
| | | | | | |
See Notes to Financial Statements. | | | | |
| | | | | | | |
| | BLACKROCK LARGE CAP SERIES FUNDS, INC. | | MARCH 31, 2013 | | 49 |
| | |
| | |
Financial Highlights (continued) | | BlackRock Large Cap Value Fund |
| | | | | | | | | | | | | | | | | | | | | | | | | | | | |
| | | Investor B | |
| | | Six Months
Ended
March 31,
2013 | | | Year Ended September 30, | | | Period
November 1,
2008 to
September 30, | | | Year Ended October 31, | |
| | | (Unaudited) | | | 2012 | | | 2011 | | | 2010 | | | 2009 | | | 2008 | | | 2007 | |
Per Share Operating Performance | | | | | | | | | | | | | | | | | | | | | | | | | | | | |
Net asset value, beginning of period | | | $ 14.52 | | | $ | 11.78 | | | $ | 12.52 | | | $ | 12.18 | | | | $ 11.34 | | | $ | 19.41 | | | $ | 17.76 | |
Net investment income (loss)1 | | | 0.01 | | | | 0.01 | | | | (0.04 | ) | | | (0.03 | ) | | | 0.03 | | | | (0.04 | ) | | | (0.09 | ) |
Net realized and unrealized gain (loss) | | | 2.03 | | | | 2.73 | | | | (0.70 | ) | | | 0.37 | | | | 0.81 | | | | (6.85 | ) | | | 2.04 | |
Net increase (decrease) from investment operations | | | 2.04 | | | | 2.74 | | | | (0.74 | ) | | | 0.34 | | | | 0.84 | | | | (6.89 | ) | | | 1.95 | |
Dividends and distributions from: | | | | | | | | | | | | | | | | | | | | | | | | | | | | |
Net investment income | | | (0.11 | ) | | | — | | | | — | | | | — | | | | — | | | | — | | | | — | |
Net realized gain | | | — | | | | — | | | | — | | | | — | | | | — | | | | (1.18 | )2 | | | (0.30 | )2 |
Total dividends and distributions | | | (0.11 | ) | | | — | | | | — | | | | — | | | | — | | | | (1.18 | ) | | | (0.30 | ) |
Net asset value, end of period | | | $ 16.45 | | | $ | 14.52 | | | $ | 11.78 | | | $ | 12.52 | | | | $ 12.18 | | | $ | 11.34 | | | $ | 19.41 | |
|
| |
Total Investment Return3 | | | | | | | | | | | | | | | | | | | | | | | | | | | | |
Based on net asset value | | | 14.11% | 4 | | | 23.26% | | | | (5.91)% | | | | 2.79% | | | | 7.41% | 4,5 | | | (37.62)% | | | | 11.11% | |
|
| |
Ratios to Average Net Assets6 | | | | | | | | | | | | | | | | | | | | | | | | | | | | |
Total expenses | | | 2.25% | 7 | | | 2.21% | | | | 2.12% | | | | 2.14% | | | | 2.21% | 7 | | | 1.99% | | | | 1.98% | |
Total expenses after fees waived and/or reimbursed | | | 2.22% | 7 | | | 2.20% | | | | 2.12% | | | | 2.14% | | | | 2.21% | 7 | | | 1.99% | | | | 1.98% | |
Net investment income (loss) | | | 0.09% | 7 | | | 0.07% | | | | (0.31)% | | | | (0.24)% | | | | 0.28% | 7 | | | (0.24)% | | | | (0.47)% | |
|
| |
Supplemental Data | | | | | | | | | | | | | | | | | | | | | | | | | | | | |
Net assets, end of period (000) | | | $ 12,705 | | | $ | 15,404 | | | $ | 22,168 | | | $ | 37,720 | | | | $63,930 | | | $ | 108,660 | | | | $277,113 | |
Portfolio turnover of the Portfolio | | | 22% | | | | 147% | | | | 156% | | | | 183% | | | | 151% | | | | 108% | | | | 72% | |
| | 1 | Based on average shares outstanding. |
| | 2 | Distributions are determined in accordance with federal income tax regulations. |
| | 3 | Where applicable, total investment returns include the reinvestment of dividends and distributions. |
| | 4 | Aggregate total investment return. |
| | 5 | Includes proceeds received from a settlement of litigation, through its investment in the Portfolio, which impacted the Fund’s total investment return. Not including these proceeds, the total investment return would have been 6.97%. |
| | 6 | Includes the Fund’s share of the Portfolio’s allocated expenses and/or net investment income. |
| | | | | | |
See Notes to Financial Statements. | | | | |
| | | | | | | |
| 50 | | BLACKROCK LARGE CAP SERIES FUNDS, INC. | | MARCH 31, 2013 | | |
| | |
| | |
Financial Highlights (continued) | | BlackRock Large Cap Value Fund |
| | | | | | | | | | | | | | | | | | | | | | | | | | | | |
| | | Investor C | |
| | | Six Months
Ended
March 31, 2013 | | | Year Ended September 30, | | | Period
November 1,
2008 to
September 30, | | | Year Ended October 31, | |
| | | (Unaudited) | | | 2012 | | | 2011 | | | 2010 | | | 2009 | | | 2008 | | | 2007 | |
Per Share Operating Performance | | | | | | | | | | | | | | | | | | | | | | | | | | | | |
Net asset value, beginning of period | | | $ 14.45 | | | $ | 11.72 | | | $ | 12.44 | | | $ | 12.13 | | | | $ 11.29 | | | $ | 19.37 | | | $ | 17.72 | |
Net investment income (loss)1 | | | 0.02 | | | | 0.02 | | | | (0.04 | ) | | | (0.03 | ) | | | 0.02 | | | | (0.04 | ) | | | (0.09) | |
Net realized and unrealized gain (loss) | | | 2.01 | | | | 2.71 | | | | (0.68 | ) | | | 0.36 | | | | 0.82 | | | | (6.83 | ) | | | 2.04 | |
Net increase (decrease) from investment operations | | | 2.03 | | | | 2.73 | | | | (0.72 | ) | | | 0.33 | | | | 0.84 | | | | (6.87 | ) | | | 1.95 | |
Dividends and distributions from: | | | | | | | | | | | | | | | | | | | | | | | | | | | | |
Net investment income | | | (0.17 | ) | | | — | | | | — | | | | (0.02 | )2 | | | — | | | | — | | | | — | |
Net realized gain | | | — | | | | — | | | | — | | | | — | | | | — | | | | (1.21 | )2 | | | (0.30 | )2 |
Total dividends and distributions | | | (0.17 | ) | | | — | | | | — | | | | (0.02 | ) | | | — | | | | (1.21 | ) | | | (0.30 | ) |
Net asset value, end of period | | | $ 16.31 | | | $ | 14.45 | | | $ | 11.72 | | | $ | 12.44 | | | | $ 12.13 | | | $ | 11.29 | | | $ | 19.37 | |
|
| |
Total Investment Return3 | | | | | | | | | | | | | | | | | | | | | | | | | | | | |
Based on net asset value | | | 14.20% | 4 | | | 23.29% | | | | (5.79)% | | | | 2.74% | | | | 7.44% | 4,5 | | | (37.66)% | | | | 11.14% | |
|
| |
Ratios to Average Net Assets6 | | | | | | | | | | | | | | | | | | | | | | | | | | | | |
Total expenses | | | 2.12% | 7 | | | 2.12% | | | | 2.10% | | | | 2.11% | | | | 2.19% | 7 | | | 2.00% | | | | 1.97% | |
Total expenses after fees waived and/or reimbursed | | | 2.09% | 7 | | | 2.11% | | | | 2.10% | | | | 2.11% | | | | 2.19% | 7 | | | 2.00% | | | | 1.97% | |
Net investment income (loss) | | | 0.19% | 7 | | | 0.14% | | | | (0.29)% | | | | (0.22)% | | | | 0.24% | 7 | | | (0.26)% | | | | (0.50)% | |
|
| |
Supplemental Data | | | | | | | | | | | | | | | | | | | | | | | | | | | | |
Net assets, end of period (000) | | | $208,634 | | | $ | 210,681 | | | $ | 220,527 | | | $ | 298,040 | | | | $379,388 | | | $ | 456,180 | | | | $959,039 | |
Portfolio turnover of the Portfolio | | | 22% | | | | 147% | | | | 156% | | | | 183% | | | | 151% | | | | 108% | | | | 72% | |
| | 1 | Based on average shares outstanding. |
| | 2 | Dividends and distributions are determined in accordance with federal income tax regulations. |
| | 3 | Where applicable, total investment returns include the reinvestment of dividends and distributions. |
| | 4 | Aggregate total investment return. |
| | 5 | Includes proceeds received from a settlement of litigation, through its investment in the Portfolio, which impacted the Fund’s total investment return. Not including these proceeds, the total investment return would have been 7.00%. |
| | 6 | Includes the Fund’s share of the Portfolio’s allocated expenses and/or net investment income. |
| | | | | | |
See Notes to Financial Statements. | | | | |
| | | | | | | |
| | BLACKROCK LARGE CAP SERIES FUNDS, INC. | | MARCH 31, 2013 | | 51 |
| | |
| | |
Financial Highlights (concluded) | | BlackRock Large Cap Value Fund |
| | | | | | | | | | | | | | | | | | | | | | | | | | | | |
| | | | | | | | | | | | Class R | | | | | | | | | | |
| | | | |
| | | Six Months
Ended March 31,
2013 | | | Year Ended September 30, | | | Period
November 1,
2008 to
September 30, | | | Year Ended October 31, | |
| | | | | | | | | | | | | | | | |
| | | (Unaudited) | | | 2012 | | | 2011 | | | 2010 | | | 2009 | | | 2008 | | | 2007 | |
|
| |
Per Share Operating Performance | | | | | | | | | | | | | | | | | | | | | | | | | | | | |
| |
Net asset value, beginning of period | | $ | 14.92 | | | $ | 12.08 | | | $ | 12.81 | | | $ | 12.48 | | | $ | 11.63 | | | $ | 19.92 | | | $ | 18.13 | |
| | | | |
Net investment income (loss)1 | | | 0.06 | | | | 0.09 | | | | 0.04 | | | | 0.04 | | | | 0.07 | | | | 0.03 | | | | (0.01) | |
Net realized and unrealized gain (loss) | | | 2.07 | | | | 2.80 | | | | (0.72) | | | | 0.38 | | | | 0.84 | | | | (7.02) | | | | 2.11 | |
| | | | |
Net increase (decrease) from investment operations | | | 2.13 | | | | 2.89 | | | | (0.68) | | | | 0.42 | | | | 0.91 | | | | (6.99) | | | | 2.10 | |
| | | | |
Dividends and distributions from: | | | | | | | | | | | | | | | | | | | | | | | | | | | | |
Net investment income | | | (0.25) | | | | (0.05) | 2 | | | (0.05) | 2 | | | (0.09) | 2 | | | (0.06) | 2 | | | — | | | | (0.01)2 | |
Net realized gain | | | — | | | | — | | | | — | | | | — | | | | — | | | | (1.30) | 2 | | | (0.30)2 | |
| | | | |
Total dividends and distributions | | | (0.25) | | | | (0.05) | | | | (0.05) | | | | (0.09) | | | | (0.06) | | | | (1.30) | | | | (0.31) | |
| | | | |
Net asset value, end of period | | $ | 16.80 | | | $ | 14.92 | | | $ | 12.08 | | | $ | 12.81 | | | $ | 12.48 | | | $ | 11.63 | | | $ | 19.92 | |
| | | | |
| | | | | | | | | | | | | |
| |
Total Investment Return3 | | | | | | | | | | | | | | | | | | | | | | | | | | | | |
| |
Based on net asset value | | | 14.47% | 4 | | | 23.98% | | | | (5.32)% | | | | 3.35% | | | | 7.88% | 4,5 | | | (37.35)% | | | | 11.71% | |
| | | | |
| | | | | | | | | | | | | |
| |
Ratios to Average Net Assets6 | | | | | | | | | | | | | | | | | | | | | | | | | | | | |
| |
Total expenses | | | 1.59% | 7 | | | 1.57% | | | | 1.56% | | | | 1.60% | | | | 1.68% | 7 | | | 1.55% | | | | 1.50% | |
| | | | |
Total expenses after fees waived and/or reimbursed | | | 1.56% | 7 | | | 1.56% | | | | 1.56% | | | | 1.60% | | | | 1.68% | 7 | | | 1.55% | | | | 1.50% | |
| | | | |
Net investment income (loss) | | | 0.73% | 7 | | | 0.70% | | | | 0.25% | | | | 0.29% | | | | 0.72% | 7 | | | 0.19% | | | | (0.06)% | |
| | | | |
| | | | | | | | | | | | | |
| |
Supplemental Data | | | | | | | | | | | | | | | | | | | | | | | | | | | | |
| |
Net assets, end of period (000) | | $ | 56,057 | | | $ | 59,934 | | | $ | 67,672 | | | $ | 115,763 | | | $ | 139,827 | | | $ | 141,571 | | | $ | 211,115 | |
| | | | |
Portfolio turnover of the Portfolio | | | 22% | | | | 147% | | | | 156% | | | | 183% | | | | 151% | | | | 108% | | | | 72% | |
| | | | |
| | 1 | Based on average shares outstanding. |
| | 2 | Dividends and distributions are determined in accordance with federal income tax regulations. |
| | 3 | Where applicable, total investment returns include the reinvestment of dividends and distributions. |
| | 4 | Aggregate total investment return. |
| | 5 | Includes proceeds received from a settlement of litigation, through its investment in the Portfolio, which impacted the Fund’s total investment return. Not including these proceeds, the total investment return would have been 7.45%. |
| | 6 | Includes the Fund’s share of the Portfolio’s allocated expenses and/or net investment income. |
| | | | | | |
See Notes to Financial Statements. | | | | |
| | | | | | | |
| 52 | | BLACKROCK LARGE CAP SERIES FUNDS, INC. | | MARCH 31, 2013 | | |
| | |
| | |
Financial Highlights | | BlackRock Large Cap Core Retirement Portfolio |
| | | | | | | | | | | | | | | | | | | | | | | | |
| | | Class K | |
| | | Six Months
Ended
March 31,
2013 | | | Year Ended September 31, | | | Period
November 1,
2008 to
September 30, | | | Period
January 3,
20081 to
October 31, | |
| | | (Unaudited) | | | 2012 | | | 2011 | | | 2010 | | | 2009 | | | 2008 | |
Per Share Operating Performance | | | | | | | | | | | | | | | | | | | | | | | | |
Net asset value, beginning of period | | $ | 12.51 | | | $ | 9.78 | | | $ | 10.06 | | | $ | 9.61 | | | $ | 8.64 | | | $ | 13.25 | |
Net investment income2 | | | 0.09 | | | | 0.18 | | | | 0.11 | | | | 0.09 | | | | 0.11 | | | | 0.07 | |
Net realized and unrealized gain (loss) | | | 1.21 | | | | 2.69 | | | | (0.28 | ) | | | 0.49 | | | | 0.96 | | | | (4.68 | ) |
Net increase (decrease) from investment operations | | | 1.30 | | | | 2.87 | | | | (0.17 | ) | | | 0.58 | | | | 1.07 | | | | (4.61 | ) |
Dividends from net investment income | | | (0.30 | ) | | | (0.14 | )3 | | | (0.11 | )3 | | | (0.13 | )3 | | | (0.10 | )3 | | | — | |
Net asset value, end of period | | $ | 13.51 | | | $ | 12.51 | | | $ | 9.78 | | | $ | 10.06 | | | $ | 9.61 | | | $ | 8.64 | |
| | | | | | | | | | | | | | | | | | | | | | | | |
| | | | | | | | | |
Total Investment Return4 | | | | | | | | | | | | | | | | | | | | | | | | |
Based on net asset value | | | 10.61% | 5 | | | 29.67% | | | | (1.81 | )% | | | 6.01% | | | | 12.55% | 5,6 | | | (34.79)% | 5 |
| | | | | | | | | | | | | | | | | | | | | | | | |
| | | | | | | | | |
Ratios to Average Net Assets7 | | | | | | | | | | | | | | | | | | | | | | | | |
Total expenses | | | 0.61% | 8 | | | 0.60% | 9 | | | 0.67% | 9 | | | 0.68% | | | | 0.73% | 8 | | | 0.71% | 8 |
Total expenses after reimbursement | | | 0.61% | 8 | | | 0.59% | 9 | | | 0.67% | 9 | | | 0.67% | | | | 0.66% | 8 | | | 0.62% | 8 |
Net investment income | | | 1.38% | 8 | | | 1.59% | 9 | | | 0.96% | 9 | | | 0.93% | | | | 1.39% | 8 | | | 0.76% | 8 |
| | | | | | | | | | | | | | | | | | | | | | | | |
| | | | | | | | | |
Supplemental Data | | | | | | | | | | | | | | | | | | | | | | | | |
Net assets, end of period (000) | | $ | 66,665 | | | $ | 81,221 | | | $ | 129,491 | | | $ | 113,241 | | | $ | 109,188 | | | $ | 105,224 | |
Portfolio turnover of the Portfolio | | | 29% | | | | 128% | | | | 129% | | | | 173% | | | | 168% | | | | 109% | |
| | 1 | Commencement of operations. |
| | 2 | Based on average shares outstanding. |
| | 3 | Dividends are determined in accordance with federal income tax regulations. |
| | 4 | Where applicable, total investment returns include the reinvestment of dividends and distributions. |
| | 5 | Aggregate total investment return. |
| | 6 | Includes proceeds received from a settlement of litigation, through its investment in the Portfolio, which impacted the Fund’s total investment return. Not including these proceeds, the total investment return would have been 12.08%. |
| | 7 | Includes the Fund’s share of the Portfolio’s allocated expenses and/or net investment income. |
| | 9 | Includes the Fund’s share of the Portfolio’s allocated fees waived of less than 0.01%. |
| | | | | | |
See Notes to Financial Statements. | | | | |
| | | �� | | | | |
| | BLACKROCK LARGE CAP SERIES FUNDS, INC. | | MARCH 31, 2013 | | 53 |
| | |
| | |
Financial Highlights | | BlackRock Large Cap Growth Retirement Portfolio |
| | | | | | | | | | | | | | | | | | | | | | | | |
| | | Class K | |
| | | Six Months
Ended
March 31,
2013 | | | Year Ended September 31, | | | Period
November 1,
2008 to
September 30, | | | Period
January 3,
20081 to
October 31, | |
| | | (Unaudited) | | | 2012 | | | 2011 | | | 2010 | | | 2009 | | | 2008 | |
Per Share Operating Performance | | | | | | | | | | | | | | | | | | | | | | | | |
Net asset value, beginning of period | | $ | 12.78 | | | $ | 9.53 | | | $ | 9.54 | | | $ | 8.93 | | | $ | 7.45 | | | $ | 11.20 | |
Net investment income2 | | | 0.17 | | | | 0.15 | | | | 0.08 | | | | 0.06 | | | | 0.05 | | | | 0.02 | |
Net realized and unrealized gain (loss) | | | 0.06 | | | | 3.19 | | | | (0.01 | ) | | | 0.61 | | | | 1.48 | | | | (3.77 | ) |
Net increase (decrease) from investment operations | | | 0.23 | | | | 3.34 | | | | 0.07 | | | | 0.67 | | | | 1.53 | | | | (3.75 | ) |
Dividends and distributions from: | | | | | | | | | | | | | | | | | | | | | | | | |
Net investment income | | | (1.50 | ) | | | (0.09 | )3 | | | (0.08 | )3 | | | (0.06 | )3 | | | (0.05 | )3 | | | — | |
Net realized gains | | | (4.38 | ) | | | — | | | | — | | | | — | | | | — | | | | — | |
Total dividends and distributions | | | (5.88 | ) | | | (0.09 | ) | | | (0.08 | ) | | | (0.06 | ) | | | (0.05 | ) | | | — | |
Net asset value, end of period | | $ | 7.13 | | | $ | 12.78 | | | $ | 9.53 | | | $ | 9.54 | | | $ | 8.93 | | | $ | 7.45 | |
| | | | | | | | | | | | | | | | | | | | | | | | |
Total Investment Return4 | | | | | | | | | | | | | | | | | | | | | | | | |
Based on net asset value | | | 5.77% | 5 | | | 35.29% | | | | 0.68% | | | | 7.46% | | | | 20.66% | 5,6 | | | (33.48)% | 5 |
| | | | | | | | | | | | | | | | | | | | | | | | |
Ratios to Average Net Assets7 | | | | | | | | | | | | | | | | | | | | | | | | |
Total expenses | | | 2.86% | 8,9 | | | 0.70% | 8 | | | 0.71% | 8 | | | 0.79% | | | | 0.88% | 9 | | | 0.81% | 9 |
Total expenses after reimbursement | | | 0.67% | 8,9 | | | 0.64% | 8 | | | 0.67% | 8 | | �� | 0.67% | | | | 0.66% | 9 | | | 0.65% | 9 |
Net investment income | | | 1.50% | 8,9 | | | 1.35% | 8 | | | 0.77% | 8 | | | 0.62% | | | | 0.73% | 9 | | | 0.30% | 9 |
| | | | | | | | | | | | | | | | | | | | | | | | |
Supplemental Data | | | | | | | | | | | | | | | | | | | | | | | | |
Net assets, end of period (000) | | $ | 1,287 | | | $ | 2,243 | | | $ | 100,169 | | | $ | 86,662 | | | $ | 83,098 | | | $ | 80,882 | |
Portfolio turnover of the Portfolio | | | 29% | | | | 132% | | | | 169% | | | | 232% | | | | 242% | | | | 144% | |
| | 1 | Commencement of operations. |
| | 2 | Based on average shares outstanding. |
| | 3 | Dividends are determined in accordance with federal income tax regulations. |
| | 4 | Where applicable, total investment returns include the reinvestment of dividends and distributions. |
| | 5 | Aggregate total investment return. |
| | 6 | Includes proceeds received from a settlement of litigation, through its investment in the Portfolio, which impacted the Fund’s total investment return. Not including these proceeds, the total investment return would have been 20.25%. |
| | 7 | Includes the Fund’s share of the Portfolio’s allocated expenses and/or net investment income. |
| | 8 | Includes the Fund’s share of the Portfolio’s allocated fees waived of less than 0.01%. |
| | | | | | |
See Notes to Financial Statements. | | | | |
| | | | | | | |
| 54 | | BLACKROCK LARGE CAP SERIES FUNDS, INC. | | MARCH 31, 2013 | | |
| | |
| | |
Financial Highlights | | BlackRock Large Cap Value Retirement Portfolio |
| | | | | | | | | | | | | | | | | | | | | | | | |
| | | Class K | |
| | | Six Months
Ended
March 31, 2013 | | | Year Ended September 31, | | | Period
November 1,
2008 to
September 30, | | | Period
January 3,
20081 to
October 31, | |
| | | (Unaudited) | | | 2012 | | | 2011 | | | 2010 | | | 2009 | | | 2008 | |
Per Share Operating Performance | | | | | | | | | | | | | | | | | | | | | | | | |
Net asset value, beginning of period | | $ | 15.93 | | | $ | 12.91 | | | $ | 13.67 | | | $ | 13.28 | | | $ | 12.33 | | | $ | 18.54 | |
Net investment income2 | | | 0.13 | | | | 0.24 | | | | 0.17 | | | | 0.17 | | | | 0.18 | | | | 0.13 | |
Net realized and unrealized gain (loss) | | | 2.22 | | | | 2.99 | | | | (0.76 | ) | | | 0.39 | | | | 0.91 | | | | (6.34 | ) |
Net increase (decrease) from investment operations | | | 2.35 | | | | 3.23 | | | | (0.59 | ) | | | 0.56 | | | | 1.09 | | | | (6.21 | ) |
Dividends from net investment income | | | (0.36 | ) | | | (0.21 | )3 | | | (0.17 | )3 | | | (0.17 | )3 | | | (0.14 | )3 | | | — | |
Net asset value, end of period | | $ | 17.92 | | | $ | 15.93 | | | $ | 12.91 | | | $ | 13.67 | | | $ | 13.28 | | | $ | 12.33 | |
| | | | | | | | | | | | | | | | | | | | | | | | |
Total Investment Return4 | | | | | | | | | | | | | | | | | | | | | | | | |
Based on net asset value | | | 15.00% | 5 | | | 25.23% | | | | (4.44 | )% | | | 4.23% | | | | 8.93% | 5,6 | | | (33.50)% | 5 |
| | | | | | | | | | | | | | | | | | | | | | | | |
Ratios to Average Net Assets7 | | | | | | | | | | | | | | | | | | | | | | | | |
Total expenses | | | 0.67% | 8 | | | 0.67% | | | | 0.70% | | | | 0.72% | | | | 0.77% | 8 | | | 0.78% | 8 |
Total expenses after reimbursement | | | 0.66% | 8 | | | 0.62% | | | | 0.67% | | | | 0.67% | | | | 0.66% | 8 | | | 0.63% | 8 |
Net investment income | | | 1.61% | 8 | | | 1.63% | | | | 1.13% | | | | 1.21% | | | | 1.74% | 8 | | | 1.03% | 8 |
| | | | | | | | | | | | | | | | | | | | | | | | |
Supplemental Data | | | | | | | | | | | | | | | | | | | | | | | | |
Net assets, end of period (000) | | $ | 121,128 | | | $ | 103,636 | | | $ | 144,964 | | | $ | 166,883 | | | $ | 132,560 | | | $ | 128,159 | |
Portfolio turnover of the Portfolio | | | 22% | | | | 147% | | | | 156% | | | | 183% | | | | 151% | | | | 108% | |
| | 1 | Commencement of operations. |
| | 2 | Based on average shares outstanding. |
| | 3 | Dividends are determined in accordance with federal income tax regulations. |
| | 4 | Where applicable, total investment returns exclude the effects of any sales charges and include the reinvestment of dividends and distributions. |
| | 5 | Aggregate total investment return. |
| | 6 | Includes proceeds received from a settlement of litigation, through its investment in the Portfolio, which impacted the Fund’s total investment return. Not including these proceeds, the total investment return would have been 8.52%. |
| | 7 | Includes the Fund’s share of the Portfolio’s allocated expenses and/or net investment income. |
| | | | | | |
See Notes to Financial Statements. | | | | |
| | | | | | | |
| | BLACKROCK LARGE CAP SERIES FUNDS, INC. | | MARCH 31, 2013 | | 55 |
| | |
| | |
Financial Highlights | | BlackRock Large Cap Core Plus Fund |
| | | | | | | | | | | | | | | | | | | | | | | | |
| | | Institutional | |
| | | Six Months
Ended
March 31,
2013 | | | Year Ended September 30, | | | Period
November 1, 2008 to
September 30, | | | Period December 19, 20071 to October 31, | |
| | | (Unaudited) | | | 2012 | | | 2011 | | | 2010 | | | 2009 | | | 2008 | |
|
| |
Per Share Operating Performance | | | | | | | | | | | | | | | | | | | | | | | | |
| |
Net asset value, beginning of period | | $ | 10.58 | | | $ | 8.11 | | | $ | 7.98 | | | $ | 7.58 | | | $ | 6.98 | | | $ | 10.00 | |
| | | | |
Net investment income (loss)2 | | | 0.00 | 3 | | | 0.03 | | | | (0.03 | ) | | | 0.05 | | | | 0.06 | | | | (0.16) | |
Net realized and unrealized gain (loss) | | | 1.21 | | | | 2.44 | | | | 0.16 | | | | 0.51 | | | | 0.54 | | | | (2.86) | |
| | | | |
Net increase (decrease) from investment operations | | | 1.21 | | | | 2.47 | | | | 0.13 | | | | 0.56 | | | | 0.60 | | | | (3.02) | |
| | | | |
Dividends from net investment income | | | (0.01 | ) | | | — | | | | — | | | | (0.16 | )4 | | | — | | | | — | |
| | | | |
Net asset value, end of period | | $ | 11.78 | | | $ | 10.58 | | | $ | 8.11 | | | $ | 7.98 | | | $ | 7.58 | | | $ | 6.98 | |
| | | | |
|
| |
Total Investment Return5 | | | | | | | | | | | | | | | | | | | | | | | | |
| |
Based on net asset value | | | 11.41% | 6 | | | 30.46% | | | | 1.63% | | | | 7.46% | | | | 8.60% | 6 | | | (30.20)%6 | |
| | | | |
|
| |
Ratios to Average Net Assets | | | | | | | | | | | | | | | | | | | | | | | | |
| |
Total expenses. | | | 2.68% | 7 | | | 2.51% | | | | 2.56% | | | | 4.11% | | | | 3.81% | 7 | | | 4.14%7 | |
| | | | |
Total expenses after fees waived and reimbursed | | | 2.31% | 7 | | | 2.25% | | | | 2.08% | | | | 1.50% | | | | 1.33% | 7 | | | 3.85%7 | |
| | | | |
Total expenses after fees waived and reimbursed and excluding dividend expense | | | 1.83% | 7 | | | 1.86% | | | | 1.72% | | | | 0.91% | | | | 0.85% | 7 | | | 3.23%7 | |
| | | | |
Total expenses after fees waived and reimbursed and excluding dividend expense, stock loan fees and interest expense | | | 1.50% | 7 | | | 1.50% | | | | 1.50% | | | | 0.66% | | | | 0.44% | 7 | | | 2.90%7 | |
| | | | |
Net investment income (loss) | | | 0.05% | 7 | | | 0.29% | | | | (0.29 | )% | | | 0.66% | | | | 1.05% | 7 | | | (2.04)%7 | |
| | | | |
|
| |
Supplemental Data | | | | | | | | | | | | | | | | | | | | | | | | |
| |
Net assets, end of period (000) | | $ | 11,959 | | | $ | 12,050 | | | $ | 16,688 | | | $ | 2,700 | | | $ | 3,630 | | | $ | 14,672 | |
| | | | |
Portfolio turnover | | | 33% | | | | 172% | | | | 126% | | | | 192% | | | | 193% | | | | 109% | |
| | | | |
| | 1 | Commencement of operations. |
| | 2 | Based on average shares outstanding. |
| | 3 | Amount is less than $0.005 per share. |
| | 4 | Dividends are determined in accordance with federal income tax regulations. |
| | 5 | Where applicable, total investment returns include the reinvestment of dividends and distributions. |
| | 6 | Aggregate total investment return. |
| | | | | | |
See Notes to Financial Statements. | | | | |
| | | | | | | |
| 56 | | BLACKROCK LARGE CAP SERIES FUNDS, INC. | | MARCH 31, 2013 | | |
| | |
| | |
Financial Highlights (continued) | | BlackRock Large Cap Core Plus Fund |
| | | | | | | | | | | | | | | | | | | | | | | | |
| | | Investor A | |
| | | Six Months
Ended
March 31,
2013 | | | Year Ended September 30, | | | Period
November 1,
2008 to
September 30, | | | Period December 19, 20071 to October 31, | |
| | | (Unaudited) | | | 2012 | | | 2011 | | | 2010 | | | 2009 | | | 2008 | |
|
| |
Per Share Operating Performance | | | | | | | | | | | | | | | | | | | | | | | | |
| |
Net asset value, beginning of period | | $ | 10.46 | | | $ | 8.04 | | | $ | 7.93 | | | $ | 7.55 | | | $ | 6.96 | | | $ | 10.00 | |
| | | | |
Net investment income (loss)2 | | | (0.01 | ) | | | (0.00 | )3 | | | (0.05 | ) | | | 0.02 | | | | 0.07 | | | | (0.17) | |
Net realized and unrealized gain (loss) | | | 1.18 | | | | 2.42 | | | | 0.16 | | | | 0.51 | | | | 0.52 | | | | (2.87) | |
| | | | |
Net increase (decrease) from investment operations | | | 1.17 | | | | 2.42 | | | | 0.11 | | | | 0.53 | | | | 0.59 | | | | (3.04) | |
| | | | |
Dividends from net investment income | | | — | | | | — | | | | — | | | | (0.15 | )4 | | | — | | | | — | |
| | | | |
Net asset value, end of period | | $ | 11.63 | | | $ | 10.46 | | | $ | 8.04 | | | $ | 7.93 | | | $ | 7.55 | | | $ | 6.96 | |
| | | | |
|
| |
Total Investment Return5 | | | | | | | | | | | | | | | | | | | | | | | | |
| |
Based on net asset value | | | 11.19% | 6 | | | 30.10% | | | | 1.39% | | | | 7.02% | | | | 8.48% | 6 | | | (30.40)%6 | |
| | | | |
|
| |
Ratios to Average Net Assets | | | | | | | | | | | | | | | | | | | | | | | | |
| |
Total expenses | | | 2.86% | 7 | | | 2.79% | | | | 2.90% | | | | 4.37% | | | | 4.14% | 7 | | | 4.18%7 | |
| | | | |
Total expenses after fees waived and reimbursed | | | 2.61% | 7 | | | 2.59% | | | | 2.36% | | | | 1.84% | | | | 1.26% | 7 | | | 4.14%7 | |
| | | | |
Total expenses after fees waived and reimbursed and excluding dividend expense | | | 2.13% | 7 | | | 2.19% | | | | 2.00% | | | | 1.25% | | | | 0.76% | 7 | | | 3.51%7 | |
| | | | |
Total expenses after fees waived and reimbursed and excluding dividend expense, stock loan fees and interest expense | | | 1.80% | 7 | | | 1.80% | | | | 1.79% | | | | 1.00% | | | | 0.33% | 7 | | | 3.18%7 | |
| | | | |
Net investment income (loss) | | | (0.26 | )%7 | | | (0.02 | )% | | | (0.54 | )% | | | 0.30% | | | | 1.16% | 7 | | | (2.30)%7 | |
| | | | |
|
| |
Supplemental Data | | | | | | | | | | | | | | | | | | | | | | | | |
| |
Net assets, end of period (000) | | $ | 17,191 | | | $ | 15,935 | | | $ | 10,749 | | | $ | 2,536 | | | $ | 2,798 | | | $ | 1,815 | |
| | | | |
Portfolio turnover | | | 33% | | | | 172% | | | | 126% | | | | 192% | | | | 193% | | | | 109% | |
| | | | |
| | 1 | Commencement of operations. |
| | 2 | Based on average shares outstanding. |
| | 3 | Amount is greater than $(0.005) per share. |
| | 4 | Dividends are determined in accordance with federal income tax regulations. |
| | 5 | Where applicable, total investment returns include the reinvestment of dividends and distributions. |
| | 6 | Aggregate total investment return. |
| | | | | | |
See Notes to Financial Statements. | | | | |
| | | | | | | |
| | BLACKROCK LARGE CAP SERIES FUNDS, INC. | | MARCH 31, 2013 | | 57 |
| | |
| | |
Financial Highlights (concluded) | | BlackRock Large Cap Core Plus Fund |
| | | | | | | | | | | | | | | | | | | | | | | | |
| | | Investor C | |
| | | Six Months
Ended March 31,
2013 | | | Year Ended September 30, | | | Period November 1,
2008 to September 30, | | | Period December 19, 20071 to October 31, | |
| | | (Unaudited) | | | 2012 | | | 2011 | | | 2010 | | | 2009 | | | 2008 | |
Per Share Operating Performance | | | | | | | | | | | | | | | | | | | | | | | | |
Net asset value, beginning of period | | $ | 10.16 | | | $ | 7.87 | | | $ | 7.82 | | | $ | 7.45 | | | $ | 6.91 | | | $ | 10.00 | |
Net investment income (loss)2 | | | (0.05 | ) | | | (0.07 | ) | | | (0.10 | ) | | | (0.03 | ) | | | 0.03 | | | | (0.23 | ) |
Net realized and unrealized gain (loss) | | | 1.16 | | | | 2.36 | | | | 0.15 | | | | 0.50 | | | | 0.51 | | | | (2.86 | ) |
Net increase (decrease) from investment operations | | | 1.11 | | | | 2.29 | | | | 0.05 | | | | 0.47 | | | | 0.54 | | | | (3.09 | ) |
Dividends from net investment income | | | — | | | | — | | | | — | | | | (0.10 | )3 | | | — | | | | — | |
Net asset value, end of period | | $ | 11.27 | | | $ | 10.16 | | | $ | 7.87 | | | $ | 7.82 | | | $ | 7.45 | | | $ | 6.91 | |
| | | | | | | | | | | | | | | | | | | | | | | | |
Total Investment Return4 | | | | | | | | | | | | | | | | | | | | | | | | |
Based on net asset value | | | 10.93% | 5 | | | 29.10% | | | | 0.64% | | | | 6.29% | | | | 7.81% | 5 | | | (30.90)% | 5 |
| | | | | | | | | | | | | | | | | | | | | | | | |
Ratios to Average Net Assets | | | | | | | | | | | | | | | | | | | | | | | | |
Total expenses | | | 3.67% | 6 | | | 3.57% | | | | 3.83% | | | | 5.14% | | | | 4.88% | 6 | | | 4.46% | 6 |
Total expenses after fees waived and reimbursed | | | 3.31% | 6 | | | 3.28% | | | | 3.04% | | | | 2.54% | | | | 1.99% | 6 | | | 4.43% | 6 |
Total expenses after fees waived and reimbursed and excluding dividend expense | | | 2.83% | 6 | | | 2.88% | | | | 2.70% | | | | 1.95% | | | | 1.50% | 6 | | | 4.23% | 6 |
Total expenses after fees waived and reimbursed and excluding dividend expense, stock loan fees and interest expense | | | 2.50% | 6 | | | 2.50% | | | | 2.50% | | | | 1.70% | | | | 1.07% | 6 | | | 3.90% | 6 |
Net investment income (loss) | | | (0.96)% | 6 | | | (0.70)% | | | | (1.13)% | | | | (0.40)% | | | | 0.41% | 6 | | | (3.03)% | 6 |
| | | | | | | | | | | | | | | | | | | | | | | | |
Supplemental Data | | | | | | | | | | | | | | | | | | | | | | | | |
Net assets, end of period (000) | | $ | 7,142 | | | $ | 6,587 | | | $ | 6,586 | | | $ | 4,213 | | | $ | 5,466 | | | $ | 3,804 | |
Portfolio turnover | | | 33% | | | | 172% | | | | 126% | | | | 192% | | | | 193% | | | | 109% | |
| | 1 | Commencement of operations. |
| | 2 | Based on average shares outstanding. |
| | 3 | Dividends are determined in accordance with federal income tax regulations. |
| | 4 | Where applicable, total investment returns include the reinvestment of dividends and distributions. |
| | 5 | Aggregate total investment return. |
| | | | | | |
See Notes to Financial Statements. | | | | |
| | | | | | | |
| 58 | | BLACKROCK LARGE CAP SERIES FUNDS, INC. | | MARCH 31, 2013 | | |
| | |
| | |
Notes to Financial Statements (Unaudited) | | BlackRock Large Cap Series Funds, Inc. |
1. Organization and Significant Accounting Policies:
BlackRock Large Cap Core Fund (“Large Cap Core”), BlackRock Large Cap Growth Fund (“Large Cap Growth”), BlackRock Large Cap Value Fund (“Large Cap Value”), BlackRock Large Cap Core Retirement Portfolio (“Large Cap Core Retirement”), BlackRock Large Cap Growth Retirement Portfolio (“Large Cap Growth Retirement”), BlackRock Large Cap Value Retirement Portfolio (“Large Cap Value Retirement”) and BlackRock Large Cap Core Plus Fund (“Large Cap Core Plus”) (collectively, the “Funds,” or individually, a “Fund”), are each a series of BlackRock Large Cap Series Funds, Inc. (the “Corporation”), which is registered under the Investment Company Act of 1940, as amended (the “1940 Act”), as an open-end management investment company. The Corporation is organized as a Maryland corporation. Each Fund is classified as diversified. The Funds’ financial statements are prepared in conformity with accounting principles generally accepted in the United States of America (“US GAAP”), which may require management to make estimates and assumptions that affect the reported amounts of assets and liabilities in the financial statements and the reported amounts of increases and decreases in net assets from operations during the reported period. Actual results could differ from those estimates. Large Cap Core, Large Cap Growth, Large Cap Value and Large Cap Core Plus each offer multiple classes of shares. Institutional Shares are sold without a sales charge and only to certain eligible investors. Service Shares are sold without a sales charge. Investor A Shares are generally sold with a front-end sales charge. Investor B and Investor C Shares may be subject to a CDSC. Class R Shares are sold without a sales charge and only to certain employer-sponsored retirement plans. Large Cap Core Retirement, Large Cap Growth Retirement and Large Cap Value Retirement each offer Class K Shares. Class K Shares are not subject to any sales charge and are only available to eligible investors. All classes of shares have identical voting, dividend, liquidation and other rights and the same terms and conditions, except that Service, Investor A, Investor B, Investor C and Class R Shares bear certain expenses related to the shareholder servicing of such shares, and Investor B, Investor C and Class R Shares also bear certain expenses related to the distribution of such shares. Investor B Shares automatically convert to Investor A Shares after approximately eight years. Investor B Shares are only available through exchanges and dividend reinvestments by existing shareholders and for purchase by certain employer-sponsored retirement plans. Each class has exclusive voting rights with respect to matters relating to its shareholder servicing and distribution expenditures (except that Investor B shareholders may vote on material changes to the Investor A distribution and service plan).
Large Cap Core, Large Cap Growth, Large Cap Value, Large Cap Core Retirement, Large Cap Growth Retirement, and Large Cap Value Retirement (collectively, the “Feeder Funds” or individually a “Feeder Fund”) seek to achieve their investment objectives by investing all of their assets in the corresponding master portfolios (individually, a “Portfolio” or collectively, the “Portfolios”) of Master Large Cap Series LLC (the “Master LLC”), an affiliate of the Funds. Large Cap Core and Large Cap Core Retirement invest all of their assets in Master Large Cap Core Portfolio. Large Cap Growth and Large Cap Growth Retirement invest all of their assets in Master Large Cap Growth Portfolio. Large Cap Value and Large Cap Value Retirement invest all of their assets in Master Large Cap Value Portfolio. Each Portfolio has the same investment objective and strate-
gies as the corresponding Feeder Fund. The value of a Feeder Fund’s investment in the applicable Portfolio reflects the Fund’s proportionate interest in the net assets of such Portfolio. The performance of a Feeder Fund is directly affected by the performance of the applicable Portfolio. The percentages of Master Large Cap Core Portfolio, Master Large Cap Growth Portfolio and Master Large Cap Value Portfolio owned by Large Cap Core, Large Cap Growth, Large Cap Value, Large Cap Core Retirement, Large Cap Growth Retirement and Large Cap Value Retirement at March 31, 2013 were 73.7%, 96.4%, 88.2%, 2.9%, 0.1% and 11.8%, respectively. The performance of a Feeder Fund is directly affected by the performance of the applicable Portfolio. The financial statements of the Portfolios, including the Schedules of Investments, are included elsewhere in this report and should be read in conjunction with the Feeder Funds’ financial statements.
The following is a summary of significant accounting policies followed by the Funds:
Valuation: US GAAP defines fair value as the price the Funds would receive to sell an asset or pay to transfer a liability in an orderly transaction between market participants at the measurement date. Large Cap Core Plus determines the fair values of its financial instruments at market value using independent dealers or pricing services under policies approved by the Board of Directors of the Corporation (the “Board”). The BlackRock Global Valuation Methodologies Committee (the “Global Valuation Committee”) is the committee formed by management to develop global pricing policies and procedures and to provide oversight of the pricing function for Large Cap Core Plus for all financial instruments.
Each Feeder Fund’s policy is to fair value its financial instruments at market value. Each Feeder Fund records its investments in the corresponding Portfolio at fair value based on the Feeder Fund’s proportionate interest in the net assets of the Portfolio. Valuation of securities held by a Portfolio is discussed in Note 1 of the Master LLCs’ Notes to Financial Statements, which are included elsewhere in this report.
Large Cap Core Plus equity investments traded on a recognized securities exchange or the NASDAQ Global Market System (“NASDAQ”) are valued at the last reported sale price that day or the NASDAQ official closing price, if applicable. For equity investments traded on more than one exchange, the last reported sale price on the exchange where the stock is primarily traded is used. Equity investments traded on a recognized exchange for which there were no sales on that day are valued at the last available bid (long positions) or ask (short positions) price. If no bid or ask price is available, the prior day’s price will be used, unless it is determined that such prior day’s price no longer reflects the fair value of the security. Investments in open-end registered investment companies are valued at NAV each business day. Short-term securities with remaining maturities of 60 days or less may be valued at amortized cost, which approximates fair value.
In the event that application of these methods of valuation results in a price for an investment which is deemed not to be representative of the market value of such investment, or if a price is not available, the investment will be valued by the Global Valuation Committee, or its delegate, in accordance with a policy approved by the Board as reflecting fair
| | | | | | |
| | | | | | | |
| | BLACKROCK LARGE CAP SERIES FUNDS, INC. | | MARCH 31, 2013 | | 59 |
| | |
| | |
Notes to Financial Statements (continued) | | BlackRock Large Cap Series Funds, Inc. |
value (“Fair Value Assets”) for Large Cap Core Plus. When determining the price for Fair Value Assets, the Global Valuation Committee, or its delegate, seeks to determine the price that Large Cap Core Plus might reasonably expect to receive from the current sale of that asset in an arm’s-length transaction. Fair value determinations shall be based upon all available factors that the Global Valuation Committee, or its delegate, deem relevant consistent with the principles of fair value measurement which include the market approach, income approach and/ or in the case of recent investments, the cost approach, as appropriate. A market approach generally consists of using comparable market transactions. The income approach generally is used to discount future cash flows to present value and adjusted for liquidity as appropriate. These factors include but are not limited to: (i) attributes specific to the investment or asset; (ii) the principal market for the investment or asset; (iii) the customary participants in the principal market for the investment or asset; (iv) data assumptions by market participants for the investment or asset, if reasonably available; (v) quoted prices for similar investments or assets in active markets; and (vi) other factors, such as future cash flows, interest rates, yield curves, volatilities, prepayment speeds, loss severities, credit risks, recovery rates, liquidation amounts and/or default rates. Due to the inherent uncertainty of valuations of such investments, the fair values may differ from the values that would have been used had an active market existed. The Global Valuation Committee, or its delegate, employs various methods for calibrating valuation approaches for investments where an active market does not exist including regular due diligence of Large Cap Core Plus’ pricing vendors, a regular review of key inputs and assumptions, transactional back-testing or disposition analysis to compare unrealized gains and losses to realized gains and losses, reviews of missing or stale prices and large movements in market values and reviews of any market related activity. The pricing of all Fair Value Assets is subsequently reported to the Board or a committee thereof on a quarterly basis.
Foreign Currency: Large Cap Core Plus’ books and records are maintained in US dollars. Purchases and sales of investment securities are recorded at the rates of exchange prevailing on the respective date of such transactions. Generally, when the US dollar rises in value against a foreign currency, Large Cap Core Plus’ investments denominated in that currency will lose value because that currency is worth fewer US dollars; the opposite effect occurs if the US dollar falls in relative value.
Large Cap Core Plus does not isolate the portion of the results of operations arising as a result of changes in the foreign exchange rates from the changes in the market prices of investments held or sold for financial reporting purposes. Accordingly, the effects of changes in foreign currency exchange rates on investments are not segregated in the Statements of Operations from the effects of changes in market prices of those investments but are included as a component of net realized and unrealized gain (loss) from investments. Large Cap Core Plus reports realized currency gains (losses) on foreign currency related transactions as components of net realized gain (loss) for financial reporting purposes, whereas such components are treated as ordinary income for federal income tax purposes.
Short Sales: Large Cap Core Plus may enter into short sale transactions in which the Fund sells a security it does not hold in anticipation of a
decline in the market price of that security. When the Fund makes a short sale, it will borrow the security sold short and deliver the security to the counterparty to which it sold the security short. An amount equal to the proceeds received by the Fund is reflected as an asset and an equivalent liability. The amount of the liability is subsequently marked-to-market to reflect the market value of the short sale. The Fund is required to repay the counterparty any dividends received on the security sold short, which is shown as dividend expense in the Statements of Operations. The Fund may pay a fee on the assets borrowed from the counterparty, which is shown as stock loan fees in the Statements of Operations. The Fund maintains a segregated account of securities or deposits cash with the broker-dealer as collateral for the short sales. The Fund may receive interest on the cash collateral deposited with the broker-dealer. The Fund is exposed to market risk based on the amount, if any, that the market value of the security increases beyond the market value at which the position was sold. Thus, a short sale of a security involves the risk that instead of declining, the price of the security sold short will rise. The short sale of securities involves the possibility of a theoretically unlimited loss since there is a theoretically unlimited potential for the market price of the security sold short to increase. A gain, limited to the price at which the Fund sold the security short, or a loss, unlimited as to the dollar amount, will be recognized upon the termination of a short sale if the market price is either less than or greater than the proceeds originally received. There is no assurance the Fund will be able to close out a short position at a particular time or at an acceptable price.
Segregation and Collateralization: In cases in which the 1940 Act and the interpretive positions of the Securities and Exchange Commission (“SEC”) require that Large Cap Core Plus either deliver collateral or segregate assets in connection with certain investments (e.g., foreign currency exchange contracts), Large Cap Core Plus will, consistent with SEC rules and/or certain interpretive letters issued by the SEC, segregate collateral or designate on its books and records cash or liquid securities having a market value at least equal to the amount that would otherwise be required to be physically segregated. Furthermore, based on requirements and agreements with certain exchanges and third party broker-dealers, Large Cap Core Plus engaging in such transactions may have requirements to deliver/deposit securities to/with an exchange or broker-dealer as collateral for certain investments.
Investment Transactions and Investment Income: For financial reporting purposes, investment transactions are recorded on the dates the transactions are entered into (the trade dates). Realized gains and losses on investment transactions are determined on the identified cost basis. Dividend income is recorded on the ex-dividend dates. Dividends from foreign securities where the ex-dividend date may have passed are subsequently recorded when Large Cap Core Plus is informed of the ex-dividend date. Under the applicable foreign tax laws, a withholding tax at various rates may be imposed on capital gains, dividends and interest. Upon notification from issuers, some of the dividend income received from a real estate investment trust may be redesignated as a reduction of cost of the related investment and/or realized gain. Income and realized and unrealized gains and losses are allocated daily to each class based on its relative net assets. For financial reporting purposes, contributions to and withdrawals from the corresponding Portfolio are
| | | | | | |
| | | | | | | |
| 60 | | BLACKROCK LARGE CAP SERIES FUNDS, INC. | | MARCH 31, 2013 | | |
| | |
| | |
Notes to Financial Statements (continued) | | BlackRock Large Cap Series Funds, Inc. |
accounted for on a trade date basis. The Feeder Funds record daily their proportionate share of the corresponding Portfolio’s income, expenses and realized and unrealized gains and losses. In addition, each Feeder Fund accrues its own expenses. Income, expenses and realized and unrealized gains and losses are allocated daily to each class based on its relative net assets.
Dividends and Distributions: Dividends and distributions paid by the Funds are recorded on the ex-dividend dates. The portion of distributions that exceeds the Funds’ current and accumulated earnings and profits, which are measured on a tax basis, will constitute a nontaxable return of capital. Distributions in excess of the Funds’ taxable income and net capital gains, but not in excess of the Funds’ earnings and profits, will be taxable to shareholders as ordinary income and will not constitute a nontaxable return of capital. Capital losses carried forward from years beginning before 2011 do not reduce earnings and profits, even if such carried forward losses offset current year realized gains. The character and timing of dividends and distributions are determined in accordance with federal income tax regulations, which may differ from US GAAP.
Income Taxes: It is each Fund’s policy to comply with the requirements of the Internal Revenue Code of 1986, as amended, applicable to regulated investment companies and to distribute substantially all of its taxable income to its shareholders. Therefore, no federal income tax provision is required.
Each Fund files US federal and various state and local tax returns. No income tax returns are currently under examination. The statute of limitations for each Fund’s US federal income tax returns remains open for each of the three years ended September 30, 2012 and the period ended September 30, 2009. The statutes of limitations on each Fund’s state and local tax returns may remain open for an additional year depending upon the jurisdiction. Management does not believe there are any uncertain tax positions that require recognition of a tax liability.
Recent Accounting Standards: In December 2011, the Financial Accounting Standards Board (the “FASB”) issued guidance that will expand current disclosure requirements on the offsetting of certain assets and liabilities. The new disclosures will be required for investments and derivative financial instruments subject to master netting or similar agreements which are eligible for offset in the Statements of Assets and Liabilities and will require an entity to disclose both gross and net information about such investments and transactions in the financial statements. In January 2013, the FASB issued guidance that clarifies which investments and transactions are subject to the offsetting disclosure requirements. The scope of the disclosure requirements for offsetting will be limited to derivative instruments, repurchase agreements and reverse repurchase agreements, and securities borrowing and securities lending transactions. The guidance is effective for financial statements with fiscal years beginning on or after January 1, 2013, and interim periods within those fiscal years. Management is evaluating the impact of this guidance on each Fund’s financial statement disclosures.
Other: Expenses directly related to a Fund or its classes are charged to that Fund or class. Other operating expenses shared by several funds are pro rated among those funds on the basis of relative net assets or other
appropriate methods. Expenses directly related to a Fund and other shared expenses pro-rated to a Fund are allocated daily to each class based on its relative net assets or other appropriate methods.
Large Cap Core Plus has an arrangement with the custodian whereby fees may be reduced by credits earned on uninvested cash balances, which, if applicable, are shown as fees paid indirectly in the Statement of Operations. The custodian imposes fees on overdrawn cash balances, which can be offset by accumulated credits earned or may result in additional custody charges.
2. Derivative Financial Instruments:
Large Cap Core Plus engages in various portfolio investment strategies using derivative contracts both to increase the returns of Large Cap Core Plus and/or to economically hedge, or protect, its exposure to certain risks such as foreign currency exchange rate risk. These contracts may be transacted on an exchange or over-the-counter (“OTC”).
Losses may arise if the value of the contract decreases due to an unfavorable change in the market rates or values of the underlying instrument or if the counterparty does not perform under the contract. Large Cap Core Plus’ maximum risk of loss from counterparty credit risk on OTC derivatives is generally the aggregate unrealized gain netted against any collateral pledged by the counterparty.
Large Cap Core Plus may mitigate counterparty risk by procuring collateral and through netting provisions included within an International Swaps and Derivatives Association, Inc. master agreement (“ISDA Master Agreement”) implemented between Large Cap Core Plus and each of its respective counterparties. An ISDA Master Agreement allows Large Cap Core Plus to offset with each separate counterparty certain derivative financial instrument’s payables and/or receivables with collateral held. The amount of collateral moved to/from applicable counterparties is generally based upon minimum transfer amounts of up to $500,000. To the extent amounts due to Large Cap Core Plus from its counterparties are not fully collateralized, contractually or otherwise, Large Cap Core Plus bears the risk of loss from counterparty non-performance. See Note 1 “Segregation and Collateralization” for information with respect to collateral practices. In addition, Large Cap Core Plus manages counterparty risk by entering into agreements only with counterparties that it believes have the financial resources to honor their obligations and by monitoring the financial stability of those counterparties.
Certain ISDA Master Agreements allow counterparties to OTC derivatives to terminate derivative contracts prior to maturity in the event Large Cap Core Plus’ net assets decline by a stated percentage or Large Cap Core Plus fails to meet the terms of its ISDA Master Agreements, which would cause Large Cap Core Plus to accelerate payment of any net liability owed to the counterparty.
Foreign Currency Exchange Contracts: Large Cap Core Plus enters into foreign currency exchange contracts as an economic hedge against either specific transactions or portfolio instruments or to obtain exposure to foreign currencies (foreign currency exchange rate risk). A foreign currency exchange contract is an agreement between two parties to buy
| | | | | | |
| | | | |
| | | | | | | |
| | BLACKROCK LARGE CAP SERIES FUNDS, INC. | | MARCH 31, 2013 | | 61 |
| | |
| | |
Notes to Financial Statements (continued) | | BlackRock Large Cap Series Funds, Inc. |
and sell a currency at a set exchange rate on a future date. Foreign currency exchange contracts, when used by Large Cap Core Plus, help to manage the overall exposure to the currencies in which some of the investments held by Large Cap Core Plus are denominated. The contract is marked-to-market daily and the change in market value is recorded by Large Cap Core Plus as an unrealized gain or loss. When the contract is closed, Large Cap Core Plus records a realized gain or loss equal to the difference between the value at the time it was opened and the value at the time it was closed. The use of foreign currency exchange contracts involves the risk that the value of a foreign currency exchange contract changes unfavorably due to movements in the value of the referenced foreign currencies and the risk that the counterparty to the contract does not perform its obligations under the agreement.
Derivative Financial Instruments Categorized by Risk Exposure:
| | | | |
The Effect of Derivative Financial Instruments in the Statement of
Operations Six Months Ended March 31, 2013 | |
| Net Realized Gain (Loss) from | |
Foreign currency exchange contracts: | | | | |
Foreign currency transactions | | $ | (7 | ) |
3. Investment Advisory Agreement and Other Transactions with Affiliates:
The PNC Financial Services Group, Inc. (“PNC”) is the largest stockholder and an affiliate, for 1940 Act purposes, of BlackRock, Inc. (“BlackRock”).
The Corporation, on behalf of Large Cap Core Plus, entered into an Investment Advisory Agreement with BlackRock Advisors, LLC (the “Manager”), the Fund’s investment advisor, an indirect, wholly owned subsidiary of BlackRock, to provide investment advisory and administration services. The Manager is responsible for the management of the Fund’s portfolio and provides the necessary personnel, facilities, equipment and certain other services necessary to the operations of the Fund. For such services, the Fund pays the Manager a monthly fee based on a percentage of the Fund’s average daily net assets at the following annual rates:
| | |
| Average Daily Net Assets | | Investment
Advisory
Fee |
First $1 Billion. | | 1.20% |
$1 Billion – $3 Billion | | 1.13% |
$3 Billion – $5 Billion | | 1.08% |
$5 Billion – $10 Billion | | 1.04% |
Greater than $10 Billion | | 1.02% |
The Corporation, on behalf of the Feeder Funds, entered into an Administration Agreement with BlackRock Advisors, LLC (the “Administrator”), an indirect, wholly owned subsidiary of BlackRock, to provide administrative services (other than investment advice and related portfolio activities). For such services, Large Cap Core, Large Cap Growth and Large Cap Value pay the Administrator a monthly fee at an annual rate of 0.25% of the average daily value of such Feeder Fund’s net assets. The Feeder Funds do not pay an investment advisory fee or investment management fee. With respect to Large Cap Core Retirement, Large Cap Growth Retirement and Large Cap Value Retirement, the Administrator does not receive an administration fee.
With respect to Large Cap Core Plus, the Manager voluntarily agreed to waive and/or reimburse fees or expenses, excluding interest expense, dividend expense, acquired fund fees and expenses and certain other fund expenses, which constitute extraordinary expenses not incurred in the ordinary course of the Fund’s business, in order to limit expenses. The current expense limitation as a percentage of average daily net assets is as follows: 1.50% for Institutional; 1.80% for Investor A; and 2.50% for Investor C.
For the six months ended March 31, 2013, the Manager waived or reimbursed $36,002, which is included in fees waived and/or reimbursed by Manager in the Statements of Operations.
The Manager also reimbursed Large Cap Core Plus for transfer agent fees which are shown as transfer agent fees reimbursed – class specific in the Statements of Operations. For the six months ended March 31, 2013, the class specific reimbursements were as follows:
| | | | |
Institutional | | $ | 9,033 | |
Investor A | | $ | 2,654 | |
Investor C | | $ | 5,031 | |
The Manager voluntarily agreed to waive its investment advisory fees by the amount of investment advisory fees Large Cap Core Plus pays to the Manager indirectly through its investment in affiliated money market funds. However, the Manager does not waive its investment advisory fees by the amount of investment advisory fees paid in connection with the Fund’s investment in other affiliated investment companies, if any. This amount is included in fees waived and/or reimbursed by Manager in the Statements of Operations. For the six months ended March 31, 2013, the Manager waived $166.
With respect to Large Cap Core Plus, the Manager entered into a sub-advisory agreement with BlackRock Investment Management, LLC (“BIM”), an affiliate of the Manager. The Manager pays BIM, for services it provides, a monthly fee that is a percentage of the investment advisory fees paid by the Fund to the Manager.
For the six months ended March 31, 2013, Large Cap Core Plus reimbursed the Manager $128 for certain accounting services, which are included in accounting services in the Statements of Operations.
With respect to Large Cap Core, the Administrator contractually agreed to waive and/or reimburse fees or expenses, excluding interest expense, dividend expense, acquired fund fees and expenses and certain other fund expenses, which constitute extraordinary expenses not incurred in the ordinary course of the Fund’s business, in order to limit expenses. The expense limitation as a percentage of average daily net assets is as follows: 1.14% for Investor A and 1.97% for Investor B. The Administrator has agreed not to reduce or discontinue this contractual waiver or reimbursement prior to February 1, 2014, unless approved by the Board, including a majority of the Independent Directors. These amounts are shown as transfer agent fees reimbursed – class specific on the Statements of Operations. For the six months ended March 31, 2013, these amounts were as follows:
| | | | | | | | |
| | | Investor A | | | Investor B | |
Large Cap Core | | $ | 412,812 | | | $ | 54,773 | |
| | | | | | |
| | | | |
| | | | | | | |
| 62 | | BLACKROCK LARGE CAP SERIES FUNDS, INC. | | MARCH 31, 2013 | | |
| | |
| | |
Notes to Financial Statements (continued) | | BlackRock Large Cap Series Funds, Inc. |
Effective June 1, 2012, with respect to Large Cap Value, the Administrator agreed to voluntarily waive 0.05%, as a percentage of daily net assets, of the administration fee payable with respect to Large Cap Value. This voluntary waiver may be reduced or discontinued at any time without notice. For the six months ended March 31, 2013, the Administrator waived $135,869, which is included in fees waived by the Administrator in the Statements of Operations.
With respect to Large Cap Core Retirement, Large Cap Growth Retirement and Large Cap Value Retirement, the Administrator has contractually agreed to waive and/or reimburse fees or expenses, excluding interest expense, dividend expense, acquired fund fees and expenses and certain other fund expenses, which constitute extraordinary expenses not incurred in the ordinary course of the Feeder Funds’ business, in order to limit expenses. The expense limitation of each of Large Cap Core Retirement, Large Cap Growth Retirement and Large Cap Value Retirement is 0.67% of the average daily net assets of such Feeder Fund. The Administrator has agreed not to reduce or discontinue this contractual waiver or reimbursement prior to February 1, 2014 unless approved by the Board, including a majority of the Independent Directors. These amounts are shown as fees reimbursed by administrator in the Statements of Operations.
The Corporation, on behalf of Large Cap Core, Large Cap Growth, Large Cap Value and Large Cap Core Plus entered into a Distribution Agreement and separate Distribution Plans with BlackRock Investments, LLC (“BRIL”), an affiliate of the Administrator. Pursuant to the Distribution and Service Plan and in accordance with Rule 12b-1 under the 1940 Act, each Fund pays BRIL ongoing service and distribution fees. The fees are accrued daily and paid monthly at annual rates based upon the average daily net assets of the shares of each Fund as follows:
| | | | | | |
| | | Service
Fee | | Distribution
Fee | |
Service | | 0.25% | | | — | |
Investor A | | 0.25% | | | — | |
Investor B | | 0.25% | | | 0.75 | % |
Investor C | | 0.25% | | | 0.75 | % |
Class R | | 0.25% | | | 0.25 | % |
Pursuant to sub-agreements with BRIL, broker-dealers and BRIL provide shareholder servicing and distribution services to each Fund. The ongoing service and/or distribution fee compensates BRIL and each broker-dealer for providing shareholder servicing and/or distribution related services to Service, Investor A, Investor B, Investor C and Class R shareholders.
For the six months ended March 31, 2013, affiliates earned underwriting discounts, direct commissions and dealer concessions on sales of the Funds’ Investor A Shares as follows:
| | | | |
| | | Investor A | |
Large Cap Core | | $ | 19,881 | |
Large Cap Growth | | $ | 28,470 | |
Large Cap Value | | $ | 6,357 | |
Large Cap Core Plus | | $ | 1,301 | |
For the six months ended March 31, 2013, the affiliates received the following CDSCs as follows:
| | | | | | | | | | | | |
| | | Investor A | | | Investor B | | | Investor C | |
Large Cap Core | | $ | 323 | | | $ | 7,546 | | | $ | 8,910 | |
Large Cap Growth | | $ | 2,151 | | | $ | 4,533 | | | $ | 8,797 | |
Large Cap Value | | $ | 235 | | | $ | 5,501 | | | $ | 3,157 | |
Large Cap Core Plus | | $ | — | | | $ | — | | | $ | 562 | |
Pursuant to written agreements, certain financial intermediaries, some of which may be affiliates, provide the Funds with sub-accounting, recordkeeping, sub-transfer agency and other administrative services with respect to sub-accounts they service. For these services, these entities receive an asset based fee or annual fee per shareholder account, which will vary depending on share class and/or net assets. For the six months ended March 31, 2013, the Funds paid the following to affiliates in return for these services, which is included in transfer agent — class specific in the Statements of Operations:
| | | | | | | | | | | | |
| | | Large Cap
Core | | | Large Cap
Growth | | | Large Cap
Value | |
Institutional | | $ | 69,030 | | | $ | 132,803 | | | $ | 37,861 | |
Service | | $ | 74 | | | $ | 147 | | | $ | 458 | |
Investor A | | $ | 661 | | | $ | 763 | | | $ | 8,786 | |
Investor C | | | — | | | | — | | | $ | 36 | |
The Manager/Administrator maintains a call center, which is responsible for providing certain shareholder services to the Funds, such as responding to shareholder inquiries and processing transactions based upon instructions from shareholders with respect to the subscription and redemption of Fund shares. For the six months ended March 31, 2013, the Funds reimbursed the Manager the following amounts for costs incurred in running the call center, which are included in transfer agent — class specific in the Statements of Operations:
| | | | | | | | | | | | | | | | |
| | | Large Cap
Core | | | Large Cap
Growth | | | Large Cap
Value | | | Large Cap
Core
Retirement | |
Institutional | | $ | 8,502 | | | $ | 908 | | | $ | 2,028 | | | | — | |
Service | | $ | 11 | | | $ | 1,075 | | | $ | 2,120 | | | | — | |
Investor A | | $ | 50,942 | | | $ | 4,233 | | | $ | 9,440 | | | | — | |
Investor B | | $ | 4,497 | | | $ | 217 | | | $ | 805 | | | | — | |
Investor C | | $ | 3,522 | | | $ | 1,366 | | | $ | 2,238 | | | | — | |
Class R | | $ | 291 | | | $ | 192 | | | $ | 435 | | | | — | |
Class K | | | — | | | | — | | | | — | | | $ | 156 | |
| | | | | | | | | | | | |
| | | Large Cap
Growth
Retirement | | | Large Cap
Value
Retirement | | | Large Cap
Core Plus | |
Institutional | | | — | | | | — | | | $ | 618 | |
Investor A | | | — | | | | — | | | $ | 302 | |
Investor C | | | — | | | | — | | | $ | 159 | |
Class K | | $ | 3 | | | $ | 219 | | | | — | |
Certain officers and/or directors of the Corporation are officers and/or directors of BlackRock or its affiliates. The Funds reimburse the Manager/Administrator for a portion of the compensation paid to the Corporation’s Chief Compliance Officer.
4. Investments:
With respect to Large Cap Core Plus, purchases and sales of investments, excluding short-term securities, for the six months ended March 31, 2013, were $14,688,204 and $18,246,172, respectively.
| | | | | | |
| | | | |
| | | | | | | |
| | BLACKROCK LARGE CAP SERIES FUNDS, INC. | | MARCH 31, 2013 | | 63 |
| | |
| | |
Notes to Financial Statements (continued) | | BlackRock Large Cap Series Funds, Inc. |
5. Income Tax Information:
As of September 30, 2012, the Funds had capital loss carryforwards available to offset future realized capital gains through the indicated expiration dates as follows:
| | | | | | | | | | | | |
| Expires September 30, | | Large Cap Core | | | Large Cap
Value | | | Large Cap
Core
Retirement | |
2016 | | | — | | | $ | 39,276,122 | | | $ | 9,577,005 | |
2017 | | $ | 541,931,905 | | | | 783,578,280 | | | | 24,488,876 | |
Total | | $ | 541,931,905 | | | $ | 822,854,402 | | | $ | 34,065,881 | |
| | | | | | | | | | | | | |
| | | | | | | | |
| Expires September 30, | | Large Cap
Value
Retirement | | | Large Cap
Core Plus | |
2016 | | | — | | | $ | 473,304 | |
2017 | | $ | 6,909,730 | | | | 5,739,252 | |
No expiration date1 | | | — | | | | 476,932 | |
Total | | $ | 6,909,730 | | | $ | 6,689,488 | |
| | | | | | | | | |
| | 1 | Must be utilized prior to losses subject to expiration. |
As of March 31, 2013, gross unrealized appreciation and gross unrealized depreciation based on cost for federal income tax purposes for BlackRock Large Cap Core Plus were as follows:
| | | | |
Tax cost | | $ | 39,267,354 | |
Gross unrealized appreciation | | $ | 8,769,245 | |
Gross unrealized depreciation | | | (222,867 | ) |
Net unrealized appreciation | | $ | 8,546,378 | |
6. Borrowings:
The Corporation, on behalf of Large Cap Core Plus, along with certain other funds managed by the Manager and its affiliates, is a party to a $500 million credit agreement with a group of lenders. Large Cap Core Plus may borrow under the credit agreement to fund shareholder redemptions. Effective November 2011 to November 2012, the credit agreement had the following terms: a commitment fee of 0.065% per annum based on the Large Cap Core Plus’ pro rata share of the unused portion of the credit agreement and interest at a rate equal to the higher of (a) the one-month London Interbank Offered Rate (“LIBOR”) plus 0.80% per annum or (b) the Fed Funds rate plus 0.80% per annum on amounts borrowed. In addition, the Large Cap Core Plus paid administration and arrangement fees which were allocated to Large Cap Core Plus based on its net assets as of October 31, 2011. The credit agreement, which expired in November 2012, was renewed with the same terms until November 2013. Effective November 2012 to November
2013, the credit agreement has the following terms: a commitment fee of 0.065% per annum based on the Large Cap Core Plus’ pro rata share of the unused portion of the credit agreement and interest at a rate equal to the higher of (a) the one-month LIBOR plus 0.80% per annum or (b) the Fed Funds rate plus 0.80% per annum on amounts borrowed. In addition, Large Cap Core Plus paid administration and arrangement fees which were allocated to Large Cap Core Plus based on its net assets as of October 31, 2012. Large Cap Core Plus did not borrow under the credit agreement during the six months ended March 31, 2013.
7. Concentration, Market and Credit Risk:
In the normal course of business, Large Cap Core Plus invests in securities and enters into transactions where risks exist due to fluctuations in the market (market risk) or failure of the issuer of a security to meet all its obligations (issuer credit risk). The value of securities held by Large Cap Core Plus may decline in response to certain events, including those directly involving the issuers whose securities are owned by Large Cap Core Plus; conditions affecting the general economy; overall market changes; local, regional or global political, social or economic instability; and currency and interest rate and price fluctuations. Similar to issuer credit risk, Large Cap Core Plus may be exposed to counterparty credit risk, or the risk that an entity with which Large Cap Core Plus has unsettled or open transactions may fail to or be unable to perform on its commitments. Large Cap Core Plus manages counterparty credit risk by entering into transactions only with counterparties that it believes have the financial resources to honor their obligations and by monitoring the financial stability of those counterparties. Financial assets, which potentially expose Large Cap Core Plus to market, issuer and counterparty credit risks, consist principally of financial instruments and receivables due from counterparties. The extent of Large Cap Core Plus’ exposure to market, issuer and counterparty credit risks with respect to these financial assets is generally approximated by their value recorded in the Statements of Assets and Liabilities, less any collateral held by Large Cap Core Plus.
As of March 31, 2013, the Large Cap Core Plus invested a significant portion of its assets in securities in the Information Technology and Financials sectors. Changes in economic conditions affecting the Information Technology and Financials sectors would have a greater impact on Large Cap Core Plus and could affect the value, income and/or liquidity of positions in such securities.
8. Capital Share Transactions:
Transactions in capital shares for each class were as follows:
| | | | | | | | | | | | | | | | | | |
| | | Six Months Ended March 31, 2013 | | | | | Year Ended September 30, 2012 | |
| Large Cap Core | | Shares | | | Amount | | | | | Shares | | | Amount | |
Institutional | | | | | | | | | | | | | | | | | | |
Shares sold | | | 2,251,660 | | | $ | 28,706,992 | | | | | | 8,138,344 | | | $ | 92,670,541 | |
Shares issued in reinvestment of distributions. | | | 339,465 | | | | 4,209,368 | | | | | | 273,969 | | | | 2,956,372 | |
Shares redeemed | | | (4,050,364 | ) | | | (51,817,609 | ) | | | | | (17,613,124 | ) | | | (206,593,570 | ) |
Net decrease | | | (1,459,239 | ) | | $ | (18,901,249 | ) | | | | | (9,200,811 | ) | | $ | (110,966,657 | ) |
| | | | | | |
| | | | |
| | | | | | | |
| 64 | | BLACKROCK LARGE CAP SERIES FUNDS, INC. | | MARCH 31, 2013 | | |
| | |
| | |
Notes to Financial Statements (continued) | | BlackRock Large Cap Series Funds, Inc. |
| | | | | | | | | | | | | | | | | | |
| | | Six Months Ended March 31, 2013 | | | | | Year Ended September 30, 2012 | |
| Large Cap Core (concluded) | | Shares | | | Amount | | | | | Shares | | | Amount | |
Service | | | | | | | | | | | | | | | | | | |
Shares sold | | | — | | | | — | | | | | | 124,740 | | | $ | 1,392,412 | |
Shares issued in reinvestment of distributions | | | 9 | | | $ | 110 | | | | | | — | | | | — | |
Shares redeemed | | | (113,129 | ) | | | (1,405,000 | ) | | | | | (25,483 | ) | | | (291,347 | ) |
Net increase (decrease) | | | (113,120 | ) | | $ | (1,404,890 | ) | | | | | 99,257 | | | $ | 1,101,065 | |
| | | | | | | | | | | | | | | | | | |
Investor A | | | | | | | | | | | | | | | | | | |
Shares sold and automatic conversion of shares | | | 2,709,338 | | | $ | 34,070,584 | | | | | | 6,804,905 | | | $ | 78,385,318 | |
Shares issued in reinvestment of distributions | | | 503,391 | | | | 6,111,167 | | | | | | 242,472 | | | | 2,516,863 | |
Shares redeemed | | | (6,983,436 | ) | | | (87,535,710 | ) | | | | | (16,710,655 | ) | | | (191,010,119 | ) |
Net decrease | | | (3,770,707 | ) | | $ | (47,353,959 | ) | | | | | (9,663,278 | ) | | $ | (110,107,938 | ) |
| | | | | | | | | | | | | | | | | | |
Investor B | | | | | | | | | | | | | | | | | | |
Shares sold | | | 53,505 | | | $ | 624,355 | | | | | | 140,692 | | | $ | 1,493,635 | |
Shares issued in reinvestment of distributions | | | 3,598 | | | | 40,943 | | | | | | — | | | | — | |
Shares redeemed and automatic conversion of shares | | | (758,413 | ) | | | (8,885,316 | ) | | | | | (2,547,503 | ) | | | (27,235,842 | ) |
Net decrease | | | (701,310 | ) | | $ | (8,220,018 | ) | | | | | (2,406,811 | ) | | $ | (25,742,207 | ) |
| | | | | | | | | | | | | | | | | | |
Investor C | | | | | | | | | | | | | | | | | | |
Shares sold | | | 1,841,686 | | | $ | 21,309,418 | | | | | | 3,344,828 | | | $ | 35,082,126 | |
Shares issued in reinvestment of distributions | | | 34,820 | | | | 390,679 | | | | | | — | | | | — | |
Shares redeemed | | | (4,443,517 | ) | | | (51,348,822 | ) | | | | | (15,649,040 | ) | | | (162,374,990 | ) |
Net decrease | | | (2,567,011 | ) | | $ | (29,648,725 | ) | | | | | (12,304,212 | ) | | $ | (127,292,864 | ) |
| | | | | | | | | | | | | | | | | | |
Class R | | | | | | | | | | | | | | | | | | |
Shares sold | | | 480,860 | | | $ | 5,798,848 | | | | | | 1,235,236 | | | $ | 13,503,539 | |
Shares issued in reinvestment of distributions | | | 13,141 | | | | 153,359 | | | | | | — | | | | — | |
Shares redeemed | | | (1,096,908 | ) | | | (13,201,635 | ) | | | | | (2,508,361 | ) | | | (27,360,638 | ) |
Net decrease | | | (602,907 | ) | | $ | (7,249,428 | ) | | | | | (1,273,125 | ) | | $ | (13,857,099 | ) |
| | | | | | | | | | | | | | | | | | |
Total Net Decrease | | | (9,214,294 | ) | | $ | (112,778,269 | ) | | | | | (34,748,980 | ) | | $ | (386,865,700 | ) |
| | | | | | | | | | | | | | | | | | |
Large Cap Growth | | | | | | | | | | | | | | | | | | |
Institutional | | | | | | | | | | | | | | | | | | |
Shares sold | | | 6,001,540 | | | $ | 70,320,550 | | | | | | 9,400,619 | | | $ | 104,647,834 | |
Shares issued in reinvestment of dividends | | | 1,437,134 | | | | 16,153,387 | | | | | | 131,077 | | | | 1,335,674 | |
Shares redeemed | | | (2,656,529 | ) | | | (31,549,722 | ) | | | | | (19,512,594 | ) | | | (241,857,313 | ) |
Net increase (decrease) | | | 4,782,145 | | | $ | 54,924,215 | | | | | | (9,980,898 | ) | | $ | (135,873,805 | ) |
| | | | | | | | | | | | | | | | | | |
Service | | | | | | | | | | | | | | | | | | |
Shares sold | | | 36,263 | | | $ | 428,039 | | | | | | 166,361 | | | $ | 1,903,338 | |
Shares issued in reinvestment of dividends | | | 73,804 | | | | 822,914 | | | | | | 647 | | | | 6,547 | |
Shares redeemed | | | (128,963 | ) | | | (1,514,339 | ) | | | | | (340,751 | ) | | | (3,967,868 | ) |
Net decrease | | | (18,896 | ) | | $ | (263,386 | ) | | | | | (173,743 | ) | | $ | (2,057,983 | ) |
| | | | | | | | | | | | | | | | | | |
Investor A | | | | | | | | | | | | | | | | | | |
Shares sold and automatic conversion of shares | | | 5,884,212 | | | $ | 65,980,190 | | | | | | 7,483,172 | | | $ | 84,093,980 | |
Shares issued in reinvestment of dividends | | | 474,969 | | | | 5,153,415 | | | | | | 57,008 | | | | 563,246 | |
Shares redeemed | | | (4,114,378 | ) | | | (47,067,126 | ) | | | | | (8,388,045 | ) | | | (93,609,288 | ) |
Net increase (decrease) | | | 2,244,803 | | | $ | 24,066,479 | | | | | | (847,865 | ) | | $ | (8,952,062 | ) |
| | | | | | |
| | | | |
| | | | | | | |
| | BLACKROCK LARGE CAP SERIES FUNDS, INC. | | MARCH 31, 2013 | | 65 |
| | |
| | |
Notes to Financial Statements (continued) | | BlackRock Large Cap Series Funds, Inc. |
| | | | | | | | | | | | | | | | | | |
| | | Six Months Ended March 31, 2013 | | | | | Year Ended September 30, 2012 | |
| Large Cap Growth (concluded) | | Shares | | | Amount | | | | | Shares | | | Amount | |
Investor B | | | | | | | | | | | | | | | | | | |
Shares sold | | | 57,703 | | | $ | 578,414 | | | | | | 82,116 | | | $ | 829,374 | |
Shares issued in reinvestment of distributions | | | 11,867 | | | | 116,887 | | | | | | — | | | | — | |
Shares redeemed and automatic conversion of shares | | | (203,569 | ) | | | (2,109,864 | ) | | | | | (594,894 | ) | | | (6,012,451 | ) |
Net decrease | | | (133,999 | ) | | $ | (1,414,563 | ) | | | | | (512,778 | ) | | $ | (5,183,077 | ) |
| | | | | | | | | | | | | | | | | | |
Investor C | | | | | | | | | | | | | | | | | | |
Shares sold | | | 2,360,353 | | | $ | 23,858,202 | | | | | | 3,920,550 | | | $ | 39,322,961 | |
Shares issued in reinvestment of distributions | | | 165,844 | | | | 1,628,585 | | | | | | — | | | | — | |
Shares redeemed | | | (2,260,069 | ) | | | (23,403,344 | ) | | | | | (3,928,882 | ) | | | (39,899,588 | ) |
Net increase (decrease) | | | 266,128 | | | $ | 2,083,443 | | | | | | (8,332 | ) | | $ | (576,627 | ) |
| | | | | | | | | | | | | | | | | | |
Class R | | | | | | | | | | | | | | | | | | |
Shares sold | | | 487,393 | | | $ | 5,255,149 | | | | | | 867,102 | | | $ | 9,247,451 | |
Shares issued in reinvestment of distributions | | | 32,363 | | | | 336,248 | | | | | | — | | | | — | |
Shares redeemed | | | (729,887 | ) | | | (8,048,593 | ) | | | | | (1,742,893 | ) | | | (18,591,354 | ) |
Net decrease | | | (210,131 | ) | | $ | (2,457,196 | ) | | | | | (875,791 | ) | | $ | (9,343,903 | ) |
| | | | | | | | | | | | | | | | | | |
Total Net Increase (Decrease) | | | 6,930,050 | | | $ | 76,938,992 | | | | | | (12,399,407 | ) | | $ | (161,987,457 | ) |
| | | | | |
Large Cap Value | | | | | | | | | | | | | | | | | | |
Institutional | | | | | | | | | | | | | | | | | | |
Shares sold | | | 885,656 | | | $ | 14,461,434 | | | | | | 3,729,269 | | | $ | 55,426,056 | |
Shares issued in reinvestment of dividends | | | 174,010 | | | | 2,745,880 | | | | | | 233,302 | | | | 3,198,578 | |
Shares redeemed | | | (5,338,069 | ) | | | (87,897,614 | ) | | | | | (16,590,308 | ) | | | (249,495,507 | ) |
Net decrease | | | (4,278,403 | ) | | $ | (70,690,300 | ) | | | | | (12,627,737 | ) | | $ | (190,870,873 | ) |
| | | | | | | | | | | | | | | | | | |
Service | | | | | | | | | | | | | | | | | | |
Shares sold | | | 21,656 | | | $ | 349,930 | | | | | | 62,275 | | | $ | 886,931 | |
Shares issued in reinvestment of dividends | | | 33,961 | | | | 534,550 | | | | | | 20,001 | | | | 273,611 | |
Shares redeemed | | | (160,509 | ) | | | (2,602,527 | ) | | | | | (575,217 | ) | | | (8,540,400 | ) |
Net decrease | | | (104,892 | ) | | $ | (1,718,047 | ) | | | | | (492,941 | ) | | $ | (7,379,858 | ) |
| | | | | | | | | | | | | | | | | | |
Investor A | | | | | | | | | | | | | | | | | | |
Shares sold and automatic conversion of shares | | | 2,088,332 | | | $ | 34,108,158 | | | | | | 4,286,663 | | | $ | 62,540,744 | |
Shares issued in reinvestment of dividends | | | 276,521 | | | | 4,297,148 | | | | | | 231,251 | | | | 3,124,215 | |
Shares redeemed | | | (5,540,027 | ) | | | (89,037,710 | ) | | | | | (17,451,096 | ) | | | (254,087,923 | ) |
Net decrease | | | (3,175,174 | ) | | $ | (50,632,404 | ) | | | | | (12,933,182 | ) | | $ | (188,422,964 | ) |
| | | | | | | | | | | | | | | | | | |
Investor B | | | | | | | | | | | | | | | | | | |
Shares sold | | | 31,373 | | | $ | 475,398 | | | | | | 76,146 | | | $ | 1,045,404 | |
Shares issued in reinvestment of distributions | | | 2,704 | | | | 39,856 | | | | | | — | | | | — | |
Shares redeemed and automatic conversion of shares | | | (322,556 | ) | | | (4,905,281 | ) | | | | | (896,691 | ) | | | (12,483,717 | ) |
Net decrease | | | (288,479 | ) | | $ | (4,390,027 | ) | | | | | (820,545 | ) | | $ | (11,438,313 | ) |
| | | | | | | | | | | | | | | | | | |
Investor C | | | | | | | | | | | | | | | | | | |
Shares sold | | | 856,264 | | | $ | 12,871,824 | | | | | | 1,762,996 | | | $ | 24,136,262 | |
Shares issued in reinvestment of distributions | | | 29,514 | | | | 430,908 | | | | | | — | | | | — | |
Shares redeemed | | | (2,671,941 | ) | | | (40,177,484 | ) | | | | | (6,006,353 | ) | | | (82,289,406 | ) |
Net decrease | | | (1,786,163 | ) | | $ | (26,874,752 | ) | | | | | (4,243,357 | ) | | $ | (58,153,144 | ) |
| | | | | | |
| | | | | | | |
| 66 | | BLACKROCK LARGE CAP SERIES FUNDS, INC. | | MARCH 31, 2013 | | |
| | |
| | |
Notes to Financial Statements (continued) | | BlackRock Large Cap Series Funds, Inc. |
| | | | | | | | | | | | | | | | | | |
| | | Six Months Ended March 31, 2013 | | | | | Year Ended September 30, 2012 | |
| Large Cap Value (concluded) | | Shares | | | Amount | | | | | Shares | | | Amount | |
Class R | | | | | | | | | | | | | | | | | | |
Shares sold | | | 498,591 | | | $ | 7,848,683 | | | | | | 1,089,126 | | | $ | 15,322,685 | |
Shares issued in reinvestment of dividends | | | 15,435 | | | | 231,836 | | | | | | 20,429 | | | | 266,800 | |
Shares redeemed | | | (1,194,628 | ) | | | (18,490,773 | ) | | | | | (2,696,522 | ) | | | (38,133,896 | ) |
Net decrease | | | (680,602 | ) | | $ | (10,410,254 | ) | | | | | (1,586,967 | ) | | $ | (22,544,411 | ) |
| | | | | | | | | | | | | | | | | | |
Total Net Decrease | | | (10,313,713 | ) | | $ | (164,715,784 | ) | | | | | (32,704,729 | ) | | $ | (478,809,563 | ) |
| | | | | |
Large Cap Core Retirement | | | | | | | | | | | | | | | | | | |
Class K | | | | | | | | | | | | | | | | | | |
Shares sold | | | 591,908 | | | $ | 7,499,076 | | | | | | 8,082,849 | | | $ | 90,932,022 | |
Shares issued in reinvestment of distributions | | | 112,565 | | | | 1,377,803 | | | | | | 146,850 | | | | 1,539,158 | |
Shares redeemed | | | (2,262,457 | ) | | | (28,626,231 | ) | | | | | (14,978,366 | ) | | | (179,156,312 | ) |
Net decrease | | | (1,557,984 | ) | | $ | (19,749,352 | ) | | | | | (6,748,667 | ) | | $ | (86,685,132 | ) |
| | | | | |
Large Cap Growth Retirement | | | | | | | | | | | | | | | | | | |
Class K | | | | | | | | | | | | | | | | | | |
Shares sold | | | 17,375 | | | $ | 114,152 | | | | | | 2,138,394 | | | $ | 24,055,829 | |
Shares issued in reinvestment of distributions | | | 1,729 | | | | 11,365 | | | | | | 88,991 | | | | 899,819 | |
Shares redeemed | | | (14,255 | ) | | | (111,157 | ) | | | | | (12,559,957 | ) | | | (151,950,634 | ) |
Net increase (decrease) | | | 4,849 | | | $ | 14,360 | | | | | | (10,332,572 | ) | | $ | (126,994,986 | ) |
| | | | | |
Large Cap Value Retirement | | | | | | | | | | | | | | | | | | |
Class K | | | | | | | | | | | | | | | | | | |
Shares sold | | | 684,794 | | | $ | 11,279,877 | | | | | | 1,811,314 | | | $ | 27,122,890 | |
Shares issued in reinvestment of distributions | | | 138,136 | | | | 2,207,412 | | | | | | 163,003 | | | | 2,254,488 | |
Shares redeemed | | | (567,601 | ) | | | (9,295,199 | ) | | | | | (6,698,808 | ) | | | (105,511,160 | ) |
Net increase (decrease) | | | 255,329 | | | $ | 4,192,090 | | | | | | (4,724,491 | ) | | $ | (76,133,782 | ) |
| | | | | |
Large Cap Core Plus | | | | | | | | | | | | | | | | | | |
Institutional | | | | | | | | | | | | | | | | | | |
Shares sold | | | 184,192 | | | $ | 2,008,319 | | | | | | 1,678,905 | | | $ | 15,932,506 | |
Shares issued in reinvestment of distributions | | | 170 | | | | 1,803 | | | | | | — | | | | — | |
Shares redeemed | | | (307,957 | ) | | | (3,330,229 | ) | | | | | (2,596,959 | ) | | | (25,985,705 | ) |
Net decrease | | | (123,595 | ) | | $ | (1,320,107 | ) | | | | | (918,054 | ) | | $ | (10,053,199 | ) |
| | | | | | | | | | | | | | | | | | |
Investor A | | | | | | | | | | | | | | | | | | |
Shares sold | | | 104,514 | | | $ | 1,149,687 | | | | | | 990,111 | | | $ | 9,222,606 | |
Shares redeemed | | | (150,591 | ) | | | (1,610,606 | ) | | | | | (803,051 | ) | | | (7,675,280 | ) |
Net increase (decrease) | | | (46,077 | ) | | $ | (460,919 | ) | | | | | 187,060 | | | $ | 1,547,326 | |
| | | | | | | | | | | | | | | | | | |
Investor C | | | | | | | | | | | | | | | | | | |
Shares sold | | | 41,234 | | | $ | 430,283 | | | | | | 174,291 | | | $ | 1,627,175 | |
Shares redeemed | | | (55,386 | ) | | | (577,011 | ) | | | | | (363,011 | ) | | | (3,412,248 | ) |
Net decrease | | | (14,152 | ) | | $ | (146,728 | ) | | | | | (188,720 | ) | | $ | (1,785,073 | ) |
| | | | | | | | | | | | | | | | | | |
Total Net Decrease | | | (183,824 | ) | | $ | (1,927,754 | ) | | | | | (919,714 | ) | | $ | (10,290,946 | ) |
| | | | | | |
| | | | | | | |
| | BLACKROCK LARGE CAP SERIES FUNDS, INC. | | MARCH 31, 2013 | | 67 |
| | |
| | |
Notes to Financial Statements (concluded) | | BlackRock Large Cap Series Funds, Inc. |
9. Subsequent Events:
Management’s evaluation of the impact of all subsequent events on the Funds’ financial statements was completed through the date the financial statements were issued and the following item was noted:
Effective April 25, 2013, the credit agreement was terminated and a new agreement was entered into. Large Cap Core Plus became a party to a 364-day, $800 million credit agreement, which expires in April 2014. Excluding commitments designated for a certain individual fund, Large Cap Core Plus can borrow up to an aggregate commitment amount of $500 million, subject to asset coverage and other limitations as specified in the agreement. The credit agreement has the following terms: a fee of 0.065% per annum on unused commitment amounts and interest at a rate equal to the higher of (a) the one-month LIBOR plus 0.80% per annum or (b) the Fed Funds rate plus 0.80% per annum on amounts borrowed.
| | | | | | |
| | | | | | | |
| 68 | | BLACKROCK LARGE CAP SERIES FUNDS, INC. | | MARCH 31, 2013 | | |
| | |
| | |
Portfolio Information as of March 31, 2013 (Unaudited) | | Master Large Cap Series LLC |
| | | | | |
| |
| Master Large Cap Core Portfolio | | Percent of
Long-Term
Investments |
Google, Inc., Class A | | | | 4 | % |
Pfizer, Inc. | | | | 3 | |
JPMorgan Chase & Co. | | | | 3 | |
Merck & Co., Inc. | | | | 3 | |
Apple, Inc. | | | | 3 | |
Bank of America Corp. | | | | 3 | |
News Corp., Class A | | | | 3 | |
3M Co. | | | | 3 | |
Citigroup, Inc. | | | | 3 | |
CVS Caremark Corp. | | | | 3 | |
| |
| Master Large Cap Growth Portfolio | | Percent of
Long-Term
Investments |
Apple, Inc. | | | | 6 | % |
Google, Inc., Class A | | | | 5 | |
Microsoft Corp. | | | | 4 | |
International Business Machines Corp. | | | | 4 | |
Philip Morris International, Inc. | | | | 3 | |
3M Co. | | | | 3 | |
Mastercard, Inc., Class A | | | | 3 | |
Oracle Corp. | | | | 3 | |
The Coca-Cola Co. | | | | 3 | |
News Corp., Class A | | | | 3 | |
| |
| Master Large Cap Value Portfolio | | Percent of
Long-Term
Investments |
Pfizer, Inc. | | | | 5 | % |
Chevron Corp. | | | | 5 | |
Exxon Mobil Corp. | | | | 5 | |
JPMorgan Chase & Co. | | | | 4 | |
Merck & Co., Inc. | | | | 4 | |
Bank of America Corp. | | | | 4 | |
Citigroup, Inc. | | | | 4 | |
News Corp., Class A | | | | 3 | |
U.S. Bancorp. | | | | 3 | |
CVS Caremark Corp. | | | | 3 | |
| | | | | |
| |
| Master Large Cap Core Portfolio | | Percent of
Long-Term
Investments |
Information Technology | | | | 21 | % |
Financials | | | | 20 | |
Health Care | | | | 12 | |
Industrials | | | | 12 | |
Energy | | | | 12 | |
Consumer Discretionary | | | | 12 | |
Consumer Staples | | | | 6 | |
Materials | | | | 4 | |
Telecommunication Services | | | | 1 | |
| |
| Master Large Cap Growth Portfolio | | Percent of
Long-Term
Investments |
Information Technology | | | | 33 | % |
Industrials | | | | 15 | |
Consumer Discretionary | | | | 15 | |
Consumer Staples | | | | 10 | |
Health Care | | | | 10 | |
Materials | | | | 6 | |
Energy | | | | 5 | |
Financials | | | | 5 | |
Telecommunication Services | | | | 1 | |
| |
| Master Large Cap Value Portfolio | | Percent of
Long-Term
Investments |
Financials | | | | 29 | % |
Energy | | | | 17 | |
Industrials | | | | 14 | |
Health Care | | | | 12 | |
Consumer Discretionary | | | | 9 | |
Information Technology | | | | 7 | |
Materials | | | | 5 | |
Consumer Staples | | | | 5 | |
Telecommunication Services | | | | 2 | |
For Portfolio compliance purposes, the Portfolios’ classifications refer to any one or more of the sub-classifications used by one or more widely recognized market indexes or ratings group indexes, and/or as defined by Portfolio management. These definitions may not apply for purposes of this report, which may combine sector sub-classifications for reporting ease.
| | | | | | |
| | | | | | | |
| | BLACKROCK LARGE CAP SERIES FUNDS, INC. | | MARCH 31, 2013 | | 69 |
| | |
| | |
Schedule of Investments March 31, 2013 (Unaudited) | | Master Large Cap Core Portfolio (Percentages shown are based on Net Assets) |
| | | | | | | | |
| Common Stocks | | Shares | | | Value | |
| |
Aerospace & Defense — 0.9% | |
The Boeing Co. | | | 246,900 | | | $ | 21,196,365 | |
| |
Airlines — 3.7% | |
Copa Holdings SA, Class A | | | 113,100 | | | | 13,527,891 | |
Delta Air Lines, Inc. (a) | | | 1,303,925 | | | | 21,527,802 | |
United Continental Holdings, Inc. (a)(b) | | | 1,531,920 | | | | 49,036,759 | |
| | | | | | | | |
| | | | | | | 84,092,452 | |
| |
Auto Components — 1.0% | |
TRW Automotive Holdings Corp. (a) | | | 429,393 | | | | 23,616,615 | |
| |
Beverages — 1.5% | |
The Coca-Cola Co. | | | 851,575 | | | | 34,437,693 | |
| |
Capital Markets — 1.5% | |
The Goldman Sachs Group, Inc. | | | 227,131 | | | | 33,422,327 | |
| |
Chemicals — 0.3% | |
Cabot Corp. | | | 203,874 | | | | 6,972,491 | |
| |
Commercial Banks — 3.5% | |
SunTrust Banks, Inc. (a) | | | 852,700 | | | | 24,566,287 | |
U.S. Bancorp | | | 1,650,775 | | | | 56,010,796 | |
| | | | | | | | |
| | | | | | | 80,577,083 | |
| |
Commercial Services & Supplies — 0.7% | |
Tyco International Ltd. | | | 468,900 | | | | 15,004,800 | |
| |
Computers & Peripherals — 4.1% | |
Apple, Inc. | | | 145,750 | | | | 64,513,323 | |
EMC Corp. (a) | | | 1,210,900 | | | | 28,928,401 | |
| | | | | | | | |
| | | | | | | 93,441,724 | |
| |
Construction & Engineering — 1.1% | |
KBR, Inc. | | | 799,900 | | | | 25,660,792 | |
| |
Consumer Finance — 1.8% | |
Discover Financial Services | | | 938,300 | | | | 42,073,372 | |
| |
Containers & Packaging — 1.8% | |
Packaging Corp. of America | | | 627,613 | | | | 28,160,995 | |
Rock-Tenn Co., Class A | | | 136,694 | | | | 12,683,836 | |
| | | | | | | | |
| | | | | | | 40,844,831 | |
| |
Diversified Financial Services — 8.6% | |
Bank of America Corp. | | | 5,296,300 | | | | 64,508,934 | |
Citigroup, Inc. | | | 1,395,018 | | | | 61,715,596 | |
JPMorgan Chase & Co. | | | 1,450,024 | | | | 68,818,139 | |
| | | | | | | | |
| | | | | | | 195,042,669 | |
| |
Diversified Telecommunication Services — 1.1% | |
Verizon Communications, Inc. | | | 492,900 | | | | 24,226,035 | |
| |
Electronic Equipment, Instruments & Components — 0.7% | |
Avnet, Inc. (a) | | | 434,200 | | | | 15,718,040 | |
| |
Energy Equipment & Services — 0.7% | |
Oceaneering International, Inc. | | | 223,800 | | | | 14,862,558 | |
| |
Food & Staples Retailing — 4.1% | |
CVS Caremark Corp. | | | 1,056,825 | | | | 58,114,807 | |
Wal-Mart Stores, Inc. | | | 473,050 | | | | 35,398,331 | |
| | | | | | | | |
| | | | | | | 93,513,138 | |
| |
Health Care Equipment & Supplies — 0.9% | |
Abbott Laboratories | | | 554,900 | | | | 19,599,068 | |
| |
Health Care Providers & Services — 1.4% | |
McKesson Corp. | | | 294,425 | | | | 31,786,123 | |
| |
Industrial Conglomerates — 3.4% | |
3M Co. | | | 585,975 | | | | 62,295,002 | |
| | | | | | | | |
| Common Stocks | | Shares | | | Value | |
| |
Industrial Conglomerates (concluded) | |
General Electric Co. | | | 605,250 | | | $ | 13,993,380 | |
| | | | | | | | |
| | | | | | | 76,288,382 | |
| |
Insurance — 4.6% | |
Allied World Assurance Co. Holdings AG | | | 75,500 | | | | 7,000,360 | |
American Financial Group, Inc. | | | 106,700 | | | | 5,055,446 | |
American International Group, Inc. (a) | | | 765,500 | | | | 29,716,710 | |
The Chubb Corp. | | | 171,700 | | | | 15,028,901 | |
Everest Re Group Ltd. | | | 9,500 | | | | 1,233,670 | |
PartnerRe Ltd. (b) | | | 141,500 | | | | 13,175,065 | |
The Travelers Cos., Inc. | | | 405,900 | | | | 34,172,721 | |
| | | | | | | | |
| | | | | | | 105,382,873 | |
| |
Internet Software & Services — 3.8% | |
Google, Inc., Class A (a) | | | 110,275 | | | | 87,561,658 | |
| |
IT Services — 5.4% | |
International Business Machines Corp. | | | 105,150 | | | | 22,428,495 | |
Mastercard, Inc., Class A | | | 107,250 | | | | 58,036,193 | |
Teradata Corp. (a) | | | 709,200 | | | | 41,495,292 | |
| | | | | | | | |
| | | | | | | 121,959,980 | |
| |
Life Sciences Tools & Services — 1.2% | |
Agilent Technologies, Inc. | | | 641,500 | | | | 26,923,755 | |
| |
Machinery — 2.0% | |
Ingersoll-Rand Plc | | | 535,900 | | | | 29,479,859 | |
Oshkosh Corp. (a) | | | 387,800 | | | | 16,477,622 | |
| | | | | | | | |
| | | | | | | 45,957,481 | |
| |
Media — 6.3% | |
Comcast Corp., Class A | | | 1,241,200 | | | | 52,142,812 | |
News Corp., Class A | | | 2,050,250 | | | | 62,573,630 | |
Time Warner Cable, Inc. | | | 306,180 | | | | 29,411,651 | |
| | | | | | | | |
| | | | | | | 144,128,093 | |
| |
Multiline Retail — 0.9% | |
Dillard’s, Inc., Class A | | | 257,065 | | | | 20,192,456 | |
| |
Oil, Gas & Consumable Fuels — 10.9% | |
Chevron Corp. | | | 405,775 | | | | 48,214,186 | |
Exxon Mobil Corp. | | | 546,100 | | | | 49,209,071 | |
Marathon Oil Corp. | | | 787,075 | | | | 26,540,169 | |
Marathon Petroleum Corp. | | | 547,050 | | | | 49,015,680 | |
PBF Energy, Inc. | | | 555,238 | | | | 20,638,196 | |
Suncor Energy, Inc. | | | 1,345,940 | | | | 40,391,659 | |
Tesoro Corp. | | | 242,093 | | | | 14,174,545 | |
| | | | | | | | |
| | | | | | | 248,183,506 | |
| |
Paper & Forest Products — 2.3% | |
Domtar Corp. | | | 168,300 | | | | 13,063,446 | |
International Paper Co. | | | 841,300 | | | | 39,187,754 | |
| | | | | | | | |
| | | | | | | 52,251,200 | |
| |
Pharmaceuticals — 8.7% | |
AbbVie, Inc. | | | 532,900 | | | | 21,731,662 | |
Eli Lilly & Co. | | | 402,175 | | | | 22,839,518 | |
Johnson & Johnson | | | 124,225 | | | | 10,128,064 | |
Merck & Co., Inc. | | | 1,483,650 | | | | 65,621,839 | |
Pfizer, Inc. | | | 2,582,175 | | | | 74,521,571 | |
Zoetis, Inc. | | | 99,300 | | | | 3,316,620 | |
| | | | | | | | |
| | | | | | | 198,159,274 | |
| |
Semiconductors & Semiconductor Equipment — 1.8% | |
KLA-Tencor Corp. | | | 565,475 | | | | 29,823,151 | |
| | | | | | |
See Notes to Financial Statements. | | | | |
| | | | | | | |
| 70 | | BLACKROCK LARGE CAP SERIES FUNDS, INC. | | MARCH 31, 2013 | | |
| | |
| | |
Schedule of Investments (continued) | | Master Large Cap Core Portfolio (Percentages shown are based on Net Assets) |
| | | | | | | | |
| Common Stocks | | Shares | | | Value | |
| |
Semiconductors & Semiconductor Equipment (concluded) | |
Teradyne, Inc. (a)(b) | | | 716,600 | | | $ | 11,623,252 | |
| | | | | | | | |
| | | | | | | 41,446,403 | |
| |
Software — 5.2% | | | | | | | | |
Activision Blizzard, Inc. | | | 1,604,900 | | | | 23,383,393 | |
Microsoft Corp. | | | 1,859,650 | | | | 53,204,587 | |
Oracle Corp. | | | 1,321,600 | | | | 42,740,544 | |
| | | | | | | | |
| | | | | | | 119,328,524 | |
| |
Specialty Retail — 2.2% | | | | | | | | |
PetSmart, Inc. | | | 195,835 | | | | 12,161,354 | |
Ross Stores, Inc. | | | 636,900 | | | | 38,608,878 | |
| | | | | | | | |
| | | | | | | 50,770,232 | |
| |
Textiles, Apparel & Luxury Goods — 0.9% | |
NIKE, Inc., Class B | | | 328,974 | | | | 19,412,756 | |
| |
Tobacco — 0.1% | | | | | | | | |
Philip Morris International, Inc. | | | 35,775 | | | | 3,316,700 | |
| |
Total Long-Term Investments | | | | | | | | |
(Cost — $1,758,631,284) — 99.1% | | | | | | | 2,257,351,449 | |
| |
| | | | | | | | |
| | | | | | | | |
| | | | | | | | |
| Short-Term Securities | | Shares | | | Value | |
| |
BlackRock Liquidity Funds, TempFund, Institutional
Class, 0.09% (c)(d) | | | 22,119,874 | | | $ | 22,119,874 | |
| |
| | | Beneficial
Interest
(000) | | | | |
| |
BlackRock Liquidity Series, LLC Money Market
Series, 0.23% (c)(d)(e) | | $ | 15,024 | | | | 15,023,875 | |
| |
| | |
| | | Par (000) | | | | |
| |
Time Deposits — 0.0% | | | | | | | | |
Brown Brothers Harriman & Co.,
0.08%, 4/01/13 | | | 441 | | | | 440,968 | |
| |
Total Short-Term Securities | | | | | | | | |
(Cost — $37,584,717) — 1.6% | | | | | | | 37,584,717 | |
| |
Total Investments (Cost — $1,796,216,001*) —100.7% | | | | 2,294,936,166 | |
Liabilities in Excess of Other Assets — (0.7)% | | | | (16,032,358 | ) |
| | | | | | | | |
Net Assets — 100.0% | | | | | | $ | 2,278,903,808 | |
| | | | | | | | |
| | | | | | | | |
|
Notes to Schedule of Investments |
| * | As of March 31, 2013, gross unrealized appreciation and gross unrealized depreciation based on cost for federal income tax purposes were as follows: |
| | | | |
Tax cost | | $ | 1,794,329,467 | |
| | | | |
Gross unrealized appreciation | | $ | 509,780,530 | |
Gross unrealized depreciation | | | (9,173,831 | ) |
| | | | |
Net unrealized appreciation | | $ | 500,606,699 | |
| | | | |
| (a) | Non-income producing security. |
| (b) | Security, or a portion of security, is on loan. |
| (c) | Investments in issuers considered to be an affiliate of the Portfolio during the period ended March 31, 2013, for purposes of Section 2(a)(3) of the Investment Company Act of 1940, as amended, were as follows: |
| | | | | | | | | | | | | | | | |
| Affiliate | | Shares/Beneficial
Interest Held at September 30, 2012 | | | Net Activity | | | Shares/Beneficial
Interest Held at
March 31, 2013 | | | Income | |
BlackRock Liquidity Funds, TempFund, Institutional Class | | | 40,033,302 | | | | (17,913,428 | ) | | | 22,119,874 | | | | $10,394 | |
BlackRock Liquidity Series, LLC Money Market Series | | | $22,802,709 | | | | $ (7,778,834 | ) | | | $15,023,875 | | | | $11,443 | |
| (d) | Represents the current yield as of report date. |
| (e) | Security was purchased with the cash collateral from loaned securities. The Portfolio may withdraw up to 25% of its investment daily, although the manager of the BlackRock Liquidity Series, LLC Money Market Series, in its sole discretion, may permit an investor to withdraw more than 25% on any one day. |
| — | | For Portfolio compliance purposes, the Portfolio’s industry classifications refer to any one or more of the industry sub-classifications used by one or more widely recognized market indexes or ratings group indexes, and/or as defined by Portfolio management. These definitions may not apply for purposes of this report, which may combine such industry sub-classifications for reporting ease. |
| — | | Fair Value Measurements — Various inputs are used in determining the fair value of investments. These inputs to valuation techniques are categorized into a disclosure hierarchy consisting of three broad levels for financial statement purposes as follows: |
| | — | | Level 1 – unadjusted price quotations in active markets/exchanges for identical assets and liabilities that the Portfolio has the ability to access |
| | — | | Level 2 – other observable inputs (including, but not limited to, quoted prices for similar assets or liabilities in markets that are active, quoted prices for identical or similar assets or liabilities in markets that are not active, inputs other than quoted prices that are observable for the assets or liabilities (such as interest rates, yield curves, volatilities, prepayment speeds, loss severities, credit risks and default rates) or other market–corroborated inputs) |
| | — | | Level 3 – unobservable inputs based on the best information available in the circumstances, to the extent observable inputs are not available (including the Portfolio’s own assumptions used in determining the fair value of investments) |
| | | | | | |
See Notes to Financial Statements. | | | | |
| | | | | | | |
| | BLACKROCK LARGE CAP SERIES FUNDS, INC. | | MARCH 31, 2013 | | 71 |
| | |
| | |
Schedule of Investments (concluded) | | Master Large Cap Core Portfolio |
The hierarchy gives the highest priority to unadjusted quoted prices in active markets for identical assets or liabilities (Level 1 measurements) and the lowest priority to unobservable inputs (Level 3 measurements). Accordingly, the degree of judgment exercised in determining fair value is greatest for instruments categorized in Level 3. The inputs used to measure fair value may fall into different levels of the fair value hierarchy. In such cases, for disclosure purposes, the level in the fair value hierarchy within which the fair value measurement falls in its entirety is determined based on the lowest level input that is significant to the fair value measurement in its entirety.
Changes in valuation techniques may result in transfers into or out of an assigned level within the disclosure hierarchy. In accordance with the Portfolio’s policy, transfers between different levels of the fair value disclosure hierarchy are deemed to have occurred as of the beginning of the reporting period. The categorization of a value determined for investments is based on the pricing transparency of the investment and is not necessarily an indication of the risks associated with investing in those securities. For information about the Portfolio’s policy regarding valuation of investments and other significant accounting policies, please refer to Note 1 of the Notes to Financial Statements.
The following table summarizes the Portfolio’s investments categorized in the disclosure hierarchy as of March 31, 2013:
| | | | | | | | | | | | | | |
| | | Level 1 | | | Level 2 | | | Level 3 | | Total | |
Assets: | | | | | | | | | | | | | | |
Investments: | | | | | | | | | | | | | | |
Long-Term Investments1 | | | $2,257,351,449 | | | | — | | | — | | | $2,257,351,449 | |
Short-Term Securities | | | 22,560,842 | | | $ | 15,023,875 | | | — | | | 37,584,717 | |
Total | | | $2,279,912,291 | | | $ | 15,023,875 | | | — | | | $2,294,936,166 | |
| | 1 | See above Schedule of Investments for values in each industry. |
Certain of the Portfolio’s liabilities are held at carrying amount, which approximates fair value for financial statement purposes. As of March 31, 2013, collateral on securities loaned at value of $15,023,875 is categorized as Level 2 within the disclosure hierarchy.
There were no transfers between levels during the period ended March 31, 2013.
| | | | | | |
See Notes to Financial Statements. | | | | |
| | | | | | | |
| 72 | | BLACKROCK LARGE CAP SERIES FUNDS, INC. | | MARCH 31, 2013 | | |
| | |
| | |
Schedule of Investments March 31, 2013 (Unaudited) | | Master Large Cap Growth Portfolio (Percentages shown are based on Net Assets) |
| | | | | | | | |
| Common Stocks | | Shares | | | Value | |
| |
Aerospace & Defense — 1.9% | | | | | | | | |
The Boeing Co. | | | 212,275 | | | $ | 18,223,809 | |
| |
Airlines — 4.3% | | | | | | | | |
Copa Holdings SA, Class A | | | 98,300 | | | | 11,757,663 | |
Delta Air Lines, Inc. (a) | | | 582,300 | | | | 9,613,773 | |
United Continental Holdings, Inc. (a) | | | 660,402 | | | | 21,139,468 | |
| | | | | | | | |
| | | | | | | 42,510,904 | |
| |
Beverages — 2.5% | | | | | | | | |
The Coca-Cola Co. | | | 613,800 | | | | 24,822,072 | |
| |
Biotechnology — 0.3% | | | | | | | | |
Myriad Genetics, Inc. (a) | | | 120,200 | | | | 3,053,080 | |
| |
Chemicals — 1.9% | | | | | | | | |
CF Industries Holdings, Inc. | | | 24,750 | | | | 4,711,657 | |
PPG Industries, Inc. | | | 105,775 | | | | 14,167,503 | |
| | | | | | | | |
| | | | | | | 18,879,160 | |
| |
Commercial Banks — 2.0% | | | | | | | | |
U.S. Bancorp | | | 575,900 | | | | 19,540,287 | |
| |
Commercial Services & Supplies — 1.0% | | | | | |
Covanta Holding Corp. | | | 492,175 | | | | 9,917,326 | |
| |
Computers & Peripherals — 7.6% | | | | | | | | |
Apple, Inc. | | | 125,875 | | | | 55,716,051 | |
EMC Corp. (a) | | | 786,700 | | | | 18,794,263 | |
| | | | | | | | |
| | | | | | | 74,510,314 | |
| |
Construction & Engineering — 1.1% | | | | | | | | |
KBR, Inc. | | | 337,400 | | | | 10,823,792 | |
| |
Consumer Finance — 1.1% | | | | | | | | |
Discover Financial Services | | | 248,125 | | | | 11,125,925 | |
| |
Containers & Packaging — 2.0% | | | | | | | | |
Packaging Corp. of America | | | 430,310 | | | | 19,308,010 | |
| |
Diversified Telecommunication Services — 1.0% | | | | | |
Verizon Communications, Inc. | | | 194,375 | | | | 9,553,531 | |
| |
Energy Equipment & Services — 1.1% | | | | | | | | |
Oceaneering International, Inc. | | | 166,150 | | | | 11,034,021 | |
| |
Food & Staples Retailing — 4.3% | | | | | | | | |
CVS Caremark Corp. | | | 399,600 | | | | 21,974,004 | |
Wal-Mart Stores, Inc. | | | 270,500 | | | | 20,241,515 | |
| | | | | | | | |
| | | | | | | 42,215,519 | |
| |
Health Care Equipment & Supplies — 1.6% | |
Abbott Laboratories | | | 442,450 | | | | 15,627,334 | |
| |
Health Care Providers & Services — 2.4% | | | | | | | | |
McKesson Corp. | | | 185,550 | | | | 20,031,978 | |
Patterson Cos., Inc. | | | 83,825 | | | | 3,188,703 | |
| | | | | | | | |
| | | | | | | 23,220,681 | |
| |
Industrial Conglomerates — 3.0% | | | | | | | | |
3M Co. | | | 278,875 | | | | 29,647,201 | |
| |
Insurance — 1.5% | | | | | | | | |
The Travelers Cos., Inc. | | | 168,950 | | | | 14,223,901 | |
| |
Internet Software & Services — 5.0% | | | | | | | | |
Google, Inc., Class A (a) | | | 61,075 | | | | 48,495,382 | |
| |
IT Services — 10.8% | | | | | | | | |
Alliance Data Systems Corp. (a)(b) | | | 91,625 | | | | 14,833,171 | |
DST Systems, Inc. | | | 126,050 | | | | 8,983,583 | |
International Business Machines Corp. | | | 167,500 | | | | 35,727,750 | |
Mastercard, Inc., Class A | | | 50,850 | | | | 27,516,461 | |
Teradata Corp. (a) | | | 324,700 | | | | 18,998,197 | |
| | | | | | | | |
| | | | | | | 106,059,162 | |
| |
| | | | | | | | |
| Common Stocks | | Shares | | | Value | |
| |
Life Sciences Tools & Services — 1.4% | | | | | |
Agilent Technologies, Inc. | | | 316,750 | | | $ | 13,293,997 | |
| |
Machinery — 3.1% | | | | | | | | |
Cummins, Inc. | | | 79,200 | | | | 9,172,152 | |
Ingersoll-Rand Plc | | | 259,600 | | | | 14,280,596 | |
Parker Hannifin Corp. | | | 76,650 | | | | 7,019,607 | |
| | | | | | | | |
| | | | | | | 30,472,355 | |
| |
Media — 8.4% | | | | | | | | |
Comcast Corp., Class A | | | 536,800 | | | | 22,550,968 | |
News Corp., Class A | | | 804,925 | | | | 24,566,311 | |
Time Warner Cable, Inc. | | | 154,100 | | | | 14,802,846 | |
The Walt Disney Co. | | | 348,600 | | | | 19,800,480 | |
| | | | | | | | |
| | | | | | | 81,720,605 | |
| |
Multiline Retail — 0.4% | | | | | | | | |
Dollar Tree, Inc. (a) | | | 77,500 | | | | 3,753,325 | |
| |
Oil, Gas & Consumable Fuels — 3.8% | | | | | |
Chevron Corp. | | | 84,925 | | | | 10,090,789 | |
PBF Energy, Inc. | | | 244,656 | | | | 9,093,864 | |
Suncor Energy, Inc. | | | 605,065 | | | | 18,158,001 | |
| | | | | | | 37,342,654 | |
| |
Paper & Forest Products — 1.6% | | | | | | | | |
International Paper Co. | | | 339,825 | | | | 15,829,049 | |
| |
Pharmaceuticals — 4.2% | | | | | | | | |
AbbVie, Inc. | | | 331,750 | | | | 13,528,765 | |
Eli Lilly & Co. | | | 164,550 | | | | 9,344,795 | |
Merck & Co., Inc. | | | 228,900 | | | | 10,124,247 | |
Warner Chilcott Plc, Class A | | | 496,950 | | | | 6,733,673 | |
Zoetis, Inc. | | | 43,300 | | | | 1,446,220 | |
| | | | | | | | |
| | | | | | | 41,177,700 | |
| |
Semiconductors & Semiconductor Equipment — 1.8% | |
KLA-Tencor Corp. | | | 236,900 | | | | 12,494,106 | |
Teradyne, Inc. (a) | | | 303,300 | | | | 4,919,526 | |
| | | | | | | | |
| | | | | | | 17,413,632 | |
| |
Software — 6.8% | | | | | | | | |
Microsoft Corp. | | | 1,392,550 | | | | 39,840,855 | |
Oracle Corp. | | | 836,400 | | | | 27,049,176 | |
| | | | | | | | |
| | | | | | | 66,890,031 | |
| |
Specialty Retail — 4.2% | | | | | | | | |
PetSmart, Inc. | | | 90,825 | | | | 5,640,233 | |
Ross Stores, Inc. | | | 286,300 | | | | 17,355,506 | |
TJX Cos., Inc. | | | 377,105 | | | | 17,629,659 | |
| | | | | | | | |
| | | | | | | 40,625,398 | |
| |
Textiles, Apparel & Luxury Goods — 1.2% | |
NIKE, Inc., Class B | | | 197,531 | | | | 11,656,304 | |
| |
Tobacco — 3.2% | | | | | | | | |
Philip Morris International, Inc. | | | 332,000 | | | | 30,779,720 | |
| |
Total Long-Term Investments | | | | | | | | |
(Cost — $768,687,218) — 96.5% | | | | | | | 943,746,181 | |
| |
| | | | | | | | |
Short-Term Securities | | | | | | | | |
| |
BlackRock Liquidity Funds, TempFund,
Institutional Class, 0.09% (c)(d) | | | 36,236,139 | | | | 36,236,139 | |
| |
| | | | | | |
See Notes to Financial Statements. | | | | |
| | | | | | | |
| | BLACKROCK LARGE CAP SERIES FUNDS, INC. | | MARCH 31, 2013 | | 73 |
| | |
| | |
Schedule of Investments (continued) | | Master Large Cap Growth Portfolio (Percentages shown are based on Net Assets) |
| | | | | | | | |
| | | Beneficial
Interest
(000) | | | Value | |
BlackRock Liquidity Series, LLC Money Market
Series, 0.23% (c)(d)(e) | | $ | 7,661 | | | $ | 7,661,000 | |
| | |
| | | Par (000) | | | | |
Time Deposits — 0.0% | | | | | | | | |
Brown Brothers Harriman & Co.,
0.08%, 4/01/13 | | | 161 | | | | 161,402 | |
| | | | | | |
| | | Value | |
Total Short-Term Securities (Cost — $44,058,541) — 4.5% | | $ | 44,058,541 | |
Total Investments (Cost — $812,745,759*) — 101.0% | | | 987,804,722 | |
Liabilities in Excess of Other Assets — (1.0)% | | | (9,972,787 | ) |
| | | | | | |
Net Assets — 100.0% | | $ | 977,831,935 | |
| | | | |
| | | | |
| |
|
| Notes to Schedule of Investments |
| * | As of March 31, 2013, gross unrealized appreciation and gross unrealized depreciation based on cost for federal income tax purposes were as follows: |
| | | | |
Tax cost | | $ | 816,283,056 | |
| | | | |
Gross unrealized appreciation | | $ | 176,937,847 | |
Gross unrealized depreciation | | | (5,416,181 | ) |
| | | | |
Net unrealized appreciation | | $ | 171,521,666 | |
| | | | |
| (a) | Non-income producing security. |
| (b) | Security, or a portion of security, is on loan. |
| (c) | Investments in issuers considered to be an affiliate of the Portfolio during the period ended March 31, 2013, for purposes of Section 2(a)(3) of the Investment Company Act of 1940, as amended, were as follows: |
| | | | | | | | | | | | | | | | |
| Affiliate | | Shares/Beneficial
Interest Held at
September 30, 2012 | | | Net Activity | | | Shares/Beneficial
Interest Held at
March 31, 2013 | | | Income | |
BlackRock Liquidity Funds, TempFund, Institutional Class | | | 16,880,866 | | | | 19,355,273 | | | | 36,236,139 | | | | $ 15,207 | |
BlackRock Liquidity Series, LLC Money Market Series | | | $17,167,563 | | | | $(9,506,563) | | | | $ 7,661,000 | | | | $200,765 | |
| (d) | Represents the current yield as of report date. |
| (e) | Security was purchased with the cash collateral from loaned securities. The Portfolio may withdraw up to 25% of its investment daily, although the manager of the BlackRock Liquidity Series, LLC Money Market Series, in its sole discretion, may permit an investor to withdraw more than 25% on any one day. |
| — | | Financial futures contracts as of March 31, 2013 were as follows: |
| | | | | | | | | | | | | | |
Contracts Purchased | | Issue | | Exchange | | Expiration | | Notional Value | | Unrealized
Appreciation | |
247 | | E-Mini S&P 500 Futures | | Chicago Mercantile | | June 2013 | | USD | | 19,299,345 | | | $170,041 | |
| — | | For Portfolio compliance purposes, the Portfolio’s industry classifications refer to any one or more of the industry sub-classifications used by one or more widely recognized market indexes or ratings group indexes, and/or as defined by Portfolio management. These definitions may not apply for purposes of this report, which may combine such industry sub-classifications for reporting ease. |
| — | | Fair Value Measurements — Various inputs are used in determining the fair value of investments. These inputs to valuation techniques are categorized into a disclosure hierarchy consisting of three broad levels for financial statement purposes as follows: |
| | — | | Level 1 – unadjusted price quotations in active markets/exchanges for identical assets and liabilities that the Portfolio has the ability to access |
| | — | | Level 2 – other observable inputs (including, but not limited to, quoted prices for similar assets or liabilities in markets that are active, quoted prices for identical or similar assets or liabilities in markets that are not active, inputs other than quoted prices that are observable for the assets or liabilities (such as interest rates, yield curves, volatilities, prepayment speeds, loss severities, credit risks and default rates) or other market–corroborated inputs) |
| | — | | Level 3 – unobservable inputs based on the best information available in the circumstances, to the extent observable inputs are not available (including the Portfolio’s own assumptions used in determining the fair value of investments) |
The hierarchy gives the highest priority to unadjusted quoted prices in active markets for identical assets or liabilities (Level 1 measurements) and the lowest priority to unobservable inputs (Level 3 measurements). Accordingly, the degree of judgment exercised in determining fair value is greatest for instruments categorized in Level 3. The inputs used to measure fair value may fall into different levels of the fair value hierarchy. In such cases, for disclosure purposes, the level in the fair value hierarchy within which the fair value measurement falls in its entirety is determined based on the lowest level input that is significant to the fair value measurement in its entirety.
Changes in valuation techniques may result in transfers into or out of an assigned level within the disclosure hierarchy. In accordance with the Portfolio’s policy, transfers between different levels of the fair value disclosure hierarchy are deemed to have occurred as of the beginning of the reporting period. The categorization of a value determined for investments is based on the pricing transparency of the investment and is not necessarily an indication of the risks associated with investing in those securities. For information about the Portfolio’s policy regarding valuation of investments and other significant accounting policies, please refer to Note 1 of the Notes to Financial Statements.
| | | | | | |
See Notes to Financial Statements. | | | | |
| | | | | | | |
| 74 | | BLACKROCK LARGE CAP SERIES FUNDS, INC. | | MARCH 31, 2013 | | |
| | |
| | |
Schedule of Investments (concluded) | | Master Large Cap Growth Portfolio |
The following tables summarize the Portfolio’s investments and derivative financial instruments categorized in the disclosure hierarchy as of March 31, 2013:
| | | | | | | | | | | | | | | | |
| | | Level 1 | | | Level 2 | | | Level 3 | | | Total | |
Assets: | | | | | | | | | | | | | | | | |
Investments: | | | | | | | | | | | | | | | | |
Long-Term Investments1 | | $ | 943,746,181 | | | | — | | | | — | | | $ | 943,746,181 | |
Short-Term Securities | | | 36,397,541 | | | $ | 7,661,000 | | | | — | | | | 44,058,541 | |
Total | | $ | 980,143,722 | | | $ | 7,661,000 | | | | — | | | $ | 987,804,722 | |
|
1 See above Schedule of Investments for values in each industry. | |
| | | Level 1 | | | Level 2 | | | Level 3 | | | Total | |
Derivative Financial Instruments2 | | | | | | | | | | | | | | | | |
Assets: | | | | | | | | | | | | | | | | |
Equity contracts | | | — | | | $ | 170,041 | | | | — | | | $ | 170,041 | |
| 2 | Derivative financial instruments are financial futures contracts which are valued at the unrealized appreciation/depreciation on the instrument. |
Certain of the Portfolio’s liabilities are held at carrying amount, which approximates fair value for financial statement purposes. As of March 31, 2013, collateral on securities loaned of $7,661,000 is categorized as Level 2 within the disclosure hierarchy.
There were no transfers between levels during the period ended March 31, 2013.
| | | | | | |
See Notes to Financial Statements. | | | | |
| | | | | | | |
| | BLACKROCK LARGE CAP SERIES FUNDS, INC. | | MARCH 31, 2013 | | 75 |
| | |
| | |
Schedule of Investments March 31, 2013 (Unaudited) | | Master Large Cap Value Portfolio (Percentages shown are based on Net Assets) |
| | | | | | | | |
| Common Stocks | | Shares | | | Value | |
| |
Aerospace & Defense — 1.9% | | | | | |
The Boeing Co. | | | 135,800 | | | $ | 11,658,430 | |
Raytheon Co. | | | 130,250 | | | | 7,657,397 | |
| | | | | | | | |
| | | | | | | 19,315,827 | |
| |
Airlines — 3.5% | | | | | | | | |
Copa Holdings SA, Class A | | | 38,000 | | | | 4,545,180 | |
Delta Air Lines, Inc. (a) | | | 568,700 | | | | 9,389,237 | |
United Continental Holdings, Inc. (a) | | | 684,092 | | | | 21,897,785 | |
| | | | | | | | |
| | | | | | | 35,832,202 | |
| |
Auto Components — 1.1% | | | | | | | | |
TRW Automotive Holdings Corp. (a) | | | 201,897 | | | | 11,104,335 | |
| |
Capital Markets — 2.0% | | | | | | | | |
The Goldman Sachs Group, Inc. | | | 135,478 | | | | 19,935,587 | |
| |
Chemicals — 0.3% | | | | | | | | |
Cabot Corp. | | | 94,044 | | | | 3,216,305 | |
| |
Commercial Banks — 4.4% | | | | | |
SunTrust Banks, Inc. (a) | | | 425,600 | | | | 12,261,536 | |
U.S. Bancorp | | | 885,275 | | | | 30,037,381 | |
Wells Fargo & Co. (a) | | | 60,625 | | | | 2,242,519 | |
| | | | | | | | |
| | | | | | | 44,541,436 | |
| |
Commercial Services & Supplies — 0.9% | |
Tyco International Ltd. | | | 288,925 | | | | 9,245,600 | |
| |
Construction & Engineering — 1.2% | |
KBR, Inc. | | | 385,300 | | | | 12,360,424 | |
| |
Consumer Finance — 2.0% | |
Discover Financial Services | | | 458,700 | | | | 20,568,108 | |
| |
Containers & Packaging — 1.7% | |
Packaging Corp. of America | | | 139,400 | | | | 6,254,878 | |
Rock-Tenn Co., Class A | | | 121,667 | | | | 11,289,481 | |
| | | | | | | | |
| | | | | | | 17,544,359 | |
| |
Diversified Financial Services — 11.3% | |
Bank of America Corp. | | | 3,059,000 | | | | 37,258,620 | |
Citigroup, Inc. | | | 811,326 | | | | 35,893,062 | |
JPMorgan Chase & Co. | | | 889,065 | | | | 42,195,025 | |
| | | | | | | | |
| | | | | | | 115,346,707 | |
| |
Diversified Telecommunication Services — 2.1% | |
AT&T Inc. | | | 293,550 | | | | 10,770,349 | |
Verizon Communications, Inc. | | | 214,350 | | | | 10,535,303 | |
| | | | | | | | |
| | | | | | | 21,305,652 | |
| |
Electronic Equipment, Instruments & Components — 0.8% | |
Avnet, Inc. (a) | | | 218,600 | | | | 7,913,320 | |
| |
Food & Staples Retailing — 4.0% | | | | | | | | |
CVS Caremark Corp. | | | 538,250 | | | | 29,598,367 | |
Wal-Mart Stores, Inc. | | | 156,750 | | | | 11,729,603 | |
| | | | | | | | |
| | | | | | | 41,327,970 | |
| |
Health Care Equipment & Supplies — 0.7% | |
Abbott Laboratories | | | 200,900 | | | | 7,095,788 | |
| |
Household Products — 0.4% | | | | | | | | |
The Procter & Gamble Co. | | | 55,200 | | | | 4,253,712 | |
| |
Industrial Conglomerates — 3.9% | | | | | | | | |
3M Co. | | | 234,275 | | | | 24,905,775 | |
General Electric Co. | | | 661,375 | | | | 15,290,990 | |
| | | | | | | | |
| | | | | | | 40,196,765 | |
| |
| | | | | | | | |
| Common Stocks | | Shares | | | Value | |
| |
Insurance — 9.3% | | | | | | | | |
Allied World Assurance Co.
Holdings AG | | | 65,600 | | | $ | 6,082,432 | |
American Financial Group, Inc. | | | 264,625 | | | | 12,537,933 | |
American International Group, Inc. (a) | | | 402,200 | | | | 15,613,404 | |
Berkshire Hathaway, Inc., Class B (a) | | | 25,800 | | | | 2,688,360 | |
The Chubb Corp. | | | 219,375 | | | | 19,201,894 | |
Everest Re Group Ltd. | | | 53,200 | | | | 6,908,552 | |
HCC Insurance Holdings, Inc. | | | 74,000 | | | | 3,110,220 | |
PartnerRe Ltd. (b) | | | 70,500 | | | | 6,564,255 | |
RenaissanceRe Holdings Ltd. (b) | | | 26,325 | | | | 2,421,637 | |
The Travelers Cos., Inc. | | | 240,800 | | | | 20,272,952 | |
| | | | | | | | |
| | | | | | | 95,401,639 | |
| |
IT Services — 0.6% | | | | | | | | |
DST Systems, Inc. | | | 85,700 | | | | 6,107,839 | |
| |
Machinery — 2.8% | | | | | | | | |
Ingersoll-Rand Plc | | | 371,300 | | | | 20,425,213 | |
Oshkosh Corp. (a) | | | 182,025 | | | | 7,734,242 | |
| | | | | | | | |
| | | | | | | 28,159,455 | |
| |
Media — 6.4% | | | | | | | | |
Comcast Corp., Class A | | | 562,400 | | | | 23,626,424 | |
News Corp., Class A | | | 1,005,075 | | | | 30,674,889 | |
Time Warner Cable, Inc. | | | 117,000 | | | | 11,239,020 | |
| | | | | | | | |
| | | | | | | 65,540,333 | |
| |
Multiline Retail — 1.0% | | | | | | | | |
Dillard’s, Inc., Class A | | | 128,200 | | | | 10,070,110 | |
| |
Oil, Gas & Consumable Fuels — 16.7% | |
Chevron Corp. | | | 417,475 | | | | 49,604,379 | |
Exxon Mobil Corp. | | | 530,425 | | | | 47,796,597 | |
Marathon Oil Corp. | | | 400,700 | | | | 13,511,604 | |
Marathon Petroleum Corp. | | | 270,325 | | | | 24,221,120 | |
PBF Energy, Inc. | | | 252,634 | | | | 9,390,406 | |
Suncor Energy, Inc. | | | 661,590 | | | | 19,854,316 | |
Tesoro Corp. | | | 118,027 | | | | 6,910,481 | |
| | | | | | | | |
| | | | | | | 171,288,903 | |
| |
Paper & Forest Products — 2.8% | | | | | |
Domtar Corp. | | | 114,400 | | | | 8,879,728 | |
International Paper Co. | | | 423,600 | | | | 19,731,288 | |
| | | | | | | | |
| | | | | | | 28,611,016 | |
| |
Pharmaceuticals — 11.2% | | | | | | | | |
AbbVie, Inc. | | | 150,200 | | | | 6,125,156 | |
Eli Lilly & Co. | | | 217,275 | | | | 12,339,047 | |
Johnson & Johnson | | | 27,300 | | | | 2,225,769 | |
Merck & Co., Inc. | | | 878,150 | | | | 38,840,575 | |
Pfizer, Inc. | | | 1,870,825 | | | | 53,992,009 | |
Zoetis, Inc. | | | 45,500 | | | | 1,519,700 | |
| | | | | | | | |
| | | | | | | 115,042,256 | |
| |
Semiconductors & Semiconductor Equipment — 1.9% | |
KLA-Tencor Corp. | | | 270,400 | | | | 14,260,896 | |
Teradyne, Inc. (a) | | | 334,200 | | | | 5,420,724 | |
| | | | | | | | |
| | | | | | | 19,681,620 | |
| |
| | | | | | |
See Notes to Financial Statements. | | | | |
| | | | | | | |
| 76 | | BLACKROCK LARGE CAP SERIES FUNDS, INC. | | MARCH 31, 2013 | | |
| | |
| | |
Schedule of Investments (continued) | | Master Large Cap Value Portfolio (Percentages shown are based on Net Assets) |
| | | | | | | | |
| Common Stocks | | Shares | | | Value | |
| |
Software — 3.2% | | | | | | | | |
Activision Blizzard, Inc. | | | 748,200 | | | $ | 10,901,274 | |
Microsoft Corp. | | | 366,100 | | | | 10,474,121 | |
Oracle Corp. | | | 349,200 | | | | 11,293,128 | |
| | | | | | | | |
| | | | | | | 32,668,523 | |
| |
Total Long-Term Investments (Cost — $790,232,201) — 98.1% | | | | | | | 1,003,675,791 | |
| |
| | | | | | | | |
Short-Term Securities | | | | | | | | |
| |
BlackRock Liquidity Funds, TempFund,
Institutional Class, 0.09% (c)(d) | | | 17,744,938 | | | | 17,744,938 | |
| |
| | | | | | | | |
| | | Beneficial
Interest
(000) | | | Value | |
| |
BlackRock Liquidity Series, LLC Money Market
Series, 0.23% (c)(d)(e) | | $ | 6,963 | | | $ | 6,962,700 | |
| |
| | |
| | | Par (000) | | | | |
| |
Time Deposits — 0.0% | | | | | | | | |
Brown Brothers Harriman & Co., 0.08%,
4/01/13 | | | 189 | | | | 188,562 | |
| |
Total Short-Term Securities | | | | | | | | |
(Cost — $24,896,200) — 2.4% | | | | | | | 24,896,200 | |
| |
Total Investments (Cost — $815,128,401*) — 100.5% | | | | 1,028,571,991 | |
Liabilities in Excess of Other Assets — (0.5)% | | | | (5,315,230 | ) |
| | | | | | | | |
Net Assets — 100.0% | | | | | | $ | 1,023,256,761 | |
| | | | | | | | |
| | | | | | | | |
| |
|
| Notes to Schedule of Investments |
| * | As of March 31, 2013, gross unrealized appreciation and gross unrealized depreciation based on cost for federal income tax purposes were as follows: |
| | | | |
Tax cost | | $ | 843,277,579 | |
| | | | |
Gross unrealized appreciation | | $ | 186,899,145 | |
Gross unrealized depreciation | | | (1,604,733 | ) |
| | | | |
Net unrealized appreciation | | $ | 185,294,412 | |
| | | | |
| (a) | Non-income producing security. |
| (b) | Security, or a portion of security, is on loan. |
| (c) | Investments in issuers considered to be an affiliate of the Portfolio during the period ended March 31, 2013, for purposes of Section 2(a)(3) of the Investment Company Act of 1940, as amended, were as follows: |
| | | | | | | | | | | | | | | | |
| Affiliate | | Shares/Beneficial
Interest Held at
September 30, 2012 | | | Net Activity | | | Shares/Beneficial
Interest Held at
March 31, 2013 | | | Income | |
BlackRock Liquidity Funds, TempFund, Institutional Class | | | 10,713,064 | | | | 7,031,874 | | | | 17,744,938 | | | | $5,659 | |
BlackRock Liquidity Series, LLC Money Market Series | | | $ 9,360,700 | | | | $(2,398,000 | ) | | | $ 6,962,700 | | | | $3,195 | |
| |
| (d) | Represents the current yield as of report date. |
| (e) | Security was purchased with the cash collateral from loaned securities. The Portfolio may withdraw up to 25% of its investment daily, although the manager of the BlackRock Liquidity Series, LLC Money Market Series, in its sole discretion, may permit an investor to withdraw more than 25% on any one day. |
| — | | For Portfolio compliance purposes, the Portfolio’s industry classifications refer to any one or more of the industry sub-classifications used by one or more widely recognized market indexes or ratings group indexes, and/or as defined by Portfolio management. These definitions may not apply for purposes of this report, which may combine such industry sub-classifications for reporting ease. |
| — | | Fair Value Measurements — Various inputs are used in determining the fair value of investments. These inputs to valuation techniques are categorized into a disclosure hierarchy consisting of three broad levels for financial statement purposes as follows: |
| | — | | Level 1 – unadjusted price quotations in active markets/exchanges for identical assets and liabilities that the Portfolio has the ability to access |
| | — | | Level 2 – other observable inputs (including, but not limited to, quoted prices for similar assets or liabilities in markets that are active, quoted prices for identical or similar assets or liabilities in markets that are not active, inputs other than quoted prices that are observable for the assets or liabilities (such as interest rates, yield curves, volatilities, prepayment speeds, loss severities, credit risks and default rates) or other market–corroborated inputs) |
| | — | | Level 3 – unobservable inputs based on the best information available in the circumstances, to the extent observable inputs are not available (including the Portfolio’s own assumptions used in determining the fair value of investments) |
The hierarchy gives the highest priority to unadjusted quoted prices in active markets for identical assets or liabilities (Level 1 measurements) and the lowest priority to unobservable inputs (Level 3 measurements). Accordingly, the degree of judgment exercised in determining fair value is greatest for instruments categorized in Level 3. The inputs used to measure fair value may fall into different levels of the fair value hierarchy. In such cases, for disclosure purposes, the level in the fair value hierarchy within which the fair value measurement falls in its entirety is determined based on the lowest level input that is significant to the fair value measurement in its entirety.
| | | | | | |
See Notes to Financial Statements. | | | | |
| | | | | | | |
| | BLACKROCK LARGE CAP SERIES FUNDS, INC. | | MARCH 31, 2013 | | 77 |
| | |
| | |
Schedule of Investments (concluded) | | Master Large Cap Value Portfolio |
Changes in valuation techniques may result in transfers into or out of an assigned level within the disclosure hierarchy. In accordance with the Portfolio’s policy, transfers between different levels of the fair value disclosure hierarchy are deemed to have occurred as of the beginning of the reporting period. The categorization of a value determined for investments is based on the pricing transparency of the investment and is not necessarily an indication of the risks associated with investing in those securities. For information about the Portfolio’s policy regarding valuation of investments and other significant accounting policies, please refer to Note 1 of the Notes to Financial Statements.
The following table summarizes the Portfolio’s investments categorized in the disclosure hierarchy as of March 31, 2013:
| | | | | | | | | | | | | | | | | | |
| | | | | Level 1 | | | Level 2 | | | Level 3 | | Total | | | |
Assets: | | | | | | | | | | | | | | | | | | |
Investments: | | | | | | | | | | | | | | | | | | |
Long-Term Investments1 | | | | $ | 1,003,675,791 | | | | — | | | — | | $ | 1,003,675,791 | | | |
Short-Term Securities | | | | | 17,744,938 | | | $ | 7,151,262 | | | — | | | 24,896,200 | | | |
|
Total | | | | $ | 1,021,420,729 | | | $ | 7,151,262 | | | — | | $ | 1,028,571,991 | | | |
| | |
| 1 | See above Schedule of Investments for values in each industry. |
Certain of the Portfolio’s liabilities are held at carrying amount, which approximates fair value for financial statement purposes. As of March 31, 2013, collateral on securities loaned at value of $6,926,700 is categorized as Level 2 within the disclosure hierarchy.
There were no transfers between levels during the period ended March 31, 2013.
| | | | | | |
See Notes to Financial Statements. | | | | |
| | | | | | | |
| 78 | | BLACKROCK LARGE CAP SERIES FUNDS, INC. | | MARCH 31, 2013 | | |
| | |
| | |
Statements of Assets and Liabilities | | Master Large Cap Series LLC |
| | | | | | | | | | | | |
| March 31, 2013 (Unaudited) | | Master Large Cap Core
Portfolio | | | Master Large
Cap Growth
Portfolio | | | Master Large
Cap Value
Portfolio | |
Assets | | | | | | | | | | | | |
Investments at value — unaffiliated1,2 | | $ | 2,257,792,417 | | | $ | 943,907,583 | | | $ | 1,003,864,353 | |
Investments at value — affiliated3 | | | 37,143,749 | | | | 43,897,139 | | | | 24,707,638 | |
Variation margin receivable | | | — | | | | 72,865 | | | | — | |
Investments sold receivable | | | 3,708,883 | | | | — | | | | 1,993,111 | |
Contributions receivable from investors | | | — | | | | — | | | | 36,958 | |
Dividends receivable | | | 2,788,754 | | | | 1,241,144 | | | | 1,245,363 | |
Securities lending income receivable — affiliated | | | 2,647 | | | | 589 | | | | 773 | |
Prepaid expenses | | | 31,962 | | | | 8,250 | | | | 26,573 | |
Total assets | | | 2,301,468,412 | | | | 989,127,570 | | | | 1,031,874,769 | |
| | | | | | | | | | | | |
Liabilities | | | | | | | | | | | | |
Collateral on securities loaned at value | | | 15,023,875 | | | | 7,661,000 | | | | 6,962,700 | |
Withdrawals payable to investors | | | 1,432,709 | | | | 966,132 | | | | 1,027,515 | |
Investments purchased payable | | | 4,906,208 | | | | 2,103,890 | | | | — | |
Investment advisory fees payable | | | 906,337 | | | | 428,560 | | | | 434,200 | |
Directors’ fees payable | | | 13,451 | | | | 7,423 | | | | 8,247 | |
Other affiliates payable | | | 15,086 | | | | 6,028 | | | | 9,358 | |
Other accrued expenses payable | | | 266,938 | | | | 122,602 | | | | 175,988 | |
Total liabilities | | | 22,564,604 | | | | 11,295,635 | | | | 8,618,008 | |
Net Assets | | $ | 2,278,903,808 | | | $ | 977,831,935 | | | $ | 1,023,256,761 | |
| | | | | | | | | | | | |
Net Assets Consist of | | | | | | | | | | | | |
Investors’ capital | | $ | 1,780,183,642 | | | $ | 802,602,932 | | | $ | 809,813,171 | |
Net unrealized appreciation/depreciation | | | 498,720,166 | | | | 175,229,003 | | | | 213,443,590 | |
Net Assets | | $ | 2,278,903,808 | | | $ | 977,831,935 | | | $ | 1,023,256,761 | |
| | | |
1 Investments at cost — unaffiliated | | $ | 1,759,072,252 | | | $ | 768,848,620 | | | $ | 790,420,763 | |
2 Securities loaned at value | | $ | 14,806,262 | | | $ | 7,608,830 | | | $ | 6,865,261 | |
3 Investments at cost — affiliated | | $ | 37,143,749 | | | $ | 43,897,139 | | | $ | 24,707,638 | |
| | | | | | |
See Notes to Financial Statements. | | | | |
| | | | | | | |
| | BLACKROCK LARGE CAP SERIES FUNDS, INC. | | MARCH 31, 2013 | | 79 |
| | |
| | |
Statements of Operations | | Master Large Cap Series LLC |
| | | | | | | | | | | | |
| Six Months Ended March 31, 2013 (Unaudited) | | Master Large
Cap Core
Portfolio | | | Master Large
Cap Growth
Portfolio | | | Master Large
Cap Value
Portfolio | |
Investment Income | | | | | | | | | | | | |
Dividends — unaffiliated | | $ | 22,317,958 | | | $ | 9,169,813 | | | $ | 11,729,754 | |
Foreign taxes withheld | | | (53,324 | ) | | | (22,611 | ) | | | (25,964 | ) |
Securities lending — affiliated — net | | | 11,443 | | | | 200,765 | | | | 3,195 | |
Dividends — affiliated | | | 10,394 | | | | 15,207 | | | | 5,629 | |
Total income | | | 22,286,471 | | | | 9,363,174 | | | | 11,712,614 | |
| | | | | | | | | | | | |
Expenses | | | | | | | | | | | | |
Investment advisory | | | 5,328,032 | | | | 2,282,261 | | | | 2,554,021 | |
Accounting services | | | 207,547 | | | | 117,397 | | | | 127,611 | |
Custodian | | | 53,134 | | | | 31,691 | | | | 33,708 | |
Professional | | | 35,310 | | | | 31,341 | | | | 31,242 | |
Directors | | | 31,723 | | | | 14,260 | | | | 15,852 | |
Printing | | | 4,482 | | | | 3,432 | | | | 3,482 | |
Miscellaneous | | | 18,089 | | | | 10,630 | | | | 16,759 | |
Total expenses excluding federal income tax | | | 5,678,317 | | | | 2,491,012 | | | | 2,782,675 | |
Federal income tax | | | 100 | | | | 100 | | | | 100 | |
Total expenses | | | 5,678,417 | | | | 2,491,112 | | | | 2,782,775 | |
Less fees waived by Manager | | | (5,581 | ) | | | (9,112 | ) | | | (3,071 | ) |
Total expenses after fees waived | | | 5,672,836 | | | | 2,482,000 | | | | 2,779,704 | |
Net investment income | | | 16,613,635 | | | | 6,881,174 | | | | 8,932,910 | |
| | | | | | | | | | | | |
Realized and Unrealized Gain (Loss) | | | | | | | | | | | | |
Net realized gain (loss) from: | | | | | | | | | | | | |
Investments | | | 132,801,231 | | | | 36,023,804 | | | | 65,577,140 | |
Financial futures contracts | | | — | | | | 2,777 | | | | — | |
Foreign currency transactions | | | (18,284 | ) | | | (7,681 | ) | | | (8,820 | ) |
| | | 132,782,947 | | | | 36,018,900 | | | | 65,568,320 | |
Net change in unrealized appreciation/depreciation on: | | | | | | | | | | | | |
Investments | | | 78,655,682 | | | | 2,888,074 | | | | 68,043,901 | |
Financial futures contracts | | | — | | | | 170,041 | | | | — | |
| | | 78,655,682 | | | | 3,058,115 | | | | 68,043,901 | |
Total realized and unrealized gain | | | 211,438,629 | | | | 39,077,015 | | | | 133,612,221 | |
Net Increase in Net Assets Resulting from Operations | | $ | 228,052,264 | | | $ | 45,958,189 | | | $ | 142,545,131 | |
| | | | | | |
See Notes to Financial Statements. | | | | |
| | | | | | | |
| 80 | | BLACKROCK LARGE CAP SERIES FUNDS, INC. | | MARCH 31, 2013 | | |
| | |
| | |
Statements of Changes in Net Assets | | Master Large Cap Series LLC |
| | | | | | | | | | | | | | | | | | |
| | | Master Large Cap Core Portfolio | | | | | Master Large Cap Growth Portfolio | |
| Increase (Decrease) in Net Assets: | | Six Months Ended
March 31, 2013
(Unaudited) | | | Year Ended
September 30,
2012 | | | | | Six Months Ended
March 31, 2013
(Unaudited) | | | Year Ended
September 30,
2012 | |
Operations | | | | | | | | | | | | | | | | | | |
Net investment income | | $ | 16,613,635 | | | $ | 40,780,497 | | | | | $ | 6,881,174 | | | $ | 17,778,424 | |
Net realized gain | | | 132,782,947 | | | | 115,001,657 | | | | | | 36,018,900 | | | | 68,721,003 | |
Net change in unrealized appreciation/depreciation | | | 78,655,682 | | | | 492,381,340 | | | | | | 3,058,115 | | | | 224,038,951 | |
Net increase in net assets resulting from operations | | | 228,052,264 | | | | 648,163,494 | | | | | | 45,958,189 | | | | 310,538,378 | |
| | | | | | | | | | | | | | | | | | |
Capital Share Transactions | | | | | | | | | | | | | | | | | | |
Proceeds from contributions | | | 89,026,973 | �� | | | 328,459,593 | | | | | | 170,816,383 | | | | 283,535,489 | |
Value of withdrawals | | | (357,026,182 | ) | | | (964,485,911 | ) | | | | | (152,574,385 | ) | | | (675,721,332 | ) |
Net increase (decrease) in net assets derived from capital share transactions | | | (267,999,209 | ) | | | (636,026,318 | ) | | | | | 18,241,998 | | | | (392,185,843 | ) |
| | | | | | | | | | | | | | | | | | |
Net Assets | | | | | | | | | | | | | | | | | | |
Total increase (decrease) in net assets | | | (39,946,945 | ) | | | 12,137,176 | | | | | | 64,200,187 | | | | (81,647,465 | ) |
Beginning of period | | | 2,318,850,753 | | | | 2,306,713,577 | | | | | | 913,631,748 | | | | 995,279,213 | |
End of period | | $ | 2,278,903,808 | | | $ | 2,318,850,753 | | | | | $ | 977,831,935 | | | $ | 913,631,748 | |
| | | | | | | | | | | | | | | | | | |
| | | | | | | | | | | Master Large Cap Value Portfolio | |
| Increase (Decrease) in Net Assets: | | | | | | | | | | Six Months Ended
March 31, 2013
(Unaudited) | | | Year Ended
September 30,
2012 | |
Operations | | | | | | | | | | | | | | | | | | |
Net investment income | | | | | | | | | | | | $ | 8,932,910 | | | $ | 22,102,476 | |
Net realized gain | | | | | | | | | | | | | 65,568,320 | | | | 55,248,783 | |
Net change in unrealized appreciation/depreciation | | | | | | | | | | | | | 68,043,901 | | | | 230,561,018 | |
Net increase in net assets resulting from operations | | | | | | | | | | | | | 142,545,131 | | | | 307,912,277 | |
| | | | | | | | | | | | | | | | | | |
Capital Share Transactions | | | | | | | | | | | | | | | | | | |
Proceeds from contributions | | | | | | | | | | | | | 54,105,204 | | | | 186,480,972 | |
Value of withdrawals | | | | | | | | | | | | | (237,217,098 | ) | | | (761,671,551 | ) |
Net decrease in net assets derived from capital share transactions | | | | | | | | | | | | | (183,111,894 | ) | | | (575,190,579 | ) |
| | | | | | | | | | | | | | | | | | |
Net Assets | | | | | | | | | | | | | | | | | | |
Total decrease in net assets | | | | | | | | | | | | | (40,566,763 | ) | | | (267,278,302 | ) |
Beginning of period | | | | | | | | | | | | | 1,063,823,524 | | | | 1,331,101,826 | |
End of period | | | | | | | | | | | | $ | 1,023,256,761 | | | $ | 1,063,823,524 | |
| | | | | | |
See Notes to Financial Statements. | | | | |
| | | | | | | |
| | BLACKROCK LARGE CAP SERIES FUNDS, INC. | | MARCH 31, 2013 | | 81 |
| | |
| | |
Financial Highlights | | Master Large Cap Series LLC |
| | | | | | | | | | | | | | | | | | | | | | | | | | | | |
| | | Master Large Cap Core Portfolio | |
| | | Six Months Ended March 31, 2013 | | | Year Ended September 30, | | | Period
November 1,
2008 to
September 30, | | | Year Ended October 31, | |
| | | (Unaudited) | | | 2012 | | | 2011 | | | 2010 | | | 2009 | | | 2008 | | | 2007 | |
Total Investment Return | | | | | | | | | | | | | | | | | | | | | | | | | | | | |
Total investment return | | | 10.66% | 1 | | | 29.97% | | | | (1.61)% | | | | 6.16% | | | | 12.63% | 1,2 | | | (38.84)% | | | | 13.94% | |
| | | | | | | |
| | | | | | | | | | | | | | | | | | | | | | | | | | | | |
Ratios to Average Net Assets | | | | | | | | | | | | | | | | | | | | | | | | | | | | |
Total expenses | | | 0.50% | 3 | | | 0.50% | | | | 0.49% | | | | 0.49% | | | | 0.50% | 3 | | | 0.50% | | | | 0.49% | |
Total expenses after fees waived | | | 0.50% | 3 | | | 0.50% | | | | 0.49% | | | | 0.49% | | | | 0.50% | 3 | | | 0.50% | | | | 0.49% | |
Net investment income | | | 1.47% | 3 | | | 1.67% | | | | 1.13% | | | | 1.11% | | | | 1.56% | 3 | | | 0.93% | | | | 0.63% | |
| | | | | | | |
| | | | | | | | | | | | | | | | | | | | | | | | | | | | |
Supplemental Data | | | | | | | | | | | | | | | | | | | | | | | | | | | | |
Net assets, end of period (000) | | | $2,278,904 | | | | $2,318,851 | | | | $2,306,714 | | | | $3,209,486 | | | | $3,946,322 | | | | $2,843,515 | | | | $5,649,731 | |
Portfolio turnover | | | 29% | | | | 128% | | | | 129% | | | | 173% | | | | 168% | | | | 109% | | | | 96% | |
| |
| | | Master Large Cap Growth Portfolio | |
| | | Six Months Ended March 31, 2013 | | | Year Ended September 30, | | | Period
November 1,
2008 to
September 30, | | | Year Ended October 31, | |
| | | (Unaudited) | | | 2012 | | | 2011 | | | 2010 | | | 2009 | | | 2008 | | | 2007 | |
Total Investment Return | | | | | | | | | | | | | | | | | | | | | | | | | | | | |
Total investment return | | | 4.99% | 1 | | | 31.61% | | | | 0.72% | | | | 7.68% | | | | 20.49% | 1,4 | | | (37.96)% | | | | 17.47% | |
| | | | | | | |
| | | | | | | | | | | | | | | | | | | | | | | | | | | | |
Ratios to Average Net Assets | | | | | | | | | | | | | | | | | | | | | | | | | | | | |
Total expenses | | | 0.55% | 3 | | | 0.55% | | | | 0.54% | | | | 0.56% | | | | 0.57% | 3 | | | 0.56% | | | | 0.56% | |
Total expenses after fees waived | | | 0.54% | 3 | | | 0.55% | | | | 0.54% | | | | 0.56% | | | | 0.57% | 3 | | | 0.56% | | | | 0.56% | |
Net investment income | | | 1.51% | 3 | | | 1.61% | | | | 0.93% | | | | 0.73% | | | | 0.81% | 3 | | | 0.54% | | | | 0.25% | |
| | | | | | | |
| | | | | | | | | | | | | | | | | | | | | | | | | | | | |
Supplemental Data | | | | | | | | | | | | | | | | | | | | | | | | | | | | |
Net assets, end of period (000) | | | $977,832 | | | | $913,632 | | | | $995,279 | | | | $671,834 | | | | $733,888 | | | | $665,963 | | | | $1,233,995 | |
Portfolio turnover | | | 29% | | | | 132% | | | | 169% | | | | 232% | | | | 242% | | | | 144% | | | | 87% | |
| |
| | | Master Large Cap Value Portfolio | |
| | | Six Months Ended March 31, 2013 | | | Year Ended September 30, | | | Period
November 1,
2008 to
September 30, | | | Year Ended October 31, | |
| | | (Unaudited) | | | 2012 | | | 2011 | | | 2010 | | | 2009 | | | 2008 | | | 2007 | |
Total Investment Return | | | | | | | | | | | | | | | | | | | | | | | | | | | | |
Total investment return | | | 15.02% | 1 | | | 25.26% | | | | (4.34)% | | | | 4.36% | | | | 9.03% | 1,5 | | | (36.54)% | | | | 12.72% | |
| | | | | | | |
| | | | | | | | | | | | | | | | | | | | | | | | | | | | |
Ratios to Average Net Assets | | | | | | | | | | | | | | | | | | | | | | | | | | | | |
Total expenses | | | 0.54% | 3 | | | 0.54% | | | | 0.54% | | | | 0.53% | | | | 0.54% | 3 | | | 0.51% | | | | 0.51% | |
Total expenses after fees waived | | | 0.54% | 3 | | | 0.54% | | | | 0.54% | | | | 0.53% | | | | 0.54% | 3 | | | 0.51% | | | | 0.51% | |
Net investment income | | | 1.75% | 3 | | | 1.71% | | | | 1.28% | | | | 1.35% | | | | 1.88% | 3 | | | 1.22% | | | | 0.95% | |
| | | | | | | |
| | | | | | | | | | | | | | | | | | | | | | | | | | | | |
Supplemental Data | | | | | | | | | | | | | | | | | | | | | | | | | | | | |
Net assets, end of period (000) | | | $1,023,257 | | | | $1,063,824 | | | | $1,331,102 | | | | $2,173,142 | | | | $2,645,858 | | | | $3,063,116 | | | | $5,392,155 | |
Portfolio turnover | | | 22% | | | | 147% | | | | 156% | | | | 183% | | | | 151% | | | | 108% | | | | 72% | |
| | 1 | Aggregate total investment return. |
| | 2 | Includes proceeds received from a settlement of litigation, which impacted the Portfolio’s total investment return. Not including these proceeds, the Portfolio’s total investment return would have been 12.39%. |
| | 4 | Includes proceeds received from a settlement of litigation, which impacted the Portfolio’s total investment return. Not including these proceeds, the Portfolio’s total investment return would have been 20.23%. |
| | 5 | Includes proceeds received from a settlement of litigation, which impacted the Portfolio’s total investment return. Not including these proceeds, the Portfolio’s total investment return would have been 8.61%. |
| | | | | | |
See Notes to Financial Statements. | | | | |
| | | | | | | |
| 82 | | BLACKROCK LARGE CAP SERIES FUNDS, INC. | | MARCH 31, 2013 | | |
| | |
| | |
Notes to Financial Statements (Unaudited) | | Master Large Cap Series LLC |
1. Organization and Significant Accounting Policies:
Master Large Cap Core Portfolio, Master Large Cap Growth Portfolio and Master Large Cap Value Portfolio (collectively the “Portfolios” or individually a “Portfolio”) are each series of Master Large Cap Series LLC (the “Master LLC”). The Master LLC is registered under the Investment Company Act of 1940, as amended (the “1940 Act”), as an open-end management investment company and is organized as a Delaware limited liability company. Each Portfolio is classified as diversified. The Limited Liability Company Agreement permits the Board of Directors of the Master LLC (the “Board”) to issue nontransferable interests in the Master LLC, subject to certain limitations. The Portfolios’ financial statements are prepared in conformity with accounting principles generally accepted in the United States of America (“US GAAP”), which may require management to make estimates and assumptions that affect the reported amounts of assets and liabilities in the financial statements and the reported amount of increases and decreases in net assets from operations during the reporting period. Actual results could differ from those estimates.
The following is a summary of significant accounting policies followed by the Portfolios:
Valuation: US GAAP defines fair value as the price the Portfolios would receive to sell an asset or pay to transfer a liability in an orderly transaction between market participants at the measurement date. The Portfolios determine the fair value of their financial instruments at market value using independent dealers or pricing services under policies approved by the Board. The BlackRock Global Valuation Methodologies Committee (the “Global Valuation Committee”) is the committee formed by management to develop global pricing policies and procedures and to provide oversight of the pricing function for the Portfolios for all financial instruments.
Equity investments traded on a recognized securities exchange or the NASDAQ Global Market System (“NASDAQ”) are valued at the last reported sale price that day or the NASDAQ official closing price, if applicable. For equity investments traded on more than one exchange, the last reported sale price on the exchange where the stock is primarily traded is used. Equity investments traded on a recognized exchange for which there were no sales on that day are valued at the last available bid (long positions) or ask (short positions) price. If no bid or ask price is available, the prior day’s price will be used, unless it is determined that such prior day’s price no longer reflects the fair value of the security. Investments in open-end registered investment companies are valued at NAV each business day. Short-term securities with remaining maturities of 60 days or less may be valued at amortized cost, which approximates fair value.
The Portfolios value their investments in BlackRock Liquidity Series, LLC Money Market Series (the “Money Market Series”) at fair value, which is ordinarily based upon their pro rata ownership in the underlying fund’s net assets. The Money Market Series seeks current income consistent with maintaining liquidity and preserving capital. Although the Money Market Series is not registered under the 1940 Act, its investments will follow the parameters of investments by a money market fund that is subject to Rule 2a-7 under the 1940 Act. The Portfolios may withdraw up
to 25% of their investment daily, although the manager of the Money Market Series, in its sole discretion, may permit an investor to withdraw more than 25% on any one day.
In the event that application of these methods of valuation results in a price for an investment which is deemed not to be representative of the market value of such investment or if a price is not available, the investment will be valued by the Global Valuation Committee, or its delegate, in accordance with a policy approved by the Board as reflecting fair value (“Fair Value Assets”). When determining the price for Fair Value Assets, the Global Valuation Committee, or its delegate, seeks to determine the price that the Portfolios might reasonably expect to receive from the current sale of that asset in an arm’s-length transaction. Fair value determinations shall be based upon all available factors that the Global Valuation Committee, or its delegate, deem relevant consistent with the principles of fair value measurement which include the market approach, income approach and/or in the case of recent investments, the cost approach, as appropriate. A market approach generally consists of using comparable market transactions. The income approach generally is used to discount future cash flows to present value and adjusted for liquidity as appropriate. These factors include but are not limited to (i) attributes specific to the investment or asset; (ii) the principal market for the investment or asset; (iii) the customary participants in the principal market for the investment or asset; (iv) data assumptions by market participants for the investment or asset, if reasonably available; (v) quoted prices for similar investments or assets in active markets; and (vi) other factors, such as future cash flows, interest rates, yield curves, volatilities, prepayment speeds, loss severities, credit risks, recovery rates, liquidation amounts and/or default rates. Due to the inherent uncertainty of valuations of such investments, the fair values may differ from the values that would have been used had an active market existed. The Global Valuation Committee, or its delegate, employs various methods for calibrating valuation approaches for investments where an active market does not exist including regular due diligence of the Portfolios’ pricing vendors, a regular review of key inputs and assumptions, transactional back-testing or disposition analysis to compare unrealized gains and losses to realized gains and losses, reviews of missing or stale prices and large movements in market values and reviews of any market related activity. The pricing of all Fair Value Assets is subsequently reported to the Board or a committee thereof on a quarterly basis.
Foreign Currency: The Portfolios’ books and records are maintained in US dollars. Purchases and sales of investment securities are recorded at the rates of exchange prevailing on the respective date of such transactions. Generally, when the US dollar rises in value against a foreign currency, the Portfolios’ investments denominated in that currency will lose value because that currency is worth fewer US dollars; the opposite effect occurs if the US dollar falls in relative value.
The Portfolios do not isolate the portion of the results of operations arising as a result of changes in the foreign exchange rates from the changes in the market prices of investments held or sold for financial reporting purposes. Accordingly, the effects of changes in foreign currency exchange rates on investments are not segregated in the Statements of Operations from the effects of changes in market prices of those investments but are included as a component of net realized and
| | | | | | |
| | | | |
| | | | | | | |
| | BLACKROCK LARGE CAP SERIES FUNDS, INC. | | MARCH 31, 2013 | | 83 |
| | |
| | |
Notes to Financial Statements (continued) | | Master Large Cap Series LLC |
unrealized gain (loss) from investments. The Portfolios report realized currency gains (losses) on foreign currency related transactions as components of net realized gain (loss) for financial reporting purposes, whereas such components are treated as ordinary income for federal income tax purposes.
Segregation and Collateralization: In cases in which the 1940 Act and the interpretive positions of the Securities and Exchange Commission (“SEC”) require that the Portfolios either deliver collateral or segregate assets in connection with certain investments (e.g., foreign currency exchange contracts), the Portfolios will, consistent with SEC rules and/or certain interpretive letters issued by the SEC, segregate collateral or designate on its books and records cash or liquid securities having a market value at least equal to the amount that would otherwise be required to be physically segregated. Furthermore, based on requirements and agreements with certain exchanges and third party broker-dealers, each party to the Portfolios engaging in such transactions may have requirements to deliver/deposit securities to/with an exchange or broker-dealer as collateral for certain investments.
Investment Transactions and Investment Income: For financial reporting purposes, investment transactions are recorded on the dates the transactions are entered into (the trade dates). Realized gains and losses on investment transactions are determined on the identified cost basis. Dividend income is recorded on the ex-dividend dates. Dividends from foreign securities where the ex-dividend date may have passed are subsequently recorded when the Portfolios are informed of the ex-dividend date. Under the applicable foreign tax laws, a withholding tax at various rates may be imposed on capital gains, dividends and interest. Upon notification from issuers, some of the dividend income received from a real estate investment trust may be redesignated as a reduction of cost of the related investment and/or realized gain. Interest income, including amortization and accretion of premiums and discounts on debt securities, is recognized on the accrual basis.
Securities Lending: The Portfolios may lend securities to approved borrowers, such as banks, brokers and other financial institutions. The borrower pledges cash, securities issued or guaranteed by the US government or irrevocable letters of credit issued by a bank as collateral. The initial collateral received by each Portfolio has a value of at least 102% of the current value of the loaned securities for securities traded on U.S. exchanges and a value of at least 105% for all other securities. The collateral is maintained thereafter at all times in an amount equal to at least 100% of the current market value of the loaned securities. The market value of the loaned securities is determined at the close of business of the Portfolios and any additional required collateral is delivered to the Portfolios on the next business day. Securities lending income, as disclosed in the Statements of Operations, represents the income earned from the investment of the cash collateral, net of rebates paid to, or fees paid by, borrowers and less the fees paid to the securities lending agent. During the term of the loan, the Portfolios earn dividend or interest income on the securities loaned but do not receive interest income on the securities received as collateral. Loans of securities are terminable at any time and the borrower, after notice, is required to return borrowed securities within the standard time period for settlement of securities transactions. The risks of securities lending include the risk
that the borrower may not provide additional collateral when required or may not return the securities when due. To mitigate this risk, the Portfolios benefit from a borrower default indemnity provided by BlackRock, Inc. (“BlackRock”). BlackRock’s indemnity allows for full replacement of securities lent. The Portfolios also could suffer a loss if the value of an investment purchased with cash collateral falls below the market value of loaned securities or if the value of an investment purchased with cash collateral falls below the value of the original cash collateral received. During the six months ended March 31, 2013, any securities on loan were collateralized by cash.
Income Taxes: The Portfolios are classified as a partnership for federal income tax purposes. As such, each investor in the Portfolios is treated as the owner of its proportionate share of net assets, income, expenses and realized and unrealized gains and losses of the Portfolios. Therefore, no federal income tax provision is required. It is intended that the Portfolios’ assets will be managed so an investor in the Portfolios can satisfy the requirements of Subchapter M of the Internal Revenue Code of 1986, as amended.
The Portfolios file US federal and various state and local tax returns. No income tax returns are currently are currently under examination. The statute of limitations on the Portfolios’ US federal tax returns remains open for each of the three years ended September 30, 2012 and the period ended September 30, 2009. The statutes of limitations on the Portfolios’ state and local tax returns may remain open for an additional year depending upon the jurisdiction. Management does not believe there are any uncertain tax positions that require recognition of a tax liability.
Recent Accounting Standards: In December 2011, the Financial Accounting Standards Board (the “FASB”) issued guidance that will expand current disclosure requirements on the offsetting of certain assets and liabilities. The new disclosures will be required for investments and derivative financial instruments subject to master netting or similar agreements which are eligible for offset in the Statements of Assets and Liabilities and will require an entity to disclose both gross and net information about such investments and transactions in the financial statements. In January 2013, the FASB issued guidance that clarifies which investments and transactions are subject to the offsetting disclosure requirements. The scope of the disclosure requirements for offsetting will be limited to derivative instruments, repurchase agreements and reverse repurchase agreements, and securities borrowing and securities lending transactions. The guidance is effective for financial statements with fiscal years beginning on or after January 1, 2013, and interim periods within those fiscal years. Management is evaluating the impact of this guidance on the Portfolios’ financial statement disclosures.
Other: Expenses directly related to one Portfolio are charged to that Portfolio. Other operating expenses shared by several funds are pro rated among those funds on the basis of relative net assets or other appropriate methods.
Each Portfolio has an arrangement with the custodian whereby fees may be reduced by credits earned on uninvested cash balances, which, if
| | | | | | |
| | | | |
| | | | | | | |
| 84 | | BLACKROCK LARGE CAP SERIES FUNDS, INC. | | MARCH 31, 2013 | | |
| | |
| | |
Notes to Financial Statements (continued) | | Master Large Cap Series LLC |
applicable, are shown as fees paid indirectly in the Statements of Operations. The custodian imposes fees on overdrawn cash balances, which can be offset by accumulated credits earned or may result in additional custody charges.
2. Derivative Financial Instruments:
The Portfolios engage in various portfolio investment strategies using derivative contracts both to increase the returns of the Portfolios and/or to economically hedge, or protect, their exposure to certain risks such as equity risk, interest rate risk and foreign currency exchange rate risk. These contracts may be transacted on an exchange or over-the-counter (“OTC”).
Losses may arise if the value of the contract decreases due to an unfavorable change in the market rates or values of the underlying instrument or if the counterparty does not perform under the contract. The Portfolios’ maximum risk of loss from counterparty credit risk on OTC derivatives is generally the aggregate unrealized gain netted against any collateral pledged by the counterparty.
The Portfolios may mitigate counterparty risk by procuring collateral and through netting provisions included within an International Swaps and Derivatives Association, Inc. master agreement (“ISDA Master Agreement”) implemented between the Portfolios and each of its respective counterparties. An ISDA Master Agreement allows each Portfolio to offset with each separate counterparty certain derivative financial instrument’s payables and/or receivables with collateral held. The amount of collateral moved to/from applicable counterparties is generally based upon minimum transfer amounts of up to $500,000. To the extent amounts due to the Portfolios from their counterparties are not fully collateralized, contractually or otherwise, the Portfolios bear the risk of loss from counterparty non-performance. See Note 1 “Segregation and Collateralization” for information with respect to collateral practices. In addition, the Portfolios manage counterparty risk by entering into agreements only with counterparties that it believes have the financial resources to honor their obligations and by monitoring the financial stability of those counterparties.
Certain ISDA Master Agreements allow counterparties to OTC derivatives to terminate derivative contracts prior to maturity in the event the Portfolios’ net assets decline by a stated percentage or a Portfolio fails to meet the terms of its ISDA Master Agreements, which would cause the Portfolio to accelerate payment of any net liability owed to the counterparty.
Financial Futures Contracts: The Portfolios purchase and/or sell financial futures contracts and options on financial futures contracts to gain exposure to, or economically hedge against, changes in interest rates (interest rate risk), changes in the value of equity securities (equity risk) or foreign currencies (foreign currency exchange rate risk). Financial futures contracts are agreements between the Portfolios and a counterparty to buy or sell a specific quantity of an underlying instrument at a specified price and at a specified date. Depending on the terms of the particular contract, financial futures contracts are settled
either through physical delivery of the underlying instrument on the settlement date or by payment of a cash settlement amount on the settlement date. Pursuant to the contract, the Portfolios agree to receive from or pay to the broker an amount of cash equal to the daily fluctuation in value of the contract. Such receipts or payments are known as variation margin and are recorded by the Portfolios as unrealized appreciation or depreciation. When the contract is closed, the Portfolios record a realized gain or loss equal to the difference between the value of the contract at the time it was opened and the value at the time it was closed. The use of financial futures contracts involves the risk of an imperfect correlation in the movements in the price of financial futures contracts, interest or foreign currency exchange rates and the underlying assets.
Foreign Currency Exchange Contracts: The Portfolios enter into foreign currency exchange contracts as an economic hedge against either specific transactions or portfolio instruments or to obtain exposure to foreign currencies (foreign currency exchange rate risk). A foreign currency exchange contract is an agreement between two parties to buy and sell a currency at a set exchange rate on a future date. Foreign currency exchange contracts, when used by the Portfolios, help to manage the overall exposure to the currencies in which some of the investments held by the Portfolios are denominated. The contract is marked-to-market daily and the change in market value is recorded by the Portfolios as an unrealized gain or loss. When the contract is closed, the Portfolios record a realized gain or loss equal to the difference between the value at the time it was opened and the value at the time it was closed. The use of foreign currency exchange contracts involves the risk that the value of a foreign currency exchange contract changes unfavorably due to movements in the value of the referenced foreign currencies and the risk that the counterparty to the contract does not perform its obligations under the agreement.
Derivative Financial Instruments Categorized by Risk Exposure:
| | | | | | |
| Fair Values of Derivative Financial Instruments as of March 31, 2013 | |
| | | Asset Derivatives | |
| | | | | Master Large Cap
Growth Portfolio | |
| | | Statements of Assets
and Liabilities Location | | Value | |
Equity contracts | | Net unrealized appreciation/depreciation; Investments at value — unaffiliated1 | | $ | 170,041 | |
| | 1 | Includes cumulative appreciation/depreciation on financial futures contracts as reported in the Schedules of Investments. Only current day’s variation margin is reported within the Statements of Assets and Liabilities. |
| | | | | | |
| | | | |
| | | | | | | |
| | BLACKROCK LARGE CAP SERIES FUNDS, INC. | | MARCH 31, 2013 | | 85 |
| | |
| | |
Notes to Financial Statements (continued) | | Master Large Cap Series LLC |
| | | | | | | | | | | | | | | |
|
| |
The Effect of Derivative Financial Instruments in the Statements of
Operations Six Months Ended March 31, 2013 |
| | | Net Realized Gain (Loss) From |
| | | Master
Large Cap
Core
Portfolio | | Master
Large Cap
Growth
Portfolio | | Master
Large Cap Value
Portfolio |
Foreign currency exchange contracts: | | | | | | | | | | | | | | | |
Foreign currency exchange contracts | | | $ | (18,377 | ) | | | $ | (7,720 | ) | | | $ | (8,864 | ) |
Equity contracts: | | | | | | | | | | | | | | | |
Financial futures contracts | | | | — | | | | | 2,777 | | | | | — | |
Total | | | $ | (18,377 | ) | | | $ | (4,943 | ) | | | $ | (8,864 | ) |
| | | | | | | | | | | | | | | |
| | | | | | | | | | | | | | | |
| | | Net Change in Unrealized
Appreciation/Depreciation on | | |
| | | Master Large Cap Growth Portfolio | | |
Equity contracts: | | | | | | | | | | | | | | | |
Financial futures contracts | | | | $170,041 | | | | | | |
| | | | | | | | | | | | | | | |
For the six months ended March 31, 2013, the average quarterly balances of outstanding derivative financial instruments were as follows:
| | | | |
| | | Master Large Cap
Growth
Portfolio | |
Financial futures contracts: | | | | |
Average number of contracts purchased | | | 124 | |
Average notional value of contracts purchased | | $ | 9,649,673 | |
3. Investment Advisory Agreement and Other Transactions with Affiliates:
The PNC Financial Services Group, Inc. (“PNC”) is the largest stockholder and an affiliate, for 1940 Act purposes, of BlackRock.
The Master LLC, on behalf of each Portfolio, entered into an Investment Advisory Agreement with BlackRock Advisors, LLC (the “Manager”), the Portfolios’ investment advisor, an indirect, wholly owned subsidiary of BlackRock, to provide investment advisory and administration services. The Manager is responsible for the management of each Portfolio and provides the necessary personnel, facilities, equipment and certain other services necessary to the operations of each Portfolio. For such services, each Portfolio pays the Manager a monthly fee based on a percentage of each Portfolio’s average daily net assets at the following annual rates:
Master Large Cap Core Portfolio
| | | | |
| Average Daily Net Assets | | Rate | |
Not exceeding $1 Billion | | | 0.50 | % |
In excess of $1 Billion, but not exceeding $5 Billion | | | 0.45 | % |
In excess of $5 Billion | | | 0.40 | % |
Master Large Cap Growth Portfolio
| | | | |
| Average Daily Net Assets | | Rate | |
Not exceeding $5 Billion | | | 0.50 | % |
In excess of $5 Billion | | | 0.45 | % |
Master Large Cap Value Portfolio
| | | | |
| Average Daily Net Assets | | Rate | |
Not exceeding $3 Billion | | | 0.50 | % |
In excess of $3 Billion | | | 0.45 | % |
The Manager voluntarily agreed to waive its investment advisory fees by the amount of investment advisory fees each Portfolio pays to the Manager indirectly through its investment in affiliated money market funds. However, the Manager does not waive its investment advisory fees by the amount of investment advisory fees paid in connection with each Portfolio’s investment in other affiliated investment companies, if any. These amounts are included in fees waived by Manager in the Statements of Operations.
The Manager entered into a sub-advisory agreement with BlackRock Investment Management LLC (“BIM”), an affiliate of the Manager. The Manager pays BIM, for services it provides, a monthly fee that is a percentage of the investment advisory fees paid by each Portfolio to the Manager.
For the six months ended March 31, 2013, the Portfolios reimbursed the Manager for certain accounting services, which is included in accounting services in the Statements of Operations. The reimbursements were as follows:
| | | | |
| Master Large Cap Core Portfolio | | $13,284 | |
Master Large Cap Growth Portfolio | | $ | 5,729 | |
Master Large Cap Value Retirement | | $ | 7,123 | |
The Portfolios received an exemptive order from the SEC permitting them, among other things, to pay an affiliated securities lending agent a fee based on a share of the income derived from the securities lending activities and has retained BIM as the securities lending agent. BIM may, on behalf of the Portfolios, invest cash collateral received by the Portfolios for such loans in a private investment company managed by the Manager or in registered money market funds advised by the Manager or its affiliates. The market value of securities on loan and the value of the related collateral, if applicable, is shown in the Statements of Assets and Liabilities as securities loaned at value and collateral on securities loaned at value, respectively. The cash collateral invested by BIM, if any, is disclosed in the Schedules of Investments. Securities lending income is equal to the total of income earned from the reinvestment of cash collateral, net of rebates paid to, or fees paid by, borrowers of securities. The Portfolios retain 65% of securities lending income and pay a fee to BIM equal to 35% of such income. The Portfolios benefit from a borrower default indemnity provided by BlackRock. As a securities lending agent, BIM bears all operational costs directly related to securities lending as well as the cost of the borrower default indemnification. BIM does not receive any fees for managing cash collateral. The share of income earned by the Portfolios on the reinvestment of cash collateral is shown as securities lending — affiliated — net in the Statements of
| | | | | | |
| | | | |
| | | | | | | |
| 86 | | BLACKROCK LARGE CAP SERIES FUNDS, INC. | | MARCH 31, 2013 | | |
| | |
| | |
Notes to Financial Statements (concluded) | | Master Large Cap Series LLC |
Operations. For the six months ended March 31, 2013, BIM received the following in securities lending agent fees related to securities lending activities for the Portfolios:
| | | | |
Master Large Cap Core Portfolio | | $ | 7,305 | |
Master Large Cap Growth Portfolio | | $ | 105,059 | |
Master Large Cap Value Retirement | | $ | 1,810 | |
Certain officers and/or directors of the Master LLC are officers and/or directors of BlackRock or its affiliates.
4. Investments:
Purchases and sales of investments, excluding short-term securities, for the six months ended March 31, 2013, were as follows:
| | | | | | | | |
| | | Purchases | | | Sales | |
Master Large Cap Core Portfolio | | $ | 643,917,891 | | | $ | 869,655,664 | |
Master Large Cap Growth Portfolio | | $ | 272,827,193 | | | $ | 260,986,981 | |
Master Large Cap Value Portfolio | | $ | 223,289,371 | | | $ | 406,886,049 | |
5. Borrowings:
The Master LLC, on behalf of the Portfolios, along with certain other funds managed by the Manager and its affiliates, is a party to a $500 million credit agreement with a group of lenders. Each Portfolio may borrow under the credit agreement to fund shareholder redemptions. Effective November 2011 to November 2012, the credit agreement had the following terms: a commitment fee of 0.065% per annum based on each Portfolio’s pro rata share of the unused portion of the credit agreement and interest at a rate equal to the higher of (a) the one-month London Interbank Offered Rate (“LIBOR”) plus 0.80% per annum or (b) the Fed Funds rate plus 0.80% per annum on amounts borrowed. In addition, each Portfolio paid administration and arrangement fees which were allocated to each Portfolio based on its net assets as of October 31, 2011. The credit agreement, which expired in November 2012, was renewed with the same terms until November 2013. Effective November 2012 to November 2013, the credit agreement has the following terms: a commitment fee of 0.065% per annum based on each Portfolio’s pro rata share of the unused portion of the credit agreement and interest at a rate equal to the higher of (a) the one-month LIBOR plus 0.80% per annum or (b) the Fed Funds rate plus 0.80% per annum on amounts borrowed. In addition, each Portfolio paid administration and arrangement fees which were allocated to each Portfolio based on its net assets as of October 31, 2012. The Portfolios did not borrow under the credit agreement during the six months ended March 31, 2013.
6. Concentration, Market and Credit Risk:
In the normal course of business, the Portfolios invest in securities and enter into transactions where risks exist due to fluctuations in the market (market risk) or failure of the issuer of a security to meet all its obliga-
tions (issuer credit risk). The value of securities held by the Portfolios may decline in response to certain events, including those directly involving the issuers whose
securities are owned by the Portfolios; conditions affecting the general economy; overall market changes; local, regional or global political, social or economic instability; and currency and interest rate and price fluctuations. Similar to issuer credit risk, the Portfolios may be exposed to counterparty credit risk, or the risk that an entity with which the Portfolios have unsettled or open transactions may fail to or be unable to perform on its commitments. The Portfolios manage counterparty credit risk by entering into transactions only with counterparties that they believe have the financial resources to honor their obligations and by monitoring the financial stability of those counterparties. Financial assets, which potentially expose the Portfolios to market, issuer and counterparty credit risks, consist principally of financial instruments and receivables due from counterparties. The extent of the Portfolios’ exposure to market, issuer and counterparty credit risks with respect to these financial assets is generally approximated by their value recorded in the Statements of Assets and Liabilities, less any collateral held by the Portfolios.
As of March 31, 2013, Master Large Cap Core Portfolio and Master Large Cap Growth Portfolio invested a significant portion of their assets in securities in the information technology sector and Master Large Cap Core Portfolio and Master Large Cap Value Portfolio invested a significant portion of their assets in securities in the financials sector. Changes in economic conditions affecting the information technology and financial sectors would have a greater impact on the Portfolios and could affect the value, income and/or liquidity of positions in such securities.
7. Subsequent Events:
Management’s evaluation of the impact of all subsequent events on the Portfolios’ financial statements was completed through the date the financial statements were issued and the following item was noted:
Effective April 25, 2013, the credit agreement was terminated and a new agreement was entered into. Each Portfolio became a party to a 364-day, $800 million credit agreement, which expires in April 2014. Excluding commitments designated for a certain individual fund, each Portfolio can borrow up to an aggregate commitment amount of $500 million, subject to asset coverage and other limitations as specified in the agreement. The credit agreement has the following terms: a fee of 0.065% per annum on unused commitment amounts and interest at a rate equal to the higher of (a) the one-month LIBOR plus 0.80% per annum or (b) the Fed Funds rate plus 0.80% per annum on amounts borrowed.
| | | | | | |
| | | | | | | |
| | BLACKROCK LARGE CAP SERIES FUNDS, INC. | | MARCH 31, 2013 | | 87 |
| | |
Robert W. Forbes, Co-Chairman of the Board and Director Rodney D. Johnson, Co-Chairman of the Board and Director Paul L. Audet, Director David O. Beim, Director Henry Gabbay, Director Dr. Martina S. Horner, Director Herbert I. London, Director Ian A. MacKinnon, Director Cynthia A. Montgomery, Director Joseph P. Platt, Director Robert C. Robb, Jr., Director Toby Rosenblatt, Director Kenneth L. Urish, Director Frederick W. Winter, Director John M. Perlowski, President and Chief Executive Officer Brendan Kyne, Vice President Neal Andrews, Chief Financial Officer Jay Fife, Treasurer Brian Kindelan, Chief Compliance Officer and Anti-Money Laundering Officer Benjamin Archibald, Secretary | | Investment Advisor and Administrator BlackRock Advisors, LLC Wilmington, DE 19809 Sub-Advisor BlackRock Investment Management, LLC Princeton, NJ 08540 Accounting Agent and Transfer Agent BNY Mellon Investment Servicing (US) Inc. Wilmington, DE 19809 Custodian Brown Brothers Harriman & Co. Boston, MA 02109 Distributor BlackRock Investments, LLC New York, NY 10022 Legal Counsel Sidley Austin LLP New York, NY 10019 Independent Registered Public Accounting Firm Deloitte & Touche LLP Philadelphia, PA 19103 Address of the Fund 100 Bellevue Parkway Wilmington, DE 19809 |
| | | | | | |
| | | | |
| | | | | | | |
| 88 | | BLACKROCK LARGE CAP SERIES FUNDS, INC. | | MARCH 31, 2013 | | |
Electronic Delivery
Electronic copies of most financial reports and prospectuses are available on the Fund’s website or shareholders can sign up for e-mail notifications of quarterly statements, annual and semi-annual reports and prospectuses by enrolling in the Fund’s electronic delivery program.
To enroll:
Shareholders Who Hold Accounts with Investment Advisors, Banks or Brokerages:
Please contact your financial advisor. Please note that not all investment advisors, banks or brokerages may offer this service.
Shareholders Who Hold Accounts Directly With BlackRock:
1) Access the BlackRock website at http://www.blackrock.com/ edelivery
2) Select “eDelivery” under the “More Information” section
3) Log into your account
Householding
The Fund will mail only one copy of shareholder documents, including prospectuses, annual and semi-annual reports and proxy statements, to shareholders with multiple accounts at the same address. This practice is commonly called “householding” and is intended to reduce expenses and eliminate duplicate mailings of shareholder documents. Mailings of your shareholder documents may be householded indefinitely unless you instruct us otherwise. If you do not want the mailing of these documents to be combined with those for other members of your household, please contact the Fund at (800) 441-7762.
Availability of Quarterly Schedule of Investments
The Fund/Portfolio file their complete schedule of portfolio holdings with the SEC for the first and third quarters of each fiscal year on Form N-Q. The Fund’s/Portfolio’s Forms N-Q are available on the SEC’s website at http://www.sec.gov and may also be reviewed and copied at the SEC’s Public Reference Room in Washington, D.C. Information on how to access documents on the SEC’s website without charge may be obtained by calling (800) SEC-0330. The Fund’s/Portfolio’s Forms N-Q may also be obtained upon request and without charge by calling (800) 441-7762.
Availability of Proxy Voting Policies and Procedures
A description of the policies and procedures that the Fund/Portfolio use to determine how to vote proxies relating to portfolio securities is available (1) without charge, upon request, by calling (800) 441-7762; (2) at http://www.blackrock.com; and (3) on the SEC’s website at http:// www.sec.gov.
Availability of Proxy Voting Record
Information about how the Fund/Portfolio voted proxies relating to securities held in the Fund’s/Portfolio’s portfolios during the most recent 12-month period ended June 30 is available, upon request and without charge (1) at http://www.blackrock.com or by calling (800) 441-7762 and (2) on the SEC’s website at http://www.sec.gov.
Account Information
Call us at (800) 441-7762 from 8:00 AM to 6:00 PM EST on any business day to get information about your account balances, recent transactions and share prices. You can also reach us on the Web at http:// www.blackrock.com/funds.
Automatic Investment Plans
Investor Class shareholders who want to invest regularly can arrange to have $50 or more automatically deducted from their checking or savings account and invested in any of the BlackRock funds.
Systematic Withdrawal Plan
Investor Class shareholders can establish a systematic withdrawal plan and receive periodic payments of $50 or more from their BlackRock portfolios, as long as their account balance is at least $10,000.
Retirement Plans
Shareholders may make investments in conjunction with Traditional, Rollover, Roth, Coverdell, Simple IRAs, SEP IRAs and 403(b) Plans.
| | | | | | |
| | | | | | | |
| | BLACKROCK LARGE CAP SERIES FUNDS, INC. | | MARCH 31, 2013 | | 89 |
| | |
| | |
Additional Information (concluded) | | |
|
| BlackRock Privacy Principles |
|
BlackRock is committed to maintaining the privacy of its current and former fund investors and individual clients (collectively, “Clients”) and to safeguarding their non-public personal information. The following information is provided to help you understand what personal information BlackRock collects, how we protect that information and why in certain cases we share such information with select parties.
If you are located in a jurisdiction where specific laws, rules or regulations require BlackRock to provide you with additional or different privacy-related rights beyond what is set forth below, then BlackRock will comply with those specific laws, rules or regulations.
BlackRock obtains or verifies personal non-public information from and about you from different sources, including the following: (i) information we receive from you or, if applicable, your financial intermediary, on applications, forms or other documents; (ii) information about your transactions with us, our affiliates, or others; (iii) information we receive from a consumer reporting agency; and (iv) from visits to our websites.
BlackRock does not sell or disclose to non-affiliated third parties any non-public personal information about its Clients, except as permitted by law or as is necessary to respond to regulatory requests or to service Client accounts. These non-affiliated third parties are required to protect the confidentiality and security of this information and to use it only for its intended purpose.
We may share information with our affiliates to service your account or to provide you with information about other BlackRock products or services that may be of interest to you. In addition, BlackRock restricts access to non-public personal information about its Clients to those BlackRock employees with a legitimate business need for the information. BlackRock maintains physical, electronic and procedural safeguards that are designed to protect the non-public personal information of its Clients, including procedures relating to the proper storage and disposal of such information.
| | | | | | |
| | | | | | | |
| 90 | | BLACKROCK LARGE CAP SERIES FUNDS, INC. | | MARCH 31, 2013 | | |
| | |
| | |
A World-Class Mutual Fund Family | | |
BlackRock offers a diverse lineup of open-end mutual funds crossing all investment styles and managed by experts in equity, fixed income and tax-exempt investing
| | | | |
Equity Funds | | | | |
BlackRock ACWI ex-US Index Fund | | BlackRock Global Dividend Income Portfolio | | BlackRock Mid-Cap Growth Equity Portfolio |
BlackRock All-Cap Energy & Resources Portfolio | | BlackRock Global Long/Short Equity Fund | | BlackRock Mid-Cap Value Opportunities Fund |
BlackRock Basic Value Fund | | BlackRock Global Opportunities Portfolio | | BlackRock Natural Resources Trust |
BlackRock Capital Appreciation Fund | | BlackRock Global SmallCap Fund | | BlackRock Pacific Fund |
BlackRock China Fund | | BlackRock Health Sciences Opportunities Portfolio | | BlackRock Real Estate Securities Fund |
BlackRock Commodity Strategies Fund | | BlackRock India Fund | | BlackRock Russell 1000 Index Fund |
BlackRock Disciplined Small Cap Core Fund | | BlackRock International Fund | | BlackRock Science & Technology |
BlackRock Emerging Markets Fund | | BlackRock International Index Fund | | Opportunities Portfolio |
BlackRock Emerging Markets Long/Short | | BlackRock International Opportunities Portfolio | | BlackRock Small Cap Growth Equity Portfolio |
Equity Fund | | BlackRock Large Cap Core Fund | | BlackRock Small Cap Growth Fund II |
BlackRock Energy & Resources Portfolio | | BlackRock Large Cap Core Plus Fund | | BlackRock Small Cap Index Fund |
BlackRock Equity Dividend Fund | | BlackRock Large Cap Growth Fund | | BlackRock S&P 500 Stock Fund |
BlackRock EuroFund | | BlackRock Large Cap Value Fund | | BlackRock U.S. Opportunities Portfolio |
BlackRock Flexible Equity Fund | | BlackRock Latin America Fund | | BlackRock Value Opportunities Fund |
BlackRock Focus Growth Fund | | BlackRock Long-Horizon Equity Fund | | BlackRock World Gold Fund |
Taxable Fixed Income Funds | | | | |
BlackRock Bond Index Fund | | BlackRock Inflation Protected Bond Portfolio | | BlackRock Strategic Income |
BlackRock Core Bond Portfolio | | BlackRock International Bond Portfolio | | Opportunities Portfolio |
BlackRock CoreAlpha Bond Fund | | BlackRock Long Duration Bond Portfolio | | BlackRock Total Return Fund |
BlackRock Emerging Market Local Debt Portfolio | | BlackRock Low Duration Bond Portfolio | | BlackRock U.S. Government Bond Portfolio |
BlackRock Floating Rate Income Portfolio | | BlackRock Secured Credit Portfolio | | BlackRock U.S. Mortgage Portfolio |
BlackRock Global Long/Short Credit Fund | | BlackRock Short Obligations Fund | | BlackRock Ultra-Short Obligations Fund |
BlackRock GNMA Portfolio | | BlackRock Short-Term Treasury Fund | | BlackRock World Income Fund |
BlackRock High Yield Bond Portfolio | | | | |
Municipal Fixed Income Funds | | | | |
BlackRock California Municipal Bond Fund | | BlackRock National Municipal Fund | | BlackRock Pennsylvania Municipal Bond Fund |
BlackRock High Yield Municipal Fund | | BlackRock New Jersey Municipal Bond Fund | | BlackRock Short-Term Municipal Fund |
BlackRock Intermediate Municipal Fund | | BlackRock New York Municipal Bond Fund | | |
| | | | | | | | | | | | |
Mixed Asset Funds | | | | | | | | | | | | |
BlackRock Balanced Capital Fund | | LifePath Active Portfolios | | LifePath Index Portfolios | | |
BlackRock Emerging Market Allocation Portfolio | | 2015 | | 2040 | | | | Retirement | | 2040 | | |
BlackRock Global Allocation Fund | | 2020 | | 2045 | | | | 2020 | | 2045 | | |
BlackRock Managed Volatility Portfolio | | 2025 | | 2050 | | | | 2025 | | 2050 | | |
BlackRock Multi-Asset Income Portfolio | | 2030 | | 2055 | | | | 2030 | | 2055 | | |
BlackRock Multi-Asset Real Return Fund | | 2035 | | | | | | 2035 | | | | |
BlackRock Strategic Risk Allocation Fund | | | | | | | | | | | | |
| | | | |
BlackRock Prepared Portfolios | | LifePath Portfolios | | | | | | |
Conservative Prepared Portfolio | | Retirement | | 2040 | | | | | | | | |
Moderate Prepared Portfolio | | 2020 | | 2045 | | | | | | | | |
Growth Prepared Portfolio | | 2025 | | 2050 | | | | | | | | |
Aggressive Growth Prepared Portfolio | | 2030 | | 2055 | | | | | | | | |
| | 2035 | | | | | | | | | | |
BlackRock mutual funds are currently distributed by BlackRock Investments, LLC. You should consider the investment objectives, risks, charges and expenses of the funds under consideration carefully before investing. Each fund’s prospectus contains this and other information and is available at www.blackrock.com or by calling (800) 441-7762 or from your financial advisor. The prospectus should be read carefully before investing.
| | | | | | |
| | | | |
| | | | | | | |
| | BLACKROCK FUNDS | | MARCH 31, 2013 | | 91 |

| Item 2 – | Code of Ethics – Not Applicable to this semi-annual report |
| Item 3 – | Audit Committee Financial Expert – Not Applicable to this semi-annual report |
| Item 4 – | Principal Accountant Fees and Services – Not Applicable to this semi-annual report |
| Item 5 – | Audit Committee of Listed Registrants – Not Applicable |
(a) The registrants’ Schedule of Investments is included as part of the Report to Stockholders filed under Item 1 of this Form.
(b) Not Applicable due to no such divestments during the semi-annual period covered since the previous Form N-CSR filing.
| Item 7 – | Disclosure of Proxy Voting Policies and Procedures for Closed-End Management Investment Companies – Not Applicable |
| Item 8 – | Portfolio Managers of Closed-End Management Investment Companies – Not Applicable |
| Item 9 – | Purchases of Equity Securities by Closed-End Management Investment Company and Affiliated Purchasers – Not Applicable |
| Item 10 – | Submission of Matters to a Vote of Security Holders – There have been no material changes to these procedures. |
| Item 11 – | Controls and Procedures |
(a) – The registrants’ principal executive and principal financial officers, or persons performing similar functions, have concluded that the registrants’ disclosure controls and procedures (as defined in Rule 30a-3(c) under the Investment Company Act of 1940, as amended (the “1940 Act”)) are effective as of a date within 90 days of the filing of this report based on the evaluation of these controls and procedures required by Rule 30a-3(b) under the 1940 Act and Rule 15d-15(b) under the Securities Exchange Act of 1934, as amended.
(b) – There were no changes in the registrants’ internal control over financial reporting (as defined in Rule 30a-3(d) under the 1940 Act) that occurred during the second fiscal quarter of the period covered by this report that have materially affected, or are reasonably likely to materially affect, the registrants’ internal control over financial reporting.
| Item 12 – | Exhibits attached hereto |
(a)(1) – Code of Ethics – Not Applicable to this semi-annual report
(a)(2) – Certifications – Attached hereto
(a)(3) – Not Applicable
(b) – Certifications – Attached hereto
2
Pursuant to the requirements of the Securities Exchange Act of 1934 and the Investment Company Act of 1940, each registrant has duly caused this report to be signed on its behalf by the undersigned, thereunto duly authorized.
BlackRock Large Cap Series Funds, Inc. and Master Large Cap Series LLC
| | |
| By: | | /s/ John M. Perlowski |
| | John M. Perlowski |
Chief Executive Officer (principal executive officer) of
BlackRock Large Cap Series Funds, Inc. and Master Large Cap Series LLC
Date: June 3, 2013
Pursuant to the requirements of the Securities Exchange Act of 1934 and the Investment Company Act of 1940, this report has been signed below by the following persons on behalf of each registrant and in the capacities and on the dates indicated.
| | |
| By: | | /s/ John M. Perlowski |
| | John M. Perlowski |
Chief Executive Officer (principal executive officer) of
BlackRock Large Cap Series Funds, Inc. and Master Large Cap Series LLC
Date: June 3, 2013
| | |
| By: | | /s/ Neal J. Andrews |
| | Neal J. Andrews |
Chief Financial Officer (principal financial officer) of
BlackRock Large Cap Series Funds, Inc. and Master Large Cap Series LLC
Date: June 3, 2013
3