UNITED STATES
SECURITIES AND EXCHANGE COMMISSION
Washington, D.C. 20549
FORM N-CSR
CERTIFIED SHAREHOLDER REPORT OF REGISTERED MANAGEMENT INVESTMENT COMPANIES
Investment Company Act file number: 811-09637 and 811-09739
Name of Fund: BlackRock Large Cap Series Funds, Inc.
BlackRock Event Driven Equity Fund
BlackRock Large Cap Core Fund
BlackRock Large Cap Growth Fund
BlackRock Large Cap Value Fund
BlackRock Large Cap Value Retirement Portfolio
Master Large Cap Series LLC
Master Large Cap Core Portfolio
Master Large Cap Growth Portfolio
Master Large Cap Value Portfolio
Fund Address: 100 Bellevue Parkway, Wilmington, DE 19809
Name and address of agent for service: John M. Perlowski, Chief Executive Officer, BlackRock Large Cap Series Funds, Inc. and Master Large Cap Series LLC, 55 East 52nd Street, New York, NY 10055
Registrants’ telephone number, including area code: (800) 441-7762
Date of fiscal year end: 09/30/2016
Date of reporting period: 03/31/2016
| Item 1 – | Report to Stockholders |
MARCH 31, 2016
| | | | |
SEMI-ANNUAL REPORT (UNAUDITED) | | | | BLACKROCK® |
BlackRock Event Driven Equity Fund
| | |
| Not FDIC Insured ¡ May Lose Value ¡ No Bank Guarantee | | |
| | |

| | Shareholders can sign up for e-mail notifications of quarterly statements, annual and semi-annual shareholder reports and prospectuses by enrolling in the electronic delivery program. Electronic copies of shareholder reports and prospectuses are also available on BlackRock’s website. TO ENROLL IN ELECTRONIC DELIVERY: Shareholders Who Hold Accounts with Investment Advisors, Banks or Brokerages: Please contact your financial advisor. Please note that not all investment advisors, banks or brokerages may offer this service. Shareholders Who Hold Accounts Directly with BlackRock: 1. Access the BlackRock website at blackrock.com 2. Select “Access Your Account” 3. Next, select “eDelivery” in the “Related Resources” box and follow the sign-up instructions |
| | | | | | |
| 2 | | BLACKROCK EVENT DRIVEN EQUITY FUND | | MARCH 31, 2016 | | |
Dear Shareholder,
Diverging monetary policies and shifting economic outlooks across regions have been the overarching themes driving financial markets over the past couple of years. Investors spent most of 2015 anticipating the end of the Federal Reserve’s (the “Fed”) near-zero interest rate policy as U.S. growth outpaced other developed markets. The Fed ultimately hiked rates in December, whereas the European Central Bank and the Bank of Japan took additional steps to stimulate growth, even introducing negative interest rates. The U.S. dollar had strengthened considerably ahead of these developments, causing profit challenges for U.S. companies that generate revenues overseas, and pressuring emerging market currencies and commodities prices.
Global market volatility increased in the latter part of 2015 and spilled over into early 2016. Oil prices were a key factor behind the instability after collapsing in mid-2015 due to excess global supply. China, one of the world’s largest consumers of oil, was another notable source of stress for financial markets. Signs of slowing economic growth, a depreciating yuan and declining confidence in the country’s policymakers stoked investors’ worries about the potential impact of China’s weakness on the global economy.
Fears of a global recession started to fade toward the end of the first quarter of 2016 and volatility abated. Central bank stimulus in Europe and Japan, combined with a more tempered outlook for rate hikes in the United States, helped bolster financial markets. A softening in U.S. dollar strength offered some relief to U.S. exporters and emerging market economies. Oil prices found firmer footing as global supply showed signs of leveling off.
The selloff in risk assets at the turn of the year has resulted in more reasonable valuations and some appealing entry points for investors today. However, investors continue to face the headwinds of uncertainty around China’s growth trajectory and currency management, the potential consequences of negative interest rates and geopolitical risks.
For the 12 months ended March 31, 2016, higher-quality assets such as municipal bonds, U.S. Treasuries and investment grade corporate bonds generated positive returns, while riskier assets such as non-U.S. and small cap equities broadly declined.
At BlackRock, we believe investors need to think globally, extend their scope across a broad array of asset classes and be prepared to adjust accordingly as market conditions change over time. We encourage you to talk with your financial advisor and visit blackrock.com for further insight about investing in today’s markets.
Sincerely,
|
 |
Rob Kapito |
| President, BlackRock Advisors, LLC |

Rob Kapito
President, BlackRock Advisors, LLC
| | | | | | | | |
| Total Returns as of March 31, 2016 | |
| | | 6-month | | | 12-month | |
U.S. large cap equities
(S&P 500® Index) | | | 8.49% | | | | 1.78% | |
U.S. small cap equities
(Russell 2000® Index) | | | 2.02 | | | | (9.76) | |
International equities
(MSCI Europe, Australasia, Far East Index) | | | 1.56 | | | | (8.27) | |
Emerging market equities
(MSCI Emerging Markets Index) | | | 6.41 | | | | (12.03) | |
3-month Treasury bills
(BofA Merrill Lynch
3-Month U.S. Treasury Bill Index) | | | 0.10 | | | | 0.12 | |
U.S. Treasury securities
(BofA Merrill Lynch
10-Year U.S. Treasury Index) | | | 3.27 | | | | 3.05 | |
U.S. investment-grade bonds
(Barclays U.S. Aggregate Bond Index) | | | 2.44 | | | | 1.96 | |
Tax-exempt municipal bonds
(S&P Municipal Bond Index) | | | 3.23 | | | | 3.95 | |
U.S. high yield bonds
(Barclays U.S. Corporate High Yield 2% Issuer Capped Index) | | | 1.23 | | | | (3.66) | |
|
| Past performance is no guarantee of future results. Index performance is shown for illustrative purposes only. You cannot invest directly in an index. | |
| | | | | | |
| | | THIS PAGE NOT PART OF YOUR FUND REPORT | | | | 3 |
| | |
Fund Summary as of March 31, 2016 | | |
BlackRock Event Driven Equity Fund’s (the “Fund”) investment objective is to seek long-term capital growth.
|
| Portfolio Management Commentary |
How did the Fund perform?
| • | | For the six-month period ended March 31, 2016, the Fund underperformed its benchmark, the Russell 1000® Index, and outperformed the BofA Merrill Lynch 3-Month U.S. Treasury Bill Index. |
What factors influenced performance?
| • | | The Fund’s tactical beta management (managing the Fund with a consideration of market movements), contributed to performance in October. In November, the Fund’s beta was tactically flattened, which protected the Fund from the extreme volatility markets experienced during the rest of the period. In addition, several positions in “hard catalysts” situations, (e.g., publicly announced transactions or restructurings) contributed to performance. Top contributors included the mergers of Time Warner Cable Inc. and Charter Communications Inc., BG Group PLC and Royal Dutch Shell PLC, Avago Technologies Ltd. with Broadcom Corp., and acquisition of Precision Castparts Corp. by Berkshire Hathaway Inc. |
| • | | Key detractors from the Fund’s performance over the period included hard catalyst positioning in the Pfizer, Inc./Allergan, Inc., Abbott/Alere, Inc. and Western Digital Corp./SanDisk Corp. mergers. A “soft catalyst” investment (e.g., when companies undergo meaningful corporate events expected to change their share prices) in Williams Companies, Inc. also detracted from returns in sympathy with the selloff in the commodities sector, as did cross-capital structure positioning in YRC Worldwide Inc. |
Describe recent portfolio activity.
| • | | During the reporting period, the Fund tactically flattened its directional market exposure, reducing beta from 0.35 to the S&P 500 as of September 30, 2015 to 0.11 as of March 31, 2016. |
| • | | Additionally, the Fund increased exposure to several high-conviction, short duration investments, which resulted in a peak gross exposure of approximately 250% in December. As these short duration investments played out successfully, the portfolio’s gross exposure naturally decreased, and the Fund concluded the period with a gross exposure of 150%. |
| • | | The Fund held derivatives during the period as part of its investment strategy. Specifically, single equity total return swaps are used by the portfolio management team as the primary instrument to gain exposure to merger arbitrage situations. As a result, cash and cash equivalents are not representative of unencumbered cash, and the portfolio is fully invested with a gross exposure of 150% as of March 31, 2016. |
Describe portfolio positioning at period end.
| • | | At period end, the Fund was comprised of 56 investments spanning the spectrum of corporate events from “hard” catalysts (e.g. publically announced transactions or restructurings) to “soft” catalysts (e.g., companies undergoing meaningful corporate events expected to change their share prices). Given the current robust opportunity set in mergers and acquisitions, the Fund is invested predominantly in hard catalyst situations with soft catalyst positions and performing credit investments rounding out the portfolio. The Fund’s exposure was concentrated in the United States, with 86% of exposure in North America, 13% in developed Europe, and 1% in developed Asia. The Fund was diversified across sectors and market capitalizations. |
The views expressed reflect the opinions of BlackRock as of the date of this report and are subject to change based on changes in market, economic or other conditions. These views are not intended to be a forecast of future events and are no guarantee of future results.
| | | | | | | | | | | | |
| | | Percent of Total Investments1 | |
| Sector Allocation | | Long | | | Short | | | Total | |
Information Technology | | | 17% | | | | 5% | | | | 22 | % |
Health Care | | | 11 | | | | 10 | | | | 21 | |
Consumer Discretionary | | | 10 | | | | 4 | | | | 14 | |
Financials | | | 7 | | | | 4 | | | | 11 | |
Energy | | | 7 | | | | 4 | | | | 11 | |
Consumer Staples | | | 8 | | | | —2 | | | | 8 | |
Materials | | | 5 | | | | —2 | | | | 5 | |
Pharmaceuticals | | | 5 | | | | — | | | | 5 | |
Industrials | | | 2 | | | | —2 | | | | 2 | |
Telecommunication Services | | | 1 | | | | — | | | | 1 | |
Total | | | 73% | | | | 27% | | | | 100 | % |
| | 1 | | Total investments include the gross notional values of long and short equity securities of the underlying derivative contracts utilized by the fund and exclude short-term securities. |
| | 2 | | Amount is less than 1%. |
| | | | | | |
| 4 | | BLACKROCK EVENT DRIVEN EQUITY FUND | | MARCH 31, 2016 | | |
|
| Total Return Based on a $10,000 Investment |
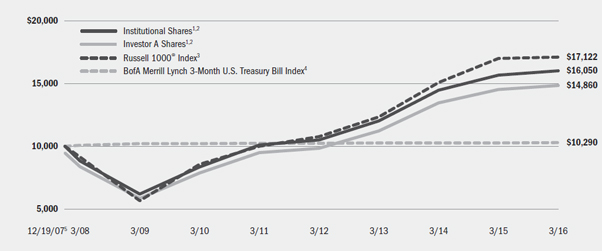
| | 1 | Assuming maximum sales charges, if any, transaction costs and other operating expenses, including investment advisory fees. Institutional Shares do not have a sales charge. |
| | 2 | Under normal circumstances, the Fund invests at least 80% of its net assets (plus any borrowings for investment purposes) in equity securities and related derivative instruments with similar economic characteristics. The Fund’s total returns prior to May 8, 2015, are the returns of the Fund when it followed different investment strategies under the name BlackRock Large Cap Core Plus Fund. |
| | 3 | An index that measures the performance of the large cap segment of the U.S. equity universe. It is a subset of the Russell 3000® Index and includes approximately 1,000 of the largest securities based on a combination of their market capitalization and current index membership. The index represents approximately 92% of the total market capitalization of the Russell 3000® Index. |
| | 4 | An unmanaged index that tracks 3-month U.S. Treasury securities. |
| | 5 | Commencement of operations. |
|
| Performance Summary for the Period Ended March 31, 2016 |
| | | | | | | | | | | | | | |
| | | | | Average Annual Total Returns2,6 |
| | | | | 1 Year | | 5 Years | | Since Inception7 |
| | | 6-Month
Total Returns | | w/o sales
charge | | w/ sales
charge | | w/o sales
charge | | w/ sales
charge | | w/o sales
charge | | w/ sales
charge |
Institutional | | 5.59% | | 2.32% | | N/A | | 9.65% | | N/A | | 5.88% | | N/A |
Investor A | | 5.54 | | 2.09 | | (3.27)% | | 9.36 | | 8.19% | | 5.58 | | 4.90% |
Investor C | | 5.13 | | 1.41 | | 0.86 | | 8.57 | | 8.57 | | 4.82 | | 4.82 |
Russell 1000® Index | | 7.75 | | 0.50 | | N/A | | 11.35 | | N/A | | 6.71 | | N/A |
BofA Merrill Lynch 3-Month U.S. Treasury Bill Index | | 0.10 | | 0.12 | | N/A | | 0.08 | | N/A | | 0.35 | | N/A |
| | 6 | | Assuming maximum sales charges, if any. Average annual total returns with and without sales charges reflect reductions for distribution and service fees. See “About Fund Performance” on page 6 for a detailed description of share classes, including any related sales charges and fees. |
| | 7 | | The Fund commenced operations on December 19, 2007. |
| | | | N/A—Not applicable as share class and index do not have a sales charge. |
| | | | Past performance is not indicative of future results. |
| | | | Performance results do not include adjustments made for financial reporting purposes in accordance with U.S. generally accepted accounting principles and may differ from amounts reported in the financial highlights on pages 18-20. |
| | | | | | |
| | | BLACKROCK EVENT DRIVEN EQUITY FUND | | MARCH 31, 2016 | | 5 |
| • | | Institutional Shares are not subject to any sales charge. These shares bear no ongoing distribution or service fees and are available only to certain eligible investors. |
| • | | Investor A Shares are subject to a maximum initial sales charge (front-end load) of 5.25% and a service fee of 0.25% per year (but no distribution fee). Certain redemptions of these shares may be subject to a contingent deferred sales charge (“CDSC”) where no initial sales charge was paid at the time of purchase. These shares are generally available through financial intermediaries. |
| • | | Investor C Shares are subject to a 1.00% CDSC if redeemed within one year of purchase. In addition, these shares are subject to a distribution fee of 0.75% per year and a service fee of 0.25% per year. These shares are generally available through financial intermediaries. |
Performance information reflects past performance and does not guarantee future results. Current performance may be lower or higher than the performance data quoted. Refer to www.blackrock.com/funds to obtain performance data current to the most recent month end. Performance results do not reflect the deduction of taxes that a shareholder
would pay on fund distributions or the redemption of fund shares. Figures shown in the performance table on the previous page assume reinvestment of all distributions, if any, at net asset value (“NAV”) on the ex-dividend date. Investment return and principal value of shares will fluctuate so that shares, when redeemed, may be worth more or less than their original cost. Distributions paid to each class of shares will vary because of the different levels of service, distribution and transfer agency fees applicable to each class, which are deducted from the income available to be paid to shareholders.
BlackRock Advisors, LLC (the “Manager”), the Fund’s investment advisor, has contractually agreed to waive and/or reimburse a portion of the Fund’s expenses. Without such waiver and/or reimbursement, the Fund’s performance would have been lower. The Manager is under no obligation to continue waiving and/or reimbursing its fees after the applicable termination date of such agreement. See Note 6 of the Notes to Financial Statements for additional information on waivers and/or reimbursements.
|
| Derivative Financial Instruments |
The Fund may invest in various derivative financial instruments. These instruments are used to obtain exposure to a security, commodity, index, market and/or other assets without owning or taking physical custody of securities, commodities and/or other referenced assets to manage market, equity, credit, interest rate, foreign currency exchange rate, commodity and/or other risks. Derivative financial instruments may give rise to a form of economic leverage and involve risks, including the imperfect correlation between the value of a derivative financial instrument and the underlying asset, possible default of the counterparty to the transaction
or illiquidity of the instrument. The Fund’s successful use of a derivative financial instrument depends on the investment advisor’s ability to predict pertinent market movements accurately, which cannot be assured. The use of these instruments may result in losses greater than if they had not been used, may limit the amount of appreciation the Fund can realize on an investment and/or may result in lower distributions paid to shareholders. The Fund’s investments in these instruments, if any, are discussed in detail in the Notes to Financial Statements.
| | | | | | |
| 6 | | BLACKROCK EVENT DRIVEN EQUITY FUND | | MARCH 31, 2016 | | |
Shareholders of the Fund may incur the following charges: (a) transactional expenses, such as sales charges and (b) operating expenses, including investment advisory fees, service and distribution fees, including 12b-1 fees, acquired fund fees and expenses, and other fund expenses. The expense example shown below (which is based on a hypothetical investment of $1,000 invested on October 1, 2015 and held through March 31, 2016) is intended to assist shareholders both in calculating expenses based on an investment in the Fund and in comparing these expenses with similar costs of investing in other mutual funds.
The expense example provides information about actual account values and actual expenses. In order to estimate the expenses a shareholder paid during the period covered by this report, shareholders can divide their account value by $1,000 and then multiply the result by the number corresponding to their share class under the heading entitled “Expenses Paid During the Period.”
The expense example also provides information about hypothetical account values and hypothetical expenses based on the Fund’s actual expense ratio and an assumed rate of return of 5% per year before expenses. In order to assist shareholders in comparing the ongoing expenses of investing in the Fund and other funds, compare the 5% hypothetical example with the 5% hypothetical examples that appear in shareholder reports of other funds.
The expenses shown in the expense example are intended to highlight shareholders’ ongoing costs only and do not reflect any transactional expenses, such as sales charges, if any. Therefore, the hypothetical example is useful in comparing ongoing expenses only, and will not help shareholders determine the relative total expenses of owning different funds. If these transactional expenses were included, shareholder expenses would have been higher.
| | | | | | | | | | | | | | | | | | | | | | | | | | | | | | | | | | | | | | | | | | | | | |
| Expense Example | | | | | | | | | | | | | | | | | | | | | | | | | | | | | | | | | | | | |
| | | Actual | | Hypothetical3 |
| | | | | | | Expenses Paid During the Period | | | | Including
Interest Expense | | Excluding
Interest Expense |
| | | Beginning
Account Value
October 1,
2015 | | Ending
Account Value
March 31,
2016 | | Including
Interest Expense1 | | Excluding
Interest Expense2 | | Beginning
Account Value
October 1,
2015 | | Ending
Account Value
March 31,
2016 | | Expenses
Paid During
the Period1 | | Ending
Account Value
March 31,
2016 | | Expenses
Paid During
the Period2 |
Institutional | | | | $1,000.00 | | | | | $1,055.90 | | | | | $ 7.14 | | | | | $ 7.09 | | | | | $1,000.00 | | | | | $1,018.05 | | | | | $ 7.01 | | | | | $1,018.10 | | | | | $ 6.96 | |
Investor A | | | | $1,000.00 | | | | | $1,055.40 | | | | | $ 8.53 | | | | | $ 8.48 | | | | | $1,000.00 | | | | | $1,016.70 | | | | | $ 8.37 | | | | | $1,016.75 | | | | | $ 8.32 | |
Investor C | | | | $1,000.00 | | | | | $1,051.30 | | | | | $12.26 | | | | | $12.26 | | | | | $1,000.00 | | | | | $1,013.05 | | | | | $12.03 | | | | | $1,013.05 | | | | | $12.03 | |
| | 1 | | For each class of the Fund, expenses are equal to the annualized expense ratio for the class (1.39% for Institutional, 1.66% for Investor A, and 2.39% for Investor C), multiplied by the average account value over the period, multiplied by 183/366 (to reflect the one-half year period shown). |
| | 2 | | For each class of the Fund, expenses are equal to the annualized expense ratio for the class (1.38% for Institutional, 1.65% for Investor A, and 2.39% for Investor C), multiplied by the average account value over the period, multiplied by 183/366 (to reflect the one-half year period shown). |
| | 3 | | Hypothetical 5% annual return before expenses is calculated by prorating the number of days in the most recent fiscal half year divided by 366. |
| | | | See “Disclosure of Expenses” above for further information on how expenses were calculated. |
| | | | | | |
| | | BLACKROCK EVENT DRIVEN EQUITY FUND | | MARCH 31, 2016 | | 7 |
| | | | |
| Schedule of Investments March 31, 2016 (Unaudited) | | | (Percentages shown are based on Net Assets) | |
| | | | | | | | | | | | |
| Common Stocks | | | | | Shares | | | Value | |
Banks — 0.2% | | | | | | | | | | | | |
Valley National Bancorp | | | | | | | 15,000 | | | $ | 143,100 | |
Chemicals — 0.0% | | | | | | | | | | | | |
Olin Corp. | | | | | | | 1,197 | | | | 20,792 | |
Food Products — 0.2% | | | | | | | | | | | | |
Kraft Heinz Co. | | | | | | | 1,800 | | | | 141,408 | |
Health Care Equipment & Supplies — 0.3% | | | | | | | | | | | | |
Cooper Cos., Inc. | | | | | | | 850 | | | | 130,875 | |
Zimmer Biomet Holdings, Inc. | | | | | | | 1,300 | | | | 138,619 | |
| | | | | | | | | | | | |
| | | | | | | | | | | | 269,494 | |
Health Care Providers & Services — 0.3% | | | | | | | | | | | | |
Aetna, Inc. | | | | | | | 228 | | | | 25,616 | |
Anthem, Inc. | | | | | | | 166 | | | | 23,072 | |
Brookdale Senior Living, Inc. (a) | | | | | | | 4,390 | | | | 69,713 | |
Cigna Corp. | | | | | | | 1,500 | | | | 205,860 | |
| | | | | | | | | | | | |
| | | | | | | | | | | | 324,261 | |
Industrial Conglomerates — 0.2% | | | | | | | | | | | | |
Danaher Corp. | | | | | | | 1,800 | | | | 170,748 | |
Oil, Gas & Consumable Fuels — 0.0% | | | | | | | | | | | | |
Williams Cos., Inc. | | | | | | | 2,900 | | | | 46,603 | |
Pharmaceuticals — 0.3% | | | | | | | | | | | | |
Pfizer, Inc. | | | | | | | 8,500 | | | | 251,940 | |
Real Estate Investment Trusts (REITs) — 0.2% | | | | | | | | | | | | |
VEREIT, Inc. | | | | | | | 17,000 | | | | 150,790 | |
Total Common Stocks — 1.7% | | | | | | | | | | | 1,519,136 | |
| | | | | | | | | | | | |
| Corporate Bonds | | | | | Par
(000) | | | | |
Diversified Financial Services — 0.5% | | | | | | | | | | | | |
Solera LLC/Solera Finance, Inc., 10.50%, 3/01/24 (b) | | $ | | | | | 454 | | | | 456,270 | |
Hotels, Restaurants & Leisure — 0.5% | | | | | | | | | | | | |
Station Casinos LLC, 7.50%, 3/01/21 | | | | | | | 466 | | | | 493,378 | |
Media — 2.2% | | | | | | | | | | | | |
Neptune Finco Corp., 10.88%, 10/15/25 (b) | | | | | | | 1,380 | | | | 1,500,060 | |
Univision Communications, Inc., 8.50%, 5/15/21 (b) | | | | | | | 470 | | | | 479,400 | |
| | | | | | | | | | | | |
| | | | | | | | | | | | 1,979,460 | |
Oil, Gas & Consumable Fuels — 0.6% | | | | | | | | | | | | |
Williams Cos., Inc., 4.55%, 6/24/24 | | | | | | | 750 | | | | 570,000 | |
Pharmaceuticals — 0.3% | | | | | | | | | | | | |
Valeant Pharmaceuticals International, Inc., 6.13%, 4/15/25 (b) | | | | | | | 375 | | | | 288,750 | |
Total Corporate Bonds — 4.1% | | | | | | | | | | | 3,787,858 | |
| | | | | | | | | | | | |
| | | | | | | | | | |
| | | | | | | | | | |
| Floating Rate Loan Interests (c) | | | | Par (000) | | | Value | |
Wireless Telecommunication Services — 0.5% | | | | | |
nTelos, Inc., Term B Advance, 5.75%, 11/09/19 | | $ | | | 496 | | | $ | 492,423 | |
Total Floating Rate Loan Interests — 0.5% | | | | | | | | | 492,423 | |
Total Long-Term Investments (Cost — $6,044,788) — 6.3% | | | | | | | | | 5,799,417 | |
| | | | | | | | | | |
| Short-Term Securities | | | | | | | | |
Borrowed Bond Agreements — 0.4% (d) | | | | | | | | | | |
Citigroup Global Markets, Inc., 0.00%, Open (e)
(Purchased on 3/10/16 to be repurchased at $367,031, collateralized by Valeant Pharmaceuticals International, Inc., 6.75% due at 8/15/18, par and fair value of USD 375,000 and $340,313, respectively) | | | 367 | | | | 367,031 | |
| | | | | | | | | | |
| | | | | Shares | | | | |
Money Market Funds — 92.4% | | | | | | | | | | |
BlackRock Liquidity Funds, TempFund, Institutional Class, 0.37% (f)(g) | | | | | 85,456,337 | | | | 85,456,337 | |
Total Short-Term Securities (Cost — $85,823,368) — 92.8% | | | | | | | | | 85,823,368 | |
Total Investments Before Borrowed Bonds (Cost — $91,868,156) — 99.1% | | | | 91,622,785 | |
| | | | | | | | | | |
| | | | |
| Borrowed Bonds | | | | Par (000) | | | | |
Corporate Bonds — (0.4)% | | | | | | | | | | |
Valeant Pharmaceuticals International, Inc., 6.75%, 8/15/18 | | $ | | | 375 | | | | (340,313 | ) |
Total Borrowed Bonds (Proceeds — $363,964) — (0.4)% | | | | | | | | | (340,313 | ) |
Total Investments, Net of Borrowed Bonds — 98.7% | | | | 91,282,472 | |
Other Assets in Excess of Liabilities — 1.3% | | | | 1,186,049 | |
| | | | | | | | | | |
Net Assets — 100.0% | | | | | | | | $ | 92,468,521 | |
| | | | | | | | | | |
| | | | | | | | | | |
| Portfolio Abbreviations |
| ADR | | American Depositary Receipt | | GBP | | British Pound | | S&P | | Standard & Poor’s |
| ETF | | Exchange-Traded Fund | | LIBOR | | London Interbank Offered Rate | | SPDR | | Standard & Poor’s Depositary Receipts |
| EUR | | Euro | | OTC | | Over-the-Counter | | USD | | U.S. Dollar |
See Notes to Financial Statements.
| | | | | | |
| 8 | | BLACKROCK EVENT DRIVEN EQUITY FUND | | MARCH 31, 2016 | | |
| | |
| Schedule of Investments (continued) | | |
|
| Notes to Schedule of Investments |
| (a) | Non-income producing security. |
| (b) | Security exempt from registration pursuant to Rule 144A under the Securities Act of 1933, as amended. These securities may be resold in transactions exempt from registration to qualified institutional investors. |
| (c) | Variable rate security. Rate as of period end. |
| (d) | Certain agreements have no stated maturity and can be terminated by either party at any time. |
| (e) | The amount to be repurchased assumes the maturity will be the day after the period end. |
| (f) | During the six months ended March 31, 2016, investments in issuers considered to be an affiliate of the Fund for purposes of Section 2(a)(3) of the Investment Company Act of 1940, as amended, were as follows: |
| | | | | | | | | | | | | | | | | | | | |
| Affiliate | | Shares Held at
September 30, 2015 | | | Net
Activity | | | Shares Held at
March 31, 2016 | | | Income | | | Realized
Gain | |
BlackRock Liquidity Funds, TempFund, Institutional Class | | | 14,378,507 | | | | 71,077,830 | | | | 85,456,337 | | | $ | 74,565 | | | | $985 | |
| (g) | Current yield as of period end. |
| • | | For Fund compliance purposes, the Fund’s industry classifications refer to any one or more of the industry sub-classifications used by one or more widely recognized market indexes or ratings group indexes, and/or as defined by the investment advisor. These definitions may not apply for purposes of this report, which may combine such industry sub-classifications for reporting ease. |
See Notes to Financial Statements.
| | | | | | |
| | | BLACKROCK EVENT DRIVEN EQUITY FUND | | MARCH 31, 2016 | | 9 |
| | |
| Schedule of Investments (continued) | | |
|
| Derivative Financial Instruments Outstanding as of Period End |
Centrally Cleared Credit Default Swaps — Buy Protection
| | | | | | | | | | | | | | | | |
| Index | | Pay
Fixed Rate | | | Expiration
Date | | | Notional
Amount
(000) | | | Unrealized
Depreciation | |
CDX.NA.HY Series 26 Version 1 | | | 5.00 | % | | | 6/20/21 | | | | $850 | | | | $(5,515 | ) |
| | | | | | | | | | | | | | | | |
OTC Total Return Swaps1
| | | | | | | | | | | | | | | | | | |
| Reference Entity | | Counterparty | | Expiration
Dates | | | Net Notional | | | Unrealized
Appreciation
(Depreciation) | | | Net Value of
Reference
Entity | |
Equity Securities Long/Short: | | Citibank N.A. | | | 5/09/16-8/17/16 | | | | $ 5,105,748 | | | | $92,3772 | | | | $ 5,159,431 | |
| | Citibank N.A. | | | 6/06/16 | | | | $ (728,474 | ) | | | (13,543)3 | | | | (727,560 | ) |
| | Goldman Sachs & Co. | | | 3/02/17-10/05/17 | | | | $ 5,686,044 | | | | 84,1544 | | | | 5,757,156 | |
| | Goldman Sachs & Co. | | | 3/02/17 | | | | $ (654 | ) | | | 2725 | | | | (398 | ) |
| | Morgan Stanley & Co. International PLC | | | 6/07/17-5/17/18 | | | | $43,815,034 | | | | 1,419,9576 | | | | 45,318,332 | |
| | Morgan Stanley & Co. International PLC | | | 6/01/18-7/11/18 | | | | $ 821,332 | | | | (26,405)7 | | | | 794,572 | |
| | | | | | | | | | | | | | $1,556,812 | | | | $56,301,533 | |
| | | | | | | | | | | | | | |
| | 1 | | The Fund receives or pays the total return on a portfolio of long and short positions underlying the total return swap. In addition, the Fund pays or receives a variable rate of interest, based on a specified benchmark, plus or minus a spread in a range of 20-270 basis points. The benchmark and spread are determined based upon the country and/or currency of the individual underlying positions. The following are the specified benchmarks used in determining the variable rate of interest: |
| | | | Euro OverNight Index Average |
| | | | Garban Intercapital Federal Funds Rate Open |
| | | | Intercontinental Exchange LIBOR: |
| | 2 | | Amount includes $38,694 of net dividends and financing fees. |
| | 3 | | Amount includes $(14,457) of net dividends and financing fees. |
| | 4 | | Amount includes $13,042 of net dividends and financing fees. |
| | 5 | | Amount includes $16 of net dividends and financing fees. |
| | 6 | | Amount includes $(83,341) of net dividends and financing fees. |
| | 7 | | Amount includes $355 of net dividends and financing fees. |
The following table represents the individual long and short positions and related values of equity securities underlying the total return swap with Citibank N.A., as of period end, expiration dates 5/09/16-8/17/16:
| | | | | | | | |
| | | Shares | | | Value | |
| Reference Entity — Long | | | | | | |
Airgas, Inc. | | | 7,454 | | | $ | 1,055,784 | |
Alere, Inc. | | | 25,823 | | | | 1,306,902 | |
Baxalta, Inc. | | | 83 | | | | 3,353 | |
Cameron International Corp. | | | 250 | | | | 16,763 | |
Humana, Inc. | | | 192 | | | | 35,126 | |
KLA-Tencor Corp. | | | 16,650 | | | | 1,212,287 | |
National Penn Bancshares, Inc. | | | 236,523 | | | | 2,706,166 | |
NTELOS Holdings Corp. | | | 13,309 | | | | 122,443 | |
Office Depot, Inc. | | | 15,000 | | | | 106,500 | |
SABMiller PLC | | | 2,831 | | | | 172,911 | |
SanDisk Corp. | | | 2,284 | | | | 173,767 | |
Time Warner Cable, Inc. | | | 2,000 | | | | 409,240 | |
| | | | | | | | |
| | | Shares | | | Value | |
TNT Express NV | | | 53,212 | | | $ | 477,389 | |
Total Reference Entity — Long | | | | | | | 7,798,631 | |
| | | | | | | | |
| Reference Entity — Short | | | | | | |
Aetna, Inc. | | | (161 | ) | | | (18,088 | ) |
BB&T Corp. | | | (50,855 | ) | | | (1,691,946 | ) |
Centene Corp. | | | (1 | ) | | | (63 | ) |
Charter Communications, Inc., Class A | | | (929 | ) | | | (188,057 | ) |
Lam Research Corp. | | | (8,325 | ) | | | (687,645 | ) |
Schlumberger Ltd. | | | (179 | ) | | | (13,201 | ) |
Shire PLC — ADR | | | (12 | ) | | | (2,063 | ) |
Staples, Inc. | | | (3,282 | ) | | | (36,200 | ) |
Western Digital Corp. | | | (41 | ) | | | (1,937 | ) |
Total Reference Entity — Short | | | | | | | (2,639,200 | ) |
Net Value of Reference Entity — Citibank N.A. | | | | | | | $5,159,431 | |
See Notes to Financial Statements.
| | | | | | |
| 10 | | BLACKROCK EVENT DRIVEN EQUITY FUND | | MARCH 31, 2016 | | |
| | |
| Schedule of Investments (continued) | | |
The following table represents the individual long and short positions and related values of equity securities underlying the total return swap with Citibank N.A., as of period end, expiration date 6/06/16:
| | | | | | | | |
| | | Shares | | | Value | |
| Reference Entity — Short | | | | | | |
Abbott Laboratories | | | (529 | ) | | | $ (22,128 | ) |
Bank of America Corp. | | | (1,631 | ) | | | (22,051 | ) |
Campbell Soup Co. | | | (1,439 | ) | | | (91,794 | ) |
Consumer Staples Select Sector SPDR Fund | | | (1,407 | ) | | | (74,641 | ) |
Energy Select Sector SPDR Fund | | | (963 | ) | | | (59,629 | ) |
Industrial Select Sector SPDR Fund | | | (751 | ) | | | (41,658 | ) |
iShares U.S. Real Estate ETF | | | (29 | ) | | | (2,258 | ) |
Johnson & Johnson | | | (657 | ) | | | (71,087 | ) |
JPMorgan Chase & Co. | | | (409 | ) | | | (24,221 | ) |
Merck & Co., Inc. | | | (687 | ) | | | (36,349 | ) |
Mettler-Toledo International, Inc. | | | (126 | ) | | | (43,440 | ) |
SPDR S&P 500 ETF Trust | | | (703 | ) | | | (144,509 | ) |
SPDR S&P Regional Banking ETF | | | (645 | ) | | | (24,278 | ) |
Stryker Corp. | | | (268 | ) | | | (28,754 | ) |
Waters Corp. | | | (309 | ) | | | (40,763 | ) |
Total Reference Entity — Short | | | | | | | (727,560 | ) |
Net Value of Reference Entity — Citibank N.A. | | | | | | | $(727,560 | ) |
| | | | | | | | |
| | | | | | | |
The following table represents the individual long and short positions and related values of equity securities underlying the total return swap with Goldman Sachs & Co., as of period end, expiration dates 3/02/17-10/05/17:
| | | | | | | | |
| | | Shares | | | Value | |
| Reference Entity — Long | | | | | | |
Airgas, Inc. | | | 8,072 | | | $ | 1,143,318 | |
Alere, Inc. | | | 3,085 | | | | 156,132 | |
Atmel Corp. | | | 232,902 | | | | 1,891,164 | |
Baxalta, Inc. | | | 674 | | | | 27,230 | |
Checkpoint Systems, Inc. | | | 7,895 | | | | 79,897 | |
Fidelity & Guaranty Life | | | 7,199 | | | | 188,902 | |
Newport Corp. | | | 18,627 | | | | 428,421 | |
Rite Aid Corp. | | | 107,394 | | | | 875,261 | |
Rouse Properties, Inc. | | | 476 | | | | 8,749 | |
SABMiller PLC | | | 7,607 | | | | 464,618 | |
TNT Express NV | | | 9,361 | | | | 83,982 | |
Youku Tudou, Inc. — ADR | | | 15,521 | | | | 426,672 | |
Total Reference Entity — Long | | | | | | | 5,774,346 | |
| | | | | | | | |
| Reference Entity — Short | | | | | | |
Shire PLC — ADR | | | (100 | ) | | | (17,190 | ) |
Net Value of Reference Entity — Goldman Sachs & Co. | | | | | | $ | 5,757,156 | |
| | | | | | | | |
| | | | | | | |
The following table represents the individual long and short positions and related values of equity securities underlying the total return swap with Goldman Sachs & Co., as of period end, expiration date 3/02/17:
| | | | | | | | |
| | | Shares | | | Value | |
| Reference Entity — Long | | | | | | |
Valley National Bancorp | | | 100 | | | $ | 954 | |
| | | | | | | | |
| Reference Entity — Short | | | | | | |
Bank of America Corp. | | | (100 | ) | | | (1,352 | ) |
Net Value of Reference Entity — Goldman Sachs & Co. | | | | | | $ | (398 | ) |
| | | | | | | | |
| | |
The following table represents the individual long and short positions and related values of equity securities underlying the total return swap with Morgan Stanley & Co. International PLC, as of period end, expiration dates 6/07/17-5/17/18:
| | | | | | | | |
| | | Shares | | | Value | |
| Reference Entity — Long | | | | | | |
Airgas, Inc. | | | 33,690 | | | $ | 4,771,852 | |
Alere, Inc. | | | 9,374 | | | | 474,418 | |
Allergan plc | | | 23,161 | | | | 6,207,843 | |
Anchor BanCorp Wisconsin, Inc. | | | 29,355 | | | | 1,322,736 | |
Atmel Corp. | | | 210,099 | | | | 1,706,004 | |
Avenue Financial Holdings Inc. | | | 1,096 | | | | 21,230 | |
Baxalta, Inc. | | | 71,005 | | | | 2,868,602 | |
Cablevision Systems Corp., Class A | | | 19,000 | | | | 627,000 | |
Cameron International Corp. | | | 93,465 | | | | 6,266,828 | |
Cigna Corp. | | | 24,030 | | | | 3,297,877 | |
Columbia Pipeline Group, Inc. | | | 81,952 | | | | 2,056,995 | |
EMC Corp. | | | 220,612 | | | | 5,879,310 | |
Fidelity & Guaranty Life | | | 25,797 | | | | 676,913 | |
First Niagara Financial Group, Inc. | | | 181,358 | | | | 1,755,545 | |
FirstMerit Corp. | | | 31,412 | | | | 661,223 | |
Heartland Payment Systems, Inc. | | | 50,446 | | | | 4,871,570 | |
Humana, Inc. | | | 24,659 | | | | 4,511,364 | |
Jarden Corp. | | | 29,440 | | | | 1,735,488 | |
Journal Media Group, Inc. | | | 9,324 | | | | 111,515 | |
KLA-Tencor Corp. | | | 38,969 | | | | 2,837,333 | |
National Penn Bancshares, Inc. | | | 78,242 | | | | 895,202 | |
Newport Corp. | | | 107 | | | | 2,461 | |
Office Depot, Inc. | | | 30,665 | | | | 217,722 | |
PowerSecure International, Inc. | | | 25,703 | | | | 480,389 | |
Rite Aid Corp. | | | 268,618 | | | | 2,189,237 | |
SABMiller PLC | | | 118,391 | | | | 7,231,045 | |
SanDisk Corp. | | | 49,253 | | | | 3,747,168 | |
Syngenta AG | | | 4,011 | | | | 332,191 | |
Time Warner Cable, Inc. | | | 41,740 | | | | 8,540,839 | |
TNT Express NV | | | 203,488 | | | | 1,825,584 | |
Youku Tudou, Inc. — ADR | | | 27,146 | | | | 746,244 | |
Total Reference Entity — Long | | | | | | | 78,869,728 | |
See Notes to Financial Statements.
| | | | | | |
| | | BLACKROCK EVENT DRIVEN EQUITY FUND | | MARCH 31, 2016 | | 11 |
| | |
| Schedule of Investments (continued) | | |
| | | | | | | | |
| | | Shares | | | Value | |
| Reference Entity — Short | | | | | | |
Aetna, Inc. | | | (20,652 | ) | | | $ (2,320,252 | ) |
Anthem, Inc. | | | (12,380 | ) | | | (1,720,696 | ) |
BB&T Corp. | | | (16,190 | ) | | | (538,641 | ) |
Centene Corp. | | | (1 | ) | | | (62 | ) |
Charter Communications, Inc., Class A | | | (22,253 | ) | | | (4,504,675 | ) |
Global Payments, Inc. | | | (33,735 | ) | | | (2,202,896 | ) |
Huntington Bancshares, Inc. | | | (54,029 | ) | | | (515,437 | ) |
KeyCorp | | | (123,345 | ) | | | (1,361,729 | ) |
Lam Research Corp. | | | (19,477 | ) | | | (1,608,800 | ) |
Microchip Technology, Inc. | | | (9,495 | ) | | | (457,659 | ) |
Newell Rubbermaid, Inc. | | | (25,377 | ) | | | (1,123,947 | ) |
Old National Bancorp | | | (60,874 | ) | | | (742,054 | ) |
Pfizer, Inc. | | | (261,724 | ) | | | (7,757,499 | ) |
Pinnacle Financial Partners, Inc. | | | (394 | ) | | | (19,330 | ) |
Schlumberger Ltd. | | | (66,920 | ) | | | (4,935,350 | ) |
Shire PLC — ADR | | | (10,524 | ) | | | (1,809,076 | ) |
Staples, Inc. | | | (6,624 | ) | | | (73,063 | ) |
VMware, Inc., Class A | | | (24,489 | ) | | | (1,281,020 | ) |
Western Digital Corp. | | | (12,261 | ) | | | (579,210 | ) |
Total Reference Entity — Short | | | | | | | (33,551,396 | ) |
Net Value of Reference Entity — Morgan Stanley & Co. International PLC | | | | | | | $45,318,332 | |
The following table represents the individual long and short positions and related values of equity securities underlying the total return swap with Morgan Stanley & Co. International PLC, as of period end, expiration dates 6/01/18-7/11/18:
| | | | | | | | |
| | | Shares | | | Value | |
| Reference Entity — Long | | | | | | |
Humana, Inc. | | | 4,600 | | | $ | 841,570 | |
| | | | | | | | |
| Reference Entity — Short | | | | | | |
Citigroup, Inc. | | | (496 | ) | | | (20,708 | ) |
Dow Chemical Co. | | | (86 | ) | | | (4,374 | ) |
Eastman Chemical Co. | | | (52 | ) | | | (3,756 | ) |
EI du Pont de Nemours & Co. | | | (48 | ) | | | (3,039 | ) |
Materials Select Sector SPDR Fund | | | (293 | ) | | | (13,129 | ) |
Westlake Chemical Corp. | | | (43 | ) | | | (1,992 | ) |
Total Reference Entity — Short | | | | | | | (46,998 | ) |
Net Value of Reference Entity — Morgan Stanley & Co. International PLC | | | | | | $ | 794,572 | |
|
| Derivative Financial Instruments Categorized by Risk Exposure |
As of period end, the fair values of derivative financial instruments located in the Statement of Assets and Liabilities were as follows:
| | | | | | | | | | | | | | | | | | | | | | |
| | | | | Commodity
Contracts | | Credit
Contracts | | | Equity
Contracts | | | Foreign
Currency
Exchange
Contracts | | Interest
Rate
Contracts | | Other
Contacts | | Total | |
Assets — Derivative Financial Instruments | | | | | | | | | | | | | | | | | | | | |
Swaps — OTC | | Unrealized appreciation on OTC swaps | | — | | | — | | | | $1,596,760 | | | — | | — | | — | | | $1,596,760 | |
| | | | | | | | | | | | | | | | | | | | | | |
Liabilities — Derivative Financial Instruments | | | | | | | | | | | | | | | | | | | | |
Swaps — OTC | | Unrealized depreciation on OTC swaps | | — | | | — | | | | $ 39,948 | | | — | | — | | — | | | $ 39,948 | |
Swaps — centrally cleared | | Net unrealized depreciation1 | | — | | | $5,515 | | | | — | | | — | | — | | | | | 5,515 | |
| | | | | |
Total | | | | — | | | $5,515 | | | | $ 39,948 | | | — | | — | | | | | $ 45,463 | |
| | | | | |
| | 1 | | Includes cumulative appreciation (depreciation) on centrally cleared swaps, if any, as reported in the Schedule of Investments. Only current day’s variation margin is reported within the Statements of Assets and Liabilities. |
See Notes to Financial Statements.
| | | | | | |
| 12 | | BLACKROCK EVENT DRIVEN EQUITY FUND | | MARCH 31, 2016 | | |
| | |
| Schedule of Investments (continued) | | |
For the six months ended March 31, 2016, the effect of derivative financial instruments in the Statement of Operations was as follows:
| | | | | | | | | | | | | | | | | | | | |
| | | Commodity
Contracts | | Credit
Contracts | | | Equity
Contracts | | | Foreign Currency
Exchange Contracts | | Interest Rate
Contracts | | Other
Contacts | | Total | |
Net Realized Gain (Loss) from: | | | | | | | | | | | | | | | | | | | | |
Swaps | | — | | | $(20,958 | ) | | | $1,623,474 | | | — | | — | | — | | | $1,602,516 | |
| | | | | | | | | | | | | | | | | | | | |
Net Change in Unrealized Appreciation (Depreciation) on: | | | | | | | | | | | | | | | | | | | | |
Swaps | | — | | | $ (5,515 | ) | | | $1,663,051 | | | — | | — | | — | | | $1,657,536 | |
| | | | | | | | | | | | | | | | | | | | |
| Average Quarterly Balances of Outstanding Derivative Financial Instruments | |
Credit default swaps: | | | | | | | | | | | | | | | | | | | | |
Average notional value — buy protection | | | | | | | | | | | | | | | | | | | $ 545,000 | |
Total return swaps: | | | | | | | | | | | | | | | | | | | | |
Average notional value | | | | | | | | | | | | | | | | | | | $65,914,913 | |
For more information about the Fund’s investment risks regarding derivative financial instruments, refer to the Notes to Financial Statements.
|
| Derivative Financial Instruments — Offsetting as of Period End |
The Fund’s derivative assets and liabilities (by type) were as follows:
| | | | | | | | |
| |
| | | Assets | | | Liabilities | |
| |
Derivative Financial Instruments: | | | | | | | | |
Swaps — Centrally cleared | | | — | | | | $ 2,240 | |
Swaps — OTC1 | | | $1,596,760 | | | | 39,948 | |
| | | | |
Derivatives not subject to a Master Netting Agreement or similar agreement (“MNA”) | | | — | | | | (2,240 | ) |
| | | | |
Total derivative assets and liabilities subject to an MNA | | | $1,596,760 | | | | $39,948 | |
| | | | |
| | 1 | | Includes unrealized appreciation (depreciation) on OTC swaps in the Statement of Assets and Liabilities. |
The following table presents the Fund’s derivative assets and liabilities by counterparty net of amounts available for offset under an MNA and net of the related collateral received by the Fund:
| | | | | | | | | | | | | | | | | | |
| | | Gross Amounts Not Offset in the Statements of Assets and Liabilities and Subject to an MNA | |
| Counterparty | | Derivative Assets
Subject to an MNA by
Counterparty | | | Derivatives Available
for Offset1 | | | Non-cash
Collateral
Received | | Cash
Collateral
Received2 | | | Net Amount of
Derivative Assets3 | |
Citibank N.A. | | | $ 92,377 | | | | $(13,543) | | | — | | | — | | | | $ 78,834 | |
Goldman Sachs & Co. | | | 84,426 | | | | — | | | — | | | — | | | | 84,426 | |
Morgan Stanley & Co. International PLC | | | 1,419,957 | | | | (26,405) | | | — | | | $(1,393,552) | | | | — | |
Total | | | $1,596,760 | | | | $(39,948) | | | — | | | $(1,393,552) | | | | $163,260 | |
| | | | | | | | | | | | | | | | | | |
| Counterparty | | Derivative Liabilities
Subject to an MNA by
Counterparty | | | Derivatives Available
for Offset1 | | | Non-cash
Collateral
Pledged | | Cash
Collateral
Pledged | | | Net Amount of
Derivative Liabilities | |
Citibank N.A. | | | $13,543 | | | | $(13,543) | | | — | | | — | | | | — | |
Morgan Stanley & Co. International PLC | | | 26,405 | | | | (26,405) | | | — | | | — | | | | — | |
Total | | | $39,948 | | | | $(39,948) | | | — | | | — | | | | — | |
| | 1 | | The amount of derivatives available for offset is limited to the amount of derivative assets and/or liabilities that are subject to an MNA. |
| | 2 | | Excess of collateral received from the individual counterparty is not shown for financial reporting purposes. |
| | 3 | | Net amount represents the net amount receivable from the counterparty in the event of default. |
See Notes to Financial Statements.
| | | | | | |
| | | BLACKROCK EVENT DRIVEN EQUITY FUND | | MARCH 31, 2016 | | 13 |
| | |
| Schedule of Investments (concluded) | | |
|
| Fair Value Hierarchy as of Period End |
Various inputs are used in determining the fair value of investments and derivative financial instruments. For information about the Fund’s policy regarding valuation of investments and derivative financial instruments, refer to the Notes to Financial Statements.
The following tables summarize the Fund’s investments and derivative financial instruments categorized in the disclosure hierarchy:
| | | | | | | | | | | | | | | | |
| |
| | | Level 1 | | | Level 2 | | | Level 3 | | | Total | |
| |
Assets: | | | | | | | | | | | | | | | | |
Investments: | | | | | | | | | | | | | | | | |
Long-Term Investments: | | | | | | | | | | | | | | | | |
Common Stocks1 | | $ | 1,519,136 | | | | — | | | | — | | | $ | 1,519,136 | |
Corporate Bonds1 | | | — | | | $ | 3,787,858 | | | | — | | | | 3,787,858 | |
Floating Rate Loan Interests | | | — | | | | — | | | $ | 492,423 | | | | 492,423 | |
Short-Term Securities: | | | | | | | | | | | | | | | | |
Borrowed Bond Agreements | | | — | | | | 367,031 | | | | — | | | | 367,031 | |
Money Market Funds | | | 85,456,337 | | | | — | | | | — | | | | 85,456,337 | |
Liabilities: | | | | | | | | | | | | | | | | |
Investments: | | | | | | | | | | | | | | | | |
Borrowed Bonds | | | — | | | | (340,313 | ) | | | — | | | | (340,313 | ) |
| | | | |
Total | | $ | 86,975,473 | | | $ | 3,814,576 | | | $ | 492,423 | | | $ | 91,282,472 | |
| | | | |
1 See above Schedule of Investments for values in each industry. | | | | | | | | | | | | | | | | |
| |
| | | Level 1 | | | Level 2 | | | Level 3 | | | Total | |
| |
Derivative Financial Instruments1 | | | | | | | | | | | | | | | | |
Assets: | | | | | | | | | | | | | | | | |
Equity contracts | | | — | | | $ | 1,596,760 | | | | — | | | $ | 1,596,760 | |
Liabilities: | | | | | | | | | | | | | | | | |
Credit contracts | | | — | | | | (5,515 | ) | | | — | | | | (5,515 | ) |
Equity contracts | | | — | | | | (39,948 | ) | | | — | | | | (39,948 | ) |
| | | | |
Total | | | — | | | $ | 1,551,297 | | | | — | | | $ | 1,551,297 | |
| | | | |
1 Derivative financial instruments are swaps. Swaps are valued at the unrealized appreciation (depreciation) on the instrument. | |
The Fund may hold assets and/or liabilities in which the fair value approximates the carrying amount for financial statement purposes. As of period end, such assets and/or liabilities are categorized within the disclosure hierarchy as follows: | |
| |
| | | Level 1 | | | Level 2 | | | Level 3 | | | Total | |
| |
Assets: | | | | | | | | | | | | | | | | |
Cash | | $ | 91,299 | | | | — | | | | — | | | $ | 91,299 | |
Cash pledged for centrally cleared swaps | | | 39,000 | | | | — | | | | — | | | | 39,000 | |
Liabilities: | | | | | | | | | | | | | | | | |
Cash received as collateral for OTC derivatives | | | — | | | $ | (2,050,000 | ) | | | — | | | | (2,050,000 | ) |
| | | | |
Total | | $ | 130,299 | | | $ | (2,050,000 | ) | | | — | | | $ | (1,919,701 | ) |
| | | | |
During the six months ended March 31, 2016, there were no transfers between levels. | |
See Notes to Financial Statements.
| | | | | | |
| 14 | | BLACKROCK EVENT DRIVEN EQUITY FUND | | MARCH 31, 2016 | | |
| | |
| Statement of Assets and Liabilities | | |
| | | | |
| March 31, 2016 (Unaudited) | | | |
| | | | |
| Assets | | | | |
Investments at value — unaffiliated (cost — $6,411,819) | | $ | 6,166,448 | |
Investments at value — affiliated (cost — $85,456,337) | | | 85,456,337 | |
Cash | | | 91,299 | |
Cash pledged for centrally cleared swaps | | | 39,000 | |
Receivables: | | | | |
Swaps | | | 497,312 | |
Capital shares sold | | | 1,218,243 | |
Dividends — affiliated | | | 27,316 | |
Dividends — unaffiliated | | | 5,683 | |
Interest | | | 113,978 | |
From the Manager | | | 6,661 | |
Unrealized appreciation on OTC swaps | | | 1,596,760 | |
Prepaid expenses | | | 33,625 | |
| | | | |
Total assets | | | 95,252,662 | |
| | | | |
| | | | |
| Liabilities | | | | |
Cash received as collateral for OTC derivatives | | | 2,050,000 | |
Borrowed bonds at value (proceeds — $363,964) | | | 340,313 | |
Payables: | | | | |
Capital shares redeemed | | | 227,243 | |
Interest expense | | | 3,280 | |
Investment advisory fees | | | 78,928 | |
Officer’s and Directors’ fees | | | 1,584 | |
Other accrued expenses | | | 30,857 | |
Other affiliates | | | 85 | |
Service and distribution fees | | | 9,663 | |
Variation margin on centrally cleared swaps | | | 2,240 | |
Unrealized depreciation on OTC swaps | | | 39,948 | |
| | | | |
Total liabilities | | | 2,784,141 | |
| | | | |
Net Assets | | $ | 92,468,521 | |
| | | | |
| | | | |
| Net Assets Consist of | | | | |
Paid-in capital | | $ | 90,752,488 | |
Accumulated net investment loss | | | (260,866 | ) |
Undistributed net realized gain | | | 647,318 | |
Net unrealized appreciation (depreciation) | | | 1,329,581 | |
| | | | |
Net Assets | | $ | 92,468,521 | |
| | | | |
| | | | |
| Net Asset Value | | | | |
Institutional — Based on net assets of $62,955,083 and 7,123,095 shares outstanding, 400,000,000 shares authorized, $0.10 par value | | $ | 8.84 | |
| | | | |
Investor A — Based on net assets of $22,614,369 and 2,652,157 shares outstanding, 300,000,000 number of shares authorized, $0.10 par value | | $ | 8.53 | |
| | | | |
Investor C — Based on net assets of $6,899,069 and 889,590 shares outstanding, 400,000,000 shares authorized, $0.10 par value | | $ | 7.76 | |
| | | | |
See Notes to Financial Statements.
| | | | | | |
| | | BLACKROCK EVENT DRIVEN EQUITY FUND | | MARCH 31, 2016 | | 15 |
| | | | |
| Six Months Ended March 31, 2016 (Unaudited) | | | |
| | | | |
| Investment Income | |
Interest | | $ | 111,437 | |
Dividends — affiliated | | | 74,565 | |
Dividends — unaffiliated | | | 30,914 | |
| | | | |
Total income | | | 216,916 | |
| | | | |
| | | | |
| Expenses | | | | |
Investment advisory | | | 317,368 | |
Service and distribution — class specific | | | 46,277 | |
Professional | | | 36,873 | |
Registration | | | 23,345 | |
Transfer agent — class specific | | | 19,719 | |
Printing | | | 14,258 | |
Custodian | | | 6,457 | |
Accounting services | | | 5,302 | |
Officer and Directors | | | 3,462 | |
Miscellaneous | | | 9,816 | |
| | | | |
Total expenses excluding interest expense | | | 482,877 | |
Interest expense | | | 1,241 | |
| | | | |
Total expenses | | | 484,118 | |
Less: | | | | |
Fees waived and/or reimbursed by the Manager | | | (51,229 | ) |
Transfer agent fees reimbursed — class specific | | | (17,888 | ) |
| | | | |
Total expenses after fees waived and/or reimbursed | | | 415,001 | |
| | | | |
Net investment loss | | | (198,085 | ) |
| | | | |
| | | | |
| Realized and Unrealized Gain (Loss) | | | | |
Net realized gain (loss) from: | | | | |
Investments | | | (444,210 | ) |
Capital gain distributions received from affiliated investment companies | | | 985 | |
Foreign currency transactions | | | (1,625 | ) |
Swaps | | | 1,602,516 | |
Short sales | | | (3,615 | ) |
| | | | |
| | | 1,154,051 | |
| | | | |
Net change in unrealized appreciation (depreciation) on: | | | | |
Investments | | | 415,455 | |
Foreign currency translations | | | (728 | ) |
Swaps | | | 1,657,536 | |
Borrowed bonds | | | 23,651 | |
| | | | |
| | | 2,095,914 | |
| | | | |
Total realized and unrealized gain | | | 3,249,965 | |
| | | | |
Net Increase in Net Assets Resulting from Operations | | $ | 3,051,880 | |
| | | | |
See Notes to Financial Statements.
| | | | | | |
| 16 | | BLACKROCK EVENT DRIVEN EQUITY FUND | | MARCH 31, 2016 | | |
| | |
Statements of Changes in Net Assets | | |
| | | | | | | | |
| Increase (Decrease) in Net Assets: | | Six Months
Ended
March 31, 2016
(Unaudited) | | | Year Ended
September 30, 2015 | |
| | | | | | | | |
| Operations | | | | | | | | |
Net investment loss | | | $ (198,085 | ) | | | $ (194,145 | ) |
Net realized gain | | | 1,154,051 | | | | 13,263,505 | |
Net change in unrealized appreciation (depreciation) | | | 2,095,914 | | | | (12,020,251 | ) |
| | | | |
Net increase in net assets resulting from operations | | | 3,051,880 | | | | 1,049,109 | |
| | | | |
| | | | | | | | |
| Distributions to Shareholders1 | | | | | | | | |
From net realized gain: | | | | | | | | |
Institutional | | | (485,623 | ) | | | (4,466,424 | ) |
Investor A | | | (672,433 | ) | | | (4,742,732 | ) |
Investor C | | | (427,844 | ) | | | (2,999,469 | ) |
| | | | |
Decrease in net assets resulting from distributions to shareholders | | | (1,585,900 | ) | | | (12,208,625 | ) |
| | | | |
| | | | | | | | |
| Capital Share Transactions | | | | | | | | |
Net increase in net assets derived from capital share transactions | | | 66,618,381 | | | | 173,294 | |
| | | | |
| | | | | | | | |
| Net Assets | | | | | | | | |
Total increase (decrease) in net assets | | | 68,084,361 | | | | (10,986,222 | ) |
Beginning of period | | | 24,384,160 | | | | 35,370,382 | |
| | | | |
End of period | | | $92,468,521 | | | | $24,384,160 | |
| | | | |
Accumulated net investment loss, end of period | | | $ (260,866 | ) | | | $ (62,781 | ) |
| | | | |
| | 1 | | Distributions for annual periods determined in accordance with federal income tax regulations. |
See Notes to Financial Statements.
| | | | | | |
| | | BLACKROCK EVENT DRIVEN EQUITY FUND | | MARCH 31, 2016 | | 17 |
| | | | | | | | | | | | | | | | | | | | | | | | |
| | | Institutional | |
| | | Six Months
Ended
March 31,
2016
(Unaudited) | | | Year Ended September 30, | |
| | | | 2015 | | | 2014 | | | 2013 | | | 2012 | | | 2011 | |
| Per Share Operating Performance | | | | | |
Net asset value, beginning of period | | $ | 8.94 | | | $ | 14.55 | | | $ | 12.48 | | | $ | 10.58 | | | $ | 8.11 | | | $ | 7.98 | |
| | | | |
Net investment income (loss)1 | | | (0.03 | ) | | | (0.04 | ) | | | (0.01 | ) | | | 0.01 | | | | 0.03 | | | | (0.03 | ) |
Net realized and unrealized gain | | | 0.51 | | | | 0.60 | | | | 2.08 | | | | 1.90 | | | | 2.44 | | | | 0.16 | |
| | | | |
Net increase from investment operations | | | 0.48 | | | | 0.56 | | | | 2.07 | | | | 1.91 | | | | 2.47 | | | | 0.13 | |
| | | | |
Distributions:2 | | | | | | | | | | | | | | | | | | | | | | | | |
From net investment income | | | — | | | | — | | | | — | | | | (0.01 | ) | | | — | | | | — | |
From net realized gain | | | (0.58 | ) | | | (6.17 | ) | | | — | | | | — | | | | — | | | | — | |
| | | | |
Total distributions | | | (0.58 | ) | | | (6.17 | ) | | | — | | | | (0.01 | ) | | | — | | | | — | |
| | | | |
Net asset value, end of period | | $ | 8.84 | | | $ | 8.94 | | | $ | 14.55 | | | $ | 12.48 | | | $ | 10.58 | | | $ | 8.11 | |
| | | | |
| | | | | | | | | | | | | | | | | | | | | | | | |
| Total Return3 | | | | | |
Based on net asset value | | | 5.59 | %4 | | | 2.28 | % | | | 16.59 | % | | | 18.03 | % | | | 30.46 | % | | | 1.63 | % |
| | | | |
| | | | | | | | | | | | | | | | | | | | | | | | |
| Ratios to Average Net Assets5 | | | | | |
Total expenses | | | 1.60 | %6 | | | 2.54 | % | | | 2.35 | % | | | 2.41 | % | | | 2.51 | % | | | 2.56 | % |
| | | | |
Total expenses after fees waived and/or reimbursed | | | 1.39 | %6 | | | 1.89 | % | | | 2.08 | % | | | 2.12 | % | | | 2.25 | % | | | 2.08 | % |
| | | | |
Total expenses after fees waived and/or reimbursed and excluding dividend expense | | | 1.39 | %6 | | | 1.65 | % | | | 1.66 | % | | | 1.72 | % | | | 1.86 | % | | | 1.72 | % |
| | | | |
Total expenses after fees waived and/or reimbursed and excluding dividend expense, stock loan fees and interest expense | | | 1.38 | %6 | | | 1.38 | % | | | 1.38 | % | | | 1.41 | % | | | 1.50 | % | | | 1.50 | % |
| | | | |
Net investment income (loss) | | | (0.63 | )%6 | | | (0.26 | )% | | | (0.05 | )% | | | 0.07 | % | | | 0.29 | % | | | (0.29 | )% |
| | | | |
| | | | | | | | | | | | | | | | | | | | | | | | |
| Supplemental Data | | | | | |
Net assets, end of period (000) | | $ | 62,955 | | | $ | 8,077 | | | $ | 15,497 | | | $ | 15,373 | | | $ | 12,050 | | | $ | 16,688 | |
| | | | |
Portfolio turnover rate | | | 58 | %7 | | | 81 | %7 | | | 44 | % | | | 65 | % | | | 172 | % | | | 126 | % |
| | | | |
| | 1 | | Based on average shares outstanding. |
| | 2 | | Distributions for annual periods determined in accordance with federal income tax regulations. |
| | 3 | | Where applicable, assumes the reinvestment of distributions. |
| | 4 | | Aggregate total return. |
| | 5 | | Excludes expenses incurred indirectly as a result of investments in underlying funds as follows: |
| | | | | | | | | | | | | | | | | | | | | | | | | | | | | | |
| | | Six Months
Ended
March 31,
2016 (Unaudited) | | Year Ended September 30, |
| | | | 2015 | | 2014 | | 2013 | | 2012 | | 2011 |
Investments in underlying funds | | | | 0.14 | % | | | | 0.04 | % | | | | — | | | | | — | | | | | — | | | | | — | |
| | 7 | | Excludes underlying investments in total return swaps. |
See Notes to Financial Statements.
| | | | | | |
| 18 | | BLACKROCK EVENT DRIVEN EQUITY FUND | | MARCH 31, 2016 | | |
| | |
| Financial Highlights (continued) | | |
| | | | | | | | | | | | | | | | | | | | | | | | |
| | | Investor A | |
| | | Six Months
Ended
March 31,
2016
(Unaudited) | | | Year Ended September 30, | |
| | | | 2015 | | | 2014 | | | 2013 | | | 2012 | | | 2011 | |
| Per Share Operating Performance | | | | | |
Net asset value, beginning of period | | $ | 8.65 | | | $ | 14.31 | | | $ | 12.30 | | | $ | 10.46 | | | $ | 8.04 | | | $ | 7.93 | |
| | | | |
Net investment loss1 | | | (0.03 | ) | | | (0.07 | ) | | | (0.04 | ) | | | (0.03 | ) | | | (0.00 | )2 | | | (0.05 | ) |
Net realized and unrealized gain | | | 0.49 | | | | 0.58 | | | | 2.05 | | | | 1.87 | | | | 2.42 | | | | 0.16 | |
| | | | |
Net increase from investment operations | | | 0.46 | | | | 0.51 | | | | 2.01 | | | | 1.84 | | | | 2.42 | | | | 0.11 | |
| | | | |
Distributions from net realized gain3 | | | (0.58 | ) | | | (6.17 | ) | | | — | | | | — | | | | — | | | | — | |
| | | | |
Net asset value, end of period | | $ | 8.53 | | | $ | 8.65 | | | $ | 14.31 | | | $ | 12.30 | | | $ | 10.46 | | | $ | 8.04 | |
| | | | |
| | | | | | | | | | | | | | | | | | | | | | | | |
| Total Return4 | | | | | |
Based on net asset value | | | 5.54 | %5 | | | 1.91 | % | | | 16.34 | % | | | 17.59 | % | | | 30.10 | % | | | 1.39 | % |
| | | | |
| | | | | | | | | | | | | | | | | | | | | | | | |
| Ratios to Average Net Assets6 | | | | | |
Total expenses | | | 1.99 | %7 | | | 2.85 | % | | | 2.64 | % | | | 2.65 | % | | | 2.79 | % | | | 2.90 | % |
| | | | |
Total expenses after fees waived and/or reimbursed | | | 1.66 | %7 | | | 2.12 | % | | | 2.35 | % | | | 2.42 | % | | | 2.59 | % | | | 2.36 | % |
| | | | |
Total expenses after fees waived and/or reimbursed and excluding dividend expense | | | 1.66 | %7 | | | 1.90 | % | | | 1.93 | % | | | 2.02 | % | | | 2.19 | % | | | 2.00 | % |
| | | | |
Total expenses after fees waived and/or reimbursed and excluding dividend expense, stock loan fees and interest expense | | | 1.65 | %7 | | | 1.65 | % | | | 1.65 | % | | | 1.71 | % | | | 1.80 | % | | | 1.79 | % |
| | | | |
Net investment loss | | | (0.73 | )%7 | | | (0.55 | )% | | | (0.32 | )% | | | (0.24 | )% | | | (0.02 | )% | | | (0.54 | )% |
| | | | |
| | | | | | | | | | | | | | | | | | | | | | | | |
| Supplemental Data | | | | | |
Net assets, end of period (000) | | $ | 22,614 | | | $ | 10,143 | | | $ | 12,238 | | | $ | 17,792 | | | $ | 15,935 | | | $ | 10,749 | |
| | | | |
Portfolio turnover rate | | | 58 | %8 | | | 81 | %8 | | | 44 | % | | | 65 | % | | | 172 | % | | | 126 | % |
| | | | |
| | 1 | | Based on average shares outstanding. |
| | 2 | | Amount is greater than $(0.005) per share. |
| | 3 | | Distributions for annual periods determined in accordance with federal income tax regulations. |
| | 4 | | Where applicable, excludes the effects of any sales charges and assumes the reinvestment of distributions. |
| | 5 | | Aggregate total return. |
| | 6 | | Excludes expenses incurred indirectly as a result of investments in underlying funds as follows: |
| | | | | | | | | | | | | | | | | | | | | | | | | | | | | | |
| | | Six Months
Ended
March 31,
2016 (Unaudited) | | Year Ended September 30, |
| | | | 2015 | | 2014 | | 2013 | | 2012 | | 2011 |
Investments in underlying funds | | | | 0.14 | % | | | | 0.04 | % | | | | — | | | | | — | | | | | — | | | | | — | |
| | 8 | | Excludes underlying investments in total return swaps. |
See Notes to Financial Statements.
| | | | | | |
| | | BLACKROCK EVENT DRIVEN EQUITY FUND | | MARCH 31, 2016 | | 19 |
| | |
| Financial Highlights (concluded) | | |
| | | | | | | | | | | | | | | | | | | | | | | | |
| | | Investor C | |
| | | Six Months
Ended
March 31,
2016
(Unaudited) | | | Year Ended September 30, | |
| | | | 2015 | | | 2014 | | | 2013 | | | 2012 | | | 2011 | |
| Per Share Operating Performance | | | | | |
Net asset value, beginning of period | | $ | 7.94 | | | $ | 13.70 | | | $ | 11.87 | | | $ | 10.16 | | | $ | 7.87 | | | $ | 7.82 | |
| | | | |
Net investment loss1 | | | (0.06 | ) | | | (0.16 | ) | | | (0.14 | ) | | | (0.10 | ) | | | (0.07 | ) | | | (0.10 | ) |
Net realized and unrealized gain | | | 0.46 | | | | 0.57 | | | | 1.97 | | | | 1.81 | | | | 2.36 | | | | 0.15 | |
| | | | |
Net increase from investment operations | | | 0.40 | | | | 0.41 | | | | 1.83 | | | | 1.71 | | | | 2.29 | | | | 0.05 | |
| | | | |
Distributions from net realized gain2 | | | (0.58 | ) | | | (6.17 | ) | | | — | | | | — | | | | — | | | | — | |
| | | | |
Net asset value, end of period | | $ | 7.76 | | | $ | 7.94 | | | $ | 13.70 | | | $ | 11.87 | | | $ | 10.16 | | | $ | 7.87 | |
| | | | |
| | | | | | | | | | | | | | | | | | | | | | | | |
| Total Return3 | | | | | |
Based on net asset value | | | 5.27 | %4 | | | 1.16 | % | | | 15.42 | % | | | 16.83 | % | | | 29.10 | % | | | 0.64 | % |
| | | | |
| | | | | | | | | | | | | | | | | | | | | | | | |
| Ratios to Average Net Assets5 | | | | |
Total expenses | | | 2.81 | %6 | | | 3.61 | % | | | 3.44 | % | | | 3.46 | % | | | 3.57 | % | | | 3.83 | % |
| | | | |
Total expenses after fees waived and/or reimbursed | | | 2.39 | %6 | | | 2.86 | % | | | 3.09 | % | | | 3.14 | % | | | 3.28 | % | | | 3.04 | % |
| | | | |
Total expenses after fees waived and/or reimbursed and excluding dividend expense | | | 2.39 | %6 | | | 2.64 | % | | | 2.67 | % | | | 2.74 | % | | | 2.88 | % | | | 2.70 | % |
| | | | |
Total expenses after fees waived and/or reimbursed and excluding dividend expense, stock loan fees and interest expense | | | 2.39 | %6 | | | 2.39 | % | | | 2.39 | % | | | 2.43 | % | | | 2.50 | % | | | 2.50 | % |
| | | | |
Net investment loss | | | (1.43 | )%6 | | | (1.28 | )% | | | (1.06 | )% | | | (0.95 | )% | | | (0.70 | )% | | | (1.13 | )% |
| | | | |
| | | | | | | | | | | | | | | | | | | | | | | | |
| Supplemental Data | | | | | | | | | | | | | | | | | | | | | | | | |
Net assets, end of period (000) | | $ | 6,899 | | | $ | 6,165 | | | $ | 7,636 | | | $ | 7,133 | | | $ | 6,587 | | | $ | 6,586 | |
| | | | |
Portfolio turnover rate | | | 58 | %7 | | | 81 | %7 | | | 44 | % | | | 65 | % | | | 172 | % | | | 126 | % |
| | | | |
| | 1 | | Based on average shares outstanding. |
| | 2 | | Distributions for annual periods determined in accordance with federal income tax regulations. |
| | 3 | | Where applicable, excludes the effects of any sales charges and assumes the reinvestment of distributions. |
| | 4 | | Aggregate total return. |
| | 5 | | Excludes expenses incurred indirectly as a result of investments in underlying funds as follows: |
| | | | | | | | | | | | | | | | | | | | | | | | | | | | | | |
| | | Six Months
Ended
March 31, 2016
(Unaudited) | | Year Ended September 30, |
| | | | 2015 | | 2014 | | 2013 | | 2012 | | 2011 |
Investments in underlying funds | | | | 0.14 | % | | | | 0.04 | % | | | | — | | | | | — | | | | | — | | | | | — | |
| | 7 | | Excludes underlying investments in total return swaps. |
See Notes to Financial Statements.
| | | | | | |
| 20 | | BLACKROCK EVENT DRIVEN EQUITY FUND | | MARCH 31, 2016 | | |
| | |
Notes to Financial Statements (Unaudited) | | |
1. Organization:
BlackRock Large Cap Series Funds, Inc. (the “Corporation”) is registered under the Investment Company Act of 1940, as amended (the “1940 Act”), The Corporation is registered as a diversified, open-end management investment company. The Corporation is organized as a Maryland corporation. BlackRock Event Driven Equity Fund (the “Fund”) is a series of the Corporation, although the Fund may invest in companies with any capitalization.
The Fund offers multiple classes of shares. All classes of shares have identical voting, dividend, liquidation and other rights and are subject to the same terms and conditions, except that certain classes bear expenses related to the shareholder servicing and distribution of such shares. Institutional Shares are sold only to certain eligible investors. Investor A and Investor C Shares are generally available through financial intermediaries. Each class has exclusive voting rights with respect to matters relating to its shareholder servicing and distribution expenditures.
| | | | | | |
| Share Class | | Initial Sales Charge | | CDSC | | Conversion
Privilege |
Institutional Shares | | No | | No | | None |
Investor A Shares | | Yes | | No1 | | None |
Investor C Shares | | No | | Yes | | None |
| | 1 | | Investor A Shares may be subject to a contingent deferred sales charge (“CDSC”) where no initial sales charge was paid at the time of purchase. |
The Fund, together with certain other registered investment companies advised by BlackRock Advisors, LLC (the “Manager”) or its affiliates, is included in a complex of open-end funds referred to as the Equity-Liquidity Complex.
2. Significant Accounting Policies:
The financial statements are prepared in conformity with accounting principles generally accepted in the United States of America (“U.S. GAAP”), which may require management to make estimates and assumptions that affect the reported amounts of assets and liabilities in the financial statements, disclosure of contingent assets and liabilities at the date of the financial statements and the reported amounts of increases and decreases in net assets from operations during the reporting period. Actual results could differ from those estimates. The Fund is considered an investment company under U.S. GAAP and follows the accounting and reporting guidance applicable to investment companies. Below is a summary of significant accounting policies:
Foreign Currency: The Fund’s books and records are maintained in U.S. dollars. Purchases and sales of investments are recorded at the rates of exchange prevailing on the respective dates of such transactions. Generally, when the U.S. dollar rises in value against a foreign currency, the investments denominated in that currency will lose value; the opposite effect occurs if the U.S. dollar falls in relative value.
The Fund does not isolate changes in the exchange rates from the changes in the market prices of investments held or sold for financial reporting purposes. Accordingly, the effects of changes in exchange rates on investments are not segregated in the Statement of Operations from the effects of changes in market prices of those investments, but are included as a component of net realized and unrealized gain (loss) from investments. The Fund reports realized currency gains (losses) on foreign currency related transactions as components of net realized gain (loss) for financial reporting purposes, whereas such components are generally treated as ordinary income for federal income tax purposes.
Segregation and Collateralization: In cases where the Fund enters into certain investments (e.g., swaps), that would be treated as “senior securities” for 1940 Act purposes, the Fund may segregate or designate on its books and records cash or liquid assets having a market value at least equal to the amount of its future obligations under such investments. Doing so allows the investment to be excluded from treatment as a “senior security.” Furthermore, if required by an exchange or counterparty agreement, the Fund may be required to deliver/deposit cash and/or securities to/with an exchange, or broker-dealer or custodian as collateral for certain investments or obligations.
Investment Transactions and Investment Income: For financial reporting purposes, investment transactions are recorded on the dates the transactions are entered into (the trade dates). Realized gains and losses on investment transactions are determined on the identified cost basis. Dividend income is recorded on the ex-dividend dates. Dividends from foreign securities where the ex-dividend date may have passed are subsequently recorded when the Fund is informed of the ex-dividend date. Under the applicable foreign tax laws, a withholding tax at various rates may be imposed on capital gains, dividends and interest. Upon notification from issuers, some of the dividend income received from a real estate investment trust may be redesignated as a reduction of cost of the related investment and/or realized gain. Interest income, including amortization and accretion of premiums and discounts on debt securities, is recognized on an accrual basis. Income, expenses and realized and unrealized gains and losses are allocated daily to each class based on its relative net assets.
Distributions: Distributions paid by the Fund are recorded on the ex-dividend date. The character and timing of distributions are determined in accordance with federal income tax regulations, which may differ from U.S. GAAP.
| | | | | | |
| | | BLACKROCK EVENT DRIVEN EQUITY FUND | | MARCH 31, 2016 | | 21 |
| | |
| Notes to Financial Statements (continued) | | |
Indemnifications: In the normal course of business, the Fund enters into contracts that contain a variety of representations that provide general indemnification. The Fund’s maximum exposure under these arrangements is unknown because it involves future potential claims against the Fund, which cannot be predicted with any certainty.
Other: Expenses directly related to the Fund or its classes are charged to the Fund or the applicable class. Other operating expenses shared by several funds, including other funds managed by the Manager, are prorated among those funds on the basis of relative net assets or other appropriate methods. Expenses directly related to the Fund and other shared expenses prorated to the Fund are allocated daily to each class based on its relative net assets or other appropriate methods.
The Fund has an arrangement with its custodian whereby fees may be reduced by credits earned on uninvested cash balances, which, if applicable, are shown as fees paid indirectly in the Statement of Operations. The custodian imposes fees on overdrawn cash balances, which can be offset by accumulated credits earned or may result in additional custody charges.
3. Investment Valuation and Fair Value Measurements:
Investment Valuation Policies: The Fund’s investments are valued at fair value (also referred to as “market value” within the financial statements) as of the close of trading on the New York Stock Exchange (“NYSE”) (generally 4:00 p.m., Eastern time). U.S. GAAP defines fair value as the price the Fund would receive to sell an asset or pay to transfer a liability in an orderly transaction between market participants at the measurement date. The Fund determines the fair values of its financial instruments using independent dealers or pricing services under policies approved by the Board of Directors of the Corporation (the “Board”). The BlackRock Global Valuation Methodologies Committee (the “Global Valuation Committee”) is the committee formed by management to develop global pricing policies and procedures and to provide oversight of the pricing function for the Fund for all financial instruments.
Fair Value Inputs and Methodologies: The following methods (or “techniques”) and inputs are used to establish the fair value of the Fund’s assets and liabilities:
| • | | Equity investments traded on a recognized securities exchange are valued at the official closing price each day, if available. For equity investments traded on more than one exchange, the official close price on the exchange where the stock is primarily traded is used. Equity investments traded on a recognized exchange for which there were no sales on that day may be valued at the last available bid (long positions) or ask (short positions) price. Generally, trading in foreign instruments is substantially completed each day at various times prior to the close of business on the NYSE. Occasionally, events affecting the values of such instruments may occur between the foreign market close and the close of business on the NYSE that may not be reflected in the computation of the Fund’s net assets. Each business day, the Fund uses a pricing service to assist with the valuation of certain foreign exchange-traded equity securities and foreign exchange-traded and over-the-counter (“OTC”) options (the “Systematic Fair Value Price”). Using current market factors, the Systematic Fair Value Price is designed to value such foreign securities and foreign options at fair value as of the close of business on the NYSE, which follows the close of the local markets. |
| • | | Bond investments are valued on the basis of last available bid prices or current market quotations provided by dealers or pricing services. Floating rate loan interests are valued at the mean of the bid prices from one or more brokers or dealers as obtained from a pricing service. In determining the value of a particular investment, pricing services may use certain information with respect to transactions in such investments, quotations from dealers, pricing matrixes, market transactions in comparable investments, various relationships observed in the market between investments and calculated yield measures. Asset-backed and mortgage-backed securities are valued by independent pricing services using models that consider estimated cash flows of each tranche of the security, establish a benchmark yield and develop an estimated tranche-specific spread to the benchmark yield based on the unique attributes of the tranche. |
| • | | Investments in open-end U.S. mutual funds are valued at net asset value each business day. |
| • | | Securities and other assets and liabilities denominated in foreign currencies are translated into U.S. dollars using exchange rates determined as of the close of business on the NYSE. Forward foreign currency exchange contracts are valued at the mean between the bid and ask prices and are determined as of the close of business on the NYSE. Interpolated values are derived when the settlement date of the contract is an interim date for which quotations are not available. |
| • | | Swap agreements are valued utilizing quotes received daily by the Fund’s pricing service or through brokers, which are derived using daily swap curves and models that incorporate a number of market data factors, such as discounted cash flows, trades and values of the underlying reference instruments. |
| | | | | | |
| 22 | | BLACKROCK EVENT DRIVEN EQUITY FUND | | MARCH 31, 2016 | | |
| | |
| Notes to Financial Statements (continued) | | |
If events (e.g., a company announcement, market volatility or a natural disaster) occur that are expected to materially affect the value of such instruments, or in the event that the application of these methods of valuation results in a price for an investment that is deemed not to be representative of the market value of such investment, or if a price is not available, the investment will be valued by the Global Valuation Committee, or its delegate, in accordance with a policy approved by the Board as reflecting fair value (“Fair Valued Investments”). When determining the price for Fair Valued Investments, the Global Valuation Committee, or its delegate, seeks to determine the price that the Fund might reasonably expect to receive or pay from the current sale or purchase of that asset or liability in an arm’s-length transaction. Fair value determinations shall be based upon all available factors that the Global Valuation Committee, or its delegate, deems relevant consistent with the principles of fair value measurement, which include the market approach, income approach and/or in the case of recent investments, the cost approach, as appropriate. The market approach generally consists of using comparable market transactions. The income approach generally is used to discount future cash flows to present value and is adjusted for liquidity as appropriate. These factors include but are not limited to: (i) attributes specific to the investment or asset; (ii) the principal market for the investment or asset; (iii) the customary participants in the principal market for the investment or asset; (iv) data assumptions by market participants for the investment or asset, if reasonably available; (v) quoted prices for similar investments or assets in active markets; and (vi) other factors, such as future cash flows, interest rates, yield curves, volatilities, prepayment speeds, loss severities, credit risks, recovery rates, liquidation amounts and/or default rates. Due to the inherent uncertainty of valuations of such investments, the fair values may differ from the values that would have been used had an active market existed. The Global Valuation Committee, or its delegate, employs various methods for calibrating valuation approaches for investments where an active market does not exist, including regular due diligence of the Fund’s pricing vendors, regular reviews of key inputs and assumptions, transactional back-testing or disposition analysis to compare unrealized gains and losses to realized gains and losses, reviews of missing or stale prices and large movements in market values and reviews of any market related activity. The pricing of all Fair Valued Investments is subsequently reported to the Board or a committee thereof on a quarterly basis.
Fair Value Hierarchy: Various inputs are used in determining the fair value of investments and derivative financial instruments. These inputs to valuation techniques are categorized into a fair value hierarchy consisting of three broad levels for financial statement purposes as follows:
| • | | Level 1 — unadjusted price quotations in active markets/exchanges for identical assets or liabilities that the Fund has the ability to access |
| • | | Level 2 — other observable inputs (including, but not limited to, quoted prices for similar assets or liabilities in markets that are active, quoted prices for identical or similar assets or liabilities in markets that are not active, inputs other than quoted prices that are observable for the assets or liabilities (such as interest rates, yield curves, volatilities, prepayment speeds, loss severities, credit risks and default rates) or other market–corroborated inputs) |
| • | | Level 3 — unobservable inputs based on the best information available in the circumstances, to the extent observable inputs are not available (including the Fund’s own assumptions used in determining the fair value of investments and derivative financial instruments) |
The hierarchy gives the highest priority to unadjusted quoted prices in active markets for identical assets or liabilities (Level 1 measurements) and the lowest priority to unobservable inputs (Level 3 measurements). Accordingly, the degree of judgment exercised in determining fair value is greatest for instruments categorized in Level 3. The inputs used to measure fair value may fall into different levels of the fair value hierarchy. In such cases, for disclosure purposes, the fair value hierarchy classification is determined based on the lowest level input that is significant to the fair value measurement in its entirety. The significant unobservable inputs used by the Global Valuation Committee in determining the price for Fair Valued Investments are typically categorized as Level 3. The fair value hierarchy for the Fund’s investments and derivative financial instruments has been included in the Schedule of Investments.
Changes in valuation techniques may result in transfers into or out of an assigned level within the hierarchy. In accordance with the Fund’s policy, transfers between different levels of the fair value hierarchy are deemed to have occurred as of the beginning of the reporting period. The categorization of a value determined for investments and derivative financial instruments is based on the pricing transparency of the investments and derivative financial instruments and is not necessarily an indication of the risks associated with investing in those securities.
4. Securities and Other Investments:
Floating Rate Loan Interests: Floating rate loan interests are typically issued to companies (the “borrower”) by banks, other financial institutions, or privately and publicly offered corporations (the “lender”). Floating rate loan interests are generally non-investment grade, often involve borrowers whose financial condition is troubled or uncertain and companies that are highly leveraged. The Fund may invest in obligations of borrowers who are in bankruptcy proceedings. In addition, transactions in floating rate loan interests may settle on a delayed basis, which may result to proceeds from the sale to not be readily available for the Fund to make additional investments or meet its redemption obligations. Floating rate loan interests may include fully funded term loans or revolving lines of credit. Floating rate loan interests are typically senior in the corporate capital structure of the borrower. Floating
| | | | | | |
| | | BLACKROCK EVENT DRIVEN EQUITY FUND | | MARCH 31, 2016 | | 23 |
| | |
| Notes to Financial Statements (continued) | | |
rate loan interests generally pay interest at rates that are periodically determined by reference to a base lending rate plus a premium. The base lending rates are generally the lending rate offered by one or more European banks, such as the London Interbank Offered Rate (“LIBOR”), the prime rate offered by one or more U.S. banks or the certificate of deposit rate. Floating rate loan interests may involve foreign borrowers, and investments may be denominated in foreign currencies. These investments are treated as investments in debt securities for purposes of the Fund’s investment policies.
When the Fund purchases a floating rate loan interest, it may receive a facility fee and when it sells a floating rate loan interest, it may pay a facility fee. On an ongoing basis, the Fund may receive a commitment fee based on the undrawn portion of the underlying line of credit amount of a floating rate loan interest. Facility and commitment fees are typically amortized to income over the term of the loan or term of the commitment, respectively. Consent and amendment fees are recorded to income as earned. Prepayment penalty fees, which may be received by the Fund upon the prepayment of a floating rate loan interest by a borrower, are recorded as realized gains. The Fund may invest in multiple series or tranches of a loan. A different series or tranche may have varying terms and carry different associated risks.
Floating rate loan interests are usually freely callable at the borrower’s option. The Fund may invest in such loans in the form of participations in loans (“Participations”) or assignments (“Assignments”) of all or a portion of loans from third parties. Participations typically will result in the Fund having a contractual relationship only with the lender, not with the borrower. The Fund has the right to receive payments of principal, interest and any fees to which it is entitled only from the lender selling the Participation and only upon receipt by the lender of the payments from the borrower. In connection with purchasing Participations, the Fund generally will have no right to enforce compliance by the borrower with the terms of the loan agreement, nor any rights of offset against the borrower. The Fund may not benefit directly from any collateral supporting the loan in which it has purchased the Participation. As a result, the Fund assumes the credit risk of both the borrower and the lender that is selling the Participation. The Fund’s investment in loan participation interests involves the risk of insolvency of the financial intermediaries who are parties to the transactions. In the event of the insolvency of the lender selling the Participation, the Fund may be treated as a general creditor of the lender and may not benefit from any offset between the lender and the borrower. Assignments typically result in the Fund having a direct contractual relationship with the borrower, and the Fund may enforce compliance by the borrower with the terms of the loan agreement.
Borrowed Bond Agreements: Repurchase agreements may be referred to as borrowed bond agreements when entered into in connection with short sales of bonds. In a borrowed bond agreement, the Fund borrows a bond from a counterparty in exchange for cash collateral. The agreement contains a commitment that the security and the cash will be returned to the counterparty and the Fund at a mutually agreed upon date. Certain agreements have no stated maturity and can be terminated by either party at any time. Earnings on cash collateral and compensation to the lender of the bond are based on agreed upon rates between the Fund and the counterparty. The value of the underlying cash collateral approximates the market value and accrued interest of the borrowed bond. To the extent that a borrowed bond transaction exceeds one business day, the value of the cash collateral in the possession of the counterparty is monitored on a daily basis to ensure the adequacy of the collateral. As the market value of the borrowed bond changes, the cash collateral is periodically increased or decreased with a frequency and in amounts prescribed in the borrowed bond agreement. The Fund may also experience delays in gaining access to the collateral.
Borrowed bond agreements are entered into by the Fund under Master Repurchase Agreements (each, an “MRA”), which permit the Fund, under certain circumstances, including an event of default (such as bankruptcy or insolvency), to offset payables and/or receivables under the MRA with collateral held and/or posted to the counterparty and create one single net payment due to or from the Fund. With borrowed bond agreements, typically the Fund and counterparty under an MRA are permitted to sell, re-pledge, or use the collateral associated with the transaction. Bankruptcy or insolvency laws of a particular jurisdiction may impose restrictions on or prohibitions against such a right of offset in the event of the MRA counterparty’s bankruptcy or insolvency. Pursuant to the terms of the MRA, the Fund receives or posts securities as collateral with a market value in excess of the repurchase price to be paid or received by the Fund upon the maturity of the transaction. Upon a bankruptcy or insolvency of the MRA counterparty, the Fund is considered an unsecured creditor with respect to excess collateral and, as such, the return of excess collateral may be delayed.
As of period end, the following table is a summary of the Fund’s open borrowed bond agreements by counterparty which are subject to offset under an MRA on a net basis:
| | | | | | |
| Counterparty | | Borrowed
Bond
Agreements1 | | Borrowed Bonds
at Value including
Accrued Interest2 | | Net Exposure
Due (to)/from
Counterparty3 |
Citigroup Global Markets, Inc. | | $367,031 | | $(343,593) | | $23,438 |
| | 1 | | Included in Investments at value-unaffiliated in the Statement of Assets and Liabilities. |
| | 2 | | Includes accrued interest on borrowed bonds in the amount of $3,280 which is included in interest expense payable in the Statement of Assets and Liabilities. |
| | 3 | | Net exposure represents the net receivable (payable) that would be due from/to the counterparty in the event of default. |
| | | | | | |
| 24 | | BLACKROCK EVENT DRIVEN EQUITY FUND | | MARCH 31, 2016 | | |
| | |
| Notes to Financial Statements (continued) | | |
When the Fund enters into an MRA and an International Swaps and Derivatives Association, Inc. Master Agreement (“ISDA Master Agreement”) and/or Master Securities Lending Agreements (“MSLA”) with the same counterparty, the agreements may contain a set-off provision allowing a fund to offset a net amount payable with a net amount receivable upon default of the counterparty. Bankruptcy or insolvency laws of a particular jurisdiction may restrict or prohibit the right of offset in bankruptcy, insolvency or other events. For example, regardless of the contractual rights included in an MRA, such laws may prohibit the Fund from setting off amounts owed to a defaulting counterparty under an MRA against amounts owed to the Fund by affiliates of the defaulting counterparty. However, the insolvency regimes of many jurisdictions generally permit set-off of simultaneous payables and receivables with the same legal entity under certain types of financial contracts. These rules would apply upon a default of the legal entity, regardless of the existence of a contractual set-off right in those contracts.
In the event the counterparty of securities under an MRA files for bankruptcy or becomes insolvent, the Fund’s use of the proceeds from the agreement may be restricted while the counterparty, or its trustee or receiver, determines whether or not to enforce the Fund’s obligation to repurchase the securities.
Short Sales Transactions: In short sale transaction, the Fund sells a security it does not hold in anticipation of a decline in the market price of that security. When the Fund makes a short sale, it will borrow the security sold short from a broker/counterparty and deliver the security to the purchaser. To close out a short position, the Fund delivers the same security to the broker and records a liability to reflect the obligation to return the security to the broker. The amount of the liability is subsequently marked-to-market to reflect the market value of the short sale. The Fund maintains a segregated account of securities or deposits cash with the broker-dealer as collateral for the short sales. Cash deposited with the broker is recorded as an asset in the Statement of Assets and Liabilities. Securities segregated as collateral are denoted in the Schedule of Investments. The Fund may pay a financing fee for the difference between the market value of the short position and the cash collateral deposited with the broker which would be recorded as interest expense. The Fund is required to repay the counterparty any dividends received on the security sold short, which, if applicable, is shown as dividend expense in the Statement of Operations. The Fund may pay a fee on the assets borrowed from the counterparty, which, if applicable, is shown as stock loan fees in the Statement of Operations. The Fund is exposed to market risk based on the amount, if any, that the market value of the security increases beyond the market value at which the position was sold. Thus, a short sale of a security involves the risk that instead of declining, the price of the security sold short will rise. The short sale of securities involves the possibility of an unlimited loss since there is an unlimited potential for the market price of the security sold short to increase. A gain, limited to the price at which the Fund sold the security short. A realized gain or loss is recognized upon the termination of a short sale if the market price is either less than or greater than the proceeds originally received. There is no assurance that the Fund will be able to close out a short position at a particular time or at an acceptable price.
5. Derivative Financial Instruments:
The Fund engages in various portfolio investment strategies using derivative contracts both to increase the returns of the Fund and/or to manage its exposure to certain risks such as credit risk, equity risk, interest rate risk, foreign currency exchange rate risk, commodity price risk or other risks (e.g., inflation risk). Derivative financial instruments categorized by risk exposure are included in the Schedule of Investments. These contracts may be transacted on an exchange or OTC.
Swaps: The Fund enters into swap contracts to manage exposure to issuers, markets and securities. Such contracts are agreements between the Fund and a counterparty to make periodic net payments on a specified notional amount or a net payment upon termination. Swap agreements are privately negotiated in the OTC market and may be entered into as a bilateral contract (“OTC swaps”) or centrally cleared (“centrally cleared swaps”).
For OTC swaps, any upfront premiums paid and any upfront fees received are shown as swap premiums paid and swap premiums received, respectively, in the Statement of Assets and Liabilities and amortized over the term of the OTC contract. The daily fluctuation in market value is recorded as unrealized appreciation (depreciation) on OTC Swaps in the Statement of Assets and Liabilities. Payments received or paid are recorded in the Statement of Operations as realized gains or losses, respectively. When an OTC swap is terminated, a realized gain or loss is recorded in the Statement of Operations equal to the difference between the proceeds from (or cost of) the closing transaction and the Fund’s basis in the contract, if any. Generally, the basis of the contract is the premium received or paid.
In a centrally cleared swap, immediately following execution of the swap contract, the swap contract is novated to a central counterparty (the “CCP”) and the Fund’s counterparty on the swap agreement becomes the CCP. The Fund is required to interface with the CCP through the broker. Upon entering into a centrally cleared swap, the Fund is required to deposit initial margin with the broker in the form of cash or securities in an amount that varies depending on the size and risk profile of the particular swap. Securities deposited as initial margin are designated in the Schedule of Investments and cash deposited is shown as cash pledged for centrally cleared swaps in the Statement of Assets and Liabilities. Pursuant to the contract, the Fund agrees to receive from or pay to the broker an amount of cash equal to the daily fluctuation in market value of the contract (“variation margin”). Variation margin is recorded as unrealized appreciation (depreciation) and shown as variation margin receivable (or payable) on centrally cleared swaps in
| | | | | | |
| | | BLACKROCK EVENT DRIVEN EQUITY FUND | | MARCH 31, 2016 | | 25 |
| | |
| Notes to Financial Statements (continued) | | |
the Statement of Assets and Liabilities. Payments received from (paid to) the counterparty, including at termination, are recorded as realized gains (losses) in the Statement of Operations.
| • | | Credit default swaps — The Fund enters into credit default swaps to manage its exposure to the market or certain sectors of the market, to reduce their risk exposure to defaults of corporate and/or sovereign issuers or to create exposure to corporate and/or sovereign issuers to which it is not otherwise exposed (credit risk). |
The Fund may either buy or sell (write) credit default swaps on single-name issuers (corporate or sovereign), a combination or basket of single-name issuers or traded indexes. Credit default swaps are agreements in which the protection buyer pays fixed periodic payments to the seller in consideration for a promise from the protection seller to make a specific payment should a negative credit event take place with respect to the referenced entity (e.g., bankruptcy, failure to pay, obligation acceleration, repudiation, moratorium or restructuring). As a buyer, if an underlying credit event occurs, the Fund will either (i) receive from the seller an amount equal to the notional amount of the swap and deliver the referenced security or underlying securities comprising the index, or (ii) receive a net settlement of cash equal to the notional amount of the swap less the recovery value of the security or underlying securities comprising the index. As a seller (writer), if an underlying credit event occurs, the Fund will either pay the buyer an amount equal to the notional amount of the swap and take delivery of the referenced security or underlying securities comprising the index or pay a net settlement of cash equal to the notional amount of the swap less the recovery value of the security or underlying securities comprising the index.
| • | | Total return swaps — The Fund enters into total return swaps to obtain exposure to a portfolio of long and short securities without owning such securities. |
Under the terms of a contract, the swap is designed to function as a portfolio of direct investments in long and short equity positions. This means that the Fund has the ability to trade in and out of these long and short positions within the swap and will receive the economic benefits and risks equivalent to direct investment in these positions, subject to certain adjustments due to events related to the counterparty and its hedge. Benefits and risks include capital appreciation (depreciation), corporate actions and dividends received and paid, all of which are reflected in the swap’s market value. The market value also includes interest charges and credits (“financing fees”) related to the notional values of the long and short positions and cash balances within the swap. These interest charges and credits are based on a specified benchmark rate plus or minus a specified spread determined based upon the country and/or currency of the positions in the portfolio.
Positions within the swap and financing fees are reset periodically. During a reset, any unrealized appreciation (depreciation) on positions and accrued financing fees become available for cash settlement between the Fund and the counterparty. The amounts that are available for cash settlement are recorded as realized gains or losses in the Statement of Operations. Cash settlement in and out of the swap may occur at a reset date or any other date, at the discretion of the Fund and the counterparty, over the life of the agreement. Certain swaps have no stated expiration and can be terminated by either party at any time.
Master Netting Arrangements: In order to define its contractual rights and to secure rights that will help the Fund mitigate its counterparty risk, the Fund may enter into an International Swaps and Derivatives Association, Inc. Master Agreement (“ISDA Master Agreement”) or similar agreement with its counterparties. An ISDA Master Agreement is a bilateral agreement between the Fund and a counterparty that governs certain OTC derivatives and typically contains, among other things, collateral posting terms and netting provisions in the event of a default and/or termination event. Under an ISDA Master Agreement, the Fund may, under certain circumstances, offset with the counterparty certain derivative financial instruments’ payables and/or receivables with collateral held and/or posted and create one single net payment. The provisions of the ISDA Master Agreement typically permit a single net payment in the event of default including the bankruptcy or insolvency of the counterparty. Bankruptcy or insolvency laws of a particular jurisdiction may restrict or prohibit the right of offset in bankruptcy, insolvency or other events. In addition, certain ISDA Master Agreements allow counterparties to OTC derivatives to terminate derivative contracts prior to maturity in the event the Fund’s net assets decline by a stated percentage or the Fund fails to meet the terms of its ISDA Master Agreements, which would cause the Fund to accelerate payment of any net liability owed to the counterparty.
Collateral Requirements: For derivatives traded under an ISDA Master Agreement, the collateral requirements are typically calculated by netting the mark-to-market amount for each transaction under such agreement and comparing that amount to the value of any collateral currently pledged by the Fund and the counterparty.
Cash collateral that has been pledged to cover obligations of the Fund and cash collateral received from the counterparty, if any, is reported separately on the Statement of Assets and Liabilities as cash pledged as collateral and cash received as collateral, respectively. Non-cash collateral pledged by
| | | | | | |
| 26 | | BLACKROCK EVENT DRIVEN EQUITY FUND | | MARCH 31, 2016 | | |
| | |
| Notes to Financial Statements (continued) | | |
the Fund, if any, is noted in the Schedule of Investments. Generally, the amount of collateral due from or to a counterparty is subject to a certain minimum transfer amount threshold before a transfer is required, which is determined at the close of business of the Fund. Any additional required collateral is delivered to/pledged by the Fund on the next business day. Typically, the counterparty is not permitted to sell, re-pledge or use cash and non-cash collateral it receives. The Fund generally agrees not to use non-cash collateral that it receives but may, absent default or certain other circumstances defined in the underlying ISDA Master Agreement, be permitted to use cash collateral received. In such cases, interest may be paid pursuant to the collateral arrangement with the counterparty. To the extent amounts due to the Fund from its counterparties are not fully collateralized, it bears the risk of loss from counterparty non-performance. Likewise, to the extent the Funds has delivered collateral to a counterparty and stands ready to perform under the terms of its agreement with such counterparty, it bears the risk of loss from a counterparty in the amount of the value of the collateral in the event the counterparty fails to return such collateral. Based on the terms of agreements, collateral may not be required for all derivative contracts.
6. Investment Advisory Agreement and Other Transactions with Affiliates:
The PNC Financial Services Group, Inc. is the largest stockholder and an affiliate of BlackRock, Inc. (“BlackRock”) for 1940 Act purposes.
Investment Advisory
The Corporation, on behalf of the Fund, entered into an Investment Advisory Agreement with the Manager, the Fund’s investment advisor, an indirect, wholly owned subsidiary of BlackRock, to provide investment advisory and administration services. The Manager is responsible for the management of the Fund’s portfolio and provides the personnel, facilities, equipment and certain other services necessary to the operations of the Fund. For such services, the Fund pays the Manager a monthly fee based on a percentage of the Fund’s average daily net assets at the following annual rates:
| | | | |
| Average Daily Net Assets | | Investment
Advisory
Fee | |
First $1 Billion | | | 1.20% | |
$1 Billion - $3 Billion | | | 1.13% | |
$3 Billion - $5 Billion | | | 1.08% | |
$5 Billion - $10 Billion | | | 1.04% | |
Greater than $10 Billion | | | 1.02% | |
Service and Distribution Fees
The Corporation, on behalf of the Fund, entered into a Distribution Agreement and Distribution Plans with BlackRock Investments, LLC (“BRIL”), an affiliate of the Manager. Pursuant to the Distribution Plans and in accordance with Rule 12b-1 under the 1940 Act, the Fund pays BRIL ongoing service and distribution fees. The fees are accrued daily and paid monthly at annual rates based upon the average daily net assets of the relevant share class of the Fund as follows:
| | | | | | |
| | | Service
Fee | | | Distribution
Fee |
Investor A | | | 0.25% | | | — |
Investor C | | | 0.25% | | | 0.75% |
Pursuant to sub-agreements with BRIL, broker-dealers and BRIL provide shareholder servicing and distribution services to the Fund. The ongoing service and/or distribution fee compensates BRIL and each broker-dealer for providing shareholder servicing and/or distribution related services to the shareholders.
For the six months ended March 31, 2016, the following table shows the class specific service and distribution fees borne directly by each share class of the Fund:
| | | | |
| Investor A | | Investor C | | Total |
$15,289 | | $30,988 | | $46,277 |
Transfer Agent
Pursuant to written agreements, certain financial intermediaries, some of which may be affiliates, provide the Fund with sub-accounting, recordkeeping, sub-transfer agency and other administrative services with respect to sub-accounts they service. For these services, these entities receive an asset-based fee or an annual fee per shareholder account, which will vary depending on share class and/or net assets.
| | | | | | |
| | | BLACKROCK EVENT DRIVEN EQUITY FUND | | MARCH 31, 2016 | | 27 |
| | |
| Notes to Financial Statements (continued) | | |
The Manager maintains a call center that is responsible for providing certain shareholder services to the Fund. Shareholder services include responding to inquiries and processing subscriptions and redemptions based upon instructions from shareholders. For the six months ended March 31, 2016, the Fund reimbursed the Manager the following amounts for costs incurred in running the call center, which are included in transfer agent — class specific in the Statement of Operations:
| | | | | | |
| Institutional | | Investor A | | Investor C | | Total |
| $74 | | $505 | | $317 | | $896 |
For the six months ended March 31, 2016, the following table shows the class specific transfer agent fees borne directly by each class of the Fund:
| | | | | | |
| Institutional | | Investor A | | Investor C | | Total |
| $8,839 | | $6,363 | | $4,517 | | $19,719 |
For the six months ended March 31, 2016, affiliates earned underwriting discounts, direct commissions and dealer concessions on sales of the Fund’s Investor A Shares of $7,506.
Expense Limitations, Waivers and Reimbursements
The Manager, with respect to the Fund, contractually agreed to waive and/or reimburse fees or expenses in order to limit expenses, excluding interest expense, dividend expense, acquired fund fees and expenses, and certain other fund expenses, which constitute extraordinary expenses not incurred in the ordinary course of the Fund’s business. The expense limitations as a percentage of average daily net assets are as follows:
| | | | |
Institutional | | | 1.38% | |
Investor A | | | 1.65% | |
Investor C | | | 2.39% | |
The Manager has agreed not to reduce or discontinue this contractual expense limitation prior to February 1, 2017, unless approved by the Board, including a majority of the Independent Directors or by a majority of the outstanding voting securities of the Fund. For the six months ended March 31, 2016, the Manager waived and/or reimbursed $35,047, which is included in fees waived and/or reimbursed by the Manager in the Statement of Operations.
The Manager, with respect to the Fund, voluntarily agreed to waive its investment advisory fees by the amount of investment advisory fees the Fund pays to the Manager indirectly through its investment in affiliated money market funds. This amount is included in fees waived and/or reimbursed by the Manager in the Statement of Operations. However, the Manager does not waive its investment advisory fees by the amount of investment advisory fees paid in connection with the Fund’s investment in other affiliated investment companies, if any. For the six months ended March 31, 2016, the Manager waived $16,182.
Class specific expense waivers and/or reimbursements are as follows:
| | | | | | | | |
| | | Institutional | | Investor A | | Investor C | | Total |
Transfer Agent Fees Reimbursed | | $8,815 | | $4,897 | | $4,176 | | $17,888 |
For the year ended March 31, 2016, the Fund reimbursed the Manager $160 for certain accounting services, which is included in accounting services in the Statement of Operations.
Officers and Directors
Certain officers and/or directors of the Funds are officers and/or directors of BlackRock or its affiliates. The Fund reimburses the Manager for a portion of the compensation paid to the Corporation’s Chief Compliance Officer, which is included in Officer and Directors in the Statement of Operations.
7. Purchases and Sales:
For the six months ended March 31, 2016, purchases and sales of investments, excluding short-term securities, were $3,327,897 and $7,461,265, respectively.
8. Income Tax Information:
It is the Fund’s policy to comply with the requirements of the Internal Revenue Code of 1986, as amended, applicable to regulated investment companies, and to distribute substantially all of its taxable income to its shareholders. Therefore, no federal income tax provision is required.
| | | | | | |
| 28 | | BLACKROCK EVENT DRIVEN EQUITY FUND | | MARCH 31, 2016 | | |
| | |
| Notes to Financial Statements (continued) | | |
The Fund files U.S. federal and various state and local tax returns. No income tax returns are currently under examination. The statute of limitations on the Fund’s U.S. federal tax returns remains open for each of the four years ended September 30, 2015. The statutes of limitations on the Fund’s state and local tax returns may remain open for an additional year depending upon the jurisdiction.
Management has analyzed tax laws and regulations and their application to the Fund as of March 31, 2016, inclusive of the open tax return years, and does not believe there are any uncertain tax positions that require recognition of a tax liability in the Fund’s financial statements.
As of March 31, 2016, gross unrealized appreciation and depreciation based on cost for federal income tax purposes were as follows:
| | | | |
Tax cost | | $ | 92,374,886 | |
| | | | |
Gross unrealized appreciation | | $ | 69,603 | |
Gross unrealized depreciation | | | (821,704 | ) |
| | | | |
Net unrealized depreciation | | $ | (752,101 | ) |
| | | | |
9. Bank Borrowings:
The Corporation, on behalf of the Fund, along with certain other funds managed by the Manager and its affiliates (“Participating Funds”), is a party to a 364-day, $2.1 billion credit agreement with a group of lenders, under which the Fund may borrow to fund shareholder redemptions. Excluding commitments designated for certain individual funds, the Participating Funds, including the Fund, can borrow up to an aggregate commitment amount of $1.6 billion at any time outstanding, subject to asset coverage and other limitations as specified in the agreement. The credit agreement has the following terms: a fee of 0.06% per annum on unused commitment amounts and interest at a rate equal to the higher of (a) one-month LIBOR (but, in any event, not less than 0.00%) on the date the loan is made plus 0.80% per annum or (b) the Fed Funds rate (but, in any event, not less than 0.00%) in effect from time to time plus 0.80% per annum on amounts borrowed. The agreement expires in April 2016 unless extended or renewed. Participating Funds paid administration, legal and arrangement fees, which, if applicable, are included in miscellaneous expenses in the Statement of Operations, and along with commitment fees, were allocated among such funds based upon portions of the aggregate commitment available to them and relative net assets of Participating Funds. During the six months ended March 31, 2016, the Fund did not borrow under the credit agreement.
10. Principal Risks:
In the normal course of business, the Fund invests in securities and enters into transactions where risks exist due to fluctuations in the market (market risk) or failure of the issuer to meet all its obligations, including the ability to pay principal and interest when due (issuer credit risk). The value of securities held by the Funds may decline in response to certain events, including those directly involving the issuers of securities owned by the Funds. Changes arising from the general economy, the overall market and local, regional or global political and/or social instability, as well as currency, interest rate and price fluctuations, may also affect the securities’ value.
Counterparty Credit Risk: Similar to issuer credit risk, the Fund may be exposed to counterparty credit risk, or the risk that an entity may fail to or be unable to perform on its commitments related to unsettled or open transactions. The Fund manages counterparty credit risk by entering into transactions only with counterparties that the Manager believes have the financial resources to honor their obligations and by monitoring the financial stability of those counterparties. Financial assets, which potentially expose the Fund to market, issuer and counterparty credit risks, consist principally of financial instruments and receivables due from counterparties. The extent of the Funds’ exposure to market, issuer and counterparty credit risks with respect to these financial assets is approximately their value recorded in the Statement of Assets and Liabilities, less any collateral held by the Fund.
A derivative contract may suffer a mark-to-market loss if the value of the contract decreases due to an unfavorable change in the market rates or values of the underlying instrument. Losses can also occur if the counterparty does not perform under the contract.
The Fund’s risk of loss from counterparty credit risk on OTC derivatives is generally limited to the aggregate unrealized gain less the value of any collateral held by the Fund.
With centrally cleared swaps, there is less counterparty credit risk to the Fund since the exchange or clearinghouse, as counterparty to such instruments, guarantees against a possible default. The clearinghouse stands between the buyer and the seller of the contract; therefore, credit risk is limited to failure of the clearinghouse. While offset rights may exist under applicable law, the Fund does not have a contractual right of offset against a clearing broker or clearinghouse in the event of a default (including the bankruptcy or insolvency). Additionally, credit risk exists in centrally cleared swaps with respect to initial and variation margin that is held in a clearing broker’s customer accounts. While clearing brokers are required to segregate customer margin from their own assets, in the event that a clearing broker becomes insolvent or goes into bankruptcy and at that time there is a shortfall
| | | | | | |
| | | BLACKROCK EVENT DRIVEN EQUITY FUND | | MARCH 31, 2016 | | 29 |
| | |
| Notes to Financial Statements (concluded) | | |
in the aggregate amount of margin held by the clearing broker for all its clients, typically the shortfall would be allocated on a pro rata basis across all the clearing broker’s customers, potentially resulting in losses to the Fund.
11. Capital Share Transactions:
Transactions in capital shares for each class were as follows:
| | | | | | | | | | | | | | | | | | |
| | | Six Months Ended
March 31, 2016 | | | | | Year Ended
September 30, 2015 | |
| | | Shares | | | Amount | | | | | Shares | | | Amount | |
Institutional | | | | | | | | | | | | | | | | | | |
Shares sold | | | 10,258,545 | | | $ | 89,888,185 | | | | | | 171,335 | | | $ | 2,113,588 | |
Shares issued in reinvestment of distributions | | | 51,880 | | | | 441,493 | | | | | | 406,878 | | | | 3,887,858 | |
Shares redeemed | | | (4,091,051 | ) | | | (37,121,928 | ) | | | | | (739,271 | ) | �� | | (9,548,210 | ) |
| | | | | | | | | | |
Net increase (decrease) | | | 6,219,374 | | | $ | 53,207,750 | | | | | | (161,058 | ) | | $ | (3,546,764 | ) |
| | | | | | | | | | |
| | | | | | | | | | | | | | | | | | |
Investor A | | | | | | | | | | | | | | | | | | |
Shares sold | | | 1,760,979 | | | $ | 14,953,841 | | | | | | 139,549 | | | $ | 1,719,286 | |
Shares issued in reinvestment of distributions. | | | 80,512 | | | | 661,808 | | | | | | 498,574 | | | | 4,589,574 | |
Shares redeemed | | | (361,666 | ) | | | (3,077,423 | ) | | | | | (321,075 | ) | | | (3,968,918 | ) |
| | | | | | | | | | |
Net increase | | | 1,479,825 | | | $ | 12,538,226 | | | | | | 317,048 | | | $ | 2,339,942 | |
| | | | | | | | | | |
| | | | | | | | | | | | | | | | | | |
Investor C | | | | | | | | | | | | | | | | | | |
Shares sold | | | 262,787 | | | $ | 2,048,071 | | | | | | 102,680 | | | $ | 1,233,551 | |
Shares issued in reinvestment of distributions | | | 54,311 | | | | 406,786 | | | | | | 333,640 | | | | 2,834,161 | |
Shares redeemed | | | (203,423 | ) | | | (1,582,452 | ) | | | | | (217,567 | ) | | | (2,687,596 | ) |
| | | | | | | | | | |
Net increase | | | 113,675 | | | $ | 872,405 | | | | | | 218,753 | | | $ | 1,380,116 | |
| | | | | | | | | | |
Total Net Increase | | | 7,812,874 | | | $ | 66,618,381 | | | | | | 374,743 | | | $ | 173,294 | |
| | | | | | | | | | |
12. Subsequent Events:
Management’s evaluation of the impact of all subsequent events on the Fund’s financial statements was completed through the date the financial statements were issued and the following item was noted:
Effective April 21, 2016, the credit agreement was extended until April 2017. The updated agreement includes the following terms: A fee of 0.12% per annum on the unused commitment amounts and interest at a rate equal to the higher of (a) one-month LIBOR (but in any event, not less than 0.00%) on the date the loan is made plus 0.80% per annum or (b) the Fed Funds rate (but in any event, not less than 0.00%) in effect from time to time plus 0.80% per annum on amounts borrowed. The commitment amounts remain unchanged. Administration, legal and arrangement fees in connection with the amended credit agreement, and along with commitment fees, are allocated among the Participating Funds based upon portions of the aggregate commitment available to them and relative net assets of the Participating Funds.
| | | | | | |
| 30 | | BLACKROCK EVENT DRIVEN EQUITY FUND | | MARCH 31, 2016 | | |
Rodney D. Johnson, Chair of the Board and Director
David O. Beim, Director
Susan J. Carter, Director
Collette Chilton, Director
Neil A. Cotty, Director
Dr. Matina S. Horner, Director
Cynthia A. Montgomery, Director
Barbara G. Novick, Director
Joseph P. Platt, Director
Robert C. Robb, Jr., Director
Mark Stalnecker, Director
Kenneth L. Urish, Director
Claire A. Walton, Director
Frederick W. Winter, Director
John M. Perlowski, Director, President and Chief Executive Officer
Jennifer McGovern, Vice President
Neal J. Andrews, Chief Financial Officer
Jay M. Fife, Treasurer
Charles Park, Chief Compliance Officer
Fernanda Piedra, Anti-Money Laundering Compliance Officer
Benjamin Archibald, Secretary
Effective December 31, 2015, Herbert I. London and Toby Rosenblatt retired as Directors of the Corporation.
Effective February 5, 2016, Frank J. Fabozzi resigned as a Director of the Corporation.
Effective February 8, 2016, Susan J. Carter, Neil A. Cotty and Claire A. Walton were elected to serve as Directors of the Corporation.
| | | | | | |
| | | | |
Investment Advisor BlackRock Advisors, LLC Wilmington, DE 19809 | | Custodian Brown Brothers Harriman & Co. Boston, MA 02109 | | Distributor BlackRock Investments, LLC New York, NY 10022 | | Address of the Corporation 100 Bellevue Parkway Wilmington, DE 19809 |
| | | | | | |
Legal Counsel Sidley Austin LLP New York, NY 10019 | | Independent Registered Public Accounting Firm Deloitte & Touche LLP Philadelphia, PA 19103 | | Accounting Agent and Transfer Agent BNY Mellon Investment Servicing (US) Inc. Wilmington, DE 19809 | | |
| | | | | | |
| | | BLACKROCK EVENT DRIVEN EQUITY FUND | | MARCH 31, 2016 | | 31 |
A Special Meeting of Shareholders was held on February 8, 2016 for shareholders of record on December 11, 2015, to elect a Board of Directors of the Fund.
| | | | | | | | | | |
| | | | | Votes For | | | | Votes Withheld | | |
Approved the Directors* as follows: | | David O. Beim | | 182,295,055 | | | | 4,705,082 | | |
| | Susan J. Carter | | 182,374,899 | | | | 4,625,239 | | |
| | Collette Chilton | | 182,289,972 | | | | 4,710,165 | | |
| | Neil A. Cotty | | 182,342,617 | | | | 4,657,520 | | |
| | Matina S. Horner | | 182,145,461 | | | | 4,854,677 | | |
| | Rodney D. Johnson | | 182,472,005 | | | | 4,528,132 | | |
| | Cynthia A. Montgomery | | 182,341,806 | | | | 4,658,331 | | |
| | Joseph P. Platt | | 182,358,309 | | | | 4,641,828 | | |
| | Robert C. Robb, Jr. | | 182,042,647 | | | | 4,957,490 | | |
| | Mark Stalnecker | | 182,548,344 | | | | 4,451,793 | | |
| | Kenneth L. Urish | | 182,561,485 | | | | 4,438,652 | | |
| | Claire A. Walton | | 182,541,376 | | | | 4,458,761 | | |
| | Frederick W. Winter | | 182,469,013 | | | | 4,531,124 | | |
| | Barbara G. Novick | | 182,356,291 | | | | 4,643,846 | | |
| | | John M. Perlowski | | 182,441,208 | | | | 4,558,930 | | |
| * | Denotes Fund-wide proposal and voting results. |
Householding
The Fund will mail only one copy of shareholder documents, including prospectuses, annual and semi-annual reports and proxy statements, to shareholders with multiple accounts at the same address. This practice is commonly called “householding” and is intended to reduce expenses and eliminate duplicate mailings of shareholder documents. Mailings of your shareholder documents may be householded indefinitely unless you instruct us otherwise. If you do not want the mailing of these documents to be combined with those for other members of your household, please call the Fund at (800) 441-7762.
Availability of Quarterly Schedule of Investments
The Fund files its complete schedule of portfolio holdings with the SEC for the first and third quarters of each fiscal year on Form N-Q. The Fund’s Forms N-Q are available on the SEC’s website at http://www.sec.gov and may also be reviewed and copied at the SEC’s Public Reference Room in Washington, DC. Information on how to access documents on the SEC’s website without charge may be obtained by calling (800) SEC-0330. The Fund’s Forms N-Q may also be obtained upon request and without charge by calling (800) 441-7762.
Availability of Proxy Voting Policies and Procedures
A description of the policies and procedures that the Fund uses to determine how to vote proxies relating to portfolio securities is available upon request and without charge, (1) by calling (800) 441-7762; (2) at http://www.blackrock.com; and (3) on the SEC’s website at http://www.sec.gov.
Availability of Proxy Voting Record
Information about how the Fund voted proxies relating to securities held in the Fund’s portfolio during the most recent 12-month period ended June 30 is available upon request and without charge (1) at http://www.blackrock.com or by calling (800) 441-7762 and (2) on the SEC’s website at http:// www.sec.gov.
BlackRock’s Mutual Fund Family
BlackRock offers a diverse lineup of open-end mutual funds crossing all investment styles and managed by experts in equity, fixed income and tax-exempt investing. Visit http://www.blackrock.com for more information.
| | | | | | |
| 32 | | BLACKROCK EVENT DRIVEN EQUITY FUND | | MARCH 31, 2016 | | |
| | |
| Additional Information (concluded) | | |
Account Information
Call us at (800) 441-7762 from 8:00 AM to 6:00 PM EST on any business day to get information about your account balances, recent transactions and share prices. You can also reach us on the Web at http://www.blackrock.com/funds.
Automatic Investment Plans
Investor Class shareholders who want to invest regularly can arrange to have $50 or more automatically deducted from their checking or savings account and invested in any of the BlackRock funds.
Systematic Withdrawal Plans
Investor Class shareholders can establish a systematic withdrawal plan and receive periodic payments of $50 or more from their BlackRock funds, as long as their account balance is at least $10,000.
Retirement Plans
Shareholders may make investments in conjunction with Traditional, Rollover, Roth, Coverdell, Simple IRAs, SEP IRAs and 403(b) Plans.
|
| BlackRock Privacy Principles |
BlackRock is committed to maintaining the privacy of its current and former fund investors and individual clients (collectively, “Clients”) and to safeguarding their non-public personal information. The following information is provided to help you understand what personal information BlackRock collects, how we protect that information and why in certain cases we share such information with select parties.
If you are located in a jurisdiction where specific laws, rules or regulations require BlackRock to provide you with additional or different privacy-related rights beyond what is set forth below, then BlackRock will comply with those specific laws, rules or regulations.
BlackRock obtains or verifies personal non-public information from and about you from different sources, including the following: (i) information we receive from you or, if applicable, your financial intermediary, on applications, forms or other documents; (ii) information about your transactions with us, our affiliates, or others; (iii) information we receive from a consumer reporting agency; and (iv) from visits to our websites.
BlackRock does not sell or disclose to non-affiliated third parties any non-public personal information about its Clients, except as permitted by law or as is necessary to respond to regulatory requests or to service Client accounts. These non-affiliated third parties are required to protect the confidentiality and security of this information and to use it only for its intended purpose.
We may share information with our affiliates to service your account or to provide you with information about other BlackRock products or services that may be of interest to you. In addition, BlackRock restricts access to non-public personal information about its Clients to those BlackRock employees with a legitimate business need for the information. BlackRock maintains physical, electronic and procedural safeguards that are designed to protect the non-public personal information of its Clients, including procedures relating to the proper storage and disposal of such information.
| | | | | | |
| | | BLACKROCK EVENT DRIVEN EQUITY FUND | | MARCH 31, 2016 | | 33 |
| | |
This report is intended for current holders. It is not authorized for use as an offer of sale or a solicitation of an offer to buy shares of the Fund unless preceded or accompanied by the Fund’s current prospectus. Past performance results shown in this report should not be considered a representation of future performance. Investment returns and principal value of shares will fluctuate so that shares, when redeemed, may be worth more or less than their original cost. Statements and other information herein are as dated and are subject to change. | |  |
| | |
EDE-3/16-SAR | |  |
MARCH 31, 2016
| | | | |
SEMI-ANNUAL REPORT (UNAUDITED) | | | | BLACKROCK® |
BlackRock Large Cap Series Funds, Inc.
▶ BlackRock Large Cap Core Fund
▶ BlackRock Large Cap Growth Fund
▶ BlackRock Large Cap Value Fund
▶ BlackRock Large Cap Value Retirement Portfolio
| | |
| Not FDIC Insured ¡ May Lose Value ¡ No Bank Guarantee | | |
| | |

| | Shareholders can sign up for e-mail notifications of quarterly statements, annual and semi-annual shareholder reports and prospectuses by enrolling in the electronic delivery program. Electronic copies of shareholder reports and prospectuses are also available on BlackRock’s website. TO ENROLL IN ELECTRONIC DELIVERY: Shareholders Who Hold Accounts with Investment Advisors, Banks or Brokerages: Please contact your financial advisor. Please note that not all investment advisors, banks or brokerages may offer this service. Shareholders Who Hold Accounts Directly with BlackRock: 1. Access the BlackRock website at blackrock.com 2. Select “Access Your Account” 3. Next, select “eDelivery” in the “Related Resources” box and follow the sign-up instructions |
| | | | | | |
| 2 | | BLACKROCK LARGE CAP SERIES FUNDS, INC. | | MARCH 31, 2016 | | |
Dear Shareholder,
Diverging monetary policies and shifting economic outlooks across regions have been the overarching themes driving financial markets over the past couple of years. Investors spent most of 2015 anticipating the end of the Federal Reserve’s (the “Fed”) near-zero interest rate policy as U.S. growth outpaced other developed markets. The Fed ultimately hiked rates in December, whereas the European Central Bank and the Bank of Japan took additional steps to stimulate growth, even introducing negative interest rates. The U.S. dollar had strengthened considerably ahead of these developments, causing profit challenges for U.S. companies that generate revenues overseas, and pressuring emerging market currencies and commodities prices.
Global market volatility increased in the latter part of 2015 and spilled over into early 2016. Oil prices were a key factor behind the instability after collapsing in mid-2015 due to excess global supply. China, one of the world’s largest consumers of oil, was another notable source of stress for financial markets. Signs of slowing economic growth, a depreciating yuan and declining confidence in the country’s policymakers stoked investors’ worries about the potential impact of China’s weakness on the global economy.
Fears of a global recession started to fade toward the end of the first quarter of 2016 and volatility abated. Central bank stimulus in Europe and Japan, combined with a more tempered outlook for rate hikes in the United States, helped bolster financial markets. A softening in U.S. dollar strength offered some relief to U.S. exporters and emerging market economies. Oil prices found firmer footing as global supply showed signs of leveling off.
The selloff in risk assets at the turn of the year has resulted in more reasonable valuations and some appealing entry points for investors today. However, investors continue to face the headwinds of uncertainty around China’s growth trajectory and currency management, the potential consequences of negative interest rates and geopolitical risks.
For the 12 months ended March 31, 2016, higher-quality assets such as municipal bonds, U.S. Treasuries and investment grade corporate bonds generated positive returns, while riskier assets such as non-U.S. and small cap equities broadly declined.
At BlackRock, we believe investors need to think globally, extend their scope across a broad array of asset classes and be prepared to adjust accordingly as market conditions change over time. We encourage you to talk with your financial advisor and visit blackrock.com for further insight about investing in today’s markets.
Sincerely,

Rob Kapito
President, BlackRock Advisors, LLC

Rob Kapito
President, BlackRock Advisors, LLC
| | | | | | | | |
| Total Returns as of March 31, 2016 | |
| | | 6-month | | | 12-month | |
U.S. large cap equities
(S&P 500® Index) | | | 8.49% | | | | 1.78% | |
U.S. small cap equities
(Russell 2000® Index) | | | 2.02 | | | | (9.76) | |
International equities
(MSCI Europe, Australasia, Far East Index) | | | 1.56 | | | | (8.27) | |
Emerging market equities
(MSCI Emerging Markets Index) | | | 6.41 | | | | (12.03) | |
3-month Treasury bills
(BofA Merrill Lynch
3-Month U.S. Treasury
Bill Index) | | | 0.10 | | | | 0.12 | |
U.S. Treasury securities
(BofA Merrill Lynch
10-Year U.S. Treasury
Index) | | | 3.27 | | | | 3.05 | |
U.S. investment grade
bonds (Barclays U.S.
Aggregate Bond Index) | | | 2.44 | | | | 1.96 | |
Tax-exempt municipal
bonds (S&P Municipal Bond Index) | | | 3.23 | | | | 3.95 | |
U.S. high yield bonds
(Barclays U.S. Corporate
High Yield 2% Issuer
Capped Index) | | | 1.23 | | | | (3.66) | |
|
| Past performance is no guarantee of future results. Index performance is shown for illustrative purposes only. You cannot invest directly in an index. | |
| | | | | | |
| | | THIS PAGE NOT PART OF YOUR FUND REPORT | | | | 3 |
| | | | |
| Fund Summary as of March 31, 2016 | | | BlackRock Large Cap Core Fund | |
BlackRock Large Cap Core Fund’s (the “Fund”) investment objective is to seek long-term capital growth. In other words, the Fund tries to choose investments that will increase in value.
|
| Portfolio Management Commentary |
How did the Fund perform?
| • | | For the six-month period ended March 31, 2016, the Fund, through its investment in Master Large Cap Core Portfolio (the “Portfolio”), underperformed its benchmark, the Russell 1000® Index. |
What factors influenced performance?
| • | | At the sector level, financials was the prime detractor from performance due to weakness among bank holdings, including Bank of America Corp. and Citigroup Inc. The underperformance of banks can be attributed to dual concerns presented by the sharp declines in energy/commodity prices: 1) that low energy/commodity prices will weigh further on inflation expectations, limiting future Fed rate hikes and the associated benefit to net interest income; and 2) the credit implications of sustained low commodities prices on bank loans to the energy, materials and industrials industries. Besides energy fears, market volatility and uncertainty led to a sharp slowdown in mergers & acquisitions, equity & debt underwriting and trading activity, which resulted in negatively revised expectations for bank earnings reports. |
| • | | Information technology (“IT”) was a second source of underperformance, in particular hardware, where the Portfolio had a stock-specific disappointment in Western Digital Corp. The stock underperformed after the company announced a highly earnings accretive, but controversial, acquisition of NAND flash producer SanDisk Corp. that coincided with Intel Corp.’s announcement of a new NAND flash fabrication plant in China. Further indications of weakness in PC and mobile NAND demand in early 2016 also weighed on the shares. |
| • | | Elsewhere, the Portfolio’s long-standing underweight to telecommunication services and utilities detracted as the defensive sectors were key beneficiaries during the market tumult later in the reporting period. |
| • | | Relative performance was supported by selection in the consumer sectors. An emphasis on home-improvement and off-price retailers drove gains in consumer discretionary as the names demonstrated standout revenue trends relative to the overall retail universe. Notably, both groups have business models that are largely shielded from online competition, with home-improvement retailers benefiting from strong housing fundamentals and long-delayed home-improvement investment. Meanwhile, food products company Tyson Foods Inc. was the top contributor in both the consumer staples sector and the Portfolio overall as the company significantly beat earnings expectations, with strong performance in all segments. Investors had been concerned about the cyclicality of its chicken business, but the company’s margins have proved far stronger than expected, leading to a significant re-rating of the shares. |
| • | | Additional contributions came from the Portfolio’s positions in NVIDIA Corp. and Southwest Airlines Co., as well as zero exposure to Wells Fargo & Co. |
Describe recent portfolio activity.
| • | | Due to a combination of portfolio trading activity and market movement during the six-month period, the Portfolio’s weighting in the materials sector increased, particularly within chemicals and containers & packaging. The biggest reduction was in the financials sector, largely with respect to banks and insurance. Energy exposure declined as well. |
Describe portfolio positioning at period end.
| • | | Relative to the Russell 1000® Index, the Portfolio ended the period with its largest sector overweights in health care, consumer discretionary and IT. Industrials, telecommunication services and utilities remained the most significant underweights. |
The views expressed reflect the opinions of BlackRock as of the date of this report and are subject to change based on changes in market, economic or other conditions. These views are not intended to be a forecast of future events and are no guarantee of future results.
| | | | | | |
| 4 | | BLACKROCK LARGE CAP SERIES FUNDS, INC. | | MARCH 31, 2016 | | |
| | | | |
| | | | BlackRock Large Cap Core Fund | |
|
| Total Return Based on a $10,000 Investment |
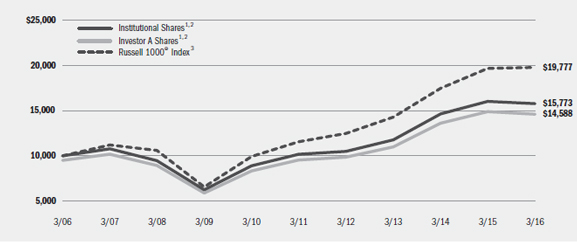
| | 1 | Assuming maximum sales charges, if any, transaction costs and other operating expenses, including administration fees, if any. Institutional Shares do not have a sales charge. |
| | 2 | The Fund invests all of its assets in the Portfolio, a series of Master Large Cap Series LLC. The Portfolio invests at least 80% of its assets in equity securities, primarily common stock, of large cap companies located in the United States that the investment advisor selects from among those that are, at the time of purchase, included in the Russell 1000® Index. |
| | 3 | An index that measures the performance of the large cap segment of the U.S. equity universe. It is a subset of the Russell 3000® Index and includes approximately 1,000 of the largest securities based on a combination of their market capitalization and current index membership. The index represents approximately 92% of the total market capitalization of the Russell 3000® Index. |
| | | | | | | | | | | | | | |
| Performance Summary for the Period Ended March 31, 2016 |
| | | | | | | | | | | | | | | | | | | | | | | | | | | | | | | | | | | |
| | | | | Average Annual Total Returns4 |
| | | | | 1 Year | | 5 Years | | 10 Years |
| | | 6-Month
Total Returns | | w/o sales
charge | | w/ sales
charge | | w/o sales
charge | | w/ sales
charge | | w/o sales
charge | | w/ sales
charge |
Institutional | | | | 5.04 | % | | | | (1.59 | )% | | | | N/A | | | | | 9.18 | % | | | | N/A | | | | | 4.66 | % | | | | N/A | |
Service | | | | 4.91 | | | | | (1.93 | ) | | | | N/A | | | | | 8.79 | | | | | N/A | | | | | 4.38 | | | | | N/A | |
Investor A | | | | 4.87 | | | | | (1.86 | ) | | | | (7.01 | )% | | | | 8.87 | | | | | 7.70 | % | | | | 4.41 | | | | | 3.85 | % |
Investor B | | | | 4.42 | | | | | (2.71 | ) | | | | (6.97 | ) | | | | 7.97 | | | | | 7.67 | | | | | 3.73 | | | | | 3.73 | |
Investor C | | | | 4.49 | | | | | (2.69 | ) | | | | (3.64 | ) | | | | 7.96 | | | | | 7.96 | | | | | 3.51 | | | | | 3.51 | |
Class R | | | | 4.72 | | | | | (2.17 | ) | | | | N/A | | | | | 8.52 | | | | | N/A | | | | | 4.03 | | | | | N/A | |
Russell 1000® Index | | | | 7.75 | | | | | 0.50 | | | | | N/A | | | | | 11.35 | | | | | N/A | | | | | 7.06 | | | | | N/A | |
| | 4 | | Assuming maximum sales charges, if any. Average annual total returns with and without sales charges reflect reductions for distribution and service fees. See “About Fund Performance” on page 12 for a detailed description of share classes, including any related sales charges and fees. |
| | | | N/A—Not applicable as share class and index do not have a sales charge. |
| | | | Past performance is not indicative of future results. |
| | | | | | | | | | | | | | | | | | | | | | | | | | | | | | | | | | | |
| | | Actual | | Hypothetical6 | | |
| | | Beginning
Account Value
October 1, 2015 | | Ending
Account Value
March 31, 2016 | | Expenses Paid
During the Period5 | | Beginning
Account Value
October 1, 2015 | | Ending
Account Value
March 31, 2016 | | Expenses Paid
During the Period5 | | Annualized
Expense
Ratio |
Institutional | | | $ | 1,000.00 | | | | $ | 1,050.40 | | | | $ | 4.51 | | | | $ | 1,000.00 | | | | $ | 1,020.60 | | | | $ | 4.45 | | | | | 0.88 | % |
Service | | | $ | 1,000.00 | | | | $ | 1,049.10 | | | | $ | 6.20 | | | | $ | 1,000.00 | | | | $ | 1,018.95 | | | | $ | 6.11 | | | | | 1.21 | % |
Investor A | | | $ | 1,000.00 | | | | $ | 1,048.70 | | | | $ | 5.84 | | | | $ | 1,000.00 | | | | $ | 1,019.30 | | | | $ | 5.76 | | | | | 1.14 | % |
Investor B | | | $ | 1,000.00 | | | | $ | 1,044.20 | | | | $ | 10.07 | | | | $ | 1,000.00 | | | | $ | 1,015.15 | | | | $ | 9.92 | | | | | 1.97 | % |
Investor C | | | $ | 1,000.00 | | | | $ | 1,044.90 | | | | $ | 10.12 | | | | $ | 1,000.00 | | | | $ | 1,015.10 | | | | $ | 9.97 | | | | | 1.98 | % |
Class R | | | $ | 1,000.00 | | | | $ | 978.30 | | | | $ | 7.17 | | | | $ | 1,000.00 | | | | $ | 1,017.75 | | | | $ | 7.31 | | | | | 1.45 | % |
| | 5 | | For each class of the Fund, expenses are equal to the annualized expense ratio for the class, multiplied by the average account value over the period, multiplied by 183/366 (to reflect the one-half year period shown). Because the Fund invests all of its assets in the Portfolio, the expense table reflects the net expenses of both the Fund and the Portfolio in which it invests. |
| | 6 | | Hypothetical 5% annual return before expenses is calculated by pro rating the number of days in the most recent fiscal half year divided by 366. |
| | | | See “Disclosure of Expenses” on page 12 for further information on how expenses were calculated. |
| | | | | | |
| | | BLACKROCK LARGE CAP SERIES FUNDS, INC. | | MARCH 31, 2016 | | 5 |
| | | | |
| Fund Summary as of March 31, 2016 | | | BlackRock Large Cap Growth Fund | |
BlackRock Large Cap Growth Fund’s (the “Fund”) investment objective is to seek long-term capital growth. In other words, the Fund tries to choose investments that will increase in value.
|
| Portfolio Management Commentary |
How did the Fund perform?
| • | | For the six-month period ended March 31, 2016, the Fund’s Institutional and Service Shares, through its investment in Master Large Cap Growth Portfolio (the “Portfolio”), outperformed its benchmark, the Russell 1000® Growth Index, while the Fund’s Investor A Shares performed inline and Investor B, Investor C and Class R Shares underperformed the benchmark. |
What factors influenced performance?
| • | | At the sector level, health care was the main contributor to relative performance due largely to the Portfolio’s absence in the worst-performing names within biotechnology. |
| • | | Consumer discretionary was a second source of outperformance. An emphasis on home-improvement and off-price retailers proved most advantageous as they demonstrated standout revenue trends relative to the overall retail universe. Notably, both groups have business models that are largely shielded from online competition, with home-improvement retailers benefiting from strong housing fundamentals and long-delayed home-improvement investment. Media also contributed in the sector, led by holding Omnicom Group Inc. |
| • | | Additional contributions in the period came from the information technology (“IT”) sector, where software holding Microsoft Corp. was a standout. The company beat earnings expectations, thanks to strong commercial cloud momentum and Office 365 metrics. At the same time, Windows 10 (launched last July) helped stem overall declining PC sales somewhat. NVIDIA Corp. was a top contributor in IT as well. The company delivered strong results in the period, reflecting its transition from PC and mobile components supplier to graphics platform provider. |
| • | | Conversely, financials was the prime detractor from performance in the reporting period. Bank holdings underperformed on speculation low commodity prices would weigh further on inflation expectations and |
| | | credit expenses. In addition, market volatility and uncertainty led to a sharp slowdown in mergers & acquisitions, equity & debt underwriting and trading activity, which resulted in negatively revised expectations for bank earnings reports. Added detractors in the sector were the Portfolio’s lack of exposure to real estate investment trusts and position in consumer finance. |
| • | | Absence in telecommunication services also hindered returns as the defensive sector was a key beneficiary during the market tumult in early 2016. |
| • | | In stock specifics, Alliance Data Systems Corp. and Western Digital Corp. were the top individual detractors. Alliance Data Systems Corp. reported an in-line fourth quarter and reiterated 2016 guidance, but the stock sold off primarily on macro worries as the guidance included higher credit losses versus a year ago. Western Digital Corp. underperformed after the company announced a highly earnings accretive, but controversial, acquisition of NAND flash producer SanDisk Corp. that coincided with Intel Corp.’s announcement of a new NAND flash fabrication plant in China. Further indications of weakness in PC and mobile NAND demand in early 2016 also weighed on the shares. |
Describe recent portfolio activity.
| • | | Due to a combination of portfolio trading activity and market movement during the six-month period, the Portfolio’s weightings in the materials and consumer staples sectors increased. The Portfolio’s weightings in industrials and health care decreased, with declines in energy as well. |
Describe portfolio positioning at period end.
| • | | Relative to the Russell 1000® Growth Index, the Portfolio ended the period with its largest sector overweight in IT. Industrials was the most significant underweight, followed by consumer staples and telecommunication services. |
The views expressed reflect the opinions of BlackRock as of the date of this report and are subject to change based on changes in market, economic or other conditions. These views are not intended to be a forecast of future events and are no guarantee of future results.
| | | | | | |
| 6 | | BLACKROCK LARGE CAP SERIES FUNDS, INC. | | MARCH 31, 2016 | | |
| | | | |
| | | | BlackRock Large Cap Growth Fund | |
|
| Total Return Based on a $10,000 Investment |
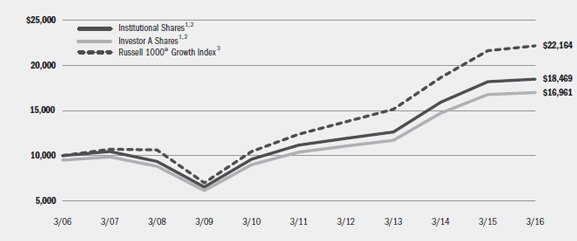
| | 1 | Assuming maximum sales charges, if any, transaction costs and other operating expenses, including administration fees, if any. Institutional Shares do not have a sales charge. |
| | 2 | The Fund invests all of its assets in the Portfolio, a series of Master Large Cap Series LLC. The Portfolio invests at least 80% of its assets in equity securities, primarily common stock, of large cap companies located in the United States that the investment advisor selects from among those that are, at the time of purchase, included in the Russell 1000® Growth Index. |
| | 3 | An unmanaged index that measures the performance of the large cap growth segment of the U.S. equity universe and consists of those Russell 1000® securities with higher price-to-book ratios and higher forecasted growth values. |
| | | | | | | | | | | | | | |
| Performance Summary for the Period Ended March 31, 2016 |
| | | | | | | | | | | | | | | | | | | | | | | | | | | | | | | | | | | |
| | | | | Average Annual Total Returns4 |
| | | | | 1 Year | | 5 Years | | 10 Years |
| | | 6-Month
Total Returns | | w/o sales
charge | | w/ sales
charge | | w/o sales
charge | | w/ sales
charge | | w/o sales
charge | | w/ sales
charge |
Institutional | | | | 8.38 | % | | | | 1.66 | % | | | | N/A | | | | | 10.64 | % | | | | N/A | | | | | 6.33 | % | | | | N/A | |
Service | | | | 8.17 | | | | | 1.35 | | | | | N/A | | | | | 10.30 | | | | | N/A | | | | | 6.05 | | | | | N/A | |
Investor A | | | | 8.16 | | | | | 1.30 | | | | | (4.02 | )% | | | | 10.30 | | | | | 9.12 | % | | | | 6.00 | | | | | 5.43 | % |
Investor B | | | | 7.77 | | | | | 0.51 | | | | | (3.77 | ) | | | | 9.41 | | | | | 9.13 | | | | | 5.31 | | | | | 5.31 | |
Investor C | | | | 7.77 | | | | | 0.52 | | | | | (0.43 | ) | | | | 9.46 | | | | | 9.46 | | | | | 5.17 | | | | | 5.17 | |
Class R | | | | 8.01 | | | | | 1.02 | | | | | N/A | | | | | 10.00 | | | | | N/A | | | | | 5.67 | | | | | N/A | |
Russell 1000® Growth Index | | | | 8.11 | | | | | 2.52 | | | | | N/A | | | | | 12.38 | | | | | N/A | | | | | 8.28 | | | | | N/A | |
| | 4 | | Assuming maximum sales charges, if any. Average annual total returns with and without sales charges reflect reductions for distribution and service fees. See “About Fund Performance” on page 12 for a detailed description of share classes, including any related sales charges and fees. |
| | | | N/A—Not applicable as share class and index do not have a sales charge. |
| | | | Past performance is not indicative of future results. |
| | | | | | | | | | | | | | | | | | | | | | | | | | | | | | | | | | | |
| | | Actual | | Hypothetical6 | | |
| | | Beginning
Account Value
October 1, 2015 | | Ending
Account Value
March 31, 2016 | | Expenses Paid
During the Period5 | | Beginning
Account Value
October 1, 2015 | | Ending
Account Value
March 31, 2016 | | Expenses Paid
During the Period5 | | Annualized
Expense
Ratio |
Institutional | | | $ | 1,000.00 | | | | $ | 1,083.80 | | | | $ | 4.38 | | | | $ | 1,000.00 | | | | $ | 1,020.80 | | | | $ | 4.24 | | | | | 0.84 | % |
Service | | | $ | 1,000.00 | | | | $ | 1,081.70 | | | | $ | 5.88 | | | | $ | 1,000.00 | | | | $ | 1,019.35 | | | | $ | 5.70 | | | | | 1.13 | % |
Investor A | | | $ | 1,000.00 | | | | $ | 1,081.60 | | | | $ | 5.88 | | | | $ | 1,000.00 | | | | $ | 1,019.35 | | | | $ | 5.70 | | | | | 1.13 | % |
Investor B | | | $ | 1,000.00 | | | | $ | 1,077.70 | | | | $ | 10.13 | | | | $ | 1,000.00 | | | | $ | 1,015.25 | | | | $ | 9.82 | | | | | 1.95 | % |
Investor C | | | $ | 1,000.00 | | | | $ | 1,077.70 | | | | $ | 10.13 | | | | $ | 1,000.00 | | | | $ | 1,015.25 | | | | $ | 9.82 | | | | | 1.95 | % |
Class R | | | $ | 1,000.00 | | | | $ | 1,010.20 | | | | $ | 6.94 | | | | $ | 1,000.00 | | | | $ | 1,018.10 | | | | $ | 6.96 | | | | | 1.38 | % |
| | 5 | | For each class of the Fund, expenses are equal to the annualized expense ratio for the class, multiplied by the average account value over the period, multiplied by 183/366 (to reflect the one-half year period shown). Because the Fund invests all of its assets in the Portfolio, the expense table reflects the net expenses of both the Fund and the Portfolio in which it invests. |
| | 6 | | Hypothetical 5% annual return before expenses is calculated by pro rating the number of days in the most recent fiscal half year divided by 366. |
| | | | See “Disclosure of Expenses” on page 12 for further information on how expenses were calculated. |
| | | | | | |
| | | BLACKROCK LARGE CAP SERIES FUNDS, INC. | | MARCH 31, 2016 | | 7 |
| | | | |
| Fund Summary as of March 31, 2016 | | | BlackRock Large Cap Value Fund | |
BlackRock Large Cap Value Fund’s (the “Fund”) investment objective is to seek long-term capital growth. In other words, the Fund tries to choose investments that will increase in value.
|
| Portfolio Management Commentary |
How did the Fund perform?
| • | | For the six-month period ended March 31, 2016, the Fund, through its investment in Master Large Cap Value Portfolio (the “Portfolio”), underperformed its benchmark, the Russell 1000® Value Index. |
What factors influenced performance?
| • | | At the sector level, information technology (“IT”) was the prime detractor from performance, in particular hardware, where the Portfolio had a stock-specific disappointment in Western Digital Corp. The stock underperformed after the company announced a highly earnings accretive, but controversial, acquisition of NAND flash producer SanDisk Corp. that coincided with Intel Corp.’s announcement of a new NAND flash fabrication plant in China. Further indications of weakness in PC and mobile NAND demand in early 2016 also weighed on the shares. |
| • | | Financials was a second source of underperformance due to weakness among bank holdings, including Bank of America Corp. and Citigroup Inc. The underperformance of banks can be attributed to dual concerns presented by the sharp declines in energy/commodity prices: 1) that low energy/commodity prices will weigh further on inflation expectations, limiting future Fed rate hikes and the associated benefit to net interest income; and 2) the credit implications of sustained low commodities prices on bank loans to the energy, materials and industrials industries. Besides energy fears, market volatility and uncertainty led to a sharp slowdown in mergers & acquisitions, equity & debt underwriting and trading activity, which resulted in negatively revised expectations for bank earnings reports. |
| • | | Elsewhere, the Portfolio’s long-standing underweight to utilities and telecommunication services detracted as the defensive sectors were key beneficiaries during the market tumult in the reporting period. |
| • | | Relative performance was supported by strong selection in consumer staples. Food products company Tyson Foods Inc. was the top contributor |
| | | in both the sector and the Portfolio overall as the company significantly beat earnings expectations, with strong performance in all segments. Investors had been concerned about the cyclicality of its chicken business, but the company’s margins have proved far stronger than expected, leading to a significant re-rating of the shares. Altria Group Inc. also contributed in the sector. The stock gained as the company reported solid fourth-quarter 2015 results, driven by stable volumes, strong net pricing and improved performance in smokeless operating leverage. In addition, the company issued upbeat earnings guidance for 2016, projecting high-visibility growth of 7%-9%. |
| • | | Energy and consumer discretionary also contributed in the six months. Within energy, an underweight and selection in the oil, gas & consumable fuels segment benefited relative performance, while specialty retail (particularly home-improvement retail) was the main source of strength in consumer discretionary. |
Describe recent portfolio activity.
| • | | Due to a combination of portfolio trading activity and market movement during the six-month period, the Portfolio’s weightings increased in the IT and materials sectors, with additions in consumer discretionary and consumer staples as well. The biggest reduction was in the financials sector, largely with respect to banks and insurance. Industrials exposure declined as well. |
Describe portfolio positioning at period end.
| • | | Relative to the Russell 1000® Value Index, the Portfolio ended the period with its largest sector overweights in consumer discretionary, health care and IT. The most significant underweights were utilities and financials (predominantly due to absence in real estate investment trusts). |
The views expressed reflect the opinions of BlackRock as of the date of this report and are subject to change based on changes in market, economic or other conditions. These views are not intended to be a forecast of future events and are no guarantee of future results.
| | | | | | |
| 8 | | BLACKROCK LARGE CAP SERIES FUNDS, INC. | | MARCH 31, 2016 | | |
| | | | |
| | | | BlackRock Large Cap Value Fund | |
|
| Total Return Based on a $10,000 Investment |
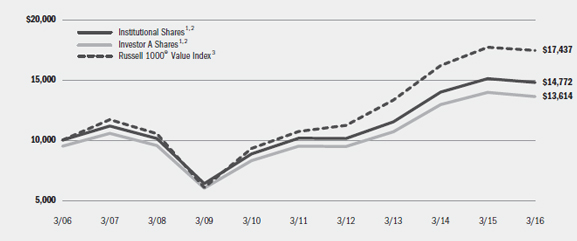
| | 1 | Assuming maximum sales charges, if any, transaction costs and other operating expenses, including administration fees, if any. Institutional Shares do not have a sales charge. |
| | 2 | The Fund invests all of its assets in the Portfolio, a series of Master Large Cap Series LLC. The Portfolio invests at least 80% of its assets in equity securities, primarily common stock, of large cap companies located in the United States that the investment advisor selects from among those that are, at the time of purchase, included in the Russell 1000® Value Index. |
| | 3 | An unmanaged index that is a subset of the Russell 1000® Index that consists of those Russell 1000® securities with lower price-to-book ratios and lower forecasted growth values. |
| | | | | | | | | | | | | | |
| Performance Summary for the Period Ended March 31, 2016 |
| | | | | | | | | | | | | | | | | | | | | | | | | | | | | | | | | | | |
| | | | | Average Annual Total Returns4 |
| | | | | 1 Year | | 5 Years | | 10 Years |
| | | 6-Month
Total Returns | | w/o sales
charge | | w/ sales
charge | | w/o sales
charge | | w/ sales
charge | | w/o sales
charge | | w/ sales
charge |
Institutional | | | | 4.17 | % | | | | (2.22 | )% | | | | N/A | | | | | 7.80 | % | | | | N/A | | | | | 3.98 | % | | | | N/A | |
Service | | | | 4.05 | | | | | (2.51 | ) | | | | N/A | | | | | 7.51 | | | | | N/A | | | | | 3.72 | | | | | N/A | |
Investor A | | | | 4.05 | | | | | (2.50 | ) | | | | (7.62 | )% | | | | 7.50 | | | | | 6.35 | % | | | | 3.69 | | | | | 3.13 | % |
Investor B | | | | 3.55 | | | | | (3.36 | ) | | | | (7.71 | ) | | | | 6.56 | | | | | 6.24 | | | | | 2.98 | | | | | 2.98 | |
Investor C | | | | 3.66 | | | | | (3.22 | ) | | | | (4.18 | ) | | | | 6.63 | | | | | 6.63 | | | | | 2.85 | | | | | 2.85 | |
Class R | | | | 3.91 | | | | | (2.79 | ) | | | | N/A | | | | | 7.19 | | | | | N/A | | | | | 3.38 | | | | | N/A | |
Russell 1000® Value Index | | | | 7.37 | | | | | (1.54 | ) | | | | N/A | | | | | 10.25 | | | | | N/A | | | | | 5.72 | | | | | N/A | |
| | 4 | | Assuming maximum sales charges, if any. Average annual total returns with and without sales charges reflect reductions for distribution and service fees. See “About Fund Performance” on page 12 for a detailed description of share classes, including any related sales charges and fees. |
| | | | N/A—Not applicable as share class and index do not have a sales charge. |
| | | | Past performance is not indicative of future results. |
| | | | | | | | | | | | | | | | | | | | | | | | | | | | | | | | | | | |
| | | Actual | | Hypothetical6 | | |
| | | Beginning
Account Value
October 1, 2015 | | Ending
Account Value
March 31, 2016 | | Expenses Paid
During the Period5 | | Beginning
Account Value
October 1, 2015 | | Ending
Account Value
March 31, 2016 | | Expenses Paid
During the Period5 | | Annualized
Expense
Ratio |
Institutional | | | $ | 1,000.00 | | | | $ | 1,041.70 | | | | $ | 4.44 | | | | $ | 1,000.00 | | | | $ | 1,020.65 | | | | $ | 4.39 | | | | | 0.87 | % |
Service | | | $ | 1,000.00 | | | | $ | 1,040.50 | | | | $ | 6.02 | | | | $ | 1,000.00 | | | | $ | 1,019.10 | | | | $ | 5.96 | | | | | 1.18 | % |
Investor A | | | $ | 1,000.00 | | | | $ | 1,040.50 | | | | $ | 5.97 | | | | $ | 1,000.00 | | | | $ | 1,019.15 | | | | $ | 5.91 | | | | | 1.17 | % |
Investor B | | | $ | 1,000.00 | | | | $ | 1,035.50 | | | | $ | 10.89 | | | | $ | 1,000.00 | | | | $ | 1,014.30 | | | | $ | 10.78 | | | | | 2.14 | % |
Investor C | | | $ | 1,000.00 | | | | $ | 1,036.60 | | | | $ | 9.88 | | | | $ | 1,000.00 | | | | $ | 1,015.30 | | | | $ | 9.77 | | | | | 1.94 | % |
Class R | | | $ | 1,000.00 | | | | $ | 1,039.10 | | | | $ | 7.34 | | | | $ | 1,000.00 | | | | $ | 1,017.80 | | | | $ | 7.26 | | | | | 1.44 | % |
| | 5 | | For each class of the Fund, expenses are equal to the annualized expense ratio for the class, multiplied by the average account value over the period, multiplied by 183/366 (to reflect the one-half year period shown). Because the Fund invests all of its assets in the Portfolio, the expense table reflects the net expenses of both the Fund and the Portfolio in which it invests. |
| | 6 | | Hypothetical 5% annual return before expenses is calculated by pro rating the number of days in the most recent fiscal half year divided by 366. |
| | | | See “Disclosure of Expenses” on page 12 for further information on how expenses were calculated. |
| | | | | | |
| | | BLACKROCK LARGE CAP SERIES FUNDS, INC. | | MARCH 31, 2016 | | 9 |
| | | | |
| Fund Summary as of March 31, 2016 | | | BlackRock Large Cap Value Retirement Portfolio | |
BlackRock Large Cap Value Retirement Portfolio’s (the “Fund”) investment objective is to seek long-term capital growth. In other words, the Fund tries to choose investments that will increase in value.
|
| Portfolio Management Commentary |
How did the Fund perform?
| • | | For the six-month period ended March 31, 2016, the Fund, through its investment in Master Large Cap Value Portfolio (the “Portfolio”), underperformed its benchmark, the Russell 1000® Value Index. |
What factors influenced performance?
| • | | At the sector level, information technology (“IT”) was the prime detractor from performance, in particular hardware, where the Portfolio had a stock-specific disappointment in Western Digital Corp. The stock underperformed after the company announced a highly earnings accretive, but controversial, acquisition of NAND flash producer SanDisk Corp. that coincided with Intel Corp.’s announcement of a new NAND flash fabrication plant in China. Further indications of weakness in PC and mobile NAND demand in early 2016 also weighed on the shares. |
| • | | Financials was a second source of underperformance due to weakness among bank holdings, including Bank of America Corp. and Citigroup Inc. The underperformance of banks can be attributed to dual concerns presented by the sharp declines in energy/commodity prices: 1) that low energy/commodity prices will weigh further on inflation expectations, limiting future Fed rate hikes and the associated benefit to net interest income; and 2) the credit implications of sustained low commodities prices on bank loans to the energy, materials and industrials industries. Besides energy fears, market volatility and uncertainty led to a sharp slowdown in mergers & acquisitions, equity & debt underwriting and trading activity, which resulted in negatively revised expectations for bank earnings reports. |
| • | | Elsewhere, the Portfolio’s long-standing underweight to utilities and telecommunication services detracted as the defensive sectors were key beneficiaries during the market tumult in the reporting period. |
| • | | Relative performance was supported by strong selection in consumer staples. Food products company Tyson Foods Inc. was the top contributor |
| | | in both the sector and the Portfolio overall as the company significantly beat earnings expectations, with strong performance in all segments. Investors had been concerned about the cyclicality of its chicken business, but the company’s margins have proved far stronger than expected, leading to a significant re-rating of the shares. Altria Group Inc. also contributed in the sector. The stock gained as the company reported solid fourth-quarter 2015 results, driven by stable volumes, strong net pricing and improved performance in smokeless operating leverage. In addition, the company issued upbeat earnings guidance for 2016, projecting high-visibility growth of 7%-9%. |
| • | | Energy and consumer discretionary also contributed in the six months. Within energy, an underweight and selection in the oil, gas & consumable fuels segment benefited relative performance, while specialty retail (particularly home-improvement retail) was the main source of strength in consumer discretionary. |
Describe recent portfolio activity.
| • | | Due to a combination of portfolio trading activity and market movement during the six-month period, the Portfolio’s weightings increased in the IT and materials sectors, with additions in consumer discretionary and consumer staples as well. The biggest reduction was in the financials sector, largely with respect to banks and insurance. Industrials exposure declined as well. |
Describe portfolio positioning at period end.
| • | | Relative to the Russell 1000® Value Index, the Portfolio ended the period with its largest sector overweights in consumer discretionary, health care and IT. The most significant underweights were utilities and financials (predominantly due to absence in real estate investment trusts). |
The views expressed reflect the opinions of BlackRock as of the date of this report and are subject to change based on changes in market, economic or other conditions. These views are not intended to be a forecast of future events and are no guarantee of future results.
| | | | | | |
| 10 | | BLACKROCK LARGE CAP SERIES FUNDS, INC. | | MARCH 31, 2016 | | |
| | | | |
| | | | BlackRock Large Cap Value Retirement Portfolio | |
|
| Total Return Based on a $10,000 Investment |
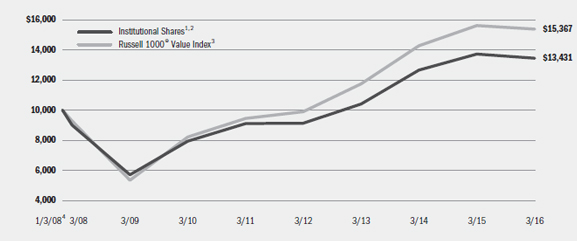
| | 1 | Assuming transaction costs and other operating expenses, including administration fees, if any. |
| | 2 | The Fund invests all of its assets in the Portfolio, a series of Master Large Cap Series LLC. The Portfolio invests at least 80% of its assets in equity securities, primarily common stock, of large cap companies located in the United States that the investment advisor selects from among those that are, at the time of purchase, included in the Russell 1000® Value Index. |
| | 3 | An unmanaged index that is a subset of the Russell 1000® Index that consists of those Russell 1000® securities with lower price-to-book ratios and lower forecasted growth values. |
| | 4 | Commencement of operations. |
| | | | | | | | |
| Performance Summary for the Period Ended March 31, 2016 |
| | | | | | | | | | | | | | | | | | | | |
| | | | | Average Annual Total Returns5 |
| | | 6-Month
Total Returns | | 1 Year | | 5 Years | | Since
Inception6 |
Institutional | | | | 4.34 | % | | | | (2.03 | )% | | | | 8.09 | % | | | | 3.64 | % |
Russell 1000® Value Index | | | | 7.37 | | | | | (1.54 | ) | | | | 10.25 | | | | | 5.35 | |
| | 5 | | See “About Fund Performance” on page 12 for a detailed description of the share class, including any related sales charges and fees. |
| | 6 | | The Fund commenced operations on January 3, 2008. |
| | | | Past performance is not indicative of future results. |
| | | | | | | | | | | | | | | | | | | | | | | | | | | | | | | | | | | |
| | | Actual | | Hypothetical8 | | |
| | | Beginning
Account Value
October 1, 2015 | | Ending
Account Value
March 31, 2016 | | Expenses Paid
During the Period7 | | Beginning
Account Value
October 1, 2015 | | Ending
Account Value
March 31, 2016 | | Expenses Paid
During the Period7 | | Annualized
Expense
Ratio |
Institutional | | | $ | 1,000.00 | | | | $ | 1,043.40 | | | | $ | 3.42 | | | | $ | 1,000.00 | | | | $ | 1,021.65 | | | | $ | 3.39 | | | | | 0.67 | % |
| | 7 | | Expenses are equal to the Fund’s annualized expense ratio, multiplied by the average account value over the period, multiplied by 183/366 (to reflect the one-half year period shown). Because the Fund invests all of its assets in the Portfolio, the expense example reflects the net expenses of both the Fund and the Portfolio in which it invests. |
| | 8 | | Hypothetical 5% annual return before expenses is calculated by pro rating the number of days in the most recent fiscal half year divided by 366. |
| | | | See “Disclosure of Expenses” on page 12 for further information on how expenses were calculated. |
| | | | | | |
| | | BLACKROCK LARGE CAP SERIES FUNDS, INC. | | MARCH 31, 2016 | | 11 |
| | | | |
| About Fund Performance | | | BlackRock Large Cap Series Funds, Inc. | |
| • | | Institutional Shares are not subject to any sales charge. These shares bear no ongoing distribution or service fees and are available only to certain eligible investors. |
| • | | Service Shares are not subject to any sales charge. These shares are subject to a service fee of 0.25% per year (but no distribution fee) and are available only to certain eligible investors. Service Share performance results for BlackRock Large Cap Growth Fund and BlackRock Large Cap Value Fund, prior to October 2, 2006, and for BlackRock Large Cap Core Fund, prior to September 24, 2007, are those of the applicable Fund’s Institutional Shares (which have no distribution or service fees) restated to reflect the Service Share fees. |
| • | | Investor A Shares are subject to a maximum initial sales charge (front-end load) of 5.25% and a service fee of 0.25% per year (but no distribution fee). Certain redemptions of these shares may be subject to a contingent deferred sales charge (“CDSC”) where no initial sales charge was paid at the time of purchase. These shares are generally available through financial intermediaries. |
| • | | Investor B Shares are subject to a maximum CDSC of 4.50%, declining to 0% after six years. In addition, these shares are subject to a distribution fee of 0.75% per year and a service fee of 0.25% per year. These shares automatically convert to Investor A Shares after approximately eight years. (There is no initial sales charge for automatic share conversions.) All returns for periods greater than eight years reflect this conversion. These shares are only available through exchanges and distribution reinvestments by current holders and for purchase by certain employer-sponsored retirement plans. |
| • | | Investor C Shares are subject to a 1.00% CDSC if redeemed within one year of purchase. In addition, these shares are subject to a distribution fee of 0.75% per year and a service fee of 0.25% per year. These shares are generally available through financial intermediaries. |
| • | | Class R Shares are not subject to any sales charge. These shares are subject to a distribution fee of 0.25% per year and a service fee of 0.25% per year. These shares are available only to certain employer-sponsored retirement plans. |
Performance information reflects past performance and does not guarantee future results. Current performance may be lower or higher than the performance data quoted. Refer to www.blackrock.com/funds to obtain performance data current to the most recent month end. Performance results do not reflect the deduction of taxes that a shareholder would pay on Fund distributions or the redemption of Fund shares. Figures shown in the performance tables on the previous pages assume reinvestment of all distributions, if any, at net asset value (“NAV”) on the ex-dividend date. Investment return and principal value of shares will fluctuate so that shares, when redeemed, may be worth more or less than their original cost. Distributions paid to each class of shares will vary because of the different levels of service, distribution and transfer agency fees applicable to each class, which are deducted from the income available to be paid to shareholders.
BlackRock Advisors, LLC (“the Administrator”), the administrator of BlackRock Large Cap Core Fund, BlackRock Large Cap Growth Fund and BlackRock Large Cap Value Retirement Portfolio, has contractually agreed to waive and/or reimburse a portion of each Fund’s expenses. Without such waiver and/or reimbursement, each Fund’s performance would have been lower. The Administrator is under no obligation to waive and/or reimburse or continue waiving and/or reimbursing its fees after the applicable termination date of such agreement. See Note 4 of the Notes to Financial Statements for additional information on waivers and/or reimbursements.
Shareholders of each Fund may incur the following charges: (a) transactional expenses, such as sales charges and (b) operating expenses, including administration, service and distribution fees, including 12b-1 fees, and other fund expenses. The expense examples shown on previous pages (which are based on a hypothetical investment of $1,000 invested on October 1, 2015 and held through March 31, 2016) are intended to assist shareholders both in calculating expenses based on an investment in each Fund and in comparing these expenses with similar costs of investing in other mutual funds.
The expense examples on the previous pages provide information about actual account values and actual expenses. In order to estimate the expenses a shareholder paid during the period covered by this report, shareholders can divide their account value by $1,000 and then multiply the result by the number corresponding to their Fund and share class under the heading entitled “Expenses Paid During the Period.”
The expense examples also provide information about hypothetical account values and hypothetical expenses based on each Fund’s actual expense ratio and an assumed rate of return of 5% per year before expenses. In order to assist shareholders in comparing the ongoing expenses of investing in these Funds and other funds, compare the 5% hypothetical example with the 5% hypothetical examples that appear in shareholder reports of other funds.
The expenses shown in the expense examples are intended to highlight shareholders’ ongoing costs only and do not reflect any transactional expenses, such as sales charges or exchange fees, if any. Therefore, the hypothetical examples are useful in comparing ongoing expenses only, and will not help shareholders determine the relative total expenses of owning different funds. If these transactional expenses were included, shareholder expenses would have been higher.
| | |
| Derivative Financial Instruments | | |
Master Large Cap Core Portfolio, Master Large Cap Growth Portfolio and Master Large Cap Value Portfolio (the “Portfolios”) may invest in various derivative financial instruments. These instruments are used to obtain exposure to a security, commodity, index, market and/or other asset without owning or taking physical custody of securities commodities and/or other referenced assets or to manage market, equity, credit, interest rate, foreign currency exchange rate, commodity and/or other risks. Derivative financial instruments may give rise to a form of economic leverage and involve risks, including the imperfect correlation between the value of a derivative financial instrument
and the underlying asset, possible default of the counterparty to the transaction or illiquidity of the instrument. The Portfolio’s successful use of a derivative financial instrument depends on the investment advisor’s ability to predict pertinent market movements accurately, which cannot be assured. The use of these instruments may result in losses greater than if they had not been used, may limit the amount of appreciation a Portfolio can realize on an investment and/or may result in lower distributions paid to shareholders. The Funds’ investments in these instruments are discussed in detail in the Notes to Financial Statements.
| | | | | | |
| 12 | | BLACKROCK LARGE CAP SERIES FUNDS, INC. | | MARCH 31, 2016 | | |
| | | | |
| Statements of Assets and Liabilities | | | BlackRock Large Cap Series Funds, Inc. | |
| | | | | | | | | | | | | | | | |
| March 31, 2016 (Unaudited) | | BlackRock
Large Cap
Core Fund | | | BlackRock
Large Cap
Growth Fund | | | BlackRock Large Cap Value Fund | | | BlackRock
Large Cap
Value
Retirement
Portfolio | |
| | | | | | | | | | | | | | | | |
| Assets | | | | | | | | | | | | | | | | |
Investments at value — from the applicable Portfolio1 | | $ | 1,603,062,465 | | | $ | 1,146,320,113 | | | $ | 677,404,743 | | | $ | 162,518,724 | |
Receivables: | | | | | | | | | | | | | | | | |
Capital shares sold | | | 1,210,199 | | | | 739,678 | | | | 883,767 | | | | 94,292 | |
From the Administrator | | | 108,367 | | | | 191,774 | | | | — | | | | 8,320 | |
Withdrawals from the Portfolio | | | 669,306 | | | | 525,875 | | | | 367,861 | | | | 308,597 | |
Prepaid expenses | | | 60,765 | | | | 66,697 | | | | 57,736 | | | | 7,006 | |
| | | | |
Total assets | | | 1,605,111,102 | | | | 1,147,844,137 | | | | 678,714,107 | | | | 162,936,939 | |
| | | | |
| | | | | | | | | | | | | | | | |
| Liabilities | | | | | | | | | | | | | | | | |
Payables: | | | | | | | | | | | | | | | | |
Administration fees | | | 333,533 | | | | 236,894 | | | | 113,383 | | | | — | |
Capital shares redeemed | | | 1,879,505 | | | | 1,265,553 | | | | 1,251,628 | | | | 402,889 | |
Officer’s fees | | | 1,692 | | | | 1,064 | | | | 772 | | | | 153 | |
Other accrued expenses | | | 8,183 | | | | 6,728 | | | | 6,096 | | | | 2,200 | |
Other affiliates | | | 25,481 | | | | — | | | | 11,469 | | | | 34 | |
Printing fees | | | 43,671 | | | | 27,488 | | | | 17,831 | | | | 5,036 | |
Professional fees | | | 29,560 | | | | 18,310 | | | | 23,202 | | | | 9,866 | |
Service and distribution fees | | | 466,500 | | | | 284,340 | | | | 221,590 | | | | — | |
Transfer agent fees | | | 841,332 | | | | 378,032 | | | | 301,087 | | | | 66,953 | |
| | | | |
Total liabilities | | | 3,629,457 | | | | 2,218,409 | | | | 1,947,058 | | | | 487,131 | |
| | | | |
Net Assets | | $ | 1,601,481,645 | | | $ | 1,145,625,728 | | | $ | 676,767,049 | | | $ | 162,449,808 | |
| | | | |
| | | | | | | | | | | | | | | | |
| Net Assets Consist of | | | | | | | | | | | | | | | | |
Paid-in capital | | $ | 1,261,320,912 | | | $ | 859,793,241 | | | $ | 1,087,054,484 | | | $ | 143,207,115 | |
Undistributed net investment income | | | 3,255,939 | | | | 1,935,530 | | | | 2,380,325 | | | | 572,220 | |
Accumulated net realized gain (loss) allocated from the Portfolio | | | 3,160,627 | | | | 26,401,316 | | | | (565,811,243 | ) | | | 11,225,197 | |
Net unrealized appreciation (depreciation) allocated from the Portfolio | | | 333,744,167 | | | | 257,495,641 | | | | 153,143,483 | | | | 7,445,276 | |
| | | | |
Net Assets | | $ | 1,601,481,645 | | | $ | 1,145,625,728 | | | $ | 676,767,049 | | | $ | 162,449,808 | |
| | | | |
1 Investments at cost | | $ | 1,269,318,298 | | | $ | 888,824,472 | | | $ | 524,261,260 | | | $ | 155,073,448 | |
See Notes to Financial Statements.
| | | | | | |
| | | BLACKROCK LARGE CAP SERIES FUNDS, INC. | | MARCH 31, 2016 | | 13 |
| | | | |
| Statements of Assets and Liabilities (concluded) | | | BlackRock Large Cap Series Funds, Inc. | |
| | | | | | | | | | | | | | | | |
| March 31, 2016 (Unaudited) | | BlackRock
Large Cap
Core Fund | | | BlackRock
Large Cap
Growth Fund | | | BlackRock
Large Cap
Value Fund | | | BlackRock
Large Cap
Value
Retirement
Portfolio | |
| | | | | | | | | | | | | | | | |
| Net Asset Value | | | | | | | | | | | | | | | | |
Institutional | | | | | | | | | | | | | | | | |
Net assets | | $ | 456,766,267 | | | $ | 371,017,927 | | | $ | 166,859,239 | | | $ | 162,449,808 | |
| | | | |
Shares outstanding, $0.10 par value2 | | | 25,831,216 | | | | 26,738,209 | | | | 7,498,537 | | | | 8,971,689 | |
| | | | |
Net asset value | | $ | 17.68 | | | $ | 13.88 | | | $ | 22.25 | | | $ | 18.11 | |
| | | | |
Service | | | | | | | | | | | | | | | | |
Net assets | | $ | 1,173,767 | | | $ | 1,670,903 | | | $ | 11,833,147 | | | | — | |
| | | | |
Shares outstanding, $0.10 par value3 | | | 66,823 | | | | 120,898 | | | | 535,257 | | | | — | |
| | | | |
Net asset value | | $ | 17.57 | | | $ | 13.82 | | | $ | 22.11 | | | | — | |
| | | | |
Investor A | | | | | | | | | | | | | | | | |
Net assets | | $ | 757,263,215 | | | $ | 555,213,044 | | | $ | 292,845,801 | | | | — | |
| | | | |
Shares outstanding, $0.10 par value4 | | | 43,894,914 | | | | 41,970,245 | | | | 13,412,742 | | | | — | |
| | | | |
Net asset value | | $ | 17.25 | | | $ | 13.23 | | | $ | 21.83 | | | | — | |
| | | | |
Investor B | | | | | | | | | | | | | | | | |
Net assets | | $ | 4,326,923 | | | $ | 922,132 | | | $ | 1,794,599 | | | | — | |
| | | | |
Shares outstanding, $0.10 par value5 | | | 273,767 | | | | 79,722 | | | | 87,844 | | | | — | |
| | | | |
Net asset value | | $ | 15.81 | | | $ | 11.57 | | | $ | 20.43 | | | | — | |
| | | | |
Investor C | | | | | | | | | | | | | | | | |
Net assets | | $ | 345,883,011 | | | $ | 193,199,541 | | | $ | 167,177,623 | | | | — | |
| | | | |
Shares outstanding, $0.10 par value6 | | | 22,201,649 | | | | 16,894,587 | | | | 8,245,819 | | | | — | |
| | | | |
Net asset value | | $ | 15.58 | | | $ | 11.44 | | | $ | 20.27 | | | | — | |
| | | | |
Class R | | | | | | | | | | | | | | | | |
Net assets | | $ | 36,068,462 | | | $ | 23,602,181 | | | $ | 36,256,640 | | | | — | |
| | | | |
Shares outstanding, $0.10 par value7 | | | 2,187,117 | | | | 1,893,828 | | | | 1,724,140 | | | | — | |
| | | | |
Net asset value | | $ | 16.49 | | | $ | 12.46 | | | $ | 21.03 | | | | — | |
| | | | |
2 Shares Authorized — Institutional | | | 400 million | | | | 100 million | | | | 400 million | | | | 200 million | |
3 Shares Authorized — Service | | | 50 million | | | | 50 million | | | | 50 million | | | | — | |
4 Shares Authorized — Investor A | | | 300 million | | | | 100 million | | | | 400 million | | | | — | |
5 Shares Authorized — Investor B | | | 200 million | | | | 200 million | | | | 200 million | | | | — | |
6 Shares Authorized — Investor C | | | 400 million | | | | 100 million | | | | 400 million | | | | — | |
7 Shares Authorized — Class R | | | 200 million | | | | 200 million | | | | 200 million | | | | — | |
See Notes to Financial Statements.
| | | | | | |
| 14 | | BLACKROCK LARGE CAP SERIES FUNDS, INC. | | MARCH 31, 2016 | | |
| | | | |
| Statements of Operations | | | BlackRock Large Cap Series Funds, Inc. | |
| | | | | | | | | | | | | | | | |
| Six Months Ended March 31, 2016 (Unaudited) | | BlackRock
Large Cap
Core Fund | | | BlackRock
Large Cap
Growth Fund | | | BlackRock
Large Cap
Value Fund | | | BlackRock
Large Cap
Value
Retirement
Portfolio | |
| | | | | | | | | | | | | | | | |
| Investment Income | | | | | | | | | | | | | | | | |
Net investment income allocated from the applicable Portfolio: | | | | | | | | | | | | | | | | |
Dividends — unaffiliated | | $ | 13,515,316 | | | $ | 7,926,549 | | | $ | 6,955,449 | | | $ | 1,603,244 | |
Dividends — affiliated | | | 52,915 | | | | 44,800 | | | | 23,201 | | | | 5,247 | |
Securities lending — affiliated — net | | | 5,375 | | | | 135,429 | | | | 13,256 | | | | 3,131 | |
Foreign taxes withheld | | | (91,108 | ) | | | (28,707 | ) | | | (51,833 | ) | | | (12,123 | ) |
Expenses | | | (4,075,169 | ) | | | (3,012,089 | ) | | | (1,869,460 | ) | | | (430,044 | ) |
Fees waived | | | 12,610 | | | | 11,355 | | | | 8,043 | | | | 1,828 | |
| | | | |
Total income | | | 9,419,939 | | | | 5,077,337 | | | | 5,078,656 | | | | 1,171,283 | |
| | | | |
| | | | | | | | | | | | | | | | |
| Fund Expenses | | | | | | | | | | | | | | | | |
Service and distribution — class specific | | | 2,848,717 | | | | 1,725,272 | | | | 1,377,798 | | | | — | |
Administration | | | 2,032,078 | | | | 1,408,369 | | | | 868,200 | | | | — | |
Transfer agent — class specific | | | 1,581,313 | | | | 1,025,490 | | | | 560,234 | | | | 103,551 | |
Registration | | | 70,768 | | | | 39,183 | | | | 25,110 | | | | 23,825 | |
Printing | | | 33,015 | | | | 23,286 | | | | 15,536 | | | | 5,391 | |
Professional | | | 23,736 | | | | 19,336 | | | | 16,591 | | | | 18,480 | |
Officer | | | 564 | | | | 355 | | | | 258 | | | | 51 | |
Miscellaneous | | | 8,957 | | | | 8,654 | | | | 8,219 | | | | 4,177 | |
| | | | |
Total expenses | | | 6,599,148 | | | | 4,249,945 | | | | 2,871,946 | | | | 155,475 | |
Less: | | | | | | | | | | | | | | | | |
Fees waived and/or reimbursed by the Administrator | | | — | | | | — | | | | (173,640 | ) | | | — | |
Transfer agent fees reimbursed — class specific | | | (435,252 | ) | | | (570,532 | ) | | | — | | | | (49,616 | ) |
| | | | |
Total expenses after fees waived and/or reimbursed | | | 6,163,896 | | | | 3,679,413 | | | | 2,698,306 | | | | 105,859 | |
| | | | |
Net investment income | | | 3,256,043 | | | | 1,397,924 | | | | 2,380,350 | | | | 1,065,424 | |
| | | | |
| | | | | | | | | | | | | | | | |
| Realized and Unrealized Gain (Loss) Allocated from the Applicable Portfolio | | | | | | | | | | | | | | | | |
Net realized gain from futures contracts and investments | | | 18,458,423 | | | | 36,460,580 | | | | 8,684,523 | | | | 2,033,553 | |
Net change in unrealized appreciation (depreciation) on investments | | | 54,567,229 | | | | 48,905,114 | | | | 12,158,895 | | | | 3,558,791 | |
| | | | |
Total realized and unrealized gain | | | 73,025,652 | | | | 85,365,694 | | | | 20,843,418 | | | | 5,592,344 | |
| | | | |
Net Increase in Net Assets Resulting from Operations | | $ | 76,281,695 | | | $ | 86,763,618 | | | $ | 23,223,768 | | | $ | 6,657,768 | |
| | | | |
See Notes to Financial Statements.
| | | | | | |
| | | BLACKROCK LARGE CAP SERIES FUNDS, INC. | | MARCH 31, 2016 | | 15 |
| | | | |
| Statements of Changes in Net Assets | | | BlackRock Large Cap Series Funds, Inc. | |
| | | | | | | | | | | | | | | | |
| | | BlackRock
Large Cap Core Fund | | | BlackRock
Large Cap Growth Fund | |
| Increase (Decrease) in Net Assets: | | Six Months Ended
March 31, 2016
(Unaudited) | | | Year Ended
September 30,
2015 | | | Six Months Ended
March 31, 2016
(Unaudited) | | | Year Ended
September 30,
2015 | |
| | | | | | | | | | | | | | | | |
| Operations | | | | | | | | | | | | | | | | |
Net investment income | | $ | 3,256,043 | | | $ | 5,797,684 | | | $ | 1,397,924 | | | $ | 1,743,837 | |
Net realized gain | | | 18,458,423 | | | | 106,732,791 | | | | 36,460,580 | | | | 59,523,289 | |
Net change in unrealized appreciation (depreciation) | | | 54,567,229 | | | | (134,894,776 | ) | | | 48,905,114 | | | | (46,726,026 | ) |
| | | | | | | | |
Net increase (decrease) in net assets resulting from operations | | | 76,281,695 | | | | (22,364,301 | ) | | | 86,763,618 | | | | 14,541,100 | |
| | | | | | | | |
| | | | | | | | | | | | | | | | |
| Distributions to Shareholders1 | | | | | | | | | | | | | | | | |
From net investment income: | | | | | | | | | | | | | | | | |
Institutional | | | (3,012,948 | ) | | | (2,772,492 | ) | | | (1,090,221 | ) | | | (970,748 | ) |
Service | | | (3,553 | ) | | | (3,118 | ) | | | — | | | | (1,738 | ) |
Investor A | | | (2,854,302 | ) | | | (2,750,357 | ) | | | (182,655 | ) | | | (372,889 | ) |
Investor C | | | — | | | | (24 | ) | | | — | | | | — | |
Class R | | | (36,755 | ) | | | — | | | | — | | | | — | |
From net realized gain: | | | | | | | | | | | | | | | | |
Institutional | | | (11,403,532 | ) | | | — | | | | (16,535,208 | ) | | | (44,583,980 | ) |
Service | | | (27,834 | ) | | | — | | | | (76,820 | ) | | | (221,822 | ) |
Investor A | | | (19,217,800 | ) | | | — | | | | (26,747,707 | ) | | | (63,450,782 | ) |
Investor B | | | (152,904 | ) | | | — | | | | (64,793 | ) | | | (339,605 | ) |
Investor C | | | (9,895,680 | ) | | | — | | | | (10,917,511 | ) | | | (25,959,863 | ) |
Class R | | | (998,533 | ) | | | — | | | | (1,158,508 | ) | | | (2,951,170 | ) |
| | | | | | | | |
Decrease in net assets resulting from distributions to shareholders | | | (47,603,841 | ) | | | (5,525,991 | ) | | | (56,773,423 | ) | | | (138,852,597 | ) |
| | | | | | | | |
| | | | | | | | | | | | | | | | |
| Capital Share Transactions | | | | | | | | | | | | | | | | |
Net increase (decrease) in net assets derived from capital share transactions | | | (35,880,211 | ) | | | (129,587,233 | ) | | | 32,990,877 | | | | 96,763,011 | |
| | | | | | | | |
| | | | | | | | | | | | | | | | |
| Net Assets | | | | | | | | | | | | | | | | |
Total increase (decrease) in net assets | | | (7,202,357 | ) | | | (157,477,525 | ) | | | 62,981,072 | | | | (27,548,486 | ) |
Beginning of period | | | 1,608,684,002 | | | | 1,766,161,527 | | | | 1,082,644,656 | | | | 1,110,193,142 | |
| | | | | | | | |
End of period | | $ | 1,601,481,645 | | | $ | 1,608,684,002 | | | $ | 1,145,625,728 | | | $ | 1,082,644,656 | |
| | | | | | | | |
Undistributed net investment income, end of period | | $ | 3,255,939 | | | $ | 5,907,454 | | | $ | 1,935,530 | | | $ | 1,810,482 | |
| | | | | | | | |
| | 1 | | Distributions for annual periods determined in accordance with federal income tax regulations. |
See Notes to Financial Statements.
| | | | | | |
| 16 | | BLACKROCK LARGE CAP SERIES FUNDS, INC. | | MARCH 31, 2016 | | |
| | | | |
| Statements of Changes in Net Assets (concluded) | | | BlackRock Large Cap Series Funds, Inc. | |
| | | | | | | | | | | | | | | | |
| | | BlackRock
Large Cap Value Fund | | | BlackRock
Large Cap Value Retirement Portfolio | |
| Increase (Decrease) in Net Assets: | | Six Months Ended
March 31, 2016
(Unaudited) | | | Year Ended
September 30,
2015 | | | Six Months Ended
March 31, 2016
(Unaudited) | | | Year Ended
September 30,
2015 | |
| | | | | | | | | | | | | | | | |
| Operations | | | | | | | | | | | | | | | | |
Net investment income | | $ | 2,380,350 | | | $ | 4,294,937 | | | $ | 1,065,424 | | | $ | 2,000,748 | |
Net realized gain | | | 8,684,523 | | | | 63,381,294 | | | | 2,033,553 | | | | 9,220,682 | |
Net change in unrealized appreciation (depreciation) | | | 12,158,895 | | | | (80,328,628 | ) | | | 3,558,791 | | | | (13,808,045 | ) |
| | | | | | | | |
Net increase (decrease) in net assets resulting from operations | | | 23,223,768 | | | | (12,652,397 | ) | | | 6,657,768 | | | | (2,586,615 | ) |
| | | | | | | | |
| | | | | | | | | | | | | | | | |
| Distributions to Shareholders1 | | | | | | | | | | | | | | | | |
From net investment income: | | | | | | | | | | | | | | | | |
Institutional | | | (1,756,581 | ) | | | (2,056,551 | ) | | | (2,100,002 | ) | | | (1,916,633 | ) |
Service | | | (85,689 | ) | | | (108,934 | ) | | | — | | | | — | |
Investor A | | | (2,234,771 | ) | | | (2,671,957 | ) | | | — | | | | — | |
Investor C | | | (55,930 | ) | | | (143,899 | ) | | | — | | | | — | |
Class R | | | (161,972 | ) | | | (215,177 | ) | | | — | | | | — | |
From net realized gains: | | | | | | | | | | | | | | | | |
Institutional | | | — | | | | — | | | | (8,933,243 | ) | | | (16,604,930 | ) |
| | | | | | | | |
Decrease in net assets resulting from distributions to shareholders | | | (4,294,943 | ) | | | (5,196,518 | ) | | | (11,033,245 | ) | | | (18,521,563 | ) |
| | | | | | | | |
| | | | | | | | | | | | | | | | |
| Capital Share Transactions | | | | | | | | | | | | | | | | |
Net increase (decrease) in net assets derived from capital share transactions | | | (23,119,056 | ) | | | (106,811,342 | ) | | | 11,502,701 | | | | 16,565,845 | |
| | | | | | | | |
| | | | | | | | | | | | | | | | |
| Net Assets | | | | | | | | | | | | | | | | |
Total increase (decrease) in net assets | | | (4,190,231 | ) | | | (124,660,257 | ) | | | 7,127,224 | | | | (4,542,333 | ) |
Beginning of period | | | 680,957,280 | | | | 805,617,537 | | | | 155,322,584 | | | | 159,864,917 | |
| | | | | | | | |
End of period | | $ | 676,767,049 | | | $ | 680,957,280 | | | $ | 162,449,808 | | | $ | 155,322,584 | |
| | | | | | | | |
Undistributed net investment income, end of period | | $ | 2,380,325 | | | $ | 4,294,918 | | | $ | 572,220 | | | $ | 1,606,798 | |
| | | | | | | | |
| | 1 | | Distributions for annual periods determined in accordance with federal income tax regulations. |
See Notes to Financial Statements.
| | | | | | |
| | | BLACKROCK LARGE CAP SERIES FUNDS, INC. | | MARCH 31, 2016 | | 17 |
| | | | |
| Financial Highlights | | | BlackRock Large Cap Core Fund | |
| | | | | | | | | | | | | | | | | | | | | | | | |
| | | Institutional | |
| | | Six Months
Ended
March 31,
2016 | | | Year Ended September 30, | |
| | | (Unaudited) | | | 2015 | | | 2014 | | | 2013 | | | 2012 | | | 2011 | |
Per Share Operating Performance | | | | | | | | | | | | | | | | | | | | | | | | |
Net asset value, beginning of period | | $ | 17.36 | | | $ | 17.68 | | | $ | 14.85 | | | $ | 12.64 | | | $ | 9.84 | | | $ | 10.11 | |
| | | | |
Net investment income1 | | | 0.07 | | | | 0.13 | | | | 0.12 | | | | 0.12 | | | | 0.16 | | | | 0.07 | |
Net realized and unrealized gain (loss) | | | 0.81 | | | | (0.35 | ) | | | 2.71 | | | | 2.36 | | | | 2.73 | | | | (0.28 | ) |
| | | | |
Net increase (decrease) from investment operations | | | 0.88 | | | | (0.22 | ) | | | 2.83 | | | | 2.48 | | | | 2.89 | | | | (0.21 | ) |
| | | | |
Distributions:2 | | | | | | | | | | | | | | | | | | | | | | | | |
From net investment income | | | (0.12 | ) | | | (0.10 | ) | | | — | | | | (0.27 | ) | | | (0.09 | ) | | | (0.06 | ) |
From net realized gain | | | (0.44 | ) | | | — | | | | — | | | | — | | | | — | | | | — | |
| | | | |
Total distributions | | | (0.56 | ) | | | (0.10 | ) | | | — | | | | (0.27 | ) | | | (0.09 | ) | | | (0.06 | ) |
| | | | |
Net asset value, end of period | | $ | 17.68 | | | $ | 17.36 | | | $ | 17.68 | | | $ | 14.85 | | | $ | 12.64 | | | $ | 9.84 | |
| | | | |
| | | | | | | | | | | | | | | | | | | | | | | | |
Total Return3 | | | | | | | | | | | | | | | | | | | | | | | | |
Based on net asset value | | | 5.04 | %4 | | | (1.25 | )% | | | 19.06 | % | | | 20.00 | % | | | 29.55 | % | | | (2.16 | )% |
| | | | |
| | | | | | | | | | | | | | | | | | | | | | | | |
Ratios to Average Net Assets5 | | | | | | | | | | | | | | | | | | | | | | | | |
Total expenses | | | 0.88 | %6,7 | | | 0.87 | %6 | | | 0.88 | %6 | | | 0.88 | %6 | | | 0.77 | %6,8 | | | 1.05 | %6 |
| | | | |
Total expenses after fees waived and/or reimbursed | | | 0.88 | %6,7 | | | 0.87 | %6 | | | 0.87 | %6 | | | 0.88 | %6 | | | 0.77 | %6,8 | | | 1.05 | %6 |
| | | | |
Net investment income | | | 0.78 | %6,7 | | | 0.72 | %6 | | | 0.70 | %6 | | | 0.90 | %6 | | | 1.41 | %6,8 | | | 0.58 | %6 |
| | | | |
| | | | | | | | | | | | | | | | | | | | | | | | |
Supplemental Data | | | | | | | | | | | | | | | | | | | | | | | | |
Net assets, end of period (000) | | $ | 456,766 | | | $ | 458,589 | | | $ | 503,035 | | | $ | 527,236 | | | $ | 513,245 | | | $ | 489,847 | |
| | | | |
Portfolio turnover rate of the Portfolio | | | 19 | % | | | 41 | % | | | 40 | % | | | 50 | % | | | 128 | % | | | 129 | % |
| | | | |
| | 1 | | Based on average shares outstanding. |
| | 2 | | Distributions for annual periods determined in accordance with federal income tax regulations. |
| | 3 | | Where applicable, assumes the reinvestment of distributions. |
| | 4 | | Aggregate total return. |
| | 5 | | Includes the Fund’s share of the Portfolio’s allocated expenses and/or net investment income. |
| | 6 | | Includes the Fund’s share of the Portfolio’s allocated fees waived of less than 0.01%. |
| | 8 | | Includes a non-recurring expense adjustment, which impacted the ratios for total expenses, total expenses after fees waived and/or reimbursed and net investment income. Excluding this adjustment, the ratios would have been 0.90%, 0.90% and 1.28%, respectively. |
See Notes to Financial Statements.
| | | | | | |
| 18 | | BLACKROCK LARGE CAP SERIES FUNDS, INC. | | MARCH 31, 2016 | | |
| | | | |
| Financial Highlights (continued) | | | BlackRock Large Cap Core Fund | |
| | | | | | | | | | | | | | | | | | | | | | | | |
| | | Service | |
| | | Six Months
Ended
March 31,
2016 | | | Year Ended September 30, | |
| | | (Unaudited) | | | 2015 | | | 2014 | | | 2013 | | | 2012 | | | 2011 | |
Per Share Operating Performance | | | | | | | | | | | | | | | | | | | | | | | | |
Net asset value, beginning of period | | $ | 17.22 | | | $ | 17.55 | | | $ | 14.78 | | | $ | 12.39 | | | $ | 9.60 | | | $ | 9.89 | |
| | | | |
Net investment income1 | | | 0.04 | | | | 0.07 | | | | 0.06 | | | | 0.07 | | | | 0.11 | | | | 0.04 | |
Net realized and unrealized gain (loss) | | | 0.81 | | | | (0.35 | ) | | | 2.71 | | | | 2.33 | | | | 2.68 | | | | (0.27 | ) |
| | | | |
Net increase (decrease) from investment operations | | | 0.85 | | | | (0.28 | ) | | | 2.77 | | | | 2.40 | | | | 2.79 | | | | (0.23 | ) |
| | | | |
Distributions:2 | | | | | | | | | | | | | | | | | | | | | | | | |
From net investment income | | | (0.06 | ) | | | (0.05 | ) | | | — | | | | (0.01 | ) | | | — | | | | (0.06 | ) |
From net realized gain | | | (0.44 | ) | | | — | | | | — | | | | — | | | | — | | | | — | |
| | | | |
Total distributions | | | (0.50 | ) | | | (0.05 | ) | | | — | | | | (0.01 | ) | | | — | | | | (0.06 | ) |
| | | | |
Net asset value, end of period | | $ | 17.57 | | | $ | 17.22 | | | $ | 17.55 | | | $ | 14.78 | | | $ | 12.39 | | | $ | 9.60 | |
| | | | |
| | | | | | | | | | | | | | | | | | | | | | | | |
Total Return3 | | | | | | | | | | | | | | | | | | | | | | | | |
Based on net asset value | | | 4.91 | %4 | | | (1.61 | )% | | | 18.74 | % | | | 19.42 | % | | | 29.06 | % | | | (2.41 | )% |
| | | | |
| | | | | | | | | | | | | | | | | | | | | | | | |
Ratios to Average Net Assets5 | | | | | | | | | | | | | | | | | | | | | | | | |
Total expenses | | | 1.21 | %6,7 | | | 1.21 | %6 | | | 1.20 | %6 | | | 1.20 | %6 | | | 1.05 | %6 | | | 1.25 | %6 |
| | | | |
Total expenses after fees waived and/or reimbursed | | | 1.21 | %6,7 | | | 1.21 | %6 | | | 1.20 | %6 | | | 1.20 | %6 | | | 1.05 | %6 | | | 1.25 | %6 |
| | | | |
Net investment income | | | 0.46 | %6,7 | | | 0.39 | %6 | | | 0.38 | %6 | | | 0.55 | %6 | | | 0.96 | %6 | | | 0.39 | %6 |
| | | | |
| | | | | | | | | | | | | | | | | | | | | | | | |
Supplemental Data | | | | | | | | | | | | | | | | | | | | | | | | |
Net assets, end of period (000) | | $ | 1,174 | | | $ | 1,085 | | | $ | 1,096 | | | $ | 968 | | | $ | 1,578 | | | $ | 270 | |
| | | | |
Portfolio turnover rate of the Portfolio | | | 19 | % | | | 41 | % | | | 40 | % | | | 50 | % | | | 128 | % | | | 129 | % |
| | | | |
| | 1 | | Based on average shares outstanding. |
| | 2 | | Distributions for annual periods determined in accordance with federal income tax regulations. |
| | 3 | | Where applicable, assumes the reinvestment of distributions. |
| | 4 | | Aggregate total return. |
| | 5 | | Includes the Fund’s share of the Portfolio’s allocated expenses and/or net investment income. |
| | 6 | | Includes the Fund’s share of the Portfolio’s allocated fees waived of less than 0.01%. |
See Notes to Financial Statements.
| | | | | | |
| | | BLACKROCK LARGE CAP SERIES FUNDS, INC. | | MARCH 31, 2016 | | 19 |
| | | | |
| Financial Highlights (continued) | | | BlackRock Large Cap Core Fund | |
| | | | | | | | | | | | | | | | | | | | | | | | |
| | | Investor A | |
| | | Six Months
Ended
March 31,
2016 | | | Year Ended September 30, | |
| | | (Unaudited) | | | 2015 | | | 2014 | | | 2013 | | | 2012 | | | 2011 | |
Per Share Operating Performance | | | | | | | | | | | | | | | | | | | | | | | | |
Net asset value, beginning of period | | $ | 16.93 | | | $ | 17.24 | | | $ | 14.52 | | | $ | 12.34 | | | $ | 9.61 | | | $ | 9.88 | |
| | | | |
Net investment income1 | | | 0.04 | | | | 0.08 | | | | 0.07 | | | | 0.09 | | | | 0.12 | | | | 0.06 | |
Net realized and unrealized gain (loss) | | | 0.79 | | | | (0.33 | ) | | | 2.65 | | | | 2.30 | | | | 2.65 | | | | (0.28 | ) |
| | | | |
Net increase (decrease) from investment operations | | | 0.83 | | | | (0.25 | ) | | | 2.72 | | | | 2.39 | | | | 2.77 | | | | (0.22 | ) |
| | | | |
Distributions:2 | | | | | | | | | | | | | | | | | | | | | | | | |
From net investment income | | | (0.07 | ) | | | (0.06 | ) | | | — | | | | (0.21 | ) | | | (0.04 | ) | | | (0.05 | ) |
From net realized gain | | | (0.44 | ) | | | — | | | | — | | | | — | | | | — | | | | — | |
| | | | |
Total distributions | | | (0.51 | ) | | | (0.06 | ) | | | — | | | | (0.21 | ) | | | (0.04 | ) | | | (0.05 | ) |
| | | | |
Net asset value, end of period | | $ | 17.25 | | | $ | 16.93 | | | $ | 17.24 | | | $ | 14.52 | | | $ | 12.34 | | | $ | 9.61 | |
| | | | |
| | | | | | | | | | | | | | | | | | | | | | | | |
Total Return3 | | | | | | | | | | | | | | | | | | | | | | | | |
Based on net asset value | | | 4.87 | %4 | | | (1.47 | )% | | | 18.73 | % | | | 19.71 | % | | | 28.96 | % | | | (2.24 | )% |
| | | | |
| | | | | | | | | | | | | | | | | | | | | | | | |
Ratios to Average Net Assets5 | | | | | | | | | | | | | | | | | | | | | | | | |
Total expenses | | | 1.25 | %6,7 | | | 1.23 | %6 | | | 1.24 | %6 | | | 1.26 | %6 | | | 1.28 | %6 | | | 1.23 | %6 |
| | | | |
Total expenses after fees waived and/or reimbursed | | | 1.14 | %6,7 | | | 1.14 | %6 | | | 1.14 | %6 | | | 1.14 | %6 | | | 1.14 | %6 | | | 1.14 | %6 |
| | | | |
Net investment income | | | 0.52 | %6,7 | | | 0.45 | %6 | | | 0.44 | %6 | | | 0.65 | %6 | | | 1.04 | %6 | | | 0.48 | %6 |
| | | | |
| | | | | | | | | | | | | | | | | | | | | | | | |
Supplemental Data | | | | | | | | | | | | | | | | | | | | | | | | |
Net assets, end of period (000) | | $ | 757,263 | | | $ | 750,260 | | | $ | 810,944 | | | $ | 732,669 | | | $ | 696,484 | | | $ | 634,822 | |
| | | | |
Portfolio turnover rate of the Portfolio | | | 19 | % | | | 41 | % | | | 40 | % | | | 50 | % | | | 128 | % | | | 129 | % |
| | | | |
| | 1 | | Based on average shares outstanding. |
| | 2 | | Distributions for annual periods determined in accordance with federal income tax regulations. |
| | 3 | | Where applicable, excludes the effects of any sales charges and assumes the reinvestment of distributions. |
| | 4 | | Aggregate total return. |
| | 5 | | Includes the Fund’s share of the Portfolio’s allocated expenses and/or net investment income. |
| | 6 | | Includes the Fund’s share of the Portfolio’s allocated fees waived of less than 0.01%. |
See Notes to Financial Statements.
| | | | | | |
| 20 | | BLACKROCK LARGE CAP SERIES FUNDS, INC. | | MARCH 31, 2016 | | |
| | | | |
| Financial Highlights (continued) | | | BlackRock Large Cap Core Fund | |
| | | | | | | | | | | | | | | | | | | | | | | | |
| | | Investor B | |
| | | Six Months
Ended
March 31,
2016 | | | Year Ended September 30, | |
| | | (Unaudited) | | | 2015 | | | 2014 | | | 2013 | | | 2012 | | | 2011 | |
Per Share Operating Performance | | | | | | | | | | | | | | | | | | | | | | | | |
Net asset value, beginning of period | | $ | 15.55 | | | $ | 15.93 | | | $ | 13.52 | | | $ | 11.43 | | | $ | 8.93 | | | $ | 9.22 | |
| | | | |
Net investment income (loss)1 | | | (0.03 | ) | | | (0.07 | ) | | | (0.06 | ) | | | (0.02 | ) | | | 0.03 | | | | (0.04 | ) |
Net realized and unrealized gain (loss) | | | 0.73 | | | | (0.31 | ) | | | 2.47 | | | | 2.15 | | | | 2.47 | | | | (0.25 | ) |
| | | | |
Net increase (decrease) from investment operations | | | 0.70 | | | | (0.38 | ) | | | 2.41 | | | | 2.13 | | | | 2.50 | | | | (0.29 | ) |
| | | | |
Distributions:2 | | | | | | | | | | | | | | | | | | | | | | | | |
From net investment income | | | — | | | | — | | | | — | | | | (0.04 | ) | | | — | | | | — | |
From net realized gain | | | (0.44 | ) | | | — | | | | — | | | | — | | | | — | | | | — | |
| | | | |
Total dividends and distributions | | | (0.44 | ) | | | — | | | | — | | | | (0.04 | ) | | | — | | | | — | |
| | | | |
Net asset value, end of period | | $ | 15.81 | | | $ | 15.55 | | | $ | 15.93 | | | $ | 13.52 | | | $ | 11.43 | | | $ | 8.93 | |
| | | | |
| | | | | | | | | | | | | | | | | | | | | | | | |
Total Return3 | | | | | | | | | | | | | | | | | | | | | | | | |
Based on net asset value | �� | | 4.42 | %4 | | | (2.39 | )% | | | 17.83 | % | | | 18.65 | % | | | 28.00 | % | | | (3.15 | )% |
| | | | |
| | | | | | | | | | | | | | | | | | | | | | | | |
Ratios to Average Net Assets5 | | | | | | | | | | | | | | | | | | | | | | | | |
Total expenses | | | 2.95 | %6,7 | | | 2.48 | %6 | | | 2.29 | %6 | | | 2.30 | %6 | | | 2.18 | %6 | | | 2.14 | %6 |
| | | | |
Total expenses after fees waived and/or reimbursed | | | 1.97 | %6,7 | | | 1.97 | %6 | | | 1.97 | %6 | | | 1.97 | %6 | | | 1.96 | %6 | | | 1.97 | %6 |
| | | | |
Net investment income (loss) | | | (0.32 | )%6,7 | | | (0.41 | )%6 | | | (0.39 | )%6 | | | (0.15 | )%6 | | | 0.24 | %6 | | | (0.34 | )%6 |
| | | | |
| | | | | | | | | | | | | | | | | | | | | | | | |
Supplemental Data | | | | | | | | | | | | | | | | | | | | | | | | |
Net assets, end of period (000) | | $ | 4,327 | | | $ | 5,946 | | | $ | 13,359 | | | $ | 21,835 | | | $ | 33,719 | | | $ | 47,836 | |
| | | | |
Portfolio turnover rate of the Portfolio | | | 19 | % | | | 41 | % | | | 40 | % | | | 50 | % | | | 128 | % | | | 129 | % |
| | | | |
| | 1 | | Based on average shares outstanding. |
| | 2 | | Distributions for annual periods determined in accordance with federal income tax regulations. |
| | 3 | | Where applicable, excludes the effects of any sales charges and assumes the reinvestment of distributions. |
| | 4 | | Aggregate total return. |
| | 5 | | Includes the Fund’s share of the Portfolio’s allocated expenses and/or net investment income. |
| | 6 | | Includes the Fund’s share of the Portfolio’s allocated fees waived of less than 0.01%. |
See Notes to Financial Statements.
| | | | | | |
| | | BLACKROCK LARGE CAP SERIES FUNDS, INC. | | MARCH 31, 2016 | | 21 |
| | | | |
| Financial Highlights (continued) | | | BlackRock Large Cap Core Fund | |
| | | | | | | | | | | | | | | | | | | | | | | | |
| | | Investor C | |
| | | Six Months
Ended
March 31,
2016 | | | Year Ended September 30, | |
| | | (Unaudited) | | | 2015 | | | 2014 | | | 2013 | | | 2012 | | | 2011 | |
Per Share Operating Performance | | | | | | | | | | | | | | | | | | | | | | | | |
Net asset value, beginning of period | | $ | 15.33 | | | $ | 15.69 | | | $ | 13.32 | | | $ | 11.31 | | | $ | 8.85 | | | $ | 9.13 | |
| | | | |
Net investment income (loss)1 | | | (0.03 | ) | | | (0.06 | ) | | | (0.06 | ) | | | (0.03 | ) | | | 0.02 | | | | (0.04 | ) |
Net realized and unrealized gain (loss) | | | 0.72 | | | | (0.30 | ) | | | 2.43 | | | | 2.12 | | | | 2.44 | | | | (0.24 | ) |
| | | | |
Net increase (decrease) from investment operations | | | 0.69 | | | | (0.36 | ) | | | 2.37 | | | | 2.09 | | | | 2.46 | | | | (0.28 | ) |
| | | | |
Distributions:2 | | | | | | | | | | | | | | | | | | | | | | | | |
From net investment income | | | — | | | | (0.00 | )3 | | | — | | | | (0.08 | ) | | | — | | | | — | |
From net realized gain | | | (0.44 | ) | | | — | | | | — | | | | — | | | | — | | | | — | |
| | | | |
Total distributions | | | (0.44 | ) | | | — | | | | — | | | | (0.08 | ) | | | — | | | | — | |
| | | | |
Net asset value, end of period | | $ | 15.58 | | | $ | 15.33 | | | $ | 15.69 | | | $ | 13.32 | | | $ | 11.31 | | | $ | 8.85 | |
| | | | |
| | | | | | | | | | | | | | | | | | | | | | | | |
Total Return4 | | | | | | | | | | | | | | | | | | | | | | | | |
Based on net asset value | | | 4.49 | %5 | | | (2.29 | )% | | | 17.79 | % | | | 18.62 | % | | | 27.80 | % | | | (3.07 | )% |
| | | | |
| | | | | | | | | | | | | | | | | | | | | | | | |
Ratios to Average Net Assets6 | | | | | | | | | | | | | | | | | | | | | | | | |
Total expenses | | | 1.99 | %7,8 | | | 1.96 | %7 | | | 1.97 | %7 | | | 2.01 | %7 | | | 1.97 | %7,9 | | | 2.00 | %7 |
| | | | |
Total expenses after fees waived and/or reimbursed | | | 1.98 | %7,8 | | | 1.96 | %7 | | | 1.97 | %7 | | | 2.01 | %7 | | | 1.97 | %7,9 | | | 2.00 | %7 |
| | | | |
Net investment income (loss) | | | (0.33 | )%7,8 | | | (0.37 | )%7 | | | (0.39 | )%7 | | | (0.22 | )%7 | | | 0.22 | %7,9 | | | (0.38 | )%7 |
| | | | |
| | | | | | | | | | | | | | | | | | | | | | | | |
Supplemental Data | | | | | | | | | | | | | | | | | | | | | | | | |
Net assets, end of period (000) | | $ | 345,883 | | | $ | 356,391 | | | $ | 394,765 | | | $ | 369,812 | | | $ | 363,613 | | | $ | 393,172 | |
| | | | |
Portfolio turnover rate of the Portfolio | | | 19 | % | | | 41 | % | | | 40 | % | | | 50 | % | | | 128 | % | | | 129 | % |
| | | | |
| | 1 | | Based on average shares outstanding. |
| | 2 | | Distributions for annual periods determined in accordance with federal income tax regulations. |
| | 3 | | Amount is greater than $(0.005) per share. |
| | 4 | | Where applicable, excludes the effects of any sales charges and assumes the reinvestment of distributions. |
| | 5 | | Aggregate total return. |
| | 6 | | Includes the Fund’s share of the Portfolio’s allocated expenses and/or net investment income. |
| | 7 | | Includes the Fund’s share of the Portfolio’s allocated fees waived of less than 0.01%. |
| | 9 | | Includes a non-recurring expense adjustment, which impacted the ratios for total expenses, total expenses after fees waived and/or reimbursed and net investment income. Excluding this adjustment, the ratios would have been 2.05%, 2.05% and 0.14%, respectively. |
See Notes to Financial Statements.
| | | | | | |
| 22 | | BLACKROCK LARGE CAP SERIES FUNDS, INC. | | MARCH 31, 2016 | | |
| | | | |
| Financial Highlights (concluded) | | | BlackRock Large Cap Core Fund | |
| | | | | | | | | | | | | | | | | | | | | | | | |
| | | Class R | |
| | | Six Months
Ended
March 31,
2016 | | | Year Ended September 30, | |
| | | (Unaudited) | | | 2015 | | | 2014 | | | 2013 | | | 2012 | | | 2011 | |
Per Share Operating Performance | | | | | | | | | | | | | | | | | | | | | | | | |
Net asset value, beginning of period | | $ | 16.18 | | | $ | 16.47 | | | $ | 13.91 | | | $ | 11.81 | | | $ | 9.19 | | | $ | 9.46 | |
| | | | |
Net investment income1 | | | 0.02 | | | | 0.03 | | | | 0.02 | | | | 0.04 | | | | 0.07 | | | | 0.01 | |
Net realized and unrealized gain (loss) | | | 0.75 | | | | (0.32 | ) | | | 2.54 | | | | 2.21 | | | | 2.55 | | | | (0.26 | ) |
| | | | |
Net increase (decrease) from investment operations | | | 0.77 | | | | (0.29 | ) | | | 2.56 | | | | 2.25 | | | | 2.62 | | | | (0.25 | ) |
| | | | |
Distributions:2 | | | | | | | | | | | | | | | | | | | | | | | | |
From net investment income | | | (0.02 | ) | | | — | | | | — | | | | (0.15 | ) | | | — | | | | (0.02 | ) |
From net realized gain | | | (0.44 | ) | | | — | | | | — | | | | — | | | | — | | | | — | |
| | | | |
Total distributions | | | (0.46 | ) | | | — | | | | — | | | | (0.15 | ) | | | — | | | | (0.02 | ) |
| | | | |
Net asset value, end of period | | $ | 16.49 | | | $ | 16.18 | | | $ | 16.47 | | | $ | 13.91 | | | $ | 11.81 | | | $ | 9.19 | |
| | | | |
| | | | | | | | | | | | | | | | | | | | | | | | |
Total Return3 | | | | | | | | | | | | | | | | | | | | | | | | |
Based on net asset value | | | 4.72 | %4 | | | (1.76 | )% | | | 18.40 | % | | | 19.26 | % | | | 28.51 | % | | | (2.68 | )% |
| | | | |
| | | | | | | | | | | | | | | | | | | | | | | | |
Ratios to Average Net Assets5 | | | | | | | | | | | | | | | | | | | | | | | | |
Total expenses | | | 1.45 | %6,7 | | | 1.44 | %6 | | | 1.43 | %6 | | | 1.48 | %6 | | | 1.53 | %6 | | | 1.51 | %6 |
| | | | |
Total expenses after fees waived and/or reimbursed | | | 1.45 | %6,7 | | | 1.43 | %6 | | | 1.43 | %6 | | | 1.48 | %6 | | | 1.53 | %6 | | | 1.51 | %6 |
| | | | |
Net investment income | | | 0.21 | %6,7 | | | 0.15 | %6 | | | 0.15 | %6 | | | 0.32 | %6 | | | 0.66 | %6 | | | 0.12 | %6 |
| | | | |
| | | | | | | | | | | | | | | | | | | | | | | | |
Supplemental Data | | | | | | | | | | | | | | | | | | | | | | | | |
Net assets, end of period (000) | | $ | 36,068 | | | $ | 36,412 | | | $ | 42,962 | | | $ | 44,330 | | | $ | 48,790 | | | $ | 49,665 | |
| | | | |
Portfolio turnover rate of the Portfolio | | | 19 | % | | | 41 | % | | | 40 | % | | | 50 | % | | | 128 | % | | | 129 | % |
| | | | |
| | 1 | | Based on average shares outstanding. |
| | 2 | | Distributions for annual periods determined in accordance with federal income tax regulations. |
| | 3 | | Where applicable, assumes the reinvestment of distributions. |
| | 4 | | Aggregate total return. |
| | 5 | | Includes the Fund’s share of the Portfolio’s allocated expenses and/or net investment income. |
| | 6 | | Includes the Fund’s share of the Portfolio’s allocated fees waived of less than 0.01%. |
See Notes to Financial Statements.
| | | | | | |
| | | BLACKROCK LARGE CAP SERIES FUNDS, INC. | | MARCH 31, 2016 | | 23 |
| | | | |
| Financial Highlights | | | BlackRock Large Cap Growth Fund | |
| | | | | | | | | | | | | | | | | | | | | | | | |
| | | Institutional | |
| | | Six Months
Ended
March 31,
2016 | | | Year Ended September 30, | |
| | | (Unaudited) | | | 2015 | | | 2014 | | | 2013 | | | 2012 | | | 2011 | |
Per Share Operating Performance | | | | | | | | | | | | | | | | | | | | | | | | |
Net asset value, beginning of period | | $ | 13.46 | | | $ | 15.02 | | | $ | 13.32 | | | $ | 12.50 | | | $ | 9.57 | | | $ | 9.54 | |
| | | | |
Net investment income1 | | | 0.04 | | | | 0.07 | | | | 0.07 | | | | 0.10 | | | | 0.14 | | | | 0.06 | |
Net realized and unrealized gain (loss) | | | 1.07 | | | | 0.17 | | | | 2.63 | | | | 1.65 | | | | 2.83 | | | | (0.03 | ) |
| | | | |
Net increase from investment operations | | | 1.11 | | | | 0.24 | | | | 2.70 | | | | 1.75 | | | | 2.97 | | | | 0.03 | |
| | | | |
Distributions:2 | | | | | | | | | | | | | | | | | | | | | | | | |
From net investment income | | | (0.04 | ) | | | (0.04 | ) | | | (0.02 | ) | | | (0.24 | ) | | | (0.04 | ) | | | — | |
From net realized gain | | | (0.65 | ) | | | (1.76 | ) | | | (0.98 | ) | | | (0.69 | ) | | | — | | | | — | |
| | | | |
Total distributions | | | (0.69 | ) | | | (1.80 | ) | | | (1.00 | ) | | | (0.93 | ) | | | (0.04 | ) | | | — | |
| | | | |
Net asset value, end of period | | $ | 13.88 | | | $ | 13.46 | | | $ | 15.02 | | | $ | 13.32 | | | $ | 12.50 | | | $ | 9.57 | |
| | | | |
| | | | | | | | | | | | | | | | | | | | | | | | |
Total Return3 | | | | | | | | | | | | | | | | | | | | | | | | |
Based on net asset value | | | 8.38 | %4 | | | 1.35 | % | | | 21.16 | % | | | 15.33 | % | | | 31.16 | % | | | 0.31 | % |
| | | | |
| | | | | | | | | | | | | | | | | | | | | | | | |
Ratios to Average Net Assets5 | | | | | | | | | | | | | | | | | | | | | | | | |
Total expenses | | | 0.95 | %6,7 | | | 0.93 | %6 | | | 0.94 | %6 | | | 0.96 | %6 | | | 0.97 | %6 | | | 0.96 | %6 |
| | | | |
Total expenses after fees waived and/or reimbursed | | | 0.84 | %6,7 | | | 0.89 | %6 | | | 0.94 | %6 | | | 0.96 | %6 | | | 0.97 | %6 | | | 0.96 | %6 |
| | | | |
Net investment income | | | 0.60 | %6,7 | | | 0.49 | %6 | | | 0.50 | %6 | | | 0.81 | %6 | | | 1.19 | %6 | | | 0.52 | %6 |
| | | | |
| | | | | | | | | | | | | | | | | | | | | | | | |
Supplemental Data | | | | | | | | | | | | | | | | | | | | | | | | |
Net assets, end of period (000) | | $ | 371,018 | | | $ | 341,606 | | | $ | 369,854 | | | $ | 311,127 | | | $ | 267,083 | | | $ | 300,111 | |
| | | | |
Portfolio turnover rate of the Portfolio | | | 17 | % | | | 41 | % | | | 49 | % | | | 54 | % | | | 132 | % | | | 169 | % |
| | | | |
| | 1 | | Based on average shares outstanding. |
| | 2 | | Distributions for annual periods determined in accordance with federal income tax regulations. |
| | 3 | | Where applicable, assumes the reinvestment of distributions. |
| | 4 | | Aggregate total return. |
| | 5 | | Includes the Fund’s share of the Portfolio’s allocated expenses and/or net investment income. |
| | 6 | | Includes the Fund’s share of the Portfolio’s allocated fees waived of less than 0.01%. |
See Notes to Financial Statements.
| | | | | | |
| 24 | | BLACKROCK LARGE CAP SERIES FUNDS, INC. | | MARCH 31, 2016 | | |
| | | | |
| Financial Highlights (continued) | | | BlackRock Large Cap Growth Fund | |
| | | | | | | | | | | | | | | | | | | | | | | | |
| | | Service | |
| | | Six Months
Ended
March 31,
2016 | | | Year Ended September 30, | |
| | | (Unaudited) | | | 2015 | | | 2014 | | | 2013 | | | 2012 | | | 2011 | |
Per Share Operating Performance | | | | | | | | | | | | | | | | | | | | | | | | |
Net asset value, beginning of period | | $ | 13.39 | | | $ | 14.96 | | | $ | 13.18 | | | $ | 12.38 | | | $ | 9.48 | | | $ | 9.47 | |
| | | | |
Net investment income1 | | | 0.02 | | | | 0.03 | | | | 0.03 | | | | 0.07 | | | | 0.09 | | | | 0.03 | |
Net realized and unrealized gain (loss) | | | 1.06 | | | | 0.17 | | | | 2.60 | | | | 1.62 | | | | 2.82 | | | | (0.02 | ) |
| | | | |
Net increase from investment operations | | | 1.08 | | | | 0.20 | | | | 2.63 | | | | 1.69 | | | | 2.91 | | | | 0.01 | |
| | | | |
Distributions:2 | | | | | | | | | | | | | | | | | | | | | | | | |
From net investment income | | | — | | | | (0.01 | ) | | | — | | | | (0.20 | ) | | | (0.01 | ) | | | — | |
From net realized gain | | | (0.65 | ) | | | (1.76 | ) | | | (0.85 | ) | | | (0.69 | ) | | | — | | | | — | |
| | | | |
Total distributions | | | (0.65 | ) | | | (1.77 | ) | | | (0.85 | ) | | | (0.89 | ) | | | (0.01 | ) | | | — | |
| | | | |
Net asset value, end of period | | $ | 13.82 | | | $ | 13.39 | | | $ | 14.96 | | | $ | 13.18 | | | $ | 12.38 | | | $ | 9.48 | |
| | | | |
| | | | | | | | | | | | | | | | | | | | | | | | |
Total Return3 | | | | | | | | | | | | | | | | | | | | | | | | |
Based on net asset value | | | 8.17 | %4 | | | 1.10 | % | | | 20.77 | % | | | 14.98 | % | | | 30.67 | % | | | 0.11 | % |
| | | | |
| | | | | | | | | | | | | | | | | | | | | | | | |
Ratios to Average Net Assets5 | | | | | | | | | | | | | | | | | | | | | | | | |
Total expenses | | | 1.23 | %6,7 | | | 1.19 | %6 | | | 1.24 | %6 | | | 1.23 | %6 | | | 1.33 | %6 | | | 1.16 | %6 |
| | | | |
Total expenses after fees waived and/or reimbursed | | | 1.13 | %6,7 | | | 1.17 | %6 | | | 1.24 | %6 | | | 1.23 | %6 | | | 1.33 | %6 | | | 1.16 | %6 |
| | | | |
Net investment income | | | 0.30 | %6,7 | | | 0.20 | %6 | | | 0.19 | %6 | | | 0.62 | %6 | | | 0.81 | %6 | | | 0.29 | %6 |
| | | | |
| | | | | | | | | | | | | | | | | | | | | | | | |
Supplemental Data | | | | | | | | | | | | | | | | | | | | | | | | |
Net assets, end of period (000) | | $ | 1,671 | | | $ | 1,577 | | | $ | 1,912 | | | $ | 1,624 | | | $ | 11,865 | | | $ | 10,734 | |
| | | | |
Portfolio turnover rate of the Portfolio | | | 17 | % | | | 41 | % | | | 49 | % | | | 54 | % | | | 132 | % | | | 169 | % |
| | | | |
| | 1 | | Based on average shares outstanding. |
| | 2 | | Distributions for annual periods determined in accordance with federal income tax regulations. |
| | 3 | | Where applicable, assumes the reinvestment of distributions. |
| | 4 | | Aggregate total return. |
| | 5 | | Includes the Fund’s share of the Portfolio’s allocated expenses and/or net investment income. |
| | 6 | | Includes the Fund’s share of the Portfolio’s allocated fees waived of less than 0.01%. |
See Notes to Financial Statements.
| | | | | | |
| | | BLACKROCK LARGE CAP SERIES FUNDS, INC. | | MARCH 31, 2016 | | 25 |
| | | | |
| Financial Highlights (continued) | | | BlackRock Large Cap Growth Fund | |
| | | | | | | | | | | | | | | | | | | | | | | | |
| | | Investor A | |
| | | Six Months
Ended
March 31,
2016 | | | Year Ended September 30, | |
| | | (Unaudited) | | | 2015 | | | 2014 | | | 2013 | | | 2012 | | | 2011 | |
Per Share Operating Performance | | | | | | | | | | | | | | | | | | | | | | | | |
Net asset value, beginning of period | | $ | 12.85 | | | $ | 14.42 | | | $ | 12.82 | | | $ | 12.09 | | | $ | 9.26 | | | $ | 9.26 | |
| | | | |
Net investment income1 | | | 0.02 | | | | 0.03 | | | | 0.03 | | | | 0.06 | | | | 0.10 | | | | 0.02 | |
Net realized and unrealized gain (loss) | | | 1.01 | | | | 0.17 | | | | 2.52 | | | | 1.58 | | | | 2.75 | | | | (0.02 | ) |
| | | | |
Net increase from investment operations | | | 1.03 | | | | 0.20 | | | | 2.55 | | | | 1.64 | | | | 2.85 | | | | — | |
| | | | |
Distributions:2 | | | | | | | | | | | | | | | | | | | | | | | | |
From net investment income | | | (0.00 | )3 | | | (0.01 | ) | | | — | | | | (0.22 | ) | | | (0.02 | ) | | | — | |
From net realized gain | | | (0.65 | ) | | | (1.76 | ) | | | (0.95 | ) | | | (0.69 | ) | | | — | | | | — | |
| | | | |
Total distributions | | | (0.65 | ) | | | (1.77 | ) | | | (0.95 | ) | | | (0.91 | ) | | | (0.02 | ) | | | — | |
| | | | |
Net asset value, end of period | | $ | 13.23 | | | $ | 12.85 | | | $ | 14.42 | | | $ | 12.82 | | | $ | 12.09 | | | $ | 9.26 | |
| | | | |
| | | | | | | | | | | | | | | | | | | | | | | | |
Total Return4 | | | | | | | | | | | | | | | | | | | | | | | | |
Based on net asset value | | | 8.16 | %5 | | | 1.11 | % | | | 20.82 | % | | | 14.90 | % | | | 30.78 | % | | | 0.00 | % |
| | | | |
| | | | | | | | | | | | | | | | | | | | | | | | |
Ratios to Average Net Assets6 | | | | | | | | | | | | | | | | | | | | | | | | |
Total expenses | | | 1.24 | %7,8 | | | 1.23 | %7 | | | 1.23 | %7 | | | 1.25 | %7 | | | 1.26 | %7 | | | 1.27 | %7 |
| | | | |
Total expenses after fees waived and/or reimbursed | | | 1.13 | %7,8 | | | 1.19 | %7 | | | 1.23 | %7 | | | 1.25 | %7 | | | 1.26 | %7 | | | 1.27 | %7 |
| | | | |
Net investment income | | | 0.30 | %7,8 | | | 0.19 | %7 | | | 0.20 | %7 | | | 0.54 | %7 | | | 0.90 | %7 | | | 0.21 | %7 |
| | | | |
| | | | | | | | | | | | | | | | | | | | | | | | |
Supplemental Data | | | | | | | | | | | | | | | | | | | | | | | | |
Net assets, end of period (000) | | $ | 555,213 | | | $ | 524,114 | | | $ | 518,858 | | | $ | 449,729 | | | $ | 405,154 | | | $ | 318,230 | |
| | | | |
Portfolio turnover rate of the Portfolio | | | 17 | % | | | 41 | % | | | 49 | % | | | 54 | % | | | 132 | % | | | 169 | % |
| | | | |
| | 1 | | Based on average shares outstanding. |
| | 2 | | Distributions for annual periods determined in accordance with federal income tax regulations. |
| | 3 | | Amount is greater than $(0.005) per share. |
| | 4 | | Where applicable, excludes the effects of any sales charges and assumes the reinvestment of distributions. |
| | 5 | | Aggregate total return. |
| | 6 | | Includes the Fund’s share of the Portfolio’s allocated expenses and/or net investment income. |
| | 7 | | Includes the Fund’s share of the Portfolio’s allocated fees waived of less than 0.01%. |
See Notes to Financial Statements.
| | | | | | |
| 26 | | BLACKROCK LARGE CAP SERIES FUNDS, INC. | | MARCH 31, 2016 | | |
| | | | |
| Financial Highlights (continued) | | | BlackRock Large Cap Growth Fund | |
| | | | | | | | | | | | | | | | | | | | | | | | |
| | | Investor B | |
| | | Six Months
Ended
March 31,
2016 | | | Year Ended September 30, | |
| | | (Unaudited) | | | 2015 | | | 2014 | | | 2013 | | | 2012 | | | 2011 | |
Per Share Operating Performance | | | | | | | | | | | | | | | | | | | | | | | | |
Net asset value, beginning of period | | $ | 11.34 | | | $ | 12.94 | | | $ | 11.56 | | | $ | 10.96 | | | $ | 8.45 | | | $ | 8.52 | |
| | | | |
Net investment loss1 | | | (0.03 | ) | | | (0.08 | ) | | | (0.07 | ) | | | (0.03 | ) | | | (0.00 | )2 | | | (0.06 | ) |
Net realized and unrealized gain (loss) | | | 0.91 | | | | 0.15 | | | | 2.27 | | | | 1.42 | | | | 2.51 | | | | (0.01 | ) |
| | | | |
Net increase (decrease) from investment operations | | | 0.88 | | | | 0.07 | | | | 2.20 | | | | 1.39 | | | | 2.51 | | | | (0.07 | ) |
| | | | |
Distributions:3 | | | | | | | | | | | | | | | | | | | | | | | | |
From net investment income | | | — | | | | — | | | | — | | | | (0.10 | ) | | | — | | | | — | |
From net realized gain | | | (0.65 | ) | | | (1.67 | ) | | | (0.82 | ) | | | (0.69 | ) | | | — | | | | — | |
| | | | |
Total distributions | | | (0.65 | ) | | | (1.67 | ) | | | (0.82 | ) | | | (0.79 | ) | | | — | | | | — | |
| | | | |
Net asset value, end of period | | $ | 11.57 | | | $ | 11.34 | | | $ | 12.94 | | | $ | 11.56 | | | $ | 10.96 | | | $ | 8.45 | |
| | | | |
| | | | | | | | | | | | | | | | | | | | | | | | |
Total Return4 | | | | | | | | | | | | | | | | | | | | | | | | |
Based on net asset value | | | 7.77 | %5 | | | 0.14 | % | | | 19.87 | % | | | 13.92 | % | | | 29.70 | % | | | (0.82 | )% |
| | | | |
| | | | | | | | | | | | | | | | | | | | | | | | |
Ratios to Average Net Assets6 | | | | | | | | | | | | | | | | | | | | | | | | |
Total expenses | | | 2.24 | %7,8 | | | 2.05 | %7 | | | 2.04 | %7 | | | 2.14 | %7 | | | 2.13 | %7 | | | 2.08 | %7 |
| | | | |
Total expenses after fees waived and/or reimbursed | | | 1.95 | %7,8 | | | 2.02 | %7 | | | 2.03 | %7 | | | 2.14 | %7 | | | 2.13 | %7 | | | 2.08 | %7 |
| | | | |
Net investment loss | | | (0.53 | )%7,8 | | | (0.68 | )%7 | | | (0.60 | )%7 | | | (0.30 | )%7 | | | (0.01 | )%7 | | | (0.61 | )%7 |
| | | | |
| | | | | | | | | | | | | | | | | | | | | | | | |
Supplemental Data | | | | | | | | | | | | | | | | | | | | | | | | |
Net assets, end of period (000) | | $ | 922 | | | $ | 1,263 | | | $ | 2,771 | | | $ | 4,656 | | | $ | 7,826 | | | $ | 10,372 | |
| | | | |
Portfolio turnover rate of the Portfolio | | | 17 | % | | | 41 | % | | | 49 | % | | | 54 | % | | | 132 | % | | | 169 | % |
| | | | |
| | 1 | | Based on average shares outstanding. |
| | 2 | | Amount is greater than $(0.005) per share. |
| | 3 | | Distributions for annual periods determined in accordance with federal income tax regulations. |
| | 4 | | Where applicable, excludes the effects of any sales charges and assumes the reinvestment of distributions. |
| | 5 | | Aggregate total return. |
| | 6 | | Includes the Fund’s share of the Portfolio’s allocated expenses and/or net investment income. |
| | 7 | | Includes the Fund’s share of the Portfolio’s allocated fees waived of less than 0.01%. |
See Notes to Financial Statements.
| | | | | | |
| | | BLACKROCK LARGE CAP SERIES FUNDS, INC. | | MARCH 31, 2016 | | 27 |
| | | | |
| Financial Highlights (continued) | | | BlackRock Large Cap Growth Fund | |
| | | | | | | | | | | | | | | | | | | | | | | | |
| | | Investor C | |
| | | Six Months
Ended
March 31,
2016 | | | Year Ended September 30, | |
| | | (Unaudited) | | | 2015 | | | 2014 | | | 2013 | | | 2012 | | | 2011 | |
Per Share Operating Performance | | | | | | | | | | | | | | | | | | | | | | | | |
Net asset value, beginning of period | | $ | 11.23 | | | $ | 12.85 | | | $ | 11.52 | | | $ | 10.95 | | | $ | 8.44 | | | $ | 8.51 | |
| | | | |
Net investment income (loss)1 | | | (0.03 | ) | | | (0.07 | ) | | | (0.07 | ) | | | (0.03 | ) | | | 0.01 | | | | (0.06 | ) |
Net realized and unrealized gain (loss) | | | 0.89 | | | | 0.15 | | | | 2.27 | | | | 1.42 | | | | 2.50 | | | | (0.01 | ) |
| | | | |
Net increase (decrease) from investment operations | | | 0.86 | | | | 0.08 | | | | 2.20 | | | | 1.39 | | | | 2.51 | | | | (0.07 | ) |
| | | | |
Distributions:2 | | | | | | | | | | | | | | | | | | | | | | | | |
From net investment income | | | — | | | | — | | | | — | | | | (0.13 | ) | | | — | | | | — | |
From net realized gain | | | (0.65 | ) | | | (1.70 | ) | | | (0.87 | ) | | | (0.69 | ) | | | — | | | | — | |
| | | | |
Total distributions | | | (0.65 | ) | | | (1.70 | ) | | | (0.87 | ) | | | (0.82 | ) | | | — | | | | — | |
| | | | |
Net asset value, end of period | | $ | 11.44 | | | $ | 11.23 | | | $ | 12.85 | | | $ | 11.52 | | | $ | 10.95 | | | $ | 8.44 | |
| | | | |
| | | | | | | | | | | | | | | | | | | | | | | | |
Total Return3 | | | | | | | | | | | | | | | | | | | | | | | | |
Based on net asset value | | | 7.77 | %4 | | | 0.27 | % | | | 19.96 | % | | | 14.02 | % | | | 29.74 | % | | | (0.82 | )% |
| | | | |
| | | | | | | | | | | | | | | | | | | | | | | | |
Ratios to Average Net Assets5 | | | | | | | | | | | | | | | | | | | | | | | | |
Total expenses | | | 2.02 | %6,7 | | | 1.99 | %6 | | | 2.00 | %6 | | | 2.04 | %6 | | | 2.07 | %6 | | | 2.05 | %6 |
| | | | |
Total expenses after fees waived and/or reimbursed | | | 1.95 | %6,7 | | | 1.97 | %6 | | | 2.00 | %6 | | | 2.04 | %6 | | | 2.07 | %6 | | | 2.05 | %6 |
| | | | |
Net investment income (loss) | | | (0.52 | )%6,7 | | | (0.59 | )%6 | | | (0.57 | )%6 | | | (0.24 | )%6 | | | 0.09 | %6 | | | (0.60 | )%6 |
| | | | |
| | | | | | | | | | | | | | | | | | | | | | | | |
Supplemental Data | | | | | | | | | | | | | | | | | | | | | | | | |
Net assets, end of period (000) | | $ | 193,200 | | | $ | 192,804 | | | $ | 193,491 | | | $ | 171,430 | | | $ | 167,518 | | | $ | 129,227 | |
| | | | |
Portfolio turnover rate of the Portfolio | | | 17 | % | | | 41 | % | | | 49 | % | | | 54 | % | | | 132 | % | | | 169 | % |
| | | | |
| | 1 | | Based on average shares outstanding. |
| | 2 | | Distributions for annual periods determined in accordance with federal income tax regulations. |
| | 3 | | Where applicable, excludes the effects of any sales charges and assumes the reinvestment of distributions. |
| | 4 | | Aggregate total return. |
| | 5 | | Includes the Fund’s share of the Portfolio’s allocated expenses and/or net investment income. |
| | 6 | | Includes the Fund’s share of the Portfolio’s allocated fees waived of less than 0.01%. |
See Notes to Financial Statements.
| | | | | | |
| 28 | | BLACKROCK LARGE CAP SERIES FUNDS, INC. | | MARCH 31, 2016 | | |
| | | | |
| Financial Highlights (concluded) | | | BlackRock Large Cap Growth Fund | |
| | | | | | | | | | | | | | | | | | | | | | | | |
| | | Class R | |
| | | Six Months
Ended
March 31,
2016 | | | Year Ended September 30, | |
| | | (Unaudited) | | | 2015 | | | 2014 | | | 2013 | | | 2012 | | | 2011 | |
Per Share Operating Performance | | | | | | | | | | | | | | | | | | | | | | | | |
Net asset value, beginning of period | | $ | 12.15 | | | $ | 13.74 | | | $ | 12.25 | | | $ | 11.58 | | | $ | 8.88 | | | $ | 8.91 | |
| | | | |
Net investment income (loss)1 | | | 0.00 | 2 | | | (0.01 | ) | | | (0.01 | ) | | | 0.03 | | | | 0.06 | | | | (0.01 | ) |
Net realized and unrealized gain (loss) | | | 0.96 | | | | 0.16 | | | | 2.41 | | | | 1.51 | | | | 2.64 | | | | (0.02 | ) |
| | | | |
Net increase (decrease) from investment operations | | | 0.96 | | | | 0.15 | | | | 2.40 | | | | 1.54 | | | | 2.70 | | | | (0.03 | ) |
| | | | |
Distributions:3 | | | | | | | | | | | | | | | | | | | | | | | | |
From net investment income | | | — | | | | — | | | | — | | | | (0.18 | ) | | | — | | | | — | |
From net realized gain | | | (0.65 | ) | | | (1.74 | ) | | | (0.91 | ) | | | (0.69 | ) | | | — | | | | — | |
| | | | |
Total distributions | | | (0.65 | ) | | | (1.74 | ) | | | (0.91 | ) | | | (0.87 | ) | | | — | | | | — | |
| | | | |
Net asset value, end of period | | $ | 12.46 | | | $ | 12.15 | | | $ | 13.74 | | | $ | 12.25 | | | $ | 11.58 | | | $ | 8.88 | |
| | | | |
| | | | | | | | | | | | | | | | | | | | | | | | |
Total Return4 | | | | | | | | | | | | | | | | | | | | | | | | |
Based on net asset value | | | 8.01 | %5 | | | 0.81 | % | | | 20.50 | % | | | 14.61 | % | | | 30.41 | % | | | (0.34 | )% |
| | | | |
| | | | | | | | | | | | | | | | | | | | | | | | |
Ratios to Average Net Assets6 | | | | | | | | | | | | | | | | | | | | | | | | |
Total expenses | | | 1.48 | %7,8 | | | 1.46 | %7 | | | 1.48 | %7 | | | 1.54 | %7 | | | 1.56 | %7 | | | 1.60 | %7 |
| | | | |
Total expenses after fees waived and/or reimbursed | | | 1.38 | %7,8 | | | 1.44 | %7 | | | 1.48 | %7 | | | 1.54 | %7 | | | 1.56 | %7 | | | 1.60 | %7 |
| | | | |
Net investment income (loss) | | | 0.06 | %7,8 | | | (0.06 | )%7 | | | (0.05 | )%7 | | | 0.27 | %7 | | | 0.57 | %7 | | | (0.12 | )%7 |
| | | | |
| | | | | | | | | | | | | | | | | | | | | | | | |
Supplemental Data | | | | | | | | | | | | | | | | | | | | | | | | |
Net assets, end of period (000) | | $ | 23,602 | | | $ | 21,279 | | | $ | 23,308 | | | $ | 24,408 | | | $ | 30,101 | | | $ | 30,868 | |
| | | | |
Portfolio turnover rate of the Portfolio | | | 17 | % | | | 41 | % | | | 49 | % | | | 54 | % | | | 132 | % | | | 169 | % |
| | | | |
| | 1 | | Based on average shares outstanding. |
| | 2 | | Amount is less than $0.005 per share. |
| | 3 | | Distributions for annual periods determined in accordance with federal income tax regulations. |
| | 4 | | Where applicable, assumes the reinvestment of distributions. |
| | 5 | | Aggregate total return. |
| | 6 | | Includes the Fund’s share of the Portfolio’s allocated expenses and/or net investment income. |
| | 7 | | Includes the Fund’s share of the Portfolio’s allocated fees waived of less than 0.01%. |
See Notes to Financial Statements.
| | | | | | |
| | | BLACKROCK LARGE CAP SERIES FUNDS, INC. | | MARCH 31, 2016 | | 29 |
| | | | |
| Financial Highlights | | | BlackRock Large Cap Value Fund | |
| | | | | | | | | | | | | | | | | | | | | | | | |
| | | Institutional | |
| | | Six Months
Ended
March 31,
2016 | | | Year Ended September 30, | |
| | | (Unaudited) | | | 2015 | | | 2014 | | | 2013 | | | 2012 | | | 2011 | |
Per Share Operating Performance | | | | | | | | | | | | | | | | | | | | | | | | |
Net asset value, beginning of period | | $ | 21.58 | | | $ | 22.25 | | | $ | 18.85 | | | $ | 15.75 | | | $ | 12.74 | | | $ | 13.51 | |
| | | | |
Net investment income1 | | | 0.12 | | | | 0.23 | | | | 0.22 | | | | 0.21 | | | | 0.20 | | | | 0.12 | |
Net realized and unrealized gain (loss) | | | 0.78 | | | | (0.65 | ) | | | 3.18 | | | | 3.25 | | | | 2.94 | | | | (0.75 | ) |
| | | | |
Net increase (decrease) from investment operations | | | 0.90 | | | | (0.42 | ) | | | 3.40 | | | | 3.46 | | | | 3.14 | | | | (0.63 | ) |
| | | | |
Distributions from net investment income2 | | | (0.23 | ) | | | (0.25 | ) | | | — | | | | (0.36 | ) | | | (0.13 | ) | | | (0.14 | ) |
| | | | |
Net asset value, end of period | | $ | 22.25 | | | $ | 21.58 | | | $ | 22.25 | | | $ | 18.85 | | | $ | 15.75 | | | $ | 12.74 | |
| | | | |
| | | | | | | | | | | | | | | | | | | | | | | | |
Total Return3 | | | | | | | | | | | | | | | | | | | | | | | | |
Based on net asset value | | | 4.17 | %4 | | | (1.94 | )% | | | 18.04 | % | | | 22.38 | % | | | 24.84 | % | | | (4.82 | )% |
| | | | |
| | | | | | | | | | | | | | | | | | | | | | | | |
Ratios to Average Net Assets5 | | | | | | | | | | | | | | | | | | | | | | | | |
Total expenses | | | 0.92 | %6,7 | | | 0.91 | %6 | | | 0.89 | %6 | | | 1.00 | %6 | | | 0.96 | % | | | 1.03 | % |
| | | | |
Total expenses after fees waived and/or reimbursed | | | 0.87 | %6,7 | | | 0.86 | %6 | | | 0.84 | %6 | | | 0.94 | %6 | | | 0.95 | % | | | 1.03 | % |
| | | | |
Net investment income | | | 1.13 | %6,7 | | | 1.01 | %6 | | | 1.07 | %6 | | | 1.19 | %6 | | | 1.33 | % | | | 0.81 | % |
| | | | |
| | | | | | | | | | | | | | | | | | | | | | | | |
Supplemental Data | | | | | | | | | | | | | | | | | | | | | | | | |
Net assets, end of period (000) | | $ | 166,859 | | | $ | 162,376 | | | $ | 184,691 | | | $ | 190,423 | | | $ | 251,764 | | | $ | 364,624 | |
| | | | |
Portfolio turnover rate of the Portfolio | | | 22 | % | | | 30 | % | | | 32 | % | | | 40 | % | | | 147 | % | | | 156 | % |
| | | | |
| | 1 | | Based on average shares outstanding. |
| | 2 | | Distributions for annual periods determined in accordance with federal income tax regulations. |
| | 3 | | Where applicable, assumes the reinvestment of distributions. |
| | 4 | | Aggregate total return. |
| | 5 | | Includes the Fund’s share of the Portfolio’s allocated expenses and/or net investment income. |
| | 6 | | Includes the Fund’s share of the Portfolio’s allocated fees waived of less than 0.01%. |
See Notes to Financial Statements.
| | | | | | |
| 30 | | BLACKROCK LARGE CAP SERIES FUNDS, INC. | | MARCH 31, 2016 | | |
| | | | |
| Financial Highlights (continued) | | | BlackRock Large Cap Value Fund | |
| | | | | | | | | | | | | | | | | | | | | | | | |
| | | Service | |
| | | Six Months
Ended
March 31,
2016 | | | Year Ended September 30, | |
| | | (Unaudited) | | | 2015 | | | 2014 | | | 2013 | | | 2012 | | | 2011 | |
Per Share Operating Performance | | | | | | | | | | | | | | | | | | | | | | | | |
Net asset value, beginning of period | | $ | 21.40 | | | $ | 22.07 | | | $ | 18.75 | | | $ | 15.67 | | | $ | 12.71 | | | $ | 13.48 | |
| | | | |
Net investment income1 | | | 0.09 | | | | 0.16 | | | | 0.16 | | | | 0.16 | | | | 0.15 | | | | 0.10 | |
Net realized and unrealized gain (loss) | | | 0.78 | | | | (0.65 | ) | | | 3.16 | | | | 3.23 | | | | 2.94 | | | | (0.75 | ) |
| | | | |
Net increase (decrease) from investment operations | | | 0.87 | | | | (0.49 | ) | | | 3.32 | | | | 3.39 | | | | 3.09 | | | | (0.65 | ) |
| | | | |
Distributions from net investment income2 | | | (0.16 | ) | | | (0.18 | ) | | | — | | | | (0.31 | ) | | | (0.13 | ) | | | (0.12 | ) |
| | | | |
Net asset value, end of period | | $ | 22.11 | | | $ | 21.40 | | | $ | 22.07 | | | $ | 18.75 | | | $ | 15.67 | | | $ | 12.71 | |
| | | | |
| | | | | | | | | | | | | | | | | | | | | | | | |
Total Return3 | | | | | | | | | | | | | | | | | | | | | | | | |
Based on net asset value | | | 4.05 | %4 | | | (2.27 | )% | | | 17.71 | % | | | 21.98 | % | | | 24.43 | % | | | (4.95 | )% |
| | | | |
| | | | | | | | | | | | | | | | | | | | | | | | |
Ratios to Average Net Assets5 | | | | | | | | | | | | | | | | | | | | | | | | |
Total expenses | | | 1.24 | %6,7 | | | 1.20 | %6 | | | 1.20 | %6 | | | 1.23 | %6 | | | 1.27 | % | | | 1.17 | % |
| | | | |
Total expenses after fees waived and/or reimbursed | | | 1.18 | %6,7 | | | 1.15 | %6 | | | 1.15 | %6 | | | 1.18 | %6 | | | 1.25 | % | | | 1.17 | % |
| | | | |
Net investment income | | | 0.82 | %6,7 | | | 0.72 | %6 | | | 0.76 | %6 | | | 0.93 | %6 | | | 0.99 | % | | | 0.64 | % |
| | | | |
| | | | | | | | | | | | | | | | | | | | | | | | |
Supplemental Data | | | | | | | | | | | | | | | | | | | | | | | | |
Net assets, end of period (000) | | $ | 11,833 | | | $ | 11,931 | | | $ | 14,155 | | | $ | 13,296 | | | $ | 28,746 | | | $ | 29,586 | |
| | | | |
Portfolio turnover rate of the Portfolio | | | 22 | % | | | 30 | % | | | 32 | % | | | 40 | % | | | 147 | % | | | 156 | % |
| | | | |
| | 1 | | Based on average shares outstanding. |
| | 2 | | Distributions for annual periods determined in accordance with federal income tax regulations. |
| | 3 | | Where applicable, assumes the reinvestment of distributions. |
| | 4 | | Aggregate total return. |
| | 5 | | Includes the Fund’s share of the Portfolio’s allocated expenses and/or net investment income. |
| | 6 | | Includes the Fund’s share of the Portfolio’s allocated fees waived of less than 0.01%. |
See Notes to Financial Statements.
| | | | | | |
| | | BLACKROCK LARGE CAP SERIES FUNDS, INC. | | MARCH 31, 2016 | | 31 |
| | | | |
| Financial Highlights (continued) | | | BlackRock Large Cap Value Fund | |
| | | | | | | | | | | | | | | | | | | | | | | | |
| | | Investor A | |
| | | Six Months
Ended
March 31,
2016 | | | Year Ended September 30, | |
| | | (Unaudited) | | | 2015 | | | 2014 | | | 2013 | | | 2012 | | | 2011 | |
Per Share Operating Performance | | | | | | | | | | | | | | | | | | | | | | | | |
Net asset value, beginning of period | | $ | 21.14 | | | $ | 21.79 | | | $ | 18.52 | | | $ | 15.48 | | | $ | 12.53 | | | $ | 13.29 | |
| | | | |
Net investment income1 | | | 0.09 | | | | 0.16 | | | | 0.15 | | | | 0.15 | | | | 0.14 | | | | 0.08 | |
Net realized and unrealized gain (loss) | | | 0.76 | | | | (0.64 | ) | | | 3.12 | | | | 3.21 | | | | 2.90 | | | | (0.74 | ) |
| | | | |
Net increase (decrease) from investment operations | | | 0.85 | | | | (0.48 | ) | | | 3.27 | | | | 3.36 | | | | 3.04 | | | | (0.66 | ) |
| | | | |
Distributions from net investment income2 | | | (0.16 | ) | | | (0.17 | ) | | | — | | | | (0.32 | ) | | | (0.09 | ) | | | (0.10 | ) |
| | | | |
Net asset value, end of period | | $ | 21.83 | | | $ | 21.14 | | | $ | 21.79 | | | $ | 18.52 | | | $ | 15.48 | | | $ | 12.53 | |
| | | | |
| | | | | | | | | | | | | | | | | | | | | | | | |
Total Return3 | | | | | | | | | | | | | | | | | | | | | | | | |
Based on net asset value | | | 4.05 | %4 | | | (2.23 | )% | | | 17.66 | % | | | 22.07 | % | | | 24.38 | % | | | (5.04 | )% |
| | | | |
| | | | | | | | | | | | | | | | | | | | | | | | |
Ratios to Average Net Assets5 | | | | | | | | | | | | | | | | | | | | | | | | |
Total expenses | | | 1.23 | %6,7 | | | 1.22 | %6 | | | 1.22 | %6 | | | 1.26 | %6 | | | 1.27 | % | | | 1.24 | % |
| | | | |
Total expenses after fees waived and/or reimbursed | | | 1.17 | %6,7 | | | 1.17 | %6 | | | 1.17 | %6 | | | 1.21 | %6 | | | 1.26 | % | | | 1.24 | % |
| | | | |
Net investment income | | | 0.82 | %6,7 | | | 0.69 | %6 | | | 0.74 | %6 | | | 0.91 | %6 | | | 0.99 | % | | | 0.57 | % |
| | | | |
| | | | | | | | | | | | | | | | | | | | | | | | |
Supplemental Data | | | | | | | | | | | | | | | | | | | | | | | | |
Net assets, end of period (000) | | $ | 292,846 | | | $ | 297,653 | | | $ | 352,267 | | | $ | 353,445 | | | $ | 392,575 | | | $ | 479,707 | |
| | | | |
Portfolio turnover rate of the Portfolio | | | 22 | % | | | 30 | % | | | 32 | % | | | 40 | % | | | 147 | % | | | 156 | % |
| | | | |
| | 1 | | Based on average shares outstanding. |
| | 2 | | Distributions for annual periods determined in accordance with federal income tax regulations. |
| | 3 | | Where applicable, excludes the effects of any sales charges and assumes the reinvestment of distributions. |
| | 4 | | Aggregate total return. |
| | 5 | | Includes the Fund’s share of the Portfolio’s allocated expenses and/or net investment income. |
| | 6 | | Includes the Fund’s share of the Portfolio’s allocated fees waived of less than 0.01%. |
See Notes to Financial Statements.
| | | | | | |
| 32 | | BLACKROCK LARGE CAP SERIES FUNDS, INC. | | MARCH 31, 2016 | | |
| | | | |
| Financial Highlights (continued) | | | BlackRock Large Cap Value Fund | |
| | | | | | | | | | | | | | | | | | | | | | | | |
| | | Investor B | |
| | | Six Months
Ended
March 31,
2016 | | | Year Ended September 30, | |
| | | (Unaudited) | | | 2015 | | | 2014 | | | 2013 | | | 2012 | | | 2011 | |
Per Share Operating Performance | | | | | | | | | | | | | | | | | | | | | | | | |
Net asset value, beginning of period | | $ | 19.73 | | | $ | 20.36 | | | $ | 17.44 | | | $ | 14.52 | | | $ | 11.78 | | | $ | 12.52 | |
| | | | |
Net investment income (loss)1 | | | (0.02 | ) | | | (0.04 | ) | | | (0.01 | ) | | | 0.002 | | | | 0.01 | | | | (0.04 | ) |
Net realized and unrealized gain (loss) | | | 0.72 | | | | (0.59 | ) | | | 2.93 | | | | 3.03 | | | | 2.73 | | | | (0.70 | ) |
| | | | |
Net increase (decrease) from investment operations | | | 0.70 | | | | (0.63 | ) | | | 2.92 | | | | 3.03 | | | | 2.74 | | | | (0.74 | ) |
| | | | |
Distributions from net investment income3 | | | — | | | | — | | | | — | | | | (0.11 | ) | | | — | | | | — | |
| | | | |
Net asset value, end of period | | $ | 20.43 | | | $ | 19.73 | | | $ | 20.36 | | | $ | 17.44 | | | $ | 14.52 | | | $ | 11.78 | |
| | | | |
| | | | | | | | | | | | | | | | | | | | | | | | |
Total Return4 | | | | | | | | | | | | | | | | | | | | | | | | |
Based on net asset value | | | 3.55 | %5 | | | (3.09 | )% | | | 16.74 | % | | | 20.98 | % | | | 23.26 | % | | | (5.91 | )% |
| | | | |
| | | | | | | | | | | | | | | | | | | | | | | | |
Ratios to Average Net Assets6 | | | | | | | | | | | | | | | | | | | | | | | | |
Total expenses | | | 2.20 | %7,8 | | | 2.06 | %7 | | | 2.01 | %7 | | | 2.20 | %7 | | | 2.21 | % | | | 2.12 | % |
| | | | |
Total expenses after fees waived and/or reimbursed | | | 2.14 | %7,8 | | | 2.01 | %7 | | | 1.96 | %7 | | | 2.15 | %7 | | | 2.20 | % | | | 2.12 | % |
| | | | |
Net investment income (loss) | | | (0.16 | )%7,8 | | | (0.17 | )%7 | | | (0.05 | )%7 | | | 0.00 | %7 | | | 0.07 | % | | | (0.31 | )% |
| | | | |
| | | | | | | | | | | | | | | | | | | | | | | | |
Supplemental Data | | | | | | | | | | | | | | | | | | | | | | | | |
Net assets, end of period (000) | | $ | 1,795 | | | $ | 2,603 | | | $ | 6,816 | | | $ | 9,377 | | | $ | 15,404 | | | $ | 22,168 | |
| | | | |
Portfolio turnover rate of the Portfolio | | | 22 | % | | | 30 | % | | | 32 | % | | | 40 | % | | | 147 | % | | | 156 | % |
| | | | |
| | 1 | | Based on average shares outstanding. |
| | 2 | | Amount is less than $0.005 per share. |
| | 3 | | Distributions for annual periods determined in accordance with federal income tax regulations. |
| | 4 | | Where applicable, excludes the effects of any sales charges and assumes the reinvestment of distributions. |
| | 5 | | Aggregate total return. |
| | 6 | | Includes the Fund’s share of the Portfolio’s allocated expenses and/or net investment income. |
| | 7 | | Includes the Fund’s share of the Portfolio’s allocated fees waived of less than 0.01%. |
See Notes to Financial Statements.
| | | | | | |
| | | BLACKROCK LARGE CAP SERIES FUNDS, INC. | | MARCH 31, 2016 | | 33 |
| | | | |
| Financial Highlights (continued) | | | BlackRock Large Cap Value Fund | |
| | | | | | | | | | | | | | | | | | | | | | | | |
| | | Investor C | |
| | | Six Months
Ended
March 31,
2016 | | | Year Ended September 30, | |
| | | (Unaudited) | | | 2015 | | | 2014 | | | 2013 | | | 2012 | | | 2011 | |
Per Share Operating Performance | | | | | | | | | | | | | | | | | | | | | | | | |
Net asset value, beginning of period | | $ | 19.57 | | | $ | 20.19 | | | $ | 17.29 | | | $ | 14.45 | | | $ | 11.72 | | | $ | 12.44 | |
| | | | |
Net investment income (loss)1 | | | 0.01 | | | | (0.01 | ) | | | (0.01 | ) | | | 0.02 | | | | 0.02 | | | | (0.04 | ) |
Net realized and unrealized gain (loss) | | | 0.70 | | | | (0.60 | ) | | | 2.91 | | | | 2.99 | | | | 2.71 | | | | (0.68 | ) |
| | | | |
Net increase (decrease) from investment operations | | | 0.71 | | | | (0.61 | ) | | | 2.90 | | | | 3.01 | | | | 2.73 | | | | (0.72 | ) |
| | | | |
Distributions from net investment income2 | | | (0.01 | ) | | | (0.01 | ) | | | — | | | | (0.17 | ) | | | — | | | | — | |
| | | | |
Net asset value, end of period | | $ | 20.27 | | | $ | 19.57 | | | $ | 20.19 | | | $ | 17.29 | | | $ | 14.45 | | | $ | 11.72 | |
| | | | |
| | | | | | | | | | | | | | | | | | | | | | | | |
Total Return3 | | | | | | | | | | | | | | | | | | | | | | | | |
Based on net asset value | | | 3.66 | %4 | | | (3.00 | )% | | | 16.77 | % | | | 21.06 | % | | | 23.29 | % | | | (5.79 | )% |
| | | | |
| | | | | | | | | | | | | | | | | | | | | | | | |
Ratios to Average Net Assets5 | | | | | | | | | | | | | | | | | | | | | | | | |
Total expenses | | | 1.99 | %6,7 | | | 1.98 | %6 | | | 2.01 | %6 | | | 2.07 | %6 | | | 2.12 | % | | | 2.10 | % |
| | | | |
Total expenses after fees waived and/or reimbursed | | | 1.94 | %6,7 | | | 1.93 | %6 | | | 1.95 | %6 | | | 2.02 | %6 | | | 2.11 | % | | | 2.10 | % |
| | | | |
Net investment income (loss) | | | 0.06 | %6,7 | | | (0.07 | )%6 | | | (0.05 | )%6 | | | 0.09 | %6 | | | 0.14 | % | | | (0.29 | )% |
| | | | |
| | | | | | | | | | | | | | | | | | | | | | | | |
Supplemental Data | | | | | | | | | | | | | | | | | | | | | | | | |
Net assets, end of period (000) | | $ | 167,178 | | | $ | 171,844 | | | $ | 204,312 | | | $ | 204,690 | | | $ | 210,681 | | | $ | 220,527 | |
| | | | |
Portfolio turnover rate of the Portfolio | | | 22 | % | | | 30 | % | | | 32 | % | | | 40 | % | | | 147 | % | | | 156 | % |
| | | | |
| | 1 | | Based on average shares outstanding. |
| | 2 | | Distributions for annual periods determined in accordance with federal income tax regulations. |
| | 3 | | Where applicable, excludes the effects of any sales charges and assumes the reinvestment of distributions. |
| | 4 | | Aggregate total return. |
| | 5 | | Includes the Fund’s share of the Portfolio’s allocated expenses and/or net investment income. |
| | 6 | | Includes the Fund’s share of the Portfolio’s allocated fees waived of less than 0.01%. |
See Notes to Financial Statements.
| | | | | | |
| 34 | | BLACKROCK LARGE CAP SERIES FUNDS, INC. | | MARCH 31, 2016 | | |
| | | | |
| Financial Highlights (concluded) | | | BlackRock Large Cap Value Fund | |
| | | | | | | | | | | | | | | | | | | | | | | | |
| | | Class R | |
| | | Six Months
Ended
March 31,
2016 | | | Year Ended September 30, | |
| | | (Unaudited) | | | 2015 | | | 2014 | | | 2013 | | | 2012 | | | 2011 | |
Per Share Operating Performance | | | | | | | | | | | | | | | | | | | | | | | | |
Net asset value, beginning of period | | $ | 20.33 | | | $ | 20.96 | | | $ | 17.86 | | | $ | 14.92 | | | $ | 12.08 | | | $ | 12.81 | |
| | | | |
Net investment income1 | | | 0.06 | | | | 0.09 | | | | 0.09 | | | | 0.10 | | | | 0.09 | | | | 0.04 | |
Net realized and unrealized gain (loss) | | | 0.73 | | | | (0.61 | ) | | | 3.01 | | | | 3.09 | | | | 2.80 | | | | (0.72 | ) |
| | | | |
Net increase (decrease) from investment operations | | | 0.79 | | | | (0.52 | ) | | | 3.10 | | | | 3.19 | | | | 2.89 | | | | (0.68 | ) |
| | | | |
Distributions from net investment income2 | | | (0.09 | ) | | | (0.11 | ) | | | — | | | | (0.25 | ) | | | (0.05 | ) | | | (0.05 | ) |
| | | | |
Net asset value, end of period | | $ | 21.03 | | | $ | 20.33 | | | $ | 20.96 | | | $ | 17.86 | | | $ | 14.92 | | | $ | 12.08 | |
| | | | |
| | | | | | | | | | | | | | | | | | | | | | | | |
Total Return3 | | | | | | | | | | | | | | | | | | | | | | | | |
Based on net asset value | | | 3.91 | %4 | | | (2.52 | )% | | | 17.36 | % | | | 21.70 | % | | | 23.98 | % | | | (5.32 | )% |
| | | | |
| | | | | | | | | | | | | | | | | | | | | | | | |
Ratios to Average Net Assets5 | | | | | | | | | | | | | | | | | | | | | | | | |
Total expenses | | | 1.50 | %6,7 | | | 1.48 | %6 | | | 1.48 | %6 | | | 1.54 | %6 | | | 1.57 | % | | | 1.56 | % |
| | | | |
Total expenses after fees waived and/or reimbursed | | | 1.44 | %6,7 | | | 1.43 | %6 | | | 1.43 | %6 | | | 1.49 | %6 | | | 1.56 | % | | | 1.56 | % |
| | | | |
Net investment income | | | 0.56 | %6,7 | | | 0.43 | %6 | | | 0.48 | %6 | | | 0.63 | %6 | | | 0.70 | % | | | 0.25 | % |
| | | | |
| | | | | | | | | | | | | | | | | | | | | | | | |
Supplemental Data | | | | | | | | | | | | | | | | | | | | | | | | |
Net assets, end of period (000) | | $ | 36,257 | | | $ | 34,551 | | | $ | 43,377 | | | $ | 49,267 | | | $ | 59,934 | | | $ | 67,672 | |
| | | | |
Portfolio turnover rate of the Portfolio | | | 22 | % | | | 30 | % | | | 32 | % | | | 40 | % | | | 147 | % | | | 156 | % |
| | | | |
| | 1 | | Based on average shares outstanding. |
| | 2 | | Distributions for annual periods determined in accordance with federal income tax regulations. |
| | 3 | | Where applicable, assumes the reinvestment of distributions. |
| | 4 | | Aggregate total return. |
| | 5 | | Includes the Fund’s share of the Portfolio’s allocated expenses and/or net investment income. |
| | 6 | | Includes the Fund’s share of the Portfolio’s allocated fees waived of less than 0.01%. |
See Notes to Financial Statements.
| | | | | | |
| | | BLACKROCK LARGE CAP SERIES FUNDS, INC. | | MARCH 31, 2016 | | 35 |
| | | | |
| Financial Highlights | | | BlackRock Large Cap Value Retirement Portfolio | |
| | | | | | | | | | | | | | | | | | | | | | | | |
| | | Institutional | |
| | | Six Months
Ended
March 31,
2016 | | | Year Ended September 30, | |
| | | (Unaudited) | | | 2015 | | | 2014 | | | 2013 | | | 2012 | | | 2011 | |
Per Share Operating Performance | | | | | | | | | | | | | | | | | | | | | | | | |
Net asset value, beginning of period | | $ | 18.63 | | | $ | 21.39 | | | $ | 19.12 | | | $ | 15.93 | | | $ | 12.91 | | | $ | 13.67 | |
| | | | |
Net investment income1 | | | 0.12 | | | | 0.24 | | | | 0.25 | | | | 0.25 | | | | 0.24 | | | | 0.17 | |
Net realized and unrealized gain (loss) | | | 0.68 | | | | (0.54 | ) | | | 3.12 | | | | 3.30 | | | | 2.99 | | | | (0.76 | ) |
| | | | |
Net increase (decrease) from investment operations | | | 0.80 | | | | (0.30 | ) | | | 3.37 | | | | 3.55 | | | | 3.23 | | | | (0.59 | ) |
| | | | |
Distributions:2 | | | | | | | | | | | | | | | | | | | | | | | | |
From net investment income | | | (0.25 | ) | | | (0.25 | ) | | | (0.14 | ) | | | (0.36 | ) | | | (0.21 | ) | | | (0.17 | ) |
From net realized gain | | | (1.07 | ) | | | (2.21 | ) | | | (0.96 | ) | | | — | | | | — | | | | — | |
| | | | |
Total distributions | | | (1.32 | ) | | | (2.46 | ) | | | (1.10 | ) | | | (0.36 | ) | | | (0.21 | ) | | | (0.17 | ) |
| | | | |
Net asset value, end of period | | $ | 18.11 | | | $ | 18.63 | | | $ | 21.39 | | | $ | 19.12 | | | $ | 15.93 | | | $ | 12.91 | |
| | | | |
| | | | | | | | | | | | | | | | | | | | | | | | |
Total Return3 | | | | | | | | | | | | | | | | | | | | | | | | |
Based on net asset value | | | 4.34 | %4 | | | (1.80 | )% | | | 18.23 | % | | | 22.71 | % | | | 25.23 | % | | | (4.44 | )% |
| | | | |
| | | | | | | | | | | | | | | | | | | | | | | | |
Ratios to Average Net Assets5 | | | | | | | | | | | | | | | | | | | | | | | | |
Total expenses | | | 0.73 | %6,7 | | | 0.71 | %6 | | | 0.68 | %6 | | | 0.68 | %6 | | | 0.67 | % | | | 0.70 | % |
| | | | |
Total expenses after reimbursement | | | 0.67 | %6,7 | | | 0.67 | %6 | | | 0.67 | %6 | | | 0.67 | %6 | | | 0.62 | % | | | 0.67 | % |
| | | | |
Net investment income | | | 1.33 | %6,7 | | | 1.19 | %6 | | | 1.24 | %6 | | | 1.42 | %6 | | | 1.63 | % | | | 1.13 | % |
| | | | |
| | | | | | | | | | | | | | | | | | | | | | | | |
Supplemental Data | | | | | | | | | | | | | | | | | | | | | | | | |
Net assets, end of period (000) | | $ | 162,450 | | | $ | 155,323 | | | $ | 159,865 | | | $ | 133,921 | | | $ | 103,636 | | | $ | 144,964 | |
| | | | |
Portfolio turnover rate of the Portfolio | | | 22 | % | | | 30 | % | | | 32 | % | | | 40 | % | | | 147 | % | | | 156 | % |
| | | | |
| | 1 | | Based on average shares outstanding. |
| | 2 | | Distributions for annual periods determined in accordance with federal income tax regulations. |
| | 3 | | Where applicable, assumes the reinvestment of distributions. |
| | 4 | | Aggregate total return. |
| | 5 | | Includes the Fund’s share of the Portfolio’s allocated expenses and/or net investment income. |
| | 6 | | Includes the Fund’s share of the Portfolio’s allocated fees waived of less than 0.01%. |
See Notes to Financial Statements.
| | | | | | |
| 36 | | BLACKROCK LARGE CAP SERIES FUNDS, INC. | | MARCH 31, 2016 | | |
| | | | |
| Notes to Financial Statements (Unaudited) | | | BlackRock Large Cap Series Funds, Inc. | |
1. Organization:
BlackRock Large Cap Series Funds, Inc. (the “Corporation”) is registered under the Investment Company Act of 1940, as amended (the “1940 Act”), as an open-end management investment company. The Corporation is organized as a Maryland corporation. The following are herein collectively referred to as the “Funds” or individually, a “Fund”:
| | | | | | |
| Fund Name | | Herein Referred To As | | | | Diversification Classification |
BlackRock Large Cap Core Fund | | Large Cap Core | | | | Diversified |
BlackRock Large Cap Growth Fund | | Large Cap Growth | | | | Diversified |
BlackRock Large Cap Value Fund | | Large Cap Value | | | | Diversified |
BlackRock Large Cap Value Retirement Portfolio | | Large Cap Value Retirement | | | | Diversified |
The Funds seek to achieve their investment objectives by investing all of their assets in the corresponding master portfolios (individually, a “Portfolio” or collectively, the “Portfolios”) of Master Large Cap Series LLC (the “Master LLC”), an affiliate of the Funds. Large Cap Core invests all of its assets in Master Large Cap Core Portfolio. Large Cap Growth invests all of its assets in Master Large Cap Growth Portfolio. Large Cap Value and Large Cap Value Retirement invest all of their assets in Master Large Cap Value Portfolio. Each Portfolio has the same investment objective and strategies as the corresponding Fund. The value of a Fund’s investment in the applicable Portfolio reflects the Fund’s proportionate interest in the net assets of such Portfolio. The performance of a Fund is directly affected by the performance of the applicable Portfolio. At March 31, 2016, the percentage of Master Large Cap Core Portfolio owned by Large Cap Core was 73.1%; the percentage of Master Large Cap Growth Portfolio owned by Large Cap Growth was 98.6%; and the percentages of Master Large Cap Value Portfolio owned by Large Cap Value and Large Cap Value Retirement were 80.6% and 19.4%; respectively. As such, the financial statements of the Portfolios, including the Schedules of Investments, are included elsewhere in this report and should be read in conjunction with the Funds’ financial statements.
Large Cap Core, Large Cap Growth and Large Cap Value each offer multiple classes of shares. Large Cap Value Retirement offers Institutional Shares. Institutional and Service Shares are sold only to certain eligible investors. All classes of shares have identical voting, dividend, liquidation and other rights and the same terms and conditions. Service, Investor A, Investor B, Investor C and Class R Shares bear certain expenses related to shareholder servicing of such shares, and Investor B, Investor C and Class R Shares also bear certain expenses related to the distribution of such shares. Investor B Shares are only available through exchanges and dividend reinvestments by existing shareholders and for purchase by certain employer-sponsored retirement plans. Class R Shares are sold only to certain employer-sponsored retirement plans. Investor A and Class C Shares are generally available through financial intermediaries. Each class has exclusive voting rights with respect to matters relating to its shareholder servicing and distribution expenditures (except that Investor B shareholders may vote on material changes to the Investor A distribution plan).
| | | | | | | | | | | | |
| Share Class | | Initial Sales Charge | | | | | CDSC | | | | | Conversion Privilege |
Institutional, Service and Class R Shares | | No | | | | | No | | | | | None |
Investor A Shares | | Yes | | | | | No1 | | | | | None |
Investor B Shares | | No | | | | | Yes | | | | | To Investor A Shares after approximately 8 years |
Investor C Shares | | No | | | | | Yes | | | | | None |
| | 1 | | Investor A Shares may be subject to a CDSC for certain redemptions where no initial sales charge was paid at the time of purchase. |
2. Significant Accounting Policies:
The financial statements are prepared in conformity with accounting principles generally accepted in the United States of America (“U.S. GAAP”), which may require management to make estimates and assumptions that affect the reported amounts of assets and liabilities in the financial statements, disclosure of contingent assets and liabilities at the date of the financial statements and the reported amounts of increases and decreases in net assets from operations during the reporting period. Actual results could differ from those estimates. Each Fund is considered an investment company under U.S. GAAP and follows the accounting and reporting guidance applicable to investment companies. Below is a summary of significant accounting policies:
Investment Transactions and Investment Income: For financial reporting purposes, contributions to and withdrawals from the Portfolios are accounted on a trade date basis. Each Fund records its proportionate share of the corresponding Portfolio’s income, expenses and realized and unrealized gains and losses on a daily basis. Realized and unrealized gains and losses are adjusted utilizing partnership tax allocation rules. In addition, each Fund accrues its own expenses. Income, expenses and realized and unrealized gains and losses are allocated daily to each class based on its relative net assets.
Distributions: Distributions paid by the Funds are recorded on the ex-dividend date. The character of distributions is determined in accordance with federal income tax regulations, which may differ from U.S. GAAP.
Indemnifications: In the normal course of business, a Fund enters into contracts that contain a variety of representations that provide general indemnification. A Fund’s maximum exposure under these arrangements is unknown because it involves future potential claims against the Fund, which cannot be predicted with any certainty.
| | | | | | |
| | | BLACKROCK LARGE CAP SERIES FUNDS, INC. | | MARCH 31, 2016 | | 37 |
| | | | |
| Notes to Financial Statements (continued) | | | BlackRock Large Cap Series Funds, Inc. | |
Other: Expenses directly related to a Fund or its classes are charged to that Fund or the applicable class. Other operating expenses shared by several funds, including other funds managed by BlackRock Advisors, LLC (the “Manager”), are prorated among those funds on the basis of relative net assets or other appropriate methods. Expenses directly related to a Fund and other shared expenses prorated to a Fund are allocated daily to each class based on its relative net assets or other appropriate methods.
3. Investment Valuation and Fair Value Measurements:
Each Fund’s policy is to value its financial instruments at fair value. Each Fund records its investment in the corresponding the Portfolio at fair value based on the Fund’s proportionate interest in the net assets of the Portfolio. Valuation of securities held by the Portfolio is discussed in Note 3 of the Portfolios’ Notes to Financial Statements, which are included elsewhere in this report.
4. Administration Agreement and Other Transactions with Affiliates:
The PNC Financial Services Group, Inc. is the largest stockholder and an affiliate of BlackRock, Inc. (“BlackRock”) for 1940 Act purposes.
Administration
The Corporation, on behalf of the Funds, entered into an Administration Agreement with BlackRock Advisors, LLC (the “Administrator”), an indirect, wholly owned subsidiary of BlackRock, to provide administrative services (other than investment advice and related portfolio activities). For such services, Large Cap Core, Large Cap Growth and Large Cap Value each pay the Administrator a monthly fee at an annual rate of 0.25% of the average daily value of such Fund’s net assets. The Funds do not pay an investment advisory fee or investment management fee. With respect to Large Cap Value Retirement, the Administrator does not receive an administration fee.
Service and Distribution Fees
The Corporation, on behalf of Large Cap Core, Large Cap Growth and Large Cap Value, entered into a Distribution Agreement and Distribution Plans with BlackRock Investments, LLC (“BRIL”), an affiliate of the Administrator. Pursuant to the Distribution Plans and in accordance with Rule 12b-1 under the 1940 Act, each Fund pays BRIL ongoing service and distribution fees. The fees are accrued daily and paid monthly at annual rates based upon the average daily net assets of the shares of each Fund as follows:
| | | | | | | | | | | | | | | | | | | | |
| | | | Service | | | | Investor A | | | | Investor B | | | | Investor C | | | | Class R | |
Service Fee | | | 0.25% | | | | 0.25% | | | | 0.25% | | | | 0.25% | | | | 0.25% | |
Distribution Fee | | | — | | | | — | | | | 0.75% | | | | 0.75% | | | | 0.25% | |
Pursuant to sub-agreements with BRIL, broker-dealers and BRIL provide shareholder servicing and distribution services to the Funds. The ongoing service and/or distribution fee compensates BRIL and each broker-dealer for providing shareholder servicing and/or distribution related services to the shareholders.
For the six months ended March 31, 2016, the following table shows the class specific service and distribution fees borne directly by each class of each Fund:
| | | | | | | | | | | | |
| | | Service | | Investor A | | Investor B | | Investor C | | Class R | | Total |
Large Cap Core | | $ 1,417 | | $951,678 | | $26,451 | | $1,775,966 | | $93,205 | | $2,848,717 |
Large Cap Growth | | $ 2,055 | | $685,040 | | $ 5,531 | | $ 977,108 | | $55,538 | | $1,725,272 |
Large Cap Value | | $14,843 | | $375,751 | | $11,143 | | $ 887,005 | | $89,056 | | $1,377,798 |
| | | | | | |
| 38 | | BLACKROCK LARGE CAP SERIES FUNDS, INC. | | MARCH 31, 2016 | | |
| | | | |
| Notes to Financial Statements (continued) | | | BlackRock Large Cap Series Funds, Inc. | |
Transfer Agent
Pursuant to written agreements, certain financial intermediaries, some of which may be affiliates, provide the Funds with sub-accounting, recordkeeping, sub-transfer agency and other administrative services with respect to sub-accounts they service. For these services, these entities receive an asset-based fee or annual fee per shareholder account, which will vary depending on share class and/or net assets. For the six months ended March 31, 2016, the Funds paid the following amounts to affiliates of BlackRock in return for these services, which are included in transfer agent — class specific in the Statements of Operations:
| | | | | | | | | | | | |
| | | Institutional | | Service | | Investor A | | Investor C | | | Total | |
Large Cap Core | | $ 20,240 | | $891 | | $ 132 | | — | | | $ 21,263 | |
Large Cap Growth | | $131,358 | | $184 | | $1,163 | | — | | | $132,705 | |
Large Cap Value | | $ 2,954 | | $539 | | $1,336 | | $48 | | | $ 4,877 | |
The Administrator maintains a call center that is responsible for providing certain shareholder services to the Funds. Shareholder services include responding to shareholder inquiries and processing subscriptions and redemptions based upon instructions from shareholders. For the six months ended March 31, 2016, the Funds reimbursed the Administrator the following amounts for costs incurred in running the call center, which are included in transfer agent — class specific in the Statements of Operations:
| | | | | | | | | | | | | | | | | | | | | | | | | | | | |
| | | | Institutional | | | | Service | | | | Investor A | | | | Investor B | | | | Investor C | | | | Class R | | | | Total | |
Large Cap Core | | | $14,433 | | | | $ 12 | | | | $111,241 | | | | $6,143 | | | | $2,927 | | | | $130 | | | | $134,886 | |
Large Cap Growth | | | $ 774 | | | | $ 344 | | | | $ 5,794 | | | | $ 190 | | | | $1,455 | | | | $ 43 | | | | $ 8,600 | |
Large Cap Value | | | $ 578 | | | | $2,015 | | | | $ 13,890 | | | | $ 423 | | | | $1,024 | | | | — | | | | $ 17,930 | |
Large Cap Value Retirement | | | $ 227 | | | | — | | | | — | | | | — | | | | — | | | | — | | | | $ 227 | |
For the six months ended March 31, 2016, the following table shows the class specific transfer agent fees borne directly by each class of each Fund: | |
| | | | Institutional | | | | Service | | | | Investor A | | | | Investor B | | | | Investor C | | | | Class R | | | | Total | |
Large Cap Core | | | $252,940 | | | | $ 1,094 | | | | $878,357 | | | | $31,286 | | | | $383,679 | | | | $33,957 | | | | $1,581,313 | |
Large Cap Growth | | | $275,491 | | | | $ 1,499 | | | | $515,995 | | | | $ 2,401 | | | | $210,439 | | | | $19,665 | | | | $1,025,490 | |
Large Cap Value | | | $ 95,553 | | | | $10,635 | | | | $254,865 | | | | $ 4,328 | | | | $161,119 | | | | 33,734 | | | | $ 560,234 | |
Large Cap Value Retirement | | | $103,551 | | | | — | | | | — | | | | — | | | | — | | | | — | | | | $ 103,551 | |
Other Fees
For the six months ended March 31, 2016, affiliates earned underwriting discounts, direct commissions and dealer concessions on sales of the Funds’ Investor A Shares as follows:
| | | | |
Large Cap Core | | $ | 14,880 | |
Large Cap Growth | | $ | 24,241 | |
Large Cap Value | | $ | 6,170 | |
For the six months ended March 31, 2016, affiliates received the following CDSCs as follows:
| | | | | | | | |
| | | | Investor A | | | | Investor C | |
Large Cap Core | | | $1,622 | | | | $10,166 | |
Large Cap Growth | | | $2,519 | | | | $14,661 | |
Large Cap Value | | | — | | | | $ 1,906 | |
| | | | | | |
| | | BLACKROCK LARGE CAP SERIES FUNDS, INC. | | MARCH 31, 2016 | | 39 |
| | | | |
| Notes to Financial Statements (continued) | | | BlackRock Large Cap Series Funds, Inc. | |
Expense Limitations, Waivers and Reimbursements
With respect to Large Cap Core, Large Cap Growth and Large Cap Value Retirement, the Administrator contractually agreed to waive and/or reimburse fees or expenses in order to limit expenses, excluding interest expense, dividend expense, tax expense, acquired fund fees and expenses and certain other fund expenses, which constitute extraordinary expenses not incurred in the ordinary course of the Fund’s business. The expense limitations as a percentage of average daily net assets are as follows:
| | | | | | |
| | | Large Cap Core | | Large Cap Growth | | Large Cap Value Retirement |
Institutional | | — | | 0.84% | | 0.67% |
Service | | — | | 1.13% | | — |
Investor A | | 1.14% | | 1.13% | | — |
Investor B | | 1.97% | | 1.95% | | — |
Investor C | | — | | 1.95% | | — |
Class R | | — | | 1.38% | | — |
The Administrator has agreed not to reduce or discontinue this contractual waiver or reimbursement prior to February 1, 2017, unless approved by the Board of Directors of the Corporation (the “Board”), including a majority of the independent directors or by a majority of the outstanding voting securities of the Funds. These amounts waived and/or reimbursed, if any, are shown as fees waived and/or reimbursed by administrator and transfer agent fees reimbursed — class specific, respectively, in the Statements of Operations.
Class specific expense reimbursements are as follows:
| | | | | | | | | | | | | | | | | | | | | | | | | | | | |
| | | | Institutional | | | | Service | | | | Investor A | | | | Investor B | | | | Investor C | | | | Class R | | | | Total | |
Large Cap Core | | | — | | | | — | | | | $409,311 | | | | $25,941 | | | | — | | | | — | | | | $435,252 | |
Large Cap Growth | | | $201,489 | | | | $829 | | | | $293,110 | | | | $ 1,590 | | | | $62,888 | | | | $10,626 | | | | $570,532 | |
Large Cap Value Retirement | | | $ 49,616 | | | | — | | | | — | | | | — | | | | — | | | | — | | | | $ 49,616 | |
With respect to Large Cap Value, the Administrator voluntarily agreed to waive 0.05%, as a percentage of average daily net assets, of the administration fee payable. This voluntary waiver may be reduced or discontinued at any time without notice. This amount waived, if any, is shown as fees waived and/or reimbursed by administrator, in the Statements of Operations.
Officers and Directors
Certain officers and/or directors of the Corporation are officers and/or directors of BlackRock or its affiliates. The Funds reimburse the Administrator for a portion of the compensation paid to the Corporation’s Chief Compliance Officer, which is included in Officer in the Statements of Operations.
5. Income Tax Information:
It is each Fund’s policy to comply with the requirements of the Internal Revenue Code of 1986, as amended, applicable to regulated investment companies, and to distribute substantially all of its taxable income to its shareholders. Therefore, no federal income tax provision is required.
Each Fund files U.S. federal and various state and local tax returns. No income tax returns are currently under examination. The statute of limitations on each Fund’s U.S. federal tax returns remains open for each of the four years ended September 30, 2015. The statutes of limitations on each Fund’s state and local tax returns may remain open for an additional year depending upon the jurisdiction.
Management has analyzed tax laws and regulations and their application to the Funds as of March 31, 2016, inclusive of open tax years, and does not believe that there are any uncertain tax positions that require recognition of a tax liability in the Funds’ financial statements.
| | | | | | |
| 40 | | BLACKROCK LARGE CAP SERIES FUNDS, INC. | | MARCH 31, 2016 | | |
| | | | |
| Notes to Financial Statements (continued) | | | BlackRock Large Cap Series Funds, Inc. | |
As of period end, the Funds listed below had capital loss carryforwards available to offset future realized capital gains through the indicated expiration dates as follows:
| | | | |
| Expires September 30, | | Large Cap
Value | |
2017 | | $ | 543,404,823 | |
6. Capital Share Transactions:
Transactions in capital shares for each class were as follows:
| | | | | | | | | | | | | | | | | | |
| | | Six Months Ended
March 31, 2016 | | | | | Year Ended
September 30, 2015 | |
| Large Cap Core | | Shares | | | Amount | | | | | Shares | | | Amount | |
Institutional | | | | | | | | | | | | | | | | | | |
Shares sold | | | 1,714,340 | | | | $ 29,592,030 | | | | | | 3,773,841 | | | | $ 70,153,843 | |
Shares issued in reinvestment of distributions | | | 666,923 | | | | 11,804,515 | | | | | | 126,387 | | | | 2,258,546 | |
Shares redeemed | | | (2,961,289 | ) | | | (51,414,952) | | | | | | (5,938,890 | ) | | | (108,654,427) | |
| | | | | | | | | | |
Net decrease | | | (580,026 | ) | | | $(10,018,407) | | | | | | (2,038,662 | ) | | | $ (36,242,038) | |
| | | | | | | | | | |
| | | | | | | | | | | | | | | | | | |
Service | | | | | | | | | | | | | | | | | | |
Shares sold | | | 2,557 | | | | $43,985 | | | | | | 3,797 | | | | $ 70,013 | |
Shares issued in reinvestment of distributions | | | 1,782 | | | | 31,361 | | | | | | 174 | | | | 3,095 | |
Shares redeemed | | | (498 | ) | | | (8,714) | | | | | | (3,471 | ) | | | (64,052) | |
| | | | | | | | | | |
Net increase | | | 3,841 | | | | $66,632 | | | | | | 500 | | | | $ 9,056 | |
| | | | | | | | | | |
| | | | | | | | | | | | | | | | | | |
Investor A | | | | | | | | | | | | | | | | | | |
Shares sold and automatic conversion of shares | | | 1,953,359 | | | | $ 33,473,737 | | | | | | 4,899,375 | | | | $ 87,706,303 | |
Shares issued in reinvestment of distributions | | | 1,169,926 | | | | 20,216,045 | | | | | | 142,959 | | | | 2,496,056 | |
Shares redeemed | | | (3,554,622 | ) | | | (60,980,505) | | | | | | (7,749,316 | ) | | | (138,830,844) | |
| | | | | | | | | | |
Net decrease | | | (431,337 | ) | | | $ (7,290,723) | | | | | | (2,706,982 | ) | | | $ (48,628,485) | |
| | | | | | | | | | |
| | | | | | | | | | | | | | | | | | |
Investor B | | | | | | | | | | | | | | | | | | |
Shares sold | | | 6,087 | | | | $ 92,474 | | | | | | 17,139 | | | | $ 282,900 | |
Shares issued in reinvestment of distributions | | | 9,191 | | | | 145,857 | | | | | | — | | | | — | |
Shares redeemed and automatic conversion of shares | | | (123,945 | ) | | | (1,910,378) | | | | | | (473,561 | ) | | | (7,833,466) | |
| | | | | | | | | | |
Net decrease | | | (108,667 | ) | | | $(1,672,047) | | | | | | (456,422 | ) | | | $(7,550,566) | |
| | | | | | | | | | |
| | | | | | | | | | | | | | | | | | |
Investor C | | | | | | | | | | | | | | | | | | |
Shares sold | | | 1,536,004 | | | | $ 23,889,113 | | | | | | 3,814,222 | | | | $ 62,064,414 | |
Shares issued in reinvestment of distributions | | | 536,402 | | | | 8,394,429 | | | | | | — | | | | 10 | |
Shares redeemed | | | (3,114,137 | ) | | | (48,296,609) | | | | | | (5,723,389 | ) | | | (93,139,848) | |
| | | | | | | | | | |
Net decrease | | | (1,041,731 | ) | | | $(16,013,067) | | | | | | (1,909,167 | ) | | | $(31,075,424) | |
| | | | | | | | | | |
| | | | | | | | | | | | | | | | | | |
Class R | | | | | | | | | | | | | | | | | | |
Shares sold | | | 355,450 | | | | $ 5,841,978 | | | | | | 635,301 | | | | $ 10,858,458 | |
Shares issued in reinvestment of distributions | | | 62,580 | | | | 1,035,061 | | | | | | — | | | | — | |
Shares redeemed | | | (481,418 | ) | | | (7,829,638) | | | | | | (992,712 | ) | | | (16,958,234) | |
| | | | | | | | | | |
Net decrease | | | (63,388 | ) | | | $ (952,599) | | | | | | (357,411 | ) | | | $ (6,099,776) | |
| | | | | | | | | | |
Total Net Decrease | | | (2,221,308 | ) | | | $(35,880,211) | | | | | | (7,468,144 | ) | | | $(129,587,233) | |
| | | | | | | | | | |
| | | | | | |
| | | BLACKROCK LARGE CAP SERIES FUNDS, INC. | | MARCH 31, 2016 | | 41 |
| | | | |
| Notes to Financial Statements (continued) | | | BlackRock Large Cap Series Funds, Inc. | |
| | | | | | | | | | | | | | | | | | |
| | | Six Months Ended
March 31, 2016 | | | | | Year Ended
September 30, 2015 | |
| Large Cap Growth | | Shares | | | Amount | | | | | Shares | | | Amount | |
Institutional | | | | | | | | | | | | | | | | | | |
Shares sold | | | 1,094,727 | | | | $ 14,797,799 | | | | | | 4,962,477 | | | | $ 71,239,064 | |
Shares issued in reinvestment of distributions | | | 1,193,477 | | | | 16,290,951 | | | | | | 2,755,379 | | | | 37,803,785 | |
Shares redeemed | | | (927,524 | ) | | | (12,744,237) | | | | | | (6,972,356 | ) | | | (99,821,062) | |
| | | | | | | | | | |
Net increase | | | 1,360,680 | | | | $ 18,344,513 | | | | | | 745,500 | | | | $ 9,221,787 | |
| | | | | | | | | | |
| | | | | | | | | | | | | | | | | | |
Service | | | | | | | | | | | | | | | | | | |
Shares sold | | | 3,306 | | | | $ 42,788 | | | | | | 5,135 | | | | $ 73,556 | |
Shares issued in reinvestment of distributions | | | 5,648 | | | | 76,816 | | | | | | 16,280 | | | | 222,707 | |
Shares redeemed | | | (5,864 | ) | | | (75,458) | | | | | | (31,432 | ) | | | (442,789) | |
| | | | | | | | | | |
Net increase (decrease) | | | 3,090 | | | | $ 44,146 | | | | | | (10,017 | ) | | | $(146,526) | |
| | | | | | | | | | |
| | | | | | | | | | | | | | | | | | |
Investor A | | | | | | | | | | | | | | | | | | |
Shares sold and automatic conversion of shares | | | 4,234,501 | | | | $ 55,737,705 | | | | | | 8,530,604 | | | | $ 118,056,683 | |
Shares issued in reinvestment of distributions | | | 2,014,303 | | | | 26,226,027 | | | | | | 4,716,368 | | | | 61,925,853 | |
Shares redeemed | | | (5,077,303 | ) | | | (65,816,264) | | | | | | (8,427,346 | ) | | | (116,214,363) | |
| | | | | | | | | | |
Net increase | | | 1,171,501 | | | | $ 16,147,468 | | | | | | 4,819,626 | | | | $ 63,768,173 | |
| | | | | | | | | | |
| | | | | | | | | | | | | | | | | | |
Investor B | | | | | | | | | | | | | | | | | | |
Shares sold | | | 12,095 | | | | $ 138,233 | | | | | | 25,457 | | | | $ 308,186 | |
Shares issued in reinvestment of distributions | | | 5,600 | | | | 63,899 | | | | | | 28,424 | | | | 331,709 | |
Shares redeemed and automatic conversion of shares | | | (49,330 | ) | | | (561,192) | | | | | | (156,647 | ) | | | (1,915,916) | |
| | | | | | | | | | |
Net decrease | | | (31,635 | ) | | | $(359,060) | | | | | | (102,766 | ) | | | $(1,276,021) | |
| | | | | | | | | | |
| | | | | | | | | | | | | | | | | | |
Investor C | | | | | | | | | | | | | | | | | | |
Shares sold | | | 2,029,100 | | | | $ 23,113,707 | | | | | | 4,355,063 | | | | $ 52,891,600 | |
Shares issued in reinvestment of distributions | | | 910,846 | | | | 10,274,160 | | | | | | 2,119,680 | | | | 24,482,215 | |
Shares redeemed | | | (3,216,287 | ) | | | (36,384,313) | | | | | | (4,366,776 | ) | | | (52,761,381) | |
| | | | | | | | | | |
Net increase (decrease) | | | (276,341 | ) | | | $ (2,996,446) | | | | | | 2,107,967 | | | | $ 24,612,434 | |
| | | | | | | | | | |
| | | | | | | | | | | | | | | | | | |
Class R | | | | | | | | | | | | | | | | | | |
Shares sold | | | 443,559 | | | | $ 5,549,975 | | | | | | 459,276 | | | | $ 6,028,623 | |
Shares issued in reinvestment of distributions | | | 94,341 | | | | 1,158,507 | | | | | | 236,435 | | | | 2,941,251 | |
Shares redeemed | | | (395,641 | ) | | | (4,898,226) | | | | | | (641,011 | ) | | | (8,386,710) | |
| | | | | | | | | | |
Net increase | | | 142,259 | | | | $ 1,810,256 | | | | | | 54,700 | | | | $ 583,164 | |
| | | | | | | | | | |
Total Net Increase | | | 2,369,554 | | | | $32,990,877 | | | | | | 7,615,010 | | | | $96,763,011 | |
| | | | | | | | | | |
| | | | | | | | | | | | | | | | | | |
| Large Cap Value | | | | | | | | | | | | | | |
Institutional | | | | | | | | | | | | | | | | | | |
Shares sold | | | 726,846 | | | | $ 16,195,571 | | | | | | 1,205,013 | | | | $ 27,672,716 | |
Shares issued in reinvestment of distributions | | | 56,405 | | | | 1,255,014 | | | | | | 67,082 | | | | 1,503,310 | |
Shares redeemed | | | (809,981 | ) | | | (17,514,374) | | | | | | (2,048,036 | ) | | | (47,005,290) | |
| | | | | | | | | | |
Net decrease | | | (26,730 | ) | | | $ (63,789) | | | | | | (775,941 | ) | | | $(17,829,264) | |
| | | | | | | | | | |
| | | | | | | | | | | | | | | | | | |
Service | | | | | | | | | | | | | | | | | | |
Shares sold | | | 1,097 | | | | $ 23,921 | | | | | | 4,315 | | | | $ 97,924 | |
Shares issued in reinvestment of distributions | | | 3,790 | | | | 83,833 | | | | | | 4,792 | | | | 106,765 | |
Shares redeemed | | | (27,076 | ) | | | (595,415) | | | | | | (93,099 | ) | | | (2,115,586) | |
| | | | | | | | | | |
Net decrease | | | (22,189 | ) | | | $(487,661) | | | | | | (83,992 | ) | | | $(1,910,897) | |
| | | | | | | | | | |
| | | | | | |
| 42 | | BLACKROCK LARGE CAP SERIES FUNDS, INC. | | MARCH 31, 2016 | | |
| | | | |
| Notes to Financial Statements (concluded) | | | BlackRock Large Cap Series Funds, Inc. | |
| | | | | | | | | | | | | | | | | | |
| | | Six Months Ended
March 31, 2016 | | | | | Year Ended
September 30, 2015 | |
| Large Cap Value (concluded) | | Shares | | | Amount | | | | | Shares | | | Amount | |
Investor A | | | | | | | | | | | | | | | | | | |
Shares sold and automatic conversion of shares | | | 1,614,978 | | | | $ 35,518,295 | | | | | | 1,997,033 | | | | $ 44,709,321 | |
Shares issued in reinvestment of distributions | | | 95,340 | | | | 2,083,144 | | | | | | 113,425 | | | | 2,496,477 | |
Shares redeemed | | | (2,379,707 | ) | | | (51,173,308) | | | | | | (4,192,798 | ) | | | (94,058,562) | |
| | | | | | | | | | |
Net decrease | | | (669,389 | ) | | | $(13,571,869) | | | | | | (2,082,340 | ) | | | $(46,852,764) | |
| | | | | | | | | | |
| | | | | | | | | | | | | | | | | | |
Investor B | | | | | | | | | | | | | | | | | | |
Shares sold | | | 3,233 | | | | $ 63,023 | | | | | | 4,468 | | | | $ 93,158 | |
Shares redeemed and automatic conversion of shares | | | (47,288 | ) | | | (951,940) | | | | | | (207,441 | ) | | | (4,374,077) | |
| | | | | | | | | | |
Net decrease | | | (44,055 | ) | | | $(888,917) | | | | | | (202,973 | ) | | | $(4,280,919) | |
| | | | | | | | | | |
| | | | | | | | | | | | | | | | | | |
Investor C | | | | | | | | | | | | | | | | | | |
Shares sold | | | 1,811,773 | | | | $ 37,422,014 | | | | | | 1,132,567 | | | | $ 23,559,890 | |
Shares issued in reinvestment of distributions | | | 2,541 | | | | 51,651 | | | | | | 6,486 | | | | 132,964 | |
Shares redeemed | | | (2,350,476 | ) | | | (46,090,251) | | | | | | (2,478,024 | ) | | | (51,550,779) | |
| | | | | | | | | | |
Net decrease | | | (536,162 | ) | | | $ (8,616,586) | | | | | | (1,338,971 | ) | | | $(27,857,925) | |
| | | | | | | | | | |
| | | | | | | | | | | | | | | | | | |
Class R | | | | | | | | | | | | | | | | | | |
Shares sold | | | 276,982 | | | | $ 5,719,737 | | | | | | 420,516 | | | | $ 9,092,961 | |
Shares issued in reinvestment of distributions | | | 7,689 | | | | 161,931 | | | | | | 10,142 | | | | 215,130 | |
Shares redeemed | | | (259,810 | ) | | | (5,371,902) | | | | | | (800,942 | ) | | | (17,387,664) | |
| | | | | | | | | | |
Net increase (decrease) | | | 24,861 | | | | $ 509,766 | | | | | | (370,284 | ) | | | $ (8,079,573) | |
| | | | | | | | | | |
Total Net Decrease | | | (1,273,664 | ) | | | $(23,119,056) | | | | | | (4,854,501 | ) | | | $(106,811,342) | |
| | | | | | | | | | |
| | | | | | | | | | | | | | | | | | |
| Large Cap Value Retirement | | | | | | | | | | | | | | |
| Institutional | | | | | | | | | | | | | | |
Shares sold | | | 774,828 | | | | $ 14,123,568 | | | | | | 1,281,285 | | | | $ 25,875,935 | |
Shares issued in reinvestment of distributions | | | 607,655 | | | | 10,992,475 | | | | | | 953,992 | | | | 18,431,121 | |
Shares redeemed | | | (745,828 | ) | | | (13,613,342) | | | | | | (1,374,558 | ) | | | (27,741,211) | |
| | | | | | | | | | |
Net increase | | | 636,655 | | | | $ 11,502,701 | | | | | | 860,719 | | | | $ 16,565,845 | |
| | | | | | | | | | |
7. Subsequent Events:
Management’s evaluation of the impact of all subsequent events on the Master LLC’s financial statements was completed through the date the financial statements were issued and the following items were noted:
Effective April 21, 2016, the credit agreement was extended until April 2017. The updated agreement includes the following terms: A fee of 0.12% per annum on the unused commitment amounts and interest at a rate equal to the higher of (a) one-month LIBOR (but in any event, not less than 0.00%) on the date the loan is made plus 0.80% per annum or (b) the Fed Funds rate (but in any event, not less than 0.00%) in effect from time to time plus 0.80% per annum on amounts borrowed. The commitment amounts remain unchanged. Administration, legal and arrangement fees in connection with the amended credit agreement, and along with commitment fees, are allocated among the Participating Funds based upon portions of the aggregate commitment available to them and relative net assets of the Participating Funds.
| | | | | | |
| | | BLACKROCK LARGE CAP SERIES FUNDS, INC. | | MARCH 31, 2016 | | 43 |
| | | | |
| Portfolio Information as of March 31,2016 (Unaudited) | | | Master Large Cap Series LLC | |
| | |
| Master Large Cap Core Portfolio | | Percent of
Net Assets |
| | | | |
Apple Inc. | | | 4 | % |
JPMorgan Chase & Co. | | | 3 | |
Microsoft Corp. | | | 3 | |
Comcast Corp., Class A | | | 3 | |
CVS Health Corp. | | | 3 | |
Bank of America Corp. | | | 3 | |
Aetna, Inc. | | | 3 | |
Cisco Systems, Inc. | | | 2 | |
Lowe’s Cos., Inc. | | | 2 | |
Home Depot, Inc. | | | 2 | |
| | |
| Master Large Cap Growth Portfolio | | Percent of
Net Assets |
| | | | |
Apple Inc. | | | 7 | % |
Microsoft Corp. | | | 4 | |
Comcast Corp., Class A | | | 4 | |
Home Depot, Inc. | | | 4 | |
Altria Group, Inc. | | | 3 | |
Alphabet, Inc., Class C | | | 3 | |
Alphabet, Inc., Class A | | | 3 | |
Amgen, Inc. | | | 3 | |
Facebook, Inc., Class A | | | 3 | |
UnitedHealth Group, Inc | | | 3 | |
| | |
| Master Large Cap Value Portfolio | | Percent of
Net Assets |
| | | | |
JPMorgan Chase & Co. | | | 5 | % |
Bank of America Corp. | | | 3 | |
Cisco Systems, Inc. | | | 3 | |
U.S. Bancorp | | | 3 | |
Microsoft Corp. | | | 3 | |
Pfizer, Inc. | | | 3 | |
Comcast Corp., Class A | | | 2 | |
UnitedHealth Group, Inc. | | | 2 | |
Aetna, Inc. | | | 2 | |
Carnival Corp. | | | 2 | |
| | |
| Master Large Cap Core Portfolio | | Percent of
Net Assets |
| | | | |
Information Technology | | | 23 | % |
Health Care | | | 18 | |
Consumer Discretionary | | | 17 | |
Financials | | | 16 | |
Consumer Staples | | | 8 | |
Industrials | | | 7 | |
Energy | | | 5 | |
Materials | | | 3 | |
Utilities | | | 1 | |
Short-Term Securities | | | 3 | |
Liabilities in Excess of Other Assets | | | (1 | ) |
| | |
| Master Large Cap Growth Portfolio | | Percent of
Net Assets |
| | | | |
Information Technology | | | 34 | % |
Consumer Discretionary | | | 20 | |
Health Care | | | 17 | |
Consumer Staples | | | 9 | |
Industrials | | | 7 | |
Financials | | | 5 | |
Materials | | | 4 | |
Energy | | | 1 | |
Short-Term Securities | | | 3 | |
| | |
| Master Large Cap Value Portfolio | | Percent of
Net Assets |
| | | | |
Financials | | | 23 | % |
Health Care | | | 17 | |
Information Technology | | | 17 | |
Consumer Discretionary | | | 12 | |
Energy | | | 10 | |
Industrials | | | 7 | |
Consumer Staples | | | 7 | |
Materials | | | 4 | |
Utilities | | | 2 | |
Investment Companies | | | 1 | |
For Portfolio compliance purposes, the Portfolios’ sector classifications refer to any one or more of the sector sub-classifications used by one or more widely recognized market indexes or ratings group indexes, and/or as defined by the investment advisor. These definitions may not apply for purposes of this report, which may combine sector sub-classifications for reporting ease.
| | | | | | |
| 44 | | BLACKROCK LARGE CAP SERIES FUNDS, INC. | | MARCH 31, 2016 | | |
| | | | |
| Schedule of Investments March 31, 2016 (Unaudited) | | | Master Large Cap Core Portfolio | |
| | | (Percentages shown are based on Net Assets) | |
| | | | | | | | |
| Common Stocks | | Shares | | | Value | |
Aerospace & Defense — 1.3% | | | | | | | | |
Raytheon Co. | | | 225,920 | | | $ | 27,704,570 | |
Air Freight & Logistics — 0.7% | | | | | | | | |
FedEx Corp. | | | 94,620 | | | | 15,396,566 | |
Airlines — 2.9% | | | | | | | | |
Delta Air Lines, Inc. | | | 417,800 | | | | 20,338,504 | |
Southwest Airlines Co. | | | 775,500 | | | | 34,742,400 | |
United Continental Holdings, Inc. (a) | | | 136,920 | | | | 8,196,031 | |
| | | | | | | | |
| | | | | | | | 63,276,935 | |
Auto Components — 2.2% | | | | | | | | |
Goodyear Tire & Rubber Co. | | | 411,300 | | | | 13,564,674 | |
Lear Corp. | | | 310,206 | | | | 34,485,601 | |
| | | | | | | | |
| | | | | | | | 48,050,275 | |
Banks — 10.3% | | | | | | | | |
Bank of America Corp. | | | 4,274,866 | | | | 57,796,188 | |
Citigroup, Inc. | | | 623,418 | | | | 26,027,702 | |
JPMorgan Chase & Co. | | | 1,151,524 | | | | 68,193,251 | |
SunTrust Banks, Inc. | | | 667,340 | | | | 24,077,627 | |
U.S. Bancorp | | | 1,245,025 | | | | 50,535,565 | |
| | | | | | | | |
| | | | | | | | 226,630,333 | |
Beverages — 1.6% | | | | | | | | |
Dr Pepper Snapple Group, Inc. | | | 282,300 | | | | 25,243,266 | |
Molson Coors Brewing Co., Class B | | | 101,800 | | | | 9,791,124 | |
| | | | | | | | |
| | | | | | | | 35,034,390 | |
Biotechnology — 3.6% | | | | | | | | |
Amgen, Inc. | | | 278,650 | | | | 41,777,996 | |
Gilead Sciences, Inc. | | | 401,080 | | | | 36,843,209 | |
| | | | | | | | |
| | | | | | | | 78,621,205 | |
Building Products — 0.5% | | | | | | | | |
Owens Corning | | | 255,600 | | | | 12,084,768 | |
Capital Markets — 1.7% | | | | | | | | |
Goldman Sachs Group, Inc. | | | 243,680 | | | | 38,252,886 | |
Chemicals — 1.5% | | | | | | | | |
Dow Chemical Co. | | | 279,100 | | | | 14,195,026 | |
Eastman Chemical Co. | | | 260,000 | | | | 18,779,800 | |
| | | | | | | | |
| | | | | | | | 32,974,826 | |
Communications Equipment — 2.9% | | | | | | | | |
Brocade Communications Systems, Inc. | | | 1,065,642 | | | | 11,274,492 | |
Cisco Systems, Inc. | | | 1,867,820 | | | | 53,176,835 | |
| | | | | | | | |
| | | | | | | | 64,451,327 | |
Construction & Engineering — 0.2% | | | | | | | | |
EMCOR Group, Inc. | | | 92,700 | | | | 4,505,220 | |
Consumer Finance — 0.8% | | | | | | | | |
SLM Corp. (a) | | | 2,719,365 | | | | 17,295,162 | |
| | | | | | | | |
| Common Stocks | | Shares | | | Value | |
Containers & Packaging — 1.3% | |
Avery Dennison Corp. | | | 152,600 | | | $ | 11,003,986 | |
Packaging Corp. of America | | | 277,313 | | | | 16,749,705 | |
| | | | | | | | |
| | | | | | | | 27,753,691 | |
Electronic Equipment, Instruments & Components — 0.7% | |
CDW Corp. | | | 345,740 | | | | 14,348,210 | |
Energy Equipment & Services — 0.5% | | | | | | | | |
Schlumberger Ltd. | | | 99,180 | | | | 7,314,525 | |
Weatherford International PLC (a) | | | 438,390 | | | | 3,410,674 | |
| | | | | | | | |
| | | | | | | | 10,725,199 | |
Food & Staples Retailing — 2.9% | |
CVS Health Corp. | | | 607,425 | | | | 63,008,195 | |
Food Products — 1.3% | | | | | | | | |
Pilgrim’s Pride Corp. (a) | | | 184,100 | | | | 4,676,140 | |
Tyson Foods, Inc., Class A | | | 357,190 | | | | 23,810,285 | |
| | | | | | | | |
| | | | | | | | 28,486,425 | |
Health Care Providers & Services — 9.8% | |
Aetna, Inc. | | | 475,300 | | | | 53,399,955 | |
Centene Corp. (a) | | | 369,300 | | | | 22,737,801 | |
Cigna Corp. | | | 291,100 | | | | 39,950,564 | |
Humana, Inc. | | | 96,500 | | | | 17,654,675 | |
Laboratory Corp. of America Holdings (a) | | | 186,540 | | | | 21,849,430 | |
UnitedHealth Group, Inc. | | | 337,100 | | | | 43,452,190 | |
Universal Health Services, Inc., Class B | | | 122,830 | | | | 15,319,358 | |
| | | | | | | | |
| | | | | | | | 214,363,973 | |
Hotels, Restaurants & Leisure — 2.2% | |
Carnival Corp. | | | 920,538 | | | | 48,576,790 | |
Household Durables — 1.4% | | | | | | | | |
DR Horton, Inc. | | | 394,435 | | | | 11,923,770 | |
Lennar Corp., Class A | | | 180,300 | | | | 8,719,308 | |
NVR, Inc. (a) | | | 3,220 | | | | 5,578,328 | |
Toll Brothers, Inc. (a) | | | 149,088 | | | | 4,399,587 | |
| | | | | | | | |
| | | | | | | | 30,620,993 | |
Insurance — 2.6% | |
American International Group, Inc. | | | 549,900 | | | | 29,722,095 | |
Travelers Cos., Inc. | | | 228,830 | | | | 26,706,749 | |
| | | | | | | | |
| | | | | | | | 56,428,844 | |
Internet & Catalog Retail — 0.7% | |
Priceline Group, Inc. (a) | | | 12,832 | | | | 16,539,935 | |
Internet Software & Services — 5.2% | |
Alphabet, Inc., Class A (a) | | | 58,277 | | | | 44,459,523 | |
Alphabet, Inc., Class C (a) | | | 63,554 | | | | 47,344,552 | |
Facebook, Inc., Class A (a) | | | 201,200 | | | | 22,956,920 | |
| | | | | | | | |
| | | | | | | | 114,760,995 | |
| | |
Portfolio Abbreviations |
| ADR | | American Depositary Receipts |
| SPDR | | Standard & Poor’s Depositary Receipts |
See Notes to Financial Statements.
| | | | | | |
| | | BLACKROCK LARGE CAP SERIES FUNDS, INC. | | MARCH 31, 2016 | | 45 |
| | | | |
| Schedule of Investments (continued) | | | Master Large Cap Core Portfolio | |
| | | | |
| | | | | | | | |
| Common Stocks | | Shares | | | Value | |
IT Services — 2.8% | | | | | | | | |
Amdocs Ltd. | | | 321,779 | | | $ | 19,441,887 | |
Cognizant Technology Solutions Corp., Class A (a) | | | 592,200 | | | | 37,130,940 | |
Total System Services, Inc. | | | 104,474 | | | | 4,970,873 | |
| | | | | | | | |
| | | | | | | | 61,543,700 | |
Leisure Products — 0.2% | | | | | | | | |
Vista Outdoor, Inc. (a) | | | 79,552 | | | | 4,129,544 | |
Machinery — 0.9% | | | | | | | | |
Parker-Hannifin Corp. | | | 102,500 | | | | 11,385,700 | |
WABCO Holdings, Inc. (a) | | | 72,800 | | | | 7,783,776 | |
| | | | | | | | |
| | | | | | | | 19,169,476 | |
Media — 4.0% | | | | | | | | |
Comcast Corp., Class A | | | 1,064,500 | | | | 65,019,660 | |
Omnicom Group, Inc. | | | 266,770 | | | | 22,203,267 | |
| | | | | | | | |
| | | | | | | | 87,222,927 | |
Multi-Utilities — 1.0% | | | | | | | | |
Public Service Enterprise Group, Inc. | | | 481,100 | | | | 22,679,054 | |
Oil, Gas & Consumable Fuels — 4.2% | | | | | | | | |
Anadarko Petroleum Corp. | | | 110,380 | | | | 5,140,397 | |
BP PLC — ADR | | | 492,710 | | | | 14,869,988 | |
Chevron Corp. | | | 140,400 | | | | 13,394,160 | |
Hess Corp. | | | 162,832 | | | | 8,573,105 | |
HollyFrontier Corp. | | | 58,700 | | | | 2,073,284 | |
Marathon Oil Corp. | | | 538,300 | | | | 5,996,662 | |
Statoil ASA — ADR | | | 293,700 | | | | 4,569,972 | |
Suncor Energy, Inc. | | | 797,600 | | | | 22,181,256 | |
Tesoro Corp. | | | 66,893 | | | | 5,753,467 | |
Valero Energy Corp. | | | 137,700 | | | | 8,832,078 | |
| | | | | | | | |
| | | | | | | | 91,384,369 | |
Paper & Forest Products — 0.4% | | | | | | | | |
Domtar Corp. | | | 245,500 | | | | 9,942,750 | |
Pharmaceuticals — 4.7% | | | | | | | | |
Allergan PLC (a) | | | 75,700 | | | | 20,289,871 | |
Johnson & Johnson | | | 80,095 | | | | 8,666,279 | |
Merck & Co., Inc. | | | 59,943 | | | | 3,171,584 | |
Pfizer, Inc. | | | 1,334,290 | | | | 39,548,356 | |
Teva Pharmaceutical Industries Ltd. — ADR | | | 575,436 | | | | 30,791,580 | |
| | | | | | | | |
| | | | | | | | 102,467,670 | |
Road & Rail — 0.5% | | | | | | | | |
Norfolk Southern Corp. | | | 142,567 | | | | 11,868,703 | |
Semiconductors & Semiconductor Equipment — 2.1% | |
Intel Corp. | | | 677,170 | | | | 21,906,450 | |
| | | | | | | | |
| Common Stocks | | Shares | | | Value | |
Semiconductors & Semiconductor Equipment (continued) | |
Lam Research Corp. | | | 158,500 | | | $ | 13,092,100 | |
NVIDIA Corp. | | | 283,400 | | | | 10,097,542 | |
| | | | | | | | |
| | | | | | | | 45,096,092 | |
Software — 4.8% | | | | | | | | |
Activision Blizzard, Inc. | | | 1,179,190 | | | | 39,903,790 | |
Microsoft Corp. | | | 1,205,600 | | | | 66,585,288 | |
| | | | | | | | |
| | | | | | | | 106,489,078 | |
Specialty Retail — 5.9% | | | | | | | | |
GNC Holdings, Inc., Class A | | | 246,400 | | | | 7,823,200 | |
Home Depot, Inc. | | | 382,500 | | | | 51,036,975 | |
Lowe’s Cos., Inc. | | | 690,800 | | | | 52,328,100 | |
Ross Stores, Inc. | | | 311,158 | | | | 18,016,048 | |
| | | | | | | | |
| | | | | | | | 129,204,323 | |
Technology Hardware, Storage & Peripherals — 4.8% | |
Apple Inc. | | | 697,400 | | | | 76,009,626 | |
EMC Corp. | | | 851,070 | | | | 22,681,016 | |
Western Digital Corp. | | | 136,010 | | | | 6,425,112 | |
| | | | | | | | |
| | | | | | | | 105,115,754 | |
Textiles, Apparel & Luxury Goods — 0.2% | | | | | | | | |
Fossil Group, Inc. (a) | | | 105,300 | | | | 4,677,426 | |
Tobacco — 2.3% | | | | | | | | |
Altria Group, Inc. | | | 808,739 | | | | 50,675,586 | |
Total Common Stocks — 97.6% | | | | | | | 2,141,558,165 | |
| | | | | | | | |
| Investment Companies — 0.4% | | | | | | |
Utilities Select Sector SPDR Fund | | | 188,000 | | | | 9,328,560 | |
Total Long-Term Investments (Cost — $1,691,944,526) — 98.0% | | | | | | | 2,150,886,725 | |
| | | | | | | | |
| Short-Term Securities | | | | | | |
BlackRock Liquidity Funds, TempFund, Institutional Class, 0.37% (b)(c) | | | 60,399,930 | | | | 60,399,930 | |
Total Short-Term Securities (Cost — $60,399,930) — 2.8% | | | | | | | 60,399,930 | |
Total Investments (Cost — $1,752,344,456) — 100.8% | | | | 2,211,286,655 | |
Liabilities in Excess of Other Assets — (0.8)% | | | | | | | (17,454,767 | ) |
| | | | | | | | |
Net Assets — 100.0% | | | | | | $ | 2,193,831,888 | |
| | | | | | | | |
|
Notes to Schedule of Investments |
| (a) | Non-income producing security. |
| (b) | During the six months ended March 31, 2016, investments in issuers considered to be affiliates of the Portfolio for purposes of Section 2(a)(3) of the Investment Company Act of 1940, as amended, were as follows: |
| | | | | | | | | | | | | | | | | | | | |
| Affiliate | | Shares/Beneficial
Interest Held at
September 30, 2015 | | | Net
Activity | | | Shares/Beneficial
Interest Held at
March 31, 2016 | | | Income | | | Realized
Gain | |
BlackRock Liquidity Funds, TempFund, Institutional Class | | | 29,818,476 | | | | 30,581,454 | | | | 60,399,930 | | | | $72,532 | | | | $500 | |
BlackRock Liquidity Series, LLC, Money Market Series | | | — | | | | — | | | | — | | | | 7,211 | 1 | | | — | |
Total | | | | | | | | | | | | | | | $79,743 | | | | $500 | |
| | | | | | | | | | | | | | | | |
| | 1 | | Represents securities lending income earned from the reinvestment of cash collateral from loaned securities, net of fees and collateral investment expenses, and other payments to and from borrowers of securities. |
| (c) | Current yield as of period end. |
See Notes to Financial Statements.
| | | | | | |
| 46 | | BLACKROCK LARGE CAP SERIES FUNDS, INC. | | MARCH 31, 2016 | | |
| | | | |
| Schedule of Investments (concluded) | | | Master Large Cap Core Portfolio | |
| • | | For Portfolio compliance purposes, the Portfolio’s industry classifications refer to one or more of the industry sub-classifications used by one or more widely recognized market indexes or ratings group indexes, and/or as defined by the investment advisor. These definitions may not apply for purposes of this report, which may combine such industry sub-classifications for reporting ease. |
|
Derivative Financial Instruments Categorized by Risk Exposure |
For the six months ended March 31, 2016, the effect of derivative financial instruments in the Statements of Operation was as follows:
| | | | | | | | | | | | | | | | | | | | | | | | | | | | |
| | | Commodity
Contracts | | | Credit
Contracts | | | Equity
Contracts | | | Foreign
Currency
Exchange
Contracts | | | Interest
Rate
Contracts | | | Other
Contracts | | | Total | |
Net Realized Gain from: | | | | | | | | | | | | | | | | | | | | | | | | | | | | |
Futures contracts | | | ��� | | | | — | | | | $4,978,545 | | | | — | | | | — | | | | — | | | | $4,978,545 | |
|
Average Quarterly Balances of Outstanding Derivative Financial Instruments |
| | | | |
Futures contracts: | | | | |
Average notional value of contracts — long | | $ | 43,343,244 | 1 |
| | 1 | | Actual amounts for the six months are shown due to limited outstanding derivative financial instruments as of each quarter. |
For more information about the Portfolio’s investment risks regarding derivative financial instruments, refer to the Notes to Financial Statements.
|
Fair Value Hierarchy as of Period End |
Various inputs are used in determining the fair value of investments. For information about the Portfolio’s policy regarding valuation of investments, refer to the Notes to Financial Statements.
The following table summarizes the Portfolio’s investments categorized in the disclosure hierarchy:
| | | | | | | | | | | | |
| | | | Level 1 | | | Level 2 | | Level 3 | | | Total | |
Assets: | | | | | | | | | | | | |
Investments: | | | | | | | | | | | | |
Long-Term Investments: | | | | | | | | | | | | |
Common Stocks1 | | $ | 2,141,558,165 | | | — | | — | | $ | 2,141,558,165 | |
Investment Companies | | | 9,328,560 | | | — | | — | | | 9,328,560 | |
Short-Term Securities | | | 60,399,930 | | | — | | — | | | 60,399,930 | |
| | | | |
Total | | $ | 2,211,286,655 | | | — | | — | | $ | 2,211,286,655 | |
| | | | |
| | 1 | | See above Schedule of Investments for values in each industry. |
During the six months ended March 31, 2016, there were no transfers between levels.
See Notes to Financial Statements.
| | | | | | |
| | | BLACKROCK LARGE CAP SERIES FUNDS, INC. | | MARCH 31, 2016 | | 47 |
| | | | |
| Schedule of Investments March 31, 2016 (Unaudited) | | | Master Large Cap Growth Portfolio | |
| | | (Percentages shown are based on Net Assets) | |
| | | | | | | | |
| Common Stocks | | Shares | | | Value | |
Aerospace & Defense — 0.9% | | | | | | | | |
Lockheed Martin Corp. | | | 17,770 | | | $ | 3,936,055 | |
Rockwell Collins, Inc. | | | 75,800 | | | | 6,989,518 | |
| | | | | | | | |
| | | | | | | | 10,925,573 | |
Air Freight & Logistics — 0.8% | | | | | | | | |
FedEx Corp. | | | 57,270 | | | | 9,318,974 | |
Airlines — 4.3% | | | | | | | | |
Delta Air Lines, Inc. | | | 256,613 | | | | 12,491,921 | |
JetBlue Airways Corp. (a) | | | 155,900 | | | | 3,292,608 | |
Southwest Airlines Co. | | | 559,016 | | | | 25,043,917 | |
United Continental Holdings, Inc. (a) | | | 150,930 | | | | 9,034,670 | |
| | | | | | | | |
| | | | | | | | 49,863,116 | |
Auto Components — 2.2% | | | | | | | | |
Goodyear Tire & Rubber Co. | | | 138,661 | | | | 4,573,040 | |
Lear Corp. | | | 187,224 | | | | 20,813,692 | |
| | | | | | | | |
| | | | | | | | 25,386,732 | |
Banks — 2.3% | | | | | | | | |
U.S. Bancorp | | | 527,410 | | | | 21,407,572 | |
Wells Fargo & Co. | | | 102,300 | | | | 4,947,228 | |
| | | | | | | | |
| | | | | | | | 26,354,800 | |
Beverages — 1.9% | | | | | | | | |
Dr Pepper Snapple Group, Inc. | | | 251,570 | | | | 22,495,389 | |
Biotechnology — 5.7% | | | | | | | | |
Amgen, Inc. | | | 230,100 | | | | 34,498,893 | |
Gilead Sciences, Inc. | | | 352,809 | | | | 32,409,035 | |
| | | | | | | | |
| | | | | | | | 66,907,928 | |
Capital Markets — 0.9% | | | | | | | | |
Goldman Sachs Group, Inc. | | | 63,299 | | | | 9,936,677 | |
Chemicals — 1.8% | | | | | | | | |
Dow Chemical Co. | | | 138,860 | | | | 7,062,420 | |
Eastman Chemical Co. | | | 189,822 | | | | 13,710,843 | |
| | | | | | | | |
| | | | | | | | 20,773,263 | |
Communications Equipment — 1.4% | | | | | | | | |
Cisco Systems, Inc. | | | 574,270 | | | | 16,349,467 | |
Consumer Finance — 0.9% | | | | | | | | |
SLM Corp. (a) | | | 1,572,252 | | | | 9,999,523 | |
Containers & Packaging — 2.1% | | | | | | | | |
Avery Dennison Corp. | | | 162,412 | | | | 11,711,529 | |
Packaging Corp. of America | | | 202,474 | | | | 12,229,430 | |
| | | | | | | | |
| | | | | | | | 23,940,959 | |
Electronic Equipment, Instruments & Components — 1.5% | |
CDW Corp. | | | 420,110 | | | | 17,434,565 | |
Energy Equipment & Services — 0.8% | | | | | | | | |
Schlumberger Ltd. | | | 126,523 | | | | 9,331,071 | |
Food & Staples Retailing — 2.3% | | | | | | | | |
CVS Health Corp. | | | 258,324 | | | | 26,795,948 | |
Food Products — 1.4% | | | | | | | | |
Pilgrim’s Pride Corp. (a) | | | 141,010 | | | | 3,581,654 | |
Tyson Foods, Inc., Class A | | | 188,961 | | | | 12,596,140 | |
| | | | | | | | |
| | | | | | | | 16,177,794 | |
Health Care Providers & Services — 9.4% | | | | | | | | |
Aetna, Inc. | | | 228,700 | | | | 25,694,445 | |
Centene Corp. (a) | | | 239,660 | | | | 14,755,866 | |
Cigna Corp. | | | 100,588 | | | | 13,804,697 | |
| | | | | | | | |
| Common Stocks | | Shares | | | Value | |
Health Care Providers & Services (continued) | | | | | | | | |
Laboratory Corp. of America Holdings (a) | | | 104,580 | | | $ | 12,249,455 | |
UnitedHealth Group, Inc. | | | 253,620 | | | | 32,691,618 | |
Universal Health Services, Inc., Class B | | | 82,856 | | | | 10,333,800 | |
| | | | | | | | |
| | | | | | | | 109,529,881 | |
Household Durables — 1.9% | | | | | | | | |
DR Horton, Inc. | | | 270,846 | | | | 8,187,674 | |
Lennar Corp., Class A | | | 100,760 | | | | 4,872,754 | |
NVR, Inc. (a) | | | 3,198 | | | | 5,540,215 | |
Toll Brothers, Inc. (a) | | | 108,560 | | | | 3,203,606 | |
| | | | | | | | |
| | | | | | | | 21,804,249 | |
Industrial Conglomerates — 0.3% | | | | | | | | |
3M Co. | | | 18,830 | | | | 3,137,643 | |
Insurance — 1.4% | | | | | | | | |
Travelers Cos., Inc. | | | 135,320 | | | | 15,793,197 | |
Internet & Catalog Retail — 2.0% | | | | | | | | |
Priceline Group, Inc. (a) | | | 18,235 | | | | 23,504,186 | |
Internet Software & Services — 9.2% | | | | | | | | |
Alphabet, Inc., Class A (a) | | | 47,825 | | | | 36,485,693 | |
Alphabet, Inc., Class C (a) | | | 50,434 | | | | 37,570,808 | |
Facebook, Inc., Class A (a) | | | 290,848 | | | | 33,185,757 | |
| | | | | | | | |
| | | | | | | | 107,242,258 | |
IT Services — 4.9% | | | | | | | | |
Amdocs Ltd. | | | 174,583 | | | | 10,548,305 | |
Cognizant Technology Solutions Corp., Class A (a) | | | 451,470 | | | | 28,307,169 | |
DST Systems, Inc. | | | 82,013 | | | | 9,248,606 | |
Total System Services, Inc. | | | 197,258 | | | | 9,385,536 | |
| | | | | | | | |
| | | | | | | | 57,489,616 | |
Machinery — 0.9% | | | | | | | | |
Parker-Hannifin Corp. | | | 49,500 | | | | 5,498,460 | |
WABCO Holdings, Inc. (a) | | | 49,530 | | | | 5,295,748 | |
| | | | | | | | |
| | | | | | | | 10,794,208 | |
Media — 5.5% | | | | | | | | |
Comcast Corp., Class A | | | 664,900 | | | | 40,612,092 | |
Omnicom Group, Inc. | | | 283,240 | | | | 23,574,065 | |
| | | | | | | | |
| | | | | | | | 64,186,157 | |
Multiline Retail — 0.2% | | | | | | | | |
Macy’s, Inc. | | | 61,930 | | | | 2,730,494 | |
Oil, Gas & Consumable Fuels — 0.3% | | | | | | | | |
HollyFrontier Corp. | | | 30,400 | | | | 1,073,728 | |
Marathon Petroleum Corp. | | | 56,212 | | | | 2,089,962 | |
| | | | | | | | |
| | | | | | | | 3,163,690 | |
Pharmaceuticals — 1.3% | | | | | | | | |
Allergan PLC (a) | | | 21,169 | | | | 5,673,927 | |
Teva Pharmaceutical Industries Ltd. — ADR | | | 178,002 | | | | 9,524,887 | |
| | | | | | | | |
| | | | | | | | 15,198,814 | |
Semiconductors & Semiconductor Equipment — 2.4% | | | | | | | | |
Intel Corp. | | | 151,580 | | | | 4,903,613 | |
Lam Research Corp. | | | 121,296 | | | | 10,019,050 | |
NVIDIA Corp. | | | 379,759 | | | | 13,530,813 | |
| | | | | | | | |
| | | | | | | | 28,453,476 | |
Software — 5.9% | | | | | | | | |
Activision Blizzard, Inc. | | | 537,954 | | | | 18,204,363 | |
See Notes to Financial Statements.
| | | | | | |
| 48 | | BLACKROCK LARGE CAP SERIES FUNDS, INC. | | MARCH 31, 2016 | | |
| | | | |
| Schedule of Investments (continued) | | | Master Large Cap Growth Portfolio | |
| | | | |
| | | | | | | | |
| Common Stocks | | Shares | | | Value | |
Software (continued) | | | | | | | | |
Microsoft Corp. | | | 904,910 | | | $ | 49,978,179 | |
| | | | | | | | |
| | | | | | | | 68,182,542 | |
Specialty Retail — 8.3% | | | | | | | | |
GNC Holdings, Inc., Class A | | | 100,226 | | | | 3,182,175 | |
Home Depot, Inc. | | | 302,445 | | | | 40,355,236 | |
Lowe’s Cos., Inc. | | | 412,800 | | | | 31,269,600 | |
Ross Stores, Inc. | | | 265,752 | | | | 15,387,041 | |
TJX Cos., Inc. | | | 81,177 | | | | 6,360,218 | |
| | | | | | | | |
| | | | | | | | 96,554,270 | |
Technology Hardware, Storage & Peripherals — 8.1% | | | | | | | | |
Apple Inc. | | | 734,907 | | | | 80,097,514 | |
EMC Corp. | | | 467,191 | | | | 12,450,640 | |
Western Digital Corp. | | | 25,300 | | | | 1,195,172 | |
| | | | | | | | |
| | | | | | | | 93,743,326 | |
Textiles, Apparel & Luxury Goods — 0.3% | | | | | | | | |
Fossil Group, Inc. (a) | | | 68,360 | | | | 3,036,551 | |
| | | | | | | | |
| Common Stocks | | Shares | | | Value | |
Tobacco — 3.2% | | | | | | | | |
Altria Group, Inc. | | | 601,401 | | | $ | 37,683,787 | |
Total Long-Term Investments (Cost — $831,315,497) — 96.7% | | | | | | | 1,124,220,124 | |
| | | | | | | | |
| Short-Term Securities | | | | | | |
BlackRock Liquidity Funds, TempFund, Institutional Class, 0.37% (b)(c) | | | 37,213,592 | | | | 37,213,592 | |
Total Short-Term Securities (Cost — $37,213,592) — 3.2% | | | | | | | 37,213,592 | |
Total Investments (Cost — $868,529,089) — 99.9% | | | | | | | 1,161,433,716 | |
Other Assets Less Liabilities — 0.1% | | | | | | | 1,737,899 | |
| | | | | | | | |
Net Assets — 100.0% | | | | | | $ | 1,163,171,615 | |
| | | | | | | | |
|
Notes to Schedule of Investments |
| (a) | Non-income producing security. |
| (b) | During the six months ended March 31, 2016, investments in issuers considered to be affiliates of the Portfolio for purposes of Section 2(a)(3) of the Investment Company Act of 1940, as amended, were as follows: |
| | | | | | | | | | | | | | | | | | | | |
| Affiliate | | Shares/Beneficial
Interest Held at
September 30, 2015 | | | Net Activity | | | Shares/Beneficial
Interest Held at
March 31, 2016 | | | Income | | | Realized
Gain | |
BlackRock Liquidity Funds, TempFund, Institutional Class | | | 12,025,797 | | | | 25,187,795 | | | | 37,213,592 | | | $ | 45,437 | | | | $712 | |
BlackRock Liquidity Series, LLC, Money Market Series | | | $ 5,520,537 | | | | (5,520,537 | ) | | | — | | | | 137,347 | 1 | | | — | |
Total | | | | | | | | | | | | | | $ | 182,784 | | | | $712 | |
| | | | | | | | | | | | | | | | |
| | 1 | | Represents securities lending income earned from the reinvestment of cash collateral from loaned securities, net of fees and collateral investment expense, and other payments to and from borrowers of securities. |
| (c) | Current yield as of period end. |
| | • | | For Portfolio compliance purposes, the Portfolio’s industry classifications refer to one or more of the industry sub-classifications used by one or more widely recognized market indexes or ratings group indexes, and/or as defined by the investment advisor. These definitions may not apply for purposes of this report, which may combine such industry sub-classifications for reporting ease. |
|
Derivative Financial Instruments Outstanding as of Period End |
| | | | | | | | | | | | | | | | |
| Futures Contracts | | | | | | | | | | | | | |
Contracts Long | | Issue | | Expiration | | Notional Value | | | Unrealized
Appreciation | |
188 | | S&P 500 E-Mini Futures | | June 2016 | | | USD | | | | 19,284,100 | | | | $676,768 | |
|
Derivative Financial Instruments Categorized by Risk Exposure |
As of period end, the fair values of derivative financial instruments located in the Statements of Assets and Liabilities were as follows:
| | | | | | | | | | | | | | | | | | | | | | | | | | | | | | | | |
| | | Statements of Assets and
Liabilities Location | | | Commodity
Contracts | | | Credit
Contracts | | | Equity
Contracts | | | foreign
Currency
Exchange
Contracts | | | Interest
Rate
Contracts | | | Other
Contracts | | | Total | |
Assets — Derivative Financial Instruments | |
Futures contracts | | | Net unrealized appreciation | 1 | | | — | | | | — | | | | $676,768 | | | | — | | | | — | | | | — | | | | $676,768 | |
| | 1 | | Includes cumulative appreciation (depreciation) on futures contracts, if any, as reported in the Schedule of Investments. Only current day’s variation margin is reported within the Statements of Assets and Liabilities. |
See Notes to Financial Statements.
| | | | | | |
| | | BLACKROCK LARGE CAP SERIES FUNDS, INC. | | MARCH 31, 2016 | | 49 |
| | | | |
| Schedule of Investments (concluded) | | | Master Large Cap Growth Portfolio | |
For the six months ended March 31, 2016, the effect of derivative financial instruments in the Statements of Operation was as follows:
| | | | | | | | | | | | | | | | | | |
| Net Realized Gain from: | | Commodity
Contracts | | Credit
Contracts | | Equity
Contracts | | | Foreign
Currency
Exchange
Contracts | | Interest
Rate
Contracts | | Other
Contracts | | Total | |
Futures contracts | | — | | — | | | $521,006 | | | — | | — | | — | | $ | 521,006 | |
| | | | | | | | | | | | | | | | | | |
Net Change in Unrealized Appreciation (Depreciation) on: | | | | | | | | | | | | | | | | | | |
Futures contracts | | — | | — | | | $676,768 | | | — | | — | | — | | $ | 676,768 | |
|
Average Quarterly Balances of Outstanding Derivative Financial Instruments |
| | | | |
Futures contracts: | | | | |
Average notional value of contracts — long | | $ | 9,642,050 | |
For more information about the Portfolio’s investment risks regarding derivative financial instruments, refer to the Notes to Financial Statements.
|
Fair Value Hierarchy as of Period End |
Various inputs are used in determining the fair value of investments and derivative instruments. For information about the Portfolio’s policy regarding valuation of investments and derivative instruments, refer to the Notes to Financial Statements.
The following tables summarize the Portfolio’s investments categorized in the disclosure hierarchy:
| | | | | | | | | | | | |
| | | | Level 1 | | | Level 2 | | Level 3 | | | Total | |
Assets: | | | | | | | | | | | | |
Investments: | | | | | | | | | | | | |
Long-Term Investments1 | | $ | 1,124,220,124 | | | — | | — | | $ | 1,124,220,124 | |
Short-Term Securities | | | 37,213,592 | | | — | | — | | | 37,213,592 | |
| | | | |
Total | | $ | 1,161,433,716 | | | — | | — | | $ | 1,161,433,716 | |
| | | | |
1 See above Schedule of Investments for values in each industry. | |
| | | | Level 1 | | | Level 2 | | Level 3 | | | Total | |
Derivative Financial Instruments2 | | | | | | | | | | | | |
Assets: | | | | | | | | | | | | |
Equity contracts | | | $ 676,768 | | | — | | — | | | $ 676,768 | |
| | | | |
2 Derivative financial instruments are financial futures contracts which are valued at the unrealized appreciation (depreciation) on the instrument. | |
The Portfolio may hold assets and/or liabilities in which the fair value approximates the carrying amount for financial statement purposes. As of period end, cash pledged for futures contracts of $893,000 is categorized as Level 1 within the disclosure hierarchy.
During the six months ended March 31, 2016, there were no transfers between levels.
See Notes to Financial Statements.
| | | | | | |
| 50 | | BLACKROCK LARGE CAP SERIES FUNDS, INC. | | MARCH 31, 2016 | | |
| | | | |
| Schedule of Investments March 31, 2016 (Unaudited) | | | Master Large Cap Value Portfolio | |
| | | (Percentages shown are based on Net Assets) | |
| | | | | | | | |
| Common Stocks | | Shares | | | Value | |
Aerospace & Defense — 1.7% | | | | | | | | |
Raytheon Co. | | | 115,673 | | | $ | 14,184,980 | |
Air Freight & Logistics — 0.5% | | | | | | | | |
FedEx Corp. | | | 25,322 | | | | 4,120,396 | |
Airlines — 1.9% | | | | | | | | |
JetBlue Airways Corp. (a) | | | 142,900 | | | | 3,018,048 | |
Southwest Airlines Co. | | | 154,900 | | | | 6,939,520 | |
United Continental Holdings, Inc. (a) | | | 97,600 | | | | 5,842,336 | |
| | | | | | | | |
| | | | | | | | 15,799,904 | |
Auto Components — 3.2% | | | | | | | | |
Goodyear Tire & Rubber Co. | | | 397,515 | | | | 13,110,045 | |
Lear Corp. | | | 124,990 | | | | 13,895,138 | |
| | | | | | | | |
| | | | | | | | 27,005,183 | |
Banks — 15.2% | | | | | | | | |
Bank of America Corp. | | | 2,105,578 | | | | 28,467,415 | |
Citigroup, Inc. | | | 416,319 | | | | 17,381,318 | |
JPMorgan Chase & Co. | | | 649,488 | | | | 38,462,679 | |
SunTrust Banks, Inc. | | | 354,671 | | | | 12,796,530 | |
U.S. Bancorp | | | 613,019 | | | | 24,882,441 | |
Wells Fargo & Co. | | | 116,835 | | | | 5,650,141 | |
| | | | | | | | |
| | | | | | | | 127,640,524 | |
Beverages — 1.0% | | | | | | | | |
Molson Coors Brewing Co., Class B | | | 86,036 | | | | 8,274,942 | |
Biotechnology — 0.8% | | | | | | | | |
Amgen, Inc. | | | 43,300 | | | | 6,491,969 | |
Building Products — 1.0% | | | | | | | | |
Owens Corning | | | 173,053 | | | | 8,181,946 | |
Capital Markets — 2.1% | | | | | | | | |
Goldman Sachs Group, Inc. | | | 114,670 | | | | 18,000,897 | |
Chemicals — 2.2% | | | | | | | | |
Dow Chemical Co. | | | 151,680 | | | | 7,714,445 | |
Eastman Chemical Co. | | | 149,404 | | | | 10,791,451 | |
| | | | | | | | |
| | | | | | | | 18,505,896 | |
Communications Equipment — 3.8% | | | | | | | | |
Brocade Communications Systems, Inc. | | | 442,281 | | | | 4,679,333 | |
Cisco Systems, Inc. | | | 949,210 | | | | 27,024,009 | |
| | | | | | | | |
| | | | | | | | 31,703,342 | |
Construction & Engineering — 0.2% | | | | | | | | |
EMCOR Group, Inc. | | | 35,800 | | | | 1,739,880 | |
Consumer Finance — 0.9% | | | | | | | | |
SLM Corp. (a) | | | 1,129,542 | | | | 7,183,887 | |
Containers & Packaging — 1.0% | | | | | | | | |
Avery Dennison Corp. | | | 111,096 | | | | 8,011,133 | |
Diversified Financial Services — 1.0% | | | | | | | | |
Berkshire Hathaway, Inc., Class B (a) | | | 60,431 | | | | 8,573,950 | |
Diversified Telecommunication Services — 0.3% | | | | | | | | |
AT&T Inc. | | | 65,100 | | | | 2,549,967 | |
Electronic Equipment, Instruments & Components — 1.1% | |
CDW Corp. | | | 216,370 | | | | 8,979,355 | |
Energy Equipment & Services — 1.9% | | | | | | | | |
Schlumberger Ltd. | | | 183,546 | | | | 13,536,517 | |
Weatherford International PLC (a) | | | 345,701 | | | | 2,689,554 | |
| | | | | | | | |
| | | | | | | | 16,226,071 | |
Food & Staples Retailing — 2.0% | | | | | | | | |
CVS Health Corp. | | | 162,521 | | | | 16,858,303 | |
Food Products — 1.9% | | | | | | | | |
Pilgrim’s Pride Corp. (a) | | | 90,881 | | | | 2,308,377 | |
| | | | | | | | |
| Common Stocks | | Shares | | | Value | |
Food Products (continued) | | | | | | | | |
Tyson Foods, Inc., Class A | | | 205,270 | | | $ | 13,683,298 | |
| | | | | | | | |
| | | | | | | | 15,991,675 | |
Health Care Providers & Services — 10.4% | | | | | | | | |
Aetna, Inc. | | | 173,630 | | | | 19,507,331 | |
Centene Corp. (a) | | | 100,951 | | | | 6,215,553 | |
Cigna Corp. | | | 92,430 | | | | 12,685,093 | |
Humana, Inc. | | | 54,029 | | | | 9,884,606 | |
Laboratory Corp. of America Holdings (a) | | | 78,912 | | | | 9,242,963 | |
UnitedHealth Group, Inc. | | | 157,980 | | | | 20,363,622 | |
Universal Health Services, Inc., Class B | | | 75,593 | | | | 9,427,959 | |
| | | | | | | | |
| | | | | | | | 87,327,127 | |
Hotels, Restaurants & Leisure — 2.3% | | | | | | | | |
Carnival Corp. | | | 365,563 | | | | 19,290,759 | |
Household Durables — 1.7% | | | | | | | | |
DR Horton, Inc. | | | 287,031 | | | | 8,676,947 | |
Lennar Corp., Class A | | | 84,580 | | | | 4,090,289 | |
Toll Brothers, Inc. (a) | | | 60,150 | | | | 1,775,027 | |
| | | | | | | | |
| | | | | | | | 14,542,263 | |
Industrial Conglomerates — 0.8% | | | | | | | | |
General Electric Co. | | | 223,265 | | | | 7,097,594 | |
Insurance — 3.3% | | | | | | | | |
American International Group, Inc. | | | 262,883 | | | | 14,208,826 | |
Travelers Cos., Inc. | | | 119,418 | | | | 13,937,275 | |
| | | | | | | | |
| | | | | | | | 28,146,101 | |
IT Services — 2.2% | | | | | | | | |
Amdocs Ltd. | | | 145,898 | | | | 8,815,157 | |
DST Systems, Inc. | | | 51,436 | | | | 5,800,438 | |
Total System Services, Inc. | | | 79,584 | | | | 3,786,607 | |
| | | | | | | | |
| | | | | | | | 18,402,202 | |
Leisure Products — 0.5% | | | | | | | | |
Vista Outdoor, Inc. (a) | | | 75,475 | | | | 3,917,907 | |
Machinery — 0.6% | | | | | | | | |
Parker-Hannifin Corp. | | | 43,527 | | | | 4,834,979 | |
Media — 2.5% | | | | | | | | |
Comcast Corp., Class A | | | 341,150 | | | | 20,837,442 | |
Multi-Utilities — 2.0% | | | | | | | | |
Public Service Enterprise Group, Inc. | | | 295,950 | | | | 13,951,083 | |
SCANA Corp. | | | 39,996 | | | | 2,805,719 | |
| | | | | | | | |
| | | | | | | | 16,756,802 | |
Oil, Gas & Consumable Fuels — 7.8% | | | | | | | | |
Anadarko Petroleum Corp. | | | 41,483 | | | | 1,931,863 | |
BP PLC — ADR | | | 487,571 | | | | 14,714,893 | |
Chevron Corp. | | | 70,489 | | | | 6,724,651 | |
Exxon Mobil Corp. | | | 165,399 | | | | 13,825,702 | |
Hess Corp. | | | 36,842 | | | | 1,939,731 | |
Marathon Oil Corp. | | | 209,028 | | | | 2,328,572 | |
Statoil ASA — ADR | | | 110,600 | | | | 1,720,936 | |
Suncor Energy, Inc. | | | 550,987 | | | | 15,322,948 | |
Tesoro Corp. | | | 37,527 | | | | 3,227,697 | |
Valero Energy Corp. | | | 59,293 | | | | 3,803,053 | |
| | | | | | | | |
| | | | | | | | 65,540,046 | |
Paper & Forest Products — 0.8% | | | | | | | | |
Domtar Corp. | | | 167,573 | | | | 6,786,707 | |
Pharmaceuticals — 6.1% | | | | | | | | |
Allergan PLC (a) | | | 12,800 | | | | 3,430,784 | |
Johnson & Johnson | | | 71,700 | | | | 7,757,940 | |
Merck & Co., Inc. | | | 105,480 | | | | 5,580,947 | |
See Notes to Financial Statements.
| | | | | | |
| | | BLACKROCK LARGE CAP SERIES FUNDS, INC. | | MARCH 31, 2016 | | 51 |
| | | | |
| Schedule of Investments (continued) | | | Master Large Cap Value Portfolio | |
| | | | | | | | |
Common Stocks | | | Shares | | | | Value | |
Pharmaceuticals (continued) | | | | | | | | |
Pfizer, Inc. | | | 725,495 | | | $ | 21,503,672 | |
Teva Pharmaceutical Industries Ltd. — ADR | | | 237,708 | | | | 12,719,755 | |
| | | | | | | | |
| | | | | | | | 50,993,098 | |
Road & Rail — 0.5% | | | | | | | | |
Norfolk Southern Corp. | | | 54,966 | | | | 4,575,919 | |
Semiconductors & Semiconductor Equipment — 3.1% | | | | | | | | |
Intel Corp. | | | 254,161 | | | | 8,222,108 | |
Lam Research Corp. | | | 104,616 | | | | 8,641,282 | |
NVIDIA Corp. | | | 257,396 | | | | 9,171,019 | |
| | | | | | | | |
| | | | | | | | 26,034,409 | |
Software — 4.2% | | | | | | | | |
Activision Blizzard, Inc. | | | 402,219 | | | | 13,611,091 | |
Microsoft Corp. | | | 392,103 | | | | 21,655,849 | |
| | | | | | | | |
| | | | | | | | 35,266,940 | |
Specialty Retail — 1.9% | | | | | | | | |
GNC Holdings, Inc., Class A | | | 134,425 | | | | 4,267,994 | |
Lowe’s Cos., Inc. | | | 153,753 | | | | 11,646,790 | |
| | | | | | | | |
| | | | | | | | 15,914,784 | |
Technology Hardware, Storage & Peripherals — 2.2% | | | | | | | | |
Apple Inc. | | | 58,719 | | | | 6,399,784 | |
EMC Corp. | | | 386,056 | | | | 10,288,392 | |
Western Digital Corp. | | | 38,360 | | | | 1,812,126 | |
| | | | | | | | |
| | | | | | | | 18,500,302 | |
| | | | | | | | |
Common Stocks | | | Shares | | | | Value | |
Tobacco — 2.1% | | | | | | | | |
Altria Group, Inc. | | | 286,654 | | | $ | 17,961,740 | |
Total Common Stocks — 98.7% | | | | | | | 828,751,321 | |
| | | | | | | | |
| Investment Companies — 0.6% | | | | | | |
Utilities Select Sector SPDR Fund | | | 107,300 | | | | 5,324,226 | |
Total Long-Term Investments (Cost — $672,226,004) — 99.3% | | | | | | | 834,075,547 | |
| | | | | | | | |
| Short-Term Securities | | | | | | |
BlackRock Liquidity Funds, TempFund, Institutional Class, 0.37% (b)(c) | | | 3,370,366 | | | | 3,370,366 | |
Total Short-Term Securities (Cost — $3,370,366) — 0.4% | | | | | | | 3,370,366 | |
Total Investments (Cost — $675,596,370) — 99.7% | | | | 837,445,913 | |
Other Assets Less Liabilities — 0.3% | | | | | | | 2,515,993 | |
| | | | | | | | |
Net Assets — 100.0% | | | | | | $ | 839,961,906 | |
| | | | | | | | |
|
| Notes to Schedule of Investments |
| (a) | Non-income producing security. |
| (b) | During the six months ended March 31, 2016, investments in issuers considered to be affiliates of the Portfolio for purposes of Section 2(a)(3) of the Investment Company Act of 1940, as amended, were as follows: |
| | | | | | | | | | | | | | | | | | | | |
| Affiliate | | Shares/Beneficial
Interest Held at
September 30, 2015 | | | Net Activity | | | Shares/Beneficial
Interest Held at
March 31, 2016 | | | Income | | | Realized
Gain | |
BlackRock Liquidity Funds, TempFund, Institutional Class | | | 20,813,175 | | | | (17,442,809 | ) | | | 3,370,366 | | | | $28,449 | | | | $1,314 | |
BlackRock Liquidity Series, LLC, Money Market Series | | | — | | | | — | | | | — | | | | 16,388 | 1 | | | — | |
Total | | | | | | | | | | | | | | | $44,837 | | | | $1,314 | |
| | | | | | | | | | | | | | | | |
| | 1 | | Represents securities lending income earned from the reinvestment of cash collateral from loaned securities, net of fees and collateral investment expenses, and other payments to and from borrowers of securities. |
| (c) | Current yield as of period end. |
| • | For Portfolio compliance purposes, the Portfolio’s industry classifications refer to one or more of the industry sub-classifications used by one or more widely recognized market indexes or ratings group indexes, and/or as defined by the investment advisor. These definitions may not apply for purposes of this report, which may combine such industry sub-classifications for reporting ease. |
|
| Derivative Financial Instruments Categorized by Risk Exposure |
For the six months ended March 31, 2016, the effect of derivative financial instruments in the Statements of Operation was as follows:
| | | | | | | | | | | | | | | | | | | | | | | | | | | | |
| | | Commodity
Contracts | | | Credit
Contracts | | | Equity
Contracts | | | Foreign
Currency
Exchange
Contracts | | | Interest
Rate
Contracts | | | Other
Contracts | | | Total | |
Net Realized Loss from: | | | | | | | | | | | | | | | | | | | | | | | | | | | | |
Futures contracts | | | — | | | | — | | | $ | (1,226,249 | ) | | | — | | | | — | | | | — | | | $ | (1,226,249 | ) |
|
| Average Quarterly Balances of Outstanding Derivative Financial Instruments |
| | | | |
Futures contracts: | | | | |
Average notional value of contracts — long | | $ | 7,073,015 | |
For more information about the Portfolio’s investment risks regarding derivative financial instruments, refer to the Notes to Financial Statements.
See Notes to Financial Statements.
| | | | | | |
| 52 | | BLACKROCK LARGE CAP SERIES FUNDS, INC. | | MARCH 31, 2016 | | |
| | | | |
| Schedule of Investments (concluded) | | | Master Large Cap Value Portfolio | |
|
| Fair Value Hierarchy as of Period End |
Various inputs are used in determining the fair value of investments. For information about the Portfolio’s policy regarding valuation of investments, refer to the Notes to Financial Statements.
The following table summarizes the Portfolio’s investments categorized in the disclosure hierarchy:
| | | | | | | | | | | | | | | | | | |
| | | Level 1 | | | | | Level 2 | | | | Level 3 | | | | Total | |
Assets: | | | | | | | | | | | | | | | | | | |
Investments: | | | | | | | | | | | | | | | | | | |
Long-Term Investments: | | | | | | | | | | | | | | | | | | |
Common Stocks1 | | $ | 828,751,321 | | | | | — | | | | — | | | | $ | 828,751,321 | |
Investment Companies | | | 5,324,226 | | | | | — | | | | — | | | | | 5,324,226 | |
Short-Term Securities | | | 3,370,366 | | | | | — | | | | — | | | | | 3,370,366 | |
| | | | |
Total | | $ | 837,445,913 | | | | | — | | | | — | | | | $ | 837,445,913 | |
| | | | |
| 1 | See above Schedule of Investments for values in each industry. |
The Portfolio may hold assets and/or liabilities in which the fair value approximates the carrying amount for financial statement purposes. As of period end, bank overdraft of $2,940 is categorized as Level 2 within the disclosure hierarchy.
During the six months ended March 31, 2016, there were no transfers between levels.
See Notes to Financial Statements.
| | | | | | |
| | | BLACKROCK LARGE CAP SERIES FUNDS, INC. | | MARCH 31, 2016 | | 53 |
| | | | |
| Statements of Assets and Liabilities | | | Master Large Cap Series LLC | |
| | | | | | | | | | | | |
| March 31, 2016 (Unaudited) | | Master Large Cap Core
Portfolio | | | Master Large Cap Growth
Portfolio | | | Master Large
Cap Value
Portfolio | |
| | | | | | | | | | | | |
| Assets | | | | | | | | | | | | |
Investments at value — unaffiliated1 | | $ | 2,150,886,725 | | | $ | 1,124,220,124 | | | $ | 834,075,547 | |
Investments at value — affiliated2 | | | 60,399,930 | | | | 37,213,592 | | | | 3,370,366 | |
Cash pledged for futures contracts | | | — | | | | 893,000 | | | | — | |
Receivables: | | | | | | | | | | | | |
Investments sold | | | 9,597,152 | | | | 13,214,411 | | | | 20,844,623 | |
Securities lending income — affiliated | | | — | | | | — | | | | 9,887 | |
Contributions from investors | | | 1,712,583 | | | | 852,875 | | | | 1,193,626 | |
Dividends — affiliated | | | 25,950 | | | | 15,819 | | | | 2,518 | |
Dividends — unaffiliated | | | 2,572,942 | | | | 1,412,449 | | | | 1,069,554 | |
Variation margin on futures contracts | | | — | | | | 31 | | | | — | |
Prepaid expenses | | | 6,887 | | | | 3,580 | | | | 2,663 | |
| | | | |
Total assets | | | 2,225,202,169 | | | | 1,177,825,881 | | | | 860,568,784 | |
| | | | |
| | | | | | | | | | | | |
| Liabilities | | | | | | | | | | | | |
Bank overdraft | | | — | | | | — | | | | 2,940 | |
Payables: | | | | | | | | | | | | |
Investments purchased | | | — | | | | 12,737,355 | | | | 18,310,483 | |
Directors’ fees | | | 15,726 | | | | 8,822 | | | | 7,035 | |
Investment advisory fees | | | 868,843 | | | | 478,160 | | | | 351,019 | |
Other accrued expenses | | | 94,510 | | | | 65,289 | | | | 62,032 | |
Other affiliates | | | 6,429 | | | | 2,956 | | | | 2,665 | |
Variation margin on futures contracts | | | — | | | | 34,780 | | | | — | |
Withdrawals to investors | | | 30,384,773 | | | | 1,326,904 | | | | 1,870,704 | |
| | | | |
Total liabilities | | | 31,370,281 | | | | 14,654,266 | | | | 20,606,878 | |
| | | | |
Net Assets | | $ | 2,193,831,888 | | | $ | 1,163,171,615 | | | $ | 839,961,906 | |
| | | | |
| | | | | | | | | | | | |
| Net Assets Consist of | | | | | | | | | | | | |
Investors’ capital | | $ | 1,734,889,689 | | | $ | 869,590,220 | | | $ | 678,112,363 | |
Net unrealized appreciation (depreciation) | | | 458,942,199 | | | | 293,581,395 | | | | 161,849,543 | |
| | | | |
Net Assets | | $ | 2,193,831,888 | | | $ | 1,163,171,615 | | | $ | 839,961,906 | |
| | | | |
1 Investments at cost — unaffiliated | | $ | 1,691,944,526 | | | $ | 831,315,497 | | | $ | 672,226,004 | |
2 Investments at cost — affiliated | | $ | 60,399,930 | | | $ | 37,213,592 | | | $ | 3,370,366 | |
See Notes to Financial Statements.
| | | | | | |
| 54 | | BLACKROCK LARGE CAP SERIES FUNDS, INC. | | MARCH 31, 2016 | | |
| | | | |
| Statements of Operations | | | Master Large Cap Series LLC | |
| | | | | | | | | | | | |
| Six Months Ended March 31, 2016 (Unaudited) | | Master Large Cap
Core Portfolio | | | Master Large
Cap Growth
Portfolio | | | Master Large
Cap Value
Portfolio | |
| | | | | | | | | | | | |
| Investment Income | | | | | | | | | | | | |
Dividends — affiliated | | $ | 72,532 | | | $ | 45,437 | | | $ | 28,449 | |
Dividends — unaffiliated | | | 18,289,675 | | | | 8,038,797 | | | | 8,559,071 | |
Securities lending — affiliated — net | | | 7,211 | | | | 137,347 | | | | 16,388 | |
Foreign taxes withheld | | | (123,872 | ) | | | (29,106 | ) | | | (63,959 | ) |
| | | | |
Total income | | | 18,245,546 | | | | 8,192,475 | | | | 8,539,949 | |
| | | | |
| | | | | | | | | | | | |
| Expenses | | | | | | | | | | | | |
Investment advisory | | | 5,199,456 | | | | 2,859,836 | | | | 2,138,467 | |
Accounting services | | | 196,851 | | | | 117,779 | | | | 94,533 | |
Directors | | | 32,094 | | | | 18,007 | | | | 14,508 | |
Professional | | | 31,779 | | | | 28,971 | | | | 28,485 | |
Custodian | | | 31,511 | | | | 18,503 | | | | 13,688 | |
Printing | | | 1,286 | | | | 1,028 | | | | 788 | |
Miscellaneous | | | 16,231 | | | | 10,592 | | | | 9,137 | |
| | | | |
Total expenses | | | 5,509,208 | | | | 3,054,716 | | | | 2,299,606 | |
Less fees waived by the Manager | | | (17,182 | ) | | | (11,515 | ) | | | (9,872 | ) |
| | | | |
Total expenses after fees waived | | | 5,492,026 | | | | 3,043,201 | | | | 2,289,734 | |
| | | | |
Net investment income | | | 12,753,520 | | | | 5,149,274 | | | | 6,250,215 | |
| | | | |
| | | | | | | | | | | | |
| Realized and Unrealized Gain (Loss) | | | | | | | | | | | | |
Net realized gain (loss) from: | | | | | | | | | | | | |
Capital gain distributions received from affiliated investment companies | | | 500 | | | | 712 | | | | 1,314 | |
Futures contracts | | | 4,978,545 | | | | 521,006 | | | | (1,226,249 | ) |
Investments | | | 19,959,836 | | | | 36,459,132 | | | | 11,943,494 | |
| | | | |
| | | 24,938,881 | | | | 36,980,850 | | | | 10,718,559 | |
| | | | |
Net change in unrealized appreciation (depreciation) on: | | | | | | | | | | | | |
Futures contracts | | | — | | | | 676,768 | | | | — | |
Investments | | | 78,434,312 | | | | 48,983,030 | | | | 15,718,532 | |
| | | | |
| | | 78,434,312 | | | | 49,659,798 | | | | 15,718,532 | |
| | | | |
Total realized and unrealized gain | | | 103,373,193 | | | | 86,640,648 | | | | 26,437,091 | |
| | | | |
Net Increase in Net Assets Resulting from Operations | | $ | 116,126,713 | | | $ | 91,789,922 | | | $ | 32,687,306 | |
| | | | |
See Notes to Financial Statements.
| | | | | | |
| | | BLACKROCK LARGE CAP SERIES FUNDS, INC. | | MARCH 31, 2016 | | 55 |
| | | | |
| Statements of Changes in Net Assets | | | Master Large Cap Series LLC | |
| | | | | | | | | | | | | | | | |
| | | Master Large Cap Core Portfolio | | | Master Large Cap Growth Portfolio | |
| Increase (Decrease) in Net Assets: | | Six Months Ended
March 31, 2016
(Unaudited) | | | Year Ended
September 30,
2015 | | | Six Months Ended
March 31, 2016
(Unaudited) | | | Year Ended
September 30,
2015 | |
| | | | | | | | | | | | | | | | |
| Operations | | | | | | | | | | | | | | | | |
Net investment income | | $ | 12,753,520 | | | $ | 25,910,700 | | | $ | 5,149,274 | | | $ | 10,399,038 | |
Net realized gain | | | 24,938,881 | | | | 143,142,291 | | | | 36,980,850 | | | | 61,300,472 | |
Net change in unrealized appreciation (depreciation) | | | 78,434,312 | | | | (174,949,314 | ) | | | 49,659,798 | | | | (45,409,726 | ) |
| | | | | | | | |
Net increase (decrease) in net assets resulting from operations | | | 116,126,713 | | | | (5,896,323 | ) | | | 91,789,922 | | | | 26,289,784 | |
| | | | | | | | |
| | | | | | | | | | | | | | | | |
| Capital Transactions | | | | | | | | | | | | | | | | |
Proceeds from contributions | | | 143,822,542 | | | | 241,299,172 | | | | 101,466,013 | | | | 261,731,405 | |
Value of withdrawals | | | (219,448,528 | ) | | | (417,574,858 | ) | | | (129,308,611 | ) | | | (345,492,080 | ) |
| | | | | | | | |
Net decrease in net assets derived from capital transactions | | | (75,625,986 | ) | | | (176,275,686 | ) | | | (27,842,598 | ) | | | (83,760,675 | ) |
| | | | | | | | |
| | | | | | | | | | | | | | | | |
| Net Assets | | | | | | | | | | | | | | | | |
Total increase (decrease) in net assets | | | 40,500,727 | | | | (182,172,009 | ) | | | 63,947,324 | | | | (57,470,891 | ) |
Beginning of period | | | 2,153,331,161 | | | �� | 2,335,503,170 | | | | 1,099,224,291 | | | | 1,156,695,182 | |
| | | | | | | | |
End of period | | $ | 2,193,831,888 | | | $ | 2,153,331,161 | | | $ | 1,163,171,615 | | | $ | 1,099,224,291 | |
| | | | | | | | |
| | | | | | | | |
| | | Master Large Cap Value Portfolio | |
| Increase (Decrease) in Net Assets: | | Six Months Ended
March 31, 2016
(Unaudited) | | | Year Ended
September 30,
2015 | |
| | | | | | | | |
| Operations | | | | | | | | |
Net investment income | | $ | 6,250,215 | | | $ | 12,527,519 | |
Net realized gain | | | 10,718,559 | | | | 72,604,118 | |
Net change in unrealized appreciation (depreciation) | | | 15,718,532 | | | | (94,139,946 | ) |
| | | | |
Net increase (decrease) in net assets resulting from operations | | | 32,687,306 | | | | (9,008,309 | ) |
| | | | |
| | | | | | | | |
| Capital Transactions | | | | | | | | |
Proceeds from contributions | | | 109,123,789 | | | | 131,159,081 | |
Value of withdrawals | | | (138,914,557 | ) | | | (251,436,817 | ) |
| | | | |
Net decrease in net assets derived from capital transactions | | | (29,790,768 | ) | | | (120,277,736 | ) |
| | | | |
| | | | | | | | |
| Net Assets | | | | | | | | |
Total increase (decrease) in net assets | | | 2,896,538 | | | | (129,286,045 | ) |
Beginning of period | | | 837,065,368 | | | | 966,351,413 | |
| | | | |
End of period | | $ | 839,961,906 | | | $ | 837,065,368 | |
| | | | |
See Notes to Financial Statements.
| | | | | | |
| 56 | | BLACKROCK LARGE CAP SERIES FUNDS, INC. | | MARCH 31, 2016 | | |
| | | | |
| Financial Highlights | | | Master Large Cap Series LLC | |
| | | | | | | | | | | | | | | | | | | | | | | | |
| | | Master Large Cap Core Portfolio | |
| | | Six Months
Ended
March 31,
2016 | | | Year Ended September 30, | |
| | | (Unaudited) | | | 2015 | | | 2014 | | | 2013 | | | 2012 | | | 2011 | |
| Total Return | | | | | | | | | | | | | | | | | | | | | | | | |
Total return | | | 5.22 | %1 | | | (0.89 | )% | | | 19.44 | % | | | 20.39 | % | | | 29.97 | % | | | (1.61 | )% |
| | | | |
| | | | | | | | | | | | | | | | | | | | | | | | |
| Ratios to Average Net Assets | | | | | | | | | | | | | | | | | | | | | | | | |
Total expenses | | | 0.50 | %2 | | | 0.50 | % | | | 0.50 | % | | | 0.50 | % | | | 0.50 | % | | | 0.49 | % |
| | | | |
Total expenses after fees waived | | | 0.50 | %2 | | | 0.50 | % | | | 0.50 | % | | | 0.50 | % | | | 0.50 | % | | | 0.49 | % |
| | | | |
Net investment income | | | 1.16 | %2 | | | 1.09 | % | | | 1.08 | % | | | 1.29 | % | | | 1.67 | % | | | 1.13 | % |
| | | | |
| | | | | | | | | | | | | | | | | | | | | | | | |
| Supplemental Data | | | | | | | | | | | | | | | | | | | | | | | | |
Net assets, end of period (000) | | | $2,193,832 | | | | $2,153,331 | | | | $2,335,503 | | | | $2,308,896 | | | | $2,318,851 | | | | $2,306,714 | |
| | | | |
Portfolio turnover rate | | | 19 | % | | | 41 | % | | | 40 | % | | | 50 | % | | | 128 | % | | | 129 | % |
| | | | |
| |
| | | Master Large Cap Growth Portfolio | |
| | | Six Months
Ended
March 31,
2016 | | | Year Ended September 30, | |
| | | (Unaudited) | | | 2015 | | | 2014 | | | 2013 | | | 2012 | | | 2011 | |
| Total Return | | | | | | | | | | | | | | | | | | | | | | | | |
Total return | | | 8.53 | %1 | | | 1.70 | % | | | 21.59 | % | | | 15.76 | % | | | 31.61 | % | | | 0.72 | % |
| | | | |
| | | | | | | | | | | | | | | | | | | | | | | | |
| Ratios to Average Net Assets | | | | | | | | | | | | | | | | | | | | | | | | |
Total expenses | | | 0.53 | %2 | | | 0.53 | % | | | 0.53 | % | | | 0.54 | % | | | 0.55 | % | | | 0.54 | % |
| | | | |
Total expenses after fees waived | | | 0.53 | %2 | | | 0.53 | % | | | 0.53 | % | | | 0.54 | % | | | 0.55 | % | | | 0.54 | % |
| | | | |
Net investment income | | | 0.90 | %2 | | | 0.85 | % | | | 0.90 | % | | | 1.25 | % | | | 1.61 | % | | | 0.93 | % |
| | | | |
| | | | | | | | | | | | | | | | | | | | | | | | |
| Supplemental Data | | | | | | | | | | | | | | | | | | | | | | | | |
Net assets, end of period (000) | | | $1,163,172 | | | | $1,099,224 | | | | $1,156,695 | | | | $1,005,008 | | | | $913,632 | | | | $995,279 | |
| | | | |
Portfolio turnover rate | | | 17 | % | | | 41 | % | | | 49 | % | | | 54 | % | | | 132 | % | | | 169 | % |
| | | | |
| |
| | | Master Large Cap Value Portfolio | |
| | | Six Months
Ended
March 31,
2016 | | | Year Ended September 30, | |
| | | (Unaudited) | | | 2015 | | | 2014 | | | 2013 | | | 2012 | | | 2011 | |
| Total Return | | | | | | | | | | | | | | | | | | | | | | | | |
Total return | | | 4.33 | %1 | | | (1.63 | )% | | | 18.35 | % | | | 22.80 | % | | | 25.26 | % | | | (4.34 | )% |
| | | | |
| | | | | | | | | | | | | | | | | | | | | | | | |
| Ratios to Average Net Assets | | | | | | | | | | | | | | | | | | | | | | | | |
Total expenses | | | 0.54 | %2 | | | 0.54 | % | | | 0.54 | % | | | 0.54 | % | | | 0.54 | % | | | 0.54 | % |
| | | | |
Total expenses after fees waived | | | 0.54 | %2 | | | 0.54 | % | | | 0.54 | % | | | 0.54 | % | | | 0.54 | % | | | 0.54 | % |
| | | | |
Net investment income | | | 1.46 | %2 | | | 1.33 | % | | | 1.37 | % | | | 1.58 | % | | | 1.71 | % | | | 1.28 | % |
| | | | |
| | | | | | | | | | | | | | | | | | | | | | | | |
| Supplemental Data | | | | | | | | | | | | | | | | | | | | | | | | |
Net assets, end of period (000) | | | $839,962 | | | | $837,065 | | | | $966,351 | | | | $955,547 | | | | $1,063,824 | | | | $1,331,102 | |
| | | | |
Portfolio turnover rate | | | 22 | % | | | 30 | % | | | 32 | % | | | 40 | % | | | 147 | % | | | 156 | % |
| | | | |
| | 1 | | Aggregate total return. |
See Notes to Financial Statements.
| | | | | | |
| | | BLACKROCK LARGE CAP SERIES FUNDS, INC. | | MARCH 31, 2016 | | 57 |
| | | | |
| Notes to Financial Statements (Unaudited) | | | Master Large Cap Series LLC | |
1. Organization:
Master Large Cap Core Portfolio, Master Large Cap Growth Portfolio and Master Large Cap Value Portfolio (collectively, the “Portfolios” or individually, a “Portfolio”) are each a series of Master Large Cap Series LLC (the “Master LLC”). The Master LLC is registered under the Investment Company Act of 1940, as amended (the “1940 Act”), as an open-end management investment company and is organized as a Delaware limited liability company. Each Portfolio is classified as diversified. The Limited Liability Company Agreement of the Master LLC permits the Board of Directors of the Master LLC (the “Board and the members are referred to as “Directors”) to issue non-transferable interests in the Master LLC, subject to certain limitations.
The Portfolios, together with certain other registered investment companies advised by BlackRock Advisors, LLC (the “Manager”) or its affiliates, are included in a complex of open-end funds referred to as the Equity-Liquidity Complex.
2. Significant Accounting Policies:
The financial statements are prepared in conformity with accounting principles generally accepted in the United States of America (“U.S. GAAP”), which may require management to make estimates and assumptions that affect the reported amounts of assets and liabilities in the financial statements, disclosure of contingent assets and liabilities at the date of the financial statements and the reported amounts of increases and decreases in net assets from operations during the reporting period. Actual results could differ from those estimates. Each Portfolio is considered an investment company under U.S. GAAP and follows the accounting and reporting guidance applicable to investment companies. Below is a summary of significant accounting policies:
Segregation and Collateralization: In cases where a Portfolio enters into certain investments (e.g., futures contracts) that would be treated as “senior securities” for 1940 Act purposes, the Portfolio may segregate or designate on its books and records cash or liquid assets having a market value at least equal to the amount of their future obligations under such investments or borrowings. Doing so allows the investment to be excluded from treatment as a “senior security.” Furthermore, if required by an exchange or counterparty agreement, the Portfolio may be required to deliver/deposit cash and/or securities to/with an exchange, or broker-dealer or custodian as collateral for certain investments or obligations.
Investment Transactions and Investment Income: For financial reporting purposes, investment transactions are recorded on the dates the transactions are entered into (the trade dates). Realized gains and losses on investment transactions are determined on the identified cost basis. Dividend income is recorded on the ex-dividend date. Dividends from foreign securities where the ex-dividend date may have passed are subsequently recorded when the Portfolios are informed of the ex-dividend date. Under the applicable foreign tax laws, a withholding tax at various rates may be imposed on capital gains, dividends and interest. Upon notification from issuers, some of the dividend income received from a real estate investment trust may be redesignated as a reduction of cost of the related investment and/or realized gain.
Indemnifications: In the normal course of business, a Portfolio enters into contracts that contain a variety of representations that provide general indemnification. A Portfolio’s maximum exposure under these arrangements is unknown because it involves future potential claims against a Portfolio, which cannot be predicted with any certainty.
Other: Expenses directly related to a Portfolio are charged to that Portfolio. Other operating expenses shared by several funds, including other funds managed by the Manager, are prorated among those funds on the basis of relative net assets or other appropriate methods.
Each Portfolio has an arrangement with its custodian whereby fees may be reduced by credits earned on uninvested cash balances, which, if applicable, are shown as fees paid indirectly in the Statements of Operations. The custodian imposes fees on overdrawn cash balances, which can be offset by accumulated credits earned or may result in additional custody charges.
3. Investment Valuation and Fair Value Measurements:
Investment Valuation Policies: The Portfolios’ investments are valued at fair value (also referred to as “market value” within the financial statements) as of the close of trading on the New York Stock Exchange (“NYSE”) (generally 4:00 p.m., Eastern time). U.S. GAAP defines fair value as the price the Portfolios would receive to sell an asset or pay to transfer a liability in an orderly transaction between market participants at the measurement date. The Portfolios determine the fair values of their financial instruments using independent dealers or pricing services under policies approved by the Board. The BlackRock Global Valuation Methodologies Committee (the “Global Valuation Committee”) is the committee formed by management to develop global pricing policies and procedures and to provide oversight of the pricing function for the Portfolios for all financial instruments.
Fair Value Inputs and Methodologies: The following methods (or “techniques”) and inputs are used to establish the fair value of each Portfolio’s assets and liabilities:
| • | | Equity investments traded on a recognized securities exchange are valued at the official close price each day, if available. For equity investments traded on more than one exchange, the official close price on the exchange where the stock is primarily traded is used. Equity investments traded on a recognized exchange for which there were no sales on that day may be valued at the last available bid (long positions) or ask (short positions) price. |
| | | | | | |
| 58 | | BLACKROCK LARGE CAP SERIES FUNDS, INC. | | MARCH 31, 2016 | | |
| | | | |
| Notes to Financial Statements (continued) | | | Master Large Cap Series LLC | |
| • | | Investments in open-end U.S. mutual funds are valued at NAV each business day. |
| • | | The Portfolios value their investment in BlackRock Liquidity Series, LLC, Money Market Series (the “Money Market Series”) at fair value, which is ordinarily based upon their pro rata ownership in the underlying fund’s net assets. The Money Market Series seeks current income consistent with maintaining liquidity and preserving capital. Although the Money Market Series is not registered under the 1940 Act, its investments will follow the parameters of investments by a money market fund that is subject to Rule 2a-7 under the 1940 Act. The Portfolios may withdraw up to 25% of their investment daily, although the manager of the Money Market Series, in its sole discretion, may permit an investor to withdraw more than 25% on any one day. |
| • | | Futures contracts traded on exchanges are valued at their last sale price. |
If events (e.g., a company announcement, market volatility or a natural disaster) occur that are expected to materially affect the value of such instruments, or in the event that the application of these methods of valuation results in a price for an investment that is deemed not to be representative of the market value of such investment, or if a price is not available, the investment will be valued by the Global Valuation Committee, or its delegate, in accordance with a policy approved by the Board as reflecting fair value (“Fair Valued Investments”). When determining the price for Fair Valued Investments, the Global Valuation Committee, or its delegate, seeks to determine the price that each Portfolio might reasonably expect to receive or pay from the current sale or purchase of that asset or liability in an arm’s-length transaction. Fair value determinations shall be based upon all available factors that the Global Valuation Committee, or its delegate, deems relevant consistent with the principles of fair value measurement. The pricing of all Fair Valued Investments is subsequently reported to the Board or a committee thereof on a quarterly basis.
Fair Value Hierarchy: Various inputs are used in determining the fair value of investments and derivative financial instruments. These inputs to valuation techniques are categorized into a fair value hierarchy consisting of three broad levels for financial statement purposes as follows:
| • | | Level 1 — unadjusted price quotations in active markets/exchanges for identical assets or liabilities that each Portfolio has the ability to access |
| • | | Level 2 — other observable inputs (including, but not limited to, quoted prices for similar assets or liabilities in markets that are active, quoted prices for identical or similar assets or liabilities in markets that are not active, inputs other than quoted prices that are observable for the assets or liabilities (such as interest rates, yield curves, volatilities, prepayment speeds, loss severities, credit risks and default rates) or other market-corroborated inputs) |
| • | | Level 3 — unobservable inputs based on the best information available in the circumstances, to the extent observable inputs are not available (including each Portfolio’s own assumptions used in determining the fair value of instruments and derivative financial instruments) |
The hierarchy gives the highest priority to unadjusted quoted prices in active markets for identical assets or liabilities (Level 1 measurements) and the lowest priority to unobservable inputs (Level 3 measurements). Accordingly, the degree of judgment exercised in determining fair value is greatest for instruments categorized in Level 3. The inputs used to measure fair value may fall into different levels of the fair value hierarchy. In such cases, for disclosure purposes, the fair value hierarchy classification is determined based on the lowest level input that is significant to the fair value measurement in its entirety. The significant unobservable inputs used by the Global Valuation Committee in determining the price for Fair Valued Investments are typically categorized as Level 3. The fair value hierarchy for each Portfolio’s investments and derivative financial instruments has been included in the Schedules of Investments.
Changes in valuation techniques may result in transfers into or out of an assigned level within the hierarchy. In accordance with each Portfolio’s policy, transfers between different levels of the fair value hierarchy are deemed to have occurred as of the beginning of the reporting period. The categorization of a value determined for investments and derivative financial instruments is based on the pricing transparency of the investment and derivative financial instruments is not necessarily an indication of the risks associated with investing in those securities.
4. Securities and Other Investments:
Securities Lending: Each Portfolio may lend its securities to approved borrowers, such as brokers, dealers and other financial institutions. The borrower pledges and maintains with the Portfolios collateral consisting of cash, an irrevocable letter of credit issued by a bank, or securities issued or guaranteed by the U.S. Government. The initial collateral received by each Portfolio is required to have a value of at least 102% of the current value of the loaned securities for securities traded on U.S. exchanges and a value of at least 105% for all other securities. The collateral is maintained thereafter, at a value equal to at least 100% of the current market value of the securities on loan. The market value of the loaned securities is determined at the close of each business day of the Portfolio and any additional required collateral is delivered to the Portfolio, or excess collateral returned by the Portfolio, on the next business day. During the term of the loan, each Portfolio is entitled to all distributions made on or in respect of the loaned securities. Loans of securities are terminable at any time and the borrower, after notice, is required to return borrowed securities within the standard time period for settlement of securities transactions.
| | | | | | |
| | | BLACKROCK LARGE CAP SERIES FUNDS, INC. | | MARCH 31, 2016 | | 59 |
| | | | |
| Notes to Financial Statements (continued) | | | Master Large Cap Series LLC | |
The market value of securities on loan, all of which were classified as common stocks in the Portfolios’ Schedules of Investments, and the value of the related collateral are shown separately in the Statements of Assets and Liabilities as a component of investments at value — unaffiliated, and collateral on securities loaned at value, respectively. As of period end, any securities on loan were collateralized by cash. The cash collateral invested by the securities lending agent, BlackRock Investment Management, LLC (“BIM”), if any, is disclosed in the Schedules of Investments.
Securities lending transactions are entered into by the Portfolios under Master Securities Lending Agreements (each, an “MSLA”) which provide the right, in the event of default (including bankruptcy or insolvency), for the non-defaulting party to liquidate the collateral and calculate a net exposure to the defaulting party or request additional collateral. In the event that a borrower defaults, each Portfolio, as lender, would offset the market value of the collateral received against the market value of the securities loaned. When the value of the collateral is greater than that of the market value of the securities loaned, the lender is left with a net amount payable to the defaulting party. However, bankruptcy or insolvency laws of a particular jurisdiction may impose restrictions on or prohibitions against such a right of offset in the event of an MSLA counterparty’s bankruptcy or insolvency. Under the MSLA, absent an event of default the borrower can resell or re-pledge the loaned securities, and a Portfolio can reinvest cash collateral received in connection with loaned securities. Upon an event of default, the parties’ obligations to return the securities or collateral to the other party are extinguished, and the parties can resell or re-pledge the loaned securities or the collateral received in connection with the loaned securities in order to satisfy the defaulting party’s net payment obligation for all transactions under the MSLA. The defaulting party remains liable for any deficiency.
The risks of securities lending include the risk that the borrower may not provide additional collateral when required or may not return the securities when due. To mitigate these risks, the Portfolios benefit from a borrower default indemnity provided by BIM. BIM’s indemnity allows for full replacement of the securities loaned if the collateral received does not cover the value on the securities loaned in the event of borrower default. Each Portfolio could suffer a loss if the value of an investment purchased with cash collateral falls below the market value of loaned securities or if the value of an investment purchased with cash collateral falls below the value of the original cash collateral received.
5. Derivative Financial Instruments:
The Portfolios engage in various portfolio investment strategies using derivative contracts both to increase the returns of the Portfolios and/or to manage their exposure to certain risks such as credit risk, equity risk, interest rate risk, foreign currency exchange rate risk, commodity price risk or other risks (e.g., inflation risk). Derivative financial instruments categorized by risk exposure are included in the Schedules of Investments. These contracts may be transacted on an exchange or over-the-counter (“OTC”).
Futures Contracts: Certain Portfolios invest in long and/or short positions in futures contracts and options on futures contracts to gain exposure to, or manage exposure to, changes in interest rates (interest rate risk), changes in the value of equity securities (equity risk) or foreign currencies (foreign currency exchange rate risk).
Futures contracts are agreements between the Portfolios and a counterparty to buy or sell a specific quantity of an underlying instrument at a specified price and on specified date. Depending on the terms of a contract, it is settled either through physical delivery of the underlying instrument on the settlement date or by payment of a cash amount on the settlement date.
Upon entering into a futures contract, the Portfolios are required to deposit initial margin with the broker in the form of cash or securities in an amount that varies depending on a contract’s size and risk profile. The initial margin deposit must then be maintained at an established level over the life of the contract.
Securities deposited as initial margin are designated in the Schedules of Investments and cash deposited, if any, is shown as cash pledged for futures contracts in the Statements of Assets and Liabilities. Pursuant to the contract, the Portfolios agree to receive from or pay to the broker an amount of cash equal to the daily fluctuation in market value of the contract (“variation margin”). Variation margin is recorded as unrealized appreciation (depreciation) and, if any, shown as variation margin receivable (or payable) on futures contracts in the Statements of Assets and Liabilities. When the contract is closed, a realized gain or loss is recorded in the Statements of Operations equal to the difference between the value of the contract at the time it was opened and the value at the time it was closed. The use of futures contracts involves the risk of an imperfect correlation in the movements in the price of futures contracts, and interest, foreign currency exchange rates or underlying assets.
6. Investment Advisory Agreement and Other Transactions with Affiliates:
The PNC Financial Services Group, Inc. is the largest stockholder and an affiliate of BlackRock, Inc. (“BlackRock”) for 1940 Act purposes.
Investment Advisory
The Master LLC, on behalf of each Portfolio, entered into an Investment Advisory Agreement with the Manager, the Portfolios’ investment advisor, an indirect, wholly owned subsidiary of BlackRock, to provide investment advisory and administration services. The Manager is responsible for the management of each Portfolio and provides the personnel, facilities, equipment and certain other services necessary to the operations of each Portfolio.
| | | | | | |
| 60 | | BLACKROCK LARGE CAP SERIES FUNDS, INC. | | MARCH 31, 2016 | | |
| | | | |
| Notes to Financial Statements (continued) | | | Master Large Cap Series LLC | |
For such services, each Portfolio pays the Manager a monthly fee based on a percentage of each Portfolio’s average daily net assets at the following annual rates:
Master Large Cap Core Portfolio
| | | | |
| Average Daily Net Assets | | Investment
Advisory Fee | |
Not exceeding $1 Billion | | | 0.50% | |
In excess of $1 Billion, but not exceeding $5 Billion | | | 0.45% | |
In excess of $5 Billion | | | 0.40% | |
Master Large Cap Growth Portfolio
| | | | |
| Average Daily Net Assets | | Investment
Advisory Fee | |
Not exceeding $5 Billion | | | 0.50% | |
In excess of $5 Billion | | | 0.45% | |
Master Large Cap Value Portfolio
| | | | |
| Average Daily Net Assets | | Investment
Advisory Fee | |
Not exceeding $3 Billion | | | 0.50% | |
In excess of $3 Billion | | | 0.45% | |
Expense Limitations, Waivers and Reimbursements
The Manager voluntarily agreed to waive its investment advisory fees by the amount of investment advisory fees each Portfolio pays to the Manager indirectly through its investment in affiliated money market funds. These amounts are shown as fees waived by the Manager in the Statements of Operations. However, the Manager does not waive its investment advisory fees by the amount of investment advisory fees paid in connection with each Portfolio’s investment in other affiliated investment companies, if any.
For the six months ended March 31, 2016, the Portfolios reimbursed the Manager for certain accounting services, which are included in accounting services in the Statements of Operations. The reimbursements were as follows:
| | | | |
Master Large Cap Core Portfolio | | | $12,241 | |
Master Large Cap Growth Portfolio | | | $ 6,377 | |
Master Large Cap Value Portfolio | | | $ 4,794 | |
Securities Lending
The U.S. Securities and Exchange Commission has issued an exemptive order which permits BIM, an affiliate of the Manager, to serve as securities lending agent for the Portfolios, subject to applicable conditions. As securities lending agent, BIM bears all operational costs directly related to securities lending. The Portfolios are responsible for expenses in connection with the investment of cash collateral received for securities on loan (the “collateral investment expenses”). The cash collateral is invested in a private investment company managed by the Manager or its affiliates. However, BIM has agreed to cap the collateral investment expenses of the private investment company to an annual rate of 0.04%. The investment advisor to the private investment company will not charge any advisory fees with respect to shares purchased by the Portfolios.
Securities lending income is equal to the total of income earned from the reinvestment of cash collateral, net of fees and other payments to and from borrowers of securities, and less the collateral investment expenses. Each Portfolio retains a portion of securities lending income and remits a remaining portion to BIM as compensation for its services as securities lending agent. Pursuant to a securities lending agreement, BIM may lend securities only when the difference between the borrower rebate rate and the risk free rate exceeds a certain level (such securities, the “specials only securities”).
Pursuant to such agreement, each Portfolio retains 80% of securities lending income. In addition, commencing the business day following the date that the aggregate securities lending income earned across certain funds in the Equity-Liquidity Complex in a calendar year exceeds a specified threshold, each Portfolio, pursuant to the securities lending agreement, will retain for the remainder of the calendar year securities lending income in an amount equal to 85% of securities lending income.
| | | | | | |
| | | BLACKROCK LARGE CAP SERIES FUNDS, INC. | | MARCH 31, 2016 | | 61 |
| | | | |
| Notes to Financial Statements (continued) | | | Master Large Cap Series LLC | |
The share of securities lending income earned by each Portfolio is shown as securities lending — affiliated — net in the Statements of Operations. For the six months ended March 31, 2016, each Portfolio paid BIM the following amounts for securities lending agent services:
| | | | |
Master Large Cap Core Portfolio | | Master Large Cap Growth Portfolio | | Master Large Cap Value Portfolio |
$1,781 | | $28,633 | | $4,078 |
Officers and Directors
Certain officers and/or directors of the Master LLC are officers and/or directors of BlackRock or its affiliates.
7. Purchases and Sales:
For the six months ended March 31, 2016, purchases and sales of investments, excluding short-term securities, were as follows:
| | | | | | | | | | | | | | | | | | | |
| | | Master Large Cap
Core Portfolio | | | | Master Large Cap
Growth Portfolio | | | | Master Large Cap
Value Portfolio |
Purchases | | | $ | 419,588,493 | | | | | | $ | 188,887,903 | | | | | | $ | 182,408,755 | |
Sales | | | $ | 487,283,065 | | | | | | $ | 236,660,972 | | | | | | $ | 190,172,096 | |
8. Income Tax Information:
The Portfolios are classified as a partnership for federal income tax purposes. As such, each investor in the Portfolios is treated as the owner of its proportionate share of net assets, income, expenses and realized and unrealized gains and losses of the Portfolios. Therefore, no federal income tax provision is required. It is intended that the Portfolios’ assets will be managed so an investor in the Portfolios can satisfy the requirements of Subchapter M of the Internal Revenue Code of 1986, as amended.
Each Portfolio files U.S. federal and various state and local tax returns. No income tax returns are currently under examination. The statute of limitations on each Portfolio’s U.S. federal tax returns remains open for each of the four years ended September 30, 2015. The statutes of limitations on each Portfolio’s state and local tax returns may remain open for an additional year depending upon the jurisdiction.
Management has analyzed tax laws and regulations and their application to the Portfolios as of March 31, 2016, inclusive of the open tax return years, and does not believe that there are any uncertain tax positions that require recognition of a tax liability in the Portfolios’ financial statements.
As of March 31, 2016, gross unrealized appreciation and depreciation based on cost for federal income tax purposes were as follows:
| | | | | | | | | | | | | | | | | | | |
| | | Master Large Cap Core Portfolio | | | | Master Large Cap
Growth Portfolio | | | | Master Large Cap
Value Portfolio |
Tax cost | | | $ | 1,756,374,524 | | | | | | $ | 871,093,276 | | | | | | $ | 688,138,308 | |
Gross unrealized appreciation | | | $ | 495,737,843 | | | | | | $ | 307,149,776 | | | | | | $ | 166,233,611 | |
Gross unrealized depreciation | | | | (40,825,712 | ) | | | | | | (16,809,336 | ) | | | | | | (16,926,006 | ) |
Net unrealized appreciation | | | $ | 454,912,131 | | | | | | $ | 290,340,440 | | | | | | $ | 149,307,605 | |
| | | | | |
| | | | | | | | | | | | | | | | | | | | |
9. Bank Borrowings:
The Master LLC, on behalf of the Portfolios, along with certain other funds managed by the Manager and its affiliates (“Participating Funds”), is a party to a 364-day, $2.1 billion credit agreement with a group of lenders, under which the Portfolios may borrow to fund shareholder redemptions. Excluding commitments designated for certain individual funds, the Participating Funds, including the Portfolios, can borrow up to an aggregate commitment amount of $1.6 billion at any time outstanding, subject to asset coverage and other limitations as specified in the agreement. The credit agreement has the following terms: a fee of 0.06% per annum on unused commitment amounts and interest at a rate equal to the higher of (a) one-month LIBOR (but, in any event, not less than 0.00%) on the date the loan is made plus 0.80% per annum or (b) the Fed Funds rate (but, in any event, not less than 0.00%) in effect from time to time plus 0.80% per annum on amounts borrowed. The agreement expires in April 2016 unless extended or renewed. Participating Funds paid administration, legal and arrangement fees, which, if applicable, are included in miscellaneous expenses in the Statements of Operations, and along with commitment fees, were allocated among such funds based upon portions of the aggregate commitment available to them and relative net assets of Participating Funds. During the six months ended March 31, 2016, the Portfolios did not borrow under the credit agreement.
10. Principal Risks:
In the normal course of business, the Portfolios invest in securities and enters into transactions where risks exist due to fluctuations in the market (market risk) or failure of the issuer to meet all its obligations, including the ability to pay principal and interest when due (issuer credit risk). The value of securities held by the Portfolios may decline in response to certain events, including those directly involving the issuers of securities owned by the
| | | | | | |
| 62 | | BLACKROCK LARGE CAP SERIES FUNDS, INC. | | MARCH 31, 2016 | | |
| | | | |
| Notes to Financial Statements (concluded) | | | Master Large Cap Series LLC | |
Portfolios. Changes arising from the general economy, the overall market and local, regional or global political and/or social instability, as well as currency, interest rate and price fluctuations, may also affect the securities’ value.
Counterparty Credit Risk: Similar to issuer credit risk, the Portfolios may be exposed to counterparty credit risk, or the risk that an entity may fail to or be unable to perform on its commitments related to unsettled or open transactions. The Portfolios manage counterparty credit risk by entering into transactions only with counterparties that the Manager believes have the financial resources to honor their obligations and by monitoring the financial stability of those counterparties. Financial assets, which potentially expose the Portfolios to market, issuer and counterparty credit risks, consist principally of financial instruments and receivables due from counterparties. The extent of the Portfolios’ exposure to market, issuer and counterparty credit risks with respect to these financial assets is approximately their value recorded in the Statements of Assets and Liabilities, less any collateral held by the Portfolios.
A derivative contract may suffer a mark-to-market loss if the value of the contract decreases due to an unfavorable change in the market rates or values of the underlying instrument. Losses can also occur if the counterparty does not perform under the contract.
With futures, there is less counterparty credit risk to the Portfolios since the exchange or clearinghouse, as counterparty to such instruments, guarantees against a possible default. The clearinghouse stands between the buyer and the seller of the contract; therefore, credit risk is limited to failure of the clearinghouse. While offset rights may exist under applicable law, a Portfolio does not have a contractual right of offset against a clearing broker or clearinghouse in the event of a default (including the bankruptcy or insolvency). Additionally, credit risk exists in exchange-traded futures with respect to initial and variation margin that is held in a clearing broker’s customer accounts. While clearing brokers are required to segregate customer margin from their own assets, in the event that a clearing broker becomes insolvent or goes into bankruptcy and at that time there is a shortfall in the aggregate amount of margin held by the clearing broker for all its clients, typically the shortfall would be allocated on a pro rata basis across all the clearing broker’s customers, potentially resulting in losses to the Portfolios.
Concentration Risk: As of period end, Master Large Cap Core Portfolio and Master Large Cap Growth Portfolio invested a significant portion of their assets in securities in the information technology sector and Master Large Cap Value Portfolio invested a significant portion of its assets in securities in the financials sector. Changes in economic conditions affecting such sectors would have a greater impact on the Portfolios and could affect the value, income and/or liquidity of positions in such securities.
11. Subsequent Events:
Management’s evaluation of the impact of all subsequent events on the Master LLC’s financial statements was completed through the date the financial statements were issued and the following items were noted:
Effective April 21, 2016, the credit agreement was extended until April 2017. The updated agreement includes the following terms: A fee of 0.12% per annum on the unused commitment amounts and interest at a rate equal to the higher of (a) one-month LIBOR (but in any event, not less than 0.00%) on the date the loan is made plus 0.80% per annum or (b) the Fed Funds rate (but in any event, not less than 0.00%) in effect from time to time plus 0.80% per annum on amounts borrowed. The commitment amounts remain unchanged. Administration, legal and arrangement fees in connection with the amended credit agreement, and along with commitment fees, are allocated among the Participating Funds based upon portions of the aggregate commitment available to them and relative net assets of the Participating Funds.
| | | | | | |
| | | BLACKROCK LARGE CAP SERIES FUNDS, INC. | | MARCH 31, 2016 | | 63 |
Rodney D. Johnson, Chair of the Board and Director
David O. Beim, Director
Susan J. Carter, Director
Collette Chilton, Director
Neil A. Cotty, Director
Dr. Matina S. Horner, Director
Cynthia A. Montgomery, Director
Barbara G. Novick, Director
Joseph P. Platt, Director
Robert C. Robb, Jr., Director
Mark Stalnecker, Director
Kenneth L. Urish, Director
Claire A. Walton, Director
Frederick W. Winter, Director
John M. Perlowski, Director, President and Chief Executive Officer
Jennifer McGovern, Vice President
Neal J. Andrews, Chief Financial Officer
Jay M. Fife, Treasurer
Charles Park, Chief Compliance Officer
Fernanda Piedra, Anti-Money Laundering Compliance Officer
Benjamin Archibald, Secretary
Effective December 31, 2015, Herbert I. London and Toby Rosenblatt retired as Directors of the Corporation/Master LLC.
Effective February 5, 2016, Frank J. Fabozzi resigned as a Director of the Corporation/Master LLC.
Effective February 8, 2016, Susan J. Carter, Neil A. Cotty and Claire A. Walton were elected to serve as Directors of the Corporation/Master LLC.
| | | | | | |
| | | | |
| Investment Advisor | | Custodian | | Distributor | | Address of the Corporation/ |
| BlackRock Advisors, LLC | | Brown Brothers Harriman & Co. | | BlackRock Investments, LLC | | Master LLC |
| Wilmington, DE 19809 | | Boston, MA 02109 | | New York, NY 10022 | | 100 Bellevue Parkway |
| | | | | | Wilmington, DE 19809 |
| | | | | | |
| Legal Counsel | | Independent Registered Public | | Accounting Agent and | | |
| Sidley Austin LLP | | Accounting Firm | | Transfer Agent | |
| New York, NY 10019 | | Deloitte & Touche LLP | | BNY Mellon Investment | | |
| | Philadelphia, PA 19103 | | Servicing (US) Inc. | | |
| | | | Wilmington, DE 19809 | | |
| | | | | | |
| 64 | | BLACKROCK LARGE CAP SERIES FUNDS, INC. | | MARCH 31, 2016 | | |
A Special Meeting of Shareholders of BlackRock Large Cap Series Funds, Inc. was held on February 8, 2016 for shareholders of record on December 11, 2015, to elect a Board of Directors of the Funds.
| | | | | | |
| | | | | Votes For | | Votes Withheld |
Approved the Directors* as follows: | | David O. Beim | | 182,295,055 | | 4,705,082 |
| | Susan J. Carter | | 182,374,899 | | 4,625,239 |
| | Collette Chilton | | 182,289,972 | | 4,710,165 |
| | Neil A. Cotty | | 182,342,617 | | 4,657,520 |
| | Matina S. Horner | | 182,145,461 | | 4,854,677 |
| | Rodney D. Johnson | | 182,472,005 | | 4,528,132 |
| | Cynthia A. Montgomery | | 182,341,806 | | 4,658,331 |
| | Joseph P. Platt | | 182,358,309 | | 4,641,828 |
| | Robert C. Robb, Jr. | | 182,042,647 | | 4,957,490 |
| | Mark Stalnecker | | 182,548,344 | | 4,451,793 |
| | Kenneth L. Urish | | 182,561,485 | | 4,438,652 |
| | Claire A. Walton | | 182,541,376 | | 4,458,761 |
| | Frederick W. Winter | | 182,469,013 | | 4,531,124 |
| | Barbara G. Novick | | 182,356,291 | | 4,643,846 |
| | | John M. Perlowski | | 182,441,208 | | 4,558,930 |
| * | Denotes Fund-wide proposal and voting results. |
A Special Meeting of Investors of Master Large Cap Series LLC (the “Master LLC”) was held on February 8, 2016 for investors of record on December 11, 2015, to elect a Board of Directors of the Master LLC.
| | | | | | |
| | | | | Votes For | | Votes Withheld |
Approved the Directors* as follows: | | David O. Beim | | 4,070,657,983 | | 125,140,954 |
| | Susan J. Carter | | 4,082,313,915 | | 113,485,022 |
| | Collette Chilton | | 4,081,559,846 | | 114,239,091 |
| | Neil A. Cotty | | 4,070,640,271 | | 125,158,666 |
| | Matina S. Horner | | 4,075,403,342 | | 120,395,595 |
| | Rodney D. Johnson | | 4,070,537,985 | | 125,260,952 |
| | Cynthia A. Montgomery | | 4,079,360,848 | | 116,438,089 |
| | Joseph P. Platt | | 4,069,525,328 | | 126,273,609 |
| | Robert C. Robb, Jr. | | 4,063,157,338 | | 132,641,599 |
| | Mark Stalnecker | | 4,076,340,203 | | 119,458,734 |
| | Kenneth L. Urish | | 4,078,308,156 | | 117,490,781 |
| | Claire A. Walton | | 4,076,521,223 | | 119,277,714 |
| | Frederick W. Winter | | 4,073,787,184 | | 122,011,753 |
| | Barbara G. Novick | | 4,081,307,576 | | 114,491,361 |
| | | John M. Perlowski | | 4,067,662,775 | | 128,136,162 |
| * | Denotes Master LLC-wide proposal and voting results. |
Householding
The Funds will mail only one copy of shareholder documents, including prospectuses, annual and semi-annual reports and proxy statements, to shareholders with multiple accounts at the same address. This practice is commonly called “householding” and is intended to reduce expenses and eliminate duplicate mailings of shareholder documents. Mailings of your shareholder documents may be householded indefinitely unless you instruct us otherwise. If you do not want the mailing of these documents to be combined with those for other members of your household, please call the Fund at (800) 441-7762.
Availability of Quarterly Schedule of Investments
The Funds/Portfolios file their complete schedule of portfolio holdings with the SEC for the first and third quarters of each fiscal year on Form N-Q. The Funds’/Portfolios’ Forms N-Q are available on the SEC’s website at http://www.sec.gov and may also be reviewed and copied at the SEC’s Public Reference Room in Washington, DC. Information on how to access documents on the SEC’s website without charge may be obtained by calling (800) SEC-0330. The Funds’/Portfolios’ Forms N-Q may also be obtained upon request and without charge by calling (800) 441-7762.
| | | | | | |
| | | BLACKROCK LARGE CAP SERIES FUNDS, INC. | | MARCH 31, 2016 | | 65 |
| | |
| Additional Information (concluded) | | |
|
| General Information (concluded) |
Availability of Proxy Voting Policies and Procedures
A description of the policies and procedures that the Funds/Portfolios use to determine how to vote proxies relating to portfolio securities is available upon request and without charge, (1) by calling (800) 441-7762; (2) at http://www.blackrock.com; and (3) on the SEC’s website at http:// www.sec.gov.
Availability of Proxy Voting Record
Information about how the Funds/Portfolios voted proxies relating to securities held in the Portfolios’ portfolio during the most recent 12-month period ended June 30 is available upon request and without charge (1) at http://www.blackrock.com or by calling (800) 441-7762 and (2) on the SEC’s website at http://www.sec.gov.
BlackRock’s Mutual Fund Family
BlackRock offers a diverse lineup of open-end mutual funds crossing all investment styles and managed by experts in equity, fixed income and tax-exempt investing. Visit http://www.blackrock.com for more information.
Account Information
Call us at (800) 441-7762 from 8:00 AM to 6:00 PM EST on any business day to get information about your account balances, recent transactions and share prices. You can also reach us on the Web at http://www.blackrock.com/funds.
Automatic Investment Plans
Investor Class shareholders who want to invest regularly can arrange to have $50 or more automatically deducted from their checking or savings account and invested in any of the BlackRock funds.
Systematic Withdrawal Plans
Investor Class shareholders can establish a systematic withdrawal plan and receive periodic payments of $50 or more from their BlackRock funds, as long as their account balance is at least $10,000.
Retirement Plans
Shareholders may make investments in conjunction with Traditional, Rollover, Roth, Coverdell, Simple IRAs, SEP IRAs and 403(b) Plans.
|
| BlackRock Privacy Principles |
BlackRock is committed to maintaining the privacy of its current and former fund investors and individual clients (collectively, “Clients”) and to safeguarding their non-public personal information. The following information is provided to help you understand what personal information BlackRock collects, how we protect that information and why in certain cases we share such information with select parties.
If you are located in a jurisdiction where specific laws, rules or regulations require BlackRock to provide you with additional or different privacy-related rights beyond what is set forth below, then BlackRock will comply with those specific laws, rules or regulations.
BlackRock obtains or verifies personal non-public information from and about you from different sources, including the following: (i) information we receive from you or, if applicable, your financial intermediary, on applications, forms or other documents; (ii) information about your transactions with us, our affiliates, or others; (iii) information we receive from a consumer reporting agency; and (iv) from visits to our websites.
BlackRock does not sell or disclose to non-affiliated third parties any non-public personal information about its Clients, except as permitted by law or as is necessary to respond to regulatory requests or to service Client accounts. These non-affiliated third parties are required to protect the confidentiality and security of this information and to use it only for its intended purpose.
We may share information with our affiliates to service your account or to provide you with information about other BlackRock products or services that may be of interest to you. In addition, BlackRock restricts access to non-public personal information about its Clients to those BlackRock employees with a legitimate business need for the information. BlackRock maintains physical, electronic and procedural safeguards that are designed to protect the non-public personal information of its Clients, including procedures relating to the proper storage and disposal of such information.
| | | | | | |
| 66 | | BLACKROCK LARGE CAP SERIES FUNDS, INC. | | MARCH 31, 2016 | | |
This report is intended for current holders. It is not authorized for use as an offer of sale or a solicitation of an offer to buy shares of a Fund unless accompanied or preceded by that Fund’s current prospectus. Past performance results shown in this report should not be considered a representation of future performance. Investment returns and principal value of shares will fluctuate so that shares, when redeemed, may be worth more or less than their original cost. Statements and other information herein are as dated and are subject to change.

| | |
CAPSERIES-3/16-SAR | | 
|
| Item 2 – | Code of Ethics – Not Applicable to this semi-annual report |
| Item 3 – | Audit Committee Financial Expert – Not Applicable to this semi-annual report |
| Item 4 – | Principal Accountant Fees and Services – Not Applicable to this semi-annual report |
| Item 5 – | Audit Committee of Listed Registrants – Not Applicable |
(a) The registrants’ Schedule of Investments is included as part of the Report to Stockholders filed under Item 1 of this Form.
(b) Not Applicable due to no such divestments during the semi-annual period covered since the previous Form N-CSR filing.
| Item 7 – | Disclosure of Proxy Voting Policies and Procedures for Closed-End Management Investment Companies – Not Applicable |
| Item 8 – | Portfolio Managers of Closed-End Management Investment Companies – Not Applicable |
| Item 9 – | Purchases of Equity Securities by Closed-End Management Investment Company and Affiliated Purchasers – Not Applicable |
| Item 10 – | Submission of Matters to a Vote of Security Holders –There have been no material changes to these procedures. |
| Item 11 – | Controls and Procedures |
(a) – The registrants’ principal executive and principal financial officers, or persons performing similar functions, have concluded that the registrants’ disclosure controls and procedures (as defined in Rule 30a-3(c) under the Investment Company Act of 1940, as amended (the “1940 Act”)) are effective as of a date within 90 days of the filing of this report based on the evaluation of these controls and procedures required by Rule 30a-3(b) under the 1940 Act and Rule 15d-15(b) under the Securities Exchange Act of 1934, as amended.
(b) – There were no changes in the registrants’ internal control over financial reporting (as defined in Rule 30a-3(d) under the 1940 Act) that occurred during the second fiscal quarter of the period covered by this report that have materially affected, or are reasonably likely to materially affect, the registrants’ internal control over financial reporting.
| Item 12 – | Exhibits attached hereto |
(a)(1) – Code of Ethics – Not Applicable to this semi-annual report
(a)(2) – Certifications – Attached hereto
(a)(3) – Not Applicable
(b) – Certifications – Attached hereto
2
Pursuant to the requirements of the Securities Exchange Act of 1934 and the Investment Company Act of 1940, each registrant has duly caused this report to be signed on its behalf by the undersigned, thereunto duly authorized.
BlackRock Large Cap Series Funds, Inc. and Master Large Cap Series LLC
| | | | |
| | By: | | /s/ John M. Perlowski |
| | | | John M. Perlowski |
| | | | Chief Executive Officer (principal executive officer) of |
| | | | BlackRock Large Cap Series Funds, Inc. and Master Large Cap Series LLC |
| |
| | Date: June 2, 2016 |
Pursuant to the requirements of the Securities Exchange Act of 1934 and the Investment Company Act of 1940, this report has been signed below by the following persons on behalf of each registrant and in the capacities and on the dates indicated.
| | | | |
| | By: | | /s/ John M. Perlowski |
| | | | John M. Perlowski |
| | | | Chief Executive Officer (principal executive officer) of |
| | | | BlackRock Large Cap Series Funds, Inc. and Master Large Cap Series LLC |
| |
| | Date: June 2, 2016 |
| | |
| | By: | | /s/ Neal J. Andrews |
| | | | Neal J. Andrews |
| | | | Chief Financial Officer (principal financial officer) of |
| | | | BlackRock Large Cap Series Funds, Inc. and Master Large Cap Series LLC |
| |
| | Date: June 2, 2016 |
3